10 11-2016 q3 webcast presentation
22
TSX – NYSE MKT: RIC Third Quarter 2016 Financial Results November 10, 2016
-
Upload
richmontminesinc2016 -
Category
Investor Relations
-
view
740 -
download
2
Transcript of 10 11-2016 q3 webcast presentation
TSX – NYSE MKT: RIC
Third Quarter 2016 Financial ResultsNovember 10, 2016
www.richmont-mines.com 2
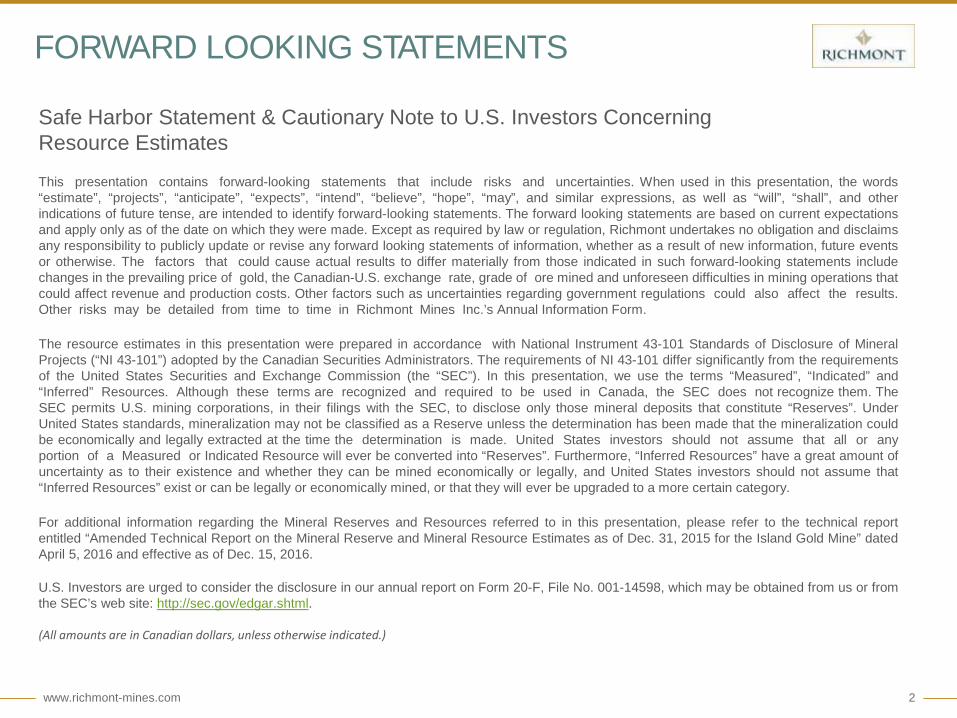
Safe Harbor Statement & Cautionary Note to U.S. Investors Concerning Resource Estimates
This presentation contains forward-looking statements that include risks and uncertainties. When used in this presentation, the words“estimate”, “projects”, “anticipate”, “expects”, “intend”, “believe”, “hope”, “may”, and similar expressions, as well as “will”, “shall”, and otherindications of future tense, are intended to identify forward-looking statements. The forward looking statements are based on current expectationsand apply only as of the date on which they were made. Except as required by law or regulation, Richmont undertakes no obligation and disclaimsany responsibility to publicly update or revise any forward looking statements of information, whether as a result of new information, future eventsor otherwise. The factors that could cause actual results to differ materially from those indicated in such forward-looking statements includechanges in the prevailing price of gold, the Canadian-U.S. exchange rate, grade of ore mined and unforeseen difficulties in mining operations thatcould affect revenue and production costs. Other factors such as uncertainties regarding government regulations could also affect the results.Other risks may be detailed from time to time in Richmont Mines Inc.’s Annual Information Form.
The resource estimates in this presentation were prepared in accordance with National Instrument 43-101 Standards of Disclosure of MineralProjects (“NI 43-101”) adopted by the Canadian Securities Administrators. The requirements of NI 43-101 differ significantly from the requirementsof the United States Securities and Exchange Commission (the “SEC”). In this presentation, we use the terms “Measured”, “Indicated” and“Inferred” Resources. Although these terms are recognized and required to be used in Canada, the SEC does not recognize them. TheSEC permits U.S. mining corporations, in their filings with the SEC, to disclose only those mineral deposits that constitute “Reserves”. UnderUnited States standards, mineralization may not be classified as a Reserve unless the determination has been made that the mineralization couldbe economically and legally extracted at the time the determination is made. United States investors should not assume that all or anyportion of a Measured or Indicated Resource will ever be converted into “Reserves”. Furthermore, “Inferred Resources” have a great amount ofuncertainty as to their existence and whether they can be mined economically or legally, and United States investors should not assume that“Inferred Resources” exist or can be legally or economically mined, or that they will ever be upgraded to a more certain category.
For additional information regarding the Mineral Reserves and Resources referred to in this presentation, please refer to the technical reportentitled “Amended Technical Report on the Mineral Reserve and Mineral Resource Estimates as of Dec. 31, 2015 for the Island Gold Mine” datedApril 5, 2016 and effective as of Dec. 15, 2016.
U.S. Investors are urged to consider the disclosure in our annual report on Form 20-F, File No. 001-14598, which may be obtained from us or fromthe SEC’s web site: http://sec.gov/edgar.shtml.
(All amounts are in Canadian dollars, unless otherwise indicated.)
FORWARD LOOKING STATEMENTS
www.richmont-mines.com 3
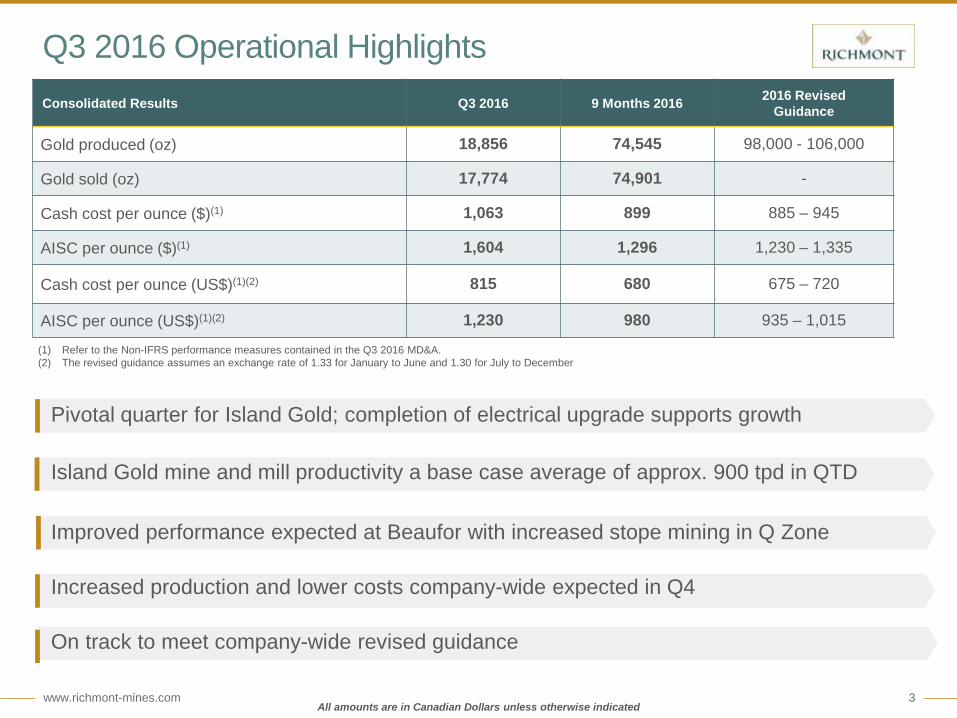
(1) Refer to the Non-IFRS performance measures contained in the Q3 2016 MD&A.(2) The revised guidance assumes an exchange rate of 1.33 for January to June and 1.30 for July to December
Q3 2016 Operational Highlights
All amounts are in Canadian Dollars unless otherwise indicated
Consolidated Results Q3 2016 9 Months 2016 2016 Revised Guidance
Gold produced (oz) 18,856 74,545 98,000 - 106,000
Gold sold (oz) 17,774 74,901 -
Cash cost per ounce ($)(1) 1,063 899 885 – 945
AISC per ounce ($)(1) 1,604 1,296 1,230 – 1,335
Cash cost per ounce (US$)(1)(2) 815 680 675 – 720
AISC per ounce (US$)(1)(2) 1,230 980 935 – 1,015
Pivotal quarter for Island Gold; completion of electrical upgrade supports growth
Island Gold mine and mill productivity a base case average of approx. 900 tpd in QTD
Improved performance expected at Beaufor with increased stope mining in Q Zone
Increased production and lower costs company-wide expected in Q4
On track to meet company-wide revised guidance
www.richmont-mines.com 4
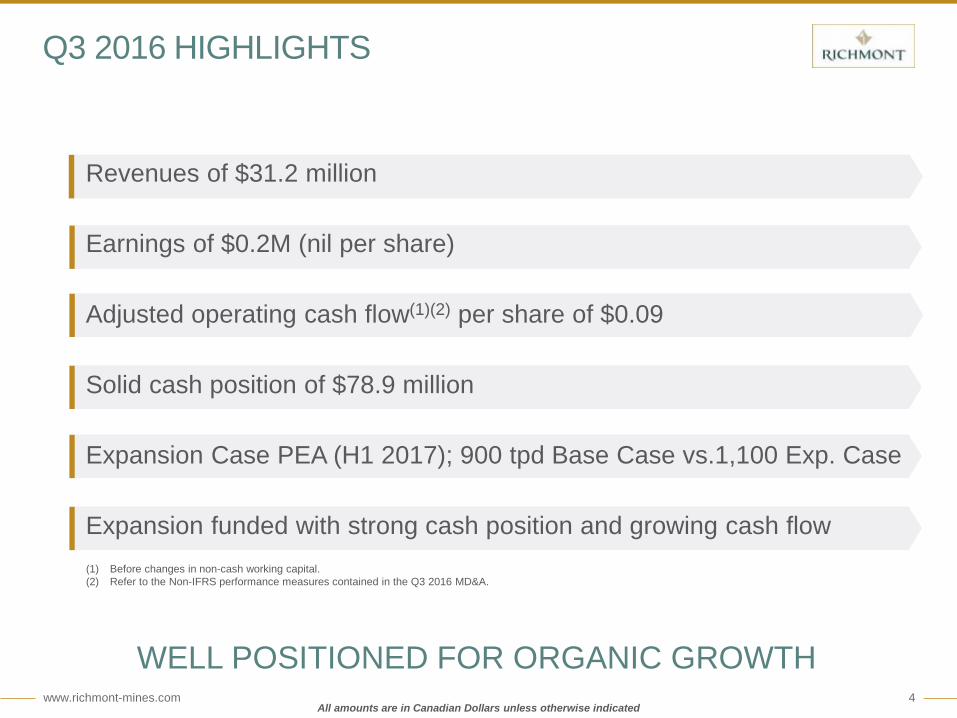
(1) Before changes in non-cash working capital.(2) Refer to the Non-IFRS performance measures contained in the Q3 2016 MD&A.
Revenues of $31.2 million
Earnings of $0.2M (nil per share)
Adjusted operating cash flow(1)(2) per share of $0.09
Solid cash position of $78.9 million
Expansion Case PEA (H1 2017); 900 tpd Base Case vs.1,100 Exp. Case
Expansion funded with strong cash position and growing cash flow
Q3 2016 HIGHLIGHTS
WELL POSITIONED FOR ORGANIC GROWTHAll amounts are in Canadian Dollars unless otherwise indicated

FINANCIAL HIGHLIGHTS
www.richmont-mines.com 6
FINANCIAL RESULTS HIGHLIGHTS
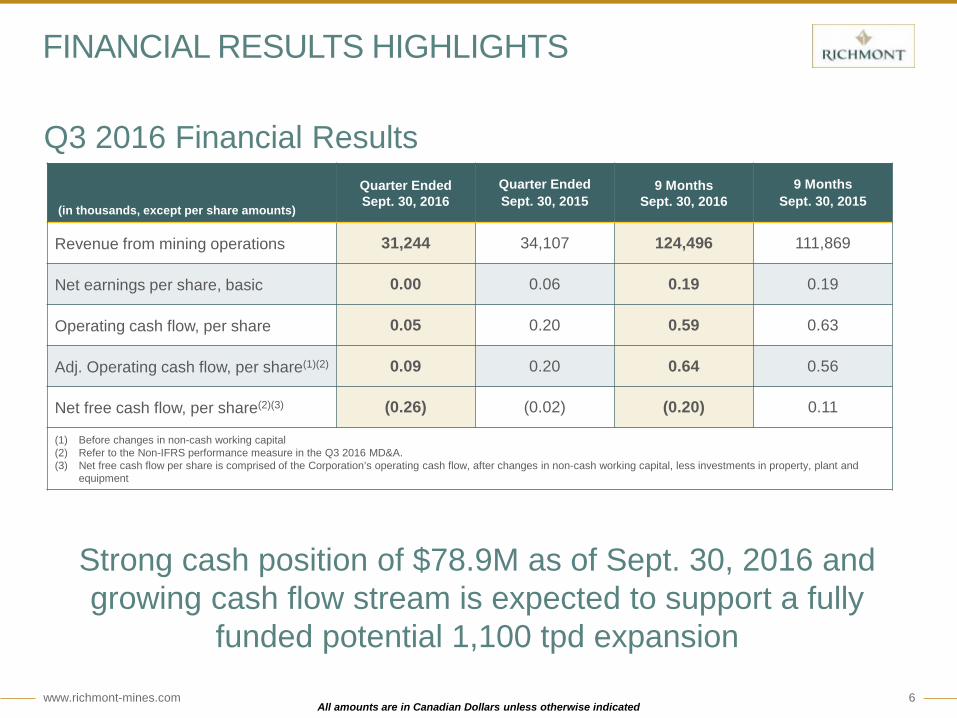
Q3 2016 Financial Results
Strong cash position of $78.9M as of Sept. 30, 2016 and growing cash flow stream is expected to support a fully
funded potential 1,100 tpd expansion
(in thousands, except per share amounts)
Quarter EndedSept. 30, 2016
Quarter EndedSept. 30, 2015
9 MonthsSept. 30, 2016
9 MonthsSept. 30, 2015
Revenue from mining operations 31,244 34,107 124,496 111,869
Net earnings per share, basic 0.00 0.06 0.19 0.19
Operating cash flow, per share 0.05 0.20 0.59 0.63
Adj. Operating cash flow, per share(1)(2) 0.09 0.20 0.64 0.56
Net free cash flow, per share(2)(3) (0.26) (0.02) (0.20) 0.11
(1) Before changes in non-cash working capital(2) Refer to the Non-IFRS performance measure in the Q3 2016 MD&A.(3) Net free cash flow per share is comprised of the Corporation’s operating cash flow, after changes in non-cash working capital, less investments in property, plant and
equipment
All amounts are in Canadian Dollars unless otherwise indicated

OPERATIONS & OVERVIEW
www.richmont-mines.com 8
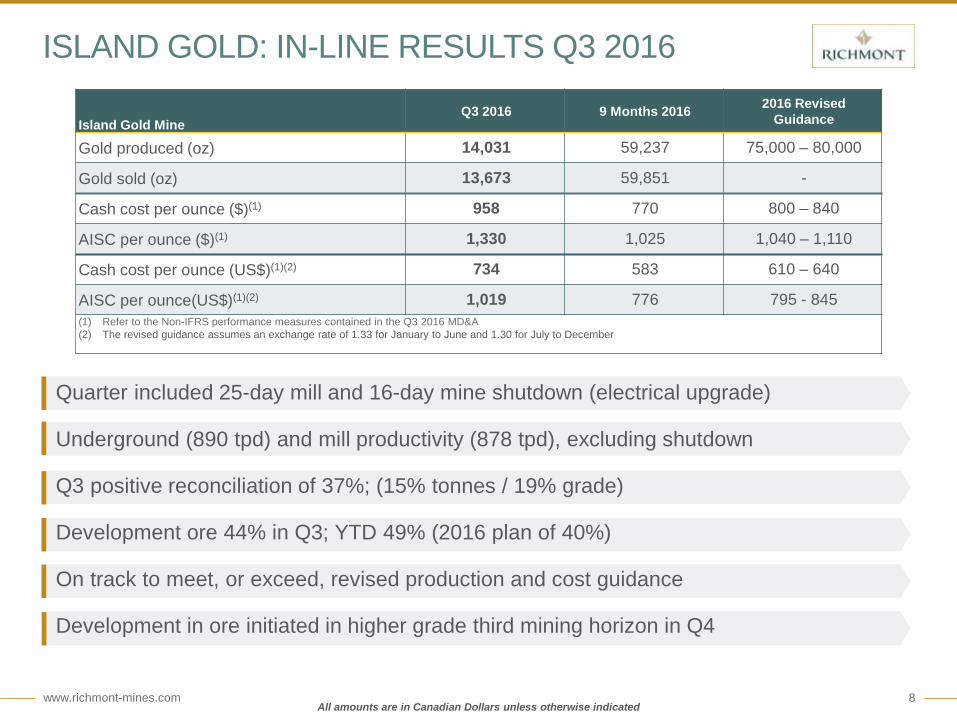
ISLAND GOLD: IN-LINE RESULTS Q3 2016
Island Gold MineQ3 2016 9 Months 2016 2016 Revised
Guidance
Gold produced (oz) 14,031 59,237 75,000 – 80,000
Gold sold (oz) 13,673 59,851 -
Cash cost per ounce ($)(1) 958 770 800 – 840
AISC per ounce ($)(1) 1,330 1,025 1,040 – 1,110
Cash cost per ounce (US$)(1)(2) 734 583 610 – 640
AISC per ounce(US$)(1)(2) 1,019 776 795 - 845(1) Refer to the Non-IFRS performance measures contained in the Q3 2016 MD&A(2) The revised guidance assumes an exchange rate of 1.33 for January to June and 1.30 for July to December
All amounts are in Canadian Dollars unless otherwise indicated
Quarter included 25-day mill and 16-day mine shutdown (electrical upgrade)
Underground (890 tpd) and mill productivity (878 tpd), excluding shutdown
Q3 positive reconciliation of 37%; (15% tonnes / 19% grade)
Development ore 44% in Q3; YTD 49% (2016 plan of 40%)
On track to meet, or exceed, revised production and cost guidance
Development in ore initiated in higher grade third mining horizon in Q4
www.richmont-mines.com 9
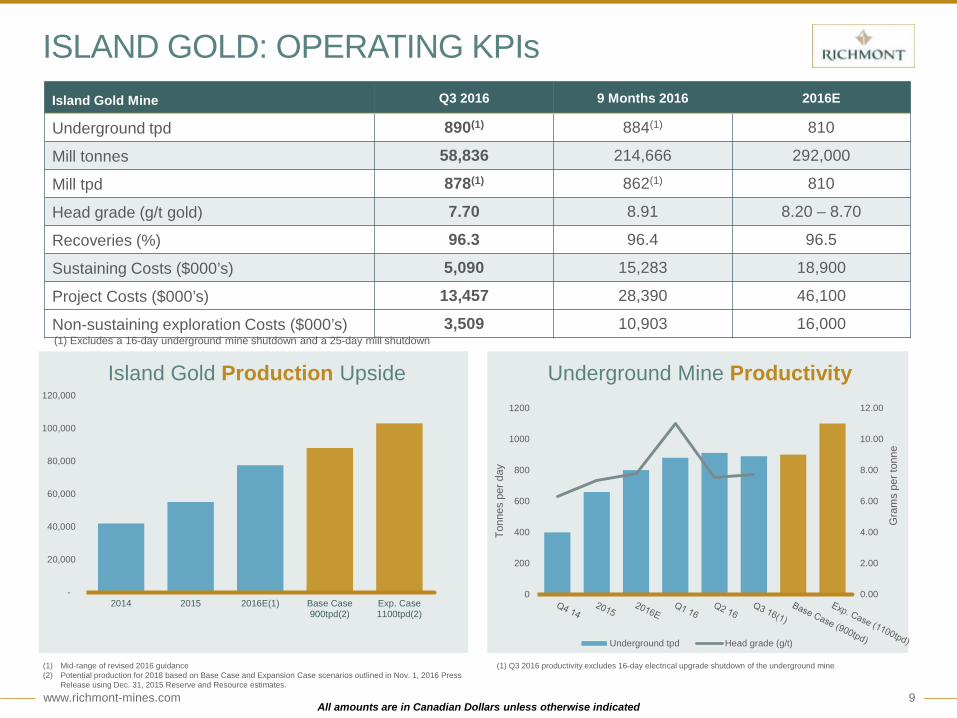
ISLAND GOLD: OPERATING KPIsIsland Gold Mine Q3 2016 9 Months 2016 2016E
Underground tpd 890(1) 884(1) 810
Mill tonnes 58,836 214,666 292,000
Mill tpd 878(1) 862(1) 810
Head grade (g/t gold) 7.70 8.91 8.20 – 8.70
Recoveries (%) 96.3 96.4 96.5
Sustaining Costs ($000’s) 5,090 15,283 18,900
Project Costs ($000’s) 13,457 28,390 46,100
Non-sustaining exploration Costs ($000’s) 3,509 10,903 16,000
Underground Mine Productivity
-
20,000
40,000
60,000
80,000
100,000
120,000
2014 2015 2016E(1) Base Case900tpd(2)
Exp. Case1100tpd(2)
Island Gold Production Upside
All amounts are in Canadian Dollars unless otherwise indicated
(1) Mid-range of revised 2016 guidance(2) Potential production for 2018 based on Base Case and Expansion Case scenarios outlined in Nov. 1, 2016 Press
Release using Dec. 31, 2015 Reserve and Resource estimates.
(1) Q3 2016 productivity excludes 16-day electrical upgrade shutdown of the underground mine
0.00
2.00
4.00
6.00
8.00
10.00
12.00
0
200
400
600
800
1000
1200
Gra
ms
per t
onne
Tonn
es p
er d
ay
Underground tpd Head grade (g/t)
(1) Excludes a 16-day underground mine shutdown and a 25-day mill shutdown
www.richmont-mines.com 10
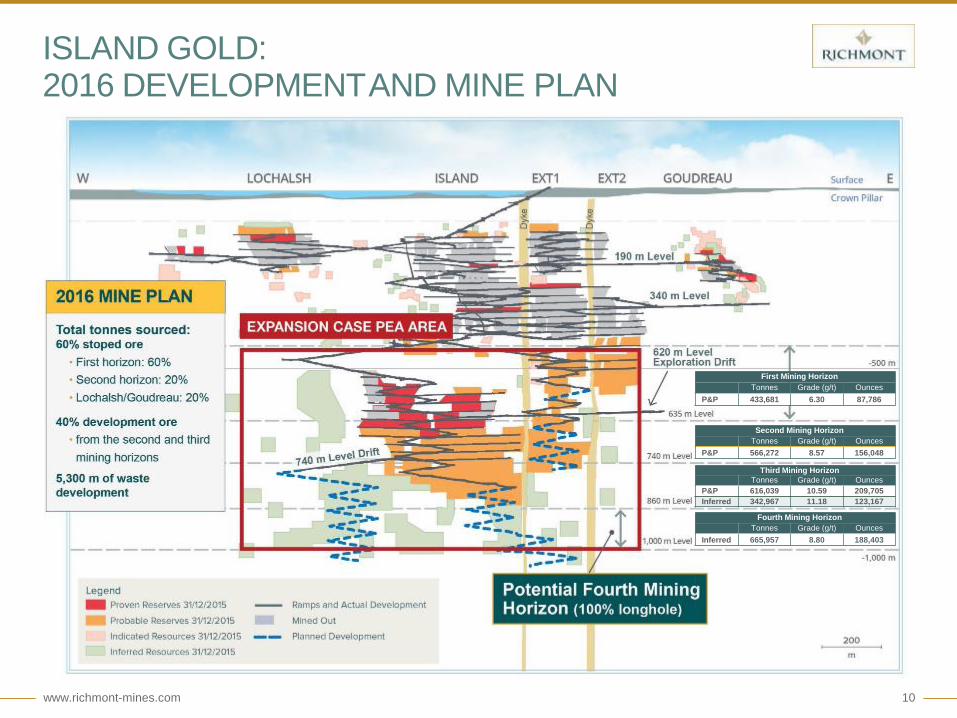
ISLAND GOLD:2016 DEVELOPMENTAND MINE PLAN
First Mining HorizonTonnes Grade (g/t) Ounces
P&P 433,681 6.30 87,786
Third Mining HorizonTonnes Grade (g/t) Ounces
P&P 616,039 10.59 209,705Inferred 342,967 11.18 123,167
Second Mining HorizonTonnes Grade (g/t) Ounces
P&P 566,272 8.57 156,048
Fourth Mining Horizon Tonnes Grade (g/t) Ounces
Inferred 665,957 8.80 188,403
www.richmont-mines.com 11
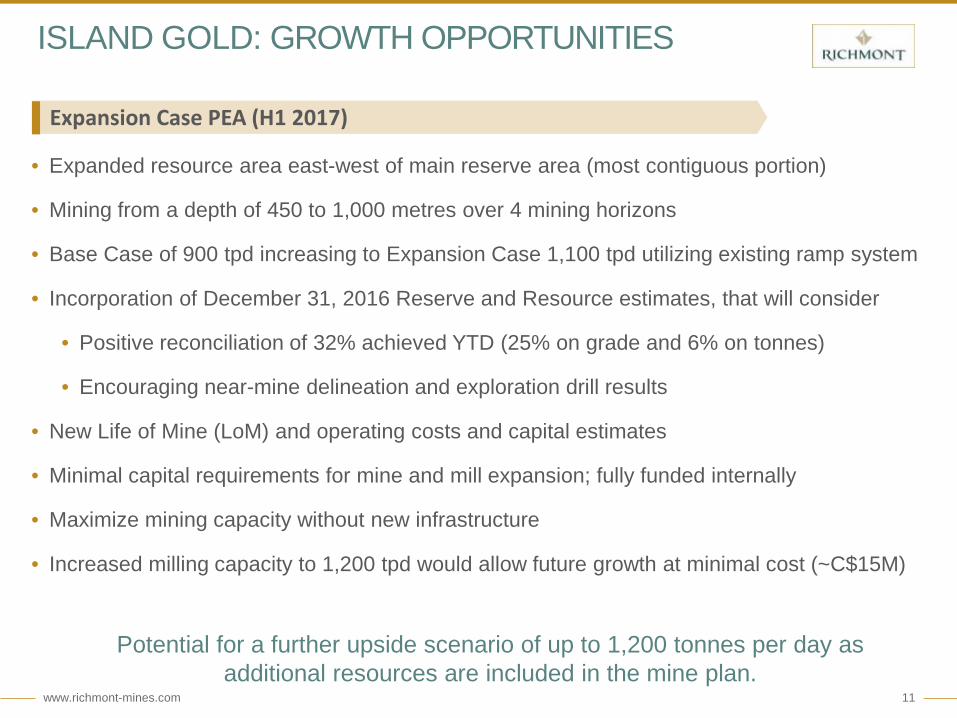
ISLAND GOLD: GROWTH OPPORTUNITIES
• Expanded resource area east-west of main reserve area (most contiguous portion)
• Mining from a depth of 450 to 1,000 metres over 4 mining horizons
• Base Case of 900 tpd increasing to Expansion Case 1,100 tpd utilizing existing ramp system
• Incorporation of December 31, 2016 Reserve and Resource estimates, that will consider
• Positive reconciliation of 32% achieved YTD (25% on grade and 6% on tonnes)
• Encouraging near-mine delineation and exploration drill results
• New Life of Mine (LoM) and operating costs and capital estimates
• Minimal capital requirements for mine and mill expansion; fully funded internally
• Maximize mining capacity without new infrastructure
• Increased milling capacity to 1,200 tpd would allow future growth at minimal cost (~C$15M)
Potential for a further upside scenario of up to 1,200 tonnes per day as additional resources are included in the mine plan.
Expansion Case PEA (H1 2017)
www.richmont-mines.com 12
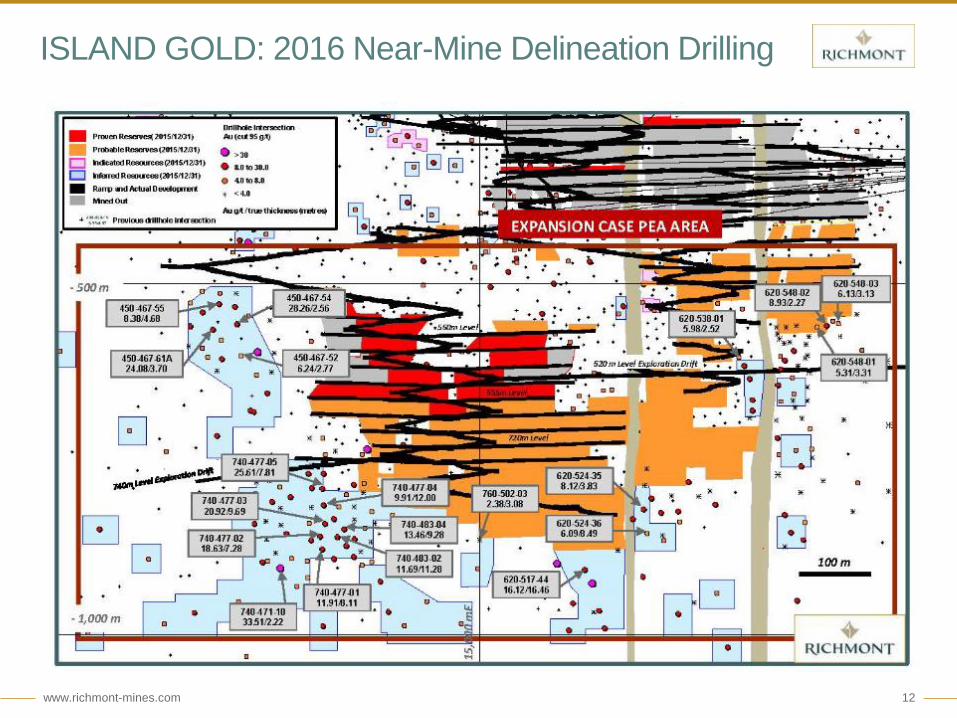
ISLAND GOLD: 2016 Near-Mine Delineation Drilling
www.richmont-mines.com 13
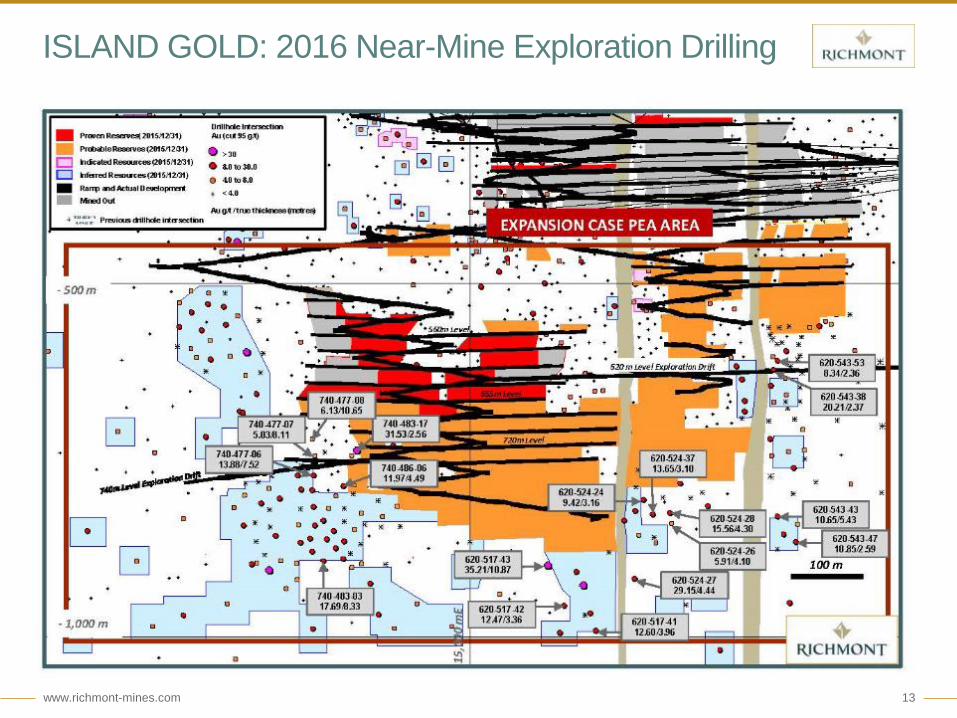
ISLAND GOLD: 2016 Near-Mine Exploration Drilling
www.richmont-mines.com 14
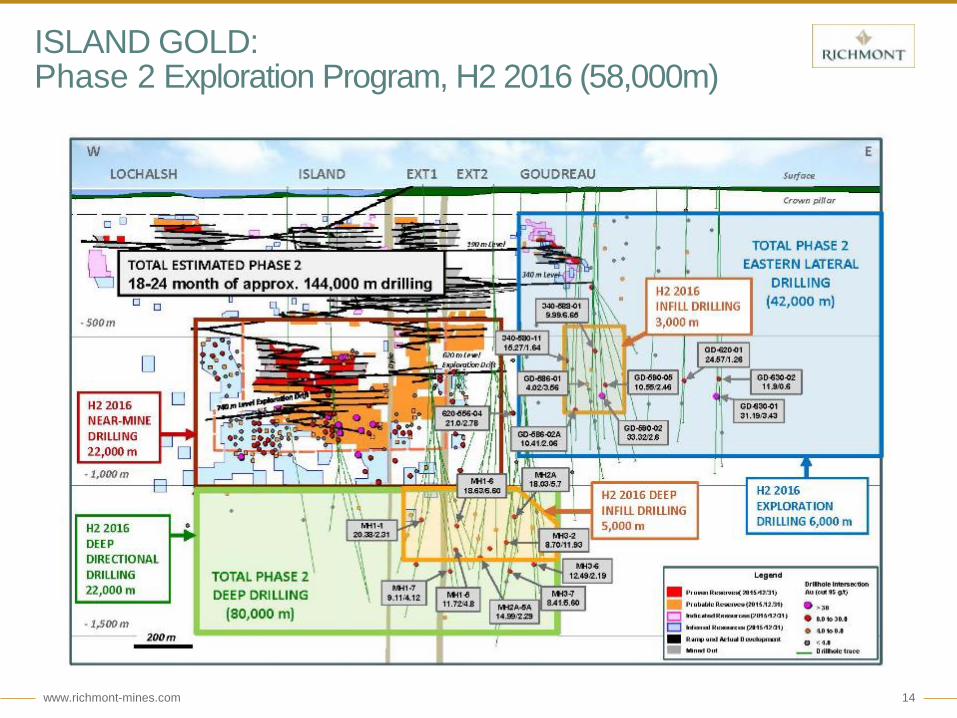
ISLAND GOLD:Phase 2 Exploration Program, H2 2016 (36,000m)ISLAND GOLD: Phase 2 Exploration Program, H2 2016 (58,000m)
www.richmont-mines.com 15
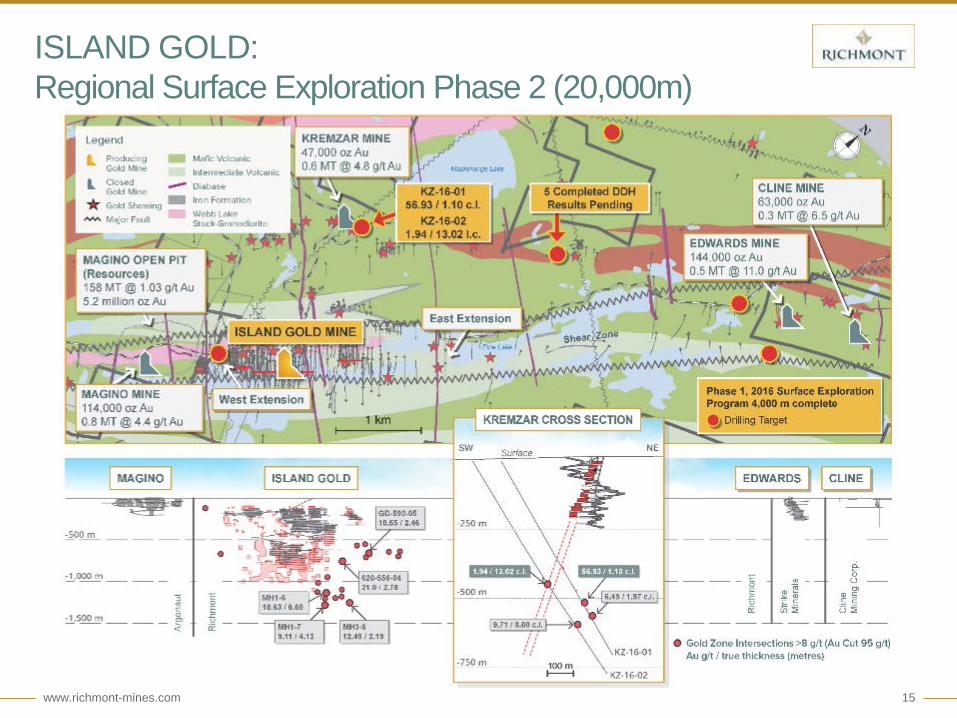
ISLAND GOLD:Regional Surface Exploration Phase 2 (20,000m)
www.richmont-mines.com 16
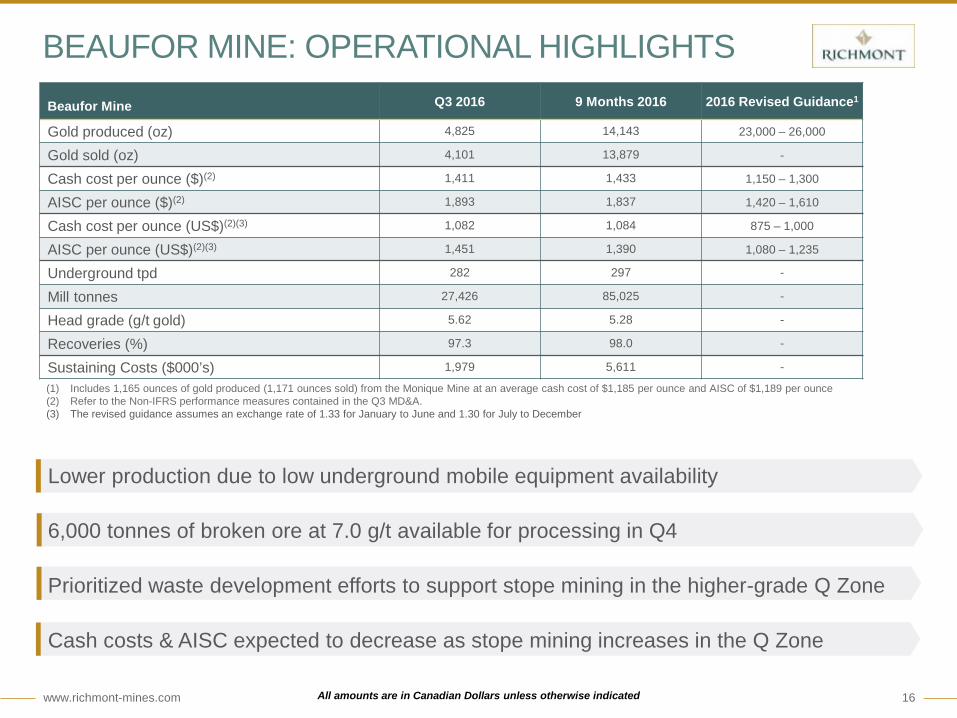
Lower production due to low underground mobile equipment availability
6,000 tonnes of broken ore at 7.0 g/t available for processing in Q4
Prioritized waste development efforts to support stope mining in the higher-grade Q Zone
Cash costs & AISC expected to decrease as stope mining increases in the Q Zone
BEAUFOR MINE: OPERATIONAL HIGHLIGHTS
(1) Includes 1,165 ounces of gold produced (1,171 ounces sold) from the Monique Mine at an average cash cost of $1,185 per ounce and AISC of $1,189 per ounce(2) Refer to the Non-IFRS performance measures contained in the Q3 MD&A.(3) The revised guidance assumes an exchange rate of 1.33 for January to June and 1.30 for July to December
Beaufor Mine Q3 2016 9 Months 2016 2016 Revised Guidance1
Gold produced (oz) 4,825 14,143 23,000 – 26,000
Gold sold (oz) 4,101 13,879 -
Cash cost per ounce ($)(2) 1,411 1,433 1,150 – 1,300
AISC per ounce ($)(2) 1,893 1,837 1,420 – 1,610
Cash cost per ounce (US$)(2)(3) 1,082 1,084 875 – 1,000
AISC per ounce (US$)(2)(3) 1,451 1,390 1,080 – 1,235
Underground tpd 282 297 -
Mill tonnes 27,426 85,025 -
Head grade (g/t gold) 5.62 5.28 -
Recoveries (%) 97.3 98.0 -
Sustaining Costs ($000’s) 1,979 5,611 -
All amounts are in Canadian Dollars unless otherwise indicated

Q&A
www.richmont-mines.com 18
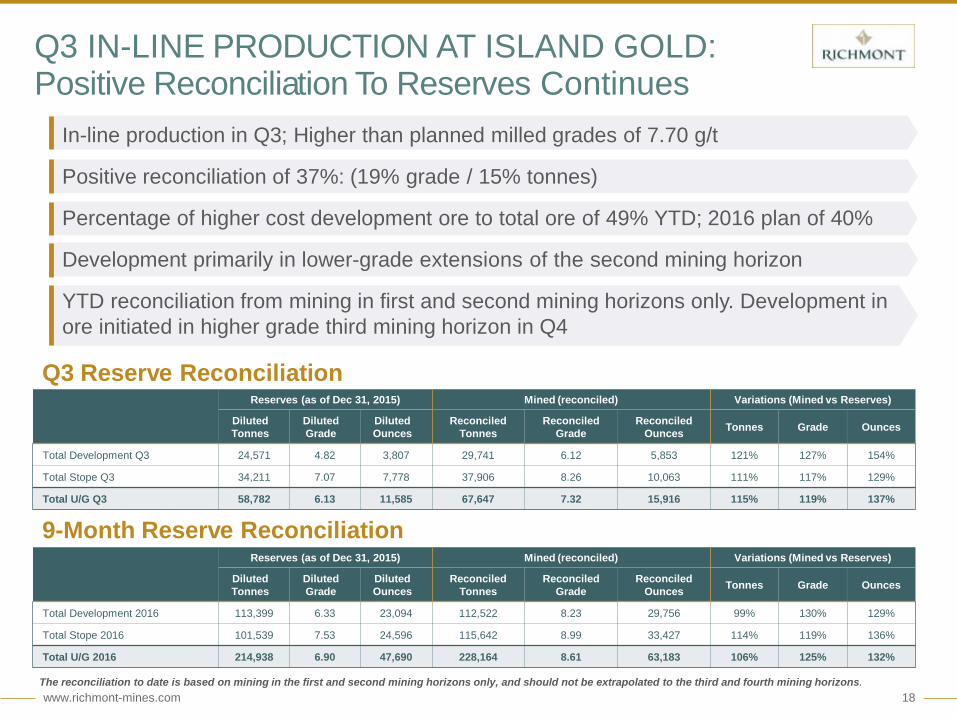
Q3 IN-LINE PRODUCTION AT ISLAND GOLD:Positive Reconciliation To Reserves Continues
9-Month Reserve Reconciliation
Reserves (as of Dec 31, 2015) Mined (reconciled) Variations (Mined vs Reserves)
Diluted Tonnes
Diluted Grade
Diluted Ounces
ReconciledTonnes
ReconciledGrade
ReconciledOunces Tonnes Grade Ounces
Total Development Q3 24,571 4.82 3,807 29,741 6.12 5,853 121% 127% 154%
Total Stope Q3 34,211 7.07 7,778 37,906 8.26 10,063 111% 117% 129%
Total U/G Q3 58,782 6.13 11,585 67,647 7.32 15,916 115% 119% 137%
In-line production in Q3; Higher than planned milled grades of 7.70 g/t
Positive reconciliation of 37%: (19% grade / 15% tonnes)
Percentage of higher cost development ore to total ore of 49% YTD; 2016 plan of 40%
Development primarily in lower-grade extensions of the second mining horizon
YTD reconciliation from mining in first and second mining horizons only. Development in ore initiated in higher grade third mining horizon in Q4
Reserves (as of Dec 31, 2015) Mined (reconciled) Variations (Mined vs Reserves)
Diluted Tonnes
Diluted Grade
Diluted Ounces
ReconciledTonnes
ReconciledGrade
ReconciledOunces Tonnes Grade Ounces
Total Development 2016 113,399 6.33 23,094 112,522 8.23 29,756 99% 130% 129%
Total Stope 2016 101,539 7.53 24,596 115,642 8.99 33,427 114% 119% 136%
Total U/G 2016 214,938 6.90 47,690 228,164 8.61 63,183 106% 125% 132%
Q3 Reserve Reconciliation
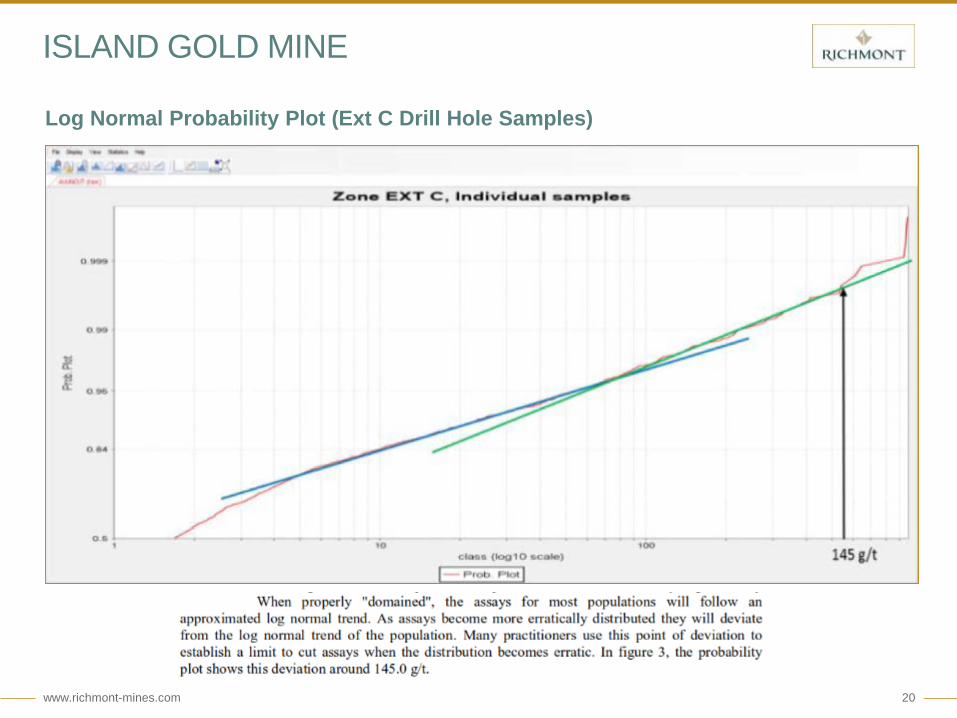
The reconciliation to date is based on mining in the first and second mining horizons only, and should not be extrapolated to the third and fourth mining horizons.
www.richmont-mines.com 19
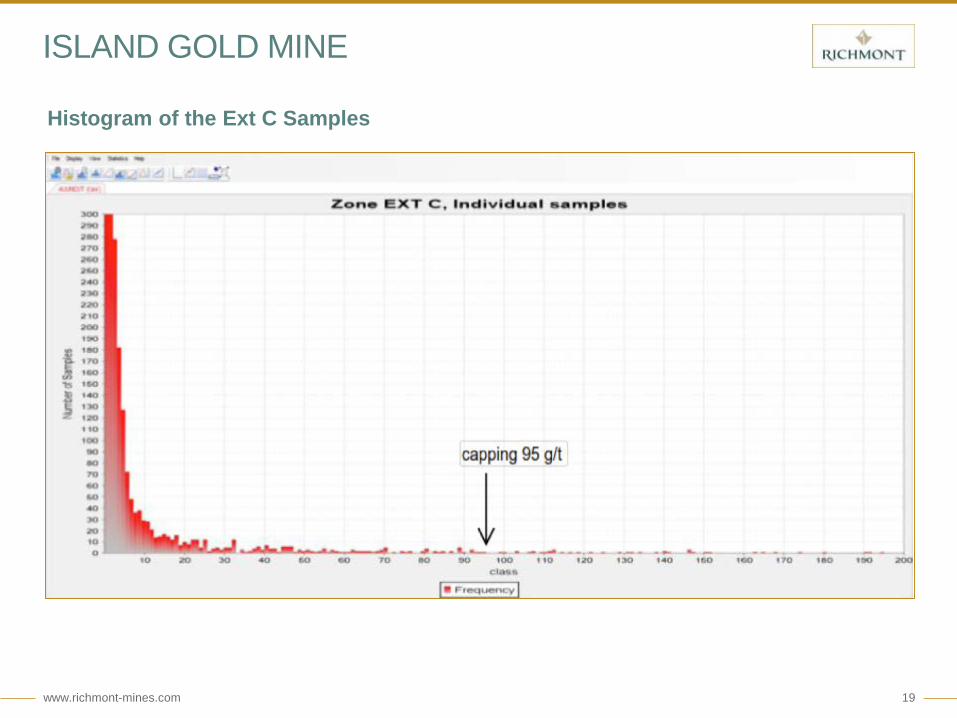
ISLAND GOLD MINE
Histogram of the Ext C Samples
www.richmont-mines.com 20
ISLAND GOLD MINE
Log Normal Probability Plot (Ext C Drill Hole Samples)
www.richmont-mines.com 21
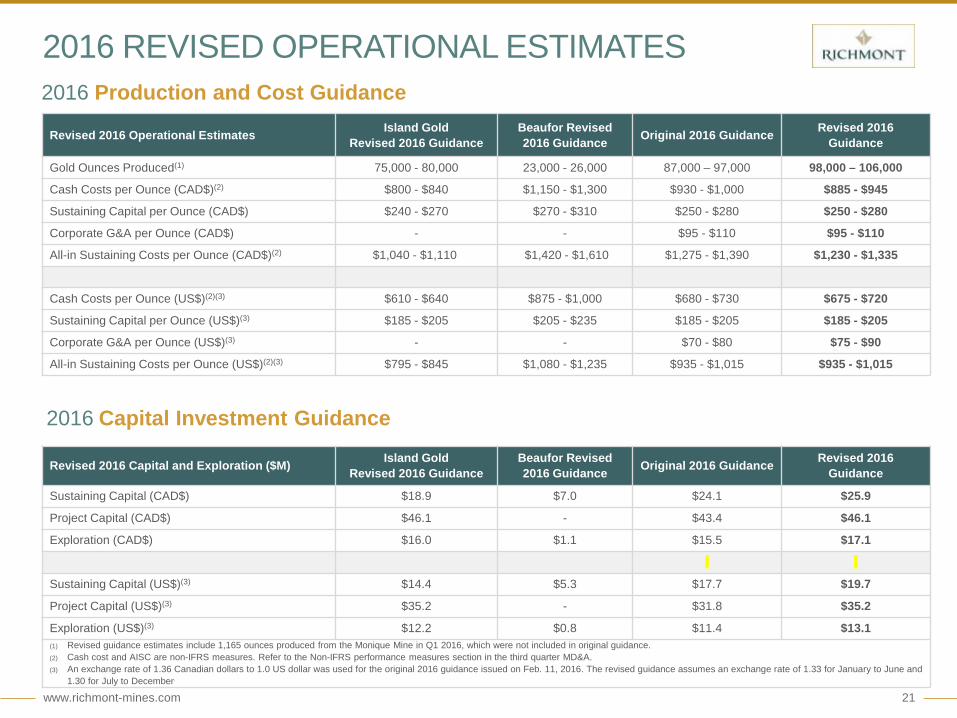
2016 REVISED OPERATIONAL ESTIMATES2016 Production and Cost Guidance
2016 Capital Investment Guidance
Revised 2016 Operational Estimates Island GoldRevised 2016 Guidance
Beaufor Revised 2016 Guidance Original 2016 Guidance Revised 2016
Guidance
Gold Ounces Produced(1) 75,000 - 80,000 23,000 - 26,000 87,000 – 97,000 98,000 – 106,000
Cash Costs per Ounce (CAD$)(2) $800 - $840 $1,150 - $1,300 $930 - $1,000 $885 - $945
Sustaining Capital per Ounce (CAD$) $240 - $270 $270 - $310 $250 - $280 $250 - $280
Corporate G&A per Ounce (CAD$) - - $95 - $110 $95 - $110
All-in Sustaining Costs per Ounce (CAD$)(2) $1,040 - $1,110 $1,420 - $1,610 $1,275 - $1,390 $1,230 - $1,335
Cash Costs per Ounce (US$)(2)(3) $610 - $640 $875 - $1,000 $680 - $730 $675 - $720
Sustaining Capital per Ounce (US$)(3) $185 - $205 $205 - $235 $185 - $205 $185 - $205
Corporate G&A per Ounce (US$)(3) - - $70 - $80 $75 - $90
All-in Sustaining Costs per Ounce (US$)(2)(3) $795 - $845 $1,080 - $1,235 $935 - $1,015 $935 - $1,015
Revised 2016 Capital and Exploration ($M) Island GoldRevised 2016 Guidance
Beaufor Revised 2016 Guidance Original 2016 Guidance Revised 2016
Guidance
Sustaining Capital (CAD$) $18.9 $7.0 $24.1 $25.9
Project Capital (CAD$) $46.1 - $43.4 $46.1
Exploration (CAD$) $16.0 $1.1 $15.5 $17.1
Sustaining Capital (US$)(3) $14.4 $5.3 $17.7 $19.7
Project Capital (US$)(3) $35.2 - $31.8 $35.2
Exploration (US$)(3) $12.2 $0.8 $11.4 $13.1(1) Revised guidance estimates include 1,165 ounces produced from the Monique Mine in Q1 2016, which were not included in original guidance.(2) Cash cost and AISC are non-IFRS measures. Refer to the Non-IFRS performance measures section in the third quarter MD&A.(3) An exchange rate of 1.36 Canadian dollars to 1.0 US dollar was used for the original 2016 guidance issued on Feb. 11, 2016. The revised guidance assumes an exchange rate of 1.33 for January to June and
1.30 for July to December.
www.richmont-mines.com 22
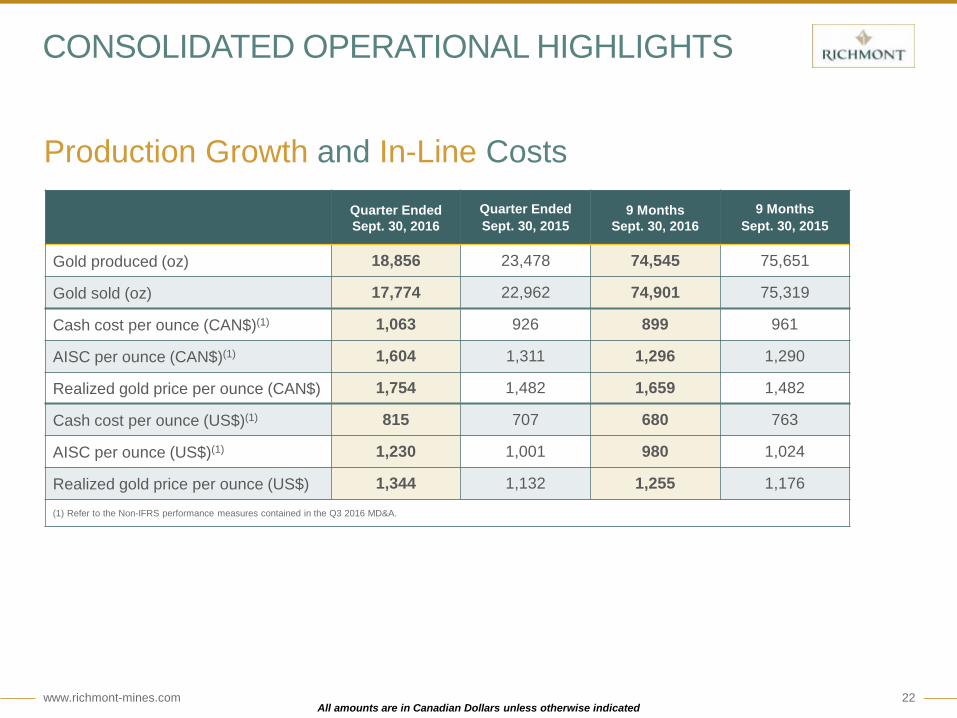
CONSOLIDATED OPERATIONAL HIGHLIGHTS
Production Growth and In-Line CostsQuarter EndedSept. 30, 2016
Quarter EndedSept. 30, 2015
9 MonthsSept. 30, 2016
9 MonthsSept. 30, 2015
Gold produced (oz) 18,856 23,478 74,545 75,651
Gold sold (oz) 17,774 22,962 74,901 75,319
Cash cost per ounce (CAN$)(1) 1,063 926 899 961
AISC per ounce (CAN$)(1) 1,604 1,311 1,296 1,290
Realized gold price per ounce (CAN$) 1,754 1,482 1,659 1,482
Cash cost per ounce (US$)(1) 815 707 680 763
AISC per ounce (US$)(1) 1,230 1,001 980 1,024
Realized gold price per ounce (US$) 1,344 1,132 1,255 1,176
(1) Refer to the Non-IFRS performance measures contained in the Q3 2016 MD&A.
All amounts are in Canadian Dollars unless otherwise indicated


![Presentation - Q3 FY 2015-16 [Company Update]](https://static.fdocuments.es/doc/165x107/577ca58d1a28abea748b9589/presentation-q3-fy-2015-16-company-update.jpg)