1701 fun investor presentation
34
Cedar Fair (NYSE: FUN) INVESTOR PRESENTATION – January 2017
-
Upload
cedarfair -
Category
Investor Relations
-
view
2.403 -
download
1
Transcript of 1701 fun investor presentation
Cedar Fair (NYSE: FUN)INVESTOR PRESENTATION – January 2017
FORWARD-LOOKING STATEMENTS
Some slides and comments included here, particularly related to estimates, comments on expectations about future performance or business conditions, may contain “forward-looking statements” within the meaning of the federal securities laws which involve risks and uncertainties. You can identify forward-looking statements because they contain words such as “believes,” “project,” “might,” “expects,” “may,” “will,” “should,” “seeks,” “approximately,” “intends,” “plans,” “estimates” or “anticipates” or similar expressions that concern our strategy, plans or intentions. These forward-looking statements are subject to risks and uncertainties that may change at anytime, and could cause actual results to differ materially from those that we anticipate. While we believe that the expectations reflected in such forward-looking statements are reasonable, we caution that it is very difficult to predict the impact of unknown factors, and it is impossible for us to anticipate all factors that could affect our actual results. Important factors, including those listed under Item 1A in the Partnership’s Form 10-K could adversely affect our future financial performance and cause actual results to differ materially from our expectations.
2
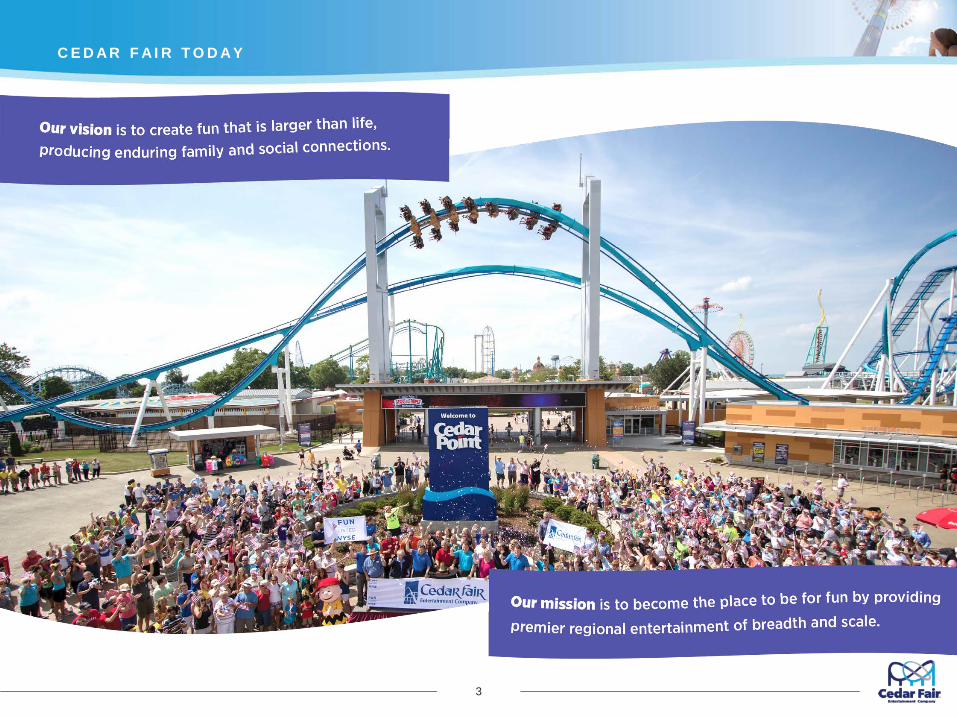
C E D A R F A I R T O D A Y
3
C E D A R F A I R T O D A Y
4
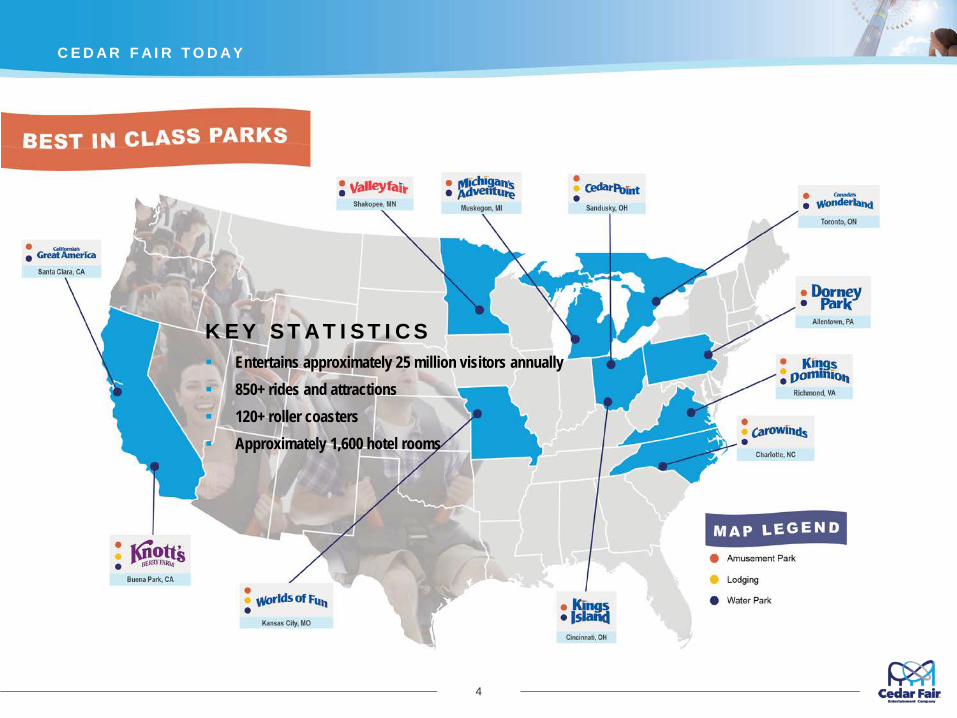
KEY STATISTICS Entertains approximately 25 million visitors annually 850+ rides and attractions 120+ roller coasters Approximately 1,600 hotel rooms
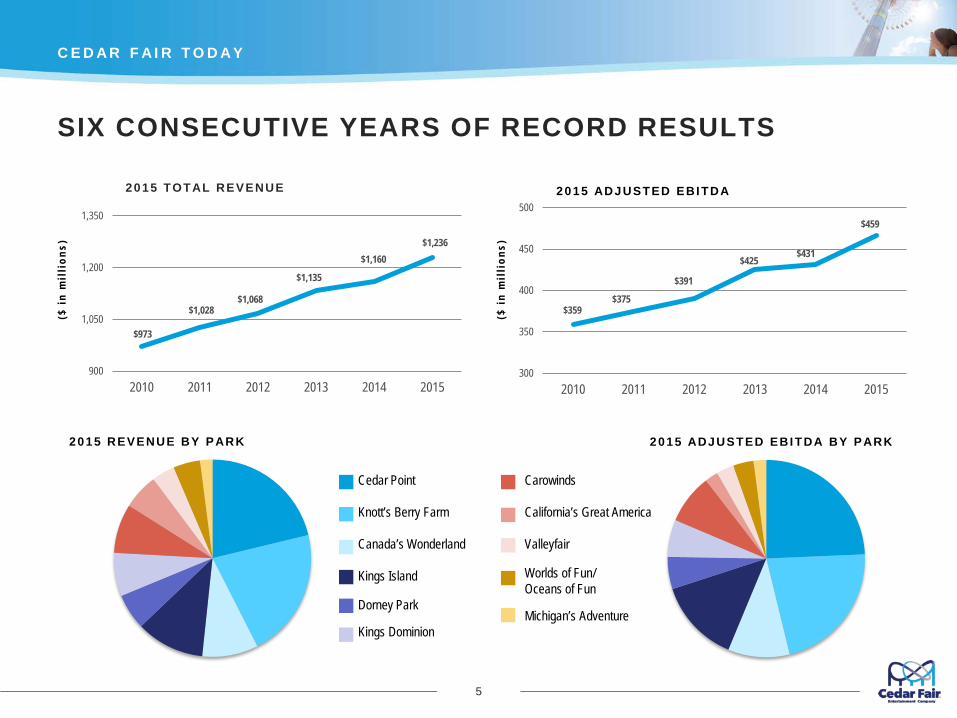
SIX CONSECUTIVE YEARS OF RECORD RESULTS
900
1,050
1,200
1,350
2010 2011 2012 2013 2014 2015
2015 TOTAL REVENUE
$1,135
C E D A R F A I R T O D A Y
5
($ i
n m
illi
ons)
300
350
400
450
500
2010 2011 2012 2013 2014 2015
2015 ADJUSTED EBITDA
($ i
n m
illi
ons)
$973
$1,028$1,068
$1,160$1,236
$359$375
$391
$425$431
$459
2015 REVENUE BY PARK 2015 ADJUSTED EBITDA BY PARK
Cedar Point
Knott’s Berry Farm
Canada’s Wonderland
Kings Island
Dorney Park
Kings Dominion
Carowinds
California’s Great America
Valleyfair
Worlds of Fun/Oceans of Fun
Michigan’s Adventure
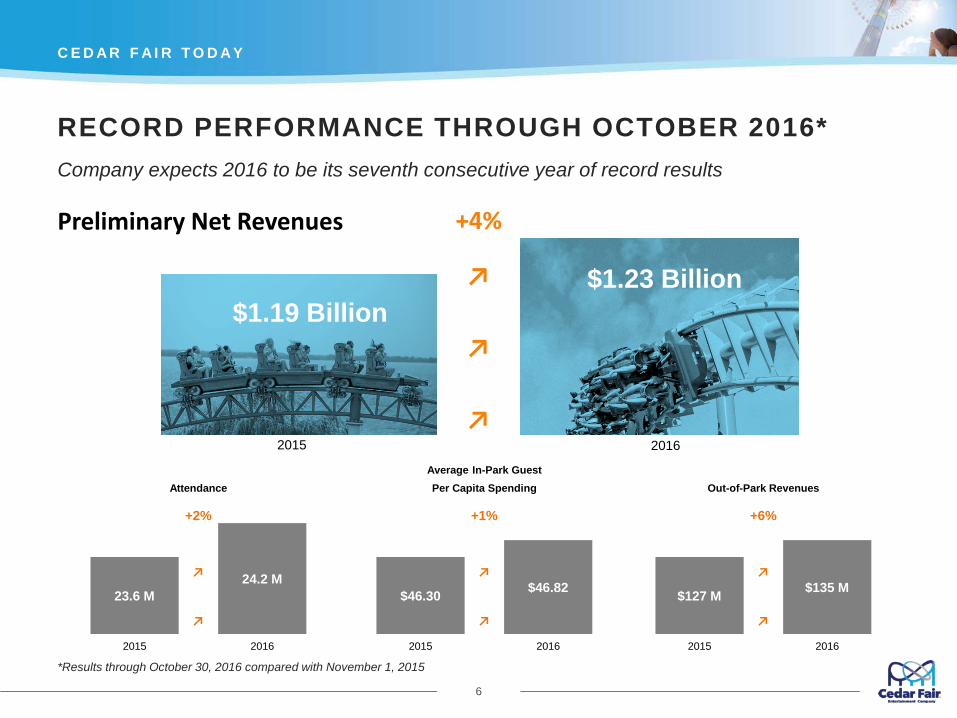
RECORD PERFORMANCE THROUGH OCTOBER 2016*
C E D A R F A I R T O D A Y
6
*Results through October 30, 2016 compared with November 1, 2015
Company expects 2016 to be its seventh consecutive year of record results
Preliminary Net Revenues
$1.23 Billion
2016
$1.19 Billion
+4%
↗
↗
↗2015
Average In-Park Guest Attendance Per Capita Spending Out-of-Park Revenues
+2% +1% +6%
24.2 M $46.82 $135 M23.6 M
↗
$46.30
↗
$127 M
↗
↗ ↗ ↗
2015 2016 2015 2016 2015 2016
C E D A R F A I R T O D A Y
7
Why Invest in FUN?
8
GREAT PARKS, GREAT PEOPLE, GREAT BUSINESS
High-quality assets with high barriers to entry
Well-run parks with a focus on operating excellence
Combination of world-class thrill rides and unique, family-oriented attractions appeal to a diverse customer base
Value proposition creates loyal and repeat customers
Stable, recession-resistant business with proven strategy driving organic growth
MLP structure allows for tax-efficient return of capital to unitholders
History of impressive total returns
Balanced approach to capital allocation
FUNforward 2.0 provides the next generation of growth
W H Y I N V E S T I N F U N ?
9
SUPERIOR TRACK RECORD, FOUNDATION FOR GROWTH
History of success through multiple economic cycles
Revenues increased in 19 of past 20 years
EBITDA growth of approximately 4% CAGR since 2007 and 5.3% CAGR since 2011
Strong, consistent cash flow
Five consecutive years of record average in-park guest per capita spending
Increasing attendance trends
$2.2 billion total distributions paid to unitholders over 30-year period
Compound annual total return to investors of 17% since going public in 1987
No near-term financing or covenant concerns
W H Y I N V E S T I N F U N ?
10
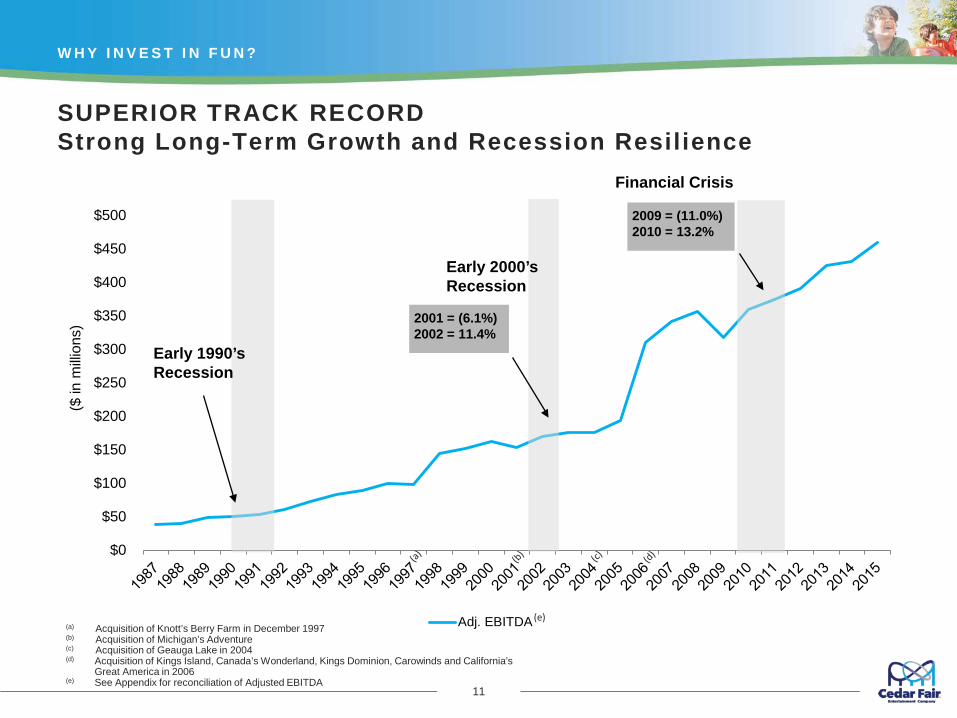
SUPERIOR TRACK RECORDStrong Long-Term Growth and Recession Resilience
W H Y I N V E S T I N F U N ?
11
$0
$50
$100
$150
$200
$250
$300
$350
$400
$450
$500
($ in
milli
ons)
Adj. EBITDA
Financial Crisis
2001 = (6.1%) 2002 = 11.4%
2009 = (11.0%) 2010 = 13.2%
Early 2000’s Recession
Early 1990’s Recession
(a) Acquisition of Knott’s Berry Farm in December 1997(b) Acquisition of Michigan’s Adventure(c) Acquisition of Geauga Lake in 2004(d) Acquisition of Kings Island, Canada’s Wonderland, Kings Dominion, Carowinds and California’s
Great America in 2006(e) See Appendix for reconciliation of Adjusted EBITDA
(e)
FUNforward 2.0
12
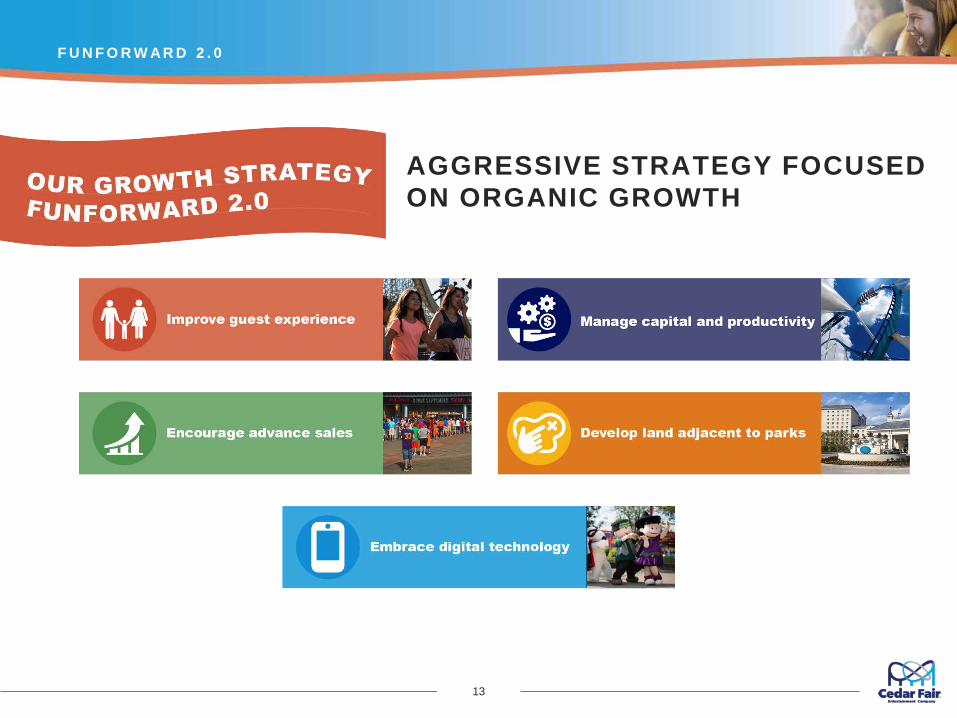
AGGRESSIVE STRATEGY FOCUSED ON ORGANIC GROWTH
F U N F O R W AR D 2 . 0
13
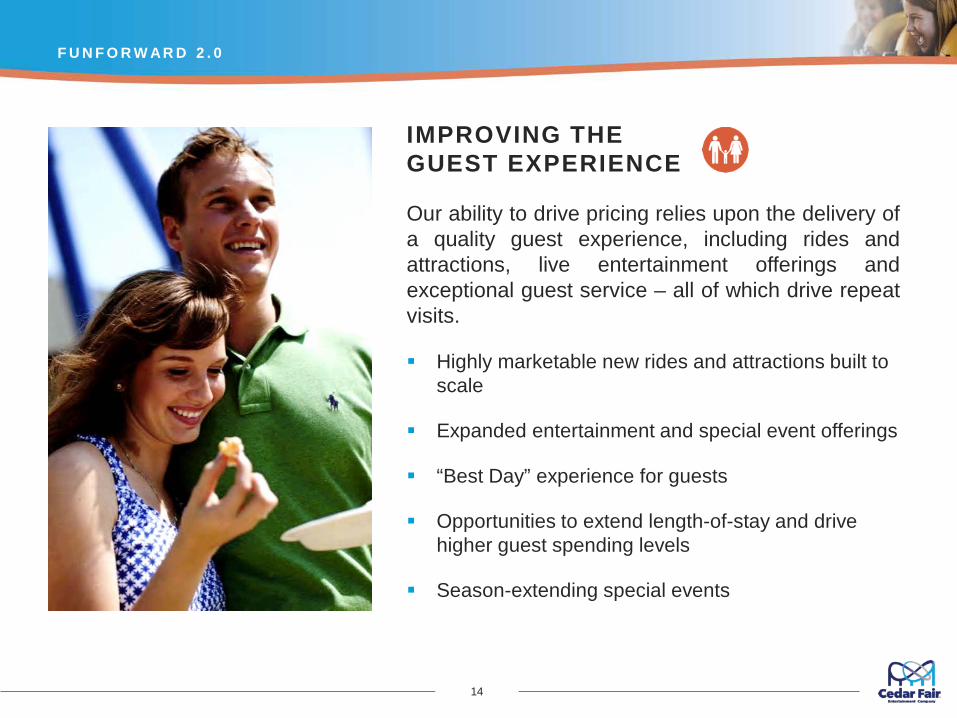
IMPROVING THE GUEST EXPERIENCE
Our ability to drive pricing relies upon the delivery ofa quality guest experience, including rides andattractions, live entertainment offerings andexceptional guest service – all of which drive repeatvisits.
Highly marketable new rides and attractions built to scale
Expanded entertainment and special event offerings
“Best Day” experience for guests
Opportunities to extend length-of-stay and drive higher guest spending levels
Season-extending special events
F U N F O R W AR D 2 . 0
14
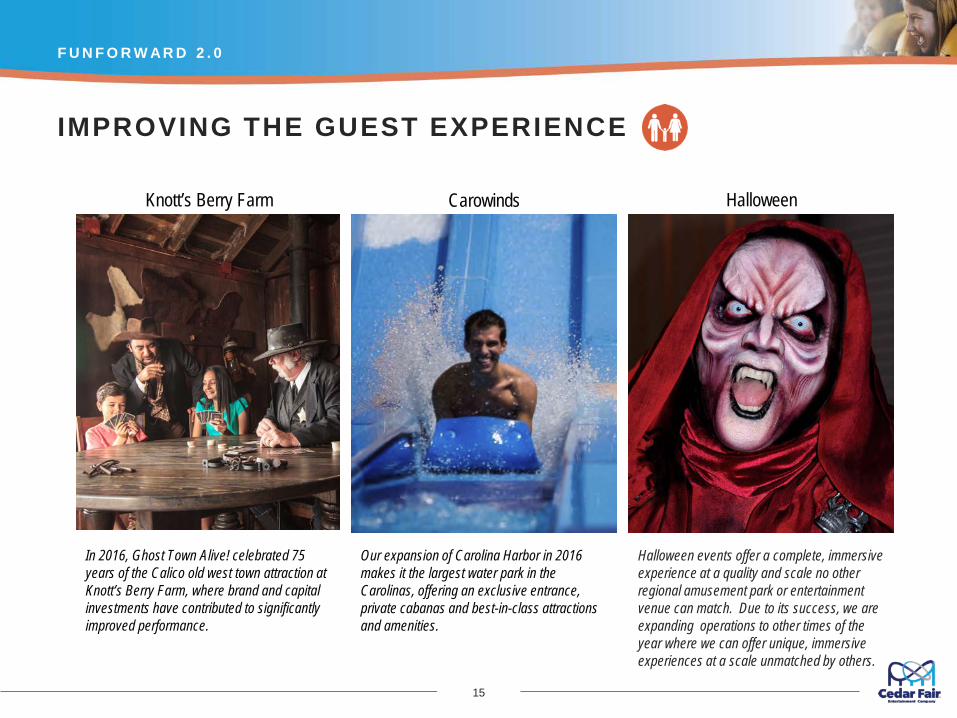
In 2016, Ghost Town Alive! celebrated 75 years of the Calico old west town attraction at Knott’s Berry Farm, where brand and capital investments have contributed to significantly improved performance.
F U N F O R W AR D 2 . 0
15
Our expansion of Carolina Harbor in 2016 makes it the largest water park in the Carolinas, offering an exclusive entrance, private cabanas and best-in-class attractions and amenities.
Halloween events offer a complete, immersive experience at a quality and scale no other regional amusement park or entertainment venue can match. Due to its success, we are expanding operations to other times of the year where we can offer unique, immersive experiences at a scale unmatched by others.
IMPROVING THE GUEST EXPERIENCE
Knott’s Berry Farm Carowinds Halloween
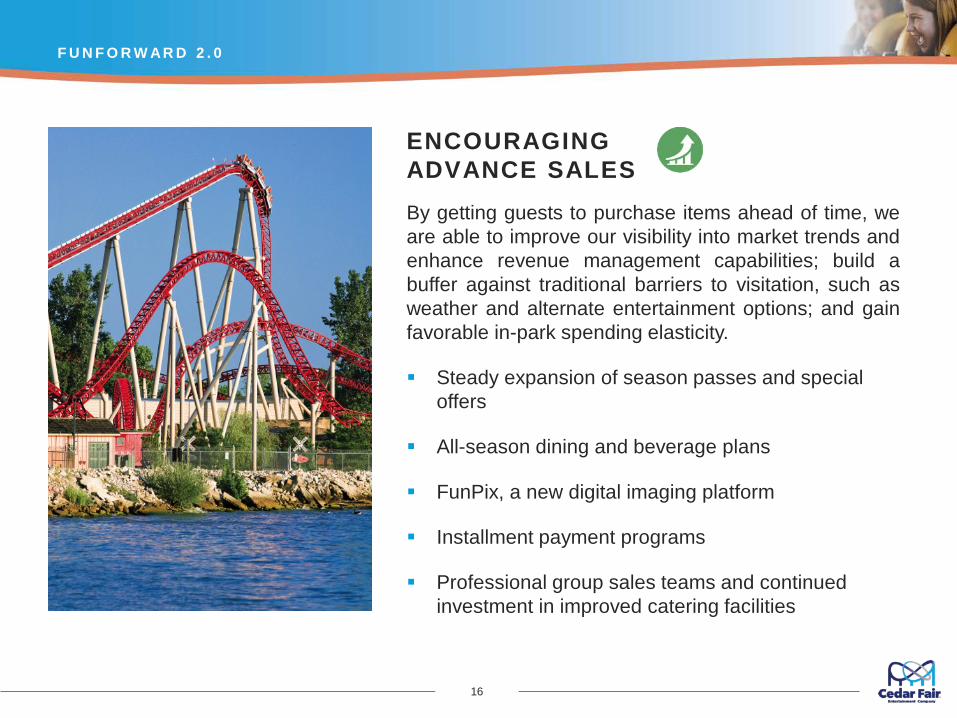
ENCOURAGING ADVANCE SALES By getting guests to purchase items ahead of time, weare able to improve our visibility into market trends andenhance revenue management capabilities; build abuffer against traditional barriers to visitation, such asweather and alternate entertainment options; and gainfavorable in-park spending elasticity.
Steady expansion of season passes and special offers
All-season dining and beverage plans
FunPix, a new digital imaging platform
Installment payment programs
Professional group sales teams and continued investment in improved catering facilities
F U N F O R W AR D 2 . 0
16
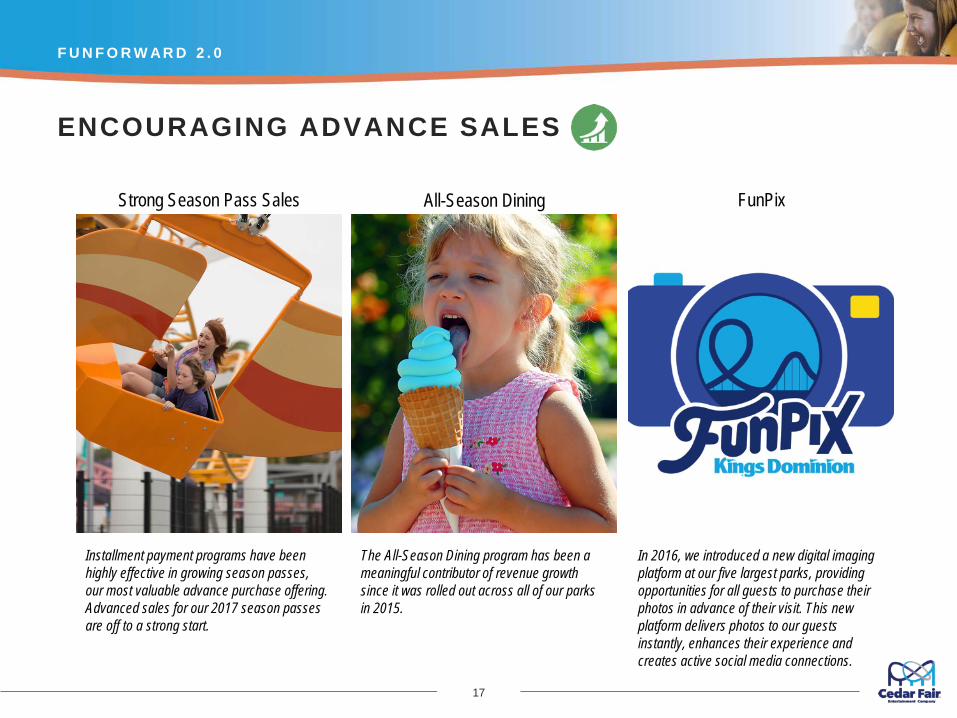
Installment payment programs have beenhighly effective in growing season passes,our most valuable advance purchase offering. Advanced sales for our 2017 season passes are off to a strong start.
F U N F O R W AR D 2 . 0
17
The All-Season Dining program has been a meaningful contributor of revenue growth since it was rolled out across all of our parks in 2015.
In 2016, we introduced a new digital imaging platform at our five largest parks, providing opportunities for all guests to purchase their photos in advance of their visit. This new platform delivers photos to our guests instantly, enhances their experience and creates active social media connections.
ENCOURAGING ADVANCE SALES
Strong Season Pass Sales All-Season Dining FunPix
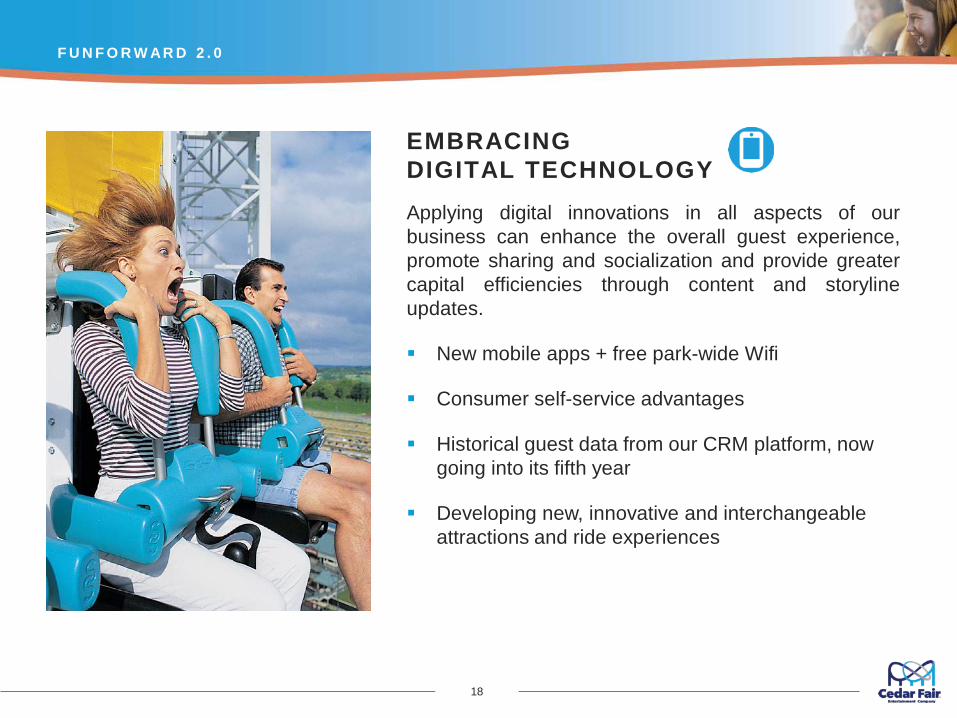
EMBRACING DIGITAL TECHNOLOGYApplying digital innovations in all aspects of ourbusiness can enhance the overall guest experience,promote sharing and socialization and provide greatercapital efficiencies through content and storylineupdates.
New mobile apps + free park-wide Wifi
Consumer self-service advantages
Historical guest data from our CRM platform, now going into its fifth year
Developing new, innovative and interchangeable attractions and ride experiences
F U N F O R W AR D 2 . 0
18
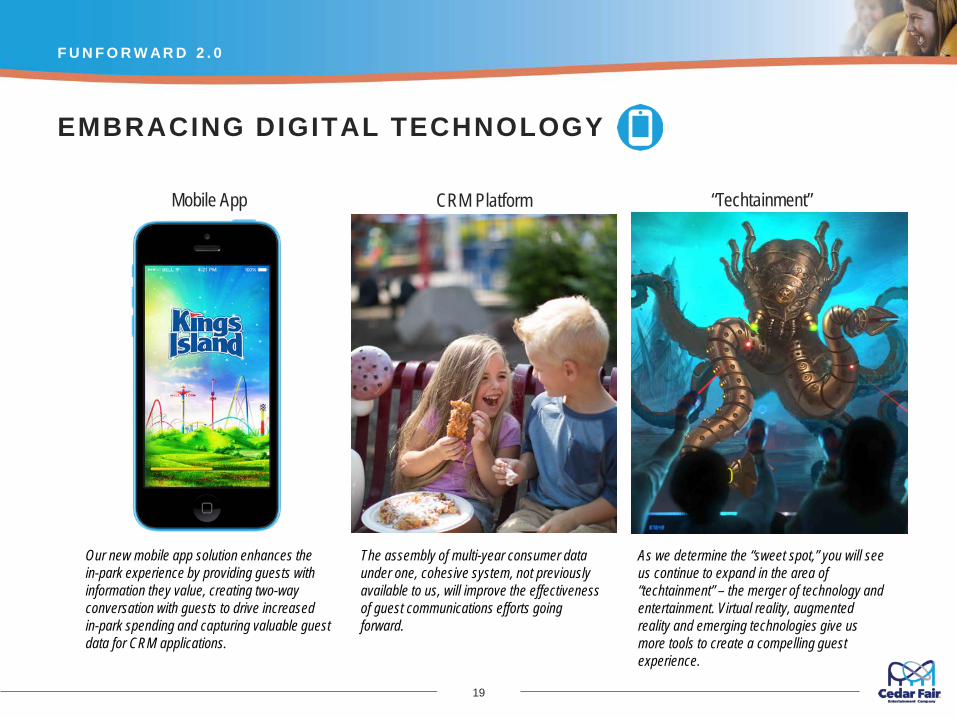
Our new mobile app solution enhances the in-park experience by providing guests with information they value, creating two-way conversation with guests to drive increased in-park spending and capturing valuable guest data for CRM applications.
F U N F O R W AR D 2 . 0
19
The assembly of multi-year consumer data under one, cohesive system, not previously available to us, will improve the effectiveness of guest communications efforts going forward.
As we determine the “sweet spot,” you will see us continue to expand in the area of “techtainment” – the merger of technology and entertainment. Virtual reality, augmented reality and emerging technologies give us more tools to create a compelling guest experience.
EMBRACING DIGITAL TECHNOLOGY
Mobile App CRM Platform “Techtainment”
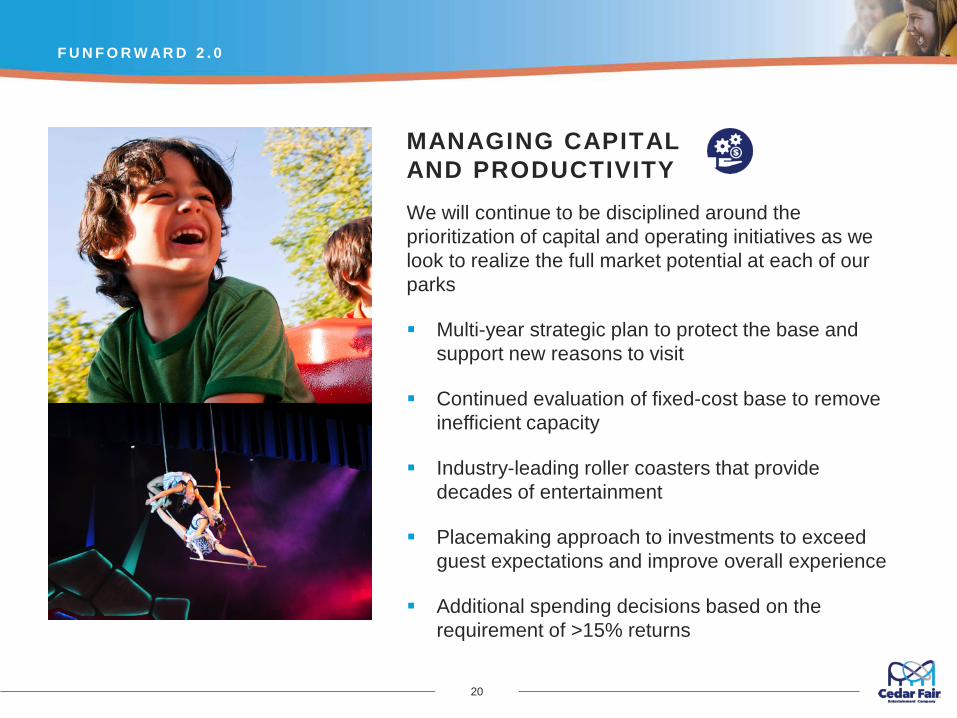
MANAGING CAPITAL AND PRODUCTIVITYWe will continue to be disciplined around the prioritization of capital and operating initiatives as we look to realize the full market potential at each of our parks
Multi-year strategic plan to protect the base and support new reasons to visit
Continued evaluation of fixed-cost base to remove inefficient capacity
Industry-leading roller coasters that provide decades of entertainment
Placemaking approach to investments to exceed guest expectations and improve overall experience
Additional spending decisions based on the requirement of >15% returns
F U N F O R W AR D 2 . 0
20
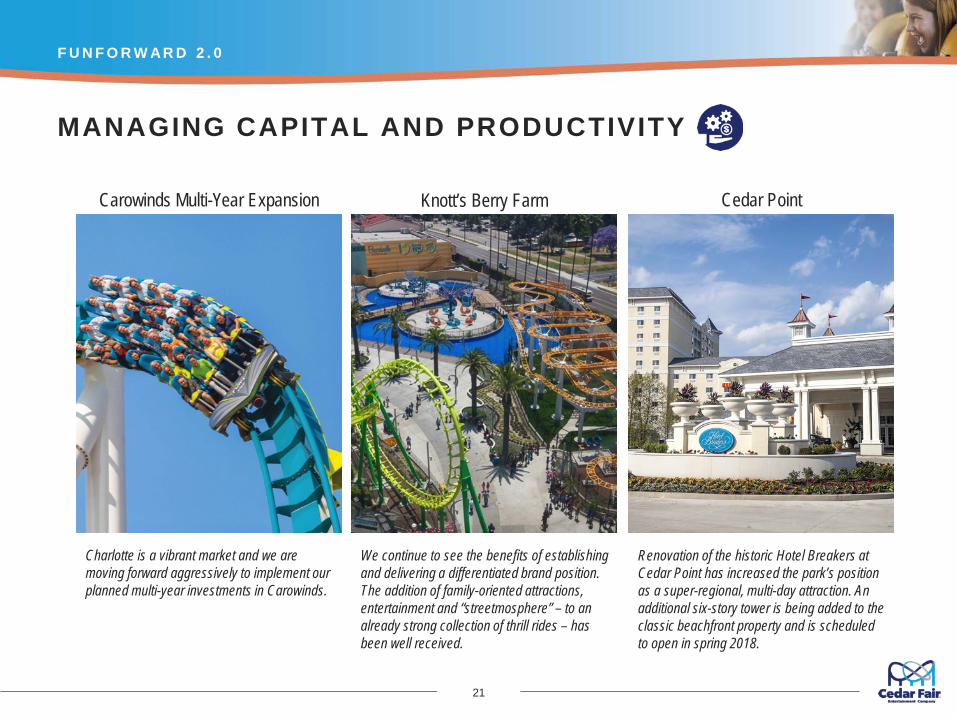
Charlotte is a vibrant market and we are moving forward aggressively to implement our planned multi-year investments in Carowinds.
F U N F O R W AR D 2 . 0
21
We continue to see the benefits of establishing and delivering a differentiated brand position. The addition of family-oriented attractions, entertainment and “streetmosphere” – to an already strong collection of thrill rides – has been well received.
Renovation of the historic Hotel Breakers at Cedar Point has increased the park’s position as a super-regional, multi-day attraction. An additional six-story tower is being added to the classic beachfront property and is scheduled to open in spring 2018.
MANAGING CAPITAL AND PRODUCTIVITY
Carowinds Multi-Year Expansion Knott’s Berry Farm Cedar Point
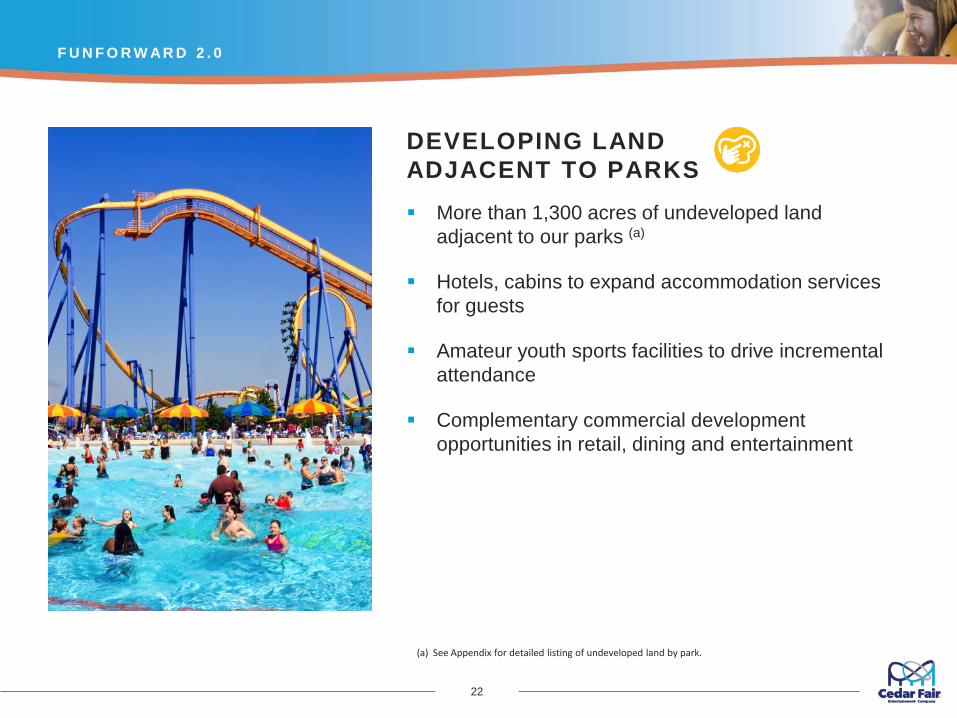
DEVELOPING LAND ADJACENT TO PARKS More than 1,300 acres of undeveloped land
adjacent to our parks (a)
Hotels, cabins to expand accommodation services for guests
Amateur youth sports facilities to drive incremental attendance
Complementary commercial development opportunities in retail, dining and entertainment
F U N F O R W AR D 2 . 0
22
(a) See Appendix for detailed listing of undeveloped land by park.
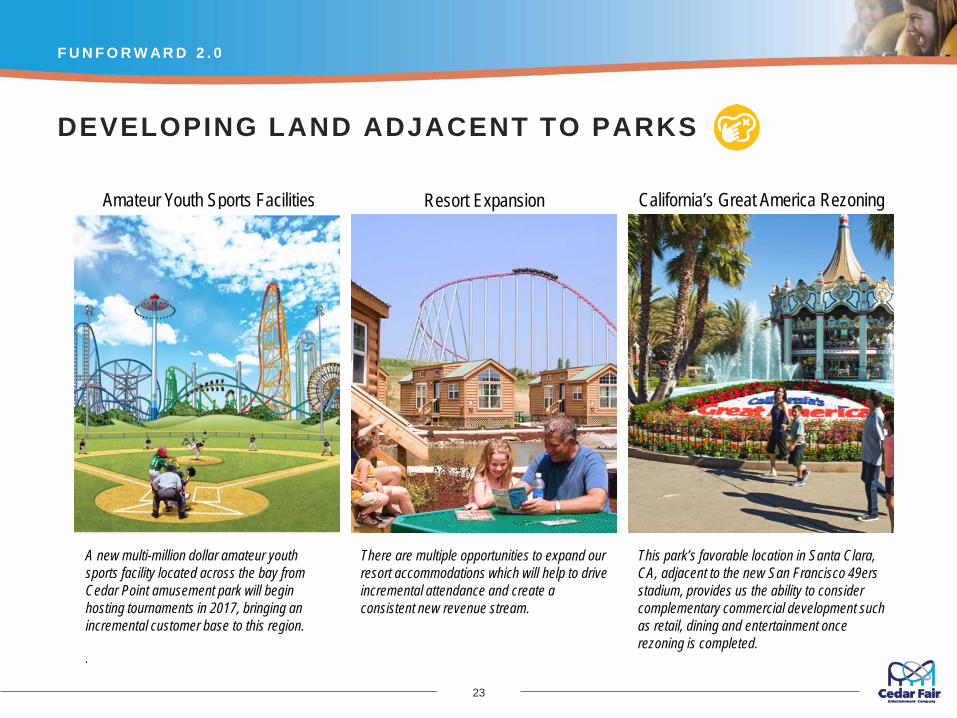
A new multi-million dollar amateur youth sports facility located across the bay from Cedar Point amusement park will begin hosting tournaments in 2017, bringing an incremental customer base to this region.
.
F U N F O R W AR D 2 . 0
23
There are multiple opportunities to expand our resort accommodations which will help to drive incremental attendance and create a consistent new revenue stream.
This park’s favorable location in Santa Clara, CA, adjacent to the new San Francisco 49ers stadium, provides us the ability to consider complementary commercial development such as retail, dining and entertainment once rezoning is completed.
DEVELOPING LAND ADJACENT TO PARKS
Amateur Youth Sports Facilities Resort Expansion California’s Great America Rezoning
The FUN Continues
24
T H E F U N C O N T I N U E S
25
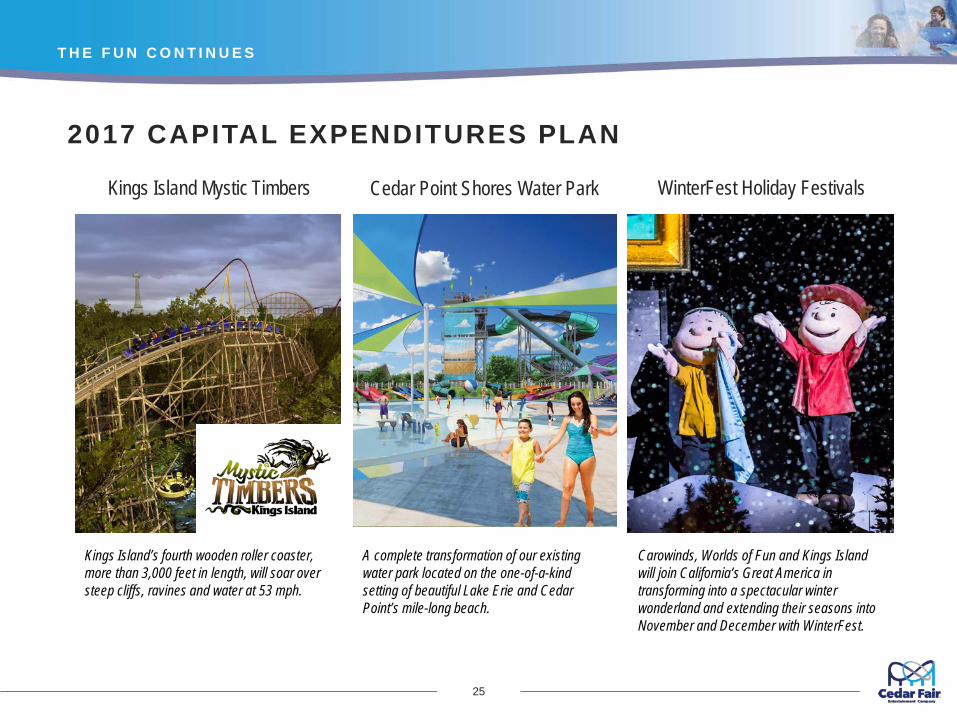
2017 CAPITAL EXPENDITURES PLAN
Kings Island Mystic Timbers Cedar Point Shores Water Park WinterFest Holiday Festivals
Kings Island’s fourth wooden roller coaster, more than 3,000 feet in length, will soar over steep cliffs, ravines and water at 53 mph.
A complete transformation of our existing water park located on the one-of-a-kind setting of beautiful Lake Erie and Cedar Point’s mile-long beach.
Carowinds, Worlds of Fun and Kings Island will join California’s Great America in transforming into a spectacular winter wonderland and extending their seasons into November and December with WinterFest.
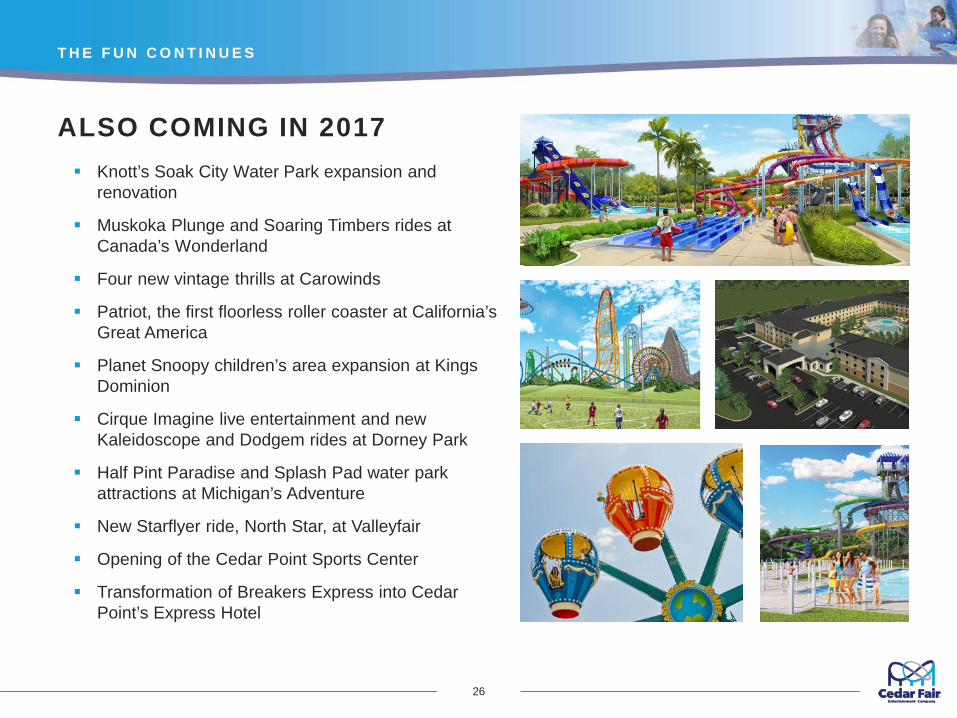
ALSO COMING IN 2017
T H E F U N C O N T I N U E S
26
Knott’s Soak City Water Park expansion and renovation
Muskoka Plunge and Soaring Timbers rides at Canada’s Wonderland
Four new vintage thrills at Carowinds
Patriot, the first floorless roller coaster at California’s Great America
Planet Snoopy children’s area expansion at Kings Dominion
Cirque Imagine live entertainment and new Kaleidoscope and Dodgem rides at Dorney Park
Half Pint Paradise and Splash Pad water park attractions at Michigan’s Adventure
New Starflyer ride, North Star, at Valleyfair
Opening of the Cedar Point Sports Center
Transformation of Breakers Express into Cedar Point’s Express Hotel
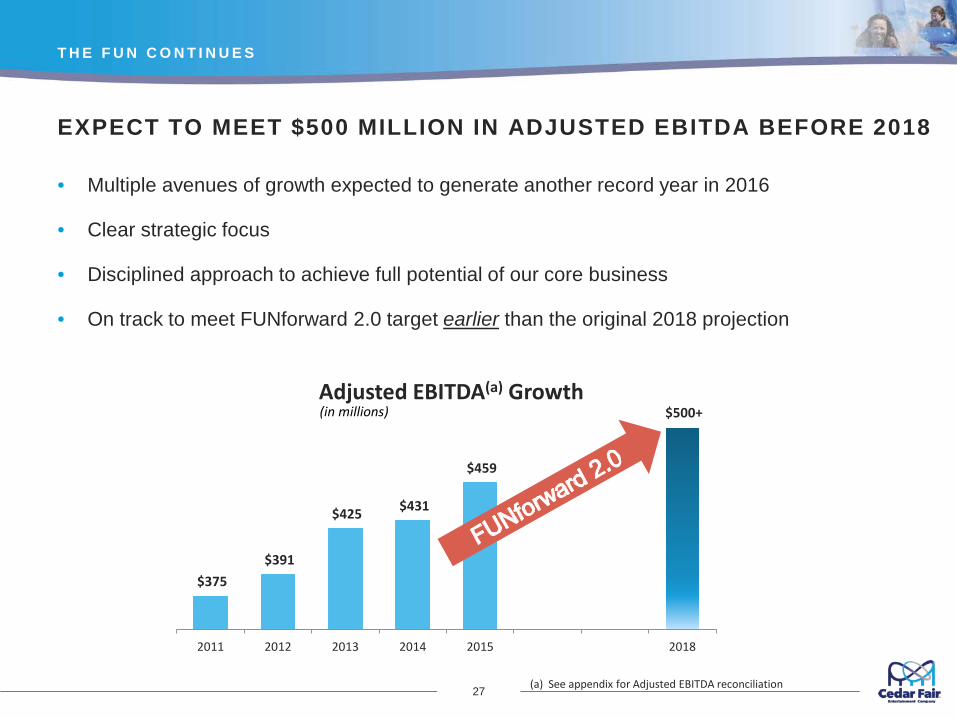
EXPECT TO MEET $500 MILLION IN ADJUSTED EBITDA BEFORE 2018
• Multiple avenues of growth expected to generate another record year in 2016
• Clear strategic focus
• Disciplined approach to achieve full potential of our core business
• On track to meet FUNforward 2.0 target earlier than the original 2018 projection
T H E F U N C O N T I N U E S
27
$375 $391
$425 $431
$459
$500+
2011 2012 2013 2014 2015 2018
Adjusted EBITDA(a) Growth(in millions)
(a) See appendix for Adjusted EBITDA reconciliation
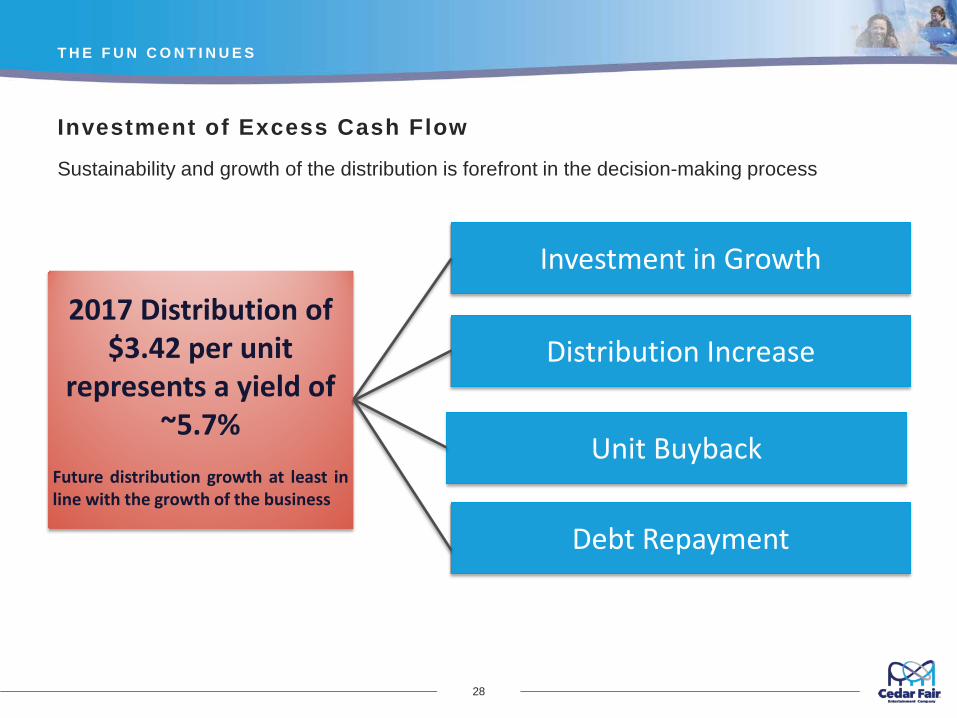
Investment of Excess Cash Flow
Sustainability and growth of the distribution is forefront in the decision-making process
T H E F U N C O N T I N U E S
28
Distribution Increase
Unit Buyback
Investment in Growth
2017 Distribution of $3.42 per unit
represents a yield of ~5.7%
Future distribution growth at least inline with the growth of the business
Debt Repayment
GREAT PARKS, GREAT PEOPLE, GREAT BUSINESS
T H E F U N C O N T I N U E S
29
High-quality assets with high barriers to entry
Well-run parks with a focus on operating excellence
Combination of world-class thrill rides and unique, family-oriented attractions appeal to a diverse customer base
Value proposition creates loyal and repeat customers
Stable, recession-resistant business with proven strategy driving organic growth
MLP structure allows for tax-efficient return of capital to unitholders
History of impressive total returns
Balanced approach to capital allocation
Appendix
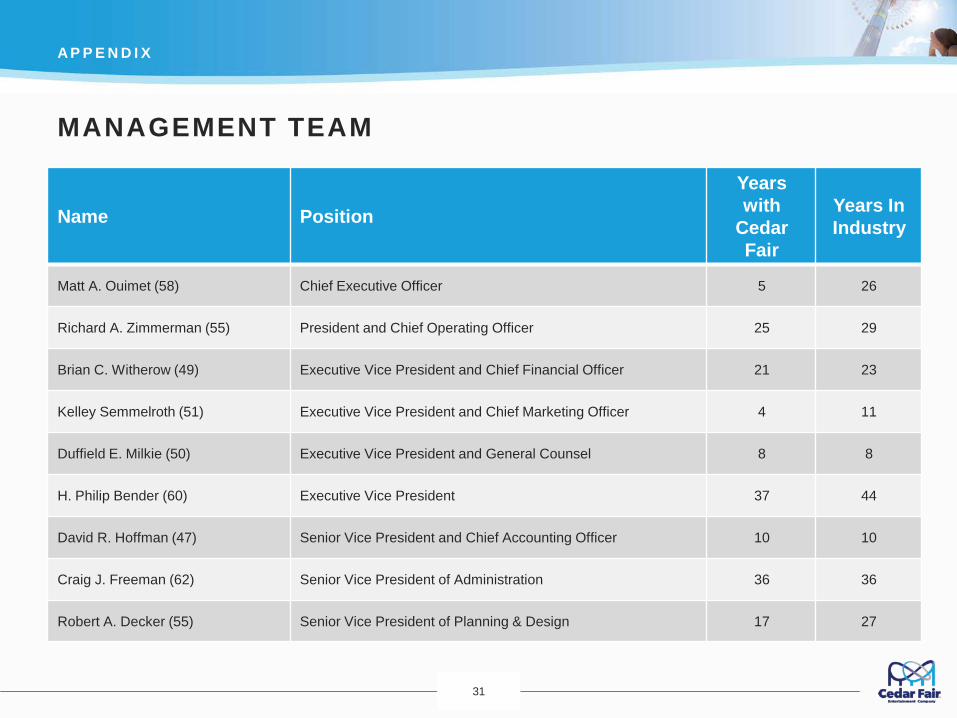
MANAGEMENT TEAM
31
A P P E N D I X
Name Position
Yearswith
Cedar Fair
Years In Industry
Matt A. Ouimet (58) Chief Executive Officer 5 26
Richard A. Zimmerman (55) President and Chief Operating Officer 25 29
Brian C. Witherow (49) Executive Vice President and Chief Financial Officer 21 23
Kelley Semmelroth (51) Executive Vice President and Chief Marketing Officer 4 11
Duffield E. Milkie (50) Executive Vice President and General Counsel 8 8
H. Philip Bender (60) Executive Vice President 37 44
David R. Hoffman (47) Senior Vice President and Chief Accounting Officer 10 10
Craig J. Freeman (62) Senior Vice President of Administration 36 36
Robert A. Decker (55) Senior Vice President of Planning & Design 17 27
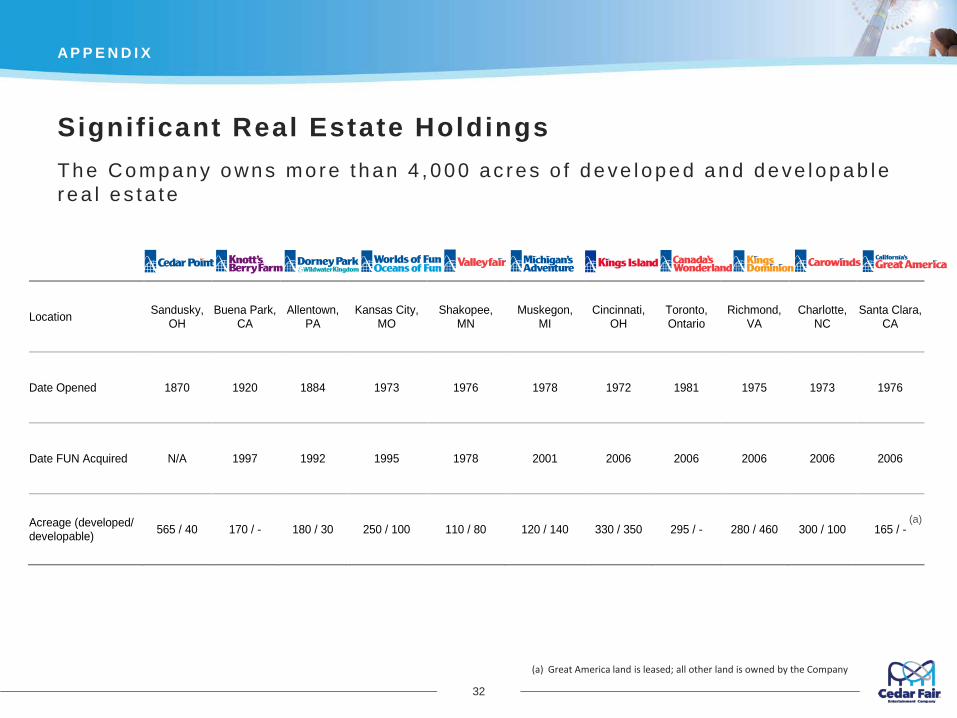
Signif icant Real Estate Holdings
32
A P P E N D I X
Location Sandusky, OH
Buena Park, CA
Allentown, PA
Kansas City, MO
Shakopee, MN
Muskegon, MI
Cincinnati, OH
Toronto, Ontario
Richmond, VA
Charlotte, NC
Santa Clara, CA
Date Opened 1870 1920 1884 1973 1976 1978 1972 1981 1975 1973 1976
Date FUN Acquired N/A 1997 1992 1995 1978 2001 2006 2006 2006 2006 2006
Acreage (developed/ developable) 565 / 40 170 / - 180 / 30 250 / 100 110 / 80 120 / 140 330 / 350 295 / - 280 / 460 300 / 100 165 / -
(a)
(a) Great America land is leased; all other land is owned by the Company
Th e Co mp a n y o wn s mo re t h a n 4 ,0 0 0 a c r e s o f d e ve lo p e d a n d d e ve lo p a b le r e a l e s ta te
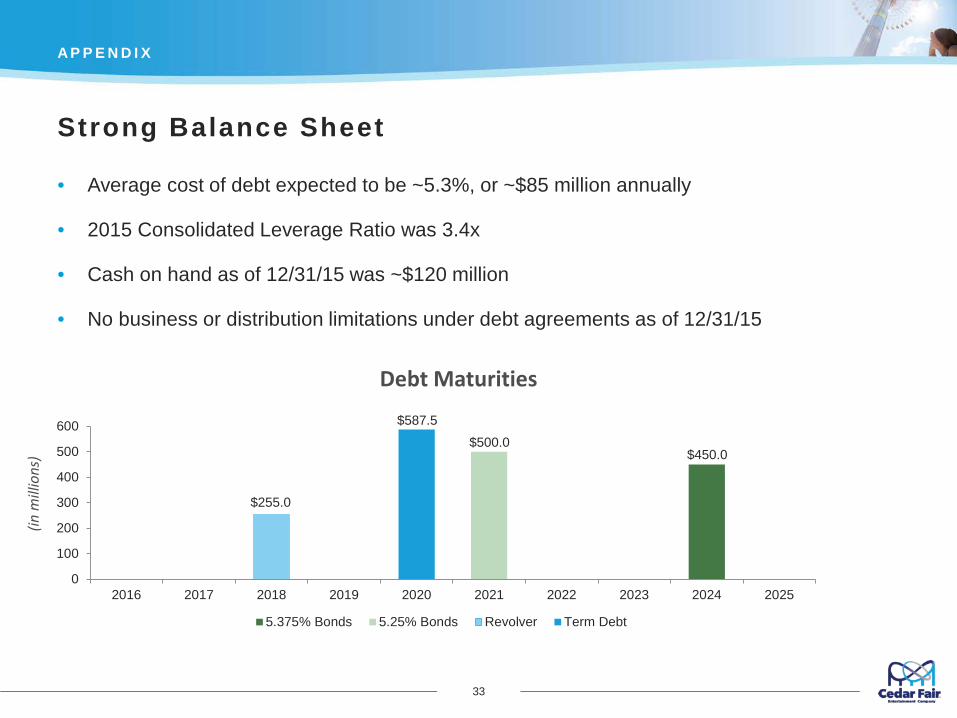
Strong Balance Sheet
33
A P P E N D I X
$450.0 $500.0
$255.0
0
100
200
300
400
500
600
2016 2017 2018 2019 2020 2021 2022 2023 2024 2025
5.375% Bonds 5.25% Bonds Revolver Term Debt
$587.5
Debt Maturities
(in m
illio
ns)
• Average cost of debt expected to be ~5.3%, or ~$85 million annually
• 2015 Consolidated Leverage Ratio was 3.4x
• Cash on hand as of 12/31/15 was ~$120 million
• No business or distribution limitations under debt agreements as of 12/31/15
NON-GAAP RECONCILIATIONS
34
A P P E N D I X
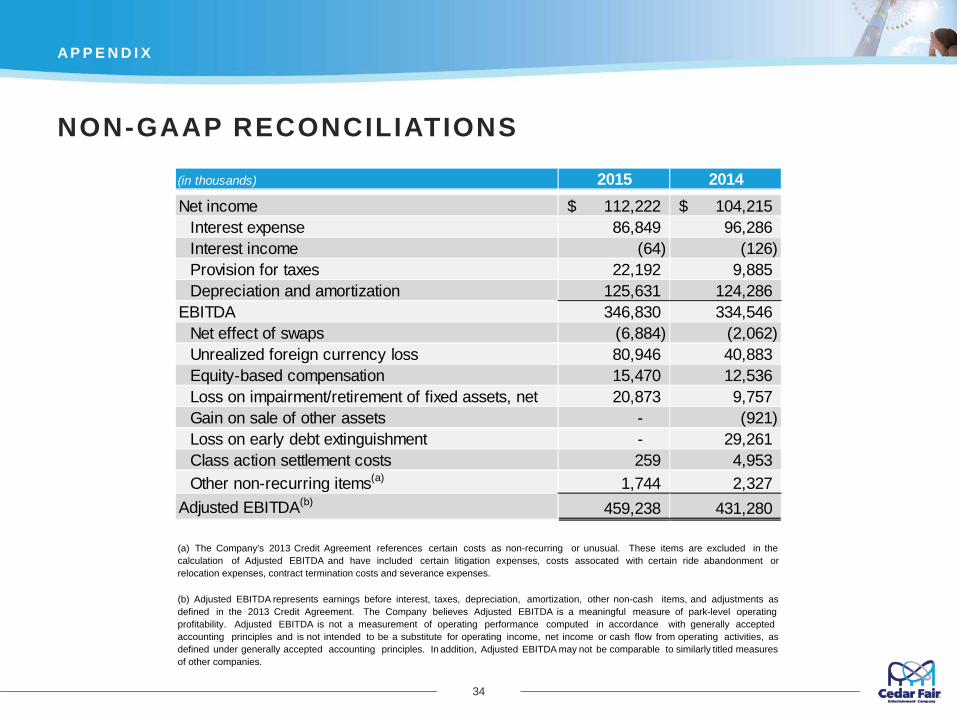
(in thousands) 2015 2014Net income 112,222$ 104,215$
Interest expense 86,849 96,286 Interest income (64) (126) Provision for taxes 22,192 9,885 Depreciation and amortization 125,631 124,286
EBITDA 346,830 334,546 Net effect of swaps (6,884) (2,062) Unrealized foreign currency loss 80,946 40,883 Equity-based compensation 15,470 12,536 Loss on impairment/retirement of fixed assets, net 20,873 9,757 Gain on sale of other assets - (921) Loss on early debt extinguishment - 29,261 Class action settlement costs 259 4,953 Other non-recurring items(a) 1,744 2,327
Adjusted EBITDA(b) 459,238 431,280
(a) The Company's 2013 Credit Agreement references certain costs as non-recurring or unusual. These items are excluded in thecalculation of Adjusted EBITDA and have included certain litigation expenses, costs assocated with certain ride abandonment orrelocation expenses, contract termination costs and severance expenses.
(b) Adjusted EBITDA represents earnings before interest, taxes, depreciation, amortization, other non-cash items, and adjustments asdefined in the 2013 Credit Agreement. The Company believes Adjusted EBITDA is a meaningful measure of park-level operatingprofitability. Adjusted EBITDA is not a measurement of operating performance computed in accordance with generally acceptedaccounting principles and is not intended to be a substitute for operating income, net income or cash flow from operating activities, asdefined under generally accepted accounting principles. In addition, Adjusted EBITDA may not be comparable to similarly titled measuresof other companies.