ADVERTIMENT. Lʼaccés als continguts dʼaquesta tesi queda … · 2017. 9. 21. · C18:0/C16:0 y...
262
ADVERTIMENT. Lʼaccés als continguts dʼaquesta tesi queda condicionat a lʼacceptació de les condicions dʼús establertes per la següent llicència Creative Commons: http://cat.creativecommons.org/?page_id=184 ADVERTENCIA. El acceso a los contenidos de esta tesis queda condicionado a la aceptación de las condiciones de uso establecidas por la siguiente licencia Creative Commons: http://es.creativecommons.org/blog/licencias/ WARNING. The access to the contents of this doctoral thesis it is limited to the acceptance of the use conditions set by the following Creative Commons license: https://creativecommons.org/licenses/?lang=en
Transcript of ADVERTIMENT. Lʼaccés als continguts dʼaquesta tesi queda … · 2017. 9. 21. · C18:0/C16:0 y...
ADVERTIMENT. Lʼaccés als continguts dʼaquesta tesi queda condicionat a lʼacceptació de les condicions dʼúsestablertes per la següent llicència Creative Commons: http://cat.creativecommons.org/?page_id=184
ADVERTENCIA. El acceso a los contenidos de esta tesis queda condicionado a la aceptación de las condiciones de usoestablecidas por la siguiente licencia Creative Commons: http://es.creativecommons.org/blog/licencias/
WARNING. The access to the contents of this doctoral thesis it is limited to the acceptance of the use conditions setby the following Creative Commons license: https://creativecommons.org/licenses/?lang=en

UNIVERSITAT AUTÒNOMA DE BARCELONA
Departament de Ciència Animal i dels Aliments
Facultat de Veterinària
CENTRE DE RECERCA EN AGRIGENÒMICA
Grup de Recerca de Genòmica Animal
GENOMIC AND FUNCTIONAL
GENOMIC ANALYSIS OF FATTY
ACID COMPOSITION IN SWINE
Manuel Revilla Sánchez
Doctoral thesis to obtain the PhD degree in Animal Production of the Universitat Autònoma de Barcelona, May 2017
Supervisors
Dr. Josep Maria Folch Albareda Dr. Maria Ballester Devis


El Dr. Josep Maria Folch Albareda, professor titular del Departament de Ciència Animal i
dels Aliments de la Universitat Autònoma de Barcelona, i la Dra. Maria Ballester Devis,
investigadora del Departament de Genètica i Millora Animal del Institut de Recerca i
Tecnologia Agroalimentàries (IRTA),
fan constar
que el treball de recerca i la redacció de la memòria de la tesi doctoral titulada “Genomic and
functional genomic analysis of fatty acid composition in swine” han estat realitzats sota la seva
direcció per
MANUEL REVILLA SÁNCHEZ i
certifiquen
que aquest treball s’ha dut a terme al Departament de Ciència Animal i del Aliments de la
Facultat de Veterinària de la Universitat Autònoma de Barcelona i a la unitat de Genòmica
Animal del Centre de Recerca en Agrigenòmica,
considerant
que la memòria resultant es apta per optar al grau de Doctor en Producció Animal per la
Universitat Autònoma de Barcelona.
I perqué quedi constància, signen aquest document a Bellaterra,
a 18 de maig de 2017.
Dr. Josep Maria Folch Albareda Dra. Maria Ballester Devis Manuel Revilla Sánchez

This work was funded by the Spanish Ministry of Economy and Competitiveness (grant numbers: AGL2011-29821-C02 and AGL2014-56369-C2). We acknowledge the support of the Spanish Ministry of Economy and Competitiveness for the Centre of Excellence Severo Ochoa 2016–2019 (SEV-2015-0533) grant awarded to the Centre for Research in Agricultural Genomics.
Manuel Revilla Sánchez was funded by the “Formació i contractació de personal investigador novell (FI-DGR)” fellowship provided by the “Agència de Gestió d’Ajuts Universitaris i de Recerca (AGAUR)” from Generalitat de Catalunya (2014-2017). The pre-doctoral stay at the Institut National de la Recherche Agronomique (INRA), Génétique Animale et Biologie Intégrative (GABI) department was financed by a grant from the Erasmus+ PhD Learning Mobility.


A mis padres y hermana, mi norte,
mi abrigo, mi refugio.
El lugar donde siempre vuelvo,
de donde nunca me he ido.


CONTENT
SUMMARY / RESUMEN ................................................................................... 00011
List of Tables ........................................................................................................ 00015
List of Figures ...................................................................................................... 00019
List of Publications .............................................................................................. 00021
Related publications by the author ...................................................................... 00023
Abbreviations ........................................................................................................ 00025
CHAPTER 1. GENERAL INTRODUCTION ................................................... 00027
1.1. Current situation of porcine meat production ................................................. 00029
1.2. Main traits of interest in porcine meat production ......................................... 00030
1.2.1. Intramuscular fat content ................................................................... 00032
1.2.2. Fatty acid composition ........................................................................ 00033
1.3. Fatty acid metabolism .......................................................................................... 00034
1.4. Pig genomics ......................................................................................................... 00038
1.4.1. NGS technologies................................................................................ 00041
1.5. Genomic studies of porcine meat quality traits ............................................... 00044
1.5.1. QTLs, GWAS and candidate genes .................................................. 00044
1.5.2. eQTL mapping approach ................................................................... 00048
1.5.3. Genomic structural variants ............................................................... 00049
1.6. The IBMAP cross ................................................................................................ 00052
1.6.1. QTLs identified in the IBMAP cross ............................................... 00053
1.6.2. Positional candidate genes of QTLs analyzed in the IBMAP cross ................................................................................................................. 00054
1.6.3. New genomic tools in the IBMAP cross ......................................... 00055
CHAPTER 2. OBJECTIVES ............................................................................... 00057
CHAPTER 3. PAPERS AND STUDIES ............................................................. 00061
Paper I. New insight into the SSC8 genetic determination of fatty acid
composition in pigs ..................................................................................................... 00063
Paper II. A global analysis of CNVs in swine using whole genome sequence
data and association analysis with fatty acid composition and growth traits ...... 00089
Paper III. Expression analysis in adipose tissue of candidate genes for fatty
acid composition and identification of eGWAS regions ....................................... 00119
CHAPTER 4. GENERAL DISCUSSION ........................................................... 00155
4.1. Global analysis of CNVs in the pig genome .................................................... 00158
4.2. From QTL to positional candidate genes for fatty acid composition .......... 00161
4.3. Gene-expression and regulation of candidate genes for fatty acid
metabolism ................................................................................................................... 00166
4.4. Challenges in livestock genomics and future directions ................................. 00173
CHAPTER 5. CONCLUSIONS .......................................................................... 00177
CHAPTER 6. REFERENCES ............................................................................ 00181
CHAPTER 7. ANNEXES .................................................................................... 00213
7.1. Supplementary material Paper I: “New insight into the SSC8 genetic
determination of fatty acid composition in pigs” ................................................... 00215
7.2. Supplementary material Paper II: “A global analysis of CNVs in swine
using whole genome sequence data and association analysis with fatty acid
composition and growth traits” ................................................................................. 00223
7.3. Supplementary material Paper III: “Expression analysis in adipose tissue
of candidate genes for fatty acid composition and identification of eGWAS
regions” ......................................................................................................................... 00226
CHAPTER 8. ACKNOWLEDGEMENTS ......................................................... 00255

11
SUMMARY
Pork is one of the main sources of human-consumed meat and consumer’s preference
towards high quality meat is increasing. Hence, understanding the molecular mechanisms
affecting meat production and quality would help in the selection of these traits. Meat
quality is determined largely by its fatty acid (FA) composition and understanding the
underlying molecular processes of FA composition is the general objective of this thesis.
We analyzed quantitative trait loci (QTL) on porcine chromosome 8 (SCC8) for FA
composition in backfat, identifying two trait-associated SNP regions at 93 Mb and 119 Mb.
The strongest statistical signals for both regions were observed for palmitoleic acid and,
C18:0/C16:0 and C18:1(n-7)/C16:1(n-7) elongation ratios. MAML3 and SETD7 genes
were analyzed as positional candidate genes in the 93 Mb region. The two novel
microsatellites analyzed in the MAML3 gene, and the SETD7:c.700G>T SNP in the
SETD7 gene did not show the strongest signal in this region, discarding these
polymorphisms as the causal mutations. Furthermore, in the 119 Mb region, the
ELOVL6:c.-533C>T SNP showed a strong association with the percentage of palmitic and
palmitoleic acids and elongation ratios in backfat. These results for ELOVL6 gene,
support the hypothesis that it has a pleiotropic effect in backfat and muscle for the 119 Mb
QTL, and reinforce this gene as a strong candidate for the SSC8 QTL for FA composition.
Moreover, whole genome sequence (WGS) data from Iberian and Landrace pigs were used
to identify 1,279 copy number variations (CNVs), merging into 540 swine CNV regions
(CNVRs). The impact of four of them in growth and FA composition in intramuscular fat
and backfat was studied. Association with carcass length and FA composition in backfat
and intramuscular fat was showed for the CNVR112, containing the GPAT2 gene which
catalyse the biosynthesis of triglycerides and glycerophospholipids. These results underline
the importance of CNVRs affecting economically important traits in pigs.
Finally, the adipose tissue mRNA expression of 44 candidate genes related with lipid
metabolism was analyzed in 115 animals. The expression genome-wide association
(eGWAS) identified 193 eSNPs located in 19 expression QTLs (eQTLs). Three out of 19
eQTLs corresponding to ACSM5, FABP4, and FADS2 were classified as cis-acting eQTLs,
whereas the remaining 16 eQTLs had trans-regulatory effects. These findings and the
polymorphisms evaluated for some of these genes provide new data to further understand
the functional mechanisms implicated in the variation of meat quality traits in pigs.

13
RESUMEN El cerdo es una de las principales fuentes de carne consumida por el hombre y las
preferencias de los consumidores hacia productos de alta calidad han aumentado durante
los últimos años. Por lo tanto, conocer los mecanismos moleculares que afectan a la
producción y a la calidad de esta carne ayudaría a la selección de estos caracteres. La calidad
de la carne está determinada en gran medida por la composición de los ácidos grasos (AG)
y la comprensión de los procesos moleculares subyacentes a éstos son el objetivo general
de esta tesis.
En este trabajo, se han identificado QTLs en el cromosoma 8 porcino (SSC8) para la
composición de AG en grasa dorsal (GD) y se han identificado dos regiones cromosómicas
con SNPs asociados, localizadas a 93 y 119 Mb. Las señales estadísticamente más
significativas para ambas regiones se observaron para el ácido palmitoleico y los índices
C18:0/C16:0 y C18:1(n-7)/C16:1(n-7). Los genes MAML3 y SETD7 fueron estudiados
como genes candidatos posicionales para la región localizada a 93 Mb. Los dos nuevos
microsatélites analizados en el gen MAML3 y el SNP del gen SETD7 (SETD7:c.700G>T)
no mostraron las asociaciones más significativas en esta región, descartando estos
polimorfismos como las mutaciones causales. Además, en la región localizada a 119 Mb, el
SNP ELOVL6:c.-533C>T mostró la asociación más significativa con el porcentaje de los
ácidos palmítico y palmitoleico y los índices de elongación en GD. Los resultados
obtenidos para el gen ELOVL6, gen candidato posicional del QTL localizado a 119 Mb
refuerzan la hipótesis de su efecto pleiotrópico sobre la composición de AG en GD y en
músculo, y su papel en la determinación del QTL del SSC8 para el perfil de AG.
Por otra parte, se utilizaron datos del genoma completo de cerdos ibéricos y landrace para
identificar 1.279 variaciones en el número de copias (CNV), las cuales se fusionaron en 540
regiones de CNVs (CNVRs). El impacto de cuatro de ellas fue estudiado para caracteres de
crecimiento y composición de AG. Se encontró asociación con la longitud de la canal y la
composición de AG en grasa intramuscular y GD para el CNVR112. Este CNVR contiene
el gen GPAT2 que cataliza la biosíntesis de triglicéridos y glicerofosfolípidos. Los
resultados obtenidos subrayan la importancia de los CNVRs en la determinación de
caracteres económicamente importantes en el cerdo.
Finalmente, se analizó la expresión de 44 genes candidatos relacionados con el
metabolismo lipídico en 115 animales. El estudio de asociación genómico con los datos de
expresión (eGWAS) identificó 193 eSNPs localizados en 19 eQTLs. Tres de los eQTLs
correspondientes a los genes ACSM5, FABP4 y FADS2 se clasificaron como cis-eQTLs;
mientras que los 16 eQTLs restantes mostraron efectos reguladores en trans. Estos
hallazgos, junto con los polimorfismos evaluados para alguno de estos genes, mejoran
nuestro conocimiento sobre los mecanismos funcionales implicados en la variación de los
caracteres relacionados con la calidad de la carne porcina.

15
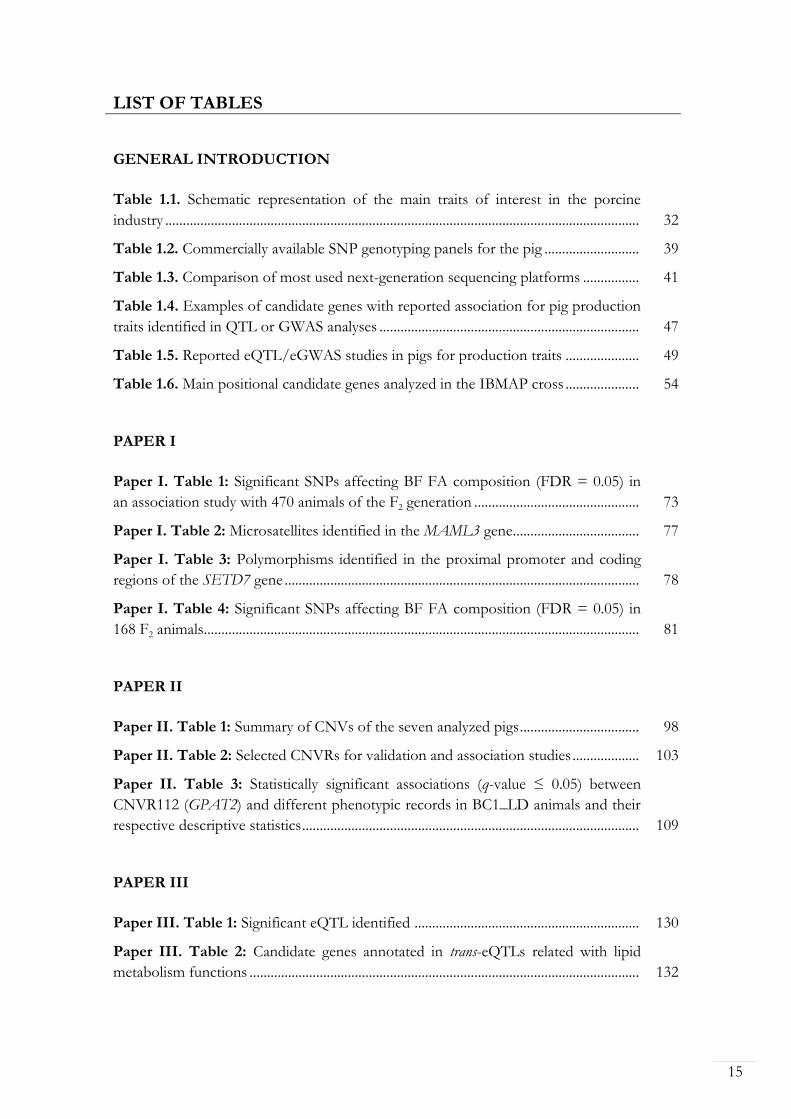
LIST OF TABLES GENERAL INTRODUCTION
Table 1.1. Schematic representation of the main traits of interest in the porcine
industry ....................................................................................................................................... 00032
Table 1.2. Commercially available SNP genotyping panels for the pig ........................... 00039
Table 1.3. Comparison of most used next-generation sequencing platforms ................ 00041
Table 1.4. Examples of candidate genes with reported association for pig production
traits identified in QTL or GWAS analyses .......................................................................... 00047
Table 1.5. Reported eQTL/eGWAS studies in pigs for production traits ..................... 00049
Table 1.6. Main positional candidate genes analyzed in the IBMAP cross ..................... 00054
PAPER I
Paper I. Table 1: Significant SNPs affecting BF FA composition (FDR = 0.05) in
an association study with 470 animals of the F2 generation ............................................... 00073
Paper I. Table 2: Microsatellites identified in the MAML3 gene .................................... 00077
Paper I. Table 3: Polymorphisms identified in the proximal promoter and coding
regions of the SETD7 gene ..................................................................................................... 00078
Paper I. Table 4: Significant SNPs affecting BF FA composition (FDR = 0.05) in
168 F2 animals ............................................................................................................................ 00081
PAPER II
Paper II. Table 1: Summary of CNVs of the seven analyzed pigs .................................. 00098
Paper II. Table 2: Selected CNVRs for validation and association studies ................... 00103
Paper II. Table 3: Statistically significant associations (q-value ≤ 0.05) between
CNVR112 (GPAT2) and different phenotypic records in BC1_LD animals and their
respective descriptive statistics ................................................................................................ 00109
PAPER III
Paper III. Table 1: Significant eQTL identified ................................................................ 00130
Paper III. Table 2: Candidate genes annotated in trans-eQTLs related with lipid
metabolism functions ............................................................................................................... 00132
16
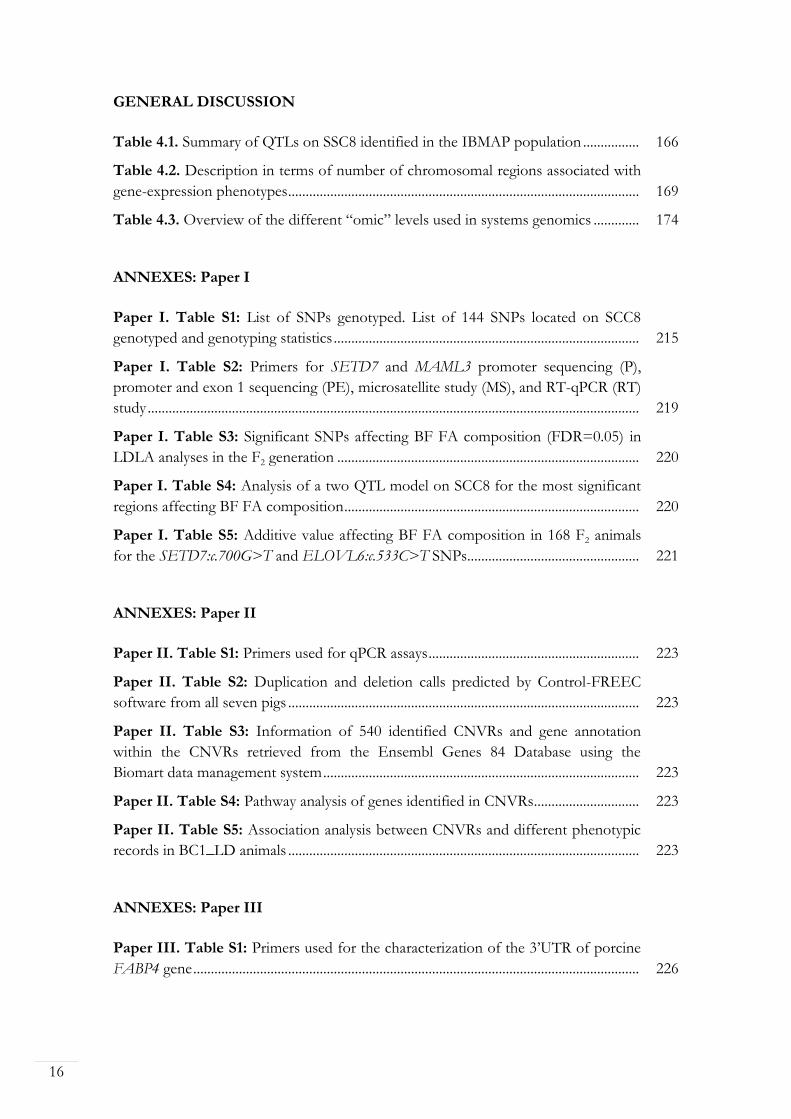
GENERAL DISCUSSION
Table 4.1. Summary of QTLs on SSC8 identified in the IBMAP population ................ 00166
Table 4.2. Description in terms of number of chromosomal regions associated with
gene-expression phenotypes .................................................................................................... 00169
Table 4.3. Overview of the different “omic” levels used in systems genomics ............. 00174
ANNEXES: Paper I
Paper I. Table S1: List of SNPs genotyped. List of 144 SNPs located on SCC8
genotyped and genotyping statistics ....................................................................................... 00215
Paper I. Table S2: Primers for SETD7 and MAML3 promoter sequencing (P),
promoter and exon 1 sequencing (PE), microsatellite study (MS), and RT-qPCR (RT)
study ............................................................................................................................................ 00219
Paper I. Table S3: Significant SNPs affecting BF FA composition (FDR=0.05) in
LDLA analyses in the F2 generation ...................................................................................... 00220
Paper I. Table S4: Analysis of a two QTL model on SCC8 for the most significant
regions affecting BF FA composition .................................................................................... 00220
Paper I. Table S5: Additive value affecting BF FA composition in 168 F2 animals
for the SETD7:c.700G>T and ELOVL6:c.533C>T SNPs................................................. 00221
ANNEXES: Paper II
Paper II. Table S1: Primers used for qPCR assays ............................................................ 00223
Paper II. Table S2: Duplication and deletion calls predicted by Control-FREEC
software from all seven pigs .................................................................................................... 00223
Paper II. Table S3: Information of 540 identified CNVRs and gene annotation
within the CNVRs retrieved from the Ensembl Genes 84 Database using the
Biomart data management system .......................................................................................... 00223
Paper II. Table S4: Pathway analysis of genes identified in CNVRs .............................. 00223
Paper II. Table S5: Association analysis between CNVRs and different phenotypic
records in BC1_LD animals .................................................................................................... 00223
ANNEXES: Paper III
Paper III. Table S1: Primers used for the characterization of the 3’UTR of porcine
FABP4 gene ............................................................................................................................... 00226
17
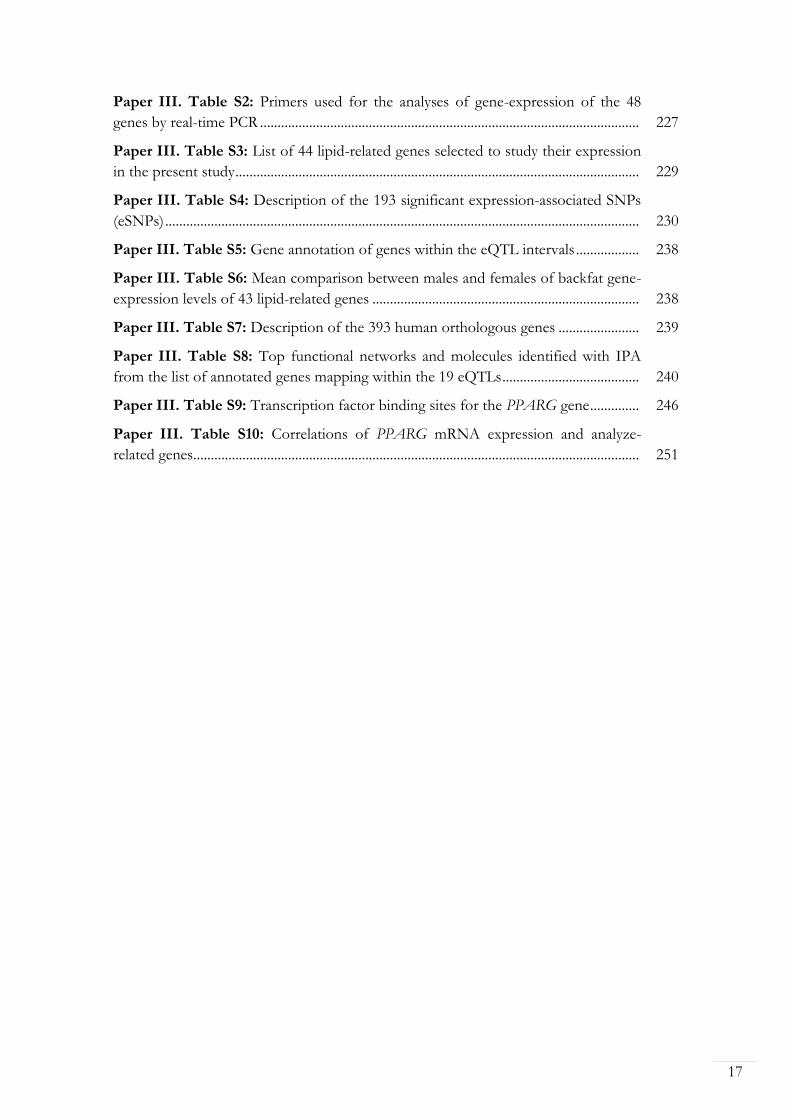
Paper III. Table S2: Primers used for the analyses of gene-expression of the 48
genes by real-time PCR ............................................................................................................ 00227
Paper III. Table S3: List of 44 lipid-related genes selected to study their expression
in the present study ................................................................................................................... 00229
Paper III. Table S4: Description of the 193 significant expression-associated SNPs
(eSNPs) ....................................................................................................................................... 00230
Paper III. Table S5: Gene annotation of genes within the eQTL intervals .................. 00238
Paper III. Table S6: Mean comparison between males and females of backfat gene-
expression levels of 43 lipid-related genes ............................................................................ 00238
Paper III. Table S7: Description of the 393 human orthologous genes ....................... 00239
Paper III. Table S8: Top functional networks and molecules identified with IPA
from the list of annotated genes mapping within the 19 eQTLs ....................................... 00240
Paper III. Table S9: Transcription factor binding sites for the PPARG gene .............. 00246
Paper III. Table S10: Correlations of PPARG mRNA expression and analyze-
related genes ............................................................................................................................... 00251


19
LIST OF FIGURES
GENERAL INTRODUCTION
Figure 1.1. Pig heads production in the World, Europe and Spain from 2000 to 2014 00029
Figure 1.2. Average number of pigs per km2 produced by European regions in 2015 . 00030
Figure 1.3. Schematic pathway in de novo fatty acid synthesis ............................................ 00036
Figure 1.4. Biological systems multi-omics from the genome, epigenome,
transcriptome, proteome and metabolome to the phenome .............................................. 00040
Figure 1.5. Distribution of porcine QTLs among the different trait types in the Pig
QTLdb ........................................................................................................................................ 00044
Figure 1.6. Overview of the general design and workflow of a GWAS analysis ........... 00045
Figure 1.7. Approaches to detect CNVs from NGS data ................................................. 00051
Figure 1.8. Schematic representation of the Iberian by Landrace cross (IBMAP) ........ 00052
PAPER I
Paper I. Figure 1: Association study and LDLA of the C18:0/C16:0 elongation ratio
in BF ........................................................................................................................................... 00075
Paper I. Figure 2: Schematic representation of the elongation pathway of 16 and 18
carbon FAs ................................................................................................................................. 00079
PAPER II
Paper II. Figure 1: Distribution of CNVRs on the different chromosomes of the
porcine genome ......................................................................................................................... 00099
Paper II. Figure 2: Validation of CNVRs detected from the WGS data using qPCR
analysis ........................................................................................................................................ 00106
Paper II. Figure 3: Plots of analyzed CNVRs generated from CNV signal-intensity
data .............................................................................................................................................. 00107
PAPER III
Paper III. Figure I: GWAS plot of ACSM5, FABP4, and FADS2 gene-expression
in adipose tissue......................................................................................................................... 00131
Paper III. Figure II: Comparison between males and females of gene-expression
levels of 43 lipid-related genes in adipose tissue .................................................................. 00142

20
GENERAL DISCUSSION
Figure 4.1. Design for genetic mapping of variation in gene-expression. ....................... 00167
Figure 4.2. Integrative view of genes and transcription factors implicated in
lipogenesis and triglyceride synthesis in adipose tissue ....................................................... 00173
ANNEXES: Paper I
Paper I. Figure S1: Association study and LDLA of the C16:1(n-7), ACL and
C18:1(n-7)/C16:1(n-7) elongation ratio in BF ...................................................................... 00222
ANNEXES: Paper II
Paper II. Figure S1: Analysis by qPCR of CNVR112 (GPAT2) ..................................... 00224
Paper II. Figure S2: Analysis by qPCR of CNVR157 (CLCA4) .................................... 00224
Paper II. Figure S3: Analysis by qPCR of CNVR298 (MOGAT2) ................................ 00225
Paper II. Figure S4: Analysis by qPCR of CNVR447 (PRKG1) ..................................... 00225
ANNEXES: Paper III
Paper III. Figure S1: Associations of SNPs from SSC8 and ELOVL6
polymorphisms for ELOVL6 gene-expression in backfat ................................................. 00252
Paper III. Figure S2: Clustered heat map to visualize correlations among gene-
expression levels (NQ) of the 43 genes and fatty content in adipose tissue .................... 00253

21
LIST OF PUBLICATIONS The present thesis is based on the work contained in the list of articles below:
Paper I. Revilla M, Ramayo-Caldas Y, Castelló A, Corominas J, Puig-Oliveras A,
Ibáñez-Escriche N, Muñoz M, Ballester M, Folch JM (2014). New insight into the
SSC8 genetic determination of fatty acid composition in pigs. Genetics Selection
Evolution 46:28. http://doi.org/10.1186/1297-9686-46-28
Paper II. Revilla M, Puig-Oliveras A, Castelló A, Crespo-Piazuelo D, Paludo E,
Fernández AI, Ballester M, Folch JM (2017). A global analysis of CNVs in swine
using whole genome sequence data and association analysis with fatty acid
composition and growth traits. PLoS One 12(5):e0177014.
http://doi.org/10.1371/journal.pone.0177014
Paper III. Revilla M, Ballester M, Puig-Oliveras A, Castelló A, Fernández AI,
Folch JM. Expression analysis in adipose tissue of candidate genes for fatty acid
composition and identification of eGWAS regions. (Manuscript in preparation)

23
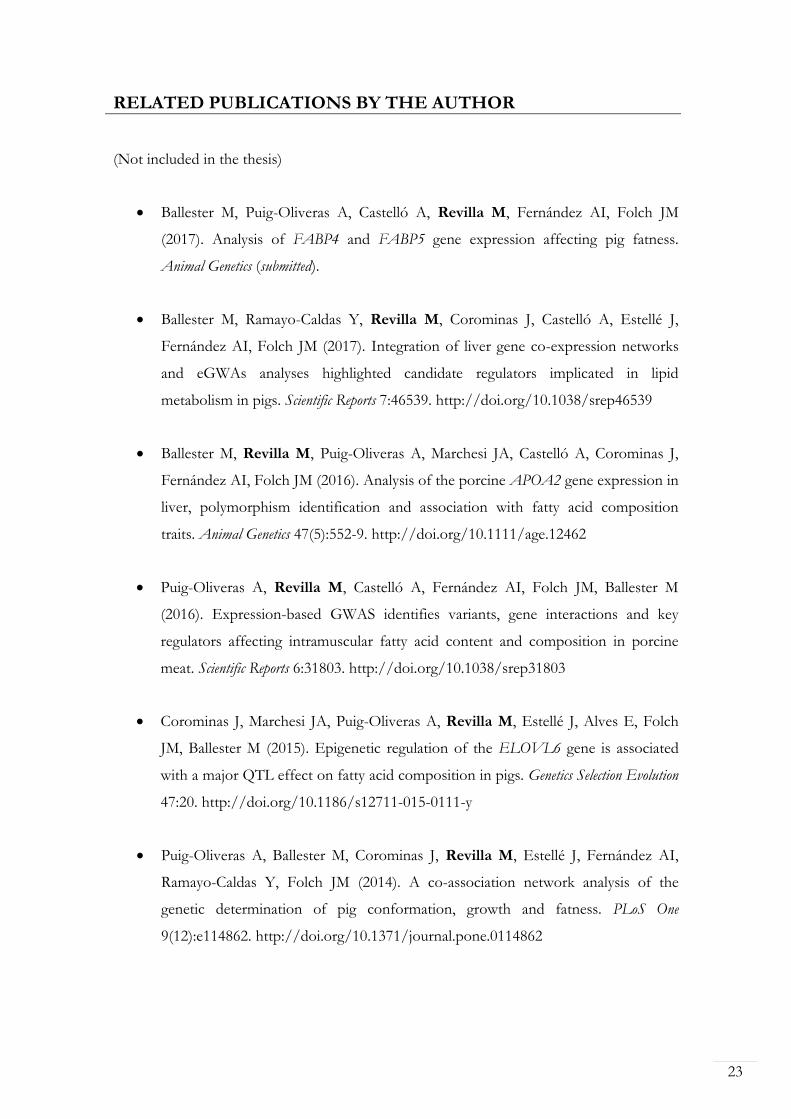
RELATED PUBLICATIONS BY THE AUTHOR (Not included in the thesis)
Ballester M, Puig-Oliveras A, Castelló A, Revilla M, Fernández AI, Folch JM
(2017). Analysis of FABP4 and FABP5 gene expression affecting pig fatness.
Animal Genetics (submitted).
Ballester M, Ramayo-Caldas Y, Revilla M, Corominas J, Castelló A, Estellé J,
Fernández AI, Folch JM (2017). Integration of liver gene co-expression networks
and eGWAs analyses highlighted candidate regulators implicated in lipid
metabolism in pigs. Scientific Reports 7:46539. http://doi.org/10.1038/srep46539
Ballester M, Revilla M, Puig-Oliveras A, Marchesi JA, Castelló A, Corominas J,
Fernández AI, Folch JM (2016). Analysis of the porcine APOA2 gene expression in
liver, polymorphism identification and association with fatty acid composition
traits. Animal Genetics 47(5):552-9. http://doi.org/10.1111/age.12462
Puig-Oliveras A, Revilla M, Castelló A, Fernández AI, Folch JM, Ballester M
(2016). Expression-based GWAS identifies variants, gene interactions and key
regulators affecting intramuscular fatty acid content and composition in porcine
meat. Scientific Reports 6:31803. http://doi.org/10.1038/srep31803
Corominas J, Marchesi JA, Puig-Oliveras A, Revilla M, Estellé J, Alves E, Folch
JM, Ballester M (2015). Epigenetic regulation of the ELOVL6 gene is associated
with a major QTL effect on fatty acid composition in pigs. Genetics Selection Evolution
47:20. http://doi.org/10.1186/s12711-015-0111-y
Puig-Oliveras A, Ballester M, Corominas J, Revilla M, Estellé J, Fernández AI,
Ramayo-Caldas Y, Folch JM (2014). A co-association network analysis of the
genetic determination of pig conformation, growth and fatness. PLoS One
9(12):e114862. http://doi.org/10.1371/journal.pone.0114862

25
ABBREVIATIONS ACACA Acetyl-CoA carboxylase 1 aCGH Array comparative genome hybridization ACSM5 acyl-CoA synthetase medium-chain family member 5 AGPAT 1-acylglycerol-3-phospate acyltransferase ANK2 Ankyrin 2 AWM Association weight matrix
BAC Bacterial artificial chromosome BC1_DU 25% Iberian x 75% Duroc backcross BC1_LD 25% Iberian x 75% Landrace backcross BC1_PI 25% Iberian x 75% Pietrain backcross
C16:0 Palmitic acid C16:1(n-7) Palmitoleic acid C18:0 Stearic acid C18:1(n-7) Vaccenic acid C18:1(n-9) Oleic acid CNV Copy number variation CNVRs CNV regions CRISPR Clustered regulatory interspaced short palindromic repeats CRISPR/Cas CRISPR in combination with Cas9 protein
DGATs Diacylglycerol acyltransferases
eGWAS Expression genome-wide association study ELF1 E74 like ETS transcription factor 1 ELOVL Elongase enzymes EP300 E1A binding protein p300 eQTLs Expression quantitative trait loci eSNP Expression-associated SNP ESR1 Estrogen receptor 1 EU European Union
FA Fatty acid FABP2 Fatty acid binding protein 2 FABP4 Fatty acid binding protein 4 FADS1 Fatty acid desaturase 1 FADS2 Fatty acid desaturase 2 FAS Fatty acid synthase FHL2 Four and a half LIM domains 2
GLUT4 Glucose transporter 4 GPAT Glycerol-3-phosphate acyltransferase GWAS Genome-wide association studies
HTO High-throughput omics
IBMAP Iberian x Landrace animal material IFC Integrated fluidic circuits IMF Intramuscular fat indels Insertions and deletions
KIT KIT proto-oncogene receptor tyrosine kinase
26
LD Linkage disequilibrium LDLA Linkage disequilibrium and linkage analysis LPL Lipoprotein lipase
MAML3 Mastermind-like 3 MAS Marker-assisted selection MTTP Microsomal triglyceride transfer protein MUFA Monounsaturated fatty acids
NCOA2 Nuclear receptor coactivator 2 NGS Next-generation sequencing NR3C1 Nuclear receptor subfamily 3 group C member 1
PA Phosphatidic acid PIGMaP Pig gene mapping project PPAR Peroxisome proliferator activated receptor PPARG Peroxisome proliferator activated receptor gamma PRDM16 PR/SET domain 16 PRKAG3 Protein kinase AMP-activated non-catalytic subunit gamma 3 PUFA Polyunsaturated fatty acids
qPCR Real-time quantitative PCR QTL Quantitative trait loci
RNA-Seq RNA sequencing RYR1 Ryanodine receptor 1
SCD Stearoyl-CoA desaturase SETD7 SET domain containing lysine methyltransferase 7 SFA Saturated fatty acids SGSC Swine genome sequencing consortium SLC27A4 Solute carrier family 27 member 4 SNP Single nucleotide polymorphism SREBF Sterol regulatory element binding transcription factor SSC Sus scrofa chromosome
TAS Trait-associated SNPs TBCK TBC1 domain containing kinase
VLDLs Very low-density lipoproteins
WGS Whole genome sequence

General Introduction
Chapter 1

General Introduction
29
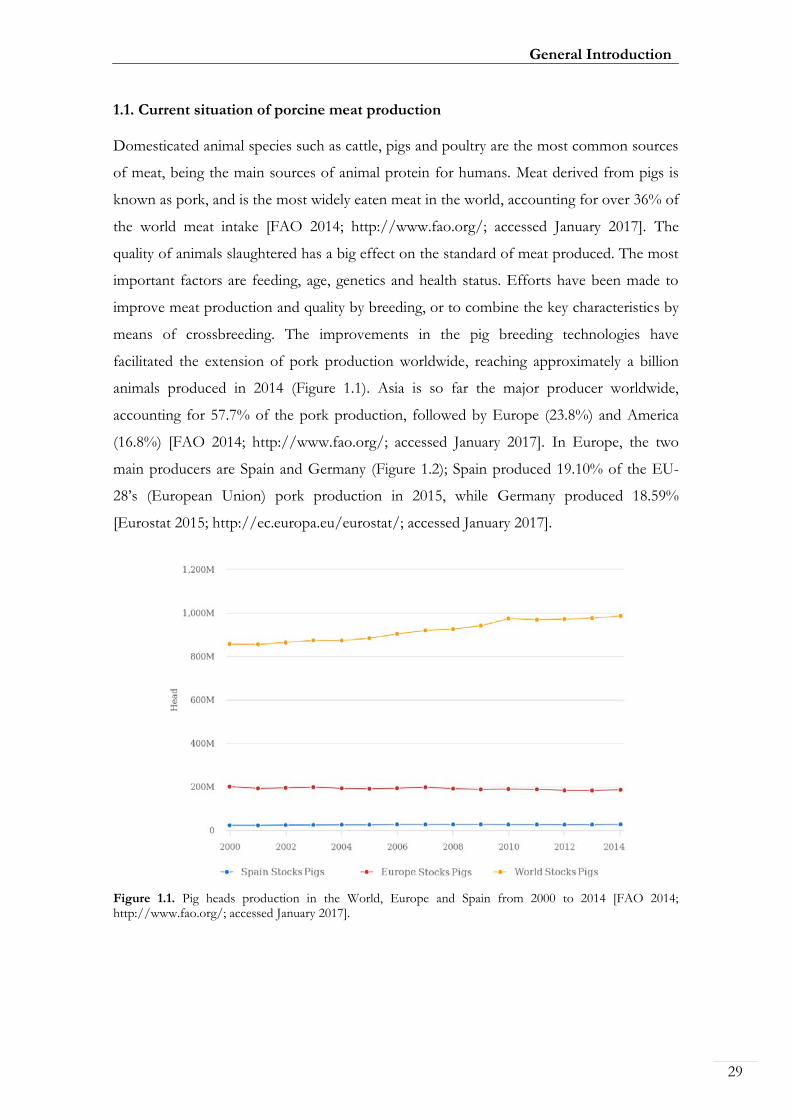
1.1. Current situation of porcine meat production Domesticated animal species such as cattle, pigs and poultry are the most common sources
of meat, being the main sources of animal protein for humans. Meat derived from pigs is
known as pork, and is the most widely eaten meat in the world, accounting for over 36% of
the world meat intake [FAO 2014; http://www.fao.org/; accessed January 2017]. The
quality of animals slaughtered has a big effect on the standard of meat produced. The most
important factors are feeding, age, genetics and health status. Efforts have been made to
improve meat production and quality by breeding, or to combine the key characteristics by
means of crossbreeding. The improvements in the pig breeding technologies have
facilitated the extension of pork production worldwide, reaching approximately a billion
animals produced in 2014 (Figure 1.1). Asia is so far the major producer worldwide,
accounting for 57.7% of the pork production, followed by Europe (23.8%) and America
(16.8%) [FAO 2014; http://www.fao.org/; accessed January 2017]. In Europe, the two
main producers are Spain and Germany (Figure 1.2); Spain produced 19.10% of the EU-
28’s (European Union) pork production in 2015, while Germany produced 18.59%
[Eurostat 2015; http://ec.europa.eu/eurostat/; accessed January 2017].
Figure 1.1. Pig heads production in the World, Europe and Spain from 2000 to 2014 [FAO 2014; http://www.fao.org/; accessed January 2017].

Genomic and functional genomic analysis of fatty acid composition in swine
30
Figure 1.2. Average number of pigs per km2 produced by European regions in 2015 [Eurostat 2015; http://ec.europa.eu/eurostat/; accessed January 2017].
1.2. Main traits of interest in porcine meat production Pig breeding programmes have selected measurable, attainable and realistic goals to
improve breeds according to the needs of producers, processors and consumers. With the
main objective to satisfy demand of consumers, these pig breeding goals have been in
permanent revision over the years (Dekkers et al., 2011). Traditionally, swine breeding

General Introduction
31
programs have focused on the genetic improvement of economically important production
traits, such as growth rate, meat percentage, feed efficiency, and piglet production (Table
1.1). However, the strong selection process focused on increasing the percentage of lean
meat in carcass, had led to a dramatic reduction of intramuscular fat (IMF) content in some
breeds, negatively affecting meat quality, and therefore, leading to detrimental changes in
taste and tenderness of the meat produced (Wood & Whittemore 2007). Many factors
(Table 1.1) affect meat quality and its definition, however it is normally defined by the
compositional quality (lean to fat ratio) and the palatability factors such as visual
appearance, smell, firmness, juiciness, tenderness, and flavor. From the technological point
of view, aspects such as pH, water-holding capacity, cooking loss and firmness have a clear
importance (Bidner et al., 2004; Boler et al., 2010; Ciobanu et al., 2011). Furthermore, the
sensorial aspects such as texture, flavor, juiciness, color and marbling are determinant for
consumer meat acceptance (Font-i-Furnols & Guerrero 2014). In addition, this meat
quality is also determined by nutritional, and safety and hygienic factors. One aspect, which
is common for all the definitions received for this trait, is that consumers play a key role in
the assessment of quality since their personal preferences drive the market demands. As a
consequence, during the last decade the genetics of pig meat quality has been included as
part of pig selection programmes to satisfy the increasing consumer demand for high
quality meat.
Usually, heritabilities of meat quality traits show great variation (Ciobanu et al., 2011) and
the genetic background of each population have a great impact on this variation. In general,
the heritability related to meat quality index range between 0.11 to 0.33 (Ciobanu et al.,
2011). Heritabilities for technological factors of meat quality, such as pH (h2= 0.04-0.41),
water-holding capacity (h2= 0.01-0.43) and cooking loss (h2= 0.00-0.51), and sensorial
aspects of meat quality traits such as, flavor (h2= 0.01-0.16), juiciness (h2= 0.00-0.28), and
color (h2= 0.15-0.57) varied from low to medium values (Ciobanu et al., 2011).
Genomic and functional genomic analysis of fatty acid composition in swine
32
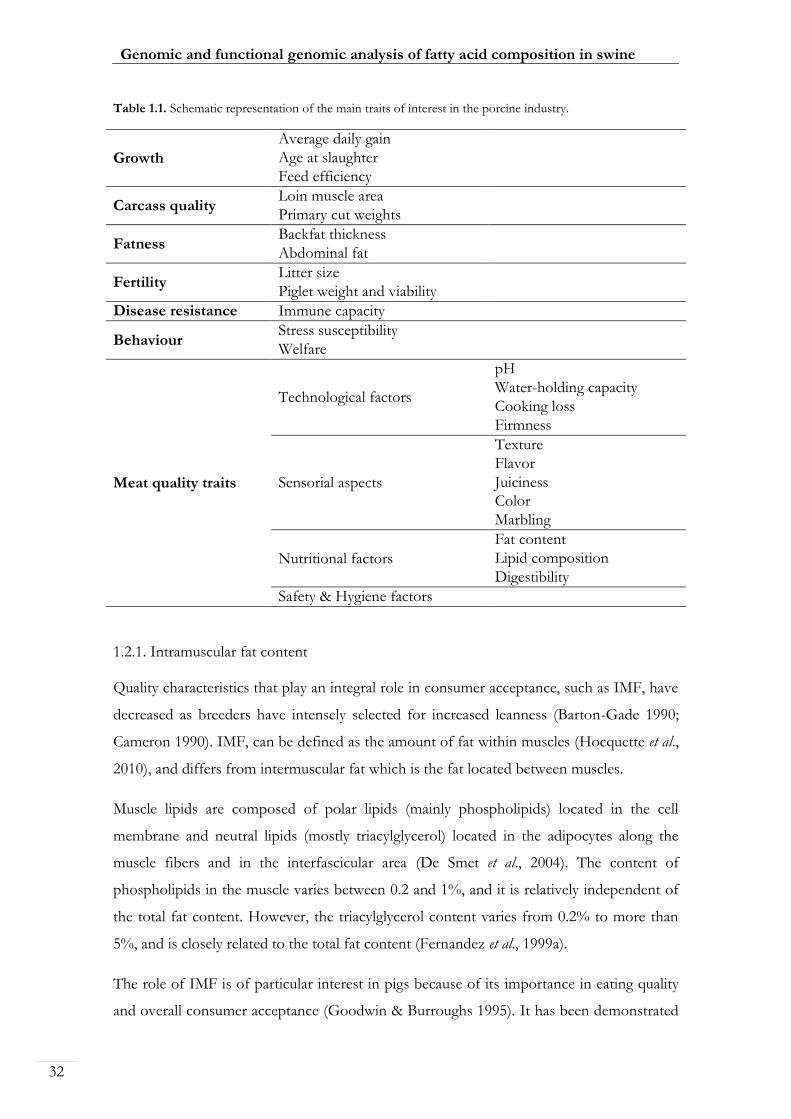
Table 1.1. Schematic representation of the main traits of interest in the porcine industry.
Growth
Average daily gain
Age at slaughter
Feed efficiency
Carcass quality Loin muscle area
Primary cut weights
Fatness Backfat thickness
Abdominal fat
Fertility Litter size
Piglet weight and viability
Disease resistance Immune capacity
Behaviour Stress susceptibility
Welfare
Meat quality traits
Technological factors
pH
Water-holding capacity
Cooking loss
Firmness
Sensorial aspects
Texture
Flavor
Juiciness
Color
Marbling
Nutritional factors
Fat content
Lipid composition
Digestibility
Safety & Hygiene factors
1.2.1. Intramuscular fat content Quality characteristics that play an integral role in consumer acceptance, such as IMF, have
decreased as breeders have intensely selected for increased leanness (Barton-Gade 1990;
Cameron 1990). IMF, can be defined as the amount of fat within muscles (Hocquette et al.,
2010), and differs from intermuscular fat which is the fat located between muscles.
Muscle lipids are composed of polar lipids (mainly phospholipids) located in the cell
membrane and neutral lipids (mostly triacylglycerol) located in the adipocytes along the
muscle fibers and in the interfascicular area (De Smet et al., 2004). The content of
phospholipids in the muscle varies between 0.2 and 1%, and it is relatively independent of
the total fat content. However, the triacylglycerol content varies from 0.2% to more than
5%, and is closely related to the total fat content (Fernandez et al., 1999a).
The role of IMF is of particular interest in pigs because of its importance in eating quality
and overall consumer acceptance (Goodwin & Burroughs 1995). It has been demonstrated

General Introduction
33
that IMF positively influences flavor, juiciness, tenderness and/or firmness. In this sense,
when IMF levels increase above approximately 2.5% in fresh pork meat, the flavor and
juiciness are significantly enhanced (Hodgson et al., 1991; Fernandez et al., 1999b; Huff-
Lonergan et al., 2002). On the other hand, IMF has only a small effect on the perceived
pork tenderness and texture (Lonergan et al., 2007).
The quantity of IMF can be accurately measured on muscle samples by various analytical
methods (e.g. Folch et al., 1957) or estimated in vivo by real-time ultrasound (e.g. Hassen et
al., 2001; Newcom et al., 2002) and nuclear magnetic resonance (e.g. García-Olmo et al.,
2012) techniques. The ideal concentration of IMF has been estimated to be between 2 and
3% (Bejerholm & Barton-Gade 1986; DeVol et al., 1988; Barton-Gade 1990), and this trait
has become important in the genetic improvement of pork quality. Different studies have
described a moderate-high heritability ranging from 0.39 to 0.53 regarding the IMF content
(Cameron et al., 1990; Suzuki et al., 2005).
1.2.2. Fatty acid composition Selection for increased percent lean meat in pigs has also produced a decrease in adipose
quality and overall firmness of fat. Adipose tissue, body fat, or simple fat is composed of
adipocytes embedded in a matrix of connective tissue with a highly developed vascular
system and is one of the main energy reserves in animals. The quality of this fat is
determined by its fatty acid (FA) composition (Gatlin et al., 2003; Wood et al., 2004). It
should be noted that FA composition differs between various tissues, including intra- and
intermuscular, as well as subcutaneous adipose tissue. Another factor with a significant
effect on fatness is sex (Nürnberg et al., 1998), as well as differences in maturity, age and/or
live weight at slaughter. In addition, the genetic variability observed for this trait consists of
differences between breeds, differences due to the crossing of these breeds, and differences
between animals within breeds (De Smet et al., 2004).
FAs influence technological and organoleptic characteristics of meat quality in several
aspects. The melting point of specific FAs differs widely; therefore, FA composition
directly affects the firmness and/or softness of adipose tissue (Pitchford et al., 2002).
Moreover, the nutritional profile of meat fat has been extensively studied because it is a
major source of dietary lipids, and has an important influence not only in meat quality but
also on human health.

Genomic and functional genomic analysis of fatty acid composition in swine
34
FAs are made up of carbon and hydrogen molecules. There are three types: saturated fatty
acids (SFA), monounsaturated fatty acids (MUFA) and polyunsaturated fatty acids (PUFA).
The basic difference between each of these is the number of carbon atoms with or without
two hydrogen atoms bonded to them. In a SFA, each carbon atom has bonded with two
hydrogen atoms. This saturation makes the FA very stable, which means it can withstand
more heat. However, SFAs are associated with human diseases like various cancers, obesity
and especially coronary heart diseases (Chizzolini et al., 1999).
In a MUFA, one pair of carbon atoms forms a double bond with each other that replaces
the bond each would have with one hydrogen atom. This means that MUFA are less stable
than SFA, and contribute to a better taste and lower oxidation rate of meat.
A PUFA has two or more carbon pairs that have bonded together rather than with a
hydrogen atom. This means that PUFAs are quite unstable. Furthermore, PUFA, mainly n-
3, have been considered beneficial for human health due to their effect in the reduction of
total cholesterol concentration and the modulation of immune functions and inflammatory
processes (Rudel et al. 1995; Poudyal et al., 2011).
It has been described that MUFA and SFA increase in subcutaneous fat and muscle with
age, while the content of PUFA decrease (Bosch et al., 2012). Additionally, the
concentrations of MUFA, SFA and PUFA differ among breeds and within fat (Cameron &
Enser 1991). Raj et al. (2010) also described a higher concentration of PUFA/SFA ratio in
backfat in comparison to IMF.
Heritabilities for FA composition have been estimated by several studies using different
genetic backgrounds, ranging from 0.15 to 0.57 (Ntawubizi et al., 2010; Casellas et al., 2010).
1.3. Fatty acid metabolism FAs are essential for life as they constitute a major source of energy and are structural
components of membranes. In addition, FAs are crucial in key biological functions, such as
regulation of lipid metabolism, cell division and inflammation. They are included in a broad
variety of compounds including oils, waxes, sterols, glycerophospholipids, sphingolipids
and triacylglycerols. A large percentage of lipids are synthesized from dietary glucose
(Nafikov & Beitz 2007). The main tissues for fat synthesis in animals are liver, adipose
tissue and muscle (Duran-Montgé et al., 2009). The adipose tissue is a highly active

General Introduction
35
metabolic and endocrine organ that acts as a fat storage depot, and is essential for
circulating free FA and regulation of lipid metabolism (Xing et al., 2016).
The transformations that lipids undergo are produced mainly by two reactions, lipolysis or
-oxidation and lipogenesis or de novo FA synthesis.
Lipolysis is the enzymatic process by which triacylglycerol, stored in cellular lipid droplets,
is hydrolytically cleaved to generate glycerol and free FAs. The free FAs can be
subsequently used as energy substrates, essential precursors for lipid and membrane
synthesis, or mediators in cell signaling processes. The complete oxidation of free FAs to
generate ATP occurs in the mitochondria. It involves the sequential degradation of FAs to
multiple units of acetyl-CoA which can then be completely oxidized.
Lipogenesis is the process by which glycerol is esterified with free FAs to form triglycerides
and the main organ for de novo fat synthesis is the adipose tissue (O’Hea & Leveille 1969;
Bergen & Mersmann 2005). Dietary fat (triglycerides), when ingested with food, is
absorbed by the gut and triglycerides are transported in the form of plasma-lipoproteins.
Lipids are released from their carrier lipoproteins through the local activity of lipoprotein
lipase (LPL) and subsequently split into their constituent FAs and glycerol. These are taken
up by adipose tissue where the triglycerides are resynthesized and stored in cytoplasmic
lipid droplets. Lipogenesis also includes the anabolic process by which triglycerides are
formed in the liver from excess glucose. Here FAs of varying length are synthesised by the
sequential addition of two-carbon units derived from acetyl-CoA. FAs generated by
lipogenesis in the liver, are subsequently esterified with glycerol to form triglycerides that
are packaged, in very low-density lipoproteins (VLDLs) and secreted into the circulation.
Once in the circulation, VLDLs come in contact with LPL in the capillary beds in the body
(adipose, cardiac, and skeletal muscle) where LPL releases the triglycerides for intracellular
storage or energy production. The predominant products of de novo lipogenesis are palmitic
(C16:0), stearic (C18:0), oleic (C18:1(n-9)) and palmitoleic (C16:1(n-7)) acids, which are
formed through procedures of elongation and/or desaturation.
Dietary FAs require the presence of enzymes, transporters, and chaperone proteins to
facilitate their absorption, transport, and uptake by cells in the body (Figure 1.3). Normally,
mammals obtain SFA from either the diet or endogenous synthesis from glucose or amino
acids (Volpe & Vagelos 1976) and MUFA can be converted from SFA by the stearoyl-CoA
desaturase (SCD) gene (Paton & Ntambi 2009) or can also be obtained from the diet. On

Genomic and functional genomic analysis of fatty acid composition in swine
36
the other hand, PUFA are mainly acquired through the diet (Leonard et al., 2004). The
process of storing energy from carbohydrate-derived carbon precursors occurs in the
cytosol of cells and is performed by a series of enzymes beginning with the production of
acetyl-CoA by ATP citrate lyase. Acetyl-CoA is then metabolized by the rate-limiting
enzyme of the FA synthesis pathway, acetyl-CoA carboxylase 1 (ACACA) to produce the
limiting reagent, malonyl-CoA (Figure 1.3). The multifunctional enzyme, fatty acid synthase
(FAS) then produces saturated, short (C14:0) to medium (C18:0) chain FAs by sequentially
adding malonyl-CoA to the growing acyl chain through a series of biochemical reactions,
with palmitic acid (C16:0) representing about 80-90% of its total product (Jayakumar et al.,
1995; Kuhajda et al., 1994). Various elongation and desaturase enzymes can further modify
FAs. These de novo synthesized FAs can then be esterified and converted into triglyceride
molecules for storage.
Figure 1.3. Schematic pathway in de novo fatty acid synthesis (Xing et al., 2016).
The metabolism of de novo and dietary FAs can differ greatly, but they may also compete as
substrates for the same elongation and desaturation enzymes. Mammals possess seven
known elongase enzymes (ELOVL1-7) with various substrate specificities that mediate the
elongation of FAs through the addition of malonyl-CoA (Guillou et al., 2010).

General Introduction
37
Introduction of double bonds into FAs is mediated by the activity of the desaturase
enzymes, SCD (also known as, delta 9 desaturase), fatty acid desaturase 1 (FADS1), and
fatty acid desaturase 2 (FADS2), each of which insert a double bond at specific locations in
the FA carbon chain. SCD is specific for the conversion of SFA to MUFA, while FADS1
(delta 5 desaturase) and FADS2 (delta 6 desaturase) are specific to PUFA (Guillou et al.,
2010); hence, SCD can metabolize both de novo and dietary FAs, while dietary intake
influences the activities of desaturase enzymes. Enzymes known to be strictly responsible
for de novo FA metabolism include FAS, ELOVL1, ELOVL3, and ELOVL6, while
enzymes that metabolize only dietary FAs include ELOVL2, ELOVL5, FADS1, and
FADS2.
Furthermore, several transcription factors are known to play an essential role in the
regulation of the expression of genes involved in FA metabolism. These transcription
factors, according to the stimulus (i.e. nutrients, hormones, etc.), have the ability to bind on
target-sequences of the genes and promote or supress transcription (Laliotis et al., 2010).
Two of the transcription factors that have been reported to modulate and control the
transcription of genes involved in lipogenesis are: sterol regulatory element binding
transcription factor (SREBF) and peroxisome proliferator activated receptor (PPAR).
SREBFs are considered one of the most important transcription factors that can mediate
the expression of lipogenic genes, and can be divided into two transcription factors,
SREBF1 and SREBF2. The regulation of lipid homeostasis is directly regulated by SREBF1
by activating lipogenic genes, which are involved in the production of palmitate (Jump
2004). On the other hand, SREBF2 is associated with genes involved in cholesterol
metabolism.
PPARs are part of the adipocyte differentiation program regulating adipogenesis (Rosen et
al., 2000) and are considered as monitors of the oxidized lipids.
Furthermore, members of the nuclear receptor family such as HNF4, RAR, ROR, and
RXR have been described to be involved in the transcriptional regulation of lipogenic
genes (Chawla et al., 2001; Tarling et al., 2004).
In addition, lipid metabolism is under the regulation of hormones (peptides or lipids),
cofactors and nuclear receptors that are tissue specific. In order to manipulate meat FA
composition, we have to understand the genetic architecture involved in this biological
process.
Genomic and functional genomic analysis of fatty acid composition in swine
38
1.4. Pig genomics Classical genetic evaluation approaches have had a huge impact on the improvement of the
efficiency of pork production and on carcass quality. Genetic progress can be made by
measurement the interest trait, if this is heritable, on the selection candidates.
Genomics can help in the selection of relevant traits by increasing the accuracy of the
prediction of the breeding value and by obtaining earlier evaluations. This is particularly
valuable for sow prolificacy traits, which tend to have low heritability and which are only
expressed in the mature females. Genomics will be also valuable for traits which can not be
evaluated in breeding animals, like meat quality traits.
The pig (Sus scrofa) was the first livestock species whose scientific community decided to
map its genome in the early 1990s with the EU-funded Pig Gene Mapping Project
(PIGMaP; Haley et al., 1990). This PIGMaP project data allowed the implementation of
linkage analysis for the identification of quantitative trait loci (QTLs) (Andersson et al.,
1994). Years later, in September 2003, the Swine Genome Sequencing Consortium (SGSC)
was established to sequence the pig genome (Schook et al., 2005), following the successful
generation of genetic (Groenen et al., 2011) and physical (Raudsepp et al., 2011) maps of the
pig. The strategy by the SGSC was based on hierarchical shotgun Sanger sequencing of
bacterial artificial chromosome (BAC) clones representing a minimal tile path across the
genome (Humphray et al., 2007), which was later supplemented with Illumina next-
generation sequencing (NGS) data (Archibald et al., 2010). These efforts resulted in the
assembly and publication of a draft reference genome sequence of Sus scrofa in 2012
(Groenen et al., 2012). This assembly, which is in constant improvement, came from a
female domestic Duroc pig and comprised 2.60 Gb assigned to chromosomes and more
than 212 Mb in unplaced scaffolds. The most recent upgraded version of the pig genome
sequence is called Sscrofa10.2, and the last upgraded annotation available for this sequence
in the Ensembl database is the release 87 [Ensembl; http://www.ensembl.org, accessed
January 2017], which comprises a total of 21,640 genes encoding 30,585 transcripts, 3,124
non-coding genes and 568 pseudogenes. Moreover, there is information about more than
60 million short variants, including single nucleotide polymorphisms (SNPs), insertions and
deletions (indels), and 85 structural variants.
Apart from the availability of the pig genome, another important genomic tool was the
development of a first commercial SNP panel for high-throughput genotyping (Ramos et

General Introduction
39
al., 2009). This SNP panel was commercially available from Illumina (PorcineSNP60
BeadChip; San Diego, CA) and contains about 60K SNPs that cover all autosomal and X
chromosomes (Ramos et al., 2009). In addition to this SNP panel, low-density SNP panels
have been developed in several studies with the purpose of reducing genotyping costs. A
commercial low-density SNP chip was developed by GeneSeek/Neogen (Lincoln, NE) to face
the need of an economic SNP chip to the market (GeneSeek/Neogen GPP-Porcine LD Illumina
Bead Chip panel). Recently, GeneSeek/Neogen also prepared a higher density SNP panel
including about 70K SNPs. A high-density SNP panel (Groenen 2015), containing
∼650,000 SNPs and including a large percentage of the SNPs present in the Illumina
PorcineSNP60 v2 BeadChip, has been recently released by Affymetrix (Santa Clara, CA) (Table
1.2).
Table 1.2. Commercially available SNP genotyping panels for the pig (adapted from Samorè & Fontanesi 2016).
Chip name SNPs Company Technology
PorcineSNP60 v2 BeadChip 64,232 Illumina Illumina Infinium chemistry
GeneSeek® Genomic Profiler for Porcine LD
(GGP-Porcine LD) 10,241 GeneSeek/Neogen Illumina Infinium chemistry
GeneSeek® Genomic Profiler for Porcine HD
(GGP-Porcine HD) 70,231 GeneSeek/Neogen Illumina Infinium chemistry
Axiom® Porcine Genotyping Array 658,692 Affymetrix Axiom assay
The SNP chips have improved the ability to detect QTL for different relevant traits for pig
production. Furthermore, the high-density SNP panels can provide significant insights into
the molecular basis of phenotypic variation of production traits and assist breeders in pig
selection (Plastow et al., 2005) and are the base of genomic selection.
Recent technological advances have created new opportunities to study complex traits in
pigs considering a more holistic view of the biological system under study. Instead of
focusing only on the discovery of a single gene or DNA markers that co-segregate with a
trait, researchers focused their interests in the detection of large-scale molecular gene-
expression profiles, gene clusters, and networks, that are characteristics of a biological
process or of a specific phenotype. Thanks to the development of high-throughput
techniques (Figure 1.4) such as genomic (high-density genotyping and DNA sequencing),
epigenomic (DNA methylation), transcriptomic (microaarays, RNA sequencing ‘RNA-Seq’,
and high-throughput real-time quantitative PCR ‘qPCR’ microfluidic systems), proteomic
(tandem mass spectophotometry), and metabolome approaches (gas chromatography and
Genomic and functional genomic analysis of fatty acid composition in swine
40
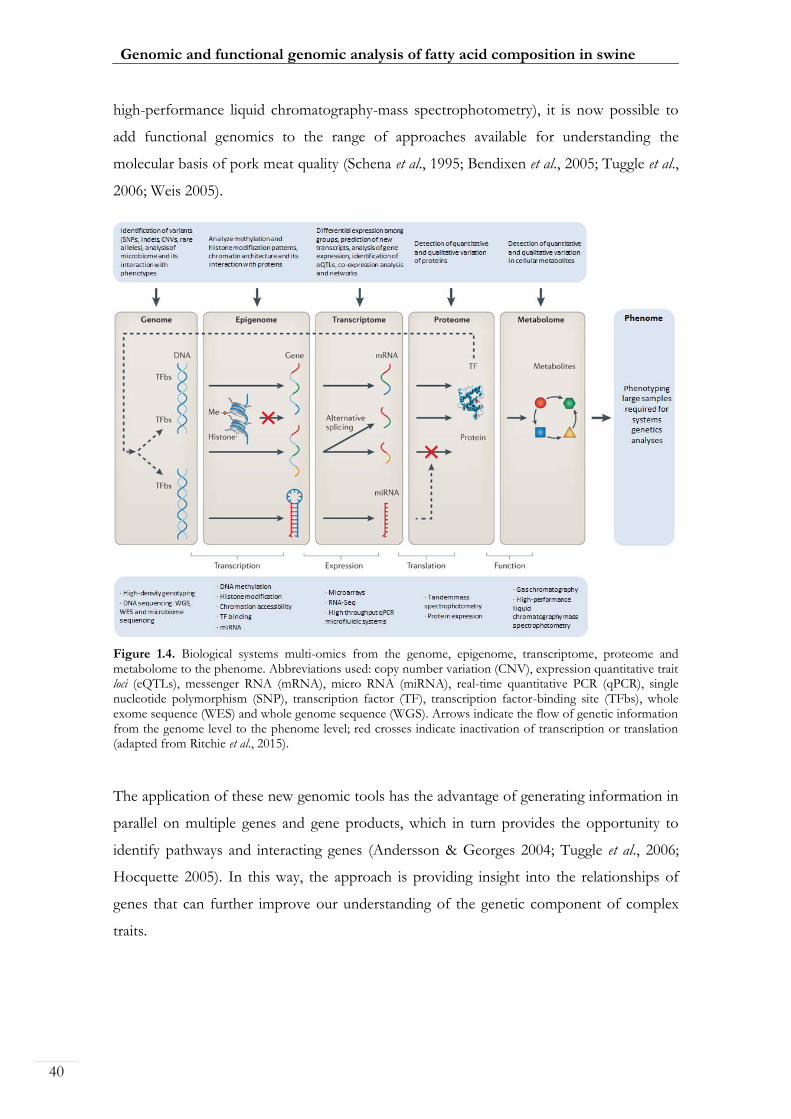
high-performance liquid chromatography-mass spectrophotometry), it is now possible to
add functional genomics to the range of approaches available for understanding the
molecular basis of pork meat quality (Schena et al., 1995; Bendixen et al., 2005; Tuggle et al.,
2006; Weis 2005).
Figure 1.4. Biological systems multi-omics from the genome, epigenome, transcriptome, proteome and metabolome to the phenome. Abbreviations used: copy number variation (CNV), expression quantitative trait loci (eQTLs), messenger RNA (mRNA), micro RNA (miRNA), real-time quantitative PCR (qPCR), single nucleotide polymorphism (SNP), transcription factor (TF), transcription factor-binding site (TFbs), whole exome sequence (WES) and whole genome sequence (WGS). Arrows indicate the flow of genetic information from the genome level to the phenome level; red crosses indicate inactivation of transcription or translation (adapted from Ritchie et al., 2015).
The application of these new genomic tools has the advantage of generating information in
parallel on multiple genes and gene products, which in turn provides the opportunity to
identify pathways and interacting genes (Andersson & Georges 2004; Tuggle et al., 2006;
Hocquette 2005). In this way, the approach is providing insight into the relationships of
genes that can further improve our understanding of the genetic component of complex
traits.
General Introduction
41
1.4.1. NGS technologies Next-generation sequencing describe a DNA sequencing technology which is set to
revolutionize the way complex trait genetics research is carried out. Since their introduction
into the market in 2005, NGS technologies offer the scientific community the opportunity
to explore the whole genome, transcriptome or epigenome of an organism in a cost-
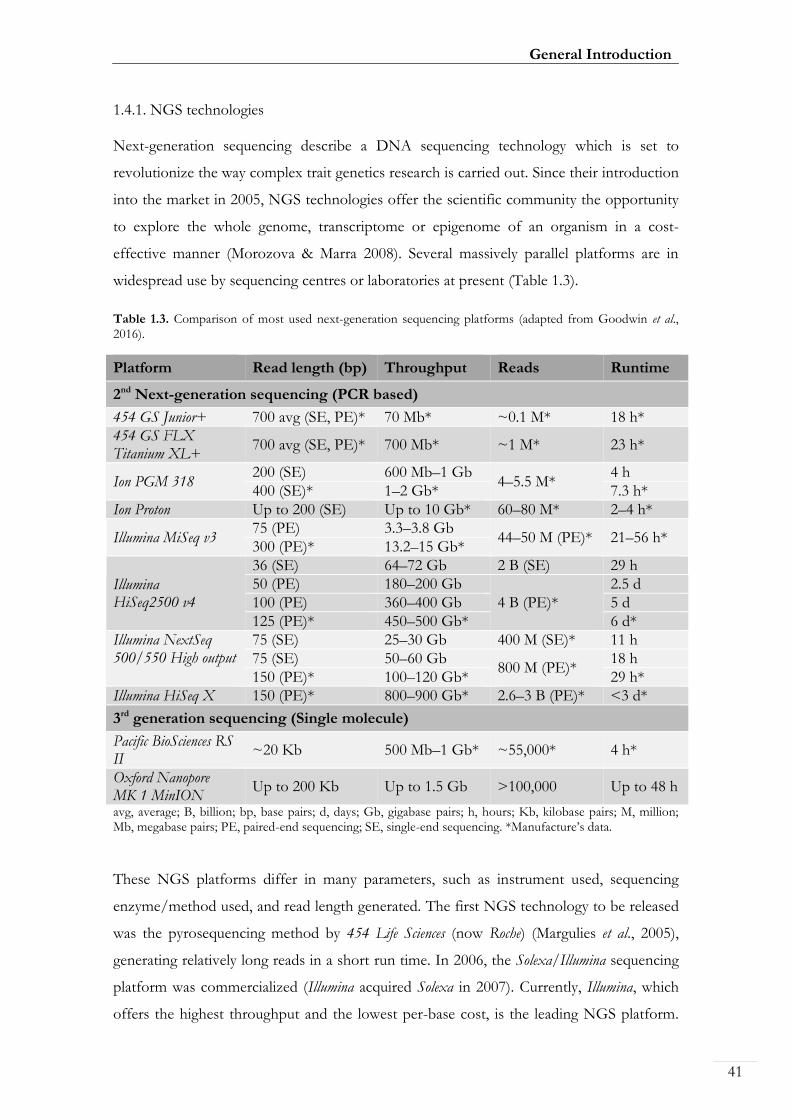
effective manner (Morozova & Marra 2008). Several massively parallel platforms are in
widespread use by sequencing centres or laboratories at present (Table 1.3).
Table 1.3. Comparison of most used next-generation sequencing platforms (adapted from Goodwin et al., 2016).
Platform Read length (bp) Throughput Reads Runtime
2nd Next-generation sequencing (PCR based)
454 GS Junior+ 700 avg (SE, PE)* 70 Mb* ~0.1 M* 18 h*
454 GS FLX Titanium XL+
700 avg (SE, PE)* 700 Mb* ~1 M* 23 h*
Ion PGM 318 200 (SE) 600 Mb–1 Gb
4–5.5 M* 4 h
400 (SE)* 1–2 Gb* 7.3 h*
Ion Proton Up to 200 (SE) Up to 10 Gb* 60–80 M* 2–4 h*
Illumina MiSeq v3 75 (PE) 3.3–3.8 Gb
44–50 M (PE)* 21–56 h* 300 (PE)* 13.2–15 Gb*
Illumina HiSeq2500 v4
36 (SE) 64–72 Gb 2 B (SE) 29 h
50 (PE) 180–200 Gb
4 B (PE)*
2.5 d
100 (PE) 360–400 Gb 5 d
125 (PE)* 450–500 Gb* 6 d*
Illumina NextSeq 500/550 High output
75 (SE) 25–30 Gb 400 M (SE)* 11 h
75 (SE) 50–60 Gb 800 M (PE)*
18 h
150 (PE)* 100–120 Gb* 29 h*
Illumina HiSeq X 150 (PE)* 800–900 Gb* 2.6–3 B (PE)* <3 d*
3rd generation sequencing (Single molecule)
Pacific BioSciences RS II
~20 Kb 500 Mb–1 Gb* ~55,000* 4 h*
Oxford Nanopore MK 1 MinION
Up to 200 Kb Up to 1.5 Gb >100,000 Up to 48 h
avg, average; B, billion; bp, base pairs; d, days; Gb, gigabase pairs; h, hours; Kb, kilobase pairs; M, million; Mb, megabase pairs; PE, paired-end sequencing; SE, single-end sequencing. *Manufacture’s data.
These NGS platforms differ in many parameters, such as instrument used, sequencing
enzyme/method used, and read length generated. The first NGS technology to be released
was the pyrosequencing method by 454 Life Sciences (now Roche) (Margulies et al., 2005),
generating relatively long reads in a short run time. In 2006, the Solexa/Illumina sequencing
platform was commercialized (Illumina acquired Solexa in 2007). Currently, Illumina, which
offers the highest throughput and the lowest per-base cost, is the leading NGS platform.
Genomic and functional genomic analysis of fatty acid composition in swine
42
The Illumina sequencers generated very high-throughput at a very balanced price per-base
pair. One of the disadvantages is the relative long run time and that the sequence quality
decreases towards the end. In 2010, Ion Torrent (now Life Technologies) released the Personal
Genome Machine, which uses semiconductor technology and does not rely on the optical
detection of incorporated nucleotides using fluorescence and camera scanning.
A few years ago, in 2010, Pacific BioSciences developed a third generation method allowing
the real-time sequencing of a single molecule. This methodology (Menlo Park, CA, USA)
offers longer read lengths than the previous generation sequencing technologies, making it
well-suited for unsolved problems in genome, transcriptome, and epigenetic research.
However, other promising technologies are starting to appear. In 2014, the first consumer
prototype of a nanopore sequencer, the MinION from Oxford Nanopore technologies,
became available. This technology is based on the transit of a DNA molecule through a
pore while the sequence is read out through the effect on an electric current or optical
signal (Clarke et al., 2009). The major advantage is that the library preparation or
sequencing reagents are not necessary due to the fact that the DNA or RNA molecules are
directly sequenced.
Several studies had used whole genome sequence (WGS) data to identify selective sweeps
in pigs and numerous methods have been developed to identify such signatures of selection
(Vitti et al., 2013). One of the first studies that used NGS data from pig populations to
identify selection footprints across domesticated genomes was performed by Amaral et al.
in 2011. The results from this study suggested the selection in domestic pigs on genes that
affect coat color, growth, muscle development, olfaction, immunity, and brain
development. However, this study lacked sufficient resolution to identify unequivocally
specific genes due to the low-coverage of the sequence data. Rubin et al. (2012) compared
the whole genome of pools of European domestic and European wild boars, revealing the
staggering complexity of multiple duplications around the KIT proto-oncogene receptor
tyrosine kinase (KIT) gene and its potential regulatory sequences, which are responsible for
different coat color phenotypes, such as dominant white, patch, and belt. After the study
performed by Rubin et al., many analyses have been performed using WGS data, by
sequencing different Sus species and Sus scrofa subspecies, with the objective of
understanding the signatures of selection and speciation process (Ramírez et al., 2015;
Moon et al., 2015; Paudel et al., 2015; Choi et al., 2015), and to study breed variability

General Introduction
43
(Groenen et al., 2012; Bosse et al., 2012; Esteve-Codina et al., 2013; Veroneze et al., 2013; Ai
et al., 2015; Bianco et al., 2015).
Moreover, whole genome transcriptome shotgun sequencing technology or RNA-Seq has
been developed to fulfill different biological purposes. RNA-Seq (Mortazavi et al., 2008;
Wang et al., 2009) is used to exploit NGS technologies to sequence cDNAs from RNA
samples and is being used for quantitative gene-expression studies (Blow 2009). However,
accurate gene-expression estimation requires accurate genome annotation (Roberts et al.,
2011). By utilizing complete or nearly completely annotated reference genomes, RNA-Seq
can assist researchers in identifying differentially-expressed genes and novel transcripts for
agricultural animals in a quantitative and efficient way. In this regard, different RNA-Seq
studies have been performed in swine to identify differentially-expressed genes between
samples under different condition(s) that could be crucial for production traits. In this way,
the expression patterns of porcine liver, muscle (longissimus dorsi) and abdominal fat were
examined in two full-sib hybrid pigs with extreme phenotypes for growth and fatness traits
(Chen et al., 2011). Furthermore, in previous works of our group the RNA-Seq
transcriptome profiling of liver (Ramayo-Caldas et al., 2012a), backfat (Corominas et al.,
2013a), muscle (Puig-Oliveras et al., 2014a), and hypothalamus (Pérez-Montarelo et al.,
2014) were performed by using extreme animals for intramuscular FA composition (liver,
backfat and muscle) or for growth and fatness (hypothalamus) of Iberian x Landrace pigs.
Similarly, a recent analysis analyzed also the RNA-Seq transcriptome profile of muscle
(biceps femoris) by comparing Iberian and Iberian x Duroc early extreme pigs for IMF (Ayuso
et al., 2015). More recently, Szostak et al. (2016) used this approach to identify changes in
the pig liver transcriptome induced by a diet enriched with linoleic acid (omega-6 family)
and α-linoleic acid (omega-3). These authors revealed that the transcriptomic profile of the
pig liver is altered when a diet enriched with omega-6 and omega-3 FAs is provided.
Regarding the transcriptome of porcine adipose tissue, several studies have focused on
differences in breeding growth phases (Li et al., 2012a; Sodhi et al., 2014), phenotype (Chen
et al., 2011; Corominas et al., 2013a; Xing et al., 2015, 2016), developmental period (Jiang et
al., 2013), and adipose depots (Wang et al., 2013a), underlying the importance of this
technique for the identification of candidate genes for livestock production traits.

Genomic and functional genomic analysis of fatty acid composition in swine
44
1.5. Genomic studies of porcine meat quality traits 1.5.1. QTLs, GWAS and candidate genes Most economically important traits in pigs are complex or quantitative and, thus, are
influenced by multiple genes. The development of molecular markers and genome maps
have facilitated the application of molecular genetic approaches to identify genes and
polymorphisms controlling variation in traits of interest. The hunt for QTL in pigs has
been ongoing for nearly two decades, beginning with the first publication of a QTL for
fatness on Sus scrofa chromosome 4 (SSC4) in 1994 (Andersson et al., 1994). Since then,
hundreds of publications have documented thousands of QTLs for a wide variety of traits.
The Pig QTLdb (Hu et al., 2013) [http://www.animalgenome.org/cgi-
bin/QTLdb/SS/index; accessed January 2017] includes information for 16,516 QTLs from
566 publications representing 626 different traits, and this total is conservative, given that it
does not include all publishes pig QTL studies. From the total QTLs reported, 2,358 are
associated with fatness traits, 1,328 are related to growth traits, and 1,311 and 841 to fat
composition and conformation traits, respectively (Figure 1.5). The populations in the
majority of these studies involved experimental crosses, using pig breeds exhibiting
extreme phenotypes for traits of interest, with the expectation that alleles for QTL
controlling these phenotypes would be segregating.
Figure 1.5. Distribution of porcine QTLs among the different trait types in the Pig QTLdb [Pig QTLdb; http://www.animalgenome.org/cgi-bin/QTLdb/SS/index; accessed January 2017].
General Introduction
45
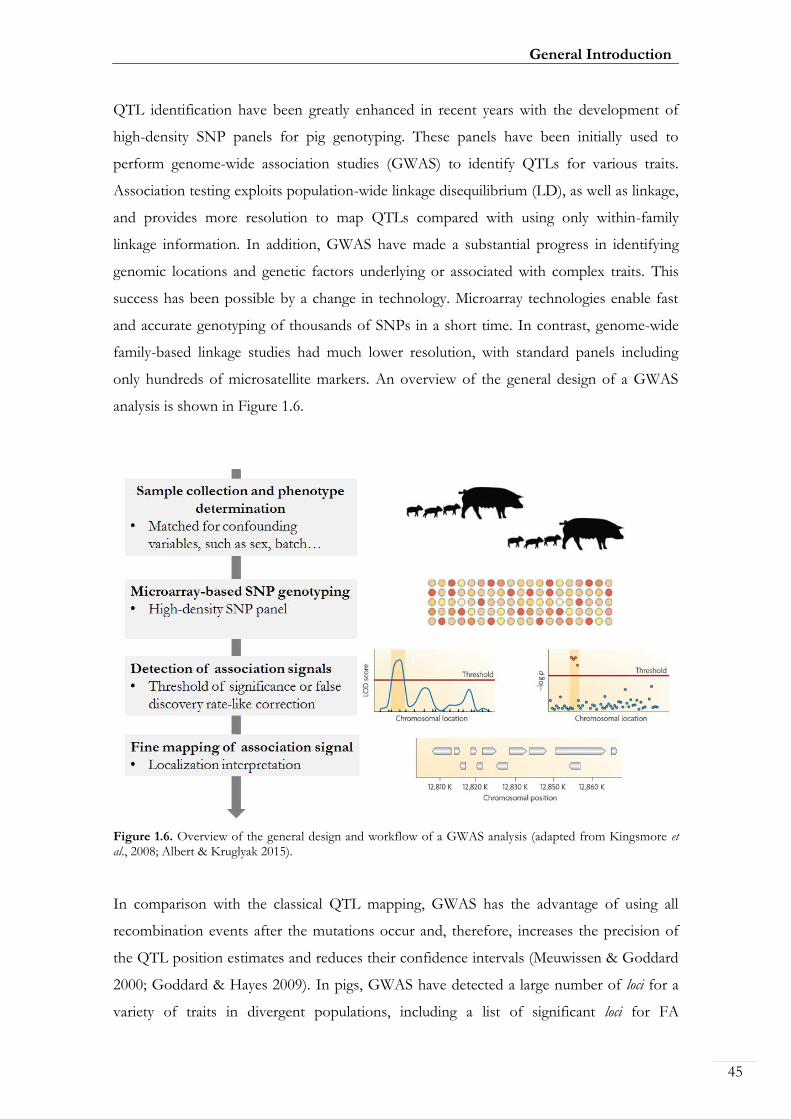
QTL identification have been greatly enhanced in recent years with the development of
high-density SNP panels for pig genotyping. These panels have been initially used to
perform genome-wide association studies (GWAS) to identify QTLs for various traits.
Association testing exploits population-wide linkage disequilibrium (LD), as well as linkage,
and provides more resolution to map QTLs compared with using only within-family
linkage information. In addition, GWAS have made a substantial progress in identifying
genomic locations and genetic factors underlying or associated with complex traits. This
success has been possible by a change in technology. Microarray technologies enable fast
and accurate genotyping of thousands of SNPs in a short time. In contrast, genome-wide
family-based linkage studies had much lower resolution, with standard panels including
only hundreds of microsatellite markers. An overview of the general design of a GWAS
analysis is shown in Figure 1.6.
Figure 1.6. Overview of the general design and workflow of a GWAS analysis (adapted from Kingsmore et al., 2008; Albert & Kruglyak 2015).
In comparison with the classical QTL mapping, GWAS has the advantage of using all
recombination events after the mutations occur and, therefore, increases the precision of
the QTL position estimates and reduces their confidence intervals (Meuwissen & Goddard
2000; Goddard & Hayes 2009). In pigs, GWAS have detected a large number of loci for a
variety of traits in divergent populations, including a list of significant loci for FA
Genomic and functional genomic analysis of fatty acid composition in swine
46
composition in pork (Ramayo-Caldas et al., 2012b; Yang et al., 2013; Muñoz et al., 2013;
Zhang et al., 2016a,b).
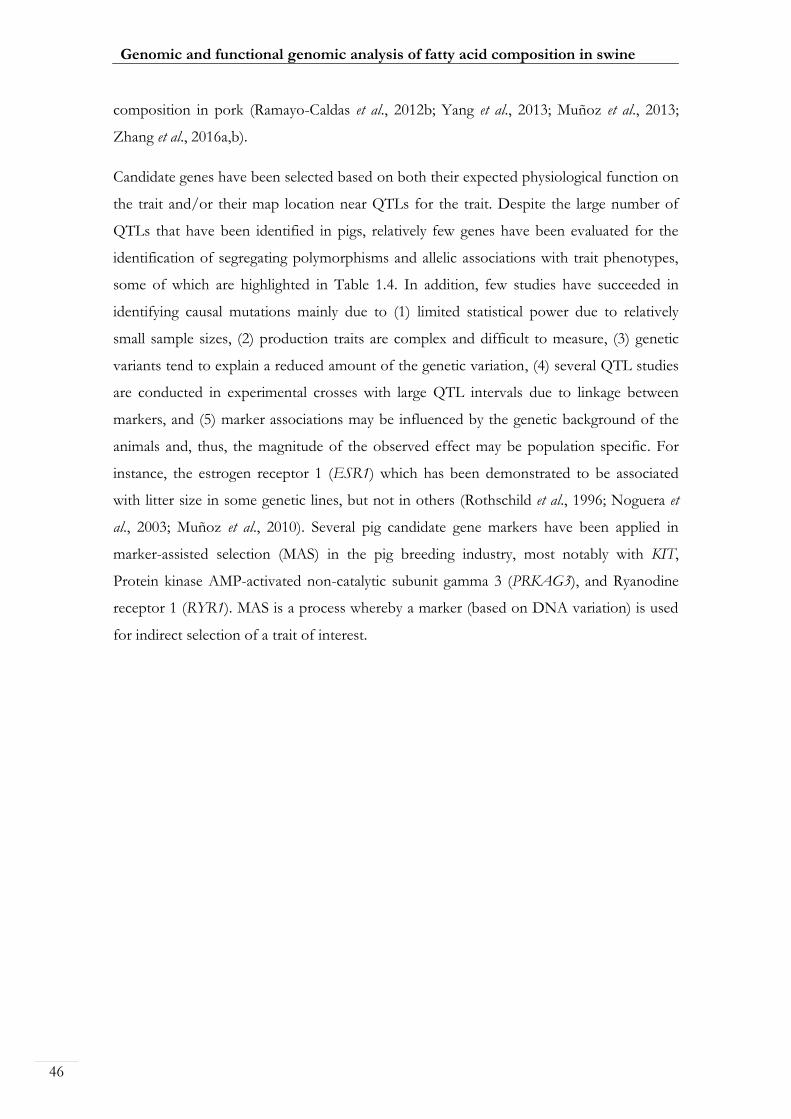
Candidate genes have been selected based on both their expected physiological function on
the trait and/or their map location near QTLs for the trait. Despite the large number of
QTLs that have been identified in pigs, relatively few genes have been evaluated for the
identification of segregating polymorphisms and allelic associations with trait phenotypes,
some of which are highlighted in Table 1.4. In addition, few studies have succeeded in
identifying causal mutations mainly due to (1) limited statistical power due to relatively
small sample sizes, (2) production traits are complex and difficult to measure, (3) genetic
variants tend to explain a reduced amount of the genetic variation, (4) several QTL studies
are conducted in experimental crosses with large QTL intervals due to linkage between
markers, and (5) marker associations may be influenced by the genetic background of the
animals and, thus, the magnitude of the observed effect may be population specific. For
instance, the estrogen receptor 1 (ESR1) which has been demonstrated to be associated
with litter size in some genetic lines, but not in others (Rothschild et al., 1996; Noguera et
al., 2003; Muñoz et al., 2010). Several pig candidate gene markers have been applied in
marker-assisted selection (MAS) in the pig breeding industry, most notably with KIT,
Protein kinase AMP-activated non-catalytic subunit gamma 3 (PRKAG3), and Ryanodine
receptor 1 (RYR1). MAS is a process whereby a marker (based on DNA variation) is used
for indirect selection of a trait of interest.
General Introduction
47
Table 1.4. Examples of candidate genes with reported association for pig production traits identified in QTL or GWAS analyses (adapted from Ernst & Steibel 2013).
Gene name Gene
Symbol Trait(s) Reference(s)
Calpastatin CAST Meat quality Ciobanu et al., 2004; Nonneman et al., 2011
Carbonic anhydrase 3 CA3 Meat quality Wimmers et al., 2007
ELOVL fatty acid elongase 6 ELOVL6* Meat quality Corominas et al., 2013b
Estrogen receptor 1 ESR1* Litter size Rothschild et al., 1996; Noguera et al., 2003; Muñoz et al., 2010
Fatty acid binding protein 4 FABP4 Meat quality Ojeda et al., 2006
Fatty acid binding protein 5 FABP5 Meat quality Estellé et al., 2006
Follicle stimulating hormone beta subunit
FSHB Litter size Onteru et al., 2009
Fucosyltransferase 1 FUT1 Disease resistance Wang et al., 2012a
Insulin like growth factor 2 IGF2* Growth and carcass composition
Van Laere et al., 2003; Aslan et al., 2012; Estellé et al., 2005a
KIT proto-oncogene receptor tyrosine kinase
KIT Coat color Johansson Moller et al., 1996
Leptin LEP Growth and
carcass composition
de Oliveira Peixoto et al., 2006
Leptin receptor LEPR Growth and
carcass composition Ovilo et al., 2005
Melanocortin 1 receptor MC1R* Coat color Kijas et al., 2001
Melanocortin 4 receptor MC4R* Growth and
carcass composition
Kim et al., 2000; Bruun et al., 2006; Fan et al., 2009
Myopalladin MYPN Carcass composition
Wimmers et al., 2007
Phosphoenolpyruvate carboxykinase 1 PCK1* Meat quality Latorre et al., 2016
POU class 1 homeobox 1 POU1F1 Growth and carcass composition
Kurył & Pierzchała 2001; Song et al., 2007
Protein kinase AMP-activated non-catalytic subunit gamma 3
PRKAG3* Meat quality Milan et al., 2000; Ciobanu et al., 2001
Prolactin receptor PRLR* Litter size and boar reproduction
Kmieć & Terman 2006; Tomás et al., 2006
Retinal binding protein 4 RBP4 Litter size Muñoz et al., 2010; Rothschild et al., 2000
Ryanodine receptor 1 RYR1* Stress susceptibility, leanness, and meat quality
Fujii et al., 1991; O’Brien & MacLennan 1992
Stearoyl-CoA desaturase SCD* Meat quality Estany et al., 2014
Titin TTN Meat quality Wimmers et al., 2007
*Detected polymorphism is in LD with causal genetic variation within particular populations

Genomic and functional genomic analysis of fatty acid composition in swine
48
1.5.2. eQTL mapping approach The analysis of variants in the context of gene-expression measured in cells or tissues has
spawned a field in animal genetics studying expression quantitative trait loci (eQTLs). An
eQTL is a locus that explains a fraction of the genetic variance of a gene-expression
phenotype, and standard analysis involves associations between genetic markers with gene-
expression levels measured in animals of interest. The polymorphic regulators may be
protein coding regions, microRNAs, or other functional nucleotide sequences (Michaelson
et al., 2009). In order to detect such genomic regions it is necessary to genotype genetically
diverse individuals and measure their expression pattern by using, for example microarrays,
qPCR or deep sequencing technologies. One of the distinctive features of this approach is
the ability to discriminate between cis- and trans- acting influences on gene-expression and
elucidate complex regulatory networks (Li et al., 2005). The first, termed cis-acting, results
from DNA polymorphisms of a gene that directly influences transcript levels of the same
gene. The second variety, termed trans-acting, where the genetic variant is located further
away from the affected gene, or on a completely different chromosome. Cis-acting genes,
which are generally easier to detect by linkage, explain a large fraction of the variance of
gene expression and have more interest as positional candidate genes for QTLs (Doss et al.,
2005). Besides this, trans-eQTLs, generally associated with lesser statistical significance, are
often detected as clusters reflecting coordinated regulation of many genes (Yvert et al.,
2003). In general, studies performed in animals have identified regulatory hotspot and trans-
eQTL in a higher ratio that those performed in humans (Gilad et al., 2008; Cheung &
Spielman 2009). Furthermore, Petretto et al. (2006) reported that the median heritabilities
range from a minimum of 0.14 for the trans-eQTLs to a maximum of 0.37 for the cis-
eQTLs.
The concept of eQTL mapping and the first studies in humans, plants, and model
organisms were published during the early 2000s (Jansen & Nap 2001; Schadt et al., 2003).
However, due to the high-cost of eQTL projects and the complexity of conducting eQTL
analyses, few studies have been conducted in agricultural animal species, with only a
reduced number performed on pigs. To date, few groups have reported genome-wide
eQTL studies in pigs (Table 1.5), with initial studies focusing on transcriptional profiling of
skeletal muscle tissue.
General Introduction
49
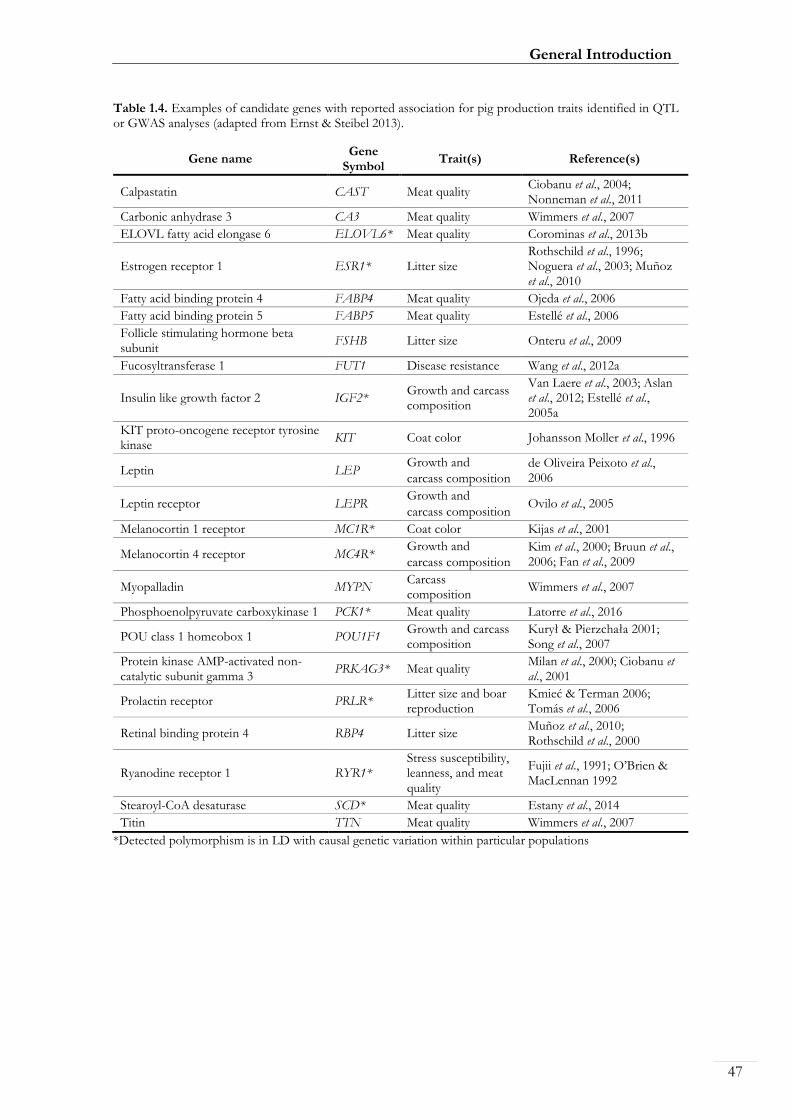
Table 1.5. Reported eQTL/eGWAS studies in pigs for production traits.
Related trait type Reference(s)
Growth Steibel et al., 2011; Ponsuksili et al., 2012
Fatness Steibel et al., 2011; Ponsuksili et al., 2011; Cánovas et al.,
2012
Meat quality and FA composition
Ponsuksili et al., 2008; Ponsuksili et al., 2010; Wimmers et al., 2010; Steibel et al., 2011; Heidt et al., 2013; Muñoz et al.,
2013; Pena et al., 2013; Manunza et al., 2014; Ponsuksili et al., 2014; Puig-Oliveras et al., 2016; Ballester et al., 2017;
González-Prendes et al., 2017
Blood metabolite profile Chen et al., 2013
Disease susceptibility and disorders
Liaubet et al., 2011; Reiner et al., 2014
Regarding FA composition traits in pigs, the combination of traditional QTL mapping with
eQTL mapping have provided crucial information about the nature of this trait (Table 1.5).
In recently published studies of our group, an analysis of the muscle (Puig-Oliveras et al.,
2016) and liver (Ballester et al., 2017) mRNA expression of several candidate genes related
with lipid metabolism was performed. Remarkably, a list of candidate genes, regulatory
polymorphisms and genetic networks have been described, and the PI3K-Akt pathway has
been identified as a central pathway in the genetic determination of FA composition traits.
1.5.3. Genomic structural variants The availability of genome sequence data from individuals within a species enables the
investigation of a range of inherited genetic variations at a high-resolution. Genomic
analysis of DNA variants has focused on the identification of SNPs, and indels. However,
in recent years, other forms of genomic variation have also begun to receive attention. One
such form is copy number variation (CNV), defined as a type of genetic structural variation
which corresponds to a genomic region (typically larger than 1 kb) that has been deleted or
duplicated, giving different number of copies of a DNA fragment (Freeman et al., 2006).
Although their role in genetic susceptibility to a variety of production traits have been
predicted to be important, they have not been explicitly examined in most association
analyses in the past. With the development of improved methods for CNV detection, this
particular type of genetic variation has gained increasing attention throughout the last years.

Genomic and functional genomic analysis of fatty acid composition in swine
50
Benefitting from the achievements of pioneering CNV studies in humans, substantial
progress has been made in the discovery and characterization of CNVs in livestock
genomes. In the past few years, a significant amount of research on genome-wide CNV
identification was conducted in pigs (Fadista et al., 2008; Ramayo-Caldas et al., 2010; Wang
et al., 2012b; Li et al., 2012b). Remarkably, Ramayo-Caldas et al. (2010) performed the first
whole genome identification of CNVs in pigs using SNP arrays. Moreover, a suite of genes
with copy number alteration were analyzed contributing to variation of either Mendelian
phenotypes (Giuffra et al., 2002; Salmon Hillbertz et al., 2007; Fontanesi et al., 2009) or
complex traits (Seroussi et al., 2010). However, potential issues in the majority of previous
CNV studies in livestock species are a lack of power and accuracy for CNV identification,
due to the technical limitations of the two most frequently used detection platforms, SNP
chips and array comparative genome hybridization (aCGH) (Alkan et al., 2011). This
highlights the need to develop more powerful tools for construction of high-resolution
CNV maps. Nowadays, NGS technologies provide a sensitive and accurate alternative
approach for detecting genomic variations. The quality and speed give NGS a significant
advantage over microarrays (Hurd & Nelson 2009; Su et al., 2011). Taking these advantages
into account, a diverse set of tools has been developed to detect CNVs based on different
features that can be extracted from NGS data. So far, the NGS based CNV detection
methods can be categorized into five different strategies (Figure 1.7), including: (1) Paired-
end mapping strategy which detects CNVs through discordantly mapped reads. A
discordant mapping is produced if the distance between two ends of a read pair is
significantly different from the average insert size. (2) Split read-based methods use
incompletely mapped reads from each read pair to identify small CNVs. (3) Read depth-
based approach detects CNVs by counting the number of reads mapped to each genomic
region. (4) De novo assembly of a genome detects CNVs by mapping contigs to the
reference genome. And (5) a combination of the above approaches to detect CNVs: read
depth and paired-end mapping information.
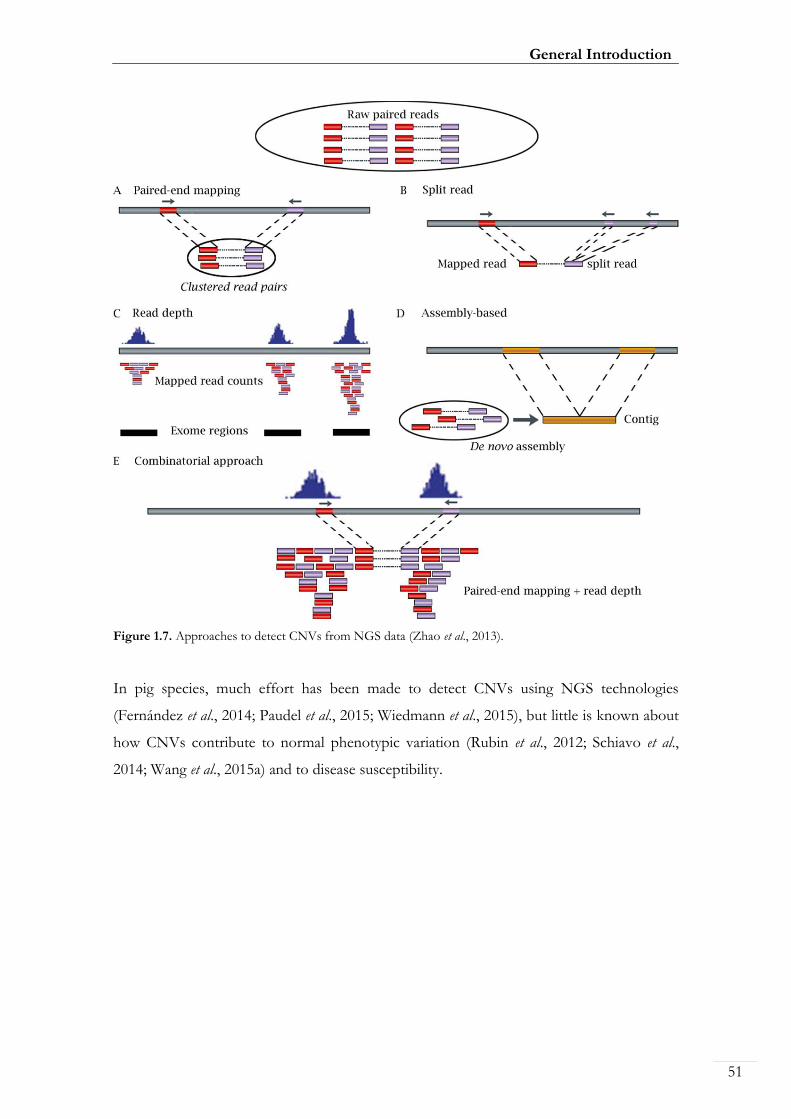
General Introduction
51
Figure 1.7. Approaches to detect CNVs from NGS data (Zhao et al., 2013).
In pig species, much effort has been made to detect CNVs using NGS technologies
(Fernández et al., 2014; Paudel et al., 2015; Wiedmann et al., 2015), but little is known about
how CNVs contribute to normal phenotypic variation (Rubin et al., 2012; Schiavo et al.,
2014; Wang et al., 2015a) and to disease susceptibility.

Genomic and functional genomic analysis of fatty acid composition in swine
52
1.6. The IBMAP cross The IBMAP consortium, created in 1996, was a collaboration between UAB (Universitat
Autònoma de Barcelona; Barcelona, Spain), INIA (Instituto Nacional de Investigación y Tecnología
Agraria y Alimentaria; Madrid, Spain), and IRTA (Institut de Recerca i Tecnologia Agroalimentàries;
Lleida, Spain) which made possible the generation of an initial Iberian x Landrace F2 cross
and several subsequent crosses (Figure 1.8).
Figure 1.8. Schematic representation of the Iberian by Landrace cross (IBMAP).
Experimental populations derived from two lines differing widely for traits of interest have
been successfully used in livestock to detect QTL (Andersson et al., 1994). In this context,
Iberian and Landrace breeds were selected for being divergent pig lines for meat quality,
growth, fatness, fertility, and feed efficiency traits. The Iberian pig is a racial grouping of
native pigs originating from Sus scrofa meridionalis which has been maintained for centuries in
large areas of the southwestern Iberian Peninsula. They constitute the largest of the
surviving populations of the Mediterranean type, which is one of the three ancient types of
domestic pigs (the others are the European/Celtic and Asian types). Its excellent meat
quality and cured products, with a higher content of SFA and MUFA, make them a highly
appreciated animal. In this sense, the Guadyerbas line stands out for its slow-growth, very
low prolificacy and high fat (Serra et al., 1998), and is an Iberian pig strain that has remained
isolated on an experimental farm since 1945 (Toro et al., 2000). By comparison, Landrace is
General Introduction
53
a lean international breed that has undergone a strong selection for production, lean meat
content, muscularity, and enhanced reproduction traits (Porter 1993). Nonetheless, the
Landrace meat has lower levels of fat, less IMF, higher content of PUFA, and lower
content of MUFA and SFA (Serra et al., 1998).
In this thesis the main population studied descends from crossing three Iberian
Guadyerbas boars (Dehesón del Encinar; Toledo, Spain) with 31 Landrace sows (Nova Genètica
S.A.; Lleida, Spain), obtaining an F1 generation. From this F1 generation, different
generations were created as shown in Figure 1.8, including F2, F3, and different backcrosses
with Pietrain (BC1_PI; 25% Iberian x 75% Pietrain backcross) and Duroc breeds
(BC1_DU; 25% Iberian x 75% Duroc backcross). The analyses performed in this thesis
were main focused on the 166 BC1_LD animals (25% Iberian x 75% Landrace backcross)
created by crossing 5 F1 boars with 26 Landrace sows.
1.6.1. QTLs identified in the IBMAP cross The first QTL studies performed in the IBMAP cross were based on microsatellite markers
and identified significant associated regions for carcass quality, growth, fatness and FA
composition in chromosomes SSC2, SSC3, SSC4, SSC6, SSC7, SSC8, SSC10, SSC12, and
SSCX (Ovilo et al., 2000; Pérez-Enciso et al., 2000; Ovilo et al., 2002; Pérez-Enciso et al.,
2002; Varona et al., 2002; Clop et al., 2003; Mercadé et al., 2005a; Ovilo et al., 2005; Pérez-
Enciso et al., 2005; Mercadé et al., 2006a; Muñoz et al., 2007). More recently, QTL and
GWAS approaches using high-density SNP markers allowed in general a higher resolution
in QTL intervals and the identification of new genomic regions with the analysed traits
(Fernández et al., 2012; Ramayo-Caldas et al., 2012b; Corominas et al., 2013b; Muñoz et al.,
2013).
A few QTLs for FA composition have been reported on SSC8 in the IBMAP population.
Clop et al. (2003) performed the first report of a genome scan for QTLs affecting FA
composition in pigs of the IBMAP cross. In this study, using F2 generation animals, a QTL
was identified on SSC8 for percentages of palmitic (C16:0) and palmitoleic acids (C16:1(n-
7)) and for average chain length of FA in backfat (Clop et al., 2003). Recently, a GWAS
study conducted in BC1_LD animals of the IBMAP cross led to the identification of five
genomic regions on SSC8 associated with intramuscular FA composition in Longissimus dorsi
muscle (Ramayo-Caldas et al., 2012b). Furthermore, Muñoz et al. (2013) found two relevant

Genomic and functional genomic analysis of fatty acid composition in swine
54
regions on SSC8 for palmitic (C16:0) and palmitoleic acids (C16:1(n-7)) in backfat and
IMF. The QTLs described, suggest a pleitropic effect of both FA QTLs in IMF and
backfat (Ramayo-Caldas et al., 2012b; Muñoz et al., 2013).
1.6.2. Positional candidate genes of QTLs analyzed in the IBMAP cross The final goal of complex traits dissection is to identify the genes involved and to decipher
their cellular role and functions. Within the described QTLs, several positional and
functional candidate genes for growth, fatness, and meat quality traits have been identified
in the IBMAP consortium, and are summarized in Table 1.6.
Table 1.6. Main positional candidate genes analyzed in the IBMAP cross.
Chr QTL associated trait(s) Candidate gene(s) Reference
SSC2 Growth and fatness IGF2 Estellé et al., 2005a
SSC4 Growth, FA composition
and form
APOA2 Ballester et al., 2016
DECR Clop et al., 2002
DGAT1 Mercadé et al., 2005b
FABP4 Mercadé et al., 2006b
FABP5 Estellé et al., 2006
SSC6 Fatness and IMF
ACADM Kim et al., 2006
FABP3 Ovilo et al., 2002
LEPR Ovilo et al., 2005
Muñoz et al., 2009
SSC8 FA composition
CDS1 Mercadé et al., 2007
ELOVL6 Corominas et al., 2013b, 2015
FABP2 Estellé et al., 2009a
MAML3
SETD7 Revilla et al., 2014
MTTP Estellé et al., 2005b
Estellé et al., 2009b
SSC12 FA composition
ACACA
FASN
GIP
Muñoz et al., 2007
SSCX FA composition, growth,
fatness and IMF ACSL4
Mercadé et al., 2006a
Corominas et al., 2012
To date, there is still a lot to discover regarding the number of genes that control meat
quality, but the QTLs detected for FA composition on SSC8 in the IBMAP population
show the importance of studying this chromosomal region. Different studies of our group
(Estellé et al., 2005b; Mercadé et al., 2007; Estellé et al., 2009a: Estellé et al., 2009b;
General Introduction
55
Corominas et al., 2013b; Corominas et al., 2015) have analyzed genes for this genomic
region in order to unravel the molecular basis of phenotypic variations with important
effects on meat quality traits.
One of the genes studied with more detail has been de ELOVL6 (Corominas et al. 2013b)
The coincidence between the biological function of ELOVL6 and the observed QTL
effect on FA composition on SSC8 (Clop et al., 2003; Ramayo-Caldas et al., 2012b)
strengthens the interest of the ELOVL6 as the positional gene for this QTL. The
characterization of the coding and proximal promoter regions of the porcine ELOVL6
gene allowed the identification of several mutations, especially the ELOVL6:c.-533C>T
polymorphism strongly associated with muscle and backfat percentages of palmitic (C16:0)
and palmitoleic (C16:1(n-7)) acids (Corominas et al., 2013b). Furthermore, this SNP was
found to be in full LD with SNP ELOVL6:c.-394G>A, which was associated with an
increase in methylation levels of the promotor of this gene and with a decrease of
ELOVL6 expression (Corominas et al., 2015).
1.6.3. New genomic tools in the IBMAP cross NGS technologies are allowing the mass sequencing of genomes and transcriptomes, which
are producing a vast array of genomic information. The IBMAP consortium has directly
benefited from these developments, and have used several of these new genomic
approaches to reveal the mechanisms involved in lipid metabolism. RNA-Seq have been
used to quantify gene expression in the main tissues affecting lipid metabolism: liver
(Ramayo-Caldas et al., 2012a), backfat (Corominas et al., 2013a) and muscle (Puig-Oliveras
et al., 2014a). These transcriptomic analyses have been performed in two divergent groups
of animals: a group of animals showing a higher proportion of SFA and MUFA and
another group with a higher content of PUFA. The results revealed a decreased FA
oxidation in liver (Ramayo-Caldas et al., 2012a), an increase of de novo lipogenesis in adipose
tissue (Corominas et al., 2013a), and also an increase of FA and glucose uptake and
enhanced lipogenesis in muscle (Puig-Oliveras et al., 2014a) in the animals with higher
proportion of SFA and MUFA. Interestingly, common pathways related with LXR/RXR
activation, PPARs and β-oxidation were identified in the three RNA-Seq studies. Thus, the
RNA-Seq method has helped in the selection of candidate genes and pathways related to
important meat quality traits such as FA composition. Moreover, RNA-Seq technology has

Genomic and functional genomic analysis of fatty acid composition in swine
56
been exploited as a method to detect polymorphisms in transcribed regions in an efficient
and cost-effective way (Martínez-Montes et al., 2017a).
A co-association network analysis was performed to study FA composition and growth.
Ramayo-Caldas et al. (2014) used the Association Weight Matrix (AWM) methodology
(Fortes et al., 2010; Reverter & Fortes 2013) to build a network of genes associated with
intramuscular FA composition. This analysis pointed to three transcription factors that
explain the majority of the network topology of FA metabolism: nuclear receptor
coactivator 2 (NCOA2), four and a half LIM domains 2 (FHL2) and E1A binding protein
p300 (EP300). Furthermore, Puig-Oliveras et al. (2014b) also used this methodology to
decipher gene interactions and pathways affecting pig conformation, growth and fatness
traits. Three transcription factors were identified: the peroxisome proliferator activated
receptor gamma (PPARG), E74 like ETS transcription factor 1 (ELF1) and PR/SET
domain 16 (PRDM16), as key transcription factors regulating growth traits.
The expression of a selection of potential candidate genes was analyzed in muscle (Puig-
Oliveras et al., 2016) and liver (Ballester et al., 2017) by qPCR in a large number of animals.
Remarkably, in the muscle gene-expression analyses (Puig-Oliveras et al., 2016), the nuclear
receptor subfamily 3 group C member 1 (NR3C1) transcription factor was pointed as a
strong candidate gene to be involved in the regulation of the analyzed genes, and several
genes were identified as potential regulators co-localizing with QTLs for fatness and
growth traits. The NR3C1 was also identified in the liver gene-expression analyses
(Ballester et al., 2017), and also a hotspot on SSC8 associated with the gene expression of
eight genes was identified underlying the TBC1 domain containing kinase (TBCK) gene as a
potential candidate gene to regulate it. In another study, Muñoz et al. (2013) also combined
QTL and eQTL mapping to identify candidate genes with potential effect on backfat
thickness and intramuscular FA composition. More recently, Martínez-Montes et al.,
(2017b) also used this approach to detect genomic regions regulating the gene expression
of genes whose expression is correlated with growth, fat deposition, and premium cut yield
measures. A long non-coding RNA (ALDBSSCG0000001928) was identified, whose
expression is correlated with premium cut yield.
In summary, the use of new genomic tools is of great value for the genetic dissection and
knowledge in the functional regulatory mechanisms involved in the analyzed complex
traits.

G Objectives
Chapter 2


Objectives
59
This PhD thesis was done under the framework of the IBMAP Project funded by the
Spanish Ministry of Economy and Competitiveness (grant numbers: AGL2011-29821-C02
and AGL2014-56369-C2). The present research has been performed using the animal
material generated by the IBMAP Project, a coordinated project involving INIA, IRTA and
UAB research groups.
The general objective of this thesis was to increase the knowledge of the genetic basis
determining fatty acid composition in pigs.
More specifically, the objectives were:
1. To deepen the study of the QTL architecture of pig chromosome 8 for fatty acid
composition and to evaluate positional candidate genes.
2. To identify copy number variation regions from porcine whole genome sequence
data on autosomal chromosomes, validate a selection of them in a large number of
animals, and study their association with growth and meat quality traits.
3. To study the expression in adipose tissue of a set of candidate genes for fatty acid
composition and to identify and characterize the genomic regions regulating the
expression of these genes.


Papers and Studies
Chapter 3

63
PAPER I
New insight into the SSC8 genetic determination of
fatty acid composition in pigs
Revilla M1, Ramayo-Caldas Y1,2, Castelló A1,2, Corominas J1,2, Puig-Oliveras
A1,2, Ibáñez-Escriche N3, Muñoz M4, Ballester M1,2, Folch JM1,2*
1 Centre de Recerca en Agrigenòmica (CRAG), Consorci CSIC-IRTA-UAB-UB, Campus
UAB, Bellaterra, 08193, Spain
2 Departament de Ciència Animal i dels Aliments, Facultat de Veterinària, Universitat
Autònoma de Barcelona, Bellaterra 08193, Spain
3 Genètica i Millora Animal, IRTA, Av Rovira Roure 191, Lleida 25198, Spain
4 Departamento Mejora Genética Animal, SGIT-INIA, Ctra. Coruña Km 7.5, Madrid
28040, Spain
* Corresponding author
Genetics Selection Evolution (2014). 46:28.
http://doi.org/10.1186/1297-9686-46-28

Paper and Studies
65
Abstract
Background: Fat content and fatty acid composition in swine are becoming increasingly studied
because of their effect on sensory and nutritional quality of meat. A QTL (quantitative trait
locus) for fatty acid composition in backfat was previously detected on porcine chromosome 8
(SSC8) in an Iberian x Landrace F2 intercross. More recently, a genome-wide association study
detected the same genomic region for muscle fatty acid composition in an Iberian x Landrace
backcross population. ELOVL6, a strong positional candidate gene for this QTL, contains a
polymorphism in its promoter region (ELOVL6:c.-533C < T), which is associated with
percentage of palmitic and palmitoleic acids in muscle and adipose tissues. Here, a combination
of single-marker association and the haplotype-based approach was used to analyze backfat fatty
acid composition in 470 animals of an Iberian x Landrace F2 intercross genotyped with 144
SNPs (single nucleotide polymorphisms) distributed along SSC8.
Results: Two trait-associated SNP regions were identified at 93 Mb and 119 Mb on SSC8. The
strongest statistical signals of both regions were observed for palmitoleic acid (C16:1(n-7))
content and C18:0/C16:0 and C18:1(n-7)/C16:1(n-7) elongation ratios. MAML3 and SETD7 are
positional candidate genes in the 93 Mb region and two novel microsatellites in MAML3 and
nine SNPs in SETD7 were identified. No significant association for the MAML3 microsatellite
genotypes was detected. The SETD7:c.700G > T SNP, although statistically significant, was not
the strongest signal in this region. In addition, the expression of MAML3 and SETD7 in liver
and adipose tissue varied among animals, but no association was detected with the
polymorphisms in these genes. In the 119 Mb region, the ELOVL6:c.-533C > T polymorphism
showed a strong association with percentage of palmitic and palmitoleic fatty acids and
elongation ratios in backfat.
Conclusions: Our results suggest that the polymorphisms studied in MAML3 and SETD7 are
not the causal mutations for the QTL in the 93 Mb region. However, the results for ELOVL6
support the hypothesis that the ELOVL6:c.-533C > T polymorphism has a pleiotropic effect on
backfat and intramuscular fatty acid composition and that it has a role in the determination of
the QTL in the 119 Mb region.

Genomic and functional genomic analysis of fatty acid composition in swine
66
Background
One of the main sources of human-consumed meat is pork, which represents more than 40% of
the meat produced worldwide [1]. The success of pig production is strongly related to
improvements in growth and carcass yield. Meat-quality traits are essential for the processing
industry and end-consumer acceptance [2], and, as a result, these qualitative traits have been the
subject of many studies in breeding programs. Fat content and fatty acid (FA) composition in
swine are becoming increasingly studied because of their effect on sensory and nutritional quality
of meat. They determine important sensory and technological aspects of pork and meat products
because of their influence on the melting point and oxidative status of porcine tissues [3]. In
addition, the amount and type of fat in the diet have a major impact on human health. The high
consumption of saturated fatty acids (SFA) raises plasma LDL-cholesterol, which is a major risk
factor for arteriosclerosis and coronary heart disease (CHD) [4-6]. However, recent studies
suggest that individual SFA have different physiological effects. Indeed, lauric acid (C12:0),
myristic acid (C14:0) and palmitic acid (C16:0) raise LDL and HDL cholesterol plasma levels,
whereas stearic acid (C18:0) is considered neutral [7,8], although some epidemiologic evidence
suggests that stearic acid (C18:0) is associated with CHD [9]. In contrast, cis-monounsaturated
fatty acids (MUFA) and polyunsaturated fatty acids (PUFA) are beneficial for human health.
PUFA have been shown to protect against CHD [10], whereas MUFA are also considered to
have a hypocholesterolemic effect [11] and, in addition, to have a beneficial effect on insulin
sensitivity [12].
A few QTL (quantitative trait loci) for FA composition have been reported on porcine
chromosome 8 (SSC8) in F2 Duroc x Large White [13], F2 White Duroc x Erhualian [14] and
Duroc [15] populations. Using an Iberian x Landrace F2 intercross (IBMAP) [16], a QTL was
identified on SSC8 for percentages of palmitic (C16:0) and palmitoleic (C16:1(n-7)) FA and for
average length of FA in backfat (BF). Recently, a genome-wide association study (GWAS)
conducted in a backcross population (BC1_LD; 25% Iberian and 75% Landrace) led to the
identification of five genomic regions on SSC8 associated with intramuscular fat in longissimus
dorsi (IMF) FA composition [17]. In addition, a study that combined a linkage QTL scan and a
GWAS on the same backcross revealed significant pleiotropic regions with effects on palmitic
(C16:0) and palmitoleic (C16:1(n-7)) FA in both IMF and BF tissues [18].

Paper and Studies
67
The main goals of this work were: (1) to study the QTL architecture for FA composition on
SSC8 in the F2 generation of the IBMAP cross using a panel of 144 informative SNPs, and (2) to
analyze additional positional candidate genes.
Methods
Animal samples
Animals used in this study belong to the IBMAP experimental population [19]. Two Iberian
(Guadyerbas line) boars were crossed with 30 Landrace sows to generate the F1 generation. Six
F1 boars were coupled with 67 F1 sows to obtain 470 F2 animals. In addition, gene-expression
analyses were carried out on 56 females from a backcross (BC1_LD) generated by crossing five
F1 (Iberian x Landrace) boars with 23 Landrace sows. All animals were maintained under
intensive conditions and feeding was ad libitum with a cereal-based commercial diet. The
experiments were performed in Europe following national and institutional guidelines for the
ethical use and treatment of animals in experiments. In addition, the protocol was approved by
the Ethical Committee of the Institution (IRTA Institut de Recerca i Tecnologia
Agroalimentàries). F2 animals were slaughtered at an average age of 175.5 ± 0.3 days. However,
tissues for RNA extraction were not isolated from animals of the F2 generation. Backcross
animals were slaughtered at an average age of 179.8 ± 2.6 days, and samples of liver and adipose
tissue were collected, snap-frozen in liquid nitrogen and stored at -80°C until analysis.
Genomic DNA was extracted from blood samples of all animals by the phenol-chloroform
method, as described elsewhere.
Traits analyzed
The composition of 10 FA in IMF and BF (taken between the third and the fourth ribs) tissues
was determined by gas chromatography as described in [16,17,19]. Subsequently, the percentage
of each FA, relative to the total FA, was calculated as well as the global percentages of SFA,
MUFA, PUFA and related indices, including desaturation and elongation indices.
Genotyping and quality control
A total of 470 animals were genotyped for 144 SNPs located on SSC8; these include a selection
of 142 informative SNPs derived from the Porcine SNP60K BeadChip [20] and two SNPs that
corresponded to the previously detected polymorphisms in the FABP2 [21] and MTTP [22]
genes. These SNPs [See Additional file 1: Table S1] were included in a custom-generated panel,
Genomic and functional genomic analysis of fatty acid composition in swine
68
genotyped using a Veracode Golden Gate Genotyping Kit (Illumina Inc.) and analyzed with a
Bead Xpress Reader (Illumina Inc.). SNP positions were based on the whole-genome sequence
assembly 10.2 build of Sus scrofa (http://www.animalgenome.org/repository/pig/). All genotypes
were assigned using the GenomeStudio software (Illumina Inc.). Markers that had a minor allele
frequency (MAF) lower than 5% and missing genotypes that had a frequency greater than 5%
were removed using PLINK [23] software. In total, 133 SNPs (92%) passed this quality-
threshold filter and were used in the subsequent analysis. Genotypes of all the parents were
obtained with the 60 K SNP chip (Illumina) [17] or by pyrosequencing [21,22].
SNPs SETD7:c.-1034T > G, SETD7:c.700G > T and ELOVL6:c.-533C > T were genotyped
using the KASP SNP genotyping system platform (http://www.lgcgenomics.com/genotyping/).
Besides these, two new microsatellites in the MAML3 gene were genotyped by PCR
amplification and capillary electrophoresis and fluorescent detection using an ABI Prism 3730
DNA Analyzer (Applied Biosystems).
Fifty-six animals of the BC1_LD were genotyped for SNPs SETD7:c.-1034T > G and
SETD7:c.700G > T and the two MAML3 microsatellites for gene-expression studies. In
addition, a subset of 168 F2 animals were genotyped for SNPs ELOVL6:c.-533C > T,
SETD7:c.700G > T and the two MAML3 microsatellites for association studies. All parents and
grandparents of these animals were also genotyped in the same way.
Association analysis
Association analysis was performed for FA composition and indices of FA metabolism in 470 F2
animals. A mixed model that accounts for additive effects was performed using Qxpak 5.0 [24]:
yijlkm = Sexi + Batchj + 𝛽cl + 𝜆lak + ul + eijlkm,
where yijlkm is the lth individual record, sex (two levels) and batch (five levels) are fixed effects, ß is
a covariate coefficient with c being carcass weight, λl is a -1, 0, +1 indicator variable depending
on the lth individual genotype for the kth SNP, ak represents the additive effect associated with
SNP, ul represents the infinitesimal genetic effect treated as random and distributed as N(0, Aσu)
where A is a numerator of the kinship matrix and eijlkm is the residual. A similar model that fitted
different QTL effects was used to test the hypothesis of the presence of two QTL located in the
studied regions with effects a1 and a2 on the same FA:
yijlkm = Sexi + Batchj + 𝛽cl + 𝜆la1k + 𝜆la2k + ul + eijlkm,
Paper and Studies
69
The R package q-value [25] was used to calculate the false-discovery rate (FDR), and the cut-off
of the significant association at the whole-genome level was set at the q-value ≤ 0.05. Version
2.15.2 of R [26] was used to calculate the descriptive statistics for the 10 analyzed traits and their
related indices.
For linkage and linkage disequilibrium (LDLA) analysis, haplotypes were reconstructed using
DualPHASE software [27], which exploits population (linkage disequilibrium) and family
information (Mendelian segregation and linkage) in a Hidden Markov Model setting. Then, QTL
fine-mapping was performed for the most significant traits C16:1(n-7), C18:0/C16:0, C16:1(n-
7)/C18:1(n-7), and the FA average chain-length (ACL) by applying the mixed model:
y = 𝐗𝐛 + 𝐙𝐡𝐡 + 𝐙𝐮𝐮 + 𝐞,
in which b is a vector of fixed effects (sex and batch), h is the vector of random QTL effects
corresponding to the K cluster defined by the Hidden State, u is the vector of random individual
polygenic effects and e is the vector of individual error.
Amplification and sequencing of the pig MAML3 and SETD7 genes
Genomic DNA samples from 10 individuals of the BC1_LD and two Iberian boars were used to
amplify and sequence the proximal promoter and exon 1 of the MAML3 and SETD7 genes.
A 931-bp region of the MAML3 gene was amplified and sequenced in two overlapping
fragments of 517 bp and 663 bp. Primers [See Additional file 2: Table S2] were designed based
on a SSC8 sequence of a Sus scrofa mixed breed [ENSSSCG00000009060] available from the
Sscrofa10.2 database and conserved with the human MAML3 gene [ENSG00000196782].
For the SETD7 gene, two overlapping fragments of 473 bp and 478 bp were amplified and
sequenced. Primers [See Additional file 2: Table S2] were designed based on a SSC8 sequence of
a Sus scrofa mixed breed [ENSSSCG00000030396] available from the Sscrofa10.2 database and
conserved with the human SETD7 gene [ENSG00000145391].
All primers were designed using the PRIMER3 software [28] and were validated using the
PrimerExpress 2.0 software (Applied Biosystems).
PCR (polymerase chain reactions) were carried out in a total volume of 25 μL containing 0.6
units of AmpliTaq Gold (Applied Biosystems), 1.5 to 2.5 mM MgCl2 depending on the primers
[See Additional file 2: Table S2], 0.2 mM of each dNTP, 0.5 μM of each primer and 20 ng of
genomic DNA. The temperature profile was 94°C for 10 min and 35 cycles at 94°C for 1 min,
Genomic and functional genomic analysis of fatty acid composition in swine
70
58°C to 62°C depending on the primers [See Additional file 2: Table S2] for 1 min and 72°C for
1.5 min, including a final step of 7 min at 72°C. Gradient parameters were determined based on
size and GC content of the amplicon. The samples were then analyzed on 1.5% agarose gels.
Purification was performed using an Exonuclease I and FastAP™ Thermosensitive Alkaline
Phosphatase [29]. For the sequencing reaction, we used the Big Dye Terminator v.3.1 Cycle
Sequencing Kit and an ABI Prism 3730 DNA analyzer was employed (Applied Biosystems).
Polymorphisms were checked through the Seq scape v2.1.1 program (Applied Biosystems).
Detection of microsatellite polymorphisms
Based on the sequencing results of the promoter region and exon 1 of the MAML3 gene, two
new microsatellites were identified. Both microsatellites were independently amplified using
fluorescent primers [See Additional file 2: Table S2]. PCR were performed in a 25-μL reaction
mix containing 20 ng of genomic DNA, 0.2 mM of each dNTP, 2.5 mM MgCl2, 0.5 μM of each
PCR primer and 0.6 units of AmpliTaq Gold (Applied Biosystems). PCR were run as follows:
94°C for 10 min, 35 cycles of 94°C for 1 min, 58°C for 1 min, 72°C for 1.5 min and a final
extension step at 72°C for 7 min. The two amplicons were mixed at a ratio of 1:3 (HEX: FAM)
and analyzed using capillary electrophoresis on an ABI Prism 3730 DNA analyzer (Applied
Biosystems) and the ROX-500 GeneScan Size Standard. The peak height of each product was
determined using Peak Scanner 2 software (Applied Biosystems).
RNA isolation and cDNA synthesis
Total RNA was extracted from liver and BF tissues using the RiboPure kit (Ambion), according
to the manufacturer’s recommendations. RNA was then quantified using a NanoDrop ND-1000
spectrophotometer (NanoDrop products) and RNA integrity was assessed with an Agilent
Bioanalyzer-2100 (Agilent Technologies). One μg of total RNA of each sample was reverse-
transcribed using the High-Capacity cDNA Reverse Transcription kit (Applied Biosystems) in a
reaction volume of 20 μL.
Gene-expression quantification
Fifty-six females of the BC1_LD were used to quantify gene expression. The expression of
MAML3 and SETD7 was analyzed using the 48.48 microfluidic dynamic array IFC chip
(Fluidigm) according to the manufacturer’s instructions. Briefly, 2 μL of 1:5 diluted cDNA was
pre-amplified using 2X Taqman PreAmp Master Mix (Applied Biosystems) and 50 nM of each
primer pair in 5 μL reaction volume. The cycling program consisted of an initial step of 10 min
Paper and Studies
71
at 95°C followed by 16 cycles of 15 s at 95°C and 4 min at 60°C. At the end of this pre-
amplification step, the reaction products were diluted 1:5 (diluted pre-amplification samples).
RT-qPCR on the dynamic array chips was conducted on the BioMarkTM system (Fluidigm). A
5-μL pre-mix sample containing 2.5 μL of SsoFast EvaGreen Supermix with Low ROX (Bio-
Rad), 0.25 μL of DNA Binding Dye Sample Loading Reagent (Fluidigm) and 2.25 μL of diluted
pre-amplification samples (1:16 or 1:64 from the diluted pre-amplification samples from liver and
BF samples, respectively), as well as a 5-μL assay mix containing 2.5 μL of Assay Loading
Reagent (Fluidigm), 2.25 μL of DNA Suspension Buffer (Teknova) and 0.25 μL of 100 μM
primer pairs (500 nM in the final reaction) were mixed inside the chip using the IFC controller
MX (Fluidigm). The cycling program consisted of an initial step of 60 s at 95°C followed by 30
cycles of 5 s at 96°C and 20 s at 60°C. A dissociation curve was also drawn for each primer pair.
Data were collected using the Fluidigm Real-Time PCR analysis software 3.0.2 (Fluidigm) and
analyzed with the DAG expression software 1.0.4.11 [30] using standard curves for relative
quantification. Relative standard-curves with a four-fold dilutions series (1/4, 1/16, 1/64, 1/256,
1/1024) of a pool of 10 cDNA samples were constructed for each gene to extrapolate the value
of the quantities of each studied sample. Of the four endogenous genes tested (ACTB, B2M,
HPRT1, TBP), ACTB and TBP had the most stable expression [31] in both tissues. The
normalized quantity values of each sample and assay were used to compare our data.
PCR primer sequences [See Additional file 2: Table S2] were designed using PrimerExpress 2.0
software (Applied Biosystems).
Mean values between genotypes were compared using a linear model implemented in R, which
performs a single stratum analysis of variance considering sex and batch as fixed effects.
Differences were considered statistically significant at a p-value of 0.05.
Results and discussion
Association studies and combined linkage disequilibrium and linkage analyses
A custom panel of 144 SNPs located on SSC8 was used to genotype 470 F2 animals. Association
analyses for the BF FA composition in the C14:0 to C22:0 ranges were performed with
genotypes from a subset of 133 SNPs (call rate > 0.99). Statistically significant associations were
found (Table 1) for the SFA myristic (C14:0), palmitic (C16:0) and stearic acids (C18:0). Among
MUFA, palmitoleic acid (C16:1(n-7)) and oleic acid (C18:1(n-9)) were associated, whereas for

Genomic and functional genomic analysis of fatty acid composition in swine
72
PUFA only eicosadienoic acid (C20:2(n-6)) was significant. Similarly, the ACL metabolic ratio
showed a significant association. A strong association signal was found for the C16:1(n-7)/C16:0
desaturation ratio and two elongation ratios: C18:0/C16:0 and C18:1(n-7)/C16:1(n-7).
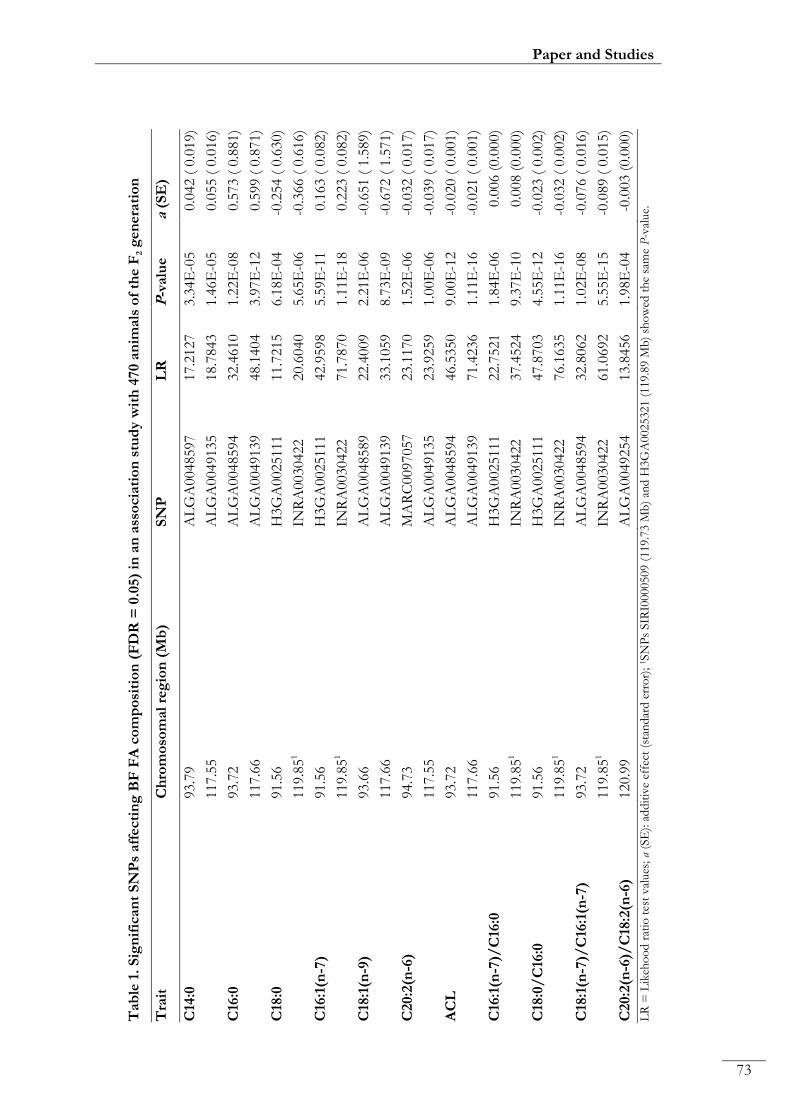
Tab
le 1
. S
ign
ific
an
t S
NP
s aff
ecti
ng
BF
FA
co
mp
osi
tio
n (
FD
R =
0.0
5)
in a
n a
sso
cia
tio
n s
tud
y w
ith
470 a
nim
als
of
the F
2 g
en
era
tio
n
Tra
it
Ch
rom
oso
mal
reg
ion
(M
b)
SN
P
LR
P
-valu
ea
(SE
)
C14
:0
93.7
9
AL
GA
0048597
17.2
127
3.3
4E
-05
0.0
42 (
0.0
19)
117.5
5
AL
GA
0049135
18.7
843
1.4
6E
-05
0.0
55 (
0.0
16)
C16
:0
93.7
2
AL
GA
0048594
32.4
610
1.2
2E
-08
0.5
73 (
0.8
81)
117.6
6
AL
GA
0049139
48.1
404
3.9
7E
-12
0.5
99 (
0.8
71)
C18
:0
91.5
6
H3G
A0025111
11.7
215
6.1
8E
-04
-0.2
54 (
0.6
30)
119.8
51
INR
A0030422
20.6
040
5.6
5E
-06
-0.3
66 (
0.6
16)
C16
:1(n
-7)
91.5
6
H3G
A0025111
42.9
598
5.5
9E
-11
0.1
63 (
0.0
82)
119.8
51
INR
A0030422
71.7
870
1.1
1E
-18
0.2
23 (
0.0
82)
C18
:1(n
-9)
93.6
6
AL
GA
0048589
22.4
009
2.2
1E
-06
-0.6
51 (
1.5
89)
117.6
6
AL
GA
0049139
33.1
059
8.7
3E
-09
-0.6
72 (
1.5
71)
C20:2
(n-6
) 94.7
3
MA
RC
0097057
23.1
170
1.5
2E
-06
-0.0
32 (
0.0
17)
117.5
5
AL
GA
0049135
23.9
259
1.0
0E
-06
-0.0
39 (
0.0
17)
AC
L
93.7
2
AL
GA
0048594
46.5
350
9.0
0E
-12
-0.0
20 (
0.0
01)
117.6
6
AL
GA
0049139
71.4
236
1.1
1E
-16
-0.0
21 (
0.0
01)
C16
:1(n
-7)/
C16
:0
91.5
6
H3G
A0025111
22.7
521
1.8
4E
-06
0.0
06 (
0.0
00)
119.8
51
INR
A0030422
37.4
524
9.3
7E
-10
0.0
08 (
0.0
00)
C18
:0/
C16
:0
91.5
6
H3G
A0025111
47.8
703
4.5
5E
-12
-0.0
23 (
0.0
02)
119.8
51
INR
A0030422
76.1
635
1.1
1E
-16
-0.0
32 (
0.0
02)
C18
:1(n
-7)/
C16
:1(n
-7)
93.7
2
AL
GA
0048594
32.8
062
1.0
2E
-08
-0.0
76 (
0.0
16)
119.8
51
INR
A0030422
61.0
692
5.5
5E
-15
-0.0
89 (
0.0
15)
C20:2
(n-6
)/C
18:2
(n-6
) 120.9
9
AL
GA
0049254
13.8
456
1.9
8E
-04
-0.0
03 (
0.0
00)
LR
= L
ikeh
oo
d r
atio
tes
t val
ues
; a
(SE
): a
dd
itiv
e ef
fect
(st
and
ard
err
or)
; 1SN
Ps
SIR
I0000509 (
119.7
3 M
b)
and
H3G
A0025321 (
119.8
9 M
b)
sho
wed
th
e sa
me
P-v
alue.
73
Paper and Studies

Genomic and functional genomic analysis of fatty acid composition in swine
74
Two regions that contain trait-associated SNPs (TAS) were clearly visualized in the association
plots at around 93 Mb and 119 Mb for all of the above-mentioned FA and indices with the
exception of the C20:2(n-6)/C18:2(n-6) elongation ratio, which showed only one significant TAS
region at 120.99 Mb (Table 1). For all significant traits, the 119 Mb TAS region showed a
stronger signal than the 93 Mb region. The strongest effects of both TAS regions were found for
palmitoleic acid (C16:1(n-7)) content and C18:0/C16:0 and C18:1(n-7)/C16:1(n-7) elongation
ratios.
A combination of linkage disequilibrium and linkage analysis (LDLA) was then performed for
the most significantly associated traits [See Additional file 2: Table S3]. With this haplotype-based
approach, it is possible to simultaneously exploit linkage analysis and linkage disequilibrium.
Several studies have shown the usefulness of this strategy for fine-mapping and QTL interval
reduction [27,32]. The LDLA study identified the two TAS regions by association analysis, with
the 119 Mb region showing the strongest statistical signal for all analyzed traits. Figure 1 shows
the two genomic regions identified for the C18:0/C16:0 elongation ratio. Plots of the other three
traits analyzed are shown in Additional file 3: Figure S1.

Paper and Studies
75
Figure 1. Association study and LDLA of the C18:0/C16:0 elongation ratio in BF. Plot of association study (red points) and LDLA patterns (blue line) for the stearic/palmitic ratio; the X-axis represents positions in Mb on SSC8, and the Y-axis shows the –log10 (p-value); vertical, the pink line represents the position of the MAML3 gene, the blue line represents the position of the SETD7 gene and the green line represents the position of the ELOVL6 gene on SSC8; horizontal, dashed lines mark the association study significance level (FDR-based q-value ≤ 0.05); positions in Mb are relative to the Sscrofa10.2 assembly of the pig genome.
In order to determine whether one or two QTL were segregating on SSC8 for the BF FA and
their indices, models fitting one QTL against a model considering two different QTL were
tested. Results of the LR test indicated that the model with two QTL was the most likely for the
10 traits analyzed [See Additional file 2: Table S4].
Previously, a QTL scan for BF FA composition was performed with 369 animals from the same
F2 generation [16], but only six microsatellite markers were genotyped. A clear effect of SSC8
markers was observed only for percentages of palmitic (C16:0) and palmitoleic (C16:1(n-7)) FA
and ACL. A suggestive effect on percentage of oleic acid (C18:1(n-9)) was also observed.
However, the confidence interval for this QTL was greater than 30 cM. Two other studies of our
group analyzed positional candidate genes for this QTL, i.e. FABP2 [21] and MTTP [22], but the
Genomic and functional genomic analysis of fatty acid composition in swine
76
localization of the QTL was not refined. In addition, QTL for IMF palmitic (C16:0) FA
composition have been reported in a Duroc x Large White F2 cross [13] and for stearic (C18:0)
FA in a White Duroc x Erhualian F2 cross [14].
A GWAS for IMF FA composition [17] with genotypes from the 60 K SNP chip (Illumina) was
carried out using 144 animals from a related backcross population (BC1_LD). The strongest
signals on SSC8 were observed for the palmitoleic (C16:1(n-7)) FA content and the C18:1(n-
7)/C16:1(n-7) ratio for SNPs ALGA0048684 and SIRI0000509, which in the Sscrofa10.2
assembly are located at 99.2 Mb and 119.7 Mb, respectively. Furthermore, two significant
pleiotropic regions (at 93.3 Mb - 99.5 Mb and 110.9 Mb - 126.9 Mb) with effects on palmitoleic
(C16:1(n-7)) FA in both IMF and BF tissues have been identified in the same backcross [18]. For
palmitic (C16:0) FA, a large (83.8 Mb - 130.6 Mb) chromosomal interval was significant for both
BF and IMF [18].
Here, two QTL at approximately 93 Mb and 119 Mb were detected and affected the BF
composition of the six FA and the four indices mentioned above in the 470 F2 animals. The
palmitoleic (C16:1(n-7)) FA QTL on SSC8 have been shown to be segregating in different
crosses of the IBMAP population, and both QTL have a pleiotropic effect on BF and IMF FA
deposits.
Gene annotation and identification of polymorphisms in positional candidate genes
Gene annotation of the two TAS genomic regions allowed us to identify genes related to FA
metabolism. In the first region, the genes mastermind-like 3 (MAML3) (at position 92.67 Mb) and
SET domain containing lysine methyltransferase 7 (SETD7) (at position 93.13 Mb) were found. Both
genes have recently been reported in a predicted co-association gene network for intramuscular
FA composition in pigs (Ramayo et al., 2013; unpublished observations).
MAML3 is a member of the Mam gene family, which plays an essential role in the stabilization of
Notch transcriptional activation complexes [33]. This Notch signaling pathway mediates short-
range communication between cells, and it has recently been associated with the regulation of
lipogenesis and gluconeogenesis in liver [34]. A 931-bp fragment of the pig MAML3 gene that
covers part of the promoter region and part of exon 1, was amplified from genomic DNA and
sequenced. Two novel microsatellites were found: MAML3_MS1, a (CA)n tandem repeat located
in the promoter region and MAML3_MS2, a (CGG)n tandem repeat identified in exon 1. The
variability of both microsatellites is described in Table 2.
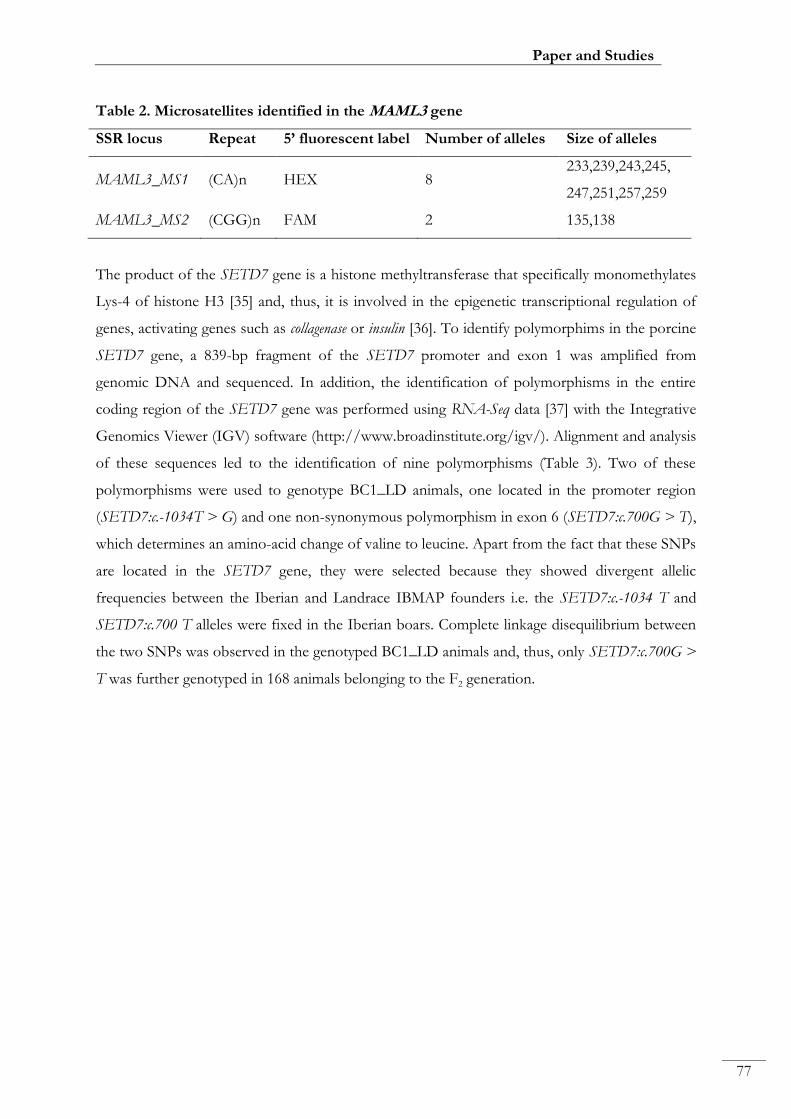
Paper and Studies
77
Table 2. Microsatellites identified in the MAML3 gene
SSR locus Repeat 5’ fluorescent label Number of alleles Size of alleles
MAML3_MS1 (CA)n HEX 8 233,239,243,245,
247,251,257,259
MAML3_MS2 (CGG)n FAM 2 135,138
The product of the SETD7 gene is a histone methyltransferase that specifically monomethylates
Lys-4 of histone H3 [35] and, thus, it is involved in the epigenetic transcriptional regulation of
genes, activating genes such as collagenase or insulin [36]. To identify polymorphims in the porcine
SETD7 gene, a 839-bp fragment of the SETD7 promoter and exon 1 was amplified from
genomic DNA and sequenced. In addition, the identification of polymorphisms in the entire
coding region of the SETD7 gene was performed using RNA-Seq data [37] with the Integrative
Genomics Viewer (IGV) software (http://www.broadinstitute.org/igv/). Alignment and analysis
of these sequences led to the identification of nine polymorphisms (Table 3). Two of these
polymorphisms were used to genotype BC1_LD animals, one located in the promoter region
(SETD7:c.-1034T > G) and one non-synonymous polymorphism in exon 6 (SETD7:c.700G > T),
which determines an amino-acid change of valine to leucine. Apart from the fact that these SNPs
are located in the SETD7 gene, they were selected because they showed divergent allelic
frequencies between the Iberian and Landrace IBMAP founders i.e. the SETD7:c.-1034 T and
SETD7:c.700 T alleles were fixed in the Iberian boars. Complete linkage disequilibrium between
the two SNPs was observed in the genotyped BC1_LD animals and, thus, only SETD7:c.700G >
T was further genotyped in 168 animals belonging to the F2 generation.

Genomic and functional genomic analysis of fatty acid composition in swine
78
Table 3. Polymorphisms identified in the proximal promoter and coding regions of the
SETD7 gene
Gene localization Position (bp) Ref4 Pol5 Aminoacid change
Promoter1 -1300 A G
-10343 T G
-980 C A
-632 T C
Exon 42 462 C T
Exon 62 7003 G T VAL/LEU
708 G A
Exon 72 807 C T
Exon 82 960 C T 1Positions relative to the transcription start-site using, as reference, the GenBank ENSSSCG00000030396 sequence; 2referring to the coding region, using RNA-Seq data; 3SNPs genotyped; 4Ref = nucleotide in the reference sequence; 5Pol = polymorphisms found.
In the second region, the ELOVL6 gene was identified at position 120.12 Mb. The ELOVL6
gene is a strong positional and functional candidate gene involved in de novo lipogenesis and acts
on the elongation of SFA and MUFA. A polymorphism in the promoter region of this gene
(ELOVL6:c.-533C> T) has previously been associated with percentages of palmitic and
palmitoleic FA in muscle and backfat in the BC1_LD population [38]. In addition, expression of
the ELOVL6 gene was lower in the backfat of animals with the Iberian allele in comparison to
those with the Landrace allele. As expected from the elongation function of this gene, a lower
ELOVL6 expression was associated with a higher percentage of palmitic and palmitoleic FA in
muscle and adipose tissue [38].
Based on our results, the observed effects on FA composition and indices are concordant with a
lower expression of the ELOVL6 gene in animals with the Iberian allele [38] for both TAS
regions (Figure 2). ELOVL6 elongates palmitic (C16:0) to stearic (C18:0), and palmitoleic
(C16:1(n-7)) to vaccenic (C18:1(n-7)) FA. Thus, a lower ELOVL6 activity associated with the
Iberian allele will directly decrease these elongation ratios. Moreover, as observed, a lower
ELOVL6 activity will result in the accumulation of palmitic (C16:0) and palmitoleic (C16:1(n-7))
FA and a reduction in stearic (C18:0) FA content (Figure 2).

Paper and Studies
79
Figure 2. Schematic representation of the elongation pathway of 16 and 18 carbon FAs. Statistically significant FA (red square) and ratios of elongation and desaturation (colored arrows) are shown for BF FA
composition in the F2 generation.
Regarding oleic FA (C18:1(n-9)), the main dietary FA, its content in BF was decreased in animals
with the Iberian allele for the TAS regions on SSC8. It must be noted that the opposite effect
was observed in the major SSC4 and SSC6 TAS regions for oleic (C18:1(n-9)) IMF content [17].
Effect of the SETD7:c. 1034T > G and SETD7:c.700G > T SNPs and MAML3
microsatellites on gene expression
The expression profiles of the pig MAML3 and SETD7 genes were studied in liver and BF
tissues of 56 BC1_LD females by RT-qPCR. The analysis of gene expression in the F2 generation
was not possible because tissues for RNA isolation were not available. Differences in the
expression of MAML3 among animals were observed, with coefficients of variation (CV) of
35% and 42% in liver and BF, respectively. The SETD7 gene expression was less variable, with
CV values of 18% and 33% in liver and BF tissue, respectively. However, no significant
differences in expression of SETD7 were detected among animals classified according to the
SETD7 genotypes (either SETD7:c.-1034T > G or SETD7:c.700G > T) in either tissue. Similarly,
no differences in expression of MAML3 were observed among animals classified according to

Genomic and functional genomic analysis of fatty acid composition in swine
80
the MAML3_MS1 and MS2 microsatellites. In addition, no significant correlation was found
between expression levels of MAML3 or SETD7 in the liver and adipose, which suggests that
different and tissue-specific mechanisms control the liver and adipose tissue expression of
MAML3 and SETD7.
Association study for BF FA composition with markers located in positional candidate
genes
Two microsatellites in the MAML3 gene (MAML3_MS1 and MAML3_MS2), one SNP in the
SETD7 gene (SETD7:c.700G > T), and one SNP in the ELOVL6 gene (ELOVL6:c.-533C > T)
were used to genotype 168 animals of the F2 generation. An association analysis with these
markers and the SSC8 genotypes from the 133 SNPs of our custom porcine SNP panel was
performed.
For the first region (93 Mb), polymorphisms in the SETD7 and MAML3 genes were studied.
For SETD7, the SETD7:c.700G > T polymorphism did not show the most significant
association (Table 4). In addition, MAML3 gene microsatellites showed no significant
associations for any of the traits studied. However, the SNPs showing the strongest signals
(Table 4) were located within a 2 Mb interval of the SETD7 and MAML3 genes. These results
suggest that other non-genotyped polymorphisms may cause the observed effects on FA
composition in the 93-Mb region.
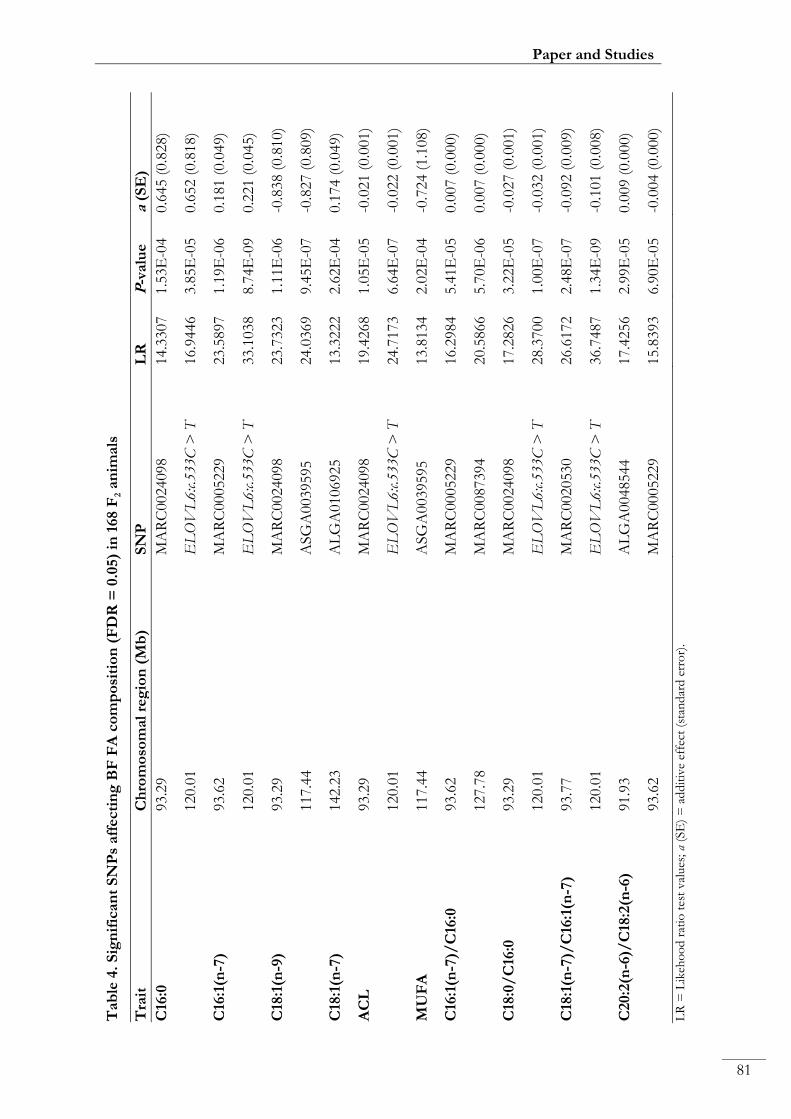
Tab
le 4
. S
ign
ific
an
t S
NP
s aff
ecti
ng
BF
FA
co
mp
osi
tio
n (
FD
R =
0.0
5)
in 1
68 F
2 a
nim
als
Tra
it
Ch
rom
oso
mal
reg
ion
(M
b)
SN
P
LR
P
-valu
ea
(SE
)
C16
:0
93.2
9
MA
RC
0024098
14.3
307
1.5
3E
-04
0.6
45 (
0.8
28)
120.0
1
EL
OV
L6:c.5
33C
> T
16.9
446
3.8
5E
-05
0.6
52 (
0.8
18)
C16
:1(n
-7)
93.6
2
MA
RC
0005229
23.5
897
1.1
9E
-06
0.1
81 (
0.0
49)
120.0
1
EL
OV
L6:c.5
33C
> T
33.1
038
8.7
4E
-09
0.2
21 (
0.0
45)
C18
:1(n
-9)
93.2
9
MA
RC
0024098
23.7
323
1.1
1E
-06
-0.8
38 (
0.8
10)
117.4
4
ASG
A0039595
24.0
369
9.4
5E
-07
-0.8
27 (
0.8
09)
C18
:1(n
-7)
142.2
3
AL
GA
0106925
13.3
222
2.6
2E
-04
0.1
74 (
0.0
49)
AC
L
93.2
9
MA
RC
0024098
19.4
268
1.0
5E
-05
-0.0
21 (
0.0
01)
120.0
1
EL
OV
L6:c.5
33C
> T
24.7
173
6.6
4E
-07
-0.0
22 (
0.0
01)
MU
FA
117.4
4
ASG
A0039595
13.8
134
2.0
2E
-04
-0.7
24 (
1.1
08)
C16
:1(n
-7)/
C16
:0
93.6
2
MA
RC
0005229
16.2
984
5.4
1E
-05
0.0
07 (
0.0
00)
127.7
8
MA
RC
0087394
20.5
866
5.7
0E
-06
0.0
07 (
0.0
00)
C18
:0/
C16
:0
93.2
9
MA
RC
0024098
17.2
826
3.2
2E
-05
-0.0
27 (
0.0
01)
120.0
1
EL
OV
L6:c.5
33C
> T
28.3
700
1.0
0E
-07
-0.0
32 (
0.0
01)
C18
:1(n
-7)/
C16
:1(n
-7)
93.7
7
MA
RC
0020530
26.6
172
2.4
8E
-07
-0.0
92 (
0.0
09)
120.0
1
EL
OV
L6:c.5
33C
> T
36.7
487
1.3
4E
-09
-0.1
01 (
0.0
08)
C20:2
(n-6
)/C
18:2
(n-6
) 91.9
3
AL
GA
0048544
17.4
256
2.9
9E
-05
0.0
09 (
0.0
00)
93.6
2
MA
RC
0005229
15.8
393
6.9
0E
-05
-0.0
04 (
0.0
00)
LR
= L
ikeh
oo
d r
atio
tes
t val
ues
; a
(SE
) =
ad
dit
ive
effe
ct (
stan
dar
d e
rro
r).
81
Paper and Studies

Genomic and functional genomic analysis of fatty acid composition in swine
82
For the second region (119 Mb), a polymorphism in the ELOVL6 gene was studied. The
ELOVL6:c.-533C > T polymorphism showed the highest association with percentage of palmitic
and palmitoleic FA, ACL, and C18:0/C16:0 and C18:1(n-7)/C16:1(n-7) ratios (Table 4). Hence,
these results are consistent with those found in the IMF FA composition of the BC1_LD
generation [38]. The clear association of the ELOVL6:c.-533C > T polymorphism with
percentage of FA in IMF and BF indicates a pleiotropic effect of this gene in both tissues.
Analysis of the additive value of SNPs SETD7:c.700G > T and ELOVL6:c.-533C > T showed a
higher contribution of ELOVL6:c.-533C > T SNP for all studied FA and indices. Furthermore,
the additive value of the two SNPs [See Additional file 2: Table S5] showed an effect in the same
direction. For instance, the Iberian alleles of both QTL increased palmitic and palmitoleic FA
content and reduced the elongation ratios. These results are in accordance with the reported
Iberian-Landrace breed differences in BF FA composition [39].
Conclusions
In summary, two TAS regions at 93 Mb and 119 Mb on SSC8 affect BF FA composition. Both
regions showed a strong effect on palmitoleic acid content and C18:0/C16:0 and C18:1(n-
7)/C16:1(n-7) elongation ratios. The MAML3 and SETD7 genes were analyzed as positional
candidate genes of the 93-Mb TAS region. Two novel microsatellites were identified in the
MAML3 gene, and nine SNPs in the SETD7 gene. However, the association analysis did not
reveal any significant association between the MAML3 microsatellite genotypes and the traits
studied, and the SETD7:c.700G > T SNP did have not the strongest signal in the 93-Mb region.
Although the expression of MAML3 and SETD7 genes in liver and adipose tissue varied among
animals, it was not associated with any of the genotyped polymorphisms in these genes. These
results suggest that the polymorphisms studied in MAML3 and SETD7 are not the causal
variants of the 93-Mb QTL. Conversely, for the 119-Mb region, the ELOVL6:c.-533C > T SNP
was strongly associated with percentage of palmitic and palmitoleic FA, ACL, and C18:0/C16:0
and C18:1(n-7)/C16:1(n-7) elongation ratios. These results suggest pleiotropic effects of
ELOVL6:c.-533C > T on BF and IMF FA composition.
Competing interests
The authors declare that they have no competing interests.
Paper and Studies
83
Authors’ contributions
JMF, MB and YRC conceived and designed the experiment. JMF was the principal investigator
of the project. NI, MM and JMF collected samples. APO, JC, MB and MR performed the DNA
and RNA isolation. MR, AC, JC and MB identified the polymorphisms and performed the
genotyping. MR, YRC and JC performed the association analysis. MR, AC, APO and MB
performed the gene-expression analysis. MR and JMF wrote the manuscript. All authors read
and approved the final manuscript.
Acknowledgments
This work was funded by MICINN AGL2008-04818-C03/GAN and MINECO AGL2011-
29821-C02 and the Innovation Programme Consolider-Ingenio 2010 (CSD2007-00036). M.
Revilla is a Master’s student of Animal Breeding and Biotechnology of Reproduction
(Polytechnical University of Valencia and Autonomous University of Barcelona). Y. Ramayo-
Caldas was funded by a FPU grant (AP2008-01450), J. Corominas by a FPI scholarship from the
Ministry of Education (BES-2009-018223) and A. Puig-Oliveras by a PIF scholarship (458-01-
1/2011). This manuscript has been proofread by Chuck Simons, a native English speaking
university instructor in English.
References
1. Rothschild MF, Ruvinsky A: The Genetics of the Pig. 2nd edition. Wallingford: CABI; 2011.
2. Park GB, Moon SS, Ko YD, Ha JK, Lee JG, Chang HH, Joo ST: Influence of slaughter
weight and sex on yield and quality grades of Hanwoo (Korean native cattle)
carcasses. J Anim Sci 2002, 80:129–136.
3. Ventanas S, Tejeda JF, Estévez M: Chemical composition and oxidative status of
tissues from Iberian pigs as affected by diets: extensive feeding v.oleic acid- and
tocopherol-enriched mixed diets. Animal 2008, 2:621–630.
4. Clarke R, Frost C, Collins R, Appleby P, Peto R: Dietary lipids and blood cholesterol:
quantitative meta-analysis of metabolic ward studies. BMJ 1997, 314:112–117.
5. Mensink RP, Katan MB: Effect of dietary fatty acids on serum lipids and lipoproteins.
A meta-analysis of 27 trials. Arterioscler Thromb 1992, 12:911–919.
6. Wolfram G: Dietary fatty acids and coronary heart disease. Eur J Med Res 2003, 8:321–
324.
Genomic and functional genomic analysis of fatty acid composition in swine
84
7. Hunter JE, Zhang J, Kris-Etherton PM: Cardiovascular disease risk of dietary stearic
acid compared with trans, other saturated, and unsaturated fatty acids: a systematic
review. Am J Clin Nutr 2010, 91:46–63.
8. Astrup A, Dyerber J, Elwood P, Hermansen K, Hu FB, Jakobsen MU, Kok FJ, Krauss RM,
Lecerf JM, LeGrand P, Nestel P, Risérus U, Sanders T, Sinclair A, Stender S, Tholstrup T,
Willet WC: The role of reducing intakes of saturated fat in the prevention of
cardiovascular disease: where does the evidence stand in 2010? Am J Clin Nutr 2011,
93:684–688.
9. Hu FB, Stampfer MJ, Manson JE, Ascherio A, Colditz GA, Speizer FE, Hennekens CH,
Willett WC: Dietary saturated fats and their food sources in relation to the risk of
coronary heart disease in women. Am J Clin Nutr 1999, 70:1001–1008.
10. Harris WS, Poston WC, Haddock CK: Tissue n-3 and n-6 fatty acids and risk for
coronary heart disease events. Atherosclerosis 2007, 193:1–10.
11. López-Huertas E: Health effects of oleic acid and long chain omega-3 fatty acids
(EPA and DHA) enriched milks. A review of intervention studies. Pharmacol Res 2010,
61:200–207.
12. Ros E: Dietary cis-monounsaturated fatty acids and metabolic control in type 2
diabetes. Am J Clin Nutr 2003, 78:617S–625S.
13. Sanchez MP, Iannuccelli N, Basso B, Bidanel JP, Billon Y, Gandemer G, Gilbert H, Larzul
C, Legault C, Riquet J, Milan D, Le Roy P: Identification of QTL with effects on
intramuscular fat content and fatty acid composition in a Duroc x Large White cross.
BMC Genet 2007, 8:55.
14. Guo T, Ren J, Yang K, Ma J, Zhang Z, Huang L: Quantitative trait loci for fatty acid
composition in longissimus dorsi and abdominal fat: results from a White Duroc x
Erhualian intercross F2 population. Anim Genet 2009, 40:185–191.
15. Uemoto Y, Soma Y, Sato S, Ishida M, Shibata T, Kadowaki H, Kobayashi E, Suzuki K:
Genome-wide mapping for fatty acid composition and melting point of fat in a
purebred Duroc pig population. Anim Genet 2012, 43:27–34.
16. Clop A, Ovilo C, Pérez-Enciso M, Cercos A, Tomas A, Fernandez A, Coll A, Folch JM,
Barragan C, Diaz I, Oliver MA, Varona L, Silio L, Sanchez A, Noguera JL: Detection of
QTL affecting fatty acid composition in the pig. Mamm Genome 2003, 14:650–656.
17. Ramayo-Caldas Y, Mercadé A, Castelló A, Yang B, Rodríguez C, Alves E, Díaz I, Ibáñez-
Escriche N, Noguera JL, Pérez-Enciso M, Fernández AI, Folch JM: Genome-wide
Paper and Studies
85
association study for intramuscular fatty acid composition in an Iberian x Landrace
Cross. J Anim Sci 2012, 90:2883–2893.
18. Muñoz M, Rodríguez MC, Alves E, Folch JM, Ibañez-Escriche N, Silió L, Fernández AI:
Genome-wide analysis of porcine backfat and intramuscular fat fatty acid
composition using high-density genotyping and expression data. BMC Genomics 2013,
14:845.
19. Pérez-Enciso M, Clop A, Noguera JL, Ovilo C, Coll A, Folch JM, Babot D, Estany J, Oliver
MA, Díaz I, Sánchez A: A QTL on pig chromosome 4 affects fatty acid metabolism:
evidence from an Iberian by Landrace intercross. J Anim Sci 2000, 78:2525–2531.
20. Ramos AM, Crooijmans RP, Affara NA, Amaral AJ, Archibald AL, Beever JE, Bendixen C,
Churcher C, Clark R, Dehais P, Hansen MS, Hedegaard J, Hu ZL, Kerstens HH, Law AS,
Megens HJ, Milan D, Nonneman DJ, Rohrer GA, Rothschild MF, Smith TP, Schnabel RD,
Van Tassell CP, Taylor JF, Wiedmann RT, Schook LB, Groenen MA: Design of a high
density SNP genotyping assay in the pig using SNPs identified and characterized by
next generation sequencing technology. PLoS ONE 2009, 4:e6524.
21. Estellé J, Mercadé A, Pérez-Enciso M, Pena RN, Silió L, Sánchez A, Folch JM: Evaluation
of FABP2 as candidate gene for a fatty acid composition QTL in porcine
chromosome 8. J Anim Breed Genet 2009, 126:52–58.
22. Estellé J, Fernández AI, Pérez-Enciso M, Fernández A, Rodríguez C, Sánchez A, Noguera
JL, Folch JM: A non-synonymous mutation in a conserved site of the MTTP gene is
strongly associated with protein activity and fatty acid profile in pigs. Anim Genet
2009, 40:813–820.
23. Purcell S, Neale B, Todd-Brown K, Thomas L, Ferreira MA, Bender D, Maller J, Sklar P, de
Bakker PI, Daly MJ, Sham PC: PLINK: a tool set for whole-genome association and
population-based linkage analyses. Am J Hum Genet 2007, 81:559–575.
24. Pérez-Enciso M, Misztal I: Qxpak.5: Old mixed model solutions for new genomics
problems. BMC Bioinforma 2011, 12:202.
25. Storey JD, Tibshirani R: Statistical significance for genomewide studies. Proc Natl Acad
Sci U S A 2003, 100:9440–9445.
26. Ihaka R, Gentleman R: R: A language for data analysis and graphics. J Comput Graph
Stat 1996, 5:299–314.
27. Druet T, Georges M: A hidden Markov model combining linkage and linkage
disequilibrium information for haplotype reconstruction and quantitative trait locus
fine mapping. Genetics 2010, 184:789–798.

Genomic and functional genomic analysis of fatty acid composition in swine
86
28. Rozen S, Skaletsky H: Primer3 on the WWW for general users and for biologist
programmers. Methods Mol Biol 2000, 132:365–386.
29. Werle E, Schneider C, Renner M, Völker M, Fiehn W: Convenient single-step, one tube
purification of PCR products for direct sequencing. Nucleic Acids Res 1994, 22:4354–
4355.
30. Ballester M, Cordón R, Foch JM: DAG expression: high-throughput gene expression
analysis of real-time PCR data using standard curves for relative quantification. PLoS
ONE 2013, 8:e80385.
31. Vandesompele J, De Preter K, Pattyn F, Poppe B, Van Roy N, De Paepe A, Speleman F:
Accurate normalization of real-time quantitative RT-PCR data by geometric
averaging of multiple internal control genes. Genome Biol 2002, 3:RESEARCH0034.
32. Karim L, Takeda H, Lin L, Druet T, Arias JA, Baurain D, Cambisano N, Davis SR, Farnir F,
Grisart B, Harris BL, Keehan MD, Littlejohn MD, Spelman RJ, Georges M, Coppieters W:
Variants modulating the expression of a chromosome domain encompassing PLAG1
influence bovine stature. Nat Genet 2011, 43:405–413.
33. Oyama T, Harigaya K, Sasaki N, Okamura Y, Kokubo H, Saga Y, Hozumi K, Suganami A,
Tamura Y, Nagase T, Koga H, Nishimura M, Sakamoto R, Sato M, Yoshida N, Kitagawa M:
Mastermind-like 1 (MamL1) and mastermind-like 3 (MamL3) are essential for Notch
signaling in vivo. Development 2011, 138:5235–5246.
34. Pajvani UB, Qiang L, Kangsamaksin T, Kitajewski J, Ginsberg HN, Accili D: Inhibition of
Notch uncouples Akt activation from hepatic lipid accumulation by decreasing
mTorc1 stability. Nat Med 2013, 19:1054–1060.
35. Syreeni A, El-Osta A, Forsblom C, Sandholm N, Parkkonen M, Tarnow L, Parving HH,
McKnight AJ, Maxwell AP, Cooper ME, Groop PH, Finn Diane Study Group: Genetic
examination of SETD7 and SUV39H1/H2 methyltransferases and the risk of
diabetes complications in patients with Type 1 diabetes. Diabetes 2011, 60:3073–3080.
36. Chakrabarti SK, Francis J, Ziesmann SM, Garmey JC, Mirmira RG: Covalent histone
modifications underlie the developmental regulation of insulin gene transcription in
pancreatic beta cells. J Biol Chem 2003, 278:23617–23623.
37. Ramayo-Caldas Y, Mach N, Esteve-Codina A, Corominas J, Castello A, Ballester M, Estelle
J, Ibañez-Escriche N, Fernandez AI, Perez-Enciso M, Folch JM: Liver transcriptome
profile in pigs with extreme phenotypes of intramuscular fatty acid composition.
BMC Genomics 2012, 13:547.

Paper and Studies
87
38. Corominas J, Ramayo-Caldas Y, Puig-Oliveras A, Pérez-Montarelo D, Noguera JL, Folch
JM, Ballester M: Polymorphism in the ELOVL6 gene is associated with a major QTL
effect on fatty acid composition in pigs. PLoS ONE 2013, 8:e53687.
39. Serra X, Gil F, Pérez-Enciso M, Oliver MA, Vázquez J, Gispert M, Díaz I, Moreno F,
Latorre R, Noguera JL: A comparison of carcass, meat quality and histochemical
characteristics of Iberian (Guadyerbas line) and Landrace pigs. Livest Prod Sci 1998,
56:215–223.
Additional files
Additional file 1: Table S1. List of SNPs genotyped. List of 144 SNPs located on SSC8
genotyped and genotyping statistics.
Additional file 2: Table S2. Primers for SETD7 and MAML3 promoter sequencing (P),
promoter and exon 1 sequencing (PE), microsatellite genotyping (MS), and RT-qPCR (RT)
study. Table S3. Significant SNPs affecting BF FA composition (FDR = 0.05) in LDLA
analyses in the F2 generation. Table S4. Analysis of a two QTL model on SSC8 for the most
significant regions affecting BF FA composition. Table S5. Additive value affecting BF FA
composition in 168 F2 animals for the SETD7:c.700G > T and ELOVL6:c.533C > T SNPs.
Additional file 3: Figure S1. Association study and LDLA of the C16:1(n-7), ACL and
C18:1(n-7)/C16:1(n-7) elongation ratio in BF. Plot of association study (red points) and LDLA
patterns (blue line) for palmitoleic acid, ACL and vaccenic/palmitoleic ratio; the X-axis
represents positions in Mb on SSC8, and the Y-axis shows the –log10 (p-value); vertical, the pink
line represents the position of the MAML3 gene, the blue line represents the position of the
SETD7 gene and the green line represents the position of the ELOVL6 gene on SSC8;
horizontal, dashed lines mark the association study significance level (FDR-based q-value ≤
0.05); positions in Mb are relative to the Sscrofa10.2 assembly of the pig genome.

89
PAPER II
A global analysis of CNVs in swine using whole
genome sequence data and association analysis with
fatty acid composition and growth traits
Revilla M1,2*, Puig-Oliveras A1,2, Castelló A1,2, Crespo-Piazuelo D1,2, Paludo E3,
Fernández AI4, Ballester M5, Folch JM1,2
1 Departament de Ciència Animal i dels Aliments, Facultat de Veterinària, Universitat
Autònoma de Barcelona (UAB), Bellaterra, Spain
2 Plant and Animal Genomics, Centre de Recerca en Agrigenòmica (CRAG), Consorci
CSIC-IRTA-UAB-UB, Campus UAB, Bellaterra, Spain
3 Department of Animal Science, Santa Catarina State University, Lages, Santa Catarina,
Brazil
4 Departamento de Genética Animal, Instituto Nacional de Investigación y Tecnología
Agraria y Alimentaria (INIA), Madrid, Spain
5 Departament de Genètica i Millora Animal, Institut de Recerca i Tecnologia
Agroalimentàries (IRTA), Torre Marimon, Caldes de Montbui, Spain
* Corresponding author
PLoS ONE (2017). 12(5):e0177014.
http://doi.org/10.1371/journal.pone.0177014


Paper and Studies
91
Abstract
Copy number variations (CNVs) are important genetic variants complementary to SNPs,
and can be considered as biomarkers for some economically important traits in domestic
animals. In the present study, a genomic analysis of porcine CNVs based on next-
generation sequencing data was carried out to identify CNVs segregating in an Iberian x
Landrace backcross population and study their association with fatty acid composition and
growth-related traits. A total of 1,279 CNVs, including duplications and deletions, were
detected, ranging from 106 to 235 CNVs across samples, with an average of 183 CNVs per
sample. Moreover, we detected 540 CNV regions (CNVRs) containing 245 genes.
Functional annotation suggested that these genes possess a great variety of molecular
functions and may play a role in production traits in commercial breeds. Some of the
identified CNVRs contained relevant functional genes (e.g., CLCA4, CYP4X1, GPAT2,
MOGAT2, PLA2G2A and PRKG1, among others). The variation in copy number of four
of them (CLCA4, GPAT2, MOGAT2 and PRKG1) was validated in 150 BC1_LD (25%
Iberian and 75% Landrace) animals by qPCR. Additionally, their contribution regarding
backfat and intramuscular fatty acid composition and growth–related traits was analyzed.
Statistically significant associations were obtained for CNVR112 (GPAT2) for the C18:2(n-
6)/C18:3(n-3) ratio in backfat and carcass length, among others. Notably, GPATs are
enzymes that catalyze the first step in the biosynthesis of both triglycerides and
glycerophospholipids, suggesting that this CNVR may contribute to genetic variation in
fatty acid composition and growth traits. These findings provide useful genomic
information to facilitate the further identification of trait-related CNVRs affecting
economically important traits in pigs.

Genomic and functional genomic analysis of fatty acid composition in swine
92
Introduction
The pig (Sus scrofa) is one of the most economically important livestock animals worldwide,
and one of the main sources of animal meat for humans. The pig is also a valuable animal
model for human diseases and nutrition. In recent years, genomic structural variations have
received considerably more attention, as they represent the major source of genetic
variation in mammalian genomes in terms of number of nucleotides involved [1]. Copy
number variations (CNVs) are a type of genetic structural variation which corresponds to
relatively large regions of the genome (typically larger than 1 kb) that have been deleted or
duplicated, giving different numbers of copies of a DNA fragment [2]. CNVs can affect
both gene expression and regulation, with potentially large phenotypic effects [3]. In
humans, several studies on CNVs showed association with Mendelian diseases and
complex genetic disorders, such as schizophrenia [4], cancer [5,6], and various congenital
defects [7]. In pigs, CNVs have been associated with several phenotypes such as coat color
[8], backfat (BF) thickness [3] and meat quality [9], demonstrating that CNVs can be
considered as promising biomarkers for some economically important traits in domestic
animals. Fat content and fatty acid (FA) composition determine important sensory and
technological aspects of pork and meat products because of their influence on the melting
point and oxidative status of porcine tissues [10]. Artificial selection to increase meat
production in pigs has caused a reduction of intramuscular fat (IMF) and changes in meat
FA composition in some breeds. Pork quality is important to the meat-processing industry,
therefore a higher IMF content and a better FA profile, while maintaining a reduced
amount of BF, is a main selection objective [11,12].
In the past few years, different approaches have been used to detect CNVs in pig genomes:
array comparative genomic hybridization (aCGH) [13,14], high-density single nucleotide
polymorphisms genotyping [3, 15-19] and next-generation sequencing (NGS) of whole
genomes [20-23]. Ramayo-Caldas et al. [15] reported the first whole genome description of
CNVs in the pig genome using genotypes from the 60K SNP chip (Illumina). Fernández et
al. [24] also applied the SNP array method on 217 highly inbred Iberian pigs, and then used
high-throughput sequencing on four of those pigs for validation. Bickhart et al. [20]
demonstrated that the NGS has superiority over the SNP chip and aCGH in CNV
detection in livestock genomes. The aCGH and SNP arrays have been extensively used for
CNV screens, however, these techniques are often affected by low probe density and cross-
hybridization of repetitive sequences [20]. The influence and utilization of NGS and

Paper and Studies
93
complementary analysis programs have provided better approaches to detect CNVs at the
genome-wide level [25].
The goal of this study is to identify CNV regions (CNVRs) from whole genome sequence
(WGS) data on autosomal chromosomes, using an Iberian x Landrace (IBMAP) cross,
validate a selection of them in a larger number of animals and study their association with
growth and meat quality traits.
Materials and Methods
Ethics Statement
All animal procedures were performed according to the Spanish Policy for Animal
Protection RD1201/05, which meets the European Union Directive 86/609 concerning
the protection of animals used in experimentation. Animals were sacrificed in a commercial
slaughterhouse following national and institutional guidelines for the Good Experimental
Practices and approved by the Ethical Committee of the Institution (IRTA- Institut de
Recerca i Tecnologia Agroalimentàries).
Animal samples
Seven founders of the IBMAP experimental population [26], two Iberian boars
(Guadyerbas line) and five Landrace sows, were used to identify CNVs by NGS of whole
genomes. Furthermore, thirty-two individuals of different backcrosses: BC1_LD (25%
Iberian and 75% Landrace; n=10), BC1_PI (25% Iberian and 75% Pietrain; n=10), and
BC1_DU (25% Iberian and 75% Duroc; n=12) were used to test the variability of six
computationally-predicted CNVs. Finally, association analyses between CNVs and FA
composition and growth traits were performed in 150 BC1_LD individuals from the
IBMAP population. All animals were maintained under intensive conditions and feeding
was ad libitum with a cereal-based commercial diet. Backcross animals were slaughtered at
an average age of 179.8±2.6 days, and samples of diaphragm tissue were collected, snap-
frozen in liquid nitrogen and stored at -80°C until analysis. Genomic DNA was extracted
from diaphragm tissue samples of all animals by the phenol-chloroform method [27].
NGS Data
The whole genomes of seven founders of the IBMAP population (two Iberian boars and
five Landrace sows) were sequenced with the Illumina Hi-Seq 2000 platform (Illumina; San

Genomic and functional genomic analysis of fatty acid composition in swine
94
Diego, CA, USA) in the CNAG institution (Centro Nacional de Análisis Genómico;
Barcelona, Spain), obtaining 100 bp paired-end reads. The reads were mapped using
Burrows-Wheeler Aligner software [28] to the reference genome (Sscrofa10.2), having a
mean coverage of 13.1x. Sequencing information is provided in the Results section.
Detection of CNV
Control-FREEC software [29,30] was used to detect CNVs in the genomes of all
individuals. This software uses GC-content to normalize read counts, and lower
mappability regions can be excluded from the analysis using provided mappability tracks
[29,30]. The mapped paired-end reads files were used to calculate read count in non-
overlapping windows by a sliding-window approach. An optimal windows size was selected
by the program for each sample (Table 1). Then, normalization of read counts was
performed by GC content in the same set of windows. At the end, the software analyzed
the prediction regions for gains and losses in order to assign copy numbers to these
regions. The program was run using the default parameters without any control sample.
Following the recommendations of Derrien et al. [31] to limit the number of false positives,
we used a GEM mappability file created by the GEM (Genome Multi-tool) mappability
program. Then, p-values to the predicted CNVs were added by running the “rtrackplayer”
R package [32], which adds both Wilcoxon test and Kolmogorov-Smirnov test p-values to
each Control-FREEC prediction.
The CNVRs were determined by merging CNVs identified in two or more animals when
the overlap is of at least 1 bp, according to the criteria proposed by Redon et al. [1]. This
merging was performed by CNVRuler software [33]. Regions of very low density of
overlapping (recurrence parameter<0.1) were not used in the analyses for a more robust
definition of the beginning and end regions.
Gene content and functional annotation
Based on the Sscrofa10.2 sequence assembly, pig gene annotations within the identified
CNVRs were retrieved from the Ensembl Genes 84 Database using the BioMart tool of
Ensembl (http://ensembl.org/biomart). Pathway analysis of these genes was performed
with DAVID bioinformatics resources 6.7 (http://david.abcc.ncifcrf.gov/). Considering
the limited number of genes annotated in the pig genome, we first converted the pig
Ensembl gene IDs to homologous human Ensembl gene IDs by BioMart, and then carried

Paper and Studies
95
out the pathway analysis. The P value and Benjamini correction for multiple testing were
assessed for statistical significance.
Real-time quantitative PCR
Real-time quantitative PCR (qPCR) was used to analyze CNVRs. Thirty-two individuals of
different backcrosses: BC1_LD (n=10), BC1_PI (n=10) and BC1_DU (n=12) were used to
validate CNVRs. Furthermore, 150 individuals of the BC1_LD were used to perform the
association analysis between CNVRs and FA composition and growth traits. The 2-ΔΔCt
method [34] for relative quantification (RQ) of CNVRs was used as previously described in
Ramayo-Caldas et al. [15].
Primers (S1 Table) were designed using the Primer Express 2.0 software (Applied
Biosystems). qPCRs were carried out using SYBR® Select Master Mix in an ABI PRISM®
7900HT instrument for primer testing (Applied Biosystems, Inc.; Foster City, CA) and a
QuantStudio™ 12K Flex Real-Time PCR System (Applied Biosystems, Inc.; Foster City,
CA) for the CNV quantification, following the manufacturer’s guidelines. The reactions
were carried out in a 96-well plate for the ABI PRISM® 7900HT instrument in a 20μl
volume containing 10 ng of genomic DNA. For the QuantStudio™ 12K Flex Real-Time
PCR instrument, the reactions were carried out in a 384-well plate in 15μl volume
containing 7.5 ng of genomic DNA. All primers were used at 300 nM. The thermal cycle
was: 10 min at 95°C, 40 cycles of 15 sec at 95°C and 1 min at 60°C. Each sample was
analyzed in triplicate. One sample without CNV for each of the genomic regions analyzed
was used as reference. The control region was determined within the region of the
glucagon gene [EMBL:GCG]. Results for the standard curve were analyzed by DAG
Expression software [35] and all samples were analyzed with Thermo Fisher Cloud
software 1.0 (Applied Biosystems). For each CNVR to be validated, a value from the 2x2-
ΔΔCt formula was calculated for each individual.
Traits analyzed
For this study, phenotypic records were used from 150 animals belonging to the IBMAP
BC1_LD backcross. The composition of 15 FA of both Longissimus dorsi muscle and BF
(taken between the third and the fourth ribs) tissues was determined by gas
chromatography as described in Pérez-Enciso et al. [26]. Subsequently, the percentage of
each FA relative to the total FA was calculated as well as the global percentages of

Genomic and functional genomic analysis of fatty acid composition in swine
96
saturated fatty acids (SFA), monounsaturated fatty acids (MUFA), polyunsaturated fatty
acids (PUFA) and related indices, including desaturation and elongation indices.
In addition, 16 phenotypic growth and carcass traits were used in the analysis,
corresponding to body weight measured at 125, 155 and 180 days (BW125, BW155, and
BW180, respectively), backfat thickness (BFT) at the level of the fourth rib at 4 cm of the
midline measured by ultrasounds at 125, 155 and 180 days (BFT125, BFT155 and BFT180,
respectively) and measured with a ruler at slaughter (BFT), carcass length (CRCL) and
carcass weight (CW), ham weight (HW), shoulder weight (SW), belly weight (BLW) and the
IMF percentage, which was measured in the Longissimus dorsi muscle by Near Infrared
Transmittance (NIT; Infratec 1625, Tecator Hoganas). Additionally pH was measured at 45
min in semimembranosus muscle (pH45SM) and at 24 h (pH24LD) and 45 min in the
Longissimus dorsi muscle (pH45LD).
Statistical analysis
Associations of RQ values of the CNVRs with phenotypic records were analyzed with a
multiplicative effect model in the CNVassoc R package [36]. The CNVassoc function
incorporates calls by using a latent class model as described in González et al. [37].
Association analyses were performed with the copy number status inferred with the CNV
function of the CNVassoc R package. The qPCR data and the composition of FA in IMF
and BF were normalized and corrected both by gender and batch (five levels) effects, and
the composition of FA also for CW, using glm R package [38]. Different corrections were
used for the analysis of phenotypic growth records. Carcass weight was corrected by
gender, batch and slaughter age. Also, gender, batch and CW were used to correct
pH45SM, pH45LD, pH24LD, CRCL, BLW, BFT, HW, SW and IMF. For BFT125,
BFT155 and BFT180, the corrections used were gender, batch and the body weight at their
respective days. Meanwhile, for the body weight, the corrections used were gender, batch
and the animal age. The R package q-value [39] was used to calculate the false-discovery
rate (FDR), and the cut-off of the significant association was set at the q-value ≤ 0.05.
Results and Discussion
Genome-wide detection of CNVs
Based on the Illumina platform (Hi-Seq 2000, Illumina; San Diego, CA, USA), WGS data of
seven founders of the IBMAP population (two Iberian boars and five Landrace sows) were
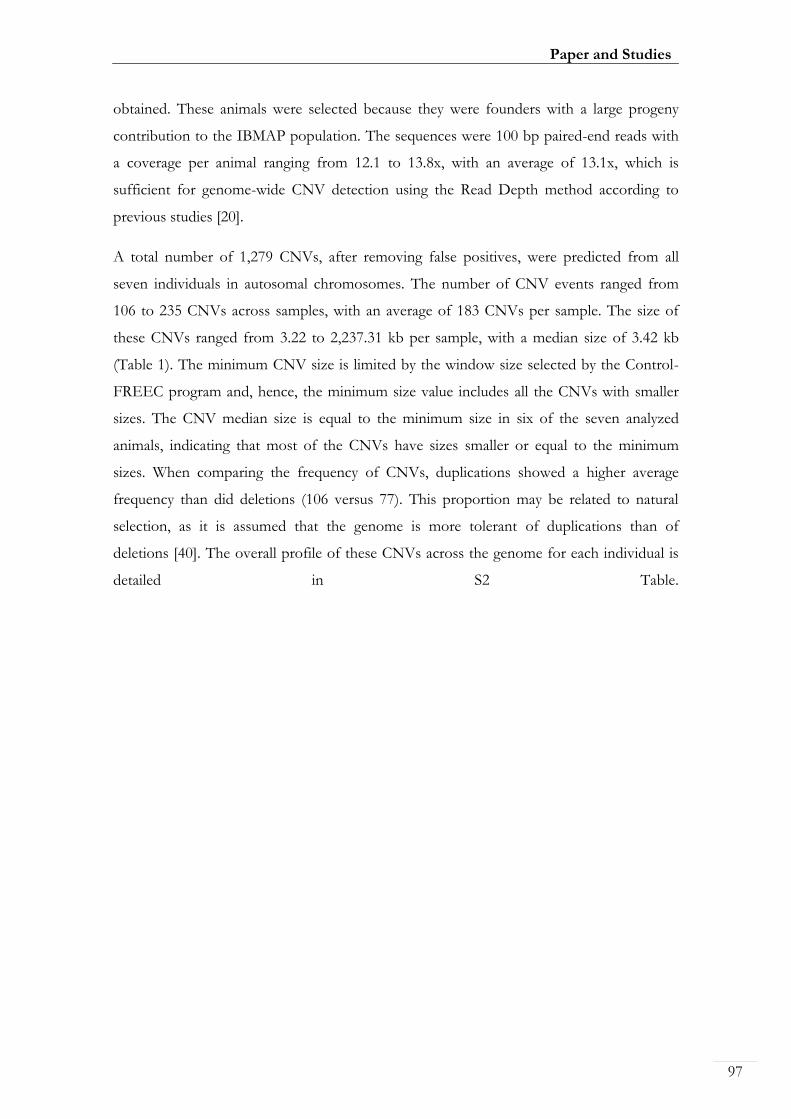
Paper and Studies
97
obtained. These animals were selected because they were founders with a large progeny
contribution to the IBMAP population. The sequences were 100 bp paired-end reads with
a coverage per animal ranging from 12.1 to 13.8x, with an average of 13.1x, which is
sufficient for genome-wide CNV detection using the Read Depth method according to
previous studies [20].
A total number of 1,279 CNVs, after removing false positives, were predicted from all
seven individuals in autosomal chromosomes. The number of CNV events ranged from
106 to 235 CNVs across samples, with an average of 183 CNVs per sample. The size of
these CNVs ranged from 3.22 to 2,237.31 kb per sample, with a median size of 3.42 kb
(Table 1). The minimum CNV size is limited by the window size selected by the Control-
FREEC program and, hence, the minimum size value includes all the CNVs with smaller
sizes. The CNV median size is equal to the minimum size in six of the seven analyzed
animals, indicating that most of the CNVs have sizes smaller or equal to the minimum
sizes. When comparing the frequency of CNVs, duplications showed a higher average
frequency than did deletions (106 versus 77). This proportion may be related to natural
selection, as it is assumed that the genome is more tolerant of duplications than of
deletions [40]. The overall profile of these CNVs across the genome for each individual is
detailed in S2 Table.

Tab
le 1. S
um
mary
of C
NV
s of th
e se
ven
an
aly
zed
pig
s
Sam
ple
B
reed
N
o. o
f to
tal c
alls
No
. of
du
plic
atio
ns
No
. of
dele
tion
s W
ind
ow
size fo
r CN
V
dete
ctio
n (k
b)
Med
ian
size a
nd
(ran
ge),
in k
b
Ib1
Iberian
235
117
118
3.3
9
3.3
9 (3
.39-1
,008.0
2)
Ib2
Iberian
189
101
88
3.3
4
3.3
4 (3
.34-2
,237.3
1)
Ld1
Lan
drace
106
76
30
3.3
9
6.7
8 (3
.39-4
16.8
5)
Ld2
Lan
drace
203
117
86
3.4
2
3.4
2 (3
.42-8
55.7
5)
Ld3
Lan
drace
172
104
68
3.2
2
3.2
2 (3
.22-3
66.6
2)
Ld4
Lan
drace
208
122
86
3.6
4
3.6
4 (3
.64-5
63.5
8)
Ld5
Lan
drace
166
101
65
3.2
4
3.2
4 (3
.24-4
47.6
7)
On
avera
ge
183
106
77
3.3
8
3.4
2 (3
.22-2
,237.3
1)
98
Genomic and functional genomic analysis of fatty acid composition in swine

Paper and Studies
99
All detected CNV segments were further merged into 540 unique CNVRs (S3 Table)
across all experimental animal genomes following the criteria that the union of overlapping
CNVs across individuals is considered as a CNVR [1].
Although CNVRs were found on all chromosomes, the number and the total size of
CNVRs per chromosome were not correlated with chromosome length. The majority (428
out of 540; 79.26%) of the CNVRs identified were smaller than 10 kb (Fig 1).
Fig 1. Distribution of CNVRs on the different chromosomes of the porcine genome. Each CNVR is represented by a circle and colors correspond to the different sizes explained in the legend.
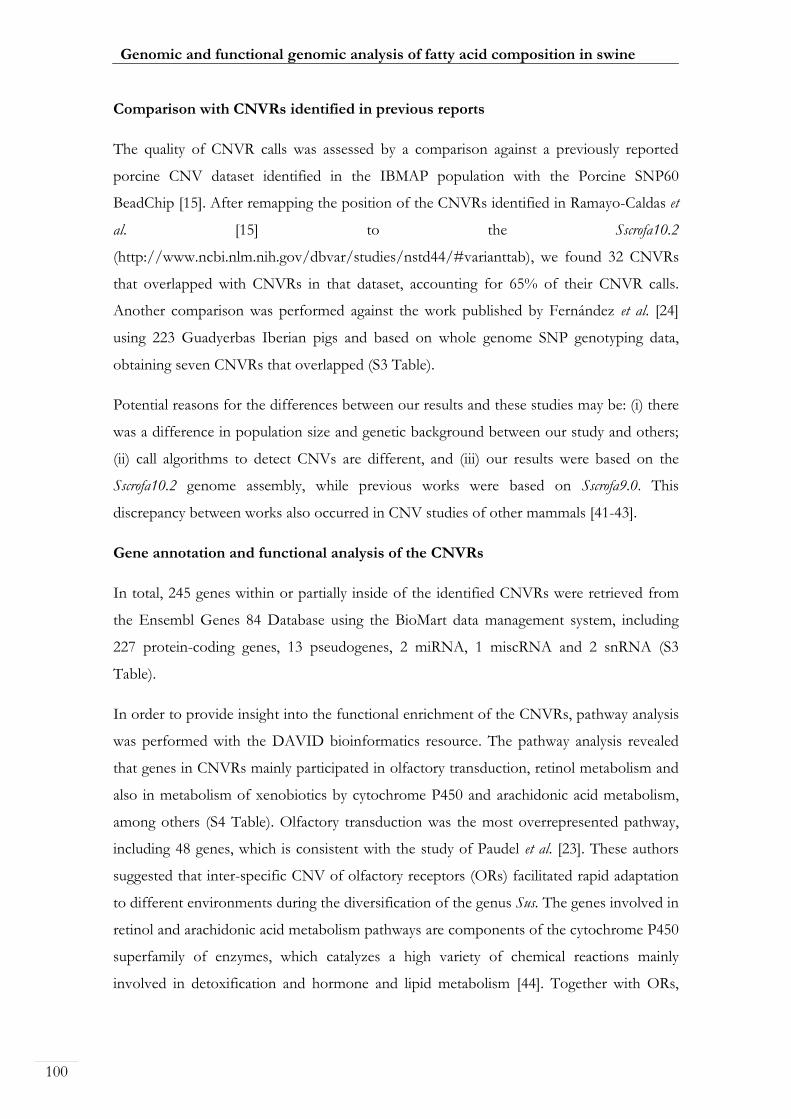
Genomic and functional genomic analysis of fatty acid composition in swine
100
Comparison with CNVRs identified in previous reports
The quality of CNVR calls was assessed by a comparison against a previously reported
porcine CNV dataset identified in the IBMAP population with the Porcine SNP60
BeadChip [15]. After remapping the position of the CNVRs identified in Ramayo-Caldas et
al. [15] to the Sscrofa10.2
(http://www.ncbi.nlm.nih.gov/dbvar/studies/nstd44/#varianttab), we found 32 CNVRs
that overlapped with CNVRs in that dataset, accounting for 65% of their CNVR calls.
Another comparison was performed against the work published by Fernández et al. [24]
using 223 Guadyerbas Iberian pigs and based on whole genome SNP genotyping data,
obtaining seven CNVRs that overlapped (S3 Table).
Potential reasons for the differences between our results and these studies may be: (i) there
was a difference in population size and genetic background between our study and others;
(ii) call algorithms to detect CNVs are different, and (iii) our results were based on the
Sscrofa10.2 genome assembly, while previous works were based on Sscrofa9.0. This
discrepancy between works also occurred in CNV studies of other mammals [41-43].
Gene annotation and functional analysis of the CNVRs
In total, 245 genes within or partially inside of the identified CNVRs were retrieved from
the Ensembl Genes 84 Database using the BioMart data management system, including
227 protein-coding genes, 13 pseudogenes, 2 miRNA, 1 miscRNA and 2 snRNA (S3
Table).
In order to provide insight into the functional enrichment of the CNVRs, pathway analysis
was performed with the DAVID bioinformatics resource. The pathway analysis revealed
that genes in CNVRs mainly participated in olfactory transduction, retinol metabolism and
also in metabolism of xenobiotics by cytochrome P450 and arachidonic acid metabolism,
among others (S4 Table). Olfactory transduction was the most overrepresented pathway,
including 48 genes, which is consistent with the study of Paudel et al. [23]. These authors
suggested that inter-specific CNV of olfactory receptors (ORs) facilitated rapid adaptation
to different environments during the diversification of the genus Sus. The genes involved in
retinol and arachidonic acid metabolism pathways are components of the cytochrome P450
superfamily of enzymes, which catalyzes a high variety of chemical reactions mainly
involved in detoxification and hormone and lipid metabolism [44]. Together with ORs,

Paper and Studies
101
CNV in cytochrome P450 (CYP450) genes suggests a relevant role of these genes in the
organism’s adaptation to rapid changes in the environment [23].
Interestingly, one gene of this family: Cytochrome P4502 C32 Fragment gene (CYP2C32;
ENSSSCG00000010488), was identified in a previous study using BC1_LD animals of the
IBMAP population [15], suggesting a possible role of this structural variation in
determining androsterone levels. Differential expression of genes of the CYP450 family has
been correlated with androsterone levels in pigs from Duroc and Landrace breeds [45].
In addition, other genes related to this family were identified: CYP1A1
(ENSSSCG00000001906), CYP19A1 (ENSSSCG00000030168), CYP2B6
(ENSSSCG00000003006), CYP4A24 (ENSSSCG00000024778), and CYP4X1
(ENSSSCG00000024129), which could affect arachidonic acid metabolism. In this sense,
Ramayo-Caldas et al. [46] demonstrated some members of this family differentially-
expressed in the liver transcriptome of pigs with extreme phenotypes for intramuscular FA
composition.
Also, the excess of CNVRs in intergenic regions implies that a major part of these
variations are likely to be neutral [47].
Identification of candidate genes for growth and FA composition traits in CNVRs
The overlapping was analyzed between the CNVRs identified in this study and the
Genome-Wide Association Study (GWAS) regions described in Ramayo-Caldas et al. [48]
using BC1_LD animals of the IBMAP population. After remapping these regions using the
Assembly Converter tool of Ensembl, 19 regions co-localized among these works (S3
Table). The overlapping between the CNVRs and QTLs for growth and body composition
traits described in Fernández et al. [49], which use a genome QTL scan based on linkage-
mapping analyses with three generations of the IBMAP population, was also analyzed,
identifying five co-localized regions (S3 Table). Finally, Muñoz et al. [50] also performed an
analysis of the genetic basis of the FA composition of BF and IMF in the IBMAP
population to identify significant QTLs for these traits using linkage-mapping and GWAS
methods. A total of 24 overlapping regions were identified between both studies (S3
Table). In addition, we found 10 genes located in CNVRs that have been reported as
differentially-expressed in the liver [46], muscle [51] or adipose tissue [52] of BC1_LD
animals phenotypically extreme for intramuscular FA composition (S3 Table).

Genomic and functional genomic analysis of fatty acid composition in swine
102
After compiling this information and taking into consideration the functional analysis of
the genes within or partially inside of these CNVRs, six genes were selected as potential
candidate genes related to growth and FA composition traits (Table 2).
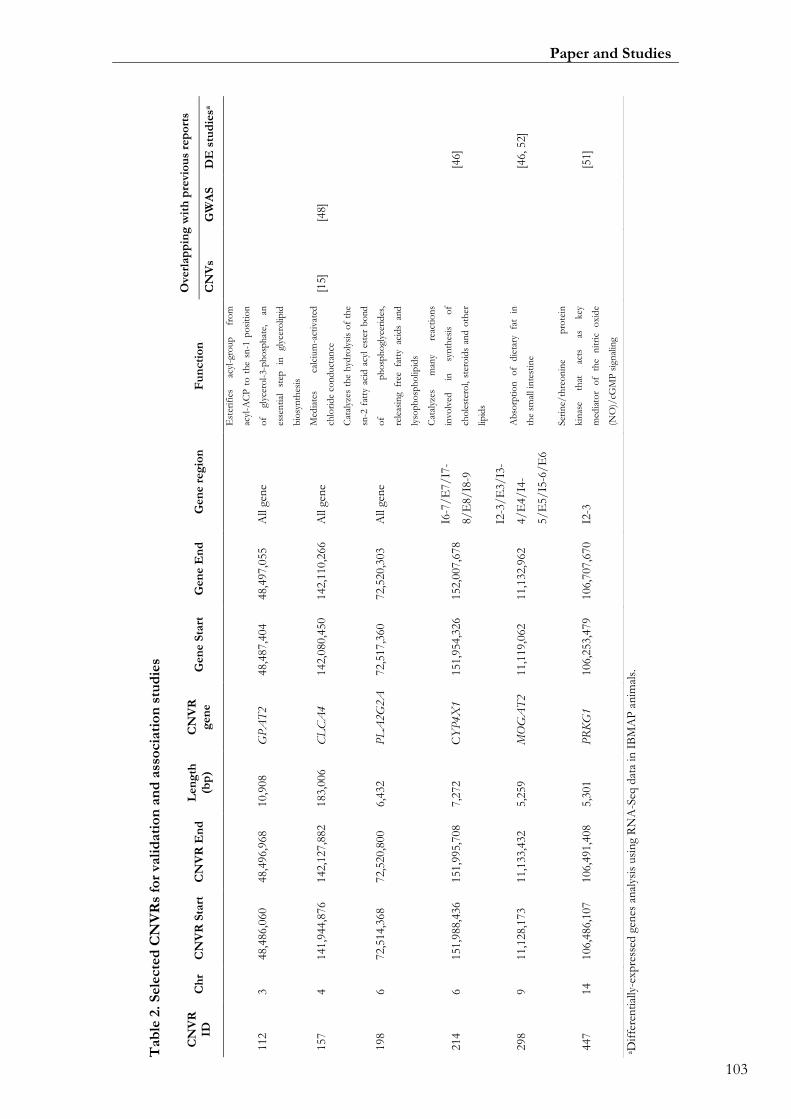
Tab
le 2
. S
ele
cte
d C
NV
Rs
for
vali
dati
on
an
d a
sso
cia
tio
n s
tud
ies
a Dif
fere
nti
ally
-exp
ress
ed g
enes
an
alys
is u
sin
g R
NA
-Seq
dat
a in
IB
MA
P a
nim
als.
CN
VR
ID
C
hr
CN
VR
Sta
rt
CN
VR
En
d
Len
gth
(b
p)
CN
VR
g
en
e
Gen
e S
tart
G
en
e E
nd
G
en
e r
eg
ion
F
un
cti
on
Ove
rlap
pin
g w
ith
pre
vio
us
rep
ort
s
CN
Vs
GW
AS
D
E s
tud
iesa
112
3
48,4
86,0
60
48,4
96,9
68
10,9
08
GP
AT
2
48,4
87,4
04
48,4
97,0
55
All
gen
e
Est
erif
ies
acyl
-gro
up
fr
om
acyl
-AC
P t
o t
he
sn-1
po
siti
on
of
glyc
ero
l-3-p
ho
sph
ate,
an
esse
nti
al
step
in
gl
ycer
olip
id
bio
syn
thes
is
157
4
141,9
44,8
76
142,1
27,8
82
183,0
06
CL
CA
4
142,0
80,4
50
142,1
10,2
66
All
gen
e M
edia
tes
calc
ium
-act
ivat
ed
chlo
rid
e co
nd
uct
ance
[1
5]
[48]
198
6
72,5
14,3
68
72,5
20,8
00
6,4
32
PL
A2G
2A
72,5
17,3
60
72,5
20,3
03
All
gen
e
Cat
alyz
es t
he
hyd
roly
sis
of
the
sn-2
fat
ty a
cid
acy
l es
ter
bo
nd
of
ph
osp
ho
glyc
erid
es,
rele
asin
g fr
ee
fatt
y ac
ids
and
lyso
ph
osp
ho
lipid
s
214
6
151,9
88,4
36
151,9
95,7
08
7,2
72
CY
P4X
1
151,9
54,3
26
152,0
07,6
78
I6-7
/E
7/
I7-
8/
E8/
I8-9
Cat
alyz
es
man
y re
acti
on
s
invo
lved
in
sy
nth
esis
o
f
cho
lest
ero
l, st
ero
ids
and
oth
er
lipid
s
[46]
298
9
11,1
28,1
73
11,1
33,4
32
5,2
59
MO
GA
T2
11,1
19,0
62
11,1
32,9
62
I2-3
/E
3/
I3-
4/
E4/
I4-
5/
E5/
I5-6
/E
6
Ab
sorp
tio
n
of
die
tary
fa
t in
the
smal
l in
test
ine
[46, 52]
447
14
106,4
86,1
07
106,4
91,4
08
5,3
01
PR
KG
1
106,2
53,4
79
106,7
07,6
70
I2-3
Ser
ine/
thre
on
ine
pro
tein
kin
ase
that
ac
ts
as
key
med
iato
r o
f th
e n
itri
c o
xid
e
(NO
)/cG
MP
sig
nal
ing
[51]
103
Paper and Studies
Genomic and functional genomic analysis of fatty acid composition in swine
104
These six CNVRs represent different predicted statues of copy numbers
(duplication/deletion) and are located on different chromosomes (SSC3, SSC4, SSC6, SSC9
and SSC14):
1. CNVR112 contains the GPAT2 gene (ENSSSCG00000008121), encoding the
mitochondrial glycerol-3-phosphate acyl-transferase 2, which plays a key role in
phospholipid and triacylglycerol biosynthesis by catalyzing the addition of fatty
acylCoA at the sn1 position of glycerol-3-phosphate to form lyso-phosphatidic acid
[53]. Among its related pathways are metabolism and regulation of lipid metabolism
by Peroxisome proliferator-activated receptor alpha (PPARA).
2. The CLCA4 gene (ENSSSCG00000006932), located in CNVR157, may be
involved in mediating calcium-activated chloride conductance [54]. The porcine
CLCA4 gene has recently been shown to be duplicated into two separated genes,
CLCA4a and CLCA4b [55].
3. CNVR198 contains the PLA2G2A gene (ENSSSCG00000003494), which encodes
an enzyme that catalyzes the hydrolysis of the sn-2 FA acyl-ester bond of
phosphoglycerides, releasing FAs and lysophospholipids, and could participate in
the regulation of the phospholipid metabolism in biomembranes [56].
4. The CYP4X1 gene (ENSSSCG00000024129), identified inside CNVR214, encodes
a member belonging to the cytochrome P450 superfamily of enzymes. As stated
before, the cytochrome P450 proteins are monooxygenases which catalyze many
reactions involved in drug metabolism and synthesis of cholesterol, steroids and
other lipids [44].
5. The MOGAT2 gene (ENSSSCG00000014861), found in CNVR298, encodes a
monoacylglycerol O-acyltransferase 2 enzyme. It plays a central role in absorption
of dietary fat in the small intestine by catalyzing the re-synthesis of digested
triacylglycerol in enterocytes. This gene may contribute to the development of the
fatty-pig phenotype [57].
6. The PRKG1 gene (ENSSSCG00000010429), located in CNVR447, has been
implicated in the nitric oxide signaling pathway [58], one of the most significantly
over-represented pathways found in the muscle RNA-Seq analysis of differentially-
expressed genes for FA composition traits [51].
Paper and Studies
105
Validation of CNVRs
In order to validate the six selected CNVRs (CNVRs 112, 157, 198, 214, 298, and 447;
Table 2), qPCR assays were designed. We analyzed the variation of these CNVRs in 12, 10
and 10 animals belonging to BC1_DU, BC1_LD and BC1_PI backcrosses, respectively.
CNV was observed among these animals for five of the six analyzed CNVRs (112, 157,
214, 298, and 447), showing different patterns of CNV among the backcrosses (Fig 2). For
CNVR112 (GPAT2), animals with two and three copies were observed in the three
backcrosses. CNVR157 (CLCA4) showed the highest variability in the three backcrosses,
with a CNV ranging from 0 to 6 copies among individuals from the different backcrosses.
Conversely, for CNVR214 (CYP4X1), no variation in copy number was observed in
BC1_LD animals, and it was discarded for further analyses. CNVR298 (MOGAT2) and
CNVR447 (PRKG1) also showed variation in the number of copies among animals of the
three backcrosses, in both cases being the individuals of the BC1_PI which presented more
variation, as compared with the other two backcrosses.

Genomic and functional genomic analysis of fatty acid composition in swine
106
Fig 2. Validation of CNVRs detected from the WGS data using qPCR analysis. The y-axis represents the animals and the x-axis shows the relative quantification value (2-ΔΔCt values for qPCR; 2*(2^Sample signal) values for qPCR).
Association analysis with growth, carcass and fatty acid composition traits
With the objective to carry out association analysis between the CNVRs and growth-related
and meat quality traits, 150 animals of BC1_LD were tested for CNVRs 112, 157, 298, and
447 (S1-S4 Figs). The repeatability of qPCR triplicates was highly accurate, showing a
maximum standard error of 0.03. Results for CNVR157 (CLCA4) revealed that copy
number varied greatly among the BC1_LD population (S2 Fig). The distribution of RQ
values for CNVR112 (GPAT2) and CNVR298 (MOGAT2) also revealed variability and the
differences between the calibrator and the sample that presented the highest value of RQ
was 0.78 for CNVR112 and 0.77 for CNVR298 (S1 and S3 Figs). CNVR447 (PRKG1)

Paper and Studies
107
variation was more homogeneous, and the differences between the calibrator, and the
sample that presented the highest value of RQ was 0.46 (S4 Fig).
An association analysis between the CNV estimates of CNVR112, CNVR157, CNVR298,
and CNVR447 and growth-related traits and FA composition in IMF and BF of BC1_LD
animals was performed using CNVassoc R package [36]. The peak intensities (CNV
quantitative measurement) and densities of the four analyzed CNVRs (CNVR112,
CNVR157, CNVR298 and CNVR447) are shown in Fig 3. Four latent classes,
corresponding to 2, 3, 4, and 5 copies for the CNVR157, were observed. For CNVR112,
CNVR298 and CNVR447, three latent classes were observed corresponding to 2, 3 and 4
copies.
Fig 3. Plots of analyzed CNVRs generated from CNV signal-intensity data. The y-axis represents the CNV quantitative measurement (Peak Intensities) and the x-axis shows the different individuals. Each copy number estimation is shown in different colors. The density plot shows the distribution of these CNVs.
Genomic and functional genomic analysis of fatty acid composition in swine
108
While for CNVR157, CNVR298 and CNVR447 only suggestive associations were found
(S5 Table), CNVR112 (GPAT2) presented statistically significant associations (cut-off of q-
value ≤ 0.05) for several traits. The strongest signal was observed for the C18:2(n-
6)/C18:3(n-3) (p-value=9.34E-05) ratio, and cis-vaccenic acid ((C18:1(n-7)) (p-
value=1.75E-03)) for the FA composition in BF. For FA percentages in IMF, the strongest
signal was detected for oleic acid (C18:1(n-9) (p-value=9.16E-04)), the global percentage of
MUFA (p-value=9.61E-04), peroxidability index (PI) (p-value=3.70E-03), dihomo gamma
linolenic acid (C20:3(n-6) (p-value=5.51E-03)), the global percentage of PUFA (p-
value=6.21E-03), eicosatrienoic acid (C20:3(n-3) (p-value=6.44E-03)) and the ratio of
MUFA/PUFA (p-value=9.18E-03). For growth traits, CRCL showed statistically significant
association (p-value=8.97E-05). These statistically significant associations and the
descriptive statistics of significant phenotypic traits for CNVR112 are summarized in Table
3. A complete list of the association analyses results is shown in S5 Table, including the no
significant associations observed in most of the FA composition traits measured in BF and
IMF and for all the growth traits with the exception or CRCL.
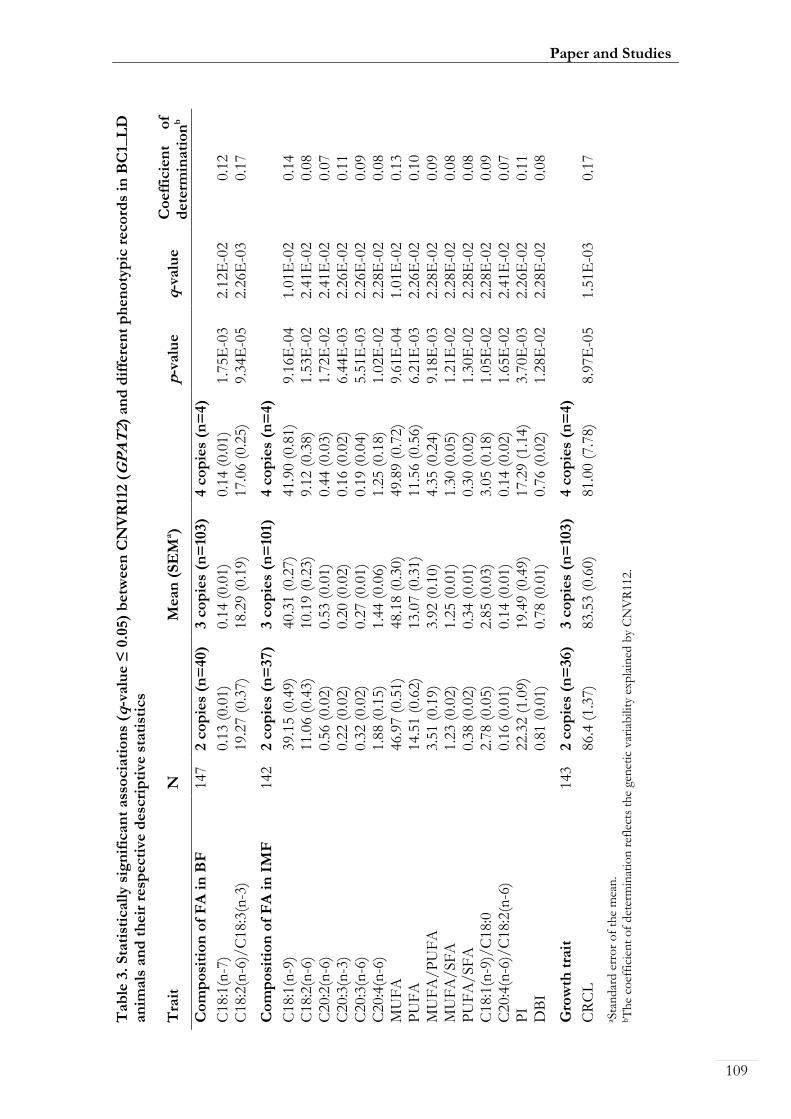
Tab
le 3
. S
tati
stic
all
y s
ign
ific
an
t ass
ocia
tio
ns
(q-v
alu
e ≤
0.0
5)
betw
een
CN
VR
112 (
GP
AT
2) a
nd
dif
fere
nt
ph
en
oty
pic
reco
rds
in B
C1_
LD
an
imals
an
d t
heir
resp
ecti
ve d
esc
rip
tive
sta
tist
ics
a Sta
nd
ard
err
or
of
the
mea
n.
bT
he
coef
fici
ent
of
det
erm
inat
ion
ref
lect
s th
e ge
net
ic v
aria
bili
ty e
xpla
ined
by
CN
VR
112.
Tra
it
N
Mean
(S
EM
a)
p-v
alu
eq
-valu
eC
oeff
icie
nt
of
dete
rmin
ati
on
b
Co
mp
osi
tio
n o
f F
A i
n B
F
147
2 c
op
ies
(n=
40)
3 c
op
ies
(n=
103)
4 c
op
ies
(n=
4)
C18:1
(n-7
) 0.1
3 (
0.0
1)
0.1
4 (
0.0
1)
0.1
4 (
0.0
1)
1.7
5E
-03
2.1
2E
-02
0.1
2
C18:2
(n-6
)/C
18:3
(n-3
) 19.2
7 (
0.3
7)
18.2
9 (
0.1
9)
17.0
6 (
0.2
5)
9.3
4E
-05
2.2
6E
-03
0.1
7
Co
mp
osi
tio
n o
f F
A i
n I
MF
142
2 c
op
ies
(n=
37)
3 c
op
ies
(n=
101)
4 c
op
ies
(n=
4)
C18:1
(n-9
) 39.1
5 (
0.4
9)
40.3
1 (
0.2
7)
41.9
0 (
0.8
1)
9.1
6E
-04
1.0
1E
-02
0.1
4
C18:2
(n-6
) 11.0
6 (
0.4
3)
10.1
9 (
0.2
3)
9.1
2 (
0.3
8)
1.5
3E
-02
2.4
1E
-02
0.0
8
C20:2
(n-6
) 0.5
6 (
0.0
2)
0.5
3 (
0.0
1)
0.4
4 (
0.0
3)
1.7
2E
-02
2.4
1E
-02
0.0
7
C20:3
(n-3
) 0.2
2 (
0.0
2)
0.2
0 (
0.0
2)
0.1
6 (
0.0
2)
6.4
4E
-03
2.2
6E
-02
0.1
1
C20:3
(n-6
) 0.3
2 (
0.0
2)
0.2
7 (
0.0
1)
0.1
9 (
0.0
4)
5.5
1E
-03
2.2
6E
-02
0.0
9
C20:4
(n-6
) 1.8
8 (
0.1
5)
1.4
4 (
0.0
6)
1.2
5 (
0.1
8)
1.0
2E
-02
2.2
8E
-02
0.0
8
MU
FA
46.9
7 (
0.5
1)
48.1
8 (
0.3
0)
49.8
9 (
0.7
2)
9.6
1E
-04
1.0
1E
-02
0.1
3
PU
FA
14.5
1 (
0.6
2)
13.0
7 (
0.3
1)
11.5
6 (
0.5
6)
6.2
1E
-03
2.2
6E
-02
0.1
0
MU
FA
/P
UF
A
3.5
1 (
0.1
9)
3.9
2 (
0.1
0)
4.3
5 (
0.2
4)
9.1
8E
-03
2.2
8E
-02
0.0
9
MU
FA
/SF
A
1.2
3 (
0.0
2)
1.2
5 (
0.0
1)
1.3
0 (
0.0
5)
1.2
1E
-02
2.2
8E
-02
0.0
8
PU
FA
/SF
A
0.3
8 (
0.0
2)
0.3
4 (
0.0
1)
0.3
0 (
0.0
2)
1.3
0E
-02
2.2
8E
-02
0.0
8
C18:1
(n-9
)/C
18:0
2.7
8 (
0.0
5)
2.8
5 (
0.0
3)
3.0
5 (
0.1
8)
1.0
5E
-02
2.2
8E
-02
0.0
9
C20:4
(n-6
)/C
18:2
(n-6
) 0.1
6 (
0.0
1)
0.1
4 (
0.0
1)
0.1
4 (
0.0
2)
1.6
5E
-02
2.4
1E
-02
0.0
7
PI
22.3
2 (
1.0
9)
19.4
9 (
0.4
9)
17.2
9 (
1.1
4)
3.7
0E
-03
2.2
6E
-02
0.1
1
DB
I 0.8
1 (
0.0
1)
0.7
8 (
0.0
1)
0.7
6 (
0.0
2)
1.2
8E
-02
2.2
8E
-02
0.0
8
Gro
wth
tra
it
143
2 c
op
ies
(n=
36)
3 c
op
ies
(n=
103)
4 c
op
ies
(n=
4)
CR
CL
86.4
(1.3
7)
83.5
3 (
0.6
0)
81.0
0 (
7.7
8)
8.9
7E
-05
1.5
1E
-03
0.1
7
109
Paper and Studies

Genomic and functional genomic analysis of fatty acid composition in swine
110
Interestingly, as stated before, CNVR112 contains the GPAT2 gene, which plays a key role
in phospholipid and triacylglycerol biosynthesis [53]. Triglycerides (TG) are the main
constituents of body fat in higher eukaryotes, serving as the major energy storage [59]. Very
low-density lipoproteins and chylomicrons derived from the liver and diet, respectively, are
important sources of FA supply to several tissues such as the BF and muscle, determining
their FA composition. Essential FAs provided by the diet may be directly stored or used to
synthesize highly unsaturated FAs [60]. On the other hand, FA synthase releases palmitic
acid (C16:0) from acetyl-CoA and malonyl-Coa which can be, in turn, the precursor of the
long-chain saturated and unsaturated FAs of n-9 family (and minor FAs of the n-7 and n-
10 families) [57]. Thus, CNVR112 may play a role in the genetic determination of IMF and
BF FA composition traits through the synthesis of TG in BF and muscle, using FAs
provided by diet or synthesized de novo in the liver or adipose tissue.
Conclusions
This study is one of the first studies to investigate the association between CNVRs and
economic traits in swine. We have described a map of swine CNVRs based on WGS data.
A total of 540 CNVRs were identified across the autosomal chromosomes. Six selected
CNVRs were validated by qPCR in three different backcrosses, and four of them were
selected to study the association with FA composition in BF and IMF, and growth traits in
150 BC1_LD animals. CNVR112, which contains the GPAT2 gene, showed associations
with several of the analyzed growth-related traits and FA composition in IMF and BF.
These results indicate that CNVRs may explain a fraction of the genetic variability of FA
composition, and also growth traits. These findings give novel insight into swine CNVRs
and provide useful genomic information to facilitate the further identification of trait-
related CNVRs.
Competing interests
The authors have declared that no competing interests exist.
Author contributions
Conceptualization: JMF MB. Methodology: JMF MB. Formal analysis: MR MB APO.
JMF. Investigation: MR EP AC DCP. Resources: JMF AIF. Writing - original draft:

Paper and Studies
111
MR MB JMF. Writing - review & editing: MB JMF. Visualization: MR. Supervision:
JMF. Funding acquisition: JMF AIF
Funding
This work has been funded by the MICINN AGL2014-56369-C2 and MINECO
AGL2011-29821-C02. MR was funded by a Formació i Contractació de Personal
Investigador Novell (FI-DGR) PhD grant from Generalitat de Catalunya
(ECO/1639/2013). APO was funded by a Personal Investigador en Formación (PIF) PhD
grant from the Universitat Autònoma de Barcelona (458-01-1/2011), DCP by a Formació i
Contractació de Personal Investigador Novell (FI-DGR) PhD grant from Generalitat de
Catalunya (ECO/1788/2014) and EP was funded by National Council of Scientific and
Technological Development of Brazil (CNPq 202243/2014-1). MB was financially
supported by a Ramon y Cajal contract (RYC-2013-12573) from the Spanish Ministry of
Economy and Competitiveness.
Acknowledgments
We would like to thank all of the members of the INIA, IRTA, and UAB institutions who
contributed to the generation of the animal material used in this work.
References
1. Redon R, Ishikawa S, Fitch KR, Feuk L, Perry GH, Andrews TD, et al. Global
variation in copy number in the human genome. Nature. 2006; 44(7118): 444.
2. Freeman JL, Perry GH, Feuk L, Redon R, McCarroll SA, Altshuler DM, et al. Copy
number variation: new insights in genome diversity. Genome Res. 2006; 16(8): 949-61.
3. Schiavo G, Dolezal MA, Scotti E, Bertolini F, Calò DG, Galimberti G, et al. Copy
number variants in Italian Large White pigs detected using high-density single
nucleotide polymorphisms and their association with back fat thickness. Anim Genet.
2014; 45(5): 745-9.
4. Vacic V, McCarthy S, Malhotra D, Murray F, Chou HH, Peoples A, et al. Duplications
of the neuropeptide receptor gene VIPR2 confer significant risk for schizophrenia.
Nature. 2011; 471(7339): 499-503.
5. Liu W, Sun J, Li G, Zhu Y, Zhang S, Kim ST, et al. Association of a germ-line copy
number variation at 2p24.3 and risk for aggressive prostate cancer. Cancer Res. 2009;
69(6): 2176-9.

Genomic and functional genomic analysis of fatty acid composition in swine
112
6. Jin G, Sun J, Liu W, Zhang Z, Chu LW, Kim ST, et al. Genome-wide copy-number
variation analysis identifies common genetic variants at 20p13 associated with
aggressiveness of prostate cancer. Carcinogenesis. 2011; 32(7): 1057-62.
7. Sailani MR, Makrythanasis P, Valsesia A, Santoni FA, Deutsch S, Popadin K, et al. The
complex SNP and CNV genetic architecture of the increased risk of congenital heart
defects in Down syndrome. Genome Res. 2013; 23(9): 1410-21.
8. Rubin CJ, Megens HJ, Martinez Barrio A, Maqbool K, Sayyab S, Schwochow D, et al.
Strong signatures of selection in the domestic pig genome. Proc Natl Acad Sci U S A.
2012; 109(48): 19529-36.
9. Wang L, Xu L, Liu X, Zhang T, Li N, Hay el H, et al. Copy number variation-based
genome wide association study reveals additional variants contributing to meat quality
in Swine. Sci Rep. 2015; 5: 12535.
10. Ventanas S, Tejeda JF, Estévez M. Chemical composition and oxidative status of
tissues from Iberian pigs as affected by diets: extensive feeding v. oleic acid- and
tocopherol-enriched mixed diets. Animal. 2008; 2(4): 621-30.
11. Kouba M, Enser M, Whittington FM, Nute GR, Wood JD. Effect of a high-linolenic
acid diet on lipogenic enzyme activities, fatty acid composition, and meat quality in the
growing pig. J Anim Sci. 2003; 81(8): 1967-79.
12. Wood JD, Richardson RI, Nute GR, Fisher AV, Campo MM, Kasapidou E, et al.
Effects of fatty acids on meat quality: a review. Meat Sci. 2004;66(1): 21-32.
13. Fadista J, Nygaard M, Holm LE, Thomsen B, Bendixen C. A snapshot of CNVs in the
pig genome. PLoS One. 2008; 3(12): e3916.
14. Li Y, Mei S, Zhang X, Peng X, Liu G, Tao H, et al. Identification of genome-wide
copy number variations among diverse pig breeds by array CGH. BMC Genomics.
2012; 13: 725.
15. Ramayo-Caldas Y, Castelló A, Pena RN, Alves E, Mercadé A, Souza CA, et al. Copy
number variation in the porcine genome inferred from a 60 k SNP BeadChip. BMC
Genomics. 2010; 11: 593.
16. Chen C, Qiao R, Wei R, Guo Y, Ai H, Ma J, et al. A comprehensive survey of copy
number variation in 18 diverse pig populations and identification of candidate copy
number variable genes associated with complex traits. BMC Genomics. 2012; 13: 733.
17. Fan Y, Xing Y, Zhang Z, Ai H, Ouyang Z, Ouyang J, et al. A further look at porcine
chromosome 7 reveals VRTN variants associated with vertebral number in Chinese
and Western pigs. PLoS One. 2013; 8(4): e62534.

Paper and Studies
113
18. Wang J, Wang H, Jiang J, Kang H, Feng X, Zhang Q, et al. Identification of genome-
wide copy number variations among diverse pig breeds using SNP genotyping arrays.
PLoS One. 2013; 8(7): e68683.
19. Wiedmann RT, Nonneman DJ, Rohrer GA. Genome-Wide Copy Number Variations
Using SNP Genotyping in a Mixed Breed Swine Population. PLoS One. 2015; 10(7):
e0133529.
20. Bickhart DM, Hou Y, Schroeder SG, Alkan C, Cardone MF, Matukumalli LK, et al.
Copy number variation of individual cattle genomes using next-generation sequencing.
Genome Res. 2012; 22(4): 778-90.
21. Duan J, Zhang JG, Deng HW, Wang YP. Comparative studies of copy number
variation detection methods for next-generation sequencing technologies. PLoS One.
2013; 8(3): e59128.
22. Jiang J, Wang J, Wang H, Zhang Y, Kang H, Feng X, et al. Global copy number
analyses by next generation sequencing provide insight into pig genome variation.
BMC Genomics. 2014; 15: 593.
23. Paudel Y, Madsen O, Megens HJ, Frantz LA, Bosse M, Crooijmans RP, et al. Copy
number variation in the speciation of pigs: a possible prominent role for olfactory
receptors. BMC Genomics. 2015; 16: 330.
24. Fernández AI, Barragán C, Fernández A, Rodríguez MC, Villanueva B. Copy number
variants in a highly inbred Iberian porcine strain. Anim Genet. 2014; 45(3): 357-66.
25. Hurd PJ, Nelson CJ. Advantages of next-generation sequencing versus the microarray
in epigenetic research. Brief Funct Genomic Proteomic. 2009; 8(3): 174-83.
26. Pérez-Enciso M, Clop A, Noguera JL, Ovilo C, Coll A, Folch JM, et al. A QTL on pig
chromosome 4 affects fatty acid metabolism: evidence from an Iberian by Landrace
intercross. J Anim Sci. 2000; 78(10): 2525-31.
27. Sambrook J, Fritsch EE, Maniatis T. Molecular Cloning: A Laboratory Manual. 2nd
Ed. Cold Spring Harbor Laboratory Press; 1989. pp. E3-E4.
28. Li H, Durbin R. Fast and accurate short read alignment with Burrows-Wheeler
transform. Bioinformatics. 2009; 25(14): 1754-60.
29. Boeva V, Zinovyev A, Bleakley K, Vert JP, Janoueix-Lerosey I, Delattre O, et al.
Control-free calling of copy number alterations in deep-sequencing data using GC-
content normalization. Bioinformatics. 2011; 27(2): 268-9.

Genomic and functional genomic analysis of fatty acid composition in swine
114
30. Boeva V, Popova T, Bleakley K, Chiche P, Cappo J, Schleiermacher G, et al. Control-
FREEC: a tool for assessing copy number and allelic content using next-generation
sequencing data. Bioinformatics. 2012; 28(3): 423-5.
31. Derrien T, Estellé J, Marco Sola S, Knowles DG, Raineri E, Guigó R, et al. Fast
computation and applications of genome mappability. PLoS One. 2012; 7(1): e30377.
32. Lawrence M, Gentleman R, Carey V. rtracklayer: an R package for interfacing with
genome browsers. Bioinformatics. 2009; 25(14): 1841-2.
33. Kim JH, Hu HJ, Yim SH, Bae JS, Kim SY, Chung YJ. CNVRuler: a copy number
variation-based case-control association analysis tool. Bioinformatics. 2012; 28(13):
1790-2.
34. Livak KJ, Schmittgen TD. Analysis of relative gene expression data using real-time
quantitative PCR and the 2(-Delta Delta C(T)) Method. Methods. 2001; 25(4): 402-8.
35. Ballester M, Cordón R, Folch JM. DAG expression: high-throughput gene expression
analysis of real-time PCR data using standard curves for relative quantification. PLoS
One. 2013; 8(11): e80385.
36. Subirana I, Diaz-Uriarte R, Lucas G, Gonzalez JR. CNVassoc: Association analysis of
CNV data using R. BMC Med Genomics. 2011; 4: 47.
37. González JR, Subirana I, Escaramís G, Peraza S, Cáceres A, Estivill X, et al.
Accounting for uncertainty when assessing association between copy number and
disease: a latent class model. BMC Bioinformatics. 2009; 10: 172.
38. Hastie TJ, Pregibon D. Generalized linear models, Chapter 6 of Statistical Models in S.
Chambers JM, Hastie TJ (eds.). Wadsworth & Brooks/Cole, Pacific grove; 1992.
39. Storey JD, Tibshirani R. Statistical significance for genomewide studies. Proc Natl
Acad Sci U S A. 2003; 100(16): 9440-5.
40. Conrad DF, Hurles ME. The population genetics of structural variation. Nat Genet.
2007; 39(7 Suppl): S30-6.
41. Liu GE, Hou Y, Zhu B, Cardone MF, Jiang L, Cellamare A, et al. Analysis of copy
number variations among diverse cattle breeds. Genome Res. 2010; 20(5): 693-703.
42. Matsuzaki H, Wang PH, Hu J, Rava R, Fu GK. High resolution discovery and
confirmation of copy number variants in 90 Yoruba Nigerians. Genome Biol. 2009;
10(11): R125.
43. Eichler EE. Widening the spectrum of human genetic variation. Nat Genet. 2006;
38(1): 9-11.

Paper and Studies
115
44. Coon MJ, Ding XX, Pernecky SJ, Vaz AD. Cytochrome P450: progress and
predictions. FASEB J. 1992; 6(2): 669-73.
45. Grindflek E, Berget I, Moe M, Oeth P, Lien S. Transcript profiling of candidate genes
in testis of pigs exhibiting large differences in androstenone levels. BMC Genet. 2010;
11: 4.
46. Ramayo-Caldas Y, Mach N, Esteve-Codina A, Corominas J, Castelló A, Ballester M, et
al. Liver transcriptome profile in pigs with extreme phenotypes of intramuscular fatty
acid composition. BMC Genomics. 2012; 13: 547.
47. Paudel Y, Madsen O, Megens HJ, Frantz LA, Bosse M, Bastiaansen JW, et al.
Evolutionary dynamics of copy number variation in pig genomes in the context of
adaptation and domestication. BMC Genomics. 2013; 14:449.
48. Ramayo-Caldas Y, Mercadé A, Castelló A, Yang B, Rodríguez C, Alves E, et al.
Genome-wide association study for intramuscular fatty acid composition in an Iberian
x Landrace cross. J Anim Sci. 2012; 90(9): 2883-93.
49. Fernández AI, Pérez-Montarelo D, Barragán C, Ramayo-Caldas Y, Ibáñez-Escriche N,
Castelló A, et al. Genome-wide linkage analysis of QTL for growth and body
composition employing the PorcineSNP60 BeadChip. BMC Genet. 2012; 13: 41.
50. Muñoz M, Rodríguez MC, Alves E, Folch JM, Ibañez-Escriche N, Silió L. Genome-
wide analysis of porcine backfat and intramuscular fat fatty acid composition using
high-density genotyping and expression data. BMC Genomics. 2013; 14: 845.
51. Puig-Oliveras A, Ramayo-Caldas Y, Corominas J, Estellé J, Pérez-Montarelo D,
Hudson NJ, et al. Differences in muscle transcriptome among pigs phenotypically
extreme for fatty acid composition. PLoS One. 2014; 9(6): e99720.
52. Corominas J, Ramayo-Caldas Y, Puig-Oliveras A, Estellé J, Castelló A, Alves E, et al.
Analysis of porcine adipose tissue transcriptome reveals differences in de novo fatty
acid synthesis in pigs with divergent muscle fatty acid composition. BMC Genomics.
2013; 14: 843.
53. Dircks LK, Sul HS. Mammalian mitochondrial glycerol-3-phosphate acyltransferase.
Biochim Biophys Acta. 1997; 1348(1-2): 17-26.
54. Plog S, Grötzsch T, Klymiuk N, Kobalz U, Gruber AD, Mundhenk L. The porcine
chloride channel calcium-activated family member pCLCA4a mirrors lung expression
of the human hCLCA4. J Histochem Cytochem. 2012; 60(1): 45-56.
55. Plog S, Klymiuk N, Binder S, Van Hook MJ, Thoreson WB, Gruber AD, et al.
Naturally Occurring Deletion Mutants of the Pig-Specific, Intestinal Crypt Epithelial

Genomic and functional genomic analysis of fatty acid composition in swine
116
Cell Protein CLCA4b without Apparent Phenotype. PLoS One. 2015; 10(10):
e0140050.
56. Murakami M, Taketomi Y, Sato H, Yamamoto K. Secreted phospholipase A2
revisited. J Biochem. 2011; 150(3): 233-55.
57. Molnár J, Nagy T, Stéger V, Tóth G, Marincs F1, Barta E. Genome sequencing and
analysis of Mangalica, a fatty local pig of Hungary. BMC Genomics. 2014; 15: 761.
58. Butt E, Abel K, Krieger M, Palm D, Hoppe V, Hoppe J, et al. cAMP- and cGMP-
dependent protein kinase phosphorylation sites of the focal adhesion vasodilator-
stimulated phosphoprotein (VASP) in vitro and in intact human platelets. J Biol Chem.
1994; 269(20): 14509-17.
59. Ahmadian M, Duncan RE, Jaworski K, Sarkadi-Nagy E, Sul HS. Triacylglycerol
metabolism in adipose tissue. Future Lipidol. 2007; 2(2): 229-237.
60. Nakamura MT, Nara TY. Structure, function, and dietary regulation of delta6, delta5,
and delta9 desaturases. Annu Rev Nutr. 2004; 24: 345-76.
Supporting Information
S1 Fig. Analysis by qPCR of CNVR112 (GPAT2). The y-axis represents the RQ
quantitative measurement by qPCR for each sample and the x-axis shows the different
samples. The baseline represents the calibrator.
S2 Fig. Analysis by qPCR of CNVR157 (CLCA4). The y-axis represents the RQ
quantitative measurement by qPCR for each sample and the x-axis shows the different
samples. The baseline represents the calibrator.
S3 Fig. Analysis by qPCR of CNVR298 (MOGAT2). The y-axis represents the RQ
quantitative measurement by qPCR for each sample and the x-axis shows the different
samples. The baseline represents the calibrator.
S4 Fig. Analysis by qPCR of CNVR447 (PRKG1). The y-axis represents the RQ
quantitative measurement by qPCR for each sample and the x-axis shows the different
samples. The baseline represents the calibrator.
S1 Table. Primers used for qPCR assays.
S2 Table. Duplication and deletion calls predicted by Control-FREEC software from all
seven pigs.

Paper and Studies
117
S3 Table. Information of 540 identified CNVRs and gene annotation within the CNVRs
retrieved from the Ensembl Genes 84 Database using the Biomart data management
system.
S4 Table. Pathway analysis of genes identified in CNVRs.
S5 Table. Association analysis between CNVRs and different phenotypic records in
BC1_LD animals.

119
PAPER III
Expression analysis in adipose tissue of candidate
genes for fatty acid composition and identification of
eGWAS regions
Revilla M1,2*, Ballester M3, Puig-Oliveras A1,2, Crespo-Piazuelo D1,2, Criado-
Mesas L1,2, Castelló A1,2, Fernández AI4, Folch JM1,2
1 Departament de Ciència Animal i dels Aliments, Facultat de Veterinària, Universitat
Autònoma de Barcelona (UAB), Bellaterra, Spain
2 Plant and Animal Genomics, Centre de Recerca en Agrigenòmica (CRAG), Consorci
CSIC-IRTA-UAB-UB, Campus UAB, Bellaterra, Spain
3 Departament de Genètica i Millora Animal, Institut de Recerca i Tecnologia
Agroalimentàries (IRTA), Torre Marimon, Caldes de Montbui, Spain
4 Departamento de Genética Animal, Instituto Nacional de Investigación y Tecnología
Agraria y Alimentaria (INIA), Madrid, Spain
* Corresponding author
Manuscript in preparation


Paper and Studies
Abstract
The aim of this work was to study the genetic basis of the backfat expression of 44 lipid-
related genes associated with meat quality traits in pigs. We performed an expression
genome-wide association study (eGWAS) with the backfat gene-expression measured by
real-time quantitative PCR and the PorcineSNP60 BeadChip genotype information in 115
Iberian x Landrace backcross animals. The eGWAS identified 193 expression-associated
SNPs (eSNPs) located in 19 chromosomal regions and associated with the ACSM5,
ELOVL6, FABP4, FADS2, and SLC27A4 genes. Three out of 19 expression quantitative
trail loci (eQTLs) corresponding to ACSM5, FABP4, and FADS2 were classified as cis-
acting eQTLs, whereas the remaining 16 eQTLs have trans-regulatory effects. Remarkably,
a SNP in the ACSM5 promoter region and a SNP in the 3’UTR region of FABP4 were
identified as the most associated polymorphisms with the ACSM5 and FABP4 mRNA
expression levels, respectively. Moreover, relevant lipid-related genes mapped in the trans-
eQTLs regions associated with the ACSM5, FABP4, FADS2, and SLC27A4. Interestingly,
a trans-eQTL hotspot on SSC13 at chromosome level regulating the gene expression of
ELOVL6, ELOLV5, and SCD, three important genes implicated in the elongation and
desaturation of fatty acids, was identified.
Finally, sex differences in the organization of gene-expression had been described in
adipose tissue, illustrating that sex is an important factor that modifies the effects of the
genetic variants that underlie complex traits in pigs. These findings provide new data to
further understand the functional regulatory mechanisms implicated in the variation of
meat quality traits in pigs.
Keywords: gene expression, expression QTL, eGWAS, backfat, lipogenesis, lipid
metabolism, fatty acid.
121

Genomic and functional genomic analysis of fatty acid composition in swine
Background
Pork meat is an appreciated, all-purpose lean meat, and represents one of the main sources
of animal meat for humans (OECD/FAO, 2016). Fat and fatty acids (FAs), are
fundamental to various aspects of meat quality and play a crucial role to meat nutritional
value, both in adipose tissue (backfat, BF) and muscle (intramuscular fat; Wood et al.,
2008).
It is demonstrated that FA composition is dependent on physiological status, nutrition
conditions (Wood et al., 2004, 2008), and genetic factors (Casellas et al., 2010).
In the last few years, genome-wide association studies (GWAS) have been performed in
attempts to uncover the genetic basis of FA composition traits. Studies of our group and
others have benefited from this approach and have identified genomic regions significantly
associated with intramuscular fatty acid (IMFA) composition by using different
experimental and commercial populations (Ramayo-Caldas et al., 2012; Muñoz et al., 2013;
Yang et al., 2013; Zhang et al., 2016a,b). However, in most cases, the GWAS approach only
allows the detection of genetic variants that explain only a modest proportion of the total
heritability of the analyzed traits (Robinson et al., 2014). In addition, the way from the
genomic statistical association to the identification of true causal genetic variants is plagued
of difficulties. Hence, it has become evident the necessity to integrate new approaches to
better understand the biological significance of GWAS findings. Recently, the association
between genetic variants and gene-expression levels has been described and used to
identify expression quantitative trait loci (eQTLs). The eQTLs regulating the transcript
abundance of the mRNAs can be identified systematically using high-throughput
technologies and have recently been proposed as a good strategy to deepen the study of the
genetic architecture of complex traits (Schadt et al., 2008; Gilad et al., 2008).
Liver, skeletal muscle and adipose tissue are the three most important tissues involved in
FA metabolism (Frayn et al., 2006). Adipose tissue, one of the main energy reserves in
animals, is composed of adipocytes embedded in a matrix of connective tissue with a highly
developed vascular system. The adipocytes are dynamic cells that play a relevant role in
energy balance and overall body homeostasis. Their main metabolic functions are to
accumulate lipids, by synthesis of triacylglycerols, and lipid mobilization, through hydrolysis
of triacylglycerols (Bernlohr et al., 2002).
122
Paper and Studies
123
Previous studies in our group have identified genomic regions, candidate regulators and
regulatory polymorphisms in the liver and muscle tissues of individuals of an Iberian x
Landrace backcross population (BC1_LD of IBMAP cross; Puig-Oliveras et al., 2016;
Ballester et al., 2017). Furthermore, a transcriptome study using RNA-Seq of the adipose
tissue of two groups of pigs with phenotypically extreme IMFA composition in the same
BC1_LD identified metabolic pathways differentially modulated between groups
controlling lipid and FA metabolism (Corominas et al., 2013a). Taking into account the
relevant role of adipose tissue in the regulation of lipid metabolism, the goals of the present
article were (1) to study the expression of 44 candidate genes related with lipid metabolism
in the adipose tissue of the BC1_LD population and (2) to analyze in detail the
chromosomal regions significantly associated with the gene-expression levels to
characterize the regulatory mechanisms influencing gene-expression phenotypes. With
these results we aim to increase our knowledge of the contribution of adipose tissue in
determining FA composition in the BC1_LD animals.
Materials and Methods
Ethics Statement
All animal procedures were performed according to the Spanish Policy for Animal
Protection RD1201/05, which meets the European Union Directive 86/609 about the
protection of animals used in experimentation. Animals were sacrificed in a commercial
slaughterhouse following national and institutional guidelines for the Good Experimental
Practices and approved by the Ethical Committee of the Institution (IRTA- Institut de
Recerca i Tecnologia Agroalimentàries).
Animal samples
The IBMAP resource population was used in this study. This population was established
by crossing 3 Iberian (Guadyerbas line) boars with 31 Landrace sows (Pérez-Enciso et al.,
2000), and 5 F1 males and 25 Landrace sows were retained to propagate the BC1_LD
generation (25% Iberian x 75% Landrace). Here, we reported results based on 115
BC1_LD pigs. All animals were maintained under intensive conditions and feeding was ad
libitum with a cereal-based commercial diet. Backcross animals were slaughtered at an
average age of 179.9 ± 8.9 days, and samples of BF tissue were collected, snap-frozen in
liquid nitrogen and stored at -80°C until analysis. Genomic DNA was extracted from

Genomic and functional genomic analysis of fatty acid composition in swine
124
diaphragm samples of all animals by the phenol-chloroform method (Sambrook et al.,
1989).
Characterization of the 3’UTR of porcine FABP4 gene
The 3’UTR of the FABP4 gene was amplified and sequenced in 10 animals with extreme
values of FABP4 mRNA expression in BF.
The 3’UTR variants of FABP4 gene were characterized by 3’-RACE PCR using UAP
reverse primer and, FABP4-3NC-1-Fw and FABP4-3NC-2-Fw forward primers (Table S1).
The specific bands were excised from agarose gel and purified using NucleoSpin® Gel and
PCR Clean-up (Macherey-Nagel GmbH & Co. KG) and sequenced in forward and reverse
directions.
All primers were designed using PRIMER3 software (Rozen & Skaletsky, 2000) based on
the Y16039 sequence (Gerbens et al., 1998) and validated using PRIMER EXPRESS™
(Applied Biosystems). In all cases, PCR was performed in a 25 µl volume containing 2 µl of
cDNA. PCR reaction contained 0.6 units of AmpliTaq Gold (Applied Biosystems), 2.5 mM
MgCl2, 0.2 mM of each dNTP and 0.5 µM of each primer. PCR were carried out under the
following conditions: 94 ºC for 10 min, 35 cycles of 94 ºC for 1 min, 62 ºC for 1 min and
72 ºC for 1 min, with a final extension at 72 ºC for 7 min. Purification was performed using
the ExoSAP-IT® method and sequenced with a Big Dye Terminator v.3.1 Cycle
Sequencing Kit in an ABI 3730 analyzer (Applied Biosystems). Polymorphisms were
identified using Seq scape v2.5 program (Applied Biosystems).
miRDB (Wong & Wang, 2015) program was run to find putative target miRNAs in the
3’UTR region of FABP4. For this purpose, the human miRNA database was used.
Detection of polymorphisms in the promoter region of the FADS2 gene
Polymorphisms in the proximal promoter region of the FADS2 gene were identified from
the whole genome sequence data of seven founders of the IBMAP experimental
population (SRA accession numbers: SRR5229970, SRR5229971, SRR5229972,
SRR5229973, SRR5229974, SRR5229975, and SRR5229976) using the Integrative
Genomics Viewer (IGV) software (Robinson et al., 2011).

Paper and Studies
125
SNP Genotyping and quality control
A total of 115 animals belonging to BC1_LD were genotyped for 62,163 SNPs with the
PorcineSNP60 Beadchip (Ramos et al., 2009) following the Infinium HD Assay Ultra protocol
(Illumina Inc.; San Diego, USA). Raw data was visualized with GenomeStudio software
(Illumina Inc.; San Diego, USA) and trimmed for high genotyping quality (call rate > 0.99).
Plink software (Purcell et al., 2007) was used to remove markers that showed a minor allele
frequency (MAF) less than 5% and SNPs with more than 5% of missing genotypes. The
SNPs not mapped in the Sscrofa10.2 assembly were also excluded. After the quality control
filter, a subset of 40,460 SNPs remained.
In addition, ten polymorphisms were genotyped in the BC1_LD animals: two SNPs located
in the proximal promoter region of the ACSM5 (g.26260422G>A, rs331702081; Puig-
Oliveras et al., 2016) and the FADS2 (rs331050552) genes, and one indel and one SNP
located in the intron 1 (FABP4:g.2634_2635insC; Mercadé et al., 2006) and in the 3'UTR
region of the FABP4 gene (FABP4:g.6723A>G), respectively. For the ELOVL6 gene,
three SNPs located in the promoter region (ELOVL6:c.-533C>T, ELOVL6:c.-480C>T,
and ELOVL6:c.-394G>A; Corominas et al., 2013b, 2015), one in exon 4
(ELOVL6:c.416C>T; Corominas et al., 2013b) and two in the 3’UTR region
(ELOVL6:c.1408A>G and ELOVL6:c.1922C>T; Corominas et al., 2015) were genotyped.
ACSM5 and FADS2 SNPs were genotyped using Taqman OpenArray™ genotyping plates
designed in a QuantStudio™ 12K flex Real-Time PCR System (ThermoFisher Scientific). The
pyrosequencing protocol described by Mercadé et al., (2006) and the High Resolution
Melting methodology (HRM, ThermoFisher Scientific) were used for genotyping the indel and
SNP of FABP4 gene, respectively. The SNPs belonging to ELOVL6 gene were genotyped
using the platform KASP SNP genotyping system platform
(http://www.lgcgroup.com/genotyping/).
Gene-expression profiling
Total RNA was isolated from the BF of the 115 BC1_LD samples with RiboPure™ RNA
Purification Kit (Ambion; Austin, TX, USA). Total RNA was quantified in a NanoDrop
ND-1000 spectrophotometer (NanoDrop products; Wilmington, DE, USA). The RNA
was converted to cDNA using the High-Capacity cDNA Reverse Transcription kit (Applied
Biosystems) in 20µl of reactions, following the manufacturer’s instructions. The cDNA
samples were loaded into a Dynamic Array 48.48 chip in a BioMark system (Fluidigm; San

Genomic and functional genomic analysis of fatty acid composition in swine
126
Francisco, CA, USA) through an integrated fluidic circuit controller following a protocol
previously described (Ramayo-Caldas et al., 2014).
For this experiment, the expressed levels of 48 genes were analyzed: 44 target genes and
four reference genes (ACTB, B2M, HPRT1, and TBP). The ACTB and TBP were the two
most stable reference genes and were used to normalize the expression levels of the target
genes. Primers used for the analysis were designed using PrimerExpress 2.0 software
(Applied Biosystems) and are detailed in Additional file 2: Table S2. Data was collected
using the Fluidigm Real-Time PCR analysis software 3.0.2 (Fluidigm) and analyzed using
the DAG expression software 1.0.5.5 (Ballester et al., 2013) applying the relative standard
curve method. Samples targeted in this study were analyzed in duplicate. The normalized
quantity (NQ) values of each sample and assay were used to compare our data. Data
obtained were normalized by performing log2 transformation of the NQ value. The sex
effect was also tested by using a linear model with the lm function of R program (Ihaka &
Gentleman, 1996).
Gene-expression association analysis
In order to detect expression-associated SNPs (eSNPs), expression GWAS (eGWAS) was
performed using as phenotype the expression values of 43 genes in adipose tissue. A mixed
model was employed in Qxpak 5.0 (Pérez-Enciso & Misztal, 2011):
Yijkl = Sexi + Batchj + λkal + uk + eijkl,
in which Yijkl was the kth individual record, sex (two levels) and batch (five levels) were fixed
effects, λk was a -1 (aa), 0 (Aa), +1 (AA) indicator variable depending on the kth individual’s
genotype for the lth SNP, al represents the additive effect associated with the lth SNP, uk is
the infinitesimal genetic effect with random distribution N(0, Aσu2) where A is the
numerator of the pedigree-based relationship matrix and the eijkl the residual.
The association analyses of the ACSM5 (rs331702081), ELOVL6 (ELOVL6:c.-533C>T,
ELOVL6:c.-480C>T, ELOVL6:c.-394G>A, ELOVL6:c.416C>T, ELOVL6:c.1408A>G,
and ELOVL6:c.1922C>T), FABP4 (FABP4:g.2634_2635insC and FABP4:g.6723A>G),
and FADS2 (rs331050552) polymorphisms with the ACSM5, ELOVL6, FABP4, and
FADS2 mRNA expression, respectively, were performed using the same mixed model
described above.

Paper and Studies
127
The R package q-value was used to calculate the false discovery rate (FDR), and the cut-off
of the significant association at the whole genome level was set at the q-value ≤ 0.05 (Ihaka
& Gentleman, 1996; Storey & Tibshirani, 2003).
The identified eSNPs were classified as cis when they were at 5 Mb upstream or
downstream of the gene position and as trans when they were located elsewhere in the
genome. Significant associated eSNPs located less than 10 Mb apart were considered as
belonging to the same interval.
Gene annotation and functional classification
The significantly associated eSNPs (FDR≤ 0.05) identified were mapped in the Sscrofa10.2
assembly and were annotated with the Ensembl Genes 84 Database using Variant Effect
Predictor (VEP) software (McLaren et al., 2010).
The genomic eQTL intervals were annotated using Biomart software
[http://www.biomart.org] considering ±1 Mb around the candidate chromosomal region
for trans-eQTLs and only the studied candidate gene for cis-eQTLs.
The Core Analysis function included in the Ingenuity Pathway Analysis software (IPA,
Ingenuity Systems Inc., http://www.ingenuity.com) was used to perform the functional
analysis of genes mapped in the 19 eQTL regions. This software was used for data
interpretation in the context of biological processes, pathways and networks. All
information generated is derived from the Ingenuity Pathway Knowledge Base (IPKB),
which is based on functions and interactions of genes published in the literature. RNA-Seq
data of BF from BC1_LD individuals (Corominas et al., 2013a) and Gene Expression Atlas
(Kapushesky et al., 2010) were used to determine which of the lipid-related genes annotated
in the genomic eQTL intervals were expressed in adipose tissue. Finally, a prediction
analysis of transcription factor (TF) binding sites was performed in the promoter region of
the 458 annotated genes. The iRegulon Cytoscape plugin (Janky et al., 2014) was used to
analyze the TFs and their related target genes. iRegulon relies on the analysis of the
regulatory sequences around each gene, and use a databases of nearly 10,000 TF motifs and
1,000 ChIP-seq data sets or “tracks”. The normalized enrichment score (NES) >5 was
considered as the threshold value for the selection of potential relationships.

Genomic and functional genomic analysis of fatty acid composition in swine
128
Gene-expression and correlation analysis with phenotypes
A correlation analysis was performed to explore the relationship between the expressions
of the 43 genes. Moreover, to analyze the relationships between gene-expression and
phenotypes, correlations among gene-expression and FA composition percentages in BF
(Muñoz et al., 2013) were performed. If required, data was normalized applying the log2
transformation. Then, gene-expression and the composition of FA in BF were corrected
both by gender (two levels) and batch effects (five levels), and the composition of FA traits
was also adjusted for carcass weight, using the glm R package (Hastie & Pregibon, 1992).
Results and discussion
Selection of genes related with lipid metabolism in the adipose tissue
Using the information generated in previous studies of our group, strong candidate genes
affecting FA composition of BF and intramuscular fat in the BC1_LD generation were
identified by GWAS, RNA-Seq and co-association network approaches (Ramayo-Caldas et
al., 2012; Corominas et al., 2013a,b; Puig-Oliveras et al., 2014a; Ramayo-Caldas et al., 2014;
Ballester et al., 2016) (Table S3). A total of 44 candidate genes related with lipid metabolism
were selected to study their expression pattern in BF. Fourteen of them (ARNT, CYP2U1,
EGF, ELOVL6, FABP4, FABP5, FADS1, FADS2, FADS3, NFKB1, PLA2G12A,
PLCB2, PLPP1, and USF1) are functional and positional candidate genes related with lipid
metabolism which were identified in GWAS analyses for BF and IMFA composition in the
BC1_LD animals (Ramayo-Caldas et al., 2012; Ballester et al., 2016). We also included two
candidate genes differentially-expressed (ELOVL6 and SCD) in a RNA-Seq analysis of the
adipose tissue of two phenotypically extreme groups of animals for IMFA composition in
the BC1_LD cross (Corominas et al., 2013a). Lipid metabolism genes identified in gene co-
association networks for FA composition (ACSM5, ANK2, ARNT, FABP4, FABP5,
MGLL, and PPARG) (Ramayo-Caldas et al., 2014), two of which were also identified in
gene co-association networks for fatness and growth traits (ARNT and PPARG) (Puig-
Oliveras et al., 2014a). In addition, in order to complete the set of genes, we included genes
which have been described in the literature to play different roles in lipid metabolism such
as transporters (RBP4, SCAP, SLC27A1, and SLC27A4), enzymes (AGPAT2, CPT1A,
CROT, DGAT1, DGAT2, ELOVL5, LIPC, LPIN1, PEX2, and PNPLA2) and
transcriptional factors, cofactors or nuclear receptors (CD36, ESRRA, MLXIPL, NR1H3,
POU2F1, PPARA, PPARD, PPARGC1A, RXRG, and SREBF1). Finally, we added the

Paper and Studies
129
ADIPOQ gene, which codifies an important adipokine of white fat tissue exerting multiple
biological processes on carbohydrate and lipid metabolism (review in Shehzad et al., 2012).
Although this gene is not mapped in the current Sscrofa10.2 assembly, it has been mapped
to the SSC13q36-41 interval (Dai et al., 2006).
Four endogenous genes (ACTB, B2M, HPRT, and TBP) were also selected as reference
controls.
Expression genome-wide association analysis (eGWAS)
In the present study, the adipose tissue expression of 48 genes (44 target and four reference
genes previously explained) was measured by real-time quantitative PCR (qPCR) in 115
BC1_LD animals. For the PPARGC1A gene, a poor PCR efficiency was obtained and it
was discarded for further analysis. eGWAS were performed with the gene-expression
values of the 43 remaining target genes and the genotypes of 40,460 SNPs of the
PorcineSNP60 BeadChip (Ilumina) distributed across the pig genome.
At whole genome level, significant association signals in five of the analyzed genes were
detected (Table 1): ACSM5, ELOVL6, FABP4, FADS2, and SLC27A4. The ACSM5,
FABP4, FADS2, and SLC27A4 genes presented more than one associated eQTL (Table
1). Three out of 19 eQTLs were identified as cis-acting for the ACSM5, FABP4, and
FADS2 gene-expression (Fig. 1), suggesting the presence of proximal polymorphisms
regulating the expression of these genes. These results showed a difference in the
prevalence of cis- and trans-eQTLs. In general, studies performed in animals have identified
regulatory trans-eQTLs in a higher ratio than those performed in humans (Gilad et al., 2008;
Cheung & Spielman, 2009). Our results are in concordance with this assumption, and also,
previously studies of our group performed in muscle (Puig-Oliveras et al., 2016) and liver
(Ballester et al., 2017) identified a prevalence of porcine trans-eQTLs compared wih the cis-
eQTLs.
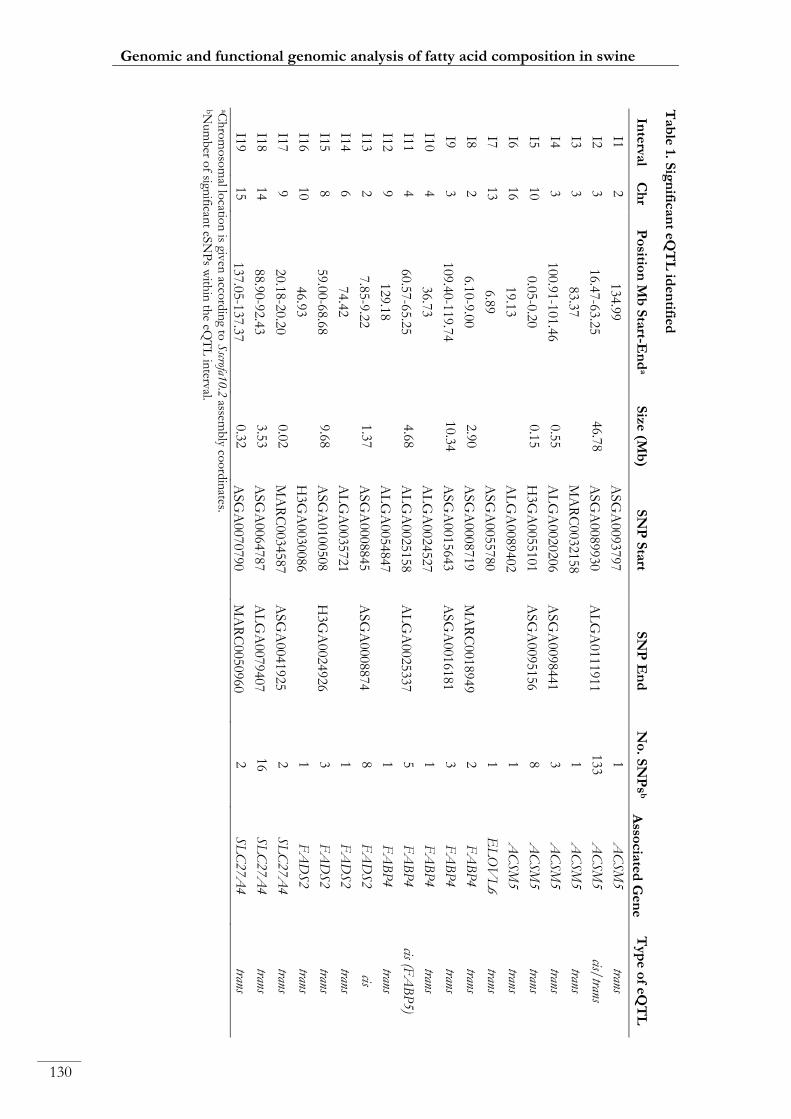
Tab
le 1. S
ign
ifican
t eQT
L id
en
tified
Inte
rval
Ch
r P
ositio
n M
b S
tart-E
nd
a S
ize (M
b)
SN
P S
tart
SN
P E
nd
N
o. S
NP
sb
Asso
cia
ted
Gen
e
Typ
e o
f eQ
TL
I1 2
134.9
9
ASG
A0093797
1
AC
SM
5
trans
I2 3
16.4
7-6
3.2
5
46.7
8
ASG
A0089930
AL
GA
0111911
133
AC
SM
5
cis/trans
I3 3
83.3
7
MA
RC
0032158
1
AC
SM
5
trans
I4 3
100.9
1-1
01.4
6
0.5
5
AL
GA
0020206
ASG
A0098441
3
AC
SM
5
trans
I5 10
0.0
5-0
.20
0.1
5
H3G
A0055101
ASG
A0095156
8
AC
SM
5
trans
I6 16
19.1
3
AL
GA
0089402
1
AC
SM
5
trans
I7 13
6.8
9
ASG
A0055780
1
EL
OV
L6
trans
I8 2
6.1
0-9
.00
2.9
0
ASG
A0008719
MA
RC
0018949
2
FA
BP
4
trans
I9 3
109.4
0-1
19.7
4
10.3
4
ASG
A0015643
ASG
A0016181
3
FA
BP
4
trans
I10
4
36.7
3
AL
GA
0024527
1
FA
BP
4
trans
I11
4
60.5
7-6
5.2
5
4.6
8
AL
GA
0025158
AL
GA
0025337
5
FA
BP
4
cis (FA
BP
5)
I12
9
129.1
8
AL
GA
0054847
1
FA
BP
4
trans
I13
2
7.8
5-9
.22
1.3
7
ASG
A0008845
ASG
A0008874
8
FA
DS
2 cis
I14
6
74.4
2
AL
GA
0035721
1
FA
DS
2 trans
I15
8
59.0
0-6
8.6
8
9.6
8
ASG
A0100508
H3G
A0024926
3
FA
DS
2 trans
I16
10
46.9
3
H3G
A0030086
1
FA
DS
2 trans
I17
9
20.1
8-2
0.2
0
0.0
2
MA
RC
0034587
ASG
A0041925
2
SL
C27A
4
trans
I18
14
88.9
0-9
2.4
3
3.5
3
ASG
A0064787
AL
GA
0079407
16
SL
C27A
4
trans
I19
15
137.0
5-1
37.3
7
0.3
2
ASG
A0070790
MA
RC
0050960
2
SL
C27A
4
trans aC
hro
mo
som
al locatio
n is giv
en acco
rdin
g to S
scrofa10.2
assemb
ly coo
rdin
ates. bN
um
ber o
f significan
t eSN
Ps w
ithin
the eQ
TL
interv
al.
130
Genomic and functional genomic analysis of fatty acid composition in swine
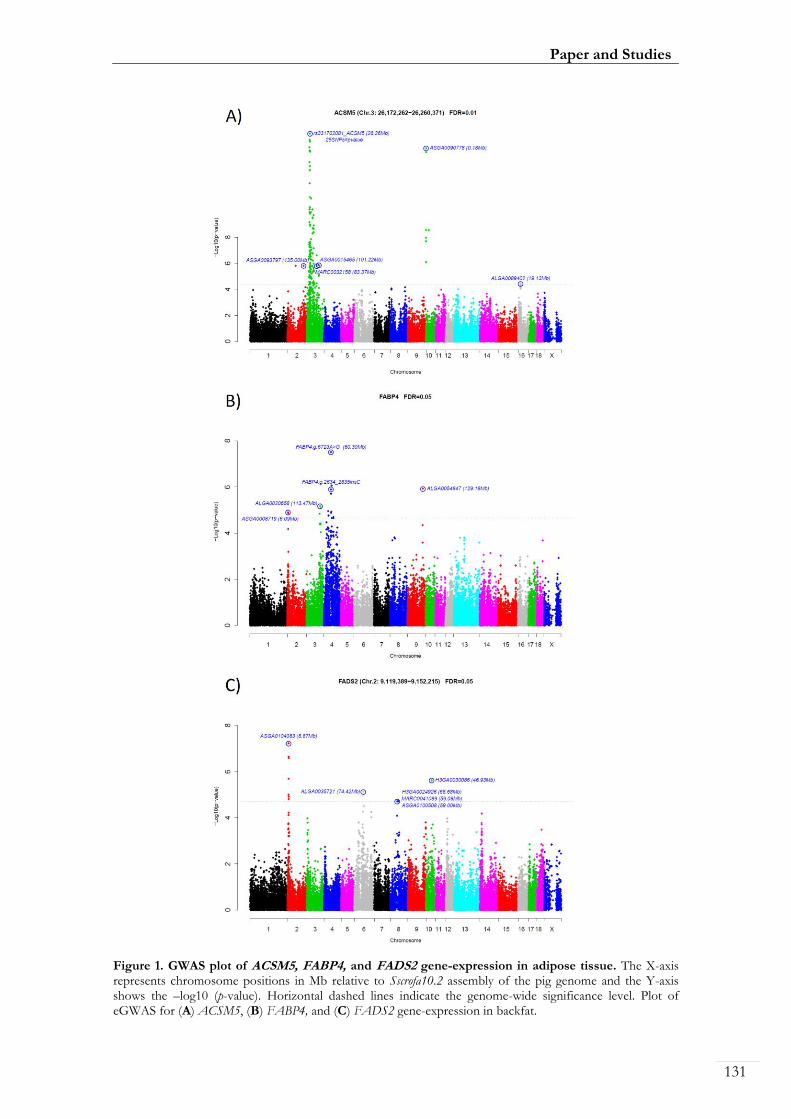
Paper and Studies
131
Figure 1. GWAS plot of ACSM5, FABP4, and FADS2 gene-expression in adipose tissue. The X-axis represents chromosome positions in Mb relative to Sscrofa10.2 assembly of the pig genome and the Y-axis shows the –log10 (p-value). Horizontal dashed lines indicate the genome-wide significance level. Plot of eGWAS for (A) ACSM5, (B) FABP4, and (C) FADS2 gene-expression in backfat.
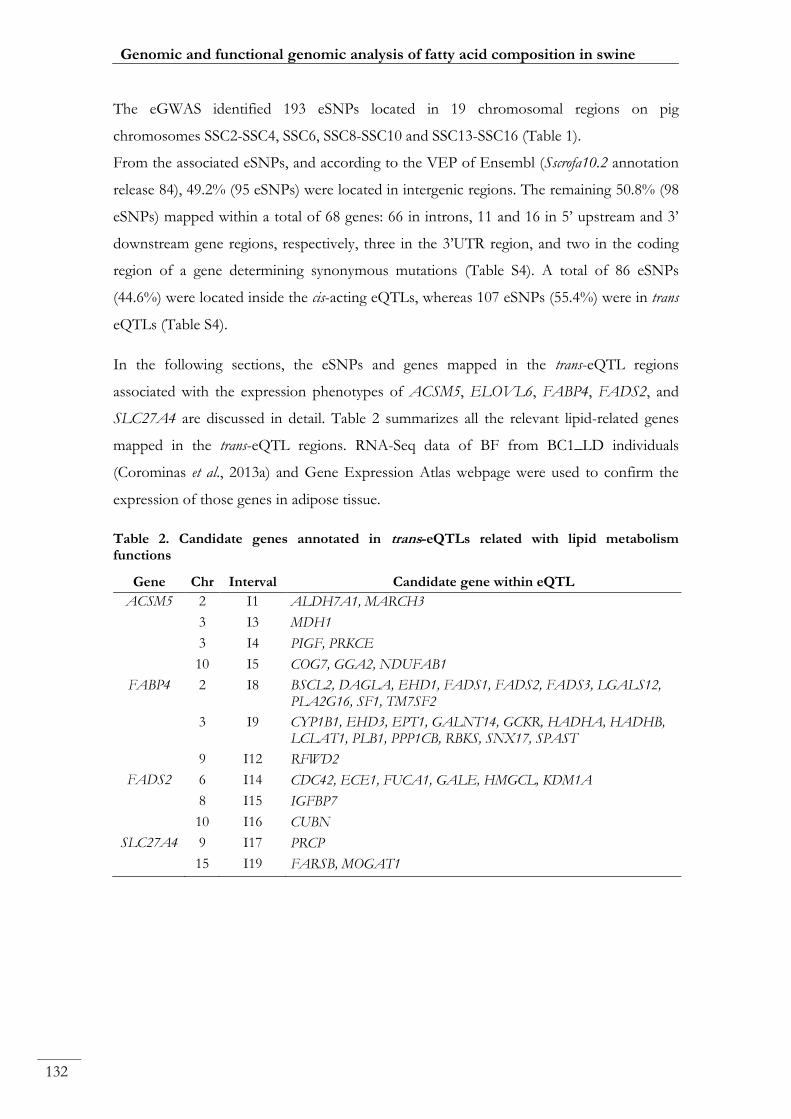
Genomic and functional genomic analysis of fatty acid composition in swine
132
The eGWAS identified 193 eSNPs located in 19 chromosomal regions on pig
chromosomes SSC2-SSC4, SSC6, SSC8-SSC10 and SSC13-SSC16 (Table 1).
From the associated eSNPs, and according to the VEP of Ensembl (Sscrofa10.2 annotation
release 84), 49.2% (95 eSNPs) were located in intergenic regions. The remaining 50.8% (98
eSNPs) mapped within a total of 68 genes: 66 in introns, 11 and 16 in 5’ upstream and 3’
downstream gene regions, respectively, three in the 3’UTR region, and two in the coding
region of a gene determining synonymous mutations (Table S4). A total of 86 eSNPs
(44.6%) were located inside the cis-acting eQTLs, whereas 107 eSNPs (55.4%) were in trans
eQTLs (Table S4).
In the following sections, the eSNPs and genes mapped in the trans-eQTL regions
associated with the expression phenotypes of ACSM5, ELOVL6, FABP4, FADS2, and
SLC27A4 are discussed in detail. Table 2 summarizes all the relevant lipid-related genes
mapped in the trans-eQTL regions. RNA-Seq data of BF from BC1_LD individuals
(Corominas et al., 2013a) and Gene Expression Atlas webpage were used to confirm the
expression of those genes in adipose tissue.
Table 2. Candidate genes annotated in trans-eQTLs related with lipid metabolism functions
Gene Chr Interval Candidate gene within eQTL
ACSM5 2 I1 ALDH7A1, MARCH3
3 I3 MDH1
3 I4 PIGF, PRKCE
10 I5 COG7, GGA2, NDUFAB1
FABP4 2 I8 BSCL2, DAGLA, EHD1, FADS1, FADS2, FADS3, LGALS12, PLA2G16, SF1, TM7SF2
3 I9 CYP1B1, EHD3, EPT1, GALNT14, GCKR, HADHA, HADHB, LCLAT1, PLB1, PPP1CB, RBKS, SNX17, SPAST
9 I12 RFWD2
FADS2 6 I14 CDC42, ECE1, FUCA1, GALE, HMGCL, KDM1A
8 I15 IGFBP7
10 I16 CUBN
SLC27A4 9 I17 PRCP
15 I19 FARSB, MOGAT1
Paper and Studies
133
The ACSM5 gene
One of the cis-eSNPs (ASGA0103234) associated with the expression of the Acyl-CoA
Synthetase Medium-Chain Family Member 5 gene (ACSM5) mapped within an intronic
region of the gene (Table S4). However, this SNP was not the most significantly associated
(ASGA0103234; p-value= 8.18x10⁻¹²; estimated additive effect, â= -3.968), suggesting the
presence of other polymorphisms within or near the ACSM5 gene as the causative
mutation affecting the expression levels of this gene. The most significant cis-SNPs (p-
value= 1.11x10⁻¹⁷) for ACSM5 gene-expression were located between 23.44 Mb and 27.94
Mb, covering a total of 25 SNPs, in a region with a strong linkage disequilibrium (LD) (D′
= 0.99). Recently, the polymorphism ACSM5:g.26260422G>A (rs331702081), located at
the proximal promoter region of the ACSM5 gene, has been described as the most
associated with the expression of ACSM5 in Longissimus dorsi muscle of BC1_LD animals
(Puig-Oliveras et al., 2016). To assess the association of this polymorphism with the
expression of the ACSM5 in BF, the ACSM5:g.26260422G>A SNP was genotyped in the
115 BC1_LD animals and included in the eGWAS study. Remarkably, this polymorphism
is one of the SNPs located in the 23.44-27.94 Mb block with the lowest p-value (p-value=
1.11x10⁻¹⁷; Fig. 1A). Hence, this SNP may be a strong candidate polymorphism to explain
the mRNA variation of the ACSM5 gene in BF and muscle. Even so, the correlation value
between the ACSM5 gene-expression in BF and muscle is of r= 0.60 (p-value= 3.0x10⁻¹²),
suggesting that other factors than the SSC3 cis-eQTL are differentially regulating the
expression of ACSM5 in both tissues.
The effect of ACSM5:g.26260422G>A SNP on the binding of TFs was determined by the
LASAGNA-Search version 2.0 software (Lee & Huang, 2013). Remarkably, the aryl
hydrocarbon receptor nuclear translocator (ARNT) gene (TF ID= M00236 and M00539)
and the signal transducer and activator of transcription 6 (STAT6) gene (TF ID= M00500)
were identified to bind only when A allele is present. ARNT gene plays an important role
in the regulation of hepatic lipogenesis and gluconeogenesis (Wang et al., 2009; Rankin et
al., 2009), and was identified as one of the most central genes in a liver co-expression
network analysis of IMFA composition in pigs (Ramayo-Caldas et al., 2014). STAT6 gene
has been described to interact with the peroxisome proliferator activated receptor gamma
gene (PPARG), and the cooperative binding of the two genes led to an increase response
of PPARG (Szanto et al., 2010). The importance of PPARG gene lies on its regulation of
adipocyte differentiation and glucose homeostasis, and it was identified as a major regulator

Genomic and functional genomic analysis of fatty acid composition in swine
for growth and fatness related traits in a co-association network in muscle of BC1_LD
individuals (Puig-Oliveras et al., 2014a). Different transcription binding sites for PPARG in
the ACSM5 proximal promoter region were also predicted by LASAGNA (data not
shown).
Five chromosomal regions (Table 1) were also associated in trans with the ACSM5 gene-
expression. Interestingly, two of these regions on SSC3 (100.91-101.46 Mb) and SSC10
(0.05-0.20 Mb) have been recently associated with the mRNA expression of the ACSM5
gene in the Longissimus dorsi muscle of BC1_LD animals (SSC3: 100.35 Mb; SSC10: 0.17
Mb) (Puig-Oliveras et al., 2016). These results, together with the cis-eQTL identification for
the ACSM5 expression, further confirm the existence of common regulatory mechanisms
implicated in the expression of ACSM5 in BF and muscle. The most associated SNP was
identified on SSC10 and it is an intronic polymorphism (ASGA0090778; p-value= 1.44x10-
15; â= -4.081) in the Component of Oligomeric Golgi Complex 7 (COG7) gene (Table S4).
In these trans-eQTLs regions, other lipid-related genes were identified such as the Golgi-
associated, Gamma Adaptin Ear Containing, ARF Binding Protein 2 (GGA2) gene
(H3GA0055120; p-value= 2.89x10⁻¹⁵; â= -4.072) and the NADH Dehydrogenase
(Ubiquinone) 1, Alpha/Beta Subcomplex, 1, 8 kDa (NDUFAB1) gene (H3GA0055101 and
MARC0015344; p-value= 8.11x10-07; â= 2.287) on SSC10, and the Phosphatidylinositol
Glycan Anchor Biosynthesis Class F (PIGF) gene and the Protein Kinase C Epsilon
(PRKCE) gene on SSC3 (Table S4). On SSC3, another region at 83.37 Mb was also
associated in trans with the ACSM5 gene-expression. In this region, the Malate
Dehydrogenase 1 (MDH1) gene (82,603,920-82,615,099 bp) was identified. Finally, within
the trans-eQTL for ACSM5 at 134.99 Mb on SSC2, two genes that may affect lipid
metabolism were identified: Aldehyde Dehydrogenase 7 Family Member A1 (ALDH7A1)
and Membrane Associated Ring-CH-Type Finger 3 (MARCH3) (Table S5).
For the trans-eQTL identified on SSC16 for ACSM5, no strong candidate gene exerting a
known lipid metabolism function was detected.
The ELOVL6 gene
In previous studies of our group, the SNP ELOVL6:c.-533C>T located in the promoter
region of ELOVL6 was found to be highly associated with the ELOVL6 expression in BF
and, with the percentages of palmitic (C16:0) and palmitoleic (C16:1(n-7)) acids in BF and
muscle (Corominas et al., 2013b). Later on, the polymorphism ELOVL6:c.-394G>A,
located in a putative binding site for estrogen receptor alpha (ERα) in the ELOVL6
134

Paper and Studies
135
promoter, was associated with the methylation levels of the ELOVL6 promoter and with
the expression of the gene, suggesting this polymorphism as the causal mutation for the
QTL on SSC8 affecting palmitic (C16:0) and palmitoleic (C16:1(n-7)) acids (Corominas et
al., 2015). Taking into account that a different number of BC1_LD animals and a different
mRNA quantification method (microfluidic array vs conventional qPCR) was applied
between studies, the previously ELOVL6 genotyped polymorphisms (three in the
promoter region, one in exon 4 and two in the 3’UTR region) (Corominas et al., 2013b;
Corominas et al., 2015) were genotyped in the 115 BC1_LD animals and incorporated in
the eGWAS. The results were consistent with those of our previous studies on SSC8
(Corominas et al., 2013b), where a significant region at chromosome level associated with
ELOVL6 mRNA expression in BF was observed (Figure S1). The most significant peak
was for two SNPs with the same p-value (ALGA0049135 and ALGA0049139; p-value=
4.60x10-05; â= -0.563), located in an intron of ANK2, very close to the ELOVL6 gene. In
addition, the ELOVL6:c.-533C>T and ELOVL6:c.-394G>A polymorphisms, which were
in full LD, also showed high association (p-value= 6.42x10-04; â= 0.460), although in our
analysis did not achieve significance after multiple testing corrections (q-value ≤ 0.05).
Remarkably, ANK2 is one of the most central genes in an adipose co-expression network
related with IMFA composition in the BC1_LD (Ramayo-Caldas et al., 2014). In a recent
study, knockin mice expressing human nonsynonymous mutations in ANK2 showed
altered glucose homeostasis contributing to increased adiposity. This phenotype was caused
by the reduction in ANK2 protein levels which produce an elevation of cell surface
GLUT4 and increased glucose uptake in skeletal muscle and fat (Lorenzo et al., 2015).
Thus, we cannot discard an association of this gene with the mRNA expression levels of
ELOVL6. Further analyses are necessary to corroborate this hypothesis.
Regarding the trans-associated regions with the BF mRNA ELOVL6 expression,
Corominas et al. (2013b) did not identify any region at whole genome level, in contrast with
the trans-eQTL on SSC13 identified in the present study. The observed discrepancy could
be due to the different animals used between the two studies (94 samples overlapping
between the two studies) and to the subtle differences observed between the two methods
used for mRNA quantification (correlation coefficient, r= 0.91). No genes related to lipid
metabolism function were identified in the SSC13 trans-eQTL. However, we have to
highlight that the same region on SSC13 was associated at chromosome level with the
expression of the ELOVL5 and SCD genes. ELOVLs and SCD genes are implicated in
Genomic and functional genomic analysis of fatty acid composition in swine
136
the elongation and desaturation of FAs in the endoplasmic reticulum membranes. These
metabolic functions are essential to the maintenance of lipid homeostasis (reviewed in
Guillou et al., 2010). Interestingly, it has been reported that the expression of these genes
are primarily regulated at transcriptional level (reviewed in Guillou et al., 2010). In this
study, highly significant correlations (p-value = 2.22x10⁻¹⁶) among the mRNA expression of
these genes were obtained (rELOVL5-ELOVL6= 0.90; rELOVL5-SCD= 0.84; rELOVL6-SCD= 0.86),
supporting the involvement of common elements regulating their mRNA expression. In
addition, we found high correlations with the genes coding for the TFs SREBF1 and
PPARs (rELOVL5-PPARG= 0.75, p-value= 2.22x10⁻¹⁶; rELOVL5-SREBF1= 0.74, p-value= 2.22x10⁻¹⁶;
rELOVL5-PPARA= 0.65, p-value= 1.02x10⁻¹⁴; rELOVL6-PPARG= 0.68, p-value= 2.22x10⁻¹⁶; rELOVL6-
SREBF1= 0.70, p-value= 2.22x10⁻¹⁶; rELOVL6-PPARA= 0.69, p-value= 2.22x10⁻¹⁶; rSCD-PPARG= 0.59,
p-value= 1.01x10⁻¹¹; rSCD-SREBF1= 0.63, p-value= 8.48x10⁻¹⁴; rSCD-PPARA= 0.51, p-value=
1.03x10-08) which contribute to the regulation of these genes (Guillou et al., 2010;
Corominas et al., 2013a; Estany et al., 2014). High correlation values were also found
between the mRNA expression of DGAT1 and DAGT2 genes with ELOVLs and SCD
genes (rDGAT1-ELOVL5= 0.72, p-value= 2.22x10⁻¹⁶; rDGAT1-ELOVL6= 0.70, p-value= 2.22x10⁻¹⁶;
rDGAT1-SCD= 0.59, p-value= 3.89x10⁻¹²; rDGAT2-ELOVL5= 0.81, p-value= 2.22x10⁻¹⁶; rDGAT2-ELOVL6=
0.74, p-value= 2.22x10⁻¹⁶; rDGAT2-SCD= 0.76, p-value= 2.22x10⁻¹⁶). This result agrees with the
interrelated function of these genes which are implicated in lipogenesis (ELOVLs and
SCD) and triglyceride (TG) synthesis (DGAT1 and DGAT2), the main function of adipose
tissue (Bernlohr et al., 2002).
ELOVL6 and SCD genes were over-expressed in the adipose tissue transcriptome (RNA-
Seq) of BC1_LD animals with higher content of intramuscular monounsaturated fatty acids
(MUFA) and saturated fatty acids (SFA), when compared with animals having more
polyunsaturated (PUFA) (Corominas et al., 2013a) supporting the relevance of these genes
in the determination of FA composition in the BC1_LD.
The FABP4 gene
The Fatty Acid Binding Protein 4 (FABP4) gene is not mapped in the current Sscrofa10.2
assembly. Nevertheless, radiation hybrid (RH) and linkage maps located FABP4 gene close
to FABP5 on SSC4 (Gerbens et al., 1998; Estellé et al., 2006), in agreement with the human
comparative map. For this reason, we used the known mapped FABP5 gene (SSC4: 60.31
Mb) in order to define cis/trans eQTLs for the unmapped FABP4 gene. This gene has been
reported as a strong positional candidate gene for a QTL region associated with growth
Paper and Studies
137
and fatness traits in the IBMAP population (Mercadé et al., 2005, 2006; Estellé et al., 2006).
Furthermore, Ramayo-Caldas et al. (2012) and Muñoz et al. (2013) identified an association
between this position of SSC4 and fat deposition and FA composition in the BC1_LD
backcross. In a previous study in the BC1_LD backcross, an indel located in the intron 1 of
FABP4 (FABP4:g.2634_2635insC) was identified as the most associated polymorphism
with the FABP4 mRNA levels in BF (Ballester et al., submitted). In the present study, the
indel, which was genotyped in the 115 BC1_LD animals and included in the eGWAS study,
was one of the most significant associated polymorphisms (p-value= 1. 27x10-06; â= -0.219)
(Fig. 1B) but the most significant cis-SNP (ALGA0025337; p-value= 8.67x10-07; â= 0.328)
was located in an intergenic region (Table S4).
Taking into account the highly polymorphic nature of the porcine FABP4 gene (Ojeda et
al., 2006) and a possible regulatory role of miRNAs in the FABP4 gene-expression (Qi et
al., 2015), the 3’UTR of the FABP4 gene was amplified and sequenced using 10 animals
with extreme values of FABP4 mRNA expression in BF. Three poly(A) signals were shown
at positions 540, 1214, and 1428 bp (positions based on the GenBank Y16039 sequence
counting from the first triplet code) used for mRNA poly(A) tail addition. Moreover, a
polymorphism in the 3’UTR (FABP4:g.6723A>G) was identified and genotyped in the 115
BC1_LD animals. The association analysis with the FABP4 mRNA expression values
revealed that the SNP in the 3’UTR region has the lowest p-value (p-value= 3.07x10-08; â= -
0.260) (Fig. 1B).
Interestingly, FABP4:g.6723A>G SNP was inside a putative miRNA binding site for the
putative human miRNA hsa-miR-3182 and it is predicted to bind only when
FABP4:g.6723G allele is present. Unfortunately, we did not find the homologous Sus scrofa
miR-3182 in the current assembly (Sscrofa10.2) of the pig genome. Although the 3’UTR
SNP (FABP4:g.6723A>G) is a clear candidate to explain the differences of FABP4 mRNA
levels among animals, we cannot discard also a role of the indel (FABP4:g.2634_2635insC)
in the FABP4 gene regulation. Indeed, the indel polymorphism was predicted to be located
in a target binding site for PPARG and NR4A2 TFs (Ballester et al., submitted). In our
analysis the correlation between the mRNA expression of PPARG and FABP4 was r= 0.51
(p-value= 9.27x10-09). Further functional analyses are needed to test the role of these
polymorphisms in the FABP4 gene regulation and besides in the determination of IMFA
composition.

Genomic and functional genomic analysis of fatty acid composition in swine
138
The eGWAS performed for the FABP4 gene, revealed four trans-eQTLs on SSC2, SSC3,
SSC4, and SSC9 (Table 1); where several genes involved in lipid metabolism were mapped.
On SSC2 the Berardinelli-Seip Congenital Lipodystrophy 2 (Seipin) (BSCL2),
Diacylglycerol Lipase Alpha (DAGLA), EH Domain Containing 1 (EHD1), Fatty Acid
Desaturase 1 (FADS1), Fatty Acid Desaturase 2 (FADS2), Fatty Acid Desaturase 3
(FADS3), Lectin Galactoside Binding Soluble 12 (LGALS12), N(Alpha)-Acetyltransferase
40 Phospholipase A2 Group XVI (PLA2G16), Splicing Factor 1 (SF1), and
Transmembrane 7 Superfamily Member 2 (TM7SF2) candidate genes were located. The
function of BSCL2 gene is still being investigated, however, its relationship with
adipogenesis, with the genesis of lipid droplets and the regulation of the metabolism of
phospholipids and triacylglycerides has been established (Boutet et al., 2009). Liu et al.,
(2014) performed an adipose-specific Seipin knockout mice with FABP-mediated BSCL2
deletion exhibiting decreased lipolysis in response to β-adrenergic receptors agonists in
vivo. We also identify some members of the fatty acid desaturase family (FADS),
specifically FADS1, FADS2, and FADS3 whose expression phenotypes have been also
analyzed in this study. However, no significant correlations between the mRNA expression
levels of the FABP4 gene and the FADS1, FADS2, and FADS3 genes were obtained. In
this chromosomal region we also identified the LGALS12 gene, an intracellular galectin
preferentially expressed in adipocytes which regulates lipolysis and whole-body energy
metabolism (Yang et al. 2011). Furthermore, FABP4 and LGALS12 genes were identified
in the glycolysis/gluconeogenesis pathway in an expression analysis performed in human
adipose-derived stem cells (Satish et al., 2015). PLA2G16, which encodes a phospholipase
that catalyzes phosphatidic acid into lysophosphatidic acid and free FA, was also identified
(Xiong et al., 2014). It is known that FABP4 and PLA2G16 are involucrate in the
glutathione peroxidase 3 (GPX3) complex. GPX3 complex is expressed in adipose tissue
(Maeda et al., 1997) and catalyze lipid hydroperoxides as well as hydrogen peroxide
(Yamamoto & Takahashi, 1993). Other lipid-related genes identified within this trans-eQTL
on SSC2 for FABP4 are shown in Table 2.
The following lipid-related genes were identified within the trans-eQTL on SSC3 for
FABP4 gene-expression: Cytochrome P450 Family 1 Subfamily B Member 1 (CYP1B1),
EH Domain Containing 3 (EHD3), Ethanolaminephosphotransferase 1 (EPT1),
Polypeptide N-Acetylgalactosaminyltransferase 14 (GALNT14), Glucokinase (Hexokinase
4) Regulator (GCKR), Hydroxyacyl-CoA Dehydrogenase/3-Ketoacyl-CoA (HADHA),
Hydroxyacyl-CoA Dehydrogenase/3-Ketoacyl-CoA (HADHB), Lysocardiolipin

Paper and Studies
139
Acyltransferase 1 (LCLAT1), Phospholipase B1 (PLB1), Protein Phosphatase 1 Catalytic
Subunit Beta (PPP1CB), Ribokinase (RBKS), Sorting Nexin 17 (SNX17), and Spastin
(SPAST). It has been demonstrated that CYP1B1 extensively affects many gene responses
directed by the lipid-responsive receptors. Liu et al., (2015) have demonstrated that the
reduction in body weight gain and white adipose tissue in CYP1B1 deficient mice exhibited
coordinate decreases in FA synthesis (regulated by FABP4, among others) when compared
with wild type ones. The HADHA and HADHB genes encode the alpha and beta,
respectively, subunits of the mitochondrial trifunctional protein, which catalyze the last
three steps of mitochondrial beta-oxidation of long chain FAs. Remarkably, these two
genes overlapped with QTLs previously described in the IBMAP population for palmitic
(C16:0) and palmitoleic (C16:1(n-7)) acids (Ramayo-Caldas et al., 2012).
For the trans-eQTL identified on SSC4 for FABP4, no strong candidate gene exerting a
known lipid metabolism function was detected.
Finally, on SSC9, we identified the RFWD2 gene (Ring Finger And WD Repeat Domain 2)
associated with FABP4 mRNA expression. Interestingly, this gene regulates lipid
metabolism by targeting acetyl-CoA carboxylase, a rate-limiting enzyme in FA synthesis,
for degradation via its interaction with the pseudokinase tribbles 3 (TRB3), a pseudokinase
and negative regulator of the Serine/Threonine Kinase (Akt) gene in muscle and liver
(Tong et al., 2006; Du et al., 2003).
The FADS2 gene
The most significant cis-eSNP for FADS2 gene-expression (ASGA0104083; p-value= 5.98
x10-08; â= 0.466) was located less than 0.23 Mb upstream of the FADS2 gene (Fig. 1C).
Interestingly, the members belonging to the FA desaturase gene family: FADS1, FADS2,
and FADS3, cluster together in a region on SSC2 significantly associated with cis-7
hexadecenoic acid (C16:1(n-9)), linoleic acid (C18:2(n-6)), α-linolenic acid (C18:3(n-3)), and
PUFA in BF (Ballester et al., 2016), and with palmitic acid (C16:0) and the SFA in
intramuscular fat (Ramayo-Caldas et al., 2012) in the BC1_LD. In addition, a high
correlation has been observed between the mRNA expression levels of FADS1 and
FADS2 in liver (rFADS1-FADS2= 0.92; p-value= 1.11x10⁻¹⁷) which suggest common regulatory
mechanisms controlling the mRNA expression of both desaturases in this tissue (Ballester
et al., 2017). In the present work, the correlation between the mRNA expression levels of
FADS1 and FADS2 in BF was moderate-high (rFADS1-FADS2= 0.63; p-value= 8.26x10⁻¹⁴).
Genomic and functional genomic analysis of fatty acid composition in swine
140
Therefore, these results suggest that common elements could also be regulating the
expression of desaturases in BF, but there are also other elements, for instance the cis-
acting element associated with the FADS2 mRNA expression, differentially regulating the
expression of FADS1 and FADS2 in BF. In addition, the low correlation observed
between FADS2 mRNA levels in BF and liver (r= 0.23; p-value= 1.91x10-02) suggests a
different mechanism of regulation in both tissues. This result agrees with the fact that
FADS2 is differentially-expressed between sexes depending on the tissue. Whereas in
adipose tissue the FADS2 gene is more expressed in males, in liver it is more expressed in
females (Ballester et al., 2017). Similar results have also been shown in rats, where the
mRNA expression of FADS2 is higher in the liver of females than males (Childs et al.,
2012). To find polymorphisms which may modulate FADS2 expression a search of
polymorphisms was performed by the analysis of whole genome sequence data from seven
founders of the IBMAP population with IGV (Robinson et al., 2011). Three
polymorphisms were identified at positions g9118843C>T (rs331050552), g9118813G>A
(rs321384923), and g9118721G>A (rs336076510) according the Ensembl
ENSSSCG00000013072. The most proximal 5’ mutation (g9118843C>T) was genotyped in
the BC1_LD animals and included in the eGWAS analysis.
However, no significant association was found between this mutation and the FADS2
mRNA expression. Further analyses are necessary to find new candidate cis-acting
polymorphisms implicated in the regulation of FADS2 gene-expression.
Three regions on SSC6, SSC8, and SSC10 were associated in trans with FADS2 gene-
expression. In SSC6, the Cell Division Cycle 42 (CDC42), Endothelin Converting Enzyme
1 (ECE1), Fucosidase, Alpha-L-1, Tissue (FUCA1), UDP-Galactose-4-Epimerase
(GALE), 3-Hydroxymethyl-3-Methylglutaryl-CoA Lyase (HMGCL), and Lysine
Demethylase 1A (KDM1A) candidate genes have been identified. Interestingly, the
KDM1A gene, also known as LSD1, has been recently identified as a novel regulator of
lipid metabolism as it is required for the expression of SREBF1 and for the efficient
binding of SREBF1 to the target gene promoters (Abdulla et al., 2014). Remarkably,
SREBF1 regulates the expression of desaturases (Nakamura & Nara, 2004), highlighting
the KDM1A gene as a potential candidate regulator of FADS2 gene-expression.
The most associated SNP for FADS2 trans-eQTL on SSC8 was an intronic polymorphism
(MARC0041089; p-value= 1.93x10-05; â= 0.516) in the Insulin Like Growth Factor Binding
Protein 7 (IGFBP7) gene (Table S4). This gene encodes a member of the insulin-like
Paper and Studies
141
growth factor (IGF)-binding protein and through their regulation of IGFs and insulin may
influence the metabolism of adipocytes, having implications in the development of obesity
and insulin resistance (Ruan et al., 2010).
The last region identified in trans for FADS2, was on SSC10 where the Cubilin (CUBN)
lipid-related gene was identified.
The SLC27A4 gene
The SLC27A4 (Solute Carrier Family 27 (Fatty Acid Transporter), Member 4) gene-
expression GWAS revealed three trans-eQTL on SSC9, SSC14, and SSC15. On SSC9, the
Prolylcarboxypeptidase (PRCP) gene was located. It is an important regulator of energy and
glucose homeostasis (Jeong et al., 2012). For the SSC14 trans-eQTL, no strong candidate
genes related to lipid metabolism could be detected. Finally, on SSC15, Phenylalanyl-tRNA
Synthetase Beta Subunit (FARSB) and Monoacylglycerol O-Acyltransferase 1 (MOGAT1)
lipid-related genes were also identified.
Sex effect on gene-expression in the adipose tissue
The control of FA homeostasis has been described to have a pronounced sexual
dimorphism (Grove et al., 2010). In agreement, sex differences in the control of gene-
expression have been identified in different tissues like muscle, liver, adipose tissue and
brain in mice (Yang et al., 2006; Van Nas et al., 2009). In the present work, a significant sex
effect (p-value≤ 0.05) on gene-expression levels was detected in 20 out of the 43 genes
analyzed (47%): ACSM5, AGPAT2, ANK2, ATGL, DGAT2, EGF, ELOVL5, ELOVL6,
FADS2, MGLL, MLXIPL, NFKB1, PEX2, PLA2G12A, PLPP1, PPARA, PPARD,
SCAP, SCD, and SREBF1 (Fig. 2). Overall, a higher number of genes were more expressed
in females (ACSM5, AGPAT2, ANK2, DGAT2, EGF, ELOVL5, ELOVL6, MGLL,
MLXIPL, PLA2G12A, PNPLA2, PPARA, PPARD, PEX2, SCAP, SCD, and SREBF1).
Conversely, only three genes (FADS2, NFKB1, and PLPP1) showed a higher expression in
males (Table S6). Among them, some key regulators of lipid metabolism such as PPARA,
SCD, and SREBF1 which may be determining the bias observed in the female over-
expressed genes. Remarkably, lipogenic genes such as SCD and SREBF1 were also more
expressed in females in the longissimus dorsi muscle of pigs (Puig-Oliveras et al., 2016), and in
pig liver tissue (Ballester et al., 2017). However, we observed a different pattern of
expression for PPARA; while it was more expressed in females in liver and adipose tissue,
the mRNA levels of PPARA were higher in males in muscle (Puig-Oliveras et al., 2016;

Genomic and functional genomic analysis of fatty acid composition in swine
142
Ballester et al., 2017). Finally, for ACSM5, AGPAT2, MLXIPL, EGF, ELOVL5, PEX2,
and SCAP the same female-biased gene-expression was observed than in pig liver tissue
(Ballester et al., 2017). This agree with the results observed in mice in which the analysis of
sexual dimorphism in liver, adipose, muscle, and brain revealed common functionalities of
steroid and lipid metabolism for the sexually dimorphic genes between liver and adipose
tissues. Furthermore, the overlap of sexually dimorphic genes was higher between adipose
and liver tissues (22.9%) than between adipose and muscle tissues (6.6%; Yang et al., 2006).
The highest rate of coincidence of female-biased gene expression among liver and adipose
tissue may suggest common regulatory mechanisms in both tissues.
Figure 2. Comparison between males and females of gene-expression levels of 43 lipid-related genes
in adipose tissue. Data represent means standard error of the means (SEM). Significant differences between sexes are indicated as *P≤0.05, **P≤0.01 and ***P≤0.001.
Fatty acid composition and gene-expression in the adipose tissue
To explore the relationship between gene-expression levels and FA composition
percentages in BF, a correlation analysis was performed. In general moderate correlations
were identified (Figure S2). The CD36 gene, which may function as a regulator of FA
transport (Bonen et al., 2004), showed a negative correlation with palmitoleic acid (C16:1(n-
7)) (r= -0.31; p-value= 9.04x10-04). Palmitoleic acid (C16:1(n-7)) has been identified as a
lipokine involved in the maintenance of systemic metabolic homeostasis (Cao et al., 2008).
A negative correlation between PLPP1 gene-expression and palmitic acid (C16:0) (r= -0.35;
p-value= 1.46x10-04) was found. This gene is a member of the phosphatidic acid
phosphatase (PAP) family and participates in the synthesis of glycerolipids. In addition,
PLPP1 gene-expression showed moderate correlations with the percentage of cis-7

Paper and Studies
143
hexadecenoic acid (C16:1(n-9)) (r= 0.32; p-value= 5.40x10-04) and C20:3(n-9) (r= 0.33; p-
value= 3.40x10-04).
The cis-7 hexadecenoic acid (C16:1(n-9)) also showed negative correlation (r= -0.39; p-
value= 2.05x10-05) with SCD gene-expression, which plays an important role in the
regulation of the expression of genes involucrated in lipogenesis (Sampath et al., 2007).
Furthermore, the octadecenoic acid (C18:1(n-7)) was negatively correlated with CROT (r= -
0.36; p-value= 1.02x10-04) and USF1 (r= -0.35; p-value= 1.29x10-04) gene-expressions. The
CROT gene plays a role in the pathway of FA beta-oxidation, and provides a crucial step in
the transport of medium and long-chain acyl-coA out of the mammalian peroxisome to the
mitochondria (Ramsay & Gandour, 1999). Moreover, USF1 gene is involved in the
maintenance of high levels of FA synthase transcription under lipogenic conditions (Griffin
& Sul, 2004).
Functional network analysis of genes mapping in eQTLs
To take a deep look at the regulatory mechanisms that are influencing the gene-expression
phenotypes, gene annotation of the 19 eQTLs chromosomal regions was performed. For
trans-eQTLs all the genes located within 1 Mb were selected for gene annotation.
Conversely, for cis-eQTLs only the studied candidate gene was considered for further
analyses. In the 19 eQTLs, a total of 474 protein-coding genes, 2 processed transcript, 11
miRNA, 3 miscRNA, 10 pseudogenes, 6 rRNA, 17 snoRNAs, and 21 snRNA were
annotated (Table S5). From the 474 protein-coding genes with Ensembl Gene ID, 393
have at least one human orthologous gene (Table S7) and were submitted to IPA to
perform a functional categorization.
Several networks related to lipid metabolism were identified: (i) lipid metabolism, small
molecule biochemistry, infectious diseases (score= 42; interval= 8); (ii) lipid metabolism,
small molecule biochemistry, cellular assembly and organization (score= 32; interval= 8);
(iii) carbohydrate metabolism, organ morphology, reproductive system development and
function (score= 30; interval= 3), and (iv) amino acid metabolism, carbohydrate
metabolism, molecular transport (score= 18; interval= 9) (Table S8). Interestingly, two of
the identified networks have the Akt complex as central (ID= 10 and 26; Table S8). It is
known that the PKB/Akt plays an important role in the insulin regulation of glucose
transport (Hajduch et al., 2001), and has been also identified as central in the main over-
represented pathways in a muscle transcriptome study between individuals phenotypically
extreme for IMFA composition (Puig-Oliveras et al., 2014b), in a muscle eQTL analysis of

Genomic and functional genomic analysis of fatty acid composition in swine
144
45 lipid-related genes (Puig-Oliveras et al., 2016), and in a liver eQTL analysis of 44
candidates genes related with lipid metabolism (Ballester et al., 2017). Remarkably, several
of the potential regulators annotated in trans-eQTL for FABP4 and FADS2 (BSCL2,
FADS1, FADS2, KDM1A, LGALS12, PLA2G16, PLB1, and PPP1CB) were identified
inside the Akt pathway. These findings suggest this pathway as central in the genetic
determination of FA composition traits in the BC1_LD.
Prediction analysis of transcription factor binding sites
To identify master regulators of global gene-expression in all the genes analyzed in the
present study, an in-silico identification of the TF binding sites in the promoter region of (1)
the 415 genes with human orthologous ID annotated in the trans-eQTL intervals and, (2)
the 43 candidate lipid-related genes was performed using the iRegulon Cytoscape plugin
(Janky et al., 2014). The PPARG gene was the most enriched TF motif (NES= 5.134; 167
target genes, 30 out of the 44 analyze-related genes; Table S9). This agree with the fact that
this gene is an adipogenic TF considered an important regulator of lipid and carbohydrate
metabolism (Peeters & Baes, 2010). In our analysis the mRNA expression of PPARG was
highly correlated with the mRNA expression of genes implicated in lipid transport,
lipogenesis and TG synthesis (Table S10), suggesting an important role of this TF in lipid
storage. Interestingly, this TF has been identified as a key regulator of FA composition in
the same material using a co-association network analysis (Ramayo-Caldas et al., 2014) and
in a muscle eQTL analysis of 45 lipid-related genes (Puig-Oliveras et al., 2016).
Conclusions
The expression pattern of forty-three lipid-related candidate genes was studied in the
adipose tissue of 115 Iberian x Landrace backcrossed pigs. Furthermore, the eGWAS
analysis identified the location of factors regulating the expression of these candidate genes,
increasing our knowledge of the regulatory mechanisms implicated in adipose tissue lipid
metabolism and its consequences in lipid-related traits.
Competing interest
The authors declare that they have no competing interests.

Paper and Studies
145
Author contributions
Conceptualization: JMF MB. Methodology: JMF MB. Formal analysis: MR MB APO
JMF. Investigation: MR APO DCP LCM AC. Resources: JMF AIF. Write original
draft: MR MB JMF. Writing review & editing: MB JMF. Visualization: MR MB.
Supervision: JMF. Funding acquisition: JMF AIF.
Funding
This work has been funded by the MICINN AGL2014-56369-C2. MR was funded by a
Formació i Contractació de Personal Investigador Novell (FI-DGR) PhD grant from
Generalitat de Catalunya (ECO/1639/2013). MB was financially supported by a Ramon y
Cajal contract (RYC-2013-12573) from the Spanish Ministry of Economy and
Competitiveness, APO was funded by a Personal Investigador en Formación (PIF) PhD
grant from the Universitat Autònoma de Barcelona (458-01-1/2011), DCP by a Formació i
Contractació de Personal Investigador Novell (FI-DGR) PhD grant from Generalitat de
Catalunya (ECO/1788/2014) and LCM was funded by a FPI PhD grant from the Spanish
Ministry of Economy and Competitiveness (BES-2015-075403).
Acknowledgments
We would like to thank all of the members of the INIA, IRTA, and UAB institutions who
contributed to the generation of the animal material used in this work. We acknowledge the
support of the Spanish Ministry of Economy and Competitiveness for the Centre of
Excellence Severo Ochoa 2016–2019 (SEV-2015-0533) grant awarded to the Centre for
Research in Agricultural Genomics.
References
Abdulla A, Zhang Y, Hsu FN, Xiaoli AM, Zhao X, Yang ES, et al. (2014). Regulation of
lipogenic gene expression by lysine-specific histone demethylase-1 (LSD1). The
Journal of Biological Chemistry 289(43):29937-47.
Ballester M, Cordón R, Folch JM (2013). DAG expression: high-throughput gene
expression analysis of real-time PCR data using standard curves for relative
quantification. PLoS One 8(11):e80385.
Genomic and functional genomic analysis of fatty acid composition in swine
146
Ballester M, Revilla M, Puig-Oliveras A, Marchesi JA, Castelló A, Corominas J, et al. (2016).
Analysis of the porcine APOA2 gene expression in liver, polymorphism
identification and association with fatty acid composition traits. Animal Genetics
47(5):552-9.
Ballester M, Ramayo-Caldas Y, Revilla M, Corominas J, Castelló A, Estellé J, et al. (2017).
Integration of liver gene co-expression networks and eGWAs analyses highlighted
candidate regulators implicated in lipid metabolism in pigs. Scientific Reports 7:46539.
Ballester M, Puig-Oliveras A, Castelló A, Revilla M, Fernández AI, Folch JM (2017).
Analysis of FABP4 and FABP5 gene expression affecting pig fatness. Animal
Genetics (submitted).
Bernlohr DA, Jenkins AE, Bennaars AA (2002). Chapter 10 Adipose tissue and lipid
metabolism. In New Comprehensive Biochemistry (Vol. 36, pp. 263-289). (New
Comprehensive Biochemistry; Vol. 36).
Bonen A, Campbell SE, Benton CR, Chabowski A, Coort SL, Han XX, et al. (2004)
Regulation of fatty acid transport by fatty acid translocase/CD36. The Proceedings of
the Nutrition Society 63(2):245-9.
Boutet E, El Mourabit H, Prot M, Nemani M, Khallouf E, Colard O, et al. (2009). Seipin
deficiency alters fatty acid Delta9 desaturation and lipid droplet formation in
Berardinelli-Seip congenital lipodystrophy. Biochimie 91(6):796-803.
Cao H, Gerhold K, Mayers JR, Wiest MM, Watkins SM, Hotamisligil GS (2008).
Identification of a lipokine, a lipid hormone linking adipose tissue to systemic
metabolism. Cell 134(6):933-44.
Casellas J, Noguera JL, Reixach J, Díaz I, Amills M, Quintanilla R (2010). Bayes factor
analyses of heritability for serum and muscle lipid traits in Duroc pigs. Journal of
Animal Science 88(7):2246-54.
Cheung VG, Spielman RS (2009). Genetics of human gene expression: mapping DNA
variants that influence gene expression. Nature Review Genetics 10(9):595-604.
Childs CE, Hoile SP, Burdge GC, Calder PC (2012). Changes in rat n-3 and n-6 fatty acid
composition during pregnancy are associated with progesterone concentrations and
Paper and Studies
147
hepatic FADS2 expression. Prostaglandins, Leukotrienes, and Essential Fatty Acids 86(4-
5):141-7.
Corominas J, Ramayo-Caldas Y, Puig-Oliveras A, Estellé J, Castelló A, Alves E, et al.
(2013a). Analysis of porcine adipose tissue transcriptome reveals differences in de
novo fatty acid synthesis in pigs with divergent muscle fatty acid composition. BMC
Genomics 14:843.
Corominas J, Ramayo-Caldas Y, Puig-Oliveras A, Pérez-Montarelo D, Noguera JL, Folch
JM, et al. (2013b). Polymorphism in the ELOVL6 gene is associated with a major
QTL effect on fatty acid composition in pigs. PLoS One 8(1):e53687.
Corominas J, Marchesi JA, Puig-Oliveras A, Revilla M, Estellé J, Alves E, et al. (2015):
Epigenetic regulation of the ELOVL6 gene is associated with a major QTL effect
on fatty acid composition in pigs. Genetics Selection Evolution 47:20.
Dai MH, Xia T, Zhang GD, Chen XD, Gan L, Feng SQ, et al. (2006). Cloning, expression
and chromosome localization of porcine adiponectin and adiponectin receptors
genes. Domestic Animal Endocrinology 30(2):117-25.
Du K, Herzig S, Kulkarni RN, Montminy M (2003). TRB3: a tribbles homolog that inhibits
Akt/PKB activation by insulin in liver. Science 300(5625):1574-7.
Estany J, Ros-Freixedes R, Tor M, Pena RN (2014). A functional variant in the stearoyl-
CoA desaturase gene promoter enhances fatty acid desaturation in pork. PLoS One
9(1):e86177.
Estellé J, Pérez-Enciso M, Mercadé A, Varona L, Alves E, Sánchez A, et al. (2006).
Characterization of the porcine FABP5 gene and its association with the FAT1
QTL in an Iberian by Landrace cross. Animal Genetics 37(6):589-91.
Frayn KN, Arner P, Yki-Järvinen H (2006). Fatty acid metabolism in adipose tissue, muscle
and liver in health and disease. Essays in Biochemistry 42:89-103.
Gerbens F, Jansen A, van Erp AJ, Harders F, Meuwissen TH, Rettenberger G, et al. (1998).
The adipocyte fatty acid-binding protein locus: characterization and association
with intramuscular fat content in pigs. Mammalian Genome 9(12):1022-6.

Genomic and functional genomic analysis of fatty acid composition in swine
148
Gilad Y, Rifkin SA, Pritchard JK (2008). Revealing the architecture of gene regulation: the
promise of eQTL studies. Trends in Genetics 24(8):408-15.
Griffin MJ, Sul HS (2004). Insulin regulation of fatty acid synthase gene transcription: roles
of USF and SREBP-1c. IUBMB Life 56(10):595-600.
Grove KL, Fried SK, Greenberg AS, Xiao XQ, Clegg DJ (2010). A microarray analysis of
sexual dimorphism of adipose tissues in high-fat-diet-induced obese mice.
International Journal of Obesity: Journal of the International Association for the Study of Obesity
34(6):989-1000.
Guillou H, Zadravec D, Martin PG, Jacobsson A (2010). The key roles of elongases and
desaturases in mammalian fatty acid metabolism: Insights from transgenic mi
Progress in Lipid Research 49(2):186-99.
Hajduch E, Litherland GJ, Hundal HS (2001). Protein kinase B (PKB/Akt)--a key regulator
of glucose transport? FEBS Letters 492(3):199-203.
Hastie TJ, Pregibon D (1992). Generalized linear models. Chapter 6 of Statistical Models in S.
Chambers JM, Hastie TJ (eds.). Wadsworth & Brooks/Cole, Pacific grove.
Ihaka R, Gentleman R (1996). R: A language for data analysis and graphics. Journal of
Computational and Graphical Statistics 5:299–314.
Janky R, Verfaillie A, Imrichová H, Van de Sande B, Standaert L, Christiaens V, et al.
(2014). iRegulon: from a gene list to a gene regulatory network using large motif
and track collections. PLoS Computational Biology 10(7):e1003731.
Jeong JK, Szabo G, Raso GM, Meli R, Diano S (2012). Deletion of prolyl carboxypeptidase
attenuates the metabolic effects of diet-induced obesity. American journal of physiology.
Endocrinology and Metabolism 302(12):E1502-10.
Kapushesky M, Emam I, Holloway E, Kurnosov P, Zorin A, Malone J, et al. (2010). Gene
expression atlas at the European bioinformatics institute. Nucleic Acids Research
38:D690-8.
Lee C, Huang CH (2013). LASAGNA-Search: an integrated web tool for transcription
factor binding site search and visualization. Biotechniques 54(3):141-53.

Paper and Studies
149
Liu L, Jiang Q, Wang X, Zhang Y, Lin RC, Lam SM, et al. (2014): Adipose-specific
knockout of SEIPIN/BSCL2 results in progressive lipodystrophy. Diabetes
63(7):2320-31.
Liu X, Huang T, Li L, Tang Y, Tian Y, Wang S, et al. (2015). CYP1B1 deficiency
ameliorates obesity and glucose intolerance induced by high fat diet in adult
C57BL/6J mice. American Journal of Translational Research 7(4):761-71.
Lorenzo DN, Healy JA, Hostettler J, Davis J, Yang J, Wang C, et al. (2015). Ankyrin-B
metabolic syndrome combines age-dependent adiposity with pancreatic β cell
insufficiency. The Journal of Clinical Investigation 125(8):3087-102.
Maeda K, Okubo K, Shimomura I, Mizuno K, Matsuzawa Y, Matsubara K (1997). Analysis
of an expression profile of genes in the human adipose tissue. Gene 190(2):227-35.
McLaren W, Pritchard B, Rios D, Chen Y, Flicek P, Cunningham F (2010). Deriving the
consequences of genomic variants with the Ensembl API and SNP Effect
Predictor. Bioinformatics 26(16):2069-70.
Mercadé A, Estellé J, Noguera JL, Folch JM, Varona L, Silió L, et al. (2005). On growth,
fatness, and form: a further look at porcine chromosome 4 in an Iberian x Landrace
cross. Mammalian Genome 16(5):374-82.
Mercadé A, Pérez-Enciso M, Varona L, Alves E, Noguera JL, Sánchez A, et al. (2006).
Adipocyte fatty-acid binding protein is closely associated to the porcine FAT1 locus
on chromosome 4. Journal of Animal Science 84(11):2907-13.
Muñoz M, Rodríguez MC, Alves E, Folch JM, Ibañez-Escriche N, Silió L, et al. (2013).
Genome-wide analysis of porcine backfat and intramuscular fat fatty acid
composition using high-density genotyping and expression data. BMC Genomics
14:845.
Nakamura MT, Nara TY (2004). Structure, function, and dietary regulation of delta6,
delta5, and delta9 desaturases. Annual Review of Nutrition 24:345-76.
OECD/FAO (2016), “OECD-FAO Agricultural Outlook”, OECD Agriculture statistics
(database).
Genomic and functional genomic analysis of fatty acid composition in swine
150
Ojeda A, Rozas J, Folch JM, Pérez-Enciso M (2006). Unexpected high polymorphism at
the FABP4 gene unveils a complex history for pig populations. Genetics
174(4):2119-27.
Peeters A, Baes M (2010). Role of PPARα in Hepatic Carbohydrate Metabolism. PPAR
Research pii:572405.
Pérez-Enciso M, Clop A, Noguera JL, Ovilo C, Coll A, Folch JM, et al. (2000). A QTL on
pig chromosome 4 affects fatty acid metabolism: evidence from an Iberian by
Landrace intercross. Journal of Animal Science 78(10):2525-31.
Pérez-Enciso M, Misztal I (2011). Qxpak.5: old mixed model solutions for new genomics
problems. BMC Bioinformatics 12:202.
Puig-Oliveras A, Ballester M, Corominas J, Revilla M, Estellé J, Fernández AI, et al.
(2014a). A co-association network analysis of the genetic determination of pig
conformation, growth and fatness. PLoS One 9(12):e114862.
Puig-Oliveras A, Ramayo-Caldas Y, Corominas J, Estellé J, Pérez-Montarelo D, Hudson
NJ, et al. (2014b). Differences in muscle transcriptome among pigs phenotypically
extreme for fatty acid composition. PLoS One 9(6):e99720.
Puig-Oliveras A, Revilla M, Castelló A, Fernández AI, Folch JM, Ballester M (2016).
Expression-based GWAS identifies variants, gene interactions and key regulators
affecting intramuscular fatty acid content and composition in porcine meat. Scientific
Reports 6:31803.
Purcell S, Neale B, Todd-Brown K, Thomas L, Ferreira MA, Bender D, et al. (2007).
PLINK: a tool set for whole-genome association and population-based linkage
analyses. American Journal of Human Genetics 81(3):559-75.
Qi RL, Chen Y, Huang JX, Yang FY (2015). Effects of conjugated linoleic acid on the
expression levels of miR-27 and miR-143 in pig adipose tissue. Genetics and Molecular
Research 14(2):6985-92.
Ramayo-Caldas Y, Mercadé A, Castelló A, Yang B, Rodríguez C, Alves E, et al. (2012).
Genome-wide association study for intramuscular fatty acid composition in an
Iberian × Landrace cross. Journal of Animal Science 90(9):2883-93.

Paper and Studies
151
Ramayo-Caldas Y, Ballester M, Fortes MR, Esteve-Codina A, Castelló A, Noguera JL, et al.
(2014): From SNP co-association to RNA co-expression: novel insights into gene
networks for intramuscular fatty acid composition in porcine. BMC Genomics
15:232.
Ramos AM, Crooijmans RP, Affara NA, Amaral AJ, Archibald AL, Beever JE, et al. (2009).
Design of a high density SNP genotyping assay in the pig using SNPs identified and
characterized by next generation sequencing technology. PLoS One 4(8):e6524.
Ramsay RR, Gandour RD (1999). Selective modulation of carnitine long-chain
acyltransferase activities. Kinetics, inhibitors, and active sites of COT and CPT-II.
Advances in Experimental Medicine and Biology 466:103-9.
Rankin EB, Rha J, Selak MA, Unger TL, Keith B, Liu Q, et al. (2009). Hypoxia-inducible
factor 2 regulates hepatic lipid metabolism. Molecular and Cellular Biology 29(16):4527-
38.
Robinson JT, Thorvaldsdóttir H, Winckler W, Guttman M, Lander ES, Getz G, et al.
(2011) Integrative genomics viewer. Nature Biotechnology 29(1):24-6.
Robinson MR, Wray NR, Visscher PM (2014). Explaining additional genetic variation in
complex traits. Trends in Genetics 30(4):124-32.
Rozen S, Skaletsky H (2000). Primer3 on the WWW for general users and for biologist
programmers. Methods in Molecular Biology 132:365-86.
Ruan W, Lai M (2010). Insulin-like growth factor binding protein: a possible marker for the
metabolic syndrome? Acta diabetologica 47(1):5-14.
Sambrook J, Fritsch EE, Maniatis T (1989). Molecular Cloning:A Laboratory Manual. 2nd
Ed. Cold Spring Harbor Laboratory Press; pp. E3-E4.
Sampath H, Miyazaki M, Dobrzyn A, Ntambi JM (2007). Stearoyl-CoA desaturase-1
mediates the pro-lipogenic effects of dietary saturated fat. The Journal of Biological
Chemistry 282(4):2483-93.
Satish L, Krill-Burger JM, Gallo PH, Etages SD, Liu F, Philips BJ, et al. (2015). Expression
analysis of human adipose-derived stem cells during in vitro differentiation to an
adipocyte lineage. BMC Medical Genomics 8:41.
Genomic and functional genomic analysis of fatty acid composition in swine
152
Schadt EE, Molony C, Chudin E, Hao K, Yang X, Lum PY, et al. (2008): Mapping the
genetic architecture of gene expression in human liver. PLoS Biology 6(5):e107.
Shehzad A, Iqbal W, Shehzad O, Lee YS (2012). Adiponectin: regulation of its production
and its role in human diseases. Hormones (Athens) 11(1):8-20.
Storey JD, Tibshirani R (2003). Statistical significance for genomewide studies. Proceedings of
the National Academy of Sciences of the United States of America 100:9440–9445.
Szanto A, Balint BL, Nagy ZS, Barta E, Dezso B, Pap A, et al. (2010). STAT6 transcription
factor is a facilitator of the nuclear receptor PPARγ-regulated gene expression in
macrophages and dendritic cells. Immunity 33(5):699-712.
Tong L, Harwood HJ Jr (2006). Acetyl-coenzyme A carboxylases: versatile targets for drug
discovery. Journal of Cellular Biochemistry 99(6):1476-88.
Van Nas A, Guhathakurta D, Wang SS, Yehya N, Horvath S, Zhang B, et al. (2009).
Elucidating the role of gonadal hormones in sexually dimorphic gene coexpression
networks. Endocrinology 150(3):1235-49.
Wang XL, Suzuki R, Lee K, Tran T, Gunton JE, Saha AK, et al. (2009). Ablation of
ARNT/HIF1beta in liver alters gluconeogenesis, lipogenic gene expression, and
serum ketones. Cell Metabolism 9(5):428-39.
Wong N, Wang X (2015) miRDB: an online resource for microRNA target prediction and
functional annotations. Nucleic Acids Research 43(Database issue):D146-52.
Wood JD, Nute GR, Richardson RI, Whittington FM, Southwood O, Plastow G, et al.
(2004). Effects of breed, diet and muscle on fat deposition and eating quality in
pigs. Meat Science 67(4):651-667.
Wood JD, Enser M, Fisher AV, Nute GR, Sheard PR, Richardson RI, et al. (2008). Fat
deposition, fatty acid composition and meat quality: A review. Meat Science
78(4):343-358.
Xiong S, Tu H, Kollareddy M, Pant V, Li Q, Zhang Y, et al. (2014). Pla2g16 phospholipase
mediates gain-of-function activities of mutant p53. Proceedings of the National Academy
of Sciences of the United States of America 111(30):11145-50.
Paper and Studies
153
Yamamoto Y, Takahashi K (1993). Glutathione peroxidase isolated from plasma reduces
phospholipid hydroperoxides. Archives of Biochemistry and Biophysics 305(2):541-5.
Yang B, Zhang W, Zhang Z, Fan Y, Xie X, Ai H, et al. (2013). Genome-wide association
analyses for fatty acid composition in porcine muscle and abdominal fat tissues.
PLoS One 8(6):e65554.
Yang RY, Yu L, Graham JL, Hsu DK, Lloyd KC, Havel PJ, et al. (2011). Ablation of a
galectin preferentially expressed in adipocytes increases lipolysis, reduces adiposity,
and improves insulin sensitivity in mice. Proceedings of the National Academy of Sciences
of the United States of America 108(46):18696-701.
Yang X, Schadt EE, Wang S, Wang H, Arnold AP, Ingram-Drake L, et al. (2006). Tissue-
specific expression and regulation of sexually dimorphic genes in mice. Genome
Research 16(8):995-1004.
Zhang W, Zhang J, Cui L, Ma J, Chen C, Ai H, et al. (2016a). Genetic architecture of fatty
acid composition in the longissimus dorsi muscle revealed by genome-wide
association studies on diverse pig populations. Genetics Selection Evolution 48:5.
Zhang W, Bin Yang, Zhang J, Cui L, Ma J, Chen C, et al. (2016b). Genome-wide
association studies for fatty acid metabolic traits in five divergent pig populations.
Scientific Reports 6:24718.
Supporting Information
Additional file 1: Figure S1. Associations of SNPs from SSC8 and ELOVL6
polymorphisms for ELOVL6 gene-expression in backfat. The X-axis represents
positions of SSC8 in Mb relative to Sscrofa10.2 assembly of the pig genome and the Y-axis
shows the –log10 (p-value). Horizontal dashed lines indicate the chromosome significance
level.
Additional file 2: Figure S2. Clustered heat map to visualize correlations among
gene-expression levels (NQ) of the 43 genes and fatty content in adipose tissue.
Color legend was adjusted to minimal and maximal values to differentiate the differences.
Additional file 1: Table S1. Primers used for the characterization of the 3’UTR of porcine
FABP4 gene.

Genomic and functional genomic analysis of fatty acid composition in swine
154
Additional file 2: Table S2. Primers used for the analyses of gene-expression of the 48
genes by real-time PCR.
Additional file 3: Table S3. List of 44 lipid-related genes selected to study their expression
in the present study. The overlapping between categories is labelled by colors.
Additional file 4: Table S4. Description of the 193 significant expression-associated SNPs
(eSNPs).
Additional file 5: Table S5. Gene annotation of genes within the eQTL intervals.
Annotation was performed by considering for trans-eQTLs the eQTL interval ±1 Mb;
whereas for cis-eQTLs only the studied gene was selected (ACSM5, FABP4, and FADS2).
Additional file 6: Table S6. Mean comparison between males and females of backfat
gene-expression levels of 43 lipid-related genes.
Additional file 7: Table S7. Description of the 393 human orthologous genes.
Additional file 8: Table S8. Top functional networks and molecules identified with IPA
from the list of annotated genes mapping within the 19 eQTLs.
Additional file 9: Table S9. Transcription factor binding sites for the PPARG gene.
Additional file 10: Table S10. Correlations of PPARG mRNA expression and analyze-
related genes.

General Discussion
Chapter 4

General Discussion
157
Consumers concerns and demands have arisen as important factors determining the
amount and quality of pork production, as well as the market price conditions and costs. In
order to achieve success in the domestic and foreign market, producers and distributors
should be aware of the consumer behaviour, and have a good command of efficient
methods to influence consumers to gain benefit. In the last decades, the consumer demand
for high quality pork products has grown fast due to increased consumer interest in aspects
related to nutritional quality and food health in general (Grunert 2005). In recent years, the
concept of food quality has received a lot of attention from food producers and retailers as
well as from public authorities and health educators (Brunsø et al., 2004). For the European
food industry, quality is a key factor because the high quality of a product is the basis for
success in this highly competitive market (Du & Sun 2006). Following Henson (2000), the
translation of the quality perceptions of consumers into physical product and process
attributes requires knowledge and understanding of the overall quality evaluation of
consumers. For example, meat should be safe, healthy, and it should taste good (Verbeke &
Viaene 1999).
The four primary measurements of meat quality that have been identified as key traits to
consider in evaluation of muscle quality are color, ultimate pH, water-holding capacity, and
IMF. These traits are important because they are related to attractiveness, palatability, and
product loss during processing, storage and cooking, and therefore, account for a large
portion of the economic loss associated with poor quality pork meat. Pig breeding
programs aim to improve pigs for these important traits. Carcass quality has been
successfully improved in most selection programs because phenotypes are easy to obtain
on live animals via ultrasonic measurements of backfat and because these traits show a
relatively high heritability. Conversely, meat quality has not been the priority in most
selection programs (De Vries et al., 1992; Hovenier et al., 1993; Sellier 1998; Knap et al.,
2002) because those traits can only be measured on the relatives of selection candidates and
late in life. Successful improvement of meat quality may be possible by combining
molecular information and traditional measurements because marker data can be obtained
on all animals at an early age (Heuven et al., 2003).
In the last decades, important advances in the characterization of QTLs affecting these
traits have been achieved. Furthermore, new genomics tools like high-density SNP chips
and NGS technologies have allowed researchers to improve knowledge of the biological

Genomic and functional genomic analysis of fatty acid composition in swine
158
mechanisms implicated in lipid-related traits providing new insights for the identification of
causal genes and mutations.
Herewith, this PhD thesis uses different molecular genetic technologies with the aim to
provide additional insight into the genetic basis of meat quality traits in pigs. Different
genomic tools are used to increase the knowledge of the biological processes involved in
lipid metabolism, to identify gene networks and candidate genes associate with FA
composition, and to find genetic variants that can determine meat quality traits.
4.1. Global analysis of CNVs in the pig genome
Differences in the number of copies of segments of DNA between different individuals
(known as CNVs) are a wide source of genetic variation in many different organisms. In
humans, CNVs play a significant role in the development of complex traits. Similarly, in
livestock, more and more studies evidence that CNVs may play causative effects on
phenotypic variations.
Published results for detection of CNVs in pigs have commonly used two methods of
detection: aCGH (Fadista et al., 2008; Li et al., 2012b; Wang et al., 2014a) and SNP array,
performed both with (Ramayo-Caldas et al., 2010; Chen et al., 2012; Wiedmann et al., 2015)
and without (Wang et al., 2012b, 2013b,c, 2014b; Schiavo et al., 2014; Dong et al., 2015)
pedigree information.
Over the last few years, NGS has been used to the comprehensive characterization of
CNVs by generating hundreds of millions of short reads in a single run (Metzker 2010).
The advantages of NGS approach for CNV identification include higher coverage and
resolution, more precise detection of breakpoints, and higher capability to identify novel
CNVs (Alkan et al., 2011; Snijders et al., 2001). However, there are some important
limitations and challenges (Xi et al., 2010; Teo et al., 2012): 1) high sequencing error rate of
NGS platforms, especially at the first one or two positions and increasing exponentially
near the end of the read, which cause a substantial loss of reads during alignment (Dohm et
al., 2008), 2) given the short length of the sequenced bases, many reads do not map
uniquely to the genome, 3) certain regions of the genomes are represented at a higher rate
than others due to the GC bias in sequencing steps (Dohm et al., 2008) and amplification
errors (if used). Recently published studies used high-throughput sequencing to detect
CNVs in pigs (Rubin et al., 2012; Paudel et al., 2013; Jiang et al., 2014; Wang et al., 2015a,b).

General Discussion
159
Fernández et al. (2014) used the SNP array method on 217 highly inbred Iberian pigs and
the high-throughput sequencing on four of these pigs for validation.
These studies have provided thousands of pig CNVs with a much more refined resolution.
However, the impact of CNVs on pig phenotypes is still relatively unknown. To date, a
well-characterized example of a trait determined by a CNV in pigs is a copy number gain of
the KIT gene that causes the dominant white phenotype (Giuffra et al., 2002). Related to fat
content and FA composition, Schiavo et al. (2014) identified CNVs in Italian Large White
pigs using the PorcineSNP60 BeadChip, and tested them for association with backfat
thickness. Their results indicated that CNVs might have a limited impact in determining fat
deposition in this breed, but a larger number of animals would be required to reach
sufficient power with these low-frequency markers. One year later, Wang et al. (2015b)
performed a GWAS between CNVs and meat quality traits in swine and eight CNVs were
significantly associated with at least one meat quality trait, and six of them were verified by
qPCR. These results suggest that CNVs may contribute to the genetic variation of meat
quality traits.
In this thesis, we performed a genomic analysis of porcine CNVs based on NGS data to
identify CNVs segregating in the IBMAP cross and studied their association with some
economically important traits related to FA composition and growth-related traits.
We have identified 1,279 CNVs, merging in 540 CNV regions (CNVRs). Although CNVRs
were found on all autosomal chromosomes, the number and the total size of CNVRs per
chromosome were not correlated with chromosome length, which is consistent with
previous studies related to CNVRs in the porcine genome (Paudel et al., 2013, 2015). There
are numerous software tools available that employ very different algorithms for the
identification of CNVs from NGS data. A comparative analysis of several of these has
been detailed in Duan et al. (2013), providing guidelines to choose the most appropriate
method according to the specific data set and requirements. From the tested CNV
detection methods, readDepth (Miller et al., 2011), CNVnator (Abyzov et al., 2011) and
EWT (Yoon et al., 2009) achieve better break point estimation. If a high true positive rate
(equivalent to sensitivity) is preferable, Control-FREEC (Boeva et al., 2011, 2012), SegSeq
(Chiang et al., 2009) and EWT are better choices. In contrast, if the computation
speed/memory usage is a priority, EWT or Control-FREEC should be taken in
consideration. Furthermore, CNVnator, readDepth and CNV-seq (Xie & Tammi 2009)
provide better copy number estimation compared with the rest. However, we selected the
Genomic and functional genomic analysis of fatty acid composition in swine
160
Control-FREEC software because it uses GC-content to normalize read counts and lower
mappability regions can be excluded from the analysis.
The quality of CNVRs calls was assessed by a comparison against a previously reported
porcine CNV dataset identified in the IBMAP population with the PorcineSNP60 BeadChip
(Ramayo-Caldas et al., 2010), showing an overlapping of 65%. In addition, in the
comparison with the work published by Fernández et al. (2014) using 217 Iberian pigs,
seven CNVRs were identified. Different factors may limit the identification of CNVs in
these studies, including marker density, non-uniform distribution of SNPs along pig
chromosomes, and/or a lack of specially designed non-polymorphic probes that is
necessary to identify CNVR with higher resolution (Ramos et al., 2009). Furthermore, the
calling algorithms to detect CNVs and the different pig assemblies used may explain the
discrepancy between works. Here, the method based on NGS, resulted in a higher
resolution to call CNVRs. Thus, most of the CNVRs discovered in this study are novel
relative to the previous studies.
Gene annotation and functional analysis were performed for the 540 CNVRs and 245
genes were identified. Six genes were selected as potential candidate genes related to
growth and FA composition traits (CLCA4, CYP4X1, GPAT2, MOGAT2, PLA2G2A,
and PRKG1) for qPCR validation of the variation in the number of copies in three different
backcrosses. However, CNVRs in the CYP4X1 did not present variation in the three
backcrosses and PLA2G2A was not validated in the BC1_LD. Several factors may account
for the discrepancy: 1) polymorphisms such as SNPs and indels may influence the
hybridization of the qPCR primers, changing the relative quantification values for some
animals; 2) the true CNVR boundaries may be polymorphic among the analyzed animals.
The four CNVRs validated by qPCR in the BC1_LD (CLCA4, GPAT2, MOGAT2, and
PRKG1) were further analyzed in 150 BC1_LD animals and association analysis was
performed for growth and meat quality traits. Statistically significant associations were
obtained for CNVR112 (GPAT2). The strongest signal was observed for the C18:2(n-
6)/C18:3(n-3) ratio, and cis-vaccenic acid ((C18:1(n-7)) for the FA composition in backfat.
For FA percentages in IMF, the strongest signal was detected for oleic acid (C18:1(n-9)),
the global percentage of MUFA, peroxidability index, dihomo gamma linolenic acid
(C20:3(n-6)), the global percentage of PUFA, eicosatrienoic acid (C20:3(n-3)) and the ratio
of MUFA/PUFA. In the case of growth traits, only the carcass length showed statistically
significant association. These results agree with the role of this gene in phospholipid and
General Discussion
161
triacylglycerol biosynthesis (Dircks & Sul 1997). The glycerol-3-phosphate acyltransferase
(GPAT) catalyze the acylation of glycerol-3-phosphate, which is involved in the beginning
of de novo synthesis of glycerolipids. The lysophosphatidic acid, the product of GPAT, is
subsequently acylated to phosphatidic acid (PA) by 1-acylglycerol-3-phospate
acyltransferase (AGPAT). This PA is the precursor for the synthesis of triacylglycerol and
glycerophospholipids. Furthermore, it has been shown that GPAT2 gene specifically
incorporates arachidonic acid to triacylglycerol (Cattaneo et al., 2012), remarking the
importance of this gene in lipid metabolism. These results suggest the interest of
CNVR112 (GPAT2) in the genetic determination of IMF and backfat FA composition
traits underlining the influence of CNVs in economic important traits in pigs. Further
studies are required for the functional validation of the CNVR122, including the analysis of
the correlation between the number of copies and the mRNA expression of the GPAT2
gene.
4.2. From QTL to positional candidate genes for fatty acid composition
For many of the economically relevant traits in pigs major QTLs have been identified in
experimental crosses or commercial populations. However, the identification of the causal
genes of QTLs and their allelic variation has proven to be difficult for complex traits.
Genetic markers located in QTLs are not necessarily useful in breeding schemes due to the
incomplete LD between the marker and the causal mutation. Furthermore, markers may
not segregate in a different population and/or the LD with the causal mutation may be
different, making difficult to translate to the actual breeding population. Therefore, the
identification of the causal polymorphism(s) underlying the QTL is relevant for its
application in animal breeding and crucial to understand the phenotypic variation observed.
Advances in genomics provided new tools for the identification of causal polymorphisms
of meat quality traits. An example, is the study of SSC8 in the IBMAP population for the
palmitic (C16:0) and palmitoleic (C16:1(n-7)) FA composition in muscle and backfat. In
this regard, Clop et al. (2003) performed the first report of a genome scan detection of
QTLs directly affecting FA composition in pigs using the IBMAP cross (Pérez-Enciso et
al., 2000). Several regions on SSC4, SSC6, SSC8, SSC10, and SSC12 showed highly
significant effects. From these regions, only SSC8, SSC10, and SSC12 were associated to
FA composition independently of the covariate (carcass weight or backfat) that was used in
the model. Years later, Estellé et al. (2009a) analyzed the Fatty acid binding protein 2
Genomic and functional genomic analysis of fatty acid composition in swine
162
(FABP2) gene as a candidate for the FA composition QTL previously described on SSC8
(86 cM). Although the analyzed polymorphism (FABP2:g.412T>C) in FABP2 was not
associated with FA composition traits, the addition of microsatellites to the pedigree
allowed to define a marker interval as the most likely QTL position, facilitating the future
study of other candidate genes for this QTL. In this sense, the same year the microsomal
triglyceride transfer protein (MTTP) gene was also tested as a positional candidate gene for
this QTL on SSC8 (Estellé et al., 2009b). In this case, the polymorphism analyzed
(p.Phe840Leu) showed a strong association with FA composition of porcine fat, much
stronger than the QTL effect. Later, Ramayo-Caldas et al. (2012b) using information from
PorcineSNP60 BeadChip identified five genomic regions associated with intramuscular FA
composition and indices of FA metabolism on SSC8 in the BC1_LD population.
Remarkably, a strong association signal was found (92.1-96.7 Mb) with palmitic acid
(C16:0), palmitoleic acid (C16:1(n-7)), SFA, and C16:1(n-7)/C16:0 and C18:1(n-
7)/C16:1(n-7) ratios (Ramayo-Caldas et al., 2012b). Furthermore, a positional concordance
was observed between this region and QTL for palmitic (C16:0) and palmitoleic (C16:1(n-
7)) acids reported in backfat in the IBMAP F2 intercross (Clop et al., 2003). In addition,
Muñoz et al., (2013) using a linkage QTL scan as well as GWAS revealed on SSC8
significant pleiotropic regions with effects on palmitic (C16:0) (QTL scan: 87 cM; GWAS:
83.8-130.6 Mb) and palmitoleic (C16:1(n-7)) (QTL scan: 90 cM; GWAS: 99.3-99.5 Mb and
110.9-126.9 Mb) FAs in backfat and muscle of BC1_LD animals.
With the aim to reduce the confidence interval of the SSC8 QTL for the intramuscular
profile of palmitic (C16:0) and palmitoleic (C16:1(n-7)) acids in the BC1_LD, Corominas et
al. (2013b) used a combination of haplotype-based approach and GWAS. The combined
LD and linkage analysis (LDLA) method has the advantage of the high-resolution of LD
mapping and the robustness to spurious associations of linkage mapping (Meuwissen &
Goddard 2004). The GWAS profile was maximized at 119.7-119.9 Mb, and the profile
from the haplotype-based analysis showed the association signal at 117.8-119.9 Mb for
palmitic acid (C16:0). In the case of palmitoleic acid (C16:1(n-7)) the profile differs, being
119.9-120.1 Mb for the GWAS and 117.8-119.7 Mb for the haplotype-based analysis.
According to the fine mapping data, Corominas et al. (2013b) suggested that ELOVL6
gene is a potential positional causal gene for this QTL and underline the ELOVL6:c.-
533C>T polymorphism as a potential mutation to explain the variation of palmitic (C16:0)
and palmitoleic (C16:1(n-7)) FAs in longissimus dorsi muscle and adipose tissue. Later on, a
new polymorphism in the ELOVL6 promoter region (ELOVL6:c.-394G>A), in full LD
General Discussion
163
with ELOVL6:c.-533C>T, was associated with the methylation levels of the ELOVL6
promoter and the ELOVL6 expression (Corominas et al., 2015), suggesting this
polymorphism as the causal mutation for the QTL on SSC8 affecting palmitic (C16:0) and
palmitoleic (C16:1(n-7)) acids (Corominas et al., 2015).
In order to further study the QTL architecture for backfat FA composition on SSC8 and to
identify additional positional candidate genes, in this PhD thesis we analyzed the F2
generation of the IBMAP cross using a panel of 144 informative SNPs distributed along
SSC8, mostly derived from the PorcineSNP60 BeadChip. Here, a combination of single-
marker association and the haplotype-based approach allowed the identification of
statistically significant associations for myristic acid (C14:0), palmitic acid (C16:0), stearic
acid (C18:0), palmitoleic acid (C16:1(n-7)), oleic acid (C18:1(n-9)), eicosadienoic acid
(C20:2(n-6)), average chain length, and C16:1(n-7)/C16:0, C18:0/C16:0, C18:1(n-
7)/C16:1(n-7) and C20:2(n-6)/C18:2(n-6) ratios. Two regions that contain trait-associated
SNPs (TAS) were clearly visualized at around 93 Mb and 119 Mb for all the above-
mentioned FA and indices with the exception of the C20:2(n-6)/C18:2(n-6) ratio. In order
to determine whether one or two QTLs were segregating on SSC8, model fitting one QTL
against a model considering two different QTLs were tested. Results of the test indicated
that the model with two QTLs was the most likely to explain the traits analyzed, with the
119 Mb region showing the strongest statistical signal for all traits. These results agree with
Clop et al. (2003), who identified a high effect of SSC8 markers for palmitic acid (C16:0),
palmitoleic acid (C16:1(n-7)) and average chain length.
However, the use of a panel of informative SNPs on SSC8 allowed the reduction of the
confidence interval of the QTLs. Furthermore, these results were also in agreement with
those reported by Ramayo-Caldas et al. (2012b), which identified a strong association signal
covering the 92.1-96.7 Mb region for palmitic acid (C16:0), palmitoleic acid (C16:1(n-7)),
SFA, and C16:1(n-7)/C16:0 and C18:1(n-7)/C16:1(n-7) ratios. For the palmitic acid
(C16:0), a strong association signal was also identified at 103.8-107.5 Mb. The difference of
the confidence intervals for these traits between the study reported by Ramayo-Caldas et al.
(2012b) and the obtained here could be explained by the use of different pig assemblies,
Sscrofa9 and Sscrofa10.2, respectively. The positional concordance between the QTLs
detected in muscle (Ramayo-Caldas et al., 2012b) and adipose tissue, suggest a pleiotropic
effect on both tissues.

Genomic and functional genomic analysis of fatty acid composition in swine
164
A work of Zhang et al. (2016b) identified also in the 119 Mb region (119.4-129.6 Mb)
associations with C16:0/C14:0, C18:0/C16:0, and C18:1(n-9)/C16:1(n-7) ratios measured
on longissimus dorsi muscle and abdominal fat samples of White Duroc x Erhualian F2 pigs.
The same authors, in a meta-analysis of five different pig populations, detected associations
in the 119.72 Mb for C16:1(n-7)/C16:0 and C18:1(n-9)/C16:1(n-7) ratios. These results
overlap with the described in our work, and reflect the importance of the 119 Mb region
on SSC8. GWAS on metabolic ratios can increase the power of detection of the association
in comparison to individual metabolites. This hypothesis is based on the assumption that
two metabolites are product of an enzyme reaction; hence, the ratios between their
concentrations are representative of the enzymatic reaction rate (Petersen et al., 2012). This
assumption is not valid in our study, where higher significant associations were identified
for the individual metabolites than the ratios of them. One explanation of this discrepancy
could be that animals who consume a higher amount of a certain nutrient also exhibit
higher levels of its biochemical break-down products, and therefore affect the product of
the enzymatic reaction.
Gene annotation of the first TAS region allowed the identification of the mastermind-like 3
(MAML3) (at position 92.67 Mb) and SET domain containing lysine methyltransferase 7
(SETD7) (at position 93.13 Mb) genes. Both genes were reported in a predicted co-
association gene network of intramuscular FA composition in pigs (Ramayo-Caldas et al.,
2014). Several polymorphisms related to SETD7 and MAML3 genes were genotyped, but
the association studies showed that the genotyped polymorphisms were not the strongest
signals for backfat FA composition. Conversely, the strongest signals were located within 2
Mb interval of the SETD7 and MAML3 genes, suggesting than other variants of these
genes or other genes in this region may be determining these traits. Some factors limiting
the results obtained in this analysis may be the strong linkage in the F2 animals and the
incomplete annotation of pig genome assembly on SSC8.
In the second region, the ELOVL6 gene was identified at position 120.12 Mb and the
ELOVL6:c.-533C>T polymorphism showed the highest association. These results are
consistent with those found by Corominas et al. (2013b), evidencing that SSC8 is clearly
associated with FA composition, with at least two QTLs related with palmitic (C16:0) and
palmitoleic acid (C16:1(n-7)) content. The majority of FAs in a cell have a length of C16 to
C18 carbon atoms, but the end product of FAS is palmitic acid (C16:0). Palmitic (C16:0)
and palmitoleic (C16:1(n-7)) FAs can be further elongated by ELOVL6 to stearic (C18:0)

General Discussion
165
and vaccenic FAs (C18:1(n-7)), respectively. Thus, ELOVL6 has a pivotal role in the
elongation of SFA and MUFA long chain FAs and furthermore, the results suggest
ELOVL6 as a potential causal gene for the QTL at 119 Mb.
In addition, Ballester et al. (2017) identified two hotspots on SSC8 (86.66-88.13 Mb and
116.2-124.0 Mb) affecting the expression of many lipid-related genes in liver. Taken
together, these findings suggest a possible direct role of genes expressed in liver in the lipid
metabolism, indicating the complex genetic basis of these traits.
In summary, several studies performed in our group have identified QTLs related with FA
composition traits on SSC8 (Table 4.1) in the IBMAP population. The presented results
identified two regions clearly associated with FA composition measured in backfat. The
positional concordance observed in this study and the previously reported, regarding the
QTL affecting palmitic (C16:0) and palmitoleic (C16:1(n-7)) acid, suggest a pleiotropic
effect of these QTLs in backfat and muscle tissues.

Genomic and functional genomic analysis of fatty acid composition in swine
166
Table 4.1. Summary of QTLs on SSC8 identified in the IBMAP population.
Reference Tissue Approach QTL trait QTL position Gene
Clop et al., 2003
Backfat QTL scan
C16:0
86 cM ---- C16:1(n-7)
ACL
Estellé et al., 2009a
Backfat QTL scan
C16:0 88 cM
FABP2 C16:1(n-7) 96 cM
ACL 95 cM
Estellé et al., 2009b
Backfat QTL scan
C16:0 111.5 cM
MTTP C16:1(n-9) 82 cM
C18:1(n-9) 110 cM
C20:1(n-9) 111.5 cM
Ramayo-Caldas et al., 2012b
Muscle* GWAS1
SFA 10.6-13.7 Mb ----
UI
C16:0 68.6-71.9 Mb ----
SFA
C16:1(n-7) 77.6-80.3 Mb ----
C18:1(n-7)/C16:1(n-7)
C16:0
92.1-96.7 Mb ----
C16:1(n-7)
SFA
C16:1(n-7)/C16:0
C18:1(n-7)/C16:1(n-7)
C16:0 103.8-107.5 Mb ----
Corominas et al. 2013b
Backfat Muscle*
GWAS2 & LDLA
C16:0 117.8-119.9 Mb ELOVL6
C16:1(n-7) 117.8-119.7 Mb
Muñoz et al., 2013
Backfat Muscle*
QTL Scan C16:0 87 cM
---- C16:1(n-7) 90 cM
Backfat Muscle*
GWAS2 C16:0 83.8-130.6 Mb
---- C16:1(n-7)
99.3-99.5 Mb 110.9-126.9 Mb
Revilla et al., 2014
Backfat GWAS2 &
LDLA
C16:1(n-7)
93 Mb MAML3 SETD7
C18:0/C16:0
C18:1(n-7)/C16:1(n-7)
C16:1(n-7)
119 Mb ELOVL6 C18:0/C16:0
C18:1(n-7)/C16:1(n-7) *The muscle analyzed corresponds to Longissimus dorsi. 1Sus scrofa assembly 9. 2Sus scrofa assembly 10.2.
4.3. Gene-expression and regulation of candidate genes for fatty acid metabolism
Transcript abundances of genes may be directly modified by polymorphisms in regulatory
elements. Consequently, transcript abundances are treated as quantitative traits and can be
mapped to genomic regions called eQTL (Schadt et al., 2003; Morley et al., 2004). The
combination of whole genome genetic association studies and the measurement of global
gene-expression allow the systematic identification of eQTLs. For genomic regions
previously associated with complex traits, genome-wide eQTL mapping data can be
examined to see if the same genetic markers are associated with quantitative transcript
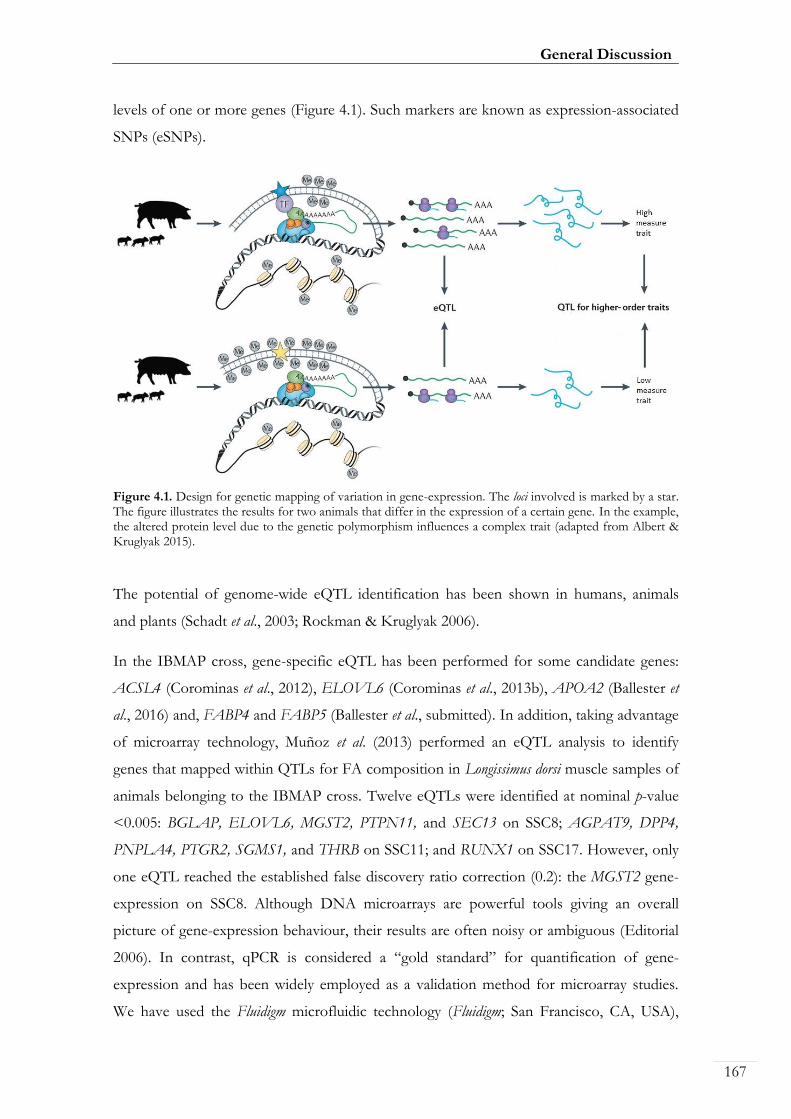
General Discussion
167
levels of one or more genes (Figure 4.1). Such markers are known as expression-associated
SNPs (eSNPs).
Figure 4.1. Design for genetic mapping of variation in gene-expression. The loci involved is marked by a star. The figure illustrates the results for two animals that differ in the expression of a certain gene. In the example, the altered protein level due to the genetic polymorphism influences a complex trait (adapted from Albert & Kruglyak 2015).
The potential of genome-wide eQTL identification has been shown in humans, animals
and plants (Schadt et al., 2003; Rockman & Kruglyak 2006).
In the IBMAP cross, gene-specific eQTL has been performed for some candidate genes:
ACSL4 (Corominas et al., 2012), ELOVL6 (Corominas et al., 2013b), APOA2 (Ballester et
al., 2016) and, FABP4 and FABP5 (Ballester et al., submitted). In addition, taking advantage
of microarray technology, Muñoz et al. (2013) performed an eQTL analysis to identify
genes that mapped within QTLs for FA composition in Longissimus dorsi muscle samples of
animals belonging to the IBMAP cross. Twelve eQTLs were identified at nominal p-value
<0.005: BGLAP, ELOVL6, MGST2, PTPN11, and SEC13 on SSC8; AGPAT9, DPP4,
PNPLA4, PTGR2, SGMS1, and THRB on SSC11; and RUNX1 on SSC17. However, only
one eQTL reached the established false discovery ratio correction (0.2): the MGST2 gene-
expression on SSC8. Although DNA microarrays are powerful tools giving an overall
picture of gene-expression behaviour, their results are often noisy or ambiguous (Editorial
2006). In contrast, qPCR is considered a “gold standard” for quantification of gene-
expression and has been widely employed as a validation method for microarray studies.
We have used the Fluidigm microfluidic technology (Fluidigm; San Francisco, CA, USA),

Genomic and functional genomic analysis of fatty acid composition in swine
168
which employs integrated fluidic circuits (IFC) containing tens of thousands of microfluidic
controlled valves and interconnected channels to move molecules of biological samples
and reagents in a variety of patterns (Melin & Quake 2007). Fluidigm microfluidic
technology reduce qPCR reactions from the routine 10-20 microliter volume down to the
10 nanoliter scale, making possible to perform routine qPCR analysis for thousands of
reactions in a single run (Melin & Quake 2007; Spurgeon et al., 2008). Hence, Fluidigm
offers rapid, cost-effective and customizable arrays for moderate number of gene-
expression profiling in several animals. This technology has already been tested in our
group, by performing an analysis of the Longissimus dorsi muscle (Puig-Oliveras et al., 2016)
and liver (Ballester et al., 2017) mRNA expression of several candidate genes related with
lipid metabolism in BC1_LD animals. In order to have a complete picture of the three
main tissues implicated in lipid metabolism (liver, muscle and adipose tissue), in this thesis,
we have studied the expression of a set of candidate genes related to lipid metabolism in
the adipose tissue of pigs in order to identify genomic regions associated with the
regulation of these genes. The final aim of these studies is to identify regulatory
polymorphisms that may determine changes in FA composition traits. We performed an
expression genome-wide association study (eGWAS) with the backfat gene-expression
measured by qPCR in 43 genes and the PorcineSNP60 BeadChip genotype information in
115 BC1_LD animals. The eGWAS identified 193 eSNPs located in 19 chromosomal
regions on SSC2-SSC4, SSC6, SSC8-SSC10, and SSC13-SSC16, and associated with the
acyl-CoA synthetase medium-chain family member 5 (ACSM5), ELOVL6, fatty acid
binding protein 4 (FABP4), FADS2, and solute carrier family 27 member 4 (SLC27A4)
genes. Three out of 19 eQTLs corresponding to ACSM5, FABP4, and FADS2 were
classified as cis-acting eQTLs, whereas the remaining 16 eQTLs have trans-regulatory
effects.
Different studies have used different definitions of cis-eQTLs (100 kb, 500 kb, 1 Mb),
several statistical tools (linear regression, ANOVA) to analyze eQTLs and different
multiple testing correction methods (Bonferroni, false discovery rate), making comparison
across experiments difficult. The results here detailed are in concordance with those
presented previously by our group in other tissues, which identified that porcine trans-
eQTLs are more abundant than the cis-eQTLs (Table 4.2). Furthermore, it has been
evidenced that genes seem to be regulated by several trans-acting regulators, which
contributed greatly on gene-expression variation (Cheung et al., 2010), and only a few cis-
acting regulators (Cheung & Spielman, 2009).
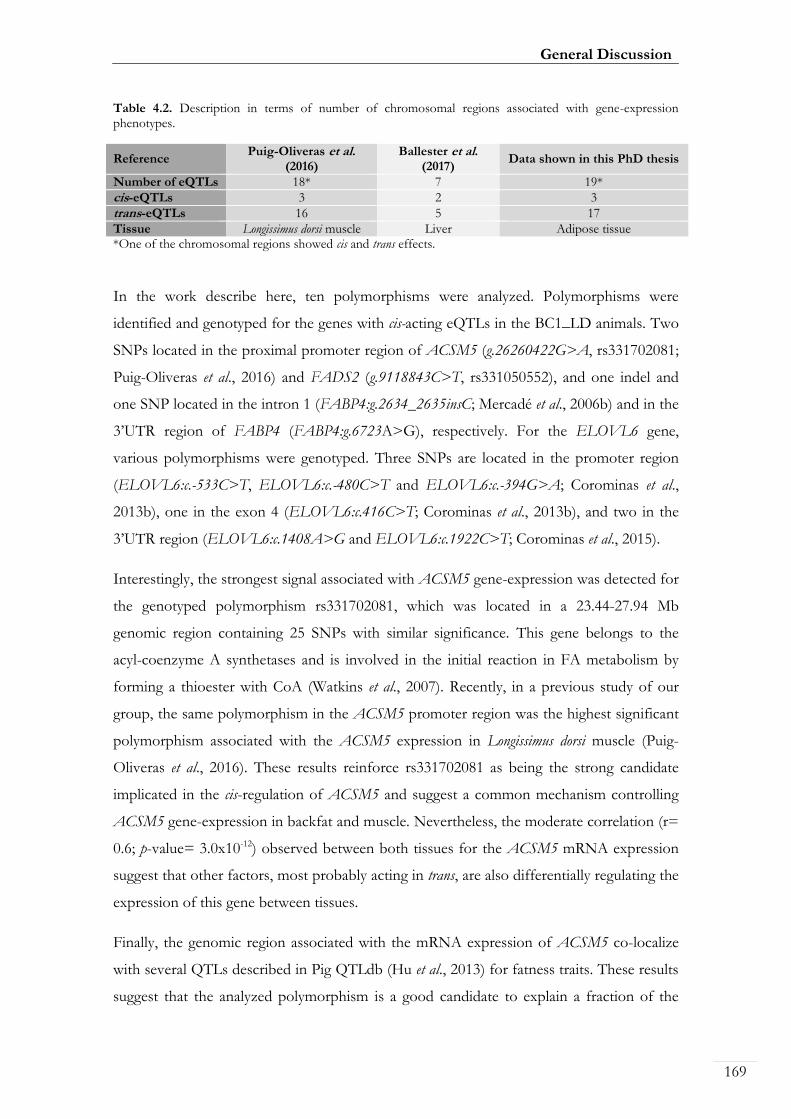
General Discussion
169
Table 4.2. Description in terms of number of chromosomal regions associated with gene-expression phenotypes.
Reference Puig-Oliveras et al.
(2016) Ballester et al.
(2017) Data shown in this PhD thesis
Number of eQTLs 18* 7 19*
cis-eQTLs 3 2 3
trans-eQTLs 16 5 17
Tissue Longissimus dorsi muscle Liver Adipose tissue *One of the chromosomal regions showed cis and trans effects.
In the work describe here, ten polymorphisms were analyzed. Polymorphisms were
identified and genotyped for the genes with cis-acting eQTLs in the BC1_LD animals. Two
SNPs located in the proximal promoter region of ACSM5 (g.26260422G>A, rs331702081;
Puig-Oliveras et al., 2016) and FADS2 (g.9118843C>T, rs331050552), and one indel and
one SNP located in the intron 1 (FABP4:g.2634_2635insC; Mercadé et al., 2006b) and in the
3’UTR region of FABP4 (FABP4:g.6723A>G), respectively. For the ELOVL6 gene,
various polymorphisms were genotyped. Three SNPs are located in the promoter region
(ELOVL6:c.-533C>T, ELOVL6:c.-480C>T and ELOVL6:c.-394G>A; Corominas et al.,
2013b), one in the exon 4 (ELOVL6:c.416C>T; Corominas et al., 2013b), and two in the
3’UTR region (ELOVL6:c.1408A>G and ELOVL6:c.1922C>T; Corominas et al., 2015).
Interestingly, the strongest signal associated with ACSM5 gene-expression was detected for
the genotyped polymorphism rs331702081, which was located in a 23.44-27.94 Mb
genomic region containing 25 SNPs with similar significance. This gene belongs to the
acyl-coenzyme A synthetases and is involved in the initial reaction in FA metabolism by
forming a thioester with CoA (Watkins et al., 2007). Recently, in a previous study of our
group, the same polymorphism in the ACSM5 promoter region was the highest significant
polymorphism associated with the ACSM5 expression in Longissimus dorsi muscle (Puig-
Oliveras et al., 2016). These results reinforce rs331702081 as being the strong candidate
implicated in the cis-regulation of ACSM5 and suggest a common mechanism controlling
ACSM5 gene-expression in backfat and muscle. Nevertheless, the moderate correlation (r=
0.6; p-value= 3.0x10⁻¹²) observed between both tissues for the ACSM5 mRNA expression
suggest that other factors, most probably acting in trans, are also differentially regulating the
expression of this gene between tissues.
Finally, the genomic region associated with the mRNA expression of ACSM5 co-localize
with several QTLs described in Pig QTLdb (Hu et al., 2013) for fatness traits. These results
suggest that the analyzed polymorphism is a good candidate to explain a fraction of the

Genomic and functional genomic analysis of fatty acid composition in swine
170
genetic variability of these traits, but further studies are required to validate the functional
implication of this polymorphism. Due to the strong LD of the 23.44-27.94 Mb genomic
region, we are analysing the segregation of these polymorphisms in populations with
different genetic backgrounds.
For FABP4 gene-expression, the SNP in the 3’UTR region (FABP4:g.6723A>G) showed
the lowest p-value and the indel (FABP4:g.2634_2635insC; Mercadé et al., 2006b) was also
one of the most significantly associated polymorphisms. This gene was previously reported
by our group as a strong positional candidate gene for a QTL related with growth and
fatness traits on SSC4 (Mercadé et al., 2005a, 2006b; Estellé et al., 2006; Ramayo-Caldas et
al., 2012b; Muñoz et al., 2013). Furthermore, the indel (FABP4:g.2634_2635insC ) was
predicted to be located in a target-binding site for PPARG and NR4A2 (Ballester et al.,
submitted).
In our work, we have shown that the FABP4:g.6723A>G SNP was inside a putative
miRNA binding site. Interestingly, the human miRNA, hsa-miR-3182 is predicted to bind
only when FABP4:g.6723G allele is present, suggesting an effect of this SNP in the RNA
expression profile of FABP4 gene. In addition, PPARG is an essential transcription factor
for adipogenesis that modulates FABP4 gene-expression (Samulin et al., 2008; Lim et al.,
2015). In our study FABP4 expression is correlated with the expression of the PPARG
gene (r= 0.51; p-value= 9.27x10-09). Hence, the indel polymorphism
(FABP4:g.2634_2635insC) may alter the binding of PPARG, modulating the differential
expression of FABP4 gene in adipose tissue.
Thus, we hypothesized that the two polymorphisms may be playing a role in the regulation
of the FABP4 gene-expression and may affect meat quality traits in the IBMAP population.
Further analyses are necessary to confirm the relevant role of these polymorphisms.
For the FADS2 gene, no significant association was found between the genotyped SNP
(g9118843C>T; rs331050552) and the FADS2 mRNA expression. FA desaturases play an
important role in the synthesis of highly unsaturated FAs (Nakamura & Nara 2004).
Interestingly, in the same animal material, Ballester et al. (2016) identified a chromosomal
region located on SSC2 (8.60 Mb) significantly associated with cis-7 hexadecenoic acid
(C16:1(n-9)), linoleic acid (C18:2(n-6)), α-linolenic acid (C18:3(n-3)), and PUFA in backfat.
This genomic region are very close to the three members of the FA desaturase gene family
(FADS1, FADS2, and FADS3). Furthermore, it has been suggested an increase conversion
General Discussion
171
of omega-3 PUFA in the liver by FADS1 and FADS2, which are acting mainly in the
omega-3 metabolic pathway (Szostak et al., 2016). Closely related, a high correlation has
been observed between the mRNA expression of FADS1 and FADS2 in liver (rFADS1-
FADS2= 0.92; p-value= 1.11x10⁻¹⁷) (Ballester et al., 2017). In contrast, in the adipose tissue the
correlation value between the expression of these genes was moderate-high (rFADS1-FADS2=
0.63; p-value= 8.26x10⁻¹⁴). It has been demonstrated that FADS pathway is both functional
in adipocytes and regulated by PUFAs (Ralston et al., 2015). These results suggest that
common elements could regulate the expression of FA desaturase in liver and adipose
tissue, but additional regulatory elements affecting the FADS1 and FADS2 mRNA
expression in adipose tissue may exist. However, the results obtained for the genotyped
SNP suggest that other variants of this gene may be determining the expression variation
of FADS2 gene.
For the ELOVL6 gene, a significant region at chromosome level on SSC8 was associated
with ELOVL6 mRNA expression in backfat, which is consistent with the signal identified
by Corominas et al. (2013b). The strongest signal was identified for two SNPs
(ALGA0049135 and ALGA0049139) with the same p-value (p-value= 4.60x10-05), near the
ELOVL6 gene, and located in an intron of Ankyrin 2 gene (ANK2). Although the
ELOVL6:c.-533C>T and ELOVL6:c.-394G>A polymorphisms also showed high
association (p-value= 6.42x10-04), in our analysis these polymorphisms did not reach
significance after multiple testing correction (q-value ≤ 0.05). This discrepancy could be
due to the different number of BC1_LD animals and the different mRNA quantification
method (microfluidic array vs conventional qPCR) used between the studies. These results
suggest that the mutation underlying the eQTL on SSC8 (117.55-117.67 Mb) would be
located in a regulatory element near the ELOVL6 gene. Interestingly, Ramayo-Caldas et al.
(2014) identified on SSC8 the ANK2 gene as central in an adipose co-expression network
related with IMF composition in BC1_LD animals. This gene has been recently defined as
an important gene for glucose homeostasis and a decrease of this gene could elevate the
cell surface of glucose transporter 4 (GLUT4) in skeletal muscle and fat (Lorenzo et al.,
2015), increasing the glucose uptake and modulating the novo lipogenesis which may alter
the gene expression of lipogenic genes. The assumption of an association of this gene with
the mRNA expression levels of ELOVL6 gene cannot be discarded.
Interestingly, and in agreement with previous studies where trans-eQTLs affecting the
expression of many genes were identified (Liaubet et al., 2011; Ballester et al., 2017), a

Genomic and functional genomic analysis of fatty acid composition in swine
172
chromosomal interval located on SSC13 (6.89 Mb) was associated with the expression of
ELOVL5, ELOVL6, and SCD genes. The co-expression pattern of these genes showed
high significant positive correlations between ELOVLs and SCD genes (r>0.84; p-
value<1.00x10⁻¹⁶) suggesting a common regulatory direction/effect (Figure 4.2). In
addition, ELOVLs and SCD gene expression are regulated by insulin through activation of
SREBF1 and PPARs transcription factors (Guillou et al., 2010; Corominas et al., 2013a;
Estany et al., 2014). Significant positive correlations ranking from 0.51 to 0.75 (p-
value<1.00x10-08) were observed among genes regulated by this eQTL and, SREBF1 and
PPARs (Figure 4.2). Similar results have been identified in mice, where ELOVL5,
ELOVL6, and SCD genes are induced by activation of PPARs (Green et al., 2010).
Apart for the high importance of ELOVLs and SCD genes in lipogenesis, diacylglycerol
acyltransferases (DGATs) enzymes are required for triglyceride synthesis. Two of their
members, DGAT1 and DGAT2, showed high correlations with ELOVLs and SCD genes,
ranking from 0.59 to 0.81 (p-value<1.00x10⁻¹²) (Figure 4.2).
The observed interrelated functions of genes involved in lipogenesis (ELOVLs and SCD),
and triglyceride synthesis (DGAT1 and DGAT2), which are the main function of adipose
tissue, highlight the relevance of these genes and the complex genetic architecture
underlying the lipid metabolism (Figure 4.2).
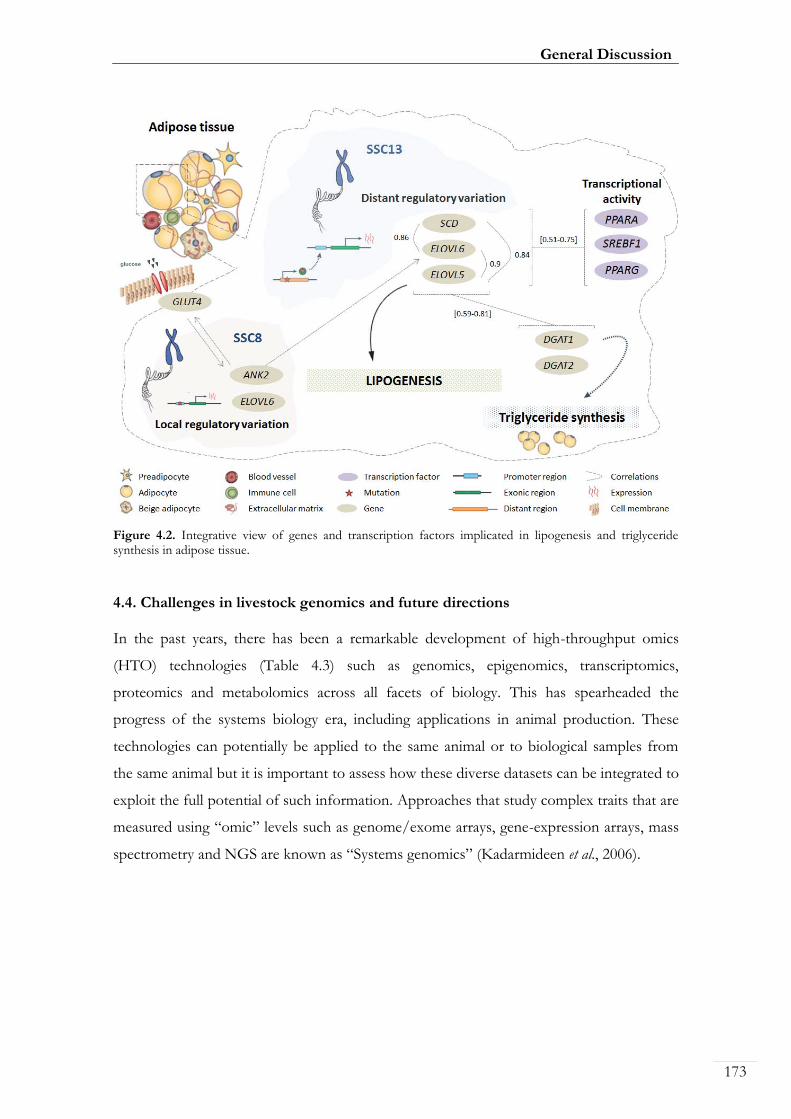
General Discussion
173
Figure 4.2. Integrative view of genes and transcription factors implicated in lipogenesis and triglyceride synthesis in adipose tissue.
4.4. Challenges in livestock genomics and future directions In the past years, there has been a remarkable development of high-throughput omics
(HTO) technologies (Table 4.3) such as genomics, epigenomics, transcriptomics,
proteomics and metabolomics across all facets of biology. This has spearheaded the
progress of the systems biology era, including applications in animal production. These
technologies can potentially be applied to the same animal or to biological samples from
the same animal but it is important to assess how these diverse datasets can be integrated to
exploit the full potential of such information. Approaches that study complex traits that are
measured using “omic” levels such as genome/exome arrays, gene-expression arrays, mass
spectrometry and NGS are known as “Systems genomics” (Kadarmideen et al., 2006).
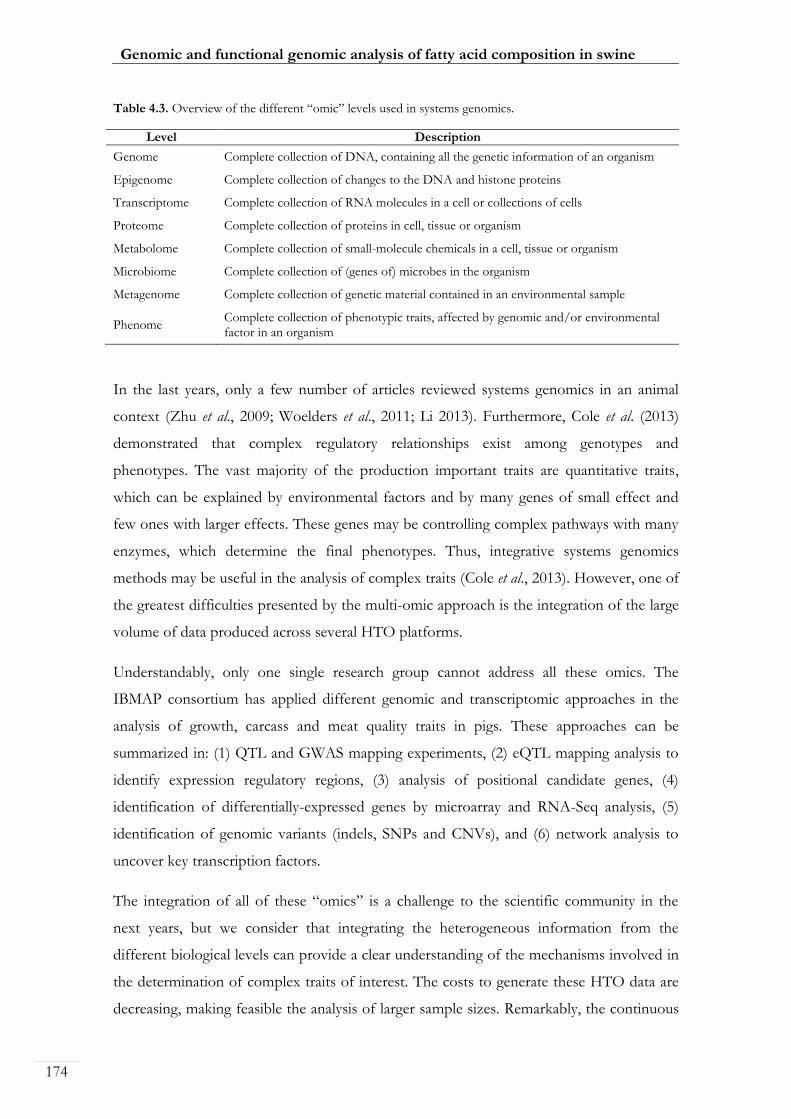
Genomic and functional genomic analysis of fatty acid composition in swine
174
Table 4.3. Overview of the different “omic” levels used in systems genomics.
Level Description
Genome Complete collection of DNA, containing all the genetic information of an organism
Epigenome Complete collection of changes to the DNA and histone proteins
Transcriptome Complete collection of RNA molecules in a cell or collections of cells
Proteome Complete collection of proteins in cell, tissue or organism
Metabolome Complete collection of small-molecule chemicals in a cell, tissue or organism
Microbiome Complete collection of (genes of) microbes in the organism
Metagenome Complete collection of genetic material contained in an environmental sample
Phenome Complete collection of phenotypic traits, affected by genomic and/or environmental factor in an organism
In the last years, only a few number of articles reviewed systems genomics in an animal
context (Zhu et al., 2009; Woelders et al., 2011; Li 2013). Furthermore, Cole et al. (2013)
demonstrated that complex regulatory relationships exist among genotypes and
phenotypes. The vast majority of the production important traits are quantitative traits,
which can be explained by environmental factors and by many genes of small effect and
few ones with larger effects. These genes may be controlling complex pathways with many
enzymes, which determine the final phenotypes. Thus, integrative systems genomics
methods may be useful in the analysis of complex traits (Cole et al., 2013). However, one of
the greatest difficulties presented by the multi-omic approach is the integration of the large
volume of data produced across several HTO platforms.
Understandably, only one single research group cannot address all these omics. The
IBMAP consortium has applied different genomic and transcriptomic approaches in the
analysis of growth, carcass and meat quality traits in pigs. These approaches can be
summarized in: (1) QTL and GWAS mapping experiments, (2) eQTL mapping analysis to
identify expression regulatory regions, (3) analysis of positional candidate genes, (4)
identification of differentially-expressed genes by microarray and RNA-Seq analysis, (5)
identification of genomic variants (indels, SNPs and CNVs), and (6) network analysis to
uncover key transcription factors.
The integration of all of these “omics” is a challenge to the scientific community in the
next years, but we consider that integrating the heterogeneous information from the
different biological levels can provide a clear understanding of the mechanisms involved in
the determination of complex traits of interest. The costs to generate these HTO data are
decreasing, making feasible the analysis of larger sample sizes. Remarkably, the continuous

General Discussion
175
achievements on these HTO techniques need to be followed by new computer
technologies for processing, interpretation and storing data.
Furthermore, a recent addition to genome editing tools has led to a revolution in biological
research. One of the most revolutionary is the genome editing technique, first introduced
by Cong et al. (2013). This technique uses the clustered regulatory interspaced short
palindromic repeats (CRISPR), which in combination with Cas9 protein (CRISPR/Cas)
systems guide RNAs into a cell’s genome (the nuclease) and cut the genome at desired
locations (Suravajhala et al., 2016). To date, it has not been thoroughly explored in
livestock, but it is clearly foreseen that animal genome modification using CRISPR/Cas
systems will play a key role in improving trait performances in animals.


G Conclusions
Chapter 5

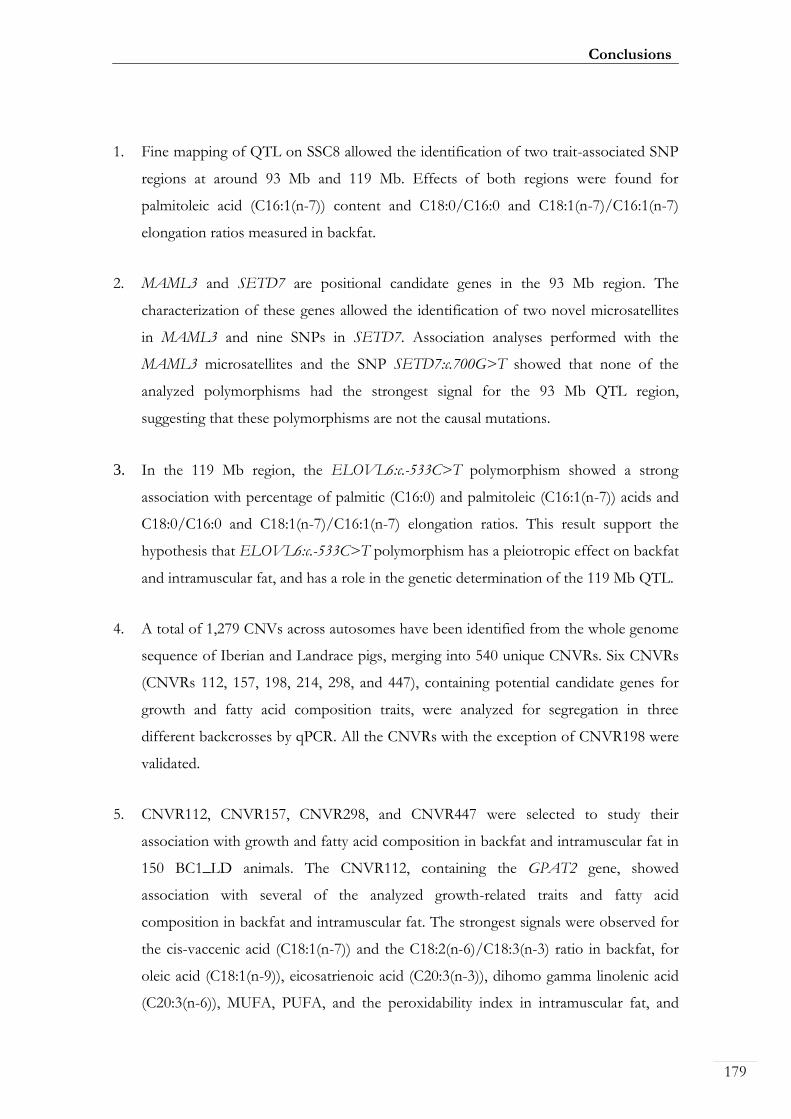
Conclusions
179
1. Fine mapping of QTL on SSC8 allowed the identification of two trait-associated SNP
regions at around 93 Mb and 119 Mb. Effects of both regions were found for
palmitoleic acid (C16:1(n-7)) content and C18:0/C16:0 and C18:1(n-7)/C16:1(n-7)
elongation ratios measured in backfat.
2. MAML3 and SETD7 are positional candidate genes in the 93 Mb region. The
characterization of these genes allowed the identification of two novel microsatellites
in MAML3 and nine SNPs in SETD7. Association analyses performed with the
MAML3 microsatellites and the SNP SETD7:c.700G>T showed that none of the
analyzed polymorphisms had the strongest signal for the 93 Mb QTL region,
suggesting that these polymorphisms are not the causal mutations.
3. In the 119 Mb region, the ELOVL6:c.-533C>T polymorphism showed a strong
association with percentage of palmitic (C16:0) and palmitoleic (C16:1(n-7)) acids and
C18:0/C16:0 and C18:1(n-7)/C16:1(n-7) elongation ratios. This result support the
hypothesis that ELOVL6:c.-533C>T polymorphism has a pleiotropic effect on backfat
and intramuscular fat, and has a role in the genetic determination of the 119 Mb QTL.
4. A total of 1,279 CNVs across autosomes have been identified from the whole genome
sequence of Iberian and Landrace pigs, merging into 540 unique CNVRs. Six CNVRs
(CNVRs 112, 157, 198, 214, 298, and 447), containing potential candidate genes for
growth and fatty acid composition traits, were analyzed for segregation in three
different backcrosses by qPCR. All the CNVRs with the exception of CNVR198 were
validated.
5. CNVR112, CNVR157, CNVR298, and CNVR447 were selected to study their
association with growth and fatty acid composition in backfat and intramuscular fat in
150 BC1_LD animals. The CNVR112, containing the GPAT2 gene, showed
association with several of the analyzed growth-related traits and fatty acid
composition in backfat and intramuscular fat. The strongest signals were observed for
the cis-vaccenic acid (C18:1(n-7)) and the C18:2(n-6)/C18:3(n-3) ratio in backfat, for
oleic acid (C18:1(n-9)), eicosatrienoic acid (C20:3(n-3)), dihomo gamma linolenic acid
(C20:3(n-6)), MUFA, PUFA, and the peroxidability index in intramuscular fat, and
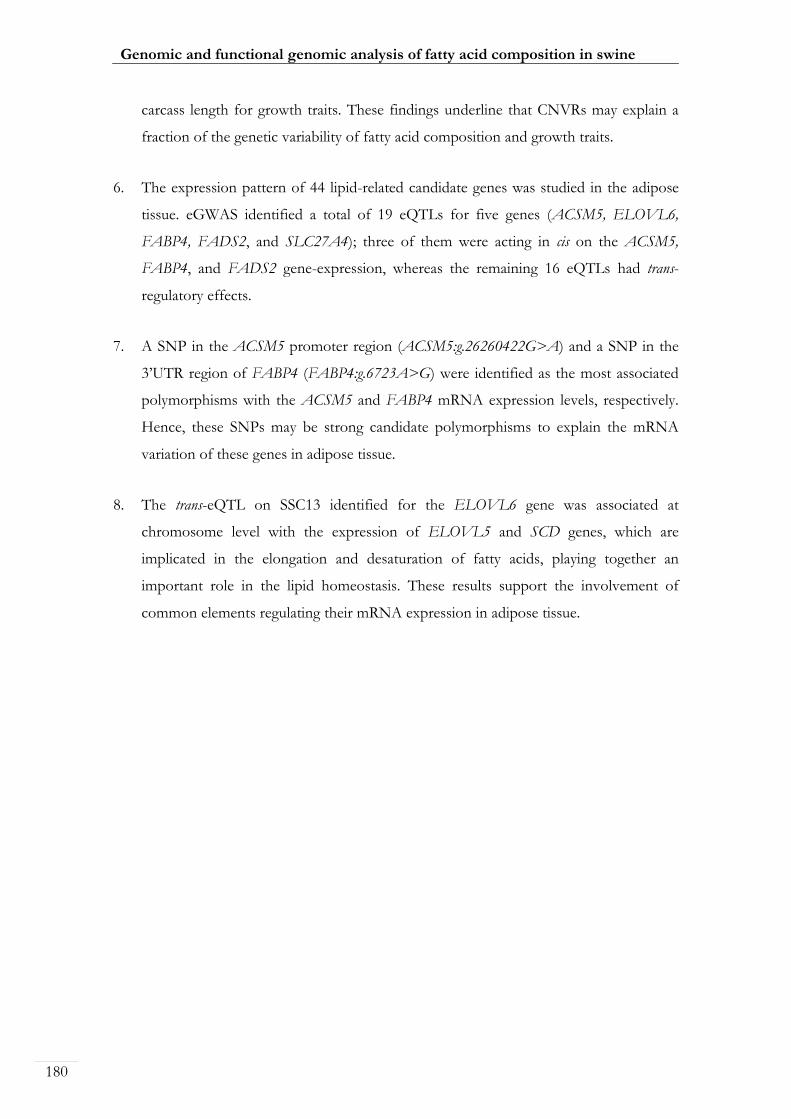
Genomic and functional genomic analysis of fatty acid composition in swine
180
carcass length for growth traits. These findings underline that CNVRs may explain a
fraction of the genetic variability of fatty acid composition and growth traits.
6. The expression pattern of 44 lipid-related candidate genes was studied in the adipose
tissue. eGWAS identified a total of 19 eQTLs for five genes (ACSM5, ELOVL6,
FABP4, FADS2, and SLC27A4); three of them were acting in cis on the ACSM5,
FABP4, and FADS2 gene-expression, whereas the remaining 16 eQTLs had trans-
regulatory effects.
7. A SNP in the ACSM5 promoter region (ACSM5:g.26260422G>A) and a SNP in the
3’UTR region of FABP4 (FABP4:g.6723A>G) were identified as the most associated
polymorphisms with the ACSM5 and FABP4 mRNA expression levels, respectively.
Hence, these SNPs may be strong candidate polymorphisms to explain the mRNA
variation of these genes in adipose tissue.
8. The trans-eQTL on SSC13 identified for the ELOVL6 gene was associated at
chromosome level with the expression of ELOVL5 and SCD genes, which are
implicated in the elongation and desaturation of fatty acids, playing together an
important role in the lipid homeostasis. These results support the involvement of
common elements regulating their mRNA expression in adipose tissue.

G References
Chapter 6


References
183
Abyzov A, Urban AE, Snyder M, Gerstein M (2011). CNVnator: an approach to discover,
genotype, and characterize typical and atypical CNVs from family and population
genome sequencing. Genome Research 21(6):974-84.
Ai H, Fang X, Yang B, Huang Z, Chen H, Mao L, et al. (2015). Adaptation and possible
ancient interspecies introgression in pigs identified by whole-genome sequencing.
Nature Genetics 47(3):217-25.
Albert FW, Kruglyak L (2015). The role of regulatory variation in complex traits and
disease. Nature Review. Genetics 16(4):197-212.
Alkan C, Coe BP, Eichler EE (2011). Genome structural variation discovery and
genotyping. Nature Review. Genetics 12(5):363-76.
Amaral AJ, Ferretti L, Megens HJ, Crooijmans RP, Nie H, Ramos-Onsins SE (2011).
Genome-wide footprints of pig domestication and selection revealed through
massive parallel sequencing of pooled DNA. PLoS One 6(4):e14782.
Andersson L, Haley CS, Ellegren H, Knott SA, Johansson M, Andersson K, et al. (1994).
Genetic mapping of quantitative trait loci for growth and fatness in pigs. Science
263(5154):1771-1774.
Andersson L, Georges M (2004). Domestic-animal genomics: deciphering the genetics of
complex traits. Nature Reviews. Genetics 2004 5(3):202-12.
Archibald AL, Bolund L, Churcher C, Fredholm M, Groenen MA, Harlizius B, et al. (2010).
Pig genome sequence-analysis and publication strategy. BMC Genomics 11:438.
Aslan O, Hamill RM, Davey G, McBryan J, Mullen AM, Gispert M, et al. (2012). Variation
in the IGF2 gene promoter region is associated with intramuscular fat content in
porcine skeletal muscle. Molecular Biology Reports 39(4):4101-10.
Ayuso M, Fernández A, Núñez Y, Benítez R, Isabel B, Barragán C, et al. (2015).
Comparative Analysis of Muscle Transcriptome between Pig Genotypes Identifies
Genes and Regulatory Mechanisms Associated to Growth, Fatness and
Metabolism. PLoS One 10(12):e0145162.
Genomic and functional genomic analysis of fatty acid composition in swine
184
Ballester M, Revilla M, Puig-Oliveras A, Marchesi JA, Castelló A, Corominas J, et al. (2016).
Analysis of the porcine APOA2 gene expression in liver, polymorphism
identification and association with fatty acid composition traits. Animal Genetics
47(5): 552-9.
Ballester M, Ramayo-Caldas Y, Revilla M, Corominas J, Castelló A, Estellé J, et al. (2017).
Integration of liver gene co-expression networks and eGWAs analyses highlighted
candidate regulators implicated in lipid metabolism in pigs. Scientific Reports 7:46539.
Ballester M, Puig-Oliveras A, Castelló A, Revilla M, Fernández AI, Folch JM (2017).
Analysis of FABP4 and FABP5 gene expression affecting pig fatness. Animal
Genetics (submitted).
Barton-Gade PA (1990). Pork quality in genetic improvement programmes- the Danish
experience. In: Proceedings of the National Swine Improvement Federation Annual
Meeting. Des Moines, IA.
Bejerholm C, Barton-Gade PA (1986). Effect of intramuscular fat level on the eating
quality of pig meat. Danish Meat Research Institute. Manuscript No. 720E.
Bendixen C, Hedegaard J, Horn P (2005). Functional genomics in farm animals -
Microarray analysis. Meat Science 71(1):128-37.
Bergen WG, Mersmann HJ (2005). Comparative aspects of lipid metabolism: impact on
contemporary research and use of animal models. The Journal of Nutrition
135(11):2499-502.
Bianco E, Nevado B, Ramos-Onsins SE, Pérez-Enciso M (2015). A deep catalog of
autosomal single nucleotide variation in the pig. PLoS One 10(3):e0118867.
Bidner BS, Ellis M, Brewer MS, Campion D, Wilson ER, Mckeith FK (2004). Effect of
ultimate ph on the quality characteristics of pork. Journal of Muscle Foods 15(2):139–
154.
Blow N (2009). Transcriptomics: The digital generation. Nature 458(7235):239-42.
References
185
Boeva V, Zinovyev A, Bleakley K, Vert JP, Janoueix-Lerosey I, Delattre O, et al. (2011).
Control-free calling of copy number alterations in deep-sequencing data using GC-
content normalization. Bioinformatics 27(2):268-9.
Boeva V, Popova T, Bleakley K, Chiche P, Cappo J, Schleiermacher G, et al. (2012).
Control-FREEC: a tool for assessing copy number and allelic content using next-
generation sequencing data. Bioinformatics 28(3):423-5.
Boler DD, Dilger AC, Bidner BS, Carr SN, Eggert JM, Day JW, et al. (2010). Ultimate ph
explains variation in pork quality traits. Journal of Muscle Foods 21(1):119–130.
Bosch L, Tor M, Reixach J, Estany J (2012). Age-related changes in intramuscular and
subcutaneous fat content and fatty acid composition in growing pigs using
longitudinal data. Meat Science 91(3):358-63.
Bosse M, Megens HJ, Madsen O, Paudel Y, Frantz LA, Schook LB, et al. (2012). Regions
of homozygosity in the porcine genome: consequence of demography and the
recombination landscape. PLoS Genetics 8(11):e1003100.
Brunsø K, Bredahl L, Grunert KG, Scholderer J (2004). Consumer perception of the
quality of beef resulting from various fattening regimes. Livestock Production Science
94:83-93.
Bruun CS, Jørgensen CB, Nielsen VH, Andersson L, Fredholm M (2006). Evaluation of
the porcine melanocortin 4 receptor (MC4R) gene as a positional candidate for a
fatness QTL in a cross between Landrace and Hampshire. Animal Genetics
37(4):359-62.
Cameron ND (1990). Genetic and phenotypic parameters for carcass traits, meat and
eating quality traits in pigs. Livestock Production Science 26:119-135.
Cameron ND, Enser MB (1991). Fatty acid composition of lipid in Longissimus dorsi
muscle of Duroc and British Landrace pigs and its relationship with eating quality.
Meat Science 29(4):295-307.

Genomic and functional genomic analysis of fatty acid composition in swine
186
Cánovas A, Pena RN, Gallardo D, Ramírez O, Amills M, Quintanilla R (2012). Segregation
of regulatory polymorphisms with effects on the gluteus medius transcriptome in a
purebred pig population. PLoS One 7(4):e35583.
Casellas J, Noguera JL, Reixach J, Díaz I, Amills M, Quintanilla R (2010). Bayes factor
analyses of heritability for serum and muscle lipid traits in Duroc pigs. Journal of
Animal Science 88(7):2246-54.
Cattaneo ER, Pellon-Maison M, Rabassa ME, Lacunza E, Coleman RA, Gonzalez-Baro
MR (2012). Glycerol-3-phosphate acyltransferase-2 is expressed in spermatic germ
cells and incorporates arachidonic acid into triacylglycerols. PLoS One 7(8):e42986.
Chawla A, Repa JJ, Evans RM, Mangelsdorf DJ (2001). Chawla A1, Repa JJ, Evans RM,
Mangelsdorf DJ. Science 294(5548):1866-70.
Chen C, Ai H, Ren J, Li W, Li P, Qiao R, et al. (2011). A global view of porcine
transcriptome in three tissues from a full-sib pair with extreme phenotypes in
growth and fat deposition by paired-end RNA sequencing. BMC Genomics 12:448.
Chen C, Qiao R, Wei R, Guo Y, Ai H, Ma J, et al. (2012). A comprehensive survey of copy
number variation in 18 diverse pig populations and identification of candidate copy
number variable genes associated with complex traits. BMC Genomics 13:733.
Chen C, Yang B, Zeng Z, Yang H, Liu C, Ren J, et al. (2013). Genetic dissection of blood
lipid traits by integrating genome-wide association study and gene expression
profiling in a porcine model. BMC Genomics 14:848.
Cheung VG, Spielman RS (2009). Genetics of human gene expression: mapping DNA
variants that influence gene expression. Nature Review. Genetics 10(9):595-604.
Cheung VG, Nayak RR, Wang IX, Elwyn S, Cousins SM, Morley M, et al. (2010).
Polymorphic cis- and trans-regulation of human gene expression. PLoS biology 8(9).
Chiang DY, Getz G, Jaffe DB, O'Kelly MJ, Zhao X, Carter SL, et al. (2009). High-
resolution mapping of copy-number alterations with massively parallel sequencing.
Nature Methods 6(1):99-103.
References
187
Chizzolini R, Zanardi E, Dorigoni V, Ghidini S (1999). Calorific value and cholesterol
content of normal and low-fat meat and meat products. Trends in Food Science &
Technology 10:119-28.
Choi JW, Chung WH, Lee KT, Cho ES, Lee SW, Choi BH, et al. (2015). Whole-genome
resequencing analyses of five pig breeds, including Korean wild and native, and
three European origin breeds. DNA Research 22(4):259-67.
Ciobanu D, Bastiaansen J, Malek M, Helm J, Woollard J, Plastow G, et al. (2001). Evidence
for new alleles in the protein kinase adenosine monophosphate-activated
gamma(3)-subunit gene associated with low glycogen content in pig skeletal muscle
and improved meat quality. Genetics 159(3):1151-62.
Ciobanu DC, Bastiaansen JW, Lonergan SM, Thomsen H, Dekkers JC, Plastow GS, et al.
(2004). New alleles in calpastatin gene are associated with meat quality traits in pigs.
Journal of Animal Science 82(10):2829-39.
Ciobanu D, Lonergan S, Huff-Lonergan E (2011) Genetics of meat quality and carcass
traits. In: Rothschild, M.F. and Ruvinsky, A. (eds) The Genetics of the Pig, 2nd
Edn. (pp. 355-389). CAB International, Wallingford, UK.
Clarke J, Wu HC, Jayasinghe L, Patel A, Reid S, Bayley H (2009). Continuous base
identification for single-molecule nanopore DNA sequencing. Nature Nanotechnology
4(4):265-70.
Clop A, Cercós A, Tomàs A, Pérez-Enciso M, Varona L, Noguera JL, et al. (2002).
Assignment of the 2,4-dienoyl-CoA reductase (DECR) gene to porcine
chromosome 4. Animal Genetics 33(2):164-5.
Clop A, Ovilo C, Perez-Enciso M, Cercos A, Tomas A, Fernandez A, et al. (2003).
Detection of QTL affecting fatty acid composition in the pig. Mammalian Genome
14(9):650-6.
Cole JB, Lewis RM, Maltecca C, Newman S, Olson KM, Tait RG Jr (2013). Breeding and
Genetics Symposium: systems biology in animal breeding: Identifying relationships
among markers, genes, and phenotypes. Journal of Animal Science 91(2):521-2.

Genomic and functional genomic analysis of fatty acid composition in swine
188
Cong L, Ran FA, Cox D, Lin S, Barretto R, Habib N, et al. (2013). Multiplex genome
engineering using CRISPR/Cas systems. Science 339(6121):819-23.
Corominas J, Ramayo-Caldas Y, Castelló A, Muñoz M, Ibáñez-Escriche N, Folch JM, et al.
(2012). Evaluation of the porcine ACSL4 gene as a candidate gene for meat quality
traits in pigs. Animal Genetics 43(6):714-20.
Corominas J, Ramayo-Caldas Y, Puig-Oliveras A, Estellé J, Castelló A, Alves E, et al.
(2013a). Analysis of porcine adipose tissue transcriptome reveals differences in de
novo fatty acid synthesis in pigs with divergent muscle fatty acid composition. BMC
Genomics 14:843.
Corominas J, Ramayo-Caldas Y, Puig-Oliveras A, Pérez-Montarelo D, Noguera JL, Folch
JM, et al. (2013b). Polymorphism in the ELOVL6 gene is associated with a major
QTL effect on fatty acid composition in pigs. PLoS One 8(1):e53687.
Corominas J, Marchesi J, Puig-Oliveras A, Revilla M, Estellé J, Alves E, et al. (2015).
Epigenetic regulation of the ELOVL6 gene is associated with a major QTL effect
on fatty acid composition in pigs. Genetics Selection Evolution 47:20.
de Oliveira Peixoto J, Facioni Guimarães SE, Sávio Lopes P, Menck Soares MA, Vieira
Pires A, Gualberto Barbosa MV, et al. (2006). Associations of leptin gene
polymorphisms with production traits in pigs. Journal of Animal Breeding and Genetics
123(6):378-83.
De Smet S, Raes K, Demeyer D (2004). Meat fatty acid composition as affected by fatness
and genetic factors: a review. Animal Research 53(2):81–98.
De Vries AG, Wal van der PG, Eikelenboom G, Merks JWM (1992). Genetische variatie in
varkensvleeskwaliteit. I.V.O. report B-376. I.V.O. Zeist, The Netherlands.
Dekkers JCM, Mathur PK, Knol EF (2011). Genetic improvement of the pig. In: The
genetics of the pig. CAB International, UK 390-425.
DeVol DL, McKeith FK, Bechtel PJ, Novakofski J, Shanks RD, Carr TR (1988). Variation
in composition and palatability traits and relationships between muscle
References
189
characteristics and palatability in a random sample of pork carcasses. Journal of
Animal Science 66:385-395.
Dircks LK, Sul HS (1997). Mammalian mitochondrial glycerol-3-phosphate acyltransferase.
Biochimica et Biophysica Acta 1348(1-2):17-26.
Dohm JC, Lottaz C, Borodina T, Himmelbauer H (2008). Substantial biases in ultra-short
read data sets from high-throughput DNA sequencing. Nucleic Acids Research
36(16):e105.
Dong K, Pu Y, Yao N, Shu G, Liu X, He X, et al. (2015). Copy number variation detection
using SNP genotyping arrays in three Chinese pig breeds. Animal Genetics 46(2):101-
9.
Doss S, Schadt EE, Drake TA, Lusis AJ (2005). Cis-acting expression quantitative trait loci
in mice. Genome Research 15(5):681-91.
Du CH, Sun DW (2006). Learning techniques used in computer vision for food quality
evaluation: a review. Journal of Food Engineering 72:39–55.
Duan J, Zhang JG, Deng HW, Wang YP (2013). Comparative studies of copy number
variation detection methods for next-generation sequencing technologies. PLoS One
8(3):e59128.
Duran-Montgé P, Theil PK, Lauridsen C, Esteve-Garcia E (2009). Fat metabolism is
regulated by altered gene expression of lipogenic enzymes and regulatory factors in
liver and adipose tissue but not in semimembranosus muscle of pigs during the
fattening period. Animal: an International Journal of Animal Bioscience 3(11):1580-90.
Editorial (2006). Making the most of microarrays (Editorial). Nature Biotechnology 24:1039.
Ernst CW, Steibel JP (2013). Molecular advances in QTL discovery and application in pig
breeding. Trends in Genetics 29(4):215-24.
Estany J, Ros-Freixedes R, Tor M, Pena RN (2014). A functional variant in the stearoyl-
CoA desaturase gene promoter enhances fatty acid desaturation in pork. PLoS One
9(1):e86177.
Genomic and functional genomic analysis of fatty acid composition in swine
190
Estellé J, Mercadé A, Noguera JL, Pérez-Enciso M, Ovilo C, Sánchez A, et al. (2005a).
Effect of the porcine IGF2-intron3-G3072A substitution in an outbred Large
White population and in an Iberian x Landrace cross. Journal of Animal Science
83(12):2723-8.
Estellé J, Sánchez A, Folch JM (2005b). Assignment of the microsomal triglyceride transfer
protein large subunit (MTP) gene to porcine chromosome 8. Animal Genetics
36(4):354-5.
Estellé J, Pérez-Enciso M, Mercadé A, Varona L, Alves E, Sánchez A, et al. (2006).
Characterization of the porcine FABP5 gene and its association with the FAT1
QTL in an Iberian by Landrace cross. Animal Genetics 37(6):589-91.
Estellé J, Mercadé A, Pérez-Enciso M, Pena RN, Silió L, Sánchez A, et al. (2009a).
Evaluation of FABP2 as candidate gene for a fatty acid composition QTL in
porcine chromosome 8. Journal of Animal Breeding and Genetics 126(1):52-8.
Estellé J, Fernández AI, Pérez-Enciso M, Fernández A, Rodríguez C, Sánchez A, et al.
(2009b). A non-synonymous mutation in a conserved site of the MTTP gene is
strongly associated with protein activity and fatty acid profile in pigs. Animal Genetics
40(6):813-20.
Esteve-Codina A, Paudel Y, Ferretti L, Raineri E, Megens HJ, Silió L, et al. (2013).
Dissecting structural and nucleotide genome-wide variation in inbred Iberian pigs.
BMC Genomics 14:148.
EuroStat (2015). Available: http://ec.europa.eu/eurostat/ [Accessed January 2017].
Fadista J, Nygaard M, Holm LE, Thomsen B, Bendixen C (2008). A snapshot of CNVs in
the pig genome. PLoS One 3(12):e3916.
Fan B, Onteru SK, Plastow GS, Rothschild MF (2009). Detailed characterization of the
porcine MC4R gene in relation to fatness and growth. Animal Genetics 40(4):401-9.
Fernández AI, Pérez-Montarelo D, Barragán C, Ramayo-Caldas Y, Ibáñez-Escriche N,
Castelló A, et al. (2012). Genome-wide linkage analysis of QTL for growth and
body composition employing the PorcineSNP60 BeadChip. BMC Genetics 13:41.
References
191
Fernández AI, Barragán C, Fernández A, Rodríguez MC, Villanueva B (2014). Copy
number variants in a highly inbred Iberian porcine strain. Animal Genetics 45(3):357-
66.
Fernandez X, Monin G, Talmant A, Mourot J, Lebret B (1999a). Influence of
intramuscular fat content on the quality of pig meat - 1. Composition of the lipid
fraction and sensory characteristics of m. longissimus lumborum. Meat Science
53(1):59-65.
Fernandez X, Monin G, Talmant A, Mourot J, Lebret B (1999b). Influence of
intramuscular fat content on the quality of pig meat - 2. Consumer acceptability of
m. longissimus lumborum. Meat Science 53(1):67-72.
Folch J, Less M, Sloane Stanley GH (1957). A simple method for the isolation and
purification of total lipides from animal tissues. The Journal of Biological Chemistry
226(1):497-509.
Fontanesi L, Beretti F, Riggio V, Gómez González E, Dall'Olio S, Davoli R, et al. (2009).
Copy number variation and missense mutations of the agouti signaling protein
(ASIP) gene in goat breeds with different coat colors. Cytogenetic and Genome Research
126(4):333-47.
Font-i-Furnols M, Guerrero L (2014). Consumer preference, behavior and perception
about meat and meat products: an overview. Meat Science 98(3):361-71.
Food and Agriculture Organization (FAO) (2014). Available: http://www.fao.org/
[Accessed January 2017].
Fortes MR, Reverter A, Zhang Y, Collis E, Nagaraj SH, Jonsson NN, et al. (2010).
Association weight matrix for the genetic dissection of puberty in beef cattle.
Proceedings of the National Academy of Sciences of the United States of America
107(31):13642-7.
Freeman JL, Perry GH, Feuk L, Redon R, McCarroll SA, Altshuler DM (2006). Copy
number variation: new insights in genome diversity. Genome Research 16(8):949-61.
Genomic and functional genomic analysis of fatty acid composition in swine
192
Fujii J, Otsu K, Zorzato F, de Leon S, Khanna VK, Weiler JE, et al. (1991). Identification
of a mutation in porcine ryanodine receptor associated with malignant
hyperthermia. Science 253(5018):448-51.
García-Olmo J, Corredor-Coca JI, De Pedro-Sanz E (2012) 1 H-NMR as a tool to
determine the type of feeding of Iberian pigs. In: De Pedro E.J. (ed.), Cabezas A.B.
(ed.). 7th International Symposium on the Mediterranean Pig. Options
Méditerranéennes: Série A. Séminaires Méditerranéens. Zaragoza: CIHEAM, Vol.
101. pp. 607-610. Available: http://om.ciheam.org/om/pdf/a101/00006755.pdf
Gatlin LA, See MT, Hansen JA, Odle J (2003). Hydrogenated dietary fat improves pork
quality of pigs from two lean genotypes. Journal of Animal Science 81(8):1989-97.
Gilad Y, Rifkin SA, Pritchard JK (2008). Revealing the architecture of gene regulation: the
promise of eQTL studies. Trends in Genetics 24(8):408-15.
Giuffra E, Törnsten A, Marklund S, Bongcam-Rudloff E, Chardon P, Kijas JM, et al.
(2002). A large duplication associated with dominant white color in pigs originated
by homologous recombination between LINE elements flanking KIT. Mammalian
Genome 13(10):569-77.
Goddard ME, Hayes BJ (2009). Mapping genes for complex traits in domestic animals and
their use in breeding programmes. Nature Review. Genetics 10(6):381-91.
González-Prendes R, Quintanilla R, Cánovas A, Manunza A, Figueiredo Cardoso T,
Jordana J, et al. (2017). Joint QTL mapping and gene expression analysis identify
positional candidate genes influencing pork quality traits. Scientific Reports 7:39830.
Goodwin R, Burroughs S (1995). Genetic Evaluation Terminal Line Program Results.
National Pork Producers Council; Des Moines, IA, USA.
Goodwin S, McPherson JD, McCombie WR (2016). Coming of age: ten years of next-
generation sequencing technologies. Nature reviews. Genetics 17(6):333-51.
Green CD, Ozguden-Akkoc CG, Wang Y, Jump DB, Olson LK (2010). Role of fatty acid
elongases in determination of de novo synthesized monounsaturated fatty acid
species. Journal of Lipid Research 51(7):1871-7.
References
193
Groenen MAM, Schook LB, Archibald AL (2011). Pig genomics. In: Rothschild MF,
Ruvinsky A, editors. The genetics of the pig. 2nd ed. Wallingford: CABI, p. 179–99.
Groenen MA, Archibald AL, Uenishi H, Tuggle CK, Takeuchi Y, Rothschild MF, et al.
(2012). Analyses of pig genomes provide insight into porcine demography and
evolution. Nature 491(7424):393-398.
Groenen MAM (2015). Development of a high-density Axiom® porcine genotyping array
to meet research and commercial needs. Plant & Animal Genome XXIII
Conference, San Diego, CA.
Grunert K (2005). Food quality and safety: consumer perception and demand. European
Review of Agricultural Economics 32:369-391.
Guillou H, Zadravec D, Martin PG, Jacobsson A (2010). The key roles of elongases and
desaturases in mammalian fatty acid metabolism: Insights from transgenic mice.
Progress in Lipid Research 49(2):186-99.
Haley CS, Archibald AL, Andersson L, Bosma AA, Davies W, Fredholm M, et al. (1990).
The pig gene mapping project – pigmap. In: 4th World Congress on Genetics
Applied to Livestock Production, Edinburgh, p 67-70.
Hassen A, Wilson DE, Amin VR, Rouse GH, Hays CL (2001). Predicting percentage of
intramuscular fat using two types of real-time ultrasound equipment. Journal of
Animal Science 79(1):11-8.
Heidt H, Cinar MU, Uddin MJ, Looft C, Jüngst H, Tesfaye D, et al. (2013). A genetical
genomics approach reveals new candidates and confirms known candidate genes
for drip loss in a porcine resource population. Mammalian Genome 24(9-10):416-26.
Henson S (2000). The process of food quality belief formation from a consumer
perspective. In: Becker T, editor. Quality policy and consumer behaviour in the
European Union. Kiel, 73-89.
Heuven HCM, van Wijk HJ, van Arendonk JAM (2003). Combining traditional breeding
and genomics to improve pork quality. Outlook on Agriculture 32:235-239.

Genomic and functional genomic analysis of fatty acid composition in swine
194
Hocquette JF (2005). Where are we in genomics? Journal of Physiology and Pharmacology
56(Suppl 3):37–70.
Hocquette JF, Gondret F, Baéza E, Médale F, Jurie C, Pethick DW (2010). Intramuscular
fat content in meat-producing animals: development, genetic and nutritional
control, and identification of putative markers. Animal 4(2):303-19.
Hodgson RR, Davis GW, Smith GC, Savell JW, Cross HR (1991). Relationships between
pork loin palatability traits and physical characteristics of cooked chops. Journal of
Animal Science 69(12):4858-65.
Hovenier R, Kanis E, van Asseldonk T, Westerink NG (1993). Breeding for pig meat
quality in halothane-negative populations – a review. Pig News and Information
14:17N-25N.
Hu ZL, Park CA, Wu XL, Reecy JM (2013). Animal QTLdb: an improved database tool for
livestock animal QTL/association data dissemination in the post-genome era.
Nucleic acids research 41(Database issue):D871-9.
Huff-Lonergan E, Baas TJ, Malek M, Dekkers JC, Prusa K, Rothschild MF (2002).
Correlations among selected pork quality traits. Journal of Animal Science 80(3):617-
27.
Humphray SJ, Scott CE, Clark R, Marron B, Bender C, Camm N, et al. (2007). A high
utility integrated map of the pig genome. Genome Biology 8(7):R139.
Hurd PJ, Nelson CJ (2009). Advantages of next-generation sequencing versus the
microarray in epigenetic research. Briefings in Functional Genomics & Proteomics
8(3):174-83.
Jansen RC, Nap JP (2001). Genetical genomics: the added value from segregation. Trends in
Genetics 17(7):388-91.
Jayakumar A, Tai MH, Huang WY, al-Feel W, Hsu M, Abu-Elheiga L, et al. (1995). Human
fatty acid synthase: properties and molecular cloning. Proceedings of the National
Academy of Sciences of the United States of America 92(19):8695-9.
References
195
Jiang J, Wang J, Wang H, Zhang Y, Kang H, Feng X, et al. (2014). Global copy number
analyses by next generation sequencing provide insight into pig genome variation.
BMC Genomics 15:593.
Jiang S, Wei H, Song T, Yang Y, Peng J, Jiang S (2013). Transcriptome comparison
between porcine subcutaneous and intramuscular stromal vascular cells during
adipogenic differentiation. PLoS One 8(10):e77094.
Johansson Moller M, Chaudhary R, Hellmén E, Höyheim B, Chowdhary B, Andersson L
(1996). Pigs with the dominant white coat color phenotype carry a duplication of
the KIT gene encoding the mast/stem cell growth factor receptor. Mammalian
genome 7(11):822-30.
Jump DB (2004). Fatty acid regulation of gene transcription. Critical Reviews in Clinical
Laboratory Sciences 41(1):41-78.
Kadarmideen HN, von Rohr P, Janss LL (2006). From genetical genomics to systems
genetics: potential applications in quantitative genomics and animal breeding.
Mammalian Genome 17(6):548-64.
Kijas JM, Moller M, Plastow G, Andersson L (2001). A frameshift mutation in MC1R and
a high frequency of somatic reversions cause black spotting in pigs. Genetics
158(2):779-85.
Kim JH, Lim HT, Park EW, Rodríguez C, Silio L, Varona L, et al. (2006) Polymorphisms in
the promoter region of the porcine acyl-coA dehydrogenase, medium-chain
(ACADM) gene have no effect on fat deposition traits in a pig Iberian x Landrace
cross. Animal Genetics 37(4):430-1.
Kim KS, Larsen N, Short T, Plastow G, Rothschild MF (2000). A missense variant of the
porcine melanocortin-4 receptor (MC4R) gene is associated with fatness, growth,
and feed intake traits. Mammalian Genome 11(2):131-5.
Kingsmore SF, Lindquist IE, Mudge J, Gessler DD, Beavis WD (2008). Genome-wide
association studies: progress and potential for drug discovery and development.
Nature Reviews. Drug Discovery 7(3):221-30.
Genomic and functional genomic analysis of fatty acid composition in swine
196
Kmieć M, Terman A (2006). Associations between the prolactin receptor gene
polymorphism and reproductive traits of boars. Journal of Applied Genetics 47(2):139-
41.
Knap PW, Sosnicki AA, Klont RE, Lacoste A (2002) Simultaneous improvement of meat
quality and growth-and-carcass traits in pigs. Proceedings of the 7th World Congress on
Genetics Applied to Livestock Production 31:339-346.
Kuhajda FP, Jenner K, Wood FD, Hennigar RA, Jacobs LB, Dick JD, et al. (1994). Fatty
acid synthesis: a potential selective target for antineoplastic therapy. Proceedings of the
National Academy of Sciences of the United States of America 91(14):6379-83.
Kurył J, Pierzchała M (2001). Association of POU1F1/RsaI genotypes with carcass traits
in pigs. Journal of Applied Genetics 42(3):309-16.
Laliotis GP, Bizelis I, Rogdakis E (2010). Comparative Approach of the de novo Fatty
Acid Synthesis (Lipogenesis) between Ruminant and Non Ruminant Mammalian
Species: From Biochemical Level to the Main Regulatory Lipogenic Genes. Current
Genomics 11(3):168-83.
Latorre P, Burgos C, Hidalgo J, Varona L, Carrodeguas JA, López-Buesa P (2016).
c.A2456C-substitution in Pck1 changes the enzyme kinetic and functional
properties modifying fat distribution in pigs. Scientific Reports 6:19617.
Leonard AE, Pereira SL, Sprecher H, Huang YS (2004). Elongation of long-chain fatty
acids. Progress in Lipid Research 43(1):36-54.
Li H, Lu L, Manly KF, Chesler EJ, Bao L, Wang J, et al. (2005). Inferring gene
transcriptional modulatory relations: a genetical genomics approach. Human
Molecular Genetics 14(9):1119-25.
Li H (2013). Systems genetics in "-omics" era: current and future development. Theory in
Biosciences 132(1):1-16.
Li XJ, Yang H, Li GX, Zhang GH, Cheng J, Guan H, et al. (2012a). Transcriptome profile
analysis of porcine adipose tissue by high-throughput sequencing. Animal Genetics
43(2):144-52.

References
197
Li Y, Mei S, Zhang X, Peng X, Liu G, Tao H, et al. (2012b). Identification of genome-wide
copy number variations among diverse pig breeds by array CGH. BMC Genomics
13:725.
Liaubet L, Lobjois V, Faraut T, Tircazes A, Benne F, Iannuccelli N, et al. (2011). Genetic
variability of transcript abundance in pig peri-mortem skeletal muscle: eQTL
localized genes involved in stress response, cell death, muscle disorders and
metabolism. BMC Genomics 12:548.
Lim D, Chai HH, Lee SH, Cho YM, Choi JW, Kim NK (2015). Gene Expression Patterns
Associated with Peroxisome Proliferator-activated Receptor (PPAR) Signaling in
the Longissimus dorsi of Hanwoo (Korean Cattle). Asian-Australasian Journal of
Animal Sciences 28(8):1075-83.
Lonergan SM, Stalder KJ, Huff-Lonergan E, Knight TJ, Goodwin RN, Prusa KJ, et al.
(2007). Influence of lipid content on pork sensory quality within pH classification.
Journal of Animal Science 85(4):1074-9.
Lorenzo DN, Healy JA, Hostettler J, Davis J, Yang J, Wang C, et al. (2015). Ankyrin-B
metabolic syndrome combines age-dependent adiposity with pancreatic β cell
insufficiency. The Journal of Clinical Investigation 125(8):3087-102.
Manunza A, Casellas J, Quintanilla R, González-Prendes R, Pena RN, Tibau J, et al. (2014).
A genome-wide association analysis for porcine serum lipid traits reveals the
existence of age-specific genetic determinants. BMC Genomics 15:758.
Margulies M, Egholm M, Altman WE, Attiya S, Bader JS, Bemben LA, et al. (2005)
Genome sequencing in microfabricated high-density picolitre reactors. Nature
437(7057): 376-80.
Martínez-Montes AM, Fernández A, Pérez-Montarelo D, Alves E, Benítez RM, Nuñez Y,
et al. (2017a). Using RNA-Seq SNP data to reveal potential causal mutations related
to pig production traits and RNA editing. Animal Genetics 48(2):151-165.
Martínez-Montes AM, Muiños-Bühl A, Fernández A, Folch JM, Ibáñez-Escriche N,
Fernández AI (2017b). Deciphering the regulation of porcine genes influencing

Genomic and functional genomic analysis of fatty acid composition in swine
198
growth, fatness and yield-related traits through genetical genomics. Mammalian
Genome 28(3-4):130-142.
Melin J, Quake SR (2007). Microfluidic large-scale integration: the evolution of design rules
for biological automation. Annual Review of Biophysics and Biomolecular Structure 36:213-
31.
Mercadé A, Estellé J, Noguera JL, Folch JM, Varona L, Silió L, et al. (2005a). On growth,
fatness, and form: a further look at porcine chromosome 4 in an Iberian x Landrace
cross. Mammalian Genome 16(5):374-82.
Mercadé A, Sánchez A, Folch JM (2005b). Exclusion of the acyl CoA:diacylglycerol
acyltransferase 1 gene (DGAT1) as a candidate for a fatty acid composition QTL
on porcine chromosome 4. Journal of Animal Breeding and Genetics 122(3):161-4.
Mercadé A, Estellé J, Pérez-Enciso M, Varona L, Silió L, Noguera JL, et al. (2006a).
Characterization of the porcine acyl-CoA synthetase long-chain 4 gene and its
association with growth and meat quality traits. Animal Genetics 37(3):219-24.
Mercadé A, Pérez-Enciso M, Varona L, Alves E, Noguera JL, Sánchez A, et al. (2006b).
Adipocyte fatty-acid binding protein is closely associated to the porcine FAT1 locus
on chromosome 4. Journal of Animal Science 84(11):2907-13.
Mercadé A, Sánchez A, Folch JM (2007). Characterization and physical mapping of the
porcine CDS1 and CDS2 genes. Animal Biotechnology 18(1):23-35.
Metzker ML (2010). Sequencing technologies - the next generation. Nature Review. Genetics
11(1):31-46.
Meuwissen TH, Goddard ME (2000). Fine mapping of quantitative trait loci using linkage
disequilibria with closely linked marker loci. Genetics 155(1):421-30.
Meuwissen TH, Goddard ME (2004). Mapping multiple QTL using linkage disequilibrium
and linkage analysis information and multitrait data. Genetics Selection Evolution
36(3):261-79.

References
199
Michaelson JJ, Loguercio S, Beyer A (2009). Detection and interpretation of expression
quantitative trait loci (eQTL). Methods : a Companion to Methods in Enzymology
48(3):265-76.
Milan D, Jeon JT, Looft C, Amarger V, Robic A, Thelander M, et al. (2000). A mutation in
PRKAG3 associated with excess glycogen content in pig skeletal muscle. Science
288(5469):1248-51.
Miller CA, Hampton O, Coarfa C, Milosavljevic A (2011). ReadDepth: a parallel R package
for detecting copy number alterations from short sequencing reads. PLoS One
6(1):e16327.
Moon S, Kim TH, Lee KT, Kwak W, Lee T, Lee SW, et al. (2015). A genome-wide scan for
signatures of directional selection in domesticated pigs. BMC Genomics 16:130.
Morley M, Molony CM, Weber TM, Devlin JL, Ewens KG, Spielman RS, et al. (2004).
Genetic analysis of genome-wide variation in human gene expression. Nature
430(7001):743-7.
Morozova O, Marra MA (2008). Applications of next-generation sequencing technologies
in functional genomics. Genomics 92(5):255-64.
Mortazavi A, Williams BA, McCue K, Schaeffer L, Wold B (2008). Mapping and
quantifying mammalian transcriptomes by RNA-Seq. Nature Methods 5(7):621-8.
Muñoz G, Alves E, Fernández A, Ovilo C, Barragán C, Estellé J, et al. (2007). QTL
detection on porcine chromosome 12 for fatty-acid composition and association
analyses of the fatty acid synthase, gastric inhibitory polypeptide and acetyl-
coenzyme A carboxylase alpha genes. Animal Genetics 38(6):639-46.
Muñoz G, Ovilo C, Silió L, Tomás A, Noguera JL, Rodríguez MC (2009). Single- and joint-
population analyses of two experimental pig crosses to confirm quantitative trait
loci on Sus scrofa chromosome 6 and leptin receptor effects on fatness and growth
traits. Journal of Animal Science 87(2):459-68.
Muñoz M, Fernández AI, Ovilo C, Muñoz G, Rodriguez C, Fernández A, et al. (2010).
Non-additive effects of RBP4, ESR1 and IGF2 polymorphisms on litter size at

Genomic and functional genomic analysis of fatty acid composition in swine
200
different parities in a Chinese-European porcine line. Genetics Selection Evolution
42:23.
Muñoz M, Rodríguez MC, Alves E, Folch JM, Ibañez-Escriche N, Silió L, et al. (2013).
Genome-wide analysis of porcine backfat and intramuscular fat fatty acid
composition using high-density genotyping and expression data. BMC Genomics
14:845.
Nafikov RA, Beitz DC (2007). Carbohydrate and lipid metabolism in farm animals. The
Journal of Nutrition 137(3):702-5.
Nakamura MT, Nara TY (2004). Structure, function, and dietary regulation of delta6,
delta5, and delta9 desaturases. Annual Review of Nutrition 24:345-76
Newcom DW, Baas TJ, Lampe JF (2002). Prediction of intramuscular fat percentage in live
swine using real-time ultrasound. Journal of Animal Science 80(12):3046-3052.
Noguera JL, Varona L, Gómez-Raya L, Sánchez A, Babot D, Estany J, et al. (2003).
Estrogen receptor polymorphism in Landrace pigs and its association with litter
size performance. Livestock Production Science 82:53-59.
Nonneman D, Lindholm-Perry AK, Shackelford SD, King DA, Wheeler TL, Rohrer GA,
et al. (2011). Predictive markers in calpastatin for tenderness in commercial pig
populations. Journal of Animal Science 89(9):2663-72.
Ntawubizi M, Colman E, Janssens S, Raes K, Buys N, De Smet S (2010). Genetic
parameters for intramuscular fatty acid composition and metabolism in pigs. Journal
of Animal Science 88(4):1286-94.
Nürnberg K, Wegner J, Ender K (1998). Factors influencing fat composition in muscle and
adipose tissue of farm animals. Livestock Production Science 56:145–156.
O’Brien PJ, MacLennan DH (1992). Application in the swine industry of a DNA-based test
for porcine stress syndrome. Proceedings 23:433–435.

References
201
O'Hea EK, Leveille GA (1969). Significance of adipose tissue and liver as sites of fatty acid
synthesis in the pig and the efficiency of utilization of various substrates for
lipogenesis. The Journal of Nutrition 99(3):338-44.
Ojeda A, Rozas J, Folch JM, Pérez-Enciso M (2006). Unexpected high polymorphism at
the FABP4 gene unveils a complex history for pig populations. Genetics
174(4):2119-27.
Onteru SK, Ross JW, Rothschild MF (2009). The role of gene discovery, QTL analyses and
gene expression in reproductive traits in the pig. Society of Reproduction and Fertility
Supplement 66:87-102.
Ovilo C, Pérez-Enciso M, Barragán C, Clop A, Rodríquez C, Oliver MA, et al. (2000). A
QTL for intramuscular fat and backfat thickness is located on porcine chromosome
6. Mammalian Genome 11(4):344-6.
Ovilo C, Clop A, Noguera JL, Oliver MA, Barragán C, Rodriguez C, et al. (2002).
Quantitative trait locus mapping for meat quality traits in an Iberian x Landrace F2
pig population. Journal of Animal Science 80(11):2801-8.
Ovilo C, Fernández A, Noguera JL, Barragán C, Letón R, Rodríguez C, et al. (2005). Fine
mapping of porcine chromosome 6 QTL and LEPR effects on body composition
in multiple generations of an Iberian by Landrace intercross. Genetics Research
85(1):57-67.
Paton CM, Ntambi JM (2009). Biochemical and physiological function of stearoyl-CoA
desaturase. American journal of physiology. Endocrinology and Metabolism 297(1):E28-37.
Paudel Y, Madsen O, Megens HJ, Frantz LA, Bosse M, Bastiaansen JW, et al. (2013).
Evolutionary dynamics of copy number variation in pig genomes in the context of
adaptation and domestication. BMC Genomics 14:449.
Paudel Y, Madsen O, Megens HJ, Frantz LA, Bosse M, Crooijmans RP, et al. (2015). Copy
number variation in the speciation of pigs: a possible prominent role for olfactory
receptors. BMC Genomics 16:330.
Genomic and functional genomic analysis of fatty acid composition in swine
202
Pena RN, Noguera JL, Casellas J, Díaz I, Fernández AI, Folch JM, et al. (2013).
Transcriptional analysis of intramuscular fatty acid composition in the longissimus
thoracis muscle of Iberian × Landrace back-crossed pigs. Animal Genetics 44(6):648-
60.
Pérez-Enciso M, Clop A, Noguera JL, Ovilo C, Coll A, Folch JM, et al. (2000). A QTL on
pig chromosome 4 affects fatty acid metabolism: evidence from an Iberian by
Landrace intercross. Journal of Animal Science 78(10):2525-31.
Pérez-Enciso M, Clop A, Folch JM, Sánchez A, Oliver MA, Ovilo C, et al. (2002).
Exploring alternative models for sex-linked quantitative trait loci in outbred
populations: application to an iberian x landrace pig intercross. Genetics 161(4):1625-
32.
Pérez-Enciso M, Mercadé A, Bidanel JP, Geldermann H, Cepica S, Bartenschlager H, et al.
(2005). Large-scale, multibreed, multitrait analyses of quantitative trait loci
experiments: the case of porcine X chromosome. Journal of Animal Science
83(10):2289-96.
Pérez-Montarelo D, Madsen O, Alves E, Rodríguez MC, Folch JM, Noguera JL, et al.
(2014). Identification of genes regulating growth and fatness traits in pig through
hypothalamic transcriptome analysis. Physiological Genomics 46(6):195-206.
Petersen AK, Krumsiek J, Wägele B, Theis FJ, Wichmann HE, Gieger C, et al. (2012). On
the hypothesis-free testing of metabolite ratios in genome-wide and metabolome-
wide association studies. BMC Bioinformatics 13:120.
Petretto E, Mangion J, Dickens NJ, Cook SA, Kumaran MK, Lu H, et al. (2006).
Heritability and tissue specificity of expression quantitative trait loci. PLoS Genetics
2(10):e172.
Pitchford WS, Deland MP, Siebert BD, Malau-Aduli AE, Bottema CD (2002). Genetic
variation in fatness and fatty acid composition of crossbred cattle. Journal of Animal
Science 80(11):2825-32.
Plastow GS, Carrión D, Gil M, García-Regueiro JA, I Furnols MF, Gispert M, et al. (2005).
Quality pork genes and meat production. Meat Science 70(3):409-21.

References
203
Ponsuksili S, Jonas E, Murani E, Phatsara C, Srikanchai T, Walz C, et al. (2008). Trait
correlated expression combined with expression QTL analysis reveals biological
pathways and candidate genes affecting water holding capacity of muscle. BMC
Genomics 9:367.
Ponsuksili S, Murani E, Schwerin M, Schellander K, Wimmers K (2010). Identification of
expression QTL (eQTL) of genes expressed in porcine M. longissimus dorsi and
associated with meat quality traits. BMC Genomics 11:572.
Ponsuksili S, Murani E, Brand B, Schwerin M, Wimmers K (2011). Integrating expression
profiling and whole-genome association for dissection of fat traits in a porcine
model. Journal of Lipid Research 52(4):668-78.
Ponsuksili S, Du Y, Murani E, Schwerin M, Wimmers K (2012). Elucidating molecular
networks that either affect or respond to plasma cortisol concentration in target
tissues of liver and muscle. Genetics 192(3):1109-22.
Ponsuksili S, Murani E, Trakooljul N, Schwerin M, Wimmers K (2014). Discovery of
candidate genes for muscle traits based on GWAS supported by eQTL-analysis.
International Journal of Biological Sciences 10(3):327-37.
Porter V (1993). Pigs: A Handbook to the Breeds of the World. Mountfield, East Sussex:
Helm Information, Ltd.
Poudyal H, Panchal SK, Diwan V, Brown L (2011). Omega-3 fatty acids and metabolic
syndrome: effects and emerging mechanisms of action. Progress in Lipid Research
50(4):372-87.
Puig-Oliveras A, Ramayo-Caldas Y, Corominas J, Estellé J, Pérez-Montarelo D, Hudson
NJ, et al. (2014a). Differences in muscle transcriptome among pigs phenotypically
extreme for fatty acid composition. PLoS One 9(6):e99720.
Puig-Oliveras A, Ballester M, Corominas J, Revilla M, Estellé J, Fernández AI, et al.
(2014b). A co-association network analysis of the genetic determination of pig
conformation, growth and fatness. PLoS One 9(12):e114862.
Puig-Oliveras A, Revilla M, Castelló A, Fernández AI, Folch JM, Ballester M (2016).
Expression-based GWAS identifies variants, gene interactions and key regulators
Genomic and functional genomic analysis of fatty acid composition in swine
204
affecting intramuscular fatty acid content and composition in porcine meat. Scientific
Reports 6:31803.
Raj S, Skiba G, Weremko D, Fandrejewski H, Migdał W, Borowiec F, et al. (2010) The
relationship between the chemical composition of the carcass and the fatty acid
composition of intramuscular fat and backfat of several pig breeds slaughtered at
different weights. Meat Science 86(2):324-30.
Ralston JC, Matravadia S, Gaudio N, Holloway GP, Mutch DM (2015). Polyunsaturated
fatty acid regulation of adipocyte FADS1 and FADS2 expression and function.
Obesity 23(4):725-8.
Ramayo-Caldas Y, Castelló A, Pena RN, Alves E, Mercadé A, Souza CA, et al. (2010). Copy
number variation in the porcine genome inferred from a 60 k SNP BeadChip. BMC
Genomics 11:593.
Ramayo-Caldas Y, Mach N, Esteve-Codina A, Corominas J, Castelló A, Ballester M, et al.
(2012a). Liver transcriptome profile in pigs with extreme phenotypes of
intramuscular fatty acid composition. BMC Genomics 13:547.
Ramayo-Caldas Y, Mercadé A, Castelló A, Yang B, Rodríguez C, Alves E, et al. (2012b).
Genome-wide association study for intramuscular fatty acid composition in an
Iberian × Landrace cross. Journal of Animal Science 90(9):2883-93.
Ramayo-Caldas Y, Ballester M, Fortes MR, Esteve-Codina A, Castelló A, Noguera JL, et al.
(2014). From SNP co-association to RNA co-expression: novel insights into gene
networks for intramuscular fatty acid composition in porcine. BMC Genomics
15:232.
Ramírez O, Burgos-Paz W, Casas E, Ballester M, Bianco E, Olalde I, et al. (2015). Genome
data from a sixteenth century pig illuminate modern breed relationships. Heredity
114(2):175-84.
Ramos AM, Crooijmans RP, Affara NA, Amaral AJ, Archibald AL, Beever JE, et al. (2009).
Design of a high density SNP genotyping assay in the pig using SNPs identified and
characterized by next generation sequencing technology. PLoS One 4(8):e6524.

References
205
Raudsepp T, Chowdhary BP (2011). Cytogenetics and chromosome maps. In: Rothschild
MF, Ruvinsky A, editors. The genetics of the pig. 2nd ed. Wallingford: CABI, p.
134–78.
Reiner G, Dreher F, Drungowski M, Hoeltig D, Bertsch N, Selke M, et al. (2014). Pathway
deregulation and expression QTLs in response to Actinobacillus pleuropneumoniae
infection in swine. Mammalian Genome 25(11-12):600-17.
Reverter A, Fortes MR (2013). Association weight matrix: a network-based approach
towards functional genome-wide association studies. Methods in Molecular Biology
1019:437-47.
Revilla M, Ramayo-Caldas Y, Castelló A, Corominas J, Puig-Oliveras A, Ibáñez-Escriche
N, et al. (2014). New insight into the SSC8 genetic determination of fatty acid
composition in pigs. Genetics Selection Evolution 46:28.
Ritchie MD, Holzinger ER, Li R, Pendergrass SA, Kim D (2015). Methods of integrating
data to uncover genotype-phenotype interactions. Nature Reviews. Genetics 16(2):85-
97.
Roberts A, Pimentel H, Trapnell C, Pachter L (2011). Identification of novel transcripts in
annotated genomes using RNA-Seq. Bioinformatics 27(17):2325-9.
Rockman MV, Kruglyak L (2006). Genetics of global gene expression. Nature Review.
Genetics 7(11):862-72.
Rosen ED, Walkey CJ, Puigserver P, Spiegelman BM (2000). Transcriptional regulation of
adipogenesis. Genes & Development 14(11):1293-307.
Rothschild M, Jacobson C, Vaske D, Tuggle C, Wang L, Short T, et al. (1996). The estrogen
receptor locus is associated with a major gene influencing litter size in pigs.
Proceedings of the National Academy of Sciences of the United States of America 93(1):201-5.
Rothschild MF, Messer L, Day A, Wales R, Short T, Southwood O, et al. (2000).
Investigation of the retinol-binding protein 4 (RBP4) gene as a candidate gene for
increased litter size in pigs. Mammalian Genome 11(1):75-7.
Genomic and functional genomic analysis of fatty acid composition in swine
206
Rubin CJ, Megens HJ, Martinez Barrio A, Maqbool K, Sayyab S, Schwochow D, et al.
(2012). Strong signatures of selection in the domestic pig genome. Proceedings of the
National Academy of Sciences of the United States of America 109(48):19529-36.
Rudel LL, Parks JS, Sawyer JK (1995). Compared with dietary monounsaturated and
saturated fat, polyunsaturated fat protects African green monkeys from coronary
artery atherosclerosis. Arteriosclerosis, Thrombosis, and Vascular Biology 15(12):2101-10.
Salmon Hillbertz NH, Isaksson M, Karlsson EK, Hellmén E, Pielberg GR, Savolainen P, et
al. (2007). Duplication of FGF3, FGF4, FGF19 and ORAOV1 causes hair ridge
and predisposition to dermoid sinus in Ridgeback dogs. Nature Genetics 39(11):1318-
20.
Samorè AB, Fontanesi L (2016). Genomic selection in pigs: state of the art and
perspectives, Italian Journal of Animal Science 15:211-232.
Samulin J, Berget I, Lien S, Sundvold H (2008). Differential gene expression of fatty acid
binding proteins during porcine adipogenesis. Comparative Biochemistry and Physiology.
Part B, Biochemistry & Molecular Biology 151(2):147-52.
Schadt EE, Monks SA, Drake TA, Lusis AJ, Che N, Colinayo V, et al. (2003). Genetics of
gene expression surveyed in maize, mouse and man. Nature 422(6929):297-302.
Schena M, Shalon D, Davis RW, Brown PO (1995). Quantitative monitoring of gene
expression patterns with a complementary DNA microarray. Science 270(5235):467-
70.
Schiavo G, Dolezal MA, Scotti E, Bertolini F, Calò DG, Galimberti G, et al. (2014). Copy
number variants in Italian Large White pigs detected using high-density single
nucleotide polymorphisms and their association with back fat thickness. Animal
Genetics 45(5):745-9.
Schook LB, Beever JE, Rogers J, Humphray S, Archibald A, Chardon P, et al. (2005). Swine
Genome Sequencing Consortium (SGSC): a strategic roadmap for sequencing the
pig genome. Comparative and Functional Genomics 6(4):251-5.
References
207
Sellier P (1998). Genetics of meat and carcass traits. The genetics of the pig. Rothschild
MF, Ruvinsky A, editors. Oxon, UK: CAB International, 463-510.
Seroussi E, Glick G, Shirak A, Yakobson E, Weller JI, Ezra E, et al. (2010). Analysis of
copy loss and gain variations in Holstein cattle autosomes using BeadChip SNPs.
BMC Genomics 11:673.
Serra X, Gil F, Pérez-Enciso M, Oliver MA, Vázquez JM, Gispert M, et al. (1998). A
comparison of carcass, meat quality and histochemical characteristics of Iberian
(Guadyerbas line) and Landrace pigs. Livestock Production Science 56:215–223.
Snijders AM, Nowak N, Segraves R, Blackwood S, Brown N, Conroy J, et al. (2001).
Assembly of microarrays for genome-wide measurement of DNA copy number.
Nature Genetics 29(3):263-4.
Sodhi SS, Park WC, Ghosh M, Kim JN, Sharma N, Shin KY, et al. (2014). Comparative
transcriptomic analysis to identify differentially expressed genes in fat tissue of adult
Berkshire and Jeju Native Pig using RNA-seq. Molecular Biology Reports 41(9):6305-
15.
Song CY, Gao B, Teng SH, Wang XY, Xie F, Chen GH, et al. (2007). Polymorphisms in
intron 1 of the porcine POU1F1 gene. Journal of Applied Genetics 48(4):371-4.
Spurgeon SL, Jones RC, Ramakrishnan R (2008). High throughput gene expression
measurement with real time PCR in a microfluidic dynamic array. PLoS One
3(2):e1662.
Steibel JP, Bates RO, Rosa GJ, Tempelman RJ, Rilington VD, Ragavendran A, et al. (2011).
Genome-wide linkage analysis of global gene expression in loin muscle tissue
identifies candidate genes in pigs. PLoS One 6(2):e16766.
Su Z, Li Z, Chen T, Li QZ, Fang H, Ding D, et al. (2011). Comparing next-generation
sequencing and microarray technologies in a toxicological study of the effects of
aristolochic acid on rat kidneys. Chemical Research in Toxicology 24(9):1486-93.
Suravajhala P, Kogelman LJ, Kadarmideen HN (2016). Multi-omic data integration and
analysis using systems genomics approaches: methods and applications in animal
production, health and welfare. Genetics Selection Evolution 48(1):38.
Genomic and functional genomic analysis of fatty acid composition in swine
208
Suzuki K, Irie M, Kadowaki H, Shibata T, Kumagai M, Nishida A (2005). Genetic
parameter estimates of meat quality traits in Duroc pigs selected for average daily
gain, longissimus muscle area, backfat thickness, and intramuscular fat content.
Journal of Animal Science 83(9):2058-65.
Szostak A, Ogłuszka M, Te Pas MF, Poławska E, Urbański P, Juszczuk-Kubiak E, et al.
(2016). Effect of a diet enriched with omega-6 and omega-3 fatty acids on the pig
liver transcriptome. Genes & Nutrition 11:9.
Tarling E, Salter A, Bennett A (2004). Transcriptional regulation of human SREBP-1c
(sterol-regulatory-element-binding protein-1c): a key regulator of lipogenesis.
Biochemical Society Transactions 32(Pt 1):107-9.
Teo SM, Pawitan Y, Ku CS, Chia KS, Salim A (2012). Statistical challenges associated with
detecting copy number variations with next-generation sequencing. Bioinformatics
28(21):2711-8.
Tomás A, Casellas J, Ramírez O, Muñoz G, Noguera JL, Sánchez A (2006). High amino
acid variation in the intracellular domain of the pig prolactin receptor (PRLR) and
its relation to ovulation rate and piglet survival traits. Journal of Animal Science
84(8):1991-8.
Toro MA, Rodrigañez J, Silió L, Rodríguez C (2000). Genealogical analysis of a closed herd
of black hairless Iberian pigs. Conservation Biology 14:1743-1851.
Tuggle CK, Dekkers JC, Reecy JM (2006). Integration of structural and functional
genomics. Animal Genetics 37 Suppl 1:1-6.
Van Laere AS, Nguyen M, Braunschweig M, Nezer C, Collette C, Moreau L, et al. (2003). A
regulatory mutation in IGF2 causes a major QTL effect on muscle growth in the
pig. Nature 425(6960):832-6.
Varona L, Ovilo C, Clop A, Noguera JL, Pérez-Enciso M, Coll A, et al. (2002). QTL
mapping for growth and carcass traits in an Iberian by Landrace pig intercross:
additive, dominant and epistatic effects. Genetic Research 80(2):145-54.
References
209
Verbeke W, Viaene J (1999). Beliefs, attitude and behaviour towards fresh meat
consumption in Belgium: empirical evidence from a consumer survey. Food Quality
and Preference 10:437-445.
Veroneze R, Lopes PS, Guimarães SE, Silva FF, Lopes MS, Harlizius B, et al. (2013).
Linkage disequilibrium and haplotype block structure in six commercial pig lines.
Journal of Animal Science 91(8):3493-501.
Vitti JJ, Grossman SR, Sabeti PC (2013). Detecting natural selection in genomic data.
Annual Review of Genetics 47:97-120.
Volpe JJ, Vagelos PR (1976). Mechanisms and regulation of biosynthesis of saturated fatty
acids. Physiological Reviews 56(2):339-417.
Wang Z, Gerstein M, Snyder M (2009). RNA-Seq: a revolutionary tool for transcriptomics.
Nature Reviews. Genetics 10(1):57-63.
Wang SJ, Liu WJ, Yang LG, Sargent CA, Liu HB, Wang C, et al. (2012a). Effects of FUT1
gene mutation on resistance to infectious disease. Molecular Biology Reports
39(3):2805-10.
Wang J, Jiang J, Fu W, Jiang L, Ding X, Liu JF, et al. (2012b). A genome-wide detection of
copy number variations using SNP genotyping arrays in swine. BMC Genomics
13:273.
Wang T, Jiang A, Guo Y, Tan Y, Tang G, Mai M, et al. (2013a). Deep sequencing of the
transcriptome reveals inflammatory features of porcine visceral adipose tissue.
International Journal of Biological Sciences 9(6):550-6.
Wang J, Wang H, Jiang J, Kang H, Feng X, Zhang Q, et al. (2013b). Identification of
genome-wide copy number variations among diverse pig breeds using SNP
genotyping arrays. PLoS One 8(7):e68683.
Wang L, Liu X, Zhang L, Yan H, Luo W, Liang J, et al. (2013c). Genome-wide copy
number variations inferred from SNP genotyping arrays using a Large White and
Minzhu intercross population. PLoS One 8(10):e74879.

Genomic and functional genomic analysis of fatty acid composition in swine
210
Wang J, Jiang J, Wang H, Kang H, Zhang Q, Liu JF (2014a). Enhancing genome-wide copy
number variation identification by high density array CGH using diverse resources
of pig breeds. PLoS One 9(1):e87571.
Wang Y, Tang Z, Sun Y, Wang H, Wang C, Yu S, et al. (2014b). Analysis of genome-wide
copy number variations in Chinese indigenous and western pig breeds by 60 K SNP
genotyping arrays. PLoS One 9(9):e106780.
Wang H, Wang C, Yang K, Liu J, Zhang Y, Wang Y, et al. (2015a). Genome Wide
Distributions and Functional Characterization of Copy Number Variations between
Chinese and Western Pigs. PLoS One 10(7):e0131522.
Wang L, Xu L, Liu X, Zhang T, Li N, Hay el H, et al. (2015b). Copy number variation-
based genome wide association study reveals additional variants contributing to
meat quality in Swine. Scientific Reports 2015 5:12535.
Watkins PA, Maiguel D, Jia Z, Pevsner J (2007). Evidence for 26 distinct acyl-coenzyme A
synthetase genes in the human genome. Journal of Lipid Research 48(12):2736-50.
Weis BK (2005). Standardizing global gene expression analysis between laboratories and
across platforms. Nature Methods 2:351–6.
Wiedmann RT, Nonneman DJ, Rohrer GA (2015). Genome-Wide Copy Number
Variations Using SNP Genotyping in a Mixed Breed Swine Population. PLoS One
10(7):e0133529.
Wimmers K, Murani E, Te Pas MF, Chang KC, Davoli R, Merks JW, et al. (2007).
Associations of functional candidate genes derived from gene-expression profiles of
prenatal porcine muscle tissue with meat quality and muscle deposition. Animal
Genetics 38(5):474-84.
Wimmers K, Murani E, Ponsuksili S (2010). Functional genomics and genetical genomics
approaches towards elucidating networks of genes affecting meat performance in
pigs. Briefings in Functional Genomics 9(3):251-8.
Woelders H, Te Pas MF, Bannink A, Veerkamp RF, Smits MA (2011). Systems biology in
animal sciences. Animal 5(7):1036-47.

References
211
Wood JD, Nute GR, Richardson RI, Whittington FM, Southwood O, Plastow G, et al.
(2004). Effects of breed, diet and muscle on fat deposition and eating quality in
pigs. Meat Science 67(4):651-67.
Wood J, Whittemore C (2007). Pig Meat and Carcass Quality. In: Whittemore’s Science and
Practise of Pig Production (pp.4-64). Blackwell Publishing Ltd.
Xi R, Kim TM, Park PJ (2010). Detecting structural variations in the human genome using
next generation sequencing. Briefings in Functional Genomics 9(5-6):405-15.
Xie C, Tammi MT (2009). CNV-seq, a new method to detect copy number variation using
high-throughput sequencing. BMC Bioinformatics 10:80.
Xing K, Zhu F, Zhai L, Liu H, Wang Y, Wang Z, et al. (2015). Integration of transcriptome
and whole genomic resequencing data to identify key genes affecting swine fat
deposition. PLoS One 10(4):e0122396.
Xing K, Zhu F, Zhai L, Chen S, Tan Z, Sun Y, et al. (2016). Identification of genes for
controlling swine adipose deposition by integrating transcriptome, whole-genome
resequencing, and quantitative trait loci data. Scientific Reports 6:23219.
Yang B, Zhang W, Zhang Z, Fan Y, Xie X, Ai H, et al. (2013). Genome-wide association
analyses for fatty acid composition in porcine muscle and abdominal fat tissues.
PLoS One 8(6):e65554.
Yoon S, Xuan Z, Makarov V, Ye K, Sebat J (2009). Sensitive and accurate detection of
copy number variants using read depth of coverage. Genome Research 19(9):1586-92.
Yvert G, Brem RB, Whittle J, Akey JM, Foss E, Smith EN, et al. (2003). Trans-acting
regulatory variation in Saccharomyces cerevisiae and the role of transcription
factors. Nature Genetics 35(1):57-64.
Zhang W, Zhang J, Cui L, Ma J, Chen C, Ai H, et al. (2016a). Genetic architecture of fatty
acid composition in the longissimus dorsi muscle revealed by genome-wide
association studies on diverse pig populations. Genetics Selection Evolution 48:5.
Genomic and functional genomic analysis of fatty acid composition in swine
212
Zhang W, Bin Yang, Zhang J, Cui L, Ma J, Chen C, et al. (2016b). Genome-wide
association studies for fatty acid metabolic traits in five divergent pig populations.
Scientific Reports 6:24718.
Zhao M, Wang Q, Wang Q, Jia P, Zhao Z (2013). Computational tools for copy number
variation (CNV) detection using next-generation sequencing data: features and
perspectives. BMC Bioinformatics 14 Suppl 11:S1.
Zhu M, Yu M, Zhao S (2009). Understanding quantitative genetics in the systems biology
era. International Journal of Biological Sciences 5(2):161-70.

G Annexes
Chapter 7


Annexes
215
7.1. Supplementary material Paper I: “New insight into the SSC8 genetic
determination of fatty acid composition in pigs”
Paper I. Table S1: List of SNPs genotyped. List of 144 SNPs located on SCC8 genotyped
and genotyping statistics.
SNP Position (bp) in Sscrofa10.2 Call Rate MAF1 HWE2 Used3
ALGA0046149 5 172 632 1.000 0.434 0.7588 Yes
ASGA0037565 5 201 344 1.000 0.405 0.9446 Yes
ALGA0046317 6 295 586 1.000 0.382 0.7487 Yes
ALGA0107380 6 904 797 1.000 0.332 0.0077 Yes
ASGA0037637 7 207 103 0.983 0.403 0.9916 Yes
H3GA0024211 7 517 818 1.000 0.341 0.4600 Yes
ALGA0046233 7 551 522 1.000 0.323 0.3732 Yes
ALGA0046202 7 749 484 0.998 0.311 0.4007 Yes
ASGA0094688 8 840 160 1.000 0.489 0.9624 Yes
M1GA0011801 11 263 172 1.000 0.226 0.5501 Yes
MARC0043725 16 904 240 1.000 0.250 0.5419 Yes
ALGA0046694 17 889 049 0.998 0.301 0.4536 Yes
ASGA0038079 19 500 165 1.000 0.462 0.8768 Yes
DRGA0008376 20 845 249 0.989 0.282 0.6021 Yes
MARC0021747 24 600 093 1.000 0.054 0.5783 No
ALGA0119566 25 020 120 1.000 0.113 0.6745 Yes
DRGA0008477 28 972 036 0.998 0.176 0.3382 Yes
H3GA0024605 30 605 538 1.000 0.414 0.6937 Yes
M1GA0011887 31 525 187 0.998 0.317 0.6920 Yes
ASGA0038470 31 593 446 0.000 0.000 0.0000 No
ALGA0047421 32 984 498 1.000 0.317 0.0587 Yes
MARC0075877 33 365 922 1.000 0.340 0.8151 Yes
ALGA0047564 35 526 849 1.000 0.182 0.0727 Yes
ASGA0096723 37 029 609 1.000 0.429 0.2819 Yes
ALGA0047653 38 715 913 1.000 0.090 0.6344 Yes
ASGA0103358 38 771 285 1.000 0.102 0.5013 Yes
ALGA0047663 38 781 175 1.000 0.376 0.1396 Yes
ALGA0047689 39 851 468 1.000 0.376 0.1656 Yes
DRGA0008696 93 820 555 0.000 0.000 0.0000 No
ALGA0047829 47 560 329 1.000 0.300 0.7381 Yes
ASGA0038791 47 539 360 1.000 0.303 0.6720 Yes
M1GA0011935 47 434 157 0.989 0.305 0.6582 Yes
MARC0093074 50 223 543 0.994 0.099 0.7124 Yes
H3GA0024868 50 479 231 1.000 0.102 0.6594 Yes
DRGA0008588 51 580 681 1.000 0.156 0.1708 Yes
MARC0077695 53 929 233 0.994 0.163 0.1410 Yes

Genomic and functional genomic analysis of fatty acid composition in swine
216
SNP Position (bp) in Sscrofa10.2 Call Rate MAF1 HWE2 Used3
H3GA0024879 55 749 069 1.000 0.162 0.1449 Yes
ALGA0047923 58 000 986 1.000 0.171 0.1059 Yes
MARC0035425 58 302 878 1.000 0.171 0.1059 Yes
ALGA0047927 58 426 682 1.000 0.245 0.8957 Yes
ALGA0047962 63 000 451 1.000 0.245 0.8957 Yes
ALGA0047982 64 602 131 0.998 0.152 0.1024 Yes
ALGA0048001 66 072 630 1.000 0.152 0.1033 Yes
MARC0000554 67 026 060 1.000 0.152 0.1033 Yes
MARC0050311 67 597 907 0.998 0.341 0.1975 Yes
ALGA0048032 67 669 269 0.000 0.000 0.0000 No
ASGA0092219 76 673 290 0.998 0.170 0.9425 Yes
INRA0029891 72 390 046 0.000 0.000 0.0000 No
MARC0021611 72 567 179 1.000 0.065 0.7347 Yes
MARC0059165 72 678 010 1.000 0.065 0.7347 Yes
MARC0107119 73 117 361 1.000 0.089 0.4728 Yes
CASI0009910 73 108 818 0.998 0.090 0.4714 Yes
ALGA0048092 73 810 886 1.000 0.380 0.4815 Yes
H3GA0024944 74 188 735 1.000 0.248 0.5588 Yes
MARC0043064 74 934 147 1.000 0.394 0.0000 Yes
DIAS0000521 78 168 017 1.000 0.361 0.5717 Yes
ASGA0039041 78 964 955 1.000 0.089 0.4728 Yes
ASGA0101844 81 243 428 0.000 0.000 0.0000 No
ALGA0048355 84 439 484 1.000 0.348 0.2272 Yes
ALGA0048452 89 396 415 1.000 0.437 0.6562 Yes
H3GA0025111 91 556 991 1.000 0.327 0.3770 Yes
ALGA0048513 91 571 647 1.000 0.306 0.2250 Yes
ALGA0048521 91 798 086 1.000 0.278 0.0413 Yes
M1GA0011992 91 991 327 1.000 0.420 0.9994 Yes
ALGA0048544 91 931 519 1.000 0.267 0.0339 Yes
ALGA0113197 92 641 183 1.000 0.480 0.8518 Yes
ASGA0089555 92 715 025 0.957 0.318 0.0214 Yes
H3GA0025137 92 803 868 1.000 0.350 0.3705 Yes
ALGA0048572 92 816 525 1.000 0.398 0.4555 Yes
H3GA0025135 92 870 605 0.957 0.136 0.0004 Yes
ALGA0048583 93 209 866 0.998 0.187 0.3035 Yes
MARC0061487 93 320 380 1.000 0.214 0.3432 Yes
MARC0024098 93 295 329 1.000 0.214 0.3432 Yes
MARC0029000 93 494 016 1.000 0.214 0.3432 Yes
ALGA0115296 93 496 083 1.000 0.214 0.3432 Yes
MARC0005229 93 618 063 1.000 0.216 0.4570 Yes
ALGA0048589 93 655 838 0.998 0.187 0.3035 Yes

Annexes
217
SNP Position (bp) in Sscrofa10.2 Call Rate MAF1 HWE2 Used3
ALGA0048594 93 721 504 1.000 0.190 0.4043 Yes
MARC0020530 93 772 525 1.000 0.217 0.4423 Yes
ALGA0048597 93 787 649 0.998 0.229 0.2447 Yes
ASGA0039312 93 799 252 0.998 0.435 0.7113 Yes
H3GA0025162 93 865 285 1.000 0.268 0.7269 Yes
MARC0097057 94 731 152 0.996 0.471 0.8713 Yes
H3GA0025172 95 696 734 1.000 0.268 0.8946 Yes
ASGA0039343 95 856 199 1.000 0.268 0.8946 Yes
ALGA0048654 96 775 500 1.000 0.273 0.7588 Yes
ASGA0039349 97 708 951 1.000 0.212 0.6158 Yes
ASGA0039362 98 985 483 0.000 0.000 0.0000 No
ALGA0048684 99 240 536 1.000 0.365 0.7535 Yes
ALGA0048697 99 519 250 0.998 0.264 0.8940 Yes
ALGA0048708 99 899 949 1.000 0.273 0.7588 Yes
ALGA0048717 100 629 167 1.000 0.198 0.4690 Yes
MARC0035880 100 725 819 0.985 0.089 0.3327 Yes
ASGA0039382 100 850 517 1.000 0.272 0.8182 Yes
ALGA0048753 103 445 870 1.000 0.000 10,000 No
ALGA0048755 103 584 645 0.998 0.423 0.7924 Yes
FABP2 Unknown 0.983 0.000 10,000 No
H3GA0025264 111 567 232 1.000 0.382 0.6167 Yes
ALGA0049011 112 856 026 0.000 0.000 0.0000 No
ALGA0049074 114 238 093 1.000 0.148 0.0828 Yes
ASGA0039595 117 438 656 1.000 0.270 0.5662 Yes
ALGA0049130 117 485 685 1.000 0.270 0.5662 Yes
ALGA0049122 117 456 463 1.000 0.270 0.5662 Yes
ALGA0049135 117 548 144 0.998 0.271 0.5606 Yes
ALGA0049139 117 666 087 1.000 0.261 0.6645 Yes
ASGA0039614 117 902 625 0.983 0.390 0.7939 Yes
MARC0008579 118 421 256 0.998 0.318 0.8182 Yes
SIRI0000509 119 727 822 1.000 0.269 0.4459 Yes
INRA0030422 119 851 321 1.000 0.269 0.4459 Yes
H3GA0025321 119 887 525 1.000 0.269 0.4459 Yes
DIAS0003532 120 567 215 0.998 0.388 0.4522 Yes
ALGA0049233 120 608 511 1.000 0.419 0.8221 Yes
ASGA0039670 121 038 694 1.000 0.267 0.6239 Yes
ALGA0049249 120 972 820 0.981 0.303 0.7412 Yes
ALGA0049254 120 996 107 0.998 0.307 0.8245 Yes
MARC0069612 122 226 942 1.000 0.024 0.8103 No
ALGA0049276 122 249 328 1.000 0.087 0.3407 Yes
MARC0037703 122 288 920 1.000 0.424 0.5606 Yes

Genomic and functional genomic analysis of fatty acid composition in swine
218
SNP Position (bp) in Sscrofa10.2 Call Rate MAF1 HWE2 Used3
MARC0022520 124 248 464 1.000 0.184 0.0913 Yes
MARC0023377 124 214 989 1.000 0.431 0.5878 Yes
MARC0087394 127 777 989 0.998 0.208 0.1445 Yes
ALGA0049404 128 842 533 1.000 0.253 0.7247 Yes
MTTP Unknown 0.998 0.390 0.7473 Yes
ASGA0039821 130 710 470 0.998 0.431 0.6636 Yes
ALGA0107284 131 690 829 1.000 0.284 0.1453 Yes
ASGA0092434 135 960 757 1.000 0.263 0.6249 Yes
MARC0052565 137 114 772 1.000 0.216 0.0455 Yes
ALGA0120603 139 458 060 1.000 0.265 0.0003 Yes
MARC0073511 140 966 269 1.000 0.305 0.1987 Yes
ALGA0106925 142 232 561 1.000 0.211 0.1649 Yes
ASGA0040343 143 633 633 0.998 0.437 0.4669 Yes
ALGA0050117 144 383 303 1.000 0.402 0.3302 Yes
ASGA0102835 145 098 780 1.000 0.317 0.9815 Yes
ALGA0050175 145 451 027 1.000 0.185 0.8995 Yes
MARC0054376 145 853 404 1.000 0.328 0.1119 Yes
ALGA0107742 146 341 093 1.000 0.434 0.0752 Yes
ALGA0050227 146 293 844 1.000 0.313 0.1665 Yes
MARC0073087 146 413 339 1.000 0.433 0.0814 Yes
MARC0072304 146 423 420 1.000 0.433 0.0814 Yes
ALGA0122878 146 829 727 0.996 0.420 0.1477 Yes
MARC0011508 147 363 214 1.000 0.437 0.2665 Yes
H3GA0025831 147 385 039 1.000 0.438 0.2508 Yes
DRGA0009028 147 583 976 1.000 0.422 0.3020 Yes
MARC0042613 147 800 024 0.998 0.446 0.0822 Yes 1MAF= Minor Allele Frequency 2HWE= p-value of the Hardy-Weinberg Equilibrium test calculated by GenomeStudio software (Illumina) 3Used= Used in association analyses
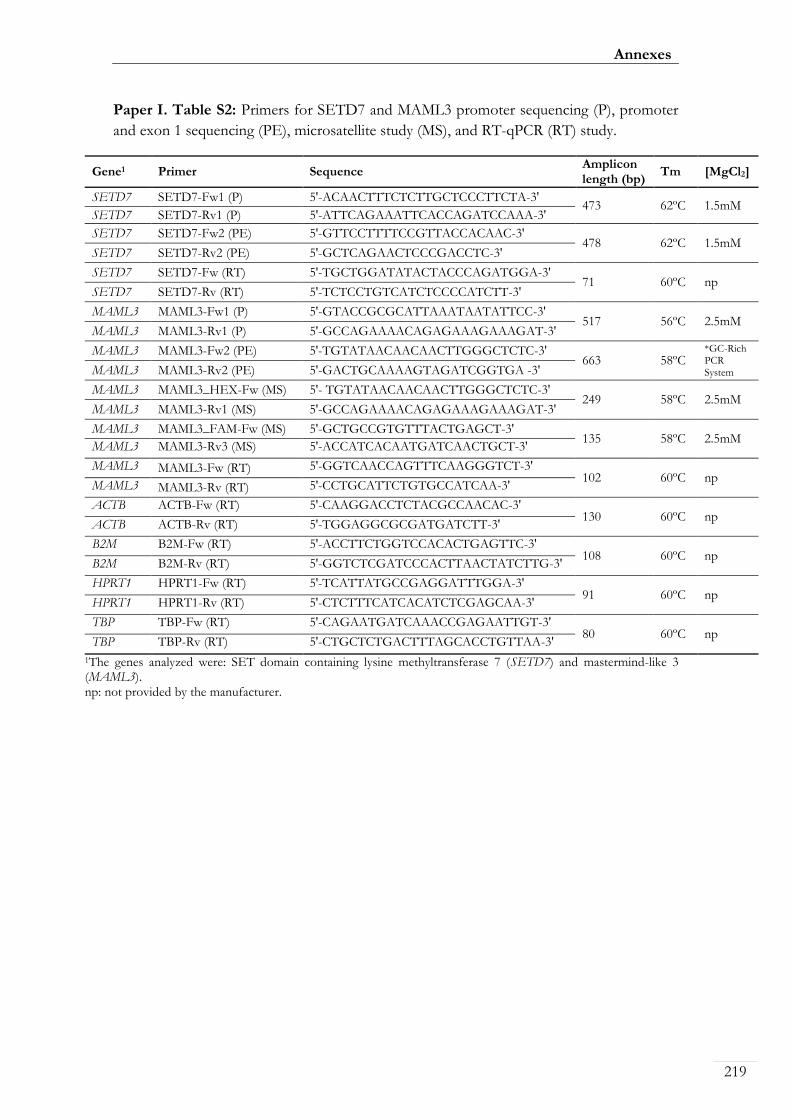
Annexes
219
Paper I. Table S2: Primers for SETD7 and MAML3 promoter sequencing (P), promoter
and exon 1 sequencing (PE), microsatellite study (MS), and RT-qPCR (RT) study.
Gene1 Primer Sequence Amplicon length (bp)
Tm [MgCl2]
SETD7 SETD7-Fw1 (P) 5'-ACAACTTTCTCTTGCTCCCTTCTA-3' 473 62ºC 1.5mM
SETD7 SETD7-Rv1 (P) 5'-ATTCAGAAATTCACCAGATCCAAA-3' SETD7 SETD7-Fw2 (PE) 5'-GTTCCTTTTCCGTTACCACAAC-3'
478 62ºC 1.5mM SETD7 SETD7-Rv2 (PE) 5'-GCTCAGAACTCCCGACCTC-3'
SETD7 SETD7-Fw (RT) 5'-TGCTGGATATACTACCCAGATGGA-3' 71 60ºC np
SETD7 SETD7-Rv (RT) 5'-TCTCCTGTCATCTCCCCATCTT-3'
MAML3 MAML3-Fw1 (P) 5'-GTACCGCGCATTAAATAATATTCC-3' 517 56ºC 2.5mM
MAML3 MAML3-Rv1 (P) 5'-GCCAGAAAACAGAGAAAGAAAGAT-3'
MAML3 MAML3-Fw2 (PE) 5'-TGTATAACAACAACTTGGGCTCTC-3' 663 58ºC
*GC-Rich PCR System MAML3 MAML3-Rv2 (PE) 5'-GACTGCAAAAGTAGATCGGTGA -3'
MAML3 MAML3_HEX-Fw (MS) 5'- TGTATAACAACAACTTGGGCTCTC-3' 249 58ºC 2.5mM
MAML3 MAML3-Rv1 (MS) 5'-GCCAGAAAACAGAGAAAGAAAGAT-3'
MAML3 MAML3_FAM-Fw (MS) 5'-GCTGCCGTGTTTACTGAGCT-3' 135 58ºC 2.5mM
MAML3 MAML3-Rv3 (MS) 5'-ACCATCACAATGATCAACTGCT-3'
MAML3 MAML3-Fw (RT) 5'-GGTCAACCAGTTTCAAGGGTCT-3' 102 60ºC np
MAML3 MAML3-Rv (RT) 5'-CCTGCATTCTGTGCCATCAA-3'
ACTB ACTB-Fw (RT) 5'-CAAGGACCTCTACGCCAACAC-3' 130 60ºC np
ACTB ACTB-Rv (RT) 5'-TGGAGGCGCGATGATCTT-3'
B2M B2M-Fw (RT) 5'-ACCTTCTGGTCCACACTGAGTTC-3' 108 60ºC np
B2M B2M-Rv (RT) 5'-GGTCTCGATCCCACTTAACTATCTTG-3'
HPRT1 HPRT1-Fw (RT) 5'-TCATTATGCCGAGGATTTGGA-3' 91 60ºC np
HPRT1 HPRT1-Rv (RT) 5'-CTCTTTCATCACATCTCGAGCAA-3'
TBP TBP-Fw (RT) 5'-CAGAATGATCAAACCGAGAATTGT-3' 80 60ºC np
TBP TBP-Rv (RT) 5'-CTGCTCTGACTTTAGCACCTGTTAA-3'
1The genes analyzed were: SET domain containing lysine methyltransferase 7 (SETD7) and mastermind-like 3 (MAML3). np: not provided by the manufacturer.
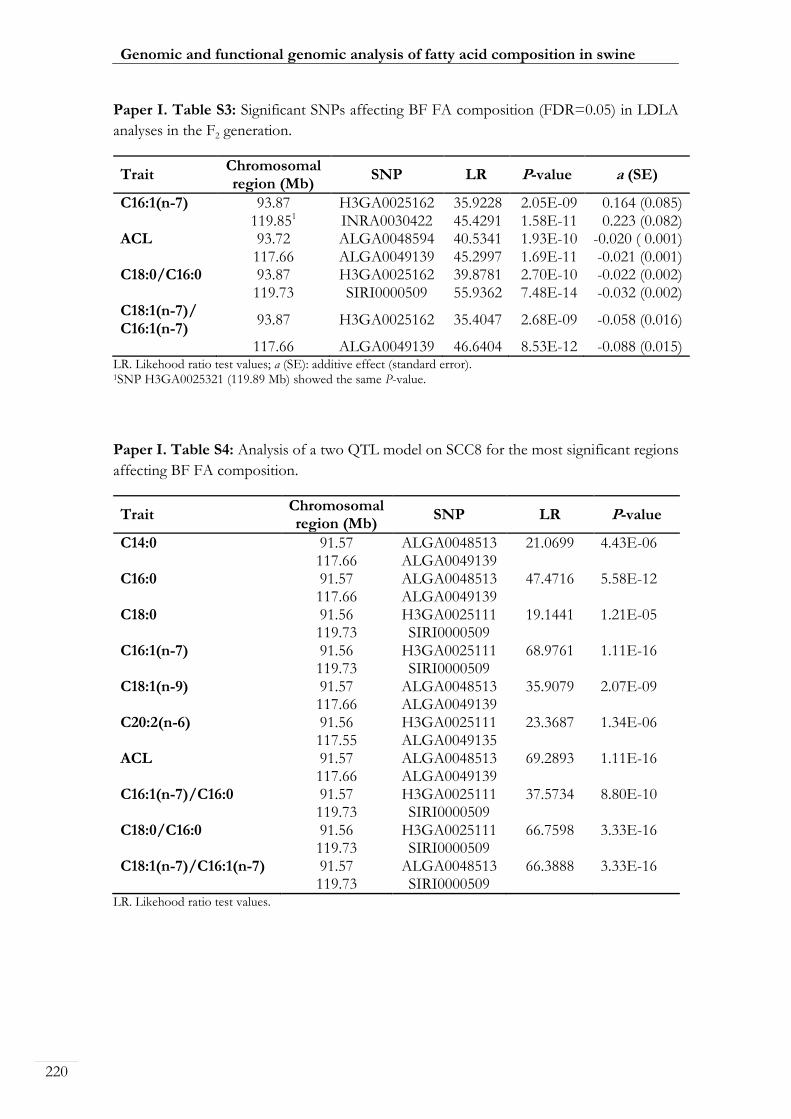
Genomic and functional genomic analysis of fatty acid composition in swine
220
Paper I. Table S3: Significant SNPs affecting BF FA composition (FDR=0.05) in LDLA
analyses in the F2 generation.
Trait Chromosomal region (Mb)
SNP LR P-value a (SE)
C16:1(n-7) 93.87 H3GA0025162 35.9228 2.05E-09 0.164 (0.085) 119.851 INRA0030422 45.4291 1.58E-11 0.223 (0.082)
ACL 93.72 ALGA0048594 40.5341 1.93E-10 -0.020 ( 0.001)117.66 ALGA0049139 45.2997 1.69E-11 -0.021 (0.001)
C18:0/C16:0 93.87 H3GA0025162 39.8781 2.70E-10 -0.022 (0.002)119.73 SIRI0000509 55.9362 7.48E-14 -0.032 (0.002)
C18:1(n-7)/ C16:1(n-7)
93.87 H3GA0025162 35.4047 2.68E-09 -0.058 (0.016)
117.66 ALGA0049139 46.6404 8.53E-12 -0.088 (0.015)LR. Likehood ratio test values; a (SE): additive effect (standard error). 1SNP H3GA0025321 (119.89 Mb) showed the same P-value.
Paper I. Table S4: Analysis of a two QTL model on SCC8 for the most significant regions
affecting BF FA composition.
Trait Chromosomal region (Mb)
SNP LR P-value
C14:0 91.57 ALGA0048513 21.0699 4.43E-06 117.66 ALGA0049139
C16:0 91.57 ALGA0048513 47.4716 5.58E-12 117.66 ALGA0049139
C18:0 91.56 H3GA0025111 19.1441 1.21E-05 119.73 SIRI0000509
C16:1(n-7) 91.56 H3GA0025111 68.9761 1.11E-16 119.73 SIRI0000509
C18:1(n-9) 91.57 ALGA0048513 35.9079 2.07E-09 117.66 ALGA0049139
C20:2(n-6) 91.56 H3GA0025111 23.3687 1.34E-06 117.55 ALGA0049135
ACL 91.57 ALGA0048513 69.2893 1.11E-16 117.66 ALGA0049139
C16:1(n-7)/C16:0 91.57 H3GA0025111 37.5734 8.80E-10 119.73 SIRI0000509
C18:0/C16:0 91.56 H3GA0025111 66.7598 3.33E-16 119.73 SIRI0000509
C18:1(n-7)/C16:1(n-7) 91.57 ALGA0048513 66.3888 3.33E-16 119.73 SIRI0000509
LR. Likehood ratio test values.
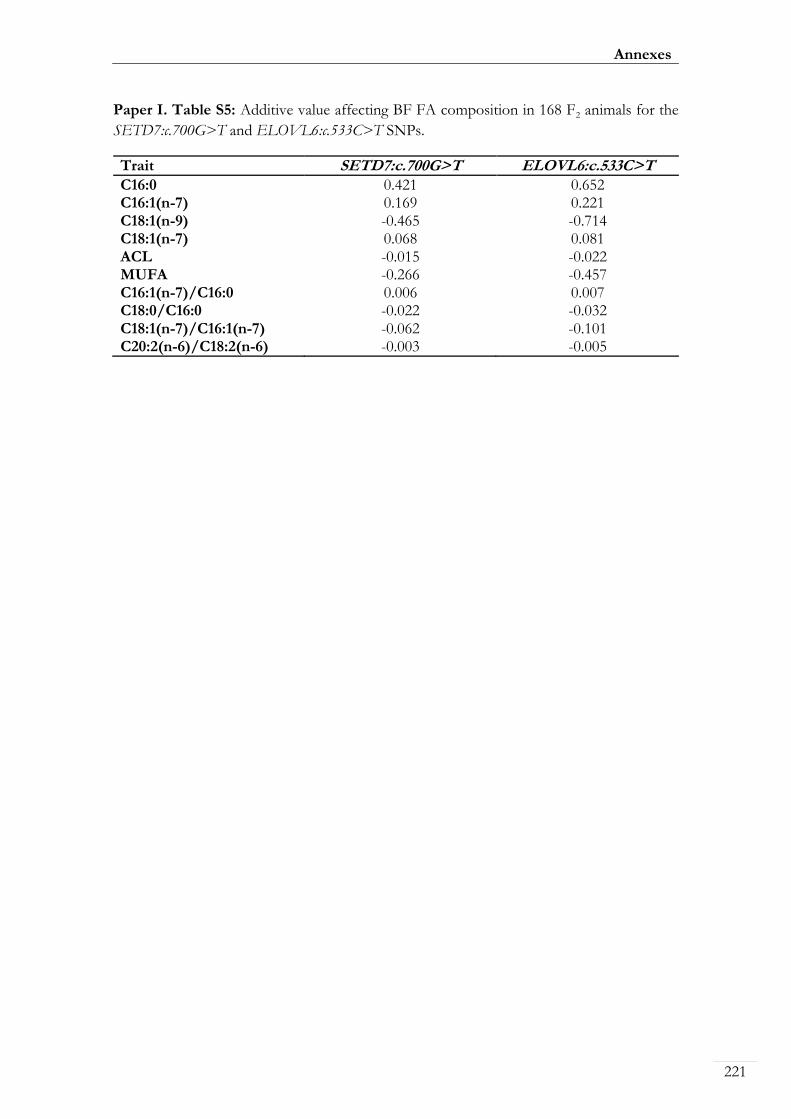
Annexes
221
Paper I. Table S5: Additive value affecting BF FA composition in 168 F2 animals for the
SETD7:c.700G>T and ELOVL6:c.533C>T SNPs.
Trait SETD7:c.700G>T ELOVL6:c.533C>T
C16:0 0.421 0.652 C16:1(n-7) 0.169 0.221 C18:1(n-9) -0.465 -0.714C18:1(n-7) 0.068 0.081ACL -0.015 -0.022MUFA -0.266 -0.457C16:1(n-7)/C16:0 0.006 0.007C18:0/C16:0 -0.022 -0.032C18:1(n-7)/C16:1(n-7) -0.062 -0.101C20:2(n-6)/C18:2(n-6) -0.003 -0.005
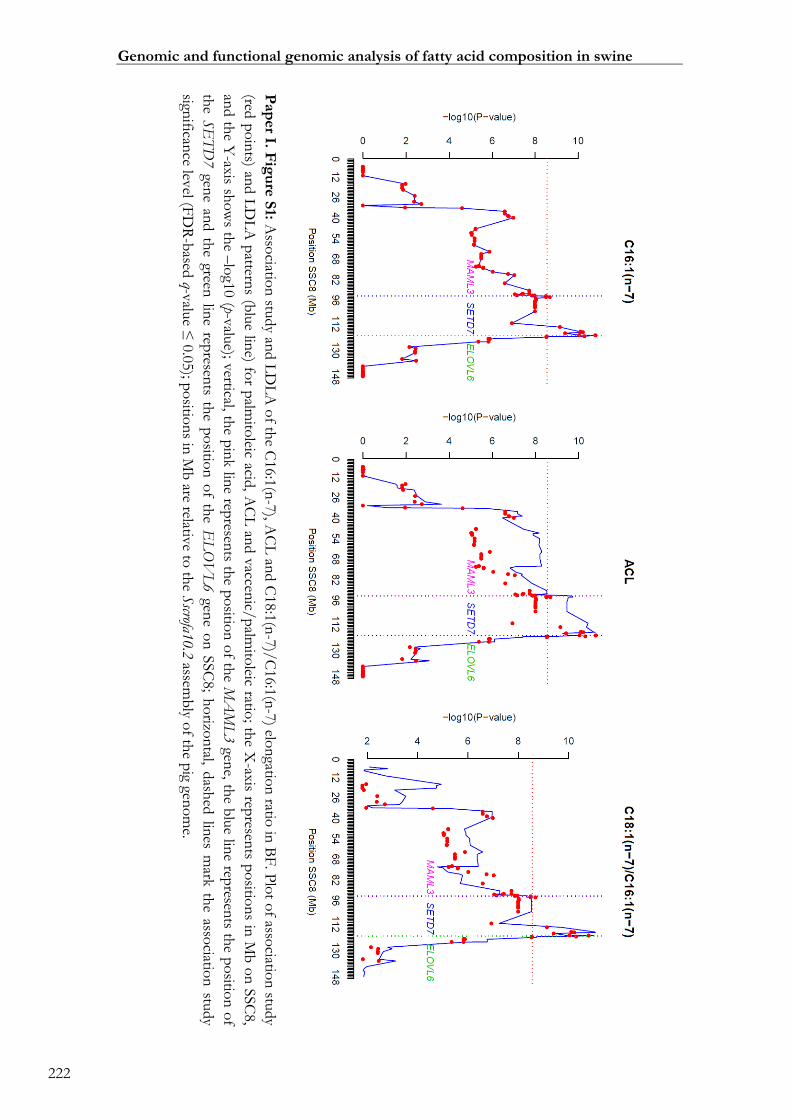
Pap
er I. F
igu
re S
1: Asso
ciation
study an
d L
DL
A o
f the C
16:1
(n-7
), AC
L an
d C
18:1
(n-7
)/C
16:1
(n-7
) elon
gation
ratio in
BF
. Plo
t of asso
ciation
study
(red p
oin
ts) and L
DL
A p
atterns (b
lue lin
e) for p
almito
leic acid, A
CL
and v
accenic/
palm
itoleic ratio
; the X
-axis represen
ts po
sition
s in M
b o
n S
SC
8,
and th
e Y-axis sh
ow
s the –
log1
0 (p-v
alue); v
ertical, the p
ink lin
e represen
ts the p
ositio
n o
f the M
AM
L3 gen
e, the b
lue lin
e represen
ts the p
ositio
n o
f
the S
ET
D7 gen
e and th
e green lin
e represen
ts the p
ositio
n o
f the E
LO
VL
6 gen
e on
SSC
8; h
orizo
ntal, d
ashed
lines m
ark th
e associatio
n stu
dy
significan
ce level (F
DR
-based
q-valu
e ≤ 0
.05); p
ositio
ns in
Mb
are relative to
the S
scrofa10.2
assemb
ly of th
e pig gen
om
e.
222
Genomic and functional genomic analysis of fatty acid composition in swine

Annexes
223
7.2. Supplementary material Paper II: “A global analysis of CNVs in swine using
whole genome sequence data and association analysis with fatty acid composition
and growth traits”
Paper II. Table S1: Primers used for qPCR assays.
CNVR ID
Chr Gene No. of tested
animals Forward primer (5’-3’) Reverse primer (5’-3’)
112 3 GPAT2 182 AGGTTTGGTCCTTTCATCCTTTG GGTCCACTCCTGCTCCTTCTC
92 4 CLCA4 182 AGCACGGCAACAGGTAAAATG TGAGTTGTCTGTCGCCCTGTAC
125 6 CYP4X1 182 ATCCTGGGTGACGGGTCTTC AAAATCCCGTGGAGCAAACTT
198 6 PLA2G2A 32 CCTGCTATTGGCAGTGATCATG GCTTCCCTCCCTGCACTGT
160 9 MOGAT2 182 CTGGGTCTTGGAACTTTCTAAACAC GAGTGCCTAATTCTTCACCATAAGC
217 14 PRKG1 32 GGCATGAACATTCGTCAAATCTC AGACAGCTGCAATCTCACTAAAGC
Control 15 GCG - AACATTGCCAAACGTCACGATG GCCTTCCTCGGCCTTTCA
Paper II. Table S2: Duplication and deletion calls predicted by Control-FREEC software
from all seven pigs. (too large to be attached, not included in the present thesis).
See table at:
https://doi.org/10.1371/journal.pone.0177014.s006 (XLSX)
Paper II. Table S3: Information of 540 identified CNVRs and gene annotation within the
CNVRs retrieved from the Ensembl Genes 84 Database using the Biomart data
management system. (too large to be attached, not included in the present thesis).
See table at:
https://doi.org/10.1371/journal.pone.0177014.s007 (XLSX)
Paper II. Table S4: Pathway analysis of genes identified in CNVRs. (too large to be
attached, not included in the present thesis).
See table at:
https://doi.org/10.1371/journal.pone.0177014.s008 (XLSX)
Paper II. Table S5: Association analysis between CNVRs and different phenotypic records in BC1_LD animals. (too large to be attached, not included in the present thesis).
See table at:
https://doi.org/10.1371/journal.pone.0177014.s009 (XLSX)
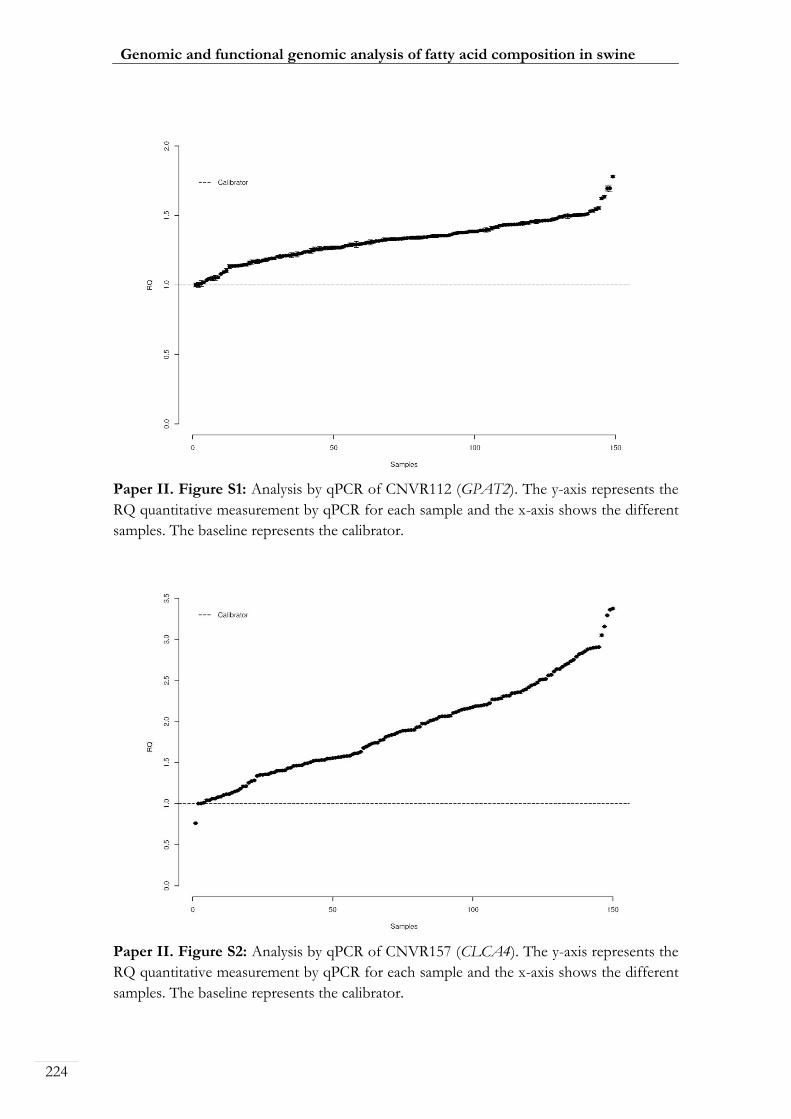
Genomic and functional genomic analysis of fatty acid composition in swine
224
Paper II. Figure S1: Analysis by qPCR of CNVR112 (GPAT2). The y-axis represents the
RQ quantitative measurement by qPCR for each sample and the x-axis shows the different
samples. The baseline represents the calibrator.
Paper II. Figure S2: Analysis by qPCR of CNVR157 (CLCA4). The y-axis represents the
RQ quantitative measurement by qPCR for each sample and the x-axis shows the different
samples. The baseline represents the calibrator.

Annexes
225
Paper II. Figure S3: Analysis by qPCR of CNVR298 (MOGAT2). The y-axis represents
the RQ quantitative measurement by qPCR for each sample and the x-axis shows the
different samples. The baseline represents the calibrator.
Paper II. Figure S4: Analysis by qPCR of CNVR447 (PRKG1). The y-axis represents the
RQ quantitative measurement by qPCR for each sample and the x-axis shows the different
samples. The baseline represents the calibrator.

Genomic and functional genomic analysis of fatty acid composition in swine
226
7.3. Supplementary material Paper III: “Expression analysis in adipose tissue of
candidate genes for fatty acid composition and identification of eGWAS regions”
Paper III. Table S1: Primers used for the characterization of the 3’UTR of porcine
FABP4 gene.
Gene Full name Primer Name Type Primer Sequence1
FABP4 Fatty acid binding protein 4 oligo(dT)-UAP mRNA 3' UTR amplification
5’-GGCCACGCGTCGACTAGTAC(T)30VN-3’
FABP4 Fatty acid binding protein 4 UAP mRNA 3' UTR amplification
5'-GGCCACGCGTCGACTAGTAC-3'
FABP4 Fatty acid binding protein 4 FABP4-3NC-1-Fw mRNA 3' UTR
sequencing 5'-TTGGATCGAACTCTACAACACTCTG-3'
FABP4 Fatty acid binding protein 4 FABP4-3NC-2-Fw mRNA 3' UTR
sequencing 5'-TGTTTATGGATCTTCCATTATCTTAGG-3'
1Primers were designed from the GenBank Y16039 sequence

Pap
er
III.
Tab
le S
2:
Pri
mer
s use
d f
or
the
anal
yses
of
gen
e-ex
pre
ssio
n o
f th
e 48 g
enes
by
real
-tim
e P
CR
.
Gen
e
Fu
ll n
am
e
Typ
e
Pri
mer
seq
uen
ce
Fo
rward
R
eve
rse
AC
SM
5 A
cyl-
Co
A s
ynth
etas
e m
ediu
m-c
hai
n f
amily
mem
ber
5
Tar
get
5'-T
GT
AA
TC
TG
TG
CC
AA
TC
CC
AA
A-3
' 5'-C
AT
CA
TC
TA
CG
AT
CT
GC
AC
CT
CA
T-3
'
AC
TB
A
ctin
, B
eta
Ref
eren
ce
5'-C
AA
GG
AC
CT
CT
AC
GC
CA
AC
AC
-3'
5'-T
GG
AG
GC
GC
GA
TG
AT
CT
T-3
'
AD
IPO
Q
Ad
ipo
nec
tin
, C
1Q
an
d c
ollag
en d
om
ain
co
nta
inin
g
Tar
get
5'-G
TA
CC
CC
AG
GC
CG
TG
AT
G-3
’ 5’-
CC
CT
TA
GG
AC
CA
GT
AA
GA
CC
TG
TA
TC
T-3
’
AG
PA
T2
1-a
cylg
lyce
rol-
3-p
ho
sph
ate
O-a
cylt
ran
sfer
ase
2T
arge
t 5’-
CA
TG
GT
CA
GG
GA
GA
AG
CT
CA
A-3
’ 5’-
GC
CA
GG
TA
GA
AG
GC
AC
CT
TT
C-3
’
AN
K2
An
kyr
in 2
T
arge
t 5'-G
TG
GA
TT
CT
GC
TA
CG
AA
GA
AA
GG
-3’
5'-A
AG
GA
CT
TT
GA
CA
AC
TT
CT
GC
TT
GT
-3’
AR
NT
A
ryl h
ydro
carb
on
rec
epto
r n
ucl
ear
tran
slo
cato
r T
arge
t 5’-
TC
TA
AT
GA
TA
AG
GA
GC
GG
TT
TG
C-3
’ 5’-
TA
TG
AT
TT
TC
CC
TG
GC
GA
GT
CT
-3’
B2M
B
eta-
2-m
icro
glo
bulin
R
efer
ence
5’-
AC
CT
TC
TG
GT
CC
AC
AC
TG
AG
TT
C-3
’ 5’-
GG
TC
TC
GA
TC
CC
AC
TT
AA
CT
AT
CT
TG
-3’
CD
36
CD
36 m
ole
cule
T
arge
t 5'-G
GT
CC
TT
AC
AC
GT
AC
AG
AG
TT
CG
TT
-3’
5'-C
CA
TT
GG
GC
TG
TA
GG
AA
AG
AG
A-3
’
CP
T1A
C
arn
itin
e p
alm
ito
yltr
ansf
eras
e 1A
T
arge
t 5’-
CC
TG
AA
GG
TG
CT
GC
TC
TC
CT
A-3
’ 5’-
CT
CA
CC
AT
CA
TC
AT
CC
AG
AT
CT
TG
-3’
CR
OT
C
arn
itin
e O
-oct
ano
yltr
ansf
eras
e T
arge
t 5'-G
GG
AA
AC
GA
AA
TT
GG
TT
GG
A-3
' 5'-C
GC
AA
AG
TT
GA
CA
TT
CA
GT
TG
TG
-3'
CY
P2U
1
Cyt
och
rom
e P
450, fa
mily
2, su
bfa
mily
U, m
emb
er 1
T
arge
t 5’-
AG
AG
AA
AA
CA
GT
GC
TC
CA
AG
GG
TA
T-3
’ 5’-
TG
GC
TG
GG
TC
TC
TG
TG
TA
CT
GA
-3’
DG
AT
1
Dia
cylg
lyce
rol O
-acy
ltra
nsf
eras
e 1
Tar
get
5'-C
CT
GA
AT
TG
GT
GT
GT
GG
TC
AT
G-3
' 5'-G
AT
GC
CG
TA
CT
TG
AT
GA
GG
TT
CT
C-3
'
DG
AT
2
Dia
cylg
lyce
rol O
-acy
ltra
nsf
eras
e 2
Tar
get
5'-G
GA
AC
AC
GC
CC
AA
GA
AA
GG
T-3
’ 5'-G
GA
TG
GG
AA
AG
TA
GT
CT
CG
AA
AG
TA
G-3
’
EG
F
Ep
ider
mal
gro
wth
fac
tor
Tar
get
5’-
AA
CG
GG
AA
TG
CC
AC
TT
GT
GT
-3’
5’-
CC
TT
CC
AA
GT
CA
AT
CC
TA
AA
GA
TA
CT
G-3
’
EL
OV
L5
EL
OV
L f
atty
aci
d e
lon
gase
5
Tar
get
5’-
CC
TC
TC
GG
CT
GG
CT
GT
AC
TT
-3’
5’-
CC
TT
CT
TG
TT
GT
AG
GT
CT
GG
AT
GT
AG
-3’
EL
OV
L6
EL
OV
L f
atty
aci
d e
lon
gase
6
Tar
get
5’-
AG
CA
GT
TC
AA
CG
AG
AA
CG
AA
GC
C-3
’ 5’-
TG
CC
GA
CC
GC
CA
AA
GA
TA
AA
G-3
’
ES
RR
A
Est
roge
n-r
elat
ed r
ecep
tor
alp
ha
Tar
get
5’-
CA
AG
AG
CA
TC
CC
AG
GC
TT
CT
C-3
’ 5’-
CA
CC
CA
AC
AC
CA
AT
AC
CT
CC
AT
-3’
FA
BP
4
Fat
ty a
cid
bin
din
g p
rote
in 4
T
arge
t 5'-T
AA
GT
TG
GT
GG
TG
GA
AT
GT
AT
CA
TG
-3'
5'-A
GA
GT
GT
TG
TA
GA
GT
TC
GA
TC
CA
AA
C-3
'
FA
BP
5
Fat
ty a
cid
bin
din
g p
rote
in 5
T
arge
t 5'-C
CA
AT
GG
AG
AA
TT
GG
TT
CA
AC
A-3
' 5'-G
TT
CA
TG
AC
GC
AT
AC
CA
CC
AC
TA
-3'
FA
DS
1 F
atty
aci
d d
esat
ura
se 1
T
arge
t 5’-
CC
TT
GT
GA
GG
AA
GT
AT
AT
GA
GC
TC
TC
T-3
’ 5’-
TC
AT
CT
GT
CA
GC
TC
TT
TA
TT
CT
TA
GT
CG
-3’
FA
DS
2 F
atty
aci
d d
esat
ura
se 2
T
arge
t 5’-
TC
CA
CC
GC
GA
CC
TT
GA
TT
TA
-3’
5’-
TC
GG
TG
AT
CT
CA
GA
GT
TC
TT
GG
T-3
’
FA
DS
3 F
atty
aci
d d
esat
ura
se 3
T
arge
t 5’-
CC
AG
CA
CC
TC
TA
CT
TC
TT
CC
TG
AT
-3’
5’-
CA
TG
TA
TG
CC
AG
AT
TT
TC
CA
CT
TC
-3’
HP
RT
1 H
ypo
xan
thin
e p
ho
sph
ori
bo
sylt
ran
sfer
ase
1
Ref
eren
ce
5’-
TC
AT
TA
TG
CC
GA
GG
AT
TT
GG
A-3
’ 5’-
CT
CT
TT
CA
TC
AC
AT
CT
CG
AG
CA
A-3
’
LIP
C
Lip
ase
C, h
epat
ic t
ype
Tar
get
5’-
CG
TT
AC
AG
CA
GT
GT
GG
CT
TC
A-3
’ 5’-
CC
AG
CA
AG
CC
AT
CC
AT
CA
A-3
’
227
Annexes

Gen
e
Fu
ll nam
e
Typ
e
Prim
er se
qu
en
ce
Fo
rward
R
eve
rse
LP
IN1
Lip
in 1
T
arget 5’- C
CG
AG
AG
AA
GG
TG
GT
GG
AC
AT
-3’
5’- C
TC
TC
CA
TT
GT
CT
CC
CA
GT
TT
CA
-3’
MG
LL
M
on
oglycerid
e lipase
Target
5'-G
TG
TT
CG
CC
CA
CG
AC
CA
T-3
’ 5'-C
CT
GA
CG
AA
CA
CC
TG
GA
AG
TC
-3’
ML
XIP
L
ML
X In
teracting P
rotein
-Lik
e T
arget 5’-C
CC
AA
GT
GG
AA
GA
AT
TT
CA
AA
GG
-3’
5’-C
TT
CC
TC
CG
CT
CC
AC
AT
AC
TG
-3’
NF
KB
1 N
uclear facto
r kap
pa B
sub
un
it 1
Target
5'-C
CC
AC
AG
AC
GT
TC
AT
AG
AC
AA
TT
T-3
' 5'-G
AG
GC
TG
GT
TT
TG
TA
AT
GT
TG
AC
A-3
'
NR
1H
3
Nuclear R
ecepto
r Sub
family 1
, Gro
up
H, M
emb
er 3
Target
5'-C
TG
GG
CA
TG
AT
CG
AG
AA
GC
T-3
' 5'-T
GG
GC
CA
AG
GC
GT
GA
CT
-3'
PE
X2
Pero
xisom
al bio
genesis facto
r 2
Target
5'-C
TC
AG
AC
TC
CT
AA
GA
AA
CC
TT
CA
GA
GA
-3'
5'-A
CT
GA
TT
CT
GA
GC
AC
TC
TG
TT
TG
C-3
'
PL
A2G
12A
P
ho
sph
olip
ase A2, gro
up
XIIA
T
arget 5'-C
CC
AC
TC
TT
TG
GT
GT
TC
AT
CT
TA
A-3
' 5'-A
TA
GC
AC
CT
GT
CG
TG
CT
GG
TT
-3'
PL
CB
2
Ph
osp
ho
lipase C
, beta 2
T
arget 5’- A
GA
TC
TT
CA
CT
TC
CT
AC
CA
CT
CC
AA
-3’
5’- G
CG
CT
GT
TT
CT
GG
TT
GA
TG
A-3
’
PL
PP
1 P
ho
sph
olip
id p
ho
sph
atase 1
Target
5'-G
GC
CA
CT
CT
TC
AT
TC
TC
CA
TG
TA
C-3
' 5'-A
GG
CC
CA
CG
TA
AA
TG
GA
TA
CA
G-3
'
PN
PL
A2
Patatin
-like p
ho
sph
olip
ase do
main
con
tainin
g 2
Target
5'-C
TT
CA
CC
GT
CC
GC
TT
GC
T-3
’ 5'-G
CA
TC
AC
CA
GG
TA
CT
GG
CA
GA
T-3
’
PO
U2F
1
PO
U class 2
ho
meo
bo
x 1
Target
5’- C
CC
AT
AC
AG
AT
CG
CA
CA
GG
AT
-3’
5’- G
AT
GA
TA
AA
CT
GT
GC
TG
GT
TG
CA
-3’
PP
AR
A
Pero
xisom
e pro
liferator-activ
ated recep
tor alp
ha
Target
5'-G
GC
AC
TG
AA
CA
TC
GA
AT
GT
AG
AA
TC
-3'
5'-C
CG
AA
AG
AA
GC
CC
TT
GC
AA
-3'
PP
AR
D
Pero
xisom
e pro
liferator-activ
ated recep
tor d
elta T
arget 5'-G
CA
TG
TC
TC
A C
AA
CG
CC
AT
T-3
' 5'-G
CT
GA
CT
CC
CC
TC
GT
TT
GC
-3'
PP
AR
G
Pero
xisom
e pro
liferator-activ
ated recep
tor gam
ma
Target
5'-T
TG
TG
AA
GG
AT
GC
AA
GG
GT
TT
-3’
5'-A
TC
CG
AC
AG
TT
AA
GA
TC
GC
AC
CT
A-3
’
PP
AR
GC
1A
P
eroxiso
me p
roliferato
r-activated
recepto
r gamm
a, co
activato
r 1 alp
ha
Target
5’-C
TC
TG
GA
AC
TG
CA
GG
CC
TA
A-3
’ 5’-T
GG
AG
AA
GC
CC
TA
AA
AG
GG
TT
AT
-3’
RB
P4
Retin
ol b
ind
ing p
rotein
4
Target
5'-G
GG
TC
GA
GT
CC
GT
CT
TT
TA
AA
TA
AC
T-3
’ 5'-G
GT
CC
TC
GG
TG
TC
TG
TA
AA
GG
T-3
’
RX
RG
R
etino
id X
recepto
r, gamm
a T
arget 5'-G
AG
GA
TT
CT
GG
AA
GC
TG
AA
CT
TG
-3'
5'-T
CA
TT
CG
TC
GA
AT
TC
TC
CA
TG
T-3
'
SC
AP
SR
EB
F ch
apero
ne
Target
5’- A
GA
TA
TC
TC
AG
GC
CT
TC
TA
CA
AC
CA
-3’
5’- A
GT
TT
CA
AC
AG
TG
GG
TA
GC
AG
C-3
’
SC
D
Stearo
yl-Co
A D
esaturase
Target
5’- G
GT
GA
TG
TT
CC
AG
AG
GA
GG
TA
CT
AC
-3’
5’- C
AG
CA
AT
AC
CA
GG
GC
AC
GA
T-3
’
SL
C27A
1
So
lute carrier fam
ily 27, m
emb
er 1
Target
5'-T
CA
CT
CG
GC
AG
GG
AA
CA
TC
-3’
5'-C
GG
CT
GG
CT
GA
AA
AC
TT
CT
T-3
’
SL
C27A
4
So
lute carrier fam
ily 27, m
emb
er 4
Target
5'-G
CT
GC
AT
AA
AA
CA
GG
GA
CT
TT
CA
-3’
5'-A
AC
AG
CG
GG
TC
TT
TC
AC
GA
CT
-3’
SR
EB
F1
Stero
l Regu
latory E
lemen
t Bin
din
g Tran
scriptio
n
Facto
r 1
Target
5'-C
AC
GG
AG
GC
GA
AG
CT
GA
AT
A-3
' 5'-G
CT
TC
TG
GT
TG
CT
CT
GC
TG
AA
-3'
TB
P
TA
TA
-Bo
x Bin
din
g Pro
tein
Referen
ce 5'-C
AG
AA
TG
AT
CA
AA
CC
GA
GA
AT
TG
T-3
' 5'-C
TG
CT
CT
GA
CT
TT
AG
CA
CC
TG
TT
AA
-3'
US
F1
Up
stream tran
scriptio
n facto
r 1
Target
5’- C
CC
TT
AT
TC
CC
CG
AA
GT
CA
GA
-3’
5’- G
CG
GC
GT
TC
CA
CT
TC
AT
TA
T-3
’
228
Genomic and functional genomic analysis of fatty acid composition in swine

Pap
er
III.
Tab
le S
3:
Lis
t o
f 44 l
ipid
-rel
ated
gen
es s
elec
ted t
o s
tudy
thei
r ex
pre
ssio
n i
n t
he
pre
sen
t st
udy.
Th
e o
ver
lap
pin
g b
etw
een
cat
ego
ries
is
lab
elle
d b
y co
lors
.
Desc
rip
tio
n
Art
icle
G
en
es
Can
did
ate
funct
ion
al a
nd p
osi
tio
nal
gen
es iden
tifi
ed in
a G
WA
S
study
for
intr
amusc
ula
r F
A c
om
po
siti
on
in
th
e B
C1_L
D
bac
kcr
oss
R
amay
o-C
aldas
et al
., 2012
AR
NT
, C
YP
2U
1, E
GF
, E
LO
VL
6, F
AB
P4, F
AB
P5, F
AD
S1,
FA
DS2, F
AD
S3, N
FK
B1, P
LA
2G
12A
, P
LC
B2, P
LP
P1, an
d
USF
1
Gen
es d
iffe
ren
tial
ly e
xpre
ssed
by
RN
A-S
eq in
th
e ad
ipo
se t
issu
e o
f tw
o p
hen
oty
pic
ally
ext
rem
e gr
oup
s o
f an
imal
s fo
r in
tram
usc
ula
r F
A c
om
po
siti
on
in
th
e B
C1_L
D b
ackcr
oss
C
oro
min
as e
t al
., 2013a
EL
OV
L6 a
nd
SC
D
Can
did
ate
po
siti
on
al g
ene
affe
ctin
g p
alm
itic
an
d p
alm
ito
leic
FA
in
pig
s C
oro
min
as e
t al
., 2013b
E
LO
VL
6
Gen
es r
elat
ed t
o lip
id m
etab
olis
m iden
tifi
ed in
gen
e co
-as
soci
atio
n n
etw
ork
s fo
r F
A c
om
po
siti
on
in
th
e B
C1_L
D
bac
kcr
oss
R
amay
o-C
aldas
et al
., 2014
AC
SM
5, A
NK
2, A
RN
T, F
AB
P4, F
AB
P5, M
GL
L, an
d
PP
AR
G
Gen
es r
elat
ed t
o lip
id m
etab
olis
m iden
tifi
ed in
gen
e co
-as
soci
atio
n n
etw
ork
s fo
r fa
tnes
s an
d g
row
th r
elat
ed t
rait
s in
th
e IB
MA
P c
ross
P
uig
-Oliv
eras
et al
., 2014
AR
NT
an
d P
PA
RG
Can
did
ate
po
siti
on
al g
enes
iden
tifi
ed in
a G
WA
S s
tudy
for
bac
kfa
t F
A c
om
po
siti
on
in
th
e B
C1_L
D b
ackcr
oss
B
alle
ster
et al
., 2016
FA
DS1, F
AD
S2, an
d F
AD
S3
Tra
nsp
ort
ers
invo
lved
in
lip
id m
etab
olism
R
BP
4, SC
AP
, SL
C27A
1, an
d S
LC
27A
4
En
zym
es in
vo
lved
in
lip
id m
etab
olis
m
AG
PA
T2, C
PT
1A
, C
RO
T, D
GA
T1, D
GA
T2, E
LO
VL
5,
LIP
C, L
PIN
1, P
EX
2, an
d P
NP
LA
2
Tra
nsc
rip
tio
nal
fac
tors
, co
fact
ors
or
nucl
ear
rece
pto
rs in
vo
lved
in
lip
id m
etab
olism
A
DIP
OQ
, C
D36, E
SR
RA
, M
LX
IPL
, N
R1H
3, P
OU
2F
1,
PP
AR
A, P
PA
RD
, P
PA
RG
C1A
, R
XR
G, an
d S
RE
BF
1
Adip
okin
e o
f w
hit
e fa
t ti
ssue
Sh
ehza
d e
t al
., 2012
AD
IPO
Q
229
Annexes

Pap
er III. T
ab
le S
4: D
escriptio
n o
f the 1
93 sign
ificant exp
ression
-associated
SN
Ps (eS
NP
s).
Inte
rval
Ch
r S
NP
P
ositio
n
(bp
) fA
1 fA
2
p-va
lue
q-va
lue
Asso
cia
ted
G
en
e
Co
nse
qu
en
ce
En
sem
bl_
Gen
eId
G
en
e Id
C
is/T
rans-e
SN
Ps
I1
2
ASG
A0093797
134992155
0.9
4
0.0
6
1.5
5E
-06
5.4
8E
-04
AC
SM
5
intergen
ic -
-trans
I2
3
ASG
A0089930
16473829
0.7
4
0.2
6
4.4
5E
-06
1.3
0E
-03
AC
SM
5
intergen
ic -
-trans
I2
3
H3G
A0053939
18724340
0.9
0
0.1
0
3.7
5E
-06
1.1
7E
-03
AC
SM
5
intro
nic
EN
SSSC
G00000007804
SH
2B
1
trans
I2
3
ASG
A0101457
18742778
0.9
0
0.1
0
3.0
3E
-07
1.2
2E
-04
AC
SM
5
intro
nic
EN
SSSC
G00000007805
AT
P2A
1
trans
I2
3
AL
GA
0112844
19373384
0.6
7
0.3
3
3.6
6E
-08
1.8
4E
-05
AC
SM
5
intro
nic
EN
SSSC
G00000022785
GS
G1L
trans
I2
3
ASG
A0098276
21286903
0.8
2
0.1
8
1.6
9E
-14
1.7
0E
-11
AC
SM
5
intergen
ic -
- cis
I2
3
AL
GA
0017974
21309417
0.7
7
0.2
3
1.2
2E
-15
1.5
1E
-12
AC
SM
5
intergen
ic -
- cis
I2
3
ASG
A0013836
21387300
0.7
7
0.2
3
6.9
7E
-10
4.7
6E
-07
AC
SM
5
intergen
ic -
- cis
I2
3
AL
GA
0017987
21528275
0.5
3
0.4
7
2.6
8E
-05
6.7
5E
-03
AC
SM
5
intergen
ic -
- cis
I2
3
ASG
A0013852
21562254
0.7
3
0.2
7
5.6
9E
-08
2.7
9E
-05
AC
SM
5
intergen
ic -
- cis
I2
3
AL
GA
0123606
21777886
0.6
3
0.3
7
7.1
3E
-11
5.6
6E
-08
AC
SM
5
intergen
ic -
- cis
I2
3
ASG
A0089383
22771385
0.5
0
0.5
0
1.1
9E
-10
8.9
3E
-08
AC
SM
5
intro
nic
EN
SSSC
G00000007831
CA
CN
G3
cis
I2
3
MA
RC
0101247
22772065
0.8
8
0.1
2
1.9
6E
-06
6.5
2E
-04
AC
SM
5
intro
nic
EN
SSSC
G00000007831
CA
CN
G3
cis
I2
3
ASG
A0094123
22794781
0.8
4
0.1
6
7.9
7E
-06
2.2
3E
-03
AC
SM
5
intro
nic
EN
SSSC
G00000007831
CA
CN
G3
cis
I2
3
AL
GA
0018006
23015607
0.7
0
0.3
0
1.0
8E
-07
4.8
6E
-05
AC
SM
5
intergen
ic -
-cis
I2
3
AL
GA
0018040
23224453
0.6
6
0.3
4
3.3
3E
-16
4.3
9E
-13
AC
SM
5
intergen
ic -
-cis
I2
3
ASG
A0098738
23442184
0.7
3
0.2
7
1.1
1E
-17
1.5
7E
-14
AC
SM
5
do
wn
stream
EN
SSSC
G00000007836
SC
NN
1G
cis
I2
3
AL
GA
0103397
23522898
0.7
3
0.2
7
1.1
1E
-17
1.5
7E
-14
AC
SM
5
up
stream
EN
SSSC
G00000030424
- cis
I2
3
AL
GA
0123533
23592793
0.6
0
0.4
0
7.2
0E
-11
5.6
6E
-08
AC
SM
5
intergen
ic -
-cis
I2
3
MA
RC
0041570
23603118
0.7
3
0.2
7
1.1
1E
-17
1.5
7E
-14
AC
SM
5
do
wn
stream
EN
SSSC
G00000026544
US
P31
cis
I2
3
ASG
A0093175
23778733
0.8
0
0.2
0
1.1
1E
-17
1.5
7E
-14
AC
SM
5
intro
nic
EN
SSSC
G00000007837
HS
3S
T2
cis
I2
3
MA
RC
0003844
23802761
0.8
0
0.2
0
1.1
1E
-17
1.5
7E
-14
AC
SM
5
intro
nic
EN
SSSC
G00000007837
HS
3S
T2
cis
I2
3
MA
RC
0047020
23961903
0.7
3
0.2
7
1.1
1E
-17
1.5
7E
-14
AC
SM
5
intergen
ic -
-cis
230
Genomic and functional genomic analysis of fatty acid composition in swine
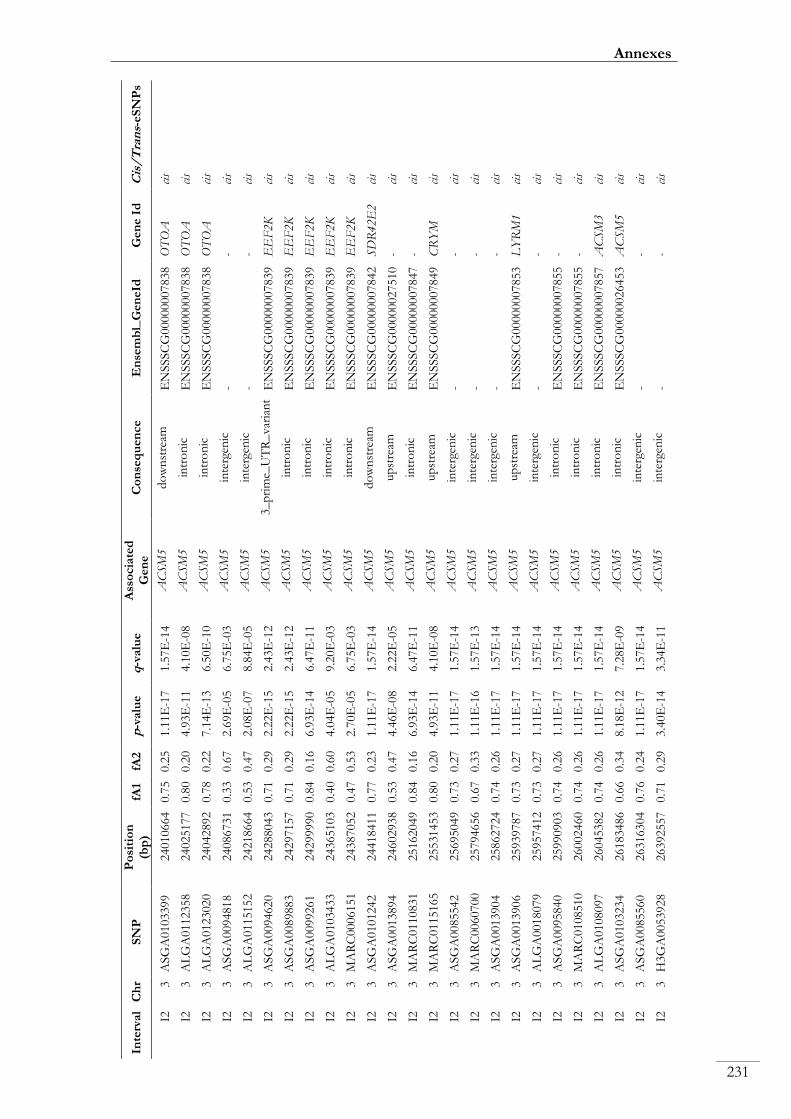
Inte
rval
Ch
r S
NP
P
osi
tio
n
(bp
) fA
1 fA
2
p-v
alu
eq
-valu
eA
sso
cia
ted
G
en
e
Co
nse
qu
en
ce
En
sem
bl_
Gen
eId
G
en
e I
d
Cis
/T
ran
s-eS
NP
s
I2
3
ASG
A0103399
24010664
0.7
5
0.2
5
1.1
1E
-17
1.5
7E
-14
AC
SM
5
do
wn
stre
am
EN
SSSC
G00000007838
OT
OA
ci
s
I2
3
AL
GA
0112358
24025177
0.8
0
0.2
0
4.9
3E
-11
4.1
0E
-08
AC
SM
5
intr
on
ic
EN
SSSC
G00000007838
OT
OA
ci
s
I2
3
AL
GA
0123020
24042892
0.7
8
0.2
2
7.1
4E
-13
6.5
0E
-10
AC
SM
5
intr
on
ic
EN
SSSC
G00000007838
OT
OA
ci
s
I2
3
ASG
A0094818
24086731
0.3
3
0.6
7
2.6
9E
-05
6.7
5E
-03
AC
SM
5
inte
rgen
ic
- -
cis
I2
3
AL
GA
0115152
24218664
0.5
3
0.4
7
2.0
8E
-07
8.8
4E
-05
AC
SM
5
inte
rgen
ic
- -
cis
I2
3
ASG
A0094620
24288043
0.7
1
0.2
9
2.2
2E
-15
2.4
3E
-12
AC
SM
5
3_
pri
me_
UT
R_
var
ian
t E
NSSSC
G00000007839
EE
F2K
ci
s
I2
3
ASG
A0089883
24297157
0.7
1
0.2
9
2.2
2E
-15
2.4
3E
-12
AC
SM
5
intr
on
ic
EN
SSSC
G00000007839
EE
F2K
ci
s
I2
3
ASG
A0099261
24299990
0.8
4
0.1
6
6.9
3E
-14
6.4
7E
-11
AC
SM
5
intr
on
ic
EN
SSSC
G00000007839
EE
F2K
ci
s
I2
3
AL
GA
0103433
24365103
0.4
0
0.6
0
4.0
4E
-05
9.2
0E
-03
AC
SM
5
intr
on
ic
EN
SSSC
G00000007839
EE
F2K
ci
s
I2
3
MA
RC
0006151
24387052
0.4
7
0.5
3
2.7
0E
-05
6.7
5E
-03
AC
SM
5
intr
on
ic
EN
SSSC
G00000007839
EE
F2K
ci
s
I2
3
ASG
A0101242
24418411
0.7
7
0.2
3
1.1
1E
-17
1.5
7E
-14
AC
SM
5
do
wn
stre
am
EN
SSSC
G00000007842
SD
R42E
2
cis
I2
3
ASG
A0013894
24602938
0.5
3
0.4
7
4.4
6E
-08
2.2
2E
-05
AC
SM
5
up
stre
am
EN
SSSC
G00000027510
- ci
s
I2
3
MA
RC
0110831
25162049
0.8
4
0.1
6
6.9
3E
-14
6.4
7E
-11
AC
SM
5
intr
on
ic
EN
SSSC
G00000007847
- ci
s
I2
3
MA
RC
0115165
25531453
0.8
0
0.2
0
4.9
3E
-11
4.1
0E
-08
AC
SM
5
up
stre
am
EN
SSSC
G00000007849
CR
YM
ci
s
I2
3
ASG
A0085542
25695049
0.7
3
0.2
7
1.1
1E
-17
1.5
7E
-14
AC
SM
5
inte
rgen
ic
- -
cis
I2
3
MA
RC
0060700
25794656
0.6
7
0.3
3
1.1
1E
-16
1.5
7E
-13
AC
SM
5
inte
rgen
ic
- -
cis
I2
3
ASG
A0013904
25862724
0.7
4
0.2
6
1.1
1E
-17
1.5
7E
-14
AC
SM
5
inte
rgen
ic
- -
cis
I2
3
ASG
A0013906
25939787
0.7
3
0.2
7
1.1
1E
-17
1.5
7E
-14
AC
SM
5
up
stre
am
EN
SSSC
G00000007853
LY
RM
1
cis
I2
3
AL
GA
0018079
25957412
0.7
3
0.2
7
1.1
1E
-17
1.5
7E
-14
AC
SM
5
inte
rgen
ic
- -
cis
I2
3
ASG
A0095840
25990903
0.7
4
0.2
6
1.1
1E
-17
1.5
7E
-14
AC
SM
5
intr
on
ic
EN
SSSC
G00000007855
- ci
s
I2
3
MA
RC
0108510
26002460
0.7
4
0.2
6
1.1
1E
-17
1.5
7E
-14
AC
SM
5
intr
on
ic
EN
SSSC
G00000007855
- ci
s
I2
3
AL
GA
0108097
26045382
0.7
4
0.2
6
1.1
1E
-17
1.5
7E
-14
AC
SM
5
intr
on
ic
EN
SSSC
G00000007857
AC
SM
3
cis
I2
3
ASG
A0103234
26183486
0.6
6
0.3
4
8.1
8E
-12
7.2
8E
-09
AC
SM
5
intr
on
ic
EN
SSSC
G00000026453
AC
SM
5
cis
I2
3
ASG
A0085560
26316304
0.7
6
0.2
4
1.1
1E
-17
1.5
7E
-14
AC
SM
5
inte
rgen
ic
- -
cis
I2
3
H3G
A0053928
26392557
0.7
1
0.2
9
3.4
0E
-14
3.3
4E
-11
AC
SM
5
inte
rgen
ic
- -
cis
231
Annexes

Inte
rval
Ch
r S
NP
P
ositio
n
(bp
) fA
1 fA
2
p-va
lue
q-va
lue
Asso
cia
ted
G
en
e
Co
nse
qu
en
ce
En
sem
bl_
Gen
eId
G
en
e Id
C
is/T
rans-e
SN
Ps
I2
3
MA
RC
0101263
26425965
0.8
3
0.1
7
1.1
1E
-17
1.5
7E
-14
AC
SM
5
intergen
ic -
- cis
I2
3
MA
RC
0050331
26428824
0.7
9
0.2
1
4.4
4E
-16
5.6
6E
-13
AC
SM
5
intergen
ic -
- cis
I2
3
MA
RC
0019934
26488381
0.3
4
0.6
6
1.3
6E
-05
3.6
1E
-03
AC
SM
5
intergen
ic -
- cis
I2
3
MA
RC
0007734
26517625
0.6
6
0.3
4
1.5
6E
-10
1.1
5E
-07
AC
SM
5
intergen
ic -
- cis
I2
3
MA
RC
0052941
26537702
0.7
3
0.2
7
1.1
1E
-17
1.5
7E
-14
AC
SM
5
do
wn
stream
EN
SSSC
G00000007862
GP
R139
cis
I2
3
AL
GA
0018104
26631496
0.4
9
0.5
1
1.8
9E
-06
6.3
4E
-04
AC
SM
5
intergen
ic -
- cis
I2
3
M1G
A0004189
26724456
0.4
0
0.6
0
3.5
3E
-05
8.2
4E
-03
AC
SM
5
intergen
ic -
- cis
I2
3
MA
RC
0001269
26822485
0.7
2
0.2
8
1.1
1E
-17
1.5
7E
-14
AC
SM
5
intergen
ic -
- cis
I2
3
AL
GA
0106209
26913735
0.4
3
0.5
7
3.1
6E
-08
1.6
1E
-05
AC
SM
5
intro
nic
EN
SSSC
G00000029212
GD
E1
cis
I2
3
AL
GA
0121590
26978899
0.5
2
0.4
8
2.6
6E
-15
2.8
3E
-12
AC
SM
5
intro
nic
EN
SSSC
G00000007866
TM
C7
cis
I2
3
ASG
A0090088
27058670
0.7
7
0.2
3
1.1
1E
-17
1.5
7E
-14
AC
SM
5
intro
nic
EN
SSSC
G00000007868
TM
C5
cis
I2
3
MA
RC
0094635
27083041
0.4
7
0.5
3
1.1
3E
-06
4.1
2E
-04
AC
SM
5
intergen
ic -
-cis
I2
3
ASG
A0105223
27200658
0.7
7
0.2
3
1.1
1E
-17
1.5
7E
-14
AC
SM
5
intro
nic
EN
SSSC
G00000022200
- cis
I2
3
AL
GA
0124353
27208947
0.5
3
0.4
7
9.9
8E
-06
2.7
5E
-03
AC
SM
5
intro
nic
EN
SSSC
G00000022200
- cis
I2
3
SIR
I0001454
27254477
0.7
7
0.2
3
1.1
1E
-17
1.5
7E
-14
AC
SM
5
intro
nic
EN
SSSC
G00000022200
- cis
I2
3
MA
RC
0010219
27473051
0.4
4
0.5
6
1.5
6E
-06
5.4
8E
-04
AC
SM
5
intergen
ic -
-cis
I2
3
ASG
A0090426
27551099
0.5
6
0.4
4
2.2
0E
-08
1.1
7E
-05
AC
SM
5
intergen
ic -
-cis
I2
3
AL
GA
0018136
27799603
0.4
7
0.5
3
4.9
5E
-06
1.4
2E
-03
AC
SM
5
intro
nic
EN
SSSC
G00000007872
- cis
I2
3
AL
GA
0018138
27839633
0.7
1
0.2
9
1.1
1E
-17
1.5
7E
-14
AC
SM
5
intro
nic
EN
SSSC
G00000007872
- cis
I2
3
MA
RC
0000263
27855477
0.5
9
0.4
1
3.3
2E
-07
1.3
2E
-04
AC
SM
5
intro
nic
EN
SSSC
G00000007872
- cis
I2
3
MA
RC
0046257
27878993
0.7
9
0.2
1
1.1
1E
-17
1.5
7E
-14
AC
SM
5
intro
nic
EN
SSSC
G00000007872
- cis
I2
3
AL
GA
0018155
27912117
0.6
6
0.3
4
1.3
7E
-07
6.1
0E
-05
AC
SM
5
up
stream
EN
SSSC
G00000007872
- cis
I2
3
AL
GA
0018160
27925965
0.6
6
0.3
4
2.3
6E
-07
9.9
2E
-05
AC
SM
5
intergen
ic -
- cis
I2
3
ASG
A0013982
27941321
0.7
1
0.2
9
1.1
1E
-17
1.5
7E
-14
AC
SM
5
intergen
ic -
- cis
I2
3
ASG
A0013988
27988181
0.6
5
0.3
5
1.0
1E
-05
2.7
6E
-03
AC
SM
5
intergen
ic -
- cis
232
Genomic and functional genomic analysis of fatty acid composition in swine

Inte
rval
Ch
r S
NP
P
osi
tio
n
(bp
) fA
1 fA
2
p-v
alu
eq
-valu
eA
sso
cia
ted
G
en
e
Co
nse
qu
en
ce
En
sem
bl_
Gen
eId
G
en
e I
d
Cis
/T
ran
s-eS
NP
s
I2
3
AL
GA
0018199
28346892
0.6
6
0.3
4
9.3
5E
-07
3.4
7E
-04
AC
SM
5
inte
rgen
ic
- -
cis
I2
3
ASG
A0014014
28373428
0.6
5
0.3
5
2.8
5E
-07
1.1
7E
-04
AC
SM
5
up
stre
am
EN
SSSC
G00000019735
5S
_rR
NA
ci
s
I2
3
ASG
A0014023
28786813
0.6
7
0.3
3
2.5
9E
-06
8.4
7E
-04
AC
SM
5
inte
rgen
ic
- -
cis
I2
3
ASG
A0104499
28886788
0.5
4
0.4
6
4.9
4E
-07
1.9
3E
-04
AC
SM
5
do
wn
stre
am
EN
SSSC
G00000019945
U6
cis
I2
3
ASG
A0014039
29752690
0.6
1
0.3
9
2.8
9E
-05
7.1
8E
-03
AC
SM
5
intr
on
ic
EN
SSSC
G00000007878
PA
RN
ci
s
I2
3
H3G
A0009179
30781487
0.6
3
0.3
7
4.3
0E
-06
1.2
7E
-03
AC
SM
5
inte
rgen
ic
- -
cis
I2
3
CA
SI0
006297
32293788
0.5
4
0.4
6
2.9
0E
-07
1.1
8E
-04
AC
SM
5
inte
rgen
ic
- -
tran
s
I2
3
M1G
A0024387
32474314
0.5
5
0.4
5
6.0
0E
-08
2.8
3E
-05
AC
SM
5
inte
rgen
ic
- -
tran
s
I2
3
AL
GA
0119050
32501522
0.5
5
0.4
5
6.0
0E
-08
2.8
3E
-05
AC
SM
5
inte
rgen
ic
- -
tran
s
I2
3
MA
RC
0015229
32509563
0.5
5
0.4
5
6.0
0E
-08
2.8
3E
-05
AC
SM
5
up
stre
am
EN
SSSC
G00000007899
- tr
ans
I2
3
MA
RC
0031378
32543630
0.5
5
0.4
5
1.6
3E
-07
7.0
9E
-05
AC
SM
5
inte
rgen
ic
- -
tran
s
I2
3
MA
RC
0004212
34672106
0.4
4
0.5
6
1.1
8E
-10
8.9
3E
-08
AC
SM
5
syn
on
ymo
us
EN
SSSC
G00000007909
AB
AT
tr
ans
I2
3
M1G
A0004280
34875865
0.6
2
0.3
8
1.6
0E
-06
5.5
2E
-04
AC
SM
5
inte
rgen
ic
- -
tran
s
I2
3
ASG
A0014213
34921528
0.5
0
0.5
0
1.3
9E
-08
7.7
1E
-06
AC
SM
5
intr
on
ic
EN
SSSC
G00000007914
- tr
ans
I2
3
AL
GA
0115191
34936811
0.3
0
0.7
0
1.1
6E
-05
3.1
3E
-03
AC
SM
5
intr
on
ic
EN
SSSC
G00000007914
- tr
ans
I2
3
AL
GA
0107071
35759334
0.6
9
0.3
1
1.0
6E
-11
9.2
2E
-09
AC
SM
5
inte
rgen
ic
- -
tran
s
I2
3
AL
GA
0102473
37034994
0.7
6
0.2
4
8.9
7E
-08
4.1
4E
-05
AC
SM
5
inte
rgen
ic
- -
tran
s
I2
3
MA
RC
0020793
37234505
0.7
7
0.2
3
5.0
5E
-07
1.9
5E
-04
AC
SM
5
inte
rgen
ic
- -
tran
s
I2
3
ASG
A0105173
39375927
0.3
7
0.6
3
1.5
2E
-05
3.9
3E
-03
AC
SM
5
inte
rgen
ic
- -
tran
s
I2
3
AL
GA
0105074
39433703
0.3
7
0.6
3
1.5
2E
-05
3.9
3E
-03
AC
SM
5
inte
rgen
ic
- -
tran
s
I2
3
AL
GA
0114510
39644923
0.3
7
0.6
3
1.5
2E
-05
3.9
3E
-03
AC
SM
5
intr
on
ic
EN
SSSC
G00000007951
CR
EB
BP
tr
ans
I2
3
H3G
A0009309
39858459
0.3
7
0.6
3
1.5
2E
-05
3.9
3E
-03
AC
SM
5
do
wn
stre
am
EN
SSSC
G00000007953
DN
AS
E1
tran
s
I2
3
AL
GA
0018568
39881683
0.5
3
0.4
7
6.1
1E
-06
1.7
3E
-03
AC
SM
5
inte
rgen
ic
- -
tran
s
I2
3
M1G
A0004302
39992614
0.5
3
0.4
7
6.1
1E
-06
1.7
3E
-03
AC
SM
5
do
wn
stre
am
EN
SSSC
G00000007954
SL
X4
tran
s
I2
3
ASG
A0093403
46893143
0.7
5
0.2
5
7.2
5E
-11
5.6
6E
-08
AC
SM
5
inte
rgen
ic
- -
tran
s
233
Annexes
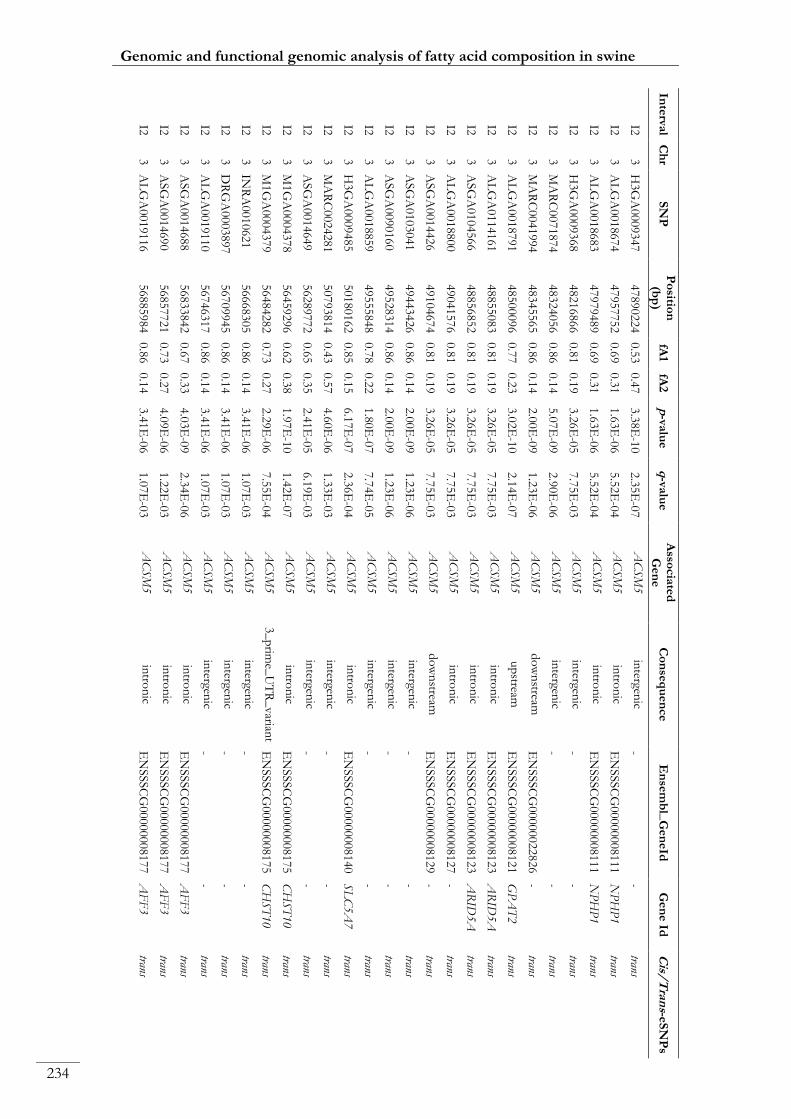
Inte
rval
Ch
r S
NP
P
ositio
n
(bp
) fA
1 fA
2
p-va
lue
q-va
lue
Asso
cia
ted
G
en
e
Co
nse
qu
en
ce
En
sem
bl_
Gen
eId
G
en
e Id
C
is/T
rans-e
SN
Ps
I2
3
H3G
A0009347
47890224
0.5
3
0.4
7
3.3
8E
-10
2.3
5E
-07
AC
SM
5
intergen
ic -
- trans
I2
3
AL
GA
0018674
47957752
0.6
9
0.3
1
1.6
3E
-06
5.5
2E
-04
AC
SM
5
intro
nic
EN
SSSC
G00000008111
NP
HP
1
trans
I2
3
AL
GA
0018683
47979489
0.6
9
0.3
1
1.6
3E
-06
5.5
2E
-04
AC
SM
5
intro
nic
EN
SSSC
G00000008111
NP
HP
1
trans
I2
3
H3G
A0009368
48216866
0.8
1
0.1
9
3.2
6E
-05
7.7
5E
-03
AC
SM
5
intergen
ic -
-trans
I2
3
MA
RC
0071874
48324056
0.8
6
0.1
4
5.0
7E
-09
2.9
0E
-06
AC
SM
5
intergen
ic -
-trans
I2
3
MA
RC
0041994
48345565
0.8
6
0.1
4
2.0
0E
-09
1.2
3E
-06
AC
SM
5
do
wn
stream
EN
SSSC
G00000022826
- trans
I2
3
AL
GA
0018791
48500096
0.7
7
0.2
3
3.0
2E
-10
2.1
4E
-07
AC
SM
5
up
stream
EN
SSSC
G00000008121
GP
AT
2
trans
I2
3
AL
GA
0114161
48855083
0.8
1
0.1
9
3.2
6E
-05
7.7
5E
-03
AC
SM
5
intro
nic
EN
SSSC
G00000008123
AR
ID5A
trans
I2
3
ASG
A0104566
48856852
0.8
1
0.1
9
3.2
6E
-05
7.7
5E
-03
AC
SM
5
intro
nic
EN
SSSC
G00000008123
AR
ID5A
trans
I2
3
AL
GA
0018800
49041576
0.8
1
0.1
9
3.2
6E
-05
7.7
5E
-03
AC
SM
5
intro
nic
EN
SSSC
G00000008127
- trans
I2
3
ASG
A0014426
49104674
0.8
1
0.1
9
3.2
6E
-05
7.7
5E
-03
AC
SM
5
do
wn
stream
EN
SSSC
G00000008129
- trans
I2
3
ASG
A0103041
49443426
0.8
6
0.1
4
2.0
0E
-09
1.2
3E
-06
AC
SM
5
intergen
ic -
-trans
I2
3
ASG
A0090160
49528314
0.8
6
0.1
4
2.0
0E
-09
1.2
3E
-06
AC
SM
5
intergen
ic -
-trans
I2
3
AL
GA
0018859
49555848
0.7
8
0.2
2
1.8
0E
-07
7.7
4E
-05
AC
SM
5
intergen
ic -
-trans
I2
3
H3G
A0009485
50180162
0.8
5
0.1
5
6.1
7E
-07
2.3
6E
-04
AC
SM
5
intro
nic
EN
SSSC
G00000008140
SL
C5A
7
trans
I2
3
MA
RC
0024281
50793814
0.4
3
0.5
7
4.6
0E
-06
1.3
3E
-03
AC
SM
5
intergen
ic -
-trans
I2
3
ASG
A0014649
56289772
0.6
5
0.3
5
2.4
1E
-05
6.1
9E
-03
AC
SM
5
intergen
ic -
-trans
I2
3
M1G
A0004378
56459296
0.6
2
0.3
8
1.9
7E
-10
1.4
2E
-07
AC
SM
5
intro
nic
EN
SSSC
G00000008175
CH
ST
10
trans
I2
3
M1G
A0004379
56484282
0.7
3
0.2
7
2.2
9E
-06
7.5
5E
-04
AC
SM
5
3_
prim
e_U
TR
_varian
t E
NSSSC
G00000008175
CH
ST
10
trans
I2
3
INR
A0010621
56668305
0.8
6
0.1
4
3.4
1E
-06
1.0
7E
-03
AC
SM
5
intergen
ic -
- trans
I2
3
DR
GA
0003897
56709945
0.8
6
0.1
4
3.4
1E
-06
1.0
7E
-03
AC
SM
5
intergen
ic -
- trans
I2
3
AL
GA
0019110
56746317
0.8
6
0.1
4
3.4
1E
-06
1.0
7E
-03
AC
SM
5
intergen
ic -
- trans
I2
3
ASG
A0014688
56833842
0.6
7
0.3
3
4.0
3E
-09
2.3
4E
-06
AC
SM
5
intro
nic
EN
SSSC
G00000008177
AF
F3
trans
I2
3
ASG
A0014690
56857721
0.7
3
0.2
7
4.0
9E
-06
1.2
2E
-03
AC
SM
5
intro
nic
EN
SSSC
G00000008177
AF
F3
trans
I2
3
AL
GA
0019116
56885984
0.8
6
0.1
4
3.4
1E
-06
1.0
7E
-03
AC
SM
5
intro
nic
EN
SSSC
G00000008177
AF
F3
trans
234
Genomic and functional genomic analysis of fatty acid composition in swine

Inte
rval
Ch
r S
NP
P
osi
tio
n
(bp
) fA
1 fA
2
p-v
alu
eq
-valu
eA
sso
cia
ted
G
en
e
Co
nse
qu
en
ce
En
sem
bl_
Gen
eId
G
en
e I
d
Cis
/T
ran
s-eS
NP
s
I2
3
AL
GA
0019121
57129085
0.7
3
0.2
7
4.0
9E
-06
1.2
2E
-03
AC
SM
5
intr
on
ic
EN
SSSC
G00000008177
AF
F3
tran
s
I2
3
AL
GA
0108239
57170110
0.7
3
0.2
7
4.0
9E
-06
1.2
2E
-03
AC
SM
5
intr
on
ic
EN
SSSC
G00000008177
AF
F3
tran
s
I2
3
MA
RC
0001937
57187517
0.5
4
0.4
6
1.2
5E
-09
8.2
5E
-07
AC
SM
5
intr
on
ic
EN
SSSC
G00000008177
AF
F3
tran
s
I2
3
MA
RC
0034058
57211150
0.4
0
0.6
0
2.2
7E
-09
1.3
8E
-06
AC
SM
5
inte
rgen
ic
- -
tran
s
I2
3
ASG
A0094631
57219021
0.5
6
0.4
4
1.0
6E
-06
3.9
0E
-04
AC
SM
5
inte
rgen
ic
- -
tran
s
I2
3
AL
GA
0019125
57431333
0.7
3
0.2
7
4.0
9E
-06
1.2
2E
-03
AC
SM
5
intr
on
ic
EN
SSSC
G00000008179
RE
V1
tran
s
I2
3
ASG
A0082387
57704441
0.7
3
0.2
7
4.0
9E
-06
1.2
2E
-03
AC
SM
5
do
wn
stre
am
EN
SSSC
G00000008185
MIT
D1
tran
s
I2
3
ASG
A0014810
60580301
0.1
8
0.8
2
3.1
4E
-05
7.7
5E
-03
AC
SM
5
up
stre
am
EN
SSSC
G00000008213
CD
8B
tr
ans
I2
3
MA
RC
0017871
60850148
0.8
1
0.1
9
3.9
7E
-05
9.1
0E
-03
AC
SM
5
do
wn
stre
am
EN
SSSC
G00000008217
CD
8A
tr
ans
I2
3
ASG
A0014871
62719672
0.2
1
0.7
9
3.8
6E
-05
8.9
0E
-03
AC
SM
5
inte
rgen
ic
- -
tran
s
I2
3
AL
GA
0111911
63248078
0.1
9
0.8
1
3.4
2E
-05
8.0
3E
-03
AC
SM
5
inte
rgen
ic
- -
tran
s
I3
3
MA
RC
0032158
83365626
0.3
5
0.6
5
1.6
3E
-06
5.5
2E
-04
AC
SM
5
inte
rgen
ic
- -
tran
s
I4
3
AL
GA
0020206
100905327
0.7
0
0.3
0
9.3
4E
-06
2.5
9E
-03
AC
SM
5
inte
rgen
ic
- -
tran
s
I4
3
ASG
A0015465
101222209
0.6
8
0.3
2
1.4
1E
-06
5.0
9E
-04
AC
SM
5
inte
rgen
ic
- -
tran
s
I4
3
ASG
A0098441
101461883
0.7
0
0.3
0
7.6
3E
-06
2.1
5E
-03
AC
SM
5
inte
rgen
ic
- -
tran
s
I5
10
H3G
A0055101
54839
0.4
7
0.5
3
8.1
1E
-07
3.0
4E
-04
AC
SM
5
intr
on
ic
EN
SSSC
G00000010795
ND
UF
AB
1
tran
s
I5
10
MA
RC
0015344
65922
0.4
7
0.5
3
8.1
1E
-07
3.0
4E
-04
AC
SM
5
do
wn
stre
am
EN
SSSC
G00000010795
ND
UF
AB
1
tran
s
I5
10
ASG
A0082591
120016
0.7
4
0.2
6
2.0
0E
-08
1.0
8E
-05
AC
SM
5
do
wn
stre
am
EN
SSSC
G00000010797
EA
RS
2
tran
s
I5
10
ASG
A0092761
150115
0.6
5
0.3
5
2.7
8E
-09
1.6
6E
-06
AC
SM
5
intr
on
ic
EN
SSSC
G00000010798
GG
A2
tran
s
I5
10
H3G
A0055120
167126
0.7
0
0.3
0
2.8
9E
-15
2.9
9E
-12
AC
SM
5
do
wn
stre
am
EN
SSSC
G00000010798
GG
A2
tran
s
I5
10
ASG
A0090778
175359
0.7
6
0.2
4
1.4
4E
-15
1.7
2E
-12
AC
SM
5
intr
on
ic
EN
SSSC
G00000010799
CO
G7
tran
s
I5
10
ASG
A0094144
184863
0.7
1
0.2
9
1.0
9E
-08
6.1
3E
-06
AC
SM
5
intr
on
ic
EN
SSSC
G00000010799
CO
G7
tran
s
I5
10
ASG
A0095156
202837
0.7
4
0.2
6
2.0
0E
-08
1.0
8E
-05
AC
SM
5
intr
on
ic
EN
SSSC
G00000010799
CO
G7
tran
s
I6
16
AL
GA
0089402
19133382
0.6
6
0.3
4
3.8
3E
-05
8.8
8E
-03
AC
SM
5
intr
on
ic
EN
SSSC
G00000016810
PD
ZD
2
tran
s
I7
13
ASG
A0055780
6891435
0.5
5
0.4
5
1.2
0E
-07
4.7
4E
-03
EL
OV
L6
inte
rgen
ic
- -
tran
s
235
Annexes

Inte
rval
Ch
r S
NP
P
ositio
n
(bp
) fA
1 fA
2
p-va
lue
q-va
lue
Asso
cia
ted
G
en
e
Co
nse
qu
en
ce
En
sem
bl_
Gen
eId
G
en
e Id
C
is/T
rans-e
SN
Ps
I8
2
ASG
A0008719
6094116
0.4
8
0.5
2
1.2
6E
-05
4.7
5E
-02
FA
BP
4
intergen
ic -
- trans
I8
2
MA
RC
0018949
8997005
0.5
9
0.4
1
1.3
8E
-05
4.7
5E
-02
FA
BP
4
up
stream
EN
SSSC
G00000023090
BE
ST
1
trans
I9
3
ASG
A0015643
109404009
0.6
9
0.3
1
1.4
4E
-05
4.7
5E
-02
FA
BP
4
3_
prim
e_U
TR
_varian
t E
NSSSC
G00000020689
CE
BP
ZO
S
trans
I9
3
AL
GA
0020658
113469226
0.9
1
0.0
9
6.7
0E
-06
4.7
5E
-02
FA
BP
4
intro
nic
EN
SSSC
G00000008510
LT
BP
1
trans
I9
3
ASG
A0016181
119739502
0.6
6
0.3
4
8.3
1E
-06
4.7
5E
-02
FA
BP
4
syno
nym
ous
EN
SSSC
G00000008568
DR
C1
trans
I10
4
AL
GA
0024527
36727180
0.5
7
0.4
3
1.1
1E
-05
4.7
5E
-02
FA
BP
4
intergen
ic -
-trans
I11
4
AL
GA
0025158
60566866
0.4
8
0.5
2
1.9
3E
-06
1.9
5E
-02
FA
BP
4
intergen
ic -
-cis (F
AB
P5)
I11
4
AL
GA
0025162
60844160
0.6
8
0.3
2
1.3
2E
-05
4.7
5E
-02
FA
BP
4
intergen
ic -
-cis (F
AB
P5)
I11
4
MA
RC
0115316
61059205
0.5
2
0.4
8
1.9
7E
-06
1.9
5E
-02
FA
BP
4
intro
nic
EN
SSSC
G00000022989
ZN
F704
cis (FA
BP
5)
I11
4
INR
A0014244
63090979
0.5
9
0.4
1
1.1
9E
-05
4.7
5E
-02
FA
BP
4
intro
nic
EN
SSSC
G00000006163
PK
IA
cis (FA
BP
5)
I11
4
AL
GA
0025337
65252780
0.7
7
0.2
3
8.6
7E
-07
1.9
5E
-02
FA
BP
4
intergen
ic -
-cis (F
AB
P5)
I12
9
AL
GA
0054847
129178729
0.8
8
0.1
2
1.1
9E
-06
1.9
5E
-02
FA
BP
4
intro
nic
EN
SSSC
G00000015508
TN
R
trans
I13
2
ASG
A0008845
7850065
0.6
1
0.3
9
9.8
8E
-06
3.9
3E
-02
FA
DS
2
intro
nic
EN
SSSC
G00000013056
LG
AL
S12
trans
I13
2
ASG
A0104083
8867970
0.7
8
0.2
2
5.9
8E
-08
5.9
4E
-04
FA
DS
2
intro
nic
EN
SSSC
G00000013066
- cis
I13
2
ASG
A0090054
8943379
0.8
6
0.1
4
2.0
3E
-06
1.1
5E
-02
FA
DS
2
intergen
ic -
-cis
I13
2
AL
GA
0011764
9098547
0.8
9
0.1
1
1.5
4E
-05
4.7
1E
-02
FA
DS
2
intergen
ic -
-cis
I13
2
ASG
A0008884
9139348
0.9
2
0.0
8
1.5
4E
-05
4.7
1E
-02
FA
DS
2
intro
nic
EN
SSSC
G00000013072
FA
DS
2
cis
I13
2
ASG
A0008896
9171685
0.6
6
0.3
4
2.5
8E
-07
1.7
1E
-03
FA
DS
2
intro
nic
EN
SSSC
G00000013073
FA
DS
3
cis
I13
2
AL
GA
0011760
9198141
0.8
6
0.1
4
1.2
1E
-05
4.3
7E
-02
FA
DS
2
up
stream
EN
SSSC
G00000013074
RA
B3IL
1
cis
I13
2
ASG
A0008874
9218889
0.7
9
0.2
1
2.2
8E
-07
1.7
1E
-03
FA
DS
2
intergen
ic -
-cis
I14
6
AL
GA
0035721
74418977
0.7
4
0.2
6
7.5
0E
-06
3.3
1E
-02
FA
DS
2
intergen
ic -
-trans
I15
8
ASG
A0100508
59002816
0.3
5
0.6
5
1.9
3E
-05
4.8
0E
-02
FA
DS
2
intro
nic
EN
SSSC
G00000025792
- trans
I15
8
MA
RC
0041089
59080961
0.6
5
0.3
5
1.9
3E
-05
4.8
0E
-02
FA
DS
2
intro
nic
EN
SSSC
G00000008913
IGF
BP
7
trans
I15
8
H3G
A0024926
68676342
0.6
5
0.3
5
1.9
3E
-05
4.8
0E
-02
FA
DS
2
intergen
ic -
-trans
I16
10
H3G
A0030086
46933533
0.6
6
0.3
4
2.4
0E
-06
1.1
9E
-02
FA
DS
2
intergen
ic -
-trans
236
Genomic and functional genomic analysis of fatty acid composition in swine

Inte
rval
Ch
r S
NP
P
osi
tio
n
(bp
) fA
1 fA
2
p-v
alu
eq
-valu
eA
sso
cia
ted
G
en
e
Co
nse
qu
en
ce
En
sem
bl_
Gen
eId
G
en
e I
d
Cis
/T
ran
s-eS
NP
s
I17
9
MA
RC
0034587
20183865
0.7
6
0.2
4
2.1
5E
-05
3.4
2E
-02
SL
C27A
4
inte
rgen
ic
- -
tran
s
I17
9
ASG
A0041925
20196539
0.7
9
0.2
1
1.6
9E
-05
2.9
2E
-02
SL
C27A
4
inte
rgen
ic
- -
tran
s
I18
14
ASG
A0064787
88898693
0.9
5
0.0
5
2.5
1E
-06
4.7
6E
-03
SL
C27A
4
inte
rgen
ic
- -
tran
s
I18
14
MA
RC
0057510
89058255
0.9
5
0.0
5
2.5
1E
-06
4.7
6E
-03
SL
C27A
4
intr
on
ic
EN
SSSC
G00000010342
SH
2D
4B
tr
ans
I18
14
MA
RC
0029597
89073094
0.9
5
0.0
5
2.5
1E
-06
4.7
6E
-03
SL
C27A
4
do
wn
stre
am
EN
SSSC
G00000010342
SH
2D
4B
tr
ans
I18
14
AL
GA
0079330
89521045
0.9
5
0.0
5
2.5
1E
-06
4.7
6E
-03
SL
C27A
4
inte
rgen
ic
- -
tran
s
I18
14
MA
RC
0041088
90286262
0.9
5
0.0
5
2.5
1E
-06
4.7
6E
-03
SL
C27A
4
inte
rgen
ic
- -
tran
s
I18
14
ASG
A0064841
90338701
0.9
5
0.0
5
2.5
1E
-06
4.7
6E
-03
SL
C27A
4
inte
rgen
ic
- -
tran
s
I18
14
ASG
A0064844
90362764
0.9
5
0.0
5
2.5
1E
-06
4.7
6E
-03
SL
C27A
4
inte
rgen
ic
- -
tran
s
I18
14
MA
RC
0088303
90797721
0.9
5
0.0
5
2.5
1E
-06
4.7
6E
-03
SL
C27A
4
inte
rgen
ic
- -
tran
s
I18
14
AL
GA
0079375
90925232
0.9
5
0.0
5
2.5
1E
-06
4.7
6E
-03
SL
C27A
4
inte
rgen
ic
- -
tran
s
I18
14
MA
RC
0010015
91126881
0.9
5
0.0
5
2.5
1E
-06
4.7
6E
-03
SL
C27A
4
inte
rgen
ic
- -
tran
s
I18
14
MA
RC
0003938
91360798
0.9
1
0.0
9
6.8
4E
-06
1.2
4E
-02
SL
C27A
4
inte
rgen
ic
- -
tran
s
I18
14
AL
GA
0079393
91666877
0.9
5
0.0
5
2.5
1E
-06
4.7
6E
-03
SL
C27A
4
inte
rgen
ic
- -
tran
s
I18
14
MA
RC
0056155
91685430
0.9
5
0.0
5
2.5
1E
-06
4.7
6E
-03
SL
C27A
4
inte
rgen
ic
- -
tran
s
I18
14
AL
GA
0079399
92014581
0.9
5
0.0
5
2.5
1E
-06
4.7
6E
-03
SL
C27A
4
inte
rgen
ic
- -
tran
s
I18
14
MA
RC
0014799
92290727
0.9
5
0.0
5
2.5
1E
-06
4.7
6E
-03
SL
C27A
4
intr
on
ic
EN
SSSC
G00000010350
RG
R
tran
s
I18
14
AL
GA
0079407
92432834
0.9
5
0.0
5
2.5
1E
-06
4.7
6E
-03
SL
C27A
4
intr
on
ic
EN
SSSC
G00000010351
CC
SE
R2
tran
s
I19
15
ASG
A0070790
137054337
0.9
3
0.0
7
3.3
9E
-05
5.0
0E
-02
SL
C27A
4
inte
rgen
ic
- -
tran
s
I19
15
MA
RC
0050960
137365338
0.9
3
0.0
7
3.3
9E
-05
5.0
0E
-02
SL
C27A
4
inte
rgen
ic
- -
tran
s
237
Annexes

Genomic and functional genomic analysis of fatty acid composition in swine
238
Paper III. Table S5: Gene annotation of genes within the eQTL intervals. Annotation
was performed by considering for trans-eQTLs the eQTL interval ±1 Mb; whereas for cis-
eQTLs only the studied gene was selected (ACSM5, FABP4, and FADS2). (too large to be
attached, not included in the present thesis).
See table at:
https://drive.google.com/open?id=0B6AO_ypOnvVONUprdEFGaExmS3c
Paper III. Table S6: Mean comparison between males and females of backfat gene-
expression levels of 43 lipid-related genes.
Gene Mean in Male Mean in Female P-valueACSM5 0.51817697 1.72852438 3.13E-04 ADIPOQ 0.92164360 0.98284488 2.36E-01 AGPAT2 0.87918084 1.10464597 1.37E-03 ANK2 0.84801896 1.14951534 2.29E-07 ARNT 1.09244595 1.12042622 5.19E-01 CD36 0.99617293 0.92619269 1.19E-01 CPT1A 0.91728879 1.01130066 1.12E-01 CROT 0.95256618 1.05867480 1.22E-01 CYP2U1 1.07606492 1.11208908 6.16E-01 DGAT1 1.00775545 1.14631721 1.60E-01 DGAT2 0.82390245 1.20770872 9.35E-03 EGF 0.68500959 1.74315974 8.85E-02
ELOVL5 0.95955732 1.16724091 2.98E-02 ELOVL6 0.74078130 1.24349924 7.89E-04 ESRRA 1.05230240 1.13238052 2.85E-01 FABP4 0.91716259 0.97833632 2.20E-01 FABP5 0.87094802 0.83276296 4.29E-01 FADS1 0.81510182 0.81918792 9.35E-01 FADS2 1.03167992 0.86056221 1.79E-02 FADS3 0.95338485 0.94140547 7.46E-01 LIPC 1.06810700 1.07355133 9.44E-01 LPIN1 0.98953571 0.90460040 2.09E-01 MGLL 0.91940037 1.05084173 2.84E-02 MLXIPL 0.96472806 1.24568591 1.65E-03 NFKB1 0.98551744 0.89685752 4.24E-03 NR1H3 1.05627984 1.06637889 8.59E-01
PEX2 0.82736047 1.10936741 7.24E-05 PLA2G12A 0.88319601 1.17250484 1.19E-04 PLCB2 0.94496027 0.90234026 4.85E-01 PLPP1 1.07868017 0.81758309 1.47E-06 PNPLA2 0.90634158 1.09133116 1.21E-03 POU2F1 0.91960235 0.97001854 1.84E-01 PPARA 0.89844266 1.21347231 2.13E-04 PPARD 0.88021205 1.20349846 1.15E-05 PPARG 0.97231705 1.05651618 1.51E-01 RBP4 1.19587676 1.20421240 9.36E-01 RXRG 1.13725219 1.11110297 8.30E-01 SCAP 0.97647064 1.18466371 7.55E-05 SCD 0.47626940 1.06854340 7.40E-03 SLC27A1 1.17366254 1.07916161 2.65E-01
SLC27A4 1.17979415 1.12465775 3.09E-01 SREBF1 0.80739118 1.25519900 5.86E-07 USF1 1.03241102 1.03328212 9.82E-01

Annexes
239
Paper III. Table S7: Description of the 393 human orthologous genes.
Interval Human associated gene name
I1 ALDH7A1, C5orf63, CTXN3, LMNB1, MARCH3, MEGF10, PHAX, PRRC1, TEX43, GRAMD3
I2 ACSM5
I3 B3GNT2, CCT4, COMMD1, EHBP1, FAM161A, NUP54, OTX1, USP34, XPO1, MDH1
I4 ATP6V1E2, CAMKMT, EPAS1, PPM1B, PREPL, PRKCE, RHOQ, SIX2, SLC3A1, SRBD1, TMEM247, PIGF
I5 COG7, EARS2, GGA2, NDUFAB1, PALB2, UBFD1, DCTN
I6 C5orf22, DROSHA, PDZD2, CDH6
I7 EFHB, KCNH8, SATB1
I8
AHNAK, AP000721.4, AP5B1, ARL2, ASRGL1, ATG2A, ATL3, B3GAT3, B4GAT1, BAD, BANF1, BATF2, BEST1, BRMS1, BSCL2, C11orf68, C11orf84, C11orf95, C11orf98, CAPN1, CATSPER1, CCDC85B, CCDC88B, CD248, CDC42BPG, CDC42EP2, CDCA5, CFL1, CHRM1, CNIH2, CPSF7, CST6, CTSW, CYB561A3, DAGLA, DDB1, DNAJC4, DPF2, DRAP1, EEF1G, EFEMP2, EHD1, EIF1AD, EML3, ESRRA, FADS1, FADS2, FADS3, FAU, FEN1, FERMT3, FIBP, FKBP2, FLRT1, FOSL1, FRMD8, GAL3ST3, GANAB, GPHA2, GPR137, HNRNPUL2, HRASLS5, INCENP, INTS5, KAT5, KCNK4, KCNK7, KLC2, LGALS12, LRRC10B, LTBP3, MACROD1, MAP4K2, MARK2, MEN1, METTL12, MRPL49, MTA2, MUS81, MYRF, NAA40, NAALADL1, NRXN2, NUDT22, NXF1, OTUB1, OVOL1, PACS1, PCNXL3, PGA4, PLA2G16, PLCB3, POLA2, POLR2G, PPP1R14B, PPP1R32, PPP2R5B, PRDX5, PYGM, RAB3IL1, RASGRP2, RCOR2, RELA, RIN1, RNASEH2C, ROM1, RPL13A, RPL22, RPS6KA4, RTN3, SAC3D1, SART1, SCGB1A1, SCGB1D2, SCYL1, SDHAF2, SF1, SF3B2, SIPA1, SLC22A10, SLC22A11, SLC22A12, SLC22A6, SLC22A8, SLC25A45, SLC3A2, SNX15, SNX32, SSSCA1, STIP1, STX5, SYT7, SYVN1, TAF6L, TEX40, TIGD3, TKFC, TM7SF2, TMEM138, TMEM151A, TMEM216, TMEM223, TMEM258, TMEM262, TRMT112, TRPT1, TSGA10IP, TTC9C, TUT1, UBXN1, UQCC3, VEGFB, VPS51, VWCE, WDR74, YIF1A, ZBTB3, ZFPL1, ZNHIT2, SCGB2A1, SLC29A2
I9
ABHD1, ADGRF3, AGBL5, ALK, ASXL2, ATRAID, BIRC6, BRE, C2orf16, C2orf70, C2orf71, CAPN14, CCDC121, CDC42EP3, CEBPZ, CEBPZOS, CENPA, CGREF1, CIB4, CLIP4, CRIM1, DNMT3A, DPY30, DPYSL5, DRC1, DTNB, EHD3, EIF2B4, EMILIN1, EPT1, FAM179A, FAM98A, FEZ2, FNDC4, FOSL2, GAREM2, GCKR, GPATCH11, GPN1, HADHA, HADHB, HEATR5B, IFT172, KHK, KIF3C, KRTCAP3, LBH, LCLAT1, LTBP1, MAPRE3, MEMO1, NDUFAF7, NLRC4, NRBP1, PLB1, PPM1G, PPP1CB, PREB, PRKD3, PRR30, QPCT, RAB10, RASGRP3, RBKS, RMDN2, SLC30A6, SLC35F6, SLC4A1AP, SLC5A6, SNX17, SPAST, SPDYA, SRD5A2, STRN, SUPT7L, TCF23, TMEM214, TRMT61B, TTC27, VIT, WDR43, XDH, YPEL5, YWHAE, ZNF512, CYP1B1, GALNT14
I10 ATP6V1C1, AZIN1, BAALC, CTHRC1, DCAF13, FZD6, KLF10, ODF1, RRM2B, SLC25A32, UBR5, RIMS2
I11 FABP5
I12 CACYBP, GPR52, KIAA0040, MRPS14, PAPPA2, RABGAP1L, RFWD2, TNN, TNR, NXPE2
I14 C1orf234, C1QA, C1QB, C1QC, CDC42, CNR2, ECE1, EPHA8, EPHB2, FUCA1, GALE, HMGCL, HSPG2, HTR1D, KDM1A, LACTBL1, LUZP1, ZBTB40
I15 ADGRL3, CENPC, CEP135, CLOCK, EPHA5, EXOC1, IGFBP7, NOA1, PDCL2, POLR2B, PPIC, REST, TECRL, TMEM165, TMSB4X
I16 ARHGAP12, CUBN, EPC1, ERV3-1, KIF5B, PTCHD3, SVIL, ZEB1, ZNF438
I17 ANKRD42, CCDC90B, DLG2, PCF11, PRCP, RAB30
I18 ANXA11, C10orf99, CCSER2, CDHR1, DYDC1, DYDC2, FAM213A, GHITM, GRID1, LRIT1, LRIT2, MAT1A, NRG3, PLAC9, PPIF, RGR, SFTPA1, SFTPD, SH2D4B, TMEM254, TSPAN14, ZMIZ1
I19 EPHA4, FARSB, MOGAT1, PAX3, SGPP2
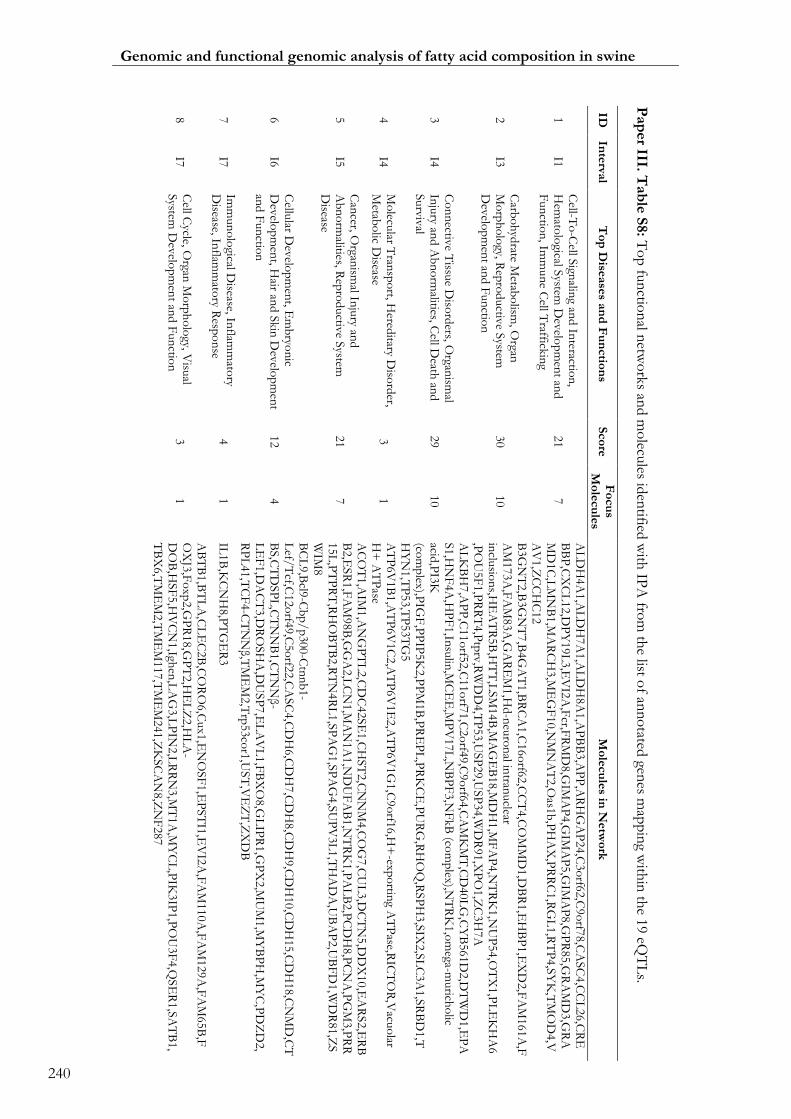
Pap
er III. T
ab
le S
8: T
op
fun
ction
al netw
ork
s and m
olecu
les iden
tified w
ith IP
A fro
m th
e list of an
no
tated gen
es map
pin
g with
in th
e 19 eQ
TL
s.
ID
Inte
rval
To
p D
isease
s an
d F
un
ctio
ns
Sco
re
Fo
cu
s M
ole
cu
les
Mo
lecu
les in
Netw
ork
1
I1
Cell-T
o-C
ell Sign
aling an
d In
teraction
, H
emato
logical S
ystem D
evelo
pm
ent an
d
Fun
ction
, Imm
un
e Cell T
raffickin
g
21
7
AL
DH
4A
1,A
LD
H7A
1,A
LD
H8A
1,A
PB
B3,A
PP
,AR
HG
AP
24,C
3o
rf62,C
9o
rf78,C
ASC
4,C
CL
26,C
RE
BB
P,C
XC
L12,D
PY
19L
3,E
VI2
A,F
cr,FR
MD
8,G
IMA
P4,G
IMA
P5,G
IMA
P8,G
PR
85,G
RA
MD
3,G
RA
MD
1C
,LM
NB
1,M
AR
CH
3,M
EG
F10,N
MN
AT
2,O
as1b
,PH
AX
,PR
RC
1,R
GL
1,R
TP
4,S
YK
,TM
OD
4,V
AV
1,Z
CC
HC
12
2
I3
Carb
oh
ydrate M
etabo
lism, O
rgan
Mo
rph
olo
gy, Rep
rod
uctiv
e System
D
evelo
pm
ent an
d F
un
ction
30
10
B3G
NT
2,B
3G
NT
7,B
4G
AT
1,B
RC
A1,C
16o
rf62,C
CT
4,C
OM
MD
1,D
BR
1,E
HB
P1,E
XD
2,F
AM
161A
,FA
M173A
,FA
M83A
,GA
RE
M1,H
d-n
euro
nal in
tranuclear
inclu
sion
s,HE
AT
R5B
,HT
T,L
SM
14B
,MA
GE
B18,M
DH
1,M
FA
P4,N
TR
K1,N
UP
54,O
TX
1,P
LE
KH
A6
,PO
U5F
1,P
RR
T4,P
tprv
,RW
DD
4,T
P53,U
SP
29,U
SP
34,W
DR
91,X
PO
1,Z
C3H
7A
3
I4
Co
nn
ective T
issue D
isord
ers, Organ
ismal
Inju
ry and
Ab
no
rmalities, C
ell Death
and
Surv
ival
29
10
AL
KB
H7,A
PP
,C11o
rf52,C
11o
rf71,C
2o
rf49,C
9o
rf64,C
AM
KM
T,C
D40L
G,C
YB
561D
2,D
TW
D1,E
PA
S1,H
NF
4A
,HP
F1,In
sulin
,MC
EE
,MP
V17L
,NB
PF
3,N
FkB
(com
plex),N
TR
K1,o
mega-m
urich
olic
acid,P
I3K
(co
mp
lex),P
IGF
,PP
IP5K
2,P
PM
1B
,PR
EP
L,P
RK
CE
,PU
RG
,RH
OQ
,RSP
H3,S
IX2,S
LC
3A
1,S
RB
D1,T
HY
N1,T
P53,T
P53T
G5
4
I4
Mo
lecular T
ransp
ort, H
ereditary D
isord
er, M
etabo
lic Disease
3
1
AT
P6V
1B
1,A
TP
6V
1C
2,A
TP
6V
1E
2,A
TP
6V
1G
1,C
9o
rf16,H
+-exp
ortin
g AT
Pase,R
ICT
OR
,Vacu
olar
H+
AT
Pase
5
I5
Can
cer, Organ
ismal In
jury an
d
Ab
no
rmalities, R
epro
ductiv
e System
D
isease 21
7
AC
OT
1,A
IM1,A
NG
PT
L2,C
DC
42SE
1,C
HST
2,C
NN
M4,C
OG
7,C
UL
3,D
CT
N5,D
DX
10,E
AR
S2,E
RB
B2,E
SR
1,F
AM
98B
,GG
A2,L
CN
1,M
AN
1A
1,N
DU
FA
B1,N
TR
K1,P
AL
B2,P
CD
H8,P
CN
A,P
GM
3,P
RR
15L
,PT
PR
T,R
HO
BT
B2,R
TN
4R
L1,S
PA
G1,S
PA
G4,S
UP
V3L
1,T
HA
DA
,UB
AP
2,U
BF
D1,W
DR
81,Z
SW
IM8
6
I6
Cellu
lar Dev
elop
men
t, Em
bryo
nic
Dev
elop
men
t, Hair an
d S
kin
Dev
elop
men
t an
d F
un
ction
12
4
BC
L9,B
cl9-C
bp
/p
300-C
tnn
b1-
Lef/
Tcf,C
12o
rf49,C
5o
rf22,C
ASC
4,C
DH
6,C
DH
7,C
DH
8,C
DH
9,C
DH
10,C
DH
15,C
DH
18,C
NM
D,C
TB
S,C
TD
SP
L,C
TN
NB
1,C
TN
Nβ-
LE
F1,D
AC
T3,D
RO
SH
A,D
USP
7,E
LA
VL
1,F
BX
O8,G
LIP
R1,G
PX
2,M
UM
1,M
YB
PH
,MY
C,P
DZ
D2,
RP
L41,T
CF
4-C
TN
Nβ,T
ME
M2,T
rp53co
r1,U
ST
,VE
ZT
,ZX
DB
7
I7
Imm
un
olo
gical Disease, In
flamm
atory
Disease, In
flamm
atory R
espo
nse
4
1
IL1B
,KC
NH
8,P
TG
ER
3
8
I7
Cell C
ycle, Organ
Mo
rph
olo
gy, Visu
al System
Dev
elop
men
t and
Fun
ction
3
1
AB
TB
1,B
TL
A,C
LE
C2B
,CO
RO
6,C
ux1
,EN
OSF
1,E
PST
I1,E
VI2
A,F
AM
110A
,FA
M129A
,FA
M65B
,FO
XJ3
,Fo
xp2,G
PR
18,G
PT
2,H
EL
Z2,H
LA
-D
OB
,HSF
5,H
VC
N1,Igh
en,L
AG
3,L
PIN
2,L
RR
N3,M
T1A
,MY
CL
,PIK
3IP
1,P
OU
3F
4,Q
SE
R1,S
AT
B1,
TB
X6,T
ME
M2,T
ME
M117,T
ME
M241,Z
KSC
AN
8,Z
NF
287
240
Genomic and functional genomic analysis of fatty acid composition in swine
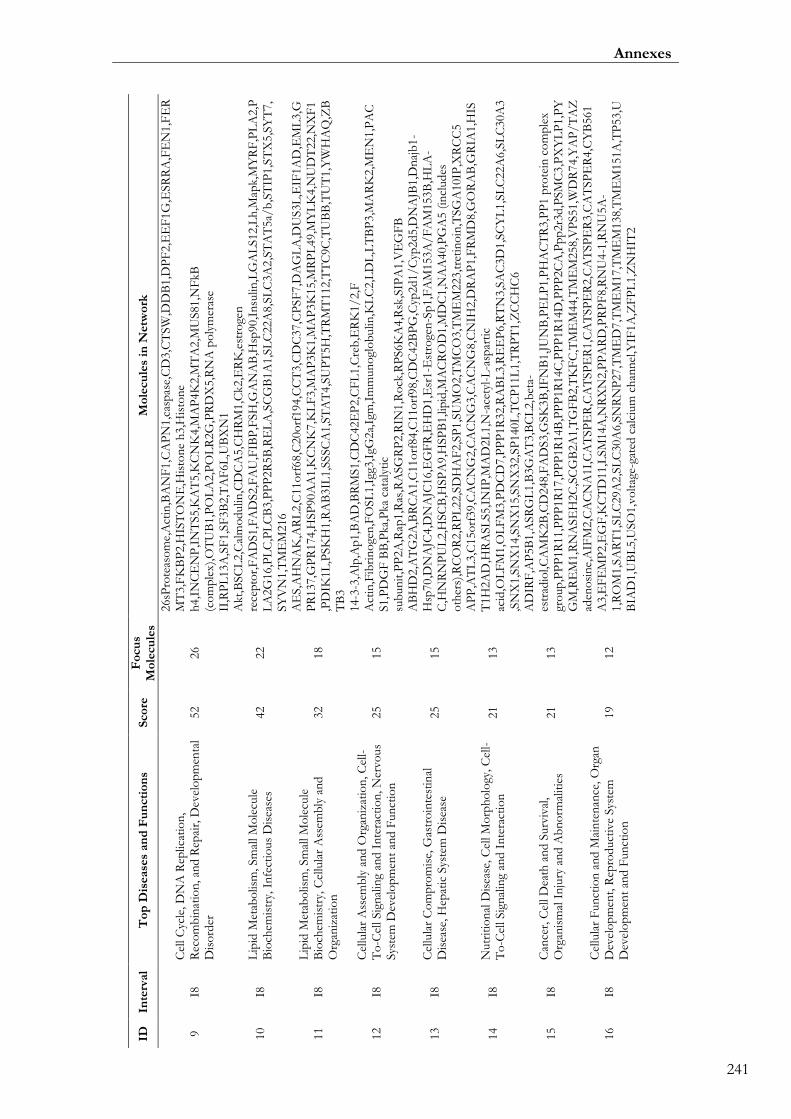
ID
Inte
rval
To
p D
isease
s an
d F
un
cti
on
s S
co
re
Fo
cu
s M
ole
cu
les
Mo
lecu
les
in N
etw
ork
9
I8
Cel
l C
ycle
, D
NA
Rep
licat
ion
, R
eco
mb
inat
ion
, an
d R
epai
r, D
evel
op
men
tal
Dis
ord
er
52
26
26sP
rote
aso
me,
Act
in,B
AN
F1,C
AP
N1,c
asp
ase,
CD
3,C
TSW
,DD
B1,D
PF
2,E
EF
1G
,ESR
RA
,FE
N1,F
ER
MT
3,F
KB
P2,H
IST
ON
E,H
isto
ne
h3,H
isto
ne
h4,I
NC
EN
P,I
NT
S5,K
AT
5,K
CN
K4,M
AP
4K
2,M
TA
2,M
US81,N
FkB
(c
om
ple
x),
OT
UB
1,P
OL
A2,P
OL
R2G
,PR
DX
5,R
NA
po
lym
eras
e II
,RP
L13A
,SF
1,S
F3B
2,T
AF
6L
,UB
XN
1
10
I8
Lip
id M
etab
olism
, Sm
all M
ole
cule
B
ioch
emis
try,
In
fect
ious
Dis
ease
s 42
22
Akt,
BSC
L2,C
alm
od
ulin
,CD
CA
5,C
HR
M1,C
k2,E
RK
,est
roge
n
rece
pto
r,F
AD
S1,F
AD
S2,F
AU
,FIB
P,F
SH
,GA
NA
B,H
sp90,I
nsu
lin,L
GA
LS12,L
h,M
apk,M
YR
F,P
LA
2,P
LA
2G
16,P
LC
,PL
CB
3,P
PP
2R
5B
,RE
LA
,SC
GB
1A
1,S
LC
22A
8,S
LC
3A
2,S
TA
T5a/
b,S
TIP
1,S
TX
5,S
YT
7,
SY
VN
1,T
ME
M216
11
I8
Lip
id M
etab
olism
, Sm
all M
ole
cule
B
ioch
emis
try,
Cel
lula
r A
ssem
bly
an
d
Org
aniz
atio
n
32
18
AE
S,A
HN
AK
,AR
L2,C
11o
rf68,C
20o
rf194,C
CT
3,C
DC
37,C
PSF
7,D
AG
LA
,DU
S3L
,EIF
1A
D,E
ML
3,G
PR
137,G
PR
174,H
SP
90A
A1,K
CN
K7,K
LF
3,M
AP
3K
1,M
AP
3K
15,M
RP
L49,M
YL
K4,N
UD
T22,N
XF
1,P
DIK
1L
,PSK
H1,R
AB
3IL
1,S
SSC
A1,S
TA
T4,S
UP
T5H
,TR
MT
112,T
TC
9C
,TU
BB
,TU
T1,Y
WH
AQ
,ZB
TB
3
12
I8
Cel
lula
r A
ssem
bly
an
d O
rgan
izat
ion
, C
ell-
To
-Cel
l Sig
nal
ing
and
In
tera
ctio
n, N
ervo
us
Sys
tem
Dev
elo
pm
ent
and
Fun
ctio
n
25
15
14-3
-3,A
lp,A
p1,B
AD
,BR
MS1,C
DC
42E
P2,C
FL
1,C
reb
,ER
K1/
2,F
Act
in,F
ibri
no
gen
,FO
SL
1,I
gg3,I
gG2a,
Igm
,Im
mun
ogl
ob
ulin
,KL
C2,L
DL
,LT
BP
3,M
AR
K2,M
EN
1,P
AC
S1,P
DG
F B
B,P
ka,
Pka
cata
lyti
csu
bun
it,P
P2A
,Rap
1,R
as,R
ASG
RP
2,R
IN1,R
ock
,RP
S6K
A4,R
sk,S
IPA
1,V
EG
FB
13
I8
Cel
lula
r C
om
pro
mis
e, G
astr
oin
test
inal
D
isea
se, H
epat
ic S
yste
m D
isea
se
25
15
AB
HD
2,A
TG
2A
,BR
CA
1,C
11o
rf84,C
11o
rf98,C
DC
42B
PG
,Cyp
2d
1/
Cyp
2d
5,D
NA
JB1,D
naj
b1-
Hsp
70,D
NA
JC4,D
NA
JC16,E
GF
R,E
HD
1,E
sr1-E
stro
gen
-Sp
1,F
AM
153A
/F
AM
153B
,HL
A-
C,H
NR
NP
UL
2,H
SC
B,H
SP
A9,H
SP
B1,li
pid
,MA
CR
OD
1,M
DC
1,N
AA
40,P
GA
5 (
incl
ud
eso
ther
s),R
CO
R2,R
PL
22,S
DH
AF
2,S
P1,S
UM
O2,T
MC
O3,T
ME
M223,t
reti
no
in,T
SG
A10IP
,XR
CC
5
14
I8
Nutr
itio
nal
Dis
ease
, C
ell M
orp
ho
logy
, C
ell-
To
-Cel
l Sig
nal
ing
and
In
tera
ctio
n
21
13
AP
P,A
TL
3,C
15o
rf39,C
AC
NG
2,C
AC
NG
3,C
AC
NG
8,C
NIH
2,D
RA
P1,F
RM
D8,G
OR
AB
,GR
IA1,H
IST
1H
2A
D,H
RA
SL
S5,I
NIP
,MA
D2L
1,N
-ace
tyl-
L-a
spar
tic
acid
,OL
FM
1,O
LF
M3,P
DC
D7,P
PP
1R
32,R
AB
L3,R
EE
P6,R
TN
3,S
AC
3D
1,S
CY
L1,S
LC
22A
6,S
LC
30A
3,S
NX
1,S
NX
14,S
NX
15,S
NX
32,S
P140L
,TC
P11L
1,T
RP
T1,Z
CC
HC
6
15
I8
Can
cer,
Cel
l D
eath
an
d S
urv
ival
, O
rgan
ism
al I
nju
ry a
nd
Ab
no
rmal
itie
s 21
13
AD
IRF
,AP
5B
1,A
SR
GL
1,B
3G
AT
3,B
CL
2,b
eta-
estr
adio
l,CA
MK
2B
,CD
248,F
AD
S3,G
SK
3B
,IF
NB
1,J
UN
B,P
EL
P1,P
HA
CT
R3,P
P1 p
rote
in c
om
ple
xgr
oup
,PP
P1R
11,P
PP
1R
17,P
PP
1R
14B
,PP
P1R
14C
,PP
P1R
14D
,PP
P2C
A,P
pp
2r3
d,P
SM
C3,P
XY
LP
1,P
YG
M,R
EM
1,R
NA
SE
H2C
,SC
GB
2A
1,T
GF
B2,T
KF
C,T
ME
M44,T
ME
M258,V
PS51,W
DR
74,Y
AP
/T
AZ
16
I8
Cel
lula
r F
un
ctio
n a
nd
Mai
nte
nan
ce, O
rgan
D
evel
op
men
t, R
epro
duct
ive
Sys
tem
D
evel
op
men
t an
d F
un
ctio
n
19
12
aden
osi
ne,
AIF
M2,C
AC
NA
1I,
CA
TSP
ER
,CA
TSP
ER
1,C
AT
SP
ER
2,C
AT
SP
ER
3,C
AT
SP
ER
4,C
YB
561
A3,E
FE
MP
2,E
GF
,KC
TD
11,L
SM
14A
,NR
XN
2,P
PA
RD
,PR
PF
8,R
NU
4-1
,RN
U5A
-1,R
OM
1,S
AR
T1,S
LC
29A
2,S
LC
30A
6,S
NR
NP
27,T
ME
D7,T
ME
M17,T
ME
M138,T
ME
M151A
,TP
53,U
BIA
D1,U
BL
5,U
SO
1,v
olt
age-
gate
d c
alci
um
ch
ann
el,Y
IF1A
,ZF
PL
1,Z
NH
IT2
241
Annexes

ID
Inte
rval
To
p D
isease
s an
d F
un
ctio
ns
Sco
re
Fo
cu
s M
ole
cu
les
Mo
lecu
les in
Netw
ork
17
I8
Cell D
eath an
d S
urv
ival, G
astroin
testinal
Disease, O
rganism
al Inju
ry and
A
bn
orm
alities 17
11
AD
GR
A1,A
DG
RG
6,A
kr1
c19,B
4G
AT
1,B
EST
1,C
a2+
,CC
DC
85B
,CP
Q,C
ST
6,F
LR
T1,F
PR
3,G
AL
3ST
3,G
PH
A2,G
PH
B5,G
PR
19,G
PR
21,G
PR
85,G
PR
108,G
PR
146,G
PR
156,H
NF
1A
,NP
FF
R2,N
PS,O
SM
,P
2R
Y10,P
CN
X3,P
TH
1R
,SL
C22A
11,S
LC
22A
12,S
OX
9,T
GF
B1,T
M7SF
2,T
RP
M5,T
SH
R,U
GT
2A
3
18
I8
Organ
Mo
rph
olo
gy, Organ
ismal In
jury an
d
Ab
no
rmalities, R
epro
ductiv
e System
D
evelo
pm
ent an
d F
un
ction
6
5
BA
TF
2,C
CD
C88B
,Ctla2
a/C
tla2b
,CY
P4Z
1,E
gfr-Erb
b2,E
SR
2,G
ranzym
e,IkB
-Nfk
B,IK
K
(com
plex
),IL12 (co
mp
lex),IL
12 (fam
ily),IL22R
1-IL
10R
2,IR
S1/
2,iso
leucin
e,Jnk,M
IP1,m
iR-1
46a-5
p
(and
oth
er miR
NA
s w/
seed G
AG
AA
CU
),N-arach
ido
nylglycin
e,OV
OL
1,P
38 M
AP
K,p
85
(pik
3r),P
I3K
(com
plex),P
kc(s),P
OU
6F
1,R
ap1-gp
91-p
22 p
ho
x-p
40 p
ho
x-p
47 p
ho
x-p
67
ph
ox,S
h2b
3,S
HIS
A2,T
CR
,TIG
D3,T
LR
2/
TL
R4,T
PST
1,T
RA
F1-T
RA
F2-T
RA
F3,V
egf,Vegfr
dim
er,VW
CE
19
I8
Dev
elop
men
tal Diso
rder, H
ereditary
Diso
rder, M
etabo
lic Disease
2
1
PH
LD
A3,U
QC
C3
20
I8
Can
cer, Organ
ismal In
jury an
d
Ab
no
rmalities, R
epro
ductiv
e System
D
isease 2
1
SC
GB
1D
2,S
CG
B2A
2
21
I8
Hered
itary Diso
rder, N
eph
rosis,
Organ
ismal In
jury an
d A
bn
orm
alities 2
1
ME
TT
L12,N
T5D
C2,X
PN
PE
P3
22
I9
Dev
elop
men
tal Diso
rder, H
ereditary
Diso
rder, M
etabo
lic Disease
58
25
26sP
roteaso
me,A
LK
,BIR
C6,B
RE
,caspase,C
EN
PA
,Cg,C
GR
EF
1,C
YP
1B
1,D
NM
T3A
,DP
Y30,E
MIL
IN
1,E
RK
1/
2,F
OSL
2,G
CK
R,G
PN
1,H
AD
HA
,HA
DH
B,H
iston
e h
3,Jn
k,K
HK
,med
iator,M
EM
O1,N
FkB
(com
plex),N
LR
C4,P
kc(s),P
RK
D3,R
ASG
RP
3,R
NA
p
olym
erase II,SP
AST
,SP
DY
A,S
RD
5A
2,S
UP
T7L
,XD
H,Y
WH
AE
23
I9
Aud
itory an
d V
estibular S
ystem
Dev
elop
men
t and
Fun
ction
, Cell D
eath
and
Surv
ival, N
ervo
us S
ystem
Dev
elop
men
t and
Fun
ction
32
16
AP
P,A
SX
L2,A
TR
AID
,CE
BP
Z,C
IAR
T,C
LIP
4,C
RE
B1,C
RIM
1,D
PY
19L
3,F
BX
O6,F
ND
C4,G
IMA
P8,
GP
R85,IG
SF
10,K
CN
C4,M
T-
ND
5,N
AG
A,N
DU
FA
F7,N
MN
AT
2,N
PM
1,O
CIA
D2,P
PM
1G
,PR
KA
CA
,QP
CT
,RA
B10,R
MD
N2,S
LC
4A
1A
P,S
LC
9A
6,S
NX
17,T
ME
M214,T
TC
27,W
AR
S2,Z
DH
HC
23,Z
NF
35,Z
NF
512
24
I9
Cellu
lar Assem
bly an
d O
rganizatio
n,
Can
cer, Cell M
orp
ho
logy
30
15
24R
,25-d
ihyd
roxyv
itamin
D
3,A
BC
A1,A
GP
AT
5,A
NG
PT
4,C
3o
rf52,C
YP
4Z
1,D
TN
B,E
LA
VL
1,E
RB
B2,F
AM
20B
,FA
M98A
,GA
LN
T4,G
AL
NT
14,H
EA
TR
5B
,IFT
172,L
BH
,LC
LA
T1,L
PC
AT
4,M
AP
K3,n
orep
inep
hrin
e,NR
BP
1,N
UD
C,P
DE
7B
,PR
EB
,PR
KC
D,S
EL
EN
OI,S
LC
35F
6,S
TR
N,T
AS1R
1,T
C2N
,TC
F23,V
egf,VH
L,W
DR
43,
YP
EL
5
25
I9
Cell M
orp
ho
logy, C
ellular A
ssemb
ly and
O
rganizatio
n, N
ervo
us S
ystem
Dev
elop
men
t and
Fun
ction
20
11
AC
TB
,AD
GR
A1,A
DG
RF
3,A
GB
L5,C
DC
42E
P3,C
lip1,D
LG
4,D
PY
SL
5,E
HD
3,F
EZ
2,F
OS,G
PR
63,G
PR
137,G
PR
146,G
PR
160,H
NF
4A
,KB
TB
D4,K
IF3C
,MA
PR
E3,M
SR
B2,N
GF
,NU
DT
11,o
rnith
ine
decarb
oxylase,P
CN
X1,P
TE
N,P
tprt,Q
RF
PR
,RB
KS,S
LC
30A
6,S
OR
CS3,S
ST
R4,S
SU
72,T
RM
T61B
,Ub
a52,V
N1R
1
242
Genomic and functional genomic analysis of fatty acid composition in swine
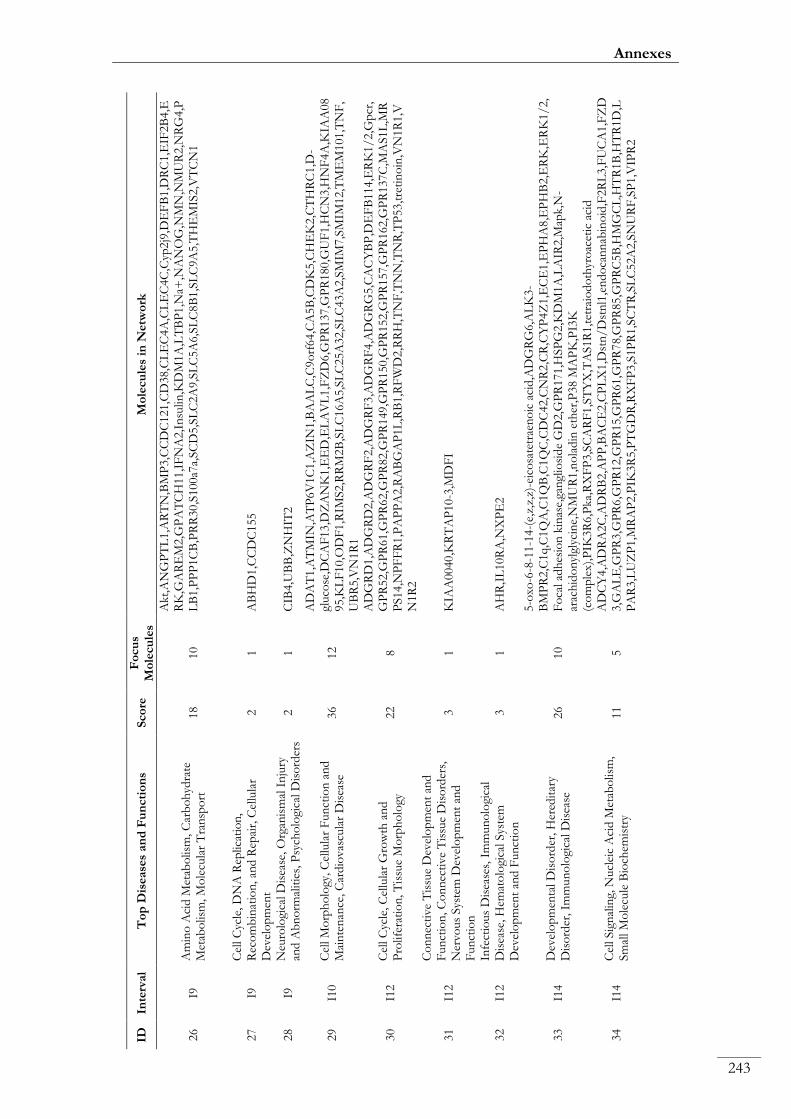
ID
Inte
rval
To
p D
isease
s an
d F
un
cti
on
s S
co
re
Fo
cu
s M
ole
cu
les
Mo
lecu
les
in N
etw
ork
26
I9
Am
ino
Aci
d M
etab
olis
m, C
arb
oh
ydra
te
Met
abo
lism
, M
ole
cula
r T
ran
spo
rt
18
10
Akt,
AN
GP
TL
1,A
RT
N,B
MP
3,C
CD
C121,C
D38,C
LE
C4A
,CL
EC
4C
,Cyp
2j9
,DE
FB
1,D
RC
1,E
IF2B
4,E
RK
,GA
RE
M2,G
PA
TC
H11,I
FN
A2,I
nsu
lin
,KD
M1A
,LT
BP
1,N
a+,N
AN
OG
,NM
N,N
MU
R2,N
RG
4,P
LB
1,P
PP
1C
B,P
RR
30,S
100a7
a,SC
D5,S
LC
2A
9,S
LC
5A
6,S
LC
8B
1,S
LC
9A
5,T
HE
MIS
2,V
TC
N1
27
I9
Cel
l C
ycle
, D
NA
Rep
licat
ion
, R
eco
mb
inat
ion
, an
d R
epai
r, C
ellu
lar
Dev
elo
pm
ent
2
1
AB
HD
1,C
CD
C155
28
I9
Neu
rolo
gica
l D
isea
se, O
rgan
ism
al I
nju
ry
and
Ab
no
rmal
itie
s, P
sych
olo
gica
l D
iso
rder
s 2
1
CIB
4,U
BB
,ZN
HIT
2
29
I10
Cel
l M
orp
ho
logy
, C
ellu
lar
Fun
ctio
n a
nd
M
ain
ten
ance
, C
ard
iovas
cula
r D
isea
se
36
12
AD
AT
1,A
TM
IN,A
TP
6V
1C
1,A
ZIN
1,B
AA
LC
,C9o
rf64,C
A5B
,CD
K5,C
HE
K2,C
TH
RC
1,D
-gl
uco
se,D
CA
F13,D
ZA
NK
1,E
ED
,EL
AV
L1,F
ZD
6,G
PR
137,G
PR
180,G
UF
1,H
CN
3,H
NF
4A
,KIA
A08
95,K
LF
10,O
DF
1,R
IMS2,R
RM
2B
,SL
C16A
5,S
LC
25A
32,S
LC
43A
2,S
MIM
7,S
MIM
12,T
ME
M101,T
NF
,U
BR
5,V
N1R
1
30
I12
Cel
l C
ycle
, C
ellu
lar
Gro
wth
an
d
Pro
lifer
atio
n, T
issu
e M
orp
ho
logy
22
8
AD
GR
D1,A
DG
RD
2,A
DG
RF
2,A
DG
RF
3,A
DG
RF
4,A
DG
RG
5,C
AC
YB
P,D
EF
B114,E
RK
1/
2,G
pcr
,G
PR
52,G
PR
61,G
PR
62,G
PR
82,G
PR
149,G
PR
150,G
PR
152,G
PR
157,G
PR
162,G
PR
137C
,MA
S1L
,MR
PS14,N
PF
FR
1,P
AP
PA
2,R
AB
GA
P1L
,RB
1,R
FW
D2,R
RH
,TN
F,T
NN
,TN
R,T
P53,t
reti
no
in,V
N1R
1,V
N1R
2
31
I12
Co
nn
ecti
ve
Tis
sue
Dev
elo
pm
ent
and
F
un
ctio
n, C
on
nec
tive
Tis
sue
Dis
ord
ers,
N
ervo
us
Sys
tem
Dev
elo
pm
ent
and
F
un
ctio
n
3
1
KIA
A0040,K
RT
AP
10-3
,MD
FI
32
I12
Infe
ctio
us
Dis
ease
s, I
mm
un
olo
gica
l D
isea
se, H
emat
olo
gica
l Sys
tem
D
evel
op
men
t an
d F
un
ctio
n
3
1
AH
R,I
L10R
A,N
XP
E2
33
I14
Dev
elo
pm
enta
l D
iso
rder
, H
ered
itar
y D
iso
rder
, Im
mu
no
logi
cal D
isea
se
26
10
5-o
xo-6
-8-1
1-1
4-(
e,z,
z,z)
-eic
osa
tetr
aen
oic
aci
d,A
DG
RG
6,A
LK
3-
BM
PR
2,C
1q,C
1Q
A,C
1Q
B,C
1Q
C,C
DC
42,C
NR
2,C
R,C
YP
4Z
1,E
CE
1,E
PH
A8,E
PH
B2,E
RK
,ER
K1/
2,
Fo
cal ad
hes
ion
kin
ase,
gan
glio
sid
e G
D2,G
PR
171,H
SP
G2,K
DM
1A
,LA
IR2,M
apk,N
-ar
ach
ido
nyl
glyc
ine,
NM
UR
1,n
ola
din
eth
er,P
38 M
AP
K,P
I3K
(co
mp
lex),
PIK
3R
6,P
ka,
RX
FP
3,S
CA
RF
1,S
TY
X,T
AS1R
1,t
etra
iod
oth
yro
acet
ic a
cid
34
I14
Cel
l Sig
nal
ing,
Nucl
eic
Aci
d M
etab
olism
, Sm
all M
ole
cule
Bio
chem
istr
y 11
5
AD
CY
4,A
DR
A2C
,AD
RB
2,A
PP
,BA
CE
2,C
PL
X1,D
stn
/D
stn
l1,e
nd
oca
nn
abin
oid
,F2R
L3,F
UC
A1,F
ZD
3,G
AL
E,G
PR
3,G
PR
6,G
PR
12,G
PR
15,G
PR
61,G
PR
78,G
PR
85,G
PR
C5B
,HM
GC
L,H
TR
1B
,HT
R1D
,LP
AR
3,L
UZ
P1,M
RA
P2,P
IK3R
5,P
TG
DR
,RX
FP
3,S
1P
R1,S
CT
R,S
LC
52A
2,S
NU
RF
,SP
1,V
IPR
2
243
Annexes
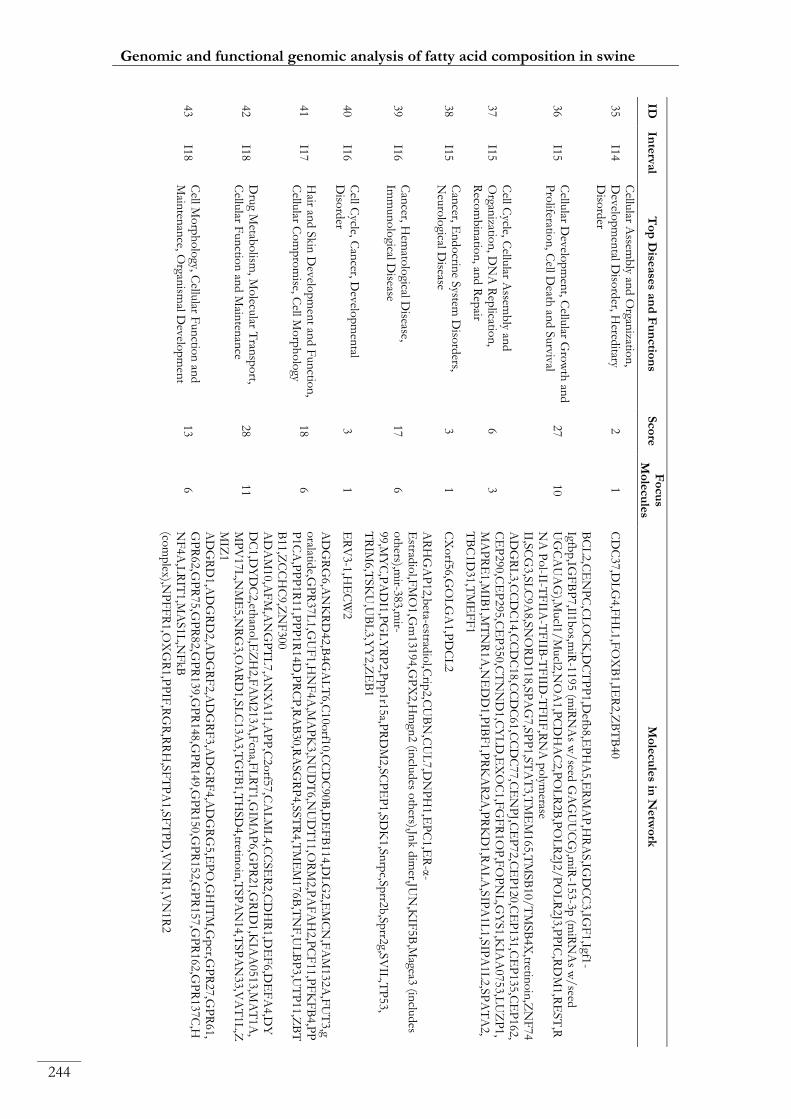
ID
Inte
rval
To
p D
isease
s an
d F
un
ctio
ns
Sco
re
Fo
cu
s M
ole
cu
les
Mo
lecu
les in
Netw
ork
35
I14
Cellu
lar Assem
bly an
d O
rganizatio
n,
Dev
elop
men
tal Diso
rder, H
ereditary
Diso
rder
2
1
CD
C37,D
LG
4,F
HL
1,F
OX
B1,IE
R2,Z
BT
B40
36
I15
Cellu
lar Dev
elop
men
t, Cellu
lar Gro
wth
and
P
roliferatio
n, C
ell Death
and
Surv
ival
27
10
BC
L2,C
EN
PC
,CL
OC
K,D
CT
PP
1,D
efb8,E
PH
A5,E
RM
AP
,HR
AS,IG
DC
C3,IG
F1,Igf1
-Igfb
p,IG
FB
P7,Il1
bo
s,miR
-1195 (m
iRN
As w
/seed
GA
GU
UC
G),m
iR-1
53-3
p (m
iRN
As w
/seed
U
GC
AU
AG
),Mucl1
/M
ucl2
,NO
A1,P
CD
HA
C2,P
OL
R2B
,PO
LR
2J2
/P
OL
R2J3
,PP
IC,R
DM
1,R
EST
,RN
A P
ol-II-T
FIIA
-TF
IIB-T
FIID
-TF
IIF,R
NA
po
lymerase
II,SC
G3,S
LC
9A
8,S
NO
RD
118,S
PA
G7,S
PP
1,S
TA
T3,T
ME
M165,T
MSB
10/
TM
SB
4X
,tretino
in,Z
NF
74
37
I15
Cell C
ycle, Cellu
lar Assem
bly an
d
Organ
ization
, DN
A R
eplicatio
n,
Reco
mb
inatio
n, an
d R
epair
6
3
AD
GR
L3,C
CD
C14,C
CD
C18,C
CD
C61,C
CD
C77,C
EN
PJ,C
EP
72,C
EP
120,C
EP
131,C
EP
135,C
EP
162,
CE
P290,C
EP
295,C
EP
350,C
TN
ND
1,C
YL
D,E
XO
C1,F
GF
R1O
P,F
OP
NL
,GY
S1,K
IAA
0753,L
UZ
P1,
MA
PR
E1,M
IB1,M
TN
R1A
,NE
DD
1,P
IBF
1,P
RK
AR
2A
,PR
KD
1,R
AL
A,S
IPA
1L
1,S
IPA
1L
2,S
PA
TA
2,
TB
C1D
31,T
ME
FF
1
38
I15
Can
cer, En
do
crine S
ystem D
isord
ers, N
euro
logical D
isease 3
1
CX
orf5
6,G
OL
GA
1,P
DC
L2
39
I16
Can
cer, Hem
atolo
gical Disease,
Imm
un
olo
gical Disease
17
6
AR
HG
AP
12,b
eta-estradio
l,Crip
2,C
UB
N,C
UL
7,D
NP
H1,E
PC
1,E
R-α
-E
stradio
l,FM
O1,G
m13194,G
PX
2,H
mgn
2 (in
clud
es oth
ers),Jnk d
imer,JU
N,K
IF5B
,Magea3
(inclu
des
oth
ers),mir-3
83,m
ir-99,M
YC
,PA
DI1
,PG
LY
RP
2,P
pp
1r1
5a,P
RD
M2,S
CP
EP
1,S
DK
1,S
nrp
c,Sp
rr2b
,Sp
rr2g,S
VIL
,TP
53,
TR
IM6,T
SK
U,U
BL
3,Y
Y2,Z
EB
1
40
I16
Cell C
ycle, Can
cer, Dev
elop
men
tal D
isord
er 3
1
ER
V3-1
,HE
CW
2
41
I17
Hair an
d S
kin
Dev
elop
men
t and
Fun
ction
, C
ellular C
om
pro
mise, C
ell Mo
rph
olo
gy 18
6
AD
GR
G6,A
NK
RD
42,B
4G
AL
T6,C
10o
rf10,C
CD
C90B
,DE
FB
114,D
LG
2,E
MC
N,F
AM
132A
,FU
T3,g
oralatid
e,GP
R37L
1,G
UF
1,H
NF
4A
,MA
PK
3,N
UD
T6,N
UD
T11,O
RM
2,P
AF
AH
2,P
CF
11,P
FK
FB
4,P
PP
1C
A,P
PP
1R
11,P
PP
1R
14D
,PR
CP
,RA
B30,R
ASG
RP
4,S
ST
R4,T
ME
M176B
,TN
F,U
LB
P3,U
TP
11,Z
BT
B11,Z
CC
HC
9,Z
NF
300
42
I18
Dru
g Metab
olism
, Mo
lecular T
ransp
ort,
Cellu
lar Fun
ction
and
Main
tenan
ce 28
11
AD
AM
10,A
FM
,AN
GP
TL
7,A
NX
A11,A
PP
,C2o
rf57,C
AL
ML
4,C
CSE
R2,C
DH
R1,D
EF
6,D
EF
A4,D
YD
C1,D
YD
C2,eth
ano
l,EZ
H2,F
AM
213A
,Fcn
a,FL
RT
1,G
IMA
P6,G
PR
21,G
RID
1,K
IAA
0513,M
AT
1A
,M
PV
17L
,NM
E5,N
RG
3,O
AR
D1,S
LC
13A
3,T
GF
B1,T
HSD
4,tretin
oin
,TSP
AN
14,T
SP
AN
33,V
AT
1L
,ZM
IZ1
43
I18
Cell M
orp
ho
logy, C
ellular F
un
ction
and
M
ainten
ance, O
rganism
al Dev
elop
men
t 13
6
AD
GR
D1,A
DG
RD
2,A
DG
RF
2,A
DG
RF
3,A
DG
RF
4,A
DG
RG
5,E
PO
,GH
ITM
,Gp
cr,GP
R27,G
PR
61,
GP
R62,G
PR
75,G
PR
82,G
PR
139,G
PR
148,G
PR
149,G
PR
150,G
PR
152,G
PR
157,G
PR
162,G
PR
137C
,HN
F4A
,LR
IT1,M
AS1L
,NF
kB
(co
mp
lex),N
PF
FR
1,O
XG
R1,P
PIF
,RG
R,R
RH
,SF
TP
A1,S
FT
PD
,VN
1R
1,V
N1R
2
244
Genomic and functional genomic analysis of fatty acid composition in swine
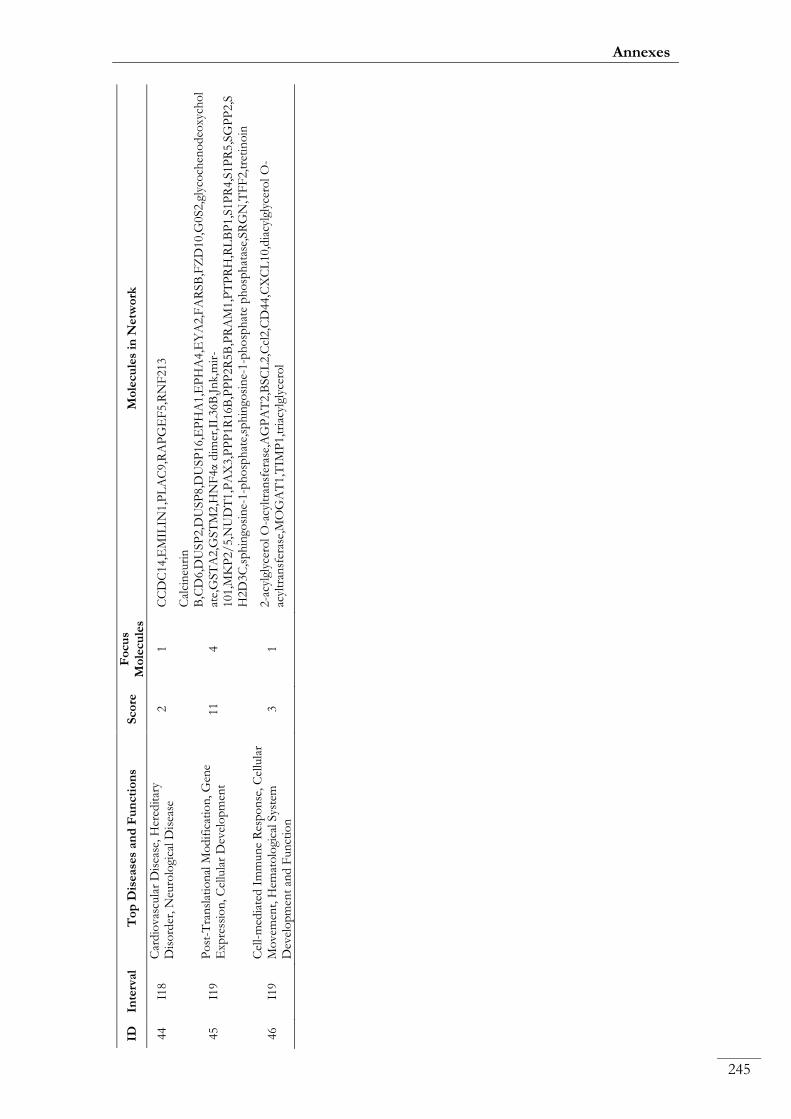
ID
Inte
rval
To
p D
isease
s an
d F
un
cti
on
s S
co
re
Fo
cu
s M
ole
cu
les
Mo
lecu
les
in N
etw
ork
44
I18
Car
dio
vas
cula
r D
isea
se, H
ered
itar
y D
iso
rder
, N
euro
logi
cal D
isea
se
2
1
CC
DC
14,E
MIL
IN1,P
LA
C9,R
AP
GE
F5,R
NF
213
45
I19
Po
st-T
ran
slat
ion
al M
od
ific
atio
n, G
ene
Exp
ress
ion
, C
ellu
lar
Dev
elo
pm
ent
11
4
Cal
cin
euri
n
B,C
D6,D
USP
2,D
USP
8,D
USP
16,E
PH
A1,E
PH
A4,E
YA
2,F
AR
SB
,FZ
D10,G
0S2,g
lyco
chen
od
eoxy
cho
lat
e,G
ST
A2,G
ST
M2,H
NF
4α d
imer
,IL
36B
,Jn
k,m
ir-
101,M
KP
2/
5,N
UD
T1,P
AX
3,P
PP
1R
16B
,PP
P2R
5B
,PR
AM
1,P
TP
RH
,RL
BP
1,S
1P
R4,S
1P
R5,S
GP
P2,S
H2D
3C
,sp
hin
gosi
ne-
1-p
ho
sph
ate,
sph
ingo
sin
e-1-p
ho
sph
ate
ph
osp
hat
ase,
SR
GN
,TF
F2,t
reti
no
in
46
I19
Cel
l-m
edia
ted
Im
mun
e R
esp
on
se, C
ellu
lar
Mo
vem
ent,
Hem
ato
logi
cal Sys
tem
D
evel
op
men
t an
d F
un
ctio
n
3
1
2-a
cylg
lyce
rol O
-acy
ltra
nsf
eras
e,A
GP
AT
2,B
SC
L2,C
cl2,C
D44,C
XC
L10,d
iacy
lgly
cero
l O
-ac
yltr
ansf
eras
e,M
OG
AT
1,T
IMP
1,t
riac
ylgl
ycer
ol
245
Annexes

Genomic and functional genomic analysis of fatty acid composition in swine
246
Paper III. Table S9: Transcription factor binding sites for the PPARG gene.
ID Target Name Interval Cis/Trans-eQTL Associated Gene
1 ABHD1 I9 trans FABP4 2 ADIPOQ
3 AGPAT2
4 AHNAK I8 trans FABP4 5 ALK I9 trans FABP4 6 ATL3 I8 trans FABP4 7 ATP6V1C1 I10 trans FABP4 8 AZIN1 I10 trans FABP4 9 B3GNT2 I3 trans ACSM5 10 BAD I8 trans FABP4 11 BATF2 I8 trans FABP4 12 BEST1 I8 trans FABP4 13 C1QA I14 trans FADS2 14 C2orf16 I9 trans FABP4 15 C2orf71 I9 trans FABP4 16 CAPN14 I9 trans FABP4 17 CD248 I8 trans FABP4 18 CD36
19 CDC42BPG I8 trans FABP4 20 CDC42EP2 I8 trans FABP4 21 CDC42EP3 I9 trans FABP4 22 CDH6 I6 trans ACSM5 23 CDHR1 I18 trans SLC27A4 24 CENPA I9 trans FABP4 25 CEP135 I15 trans FADS2 26 CHRM1 I8 trans FABP4 27 CIB4 I9 trans FABP4 28 CLOCK I15 trans FADS2 29 CPSF7 I8 trans FABP4 30 CPT1A
31 CRIM1 I9 trans FABP4 32 CST6 I8 trans FABP4 33 CTHRC1 I10 trans FABP4 34 CTXN3 I1 trans ACSM5 35 CUBN I16 trans FADS2 36 CYP2U1
37 DAGLA I8 trans FABP4 38 DDB1 I8 trans FABP4 39 DGAT1
40 DGAT2

Annexes
247
ID Target Name Interval Cis/Trans-eQTL Associated Gene
41 DLG2 I17 trans SLC27A4
42 DNMT3A I9 trans FABP4
43 ECE1 I14 trans FADS2
44 EHBP1 I3 trans ACSM5
45 EHD3 I9 trans FABP4
46 ELOVL5
47 EMILIN1 I9 trans FABP4
48 EML3 I8 trans FABP4
49 EPAS1 I4 trans ACSM5
50 EPC1 I16 trans FADS2
51 EPHA8 I14 trans FADS2
52 EPT1 I9 trans FABP4
53 ESRRA I8 trans FABP4
54 FABP4
55 FADS1 I8 trans FABP4
56 FADS2 I8.I13 trans/cis FABP4/FADS2
57 FADS3 I8 trans FABP4
58 FAM179A I9 trans FABP4
59 FKBP2 I8 trans FABP4
60 FLRT1 I8 trans FABP4
61 FNDC4 I9 trans FABP4
62 FOSL1 I8 trans FABP4
63 FOSL2 I9 trans FABP4
64 FRMD8 I8 trans FABP4
65 GAL3ST3 I8 trans FABP4
66 GALNT14 I9 trans FABP4
67 GCKR I9 trans FABP4
68 GGA2 I5 trans ACSM5
69 GPR52 I12 trans FABP4
70 GRID1 I18 trans SLC27A4
71 HADHA I9 trans FABP4
72 HSPG2 I14 trans FADS2
73 IGFBP7 I15 trans FADS2
74 KCNH8 I7 trans ELOVL6
75 KHK I9 trans FABP4
76 KIAA0040 I12 trans FABP4
77 KIF5B I16 trans FADS2
78 KLC2 I8 trans FABP4
79 KLF10 I10 trans FABP4
80 LBH I9 trans FABP4
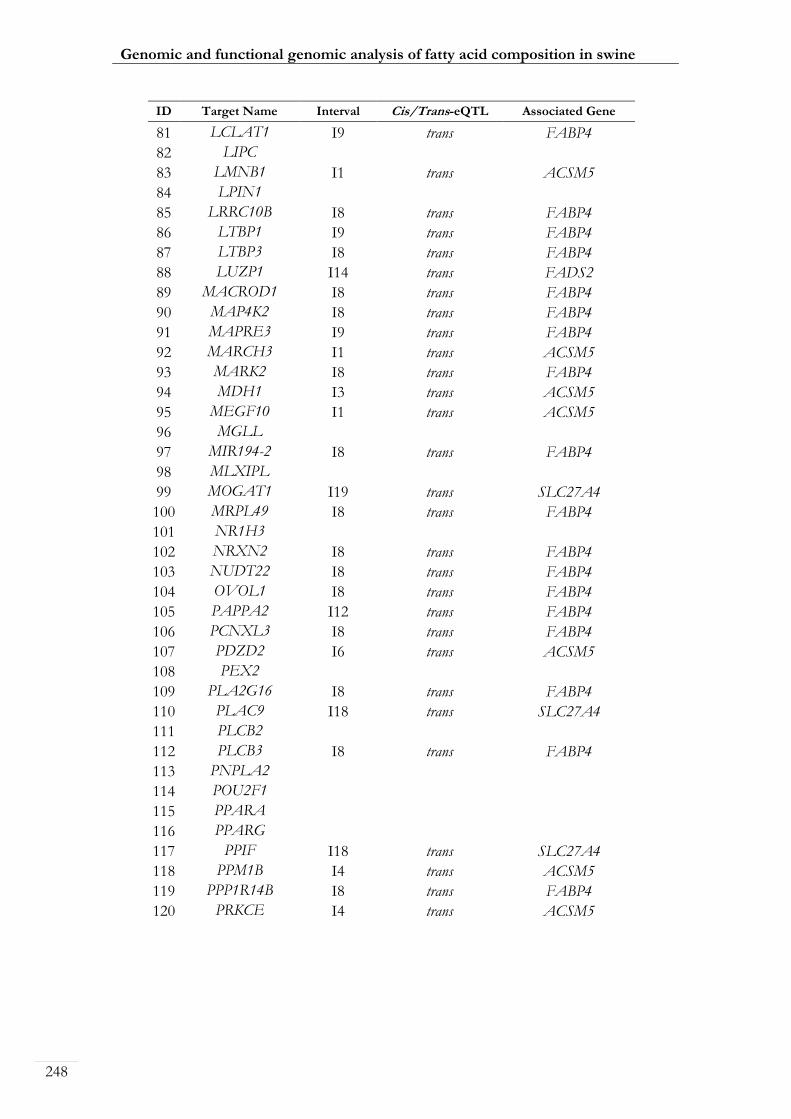
Genomic and functional genomic analysis of fatty acid composition in swine
248
ID Target Name Interval Cis/Trans-eQTL Associated Gene
81 LCLAT1 I9 trans FABP4
82 LIPC
83 LMNB1 I1 trans ACSM5
84 LPIN1
85 LRRC10B I8 trans FABP4
86 LTBP1 I9 trans FABP4
87 LTBP3 I8 trans FABP4
88 LUZP1 I14 trans FADS2
89 MACROD1 I8 trans FABP4
90 MAP4K2 I8 trans FABP4
91 MAPRE3 I9 trans FABP4
92 MARCH3 I1 trans ACSM5
93 MARK2 I8 trans FABP4
94 MDH1 I3 trans ACSM5
95 MEGF10 I1 trans ACSM5
96 MGLL
97 MIR194-2 I8 trans FABP4
98 MLXIPL
99 MOGAT1 I19 trans SLC27A4
100 MRPL49 I8 trans FABP4
101 NR1H3
102 NRXN2 I8 trans FABP4
103 NUDT22 I8 trans FABP4
104 OVOL1 I8 trans FABP4
105 PAPPA2 I12 trans FABP4
106 PCNXL3 I8 trans FABP4
107 PDZD2 I6 trans ACSM5
108 PEX2
109 PLA2G16 I8 trans FABP4
110 PLAC9 I18 trans SLC27A4
111 PLCB2
112 PLCB3 I8 trans FABP4
113 PNPLA2
114 POU2F1
115 PPARA
116 PPARG
117 PPIF I18 trans SLC27A4
118 PPM1B I4 trans ACSM5
119 PPP1R14B I8 trans FABP4
120 PRKCE I4 trans ACSM5
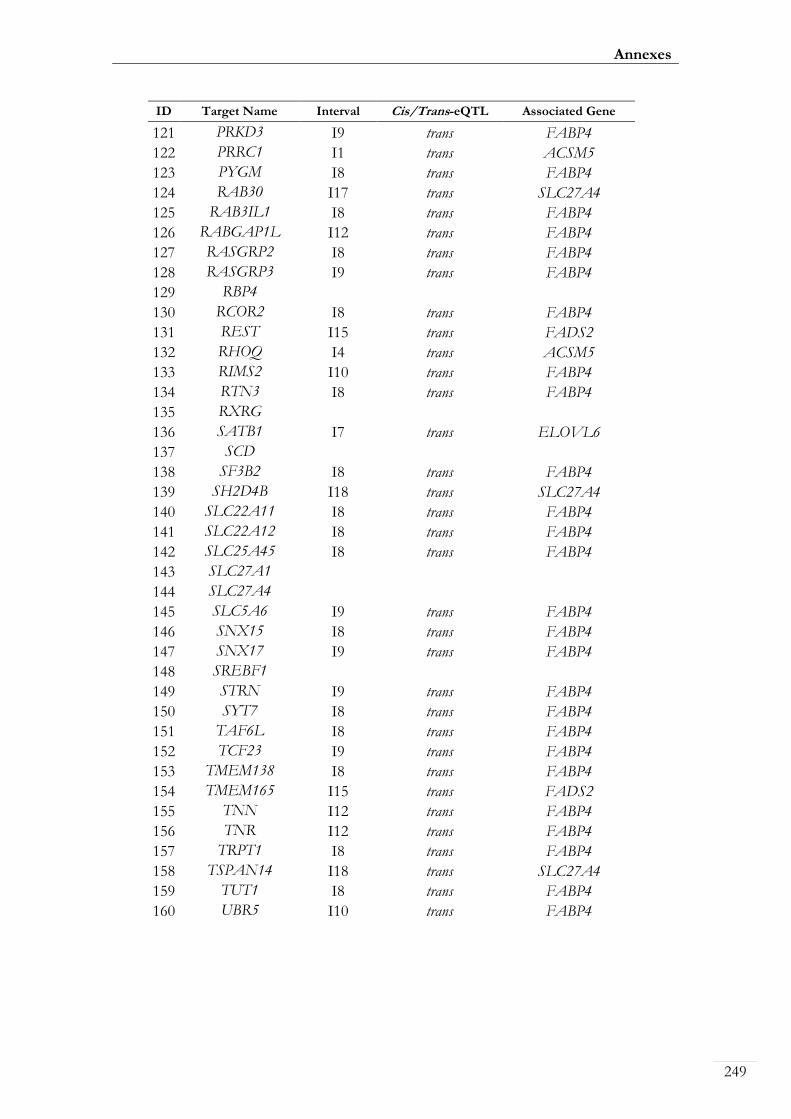
Annexes
249
ID Target Name Interval Cis/Trans-eQTL Associated Gene
121 PRKD3 I9 trans FABP4
122 PRRC1 I1 trans ACSM5
123 PYGM I8 trans FABP4
124 RAB30 I17 trans SLC27A4
125 RAB3IL1 I8 trans FABP4
126 RABGAP1L I12 trans FABP4
127 RASGRP2 I8 trans FABP4
128 RASGRP3 I9 trans FABP4
129 RBP4
130 RCOR2 I8 trans FABP4
131 REST I15 trans FADS2
132 RHOQ I4 trans ACSM5
133 RIMS2 I10 trans FABP4
134 RTN3 I8 trans FABP4
135 RXRG
136 SATB1 I7 trans ELOVL6
137 SCD
138 SF3B2 I8 trans FABP4
139 SH2D4B I18 trans SLC27A4
140 SLC22A11 I8 trans FABP4
141 SLC22A12 I8 trans FABP4
142 SLC25A45 I8 trans FABP4
143 SLC27A1
144 SLC27A4
145 SLC5A6 I9 trans FABP4
146 SNX15 I8 trans FABP4
147 SNX17 I9 trans FABP4
148 SREBF1
149 STRN I9 trans FABP4
150 SYT7 I8 trans FABP4
151 TAF6L I8 trans FABP4
152 TCF23 I9 trans FABP4
153 TMEM138 I8 trans FABP4
154 TMEM165 I15 trans FADS2
155 TNN I12 trans FABP4
156 TNR I12 trans FABP4
157 TRPT1 I8 trans FABP4
158 TSPAN14 I18 trans SLC27A4
159 TUT1 I8 trans FABP4
160 UBR5 I10 trans FABP4

Genomic and functional genomic analysis of fatty acid composition in swine
250
ID Target Name Interval Cis/Trans-eQTL Associated Gene
161 VIT I9 trans FABP4
162 VWCE I8 trans FABP4
163 XDH I9 trans FABP4
164 ZBTB40 I14 trans FADS2
165 ZEB1 I16 trans FADS2
166 ZMIZ1 I18 trans SLC27A4
167 ZNF438 I16 trans FADS2

Annexes
251
Paper III. Table S10: Correlations of PPARG mRNA expression and analyze-related
genes.
Gene Correlation p-value
ACSM5 0.08 3.86E-01
ADIPOQ 0.66 1.78E-15
AGPAT2 0.54 6.98E-10
ANK2 0.27 3.93E-03
ARNT 0.30 1.42E-03
CD36 0.70 2.22E-16
CPT1A 0.03 7.33E-01
CROT 0.50 1.71E-08
CYP2U1 0.54 6.01E-10
DGAT1 0.62 2.53E-13
DGAT2 0.61 1.09E-12
EGF 0.08 4.00E-01
ELOVL5 0.75 2.22E-16
ELOVL6 0.68 2.22E-16
ESRRA 0.43 2.41E-06
FABP4 0.51 9.27E-09
FABP5 0.40 1.27E-05
FADS1 0.12 1.95E-01
FADS2 0.18 5.92E-02
FADS3 0.17 7.71E-02
LIPC 0.27 3.55E-03
LPIN1 0.69 2.22E-16
MGLL 0.43 1.90E-06
MLXIPL 0.61 5.55E-13
NFKB1 0.58 2.49E-11
NR1H3 0.56 1.56E-10
PEX2 0.60 1.69E-12
PLA2G12A 0.61 9.13E-13
PLCB2 0.13 1.71E-01
PLPP1 0.27 4.16E-03
PNPLA2 0.55 3.09E-10
POU2F1 0.25 7.75E-03
PPARA 0.63 1.01E-13
PPARD 0.48 8.61E-08
RBP4 0.36 1.11E-04
RXRG 0.41 7.83E-06
SCAP 0.45 4.59E-07
SCD 0.59 1.01E-11
SLC27A1 0.23 1.23E-02
SLC27A4 0.23 1.60E-02
SREBF1 0.55 2.63E-10
USF1 0.33 4.15E-04

Genomic and functional genomic analysis of fatty acid composition in swine
252
Paper III. Figure S1: Associations of SNPs from SSC8 and ELOVL6 polymorphisms for
ELOVL6 gene-expression in backfat. The X-axis represents positions of SSC8 in Mb
relative to Sscrofa10.2 assembly of the pig genome and the Y-axis shows the –log10 (p-
value). Horizontal dashed lines indicate the chromosome significance level.

Annexes
253
Paper III. Figure S2: Clustered heat map to visualize correlations among gene-expression
levels (NQ) of the 43 genes and fatty content in adipose tissue. Color legend was adjusted
to minimal and maximal values to differentiate the differences.


G Acknowledgements
Chapter 8


Acknowledgements
257
Suele decirse que ningún éxito sabe mejor que el que viene de nuestros esfuerzos y
determinación. Esta tesis doctoral, si bien ha requerido de esfuerzo y dedicación, no
hubiese sido posible su finalización sin la cooperación desinteresada de todas y cada una de
las personas que me han acompañado a lo largo de estos años y a las que me gustaría
mostrar mi más profundo y sincero agradecimiento.
En primer lugar agradecer a la Universitat Autònoma de Barcelona (UAB) y en especial al
personal investigador del Centre de Recerca en Agrigènomica (CRAG), por abrirme las puertas y
permitir iniciar mi formación investigadora.
Debo a su vez un especial agradecimiento a mi Director de Tesis, el Dr. Josep M Folch
por su generosidad al brindarme la oportunidad de recurrir a su capacidad y experiencia
científica en un marco de confianza, afecto y amistad, fundamentales para la concreción de
este proyecto.
Del mismo modo merece un agradecimiento especial mi Directora de Tesis, la Dra. Maria
Ballester quien me guió por la ruta de la genética molecular y el mejoramiento genético,
quien siempre estuvo allí a la hora de cualquier duda y asesoramiento en aspectos
moleculares. Por su generosidad en la explicación y valiosos comentarios realizados en todo
el proceso de elaboración del trabajo y sus atinadas correcciones. Sin la cual la elaboración
de este proyecto no hubiera sido viable.
Quiero agradecer a mis compañeros de proyecto. Tanto los que marcharon y marcaron el
camino a seguir, como los que continúan. Dr. Yuliaxis Ramayo, por su presencia
incondicional, quien nos enseñó que no es incompatible el éxito profesional con la
honestidad, pocas personas conozco con tanto amor a su profesión como la que él irradia.
Dr. Jordi Corominas, por sus apreciados y relevantes comentarios, y por su enorme
sensatez. Dra. Anna Puig, ejemplo de entrega y sacrificio, cada día compartido a su lado
era un aprendizaje continuo en un entorno de diversión, le debo mucho. Daniel Crespo,
por su predisposición y generosidad. Lourdes Criado, por su tiempo. Y a aquellos que
aunque su paso fuese más o menos breve, dejaron gratos recuerdos: Jorge Petroli, Ediane
Paludo, Natalia Blay, Eduardo Sambache, Odei Barreñada, Iván Martos, Wiktoria
Torbé y Roi Rodríguez.
A los investigadores que forman parte de la Unidad de Genómica animal del CRAG, Dr. Alex
Clop por los constantes ánimos, Dr. Armand Sánchez por su capacidad de liderazgo, Dr.
Marcel Amills por las tan amenas conversaciones mantenidas, Dr. Miguel Pérez-Enciso
Genomic and functional genomic analysis of fatty acid composition in swine
258
por compartir afición más allá de la científica, y Dr. Sebastián Ramos por sus constantes
y divertidas visitas al despacho. A todos vosotros gracias por compartir la vocación de la
docencia y sobre todo de la investigación, tan poco valorada a veces.
A todos y cada uno de los compañeros de trabajo con los que he compartido vivencias en
el CRAG durante estos años. Al Dr. Rayner González, por haber crecido
profesionalmente a mi lado y por todas las reflexiones compartidas. A Marta Gòdia,
porque cualquier línea está de más si se trata de agradecer todo el apoyo y cariño recibido.
A la Dra. Antonia Noce, por su carisma especial y sonrisa contagiosa. A la Dra. Erica
Bianco, por su disposición de brindar ayuda espontáneamente. A la Dra. Sarai Córdoba,
por su constante espíritu servicial. A la Dra. Arianna Manunza, por su responsabilidad. A
la Dra. Verónica Martínez, por su versatilidad. Al Dr. Oriol Tiomoneda, por los
momentos compartidos. A Paulina García, por enseñarnos que en viajar reside la
auténtica riqueza. A la Dra. Fabiana Quoos, por su pasión y alegría. A Julieta Nafissi,
por contagiar su optimismo. A Tainã Cardoso, por su simpatía. A Jordi Leno, por
contribuir en la “cultureta general” que tango nos gusta. A Joan Jené, por su discreción y
sencillez. A Emilio Mármol, por liderar las riendas burocráticas del centro. A la Dra. Sara
Guirao, por su entusiasmo en el trabajo. A la Dra. Natalia Forneris, por enseñarnos las
costumbres argentinas. A Lino César, por enseñarnos que con un poco de tereré todo es
más sencillo. A Betlem Cabrera, por su permanente disposición y desinteresada ayuda. A
la Dra. Maria Corujo y Sara Martínez, por nuestras charlas científicas y no tan científicas.
A los compañeros con los que he compartido despacho, Dra. Cèlia Guiu, Dra. María
Urrutia, Dr. Pablo Ríos, Yu Zhang, Elena Navas, Pol Rey, por todos los momentos
vividos.
Así como a los compañeros de la Facultat de Veterinària de la UAB. Al Dr. Joaquim
Casellas, por compartir su visión de la ciencia. A la Dra. Olga Francino, por su
profesionalidad. A la Dr. Natàlia Sastre, por su vitalidad. Al Dr. David Gallardo, por
aportarnos su constante visión comercial. A Anna Cuscó, por hacer que los seguimientos
valgan la pena. A Sara d’Andreano, por los ánimos aportados.
A las Dra. Anna Castelló y Dra. Anna Mercadé por siempre haber sido un ejemplo a la
ética, profesionalismo y por su continuo asesoramiento.
A Julia Lacuesta y Tania Guil por vuestra implicación y complicidad.
Todos ellos han conseguido crear un ambiente de trabajo excepcional.
Acknowledgements
259
Thanks to all the people of the Génétique Animale et Biologie Intégrative department (GABI) at
Institut National de la Recherche Agronomique (INRA), who hosted me during my stay in
France. In particular I thank to Dr. Andrea Rau for giving me the opportunity to work
with her. I am grateful for her patience, support and helpful suggestions. Thanks to Dr.
Dominique Rocha for his enthusiastic support. Thanks to Clémentine Escouflaire, Dr.
David Pérez, Dr. Hector Argüello, Dr. Marco Moroldo, Maurice Konkobo, Michiel
Van Niekerk, Dr. Núria Mach, Rabia Letaief, Dr. Rebeca Martin, Dr. Parsaoran
Silalahi, Dr. Yoel Rodríguez, and the rest of the group for letting me feel at home during
my stay. I also would like to thank the Thaon family for their hospitality and friendship.
Agradecimiento especial merece el Dr. Jordi Estellé, por el aprendizaje y el crecimiento
profesional y personal que he tenido la oportunidad de desarrollar a su lado, y por toda la
confianza depositada.
A todo el grupo de Mejora Genética Animal del Instituto Nacional de Investigación y Tecnología
Agraria y Alimentaria (INIA) de Madrid con el que he tenido la oportunidad de colaborar
durante estos años. Dra. Ana I Fernández, Dr. Luis Silió, Dra. Carmen Rodríguez,
Dra. Cristina Óvilo, Dra. Estefania Alves, Dra. María Muñoz, Dra. Almudena
Fernández, Ángel Martínez y Rita Benítez.
A todos los profesores de la Universidad de Extremadura (UNEX), de los cuales he aprendido
mi profesión y a los que les debo bastante de mi recorrido académico y profesional.
Merecen un reconocimiento especial la Dra. Araceli Rabasco, la Dra. Margarita
Martínez y la Dra. Esther Sansinforiano, quienes despertaron mi interés hacia la
genética.
A todos los profesores que he tenido a lo largo de mi vida académica, por su dedicación,
entrega y transmisión de conocimientos.
A mis compañeros de Máster, de los cuales me llevo gratas experiencias, en especial a
vosotros Marcia Ferraz, la Dra. Marina Martínez y Ximena Quintero.
A mi familia en Barcelona, quienes han compartido conmigo los “ires y venires” en el
plano personal durante estos años en la ciudad Condal. Por los buenos momentos vividos
en Aribau: Dr. Javier Arranz, Dr. Luis Manuel Molinos y Marta Fernández. Y las risas
de Balmes: Dra. Laura Pérez, Juan Azcárate, Dr. Sebastián Agramunt, Anna Jané,
Laia Quintá, Selma Casals, Pablo Mediavilla, Irean Navas y Alba Soler. Por nuestras

Genomic and functional genomic analysis of fatty acid composition in swine
260
peculiares jornadas gastronómicas: Dr. Álvaro Hernáez, Laura Mariño, Dr. Pablo
Pérez, Paula Santa Barbara y Ricardo Moure. Sin olvidar también los días de vermut
que tantos momentos de felicidad nos han aportado: Albert Viel, Ananda Marina, Biotza
del Campo, Cristian Casorrán, Leonor Ayala, Marta Valle, Sara Sarroca y Dr. Xavier
Roa.
Tampoco puedo olvidarme de esos amigos con los que tanto he compartido y tantos años
han estado apoyando cada una de mis decisiones. Los amigos: una familia cuyos individuos
se eligen a voluntad. Los que aprendimos a andar juntos: Javier García, Jose Antonio
Parra y Luis Gómez. Los que me enseñasteis que cualquier persona que te motiva a ser
mejor, es alguien a quien merece la pena mantener cerca: Adrián de Dios, Álvaro del
Castillo, Álvaro García, Ignacio Benito, Jaime de la Cuesta, Jose M Benito, Julio
Pérez-Tabernero, Marcos Areces y Michel Rodilla. A los compañeros de carrera que
continúan demostrando que son amigos para siempre: Álvaro García, Beatriz Bigeriego,
Francisco Fernández, Javier García, José Vaquero, Lope Sánchez, Manuel Romero,
María Suárez y Tamara Matos.
Al Club Ciclista Gràcia (CCG) por enseñarme que sólo aquellos que arriesgan con ir más
lejos pueden descubrir lo lejos que son capaces de llegar. Reconocimiento especial merecen
la familia Domènech, Eloi Cuevas, Joan Coromina, LLuìs Martí, Miguel Chiva y
Pedro Toledo.
A mis padres, Manuel y Asunción, porque todo lo que soy se lo debo a ellos. Gracias por
vuestras enseñanzas, por ser un ejemplo, por creer en mí, por apoyarme, por estar siempre
a mí lado, por comprenderme, y sobretodo, gracias por brindarme todo vuestro amor y por
otorgarme mi educación, la mejor herencia que todo hijo pueda recibir. A mi hermana,
Cristina, por ser un ejemplo de valentía, capacidad y superación; el espejo donde mirarme,
el ejemplo a seguir. ¡Os quiero!
A las personas que, aunque no aparecen aquí con nombres y apellidos, han estado
presentes durante el desarrollo de este trabajo y han hecho posible que hoy vea la luz.
A todos vosotros os podría seguir dedicando bonitas palabras que al leerlas os llenasen de
emoción. Pero considero que lo más gratificante es dedicar tiempo, eso sí que es un bonito
regalo. Y con todos vosotros he compartido mucho de este último.
A todos mi eterno agradecimiento.