ANÁLISIS COMPARATIVO ENTRE JARABE DE AGAVE AZUL ...
12
233 RESUMEN El jarabe de agave azul (Agave tequilana Weber var. azul) es la sustancia dulce natural producida por hidrólisis de los fruc- tanos almacenados en la planta de maguey. Este endulzan- te se ha popularizado por su capacidad prebiótica e índice glucémico bajo respecto a otros jarabes y mieles naturales. Las marcas comerciales, distribuidores, producción y comer- cialización de estos jarabes han incrementado, por ello es conveniente conocer sus características físicas y químicas y contrastarlas con las de otros productos del mismo tipo. En el presente estudio se determinaron el contenido de sólidos solubles totales (SST) y de humedad, pH, perfil de carbohi- dratos y algunas características sensoriales de 29 muestras de jarabes de agave azul, maíz y caña, y miel de abeja. El jara- be de agave azul, en promedio tuvo SST equivalentes a 76 °Brix, 22 % de humedad (% H) y pH 4; en contraste la miel presentó el contenido mayor de SST (82 °Brix), el menor de humedad (16 % H) y pH (pH 3.7). La cromatografía en capa fina (TLC) y cromatografía de intercambio aniónico de alta resolución, acoplada a un detector de pulso amperométrico (HPAEC-PAD), mostró que el jarabe de agave azul contiene principalmente fructosa y fructooligosacáridos; los de maíz y caña y la miel contienen glucosa, sacarosa y maltooligosacári- dos con perfiles diferenciables. Palabras clave: Agave tequilana Weber var. azul, endulzante na- tural, fructooligosacáridos, jarabe de agave azul, perfil de carbo- hidratos, propiedades físicas y químicas. ABSTRACT The blue agave syrup (Agave tequilana Weber var. azul) is the natural sweet substance produced by hydrolysis of fructans stored in the agave plant. This sweetener has become popular for its prebiotic capacity and low glycemic index compared to other natural syrups and honeys. The trademarks, distributors, production and commercialization of these syrups have increased; therefore, it is important to know their physical and chemical characteristics and contrast them with other products of the same type. In this study we determined the content of total soluble solids (TSS) and of humidity, pH, carbohydrate profile and some sensorial characteristics of 29 samples of blue agave and corn, sugarcane syrups, and honey. The blue agave syrup, on average, had TSS equivalent to 76 °Brix, 22 % humidity (% H) and pH 4; in contrast, honey showed the highest TSS content (82 °Brix), the lowest values of humidity (16 % H) and pH (pH 3.7). Thin-layer chromatography (TLC) and anion-exchange chromatography with high-performance coupled to a pulsed amperometric detector (HPAEC-PAD), showed that the blue agave syrups contains mainly fructose and fructooligosaccharides; those of corn, sugarcane, and honey contain glucose, sucrose and maltooligosaccharides with differentiated profiles. Key words: Agave tequilana Weber var. azul, natural sweetener, fructooligosaccharides, blue agave syrup, carbohydrate profile, physical and chemical properties. INTRODUCTION P lants of the Agave genus store fructans (polymers of fructose) as main reserve carbohydrates (López et al., 2003; Mancilla- Margalli and López, 2006). In this genus, Agave tequilana Weber var. azul stands out as an ANÁLISIS COMPARATIVO ENTRE JARABE DE AGAVE AZUL (Agave tequilana Weber var. azul) Y OTROS JARABES NATURALES COMPARATIVE ANALYSIS BETWEEN BLUE AGAVE SYRUP (Agave tequilana Weber var. azul) AND OTHER NATURAL SYRUPS Erika Mellado-Mojica, Mercedes Gpe. López-Pérez * Departamento de Biotecnología y Bioquímica. Centro de Investigación y de Estudios Avanza- dos del IPN. Unidad Irapuato. Km 9.6 Lib. Norte Carretera Irapuato-Leon. 36821. Irapuato, Guanajuato. México. ([email protected]). *Autor responsable v Author for correspondence. Recibido: marzo, 2012. Aprobado: abril, 2013. Publicado como ARTÍCULO en Agrociencia 47: 233-244. 2013.
-
Upload
vuongnguyet -
Category
Documents
-
view
228 -
download
1
Transcript of ANÁLISIS COMPARATIVO ENTRE JARABE DE AGAVE AZUL ...
233
Resumen
El jarabe de agave azul (Agave tequilana Weber var. azul) es la sustancia dulce natural producida por hidrólisis de los fruc-tanos almacenados en la planta de maguey. Este endulzan-te se ha popularizado por su capacidad prebiótica e índice glucémico bajo respecto a otros jarabes y mieles naturales. Las marcas comerciales, distribuidores, producción y comer-cialización de estos jarabes han incrementado, por ello es conveniente conocer sus características físicas y químicas y contrastarlas con las de otros productos del mismo tipo. En el presente estudio se determinaron el contenido de sólidos solubles totales (SST) y de humedad, pH, perfil de carbohi-dratos y algunas características sensoriales de 29 muestras de jarabes de agave azul, maíz y caña, y miel de abeja. El jara-be de agave azul, en promedio tuvo SST equivalentes a 76 °Brix, 22 % de humedad (% H) y pH 4; en contraste la miel presentó el contenido mayor de SST (82 °Brix), el menor de humedad (16 % H) y pH (pH 3.7). La cromatografía en capa fina (TLC) y cromatografía de intercambio aniónico de alta resolución, acoplada a un detector de pulso amperométrico (HPAEC-PAD), mostró que el jarabe de agave azul contiene principalmente fructosa y fructooligosacáridos; los de maíz y caña y la miel contienen glucosa, sacarosa y maltooligosacári-dos con perfiles diferenciables.
Palabras clave: Agave tequilana Weber var. azul, endulzante na-tural, fructooligosacáridos, jarabe de agave azul, perfil de carbo-hidratos, propiedades físicas y químicas.
AbstRAct
The blue agave syrup (Agave tequilana Weber var. azul) is the natural sweet substance produced by hydrolysis of fructans stored in the agave plant. This sweetener has become popular for its prebiotic capacity and low glycemic index compared to other natural syrups and honeys. The trademarks, distributors, production and commercialization of these syrups have increased; therefore, it is important to know their physical and chemical characteristics and contrast them with other products of the same type. In this study we determined the content of total soluble solids (TSS) and of humidity, pH, carbohydrate profile and some sensorial characteristics of 29 samples of blue agave and corn, sugarcane syrups, and honey. The blue agave syrup, on average, had TSS equivalent to 76 °Brix, 22 % humidity (% H) and pH 4; in contrast, honey showed the highest TSS content (82 °Brix), the lowest values of humidity (16 % H) and pH (pH 3.7). Thin-layer chromatography (TLC) and anion-exchange chromatography with high-performance coupled to a pulsed amperometric detector (HPAEC-PAD), showed that the blue agave syrups contains mainly fructose and fructooligosaccharides; those of corn, sugarcane, and honey contain glucose, sucrose and maltooligosaccharides with differentiated profiles.
Key words: Agave tequilana Weber var. azul, natural sweetener, fructooligosaccharides, blue agave syrup, carbohydrate profile, physical and chemical properties.
IntRoductIon
Plants of the Agave genus store fructans (polymers of fructose) as main reserve carbohydrates (López et al., 2003; Mancilla-
Margalli and López, 2006). In this genus, Agave tequilana Weber var. azul stands out as an
ANÁLISIS COMPARATIVO ENTRE JARABE DE AGAVE AZUL (Agave tequilana Weber var. azul) Y OTROS JARABES NATURALES
COMPARATIVE ANALYSIS BETWEEN BLUE AGAVE SYRUP (Agave tequilana Weber var. azul) AND OTHER NATURAL SYRUPS
Erika Mellado-Mojica, Mercedes Gpe. López-Pérez*
Departamento de Biotecnología y Bioquímica. Centro de Investigación y de Estudios Avanza-dos del IPN. Unidad Irapuato. Km 9.6 Lib. Norte Carretera Irapuato-Leon. 36821. Irapuato, Guanajuato. México. ([email protected]).
*Autor responsable v Author for correspondence.Recibido: marzo, 2012. Aprobado: abril, 2013.Publicado como ARTÍCULO en Agrociencia 47: 233-244. 2013.
234
AGROCIENCIA, 1 de abril - 15 de mayo, 2013
VOLUMEN 47, NÚMERO 3
IntRoduccIón
Las plantas del género Agave almacenan fruc-tanos (polímeros de fructosa) como prin-cipal carbohidrato de reserva (López et al.,
2003; Mancilla-Margalli y López, 2006). En este género, Agave tequilana Weber var. azul sobresale como un cultivo con importancia agronómica en México por ser la materia prima principal para la elaboración de tequila (NOM, 2006), por la ca-pacidad prebiótica de sus fructanos y su efecto sistémico en la salud (Urías-Silvas et al., 2008; Urías-Silva y López, 2009). Los fructanos de Agave sp. disminuyen los niveles de glucosa y colesterol sérico e incrementan la absorción de calcio en los huesos (Urías-Silvas et al., 2008; García-Vieyra y López, 2010). El gran número de marcas comercia-les y distribuidores de jarabe de agave azul reflejan el incremento de su producción y aceptación como endulzante en México y otros países (NMX, 2008; Phillips et al., 2009). Según la Norma Mexicana NMX, 2008 (NMX-FF-110-SCFI-2008) el jarabe de agave azul es la sustancia dulce natural produ-cida por hidrólisis de sus fructanos y no debe con-tener aditivos alimentarios, almidones, melazas, glucosa, dextrinas, fructosa u otros azúcares de otro origen. No obstante su popularidad, la literatura disponible acerca del jarabe de agave azul está re-lacionada con producción (Partida et al., 1998), diseño de estrategias biotecnológicas para ese fin (García-Aguirre et al., 2009), capacidad antibac-teriana (Davidson y Ortiz de Montellano, 1983) y potencial como antioxidante (Phillips et al., 2009). Por tanto, es necesario conocer sus características físicas y químicas y los carbohidratos que contiene, lo que permitirá validar su autenticidad, calidad e impacto en la salud. El objetivo de este estudio fue determinar las propiedades físicas y químicas del jarabe de agave azul, identificar el tipo y abundan-cia de sus carbohidratos y compararlos con otros endulzantes naturales.
mAteRIAles y métodos
Estándares de carbohidratos
Para la identificar y cuantificar los mono y disacáridos se usa-ron estándares de glucosa, fructosa y sacarosa de Sigma-Aldrich (EE.UU.), los de los fructooligosacáridos (FOS) kestosa, nistosa
agronomical important crop in Mexico as the main raw material for tequila production (NOM, 2006), by the prebiotic capacity of its fructans and its systemic effect on health (Urías-Silvas et al., 2008; Urías-Silva and López, 2009). Fructans of Agave spp. decrease glucose levels and serum cholesterol and increase the absorption of calcium in bones (Urías-Silvas et al., 2008; García-Vieyra and López, 2010). The large number of trademarks and distributors of blue agave syrup reflect the increase in production and acceptance as a sweetener in Mexico and other countries (NMX, 2008, Phillips et al., 2009). According to the Mexican Standard NMX, 2008 (NMX-FF-110-SCFI-2008) blue agave syrup is the natural sweet substance produced by hydrolysis of fructans, and contains no food additives, starches, molasses, glucose, dextrin, fructose or other sugars from other sources. Despite its popularity, the available literature on the blue agave syrup is related to production (Partida et al., 1998), design of biotechnological strategies for this purpose (Garcia-Aguirre et al., 2009), antibacterial ability (Davidson and Ortiz de Montellano, 1983) and potential as an antioxidant (Phillips et al., 2009). Therefore, it is important to know the physical and chemical characteristics and carbohydrates that it contains, which will validate its authenticity, quality and impact on health. The objective of this study was to determine the physical and chemical properties of the blue agave syrup, identify the type and abundance of its carbohydrates it and compare them with other natural sweeteners.
mAteRIAls And methods
Carbohydrate standards
To identify and quantify mono-and di-saccharides standards of glucose, fructose and sucrose from Sigma-Aldrich (USA) were used; those of fructooligosaccharides (FOS), kestose, nystose and kestopentaosa were from Wako Pure Chemicals (Japan), and the maltooligosaccharides (MOS) were from Supelco (USA).
Analyzed samples of syrups and honey
Twenty nine products were analyzed and they were purchased in supermarkets of the cities of Arandas, Jalisco; Celaya, Guanajuato; District Federal, Guadalajara, Jalisco;

ANÁLISIS COMPARATIVO ENTRE JARABE DE AGAVE AZUL (Agave tequilana Weber var. azul) Y OTROS JARABES NATURALES
235MELLADO-MOJICA y LÓPEZ-PÉREZ
1 USDA, 1985: http://www.ams.usda.gov/AMSv1.0/getfile?dDocName=STELDEV3011895
y kestopentaosa fueron de Wako Pure Chemicals (Japón), y los de los maltooligosacáridos (MOS) de Supelco (EE.UU.).
Muestras analizadas de jarabes y miel
Se analizaron 29 productos adquiridos en supermercados de las ciudades de Arandas, Jalisco; Celaya, Guanajuato; Distrito Federal; Guadalajara, Jalisco; Irapuato, Guanajuato; Morelia, Michoacán; Oaxaca, Oaxaca; Tuxtla Gutiérrez, Chiapas; Vera-cruz, Veracruz; y Zacatecas, Zacatecas. El número de muestras y la nomenclatura fue la siguiente: 15 muestras de jarabe de agave azul (JA), 2 muestras de jarabe de maíz (JM), 2 muestras de ja-rabe de caña (JC) y 10 muestras de miel de abeja (MA). Previo a su análisis las muestras se homogenizaron durante 60 min con agitación a 500 rpm y 50 °C, se sonicaron 30 min, se enfriaron a temperatura ambiente (25 °C) y se almacenaron a 20 °C.
Sólidos solubles totales y contenido de humedad
Los SST (°Brix), la humedad (% H) y pH se cuantificaron según las especificaciones y métodos de la Norma Mexicana (NMX, 2008) para el producto denominado jarabe de agave azul elaborado con Agave tequilana Weber var. azul. Se evaluaron tres repeticiones de cada muestra. El contenido de SST y de humedad se determinaron en un refractómetro Abbé Carl Zeiss 736008 (Jena, Alemania) en 200 mL de muestra; la lectura se obtuvo en °Brix y en la escala de índice de refacción. El porcentaje de humedad se calculó con la tabla de equivalencias de índice de refracción y contenido de humedad, descrita en la United States Standards for Grades of Extracted Honey (USDA, 1985[1]).
pH
El pH de las muestras se midió con un potenciómetro 3510 pHmeter Jenway (EE.UU.), en tres alícuotas de una solución con 10 g de jarabe en 75 mL de agua destilada libre de dióxido de carbono.
Color
El color de las muestras se determinó con la absorbancia a 560 nm en un espectrofotómetro Benchmark-Plus Microplate de Biorad (EE.UU.), de acuerdo con el protocolo descrito en United States Standards for Grades of Extracted Honey (USDA, 1985[1]). Se usó glicerol como blanco y el color se definió según la escala para miel de abeja.
Irapuato, Guanajuato; Morelia, Michoacan; Oaxaca, Oaxaca; Tuxtla Gutierrez, Chiapas; Veracruz, Veracruz; and Zacatecas, Zacatecas. The number of samples and the nomenclature were as follows: 15 samples of blue agave syrup (JA), 2 samples of corn syrup (JM), 2 samples of cane syrup (JC) and 10 samples of honey (MA). Prior to analysis, the samples were homogenized by shaking at 500 rpm for 60 min and 50 °C, sonicated for 30 min, cooled to room temperature (25 °C) and stored at 20 °C.
Total soluble solids and humidity content
TSS (°Brix), humidity (% H) and pH were quantified according to specifications and methods of the Mexican Standard (NMX, 2008) for the product called blue agave syrup made from Agave tequilana Weber var. azul. Three replicates were evaluated for each sample. The content of TSS and humidity content were determined on an Abbé refractometer Carl Zeiss 766008 (Jena, Germany) in 200 mL of sample; reading was obtained on °Brix and in the refractive index scale. The humidity percentage was calculated with the table of equivalents of refractive index and humidity content, described in the United States Standards for Grades of Extracted Honey (USDA, 1985[1]).
pH
The pH of the samples was measured with a potentiometer pHmeter Jenway 3510 (USA) in three aliquots of a solution containing 10 g of syrup in 75 mL of distilled water carbon dioxide free.
Color
The color of the samples was determined with absorbance at 560 nm in a spectrophotometer Benchmark-Plus Microplate of Biorad (USA) according to the protocol described in United States Standards for Grades of Extracted Honey (USDA, 1985[1]). Glycerol was used as white and the color was defined according to the scale for honey.
Carbohydrate content in syrups and honeys
Carbohydrates were identified and quantified by thin layer chromatography and high-performance anion exchange chromatography coupled to a pulsed amperometric detector.
236
AGROCIENCIA, 1 de abril - 15 de mayo, 2013
VOLUMEN 47, NÚMERO 3
Contenido de carbohidratos en los jarabes y mieles
Los carbohidratos se identificaron y cuantificaron con cromatografía en capa fina y cromatografía de intercambio aniónico de alta resolución, acoplada a un detector de pulso amperométrico.
Análisis por cromatografía en capa fina (TLC)
Se aplicó 1 mL de las soluciones acuosas de los jarabes (100 mg mL1) a las placas de silica gel con soporte de aluminio. Las placas de TLC se desarrollaron en un sistema de solventes butanol/propanol/agua (Kanaya et al., 1978) y la presencia de los carbohidratos se detectó con anilina/difenilamina/ácido fosfórico en acetona (Anderson et al., 2000).
Análisis por cromatografía de intercambio aniónico de alta resolución acoplada a un detector de
pulso amperométrico (HPAEC-PAD)
En los jarabes y miel se cuantificaron glucosa, fructosa y sacarosa mediante HPAEC-PAD con un cromatógrafo de io-nes Dionex ICS-3000 (USA), con una guarda-columna Car-boPac PA-100 y columna CarboPac-PA100. Para el análisis se usaron 25 mL de las muestras diluidas (0.2 mg mL1 con agua desionizada y se filtraron a través de una membrana de nylon de 0.45 mm). La separación de los carbohidratos se realizó con un gradiente de acetato de sodio (0-500 mM) en NaOH 150 mM, con un flujo de 0.8 mL min1 y temperatura de co-lumna de 25 °C. El potencial aplicado para la detección por pulso amperométrico para E1 (400 ms), E2 (20 ms), E3 (20 ms) y E4 (60 ms) fue 0.1, 2.0, 0.6 y 0.1 V (Mellado-Mojica y López, 2012).
ResultAdos y dIscusIón
Sólidos solubles totales, humedad y pH
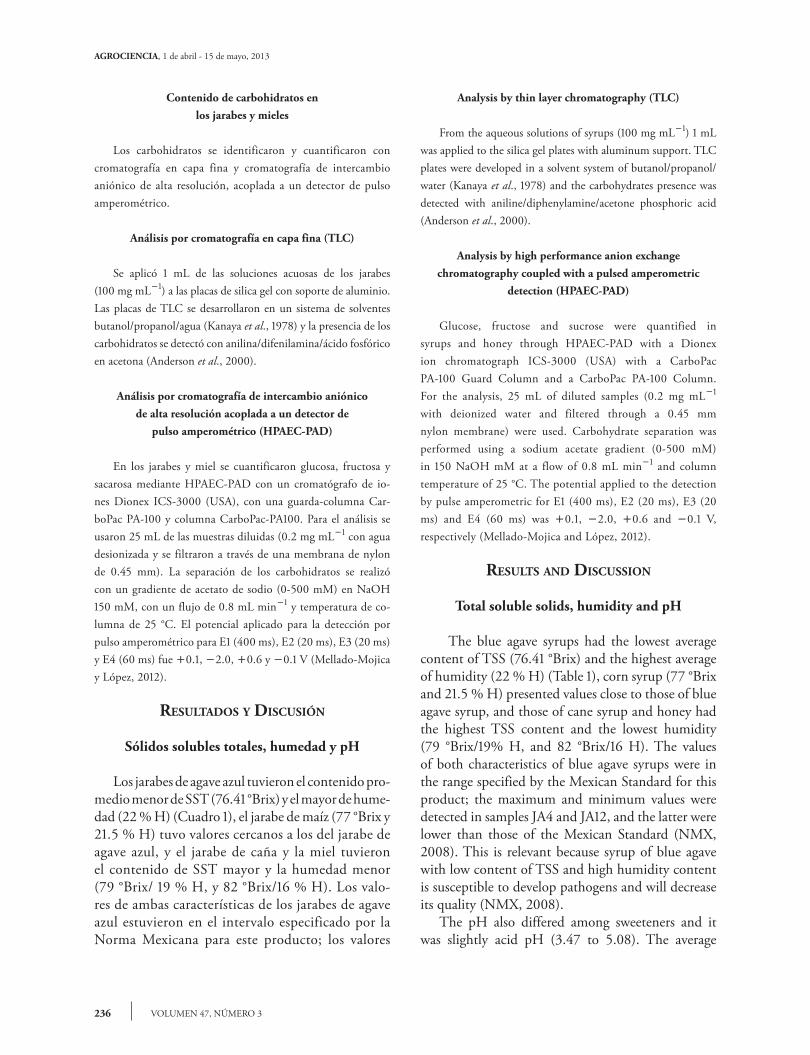
Los jarabes de agave azul tuvieron el contenido pro-medio menor de SST (76.41 °Brix) y el mayor de hume-dad (22 % H) (Cuadro 1), el jarabe de maíz (77 °Brix y 21.5 % H) tuvo valores cercanos a los del jarabe de agave azul, y el jarabe de caña y la miel tuvieron el contenido de SST mayor y la humedad menor (79 °Brix/ 19 % H, y 82 °Brix/16 % H). Los valo-res de ambas características de los jarabes de agave azul estuvieron en el intervalo especificado por la Norma Mexicana para este producto; los valores
Analysis by thin layer chromatography (TLC)
From the aqueous solutions of syrups (100 mg mL1) 1 mL was applied to the silica gel plates with aluminum support. TLC plates were developed in a solvent system of butanol/propanol/water (Kanaya et al., 1978) and the carbohydrates presence was detected with aniline/diphenylamine/acetone phosphoric acid (Anderson et al., 2000).
Analysis by high performance anion exchange chromatography coupled with a pulsed amperometric
detection (HPAEC-PAD)
Glucose, fructose and sucrose were quantified in syrups and honey through HPAEC-PAD with a Dionex ion chromatograph ICS-3000 (USA) with a CarboPac PA-100 Guard Column and a CarboPac PA-100 Column. For the analysis, 25 mL of diluted samples (0.2 mg mL1 with deionized water and filtered through a 0.45 mm nylon membrane) were used. Carbohydrate separation was performed using a sodium acetate gradient (0-500 mM) in 150 NaOH mM at a flow of 0.8 mL min1 and column temperature of 25 °C. The potential applied to the detection by pulse amperometric for E1 (400 ms), E2 (20 ms), E3 (20 ms) and E4 (60 ms) was 0.1, 2.0, 0.6 and 0.1 V, respectively (Mellado-Mojica and López, 2012).
Results And dIscussIon
Total soluble solids, humidity and pH
The blue agave syrups had the lowest average content of TSS (76.41 °Brix) and the highest average of humidity (22 % H) (Table 1), corn syrup (77 °Brix and 21.5 % H) presented values close to those of blue agave syrup, and those of cane syrup and honey had the highest TSS content and the lowest humidity (79 °Brix/19% H, and 82 °Brix/16 H). The values of both characteristics of blue agave syrups were in the range specified by the Mexican Standard for this product; the maximum and minimum values were detected in samples JA4 and JA12, and the latter were lower than those of the Mexican Standard (NMX, 2008). This is relevant because syrup of blue agave with low content of TSS and high humidity content is susceptible to develop pathogens and will decrease its quality (NMX, 2008). The pH also differed among sweeteners and it was slightly acid pH (3.47 to 5.08). The average
ANÁLISIS COMPARATIVO ENTRE JARABE DE AGAVE AZUL (Agave tequilana Weber var. azul) Y OTROS JARABES NATURALES
237MELLADO-MOJICA y LÓPEZ-PÉREZ
Cuadro 1. Sólidos solubles totales (SST), contenido de humedad (%) y pH de jarabes y miel.Table 1. Total soluble solids (TSS), humidity content (%) and pH of syrups and honey.
Jarabe SST (°Brix) Humedad (%) pH Jarabe† SST (°Brix) Humedad (%) pH
JA1 75.2 0.2 23.2 0.2 4.40 0.02 JM1 77.4 0.0 21 0.0 4.05 0.02JA2 77.5 0.3 20.8 0.2 3.69 0.05 JM2 76.6 0.05 21.9 0.1 4.73 0.01JA3 79.1 0.1 19.2 0.2 4.11 0.01 JC1 78.5 0.05 19.9 0.1 4.83 0.01JA4 79.5 0.5 19 0.4 4.11 0.03 JC2 80.1 0.1 18.2 0.0 5.08 0.12JA5 75.0 0.0 23.4 0.0 4.16 0.02 MA1 82.3 0.1 15.9 0.1 4.25 0.06JA6 76.0 0.0 22.4 0.0 3.74 0.01 MA2 81.3 0.1 17 0.0 3.77 0.03JA7 74.1 0.1 24.3 0.1 3.85 0.01 MA3 82.0 0.1 16.2 0.2 3.47 0.01JA8 77.0 0.0 21.5 0.1 3.74 0.01 MA4 84.0 0.0 14.3 0.0 3.80 0.01JA9 77.7 0.15 21 0.2 3.91 0.02 MA5 82.4 0.0 15.8 0.0 3.91 0.02JA10 78.0 0.0 20.3 0.1 3.87 0.04 MA6 80.0 0.0 18.2 0.0 3.60 0.01JA11 78.1 0.1 20.3 0.1 3.96 0.02 MA7 82.8 0.25 15.4 0.3 3.59 0.01JA12 73.4 0.0 25 0.0 3.87 0.02 MA8 81.0 0.0 17.4 0.0 3.53 0.01JA13 75.4 0.0 23 0.0 3.99 0.02 MA9 80.6 0.0 17.7 0.1 3.74 0.0JA14 75.7 0.1 22.7 0.1 4.07 0.01 MA10 83.1 0.1 15.1 0.0 3.57 0.01JA15 74.5 0.1 23.9 0.1 4.16 0.01
† JAjarabe de agave azul; JMjarabe de maíz; JCjarabe de caña; MAmiel de abeja v † JAblue agave syrup; JMcorn syrup; JCcane syrup; MAhoney.
máximos y mínimos se detectaron en las muestras JA4 y JA12, y los de esta última fueron menores a los de la Norma (NMX, 2008). Esto es relevante porque un jarabe de agave azul con contenido bajo de SST y alto de humedad es susceptible al desa-rrollo de patógenos y disminuirá su calidad (NMX, 2008). El pH también difirió entre los endulzantes y fue ligeramente ácido (3.47 a 5.08). El pH promedio de los jarabes de agave azul fue 4, y el de las muestras JA1 y JA2 fue el mayor (4.4) y menor (3.69) de ese grupo. El pH del jarabe de agave azul indicado en la Norma es de 4 a 6; varias de las muestras analizadas no cumplieron con la normatividad pues su pH fue menor, pero sus valores coinciden con el reportado por López et al. (2011). Así, el pH del jarabe de aga-ve azul más frecuente es cercano a 4. Las mieles tuvieron el pH menor (3.72), los ja-rabes de agave azul (pH 3.97) y de maíz (pH 4.5) tuvieron valores intermedios y el de caña (pH 4.95) fue el mayor. Los valores de SST, contenido de humedad y pH coincidieron con las especificaciones en la NNDSR (USDA, 2011[2]) para jarabes de maíz, y de caña, y la miel. Esto permite señalar que las tres caracterís-ticas de los jarabes y miel son típicas de cada tipo
pH of the blue agave syrups was 4, and that of the samples JA1 and JA2 was the highest (4.4) and the lowest (3.69) in this group. The pH of the blue agave syrup indicated in the Mexican Standard is between 4 and 6; several of the analyzed samples did not meet the regulations as their pH was lower, but their values coincide with those reported by López et al. (2011). Thus, the pH of the blue agave syrup more frequent is close to 4. Honeys had the lowest pH (3.72), the blue agave syrup (pH 3.97) and of corn (pH 4.5) had intermediate values and that of cane (pH 4.95) was the highest. Values of TSS, humidity content and pH coincided with the specifications in the NNDSR (USDA, 2011[2]) for corn and cane syrups, and honey. This allows to point out that the three characteristics of syrups and honey are typical of every kind and could to validate the authenticity and quality of these products.
Color
The blue agave syrup and honey had the greatest range of colors; in contrast, corn and sugar cane syrups had a unique hue (Table 2). Therefore, color
2 USDA, 2011: http://www.nal.usda.gov/fnic/foodcomp/search/
238
AGROCIENCIA, 1 de abril - 15 de mayo, 2013
VOLUMEN 47, NÚMERO 3
y podrían validar la autenticidad y calidad de esos productos.
Color
El jarabe de agave azul y la miel presentaron la gama mayor de colores; en contraste, los jarabes de maíz y de caña tuvieron una tonalidad única (Cua-dro 2). Por tanto, el color no es una variable adecua-da para validar o identificar estos endulzantes.
Identificación y contenido de carbohidratos
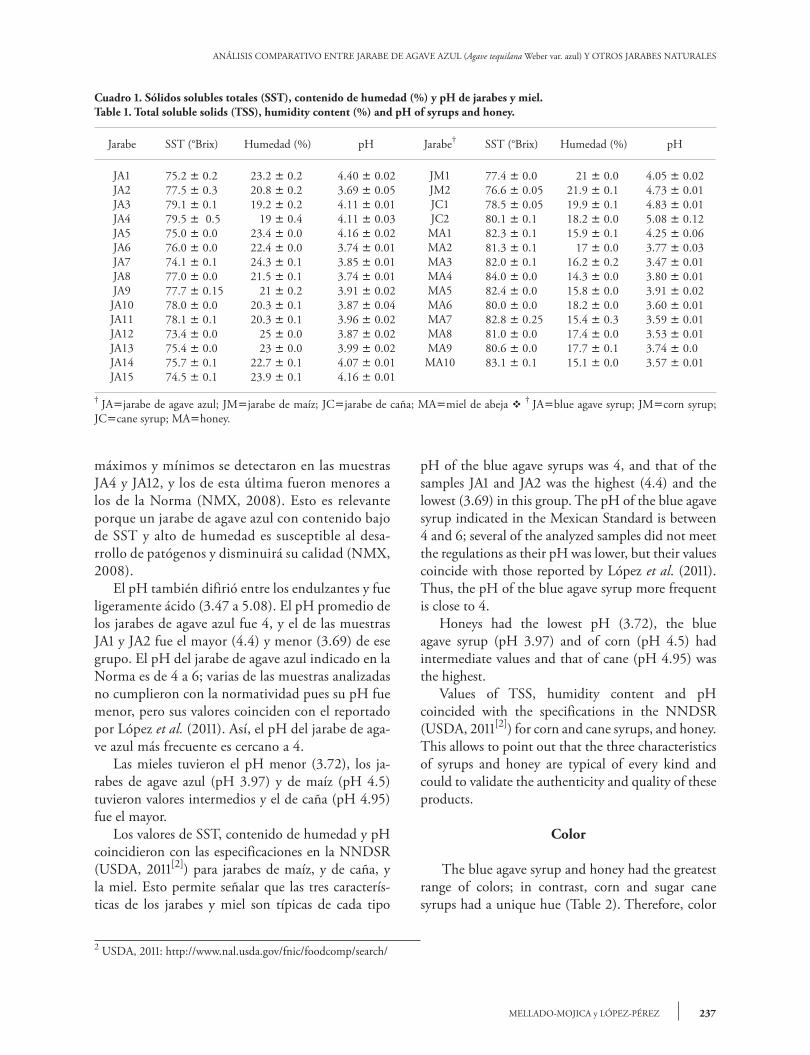
Los carbohidratos, separados con TLC e identificados mediante estándares (Cuadro 3),de cada jarabe o miel son específicos, y diferentes entre los productos con origen diverso (Figura 1). La misma metodología mostró que los jarabes de agave azul contienen fructosa en abundancia y al-gunos contienen trazas de FOS DP4 (kestosa y nistosa), formados en la hidrólisis de los fructanos de A. tequilana Weber var. azul cuando se elabo-ra el jarabe (García-Aguirre et al., 2009 y NMX, 2008). El jarabe de maíz y caña presentaron gluco-sa y MOS, y la presencia de sacarosa diferenció al jarabe de caña. La miel presentó glucosa, fructosa, maltosa, maltotriosa y un trisacárido de coloración rojiza cuyo factor de retardo (FR) estuvo entre los carbohidratos. El análisis HPAEC-PAD mostró que glucosa, fructosa y sacarosa fueron azúcares comunes y los más abundantes en los endulzantes. Los cromato-gramas (Figuras 2 y 3) mostraron patrones simila-res, como la presencia y abundancia de esos tres azú-cares en las muestras de cada tipo (Figura 2A-2D) y diferentes entre los tipos de endulzantes (2E).
is not a suitable variable to validate or identify these sweeteners.
Carbohydrate content and identification
Carbohydrates, separated by TLC and identified with standards (Table 3), of each syrup or honey were specific and different among the products with different origin (Figure 1). The same methodology showed that blue agave syrups contain fructose in abundance and that some contain traces of FOS DP4 (kestose and nystose), formed during the hydrolysis of fructans of A. tequilana Weber var. azul when making the syrup (Garcia-Aguirre et al., 2009 and NMX, 2008). Corn and cane syrups presented glucose and MOS, and the presence of sucrose differentiated the cane syrup. Honey presented glucose, fructose, maltose, maltotriose and a reddish trisaccharide whose retardation factor (RF) was among the carbohydrates. HPAEC-PAD analysis showed that glucose, fructose and sucrose were common sugars and the most abundant in sweeteners. Chromatograms (Figures 2 and 3) showed similar patterns, as the presence and abundance of these three sugars in samples of each type (Figure 2A-2D) and different between types of sweeteners (2E). Abundance of fructose, shortage of glucose and apparent absence of sucrose in the blue agave syrups was confirmed by HPAEC-PAD (Figure 2A). Corn syrup presented inverse relationship of sugars, respect to the blue agave syrup, because glucose was more abundant than fructose (Figure 2B). The high abundance of sucrose in the cane syrup allowed us to differentiate it from corn syrup (Figure 2C); so, the presence and abundance of disaccharide could be used to differentiate them. This contrasted with
3 USDA, 1985: http://www.ams.usda.gov/AMSv1.0/getfile?dDocName=STELDEV3011895
Cuadro 2. Gama de colores en los jarabes y miel.Table 2. Range of colors in syrups and honey.
Jarabe DO† Color USDA¶
Agave azul 0.017 -0.961 Transparente a ámbar claroMaíz 0.003 -0.005 TransparenteCaña 2.553 -3.956 Ámbar a ámbar oscuroAbeja 0.034 -0.426 Transparente a ámbar extra claro
† DOabsorbancia del jarabe a 560 nm. ¶ USDA, 1985[3] v † DOabsorbance of syrup at 560 nm. ¶ USDA, 1985[3].

ANÁLISIS COMPARATIVO ENTRE JARABE DE AGAVE AZUL (Agave tequilana Weber var. azul) Y OTROS JARABES NATURALES
239MELLADO-MOJICA y LÓPEZ-PÉREZ
Cuadro 3. Propiedades cromatográficas de carbohidratos utilizados como estándares.Table 3. Chromatographic properties of carbohydrates used as standards.
Abreviación Carbohidrato DP† Tipo¶ Color FR§ TRÞ
X Xilosa 1 MS Azul 0.70 n.d.G Glucosa 1 MS Azul 0.60 6.88F Fructosa 1 MS Rojo 0.60 8.00
IM2 Isomaltosa 2 MOS Azul n.d. 11.02S Sacarosa 2 DS Café 0.55 12.58
IM3 Isomaltotriosa 3 MOS Azul n.d 15.20K Kestosa 3 FOS Rojizo 0.44 15.92
M2 Maltosa 2 MOS Azul 0.5 16.25NK Neokestosa 3 FOS Rojizo 0.49 18.32N Nistosa 4 FOS Rojizo 0.37 18.95
M3 Maltotriosa 3 MOS Azul 0.41 19.58DP5 DP5 5 FOS Rojizo 0.31 22.12M4 Maltotetraosa 4 MOS Azul 0.3 22.78M5 Maltopentaosa 5 MOS Azul 0.22 25.93M6 Maltohexaosa 6 MOS Azul 0.16 29.62M7 Maltoheptaosa 7 MOS Azul 0.12 32.75
† DPgrado de polimerización. ¶ DSdisacárido; FOSfructooligosacárido, MOSmaltooligosacárido; MSmonosacárido; coloración del carbohidrato en TLC. § FRfactor de retardo en TLC. Þ
TRtiempo de retención (min) en HPAEC-PAD v † DPdegree of polymerization. ¶ DSdisaccharide, FOSfructooligosaccharide, MOSmaltooligosaccharide, MSmonosaccharide; staining of carbohydrate in TLC. § FRfactor of retard in TLC. Þ TRretention time (min) in HAPAEC-PAD.
Figura 1. Cromatografía en capa fina (TLC) de los jarabes y mieles estudiados. La nomenclatura de los estándares corres-ponde a la descrita en materiales y métodos.
Figure 1. Thin layer chromatography (TLC) of syrups and honeys studied. The standard nomenclature corresponds to that described in materials and methods.
MO
SFO
SJA
1JA
2JA
3JA
4JA
5JA
6JA
7JA
8JA
9JA
10JA
11JA
12JA
13JA
14JA
15FO
SM
OS
JM1
JM2
JC1
JC2
MA1
MA2
MA3
MA4
MA5
MA6
MA7
MA8
MA9
MA1
0FO
S
G
M
M3
M4M5M6M7
XG&FSNKKNDP5
Jarabes y mieles analizados
Mediante HPAEC-PAD (Figura 2A) se confirmó la abundancia de fructosa, la escasez de glucosa y au-sencia aparente de sacarosa en los jarabes de agave azul. El jarabe de maíz presentó relación inversa de azúcares, respecto al de agave azul, ya que la glucosa
honey since it showed similar glucose and fructose content, and absence of sucrose (Figure 2D). The results confirm that the presence or absence and abundance of glucose, fructose and sucrose (Figure 2E), could be a tool in the analysis of
240
AGROCIENCIA, 1 de abril - 15 de mayo, 2013
VOLUMEN 47, NÚMERO 3
Figura 2. Perfil de glucosa (G), fructosa (F) y sacarosa (S) mediante HPAEC-PAD de A) jarabe de agave azul, B) jarabe de maíz, C) jarabe de caña, D) miel de abeja y E) comparativo entre los jarabes y miel.
Figure 2. Profile of glucose (G), fructose (F) and sucrose (S) by HPAEC-PAD of A) blue agave syrup, B) corn syrup, C) cane syrup, D) honey and E) comparative between syrups and honey.
ANÁLISIS COMPARATIVO ENTRE JARABE DE AGAVE AZUL (Agave tequilana Weber var. azul) Y OTROS JARABES NATURALES
241MELLADO-MOJICA y LÓPEZ-PÉREZ
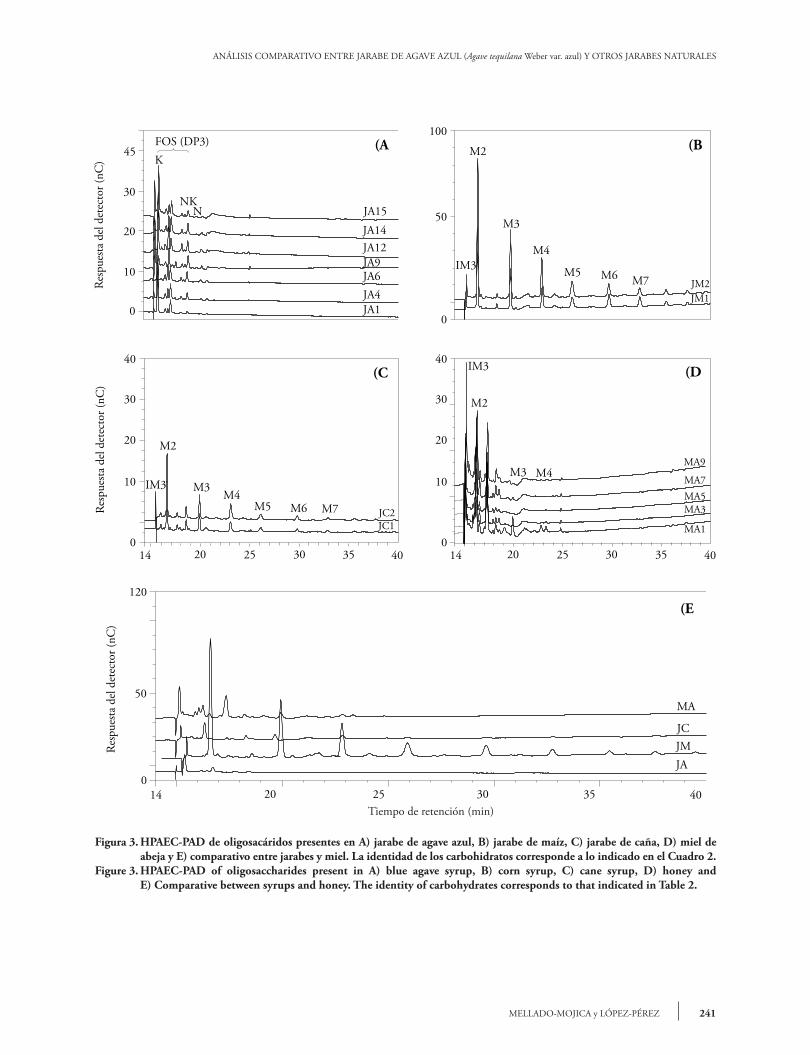
Figura 3. HPAEC-PAD de oligosacáridos presentes en A) jarabe de agave azul, B) jarabe de maíz, C) jarabe de caña, D) miel de abeja y E) comparativo entre jarabes y miel. La identidad de los carbohidratos corresponde a lo indicado en el Cuadro 2.
Figure 3. HPAEC-PAD of oligosaccharides present in A) blue agave syrup, B) corn syrup, C) cane syrup, D) honey and E) Comparative between syrups and honey. The identity of carbohydrates corresponds to that indicated in Table 2.

242
AGROCIENCIA, 1 de abril - 15 de mayo, 2013
VOLUMEN 47, NÚMERO 3
fue más abundante que la fructosa (Figura 2B). La gran abundancia de sacarosa en el jarabe de caña per-mitió diferenciarlo del de maíz (Figura 2C); así, la presencia y abundancia del disacárido podría usarse para diferenciarlos. Lo anterior contrastó con la miel, pues presentó contenido similar de glucosa y fructo-sa, y ausencia de sacarosa (Figura 2D). Los resultados confirman que la presencia o au-sencia y abundancia de glucosa, fructosa y sacarosa (Figura 2E), puede ser una herramienta en el análisis de autenticidad de los jarabe de agave azul y usarse para identificar algunos adulterantes. Mediante HPAEC-PAD se obtuvo el perfil (tipo y abundancia) de oligosacáridos de los jarabes y miel, se reconoció el perfil similar de ellos entre las mues-tras de cada tipo de jarabe o miel, y la diferencia en-tre los tipos (Figura 3). Los cromatogramas corres-ponden a una muestra representativa de las diversas muestras de cada tipo de jarabe de agave azul. Los oligosacáridos diferentes a sacarosa presen-tes en los jarabes de agave azul son conocidos como fructooligosacáridos, con DP5, incluyeron 1-kes-tosa (K), neokestosa (NK) y nistosa (N) (Figura 3A). En contraste, los jarabes de maíz y caña pre-sentaron maltooligosacáridos con un DP2 a DP9, y fueron más abundantes en el jarabe de maíz (Figura 3B-3C). También se confirmó la presencia de mal-tosa, maltotriosa y maltotetraosa en la miel y hubo otros carbohidratos diferentes a los incluidos como estándares en el estudio (Figura 3D). Además de los MOS identificados en la miel, se han reportado va-rios oligosacáridos, como erlosa, rafinosa, turanosa y laminariobiosa (Cotte et al., 2003; Megherbi et al., 2009; Alvarez-Suarez et al., 2010) y alguno de estos puede corresponder con los compuestos no identificados. El perfil de oligosacáridos del jarabe de agave azul fue único por la presencia de fructooligosacáridos (Fi-gura 3E) y oligosacáridos diferentes a los de los otros jarabes y miel. Esto indica que mediante HPAEC-PAD es posible establecer diferencias inequívocas entre los endulzantes analizados, y reconocer su ori-gen y calidad. HPAEC-PAD es una herramienta para identificar la presencia y tipo de otros jarabes que pudieran usarse como adulterantes de los jarabes de agave azul, por el tipo de los oligosacáridos. El contenido de glucosa, fructosa y sacarosa fue similar entre las muestras del mismo tipo y diferente entre los tipos de jarabes y miel. Los resultados de los
authenticity of blue agave syrups and be used to identify some adulterants. By HPAEC-PAD the profiles (type and abundance) of oligosaccharides of all syrups and honeys were obtained, similar profiles were found for samples of the same natural origin, besides relevant differences on the oligosaccharide profiles were observed for products of different natural source (Figure 3). The chromatograms correspond to a representative sample of the different samples used for each type of blue agave syrup. Oligosaccharides different from sucrose present in blue agave syrups are known as fructooligosaccharides with DP5, and included 1-kestose (K), neokestose (NK) and nystose (N) (Figure 3A). In contrast, corn and cane syrups presented maltooligosaccharides with a DP2 to DP9, and they were more abundant in corn syrup (Figures 3B-3C). It was further confirmed the presence of maltose, maltotriose and maltotetraose in honey and there were other carbohydrates different from those listed as standards in the study (Figure 3D). Besides the MOS identified in honey, several oligosaccharides, such as erlosa, raffinose, turanose and laminariobiosa are documented (Cotte et al., 2003; Megherbi et al., 2009; Alvarez- Suarez et al., 2010), and any of these may correspond to unidentified compounds. The oligosaccharide profile of blue agave syrup was unique due to the presence of fructooligosaccharides (Figure 3E) and oligosaccharides different to those of other syrups and honey. This indicates that by HPAEC-PAD is possible to establish unequivocal differences among sweeteners analyzed and their origin and quality can be recognized. HPAEC-PAD is a tool to identify the presence and type of other syrups that could be used as adulterants of blue agave syrups, by the type of oligosaccharides. The content of glucose, fructose and sucrose was similar among samples of the same kind and different between different types of syrups and honey. The results observed on the TLC coincided with the qualitative analysis of those by HPAEC-PAD (Figure 4). The content of fructose in the blue agave syrups was higher than 500 mg g1 and that of glucose on average is lower than 150 mg g1, in contrast with fructose formed by hydrolysis of fructans in the Agave genus (López et al., 2003), and in corn syrup glucose and MOS derived from hydrolysis of corn
ANÁLISIS COMPARATIVO ENTRE JARABE DE AGAVE AZUL (Agave tequilana Weber var. azul) Y OTROS JARABES NATURALES
243MELLADO-MOJICA y LÓPEZ-PÉREZ
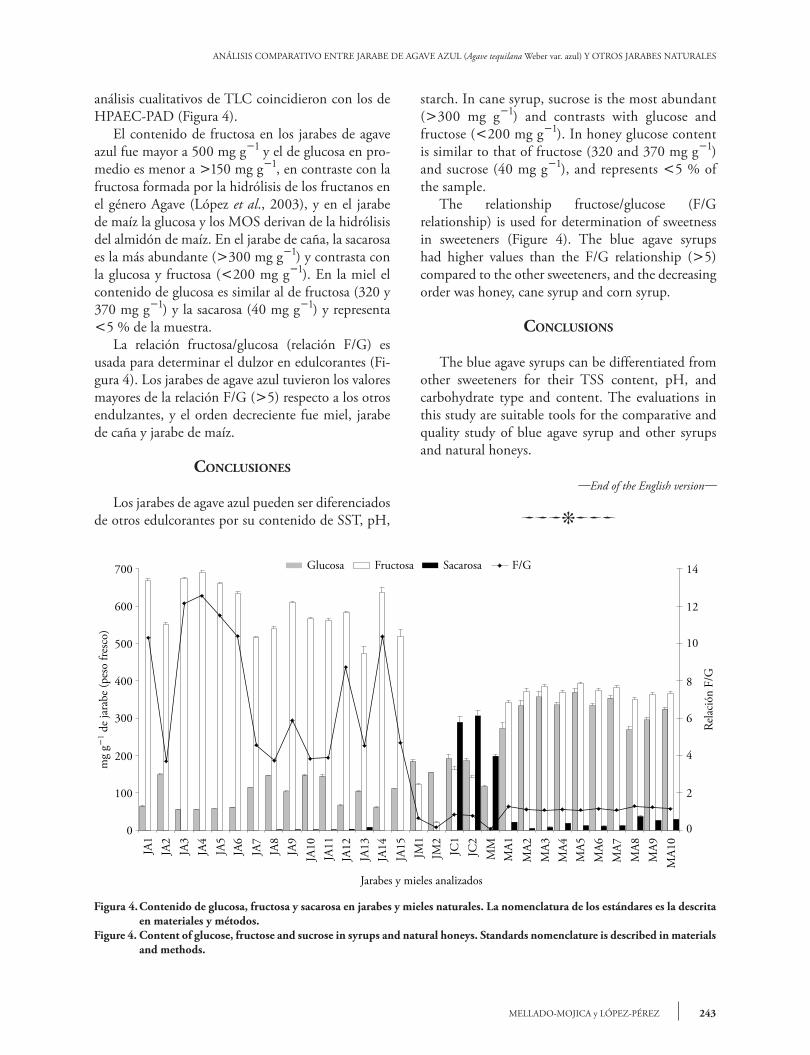
análisis cualitativos de TLC coincidieron con los de HPAEC-PAD (Figura 4). El contenido de fructosa en los jarabes de agave azul fue mayor a 500 mg g1 y el de glucosa en pro-medio es menor a 150 mg g1, en contraste con la fructosa formada por la hidrólisis de los fructanos en el género Agave (López et al., 2003), y en el jarabe de maíz la glucosa y los MOS derivan de la hidrólisis del almidón de maíz. En el jarabe de caña, la sacarosa es la más abundante (300 mg g1) y contrasta con la glucosa y fructosa (200 mg g1). En la miel el contenido de glucosa es similar al de fructosa (320 y 370 mg g1) y la sacarosa (40 mg g1) y representa 5 % de la muestra. La relación fructosa/glucosa (relación F/G) es usada para determinar el dulzor en edulcorantes (Fi-gura 4). Los jarabes de agave azul tuvieron los valores mayores de la relación F/G (5) respecto a los otros endulzantes, y el orden decreciente fue miel, jarabe de caña y jarabe de maíz.
conclusIones
Los jarabes de agave azul pueden ser diferenciados de otros edulcorantes por su contenido de SST, pH,
starch. In cane syrup, sucrose is the most abundant (300 mg g1) and contrasts with glucose and fructose (200 mg g1). In honey glucose content is similar to that of fructose (320 and 370 mg g1) and sucrose (40 mg g1), and represents 5 % of the sample. The relationship fructose/glucose (F/G relationship) is used for determination of sweetness in sweeteners (Figure 4). The blue agave syrups had higher values than the F/G relationship (5) compared to the other sweeteners, and the decreasing order was honey, cane syrup and corn syrup.
conclusIons
The blue agave syrups can be differentiated from other sweeteners for their TSS content, pH, and carbohydrate type and content. The evaluations in this study are suitable tools for the comparative and quality study of blue agave syrup and other syrups and natural honeys.
—End of the English version—
pppvPPP
Figura 4. Contenido de glucosa, fructosa y sacarosa en jarabes y mieles naturales. La nomenclatura de los estándares es la descrita en materiales y métodos.
Figure 4. Content of glucose, fructose and sucrose in syrups and natural honeys. Standards nomenclature is described in materials and methods.
244
AGROCIENCIA, 1 de abril - 15 de mayo, 2013
VOLUMEN 47, NÚMERO 3
tipo y contenido de carbohidratos. Las evaluaciones en este estudio son herramientas adecuadas para el estudio comparativo y de calidad del jarabe de agave azul y otros jarabes y mieles naturales
lIteRAtuRA cItAdA
Alvarez-Suarez, J. M., S. Tulipani, S. Romandini, E. Bertoli, and M. Battino. 2010. Contribution of honey in nutrition and human health: a review. Mediterr. J. Nutr. Metab. 3: 15-23.
Anderson, K., S. C. Li, and Y. T. Li. 2000. Diphenylamine-aniline-phosphoric acid reagent, a versatile spray reagent for revealin glycoconjugates on thin-layer chromatography plates. Anal. Biochem. 287: 337-339.
Cotte, J. F., H. Casablanca, S. Chardon, J. Lheritier, and M. F. Grenier-Loustalot. 2003. Aplication of carbohydrate analysis to verify honey authenticity. J. Chromatogr. A. 1021: 145-155.
Davidson, J. R., and B. R. Ortiz de Montellano. 1983. The bacterial properties o fan aztec wound remedy. J. Ethnopharmacol. 8: 149-161.
García-Aguirre, M., V. A. Sáenz-Álvaro, M. A. Rodríguez-Soto, F. J. Vicente-Magueyal, E. Botello-Álvarez, H. Jiménez-Islas, M. Cárdenas-Manríquez, R. Rico-Martínez, and J. L. Navarrete-Bolaños. 2009. Strategy for biotechnological process design applied to the enzymatic hydrolysis of agave fructo-oligosaccharides to obtain fructose-rich syrups. J. Agric. Food Chem. 57: 10205-10210.
García-Vieyra, M. I., and M. G. López. 2010. Agave fructans prevent bone loss by stimulating bone formation. In: Abstracts of 239 American Chemical Society (ACS) National Meeting. Agric. Food Chem. Division. San Francisco CA. EE.UU.
Kanaya, K., S. Chiba, and T. Shimomura. 1978. Thin-layer chromatography of linear oligosaccharides. Agric. Biol. Chem. 42: 1947-1948.
López, M. G., N. A. Mancilla-Margalli, and G. Mendoza-Díaz G. 2003. Molecular structures of fructans from Agave tequilana Weber var. azul. J. Agric. Food Chem. 51: 7835-7840.
López, M. G., A. M. Vera-Guzmán, and E. Mellado-Mojica. 2011. Open new doors: Agave syrup. In: Abstracts of 241 American Chemical Society (ACS) National Meeting. Agric. Food Chem. Division. Anaheim. CA. EE.UU.
Mancilla-Margalli, N. A., and M. G. López. 2006. Water-soluble carbohydrates and fructan structures patterns from Agave and Dasylirion species. J. Agric. Food Chem. 54: 7832-7839.
Megherbi, M., B. Herbreteau, R. Faure, and A. Salvador. 2009. Polysaccharides as a marker for detection of corn sugar syrup addition in honey. J. Agric. Food Chem. 57: 2105-2111.
Mellado-Mojica, E., and M. G. López. 2012. Fructan metabolism in A. tequilana Weber Blue variety along its developmental cycle in the field. J. Agric. Food Chem. 60: 11704-11713.
NMX-2008, Norma Mexicana (2008) que establece las especificaciones del producto denominado jarabe de agave elaborado con A. tequilana Weber. Var. azul. Especificaciones y métodos de prueba. NMX-FF-110-SCFI-2008. Diario Oficial 22 de abril del 2009. México.
NOM-2006, Norma Oficial Mexicana (2006) que establece las características y especificaciones de todos los integrantes de la cadena productiva, industrial y comercial del Tequila. Tequila especificaciones. NOM-006-SCFI-2005. Diario Oficial 6 de enero del 2006. México.
Partida, V., A. Camacho, and A. J. Martinez. 1998. Method of producing fructose syrup from agave plants. US patent 5 846 333.
Phillips, K. M., M. H. Carlsen, and R. Blomhoff. 2009. Total antioxidant content of alternatives to refined sugar. J. Am. Diet. Assoc. 109: 64-71.
USDA-1985. Agricultural Marketing Service. Fruit and Vegetable Division. Processed Products Branch. United States Standards for Grades of Extracted honey. http://www.ams.usda.gov/AMSv1.0/getfile?dDocName=STELDEV3011895. (Consultado: marzo 2012).
USDA-2011. Nutrient Data Laboratory. National Nutrient Database for Standard reference. http://www.nal.usda.gov/fnic/foodcomp/search/. (Consultado: marzo 2012).
Urías-Silvas, J. E., P. D. Cani, E. Delmée, A. Neyrinck, M. G. López, and N. M. Delzenne. 2008. Physiological effects of dietary fructans extracted from Agave tequilana Gto. and Dasylirion spp. Brit. J. Nutr. 99: 254-261.
Urías-Silvas, J. E., and M. G. López. 2009. Agave spp. and Dasylirion sp. fructans as a potential novel source of prebiotics. Dynam. Biochem. Proc. Biotech. Mol. Biol. 3: 59-64.