Analyst presentation Q3 2016
14
Q3 2016 Financial Results 9 November 2016
-
Upload
hera-group -
Category
Investor Relations
-
view
396 -
download
0
Transcript of Analyst presentation Q3 2016

Q3 2016 Financial Results9 November 2016

(3.1%)
+1.6%
+3.8%
+9.5%
+13.8%
Turnover Ebitda Ebit Pretax Net profit
The positive performance in first 9 months 2016
Doubling 9M Net Profit in 5Y (m€)
01
9M 2016 positive growth(growth rates %)
67,3
86,8
113,8125,0
142,3
9M '12 9M '13 9M '14 9M '15 9M '16
GRUPPOHERA
+16% Cagr
Boost on value creation for shareholders

Solid operating, financial and tax performances
9M RESULT HIGHLIGHTS(M€)
02
9M ‘15 9M ‘16
Turnover 3,472.4 3,364.8 (3.1%)
EBITDA 640.2 650.6 +1.6%
Ebitda margin 18.4% 19.3%
Depreciations (250.3) (252.1)
Provisions (72.7) (69.2)
EBIT 317.3 329.2 +3.8%
Cost of Debt (92.2) (84.0) (2.5%)
Figurative interests (IAS) (12.7) (14.2)
Income from Associates & J.V. 6.1 8.0
PRETAX PROFIT 218.4 239.1 +9.5%
Tax (83.5) (87.2)
Tax rate 38.2% 36.5%
Minorities (9.9) (9.6)
NET PROFIT POST MINORITIES 125.0 142.3 +13.8%
• Revenues affected by WACC cut and lower energy commodity prices.
• Ebitda margin affected by lower gas import and benefit from lower energy commodity prices.
• Ebit benefit from lower provisions to landfills.
• Financial expenses reduced following to lower debt and financial costs.
• Tax rate further decreased exploiting “patent box” and “maxi” depreciation tax benefits.
• Minorities benefit by increased minority stakes.
GRUPPOHERA
Results on track with expectations
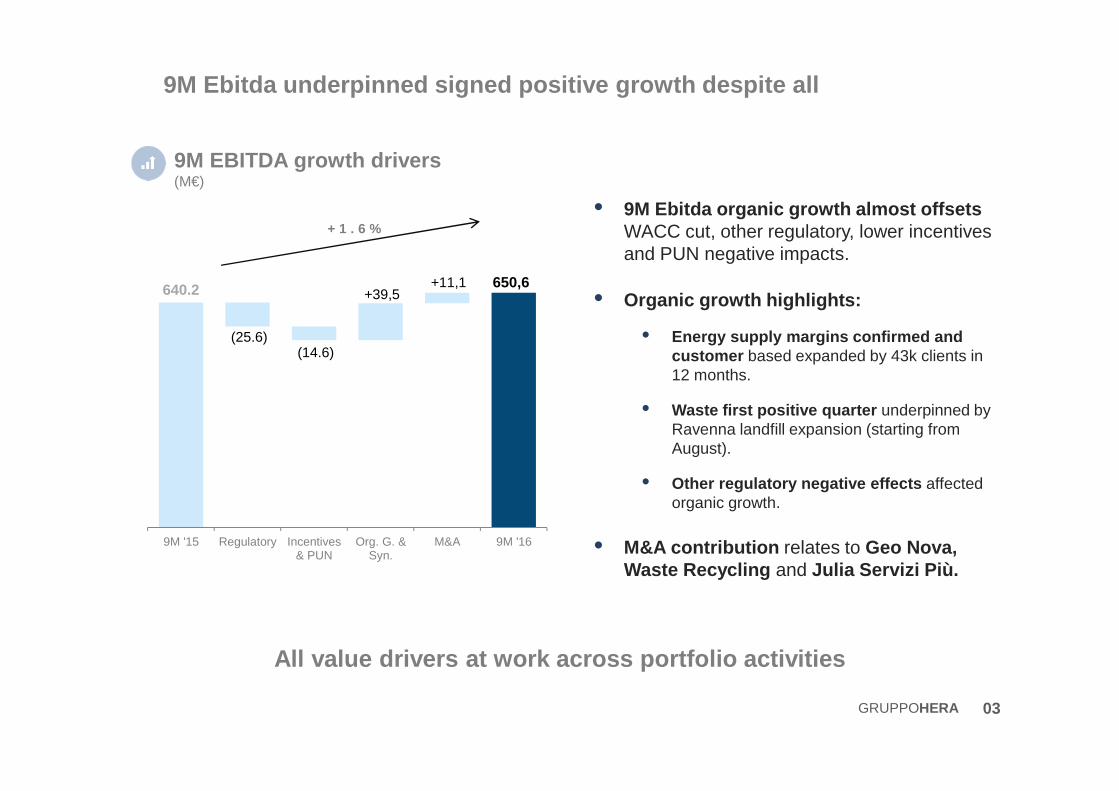
9M Ebitda underpinned signed positive growth despite all
9M EBITDA growth drivers(M€)
03
• 9M Ebitda organic growth almost offsets WACC cut, other regulatory, lower incentives and PUN negative impacts.
• Organic growth highlights:
• Energy supply margins confirmed and customer based expanded by 43k clients in 12 months.
• Waste first positive quarter underpinned by Ravenna landfill expansion (starting from August).
• Other regulatory negative effects affected organic growth.
• M&A contribution relates to Geo Nova, Waste Recycling and Julia Servizi Più.
640.2 650,6
(25.6)(14.6)
+39,5+11,1
9M '15 Regulatory Incentives& PUN
Org. G. &Syn.
M&A 9M '16
+ 1 . 6 %
All value drivers at work across portfolio activiti es
GRUPPOHERA

(3,8%)(1,8%)
+5,9%
Q1 Q2 Q3
172,5 172.2+1.8+10.5
(14.6)
+2.0
9M '15 Incentives M&A Prices Other 9M '16
WASTE: Stable results although lower incentives and landfill capacity
04
Q3 Ebitda growth fully offsets H1 landfill negative effect
9M Waste Ebitda(M€)
Waste Ebitda growth by quarters (M€)
• Incentives expiry (Cip6) together with green certificates and PUN reduction affected results.
• Waste Recycling and Geo Nova performed in line with expectations.
• Positive trends in Special Waste prices/demand confirmed; Special Waste up by +271k ton whereas Urban waste volumes stable.
• Landfill contribution, benefits from Ravenna landfill enlargement by 1m tons (entered into operations in august).
GRUPPOHERA
0
& PUN

3,1
1.5
1.10.3
0.2
Water gas Electricity D.H. Total 9M'16
NETWORKS: tackling with regulatory impacts
05
Efficiency remains management focus
9M Networks Ebitda(M€)
9M RAB by business(B€)
307.0 303,5
(16.7) (8.9)
22.1
9M '15 Wacc cut Other reg. Internal g. 9M'16
• Ebitda substantially in line with 9M ’15 being all negatives almost offset by internal growth drivers only.
• Wacc cut by 80 bps across all Network businesses on avg.
• Water benefit from efficiency improvements while expecting “quality standards” to be applied soon.
• InRete (spin off all Hera Spa energy networks)established 1st July. Reorganizations and means already in place to face gas tenders.
GRUPPOHERA
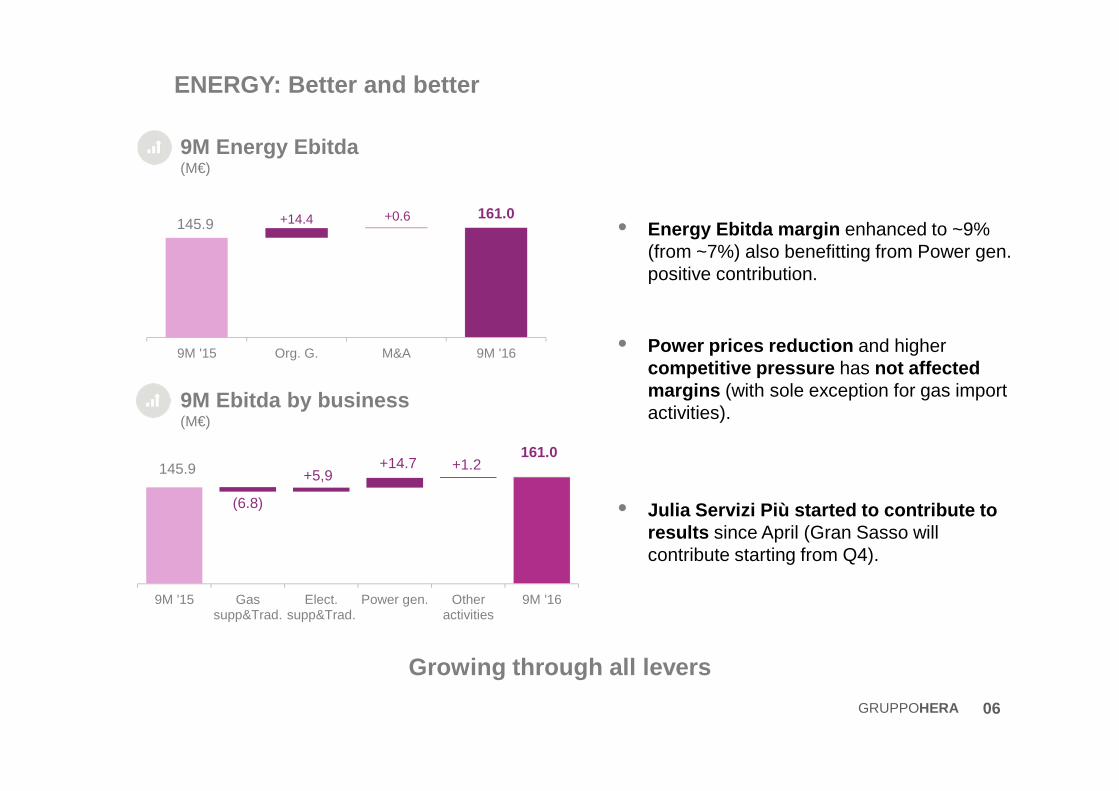
145.9161.0+14.4 +0.6
9M '15 Org. G. M&A 9M '16
ENERGY: Better and better
06
• Energy Ebitda margin enhanced to ~9% (from ~7%) also benefitting from Power gen. positive contribution.
• Power prices reduction and higher competitive pressure has not affected margins (with sole exception for gas import activities).
• Julia Servizi Più started to contribute to results since April (Gran Sasso will contribute starting from Q4).
Growing through all levers
145.9161.0
(6.8)
+5,9+14.7 +1.2
9M '15 Gassupp&Trad.
Elect.supp&Trad.
Power gen. Otheractivities
9M '16
9M Energy Ebitda(M€)
9M Ebitda by business(M€)
GRUPPOHERA
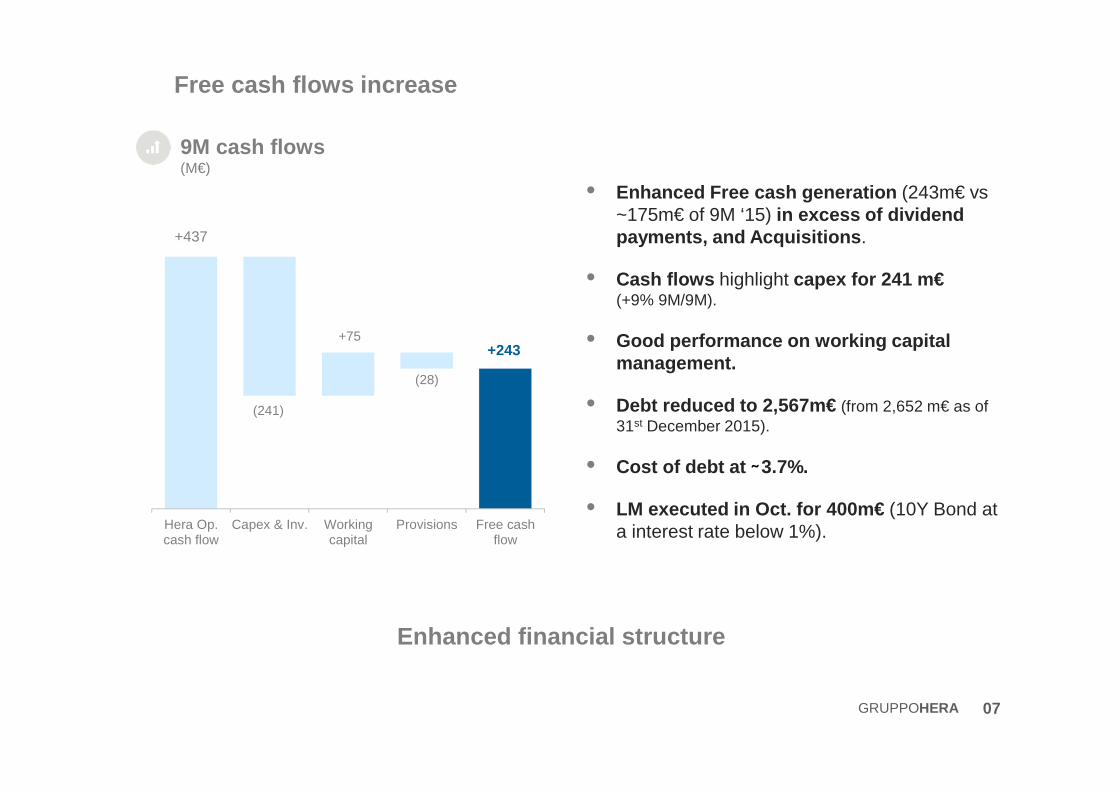
Free cash flows increase
07
• Enhanced Free cash generation (243m€ vs ~175m€ of 9M ‘15) in excess of dividend payments, and Acquisitions .
• Cash flows highlight capex for 241 m€(+9% 9M/9M).
• Good performance on working capital management.
• Debt reduced to 2,567m€ (from 2,652 m€ as of 31st December 2015).
• Cost of debt at 3.7%.
• LM executed in Oct. for 400m€ (10Y Bond at a interest rate below 1%).
Enhanced financial structure
+437
+243
(241)
+75
(28)
Hera Op.cash flow
Capex & Inv. Workingcapital
Provisions Free cashflow
9M cash flows(M€)
GRUPPOHERA
Closing remarks – Q&A session
• Enhanced value creation to shareholders through all levers
• M&A process contributed to growth and value creation once again
• Enhanced cash generation in excess of Capex, M&A and dividend payments
• Further liability management strengthened our financial structure
08
On track and the new business plan underway
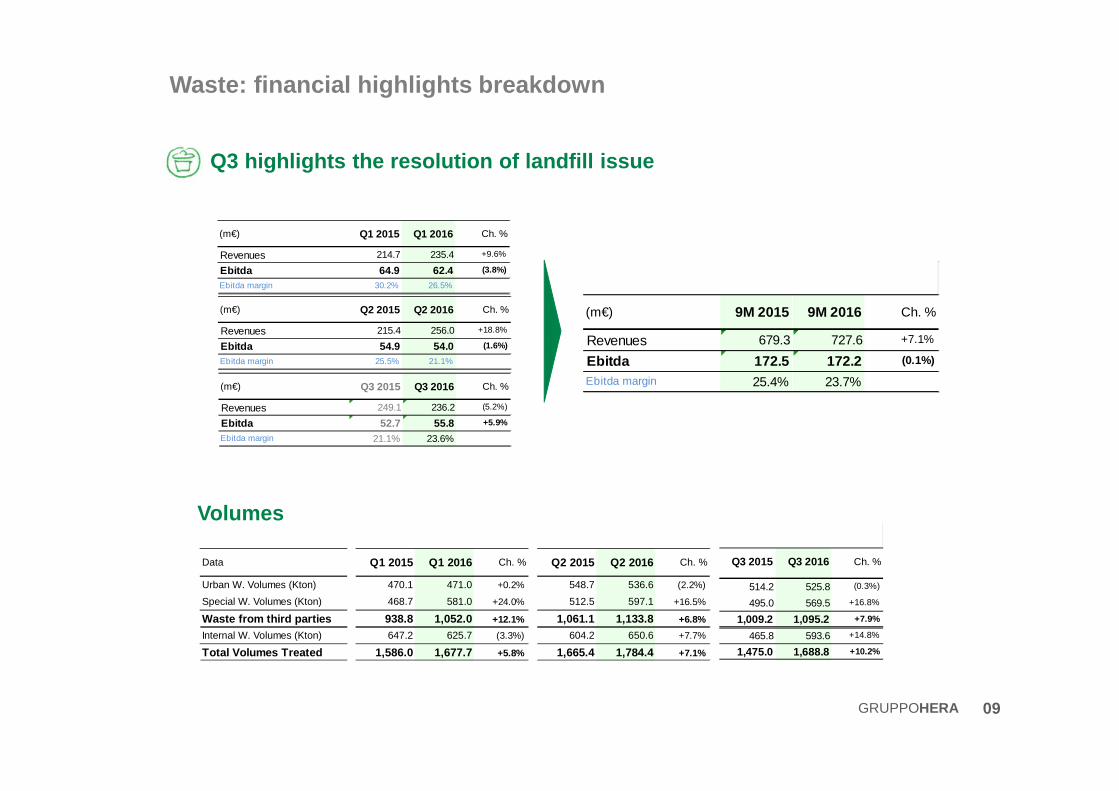
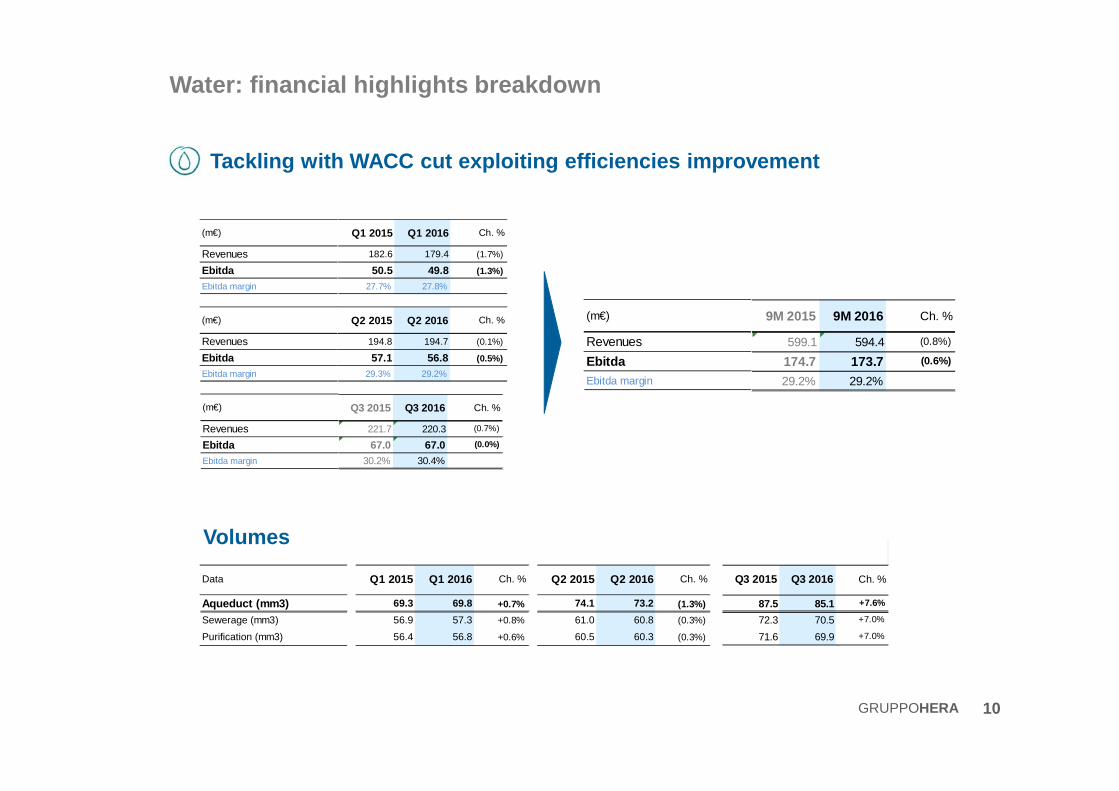
(m€) Q3 2015 Q3 2016 Ch. %
Revenues 249.1 236.2 (5.2%)
Ebitda 52.7 55.8 +5.9%
Ebitda margin 21.1% 23.6%
(m€) Q2 2015 Q2 2016 Ch. %
Revenues 215.4 256.0 +18.8%
Ebitda 54.9 54.0 (1.6%)
Ebitda margin 25.5% 21.1%
Waste: financial highlights breakdown
Q3 highlights the resolution of landfill issue
09
Volumes
Data
Urban W. Volumes (Kton)
Special W. Volumes (Kton)
Waste from third partiesInternal W. Volumes (Kton)
Total Volumes Treated
Q1 2015 Q1 2016 Ch. %
470.1 471.0 +0.2%
468.7 581.0 +24.0%
938.8 1,052.0 +12.1%
647.2 625.7 (3.3%)
1,586.0 1,677.7 +5.8%
Q2 2015 Q2 2016 Ch. %
548.7 536.6 (2.2%)
512.5 597.1 +16.5%
1,061.1 1,133.8 +6.8%
604.2 650.6 +7.7%
1,665.4 1,784.4 +7.1%
GRUPPOHERA
(m€) 9M 2015 9M 2016 Ch. %
Revenues 679.3 727.6 +7.1%
Ebitda 172.5 172.2 (0.1%)
Ebitda margin 25.4% 23.7%
(m€) Q1 2015 Q1 2016 Ch. %
Revenues 214.7 235.4 +9.6%
Ebitda 64.9 62.4 (3.8%)
Ebitda margin 30.2% 26.5%
Q3 2015 Q3 2016 Ch. %
514.2 525.8 (0.3%)
495.0 569.5 +16.8%
1,009.2 1,095.2 +7.9%
465.8 593.6 +14.8%
1,475.0 1,688.8 +10.2%
Q3 2015 Q3 2016 Ch. %
221.7 220.3 (0.7%)
67.0 67.0 (0.0%)
30.2% 30.4%
(m€)
Revenues
EbitdaEbitda margin
Q2 2015 Q2 2016 Ch. %
194.8 194.7 (0.1%)
57.1 56.8 (0.5%)
29.3% 29.2%
(m€)
Revenues
EbitdaEbitda margin
(m€)
Revenues
EbitdaEbitda margin
Water: financial highlights breakdown
10
Tackling with WACC cut exploiting efficiencies impr ovement
Volumes
Q1 2015 Q1 2016 Ch. %
182.6 179.4 (1.7%)
50.5 49.8 (1.3%)
27.7% 27.8%
Data
Aqueduct (mm3)Sewerage (mm3)
Purification (mm3)
Q1 2015 Q1 2016 Ch. %
69.3 69.8 +0.7%
56.9 57.3 +0.8%
56.4 56.8 +0.6%
Q2 2015 Q2 2016 Ch. %
74.1 73.2 (1.3%)
61.0 60.8 (0.3%)
60.5 60.3 (0.3%)
GRUPPOHERA
9M 2015 9M 2016 Ch. %
599.1 594.4 (0.8%)
174.7 173.7 (0.6%)
29.2% 29.2%
(m€)
Revenues
EbitdaEbitda margin
Q3 2015 Q3 2016 Ch. %
87.5 85.1 +7.6%
72.3 70.5 +7.0%
71.6 69.9 +7.0%

Q1 2015 Q1 2016 Ch. %
632.1 557.9 (11.7%)
128.4 128.7 +0.2%
20.3% 23.1%
Results account WACC cut and lower trading margins
Gas: financial highlights breakdown
11
(m€)
Revenues
EbitdaEbitda margin
(m€)
Revenues
EbitdaEbitda margin
Data
Volumes distrib. (mm3)
Volumes sold (mm3)
of which trading (mm3)
District Heating (GWht)
Clients ('000 unit)
Q1 2015 Q1 2016 Ch. %
1,358.3 1,313.3 (3.3%)
1,362.3 1,261.2 (7.4%)
356.5 324.0 (9.1%)
253.8 238.9 (5.9%)
1,315.4 1,327.1 +0.9%
Q2 2015 Q2 2016 Ch. %
370.8 361.6 (2.5%)
481.6 701.8 +45.7%
233.5 416.2 +78.2%
45.7 44.6 (2.4%)
Volumes
GRUPPOHERA
(m€)
Revenues
EbitdaEbitda margin
Q3 2015 Q3 2016 Ch. %
225.9 238.5 +5.6%
31.2 24.5 (21.5%)
13.8% 10.3%
(m€)
Revenues
EbitdaEbitda margin
9M 2015 9M 2016 Ch. %
1,117.3 1,032.2 (7.6%)
203.6 186.5 (8.4%)
18.2% 18.1%
Q3 2015 Q3 2016 Ch. %
243.3 243.5 (5.7%)
442.4 563.4 +85.0%
272.0 361.2 +217.6%
25.3 26.3 (8.6%)
1,314.7 1,338.4 +1.8%
Q2 2015 Q2 2016 Ch. %
259.4 235.9 (9.1%)
44.0 33.4 (24.2%)
17.0% 14.1%

Q3 2015 Q3 2016 Ch. %
439.7 377.8 (14.1%)
25.1 28.0 +11.6%
5.7% 7.4%
Q2 2015 Q2 2016 Ch. %
326.7 334.8 +2.5%
20.3 43.1 +112.3%
6.2% 12.9%
Electricity: regulatory changes and better Power ge n. management
Electricity: financial highlights breakdown
12
Q1 2015 Q1 2016 Ch. %
391.4 362.9 (7.3%)
29.3 33.2 +13.3%
7.5% 9.1%
(m€)
Revenues
EbitdaEbitda margin
(m€)
Revenues
EbitdaEbitda margin
Volumes
Q1 2015 Q1 2016 Ch. %
2,377.9 2,524.2 +6.2%
510.4 656.5 +28.6%
756.5 862.6 +14.0%
808.2 862.6 +6.7%
Q2 2015 Q2 2016 Ch. %
1,263.9 1,142.6 (9.6%)
472.4 520.3 +10.1%
715.6 584.3 (18.3%)
18.1 (7.0) (138.7%)
Data
Volumes sold (GWh)
of which Salvaguardia (GWh)
Volumes distrib. (GWh)
Clients ('000 unit)
GRUPPOHERA
(m€)
Revenues
EbitdaEbitda margin
Q3 2015 Q3 2016 Ch. %
2,036.7 1,869.7 +112.1%
825.6 768.9 +4.1%
844.4 863.8 +2.3%
(m€)
Revenues
EbitdaEbitda margin
9M 2015 9M 2016 Ch. %
1,157.8 1,075.5 (7.1%)
74.7 104.3 +39.7%
6.4% 9.7%