ANGLE OF REPOSE WALKS ON ITS TWO LEGS: CARR INDEX AND ...
15
www.wjpps.com Vol 9, Issue 5, 2020. 1565 Sen et al. World Journal of Pharmacy and Pharmaceutical Sciences ANGLE OF REPOSE WALKS ON ITS TWO LEGS: CARR INDEX AND HAUSNER RATIO Kushal Nandi, Dr. Dhrubo Jyoti Sen, Dr. Falguni Patra, Dr. Bankim Nandy, Dr. Khokan Bera and Dr. Beduin Mahanti Department of Pharmaceutical Chemistry and Pharmaceutics, School of Pharmacy, Techno India University, Salt Lake City, Sector‒V, EM‒4, Kolkata‒700091, West Bengal, India. ABSTRACT Every solid in dry state can flow on a surface to produce flowability according to the rheology. Flow property depends on the state of solid: Free flowing or Coarse flowing. The angle of repose of any solid in pulverized form represents an angle measured in theta (θ) which is measured in tanθ which is the ratio of height/radius of the conical shape. The equation for calculating the angle of repose is: tan ‒1 (2h/d). Using your scientific calculator, multiply height by 2 and divide this value by the distance. Then, hit the inverse tan key (or tan ‒1 ) and the answer just calculated. This will give the angle of repose. Angle of Repose (θ) In Degree (º) when it is less than 25º then it is excellent, when it is in the range 25‒30º then it is good, when it is in the range 30‒40º then it is average and when it is greater than 40º then the flow property is noted as bad. Flow Properties according to angle of repose comes under that range 0‒90º. Carr Index of any solid is calculated for compressibility of a powder which is based on true density (ρT) and bulk density (ρB), CI=100[(ρT‒ρB)/ρB]. A Carr index greater than 25 is considered to be an indication of poor flowability, and below 15, of good flowability. Another way to measure the flow of a powder is the Hausner ratio, which can be expressed as ρT/ρB. Excellent/very free flow for Carr Index is ≤10% and for Hausner Ratio is 1.00‒1.11, Good/free flow for Carr Index is 11‒15% and for Hausner Ratio is 1.12‒1.18, Fair flow for Carr Index is 16‒20% and for Hausner Ratio is 1.19‒1.25, Passable flow for Carr Index is 21‒25% and for Hausner Ratio is 1.26‒1.34, Poor/cohesive flow for Carr Index is 26‒31% and for Hausner Ratio it is 1.35‒1.45, Very Poor/very cohesive flow for Carr Index is 32‒37% and for Hausner Ratio it is 1.46‒1.59 WORLD JOURNAL OF PHARMACY AND PHARMACEUTICAL SCIENCES SJIF Impact Factor 7.632 Volume 9, Issue 5, 1565-1579 Research Article ISSN 2278 – 4357 Article Received on 15 March 2020, Revised on 03 April 2020, Accepted on 23 April 2020 DOI: 10.20959/wjpps20205-16174 *Corresponding Author Dr. Dhrubo Jyoti Sen Department of Pharmaceutical Chemistry and Pharmaceutics, School of Pharmacy, Techno India University, Salt Lake City, Sector‒V, EM‒4, Kolkata‒700091, West Bengal, India.
Transcript of ANGLE OF REPOSE WALKS ON ITS TWO LEGS: CARR INDEX AND ...
www.wjpps.com Vol 9, Issue 5, 2020.
1565
Sen et al. World Journal of Pharmacy and Pharmaceutical Sciences
ANGLE OF REPOSE WALKS ON ITS TWO LEGS: CARR INDEX AND
HAUSNER RATIO
Kushal Nandi, Dr. Dhrubo Jyoti Sen, Dr. Falguni Patra, Dr. Bankim Nandy,
Dr. Khokan Bera and Dr. Beduin Mahanti
Department of Pharmaceutical Chemistry and Pharmaceutics, School of Pharmacy, Techno
India University, Salt Lake City, Sector‒V, EM‒4, Kolkata‒700091, West Bengal, India.
ABSTRACT
Every solid in dry state can flow on a surface to produce flowability
according to the rheology. Flow property depends on the state of solid:
Free flowing or Coarse flowing. The angle of repose of any solid in
pulverized form represents an angle measured in theta (θ) which is
measured in tanθ which is the ratio of height/radius of the conical
shape. The equation for calculating the angle of repose is: tan‒1
(2h/d).
Using your scientific calculator, multiply height by 2 and divide this
value by the distance. Then, hit the inverse tan key (or tan‒1
) and the
answer just calculated. This will give the angle of repose. Angle of
Repose (θ) In Degree (º) when it is less than 25º then it is excellent,
when it is in the range 25‒30º then it is good, when it is in the range
30‒40º then it is average and when it is greater than 40º then the flow
property is noted as bad. Flow Properties according to angle of repose
comes under that range 0‒90º. Carr Index of any solid is calculated for compressibility of a
powder which is based on true density (ρT) and bulk density (ρB), CI=100[(ρT‒ρB)/ρB]. A
Carr index greater than 25 is considered to be an indication of poor flowability, and below 15,
of good flowability. Another way to measure the flow of a powder is the Hausner ratio, which
can be expressed as ρT/ρB. Excellent/very free flow for Carr Index is ≤10% and for
Hausner Ratio is 1.00‒1.11, Good/free flow for Carr Index is 11‒15% and for Hausner
Ratio is 1.12‒1.18, Fair flow for Carr Index is 16‒20% and for Hausner Ratio is
1.19‒1.25, Passable flow for Carr Index is 21‒25% and for Hausner Ratio is 1.26‒1.34,
Poor/cohesive flow for Carr Index is 26‒31% and for Hausner Ratio it is 1.35‒1.45, Very
Poor/very cohesive flow for Carr Index is 32‒37% and for Hausner Ratio it is 1.46‒1.59
WORLD JOURNAL OF PHARMACY AND PHARMACEUTICAL SCIENCES
SJIF Impact Factor 7.632
Volume 9, Issue 5, 1565-1579 Research Article ISSN 2278 – 4357
Article Received on
15 March 2020,
Revised on 03 April 2020,
Accepted on 23 April 2020
DOI: 10.20959/wjpps20205-16174
*Corresponding Author
Dr. Dhrubo Jyoti Sen
Department of
Pharmaceutical Chemistry
and Pharmaceutics,
School of Pharmacy,
Techno India University,
Salt Lake City, Sector‒V,
EM‒4, Kolkata‒700091,
West Bengal, India.
www.wjpps.com Vol 9, Issue 5, 2020.
1566
Sen et al. World Journal of Pharmacy and Pharmaceutical Sciences
and Very very poor/non flow Carr Index is >38% and for Hausner Ratio it is >1.60. In a
free‒flowing powder, the bulk density and tapped density would be close in value, therefore,
the Carr index would be small. On the other hand, in a poor‒flowing powder where there are
greater interparticle interactions, the difference between the bulk and tapped density observed
would be greater, therefore, the Carr index would be larger. Compressibility of powder
depends on true density and tap density and out of that flow property of powder comes in the
category of excellent flow (5‒15% compressibility), good flow (16‒18% compressibility),
fair flow (19‒21% compressibility), poor flow (22‒35% compressibility), very poor flow
(36‒40% compressibility), extremely poor flow (>40% compressibility).
KEYWORDS: Angle of Repose, Carr Index, Hausner Ratio, Tap Density, True Density.
INTRODUCTION
Angle of repose is the angle that the plane of contact between two bodies makes with the
horizontal when the upper body is just on the point of sliding: the angle whose tangent is the
coefficient of friction between the two bodies.[1]
The angle of repose, or critical angle of repose, of a granular material is the steepest angle of
descent or dip relative to the horizontal plane to which a material can be piled without
slumping. At this angle, the material on the slope face is on the verge of sliding. The angle of
repose can range from 0° to 90°. The morphology of the material affects the angle of repose;
smooth, rounded sand grains cannot be piled as steeply as can rough, interlocking sands. The
angle of repose can also be affected by additions of solvents. If a small amount of water is
able to bridge the gaps between particles, electrostatic attraction of the water to mineral
surfaces will increase the angle of repose, and related quantities such as the soil strength.[2]
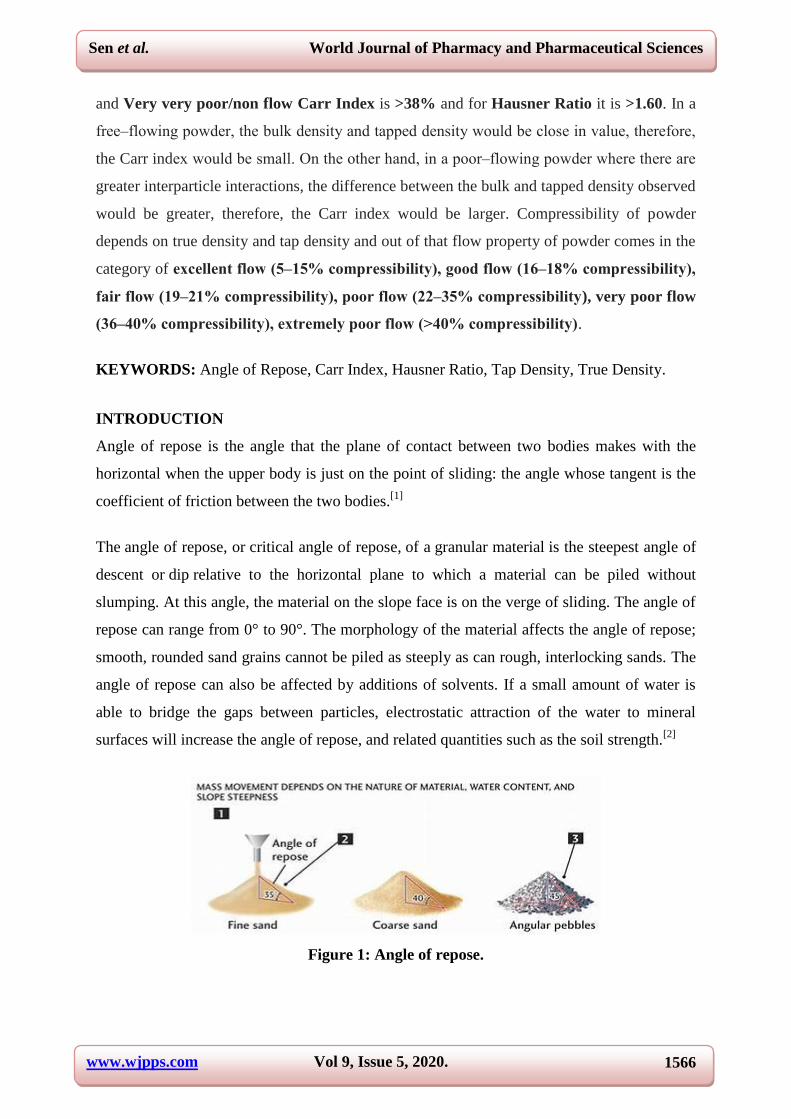
Figure 1: Angle of repose.
www.wjpps.com Vol 9, Issue 5, 2020.
1567
Sen et al. World Journal of Pharmacy and Pharmaceutical Sciences
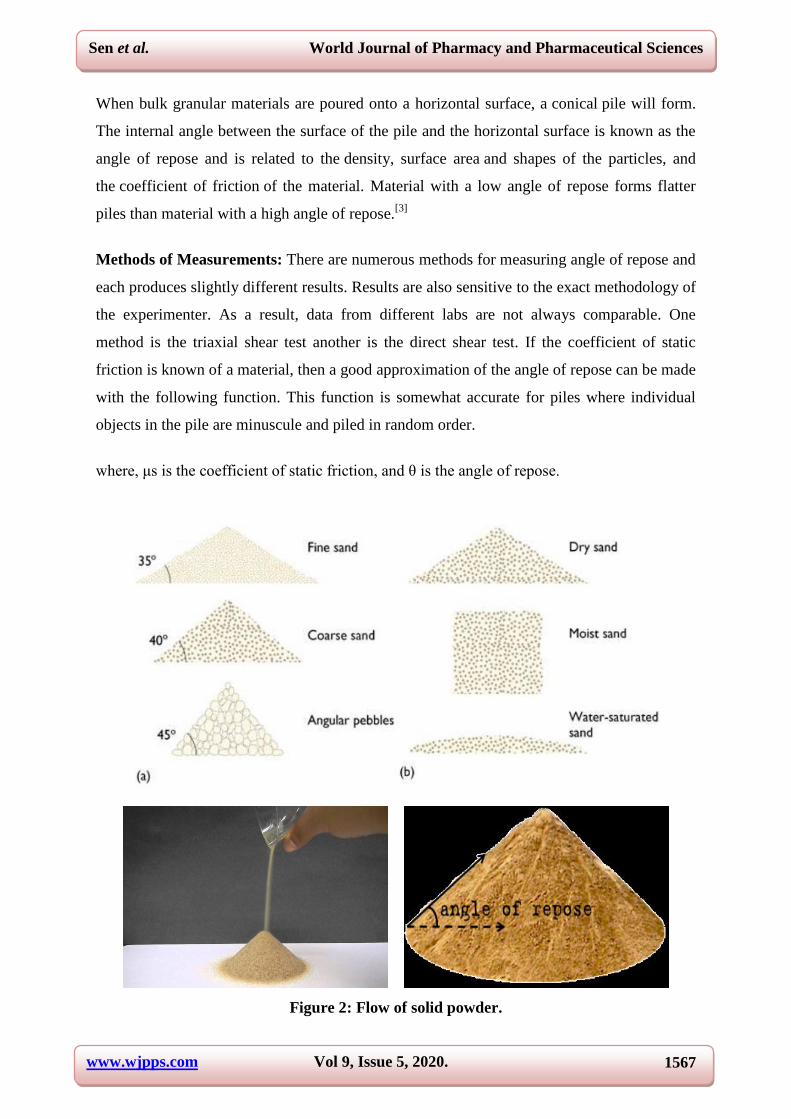
When bulk granular materials are poured onto a horizontal surface, a conical pile will form.
The internal angle between the surface of the pile and the horizontal surface is known as the
angle of repose and is related to the density, surface area and shapes of the particles, and
the coefficient of friction of the material. Material with a low angle of repose forms flatter
piles than material with a high angle of repose.[3]
Methods of Measurements: There are numerous methods for measuring angle of repose and
each produces slightly different results. Results are also sensitive to the exact methodology of
the experimenter. As a result, data from different labs are not always comparable. One
method is the triaxial shear test another is the direct shear test. If the coefficient of static
friction is known of a material, then a good approximation of the angle of repose can be made
with the following function. This function is somewhat accurate for piles where individual
objects in the pile are minuscule and piled in random order.
where, μs is the coefficient of static friction, and θ is the angle of repose.
Figure 2: Flow of solid powder.

www.wjpps.com Vol 9, Issue 5, 2020.
1568
Sen et al. World Journal of Pharmacy and Pharmaceutical Sciences
The measured angle of repose may vary with the method used.
Tilting box method: This method is appropriate for fine‒grained, non‒cohesive materials
with individual particle size less than 10 mm. The material is placed within a box with a
transparent side to observe the granular test material. It should initially be level and parallel
to the base of the box. The box is slowly tilted until the material begins to slide in bulk, and
the angle of the tilt is measured.
Fixed funnel method: The material is poured through a funnel to form a cone. The tip of the
funnel should be held close to the growing cone and slowly raised as the pile grows, to
minimize the impact of falling particles. Stop pouring the material when the pile reaches a
predetermined height or the base a predetermined width. Rather than attempt to measure the
angle of the resulting cone directly, divide the height by half the width of the base of the
cone. The inverse tangent of this ratio is the angle of repose.
Revolving cylinder method: The material is placed within a cylinder with at least one
transparent end. The cylinder is rotated at a fixed speed and the observer watches the material
moving within the rotating cylinder. The effect is similar to watching clothes tumble over one
another in a slowly rotating clothes dryer. The granular material will assume a certain angle
as it flows within the rotating cylinder. This method is recommended for obtaining the
dynamic angle of repose, and may vary from the static angle of repose measured by other
methods of various materials. Here is a list of various materials and their angle of repose. All
measurements are approximated.
Table 1: List of Angle of Repose of substances.
Material Angle of Repose
(degrees) Material
Angle of Repose
(degrees)
Ashes 40° Clover seed 28°
Asphalt (crushed) 30–45° Coconut (shredded) 45°
Bark (wood refuse) 45° Coffee Bean (fresh) 35–45°
Bran 30–45° Earth 30–45°
Chalk 45° Flour (corn) 30–40°
Clay (dry lump) 25–40° Flour (wheat) 45°
Clay (wet
excavated) 15° Granite 35–40°
Sand (dry) 34° Gravel (crushed stone) 45°
Sand (wet) 45° Gravel (natural w/
sand) 25–30°
Snow 38° Wheat 27°

www.wjpps.com Vol 9, Issue 5, 2020.
1569
Sen et al. World Journal of Pharmacy and Pharmaceutical Sciences
Bulk density and tapped density of powders
Bulk Density: The bulk density of a powder is the ratio of the mass of an untapped powder
sample and its volume including the contribution of the interparticulate void volume. Hence,
the bulk density depends on both the density of powder particles and the spatial arrangement
of particles in the powder bed. The bulk density is expressed in grams per millilitre (g/ml)
although the international unit is kilogram per cubic metre (1 g/ml = 1000 kg/m3) because the
measurements are made using cylinders. It may also be expressed in grams per cubic
centimetre (g/cm3). The bulking properties of a powder are dependent upon the preparation,
treatment and storage of the sample, i.e. how it was handled. The particles can be packed to
have a range of bulk densities and, moreover, the slightest disturbance of the powder bed
may result in a changed bulk density. Thus, the bulk density of a powder is often very
difficult to measure with good reproducibility and, in reporting the results, it is essential to
specify how the determination was made.
The bulk density of a powder is determined by measuring the volume of a known mass of
powder sample, that may have been passed through a sieve, into a graduated cylinder
(Method A), or by measuring the mass of a known volume of powder that has been passed
through a volumeter into a cup (Method B) or a measuring vessel (Method A. Bulk
Density=Mass/Volume [gm cm‒3
]
Method A. Measurement in a graduated cylinder
Procedure. Pass a quantity of powder sufficient to complete the test through a sieve with
apertures greater than or equal to 1.0 mm, if necessary, to break up agglomerates that may
have formed during storage; this must be done gently to avoid changing the nature of the
material. Into a dry graduated cylinder of 250 ml (readable to 2 ml), gently introduce, without
compacting, approximately 100 g of the test sample (m) weighed with 0.1% accuracy.
Carefully level the powder without compacting, if necessary, and read the unsettled apparent
volume (V0) to the nearest graduated unit. Calculate the bulk density in (g/ml) using the
formula m/V0. Generally, replicate determinations are desirable for the determination of this
property.
If the powder density is too low or too high, such that the test sample has an untapped
apparent volume of either more than 250 ml or less than 150 ml, it is not possible to use 100 g
of powder sample. Therefore, a different amount of powder has to be selected as test sample,
such that its untapped apparent volume is 150 ml to 250 ml (apparent volume greater than or

www.wjpps.com Vol 9, Issue 5, 2020.
1570
Sen et al. World Journal of Pharmacy and Pharmaceutical Sciences
equal to 60% of the total volume of the cylinder); the mass of the test sample is specified in
the expression of results.
For test samples having an apparent volume between 50 ml and 100 ml a 100 ml cylinder
readable to 1 ml can be used; the volume of the cylinder is specified in the expression of
results.[4]
Figure 3: Bulk Density measurement.
Method B. Measurement in a volumeter
Apparatus. The apparatus[1]
(Figure 1) consists of a top funnel fitted with a 1.0 mm sieve.
The funnel is mounted over a baffle box containing four glass baffle plates over which the
powder slides and bounces as it passes. At the bottom of the baffle box is a funnel that
collects the powder and allows it to pour into a cup mounted directly below it. The cup may
be cylindrical (25.00 ± 0.05 ml volume with an inside diameter of 30.00 ± 2.00 mm) or
cubical (16.39 ± 0.20 ml volume with inside dimensions of 25.400 ± 0.076 mm).

www.wjpps.com Vol 9, Issue 5, 2020.
1571
Sen et al. World Journal of Pharmacy and Pharmaceutical Sciences
Figure 4: Volumeter and Digital volumeter.
Procedure. Allow an excess of powder to flow through the apparatus into the sample
receiving cup until it overflows, using a minimum of 25 cm3 of powder with the cubical cup
and 35 cm3 of powder with the cylindrical cup. Carefully, scrape excess powder from the top
of the cup by smoothly moving the edge of the blade of a spatula perpendicular to and in
contact with the top surface of the cup, taking care to keep the spatula perpendicular to
prevent packing or removal of powder from the cup. Remove any material from the side of
the cup and determine the mass (M) of the powder to the nearest 0.1%. Calculate the bulk
density (g/ml) using the formula M/V0 in which V0 is the volume of the cup and record the
average of three determinations using three different powder samples.
Method C. Measurement in a vessel
Apparatus. The apparatus consists of a 100 ml cylindrical vessel of stainless steel with
dimensions as specified in Figure 2.
Figure 5: Measuring vessel (left) and cap (right) – Dimensions in mm.
Procedure. Pass a quantity of powder sufficient to complete the test through a 1.0 mm sieve,

www.wjpps.com Vol 9, Issue 5, 2020.
1572
Sen et al. World Journal of Pharmacy and Pharmaceutical Sciences
if necessary, to break up agglomerates that may have formed during storage and allow the
obtained sample to flow freely into the measuring vessel until it overflows. Carefully scrape
the excess powder from the top of the vessel as described for Method B. Determine the mass
(M0) of the powder to the nearest 0.1% by subtraction of the previously determined mass of
the empty measuring vessel. Calculate the bulk density (g/ml) using the formula M0/100 and
record the average of three determinations.[5]
Tapped Density: The tapped density is an increased bulk density attained after mechanically
tapping a container containing the powder sample.
The tapped density is obtained by mechanically tapping a graduated measuring cylinder or
vessel containing the powder sample. After observing the initial powder volume or mass, the
measuring cylinder or vessel is mechanically tapped, and volume or mass readings are taken
until little further volume or mass change is observed. The mechanical tapping is achieved by
raising the cylinder or vessel and allowing it to drop, under its own mass, a specified distance
by either of three methods as described below. Devices that rotate the cylinder or vessel
during tapping may be preferred to minimize any possible separation of the mass during
tapping down.[6]
Table 1: Correlation between hausner Ratio & Carr Index.
Figure 6: Tap density tester.

www.wjpps.com Vol 9, Issue 5, 2020.
1573
Sen et al. World Journal of Pharmacy and Pharmaceutical Sciences
Method A
Apparatus. The apparatus (Figure 3) consists of the following:
— a 250 ml graduated cylinder (readable to 2 ml) with a mass of 220 ± 44 g; and
— a settling apparatus capable of producing, in 1 minute, either nominally 250 ± 15 taps
from a height of 3 ±0.2 mm, or nominally 300 ± 15 taps from a height of 14 ± 2 mm.
The support for the graduated cylinder, with its holder, has a mass of 450 ± 10 g.
Procedure. Proceed as described above for the determination of the bulk volume (V0). Secure
the cylinder in the holder. Carry out 10, 500 and 1250 taps on the same powder sample and
read the corresponding volumes V10, V500 and V1250 to the nearest graduated unit. If the
difference between V500 and V1250 is less than or equal to 2 ml, V1250 is the tapped volume. If
the difference between V500 and V1250 exceeds 2 ml, repeat in increments such as 1250 taps,
until the difference between succeeding measurements is less than or equal to 2 ml. Fewer
taps may be appropriate for some powders, when validated. Calculate the tapped density
(g/ml) using the formula m/Vf in which Vf is the final tapped volume. Generally, replicate
determinations are desirable for the determination of this property. Specify the drop height
with the results.
If it is not possible to use a 100 g test sample, use a reduced amount and a suitable 100 ml
graduated cylinder (readable to 1 ml) weighing 130 ± 16 g and mounted on a holder weighing
240 ± 12 g. The modified test conditions are specified in the expression of the results.
Method B
Procedure. Proceed as directed under Method A except that the mechanical tester provides a
fixed drop of 3 ± 0.2 mm at a nominal rate of 250 taps per minute.
Method C
Procedure. Proceed as described in Method C for measuring the bulk density using the
measuring vessel equipped with the cap shown in Figure 2. The measuring vessel with the
cap is lifted 50‒60 times per minute by the use of a suitable tapped density tester. Carry out
200 taps, remove the cap and carefully scrape excess powder from the top of the measuring
vessel as described in Method C for measuring the bulk density. Repeat the procedure using
400 taps. If the difference between the two masses obtained after 200 and 400 taps exceeds
2%, carry out a test using 200 additional taps until the difference between succeeding
measurements is less than 2%. Calculate the tapped density (g/ml) using the formula Mf/100

www.wjpps.com Vol 9, Issue 5, 2020.
1574
Sen et al. World Journal of Pharmacy and Pharmaceutical Sciences
where Mf is the mass of powder in the measuring vessel. Record the average of three
determinations using three different powder samples. The test conditions including tapping
height are specified in the expression of the results.[7]
Measures of powder compressibility: Because the interparticulate interactions influencing
the bulking properties of a powder are also the interactions that interfere with powder flow, a
comparison of the bulk and tapped densities can give a measure of the relative importance of
these interactions in a given powder. Such a comparison is often used as an index of the
ability of the powder to flow, for example the Compressibility index or the Hausner ratio.
The Compressibility index and Hausner ratio are measures of the propensity of a powder to
be compressed as described above. As such, they are measures of the powder ability to settle
and they permit an assessment of the relative importance of interparticulate interactions. In a
free‒ flowing powder, such interactions are less significant, and the bulk and tapped densities
will be closer in value. For poorer flowing materials, there are frequently greater
interparticulate interactions, and a greater difference between the bulk and tapped densities
will be observed. These differences are reflected in the Compressibility Index and the
Hausner Ratio.
Figure 7: Compressibility index.
Compressibility index:
V0 = unsettled apparent volume,

www.wjpps.com Vol 9, Issue 5, 2020.
1575
Sen et al. World Journal of Pharmacy and Pharmaceutical Sciences
Vf = final tapped volume.
Hausner ratio
Depending on the material, the compressibility index can be determined using V10 instead of
V0. If V10 is used, it is clearly stated in the results.
The Carr index (Carr's index or Carr's Compressibility Index) is an indication of
the compressibility of a powder. It is named after the scientist Ralph J. Carr, Jr. The Carr
index is calculated by the formula=100[ρT‒ρB/ρB] , where ρB is the freely settled bulk
density of the powder, and ρT is the tapped bulk density of the powder after "tapping down".
It can also be expressed as C=100[1‒ρB/ρT].[8]
The Carr index is frequently used in pharmaceutics as an indication of the flowability of a
powder. In a free‒flowing powder, the bulk density and tapped density would be close in
value, therefore, the Carr index would be small. On the other hand, in a poor‒flowing powder
where there are greater interparticle interactions, the difference between the bulk and tapped
density observed would be greater, therefore, the Carr index would be larger. A Carr index
greater than 25 is considered to be an indication of poor flowability, and below 15, of good
flowability. Another way to measure the flow of a powder is the Hausner ratio, which can be
expressed as ρT/ρB. Both the Hausner ratio and the Carr index are sometimes criticized,
despite their relationships to flowability being established empirically, as not having a strong
theoretical basis. Use of these measures persists, however, because the equipment required to
perform the analysis is relatively cheap and the technique is easy to learn.
Figure 8: Flow characteristics & Carr Index.

www.wjpps.com Vol 9, Issue 5, 2020.
1576
Sen et al. World Journal of Pharmacy and Pharmaceutical Sciences
The Hausner ratio is a number that is correlated to the flowability of a powder or granular
material. It is named after the engineer Henry H. Hausner (1900–1995). The Hausner ratio is
calculated by the formula H=ρT/ρB
where ρB is the freely settled bulk density of the powder, and ρT is the tapped bulk density of
the powder. The Hausner ratio is not an absolute property of a material; its value can vary
depending on the methodology used to determine it. The Hausner ratio is used in a wide
variety of industries as an indication of the flowability of a powder. A Hausner ratio greater
than 1.25 is considered to be an indication of poor flowability. The Hausner ratio (H) is
related to the Carr index (C), another indication of flowability, by the formula
H=100/(100‒C). Both the Hausner ratio and the Carr index are sometimes criticized, despite
their relationships to flowability being established empirically, as not having a strong
theoretical basis. Use of these measures persists, however, because the equipment required to
perform the analysis is relatively cheap and the technique is easy to learn.[9]
Figure 9: Graphical Representation of hausner’s ratio.
Experimental protocol
www.wjpps.com Vol 9, Issue 5, 2020.
1577
Sen et al. World Journal of Pharmacy and Pharmaceutical Sciences
Chemical required: Magnesium Stearate
Apparatus required: Funnel, Clamp Stand, Beaker, Balance, Stirrer, Weight Box
Procedure: i) Supplied Magnesium Stearate granules are taken approximately 5g accurately
weighed.
ii) The funnel is properly fitted so that the tip of funnel should not be away from the pile. A
paper is placed below the funnel.
iii) Holding the funnel tip with thumb, the sample is poured into funnel.
iv) The height of the pipe (h) and the radius (r) of the base is measured after taking the thumb
out & keep the sample.
v) Same process is repeated by adding various concentration of glidant.
vi) The result was recorded.[10]
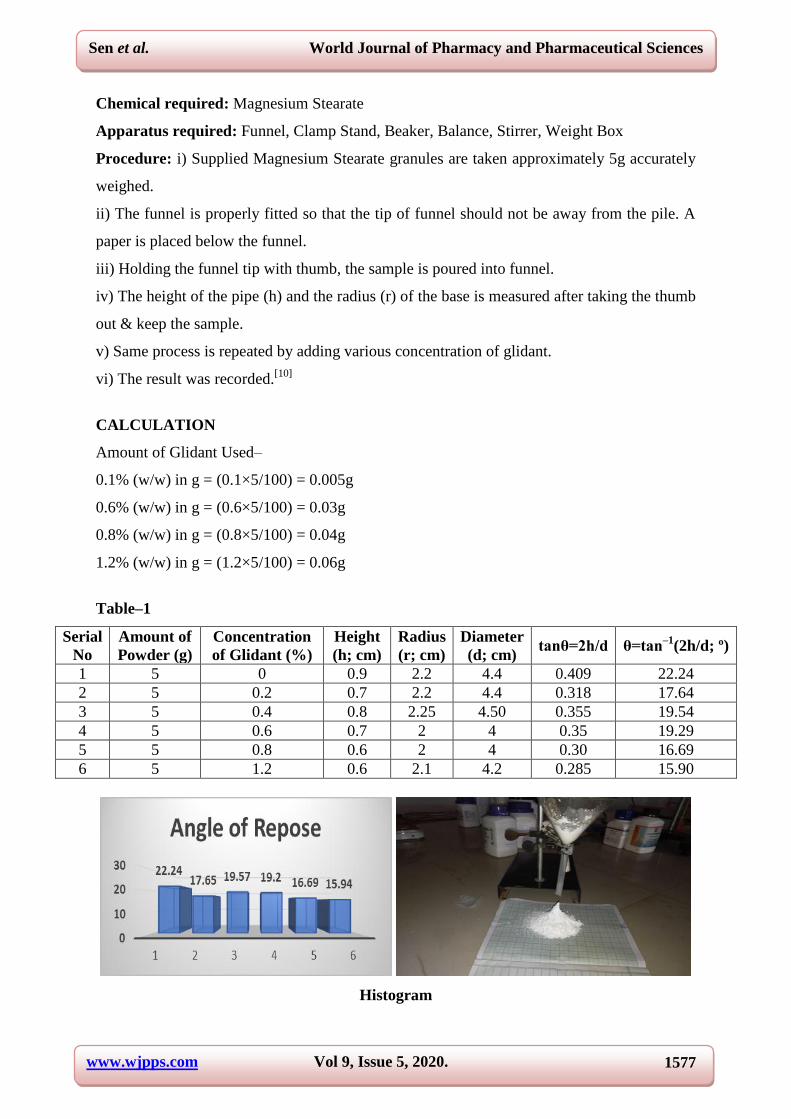
CALCULATION
Amount of Glidant Used‒
0.1% (w/w) in g = (0.1×5/100) = 0.005g
0.6% (w/w) in g = (0.6×5/100) = 0.03g
0.8% (w/w) in g = (0.8×5/100) = 0.04g
1.2% (w/w) in g = (1.2×5/100) = 0.06g
Table‒1
Serial
No
Amount of
Powder (g)
Concentration
of Glidant (%)
Height
(h; cm)
Radius
(r; cm)
Diameter
(d; cm) tanθ=2h/d θ=tan
‒1(2h/d; º)
1 5 0 0.9 2.2 4.4 0.409 22.24
2 5 0.2 0.7 2.2 4.4 0.318 17.64
3 5 0.4 0.8 2.25 4.50 0.355 19.54
4 5 0.6 0.7 2 4 0.35 19.29
5 5 0.8 0.6 2 4 0.30 16.69
6 5 1.2 0.6 2.1 4.2 0.285 15.90
Histogram

www.wjpps.com Vol 9, Issue 5, 2020.
1578
Sen et al. World Journal of Pharmacy and Pharmaceutical Sciences
Table 2.
Angle of Repose in Degree Flow Properties
θ<25º Excellent
θ=25‒30º Good
θ=30‒40º Passable/Average
θ>40º Bad
RESULT
The sample was mix concentration various concentration of glidant & most of the exhibits
angle of repose is below 25º. Hence flow is excellent.
CONCLUSION
A smooth cone is produced for each solid powder having height of cone (h) and a radius (r)
of diameter of the cone produced when flowing from a conical funnel on a smooth surface
producing and angle of repose (θ)=tan‒1
(2h/d; º). This indicates the flow property of the solid
powder and Hausner’s Ratio & Carr Index by bulk density & tapped density represents the
flow characteristics. Angle of Repose depends upon the cohesive forces of the particles.
Frictional forces are measured and maximum angle formed between the surface of a pile of
powder and horizontal surface. Angle of Repose is high in case of the powder which have
rough and irregular surface. Angle of Repose decreases to certain extent when we use
lubricants in less amount. In excess quantity of lubricant increases the Angle of Repose.
Angle of Repose 25º=powder flows smoothly and greater than 40º=does not flow. Hausner’s
Ratio H=ρT/ρB; value greater than 1.5 indicates poor flow (33% Carr Index), value less than
1.25 indicates good flow (20% Carr Index), value in between 1.25 & 1.5=added glidant
normally improves flow. Bulk Density/Apparent Density/Volumetric Density is ρB=M/V;
where M=weight of powder, V=volume of powder. Tapped Density is ρT=M/Vt; where
M=weight of powder, Vt=minimum volume of occupied after tapping. Bulk Density
(Vb)=Mass/Bulk Volume. Tapped Density (Vt)=Mass/Tapped Volume. Hausner’s
Ratio=ρT/ρB. Carr index (I)=[Tapped Density‒Bulk Density]/Tapped Density×100
REFERENCE
1. Mehta, A.; Barker, G. C. "The dynamics of sand". Reports on Progress in Physics, 1994;
57(4): 383.
2. Nichols, E. L.; Franklin, W. S. The Elements of Physics Macmillan, 1898; 1: 101. LCCN
03027633.
3. Glover, T. J. Pocket Ref. Sequoia Publishing, 1995. ISBN 978‒1885071002.
www.wjpps.com Vol 9, Issue 5, 2020.
1579
Sen et al. World Journal of Pharmacy and Pharmaceutical Sciences
4. Ileleji, K. E. "The angle of repose of bulk corn stover particles". Powder Technology,
2008; 187(2): 110–118.
5. Lobo‒Guerrero, Sebastian. "Influence of pile shape and pile interaction on the crushable
behavior of granular materials around driven piles: DEM analyses" (em en). Granular
Matter, 2007; 9(3–4): 241.
6. Kanig, Joseph L.; Lachman, Leon; Lieberman, Herbert A. The Theory and Practice of
Industrial Pharmacy. Philadelphia: Lea & Febiger, 1986; 3.
7. Beddow, J. K. "Professor Dr. Henry H. Hausner, 1900–1995." Particle & Particle
Systems Characterization, 1995; 12: 213.
8. R.O. Grey and J.K. Beddow "On the Hausner Ratio and its relationship to some
properties of metal powders" Powder Technology, 1969; 2(6): 323‒326.
9. Q. Li et al. "Interparticle van der Waals force in powder flowability and compactibility"
International Journal of Pharmaceutics, 2004; 280(1‒2): 77‒93.
10. C. Conesa et al. "Characterization of Flow Properties of Powder Coatings Used in the
Automotive Industry" Kona, 2004; 22: 94‒106.
11. S.L. Rough, D.I. Wilson and D.W. York "Effect of solids formulation on the manufacture
of high shear mixer agglomerates" Adv. Powder Technol., 2005; 16: 145‒169.