Artigo RBGF
13
Revista Brasileira de Geof´ ısica (2013) 31(3) : 413-425 © 2013 So ciedade Brasileira de Geof´ ısica ISSN 0102-261X www.scielo.br/rbg CLIMATOLOGY OF EXTREME RAINFALL EVENTS IN EASTERN AND NORTHERN SANTA CATARINA STATE, BRAZIL: PRESENT AND FUTURE CLIMATE Andr´ e Bec ker Nun es and Gilson Carlos da Silva ABSTRACT. The eastern region of Santa Catarina State (Brazil) has an important history of natural disasters due to extreme rainfall events. Floods and landslides are enhancedby local features such as orography and urbanization: the replacement of natural surface coverage causing more sur face runoff and, hence, flooding. Thus, studies of this type of events – which directly influence life in the towns – take on increasing importance. This work makes a quantitative analysis of occurrences of extreme rainfall events in the eastern and northern regions of Santa Catarina State in the last 60 years, through individual analysis, considering the history of floods in each selected town, as well as an estimate through to the end of century following regional climate modeling. A positive linear trend, in most of the towns studied, was observed in the results, indicating greater frequency of these events in recent decades, and the HadRM3P climate model shows a heterogeneous increase of events for all towns in the period from 2071 to 2100. Keywords: floods, climate modeling, linear trend. RESUMO. A reg i˜ aolestedo Est adode Sant a Ca tar inatemum imp ort ant e his t´ oricode desas tresnaturaisocasiona dos por eventosextremos de preci pitac ¸ ˜ ao. In und ac ¸˜ oes e deslizamentos de terra s˜ ao potencializados pelo relevo acidentado e pela urbanizac ¸˜ ao das cidades da regi˜ ao: a v egetac ¸˜ ao nativa vem sendo removida acarretando um maior escoamento superficial e, consequentemente, em inundac ¸˜ oes. Desta forma, torna-se de suma importˆ ancia os estudos acerca deste tipo de evento que influencia diretamente a sociedade em geral. Neste trabalho ´ e realizada uma an´ alise quantitativa do n´ umero de even tos severos de pre cipitac ¸ ˜ ao ocorridos nas regi˜ oes leste e norte de Santa Catar ina dos ´ ultimos 60anos, por meio de uma an´ alise pontua l, consi deran do o hist´ orico de in undac ¸˜ oesde cadacidadeseleciona da, al´ em de uma proje c ¸˜ aopara o fim do s´ eculo de acordo com modelagem clim´ atica regional. Na an´alise dos resultados observou-se uma tendˆ encia linear positiva na maioria das cidades, indicando uma maior frequˆ encia deste tipo de evento nas ´ ultimas d´ ecadas, e o modelo clim´ atico HadRM3P mostra um aumento heterogˆ eneo no n´ umero de eventos para todas as cidades n o per´ ıodo de 2 071 a 210 0. Palavras-chave: inund ac ¸˜ oes, modelagem clim´ atica, tendˆ encia linear. Universidade Federal de Pelotas UFPEL, Post-Graduate Program in Meteorology PPGMET, Faculdade de Meteorologia, Campus Universit´ ario Cap˜ ao do Le˜ao s/n, Caixa Postal 354, 96010-900 Pelotas, RS, Brazil. Phone: +55(53) 3275-7328 – E-mails: [email protected]; [email protected]
Transcript of Artigo RBGF
7/26/2019 Artigo RBGF
http://slidepdf.com/reader/full/artigo-rbgf 1/13
Revista Brasileira de Geofısica (2013) 31(3) : 413-425
© 2013 So ciedade Brasileira de Geofısica
ISSN 0102-261X
www.scielo.br/rbg
CLIMATOLOGY OF EXTREME RAINFALL EVENTS IN EASTERN
AND NORTHERN SANTA CATARINA STATE, BRAZIL:
PRESENT AND FUTURE CLIMATE
Andre Becker Nunes and Gilson Carlos da Silva
ABSTRACT. The eastern region of Santa Catarina State (Brazil) has an important history of natural disasters due to extreme rainfall events. Floods and landslides
are enhancedby local features such as orography and urbanization: the replacement of natural surface coverage causing more surface runoff and, hence, flooding. Thus,
studies of this type of events – which directly influence life in the towns – take on increasing importance. This work makes a quantitative analysis of occurrences of
extreme rainfall events in the eastern and northern regions of Santa Catarina State in the last 60 years, through individual analysis, considering the history of floods in
each selected town, as well as an estimate through to the end of century following regional climate modeling. A positive linear trend, in most of the towns studied, was
observed in the results, indicating greater frequency of these events in recent decades, and the HadRM3P climate model shows a heterogeneous increase of events for
all towns in the period from 2071 to 2100.
Keywords: floods, climate modeling, linear trend.
RESUMO. A regiaolestedo Estadode Santa Catarinatemum importante historicode desastresnaturaisocasionados por eventos extremos de precipitacao. Inundacoes
e deslizamentos de terra sao potencializados pelo relevo acidentado e pela urbanizacao das cidades da regiao: a vegetacao nativa vem sendo removida acarretando um
maior escoamento superficial e, consequentemente, em inundacoes. Desta forma, torna-se de suma importancia os estudos acerca deste tipo de evento que influencia
diretamente a sociedade em geral. Neste trabalho e realizada uma analise quantitativa do numero de eventos severos de precipitac ao ocorridos nas regioes leste e norte
de Santa Catarina dos ultimos 60anos, por meio de uma analise pontual, considerando o historico de inundacoesde cadacidadeselecionada, alem de uma proje caopara
o fim do seculo de acordo com modelagem climatica regional. Na analise dos resultados observou-se uma tendencia linear positiva na maioria das cidades, indicandouma maior frequencia deste tipo de evento nas ultimas decadas, e o modelo climatico HadRM3P mostra um aumento heterogeneo no numero de eventos para todas as
cidades no perıodo de 2071 a 2100.
Palavras-chave: inundacoes, modelagem climatica, tendencia linear.
Universidade Federal de Pelotas UFPEL, Post-Graduate Program in Meteorology PPGMET, Faculdade de Meteorologia, Campus Universit ario Capao do Leao s/n,
Caixa Postal 354, 96010-900 Pelotas, RS, Brazil. Phone: +55(53) 3275-7328 – E-mails: [email protected]; [email protected]
7/26/2019 Artigo RBGF
http://slidepdf.com/reader/full/artigo-rbgf 2/13
414 CLIMATOLOGY OF EXTREME RAINFALLEVENTS IN EASTERN AND NORTHERN SANTA CATARINA STATE, BRAZIL: PRESENTAND FUTURE CLIMATE
INTRODUCTION
Disorders brought about by anomalous rainfall cause great harm
to society in general, especially in towns, given the greater ef-
fects of urbanizing factors. The change in surface coverage tends
to reduce the seepage of water into the soil, increasing surfacerunoff and consequently causing an accumulation of waters in the
lower regions of urban areas, characterizing flooding. Other fac-
tors, such as river floods, also lead to urban floods, thus amount-
ing to a spectrum of events of varying durations which may cause
disorders: events of either sudden or gradual flooding. Sudden
floods (also known as flash floods) are normally associated with
individual convective storms, of brief duration and great intensity,
and more characteristic of large cities, due to the impermeabil-
ity of the soil. Gradual flooding, on the other hand, is charac-
terized by daily rainfall rates that are not so high, but which ac-
cumulate continuously over a greater number of days, normallyassociated to meteorological systems of longer duration, such
as stationary, seasonal or climatic systems. Therefore, flooding
is always linked to extreme rainfall events. The literature con-
tains different methodologies for determining an extreme event,
such as those indicated, for example, in Doswell et al. (1996),
Brooks & Stensrud (2000), Schumacher & Johnson (2005) and
Teixeira & Satyamurty (2007). Here, extreme events will be de-
termined based on the track record of flooding in each town,
as in Da Silva & Nunes (2011a), considering the precipitation
accumulated over 15 days, given that one of the factors that in-
fluence the occurrence of rainfall is the quantity of water accumu-
lated in the soil.
The State of Santa Catarina displays an important history
of disorders related to extreme rainfall events, particularly in
the eastern region of the State, as verified by Marcelino et al.
(2004 and 2006) and Herrmann (2006) among others. As a re-
cent example, we may cite the torrential rains of November 2008,
which caused climatological records of rainfall in various towns
in the region in question (Pinheiro & Severo, 2010). The northern
and eastern region of Santa Catarina State is home to important
towns for the Brazilian economy, such as Blumenau, Joinville and
Florianopolis; these two latter are the most populous in the State.
Moreover, due to economic development in various sectors of the
economy, the North of Santa Catarina State is one of the regions
with the highest GNP in Brazil (IBGE, 2010).
Just as analyzing the trend of severe events is important to
find out whether such events are becoming more frequent, anal-
ysis of a future scenario may provide scientific support for bet-
ter town planning. Some studies, such as, for instance, Alexan-
der et al. (2006), Groisman et al. (1999), Tebaldi et al. (2006)
and indicate an increase in the number of severe events in overall
terms, which is also being verified in the south and southeastern
regions of the country (Marengo et al., 2007; Marengo, 2008;
Milly et al., 2002 and 2005, Valverde & Marengo, 2010). Thus,
this work will also assess the behavior of this type of event for
the period from 2071 to 2100, according to theHadRM3P regional
climate model (Marengo et al., 2009), thus making a climatic
analysis of extreme rainfall events in the northern and eastern
region of the State for the present and future climate.
METHODOLOGY
The methodology employed to obtain the variation over time
(trend) of extreme events may be organized into four steps: col-
lecting cases of flooding, associating data of rainfall observed in
each case of flooding, obtaining the thresholds that identify the
extreme events occurring over recent decades, and quantify-
ing the events (Medin et al., 2010; Da Silva et al., 2010). The
cases of flooding were obtained from various sources, such as
the State Civil Defense, decrees of an emergency situation or
state of public calamity, from scientific works such as those of
Silva (2003), Herrmann (2006), Silveira (2008), Herrmann &
Mendonca (2007) and Silveira & Kobiyama (2007), besides lo-
cal news items published in newspapers (such as ‘Diario Catari-
nense’ and ‘A Notıcia’), and from the State Databank of Hydric
Resources. According to this bibliographic research, 18 towns
were selected, displaying a good track record of flooding, as
shown in Figure 1.
Present Climate
After collecting the cases of flooding, daily rainfall data were
obtained for rainfall preceding the events of flooding, to deter-
mine an average numerical value (rate) that may identify extreme
events. The data, referring to the period from 1951 through 2010,
were obtained from rain gauge stations of the ANA (Agencia
Nacional de Aguas), using the site http://hidroweb.ana.gov.br,
after identifyingt the stations with data available in the region.
Missing data from the stations amounted to, on average below
2% of the total (Da Silva, 2011). Two types of threshold were
obtained: the first with the aim of capturing only events of sud-
den flooding caused by transient systems, representing the rain-
fall necessary to potentially produce flooding in a short period (up
to 4 days before the flooding) of accumulated rainfall; the second
indicates the average rainfall accumulated in the 15 days prior to
the date of the flowing, and captures the short duration storms in
sequence or events that may cause rainfall at rates that are not so
Revista Brasileira de Geofısica, Vol. 3 1(3), 2013
7/26/2019 Artigo RBGF
http://slidepdf.com/reader/full/artigo-rbgf 3/13
NUNES AB & DA SILVA GC 415
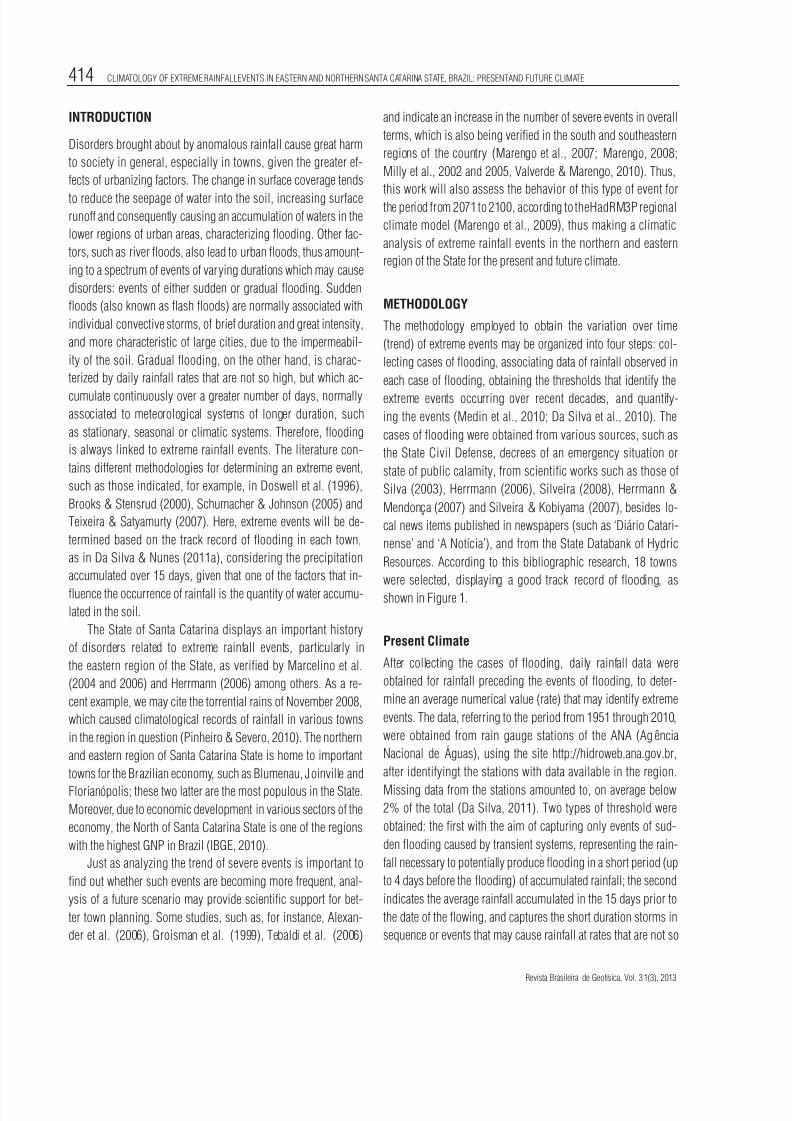
Figure1 – Location and numbering of the towns studied (inside the rectangle): 1 – Alfredo Wagner; 2 – Ararangua; 3 – Benedito
Novo; 4 – Blumenau; 5 – Brusque; 6 – Criciuma; 7 – Florianopolis; 8 – Ilhota; 9 – Ituporanga; 10 – Joinville; 11 – Mafra; 12 –
Orleans; 13 – Porto Uniao; 14 – Rio do Sul; 15 – Santo Amaro da Imperatriz; 16 – Taio; 17 – Timbe do Sul; 18 – Tubarao.
high, but with a considerable accumulated value, on the surface
or inside the soil, over up to 15 days, which likewise tends to
cause flooding. The first threshold is determined based on the
rate (mm/day) that displays least standard deviation, that is to
say, the rate of least spreading, whereas the second is deter-
mined by the average rainfall accumulated in the 15 days preced-
ing the floods, according to Da Silva & Nunes (2001b, c). Thesetwo thresholds served to filter, from the rainfall data from 1951
through 2010, the extreme rainfall events analyzed in this work.
Here, what is addressed as cases of severe events is the number
of days under the influence of the severe event, to consider the
fact that a large volume of rainfall continues to interfere, either on
or under the surface of the soil, and thus its period of influence
is considered the same as the number of days of the threshold
(Da Silva, 2011).
Example of obtaining the first threshold
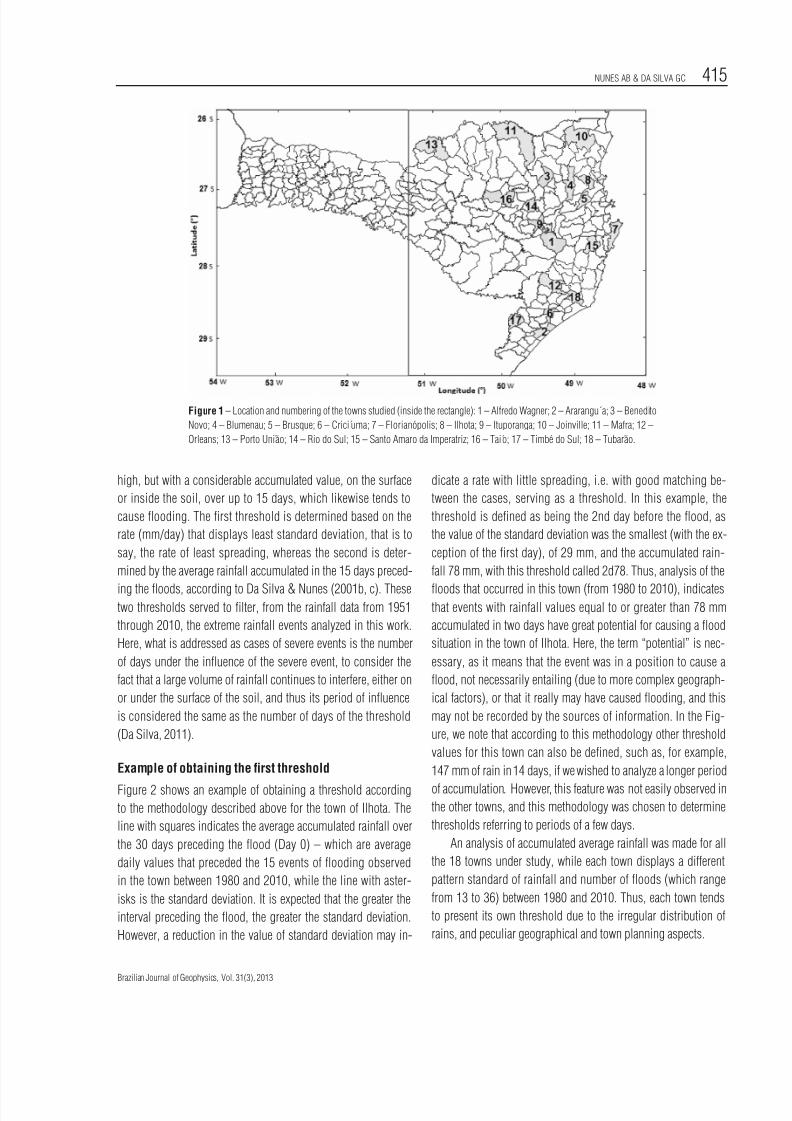
Figure 2 shows an example of obtaining a threshold according
to the methodology described above for the town of Ilhota. The
line with squares indicates the average accumulated rainfall over
the 30 days preceding the flood (Day 0) – which are average
daily values that preceded the 15 events of flooding observed
in the town between 1980 and 2010, while the line with aster-
isks is the standard deviation. It is expected that the greater the
interval preceding the flood, the greater the standard deviation.
However, a reduction in the value of standard deviation may in-
dicate a rate with little spreading, i.e. with good matching be-
tween the cases, serving as a threshold. In this example, the
threshold is defined as being the 2nd day before the flood, as
the value of the standard deviation was the smallest (with the ex-
ception of the first day), of 29 mm, and the accumulated rain-
fall 78 mm, with this threshold called 2d78. Thus, analysis of the
floods that occurred in this town (from 1980 to 2010), indicatesthat events with rainfall values equal to or greater than 78 mm
accumulated in two days have great potential for causing a flood
situation in the town of Ilhota. Here, the term “potential” is nec-
essary, as it means that the event was in a position to cause a
flood, not necessarily entailing (due to more complex geograph-
ical factors), or that it really may have caused flooding, and this
may not be recorded by the sources of information. In the Fig-
ure, we note that according to this methodology other threshold
values for this town can also be defined, such as, for example,
147 mm of rain in 14 days, if we wished to analyze a longer period
of accumulation. However, this feature was not easily observed inthe other towns, and this methodology was chosen to determine
thresholds referring to periods of a few days.
An analysis of accumulated average rainfall was made for all
the 18 towns under study, while each town displays a different
pattern standard of rainfall and number of floods (which range
from 13 to 36) between 1980 and 2010. Thus, each town tends
to present its own threshold due to the irregular distribution of
rains, and peculiar geographical and town planning aspects.
Brazilian Journal of Geophysics, Vol. 31(3), 2013
7/26/2019 Artigo RBGF
http://slidepdf.com/reader/full/artigo-rbgf 4/13
416 CLIMATOLOGY OF EXTREME RAINFALLEVENTS IN EASTERN AND NORTHERN SANTA CATARINA STATE, BRAZIL: PRESENTAND FUTURE CLIMATE
Figure 2 – Example of the rainfall threshold with potential to cause flooding, obtained for the town of Ilhota (SC). The line
with asterisks represents the standard deviation (mm) and the line with squares represents the accumulated rainfall (mm).
Future Climate
To analyze the behavior of severe events in the future climate,
future scenarios were used according to the HadRM3P regional
climate model, from the Hadley Centre, in the United Kingdom,
whose projections were made by the Centro de Ciencias do Sis-
tema Terrestre at the Instituto Nacional de Pesquisas Espaci-
ais (CCST/INPE) (Marengo et al., 2009). The simulations made
use of the PRECIS modeling system (Providing REgional Cli-
mates for Impacts Studies), which is being employed by vari-ous countries for regional climate forecasts (for example, Tadross
et al., 2005; Rupa Kumar et al., 2006; Xu et al., 2006a, b; Is-
lam & Rehman, 2006; Zhang et al., 2006). In Brazil, a sys-
tem has been implemented to study the future climate (2071-
2100) and impacts of climate changes, the CREAS (Regional
Climate Change Scenarios for South America), which was fi-
nanced by MMA/BIRD/GEF/CNPq (PROBIO Project), by the Na-
tional Program of Climate Changes of the Ministry of Science,
Technology and Innovation (MCTI), by the UK Global Opportunity
Fund – GOF Project Using Regional Climate Change Scenarios
for Studies on Vulnerability and Adaptation in Brazil and South
America, and by the GOD-Dangerous Climate Change (DCC).
The HadRM3P model has a spatial scale of 50 km and sur-
rounding conditions generated by the general circulation model
(global scale) HadAM3P, also from the Hadley Center, in which
the principal forcing factors for the simulation of the period
from 1961 to 1990 (baseline) are the surface temperature of
the sea and the cover of sea ice. To simulate the future scenar-
ios, HadAM3P adds to the baseline conditions trends generated
by the coupled HadCM3 model (Gordon et al., 2000), whose
atmospheric components consider, for the baseline case, ob-
served data on emissions of greenhouse gases and, for the case
of future scenarios, simulated emissions from the SRES (Special
Reports for Emissions Scenarios). Validation of the model in rela-
tionto rainfallfor the present(1961-1990) wasperformed in South
America (Alves, 2007; Marengo et al., 2009; Soares and Marengo,
2008), making a comparison with observed data to ensure the
skill to simulate the trend of climate extremes for the future.
The CREAS generates high resolution scenarios for South Amer-ica, taking into account the “GEE” (greenhouse gases) and SO2
emitted, based on two scenarios from the United Nations (UNO)
Intergovernmental Panel on Climate Changes: A2, pessimistic
and B2, optimistic. The concentration of CO2 in SRES A2 is ap-
proximately 300 ppm during the decade of 1980, and approxi-
mately 700 ppm during the decade of 2080, while concentrations
of NO2 are in the order of 280 and 400 ppb, respectively (Soares,
2008). Besides the uncertainties inherent to weather numerical
modelling, climate modelling, especially those which estimate
projections for a long period of time, such as decades, have ad-
ditional sources of uncertainties, such as the variations (and dif-
ficulties in measurements) of emissions of greenhouse gases and
the methods of mitigation, both functions of the socio-economic
development of nations, besides the inherent complexity of the
of the climatic system dynamics (Soares, 2008).
Identification of severe events in the rainfall data of the fu-
ture scenario will be done by employing the thresholds obtained
from the present climate. Here, we shall consider climate change
according to scenario A2 – considered in this work as more
Revista Brasileira de Geofısica, Vol. 3 1(3), 2013
7/26/2019 Artigo RBGF
http://slidepdf.com/reader/full/artigo-rbgf 5/13
NUNES AB & DA SILVA GC 417
realistic than the optimistic scenario (more information on the
different scenarios in Pesquero (2009)) – and will be obtained
by the ratio between the data from scenario A2 (2071-2100)
and the baseline (1960-1990). Finally, the number of events in
the future climate will be determined according to the productbetween the term referring to climate change and the number of
events observed in the present (Da Silva & Nunes, 2011c).
RESULTS
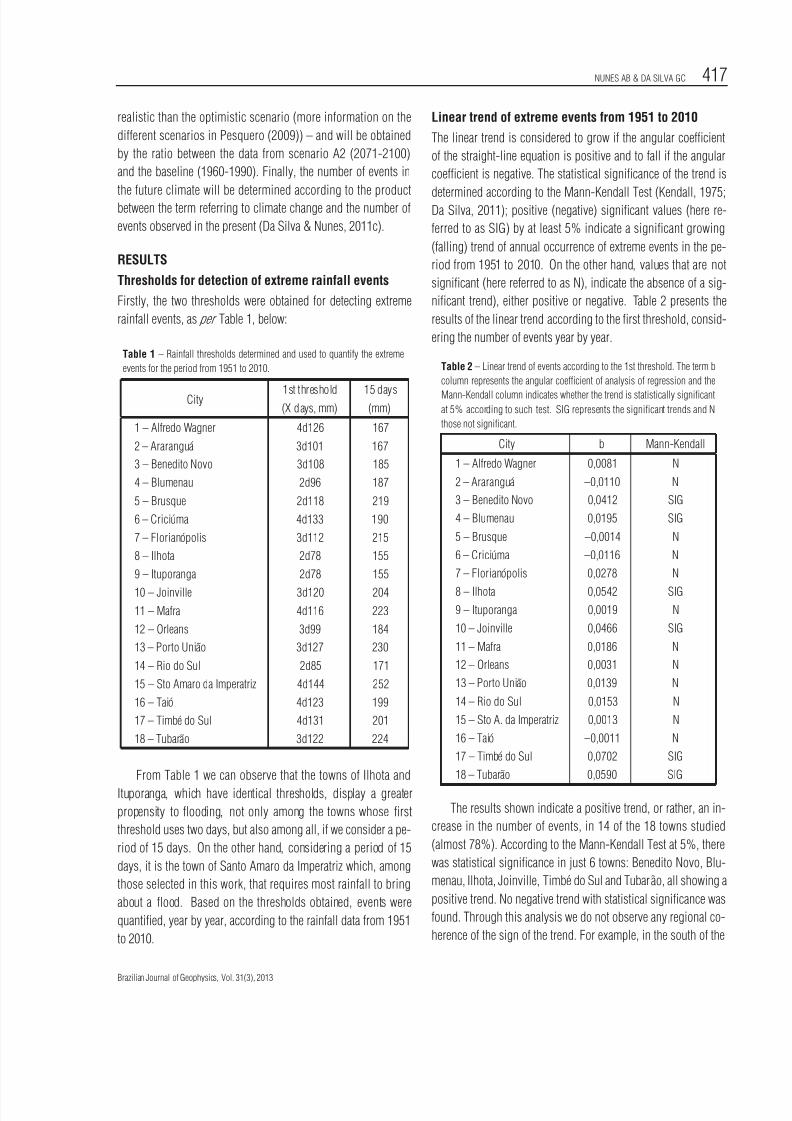
Thresholds for detection of extreme rainfall events
Firstly, the two thresholds were obtained for detecting extreme
rainfall events, as per Table 1, below:
Table 1 – Rainfall thresholds determined and used to quantify the extreme
events for the period from 1951 to 2010.
City 1st threshold 15 days(X days, mm) (mm)
1 – Alfredo Wagner 4d126 167
2 – Ararangua 3d101 167
3 – Benedito Novo 3d108 185
4 – Blumenau 2d96 187
5 – Brusque 2d118 219
6 – Criciuma 4d133 190
7 – Florianopolis 3d112 215
8 – Ilhota 2d78 155
9 – Ituporanga 2d78 155
10 – Joinville 3d120 204
11 – Mafra 4d116 223
12 – Orleans 3d99 184
13 – Porto Uniao 3d127 230
14 – Rio do Sul 2d85 171
15 – Sto Amaro da Imperatriz 4d144 252
16 – Taio 4d123 199
17 – Timbe do Sul 4d131 201
18 – Tubarao 3d122 224
From Table 1 we can observe that the towns of Ilhota and
Ituporanga, which have identical thresholds, display a greater
propensity to flooding, not only among the towns whose first
threshold uses two days, but also among all, if we consider a pe-
riod of 15 days. On the other hand, considering a period of 15
days, it is the town of Santo Amaro da Imperatriz which, among
those selected in this work, that requires most rainfall to bring
about a flood. Based on the thresholds obtained, events were
quantified, year by year, according to the rainfall data from 1951
to 2010.
Linear trend of extreme events from 1951 to 2010
The linear trend is considered to grow if the angular coefficient
of the straight-line equation is positive and to fall if the angular
coefficient is negative. The statistical significance of the trend is
determined according to the Mann-Kendall Test (Kendall, 1975;Da Silva, 2011); positive (negative) significant values (here re-
ferred to as SIG) by at least 5% indicate a significant growing
(falling) trend of annual occurrence of extreme events in the pe-
riod from 1951 to 2010. On the other hand, values that are not
significant (here referred to as N), indicate the absence of a sig-
nificant trend), either positive or negative. Table 2 presents the
results of the linear trend according to the first threshold, consid-
ering the number of events year by year.
Table 2 – Linear trend of events according to the 1st threshold. The term b
column represents the angular coefficient of analysis of regression and the
Mann-Kendall column indicates whether the trend is statistically significantat 5% according to such test. SIG represents the significant trends and N
those not significant.
City b Mann-Kendall
1 – Alfredo Wagner 0,0081 N
2 – Ararangua –0,0110 N
3 – Benedito Novo 0,0412 SIG
4 – Blumenau 0,0195 SIG
5 – Brusque –0,0014 N
6 – Criciuma –0,0116 N
7 – Florianopolis 0,0278 N
8 – Ilhota 0,0542 SIG
9 – Ituporanga 0,0019 N
10 – Joinville 0,0466 SIG
11 – Mafra 0,0186 N
12 – Orleans 0,0031 N
13 – Porto Uniao 0,0139 N
14 – Rio do Sul 0,0153 N
15 – Sto A. da Imperatriz 0,0013 N
16 – Taio –0,0011 N
17 – Timbe do Sul 0,0702 SIG
18 – Tubarao 0,0590 SIG
The results shown indicate a positive trend, or rather, an in-
crease in the number of events, in 14 of the 18 towns studied
(almost 78%). According to the Mann-Kendall Test at 5%, there
was statistical significance in just 6 towns: Benedito Novo, Blu-
menau, Ilhota, Joinville, Timbe do Sul and Tubarao, all showing a
positive trend. No negative trend with statistical significance was
found. Through this analysis we do not observe any regional co-
herence of the sign of the trend. For example, in the south of the
Brazilian Journal of Geophysics, Vol. 31(3), 2013
7/26/2019 Artigo RBGF
http://slidepdf.com/reader/full/artigo-rbgf 6/13
418 CLIMATOLOGY OF EXTREME RAINFALLEVENTS IN EASTERN AND NORTHERN SANTA CATARINA STATE, BRAZIL: PRESENTAND FUTURE CLIMATE
State two towns were found with a growing and significant trend
(Timbe do Sul and Tubarao), and two towns with a falling trend
(Criciuma and Ararangua), yet not significant.
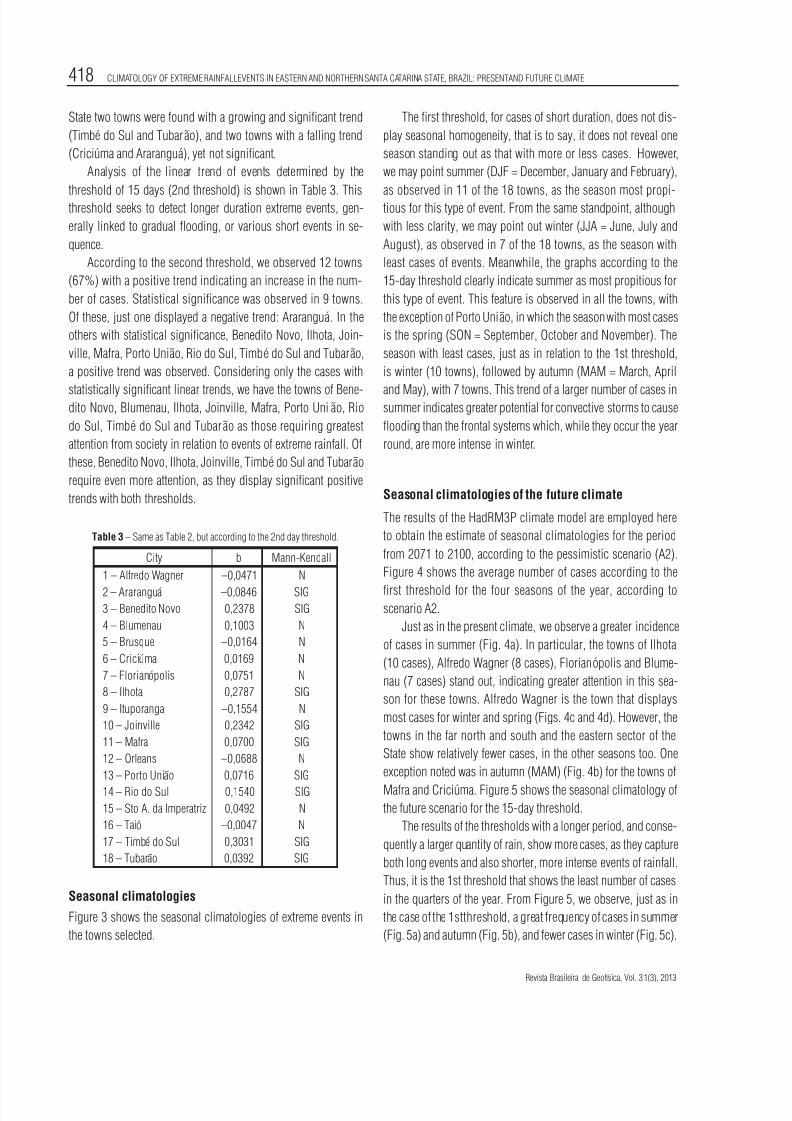
Analysis of the linear trend of events determined by the
threshold of 15 days (2nd threshold) is shown in Table 3. Thisthreshold seeks to detect longer duration extreme events, gen-
erally linked to gradual flooding, or various short events in se-
quence.
According to the second threshold, we observed 12 towns
(67%) with a positive trend indicating an increase in the num-
ber of cases. Statistical significance was observed in 9 towns.
Of these, just one displayed a negative trend: Ararangua. In the
others with statistical significance, Benedito Novo, Ilhota, Join-
ville, Mafra, Porto Uniao, Rio do Sul, Timbe do Sul and Tubarao,
a positive trend was observed. Considering only the cases with
statistically significant linear trends, we have the towns of Bene-dito Novo, Blumenau, Ilhota, Joinville, Mafra, Porto Uniao, Rio
do Sul, Timbe do Sul and Tubarao as those requiring greatest
attention from society in relation to events of extreme rainfall. Of
these, Benedito Novo, Ilhota, Joinville, Timbe do Sul and Tubarao
require even more attention, as they display significant positive
trends with both thresholds.
Table 3 – Same as Table 2, but according to the 2nd day threshold.
City b Mann-Kendall
1 – Alfredo Wagner –0,0471 N
2 – Ararangua –0,0846 SIG3 – Benedito Novo 0,2378 SIG
4 – Blumenau 0,1003 N
5 – Brusque –0,0164 N
6 – Criciuma 0,0169 N
7 – Florianopolis 0,0751 N
8 – Ilhota 0,2787 SIG
9 – Ituporanga –0,1554 N
10 – Joinville 0,2342 SIG
11 – Mafra 0,0700 SIG
12 – Orleans –0,0688 N
13 – Porto Uniao 0,0716 SIG
14 – Rio do Sul 0,1540 SIG
15 – Sto A. da Imperatriz 0,0492 N
16 – Taio –0,0047 N
17 – Timbe do Sul 0,3031 SIG
18 – Tubarao 0,0392 SIG
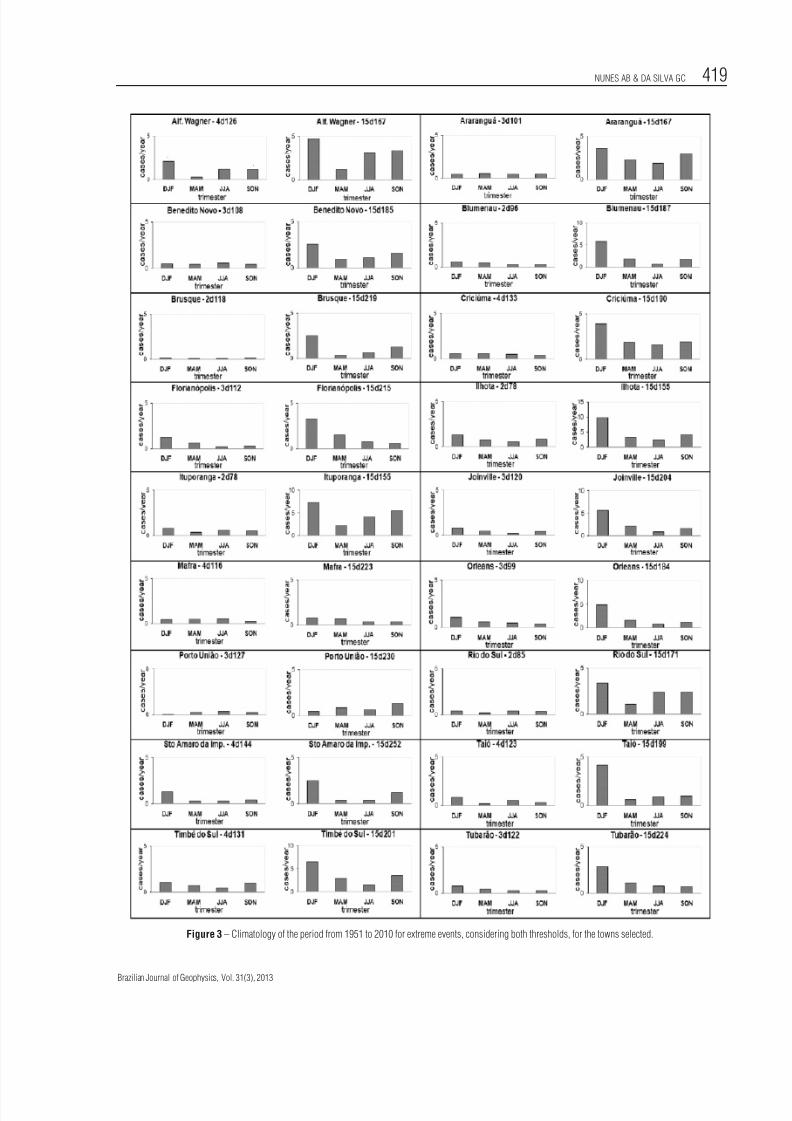
Seasonal climatologies
Figure 3 shows the seasonal climatologies of extreme events in
the towns selected.
The first threshold, for cases of short duration, does not dis-
play seasonal homogeneity, that is to say, it does not reveal one
season standing out as that with more or less cases. However,
we may point summer (DJF = December, January and February),
as observed in 11 of the 18 towns, as the season most propi-tious for this type of event. From the same standpoint, although
with less clarity, we may point out winter (JJA = June, July and
August), as observed in 7 of the 18 towns, as the season with
least cases of events. Meanwhile, the graphs according to the
15-day threshold clearly indicate summer as most propitious for
this type of event. This feature is observed in all the towns, with
the exception of Porto Uniao, in which the season with most cases
is the spring (SON = September, October and November). The
season with least cases, just as in relation to the 1st threshold,
is winter (10 towns), followed by autumn (MAM = March, April
and May), with 7 towns. This trend of a larger number of cases insummer indicates greater potential for convective storms to cause
flooding than the frontal systems which, while they occur the year
round, are more intense in winter.
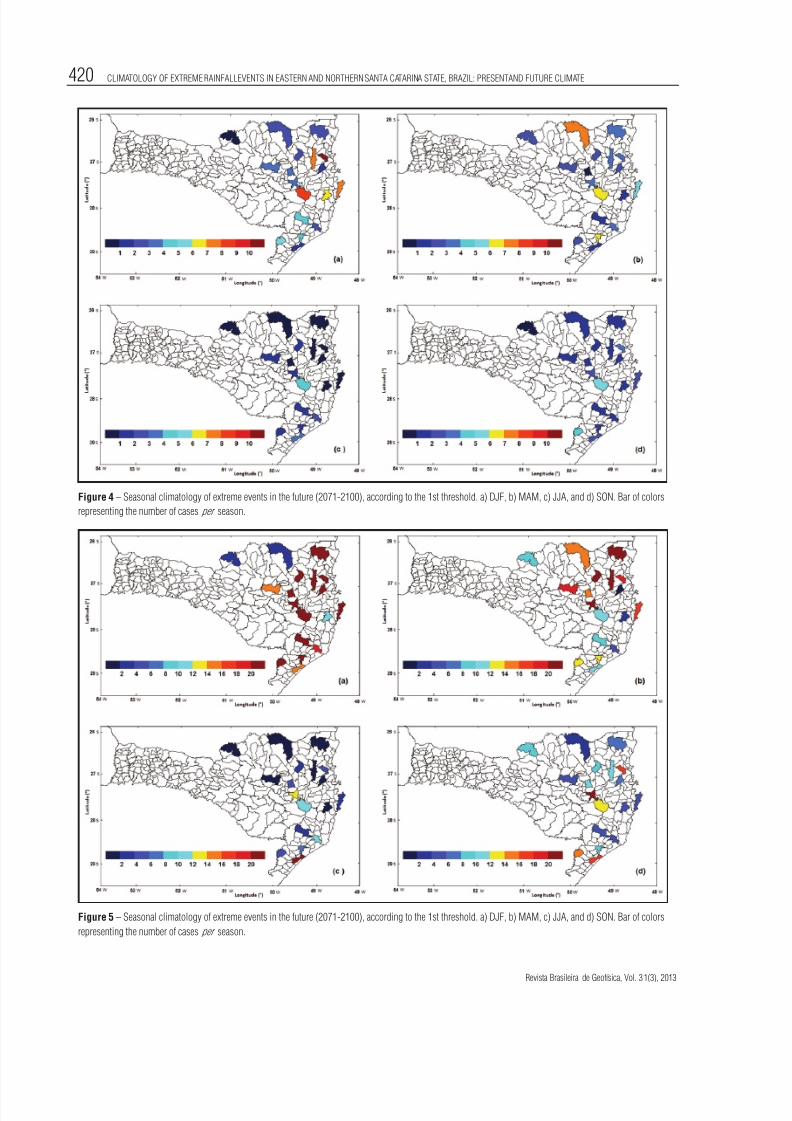
Seasonal climatologies of the future climate
The results of the HadRM3P climate model are employed here
to obtain the estimate of seasonal climatologies for the period
from 2071 to 2100, according to the pessimistic scenario (A2).
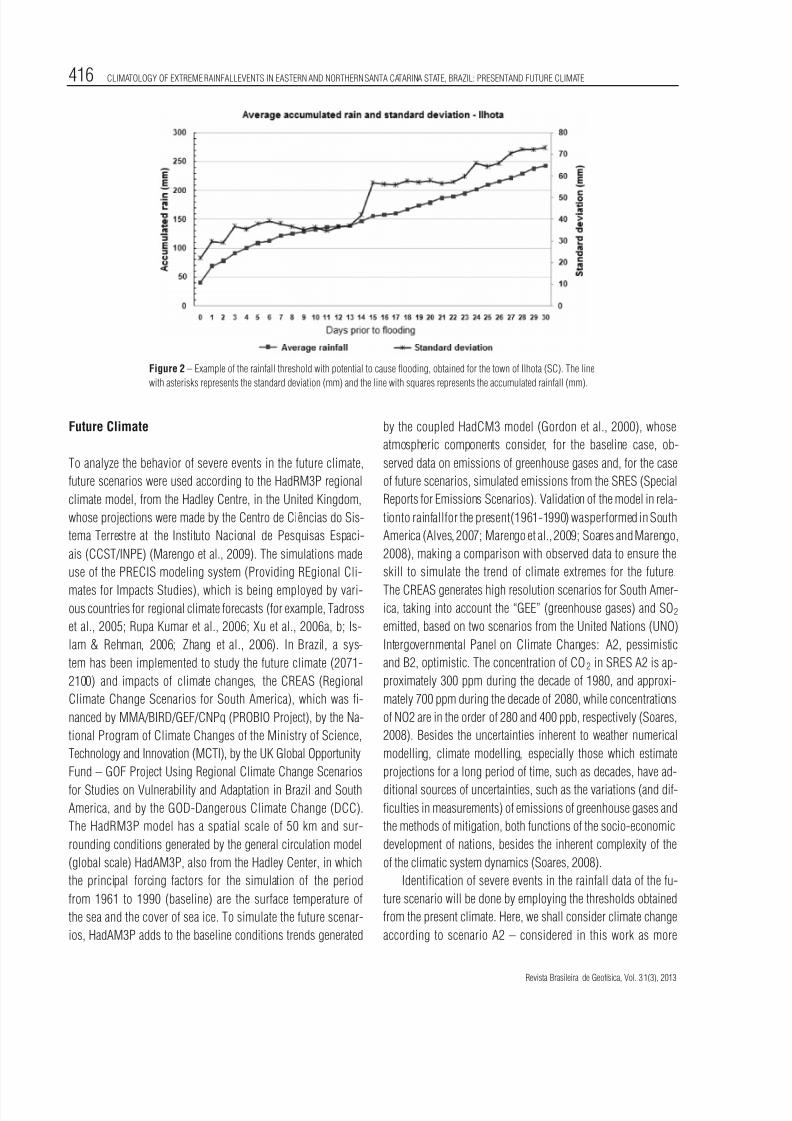
Figure 4 shows the average number of cases according to the
first threshold for the four seasons of the year, according toscenario A2.
Just as in the present climate, we observe a greater incidence
of cases in summer (Fig. 4a). In particular, the towns of Ilhota
(10 cases), Alfredo Wagner (8 cases), Florianopolis and Blume-
nau (7 cases) stand out, indicating greater attention in this sea-
son for these towns. Alfredo Wagner is the town that displays
most cases for winter and spring (Figs. 4c and 4d). However, the
towns in the far north and south and the eastern sector of the
State show relatively fewer cases, in the other seasons too. One
exception noted was in autumn (MAM) (Fig. 4b) for the towns of
Mafra and Criciuma. Figure 5 shows the seasonal climatology of
the future scenario for the 15-day threshold.
The results of the thresholds with a longer period, and conse-
quently a larger quantity of rain, show more cases, as they capture
both long events and also shorter, more intense events of rainfall.
Thus, it is the 1st threshold that shows the least number of cases
in the quarters of the year. From Figure 5, we observe, just as in
the case of the 1stthreshold, a great frequency of cases in summer
(Fig. 5a) and autumn (Fig. 5b), and fewer cases in winter (Fig. 5c).
Revista Brasileira de Geofısica, Vol. 3 1(3), 2013
7/26/2019 Artigo RBGF
http://slidepdf.com/reader/full/artigo-rbgf 7/13
NUNES AB & DA SILVA GC 419
Figure 3 – Climatology of the period from 1951 to 2010 for extreme events, considering both thresholds, for the towns selected.
Brazilian Journal of Geophysics, Vol. 31(3), 2013
7/26/2019 Artigo RBGF
http://slidepdf.com/reader/full/artigo-rbgf 8/13
420 CLIMATOLOGY OF EXTREME RAINFALLEVENTS IN EASTERN AND NORTHERN SANTA CATARINA STATE, BRAZIL: PRESENTAND FUTURE CLIMATE
Figure 4 – Seasonal climatology of extreme events in the future (2071-2100), according to the 1st threshold. a) DJF, b) MAM, c) JJA, and d) SON. Bar of colors
representing the number of cases per season.
Figure 5 – Seasonal climatology of extreme events in the future (2071-2100), according to the 1st threshold. a) DJF, b) MAM, c) JJA, and d) SON. Bar of colors
representing the number of cases per season.
Revista Brasileira de Geofısica, Vol. 3 1(3), 2013
7/26/2019 Artigo RBGF
http://slidepdf.com/reader/full/artigo-rbgf 9/13
NUNES AB & DA SILVA GC 421
Just as in the case of the 1st threshold, we do not easily identify
any spatial homogeneity, that is to say, towns close to one an-
other display different behaviors. Moreover, it must be taken into
account that the numerical models display reduced trends of rep-
resentation of the extreme rains simulated; which in general allnumerical models do, especially in regions of irregular topogra-
phy, as seen, for example, in (Guimaraes et al., 2006).
From Figures 3, 4 and 5 we note that the estimate of the fu-
ture climate may also generate a seasonal change of behavior of
intense rains in some towns, such as, for instance, in Joinville,
where the maximum migrates from summer (Fig. 3) to autumn
(Fig. 4b). In Rio do Sul, the winter season will cease to be one
of the most active and will become that of least frequency. In the
town of Tubarao the winter, which has the least frequency, be-
comes just like the summer, one of the most active, with the
exception of the cases of the 1st threshold. Similarly the townof Taio shows a change in the pattern of intense rains; autumn
will have the greatest occurrence, instead of summer, mainly in
relation to more prolonged events of rain. This seasonal change
will probably be a consequence of seasonal changes in the
behavior of atmospheric phenomena that generate this type of
event, such as convective systems and/or frontal systems. This
may be verified in Valverde and Marengo (2010), where changes
were identified in the pattern of general circulation of the atmo-
sphere for the period of 2071 to 2100, according to global cli-
matic modelling.
In general, the results of the climatic model accompany thetrend observed in the present climate: the greatest incidence of
cases of extreme rainfall is still foreseen for the summer. In addi-
tion, a complementary fact, and no less important, is how much
the frequency of cases should increase according to the future
scenario. In this regard, Figure 6 displays the intensity of sea-
sonal climate variation (or change) of the number of cases ac-
cording to the 1st threshold. Here, the intensity of the variation
is shown in the following way: 0 for values close to zero (with-
out considerable importance); 50 for a variation of up to 50%;
100 for variations of up to 100%, and 100+ for variations greater
than 100%. We note, thus, than in no towns was there a reduction(at least considerable) in the number of cases, in any season of
the year.
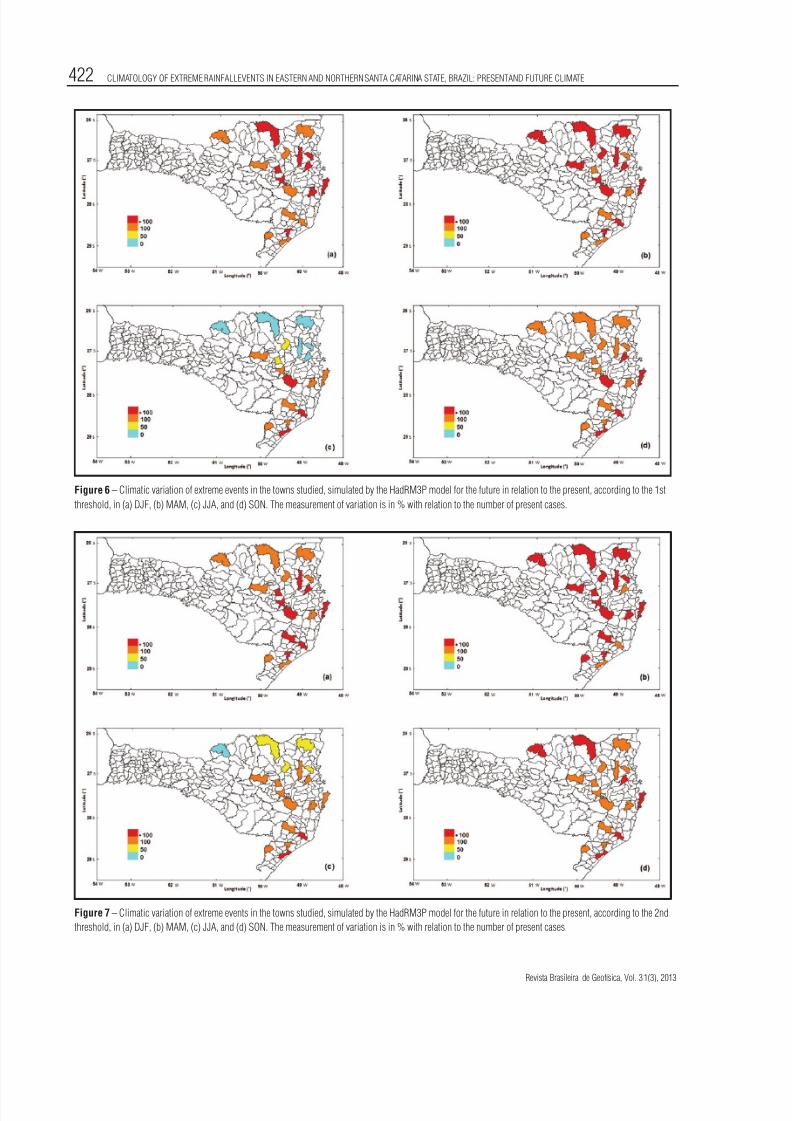
From Figure 6 we note that the season with the greatest
change, or rather, the greatest increase in the number of cases of
short duration (1st threshold) will be autumn (Fig. 6b), while the
season with least variation in relation to the present climate will
be winter (Fig. 6c). One regional characteristic worthy of note is
the northern part of the study area, where no considerable climate
change was found during winter. In general, we observe that the
changes foreseen will be intense, varying around 10%, that is to
say, the number of cases of events of short duration with potential
for flooding in the future tends to double in most towns. Figure 7
sets out the results of climate change using the 15-day threshold.In general, the results of the 15-day threshold match those
obtained by means of a threshold of a few days, that is to say,
autumn (Fig. 7b) was the season of most intense climate change,
and winter (Fig. 7c) with the least intense change. This time,
we note that situations with no considerable change are concen-
trated in just one: winter in the town of Porto Uniao. Just as in
Figure 6, here too we observe that, in general, the number of
cases tends to double; see the example of Florianopolis, where
the number of cases foreseen will have an increase of up to
100% in winter, and greater than 100% in the other seasons.
The results that employed the 15-day threshold bear out whatwas found for the first threshold: in all the towns we see an in-
crease in the frequency of extreme events foreseen in the future
vis-a-vis the present, agreeing with various studies (IPCC, 2007;
Marengo et el., 2007, 2009; Silva Dias et al., 2009). The sea-
son of the year that will have the greatest increase in the number
of events is autumn (MAM), although the summer quarter (DJF)
displays similar variations. In these seasons, the greater part of
the towns have an addition of over 100% in relation to the pe-
riod from 1951 to 2010. According to Soares & Marengo (2008),
IPCC scenario A2, according to the regional HadRM3P simulated
for a future period (2080-2089), showed a trend of low-level jetintensification in the region, which would favor the greater occur-
rence of intense rainfall systems in the south of Brazil.
CONCLUSION
The results presented in this work may be summarized in the
following points:
• A positive linear trend was identified, that is to say, an in-
crease in the frequency of extreme rainfall events in the
greater part of the towns studied in the eastern and north-
ern region of the State of Santa Catarina.
• According to Tables 2 and 3, of the 36 situations analyzed
(18 towns, 2 thresholds), we observe 26 with a positive
trend and 10 with a negative trend of extreme events dur-
ing the period from 1951 to 2010. However, on performing
the Mann-Kendall test to analyze statistical significance
at 5%, we note that, from these results, only 15 are sta-
tistically significant, and of these, just one is associated to
a negative trend.
Brazilian Journal of Geophysics, Vol. 31(3), 2013
7/26/2019 Artigo RBGF
http://slidepdf.com/reader/full/artigo-rbgf 10/13
422 CLIMATOLOGY OF EXTREME RAINFALLEVENTS IN EASTERN AND NORTHERN SANTA CATARINA STATE, BRAZIL: PRESENTAND FUTURE CLIMATE
Figure 6 – Climatic variation of extreme events in the towns studied, simulated by the HadRM3P model for the future in relation to the present, according to the 1st
threshold, in (a) DJF, (b) MAM, (c) JJA, and (d) SON. The measurement of variation is in % with relation to the number of present cases.
Figure 7 – Climatic variation of extreme events in the towns studied, simulated by the HadRM3P model for the future in relation to the present, according to the 2nd
threshold, in (a) DJF, (b) MAM, (c) JJA, and (d) SON. The measurement of variation is in % with relation to the number of present cases.
Revista Brasileira de Geofısica, Vol. 3 1(3), 2013
7/26/2019 Artigo RBGF
http://slidepdf.com/reader/full/artigo-rbgf 11/13
NUNES AB & DA SILVA GC 423
• That is to say, by means of a careful evaluation, we have
14 situations (Blumenau with the 1st threshold; Mafra,
Porto Uniao and Rio Sul with the 2nd threshold; Bene-
dito Novo, Ilhota, Joinville, Timbe do Sul and Tubarao
with both thresholds), indicating that extreme rainfallevents are more frequent, as against just one (Ararangua,
with the 2nd threshold), indicating a reduction in the
frequency of such events.
• In the greater part of the towns the seasonal climatolo-
gies, considering the two thresholds, for both the present
and future scenario, indicate summer (winter) as the
season most (least) likely to have the occurrence of ex-
treme events. However, in some cases there may be a
change in this pattern, such as Joinville, for instance,
where the most active season in relation to the events willcease to be summer, to be autumn in future.
• Considering specifically climate change, that is, the dif-
ference between the results of the future and the present,
the results indicate that in the greater part of towns the
number of extreme event tends to increase around 100%.
Autumn is the season where the greatest change will oc-
cur, and winter the season where the change will be least
noticeable, to the point that, in relation to cases of short
duration (1st threshold), the towns in the northern part of
the region will not display considerable changes. Suchresults show that the atmospheric phenomena associ-
ated with severe rainfall events in the future will display
a behavior different from the present, not only in rela-
tion to seasonality, but also with respect to the regions
of activity.
In this way, we conclude that this work presents results that
tend to stimulate, scientifically, society in general with relation
to extreme rainfall events in the present and future climate in the
eastern and northern region of Santa Catarina State; indicating
that preventive measures addressing flooding must be part of theshort and long-term planning of the towns in the areas under
study.
ACKNOWLEDGMENTS
The authors wish to thank CCST/INPE for the data generated
with the regional climate model. The first author thanks CAPES
(Coordenacao de Aperfeicoamento de Pessoal de Nıvel Superior)
for the master’s scholarship in the PPGMET program.
REFERENCES
ALEXANDER LV, ZHANG X, PETERSON TC, CAESAR J, GLEASON B,
KLEIN TA, HAYLOCK M, COLLINS D, TREWIN B, RAHIMZADEH F,
TAGIPOUR A, AMBENJE P, RUPA KK, REVADEKAR J, GRIFFITHS G,
VINCENT L, STEPHENSON D, BURN J, AGUILAR E, BRUNET M, TAY-LOR M, NEW M, ZHAI P, RUSTICUCCI M & VAZQUEZ-AGUIRRE JL.
2006. Global observed changes in daily climate extremes of tem-
perature and precipitation. J. Geophys. Res., 111: D05109, DOI:
10.1029/2005JD006290.
ALVES LM. 2007. Simulacoes da variabilidade do clima presente sobre
a America do Sul utilizando um modelo climatico regional. 92f. Disser-
tation (Master’s) – INPE, Sao Jose dos Campos.
BROOKS HE & STENSRUD DJ. 2000. Climatology of heavy rain events
in United Statesfrom hourly precipitationobservations. Mon. Wea. Rev.,
128: 1418–1431.
DA SILVA GC. 2011. Analise quantitativa de eventos extremos de pre-
cipitacao da regiao Leste e Norte de Santa Catarina. Master Disserta-
tion on Meteorology – Programa de Pos-Graduacao em Meteorologia,
Faculdade de Meteorologia, Universidade Federal de Pelotas, 2011.
104 pp.
DA SILVA GC & NUNES AB. 2011a. Analise de eventos extremos de
precipitacao com potencial de inundacao no leste de Santa Catarina:
estudo sazonal e de tendencia. Ciencia e Natura. Volume 33, Micro-
meteorologia – Edicao Suplementar. 251–254 pp.
DA SILVA GC & NUNES AB. 2011b. Analise quantitativa de eventos
extremos de precipitacao na cidade de Florianopolis – Parte 1: Clima
Presente (1951-2005). In: Encontro Sul-Brasileiro de Meteorologia, 4,
2011, Pelotas-RS. Proceedings... Pelotas: UFPel, 2011. CD-ROM.
DA SILVA GC & NUNES AB. 2011c. Mudancas climaticas dos eventos
severos de precipitacao no leste de Santa Catarina de acordo com o mo-
delo HADRM3P. In: Simposio Internacional de Climatologia, 4, 2011,
Joao Pessoa-PBProceedings... Joao Pessoa: SBMet, 2011. CD-ROM.
DA SILVA GC, MEDINA BL & NUNES AB. 2010. Variacao temporal de
eventos extremos de precipitacao nas cidades de Blumenau e Joinville
(SC). In: Encontro de Pos-Graduacao, 12, 2010, Pelotas-RS. Proceed-
ings... Pelotas: UFPel, 2010. CD-ROM.
DOSWELL CA III, BROOKS HE & MADDOX RA. 1996. Flash flood fore-casting: An ingredients-basedapproach. Wea. Forecasting, 11: 56–581.
GORDON C, COOPER C, SENIOR CA, BANKS H, GREGORYJM, JOHNS
TC, MITCHELL JFB & WOOD RA. 2000. The simulation of SST, sea
ice extent and ocean heat transports in a version of the Hadley Centre
coupled model without flux adjustments. Clim. Dyn., 16: 147–168.
GROISMAN PY, KARL TR, EASTERLING DR, KNIGHT RW, JAMASON
PF, HENNESSY KJ, SUPPIAH R, PAGE CM, WIBIG J, FORTUNIAK K,
RAZUVAEV VN, DOUGLAS A, FORLAND E & ZHAI PM. 1999. Changes
Brazilian Journal of Geophysics, Vol. 31(3), 2013
7/26/2019 Artigo RBGF
http://slidepdf.com/reader/full/artigo-rbgf 12/13
424 CLIMATOLOGY OF EXTREME RAINFALLEVENTS IN EASTERN AND NORTHERN SANTA CATARINA STATE, BRAZIL: PRESENTAND FUTURE CLIMATE
in the probability of heavy precipitation: important indicators of climatic
change. Clim Change, 42: 243–283.
GUIMARAES JM, DERECZYNSKY CP & CHOU SC. 2006. Avaliacao do
modelo Eta durante um episodio de chuvas intensas na regiao da Serra
do Mar. In: Congresso Brasileiro de Meteorologia, 14: 2006, Floria-nopolis. Proceedings... Florianopolis: SBMET, 2006. CD-ROM.
HERRMANN MLP (Org.). 2006. Atlas de Desastres Naturais do Estado
de Santa Catarina, IOESC, Florianopolis, 146 pp.
HERRMANN MLP & MENDONCA M. 2007. Desastres Naturais no Es-
tado de Santa Catarina durante o perıodo 1980 a 2004: Inundacoes e
estiagens associadas aos sistemas meteorologicos nas escalas global
e regional. In: Encontro Sul Brasileiro de Meteorologia, 2, 2007, Flo-
rianopolis-SC. Proceedings... Florianopolis-SC: CEFET-SC, 2007. CD-
ROM.
IBGE (Instituto Brasileiro de Geografia e Estatıstica). 2010. Anuario
Estatıstico do Brasil. Rio de Janeiro: IBGE, 2010.578 pp.
IPCC (Intergovernmental Panel on Climate Change). 2007. The Phys-
ical Science Basis. Contribuition of working group I to the fourth as-
sessment report of the Intergovernmental Panel on Climate Change.
Cambridge University Press, United Kingdom and New York, NY, USA.
996 pp.
ISLAM S & REHMAN N. 2006. Future changein the frequency of warm
and cold spells durations over Pakistan simulated by the PRECIS re-
gional climate model. Paperpresented in the SecondInternational Young
Scientists’ Global Change Conference, Beijing, 7-9 November 2006, or-
ganised by START (the global change SysTem for Analysis, Research
and Training) and the China Meteorological Administration. MetOffice:
2006. Available on: <http://precis.metoffice.com/docs/poster-china-
final siraj.pdf>. Access on Set. 14, 2010.
KENDALL MG. 1975. Rank correlationmethods. Charles Griffin, London,
120 pp.
MARCELINO EV, GOERL RF & RUDORFF FM. 2004. Distribuicao es-
paco-temporal de inundacoes bruscas em Santa Catarina (perıodo 1980
- 2003). In: Simposio Brasileiro de Desastres Naturais, 1, 2004, Flo-
rianopolis. Proceedings... Florianopolis: GEDN/UFSC, 2004. p. 554–
564.
MARCELINO EV, NUNES LH & KOBIYAMA M. 2006. Mapeamento derisco de desastre naturais do Estado de Santa Catarina. Caminhos da
Geografia, 8(7): 72–84.
MARENGOJA. 2008. Agua e Mudancas Climaticas. Estudos Avancados,
63: 1–14.
MARENGO JA, ALVES LM, VALVERDE MC, ROCHA RP & LABORBE R.
2007. Eventos extremos em cenariosregionalizados de clima no Brasil e
America do Sul para o seculo XXI: Projecoes de clima futuro usandotres
modelosregionais. Relatorio 5. MMA/SBF/DCBio, Mudancas climaticas
globais e efeitos sobre a biodiversidade, Subprojeto: Caracterizacao
do clima a tual e definicao das alteracoes climaticas para o territorio
brasileiro ao longo do seculo XXI. Brasılia. 2007.
MARENGO JA, AMBRIZZI T, ROCHA RP, ALVES LM, CUADRA SV,
VALVERDE MC, TORRES RR, SANTOS DC & FERRAZ SET. 2009. Fu-ture change of climate in South America in the late twenty-first century:
intercomparison of scenarios from three regional climate models. Clim.
Dyn. DOI: 10.1007/s00382-009-0721-6.
MEDINA BL, DA SILVA GC & NUNES AB. 2010. Analise quantitativa
dos eventos extremos de precipitacao com potencial de inundacao em
Blumenau SC. In: Congresso Brasileiro de Meteorologia, 16, 2010,
Belem-PA. Proceedings... Belem: SBMET, 2010. CD-ROM.
MILLY PCD, WETHERALD RT, DUNE KA & DELWORTH TL. 2002. In-
creasing risk of great floods in a changing climate. Nature, 415: 514–
518.
MILLY PCD, DUNE KA & VECCHIA AV. 2005. Global pattern of trends
in streamflow and water availability in a changing climate. Nature, 438:
347–350.
PESQUERO JF. 2009. Balanco de umidade na regiao do sistema de
moncao da America do Sul em cenarios climaticos futuros (2071-2100)
utilizando o modelo ETA: Um estudo de modelagem. Thesis (Doctorate
in Meteorology) – INPE, Sao Jose dos Campos. 2009. 204 pp.
PINHEIRO A & SEVERO DL. 2010. Analise do Evento Pluviometrico
Catastroficode Novembro de2008 naRegiao de Blumenau, SC. In: Con-
gresso Brasileiro de Meteorologia, 16, 2010, Belem-PA. Proceedings...
Belem: SBMET, 2010. CD-ROM.
RUPA KUMAR K, SAHAI AK, KRISHNA KK, PATWARDHANSK, MISHRA
PK, REVADEKAR JV, KAMALA K & PANT GB. 2006. High-resolution cli-
mate change scenarios for India for the 21st century. Curr. Sci., 90:
334–345.
SCHUMACHER RS & JOHNSON RH. 2005. Organization and environ-
mental properties of extreme-rain-producing mesoscale convective sys-
tems. Mon. Wea. Rev., 133: 961–976.
SILVA HS. 2003. Analise Sociotecnica da Meteorologia Brasileira: Uma
Aplicacao para o Vale do Itajaı (SC). Doctorade Thesis on Human Sci-
ence – Programa de Pos-Graduacao Interdisciplinar em Ciencias Hu-
manas, Centro de Filosofia e Ciencias Humanas, Universidade Federalde Santa Catarina, Florianopolis, 2003. 208 pp.
SILVA DIAS MAF, NOBRE C, MARENGO J, RODRIGUES MLG, LIMA
M & MINUZZI RB. 2009. As chuvas de novembro de 2008 em Santa
Catarina: um estudo de caso visandoa melhoria do monitoramento e da
previsao de eventos extremos. Cachoeira Paulista: CPTEC/INPE. 71 pp.
SILVEIRA WN. 2008. Analise historica de inundacao na cidade de
Joinville-SC,com enfoquena bacia do rioCubatao do Norte. Dissertacao
(Mestrado em Engenharia Ambiental) – Programa de Pos-Graduacao
Revista Brasileira de Geofısica, Vol. 3 1(3), 2013
7/26/2019 Artigo RBGF
http://slidepdf.com/reader/full/artigo-rbgf 13/13
NUNES AB & DA SILVA GC 425
em Engenharia Ambiental, Universidade Federal de Santa Catarina, Flo-
rianopolis, 2008. 165 pp.
SILVEIRA WN & KOBIYAMA M. 2007. Historico de inundacao em
Joinville/SC – Brasil, no perıodo de 1851-2007. In: Simposio Brasileiro
de Recursos Hıdricos, 17, Sao Paulo. Proceedings... Sao Paulo: ABRH,2007. CD-ROM.
SOARES WR. 2008. Caracterizacao dos fluxos de umidade sobre a
America do Sul associados ao jato de baixos nıveis ao Leste dos Andes
utilizando o modelo HadRM3P em um cenario de aquecimento global.
Thesis(Doctoratein Meteorology)– INPE, Sao Jose dos Campos. 2008.
190 pp.
SOARES WR & MARENGO JA. 2008. Assessments of moisture fluxes
east of the Andes in South America in a global warming scenario. Int. J.
Climatol., 29: 1395–1414.
TADROSS M, JACK C & HEWITSON B. 2005. On RCM-based projec-
tions of change in southern African summer climate. Geophys. Res.Lett., 32: L23713, DOI: 10.1029/2005GL024460.
TEBALDI C, HAYHOE K, ARBLASTER JM & MEEHL GA. 2006. Going to
extremes – An Intercomparison of model-simulatedhistorical and future
changesin extreme events. Clim. Change, 79: 185–211.
TEIXEIRA MS & SATYAMURTY P. 2007. Dynamical and Synoptic
Characteristics of heavy rainfall episodes in southern Brazil. Mon. Wea.
Rev., 135: 598–617.
VALVERDE MC & MARENGO JA. 2010. Mudancas na circulacao at-
mosferica sobre a America do Sul para cenarios futuros de clima pro-jetados pelos modelos globais do IPCC AR4. Rev. Bras. Meteorol., 25:
125–145.
XU YL, HUANG XY, ZHANG Y, LIN WT & LIN ED. 2006a. Statistical anal-
yses of climate change scenarios over China in the 21st century. Adv.
Clim. Change Res., 2 (Suppl. 1): 50–53.
XU YL, ZHANG Y, LIN ED, LIN WT, DONG WJ, JONES R, HASSELL D
& WILSON S. 2006b. Analyses on the climate change responses over
China under SRES B2 scenario using PRECIS. Chin. Sci. Bull., 51(18):
2260–2267.
ZHANG Y, YINLONG X, WENJIE D, LIJUAN C & SPARROW M. 2006.A future climate scenario of regional changes in extreme climate
events over China using the PRECIS climate events over China us-
ing the PRECIS climate model. Geophys. Res. Lett., 33: L24702, DOI:
10.1029/2006GL027229.
Recebido em 22 maio, 2012 / Aceito em 16 julho, 2012
Received on May 22, 2012 / Accepted on July 16, 2012
NOTES ABOUT THE AUTHORS
Andre Becker Nunes. Bachelor degree in Meteorology from the Meteorology Faculty at UFPel in 2000. Master in Meteorology in the area of Micro-meteorology
through the Post-Graduate Program in Meteorology at UFPel in 2002. Doctorate in Meteorology in the area of Micro-meteorology from the National Institute of
Space Research (INPE) in 2008. DTI-IC scholarship in the Climate Change Group at the Land System Sciences Center (CCST) at INPE, in the area of Extreme Events
in 2008-2009. Assistant Professor at the Meteorology Faculty at UFPel (graduation and post-graduation) since 2009. Publications and orientation in master’s courses
and scientific initiation in the areas of micro-meteorology, climatology, extreme events and climate changes.
Gilson Carlos da Silva. Bachelor degree in Meteorology from the Meteorology Faculty at UFPel in 2008. Master in Meteorology in the area of Climatology
through the Post-Graduate Program in Meteorology at UFPel in 2011. Master’s dissertation in the areas of Climatology, Climate Changes and Climate Modelling.
Areas of interest: Climatology and Synoptic Meteorology. Publications in the areas of Climatology, Climate Modeling, Extreme Events and Synoptic Meteorology.
Brazilian Journal of Geophysics, Vol. 31(3), 2013