Optical characterization of Molecular Beam Epitaxy grown ...
•VIS
ION
S•SCIENCE•TEC
HN
OL
OG
Y•RESEARCHHIGHLI
GH
TS
Dissertation
26
VT
T S
CIE
NC
E 2
6
Ch
ara
cte
rizatio
n o
f the h
um
an
pre
do
min
an
t fecal m
icro
bio
ta . W
ith sp
ec
ial...
ISBN 978-951-38-7954-9 (soft back ed.) ISBN 978-951-38-7955-6 (URL: http://www.vtt.fi /publications/index.jsp)ISSN 2242-119X (soft back ed.) ISSN 2242-1203 (URL: http://www.vtt.fi /publications/index.jsp)
Characterization of the human predominant fecal microbiotaWith special focus on the Clostridial clusters IV and XIVa
The human gut microbiota is considered to be a complex fermentor with a metabolic potential rivaling that of the liver. In addition to its primary function in digestion, the indigenous microbial community has an important infl uence on host physiological, nutritional and immunological processes.
Molecular tools were developed for rapid, sensitive, and highly specifi c characterization of the human predominant fecal and salivary microbiota. Predominant bacterial, Eubacterium rectale – Blautia coccoides group (Erec), Clostridium leptum group (Clept), and Bacteroides spp. populations of healthy adults were temporally rather stable, showing intra-individual diversity and inter-individual variability. However, rRNA-based denaturing gradient gel electrophoresis (DGGE) profi les showed more temporal instability than DNA-based profi les. Moreover, the diversity of predominant bacteria and Erec-group bacteria was signifi cantly higher in elderly subjects as compared to younger adults. Clostridial populations represented the dominant fecal microbiota of most of the studied subjects. However, the proportion of Erec-group was signifi cantly lower in the constipation type IBS subjects than in the healthy adults. Altogether, the observations indicated that in addition to temporal instability of the active predominant fecal bacterial population, clostridial microbiota may be involved in IBS. Thereafter, the similarity of the salivary and fecal microbiota was studied to assess whether the upper gastrointestinal tract microbiota infl uence the results obtained with DNA-based methods from feces. The predominant bacteria, bifi dobacteria, and Erec-group bacteria of the oral cavity and feces showed more diversity in feces than in saliva and different species compositions for the two sampling sites. However, fecal and salivary samples contained identical indigenous Lactobacillus genotypes in most subjects. The effects of storage conditions and DNA-extraction protocols of fecal samples on the results were also evaluated. The DNA-extraction did not affect the diversity, composition, or quantity of Bacteroides spp., whereas after one week’s storage at -20°C the numbers of Bacteroides spp. were signifi cantly lower. Furthermore, the numbers of predominant bacteria, Erec-group, Clept-group, bifi dobacteria, and Atopobium-group were 0.5–4 log-units higher after mechanical DNA-extraction than after enzymatic DNA-extraction, regardless of the storage. Moreover, the bacterial composition of Erec-group differed signifi cantly depending on the DNA-extraction protocol applied. According to the results, rigorous mechanical lysis leads to the detection of higher bacterial numbers and diversity from human fecal samples than enzymatic DNA-extraction.
Characterization of the human predominant fecal microbiota With special focus on the Clostridial clusters IV and XIVa
Johanna Maukonen

VTT SCIENCE 26
Characterization of the human predominant fecal microbiota With special focus on the Clostridial clusters IV and XIVa
Johanna Maukonen
Doctoral dissertation for the degree of Doctor of Science in Technology to be presented with due permission of the School of Chemical Technology for public examination and debate in Auditorium KE2 (Komppa Auditorium) at the Aalto University School of Chemical Technology (Espoo, Finland) on the 7th of December, 2012, at 12 noon.
ISBN 978-951-38-7954-9 (soft back ed.) ISSN 2242-119X (soft back ed.)
ISBN 978-951-38-7955-6 (URL: http://www.vtt.fi/publications/index.jsp) ISSN 2242-1203 (URL: http://www.vtt.fi/publications/index.jsp)
Copyright © VTT 2012
JULKAISIJA – UTGIVARE – PUBLISHER
VTT PL 1000 (Tekniikantie 4 A, Espoo) 02044 VTT Puh. 020 722 111, faksi 020 722 7001
VTT PB 1000 (Teknikvägen 4 A, Esbo) FI-02044 VTT Tfn +358 20 722 111, telefax +358 20 722 7001
VTT Technical Research Centre of Finland P.O. Box 1000 (Tekniikantie 4 A, Espoo) FI-02044 VTT, Finland Tel. +358 20 722 111, fax + 358 20 722 7001
Kopijyvä Oy, Kuopio 2012
3
Characterization of the human predominant fecal microbiota With special focus on the Clostridial clusters IV and XIVa
Ihmisen vallitsevan ulostemikrobiston karakterisointi. Painopiste erityisesti klostridien fylogeneettisissä ryhmissä IV ja XIVa. Johanna Maukonen. Espoo 2012. VTT Science 26. 161 p. + app. 62 p.
Abstract The human gut microbiota is considered to be a complex fermentor with a meta-bolic potential rivaling that of the liver. In addition to its primary function in diges-tion, it affects the human host in numerous ways: maturation and modulation of the immune system, production of short-chain fatty acids and gases, transfor-mation of bile acids, formation of vitamins, and also potential formation of muta-genic, toxic, and carcinogenic substances. Commensal bacteria are able to modu-late the expression of host genes that regulate diverse and fundamental physio-logical functions. Thus the indigenous microbial community has an important influ-ence on host physiological, nutritional and immunological processes. The primary aim of this study was to characterize human predominant fecal microbiota with a special focus on Clostridial clusters XIV (Lachnospiraceae, Eubacterium rectale – Blautia coccoides group) and IV (Ruminococcaceae, Clostridium leptum group). The specific aims were: 1) To develop molecular methods for characterization of the human predominant fecal microbiota; 2) To assess the specificity, practicality, and usability of the developed methods for human fecal samples in healthy adults, elderly people, and people having IBS; 3) To assess possible confounding factors in the analysis of human fecal samples.
Molecular tools were developed for rapid, sensitive, and highly specific charac-terization of the human predominant fecal and salivary microbiota. DNA- and rRNA-based denaturing gradient gel electrophoresis methods (DGGE) were developed for Eubacterium rectale – Blautia coccoides group (Erec), rRNA-based DGGE method for predominant bacteria, and DNA-based DGGE methods for Clostridium leptum group (Clept) and Bacteroides spp. In addition, quantitative real-time PCR (qPCR) methods targeting predominant bacteria, Erec-group, Clept-group, Bacteroides spp., bifidobacteria, and Atopobium group were developed.
Predominant bacterial, Erec-group, Clept-group, and Bacteroides spp. popula-tions of healthy adults were temporally rather stable, showing intra-individual di-versity and inter-individual variability. The rRNA-based profiles showed more tem-poral instability than DNA-based profiles. The enumerated clostridial groups (Erec, Clept, C. lituseburense, and C. histolyticum) represented the dominant fecal mi-crobiota of most of the studied subjects, comprising altogether 29–87% of the total bacteria. Erec-group was the dominant group, accounting on average for 43% of total bacteria in control subjects, and 30% and 50% in irritable bowel syndrome (IBS) subjects affected by constipation and diarrhea, respectively. The proportion of Erec-group was significantly lower in the constipation type IBS subjects than in

4
the healthy controls. The rRNA-based DGGE-profiles of the fecal microbiota of the IBS subjects further indicated higher temporal instability of their microbiota com-position as compared to the control subjects. Our observations indicated that in addition to temporal instability of the active predominant fecal bacterial population, clostridial microbiota may be involved in IBS.
Differences in the predominant fecal microbiota between elderly people and younger adults were also assessed. Temporal stabilities of the studied bacterial populations (predominant bacteria, Erec-group, bifidobacteria, and lactobacilli) were similar in both age groups. However, the diversity of predominant bacteria and Erec-group bacteria was significantly higher in elderly subjects as compared to younger adults. Consumption of probiotic yoghurt containing galacto-oligosaccharide (GOS) for three weeks did not significantly affect the diversity or temporal stability of the studied bacterial groups. However, the composite data set containing all DGGE analyses of the study showed that the microbial communities from the GOS-supplemented subjects were more similar to each other than those of the control subjects. Therefore, the GOS-yoghurt may have a stabilizing effect on the predominant fecal microbiota of elderly people.
Thereafter, the similarity of the salivary and fecal microbiota was studied to as-sess whether the upper gastrointestinal tract microbiota influence the results ob-tained with DNA-based methods from feces. The predominant bacteria, bifidobac-teria, and Erec-group bacteria of the oral cavity and feces were generally stable during probiotic consumption, showing more diversity in feces than in saliva and different species compositions for the two sampling sites. Lactobacilli, however, showed temporal instability in both feces and saliva. Furthermore, fecal and salivary samples contained identical indigenous Lactobacillus genotypes (L. rhamnosus, L. gasseri, L. paracasei, L. plantarum group, and a Lactobacillus sp.) in most subjects.
The effects of storage conditions and DNA-extraction protocols of fecal samples on the results were also evaluated. The DNA-extraction did not affect the diversity, composition, or quantity of Bacteroides spp., whereas after one week’s storage at -20oC the numbers of Bacteroides spp. were 1.6–2.5 log-units lower (p<0.05). Furthermore, the numbers of predominant bacteria, Erec-group, Clept-group, bifidobacteria, and Atopobium-group were 0.5–4 log-units higher (p<0.05) after mechanical DNA-extraction than after enzymatic DNA-extraction as detected with qPCR, regardless of the storage. The bacterial composition of Erec-group differed significantly depending on the DNA-extraction protocol; after enzymatic DNA-extraction the most prevalent genera detected were Roseburia (39% of clones) and Coprococcus (10%), whereas after mechanical DNA-extraction the most prevalent genera were Blautia (30%), Coprococcus (13%), and Dorea (10%). According to the results, rigorous mechanical lysis leads to the detection of higher bacterial numbers and diversity from human fecal samples than enzymatic DNA-extraction. Since it was shown that the results of Clostridial and Actinobacterial populations are highly dependent on the DNA-extraction methods applied, the use of different DNA-extraction protocols may partly explain the contradictory results previously obtained in regard of obesity related and infant microbiota. Keywords human fecal microbiota, human salivary microbiota, DGGE, qPCR, IBS,
elderly, GOS, DNA-extraction, Erec, Clept, Bacteroides spp., bifidobacteria,lactobacill
5
Ihmisen vallitsevan ulostemikrobiston karakterisointi Painopiste erityisesti klostridien fylogeneettisissä ryhmissä IV ja XIVa
Characterization of the human predominant fecal microbiota. With special focus on the Clostridial clusters IV and XIVa. Johanna Maukonen. Espoo 2012. VTT Science 26. 160 s. + liitt. 62 s.
Tiivistelmä Suolistomikrobiston ensisijainen tehtävä on auttaa ruoansulatuksessa; paksu-suolen mikrobit käyttävät hyödykseen useita ravintoaineita, jotka eivät imeydy ohutsuolessa. Ihminen puolestaan hyödyntää mikrobien aineenvaihduntatuotteita. Suolistomikrobisto vaikuttaa ihmiseen monella muullakin tavoin: se edesauttaa immuunijärjestelmän kehittymistä, tuottaa kaasuja sekä lyhytketjuisia rasvahappoja, muuttaa sappihappojen muotoa, tuottaa vitamiineja ja muodostaa mahdollisesti myös mutageenisiä, toksisia sekä karsinogeenisiä yhdisteitä. Niinpä ihmisen suo-listomikrobistolla on merkittävä vaikutus ihmisen fysiologisiin, ravitsemuksellisiin ja immunologisiin toimintoihin. Tämän tutkimuksen tavoitteena oli kehittää menetelmiä ihmisen suolistomikrobiston tärkeimpien bakteeriryhmien karakterisointiin ja kvan-titointiin ja todentaa kehitettyjen menetelmien soveltuvuus ihmisen uloste- ja sylki-näytteiden analysointiin.
Tässä työssä kehitettiin spesifiset ja herkät rRNA-pohjaiset PCR – denaturoiva gradientti geeli elektroforeesi (DGGE) -menetelmät vallitsevan bakteeriston ja Eubacterium rectale – Blautia coccoides -klostridiryhmän (Erec) karakterisointiin sekä DNA-pohjaiset PCR-DGGE-menetelmät Clostridium leptum -klostridiryhmän (Clept), sekä Bacteroides-suvun karakterisointiin. Lisäksi kehitettiin reaaliaikaiset PCR-menetelmät (qPCR) vallitsevan bakteeriston, Erec-ryhmän, Clept-ryhmän, Bacteroides-suvun, bifidobakteerien, sekä Atopobium-ryhmän kvantitointiin.
Terveiden aikuisten vallitseva bakteeriston, Erec-klostridiryhmän, Clept-klostridi-ryhmän ja Bacteroides-suvun bakteeripopulaatiot olivat ajallisesti melko stabiileja. Bakteeripopulaatioprofiilit olivat monimuotoisia ja kullekin ihmiselle ominaisia. rRNA:han pohjautuvat bakteeriprofiilit olivat sekä terveillä aikuisilla että ärtyneen suolen oireyhtymästä (IBS) kärsivillä aikuisilla ajallisesti epästabiilimpia kuin DNA-pohjaiset bakteeriprofiilit. Lisäksi IBS-potilaiden rRNA-pohjaiset vallitsevan bakteeriston profiilit olivat ajallisesti epästabiilimpia kuin terveiden aikuisten (p < 0.05). Tutkittujen klostridiryhmien (Erec, Clept, C. lituseburense -ryhmä sekä C. histolyticum -ryhmä) bakteerit muodostivat valtaosan (29–87 %) ulostemikrobistosta. Erec-ryhmän klostridit muodostivat keskimäärin 43 % terveiden aikuisten ulostemikrobistosta, kun taas IBS-potilailla Erec-ryhmän klostridit muodostivat 30 % (p < 0.05; ummetus-tyyppi) tai 50 % (ripulityyppi) ulostemikrobistosta.
Aikuisten ja vanhempien ihmisten (yli 60 v.) välillä ei ollut eroja tutkittujen bak-teeriryhmien ajallisessa stabiilisuudessa (vallitseva bakteeristo, Erec-ryhmän klostridit, bifidobakteerit ja laktobasillit). Vanhempien ihmisten vallitseva bakteeristo sekä Erec-klostridiryhmä olivat kuitenkin monimuotoisempia kuin nuorempien
6
aikuisten. Galakto-oligosakkarideja (GOS) sisältävällä probioottisella jogurtilla ei ollut vaikutusta vanhempien ihmisten ulostmikrobiston monimuotoisuuteen eikä ajalliseen stabiilisuuteen. GOS-jogurtti kuitenkin muokkasi vanhempien ihmisten ulostemikrobistoa siten, että ulostemikrobistot muistuttivat enemmän toisiaan GOS-jogurtti jakson jälkeen kuin lumejakson jälkeen.
Koska DNA-pohjaisilla menetelmillä voitaisiin periaatteessa detektoida ulos-teesta myös sylkibakteereita, tutkimuksesssa selvitettiin myös, löytyykö syljestä samoja bakteereita kuin ulosteesta. Sekä syljen että ulosteen vallitseva bakteeristo, Erec-ryhmän klostridit, bifidobakteeri- sekä laktobasillipopulaatiot pysyivät melko stabiileina probiootti-syöttöjakson aikana. Ulostenäytteiden bakteeripopulaatiot olivat monimuotoisempia kuin syljen bakteeripopulaatiot. Lisäksi näiden bakteerisuvut/lajit olivat pääasiallisesti erilaisia. Ainoan selkeän poikkeuksen muodostivat laktobasillit; useimpien koehenkilöiden syljestä ja ulosteesta löytyi samoja laktobasilli-lajeja ja toisinaan jopa kantoja (esim. L. rhamnosus, L. gasseri, L. paracasei, L. plantarum-ryhmä ja Lactobacillus sp.).
Viimeisessä osatyössä tutkittiin ulostenäytteiden säilytyslämpötilojen ja eri DNA-eristysmenetelmien vaikutusta näytteistä saataviin tuloksiin. Näytteiden säilytys -20 oC:ssa viikon ajan alensi Bacteroides-suvun bakteerien lukumäärää 1,6–2,5 log-yksikön verran (p < 0.05), kun taas eri DNA-eristysmenetelmillä ei ollut vaikutusta Bacte-roides-suvun bakteerien määrään tai populaation monimuotoisuuteen tai koostu-mukseen. Säilytyslämpötila ei vaikuttanut merkitsevästi muiden tutkittujen baktee-riryhmien määriin eikä myöskään populaatioiden monimuotoisuuteen tai koostu-mukseen. Käytetyllä DNA-eristysmenetelmällä sen sijaan oli merkittävä vaikutus: Vallitseva bakteeriston, Erec-ryhmän klostridien, Clept-ryhmän klostridien, bifidobak-teerien ja Atopobium-ryhmän bakteerien määrät olivat 0,5–4 log-yksikköä korke-ammat (p < 0.05) mekaanista DNA-eristystä käytettäessä kuin entsymaattista DNA-eristystä käytettäessä. Lisäksi käytetyllä DNA-eristysmenetelmällä oli suuri vaikutus Erec-ryhmän bakteerikoostumukseen: Mekaanisen DNA-eristyksen jälkeen ylei-simmät detektoidut suvut olivat Blautia (30 % klooneista), Coprococcus (13 %) ja Dorea (10 %), kun taas entsymaattisen DNA-eristyksen jälkeen yleisimmät suvut olivat Roseburia (39 %) ja Coprococcus (10 %). Käytetyllä DNA-eristysmenetelmällä on saatujen tulosten perusteella huomattava merkitys etenkin klostridi- sekä aktino-bakteeripopulaatioden detektointiin ja kvantitointiin. Eri DNA-eristysmenetelmien käyttö saattaakin osittain selittää viime aikoina saatuja ristiriitaisia tuloksia liittyen esim. suolistomikrobiston rooliin lihavuudessa ja bifidobakteerien määrään vauvojen suolistossa.
Avainsanat human fecal microbiota, human salivary microbiota, DGGE, qPCR, IBS, elderly, GOS, DNA-extraction, Erec, Clept, Bacteroides spp., bifidobacteria, lactobacilli
7
Preface The studies presented in this thesis were carried out at VTT Technical Research Centre of Finland during the years 2002–2012. The financial support of European Commission [ARTRADI (QLK2-CT-2002-00843), TORNADO (FP7-KBBE-222720), and ETHERPATHS (FP7-KBBE-222639)], Academy of Finland (SA-klostridi; project 209758), the Finnish Funding Agency for Technology and Innovation (IBSPROB; Tekes grant 954/401/00), and VTT is greatly appreciated.
I am grateful to Vice Presidents R&D, Bio and Process Technology, Prof. Juha Ahvenainen (–2007) and Prof. Anu Kaukovirta-Norja (2007–), and Technology Manager Dr. Richard Fagerström, as well as to my team leader Doc. Maria Saarela for providing excellent working facilities and for the possibility to finalize this thesis.
I express my sincere gratitude to the pre-examiners Prof. Michael Blaut and Prof. Atte von Wright for their detailed interest in my thesis, although the manu-script was rather long and the schedule rather tight. Their suggestions clearly improved the manuscript. I warmly thank Prof. Katrina Nordström for her coopera-tion during the preparation of this thesis.
I am deeply grateful to my supervisor Doc. Maria Saarela for introducing me to the captivating world of human oro-gastrointestinal microbiota. I also warmly thank her for continuous interest in my studies, all the philosophical discussions, and for being available whenever I have needed help (regardless of her semi-nomadic job description). I am also grateful to Dr. Jaana Mättö for fruitful discussions and in-valuable advice related to the method developments, while you were still working at VTT.
I warmly thank all my co-authors, Dr. Jaana Mättö, Prof. Tiina Mattila-Sandholm, Doc. Reetta Satokari, Prof. Hans Söderlund, Doc. Maija-Liisa Suihko, Dr. Kajsa Kajander, and MSc Catarina Simões for pleasant cooperation during the projects and while preparing the manuscripts. Michael Bailey is thanked for his fast and excellent language editing. I also thank Prof. Sirkka Asikainen for providing three bacterial strains for method validation (Fusobacterium nucleatum, Prevotella melaninogenica, and Veillonella parvula).
My special thanks go to the excellent technical staff at VTT. I am especially grateful to Marja-Liisa Jalovaara for her skillful and invaluable assistance in a myriad of experiments. Without her help, I would still be in the lab. I also warmly thank Anne Heikkinen, Niina Torttila, and MSc Tiina Hyytiäinen for their help with laboratory experiments and Helena Hakuli, Doc. Maija-Liisa Suihko, and Dr. Erna

8
Storgårds for taking care of the microbial strains in the VTT Culture Collection. Furthermore, I am indebted to all the anonymous sample donors (you know who you are) for providing the fecal and salivary samples needed for the studies. With-out their concrete contribution, there would be no thesis.
I sincerely thank all my colleagues at VTT for cooperation during the past 17 years. Although only a few of the past studies are included in this thesis, all the projects and cooperation during my years at VTT are greatly acknowledged. The different types of projects, protocols, and people have taught me a lot. Especially I want to thank my present and past colleagues from the 2nd and 3rd floor microbiol-ogy laboratories: Anne, Annukka, Arja, Auli, Catarina, Eija, Erna, Gun, Hanna, Helena, Kari, Kirsi, Maija-Liisa, Maisa, Mari, Maria, Merja, Mia, Niina, Outi, Reetta, Riikka, Satu, Tarja N, Tiina H., Tiina K., Tuija and all the others for creating such a tremendous working atmosphere. There has never been a dull (or quiet…) day!
Last but not least, I heartily thank my parents and brother for their love and support throughout my life. I also warmly thank my mother Anna-Liisa for count-less hours of baby-sitting (which have enabled the completion of this thesis), brother Juha for mathematical advice (despite my stupid questions posed at odd hours), and mother Anna-Liisa & father Antti for financing my foreign exchange year many, many years ago; the language skills obtained during that year have smoothed my way in the scientific – English-speaking – world. My special thanks are due to all my dear friends, especially Elina, Jyri, Kirsi K., Kirsi T. & Satu, who have shared the joys and sorrows of everyday life. Finally, I express my heartfelt thanks to my husband Marko and to my children Juho & Anni for their love and patience during these years. They have ensured that I have not worked 24/7 (alt-hough I have occasionally tried), by reminding me what is most important in life.
Espoo, October 2012 Johanna Maukonen

9
Academic dissertation Custos Professor Katrina Nordström
School of Chemical Technology Aalto University Espoo, Finland
Supervisor Docent Maria Saarela VTT Technical Research Centre of Finland Espoo, Finland
Reviewers Professor Michael Blaut PhD German Institute of Human Nutrition Nuthetal, Germany Professor Atte von Wright Institute of Public Health and Clinical Nutrition University of Eastern Finland Kuopio, Finland
Opponent Professor Airi Palva Faculty of Veterinary Medicine University of Helsinki Helsinki, Finland
10
List of publications
This thesis is based on the following original articles, which are referred to in the text by their Roman numerals. In addition, some unpublished data is presented.
I. Maukonen J, Satokari R, Mättö J, Söderlund H, Mattila-Sandholm T & Saarela M (2006). Prevalence and temporal stability of selected clostridial groups in irritable bowel syndrome in relation to predominant faecal bacteria. Journal of Medical Microbiology, 55, 625–633.
II. Maukonen J, Mättö J, Satokari R, Söderlund H, Mattila-Sandholm T & Saarela M (2006). PCR-DGGE and RT-PCR-DGGE show diversity and short-term temporal stability in the Clostridium coccoides – Eubacterium rectale group in the human intestinal microbiota. FEMS Microbiology Ecology, 58, 517–528.
III. Maukonen J, Mättö J, Kajander K, Mattila-Sandholm T & Saarela M (2008). Diversity and temporal stability of fecal bacterial populations in elderly sub-jects consuming galacto-oligosaccharide containing probiotic yoghurt. In-ternational Dairy Journal, 18, 386–395.
IV. Maukonen J, Mättö J, Suihko M-L & Saarela M (2008). Intra-individual diversity and similarity of salivary and faecal microbiota. Journal of Medical Microbiology, 57, 1560–1568.
V. Maukonen J, Simões C & Saarela M (2012). The currently used commercial DNA-extraction methods give different results of clostridial and actinobacte-rial populations derived from human fecal samples. FEMS Microbiology Ecology, 79, 697–708.

11
Author’s contributions I Johanna Maukonen had the main responsibility for preparing and writing
the article, and is the corresponding author. She planned the study together with the co-authors. She designed the experiments and did the experi-mental work together with Reetta Satokari, and was mainly responsible for the interpretation of the results. Most of the experimental work related to transcriptional profiling with the aid of affinity capture was performed by Reetta Satokari, but Johanna Maukonen also participated with a smaller impact.
II Johanna Maukonen had the main responsibility for preparing and writing the article, and is the corresponding author. She was mainly responsible for the planning of the study, design of the experiments, experimental work, and interpretation of the results.
III Johanna Maukonen had the main responsibility for preparing and writing the article, and is the corresponding author. She planned the study together with the co-authors. She was mainly responsible for the design of the ex-periments and interpretation of the results. She was partly responsible for the experimental work, and supervised the rest.
IV Johanna Maukonen had the main responsibility for preparing and writing the article, and is the corresponding author. She planned the study together with the co-authors. She was mainly responsible for design of the experi-ments and interpretation of the results. She was partly responsible for the experimental work, and supervised the rest.
V Johanna Maukonen had the main responsibility for preparing and writing the article, and is the corresponding author. She was mainly responsible for the planning of the study, design of the experiments, and interpretation of the results. She was partly responsible for the experimental work, except for the qPCR studies, which were performed by Catarina Simões.
12
Contents Abstract ........................................................................................................... 3
Tiivistelmä ....................................................................................................... 5
Preface ............................................................................................................. 7
Academic dissertation ..................................................................................... 9
List of publications ........................................................................................ 10
Author’s contributions .................................................................................. 11
List of abbreviations ...................................................................................... 15
1. Introduction ............................................................................................. 17 1.1 The microbiota of the human oro-gastrointestinal tract ....................... 18
Oral cavity ............................................................................. 18 1.1.1 Pharynx and esophagus......................................................... 20 1.1.2 Stomach ................................................................................ 20 1.1.3 Small intestine ....................................................................... 22 1.1.4 Large intestine and feces ....................................................... 23 1.1.5
1.2 Properties and activities of the human commensal gut microbiota ...... 24 Phylum Firmicutes ................................................................. 25 1.2.1
Family Clostridiaceae (Clostridial cluster I; 1.2.1.1“true clostridia”) ......................................................... 26
Family Lachnospiraceae (Clostridial cluster XIV; 1.2.1.2Eubacterium rectale – Blautia coccoides group) ......... 27
Family Ruminococcaceae (Clostridial clusters 1.2.1.3III and IV) .................................................................. 28
Other relevant Clostridial Families ............................. 29 1.2.1.4 Class Bacilli .............................................................. 31 1.2.1.5
Phylum Bacteroidetes ............................................................ 33 1.2.2 Family Bacteroidaceae .............................................. 33 1.2.2.1 Families Prevotellaceae, Porphyromonadaceae 1.2.2.2
and Rikenellaceae .................................................... 34 Phylum Actinobacteria ........................................................... 34 1.2.3
13
Family Bifidobacteriaceae ......................................... 34 1.2.3.1 Family Coriobacteriaceae .......................................... 35 1.2.3.2
Some other predominant human bacterial Phyla ..................... 35 1.2.4 Domain Archaea, phylum Euryarchaeota ................................ 38 1.2.5 The importance of the metabolic activities of the gut 1.2.6
microbiota from the host’s perspective .................................... 38 1.3 Methods used for studying the gastrointestinal microbiota .................. 39
Microscopy ............................................................................ 40 1.3.1 Culturing ................................................................................ 41 1.3.2 Molecular techniques ............................................................. 41 1.3.3
Hybridization ............................................................. 42 1.3.3.1 PCR-amplification ..................................................... 43 1.3.3.2 Community analysis .................................................. 44 1.3.3.3 Typing of bacterial isolates ........................................ 45 1.3.3.4 Metagenomic studies ................................................ 46 1.3.3.5
The effect of the used method on the results........................... 46 1.3.41.4 Factors affecting the autochthonous microbiota ................................. 47
Age ....................................................................................... 48 1.4.1 Gender .................................................................................. 50 1.4.2 Genetics of the host and geography ....................................... 51 1.4.3 Diet ....................................................................................... 51 1.4.4
Dietary fiber .............................................................. 53 1.4.4.1 Probiotics and prebiotics ........................................... 54 1.4.4.2 Medication ................................................................ 54 1.4.4.3
Health status & living conditions ............................................. 56 1.4.51.5 The role of microbiota in certain diseases and disorders .................... 57
Oral diseases ........................................................................ 58 1.5.1 Irritable bowel syndrome (IBS) ............................................... 59 1.5.2 Inflammatory bowel disease (IBD) .......................................... 60 1.5.3 Allergy and asthma ................................................................ 61 1.5.4 Obesity, metabolic syndrome and diabetes ............................. 61 1.5.5 Others ................................................................................... 63 1.5.6
2. Hypotheses, rationale and specific aims of the study............................ 66
3. Materials and methods ............................................................................ 68 3.1 Materials .......................................................................................... 68
Bacterial pure cultures ........................................................... 68 3.1.1 Bacterial isolates.................................................................... 70 3.1.2 Human sample collection and handling ................................... 70 3.1.3
3.2 Methods ........................................................................................... 71 Nucleic acid extraction and biotinylation (Articles I–V) ............. 71 3.2.1 PCR and reverse transcriptase (RT) – PCR (Articles I–V) ....... 72 3.2.2 Denaturing gradient gel electrophoresis (DGGE; Articles I–V) .... 72 3.2.3 Cloning (Articles II & V) .......................................................... 74 3.2.4

14
Sequence analysis (Articles II & V) ......................................... 74 3.2.5 Fingerprinting of bacterial isolates (Article IV) ......................... 74 3.2.6 Real time PCR (qPCR; Article V) ............................................ 75 3.2.7 Transcript analysis with the aid of affinity capture 3.2.8
(TRAC; Articles I and II) ......................................................... 75 3.3 Statistical analysis (Articles I–V) ........................................................ 75
4. Results and discussion........................................................................... 79 4.1 Development of bacterial group-specific PCR-DGGE- and
qPCR-methods (Articles I, II, and V) .................................................. 79 rRNA-based vs. rDNA-based detection ................................... 79 4.1.1 Eubacterium rectale – Blautia coccoides group (Clostridial 4.1.2
cluster XIV; Lachnospiraceae) PCR-DGGE ............................. 80 Clostridium leptum group (Clostridial cluster IV; 4.1.3
Ruminococcaceae) PCR-DGGE ............................................. 82 Bacteroides spp. PCR-DGGE................................................. 83 4.1.4 qPCR methods ...................................................................... 84 4.1.5
4.2 Differences in the fecal microbiota between healthy adults and adults with IBS (Article I) ............................................................ 84
Temporal stability of predominant bacterial populations 4.2.1and clostridial populations ...................................................... 84
Proportion of clostridia ........................................................... 87 4.2.24.3 Characterization of the fecal microbiota of elderly people during
a GOS-yoghurt intervention (Article III) .............................................. 90 Fecal microbiota differences between elderly people 4.3.1
and younger adults ................................................................ 90 The effect of GOS-yoghurt consumption on the fecal 4.3.2
microbiota of elderly people.................................................... 92 4.4 Confounding factors in the DNA-based studies of fecal samples
(Articles IV and V) ............................................................................. 94 The effect of sample storage and DNA-extraction on the 4.4.1
fecal microbiota results .......................................................... 95 Salivary microbiota vs. fecal microbiota .................................. 99 4.4.2
5. Summary and conclusions ................................................................... 103
6. Future outlook ....................................................................................... 105
References ................................................................................................... 107
Appendices
Articles I–V
1. Introduction
15
List of abbreviations ATCC American Type Culture Collection
AFM atomic force microscope
ARDRA amplified rDNA restriction analysis
CD Crohn’s disease
CFU colony forming unit
Chis Clostridium histolyticum group of clostridia (Clostridial cluster II), howev-er, the Chis-probe targets both Clostridial clusters I and II
Clept Clostridium leptum group of clostridia (Clostridial cluster IV; Ruminococ-caceae)
Clit Clostridium lituseburense group of clostridia (Clostridial cluster XI)
CH4 methane
CO2 carbon dioxide
CRC colorectal cancer
C-section Cesarean section
CSLM confocal scanning laser microscopy
DAPI 4’,6-diamidino-2-phenylindole
DGGE denaturing gradient gel electrophoresis
DNA deoxyribonucleic acid
DSMZ Deutsche Sammlung von Mikroorganismen und Zellkulturen (German Collection of Microorganisms and Cell Cultures)
Erec Eubacterium rectale – Blautia coccoides group of clostridia (Clostridial cluster XIV; Lachnospiraceae)
FISH fluorescent in situ hybridization
FOS fructo-oligosaccharide
G+C guanine + cytosine
GI gastrointestinal
GIT gastrointestinal tract
GOS galacto-oligosaccharide
H2 hydrogen
H2S hydrogen sulfide
IBD inflammatory bowel disease
IBS irritable bowel syndrome

1. Introduction
16
LAB lactic acid bacteria
LPS lipopolysaccharides
MA methanogenic archaea
MIC minimal inhibitory concentration
MRSA de Man – Rogosa – Sharpe agar
mRNA messenger ribonucleic acid
MZ monozygotic
NGS next-generation sequencing
OUT operational taxonomic unit
PCR polymerase chain reaction
PFGE pulsed field gel electrophoresis
PYG peptone-glucose-yeast (medium)
qPCR quantitative (real-time) PCR
RAPD randomly amplified polymorphic deoxyribonucleic acid
rDNA ribosomal deoxyribonucleic acid
mRNA messenger ribonucleic acid
RNA ribonucleic acid
rRNA ribosomal ribonucleic acid
RT-PCR reverse transcriptase polymerase chain reaction
SEM scanning electron microscope
SRB sulfate reducing bacteria
SSCP single-stranded conformation polymorphism
T1D Type 1 diabetes
T2D Type 2 diabetes
TEM Transmission electron microscope
TGGE temperature gradient gel electrophoresis
TGY trypticase- glucose-yeast extract
TRAC transcriptional profiling with the aid of affinity capture
T-RFLP terminal restriction fragment length polymorphism
UC ulcerative colitis
1. Introduction
17
1. Introduction
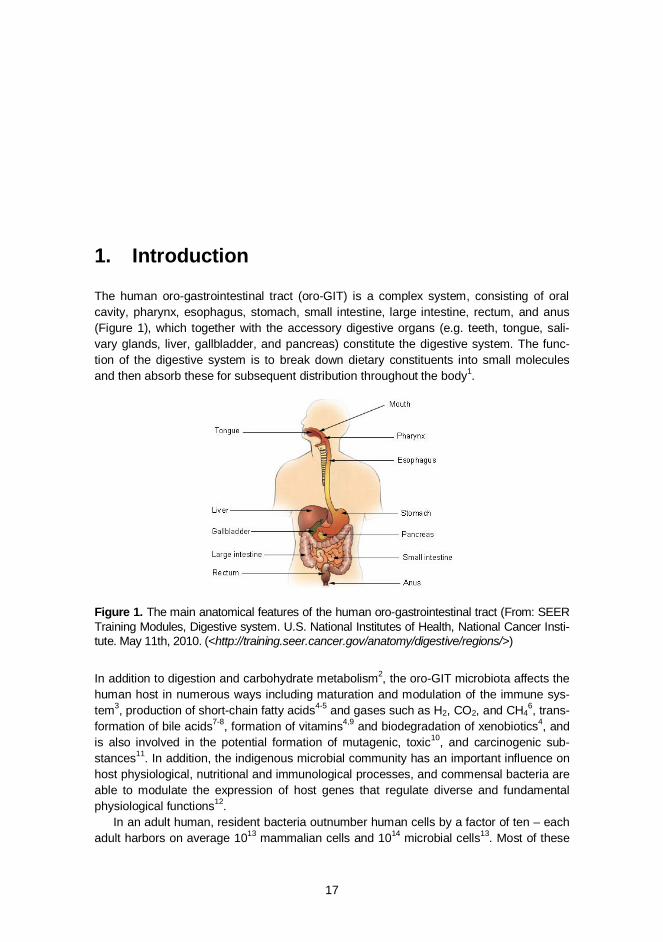
The human oro-gastrointestinal tract (oro-GIT) is a complex system, consisting of oral cavity, pharynx, esophagus, stomach, small intestine, large intestine, rectum, and anus (Figure 1), which together with the accessory digestive organs (e.g. teeth, tongue, sali-vary glands, liver, gallbladder, and pancreas) constitute the digestive system. The func-tion of the digestive system is to break down dietary constituents into small molecules and then absorb these for subsequent distribution throughout the body1.
Figure 1. The main anatomical features of the human oro-gastrointestinal tract (From: SEER Training Modules, Digestive system. U.S. National Institutes of Health, National Cancer Insti-tute. May 11th, 2010. (<http://training.seer.cancer.gov/anatomy/digestive/regions/>)
In addition to digestion and carbohydrate metabolism2, the oro-GIT microbiota affects the human host in numerous ways including maturation and modulation of the immune sys-tem3, production of short-chain fatty acids4-5 and gases such as H2, CO2, and CH4
6, trans-formation of bile acids7-8, formation of vitamins4,9 and biodegradation of xenobiotics4, and is also involved in the potential formation of mutagenic, toxic10, and carcinogenic sub-stances11. In addition, the indigenous microbial community has an important influence on host physiological, nutritional and immunological processes, and commensal bacteria are able to modulate the expression of host genes that regulate diverse and fundamental physiological functions12.
In an adult human, resident bacteria outnumber human cells by a factor of ten – each adult harbors on average 1013 mammalian cells and 1014 microbial cells13. Most of these

1. Introduction
18
microbes, typically 1011–1012 microbes/g, are located in the feces and large intestine14-16, which is considered to be a complex fermentor with a metabolic potential rivaling that of the liver17. The environmental determinants – namely temperature, pH, redox potential, atmos-pheric composition, water activity, salinity, and light – within each region of the human oro-GIT are very different, and therefore each region has its own distinctive microbiota1.
The aim of this PhD thesis was to study the commensal fecal microbiota, and there-fore pathogenic bacteria are not discussed in detail in the following sections.
1.1 The microbiota of the human oro-gastrointestinal tract
Oral cavity 1.1.1
The oral cavity is formed by the cheeks, the hard and soft palates, and the tongue (Figure 2), and it is connected to the pharynx. The total surface area of the oral cavity, including teeth, is approximately 200 cm2, of which tooth surfaces account for ~20%. The hard palate sepa-rates the oral and nasal cavities, and the soft palate the oropharynx and nasopharynx1.
Figure 2. The main anatomical features of the human oral cavity (From: SEER Training Modules, Digestive system. U.S. National Institutes of Health, National Cancer Institute. May 12th, 2010. (<http://training.seer.cancer.gov/anatomy/digestive/regions/mouth.html>)
Each different micro-environment (cheeks, palate, tongue, tooth surfaces, gingival areas, and saliva) contains its own microbiota18-19, partly due to the different environmental con-ditions. The temperature of the oral cavity varies from site to site, but remains mainly within the range of 33–37oC. However, when cold or hot drinks and food are consumed, the temperature variations may be considerably larger. The pH of saliva, tongue and mucosal surfaces is usually approximately neutral, whereas the pH of gingival crevices is alkaline and that of fissures and approximal oral regions tends to be neutral/acidic. In addition, the redox potential of most of the oral sites is positive (E0 = 74-273 mV). However, the redox potential of gingival crevices is negative (E0 = -73 mV)1, thereby offering a suitable niche for obligate anaerobes.
Communities in the oral cavity are polymicrobial and exist primarily as biofilms on the surface of the teeth, gums, and tongue. Over 600 prevalent oral bacterial taxa are recog-
1. Introduction
19
nized, of which approximately 50% have not yet been cultured20-21. The number of pre-dominant species – including all oral sites – may vary individually between 34 and 72 as detected with Sanger sequencing18 and between 88 and 104 as detected with pyrose-quencing based on ~240 nt long sequences19). The predominant taxa that have been detected in various sites of the oral cavity with molecular techniques include: phyla Fir-micutes (e.g. Streptococcus, Gemella, Eubacterium, Selemonas, Veillonella, and Granu-licatella species), Actinobacteria (e.g. Actinomyces, Atopobium, Rothia, Corynebacterium, and related species), Fusobacteria (e.g. Fusobacterium and Leptotrichia species), Prote-obacteria (e.g. Neisseria, Eikenella, Kingella, Campylobacter, and related species), Bac-teroidetes (e.g. Prevotella, Porphyromonas, Parabacteroides, and Capnocytophaga spe-cies), and TM7 (no culturable representatives). In addition, smaller populations of the phyla Cyanobacteria, Spirochaetes, Chlamydiae, Chloroflexi, Euryarchaeota, SR1, Syn-ergistetes, and Tenericutes have been detected in different oral sites18-19,21-25. In the oral cavity, indigenous lactobacilli and bifidobacteria do not have the same positive image as in the gut, since they have been associated with oral diseases. In addition, they can be detected but their occurrence is reversed as compared to feces: lactobacilli are a com-mon finding in the oral cavity whereas bifidobacteria are less frequently detected. Lacto-bacillus species found in oral samples include L. casei group, L. acidophilus group, L. plantarum, L. fermentum, and L. salivarius26-27. The oral cavity harbors only one known indigenous Bifidobacterium species, B. dentium28. Other oral Bifidobacterium-like organ-isms currently belong to the genera Scardovia and Parascardovia (Scardovia inopinata and Parascardovia denticolens29. Altogether, culturable and not yet culturable species of Gemella, Granulicatella, Streptococcus, and Veillonella have commonly been found in most of the oral sites18-19. Moreover, 30 significant health-associated species – i.e. spe-cies that are more prevalent in healthy than in diseased mouth; e.g. Streptococcus san-guinis, Kingella oralis, and Streptococcus intermedius – have been found at healthy sites (i.e. no caries, gingivitis, or periodontitis) in permanent teeth30-32.
The number of bacteria in the oral cavity is approximately 1011 per gram (wet weight) of dental plaque and 108–109 per ml of saliva (culturable bacteria33-34). Salivary microbiota reflects a mixture of bacteria washed off from the various surfaces of the oral cavity, es-pecially from the tongue34. The whole saliva also contains gingival crevicular fluid (GCF), mucosal transudations, expectorated bronchial and nasal secretions, serum and blood derivatives from oral wounds, desquamated epithelial cells, other cellular components, and food debris35. Since saliva is easily available, it has been a widely used sample ma-terial in oral microbiota studies. The bacterial microbiota of saliva is dominated by the genera Streptococcus, Prevotella, Veillonella, Neisseria, Haemophilus, Rothia, Porphy-romonas, and Fusobacterium, which account for over 70% of the microbiota18-19,24-25. In addition, high microbial diversity within and between individuals has been found, but only minimal grouping based on the host’s geographical location24. In a study of Yang et al. only a minimal core salivary microbiome was found, comprising of 0.53% of the detected bacteria25. Instead Zaura et al. found a clear core microbiome, which comprised of 47% of the detected bacteria19. This discrepancy is partly due to the stringent read-selection of Zaura et al.19, which resulted in exclusion of sequences that were found less than five times. In addition, in the study of Zaura et al. only three study subjects were included, whereas in the study of Yang et al. 26 study subjects were included. Therefore, it is likely that the conclusions of Yang et al.25 are more accurate.
1. Introduction
20
Pharynx and esophagus 1.1.2
The pharynx (Figure 1; Section 1) is a tube that extends from the internal nares down to the larynx and consists of three main regions: the nasopharynx, the oropharynx, and the laryngopharynx. The pharynx acts as a passageway for food, drink, and air1. The oro-pharynx is constantly exposed to both ingested and inhaled microbes, those contained in saliva and those cleared by mucociliary mechanisms from both the upper and lower res-piratory tracts. Members of nine microbial phyla (Firmicutes, Proteobacteria, Bacteroide-tes, Fusobacteria, Actinobacteria, TM7 and SR1), represented by 71 taxa have been found in the oropharynx. The majority of the bacteria belonged to Streptococcaceae, as well as to Lachnospiraceae and Acidaminococcaceae36.
The esophagus (Figure 1; Section 1) connects the laryngopharynx to the stomach, and its function is to transport food between these regions. The esophagus is an aerobic region. Food entering the esophagus moves towards the stomach by peristalsis, and movement of the food bolus is aided by the presence of saliva and mucus. The tempera-ture in esophagus is 37oC and pH of esophagus mucus layer is ~6.81. Overall, represent-atives of nine microbial phyla, represented by 166 species have been found in the esoph-agus. Based on these results, the distal esophagus may harbor over 200 species, as predicted by the Chao1 richness estimator37. The predominant genus in the esophagus of healthy individuals is Streptococcus (>78% of clones), and in particular the mitis group species S. mitis and S. pseudopneumoniae25,38-40. Moreover, S. mitis was the only taxon that was found in all samples in the study of Yang et al.37. Gram-negative bacteria (e.g. Prevotella, Veillonella etc.) comprised on average 15% of the clones. Moreover, the aer-obic conditions of the site were reflected in the population structure, since only 16% of the clones originated from anaerobic or microaerophilic bacteria37. Overall, the bacterial pop-ulation in the normal distal esophagus is similar to that of the oropharynx22-23. The majori-ty of clones, especially those that share significant homology only with uncultivated 16S rRNA gene clones, are mostly related to oral bacteria, suggesting that transient bacteria originating from the oral cavity predominated in the specimens39.
The microbiota of the throat has been found to be similar to that of the distal esopha-gus; eight genera (Streptococcus, Prevotella, Actinomyces, Gemella, Rothia, Granulica-tella, Haemophilus, and Veillonella) were found in all the samples, constituting 75% of the total sequences. Genus Streptococcus was the dominant genus followed by Prevotella. A differentiating genus between the throat and esophagus microbiota was Veillonella, rep-resenting 14% of the esophagus sequences but only 0.4% of the throat reads39-41.
Stomach 1.1.3
The stomach is a J-shaped structure linking the esophagus to the duodenum (Figure 3) and has a total capacity of approximately 1500 ml1.
1. Introduction
21
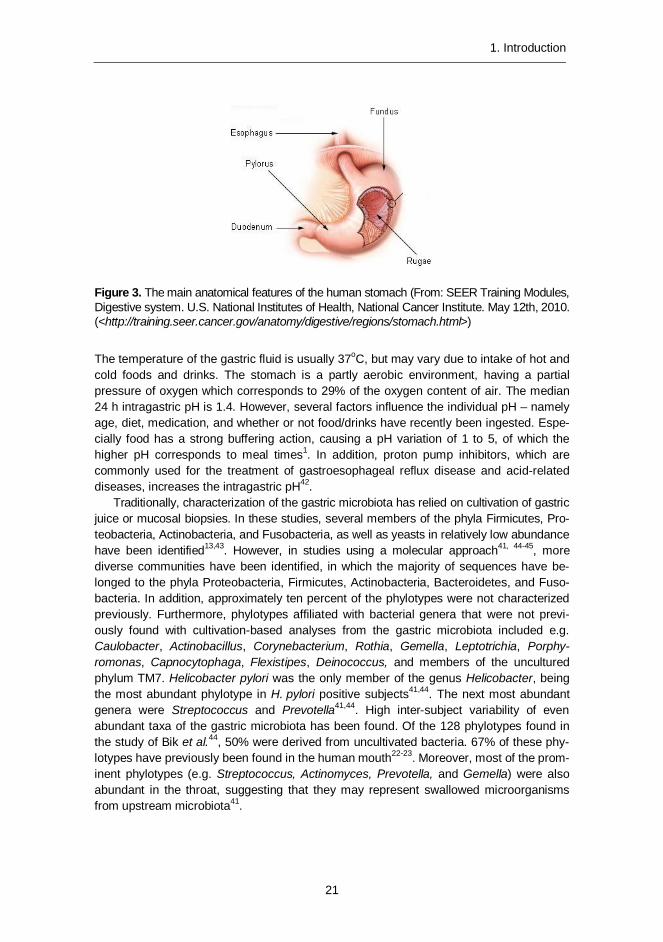
Figure 3. The main anatomical features of the human stomach (From: SEER Training Modules, Digestive system. U.S. National Institutes of Health, National Cancer Institute. May 12th, 2010. (<http://training.seer.cancer.gov/anatomy/digestive/regions/stomach.html>)
The temperature of the gastric fluid is usually 37oC, but may vary due to intake of hot and cold foods and drinks. The stomach is a partly aerobic environment, having a partial pressure of oxygen which corresponds to 29% of the oxygen content of air. The median 24 h intragastric pH is 1.4. However, several factors influence the individual pH – namely age, diet, medication, and whether or not food/drinks have recently been ingested. Espe-cially food has a strong buffering action, causing a pH variation of 1 to 5, of which the higher pH corresponds to meal times1. In addition, proton pump inhibitors, which are commonly used for the treatment of gastroesophageal reflux disease and acid-related diseases, increases the intragastric pH42.
Traditionally, characterization of the gastric microbiota has relied on cultivation of gastric juice or mucosal biopsies. In these studies, several members of the phyla Firmicutes, Pro-teobacteria, Actinobacteria, and Fusobacteria, as well as yeasts in relatively low abundance have been identified13,43. However, in studies using a molecular approach41, 44-45, more diverse communities have been identified, in which the majority of sequences have be-longed to the phyla Proteobacteria, Firmicutes, Actinobacteria, Bacteroidetes, and Fuso-bacteria. In addition, approximately ten percent of the phylotypes were not characterized previously. Furthermore, phylotypes affiliated with bacterial genera that were not previ-ously found with cultivation-based analyses from the gastric microbiota included e.g. Caulobacter, Actinobacillus, Corynebacterium, Rothia, Gemella, Leptotrichia, Porphy-romonas, Capnocytophaga, Flexistipes, Deinococcus, and members of the uncultured phylum TM7. Helicobacter pylori was the only member of the genus Helicobacter, being the most abundant phylotype in H. pylori positive subjects41,44. The next most abundant genera were Streptococcus and Prevotella41,44. High inter-subject variability of even abundant taxa of the gastric microbiota has been found. Of the 128 phylotypes found in the study of Bik et al.44, 50% were derived from uncultivated bacteria. 67% of these phy-lotypes have previously been found in the human mouth22-23. Moreover, most of the prom-inent phylotypes (e.g. Streptococcus, Actinomyces, Prevotella, and Gemella) were also abundant in the throat, suggesting that they may represent swallowed microorganisms from upstream microbiota41.
1. Introduction
22
Small intestine 1.1.4
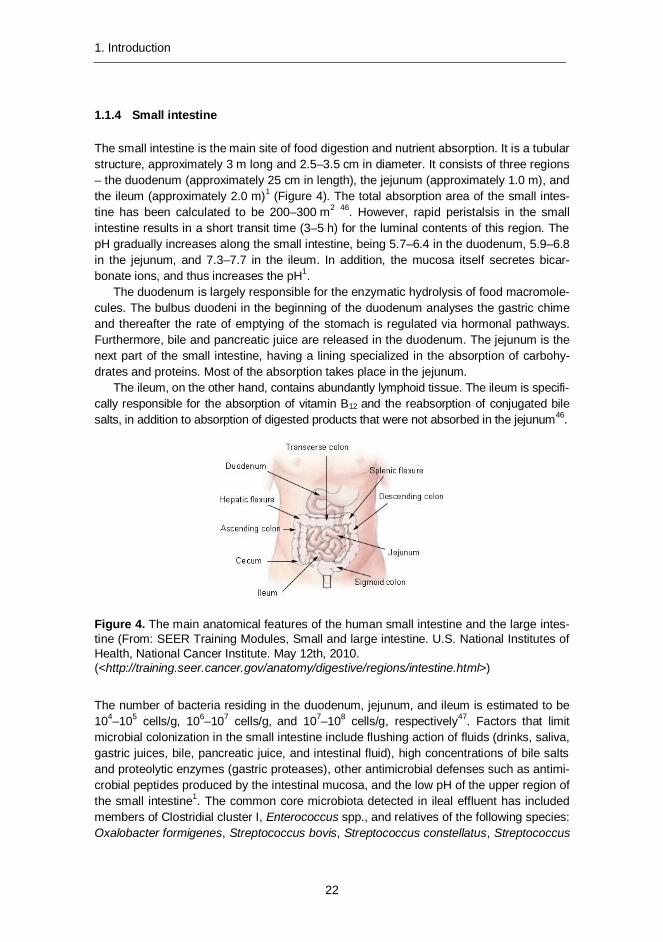
The small intestine is the main site of food digestion and nutrient absorption. It is a tubular structure, approximately 3 m long and 2.5–3.5 cm in diameter. It consists of three regions – the duodenum (approximately 25 cm in length), the jejunum (approximately 1.0 m), and the ileum (approximately 2.0 m)1 (Figure 4). The total absorption area of the small intes-tine has been calculated to be 200–300 m2 46. However, rapid peristalsis in the small intestine results in a short transit time (3–5 h) for the luminal contents of this region. The pH gradually increases along the small intestine, being 5.7–6.4 in the duodenum, 5.9–6.8 in the jejunum, and 7.3–7.7 in the ileum. In addition, the mucosa itself secretes bicar-bonate ions, and thus increases the pH1.
The duodenum is largely responsible for the enzymatic hydrolysis of food macromole-cules. The bulbus duodeni in the beginning of the duodenum analyses the gastric chime and thereafter the rate of emptying of the stomach is regulated via hormonal pathways. Furthermore, bile and pancreatic juice are released in the duodenum. The jejunum is the next part of the small intestine, having a lining specialized in the absorption of carbohy-drates and proteins. Most of the absorption takes place in the jejunum.
The ileum, on the other hand, contains abundantly lymphoid tissue. The ileum is specifi-cally responsible for the absorption of vitamin B12 and the reabsorption of conjugated bile salts, in addition to absorption of digested products that were not absorbed in the jejunum46.
Figure 4. The main anatomical features of the human small intestine and the large intes-tine (From: SEER Training Modules, Small and large intestine. U.S. National Institutes of Health, National Cancer Institute. May 12th, 2010. (<http://training.seer.cancer.gov/anatomy/digestive/regions/intestine.html>)
The number of bacteria residing in the duodenum, jejunum, and ileum is estimated to be 104–105 cells/g, 106–107 cells/g, and 107–108 cells/g, respectively47. Factors that limit microbial colonization in the small intestine include flushing action of fluids (drinks, saliva, gastric juices, bile, pancreatic juice, and intestinal fluid), high concentrations of bile salts and proteolytic enzymes (gastric proteases), other antimicrobial defenses such as antimi-crobial peptides produced by the intestinal mucosa, and the low pH of the upper region of the small intestine1. The common core microbiota detected in ileal effluent has included members of Clostridial cluster I, Enterococcus spp., and relatives of the following species: Oxalobacter formigenes, Streptococcus bovis, Streptococcus constellatus, Streptococcus
1. Introduction
23
intermedius, Streptococcus mitis, and Veillonella spp.47. The intestinal contents of jejunum and ileum of elderly people have been found to consist of simple, mostly facultatively anaerobic or aerobic microbial communities of streptococci, lactobacilli, members of the Class Gammaproteobacteria, and the Enterococcus group. In addition, Bacteroides spp. have been found48. According to culture-dependent analyses, enterococci, Escherichia coli, klebsiella, lactobacilli, staphylococci, and streptococci are present in the jejunum and ileum49.
Large intestine and feces 1.1.5
The large intestine consists of several regions – cecum, colon (ascending, transverse, descending, and sigmoid), rectum, and anal canal (Figures 1 and 4). The large intestine is approximately 1.5 m long and 6.5 cm in diameter, with a surface area of approximately 1250 cm2. No digestive enzymes are secreted by the mucosa of the large intestine, and thus further breakdown of dietary constituents is carried out by the resident microbiota1. The human colon receives digested food from the ileum. The contents are then mixed and retained for 6–12 h in the cecum and ascending colon. Thereafter, digesta are ejected and pass through the transverse to the descending colon for storage and eventual excre-tion. Carbohydrates are mainly fermented in the proximal colon, whereas the fermentation of proteins takes place mainly in the distal colon. Transit time of digesta through the colon strongly influences the activities of the gut microbiota. The mean transit time of the oro-gastrointestinal tract has been reported to be approximately 70 h in UK people consuming a normal daily diet6,50. The primary activity of the cecum and colon microbiota is the breakdown of carbohydrates not digested in the ileum to short-chain fatty acids (SCFA), which are then rapidly absorbed. The principal products of carbohydrate fermentation are SCFAs (acetate, propionate, and butyrate), hydrogen and carbon dioxide gases, and bacterial cell mass (biomass)51. The amount of energy derived from SCFA accounts for up to 10% of the total energy requirement of humans52. From a nutritional point of view, the SCFAs are important since they not only provide the body with energy but are also metabolized in different tissues51. The pH of the caecum (~5.7) is lower than that of the ileum because of rapid bacterial fermentation of carbohydrates to short-chain fatty acids (SCFAs). The pH remains similar (5.6–5.7) in the ascending colon and traverse colon, but increases again to 6.6 in the descending and sigmoid colons because of the absorption of SCFAs. In addition, the secretion of bicarbonate by the mucosa increases the pH. The pH in the rectum varies between 6.6 and 6.81.
The microbiota in the colon is extremely diverse and on basis of estimations from cul-ture-based and molecular studies more than 1200 prevalent bacterial species altogether reside there. Each individual harbors at least 160 such species53-54. However, a large fraction (>80%) of the GI-tract microbiota has not yet been cultured55, which necessitates the use of molecular techniques in the characterization of GI-tract microbiota. Under normal circumstances, the predominant intestinal microbiota of an adult individual has been reported to be rather stable. However, in studies in which the long-term temporal stability of the predominant microbiota has been assessed from healthy subjects, the number of subjects has been limited56-59.
Fecal microbiota is dominated by Eubacterium rectale – Blautia coccoides group (Erec-group; Clostridial cluster XIV60), Clostridium leptum group (Clept-group; Clostridial
1. Introduction
24
cluster IV), and Bacteroidetes group15-16,55, 61- 62, which together account for 60–80% of the fecal bacteria of healthy adults62-64. Bacteria belonging to the Erec-group comprise on average 10–45% of the total fecal bacteria as detected with quantitative methods based on hybridization15-16,62-70, and bacteria belonging to the Clept-group account for 16–27%, thus co-dominating with the members of the Erec-group 62-65,70-72. Bacteroidetes (Bac-teroides – Prevotella group) comprise 4–28% of the total fecal bacteria as detected with quantitative hybridization-based methods from healthy adults (probe Bac303)63-64, where-as the abundance of Bacteroidetes (Bacteroides – Porphyromonas – Prevotella group + several Firmicutes) has been found to be ≈ 40% (range 12–64%) using another probe (Bacto 1080)62,73. Moreover, the average proportion of B. fragilis and B. vulgatus species has been found to be 2–9% in healthy adults63-64,74 and that of B. fragilis and B. distasonis – using another set of probes – 10–30%15.
Although found in most humans, Bifidobacterium spp. and Lactobacillus-group (com-prising the genera Lactobacillus, Leuconostoc, Pediococcus, and Weissella) comprise smaller populations among fecal bacteria in adults (bifidobacteria 0.5–6% and lactobacilli <1–3% of the total fecal bacteria)15-16,62-64,70. Atopobium-group (e.g. genera Collinsella, Eggerthella, and Slackia) also usually comprises 1–5% of the total fecal microbiota. Moreover, there are several bacteria / bacterial groups, which usually comprise less than 1–2% of the total fecal microbiota of healthy adults; these include Akkermansia muciniphi-la, Clostridium lituseburense group (Clostridial cluster XI), Clostridium histolyticum group (Clostridial clusters I & II), enterobacteria, streptococci, Veillonella spp., Eubacterium cylindroides group, Clostridium ramosum group, sulfate-reducing bacteria, and methano-gens15,62-63,67,75-78. In addition to bacteria, low levels of viruses, archaea (<1%), and eu-karyotes (≤ 2%) are also found in the large intestine78-80.
1.2 Properties and activities of the human commensal gut microbiota
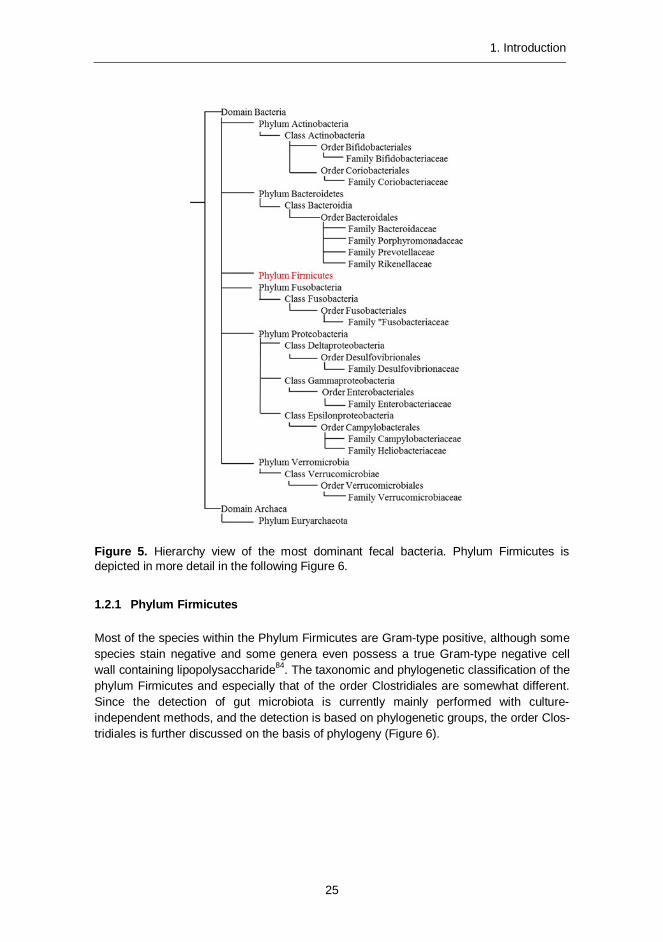
The human GI-tract, although harboring a vast number of microbes, has only a limited di-versity at the phylum level. Microbes from seven bacterial phyla (Firmicutes, Bacteroidetes, Actinobacteria, Proteobacteria, Fusobacteria, Verromicrobia, and Cyanobacteria-like) and one archael phylum (Euryarchaeota) have been detected in the human intestine55,61,81-83, whereas microbes from 14 phyla have been found in the oral cavity (Actinobacteria, Bac-teroidetes, Chlamydiae, Chloroflexi, Cyanobacteria, Euryarchaeota, Firmicutes, Fusobac-teria, Proteobacteria, Spirochaetes, SR1, Synergistetes, Tenericutes, and TM7)18-19,21. However, the majority of the GI-tract population are representatives of only two phyla; the Firmicutes and the Bacteroidetes (Figures 5 and 6). Since the current PhD study was mainly focused on fecal samples, oral taxa are only briefly described.
1. Introduction
25
Figure 5. Hierarchy view of the most dominant fecal bacteria. Phylum Firmicutes is depicted in more detail in the following Figure 6.
Phylum Firmicutes 1.2.1
Most of the species within the Phylum Firmicutes are Gram-type positive, although some species stain negative and some genera even possess a true Gram-type negative cell wall containing lipopolysaccharide84. The taxonomic and phylogenetic classification of the phylum Firmicutes and especially that of the order Clostridiales are somewhat different. Since the detection of gut microbiota is currently mainly performed with culture-independent methods, and the detection is based on phylogenetic groups, the order Clos-tridiales is further discussed on the basis of phylogeny (Figure 6).
1. Introduction
26
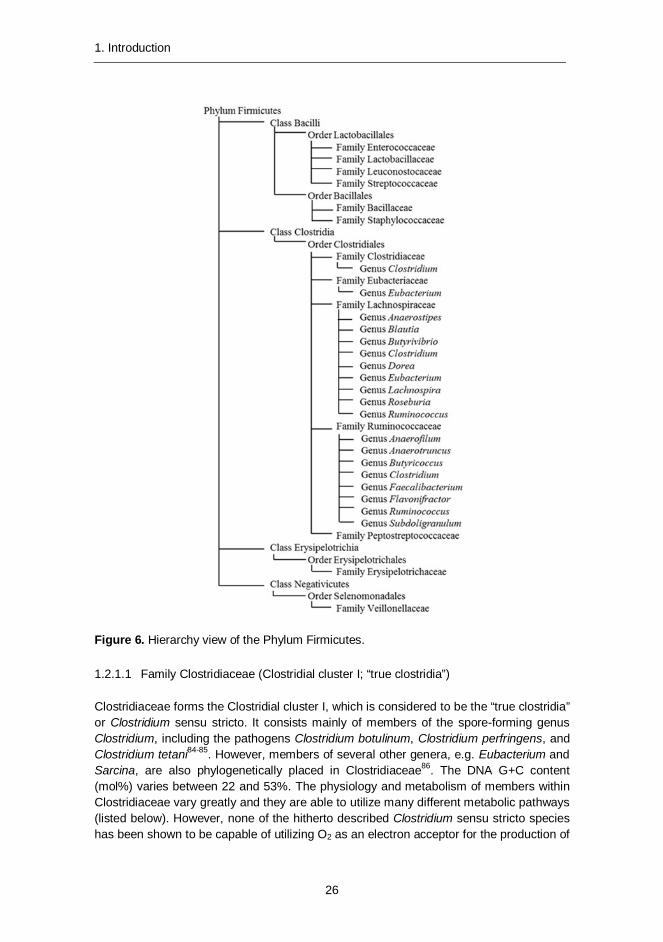
Figure 6. Hierarchy view of the Phylum Firmicutes.
Family Clostridiaceae (Clostridial cluster I; “true clostridia”) 1.2.1.1
Clostridiaceae forms the Clostridial cluster I, which is considered to be the “true clostridia” or Clostridium sensu stricto. It consists mainly of members of the spore-forming genus Clostridium, including the pathogens Clostridium botulinum, Clostridium perfringens, and Clostridium tetani84-85. However, members of several other genera, e.g. Eubacterium and Sarcina, are also phylogenetically placed in Clostridiaceae86. The DNA G+C content (mol%) varies between 22 and 53%. The physiology and metabolism of members within Clostridiaceae vary greatly and they are able to utilize many different metabolic pathways (listed below). However, none of the hitherto described Clostridium sensu stricto species has been shown to be capable of utilizing O2 as an electron acceptor for the production of
1. Introduction
27
ATP. Many clostridial species cease growth under oxic conditions, but resume growth once anoxic conditions are reinstated. With regard to carbon, there are chemolithoauto-trophic and organoheterotrophic species. The organoheterotrophic species include: 1) saccharolytic species (able to use many or a few monocarbohydrates and one or more polymers such as starch, chitin, xylans, and cellulose); 2) proteolytic and peptidolytic species of amino acid utilizers; 3) lipolytic and purinolytic species; 4) organic acid utiliz-ers; and 5) C-1 compound utilizers. In addition, many of the Clostridium sensu stricto species exhibit mixed acid and alcohol fermentations, i.e. they form various concentra-tions of acetic acid, lactic acid and/or ethanol, propanol and butanol, as well as butyric acid. The amount of butyrate produced is strongly dependent on the growth substrate84.
Family Lachnospiraceae (Clostridial cluster XIV; Eubacterium rectale – Blautia 1.2.1.2coccoides group)
Lachnospiraceae forms the Clostridial cluster XIV, and it includes species of the genera such as Anaerostipes, Blautia, Butyrivibrio, Catonella, Clostridium, Coprococcus, Dorea, Eubacterium, Lachnospira, Johnsonella, Roseburia, Ruminococcus, and Shuttleworthia86. Many members of Lachnospiraceae are polysaccharolytic and produce butyrate. In addition, they are obligately anaerobic. The DNA G+C content (mol%) varies between 29 and 51%.
Anaerostipes spp. produce butyrate, acetate and lactate as major products of glucose metabolism. They are able to produce acids from e.g. fructose, glucose, galactose, fructo-oligosaccharides, and soluble starch. In addition, they are able to utilize acetate87. Blautia spp. produce acetate, ethanol, hydrogen, lactate, and succinate as major products of glucose metabolism. They are chemo-organotrophic bacteria, which have a fermentative type of catabolism. Some species use H2/CO2 as the major energy source88. Butyrivibrio spp. are able to ferment a wide range of sugars. In addition, they produce extracellular proteases and both cellular and extracellular esterase activities. Many strains are also pectinolytic and amylolytic. All the characterized Butyrivibrio fibrisolvens strains are highly xylanolytic, but only ~10% are capable of growing on cellulose. A few strains are also capable of degrading complex heterocyclic bioflavonoid-type compounds. Due to their wide biochemical diversity, they are presumably involved in the degradation of fibrous plant materials, starches, pectins, and proteins in the caecum and large intestine89. Co-prococcus spp. actively ferment carbohydrates, producing butyric and acetic acids to-gether with formic or propionic and/or lactic acids. Fermentable carbohydrates are either required or are highly stimulatory for growth90. The species of the genus Clostridium that belong to Lachnospiraceae (e.g. C. bolteae, C. clostridioforme, C. hathewayi, C. indolis, C. jejuense, C. nexile, C. saccharolyticum, C. scindens, C. sphenoides, C. symbiosum, and C. xylanolyticum) are able to ferment a range of different carbohydrates, producing acetate, lactate, propionate, succinate, formate, butyrate, ethanol, carbon dioxide and/or hydrogen as major products of glucose metabolism. In addition, unlike most of the clos-tridia C. symbiosum is able to ferment glutamate via the α-hydroxyglutarate pathway91. Dorea spp. produce ethanol, formate, acetate, hydrogen, and carbon dioxide as major products of glucose metabolism; lactate may or may not be formed but butyrate is not produced. Dorea spp. are able to utilize a variety of sugars, but e.g. starch is not hydro-lyzed92.
1. Introduction
28
The human-associated species of the genus Eubacterium that belong to Lachnospi-raceae (E. cellulosolvens, E. eligens, E. hallii, E. ramulus, E. rectale, and E. ventriosum) produce lactate as a major product of glucose metabolism. In addition, some strains pro-duce butyrate, formate, butanol, and/or hydrogen93. Furthermore, E. ramulus cleaves the ring system of several flavonols and flavones, giving rise to the corresponding hydroxy-phenylacetic and hydroxyphenylpropionic acids, respectively, as well as acetate and butyrate. E. ramulus is also capable of converting the isoflavonoids genistein and daidze-in to the products 2-(4-hydroxyphenyl)-propionic acid and O-desmethylangolensin, re-spectively94. Lachnospira spp. are the primary pectin fermenters. In addition to pectin, there is a limited range of carbohydrates that they are able to ferment; sucrose, fructose, and glucose89. Roseburia spp. are butyrate-producing bacteria that show net acetate utilization during growth on media containing carbohydrates and short-chain fatty acids. Major fermentation products from glucose and acetate include butyrate, lactate, hydrogen and carbon dioxide. However, Roseburia spp. are able to ferment only a limited range of sugars89,95-96. The species of the genus Ruminococcus that belong to Lachnospiraceae (R. gnavus, R. lactaris, R. obeum, R. torques) produce lactic, formic, and acetic acids and ethanol, sometimes with trace amounts of succinic and pyruvic acids, as major products of glucose metabolism. However, butyric acid is not formed. In addition, abundant hydro-gen is produced. Several strains of R. gnavus also form small amounts of ammonia from chopped meat90,97.
Family Ruminococcaceae (Clostridial clusters III and IV) 1.2.1.3
Ruminococcaceae contains the Clostridial clusters III and IV. Clostridial cluster IV (Clostridium leptum group) includes species of the genera such as Anaerofilum, Anaerotruncus, Butyricoccus, Clostridium, Faecalibacterium, Flavonifractor, Pseudoflavonifractor, Ruminococcus, and Subdoligranulum. Many members of the Clos-tridial cluster IV are polysaccharolytic and produce butyrate. In addition, they are obligately anaerobic. The DNA G+C content (mol%) varies between 27 and 60%.
Anaerofilum spp. grow chemo-organotrophically on a number of mono- and disaccharides, including glucose and xylose. The principal fermentation products from glucose include lac-tate, acetate, ethanol, formate, and CO2, whereas hydrogen is not generated98. Anaerotrun-cus spp. produce acetic and butyric acids as end products of glucose metabolism. In addi-tion to glucose, they are able to ferment e.g. fructose, mannose and cellobiose, but there is no growth on e.g. lactose, sorbitol, starch, or xylose. Furthermore, Anaerotruncus colihomi-nis is able to utilize e.g. ketobutyric acid, ketovaleric acid, malic acid, and pyruvic acid99. Most of the species of the genus Clostridium that belong to the Clostridial cluster IV (e.g. C. leptum, C. methylpentosum, C. sporosphaeroides, and C. viride) are able to ferment a range of different carbohydrates producing acetate, propionate, butyrate, valerate, n-propanol, carbon dioxide and/or hydrogen as major products of the carbohydrate metabo-lism. In addition, small amounts of ammonia may occasionally be produced in chopped meat medium. C. leptum, however, is not able to ferment glucose or e.g. adonitol, galac-tose, glycerol, inulin, or sorbose, but ferments maltose. Furthermore, C. sporosphaeroides is able to ferment glutamate via the α-hydroxyglutarate pathway and C. viride is able to reduce sulfur by a mechanism not linked to energy conservation91,97, 100-101.
1. Introduction
29
The human-associated species of the genus Eubacterium that belong to Ruminococ-caceae (E. desmolans and E. siraeum) produce butyrate, lactate, ethanol, and/or hydro-gen as major products of glucose metabolism93. In addition, E. desmolans is able to de-grade steroids102. Faecalibacterium spp. produce butyrate, formate and d-lactate, but not hydrogen as fermentation products of glucose. They are also able to utilize acetate103. Faecalibacterium prausnitzii was formerly identified as Fusobacterium prausnitzii104 but was reclassified as Faecalibacterium prausnitzii in 2002103. The species of the genus Ruminococcus that belong to Ruminococcaceae (R. albus, R. bromii, R. cellulosi, R. callidus, R. flavefaciens) require a fermentable carbohydrate for good growth and produce acetate, formate, succinate, ethanol, carbon dioxide and/or hydrogen90,105-106. Subdoligranulum variabile (currently the only species of the genus Subdoligranulum) is able to use a variety of different sugars. Esculin is hydrolyzed but starch is not. In addi-tion, cellulose is not degraded. The major products of glucose fermentation are butyric and lactic acids, together with minor amounts of acetic and succinic acids107. Flavonifrac-tor spp. (Clostridium orbiscindens and Eubacterium plautii were unified as Flavonifractor plautii) are asaccharolytic; glucose, fructose, and ribose are only weakly fermented. Major metabolic end products in trypticase-glucose-yeast extract (TGY) broth are acetate and butyrate. In addition, Flavonifractor spp. are able to cleave quercetin and other flavo-noids108. Pseudoflavonifractor spp. (Bacteroides capillosus was reclassified as Pseudo-flavonifractor capillosus) are also asaccharolytic; e.g. glucose, fructose, galactose, and lactose are only weakly fermented. Major metabolic end products in TGY broth are ace-tate and succinate. Unlike Flavonifractor spp. they are unable to cleave quercetin108.
Clostridial cluster III includes species of the genera such as Acetivibrio and Clostridi-um. Many members of the Clostridial cluster III have been isolated from soil or compost environment, and are not usually found in abundance in human samples. Therefore, if Ruminococcaceae is targeted in human samples, mostly members of the Clostridial clus-ter IV are targeted. Most of the species of the genus Clostridium that belong to the Clos-tridial cluster III (e.g. C. aldrichii, C. cellobioparum, C. cellulolyticum, C. hungatei, C. josui, C. stercorarium, and C. thermocellum) are able to ferment a range of different carbohy-drates – including cellulose, xylan, and cellobiose – producing acetate, propionate, for-mate, lactate, butyrate, isovalerate, succinate, ethanol, carbon dioxide, and/or hydrogen as major products of the carbohydrate metabolism91,109-110.
Other relevant Clostridial Families 1.2.1.4
Family Veillonellaceae. The members of Veillonellaceae are anaerobic bacteria that stain Gram-negative. The most relevant genera of Veillonellaceae with regard to the human oro-gastrointestinal tract are Anaeroglobus, Dialister, Megasphaera, Mitsuokella, Selenomonas, and Veillonella. Anaeroglobus spp. are not able to reduce nitrate or to ferment most of the sugars, although, galactose and mannose are fermented. The meta-bolic end-products are acetate, propionate, isobutyrate, butyrate, and isovalerate. Anaer-oglobus spp. mostly reside in the human gastrointestinal tract. Dialister spp. are obligately anaerobic or microaerophilic, nonfermentative bacteria that produce acetate, lactate, and propionate as metabolic end products on blood agar. Dialister spp. are mainly found in the oral cavity. Megasphaera eldsdenii, the only human-associated species of the genus Megasphaera, is a chemo-organotrophic bacterium that produces acetate, propionate,
1. Introduction
30
butyrate, iso-butyrate, iso-valerate, 2-methylbutyrate, valerate, carbon dioxide, and/or hydrogen as metabolic end-products of lactate, whereas butyrate, formate, and caproate are produced as the end-products of glucose metabolism. It is not able to reduce nitrate, but produces H2S. Mitsuokella spp. are saccharolytic bacteria that are able to ferment a variety of carbohydrates. The major fermentation end products are acetate, lactate, and succinate. In addition, nitrate is reduced to nitrite. Mitsuokella spp. inhabit the human gastrointestinal tract. Selenomonas spp. are chemo-organotrophic bacteria that produce acetate, propionate, carbon dioxide and/or lactate as major products of glucose metabolism. In addition, small amounts of hydrogen and succinate may be produced. Furthermore, most of the Selenomonas spp. require volatile fatty acids for growth when glucose is used as an energy source. Human Selenomonas spp. are mostly associated with the oral cavity. Veil-lonella spp. are generally unable to ferment carbohydrates or amino acids, but reduce ni-trate. The major metabolic end-products in TGY-broth are acetate and propionate. In addi-tion, carbon dioxide and hydrogen are produced from lactate. Furthermore, Veillonella spp. are able to produce H2S from e.g. cysteine, thiosulfate, and thioglycolate. Veillonella spp. reside mostly in the oral cavity, and in the respiratory and intestinal tracts111-112.
Family Peptostreptococcaceae (Clostridial cluster XI; Clostridium lituseburense group60, 86) includes species of the genera such as Clostridium, Eubacterium, Filifactor, and Peptostreptococcus. Most of the species of the genus Clostridium that belong to Peptostrep-tococcaceae (e.g. C. bartlettii, C. bifermentans, C. difficile, C. irregulare, C. lituseburense, and C. sordellii) are saccharolytic producing acetate, butyrate, isobutyrate, valerate, and iso-valerate as major fermentation products, and formate, propionate, ethanol, propanol, isobutanol, and H2 as minor products. In addition, C. bifermentans, C. lituseburense, and C. sordellii are also proteolytic. C. irregulare is neither saccharolytic nor proteolytic, but gelatin is hydrolyzed. On the other hand, C. difficile and C. sordellii produce several toxins. C. difficile produces toxins A and B; toxin A causes intestinal fluid accumulation and toxin B is primarily cytotoxic. C. sordellii also produces two toxins, LT and HT; the major lethal toxin LT is an edema-producing toxin and toxin HT is a hemorrhagic toxin. Moreover, toxin A of C. difficile cross-reacts with the HT toxin of C. sordellii, whereas toxin B of C. difficile cross-reacts with the LT toxin of C. sordellii 91,113. Peptone is the major energy source of Peptostreptococcus spp. They do not need carbohydrates for growth, but bu-tyrate and caproate are produced as products of the weak carbohydrate fermentation106. Oral saccharolytic Eubacterium yurii spp. (produce butyrate, H2S and indole, in addition to smaller amounts of acetate and propionate) and Filifactor spp. (produce acetate, butyrate, isobutyrate, formate, and isovalerate as major fermentation products) have been associ-ated with endodontic infections60,114.
Family Eubacteriaceae (Clostridial cluster XV; Eubacterium limosum group). Eubac-terium limosum, the type species of genus Eubacterium, forms Eubacteriaceae with Eu-bacterium aggregans, Eubacterium barkeri, Eubacterium callenderi, and Eubacterium coprostanoligenes along with species of the genera Acetobacterium, Alkalibacter, Anaer-ofustis, and Pseudoramibacter60,86. It has been proposed that the above-mentioned Eu-bacterium species should form the genus Eubacterium sensu stricto115. The major prod-ucts of glucose fermentation of Eubacterium spp. within Eubacteriaceae are butyrate, caproate, formate, lactate, and/or hydrogen93. Moreover, E. limosum is nutritionally an extremely versatile species, degrading carbohydrates, amino acids, lactate, and metha-nol. In addition, it is able to grow autotrophically on H2 + CO2 or CO102, and is able to

1. Introduction
31
produce cobamides and carboxylic acids93. Furthermore, E. coprostanoligenes is able to reduce cholesterol via the formation of 4-cholesten-3-one, which is then reduced to co-prostanol with coprastanone as an intermediate102.
Family Erysipelotrichaceae contains Clostridial clusters XVI and XVIII60,86. Clostridi-al cluster XVI includes species of the genera such as Clostridium, Erysipelothrix, Eubac-terium, and Holdemania. Clostridium innocuum is polysaccharolytic and produces butyr-ate, lactate, acetate, hydrogen, and carbon dioxide as end products of carbohydrate fermentation91. Erysipelothrix spp. are chemo-organotrophic; metabolism is respiratory and weakly fermentative. Acid, but no gas, is produced from glucose and other carbohy-drates116. One of the major clusters of Eubacterium spp. includes species within Erysipe-lotrichaceae (E. biforme, E. cylindroides, E. dolichum, and E. tortuosum). The main prod-ucts of glucose fermentation of Eubacterium spp. within Erysipelotrichaceae are butyrate, caproate, formate, lactate, and/or hydrogen91,102. Holdemania spp. produce acetic and lactic acids as main fermentation end products from glucose, whereas succinic acid is produced only in smaller amounts117. Clostridial cluster XVIII (Clostridium ramosum group60) consists of helically coiled Clostridium cocleatum, Clostridium ramosum, Clos-tridium saccharogumia, and Clostridium spiroforme species that are isolated from the gastrointestinal tract. They are saccharolytic and produce acetate, formate, lactate, and succinate but not butyrate as major fermentation products. In addition, C. saccharogumia has been shown to be involved in the conversion of the plant lignan secoisolariciresinol diglucoside. Furthermore, C. ramosum has been reported to produce β-lactamase and C. spiroforme to produce a toxin similar to the C. perfringens type E iota toxin91,118-119.
Class Bacilli 1.2.1.5
Order Lactobacillales includes Families such as Enterococcaceae, Lactobacillaceae, Leuconostocaceae, and Streptococcaceae and are commonly referred to as lactic acid bacteria (LAB). They are a diverse group of Gram-positive, non-spore forming, faculta-tively anaerobic bacteria that have a G+C content of less than 50 mol-% and produce lactic acid by fermentation. Their nutritional requirements are complex and variable 120. Enterococcus spp. of Enterococcaceae are chemo-organotrophic bacteria that are able to ferment a wide variety of substrates and have a homofermentative lactic acid fermenta-tion. The predominant product of glucose fermentation is L(+)-lactic acid. However, under aerobic conditions, Enterococcus faecalis ferments glucose to acetic acid, acetoin, and carbon dioxide. Furthermore, if the fermentation takes place under neutral to slightly alkaline conditions glucose is fermented to formate, ethanol, and acetate. Enterococcus spp. harbor a wide variety of plasmids and transposons that are involved e.g. in the trans-fer of antibiotic resistance and virulence factor determinants. In addition, the Enterococ-cus spp. are resistant to 40% (v/v) bile. Although enterococci are mostly commensal human bacteria, they have been increasingly isolated from a variety of nosocomial and other infections120-121. Lactobacillaceae includes genera such as Lactobacillus and Pedio-coccus. Lactobacillus spp. are aciduric or acidophilic bacteria that are obligately saccha-roclastic. With glucose as a carbon source, Lactobacillus spp. may be either homofer-mentative (>85% of the end product is lactic acid) or heterofermentative (production of lactic acid, CO2, ethanol and/or acetic acid). In addition, under aerobic conditions in-creased amounts of acetic acid may be produced at the expense of lactic acid or ethanol.
1. Introduction
32
Due to the heterogeneous fermentation behavior, Lactobacillus spp. may be divided into three subgroups: A) Obligately homofermentative lactobacilli, in which hexoses are al-most exclusively (>85%) fermented to lactate (e.g. L. acidophilus, L. crispatus, L. del-brueckii, L. gasseri, L. johnsonii, and L. salivarius); B) Facultatively heterofermentative lactobacilli, in which hexoses are almost exclusively fermented to lactate, but under glu-cose limitation lactic acid, acetic acid, ethanol, and formic acid are produced. Moreover, availability of the nutrients, pH and redox potential all have an effect on which end products will be formed (e.g. L. casei, L. paracasei, L. rhamnosus, and L. plantarum); C) Obligately heterofermentative lactobacilli, in which hexoses are fermented to lactic acid, ethanol, acetic acid and CO2 (e.g. L. brevis, L. buchneri, L. fermentum, L. oris, and L. reuteri)120,122. Pediococcus spp. are able to ferment a wide variety of substrates. Under anaerobic conditions, Pediococcus spp. ferment glucose to lactic acid. Pediococci are the only lactic acid bacteria that divide alternately in two perpendicular directions to form tetrads. They are mostly found in various beverages, and unlike enterococci and lactobacilli only rarely in the GIT120,122. Leuconostocaceae includes genera such as Leuconostoc and Weissella. Leuconostoc spp. are nonacidophilic, chemo-organotrophic, heterofermentative bacteria that are mostly found in food and drink products120,123. Weissella spp. are chemo-organotrophic, heterofermentative bacteria that are able to ferment a wide variety of sub-strates. The end products of glucose metabolism are DL- or D-lactate, ethanol, CO2 and/or acetate. Weissella confusa forms part of the commensal human microbiota, whereas other Weissella spp. are mostly associated with various food products120, 123. Streptococ-caceae includes genera such as Lactococcus and Streptococcus. Lactococcus spp. are chemo-organotrophic, homofermentative bacteria that are able to ferment a variety of substrates. They are commonly found in plant material and from dairy products, but only transiently in the GIT120-121. Streptococcus spp. are chemo-organotrophic, homofer-mentative bacteria that are able to ferment a wide range of substrates. However, under glucose-limited conditions, other end products such as formate, acetate, and ethanol, may also be detected. Many of the known species are commensals in humans, although some are important pathogens (e.g. S. pyogenes and S. pneumoniae), and some are used for production of dairy products (S. thermophilus for production of yoghurt)120-121.
Order Bacillales consists of e.g. Families Bacillaceae and Staphylococcaceae. Bacil-lus spp. of Bacillaceae are mostly aerobic or facultatively anaerobic bacteria, although a few species have been described to be strictly anaerobic. They are mostly chemo-organotrophic – two species are facultative chemolithotrophs – spore-forming bacteria. Bacillus spp. have a wide range of physiological abilities ranging from psychrophilic to thermophilic, and acidophilic to alkaliphilic. Furthermore, some strains are salt tolerant and some are halophilic. Most species are able to use glucose and/or other fermentable carbohydrates, but some species are not able to utilize carbohydrates at all. In addition, some species are able to decompose pectin and polysaccharides. Bacillus spp. are also able to use both inorganic and organic sources of nitrogen, and able to reduce nitrate to nitrite. Moreover, Bacillus cereus is an important foodborne pathogen, which produces enterotoxins and some strains produce an emetic toxin (cereulide)124-125. Staphylococ-cus spp. of Staphylococcaceae are facultatively anaerobic, chemo-organotrophic bacte-ria. The main fermentation product of most of the species is lactic acid. However, under aerobic conditions acetic acid and carbon dioxide are the main end-products. Nutritional requirements of Staphylococcus spp. are variable; however, most of the species require
1. Introduction
33
an organic source of nitrogen. Staphylococcus spp. are mainly associated with skin, skin glands, and mucus membranes. Some species are opportunistic pathogens, most notably S. aureus, which produces enterotoxins125-126.
Phylum Bacteroidetes 1.2.2
The members of the Phylum Bacteroidetes are Gram-negative bacteria, having a DNA G+C content (mol%) of 28–61%. Most members of the Phylum Bacteroidetes were origi-nally classified as part of the genus Bacteroides. Within the past few decades, the taxon-omy of the genus Bacteroides has undergone major revisions and many new genera have been identified.
Family Bacteroidaceae 1.2.2.1
Bacteroides spp. are saccharolytic bacteria that contain a wealth of polysaccharide-degrading enzymes. They have an excellent ability to ferment simple and complex sugars and polysaccharides, such as xylans, noncellulosic glucans, pectins, galactomannans, arabinogalactans, mucopolysaccharides, and mucin, producing acetate and succinate as major metabolic end products. In addition, most species are weakly proteolytic. Peptidases produced by Bacteroides spp. facilitate the degradation of proteins to yield a variety of free amino acids and peptides. Furthermore, Bacteroides spp. have an enriched set of glycan, vitamin, and cofactor enzymes important for food digestion. Moreover, Bacteroides fragilis plays a key role in the enterohepatic circulation of bile acids by helping the process of bio-transformation between conjugated and deconjugated bile salts. The DNA G+C content (mol%) of Bacteroides spp. is 40–48%127-132. Bacteroides spp. differ significantly from other Bacteroidaceae species in possessing enzymes of the hexose monophosphate shunt-pentose phosphate pathway. B. fragilis and related species also possess sphingolipids, predominantly methyl-branched long-chain fatty acids, and menaquinones as the sole res-piratory quinones131. The completion of whole genome sequencing projects has shed more light onto the ecophysiology of Bacteroides spp.; they have been shown to possess 1) complex systems to sense the nutrient availability and tailor nutrient-metabolizing systems accordingly; 2) multiple pump systems to rid the bacteria of toxic substances; and 3) the ability to control the environment by interacting with the host immune system so that it con-trols other, possibly competing, pathogenic bacteria127. Furthermore, it has been shown in mice studies that Bacteroides thetaiotaomicron is able to redirect its carbohydrate-utilizing capability from dietary to host polysaccharides according to nutrient availability133.
According to the all-species living tree, the genus Parabacteroides belongs to Bacteroi-daceae86, whereas according to the NCBI taxonomy Parabacteroides is placed within Por-phyromonadaceae134. Parabacteroides spp. were moved away from the genus Bacteroides because of clear differences in the 16S rRNA-based phylogeny (e.g. Bacteroides merdae → Parabacteroides merdae and Bacteroides distasonis → Parabacteroides distasonis). However, at the whole genome level, the Parabacteroides spp. are a part of the Bacteroides genus130. The physiological properties of the genus Parabacteroides resemble those of the genus Bacteroides. Parabacteroides spp. are saccharolytic bacteria that produce acetate and succinate as major metabolic end products. The G+C content is 43–46 mol%135.
1. Introduction
34
Families Prevotellaceae, Porphyromonadaceae and Rikenellaceae 1.2.2.2
Most of the bacteria within Prevotellaceae and Porphyromonadaceae have been isolated from the oral cavity and are commonly found in oral sites in culture-based studies, whereas with DNA-based molecular studies members of Prevotellaceae and Porphy-romonadaceae have also been found in feces. Family Prevotellaceae includes genera such as Prevotella and Paraprevotella86,128. Prevotella spp., which are mainly associated with the oral cavity, are pigmented, moderately saccharolytic bacteria. They mainly pro-duce acetic and succinic acids as major products of glucose fermentation. The G+C con-tent is 40–60 mol%128-129. Paraprevotella spp., which have been isolated from feces, are saccharolytic and able to utilize various sugars, producing succinic and acetic acids as end products of glucose metabolism. The DNA G+C content is 48–49 mol%136. Family Porphyromonadaceae includes oral genera such as Porphyromonas and Tannerella, which are asaccharolytic, pigmented, and proteolytic bacteria. The DNA G+C content ranges between 46 and 54 mol%86,137-138.
Family Rikenellaceae consists of the gastrointestinal genera Alistipes and Rikenella 86 that have high mol% G+C of DNA (55–61%). Most Alistipes spp. are saccharolytic bacteria. The major glucose fermentation product is succinic acid, together with minor amounts of acetic, isovaleric and propionic acids; lactic acid, isobutyric and butyric acids are some-times produced in very small amounts139-140. Rikenella spp. are weakly saccharolytic bacteria that produce acetate and succinate as the end products of carbohydrate fermentation141.
Phylum Actinobacteria 1.2.3
Phylum Actinobacteria consists of Gram-positive bacterial genera that mostly have DNA of high guanine + cytosine (G + C) content (60–64%), with the exception of the genus Atopobium with a G + C range of approx. 36–46 mol%.
Family Bifidobacteriaceae 1.2.3.1
Bifidobacterium spp. are proteolytic, acid-tolerant (but not acidophilic) bacteria that pro-duce acetate and lactate from sugars, and are able to hydrolyze a wide range of polysac-charides. Bifidobacteria are common inhabitants in the human intestine. The most com-monly found gastrointestinal bifidobacteria include; B. adolescentis, B. angulatum, B. bifidum, B. breve, B. catenulatum, B. longum, and B. pseudocatenulatum142-145. B. denti-um is the only Bifidobacterium that has been isolated from the human oral cavity146. The other oral genera within Bifidobacteriaceae include Scardovia and Parascardovia. Scar-dovia inopinata (formerly B. inopinatum) and Parascardovia denticolens (formerly B. denticolens) have been transferred from the genus Bifidobacterium since they have distinct phenotypic characteristics and low G+C contents as compared to the bifidobacteria29. Scardovia spp. and Parascardovia spp. are non-acid-fast and saccharoclastic bacteria. The G-C content of the Scardovia spp. is ~45 mol% and that of Parascardovia spp. ~55 mol%29.

1. Introduction
35
Family Coriobacteriaceae 1.2.3.2
Coriobacteriaceae was formed on the basis of reclassification of former members of the genus Eubacterium. It consists of members of the genera such as Atopobium, Collinsella, Coriobacterium, Eggerthella, Olsenella, and Slackia86. Genera Collinsella, Coriobacte-rium, and Eggerthella are associated with the gastrointestinal tract, whereas Atopobium, Olsenella, and Slackia are mostly found in the oral cavity147-149. Atopobium spp. produce major amounts of lactic acid as fermentation products148,150. Coriobacterium spp. produce acetate, lactate, ethanol, CO2 and/or H2 as major products of glucose fermentation151. Collinsella spp. produce lactate, formate, ethanol, and H2 as principal fermentation products from glucose. In addition, the cell wall contains a unique A4β-type peptidoglycan93, 152. Eg-gerthella spp. produce acetate, lactate, and succinate as principal fermentation products from glucose. Eggerthella lenta is capable of inactivating digoxin, a widely used cardiac glycoside. In addition, E. lenta-like organisms have been found to be able to deconjugate both glycine and taurine conjugates of cholic aid and chenodeoxycholic acid and they are found to be quite active in transforming steroid compounds93,147,149. The type species of the genus Slackia, Slackia exigua, does not ferment sugars. However, Slackia heli-otrinireducens produces acetate as a fermentation product from glucose147.
Some other predominant human bacterial Phyla 1.2.4
The most important members of Class Delta-Proteobacteria of Phylum Proteobacteria with regard to the lower human gastro-intestinal tract are the H2S producing bacteria of Family Desulfovibrionaceae (e.g. Desulfovibrio spp. and Bilophila spp.). Sulfate-reducing bacteria (SRB) are a morphologically and physiologically diverse group of strictly anaero-bic organisms, which share the ability to dissimilate sulfate to sulfide while oxidizing vari-ous growth substrates. Desulfovibrio spp. (namely D. desulfuricans subsp. desulfuricans, D. fairfieldensis, D. piger, and D. vulgaris) are non-saccharolytic, non-proteolytic bacteria that contain desulfoviridin. Desulfovibrio spp. commonly utilize lactate, ethanol, and hy-drogen as electron donors for sulfate reduction. However, a wide range of different com-pounds such as short-chain fatty acids, other carboxylic acids, alcohols, sugars, amino acids, and aromatic compounds, may also act as electron donors for dissimilatory sulfate reduction. They are not able to grow with acetate as an electron donor, because of in-complete oxidization of organic compounds to acetate. In addition, they use sulfate, sul-fite, and thiosulfate and do not use nitrite as electron acceptors. The activities of SRB are controlled largely by the availability of oxidized sulfur compounds, especially SO4
2- and SO3
2-, which may be present in drinking water or/and foods as preservatives. Intestinal sulfate can also be derived from endogenous sources such as sulfated mucins (sul-fomucins), sulfate-conjugated bile, and chondroitin sulfate. Furthermore, the use of chem-ically bound, endogenous sulfate by SRB is facilitated through interactions with sulfatase-harboring bacteria (e.g. Bacteroides spp.)51,78,153-155. Bilophila spp. are non-saccharolytic bacteria, which produce acetic acid as major and succinic and lactic acids as minor fer-mentation products from peptone-yeast broth. In addition, ammonia is produced from urea and nitrate is reduced to nitrite and occasionally to N2. Moreover, desulfoviridin is weakly present in some strains, but sulfate is not reduced. Besides not being able to reduce sulfate, Bilophila spp. also differs from the other human-associated members of
1. Introduction
36
Desulfovibrionaceae in other ways; the G+C-content of Bilophila spp. is 40 mol%156, whereas that of human Desulfovibrio spp. ranges between 59 and 64 mol%154.
Class Gammaproteobacteria of Phylum Proteobacteria contains e.g. Family Enter-obacteriaceae, which includes several enterobacterial genera (e.g. Cronobacter, Entero-bacter, Escherichia, Klebsiella, Salmonella, Shigella, and Yersinia). Salmonella spp., Shigella spp., Yersinia spp., and many Escherichia coli types (EHEC, ETEC etc.) are widely recognized enteric pathogens, whereas other Escherichia spp., Enterobacter spp. and Klebsiella spp. are opportunistic human pathogens. Enterobacter spp. are facultatively anaerobic polysaccharolytic bacteria that produce CO2 and H2 as major fermentation products of glucose. In addition, some Enterobacter spp. are able to fix nitrogen. Most Cronobacter and Enterobacter bacteremias are acquired in hospitals. The majority of the infections are caused by E. cloacae. E. agglomerans and Cronobacter sakazakii (former Enterobacter sakazakii) are the next most prevalent causative agents. Moreover, C. sakazakii has been found on multiple occasions in infant milk powder, where it has caused meningitis and generalized sepsis. The increased prevalence of nosocomial in-fections may be due to increased resistance to antimicrobial agents and disinfectants157. Escherichia spp. are aerobic and facultatively anaerobic chemo-organotrophic, polysac-charolytic bacteria that produce lactic, acetic, and formic acids and usually CO2 and H2 (1:1) as fermentation products of glucose. In addition to fermentative metabolism, Esche-richia spp. also have respiratory metabolism. E. coli is a normal part of the human gut microbiota. Most E. coli strains are non-pathogenic, but certain serotypes play an im-portant role in intestinal and other diseases, e.g.: 1) Enteropathogenic E. coli (EPEC) are diarrheagenic E. coli, the pathogenic mechanisms of which have not yet been demon-strated to be related to heat-labile enterotoxins or heat-stable enterotoxins or Shigella-like invasiveness. In addition, EPEC are not invasive in the same way as Salmonella, Shigella, and Yersinia; 2) Enterotoxigenic E. coli (ETEC) do not invade epithelial cells, but produce one or more enterotoxins that are either heat-labile or heat-stable; 3) Enteroinvasive E. coli (EIEC) are, like Shigella, able to invade and multiply in the intestinal epithelial cells in the colon; 4) Shiga toxin producing (STEC) or Vero cytotoxin-producing (VTEC) E. coli have the ability to produce either one or both of at least two antigenically distinct cytotoxins. Enterohemorrhagic E. coli (EHEC) is used to describe a subgroup O157:H7 of STEC/VTEC that causes hemorrhagic colitis158. Shigella spp. are facultatively anaerobic, chemo-organotrophic bacteria that have both a respiratory and a fermentative type of metabolism and are able to reduce nitrates to nitrites. They produce pyruvate, which is further con-verted into formic acid, acetic acid, and ethanol, as a fermentation product from glucose. However, gas is not produced as a fermentation product. Shigella spp. are human intesti-nal pathogens that cause shigellosis (bacillary dysentery). Common clinical signs are fever, severe abdominal pain, and cramping. In addition, strains producing shiga-toxin may cause hemolytic uremic syndrome. Shigella spp. are acid-resistant. Moreover, sta-tionary phase cells of S. flexneri are able to survive for several hours at pH 2.5, which is thought to contribute to the low infective dose of Shigella spp. (as low as 10–100 organ-isms). Shigella spp. penetrate into the colon epithelial cells, multiply in them and thereaf-ter spread from cell to cell through the mucosa159. Yersinia spp. are facultatively anaero-bic bacteria that have both a respiratory and a fermentative type of metabolism and are mostly able to reduce nitrate to nitrite. Little or no gas is produced as a fermentation product. Y. pestis is the causative agent of plague, which is primarily a disease of wild
1. Introduction
37
rodents. Flea bites and ingestion of infected animal tissue transmit Y. pestis among wild rodents. If no other hosts are available, fleas may transmit Y. pestis to humans. Untreated plague evolves in 5–10 days to profound septicemia. Y. enterocolitica is another human pathogen, which mostly causes acute enteritis in children. In adults, the secondary clinical consequences also include arthritis and erythema nodosum160. Klebsiella spp. are facul-tatively anaerobic polysaccharolytic bacteria that produce 2,3-butanediol, CO2, and H2 as major glucose fermentation products. In addition, lactic, acetic, and formic acids are formed in smaller amounts. As well as fermentative metabolism, Klebsiella spp. also exhibit respiratory metabolism. Furthermore, most strains hydrolyze urea and β-galactosides, and some strains are able to fix nitrogen. Human Klebsiella infections are mainly caused by K. pneumoniae and K. oxytoca. Four components of Klebsiella have long been implicated in the pathogenesis: adhesins, capsular polysaccharides, lipopoly-saccharide (LPS), and iron-scavenging systems (siderophores)161. Salmonella spp. are chemo-organotrophic bacteria having both fermentative and oxidative metabolism. They ferment glucose to formate, ethanol, acetate, or lactate. The electron transport chain is cytochrome-based with oxygen, nitrate, fumarate, dimethyl sulfoxide, and trimethylamine oxide as terminal electron acceptors. Salmonella spp. usually cannot metabolize lactose or sucrose, but are able to hydrolyze 4-methylumbelliferyl caprylate, and produce H2S from sulfur-containing amino acids. Moreover, the genes for production of hydrogen sul-fide can be used as Salmonella-specific molecular markers. In addition, most serotypes of Salmonella are prototrophs162.
Class Epsilonproteobacteria of Phylum Proteobacteria contains e.g. Families Campylobacteriaceae (e.g. Campylobacter spp.) and Helicobacteriaceae (e.g. Helicobac-ter spp.). Campylobacter spp. are chemo-organotrophic bacteria, with a respiratory type of metabolism. Energy is obtained from amino acids or tricarboxylic acid cycle intermedi-ates, whereas carbohydrates are neither fermented nor oxidized. Most species are also able to reduce nitrate. Most of the Campylobacter spp. are human pathogens. Campylo-bacter jejuni subsp. jejuni is regarded as the most common bacterial cause of gastroen-teritis in humans worldwide. It is more common in children than in adults, and more prevalent in summer and fall than in winter and spring163. Helicobacter spp. are chemo-organotrophic bacteria, with a respiratory type of metabolism. Energy is obtained from amino acids, whereas carbohydrates are neither fermented nor oxidized when standard methods are used for testing of carbohydrate metabolism. However, genome analysis of Helicobacter pylori has revealed that H. pylori possesses catabolic pathways for glucose, and may therefore in theory be able to utilize glucose. Many Helicobacter spp. are human or animal pathogens. H. pylori is the leading microbiological cause of human gastric and duodenal ulcers. In addition, H. pylori infections have been associated with the develop-ment of atrophic gastritis and subsequent progression to gastric cancer, mucosa-associated lymphoid tissue lymphoma, adenocarcinoma of the distal stomach, and Mé-nétrièr’s disease (a disorder in which the gastric folds become hypertrophic). Moreover, H. pylori has been classified as a class 1 carcinogen by the International Agency for Re-search in Cancer of the World Health Organization164.
Most of the members of the Phylum Verrumicrobia are marine bacteria. However, Akkermansia muciniphila has been found in the human intestine. A. muciniphila is a chemo-organotrophic bacterium, which is able to use mucin as a carbon, energy, and nitrogen source. It can grow on a limited number of carbohydrates, including glucose, but

1. Introduction
38
only when a protein source is present. Moreover, it is also able to release sulfate in a free form from mucin fermentation165.
Phylum Fusobacteria is formed of the Families Fusobacteriaceae and Leptotrichiaceae. Fusobacteriaceae are found from both the oral cavity and gastrointestinal tract, whereas Leptotrichiaceae are mostly associated with the oral cavity. Fusobacterium spp. form butyric acid as a major end product from peptone or glucose (without isobutyric or isovaleric acids). Peptides are the most important energy source. Fusobacterium spp. are either non-fermentative or only weakly fermentative. The utilization of glucose is dependent on energy supplied by fermentation of amino acids. F. necrophorum is also able to deconjugate bile salts. Moreover, F. nucleatum and F. necrophorum, as well as other Fusobacterium spe-cies, possess a cell wall lipopolysaccharide with the characteristics of an endotoxin166. Lep-totrichia spp. are saccharolytic bacteria, which produce lactic acid as the major fermentation product. In addition, trace amounts of hydrogen sulfide are also produced167.
Domain Archaea, phylum Euryarchaeota 1.2.5
Methanogenic Archaea (MA) are a phylogenetically diverse group of strictly anaerobic Euryarchaeota with an energy metabolism that is restricted to the formation of methane from various components168. In the human GI-tract MA metabolize major fermentation products, such as alcohols, short chain organic acids, CO2, and H2
52,169. The diversity of MA in the human gut is scarce. The most abundant MA, Methanobrevibacter smithii, converts H2, CO2, and formate into CH4, using carbon as the terminal electron accep-tor170-171. M. smithii can remove fermentation end products, such as methanol and ethanol produced by other bacteria. The energy metabolism of the other human MA, Methano-sphaera stadtmanae, is limited to using H2 to reduce methanol to methane. In addition, it is dependent on acetate as a carbon source172. SRB and methanogens are largely mutu-ally exclusive in the colon (UK; 70% SRB, 30% MA)78. However, under conditions of sulfate availability SRB are able to outcompete methanogenic bacteria for H2
173.
The importance of the metabolic activities of the gut microbiota from the 1.2.6host’s perspective
From the host’s perspective, there are numerous activities of the commensal gut microbi-ota that are of great importance to health. Carbohydrates are mainly fermented in the proximal colon, whereas the fermentation of proteins takes place mainly in the distal colon. However, the metabolic output of the microbial community depends not only on available substrates, but also on the gut environment, with the pH playing major role. For example at pH 6.7 Bacteroides spp. predominate, whereas at pH 5.5 bacteria related to E. rectale predominate112,174-175. The main saccharolytic genera in the human gastrointes-tinal tract are Bacteroides, Bifidobacterium, Clostridium, Eubacterium, Lactobacillus, and Ruminococcus. They are able to produce SCFA, which have both local and systematic beneficial biological effects (Chapter 1.4.4.1 Dietary fiber). A wide range of bacteria have proteolytic activities, such as clostridia, Propionibacterium spp., Prevotella spp., Bifidobacterium spp., and Bacteroides spp. The protein metabolism, however, is not as favorable to the host as the carbohydrate metabolism; some of the end-products of amino
1. Introduction
39
acid metabolism may be deleterious to the host, e.g. ammonia, amines, and phenol com-pounds. Some species of the genera Bacteroides, ruminococci, and Akkermansia are able to break down mucin. Moreover, several Eubacterium spp. and Clostridium spp. are able to dehydroxylate bile acids, some Clostridium spp. transform conjugated bilirubin, Eubacterium coprostanoligenes is able to convert cholesterol to coprostanol and Bac-teroides spp. inactivate tryptic activity, have dipeptidase activity, and play a key role in the enterohepatic circulation of bile acids6,102,127-130,165.
In addition to the individual activities, cross-feeding between the gut microbes and the metabolic networks thus created are also of great importance. For example, it has been shown in vitro that lactate produced by Bifidobacterium adolescentis as a fermentation product from fructo-oligosaccharide (FOS) and starch was further utilized by butyrate producers, which were not able to grow solely on FOS and starch176. In addition, Rose-buria intestinalis and Anaerostipes caccae have been shown to be able to grow with Bifidobacterium longum using FOS; R. intestinalis was able to grow on FOS-supplemented medium when acetate, a major fermentation product of B. longum, was added to the medium, whereas A. caccae was able to utilize fructose which was released during the bifidobacterial fermentation of FOS177. Besides other survival mechanisms, gene transfer within and from outside the gut microbiota has also been shown to occur. In Japan, where consumption of marine algae is high, a Japanese gut bacterium (Bacteroides plebeius) has been shown to acquire genes coding for porphyromonases, agarases, and associat-ed proteins and thus the ability to utilize marine algae. These algae are not readily fer-mentable by Western gut microbiota178.
1.3 Methods used for studying the gastrointestinal microbiota
The application of molecular techniques for the identification and/or enumeration of differ-ent microbial groups has increased enormously during the past decade. Especially the 16S ribosomal RNA (rRNA)-based detection and enumeration techniques have advanced greatly. Molecular techniques enable faster detection and enumeration of specific bacte-ria than conventional culture-base methods. However, culture-based methods are still the only validated methods able to quantitate viable bacteria. When molecular techniques are applied to study microbial communities of the GI-tract, it should be kept in mind that the human oro-GI-tract is an open system – i.e. oral bacteria may be detected with molecular techniques from feces as well. Therefore, it is of the utmost importance to understand the limitations – as well as the advantages – related to the techniques applied (Figure 7).
In addition to the analysis techniques applied, sampling and transportation may also affect the quality of the samples. Conditions during sample transportation have a major impact on sample quality and therefore the time between sampling and further processing and storing should be limited to the minimum. It should be kept in mind that regardless of how sophisticated the applied method for characterization of the microbial community is, the result can be only as good as the sample which arrives in the laboratory. Furthermore, the sample processing method must be chosen taking into account both the properties of the target microbial groups and the method used in the subsequent detection step.

1. Introduction
40
Figure 7. Microbiological analysis of human samples.
Microscopy 1.3.1
There are several types of microscopy that may be used for the study of microbial com-munities. Light microscopy is nowadays used mainly for verification of the purity of bacte-rial isolates or for studying the effects of gram- or spore-staining, whereas fluorescence microscopy has widely been used in microbial ecology. Epifluorescence microscopy (two-dimensional) and confocal scanning laser microscopy (CSLM; three-dimensional) are used for studying specimens that fluoresce. Furthermore, CSLM allows a detailed, non-destructive examination of thick microbial samples. The advantages of fluorescence mi-croscopy are rapidity, easy usability, and visualization of spatial distribution of cells. With a suitable combination of fluorescent stains, the differentiation between viable and dead cells is possible179-180. Transmission electron microscopy (TEM), scanning electron mi-croscopy (SEM), and atomic force microscopy (AFM) allow higher resolution of the cell structure than the light-based microscopies. In TEM and SEM, electrons are used for imaging instead of light. The resolution of TEM enables the imaging of molecules (pro-teins, nucleic acids etc.). However, since electrons are only able to penetrate extra thin layers, ultra-thin specimens are needed; e.g. several thin layers are needed for a single bacterium181. In SEM, information about the sample’s external morphology, chemical composition, crystalline structure, and orientation of materials making up the sample may be obtained. In addition, layering is not needed. The sample is coated with a thin layer of conducting material, commonly carbon, gold, or some other metal or alloy, and thereafter analyzed from above182. AFM allows the investigation of surfaces on an atomic scale. Images are obtained by measurement of the force on a sharp tip created by the proximity to the surface of the sample. The force is kept small and at a constant level with a feed-back mechanism183.

1. Introduction
41
Culturing 1.3.2
An ideal method for studying microbial communities would detect and enumerate all mi-crobial species present in the samples with equal efficiency. It has been speculated that many microbial communities are too diverse to be counted exhaustively, which has led to the application of statistical approaches for estimation of the diversity184. Microbial com-munity analysis by cultivation is extremely laborious, especially when complex samples with high diversity are studied. If cultivation is used for microbial community analysis, several non-selective and selective culture media and different growth conditions includ-ing different temperatures and atmospheres, followed by accurate identification of a large number of isolates from each medium, should be included in order to obtain the best possible overview of the diversity of the microbial population. The dominant cultivable population is recovered from non-selective media, whereas selective media allow detec-tion of groups or species that are present in lower numbers. Identification of isolates with traditional methods is based on the assessment of several phenotypic features, which is often inaccurate, and may lead to underestimation of the species diversity. Currently, this is combined with molecular identification techniques, e.g. sequencing.
A large fraction (>80%) of the GI-tract microbiota has not yet been cultured55, partly due to the poor ability of the routinely used culture media and growth conditions to recover a large fraction of the microbial population185. Culture-based studies are, therefore, nowa-days used to a lesser extent. However, culture-based studies also enable phenotypic as well as genotypic identification, and especially in those cases where phenotypic identifica-tion is crucial (e.g. antibiotic resistance186), culture-based studies can still offer more information than purely genotypic studies.
Molecular techniques 1.3.3
A commonly used target for bacterial detection and enumeration is 16S rRNA. Ribo-somes are two-subunit rRNA-protein complexes. In prokaryotes, the small subunit in-cludes a 16S rRNA, whereas the large subunit includes 23S and 5S rRNAs. 16S rRNA sequences can be used to infer phylogenetic relationships, and to identify unknown mi-crobes by database comparisons187. Since DNA remains relatively intact in non-viable cells, the methods targeting DNA (e.g. 16S rRNA gene) enumerate both viable and dead cells188-189. RNA is more labile than DNA and more susceptible to degradation caused directly by deleterious conditions/treatments190. Due to the fact that environmental condi-tions influence the cellular rRNA content, the amount of rRNA in cells is considered to correlate with the growth rate191. However, the rRNA molecule remains stable for some time after cell death; therefore, the rRNA content of a bacterium may not correctly reflect its physiological status. A more attractive molecular indicator molecule for bacterial viabil-ity would be messenger RNA (mRNA), due to its rapid degradation after cell death. How-ever, the extent of degradation varies according to the type and severity of the treatment used for killing of the bacteria190. Furthermore, since detection of mRNA in viable cells may depend on their physiological status, cells that are stressed, or viable but poorly culturable, may contain too low quantities of mRNA for detection192. In addition to 16S rRNA, other housekeeping or functional genes – such as genes associated with sulfate

1. Introduction
42
reduction (dsrAB gene) or methane (mcrA gene) or butyrate (butyryl-CoA:acetate CoA-transferase gene) production193-196 – may be used as targets for PCR and/or hybridiza-tion. However, the sequence databases for other genes besides 16S rRNA contain only limited numbers of sequences, thus limiting their use in microbial ecological studies188.
Hybridization 1.3.3.1
Hybridization techniques can be used in bacterial identification either alone or combined with a preceding PCR step. In hybridization, a labeled probe anneals to a denatured target DNA / RNA with sequence homology197-198. Target DNA / RNA can be directly blotted onto a mem-brane, or if size information of the hybridization target is warranted, the target DNA / RNA is first run through an agarose gel and then transferred to a membrane. Detection of hybrids is based on radioactive signal, fluorescence, or color reaction, depending on the type of label. By determining the intensity of the hybridization signal, the number of target organisms can be estimated199. However, it should be noted that the relative amount of an rRNA sequence does not reflect the true abundance of the microbe, since the amount of rRNA per cell var-ies according to the species and the metabolic activity of the bacterial cell200. Neverthe-less, the relative quantity of rRNA provides a reasonable measure of the relative physiologi-cal activity of a specific population201. Dot-blot hybridization has been used to measure the quantity of a specific 16S rRNA in a mixture relative to the total amount of rRNA from human GI-samples in several studies15,59,62,67,70,73,80,202-204.
Microarrays, which are miniaturized and automated forms of a dot-blot hybridization, facilitate the study of large numbers of genes simultaneously by hybridization of DNA or mRNA to a high-density array of immobilized probes205-207. There are two major types of DNA microarrays; an oligonucleotide-based array and a PCR product-based array. Cur-rently there are several microarrays developed for the analysis of human oro-gastrointestinal tract microbiota208-219.
The detection of whole bacterial cells via labeling of specific nucleic acids with fluo-rescently labeled oligonucleotide probes is called fluorescent in situ hybridization (FISH). FISH requires no cultivation and cells can be fixed before analysis, thus enabling the storage of samples prior to analysis220-221. The whole-cell or in situ hybridization tech-nique has become a much used molecular tool in microbial ecology, since organisms or groups of organisms can be identified with minimal disturbance of their environment and spatial distribution. FISH in combination with epifluorescence microscopy and/or flow cytometry is a widely applied method to analyze and quantify microbial communities of the human oro-gastrointestinal tract15-16,63-64,66-69,71,74,77,222-227.
Multiplexed quantification of bacterial 16S rRNA by solution hybridization with oligo-nucleotide probes and affinity capture (transcript analysis with the aid of affinity capture; TRAC) has also been used for the detection of GI microbiota65,228. In TRAC, biotinylated RNA is hybridized with multiple probes. Thereafter, the hybrids are affinity captured on streptavidin coated paramagnetic beads and washed. The hybridized probes are eluted and their quantity and identity are determined by capillary electrophoresis. The signal intensities of the recorded probes correspond to the amount of target nucleic acid in the mixture, while the size indicates the target228.
1. Introduction
43
PCR-amplification 1.3.3.2
Reliable and reproducible lysis of microbial cells, as well as the extraction of intact nucleic acids from any habitat is a demanding task229-230. In addition, removal of substances, which may interfere with hybridization or PCR amplification, may be difficult229. The cell lysis can be performed by enzymatic (e.g. lysozyme, lyticase or proteinase), chemical (e.g. detergents or guanidium isothiocyanate), or mechanical procedured (e.g. freeze-thaw/freeze-boil cycles, bead-beating, or microwave heating). In many cases, e.g. for the identification or fingerprinting of isolates obtained by culture, the crude cell lysate can be used directly in a subsequent molecular analysis. However, since oro-GIT samples con-tain inhibitory compounds, crude cell lysates are not sufficient when direct molecular detection methods are applied. Further processing steps include removal of proteins, which has commonly been performed by phenol-chloroform extraction, followed by pre-cipitation of nucleic acids by ethanol, isopropanol or polyethylenglycol precipitation, and purification of nucleic acids231-232. Numerous articles have been published in which differ-ent DNA extraction protocols have been described for GIT samples233-240. When the met-abolically active fraction of the community is of interest, the analysis should be performed with RNA rather than DNA. However, while extracting RNA from oro-GIT samples, special attention should be paid to avoiding degradation of RNAs with RNAses during the extrac-tion procedure (for a review, see230). There are several articles describing different RNA extraction procedures for the GI-tract microbiota239,241-243. In addition, there are also sev-eral commercial kits available for the DNA and RNA extractions237-238, 244-246
In PCR, a thermostable DNA polymerase is used to exponentially amplify a target DNA sequence defined by two oligonucleotide primers247. The amplified DNA fragment can be visualized by agarose gel electrophoresis, which also allows the size determina-tion of the PCR product, or by hybridizing the PCR product with a labeled probe. PCR techniques are very sensitive, and small amounts of contaminating DNA carried e.g. from one run to the next can give false positive results. Many types of sample matrices (e.g. feces) contain factors which can either totally inhibit the PCR reaction or cause partial inhibition leading to a non-exponential amplification of the target DNA. Inhibition may be avoided or reduced by pre-PCR sample manipulations such as dilution of the sample material, optimization of the used DNA/RNA extraction protocol, or by harvesting the bacterial cells from the sample e.g. by centrifugation, filtration, or using immunomagnetic beads coated with specific monoclonal antibodies to the target organism. However, even partial inhibition of the PCR reaction inevitably leads to reduced sensitivity and excludes the possibility of performing quantitative PCR. To minimize the risk of obtaining false-negative amplification results suitable external standards, which are co-amplified together with the target DNA in the PCR reaction, may be used230,248.
When PCR is applied to human oro-GIT samples several problems arise including in-hibition of PCR amplification by co-extracted contaminants, differential PCR amplification, formation of PCR artefacts e.g. chimeric molecules (leading to description of non-existing species), and DNA contamination. It should also be noted that 16S rRNA gene sequence variations due to ribosomal RNA operon heterogeneity can interfere with the analysis (for a review, see230). When PCR is used in direct bacterial detection from sample materials containing other microbes, the validation of the protocol applied is of utmost importance. The chosen method must be tested with a large panel of strains representing the target

1. Introduction
44
species, closely related species, and other microbes commonly present in the sample material249. If only in silico testing is performed, the specificity of the applied PCR may not necessarily be as expected. This, and the fact that different methods must be applied to overcome the inhibitory effects of different sample matrices, necessitates the use of tailor-made approaches for each microbe-sample matrix pair. A positive control for each analy-sis is important in order to confirm that inhibitory substances do not interfere with the detection and cause false negative results.
Quantification of the initial amount of target is not possible in traditional end-point PCR because the amount of PCR product is already determined when the reaction has reached the plateau phase. In real-time PCR (qPCR), the amount of PCR product is measured at each cycle, including during the exponential phase, which enables quantifi-cation of the initial template amount. The real-time measurement is based on fluorescent dyes that either bind to double strand DNA or hybridize to a specific sequence. Since q PCR is especially vulnerable to inhibitory compounds, internal standards should always be used when complex sample matrices are studied248
There are numerous articles in which PCR and/or qPCR have been applied to sam-ples from the human gastrointestinal tract145,236-237,250-255. However, nowadays endpoint PCR is mainly used as a preceding step before further characterization with DGGE, RAPD, microarrays etc.
Community analysis 1.3.3.3
Genetic fingerprinting techniques can be used to characterize bacterial communities or single bacterial isolates (Section 1.3.3.4). Genetic fingerprinting techniques of microbial communities provide a pattern or a profile of the community diversity based on the physi-cal separation of unique nucleic acid sequences. Community fingerprinting techniques are relatively easy and rapid to perform and they allow simultaneous analysis of multiple samples, enabling the comparison of genetic diversities of microbial communities from different habitats, or studying the behavior of individual communities over time. Denatur-ing gradient gel electrophoresis (DGGE) has been used in numerous studies for charac-terization of the microbiota within oral cavity, colon, and feces56-57,65,237,242,256-260. Temper-ature gradient gel electrophoresis (TGGE), single-stranded conformation polymorphism (SSCP), and terminal restriction fragment length polymorphism (T-RFLP) have been used to a lesser extent than DGGE in the characterization of the human GIT45,48,56,261-264. In DGGE and TGGE, PCR-amplified DNA fragments of the same length but with different DNA sequences can be differentiated. Separation in DNA fragments is based on the electrophoretic mobility of a partially melted double-stranded DNA molecule in poly-acrylamide gels containing a linear gradient of DNA denaturants (a mixture of urea and formamide; DGGE) or a linear temperature gradient (TGGE). Partially melted DNA frag-ments are held together with a G+C-rich oligonucleotide, a GC-clamp. Therefore, each denaturing fragment theoretically generates only a single band in the gel. DGGE analysis combines a direct visualization of bacterial diversity and the opportunity for subsequent identification of community members by DNA fragment sequence analysis or hybridiza-tion with specific probes. However, DGGE has some specific limitations. DGGE can be used to separate only relatively small fragments, and it displays only the rDNA amplicons obtained from the predominant (over 1% of the population) species present in the com-
1. Introduction
45
munity265-266. The presence of heterogeneous 16S rRNA genes (16S rRNA genes that exhibit small sequence variations in the genome of a given strain) can result in several bands in a DGGE/TGGE profile56,256,267. Furthermore, a single band may represent more than one strain242,256,268. The construction of 16S rRNA gene clone libraries and the screening for different clones by DGGE may overcome these deficiencies269-270.
Denaturing high-performance liquid chromatography (DHPLC) has also recently been utilized in microbial community fingerprinting271-272. In DHPLC, PCR-products are sepa-rated using HPLC equipment instead of a denaturing gel, which enables automation and higher throughput than in manually handled DGGE. DHPLC has already been used for the analysis of human fecal samples271,273-274, in which the new method proved to be as efficient as DGGE. However, the microbiota in the samples has not been as diverse as e.g. the predominant microbiota of elderly subjects. A drawback of the currently used DHPLC-method is the price of the equipment. However, a recent study demonstrated that traditional HPLC equipment may also be used for the analysis275.
Clone libraries have been applied in gut microbiota research to a great extent. After the PCR step, the amplification product is purified, ligated to a vector and thereafter the ligated products are transformed into competent E. coli cells. The colonies of ampicillin-resistant transformants are randomly picked and thereafter processed for sequencing61. The first clone libraries constructed from the human gut microbiota were sequenced using Sanger sequencing55,61,276-277, whereas in recent publications next-generation sequencing (NGS) has been applied for direct sequencing of the DNA-template (see Section 1.3.3.5 Metagenomics) or for sequencing of the PCR-products (e.g.41,278-289). In addition, in most of the Human Microbiome Project publications (http://hmpdacc.org/pubs/publications.php) NGS has been applied. There are several different approaches to NGS, depending on the equipment manufacturer, which were nicely reviewed by e.g. Shendure & Ji290, Metzker291, and Kuczynski et al.292. A common feature of all the NGS techniques today is that a mas-sive amount of data is generated rather rapidly and with rather low cost. However, since the amount of data is indeed massive, the bioinformatics-part of the data is a demanding and laborious step, thereby counteracting the cost-effective approach.
Typing of bacterial isolates 1.3.3.4
Fingerprinting of bacterial isolates can be performed by a variety of techniques including e.g. ribotyping, amplified ribosomal DNA restriction analysis (ARDRA), pulsed-field gel electrophoresis (PFGE), randomly amplified polymorphic DNA (RAPD), repetitive element sequence-based-PCR (rep-PCR), and amplified fragment length polymorphism (AFLP). All these techniques aim at differentiating bacterial isolates at the subspecies level, pref-erably even at the strain level. PFGE and RAPD were used in the experimental part, and they are therefore discussed in more detail.
Random amplified polymorphic DNA (RAPD). In RAPD fingerprinting, one or two pri-mers (usually 10–12 bp long) are arbitrarily selected and allowed to anneal to the bacterial genomic DNA template at a low stringency, thus resulting in several amplification products of varying sizes. The products are thereafter resolved electrophoretically to yield a RAPD-fingerprint293. RAPD typing is fast to perform, especially if the fingerprinting can be per-formed directly on single colonies growing on an agar plate. Due to the low stringency of the PCR amplification, RAPD-fingerprints can show some variation (especially in band strength)
1. Introduction
46
and therefore the fingerprint comparisons must be performed visually by an experienced person. However, when strictly identical conditions (same thermocycler, reagents etc.) are used, the method is usually reliable294. RAPD banding pattern reproducibility can be im-proved by using a procedure in which the same strains are exposed to three different an-nealing temperatures (with increasing stringency) and by identifying the stable amplicons295. This triplicate procedure naturally makes the RAPD fingerprinting technique more laborious. RAPD is best suited for studies in which a specific bacterial strain (e.g. a certain food-borne pathogen) is searched among a large number of isolates. With RAPD, bacterial isolates with clearly different fingerprints can be quickly identified and rejected and the remaining – fewer – strains then further characterized with another, more laborious technique (e.g. ribotyping, PFGE, AFLP). RAPD is not well suited for inter-laboratory or taxonomical studies or for studies in which the aim is to develop a fingerprint database.
Pulsed-field gel electrophoresis (PFGE). Due to the problems encountered with conventional ribotyping of bacterial genomes, bacterial fingerprinting technique was de-veloped in which profiles consisting of fewer numbers of larger sized genomic restriction fragments were obtained. In this technique, bacterial genomic DNA is restricted in situ (in a gel block) with a rare cutting restriction endonuclease such as SmaI, SfiI, NotI, or BssHII, and the restriction fragments are separated by pulsed-field gel electrophoresis (PFGE; a special technique capable of resolution of large DNA fragments)296. With PFGE highly discriminative fingerprinting of bacterial isolates can be performed. Of the different molecular fingerprinting methods PFGE has in many cases proved to be the most dis-criminative142. However, PFGE is a laborious technique and it is not usually applied in studies in which large numbers of isolates are characterized.
Metagenomic studies 1.3.3.5
Metagenomics may be defined as the application of NGS to a DNA-template obtained directly from a sample142. Recently there have been several metagenomic studies on the human gut microbiota e.g.4,54,298-305. In most studies, metagenomic approach is applied to study the genes present in the microbiota. The gene-pool of human fecal microbiota has been found to be enriched with genes responsible for e.g. (pro)phage-related proteins, biodegradation of complex sugars and glycans, carbohydrate fermentation (e.g. man-nose, fructose, cellulose, and sucrose), vitamin production etc.2,4,54, which is not surpris-ing taking into account the known properties of the most abundant human gut microbes (Section 1.2 of this thesis). As with any NGS-technique, the amount of data obtained is enormous. However, metagenomic studies are usually performed with Illumina technique, and thus the obtained sequence length is usually <200 bp. This makes the bioinformatics part even more demanding than when NGS is applied to a PCR-product.
The effect of the used method on the results 1.3.4
Most of the steps in the processing of fecal samples (Figure 5) may affect the microbiologi-cal results obtained. The sampling and storage conditions have been shown to affect the results280,306-307, although not as extensively as the following steps, especially the DNA extraction236-237,308. The initial two week storage at -20oC has been shown to decrease the
1. Introduction
47
detected numbers of Bacteroides spp. by over 1 log unit as compared to the fresh samples, whereas the storage temperature has not been shown to have such a significant effect on the gram-positive bacteria (e.g. Firmicutes and Actinobacteria)237. Since the analysis of fresh fecal samples, especially in the case of large cohorts, is impractical and mostly also impossible, the effect of the storage conditions on the results obtained should be taken into account when the results are discussed. When DNA-extraction is performed using solely chemical treatments combined with heat treatments, it has been shown that the results for some bacterial groups may be as much as 4 log-values lower as compared to a DNA ex-traction method in which rigorous mechanical disruption is applied237.
Actinobacteria, in particular, have been shown to be underestimated with many cur-rently used techniques, most probably due to their high G+C content309. In a study of Nakamura et al.310, it was shown that when the same samples were examined with qPCR (enzymatic DNA-extraction) and FISH, the difference in results was enormous. The pro-portions of bifidobacteria with qPCR was detected to be 0.1 -1.7%, whereas the proportion with FISH was 28–84%310. Moreover, in studies in which clone libraries have been con-structed, the primer Bact-8F (synonyms: e.g. 008F) targets bifidobacteria only poorly262, and therefore in studies in which this primer has been used the abundance of bifidobacteria has been underestimated (e.g.55,61,311). In addition, the normally used 95oC for denatura-tion in PCR-amplification may not be sufficient for high G + C content bacteria, such as Actinobacteria and SRB312.
Another methodological aspect that may cause confusion is that different probes/primers target different bacterial populations, such as in the detection of Bac-teroidetes and Firmicutes. In pyrosequencing/metagenomic studies the authors usually refer to Bacteroidetes, whereas in studies conducted with FISH/PCR, the studied bacterial population is usually narrower (e.g. Bacteroides spp. or Bacteroides-Prevotella group)313. The same controversy applies to Firmicutes. In many pyrosequencing studies Firmicutes are discussed as a single group, whereas in fact it contains several different bacterial classes – e.g. Bacilli, Clostridia, Erysipelotrichia – which all have different metabolic properties. Furthermore, when PCR/FISH is used, each of these groups is usually studied separately. Moreover, since the phylum Bacteroidetes is more thoroughly characterized than the phylum Firmicutes, it is possible that the representation of Bacteroidetes in met-agenomic studies is over-estimated.
When microbial communities are examined, especially using several different tech-niques and/or next-generation sequencing, the quantity of data generated is enormous. Therefore, the use of suitable algorithms for e.g. measurement of microbial diversity and correct interpretation of the results are of utmost importance292,314-320. Moreover, we should also bear in mind that even if statistical significance is achieved, the observed changes may not be of biological significance.
1.4 Factors affecting the autochthonous microbiota
There are several factors that affect the composition of the human gastrointestinal micro-biota, and thus potential dysbiosis (Figure 8).

1. Introduction
48
Figure 8. Proposed causes of dysbiosis of the microbiota (adapted from292, 314-320)
Age 1.4.1
Bacterial colonization of the infant gastrointestinal tract is influenced by e.g. mode of delivery, prematurity, type of feeding (breast feeding vs. formula feeding), antibiotic treatment of the child or the mother, lifestyle, and geographics225-226,274,321-324. The earliest colonizers are usually facultative anaerobic bacteria such as Enterobacteriaceae, strepto-cocci and staphylococci, whereas later colonizers tend to be strict anaerobes e.g. bifidobacteria, clostridia, and Bacteroides spp. regardless of the infant’s geographical origin and methods used for the detection225,270,311,325-328. Immediately after birth, within the first 24-h, the rectal microbiota of vaginally delivered babies has been shown to re-semble their own mother’s vaginal microbiota (i.e. dominated by Lactobacillus, Prevotella, or Snethia spp.), whereas the rectal microbiota of babies delivered by Caesarean section (C-section) resembled that of the skin (e.g. Staphylococcus, Corynebacterium, and Pro-pionibacterium spp.)329. Infants delivered by C-section harbor fewer bifidobacteria and higher proportions of Bacteroides, the Atopobium cluster, and C. difficile at early infancy than those delivered vaginally. In addition, at the age of one month, the total gut bacterial count of vaginally delivered infants has been reported to be higher as compared to infants delivered by C-section225,330. The gut microbiota of preterm infants is less diverse than those of full-term babies, and the main bacterial groups found have been Enterococcus, Streptococcus, Staphylococcus, and Clostridium spp., whereas the levels of Bifidobacte-rium, Bacteroides, lactobacilli, and the Atopobium-cluster are lower262,274,323,331-332.
There are numerous studies in which the predominance of bifidobacteria in exclusively breast-fed infants has been found (regardless of the detection method used)143,225, 255, 324, 333-335. At the age of 3–6 weeks, exclusively breast fed infants harbor higher numbers of bifidobac-teria, whereas formula-fed babies have more diverse microbiota, lower numbers of bifidobacteria and higher numbers of Bacteroides, Eubacterium rectale group, Lactobacillus group, C. difficile, and the Atopobium cluster225,321, 324,333,336-337. At the age of two years, the breast-fed children have been reported to have higher numbers of enterococci322.
Children who have received antibiotics during the first year/s of life have lower numbers of enterococci and lactic acid bacteria as detected by culture-based analysis, and Bac-
1. Introduction
49
teroides and bifidobacteria as detected with molecular techniques321-322. Lifestyle has also been shown to be associated with the development of the gut microbiota. Children living according to an anthroposophic lifestyle (restricted use of antibiotics, greater consumption of vegetables, etc.) have been reported to have higher bacterial diversity than omnivorous control children and farm children (greater consumption of farm milk, contact with animals, etc.). The farm children were reported to have the lowest bacterial diversity as compared to the children living according to anthroposophic lifestyle and control children261.
In addition to the aforementioned factors affecting the intrinsic microbiota of infants, mother’s weight at delivery and weight-gain during the pregnancy, have also been asso-ciated with the infants’ microbiota. Fecal Bacteroides and Staphylococcus were higher in infants of over-weight mothers during the first 6 months of life. Furthermore, prevalence of A. muciniphila and C. difficile were lower in infants of normal-weight mothers and of mothers with normal weight gain during pregnancy338. However, the microbiota of the mothers was not studied. Longer daily time of crying and fussing in infants of 7–12 weeks of age has also been associated with lower numbers of bifidobacteria and lactobacilli339.
By the end of the first year of life, when the child has already started to eat the same foods as the adults, the gut microbiota starts to converge towards a profile characteristic of the adult microbiota311,337. However, the fecal bacterial diversity is still lower312. By the end of the second to third year, the phylogenetic composition evolves towards the adult-like composition335,340.
It was already shown several decades ago that the gastrointestinal microbiota evolves with age341. Dental deterioration, salivary function, digestion, slower intestinal transit time, and changes in diet and physical activity may affect the gastrointestinal microbiota of aging people. Interest, as well as the number of studies, in the gastrointestinal microbiota of elderly people has grown as life expectancy in the western world has rapidly increased. The elderly have been reported to have relatively stable microbiota211,278,342. However, the microbiota of the elderly has been reported to be more diverse and to contain partly dif-ferent core microbiota as compared to younger adults211,278,343-344. Moreover, inter-individual variation is greater in elderly people as compared to younger adults14,278,344-345.
In culture-based studies, Asian elderly subjects have been reported to have lower levels of bifidobacteria and higher levels of clostridia, lactobacilli, streptococci, and Enter-obacteriaceae than younger adults346-347. Moreover, in European culture-based and mo-lecular studies the results have been partly contradictory64,204,211, 278,342,345,348-350. Moreo-ver, the difference in several bacterial groups between elderly people and younger adults has been shown to be dependent on geographical location64. The number of bifidobacte-ria has been shown to be lower in most of the European studies in elderly subjects as compared to younger adults64,204,278,342,349-353. The absence of bifidobacteria, or their low numbers in the elderly, may have metabolic and health consequences for the host, since they affect immune system function and a multiplicity of other functions – e.g. synthesis of vitamins and protein, and supplementation in digestion and absorption204,347. Furthermore, genomic DNA of some bifidobacterial strains has been shown to stimulate production of the Th1 and pro-inflammatory cytokines, interferon (IFN)-gamma and TNF-alpha354. In addition, bifidobacteria are involved in colonization resistance in the bowel204. Besides reduction in numbers, diversity of the bifidobacterial population has been reported to decrease with age in some studies342,351, whereas others have had contradictory results344.
1. Introduction
50
The abundance of the Bacteroides – Prevotella group has been reported to decrease in French, Italian, Swedish, Dutch, and Finnish elderly people, whereas in German and Austrian elderly people an increase was observed with molecular techniques64,211,255,348. By contrast, German elderly people were reported to have decreased numbers of Bac-teroides – Prevotella group bacteria using culture-based techniques355 and Finnish elderly people had a higher relative proportion of Bacteroides spp. with clone library based anal-ysis356. Moreover, in recent pyrosequencing-based studies of Irish elderly people, it was reported that Bacteroidetes was the most dominant fecal bacterial phylum in 68% of the elderly individuals, with an average proportion of 57% (range 3% to 92%). More than half of the core microbiota (53%) in the elderly subjects comprised Bacteroidetes belonging to the genera Bacteroides (29%), Alistipes (17%), and Parabacteroides (7%) as compared to 8–27% in the younger adults278,345.
In the Irish elderly people the phylum Firmicutes had an average proportion of 40% (range 7% to 94%), whereas proportions of the total number of reads for clusters IV and XIVa ranged from 1.7% to 34% and 1.1% to 22%, respectively278,345. The abundance of bacteria belonging to the Clostridial cluster XIV has been reported to clearly increase in the German elderly population, whereas a clear reduction has been observed in the Ital-ian, Dutch, Finnish, and Japanese elderly populations64,348,356-357. In addition, significant increase in Clostridial cluster XIV diversity and reduction in relative abundance of Eubac-terium hallii-like bacteria has been observed in Finnish elderly people211,344.
F. prausnitzii subgroup and Clostridial cluster IV have been reported to clearly de-crease in Italian, Swedish, Dutch, French, and Austrian elderly people64,348,352-353, where-as in Irish elderly people the proportion of Faecalibacterium spp. and consequently Clos-tridial cluster IV was higher than in younger adults278. Similarly to these studies, copy numbers of the butyryl CoA:acetate CoA-transferase gene responsible for butyrate pro-duction have been shown to be reduced in elderly Austrian people358.
In many studies the abundance of lactobacilli has been shown to increase or to remain stable, regardless of the nationality of the studied elderly people211,255,347-348,352,355-356. The levels of enterobacteria have been reported to increase with age in German, Dutch, and French elderly populations255,348,355, similarly to the studies of Asian elderly people357.
Italian centenaries have been reported to have less diverse microbiota than the elderly (aged 63 to 76 years; average 73) or the younger adults (aged 25 to 40 years; average 31). The microbiota of the centenaries was enriched in facultative anaerobes, mostly belong-ing to Proteobacteria and Bacilli. In addition, the centenaries tended to have a higher prevalence of Archaea. On the other hand, the relative proportion of E. rectale group was lower in the centenaries than in the elderly and in the younger adults and numbers of bifidobacteria were lower. Furthermore, although the relative proportion of the C. leptum group was unaffected, the proportion of the F. prausnitzii subgroup decreased, indicating rearrangement in the species composition of the C. leptum group359.
Gender 1.4.2
There are not many articles in which the effect of gender on the gut microbiota has been studied, although some differences have been found; e.g. the numbers of the Bac-teroides-Prevotella group in feces have been found to be higher in males than in fe-males64,360. Most likely there are also other not yet reported differences, since there are
1. Introduction
51
many anatomical, hormonal, and other physiological differences between the genders, but due to other confounding factors bacterial differences between genders are not easily detectable. Moreover, the microbiota of premenopausal and postmenopausal healthy women has been shown to differ, stressing even more the hormonal effects361.
Genetics of the host and geography 1.4.3
Twins, especially monozygotic (MZ) twins, have been reported to have more similar interin-dividual fecal microbiota than unrelated people. In addition, twins and their mothers have been found to have a more similar microbiota than unrelated individuals. These findings have led to the conclusion that the host genotype affects the development of the gut micro-biota and gut bacterial composition57,83,284,362-363. However, the aforementioned studies have been conducted with MZ pairs concordant for leanness or obesity. Simões et al.364 studied MZ twins concordant and discordant for obesity, and found that the concordant normal-weight MZ twins had more similar bacterial populations than the MZ twins discordant for obesity. Especially those discordant twins whose liver-fat values differed greatly had less similar bacterial populations. These findings also address the importance of the diet in addi-tion to the genetic drivers364. Although the genetics or the shared environmental factors during upbringing result in more similar bacterial populations, viromes have been shown to be unique to individuals regardless of their degree of genetic relatedness79.
Besides genetics, the effect of the geographic origin (which may also include genetic differences) has also been studied in relation to the gut microbiota composition. Even in Europe some differences may be found between different countries, e.g. proportions of bifidobacteria have been found to be two- to threefold higher in an Italian adult study population than in other European study populations. Other bacterial differences, alt-hough non-significant, were also found in the European studies63-64. In addition, when 6-week old infants across Europe were studied, geography was found to be a more promi-nent factor than delivery mode, breast-feeding, and antibiotics. In infants, children from Northern European countries had more bifidobacteria, whereas the southern European infants were associated with more diverse microbiota and higher numbers of Bacteroides than the Northern European children225. In the studies involving people from different continents, the bacterial population differences have been more distinct. In a comparison of healthy people from southern India and the United States, it was found that 36% of the Americans as compared to 14% of the Indians were able to metabolize digoxin (metabo-lized by e.g. Eggerthella lenta)365. Furthermore, in a few recent studies there have been consistent results that the European and North-American fecal microbiota differs significant-ly from the Southern-American, African and Chinese fecal microbiota335,360,366. However, in all these studies it is not possible to exclude the impact of other possible confounding fac-tors, and therefore dietary habits and genetics may also contribute to the differences.
Diet 1.4.4
The main external factors that can affect the composition of the microbial community in generally healthy adults include major dietary changes and antibiotic therapy. The effect of diet on the GI-tract microbiota is not completely clear, although changes in some se-
1. Introduction
52
lected bacterial groups have been observed due to controlled changes to the normal diet – e.g. high-protein diet 367-368, prebiotics344, 369-371, probiotics372-377, weight-loss diet82,378-379 and berries380. More specifically, changes in the type and quantity of non-digestible car-bohydrates in the human diet influence both the metabolic products formed in the lower regions of the GI-tract and levels of bacterial populations detected in feces381. The inter-actions between dietary factors, gut microbiota and host metabolism are increasingly demonstrated to be important for maintaining homeostasis and health382.
Diet influences bacterial metabolism, and specific items in the diet may have selective effects in the microbiota, which may be important for health51. It has been shown with culture-based methods367 that the counts of Bacteroides sp., B. vulgatus, B. fragilis, and unidentified clostridia increased significantly, whereas counts of Bifidobacterium adoles-centis decreased significantly during a high-beef diet as compared to a meatless diet (fat and fiber contents were essentially the same in both diets). In addition, sulfide concentra-tions have been shown to be high on a high-beef diet383. Since H2S is toxic to the colonic epithelium and sulfide has been shown to inhibit butyrate oxidation, dietary sulfide may selectively stimulate the growth of a single group of bacteria, namely SRB, with potentially harmful effects on the epithelium51,384. In addition, diet with high protein and low carbohy-drate content has been shown to reduce the numbers of Roseburia / E. rectale group, while increasing proportions of branched-chain fatty acids and concentrations of phenyla-cetic acid and N-nitroso compounds368. Moreover, it should be noted that the World Can-cer Research Fund released in May 2011 a report based on 1012 clinical trials, in which red and processed meat were convincingly associated with increased risk, whereas foods containing dietary fiber, in particular cereal fiber and whole grains, were associated with decreased risk of colorectal cancer385-387.
The impact of habitual diet on fecal microbiota has been studied for decades. In older culture-based studies it was found that numbers of bacteroides were lower and numbers of enterococci and E. coli higher in Ugandan, Indian, and Japanese people on high-carbohydrate diet as compared to people on a Western diet388-389. However, when Eng-lish people on a strictly vegetarian diet were studied, their microbiota resembled those of people on a Western diet more than the microbiota of other vegetarian people from different continents388. Similarly, numbers of bacteroides and clostridia were lower in the Nigerian Maguzawa tribal people (predominantly cereal diet) than in the other dietary groups (ce-real with regular meat consumption and cereal with frequent consumption of cows' milk)390. In more recent molecular studies, in which gut microbiota from different parts of the world has been compared, a significant correlation between habitual diet and fecal microbiota has also been found. African children consuming a diet low in fat and animal protein and rich in starch, fiber, and plant polysaccharides (predominantly vegetarian) had significantly more Bacteroidetes and Actinobacteria and less Firmicutes and Proteobacteria than European children, who had a diet high in animal protein, fat, sugar, and starch, but low in fiber. Moreover, members of the genera Prevotella and Xylanibacter were found exclu-sively from the African children366. Partly similarly to these findings, Prevotella enterotype was found to be associated with high consumption of carbohydrates, whereas Bacteroides enterotype was associated with high consumption of animal protein, amino acids, and saturat-ed fats391. Strict vegetarians have been shown to have higher percentages and/or numbers of E. rectale – B. coccoides group and C. ramosum group (Clostridial cluster XVIII) bacteria than omnivorous people264, 358, whereas vegans have been shown to have lower fecal numbers of
1. Introduction
53
Bacteroides spp., Bifidobacterium spp., E. coli, and Enterobacteriaceae392. In addition, both vegetarian and vegan habitual diets have been associated with the Prevotella enterotype391. In older culture-based studies, no fusobacteria were found in fecal samples of vegetarian people, whereas the mean count in both Japanese and America fecal samples the levels were over 108 cfu/g. Furthermore, the total count of anaerobic streptococci, Peptostrepto-coccus spp., Actinomyces spp., and Lactobacillus spp. were higher in strict vegetarians as compared to people on a traditional Western diet14,389,393-394.
Dietary fiber 1.4.4.1
Dietary components that escape digestion by endogenous enzymes in the upper gastro-intestinal tract become available substrates in the large intestine6. Dietary fiber (DF) is a normal constituent of most foods derived from plants395. These “non-digestible” (ND) dietary carbohydrate substrates include resistant starch, plant cell wall material (non-starch polysaccharides), and oligosaccharides6. In the human colon, the DF is metabo-lized by the microbiota to short chain fatty acids (SCFA), comprising mainly acetic, propi-onic, and butyric acids. SCFA have been implicated to have both local and systemic beneficial biological effects in the human body; acetate is readily absorbed and transport-ed to the liver; propionate is a substrate for hepatic gluconeogenesis; and butyrate is the preferred fuel of the colonocytes and also plays a major role in the regulation of cell pro-liferation and differentiation6.
In vitro and in vivo evidence indicates that a group related to F. prausnitzii, Roseburia, and E. rectale plays a major role in mediating the butyrogenic effect of fermentable die-tary carbohydrates112,223,396-397. In addition, it has been shown in numerous studies that as dietary carbohydrate content is reduced in the diet the count of F. prausnitzii declines respectively381,398. However, some lactate-utilizing bacteria of the Clostridial cluster XIV produce less butyrate in the presence of lactate-utilizing SRB. Moreover, in the presence of higher abundance of lactate, the formation of butyrate was reduced even more and the formation of hydrogen sulfide was promoted399.
Cereal grains are a good source of DF. The main DF components of cereal grains are arabinoxylan (AX), cellulose, β-glucan, fructan, resistant starch, and lignin400. The gut mi-crobiota-stimulating activities of AX (stimulates Bacteroides spp. and Roseburia spp.), re-sistant starch (stimulates bifidobacteria, Bacteroides spp., Ruminococcus bromii, E. rectale, and Roseburia spp.), β-glucan (stimulates bifidobacteria), and fructan (stimulates bifidobac-teria, Bacteroides spp., lactobacilli and butyrate-producers) are well recognized401-409. In addition, arabinoxylan-oligosaccharides (AXOS), which are enzymatic hydrolysis products of AX, have been shown to stimulate the growth of bifidobacteria in some studies404. The effects of cellulose and lignin on gut microbiota are less well known 410-411. However, it should be noted that e.g. the size of the grain flakes may lead to different bacterial re-sponses: i.e. it has been shown that smaller sized whole oat grain flakes (0.53–0.63 mm) resulted in a significant increase in the numbers of Bacteroides – Prevotella group bacte-ria, whereas in a fermentation with larger oat flakes (0.85–1.00 mm) bifidobacterial num-bers increased412. It has been shown in in vitro model studies using different substrates that the majority of the bacteria attached to wheat bran belonged to the Clostridial cluster XIV and some bacteria were Bacteroides spp., whereas Ruminococcus bromii, Bifidobac-terium adolescentis, Bifidobacterium breve, and E. rectale were found attached to starch.

1. Introduction
54
When mucin was used as a substrate, the most commonly found bacteria were Bifidobac-terium bifidum and an uncultured relative of Ruminococcus lactaris413.
Probiotics and prebiotics 1.4.4.2
Probiotics are live microorganisms which when administered in adequate amounts con-fer a health benefit on the host, according to the widely accepted definition by FAO/WHO414. Most of the currently used probiotics belong to the genera Bifidobacterium and Lactobacillus. However, probiotic preparations containing species of the genera Enterococcus, Pediococcus, Streptococcus, Lactococcus, Propionibacterium, Bacillus, and Saccharomyces are also used415. The past two decades have seen a marked in-crease in the inclusion of probiotic bacteria in various types of food products, especially in fermented milks416. During recent years probiotics have also been increasingly incorpo-rated into non-dairy foods such as fruit and berry juices and e.g. cereals415. In good quality products, the daily dose should be approximately 109 cfu/d417. Probiotics do not usually colonize the GI-tract, and therefore the products should be consumed daily for the health benefits418. In most of the studies, probiotics have not caused any significant changes in the predominant fecal microbiota of healthy adults. However, there are a few studies in which e.g. L. rhamnosus GG has been shown to modulate the fecal microbiota and in-crease overall bacterial diversity in infants373,419. In addition, Bifidobacterium animalis subsp. lactis Bb12 has been shown to reduce the numbers of Enterobacteriaceae and Clostridium spp. in preterm infants374.
Prebiotics were originally described as non-digestible food ingredients that beneficially affect the host by selectively stimulating the growth, activity, or both of one or a limited number of bacterial species already resident in the colon420. The updated description of prebiotics is as follows; prebiotics are non-digestible (by the host) food ingredients that have a beneficial effect through their selective metabolism in the intestinal tract. The prebiotics that currently fulfill the prebiotic criteria are inulin, fructo-oligosaccharides (FOS), galacto-oligosaccharides (GOS), and lactulose421. The best sources of naturally occurring prebiotics may be found in vegetables such as artichokes, onions, chicory, garlic, and leeks418. There are numerous studies in which the bifidogenic properties of prebiotics have been shown239,288,370-371,421-425. In addition, increase in abundance of lac-tobacilli370-371 and F. prausnitzii195,424 has been shown. Moreover, in infant formulas, GOS + FOS supplementation of cow’s milk based formula has led to a bifidobacterial popula-tion, which resembled more that of breast-fed infants than purely formula-fed infants426.
Medication 1.4.4.3
In addition to dietary components, the other important external factor affecting the micro-biota is antibiotic consumption. However, different types of antibiotics have different types of action mechanisms and thus different effects on the gut microbiota427-428. In addi-tion, individual human responses may be different. Bifidobacteria are typically susceptible to the majority of clinically relevant antibiotics such as penicillins, cephalosporins, and macrolides429-434, and most of the commensal gut bacteria (e.g. bifidobacteria, Bac-teroides spp.) to amoxicillin and clavulanate430.

1. Introduction
55
Penicillins are the most commonly used antibiotics among outpatients in EU435. In cul-ture-based studies, which can only give a limited view of the microbiota, a typical finding in short-term studies in adults consuming amoxicillin has been an increase in the numbers of Enterobacteriaceae and Klebsiella spp., and reduction in bifidobacteria and bac-teroides428,436. It has also been shown that amoxicillin consumption results in a significant reduction in the metabolic activity of gut microbiota (seen as reduced production of SCFAs)376 and a major shift in the fecal dominant microbiota437. On the other hand, studies on the effect of amoxicillin on the gut microbiota in young children are limited. In a short-term (3 weeks) study performed in Chile, amoxicillin consumption resulted in a decrease in the total number of fecal bacteria (groups were not identified) and in an increase in the numbers of E. coli438. In addition, amoxicillin has been shown to alter the bifidobacterial population of infants; B. adolescentis disappeared and the occurrence of B. bifidum decreased439.
Most cephalosporin administrations have been associated with increase of enterococ-ci and significant colonization with C. difficile, as detected with culture-based methods. In addition, cefixime has also been shown to significantly suppress anaerobic microbes436. However, ceftaroline, a new broad-spectrum cephalosporin, did not significantly affect any studied fecal bacterial groups440.
Oral quinolones have been shown to eliminate or strongly suppress bacteria within En-terobacteriaceae using a culture-based approach436. Ciprofloxacin (a member of the quinolone-family) ingestion has been shown to affect numerous fecal bacterial operational taxonomic units (OTU); the relative abundance of 43 OTUs decreased and 11 OTUs increased. Within the OTUs showing a decrease were eight OTUs related to F. prausnitzii and similar numbers of OTUs related to other Ruminococcaceae and Lachnospiraceae, seven OTUs within the genus Bacteroides, four in the genus Alistipes, and two in Porphy-romonadaceae. The OTUs whose relative abundance increased during the ciprofloxacin ingestion also included OTUs within Lachnospiraceae and Bacteroides spp. Interestingly, only below 0.l% of the reads belonged to the Phylum Actinobacteria, which may be the reason why no difference in the Actinobacterial population was detected441. Ciprofloxacin + clindamycin treatment has also been reported to simplify the predominant microbiota442.
Antibiotic use in elderly people has been reported to cause significant increase in the relative abundance of Bacteroidetes, especially Parabacteroides spp., and a decrease in the relative abundance of Firmicutes, Proteobacteria, and Actinobacteria. In addition, a low (250-mg) dose of clarithromycin decreased the proportion of Bacteroidetes (Bac-teroides spp. and Parabacteroides spp.) and equivalently increased the proportion of Firmicutes, whereas a higher (500-mg) dose of clarithromycin increased the proportion of Bacteroidetes (Parabacteroides spp.) and non-equivalently decreased the proportion of Firmicutes278. The combination of clarithromycin and metronidazole (used for treatment of H. pylori) has been shown to cause a significant decline in bacterial species diversity of fecal microbiota and reduction in the relative abundance of Actinobacteria443. Clindamycin administration has been shown to cause a sharp decline in the clonal diversity (as detect-ed with repetitive sequence-based PCR) of fecal Bacteroides spp. In addition, the fecal Bacteroides population never returned to its original composition during the two year study period444. Moreover, distinctly lower numbers of anaerobic bacteria have been observed after clindamycin administration445-446.
Doxycycline has not been shown to cause major disturbances in the predominant cul-turable anaerobic microbiota. However, the numbers of streptococci, enterococci, entero-
1. Introduction
56
bacteria, and fusobacteria declined during doxycycline intake445-448. In addition, doxycy-cline therapy has been shown to reduce fecal bifidobacterial diversity449. In the study of Borglund et al.450, tetracycline significantly suppressed the culturable intestinal anaerobic microbiota, as well as streptococci and enterococci, and resulted in colonization by new tetracycline-resistant bacteria in several subjects. However, the effects of tetracycline antibiotics are quite significant on the aerobically growing intestinal microbiota; especially an increase of resistance in E. coli has been noted451-453.
In many studies the antibiotic group administered has not been reported, and there-fore the results of some studies cannot be grouped according to the relevant antibiotic. However, in several studies on children and infants a decrease in bifidobacteria and Bac-teroides has been observed321,454-455. In elderly hospitalized people, a reduction in the prevalence of Bacteroides – Prevotella group, Bifidobacterium spp., Desulfovibrio spp., Clostridium butyricum, and Ruminococcus albus and an increase of Enterococcus faecalis have been reported342,456.
The predominant fecal microbiota has been shown to return (as detected with TGGE) to a rather similar profile as before the antibiotic intake within a month437. Similarly, in more detailed pyrosequencing studies it has been shown that the majority of the fecal microbiota is restored in four weeks after the antibiotic treatment ended. However, sever-al taxa (OTUs related to Clostridium piliforme/Clostridium colinum and Bilophila wads-worthia) were not restored even after a six month follow-up period457. Furthermore, in a pyrosequencing and T-RLFP based study of Jakobsson et al. it took four years post treatment for the fecal microbiota of some individuals to recover443.
Proton pump inhibitors (PPIs) are commonly used to treat acid-related diseases of the stomach. Due to increased availability, many patients suffering from mild gas-troesophageal reflux disease are nowadays relying on self-diagnosis and treatment. PPIs are designed to shut down the gastric proton pump of parietal cells, resulting in increase in the pH of the stomach42. Several studies have shown bacteriostatic effects of PPIs458-459 on H. pylori. The effects of PPIs on C. difficile-associated diseases have, however, been contradictory; some studies have found that PPI use is a risk factor for C. difficile infec-tion460, whereas others argue that a causal relationship has not been established461. On the other hand, studies on the effects of PPIs on commensal microbiota are scarce. Since prolonged use of PPIs increases the gastric pH, microbes such as β-hemolytic strepto-cocci – which cause pneumonia – may flourish in the stomach, thereby triggering in-creased susceptibility to infection and disease462.
Health status & living conditions 1.4.5
Hospitalization of Scottish elderly people has been reported to result in a decrease of fecal Bacteroides – Prevotella group and Ruminococcus albus prevalence, while increas-ing the Enterococcus faecalis prevalence, as compared to healthy elderly people. Moreo-ver, when the hospitalization was combined with antibiotic treatment, reductions in Bifidobacterium spp., Desulfovibrio spp., and Clostridium butyricum were also observed456. Long-term residential care of Irish elderly people has been associated with higher propor-tion of bacteria belonging to the phylum Bacteroidetes and the genera Parabacteroides, Eubacterium, Anaerotruncus, Lactonifactor, and Coprobacillus, whereas community-dwelling elderly people had higher proportions of bacteria belonging to the phylum Firmicu-
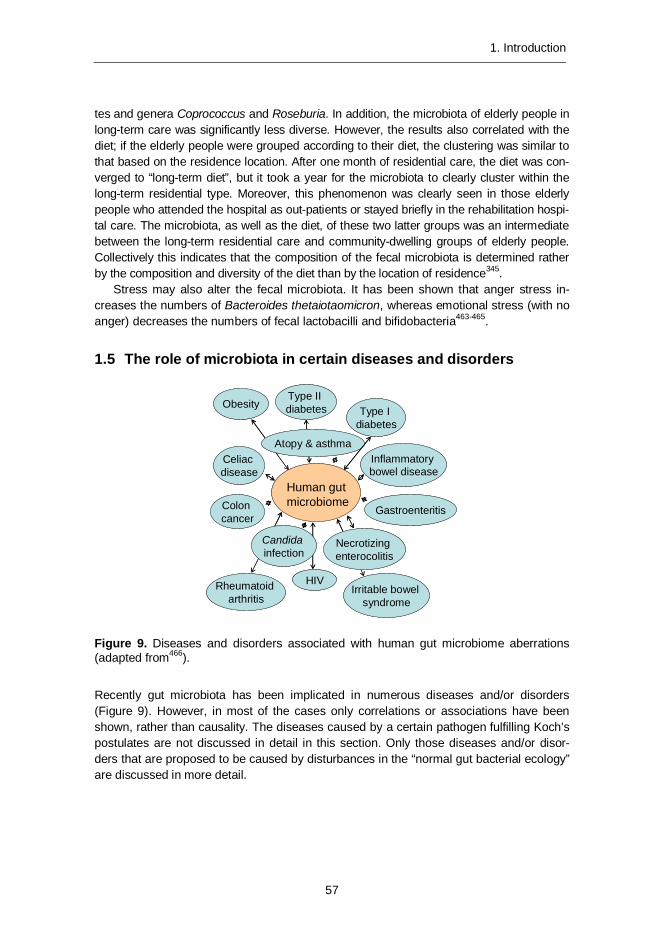
1. Introduction
57
tes and genera Coprococcus and Roseburia. In addition, the microbiota of elderly people in long-term care was significantly less diverse. However, the results also correlated with the diet; if the elderly people were grouped according to their diet, the clustering was similar to that based on the residence location. After one month of residential care, the diet was con-verged to “long-term diet”, but it took a year for the microbiota to clearly cluster within the long-term residential type. Moreover, this phenomenon was clearly seen in those elderly people who attended the hospital as out-patients or stayed briefly in the rehabilitation hospi-tal care. The microbiota, as well as the diet, of these two latter groups was an intermediate between the long-term residential care and community-dwelling groups of elderly people. Collectively this indicates that the composition of the fecal microbiota is determined rather by the composition and diversity of the diet than by the location of residence345.
Stress may also alter the fecal microbiota. It has been shown that anger stress in-creases the numbers of Bacteroides thetaiotaomicron, whereas emotional stress (with no anger) decreases the numbers of fecal lactobacilli and bifidobacteria463-465.
1.5 The role of microbiota in certain diseases and disorders
Figure 9. Diseases and disorders associated with human gut microbiome aberrations (adapted from466).
Recently gut microbiota has been implicated in numerous diseases and/or disorders (Figure 9). However, in most of the cases only correlations or associations have been shown, rather than causality. The diseases caused by a certain pathogen fulfilling Koch’s postulates are not discussed in detail in this section. Only those diseases and/or disor-ders that are proposed to be caused by disturbances in the “normal gut bacterial ecology” are discussed in more detail.
Necrotizingenterocolitis
Human gutmicrobiome
Atopy & asthma
Candidainfection
Celiacdisease
Colon cancer
Type I diabetes
Type II diabetes
HIV
Inflammatorybowel disease
Irritable bowelsyndrome
Gastroenteritis
Obesity
Rheumatoidarthritis
Necrotizingenterocolitis
Human gutmicrobiome
Atopy & asthma
Candidainfection
Celiacdisease
Colon cancer
Type I diabetes
Type II diabetes
HIV
Inflammatorybowel disease
Irritable bowelsyndrome
Gastroenteritis
Obesity
Rheumatoidarthritis
1. Introduction
58
Oral diseases 1.5.1
The major infectious diseases of the oral tissue are all polymicrobial20. Dental plaque is a multispecies biofilm displaying community characteristics such as tertiary structures with aqueous or exopolysaccharide-filled channels. In addition, microbes of dental plaque have physiological co-dependencies and quorum sensing467-469. The oral primary colo-nizing bacteria – Streptococcus and Actinomyces- form the basis for the dental plaque. These provide a base biofilm for the subsequent attachment and accumulation of other bacteria – e.g. Veillonella and other Actinomyces – that form close metabolic relation-ships with streptococci. Thereafter Porphyromonas and other streptococci are able to attach, as the local microenvironment start to favor anaerobic bacteria as well. Anaerobic conditions also enable the incorporation of Fusobacterium, which interacts with a wide range of bacteria involved in plaque formation and has, therefore, been suggested to be an important bridging component in oral microbial communities. As Porphyromonas and Fusobacterium are incorporated into the biofilm, they most likely also facilitate the growth of Treponema, which is part of the so-called “red-group” of periodontal pathogens. Fur-thermore, when the host immunity is compromised, yeasts (e.g. Candida albicans) may also be included in the sub-gingival plaque community20,467. Dental plaque that is not removed forms a basis for polymicrobial oral diseases and if systemically distributed, even for cardiovascular, musculo-skeletal and nervous system diseases20,470-471.
Dental caries activity causes lesions and cavities on tooth surfaces, which lead to decay and even loss of tooth structure, resulting in infection and pain. The prevalence of dental caries is high; 92% of US adults aged 20 to 64 have had dental caries in their permanent teeth (http://www.nidcr.nih.gov/DataStatistics). Dental caries lesions are known to contain a variety of streptococcal species, lactobacilli, actinomyces, prevotellae, and occasionally Candida yeasts20,30,472-473. Moreover, the abundance of the genus Prevotella is higher in caries microbiota and the Prevotella species differ from those of healthy individuals25. In the oral cavity, indigenous lactobacilli and bifidobacteria do not have the same positive image as in the gut: Bifidobacterium-like organisms have been detected in advanced carious le-sions472 and oral lactobacilli are implicated as contributory bacteria in demineralization of the teeth once carious lesions are established474. There are three major hypotheses for the etiology of dental caries: 1) the specific plaque hypothesis, according to which only a few specific species (e.g. S. mutans) are causative agents20,475-476; 2) the non-specific plaque hypothesis, in which it is proposed that caries is an outcome of the overall activity of the plaque microbiota476-477; 3) the ecological plaque hypothesis, in which it is proposed that a change in key environmental factors will trigger a shift in the balance of the resident plaque microbiota, and this might predispose a site to disease25, 31,476,478. Although there are three different hypotheses for the microbial involvement in dental caries, the medical consensus is that acids from microbial fermentation of carbohydrates obtained from the diet result in an imbalance of the demineralization and remineralization processes on the enamel479.
Gingivitis, an inflammation of the gum tissue, is a non-destructive periodontal dis-ease. It is associated with the accumulation of plaque around the gingival margin476. Estimates of the general prevalence of adult gingivitis vary from approximately 50 to 100% for dentate subjects480. The subgingival microbiota of gingivitis differs from that of both healthy tissue and advanced periodontitis481. Bacteria involved in the etiology of gingivitis include species of Streptococcus, Fusobacterium, Actinomyces, Veillonella, and
1. Introduction
59
Treponema, and possibly Prevotella, Capnocytophaga, and Eikenella481-482. If gingivitis is not treated, it may progress to periodontitis482.
Periodontal disease (periodontitis) is a polymicrobial infection that destroys the at-tachment fibers and supporting bone that hold the teeth, being the most common cause of tooth loss worldwide469. It is caused by several microbial species, of which Porphy-romonas gingivalis, Tannerella forsythensis, and Treponema denticola are considered to be the “red-complex” pathogens showing strong association with the disease, particularly in tobacco smokers and elderly people. In addition, e.g. Actinobacillus actinomycetem-comitans, Fusobacterium nucleatum, Prevotella intermedia, Treponema socranskii, and potentially also oral lactobacilli and Selenomonas spp. have been associated with perio-dontitis20,32,216,259,469,483-487.
Irritable bowel syndrome (IBS) 1.5.2
IBS is an intestinal disorder that involves continuous or recurrent intestinal pain or dis-comfort that is relieved during defecation. In addition, IBS symptoms include altered stool frequency, form or passage, and passage of mucus and bloating488. Diagnostic criteria of IBS are based on symptoms and according to the Rome III criteria they are: “Recurrent abdominal pain or discomfort at least 3 days per month in the last 3 months associated with 2 or more of the following: 1) Improvement with defecation; 2) Onset associated with a change in frequency of stool; 3) Onset associated with a change in form (appearance) of stool. Criteria should be fulfilled for the last 3 months with symptom onset at least 6 months prior to diagnosis”. Moreover, people having IBS are further divided into subtypes depending on the predominant stool pattern; 1) constipation type IBS; 2) diarrhea type IBS; 3) mixed type IBS; and 4) unclassified IBS (does not meet the criteria for any of the subtypes)489. The etiology of IBS is unknown, but genetic, biological, and psychosocial factors may be involved489-490. Moreover, some overlapping similarities have been found between IBS and inflammatory bowel disease (IBD), namely: similar genetic factors pre-disposing to IBD have also been associated with IBS; IBS and IBD both have impaired gut barrier function; and stress-induced flares and activation of mast cells typical for IBD are also associated with some of the IBS types491.
The existence of abnormal colonic fermentation in IBS492, and alleviation of IBS symptoms by eradication of small intestinal bacterial overgrowth by antibiotic therapy493, suggest that intestinal microbiota may have a role in IBS. In addition, there are many studies in which dif-ferences in the fecal microbiota and/or temporal stability have been reported65,355,377,494-514. Reduction in fecal bifidobacteria of IBS subjects has been a common finding with both culture-based and molecular techniques355,494,498,500,510,514. In addition, in most of the studies the numbers / relative abundance of bacteria of the class Gammaproteobacte-ria497,508,513,515 and numbers of Veillonella spp.498,512-513 have also been shown to be high-er in IBS subjects than inhealthy controls. Temporal instability and lower biodiversity in fecal microbiota of IBS subjects have also been reported65,497,505,507-508. However, the results regarding other bacterial groups have been partly contradictory; e.g. numbers / relative abundance of Bacteroides spp. / Bacteroidetes have been reported to be lower in IBS subjects as compared to healthy controls in several studies505,513-514, whereas in one study higher numbers and diversity of Bacteroidetes were observed in IBS subjects than in healthy controls510.
1. Introduction
60
Inflammatory bowel disease (IBD) 1.5.3
Inflammatory bowel diseases (IBD), e.g. Crohn’s disease (CD) and ulcerative colitis (UC), are chronic inflammatory diseases, for which chronic and relapsing inflammation of the gastrointestinal tract is typical. In UC, the inflammation is localized in the colon mucosa and occurs in the proximity of the epithelium. Therefore, colonocytes are implicated in the pathogenesis of UC. In CD, the inflammation may occur in both ileum and colon. The symptoms of IBD vary from bloody diarrhea and weight loss to ulceration, perforation, and complete obstruction of the GI tract. The chronic nature of UC also increases the risk of colon cancer. The incidence of UC is 1.2 to 20.3 cases per 100,000 persons per year, and its prevalence is 7.6 to 246 cases per 100,000 per year, as compared to the inci-dence and prevalence of CD; 0.03 to 15.6 and 3.6 to 214 per 100,000 per year, respec-tively. The highest incidence and prevalence of IBD are seen in the North European and North American populations. Western diet in addition to westernized lifestyle and envi-ronment, e.g. medication use, stress, smoking, and high socioeconomic status have been linked with high prevalence of IBD. Since germ-free mice do not develop colitis, the gas-trointestinal microbiota is thought to be one of the most important environmental factors associated with IBD516. Most of the genes currently thought to be involved in the patho-genesis of IBD [nucleotide-binding oligomerization domain 2 (NOD2), autophagy-related protein 16-1 (ATG16L1), and immunity-related GTPase family M protein (IRGM)], are related to interactions between the immune system and the microbiota517-519.
There are several common findings with regard to the gut microbiota of both UC and CD patients. The abundance of mucosa-associated bacteria of IBD patients has been shown to be higher than that of healthy adults, and it has been hypothesized that the capability of rejecting fecal bacteria in healthy mucosa has been profoundly disturbed in patients with IBD496,520. On the other hand, the mucosa-associated microbiota of IBD patients has also been shown to have reduced bacterial diversity and lower incidence of Firmicutes and Bacteroidetes bacteria, namely e.g. F. prausnitzii, Clostridium nexile, and B. thetaiotaomicron, whereas the incidence of several Alpha-, Beta-, and Gammaproteo-bacteria has increased263,521. Contrary to these results, Walker et al.522 found an increase in Bacteroidetes in IBD patients. In addition, fecal microbiota of both UC and CD patients has been found to have an unusual bacterial composition as compared to healthy con-trols, e.g. the numbers of Enterobacteria are increased and the numbers of lactobacilli are decreased in IBD patients. Moreover, Gammaproteobacteria and Epsilonproteobacteria, and in particular (adherent-invasive) E. coli, Campylobacter concisus, and enterohepatic Helicobacter, have all been associated with the pathogenesis of IBD59, 523-528. Besides the shared microbial characteristics, both diseases have their own distinct microbial features. Mucosa-associated microbiota of CD patients has been reported to have a reduced inci-dence of F. prausnitzii and increased incidence of Mycobacterium avium subsp. paratu-berculosis, Ruminococcus torques, and E. coli, particularly the adherent-invasive E. coli (AIEC) pathovar529-532. Fecal microbiota of CD patients has been shown to be temporally unstable and to have reduced bacterial diversity, especially of the C. leptum group59,523,
528,533-534 and lower numbers of bifidobacteria59,524 as compared to the healthy controls. Fecal microbiota of UC patients has been reported to have reduced numbers of E. rectale group bacteria523.

1. Introduction
61
The role of SRB – through production of H2S – in the mucosal inflammation has been hypothesized for several decades. Butyrate is the preferred fuel of the colonocytes and it also plays a major role in the regulation of cell proliferation and differentiation. Hydrogen sulfide impedes butyrate oxidation in colonocytes, and therefore it has been implicated in the etiology of IBD384,535-536. Due to the contradictory results obtained hitherto527,537-539, clear association with SRB and IBD has not been established. However, H2S may still be an environmental factor contributing to the etiology of IBD, since it has been found that the H2S production rates were higher in SRB isolated from patients with ulcerative colitis as compared to those isolated from healthy controls539.
Allergy and asthma 1.5.4
An altered (both in numbers and composition) bifidobacterial population in infants has been associated with allergies, asthma, and atopic dermatitis540-544. The number of bacte-ria within Bacteroidaceae was significantly higher in the allergic group (at the ages of 1 and 2 months) than in the healthy controls545-546. In addition, the relative abundance of the genera Propionibacterium and Klebsiella (at the age of 2 months) was higher, whereas the relative abundance of the genera Acinetobacter and Clostridium as well as the num-bers of lactobacilli were lower than in the healthy controls543,546.
Children, who have developed asthma before the age of three years, have been shown to harbor higher numbers and prevalence of B. fragilis at the age of three months than the healthy controls547. In addition, colonization at three weeks with either Bac-teroides spp. or E. rectale group members was associated with increased asthma risk548.
Atopic children have been reported to have more bacteria from the Clostridial cluster I and fewer bifidobacteria in their fecal samples than non-atopic children. In addition, chil-dren with atopic eczema have been reported to have a less diverse total microbiota, less diverse genus Bacteroides (at the age of 1 month), lower counts of bacteroides (at the age of 12 months), and less diverse phylum Proteobacteria (at the age of 12 months) as compared to healthy children, whereas the prevalence and counts of E. coli have been reported to be higher in atopic children289,321,540,549-552. However, in another study less diverse fecal microbiota was associated with increased risk of allergic sensitization, aller-gic rhinitis, but not with asthma or atopic dermatitis553.
Obesity, metabolic syndrome and diabetes 1.5.5
Obesity is a complex health issue with serious consequences such as type 2 diabetes (T2D), cardiovascular diseases etc. Obesity, metabolic syndrome, and T2D are all char-acterized by low-grade inflammation. There are several factors that contribute to the development of obesity; namely genetic, environmental, behavioral, and psychosocial factors554. After the findings of Turnbaugh et al.555 and Ley et al.82 that the relative propor-tion of Bacteroidetes decreased and the relative proportion of Firmicutes increased in obese mice555-556 and men82 as compared to their lean counterparts, obesity-related gut microbiota studies have attracted considerable attention. There have been several related studies in which the findings have been similar83,557-560 to those of Ley et al.82,556 and Turnbaugh et al.555. Moreover, there have also been studies in which the findings have
1. Introduction
62
been contradictory or there have not been any statistically significant differences between Firmicutes and Bacteroidetes in obese/over-weight and normal weight people345,378,381,561-564, and therefore the relationship between Firmicutes and Bacteroidetes vs. obesity still re-mains controversial. Maukonen et al.237 showed that the numbers of Gram-positive bacte-ria are greatly underestimated when the “golden-standard” DNA-isolation kit is applied to fecal samples. Most of the obesity-related studies that have obtained similar results, i.e. that the relative proportion of Bacteroidetes decreases and the relative proportion of Fir-micutes increases in obese humans82 have used QIAmp DNA Stool Mini Kit558-560,562, whereas in those studies in which there has been no difference between obese and lean subjects or the results have been contradictory to the initial findings, a more rigorous DNA-extraction protocol has been applied563-565 or the samples have been studied with fluorescent in situ hybridization378,381,561,564. Therefore, the differences in the DNA-extraction step may, at least partly, explain the contradictory results. Obese people have been re-ported to have less diverse microbiota, phylum-level changes in the microbiota, and al-tered representation of bacterial genes and metabolic pathways83. In addition, an altered (both in numbers and composition) bifidobacterial population in infants566, as well as the use of antibiotics567, have been associated with obesity. Since bifidobacteria are suscep-tible to many antibiotics, it is also possible that the use of antibiotics causes the reduction of bifidobacteria, which is then detected in the obese children. Furthermore, it has not been shown whether these changes are due to the diet leading to obesity or to obesity itself, since there are no studies in which the microbiota of people gaining weight has been followed. Moreover, it has been shown in mice studies that absence of intestinal microbiota does not protect from diet-induced obesity568 and that high-fat diet determines the composition of the mice microbiota independently of obesity569. The impact of the diet should, therefore, also be considered. In addition, it has been shown in twin studies that the amount of food consumed is the major contributor to obesity independently of genetic predisposition570. However, the gut microbiota has the potential to influence host physiol-ogy and behavior in ways that may have an impact on weight gain, fat deposition, and metabolic health, since SCFAs are known to interact with host receptors with the potential to influence gut hormones, inflammation, gut motility, and satiety571.
Metabolic syndrome may be defined as a group of health problems, the common fun-damental pathogenic component of which is resistance to insulin. Metabolic abnormalities include glucose intolerance (T2D, impaired glucose tolerance, or impaired fasting gly-caemia), insulin resistance, central obesity, dyslipidemia, and hypertension. When all these symptoms are grouped together, they are associated with increased risk of cardiovascu-lar disease. The prevalence of metabolic syndrome is highly age-dependent, i.e. metabol-ic syndrome is more common in the middle age to elderly age groups than in younger adults. However, since the prevalence of obesity in adolescents and young adults is in-creasing, we may also expect that the prevalence of metabolic syndrome in young adults will rise in the future572. There have been several microbiological findings related to peo-ple having metabolic syndrome; they have been reported to have higher proportion of bacteria belonging to E. rectale – B. coccoides group as detected with FISH573, and lower diversity of Bacteroides spp. as detected with DGGE312.
T2D is a metabolic disorder that is characterized by high blood glucose in the context of insulin resistance and relative insulin deficiency. Adults with T2D have been reported to have a lower proportion of Firmicutes, especially those belonging to the Class Clostridia,
1. Introduction
63
whereas the proportions of the classes Bacilli and Betaproteobacteria were highly en-riched in the diabetic subjects. The ratio of Bacteroidetes to Firmicutes and the proportion of the genus Prevotella correlated positively, whereas the proportion of the genus Rose-buria negatively correlated with the values of the plasma glucose as detected with py-rosequencing. Moreover, the ratio of Bacteroides – Prevotella group to E. rectale – B. coccoides group also correlated positively with the values of the plasma glucose, and the counts of the Lactobacillus group were higher in the diabetic subjects when qPCR analysis was applied285. In addition, people having T2D have been reported to have lower numbers of bifidobacteria574 and F. prausnitzii575. Interestingly, low F. prausnitzii numbers have also been associated with other inflammatory diseases, e.g. IBD576.
Type 1 diabetes (T1D) is an autoimmune disease resulting from T-cell mediated de-struction of insulin-producing β-cells. Much of the T1D etiology is accounted for by genetic predisposition. However, since the incidence of T1D has increased rapidly in Western countries during the past few decades, environmental factors may also play an important role577. Besides genetic and environmental factors, an aberrant intestinal microbiota, a “leaky” intestinal mucosal barrier, and altered intestinal immune responsiveness have also been proposed to have a role in the onset of T1D578. Children with T1D have been reported to have less diverse and stable microbiota compared to healthy children as detected with pyrosequencing. In addition, the proportion of a single species, Bacteroides ovatus, was greatly increased, whereas the proportion of a certain Firmicutes strain (no further phylogenetic position was given) was decreased in the children with T1D579. How-ever, in this study579 no Actinobacteria were found in the samples of Finnish children who were part of the DIPP-study, even though representatives from the classes Betaproteo-bacteria, Erysipelotrichi, and Fusobacteria were found. Maukonen et al.312 have analyzed samples from 76 Finnish children who were also part of the same DIPP study and had the same HLA genotype (altogether 212 samples at similar ages as in Giongo et al.579), and bifidobacteria were found in nearly all of the samples (96% of the children;312). The sam-ples of Giongo et al.579 were also subjected to metagenomic analysis303, in which it was found that the control children had higher proportions of butyrate-producing and mucin-degrading bacteria, whereas the children with T1D had higher proportions of those bacte-ria that produce other SCFAs than butyrate. Interestingly, bifidobacteria were found to be among the 11 most abundant genera on the basis of metagenomic analysis, although they were not detected with pyrosequencing303. These contradictory results indicate that the DNA-extraction method used was capable of extraction of high G+C Actinobacteria, but that for some reason the pyrosequencing step excluded them.
Others 1.5.6
Besides the aforementioned diseases and/or disorders, there are also many others in which gut microbiota has been implicated to have a role. However, these will only be briefly discussed. The role of gut microbiota in some psychiatric disorders has also been speculated. Autism is a complex disorder with unknown etiology. Besides genetic factors, environmental factors that may contribute to the etiology of autistic disorders include pre- or postnatal exposure to certain environmental chemicals and drugs, stress, maternal infection, and dietary factors580. There are several studies in which Clostridium bolteae and bacteria from Clostridial clusters I and XI have been shown to be more abundant in
1. Introduction
64
autistic children than in healthy control children581-583. In addition, the bacterial diversity of autistic children has been found to be higher with a pyrosequencing study; the prevalence of bacteria belonging the phyla Bacteroidetes and Proteobacteria and the genera Acet-anaerobacterium, Alkaliflexus, Bacteroides, Desulfovibrio, and Parabacteroides were higher in autistic children, whereas the prevalence of bacteria belonging to the phyla Firmicutes and Actinobacteria and 14 genera e.g. Anaerofilum, Clostridium, Ruminococcus, Streptococcus, and Weissella were lower in the autistic children286. Children with autism have also been found to have lower numbers of Bifidobacterium spp., Enterococcus spp., Klebsiella oxytoca and higher numbers of Lactobacillus spp. and Bacillus spp.in feces using standard culture-based techniques584. The lower levels of bifidobacteria as well as A. muciniphila have also been noted with a qPCR-based study585, as have the higher levels of Sutterella spp.586.
Colorectal cancer (CRC), also known as large bowel cancer, is one of the most com-mon forms of cancer. Cancer manifests as the uncontrolled proliferation of host cells. The etiology of cancer is not completely clear, and as in other diseases/disorders in which the role of gut microbiota has been studied, both genetic and environmental factors have been shown to have an effect on the onset of the cancer, although diet is considered to be the most significant risk factor by many researchers587. There are several studies in which the correlation between the gut microbiota and CRC has been studied and in most of them some kind of microbiota dysbiosis has been detected. However, in different stud-ies the observed dysbiosis has been partly different; with qPCR-based studies the num-ber of bacteria belonging to the Bacteroides – Prevotella group has been higher in the CRC patients588, whereas in a pyrosequencing-based study it was found that B. fragilis type of OTUs were enriched in the cancer patients and B. vulgatus and B. uniformis type OTUs were enriched in the healthy controls587. Furthermore, OTUs belonging to the genera Enter-ococcus, Escherichia/Shigella, Klebsiella, Streptococcus, and Peptostreptococcus were enriched in the cancer patients, whereas OTUs belonging to the genera Roseburia and other butyrate-producers within Lachnospiraceae were less abundant. Moreover, qPCR results validated the lower counts of butyrate-producing bacteria in the cancer patients587.
In addition to the characterization of the fecal microbiota of the CRC patients, tumor microbiota has also been studied. Fusobacterium spp. sequences have been found to be enriched in carcinomas, confirmed by quantitative PCR and 16S rRNA gene sequence analysis of 95 carcinoma/normal DNA-pairs, whereas the phyla Bacteroidetes and Fir-micutes were depleted in tumors589. Moreover, genera over-represented in tumors included members of the Coriobacteridae, Roseburia, Fusobacterium, and Faecalibacterium, whereas potentially pathogenic enterobacteria were under-represented in tumor tissue590.
Celiac disease is a chronic inflammatory disorder of the small intestine, with perma-nent intolerance to cereal gluten proteins. Chronic inflammation in the small intestine results in villous atrophy and flattening of the mucosa. Treatment with a gluten-free diet usually leads to remission of clinical symptoms and normalization of mucosal histology. Celiac disease may manifest at any age in those with genetic susceptibility, but in many cases the symptoms already start in childhood591. In addition, cesarean delivery has been found to correlate positively with the onset of celiac disease592. Since environmental fac-tors also have a role in the manifestation of celiac disease, the role of gut microbiota in its etiology has been studied. It has been found that children with celiac disease have higher bacterial diversity593-594, lower numbers of bifidobacteria and higher numbers of C. leptum
1. Introduction
65
group bacteria and Bacteroides spp. in both feces and duodenal biopsies, and lower numbers of C. histolyticum group and C. lituseburense group bacteria and F. prausnitzii in feces than healthy children. Moreover, the counts of E. coli and Staphylococcus spp. were higher in the untreated children, but decreased to the same level as those of the healthy children after treatment with a non-gluten diet595-598. Similar results have also been obtained with a culture-based study; children with celiac disease were found to have lower numbers of bifidobacteria and lactobacilli and higher numbers of Bacteroides spp., Clostridium spp., Salmonella spp., Shighella spp., and Klebsiella spp.599-600. However, the levels of Staphylococcus spp. varied between the culture-based studies; in the first study the levels of Staphylococcus spp. were lower in the children with celiac disease599, whereas in the second, healthy children had lower levels of Staphylococcus spp.600. The effect of gluten-free diet on healthy adults has also been studied to assess the effects caused by the gluten-free diet. It was observed that the numbers of Bifidobacterium spp., C. lituseburense group, Lactobacillus group, and F. prausnitzii decreased, whereas the numbers of Enterobacteriaceae and E. coli increased. Simultaneously the production of TNF-α, interferon-γ, IL-10, and IL-8 by peripheral blood mononuclear cells was reduced. Thus, the gluten-free diet resulted in reduction of beneficial bacteria in the GI-tract601.
2. Hypotheses, rationale and specific aims of the study
66
2. Hypotheses, rationale and specific aims of the study
This study was based on four hypotheses. The first hypothesis was that the developed molecular tools enable rapid and cost-effective characterization of the human predominant fecal microbiota. A large fraction (>80%) of the GI-tract microbiota has not yet been cul-tured, which necessitates the use of molecular techniques in the characterization of GI-tract microbiota. However, due to the immense numbers of bacteria in fecal samples, the optimi-zation and validation of the methods applied to fecal samples is of utmost importance.
The second hypothesis was that the fecal microbiota of people having IBS differs from that of healthy adults, and that the difference is distinguishable with molecular microbio-logical techniques. At the time the study was conducted, the results relating to the fecal microbiota of people having IBS were partly contradictory and only a few studies had been published using molecular microbiological techniques. Most of the members of the Clostridial clusters XIV and IV are difficult to culture, especially from fecal samples when specific enumeration and characterization is needed. Therefore it was expected that more insight into the possible role of the most predominant Clostridial clusters of the human fecal microbiota in IBS would be gained.
The third hypothesis was that the fecal microbiota of elderly people differs from that of younger adults and that the elderly fecal microbiota may be modified with a GOS-yoghurt intervention. The gut microbiota evolves with age, and the differences in the gut microbiota of elderly people and younger adults have been shown previously. However, the results have been partly contradictory and dependent on the geographical location of the sub-jects. Therefore, the aim was to assess the differences within the Finnish population. Moreover, although the effects of prebiotics on the fecal microbiota have been studied, GOS has received less attention. Since bifidobacteria have been shown to be present in lower numbers in elderly people, the ingestion of bifidogenic GOS could in theory in-crease the abundance of bifidobacteria.
The fourth hypothesis was that there might be confounding factors responsible for the contradictory results obtained in many recent studies – especially differences in storage conditions and DNA-extraction protocols of fecal samples. There are a few studies in which bifidobacteria were found to be a minor part of the infant microbiota, whereas there are numerous studies in which bifidobacteria have been found to be a predominant part of the infant microbiota with both culture-based and culture-independent methods. More-over, especially in the obesity related studies the results have been contradictory. The hypothesis was that some of the used DNA-extraction methods were not capable of ex-
2. Hypotheses, rationale and specific aims of the study
67
tracting Gram-positive bacteria efficiently, especially those belonging to the phylum Ac-tinobacteria. Moreover, since the gastrointestinal tract is an open system, the salivary and upper gastrointestinal tract microbiota may also influence the results obtained with DNA-based methods. Therefore the similarity of the salivary and fecal microbiota was studied.
The primary aim of this study was to characterize human predominant fecal microbiota with a special focus on Clostridial clusters XIV (Lachnospiraceae, Eubacterium rectale – Blautia coccoides group) and IV (Ruminococcaceae, Clostridium leptum group).
The specific aims were:
· To develop molecular methods for characterization of the human predominant fe-cal microbiota
· To assess the specificity, practicality, and usability of the developed methods for human fecal samples in healthy adults, elderly people, and people having IBS.
· To assess possible confounding factors in the analysis of human fecal samples.
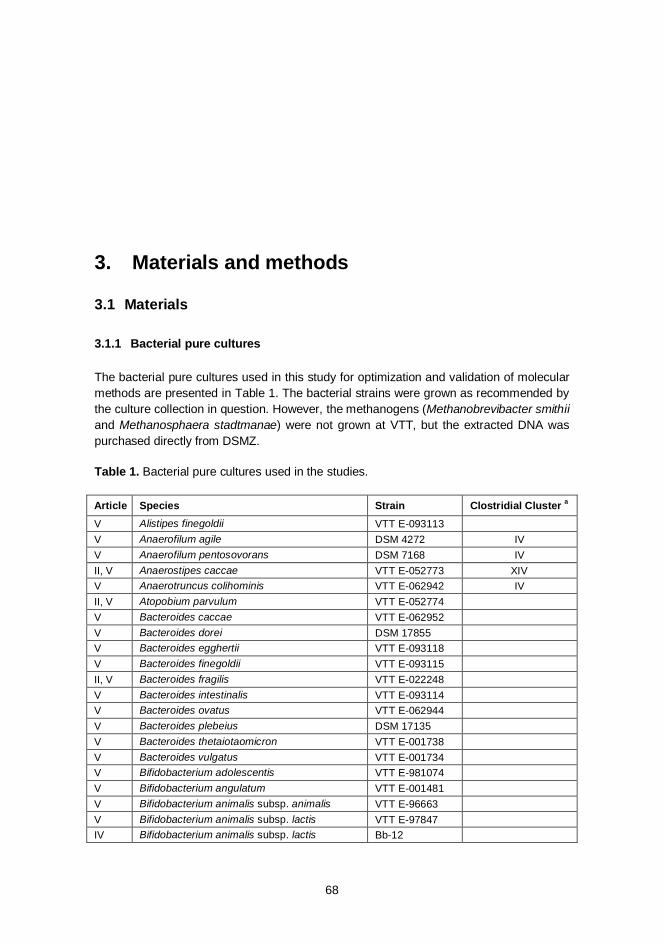
3. Materials and methods
68
3. Materials and methods
3.1 Materials
Bacterial pure cultures 3.1.1
The bacterial pure cultures used in this study for optimization and validation of molecular methods are presented in Table 1. The bacterial strains were grown as recommended by the culture collection in question. However, the methanogens (Methanobrevibacter smithii and Methanosphaera stadtmanae) were not grown at VTT, but the extracted DNA was purchased directly from DSMZ.
Table 1. Bacterial pure cultures used in the studies.
Article Species Strain Clostridial Cluster a
V Alistipes finegoldii VTT E-093113 V Anaerofilum agile DSM 4272 IV V Anaerofilum pentosovorans DSM 7168 IV II, V Anaerostipes caccae VTT E-052773 XIV V Anaerotruncus colihominis VTT E-062942 IV II, V Atopobium parvulum VTT E-052774 V Bacteroides caccae VTT E-062952 V Bacteroides dorei DSM 17855 V Bacteroides egghertii VTT E-093118 V Bacteroides finegoldii VTT E-093115 II, V Bacteroides fragilis VTT E-022248 V Bacteroides intestinalis VTT E-093114 V Bacteroides ovatus VTT E-062944 V Bacteroides plebeius DSM 17135 V Bacteroides thetaiotaomicron VTT E-001738 V Bacteroides vulgatus VTT E-001734 V Bifidobacterium adolescentis VTT E-981074 V Bifidobacterium angulatum VTT E-001481 V Bifidobacterium animalis subsp. animalis VTT E-96663 V Bifidobacterium animalis subsp. lactis VTT E-97847 IV Bifidobacterium animalis subsp. lactis Bb-12
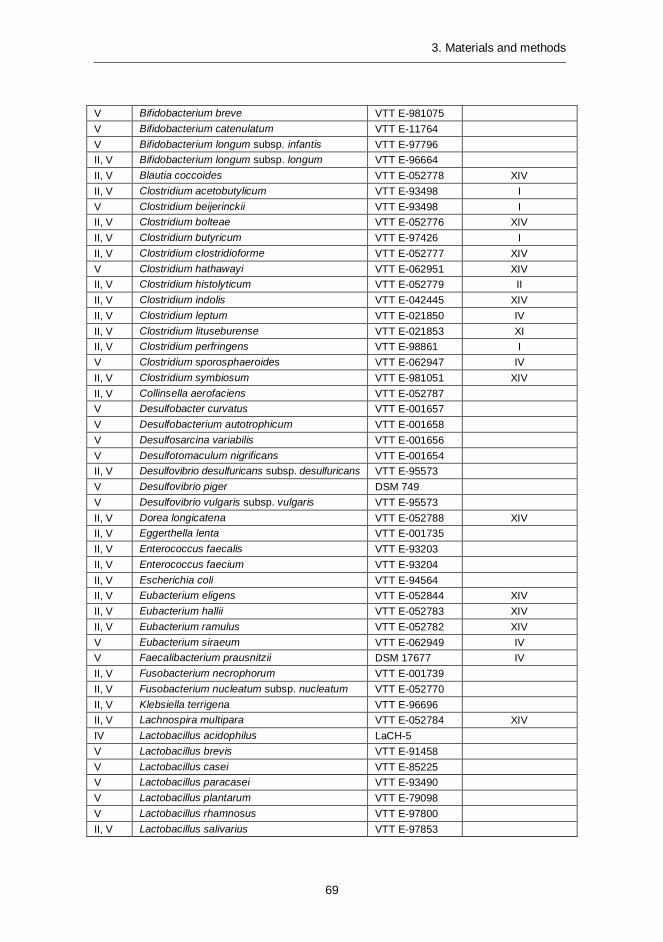
3. Materials and methods
69
V Bifidobacterium breve VTT E-981075 V Bifidobacterium catenulatum VTT E-11764 V Bifidobacterium longum subsp. infantis VTT E-97796 II, V Bifidobacterium longum subsp. longum VTT E-96664 II, V Blautia coccoides VTT E-052778 XIV II, V Clostridium acetobutylicum VTT E-93498 I V Clostridium beijerinckii VTT E-93498 I II, V Clostridium bolteae VTT E-052776 XIV II, V Clostridium butyricum VTT E-97426 I II, V Clostridium clostridioforme VTT E-052777 XIV V Clostridium hathawayi VTT E-062951 XIV II, V Clostridium histolyticum VTT E-052779 II II, V Clostridium indolis VTT E-042445 XIV II, V Clostridium leptum VTT E-021850 IV II, V Clostridium lituseburense VTT E-021853 XI II, V Clostridium perfringens VTT E-98861 I V Clostridium sporosphaeroides VTT E-062947 IV II, V Clostridium symbiosum VTT E-981051 XIV II, V Collinsella aerofaciens VTT E-052787 V Desulfobacter curvatus VTT E-001657 V Desulfobacterium autotrophicum VTT E-001658 V Desulfosarcina variabilis VTT E-001656 V Desulfotomaculum nigrificans VTT E-001654 II, V Desulfovibrio desulfuricans subsp. desulfuricans VTT E-95573 V Desulfovibrio piger DSM 749 V Desulfovibrio vulgaris subsp. vulgaris VTT E-95573 II, V Dorea longicatena VTT E-052788 XIV II, V Eggerthella lenta VTT E-001735 II, V Enterococcus faecalis VTT E-93203 II, V Enterococcus faecium VTT E-93204 II, V Escherichia coli VTT E-94564 II, V Eubacterium eligens VTT E-052844 XIV II, V Eubacterium hallii VTT E-052783 XIV II, V Eubacterium ramulus VTT E-052782 XIV V Eubacterium siraeum VTT E-062949 IV V Faecalibacterium prausnitzii DSM 17677 IV II, V Fusobacterium necrophorum VTT E-001739 II, V Fusobacterium nucleatum subsp. nucleatum VTT E-052770 II, V Klebsiella terrigena VTT E-96696 II, V Lachnospira multipara VTT E-052784 XIV IV Lactobacillus acidophilus LaCH-5 V Lactobacillus brevis VTT E-91458 V Lactobacillus casei VTT E-85225 V Lactobacillus paracasei VTT E-93490 V Lactobacillus plantarum VTT E-79098 V Lactobacillus rhamnosus VTT E-97800 II, V Lactobacillus salivarius VTT E-97853
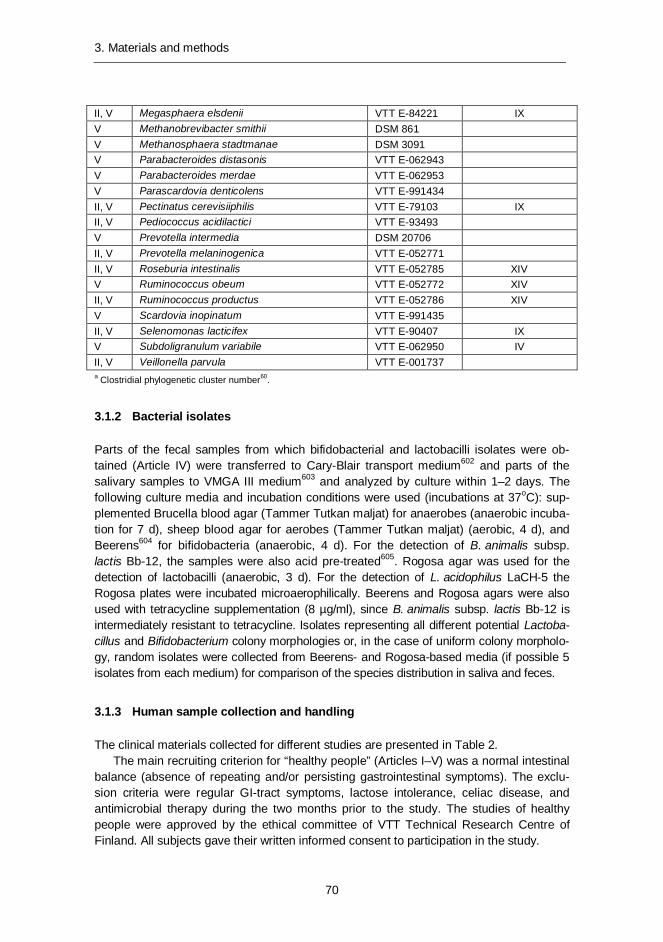
3. Materials and methods
70
II, V Megasphaera elsdenii VTT E-84221 IX V Methanobrevibacter smithii DSM 861 V Methanosphaera stadtmanae DSM 3091 V Parabacteroides distasonis VTT E-062943 V Parabacteroides merdae VTT E-062953 V Parascardovia denticolens VTT E-991434 II, V Pectinatus cerevisiiphilis VTT E-79103 IX II, V Pediococcus acidilactici VTT E-93493 V Prevotella intermedia DSM 20706 II, V Prevotella melaninogenica VTT E-052771 II, V Roseburia intestinalis VTT E-052785 XIV V Ruminococcus obeum VTT E-052772 XIV II, V Ruminococcus productus VTT E-052786 XIV V Scardovia inopinatum VTT E-991435 II, V Selenomonas lacticifex VTT E-90407 IX V Subdoligranulum variabile VTT E-062950 IV II, V Veillonella parvula VTT E-001737 a Clostridial phylogenetic cluster number60.
Bacterial isolates 3.1.2
Parts of the fecal samples from which bifidobacterial and lactobacilli isolates were ob-tained (Article IV) were transferred to Cary-Blair transport medium602 and parts of the salivary samples to VMGA III medium603 and analyzed by culture within 1–2 days. The following culture media and incubation conditions were used (incubations at 37oC): sup-plemented Brucella blood agar (Tammer Tutkan maljat) for anaerobes (anaerobic incuba-tion for 7 d), sheep blood agar for aerobes (Tammer Tutkan maljat) (aerobic, 4 d), and Beerens604 for bifidobacteria (anaerobic, 4 d). For the detection of B. animalis subsp. lactis Bb-12, the samples were also acid pre-treated605. Rogosa agar was used for the detection of lactobacilli (anaerobic, 3 d). For the detection of L. acidophilus LaCH-5 the Rogosa plates were incubated microaerophilically. Beerens and Rogosa agars were also used with tetracycline supplementation (8 µg/ml), since B. animalis subsp. lactis Bb-12 is intermediately resistant to tetracycline. Isolates representing all different potential Lactoba-cillus and Bifidobacterium colony morphologies or, in the case of uniform colony morpholo-gy, random isolates were collected from Beerens- and Rogosa-based media (if possible 5 isolates from each medium) for comparison of the species distribution in saliva and feces.
Human sample collection and handling 3.1.3
The clinical materials collected for different studies are presented in Table 2. The main recruiting criterion for “healthy people” (Articles I–V) was a normal intestinal
balance (absence of repeating and/or persisting gastrointestinal symptoms). The exclu-sion criteria were regular GI-tract symptoms, lactose intolerance, celiac disease, and antimicrobial therapy during the two months prior to the study. The studies of healthy people were approved by the ethical committee of VTT Technical Research Centre of Finland. All subjects gave their written informed consent to participation in the study.
3. Materials and methods
71
The IBS group (Article I) comprised 16 subjects, who fulfilled the Rome II criteria for IBS488. All patients had undergone clinical investigation and endoscopy or barium enema of the gastrointestinal tract 0–1 years prior to the study. Exclusion criteria were pregnan-cy, breast feeding, organic intestinal diseases or other severe systematic diseases, previ-ous major or complex abdominal surgery, severe endometriosis, antimicrobial medication during the previous two months, and dementia or otherwise inadequate co-operation. Patients with lactose intolerance were included if they reported following a low-lactose or lactose-free diet. The IBS study was approved by the human ethics committee at the joint authority for the hospital district of Helsinki and Uusimaa (HUS).
The elderly group (Article III) consisted of 41 elderly subjects with self-reported con-stipation. Additional inclusion criteria were; age between 60 and 80 years and a success-ful completion of the Mini-Mental State questionnaire606. The exclusion criteria were daily use of laxatives, other gastrointestinal disorders (celiac disease, IBD, gastrointestinal tumors, diverticulitis, or IBS), thyroid dysfunction, use of strong psychopharmaceuticals or opioids, and use of antimicrobials during the preceding month. The Human Ethics Com-mittee of the Joint Authority for the Hospital District of Helsinki and Uusimaa (HUS, Fin-land) approved the study protocol. All subjects gave their written informed consent to participation in the study.
The subjects defecated into a plastic container, which was then made anaerobic with gas-generators (Anaerocult A mini, Merck, Darmstadt, Germany) placed on the lid of the container. The samples were transported to the laboratory and processed in an anaerobic workstation (Don Whitley Scientific Ltd., Shipley, UK) within 0–4 h of defecation (Articles I, II, IV, V). The samples were maintained at -70oC until analyzed. In the study of Article III, the subjects defecated into a plastic container and placed the samples immediately after defecation into their own freezer (-20oC). Within one week, the samples were trans-ferred into a -70oC freezer to wait for further analysis.
3.2 Methods
Nucleic acid extraction and biotinylation (Articles I–V) 3.2.1
DNA was extracted from 200 mg of fecal material using FastDNA Spin Kit for Soil (QBIO-gene, Carlsbad, CA, USA) according to the manufacturer’s instructions with one modifica-tion; the bacterial cells were disrupted with a Fast Prep instrument at 6.0 m/s for 60 s three times.
For DNA-extraction experiments (article V) 6 different protocols (FastPrep lysis: 1) 60s 4.5 m/s; 2) 60s 6.5 m/s; 3) 60s + 30s 6.5 m/s; 4) 60s + 60s s 6.5 m/s; 5) 60s + 60s + 30s 6.5 m/s; 6) 60s + 60s + 60s 6.5 m/s) with FastDNA SpinKit for Soil (QBIOgene) and two different protocols: (1) protocol for Gram-negative bacteria; 2) protocol for Gram-positive bacteria) with QIAamp DNA Stool Mini Kit (Qiagen, Hilden, Germany) were eval-uated. The isolated DNA was stored at -20oC until examined.
RNA was extracted from reference strains and feces as previously described by Sato-kari et al.228 and further purified by using the clean-up protocol of RNeasy mini kit (Qi-agen). RNA concentration and purity were determined spectrophotometrically (A260/A280; BioPhotometer 6131, Eppendorf, Hamburg, Germany) and the integrity of RNA was eval-
3. Materials and methods
72
uated with agarose gel electrophoresis in which 23S and 16S rRNA were observed. Puri-fied RNA used for quantitative analysis (TRAC; see below) was biotinylated by using Photoprobe® Biotin (Vector Laboratories, CA, USA). Biotinylation was performed by exposing the reaction to long wave UV-light (365 nm) for 30 min and the subsequent purification of the RNA from free biotin was performed according to the manufacturer’s instructions as previously described228.
PCR and reverse transcriptase (RT) –PCR (Articles I–V) 3.2.2
Partial 16S rRNA genes of the bacterial group of interest were PCR-amplified with the primers specified in Table 3 and with conditions specified in the Article in question. RT-PCR was performed with the Qiagen® OneStep RT-PCR Kit according to the manufac-turer’s instructions with or without a Q-solution. Q-solution modifies the melting behavior of nucleic acids thus facilitating reverse transcription and amplification of templates with a high GC content or a high degree of secondary structure. Primers used for the RT-PCR were the same as were used for the PCR (Table 3).
Denaturing gradient gel electrophoresis (DGGE; Articles I–V) 3.2.3
PCR products were separated in polyacrylamide gels with a denaturing gradient of 38–60% (predominant bacteria and Erec-group), 45–55% (bifidobacteria and B. animalis subsp. lactis Bb12), or 30–60% (Lactobacillus-group, Clept-group and Bacteroides spp.) (where 100% is 7 M urea and 40% (vol/vol) deionized formamide) as described previously497. L. acidophilus LaCH-5 was added as a probiotic control lane to each Lactobacillus-group specific DGGE (in Article IV).
Similarity of the PCR-DGGE-profiles of the samples obtained from a single subject at different sampling points was compared in order to evaluate the temporal stability of se-lected fecal bacterial populations. Comparison of the profiles was performed by calculat-ing a similarity percentage using BioNumerics software version 4.01 (Articles I–IV) or version 5.1 (Article V) (Applied Maths BVBA, Sint-Martens-Latem, Belgium). Clustering was performed with Pearson correlation and the unweighted-pair group method (UPGMA). Amplicons with the total surface area of at least 1% were included in the simi-larity analysis.
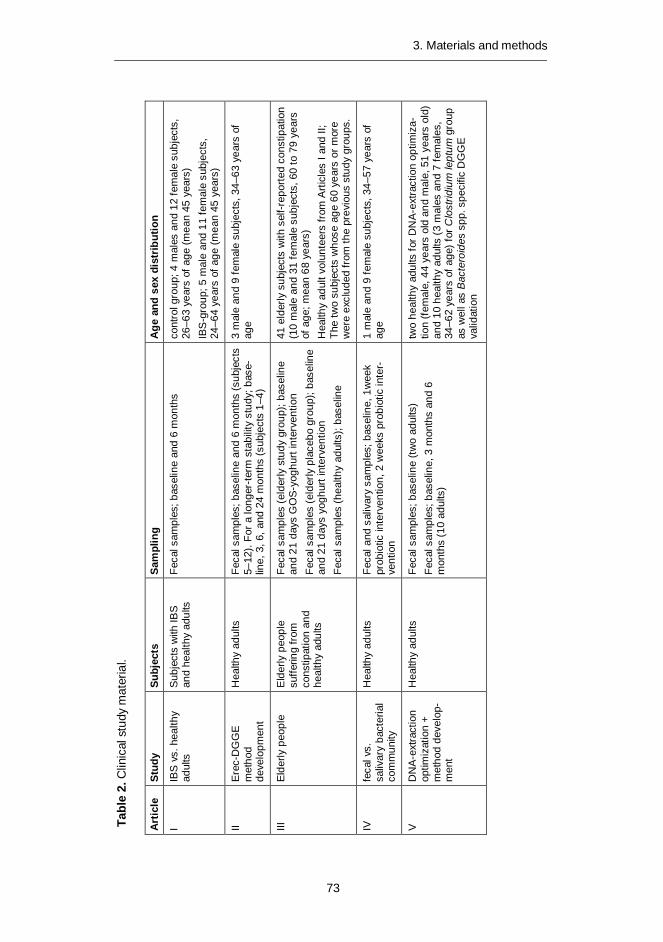
Tabl
e 2.
Clin
ical
stu
dy m
ater
ial.
Art
icle
St
udy
Su
bjec
ts
Sam
plin
g A
ge a
nd s
ex d
istr
ibut
ion
I IB
S vs
. hea
lthy
adul
ts
Subj
ects
with
IBS
an
d he
alth
y ad
ults
Fe
cal s
ampl
es; b
asel
ine
and
6 m
onth
s co
ntro
l gro
up; 4
mal
es a
nd 1
2 fe
mal
e su
bjec
ts,
26–6
3 ye
ars
of a
ge (m
ean
45 y
ears
) IB
S-g
roup
; 5 m
ale
and
11 fe
mal
e su
bjec
ts,
24–6
4 ye
ars
of a
ge (m
ean
45 y
ears
)
II E
rec-
DG
GE
m
etho
d
deve
lopm
ent
Hea
lthy
adul
ts
Feca
l sam
ples
; bas
elin
e an
d 6
mon
ths
(sub
ject
s 5–
12).
For a
long
er-te
rm s
tabi
lity
stud
y; b
ase-
line,
3, 6
, and
24
mon
ths
(sub
ject
s 1–
4)
3 m
ale
and
9 fe
mal
e su
bjec
ts, 3
4–63
yea
rs o
f ag
e
III
Elde
rly p
eopl
e E
lder
ly p
eopl
e su
fferin
g fro
m
cons
tipat
ion
and
heal
thy
adul
ts
Feca
l sam
ples
(eld
erly
stu
dy g
roup
); ba
selin
e an
d 21
day
s G
OS
-yog
hurt
inte
rven
tion
Feca
l sam
ples
(eld
erly
pla
cebo
gro
up);
base
line
and
21 d
ays
yogh
urt i
nter
vent
ion
Feca
l sam
ples
(hea
lthy
adul
ts);
base
line
41 e
lder
ly s
ubje
cts
with
sel
f-rep
orte
d co
nstip
atio
n
(10
mal
e an
d 31
fem
ale
subj
ects
, 60
to 7
9 ye
ars
of a
ge; m
ean
68 y
ears
) H
ealth
y ad
ult v
olun
teer
s fro
m A
rticl
es I
and
II;
The
two
subj
ects
who
se a
ge 6
0 ye
ars
or m
ore
wer
e ex
clud
ed fr
om th
e pr
evio
us s
tudy
gro
ups.
IV
feca
l vs.
sa
livar
y ba
cter
ial
com
mun
ity
Hea
lthy
adul
ts
Feca
l and
sal
ivar
y sa
mpl
es; b
asel
ine,
1w
eek
prob
iotic
inte
rven
tion,
2 w
eeks
pro
biot
ic in
ter-
vent
ion
1 m
ale
and
9 fe
mal
e su
bjec
ts, 3
4–57
yea
rs o
f ag
e
V
DN
A-ex
tract
ion
optim
izat
ion
+ m
etho
d de
velo
p-m
ent
Hea
lthy
adul
ts
Feca
l sam
ples
; bas
elin
e (tw
o ad
ults
) Fe
cal s
ampl
es; b
asel
ine,
3 m
onth
s an
d 6
mon
ths
(10
adul
ts)
two
heal
thy
adul
ts fo
r DN
A-ex
tract
ion
optim
iza-
tion
(fem
ale,
44
year
s ol
d an
d m
ale,
51
year
s ol
d)
and
10 h
ealth
y ad
ults
(3
mal
es a
nd 7
fem
ales
, 34
–62
year
s of
age
) for
Clo
strid
ium
lept
um g
roup
as
wel
l as
Bac
tero
ides
spp
. spe
cific
DG
GE
va
lidat
ion
73
3. Materials and methods
3. Materials and methods
74
Cloning (Articles II & V) 3.2.4
PCR amplicons were purified using a Qiaquick PCR purification kit (Qiagen) according to the manufacturer's instructions. DNA purity and yield were estimated by electrophoresis in 1% (w/v) agarose gels. Purified amplification products were ligated into pGEM-T vector system II and transformed into Escherichia coli JM109 high efficiency competent cells (Promega, Madison, WI, USA) according to the manufacturer's instructions. 130–146 colonies of ampicillin-resistant transformants were randomly picked from each sample. PCR with pGEM-T-specific primers T7 and SP6 (Table 3) was performed from the lyzed cells to check the size of the inserts. The PCR-products of the plasmids containing inserts of the correct size were purified with the Qiaquick PCR purification kit (Qiagen) according to the manufacturer's instructions and sequenced with the ABI PRISM BigDye terminator Cycle sequencing kit v.3.1 (Applied Biosystems, Foster City, CA, USA) according to the manufacturer's instructions using the primer T7. All the sequences were analyzed with ABI PRISM 3100 automated capillary DNA cycle sequencer (Applied Biosystems).
Sequence analysis (Articles II & V) 3.2.5
The sequences were checked and edited with the Chromas program (Technelysium Pty Ltd, Helensvale, Australia). ClustalW (http://align.genome.jp; Article II or http://www.ebi. ac.uk/Tools/clustalw2/index.html?; Article V) was used for the alignment of the sequences and for checking of the sequence similarities.
All unequal sequences were thereafter identified through the GenBank database (www.ncbi.nlm.nih.gov) using the "BLAST" (Basic Local Alignment Search Tool) algo-rithm607 or using the “Classifier” tool of the Ribosomal Database Project (RDP) II134. Clus-talW and DNAMAN 4.1 (Lynnon BioSoft) were used for the creation of operational taxo-nomic units (OTU) in Article II. An OTU, as employed here, consisted of all sequences with less than 2% divergence from 440 aligned homologous nucleotides61. Phylogenetic analysis of OTU subgroups was performed with DNAMAN 4.1. One representative of each OTU was deposited in the GenBank database and the sequences are available under the accession numbers DQ307759-DQ307802. “Library compare” of RDPII 608 was used for the classification of sequences derived from DNA extraction optimization (Article V) into the phylogenetically consistent higher-order bacterial taxonomy. Each different clone was deposited in the GenBank database and the sequences are available under the accession numbers JN206701-JN20712. Phylogenetic analyses were performed with the Kodon software (Applied Maths, Sint-Martens-Latem, Belgium).
Fingerprinting of bacterial isolates (Article IV) 3.2.6
Randomly amplified polymorphic DNA (RAPD) was used for fingerprinting of bifidobacte-ria and lactobacilli (Article IV). 587 isolates from Beerens were analyzed using primer OPA-2 (Table 3) and 574 isolates from Rogosa were analyzed using primer OPA-3 (Ta-ble 3) as previously described605. The RAPD fingerprints of fecal and salivary isolates were compared to those of the B. animalis subsp. lactis Bb12 and L. acidophilus LaCH-5
3. Materials and methods
75
strains by visual inspection. All types that appeared to be different from the ingested probiotic strains were selected for further characterization.
Real time PCR (qPCR; Article V) 3.2.7
Partial 16S rRNA genes of the bacterial group of interest were qPCR-amplified with the primers specified in Table 3 and with conditions specified in Article V. All the qPCRs were performed in duplicate (from duplicate DNA-extractions; i.e. four replicates in all). Stand-ard curves were created as described in Article V.
Transcript analysis with the aid of affinity capture (TRAC; Articles I and II) 3.2.8
Multiplexed quantification of clostridial 16S rRNA was performed with the TRAC tech-nique using specific 16S rRNA targeted probes for different groups of clostridia and a universal bacterial probe (Table 3)228. The probes were labeled with 6-FAM (6-carboxyfluorescein) at the 5’-end and HPLC-purified. RNA (maximum amount from five to ten ng) was denatured at 70oC for 2 min and hybridized with all the oligonucleotide probes at 50oC for 1h. After hybridization the biotin-nucleic acid-probe complexes were captured on magnetic streptavidin-coated microparticles and washed. The hybridized probes were eluted and their identity and quantity were determined by capillary electro-phoresis with an ABI PRISM 310 Genetic Analyzer. The signal intensities of the recorded probes corresponded to the amount of target nucleic acid in the mixture, while the size indicated the target. Results were expressed as percent of total bacterial 16S rRNA that was detected by the Bact338-IIA probe and were given as means ± standard deviations from triplicate measurements.
3.3 Statistical analysis (Articles I–V)
qPCR and culture data were transformed into logarithmic scale in order to be able to use parametric statistical methods. Mean and standard deviation were calculated for each experiment. Student’s t-test (“two-sample assuming equal variances” or “two-sample assuming unequal variances”, depending on the dataset) was used for statistical analysis of the results obtained from a single DGGE-analysis. Multivariate analysis of variance (MANOVA) and principal component analysis (PCA), included in the BioNumerics soft-ware (Applied Maths BVBA), were used for statistical analysis of the composite data sets. In addition, discriminant analysis including similarity between baseline and first interven-tion (Article III) and difference in band numbers was performed with SPSS 14.0 for Win-dows (SPSS Inc., Chicago, Illinois, USA).
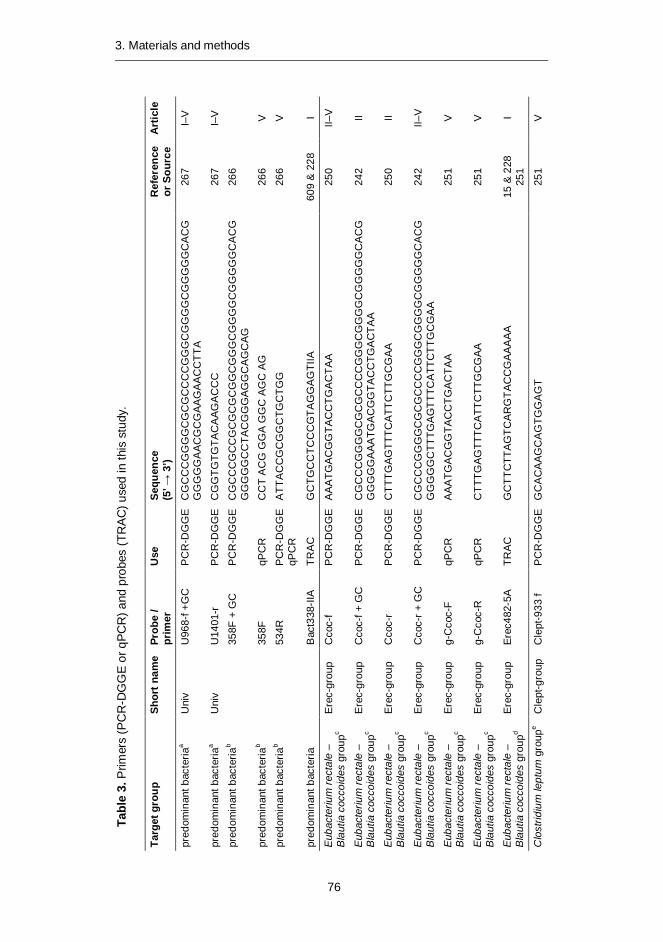
Tabl
e 3.
Prim
ers
(PC
R-D
GG
E o
r qPC
R) a
nd p
robe
s (T
RAC
) use
d in
this
stu
dy.
Targ
et g
roup
Sh
ort n
ame
Prob
e /
pr
imer
U
se
Sequ
ence
(5
’ → 3
’)
Ref
eren
ce
or S
ourc
e A
rtic
le
pred
omin
ant b
acte
riaa
Uni
v U
968-
f +G
C
PC
R-D
GG
E
CG
CC
CG
GG
GC
GC
GC
CC
CG
GG
CG
GG
GC
GG
GG
GC
AC
GG
GG
GG
AAC
GC
GAA
GAA
CC
TTA
26
7 I–
V
pred
omin
ant b
acte
riaa
Uni
v U
1401
-r
PC
R-D
GG
E
CG
GTG
TGTA
CA
AGA
CC
C
267
I–V
pred
omin
ant b
acte
riab
35
8F +
GC
P
CR
-DG
GE
C
GC
CC
GC
CG
CG
CG
CG
GC
GG
GC
GG
GG
CG
GG
GG
CA
CG
GG
GG
GC
CTA
CG
GG
AGG
CA
GC
AG
266
pred
omin
ant b
acte
riab
35
8F
qPC
R
CC
T A
CG
GG
A G
GC
AG
C A
G
266
V
pred
omin
ant b
acte
riab
53
4R
PC
R-D
GG
E
qPC
R
ATT
AC
CG
CG
GC
TGC
TGG
26
6 V
pred
omin
ant b
acte
ria
B
act3
38-II
A TR
AC
G
CTG
CC
TCC
CG
TAG
GA
GTI
IA
609
& 2
28
I
Euba
cter
ium
rect
ale
– B
laut
ia c
occo
ides
gro
upc
Ere
c-gr
oup
Cco
c-f
PC
R-D
GG
E
AA
ATG
AC
GG
TAC
CTG
AC
TAA
25
0 II–
V
Euba
cter
ium
rect
ale
– B
laut
ia c
occo
ides
gro
upc
Ere
c-gr
oup
Cco
c-f +
GC
P
CR
-DG
GE
C
GC
CC
GG
GG
CG
CG
CC
CC
GG
GC
GG
GG
CG
GG
GG
CA
CG
GG
GG
GA
AATG
AC
GG
TAC
CTG
AC
TAA
24
2 II
Euba
cter
ium
rect
ale
– B
laut
ia c
occo
ides
gro
upc
Ere
c-gr
oup
Cco
c-r
PC
R-D
GG
E
CTT
TGA
GTT
TCA
TTC
TTG
CG
AA
25
0 II
Euba
cter
ium
rect
ale
– B
laut
ia c
occo
ides
gro
upc
Ere
c-gr
oup
Cco
c-r +
GC
P
CR
-DG
GE
C
GC
CC
GG
GG
CG
CG
CC
CC
GG
GC
GG
GG
CG
GG
GG
CA
CG
GG
GG
GC
TTTG
AG
TTTC
ATT
CTT
GC
GA
A
242
II–V
Euba
cter
ium
rect
ale
– B
laut
ia c
occo
ides
gro
upc
Ere
c-gr
oup
g-C
coc-
F qP
CR
A
AA
TGA
CG
GTA
CC
TGA
CTA
A
251
V
Euba
cter
ium
rect
ale
– B
laut
ia c
occo
ides
gro
upc
Ere
c-gr
oup
g-C
coc-
R
qPC
R
CTT
TGA
GTT
TCA
TTC
TTG
CG
AA
25
1 V
Euba
cter
ium
rect
ale
– B
laut
ia c
occo
ides
gro
upd
Erec
-gro
up
Erec
482-
5A
TRA
C
GC
TTC
TTA
GTC
AR
GTA
CC
GA
AA
AA
15
& 2
28
251
I
Clo
strid
ium
lept
um g
roup
e C
lept
-gro
up
Cle
pt-9
33 f
PC
R-D
GG
E
GC
AC
AAG
CA
GTG
GA
GT
25
1 V
76
3. Materials and methods

Clo
strid
ium
lept
um g
roup
e C
lept
-gro
up
Cle
pt-1
240-
r
GTT
TTR
TC
A A
CG
GC
A G
TC
62
V
Clo
strid
ium
lept
um g
roup
e C
lept
-gro
up
Cle
pt-1
240-
r +G
C
PC
R-D
GG
E
CG
CC
CG
GG
GC
GC
GC
CC
CG
GG
CG
GG
GC
GG
GG
GC
AC
GG
GG
GG
GTT
TTR
TCA
ACG
GC
AGTC
23
7 V
Clo
strid
ium
lept
um g
roup
e C
lept
-gro
up
Cle
pt-f
qPC
R
GC
AC
AAG
CA
GTC
GA
GT
251
V
Clo
strid
ium
lept
um g
roup
e C
lept
-gro
up
Cle
pt-R
3 qP
CR
C
TTC
CTC
CG
TTTT
GTC
AA
25
1 V
C
lost
ridiu
m le
ptum
gro
upe
Cle
pt-g
roup
C
lept
1240
TR
AC
G
TTTT
RTC
AA
CG
GC
AG
TC
62
I
Clo
strid
ium
litu
sebu
rens
e gr
oupf
Clit
-gro
up
Clit
135
TR
AC
G
TTAT
CC
GTG
TGTA
CA
GG
G
15
I
Clo
strid
ium
his
toly
ticum
gr
oupg
Chi
s-gr
oup
Chi
s150
TR
AC
TT
ATG
CG
GTA
TTA
ATC
TYC
CTT
T 15
I
genu
s B
acte
roid
es
Bact
eroi
des
spp.
B
act5
96f
PC
R-D
GG
E
58
V
Bac
to10
80r
G
CA
CTT
AA
G C
CG
AC
A C
CT
73
V
genu
s B
acte
roid
es
Bact
eroi
des
spp.
B
acto
1080
r +
GC
P
CR
-DG
GE
C
GC
CC
GG
GG
CG
CG
CC
CC
GG
GC
GG
GG
CG
GG
GG
CA
CG
GG
GG
GG
CA
CTT
AAG
CC
GA
CAC
CT
237
V
genu
s B
acte
roid
es
Bact
eroi
des
spp.
g-
Bfra
-F
qPC
R
ATA
GC
CTT
TCG
AA
AG
RA
AG
AT
251
V
genu
s B
acte
roid
es
Bact
eroi
des
spp.
g-
Bfra
-R
qPC
R
CC
AG
TATC
AA
CTG
CA
ATT
TTA
25
1 V
Bifi
doba
cter
ia
Bif
Bif1
64-f
PC
R-D
GG
E
seq.
G
GG
TGG
TAAT
GC
CG
GAT
G
256
III–V
Bifi
doba
cter
ia
Bif
Bif6
62-G
C-r
P
CR
-DG
GE
se
q.
CG
CC
CG
CC
GC
GC
GC
GG
CG
GG
CG
GG
GC
GG
GG
GC
AC
GG
GG
GG
CC
AC
CG
TTA
CAC
CG
GG
AA
25
6 III
–V
B. a
nim
alis
sub
sp. l
actis
B
b12
Bb1
2 Bi
f164
mod
-f P
CR
-DG
GE
G
GG
TGG
TAAT
AC
CG
GA
TG
610
IV
Bifi
doba
cter
ia
Bif
Bifi
d-f
qP
CR
C
TCC
TGG
AA
ACG
GG
TGG
25
0 V
Bifi
doba
cter
ia
Bif
Bifi
d-r
qPC
R
GG
TGTT
CTT
CC
CG
ATA
TCTA
CA
25
0 V
77
3. Materials and methods
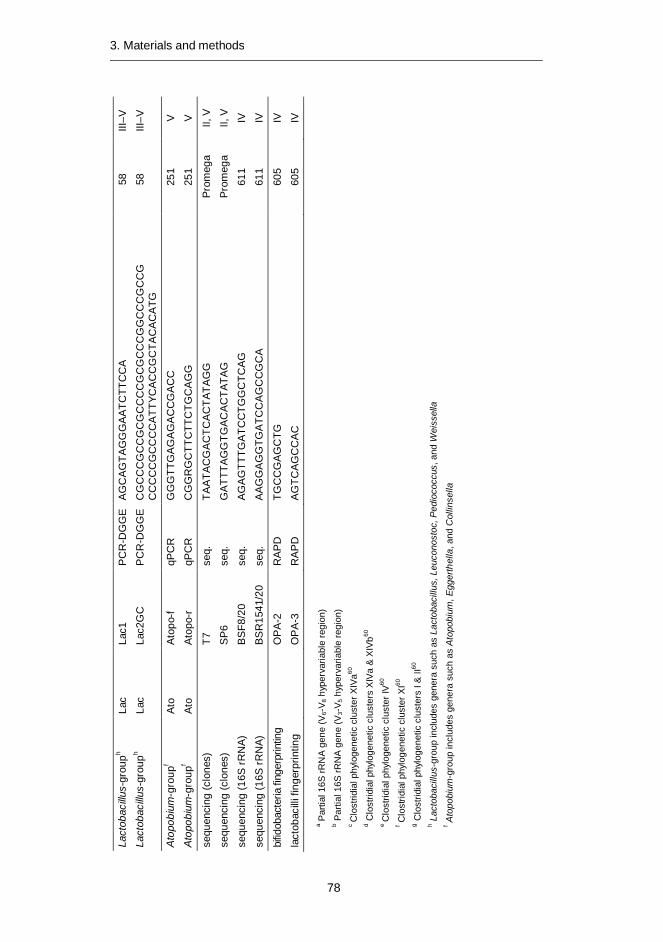
Lact
obac
illus-
grou
ph La
c La
c1
PC
R-D
GG
E
AG
CA
GTA
GG
GA
ATC
TTC
CA
58
III
–V
Lact
obac
illus-
grou
ph La
c La
c2G
C
PC
R-D
GG
E
CG
CC
CG
CC
GC
GC
CC
CG
CG
CC
CG
GC
CC
GC
CG
C
CC
CC
GC
CC
CA
TTYC
AC
CG
CTA
CA
CA
TG
58
III–V
Ato
pobi
um-g
roup
f At
o A
topo
-f qP
CR
G
GG
TTG
AG
AG
AC
CG
AC
C
251
V
Ato
pobi
um-g
roup
f At
o A
topo
-r
qPC
R
CG
GR
GC
TTC
TTC
TGC
AG
G
251
V
sequ
enci
ng (c
lone
s)
T7
se
q.
TAA
TAC
GA
CTC
AC
TATA
GG
Pr
omeg
a II,
V
sequ
enci
ng (c
lone
s)
S
P6
seq.
G
ATT
TAG
GTG
AC
AC
TATA
G
Prom
ega
II, V
sequ
enci
ng (1
6S rR
NA)
BS
F8/2
0 se
q.
AG
AG
TTTG
ATC
CTG
GC
TCA
G
611
IV
sequ
enci
ng (1
6S rR
NA)
BSR
1541
/20
seq.
A
AGG
AG
GTG
ATC
CA
GC
CG
CA
61
1 IV
bifid
obac
teria
fing
erpr
intin
g
OP
A-2
R
AP
D
TGC
CG
AG
CTG
60
5 IV
lact
obac
illi fi
nger
prin
ting
O
PA
-3
RA
PD
A
GTC
AG
CC
AC
60
5 IV
a Par
tial 1
6S rR
NA
gene
(V6-
V 8 h
yper
varia
ble
regi
on)
b Par
tial 1
6S rR
NA
gene
(V3-
V 5 h
yper
varia
ble
regi
on)
c C
lost
ridia
l phy
loge
netic
clu
ster
XIV
a60
d Clo
strid
ial p
hylo
gene
tic c
lust
ers
XIVa
& X
IVb60
e C
lost
ridia
l phy
loge
netic
clu
ster
IV60
f C
lost
ridia
l phy
loge
netic
clu
ster
XI60
g C
lost
ridia
l phy
loge
netic
clu
ster
s I &
II60
h L
acto
baci
llus-
grou
p in
clud
es g
ener
a su
ch a
s La
ctob
acill
us, L
euco
nost
oc, P
edio
cocc
us, a
nd W
eiss
ella
f A
topo
bium
-gro
up in
clud
es g
ener
a su
ch a
s A
topo
bium
, Egg
erth
ella
, and
Col
linse
lla
78
3. Materials and methods
4. Results and discussion
79
4. Results and discussion 4.1 Development of bacterial group-specific PCR-DGGE- and
qPCR-methods (Articles I, II, and V)
A large fraction (>80%) of the GI-tract microbiota has not yet been cultured55, which necessitates the use of molecular techniques in the characterization of GI-tract microbiota. The predominant intestinal clostridia mainly belong to clusters XIVa (E. rectale – B. coccoides group) and IV (C. leptum group)15,55,61-64, whereas most of the medically important clostridia belong to cluster I612. Many clostridia are cultivable, but their culture-based quantification is impractical due to unavailability of good sub-group selective media (with the exception of some clinically important species). Hence, culture-independent techniques have great practical relevance in the study of clostridia. Clostridia contain saccharolytic and proteolytic species and they are able to metabolize a wide variety of substrates. In the colon they have an important role in the fermentation and putrefaction of food-derived substances, resulting in various metabolites such as fatty acids and gases. Short-chain fatty acids formed by microbial fermentation have an important role in colonic health; butyrate plays a role in the metabolism and normal development of colonic epithe-lial cells. Butyrate has also been implicated in protection against cancer and ulcer-ative colitis51. 80% of the butyrate-producing isolates of human fecal origin have been shown to belong to the clostridial phylogenetic cluster XIVa396.
Bacteroides spp. were also added as a target group in this study, since Bac-teroidetes have been shown to be one of the predominant groups in the human fecal microbiota15,62-64,73-74, although the focus was on Clostridial clusters XIV and IV.
rRNA-based vs. rDNA-based detection 4.1.1
rRNA-based methods were developed in this study to enable the detection of the metabolically active fraction of the fecal microbiota. Since DNA remains relatively intact in non-viable cells, methods targeting DNA enumerate both viable and dead cells188-189. RNA is more labile than DNA and more susceptible to degradation caused by deleterious conditions/treatments190. Due to the fact that environmental conditions influence the cellular rRNA content, the amount of rRNA in cells is considered to correlate with the growth rate191.

4. Results and discussion
80
rRNA-based DGGE methods were developed for the predominant bacteria (Ar-ticle I) and E. rectale – B. coccoides group (Article II). Overall, the rRNA-based DGGE-profiles contained less amplicons than the DNA-based DGGE-profiles; in predominant bacterial DGGE-profiles, the rRNA-based profiles contained on aver-age 15 less amplicons (p<0.05), whereas in the E. rectale – B. coccoides group DGGE-profiles the difference was on average only one amplicon. A clear difference in almost all of the samples between the DNA-based and rRNA-based predominant bacterial DGGE-profiles was the lack of high GC-amplicons in the rRNA-based DGGE-profiles. The differences were also seen in all parts of the denaturing gradient. The rRNA- and DNA-based profiles had such different appearances that they were easily distinguishable. Moreover, the rRNA-based profiles of different time points were more similar to each other than the DNA-based and rRNA-based profiles of a given time point. The clear difference between the DNA- and RNA-derived pre-dominant fecal bacterial populations has also been reported previously239.
The difference between the DNA- and rRNA-based DGGE-profiles of E. rectale – B. coccoides group was less clear. The number of amplicons on both rRNA- and DNA-based DGGEs was similar, and in most cases rRNA- and DNA-based DGGE-profiles of a given sample were more similar than the intra-individual tem-poral stability as detected with either DNA- or rRNA-based DGGE.
The predominant bacterial DGGE results obtained in Article I indicated that the use of rRNA-based DGGE would give more insight into the active part of the fecal microbiota than DNA-based methods. However, when the results of E. rectale – B. coccoides group DGGE in Article II indicated that the rRNA- and DNA-based profiles greatly resembled each other, we did not continue with the rRNA-based DGGE-method development. In seemed that since the rRNA molecule remains stable for some time after cell death, the rRNA content of a bacterium may not correctly reflect its physiological status. Thus the laborious and expensive ap-proach was discontinued.
Eubacterium rectale – Blautia coccoides group (Clostridial cluster XIV; 4.1.2Lachnospiraceae) PCR-DGGE
The E. rectale – B. coccoides group (Erec) is one of the major bacterial groups in human feces15,61,201, and according to one study within this thesis (Article I65), the most predominant Clostridial cluster in fecal samples of Finnish people. At the time Article II was published, only group-specific quantitative methods were avail-able15,59,228,251-252,582. Recently there have also been other studies in which the Erec-group has been characterized with microarrays or high-throughput sequenc-ing210-211,565. Since it was extensively demonstrated that the Erec-group bacteria are abundant in the human fecal microbiota, a simple PCR-DGGE method, which does not necessitate the construction of a clone library from each sample, was developed to assess the diversity of this group. The method was optimized with a wide number of different bacteria (Table 1, Article II) and further validated with a clone library. All the 205 clones belonged to the Erec-group. The 108 clones of
4. Results and discussion
81
subject 4 fell into 21 OTUs (Figure 1, Article II) and the 97 clones of the subject 6 into 22 OTUs (Figure 2, Article II), when an OTU was defined as a phylogenetic group consisting of members having over 98% sequence similarity to each other from 440 aligned homologous nucleotides. Moreover, all the amplicons seen in the DGGE-profiles were identified through the clone library and each DGGE band was comprised of either one OTU or a few OTUs that were phylogenetically closely related. Therefore the number of amplicons seen in the DGGE-profiles reflected the phylogenetic diversity of the samples. In addition, the method proved to be semi-quantitative, since the intensity of an amplicon correlated with the clones retrieved at that position (Figures 1 and 2, Article II). The majority of the sequenc-es retrieved from the 205 clones of the two subjects were different. Similar findings have also been observed in other studies55. However, when the cloned samples were run in the same DGGE-gel, several amplicons migrated similarly (Figure 1, Article II). The two samples for cloning were chosen on the basis of the abun-dance of the Erec-group bacteria – one sample contained a high percentage of Erec-group bacteria and another a low percentage. Our results showed that the number of bacteria belonging to the Erec-group was not related to the diversity of that same bacterial group. One sample (subject 4, baseline sample: Figure 1, Article II) containing 71% of Erec-group bacteria had 15 DGGE bands representing 21 OTUs, whereas another sample containing 27% of Erec-group bacteria (subject 6, baseline sample; Figure 2, Article II) had 16 DGGE bands representing 22 OTUs.
After method validation, diversity and temporal stability of Erec-group bacteria from fecal samples of healthy adults were evaluated. Although considerable intra-individual diversity as well as uniqueness of the predominant fecal bacterial popu-lation with both DNA- (24–51 amplicons per each sample) and RNA-based (12–25 amplicons per each sample) PCR-DGGE analyses were observed, the same intra-individual diversity was not observed in Erec-group DGGE-profiles (12–18 ampli-cons/DNA-sample; 10–17 amplicons/RNA-sample), even though this group com-prised a majority of the microbiota in some individuals according to the hybridiza-tion results. However, since it is possible to detect only those bacteria that com-prise over 1% of the total population with DGGE266, we were able to detect the majority of the Erec-group bacteria, as could be seen from the clone library re-sults. The inter-individual uniqueness of Erec-profiles was less clear than that of the predominant bacterial profiles. Regardless of this, samples of a single subject clustered together in most cases. In addition, the clone libraries of the two subjects indicated that even though the DGGE-profiles resembled each other and con-tained several similar OTUs, only less than 20% of their sequences were identical, which is in agreement with the findings of Tap et al.81 and Turnbaugh et al.284.
The Erec-group was found to be temporally as stable or unstable as the pre-dominant bacteria, which was as expected since the Erec-group is the most abun-dant bacterial group detected with the predominant bacterial DGGE. In the two-year stability study the DGGE-profiles of two subjects were unstable and two sub-jects had minor differences with both predominant bacterial DGGE and Erec-DGGE. In the shorter follow-up study (6 months), nearly all of the profiles that were unstable with either RNA-based or DNA-based Erec-DGGE, were also un-
4. Results and discussion
82
stable with predominant bacterial DGGE. However, the hybridization-detected proportional stability was not found to correlate with the DGGE-based temporal stability. This finding further addresses the difference between proportion and diversity of a given bacterial group discussed above.
Clostridium leptum group (Clostridial cluster IV; Ruminococcaceae) 4.1.3PCR-DGGE
The C. leptum group (Clept) has been shown to be the second most abundant Clostridial cluster of Finnish fecal microbiota65. Therefore, a DGGE-method was developed to cost-effectively study the diversity and temporal stability of this bac-terial group. The primer pair Clept-933 f – Clept-1240-r + GC gave positive PCR results for all the target bacteria belonging to the Clept-group. No false positive results were obtained. In most cases only one strong or one strong and one addi-tional weak band was/were seen in the DGGE-profiles of the reference strains. All amplicons of the reference strains of the Clept-group migrated differently and could thus be distinguished (data not shown). Two samples were cloned after the Clept-group PCR to validate the specificity of the method. All the 204 sequenced Clept-group PCR clones belonged to the C. leptum Clostridial cluster IV. Notably, over half of the sequences clustered with F. prausnitzii when a phylogenetic tree was constructed using the neighbor-joining algorithm (data not shown). Clept-group specific DGGE proved to be semi-quantitative; the stronger the band, the more clones were found migrating into that position. Moreover, single clones were not seen in the profile, which supported the theory that only bacteria comprising over 1% of the targeted population may be detected with DGGE266. The majority of the sequences retrieved from the 204 clones of the two subjects were different. This is in agreement with previous studies55. However, when the cloned samples were run in the same DGGE-gel, several amplicons migrated similarly. The DGGE-profiles of the cloned samples and the sequence information obtained from the cloning of Clept-group are presented in Figures S1 and S2 of Article V.
After the method validation, the diversity and temporal stability of Clept-group bacteria from fecal samples of healthy adults were evaluated. Considerable intra-individual diversity as well as uniqueness was found. The Clept-group diversity was on average 20.9 ± 3.4 amplicons (range 16–28 amplicons per sample). Intra-individual similarity of the follow-up samples (three and six months) was higher than inter-individual similarity, i.e. in 8/10 subjects all the samples from a given subject clustered together (each individual created his/her own cluster; data not shown). The intra-individual similarity of samples taken three months apart was 87.5 ± 9.2%, whereas the intra-individual similarity of samples taken six months apart was on average 81.7 ± 11.7%.
4. Results and discussion
83
Bacteroides spp. PCR-DGGE 4.1.4
The proportion of Bacteroidetes has varied greatly between different studies, depend-ing on the used probe and thus the target to be quantified. In this study, Bacteroides spp. were chosen instead of Bacteroidetes, because Bacteroides spp. (formerly Bac-teroides fragilis group) have been found in the lower intestine, whereas if we had tar-geted Bacteroidetes we could potentially also have detected the DNA of the oral Prevotella spp. and Porphyromonas spp. Presently (August, 2012) there are 47 de-scribed type species within the genus Prevotella (http://www.bacterio.cict.fr/index.html), only two of which have been isolated from feces, whereas 32 type strains have been isolated from the oral cavity, four from ruminants and one from a plant residue. However, there are five Prevotella spp. type strains which have been isolated from clinical infections, one from amniotic fluid, one from pleural fluid, and one from a breast abscess. The original habitats of these strains are not known, and therefore they may originate from any part of the oro-gastrointestinal tract. Moreover, in a recent study of elderly people in which the proportions of different genera within the phylum Bacteroidetes were given, the predominant genera were Bacteroides, Alisti-pes, and Parabacteroides, with no mention of Prevotella278. By targeting only Bac-teroides spp. we did not target Rikenellaceae, which would have been targeted by choosing Bacteroidetes. The abundance of Rikenellaceae has not been shown to be very high in younger adults and thus their omission was preferred to the possibility of detecting oral bacterial DNA in feces.
The primer pair Bact596f – Bacto-1080r + GC gave positive PCR results for all the target bacteria belonging to the genus Bacteroides. No false positive results were obtained. In most cases only one strong or one strong and one additional weak band was/were seen in the DGGE-profiles of the reference strains. All amplicons of the reference strains of Bacteroides spp. migrated differently and could thus be distinguished (data not shown). Two samples were cloned after the Bacteroides spp. specific PCR to validate the specificity of the method. All the sequenced 240 Bac-teroides spp. specific PCR clones belonged to Bacteroides spp. The DGGE-profiles of the cloned samples and the sequence information obtained from the cloning of Bacteroides spp. are presented in Figures S3 and S4 of Article V. As with previous DGGE-methods, Bacteroides spp. specific DGGE is also semi-quantitative; the stronger the band, the more clones were found migrating to that position. Moreover, single clones were not seen in the profile, which confirmed the theory that bacteria comprising over 1% of the targeted population may be detected with DGGE266.
After method validation, the diversity and temporal stability of Bacteroides spp. were evaluated. Diversity of Bacteroides spp. was on average 9.2 ± 1.9 (range 5–12 amplicons per sample). Intra-individual similarity of the follow-up samples was higher than inter-individual similarity, i.e. in 8/10 subjects all the samples from a given subject clustered together (each individual created his/her own cluster; data not shown). The intra-individual similarity of Bacteroides spp. of samples taken three months apart was 85.4 ± 12.1%, whereas the intra-individual similarity of Bac-teroides spp. of samples taken six months apart was on average 82.0 ± 16.2%.
4. Results and discussion
84
qPCR methods 4.1.5
Since we showed in Article II that the proportion and diversity of a given bacterial group do not correlate with each other, we wanted to develop easier and faster quantification methods than TRAC. In TRAC, RNA-extraction, purification, and biotinylation are needed. In addition, the actual TRAC-procedure is very sensitive to manual errors and takes rather a long time to perform. We wanted to develop DNA-based rapid methods for the quantification of the most predominant bacterial groups, and therefore developed several qPCR-methods.
Primers (Table 3) were chosen based on in silico testing of published primer pairs. All the used qPCR-methods, targeting predominant bacteria, Clept-group, Erec-group, Bacteroides spp., bifidobacteria, and Atopobium group, were opti-mized with an extensive set of positive and negative controls (Table 2). The qPCR conditions were optimized in such a way that all target strains amplified after around 15 cycles and non-target strains after 35 cycles of the program. Reduction of one logarithm corresponded to approximately 4 cycles of qPCR. By using the aforementioned protocol we wanted to make sure that as little as possible unspe-cific binding could occur, since it is not feasible to validate methods with all possi-ble gastrointestinal bacteria. Standard curves were created with the help of DNA extracted from a known number of culturable representatives; Blautia coccoides for predominant bacteria and Erec-group, Anaerotruncus colihominis for Clept-group, B. fragilis for Bacteroides spp., B. longum for bifidobacteria, and A. par-vulum for Atopobium group.
4.2 Differences in the fecal microbiota between healthy adults and adults with IBS (Article I)
Some older studies have reported differences in fecal bacterial populations be-tween healthy adults and those with IBS494-495,497-498,613. However, the results ob-tained in those studies were partly contradictory and with the exception of those of Mättö et al.497 and Malinen et al.498 were conducted with culture-based analysis. Therefore, the role of intestinal microbiota in IBS was still rather poorly known at the time of this study. Since IBS has often been linked with extensive gas produc-tion in the colon492, and some bacterial groups are more prone to gas production than others, the possible role of the composition and/or activity of clostridia and related bacteria in intestinal (in)balance was studied.
Temporal stability of predominant bacterial populations and 4.2.1clostridial populations
Mättö et al.497 showed using DNA-based analysis that people having IBS had more instability in their fecal predominant microbiota than healthy controls. We broadened the study by including rRNA-based analysis. DNA-based PCR-DGGE
4. Results and discussion
85
and rRNA-based RT-PCR-DGGE analyses targeted to the predominant bacterial population showed considerable diversity as well as uniqueness of the microbiota in each individual in both control and IBS groups. Furthermore, the rRNA-based DGGE-profiles of IBS subjects were more unstable than those of the healthy con-trols. Neither DNA- nor rRNA-based predominant DGGE analysis revealed any IBS-specific amplicons. Both DNA- and rRNA-based predominant DGGE-profiles were heterogeneous, containing approximately 20–30 and 15–25 amplicons, re-spectively. The rRNA-based DGGE-profiles contained significantly less amplicons than the DNA-based DGGE-profiles (p<0.05; Fig. 1 in Article II). As can be seen in the Figure 1 of Article II, there were differences in all parts of the denaturing gradi-ent. However, the amplicons with the highest GC-content, which migrate to the lower part of the DGGE gel, were generally missing in the rRNA-based DGGE-profiles. The clear difference between the DNA- and rRNA-derived predominant fecal bacterial populations was also reported by Tannock et al.239. The differences may be due to several reasons; the resolving power of RT-PCR is limited by the efficiency of RNA-to-cDNA conversion614 and the DNA obtained from complex samples does not reflect the metabolic activity of the microbiota615, whereas rRNA is regarded as an indicator of the total bacterial activity268. Therefore, the ampli-cons present only in the DNA-based profiles may reflect bacteria with low activity.
When an rRNA-based DGGE-profile was compared to a DNA-based DGGE-profile of the same sample, the temporal intra-individual similarity value was signif-icantly lower than the intra-individual similarity value between DNA-based profiles or rRNA-based DGGE-profiles between different time points (p<0.05; Table 4). However, since each individual had a unique DNA- and rRNA-based DGGE-profile, the intra-individual profiles resembled each other more than the inter-individual RNA-based profiles (Fig. 1 in Article II). Moreover, the DNA-based DGGE-profiles of a certain person clustered together in nearly all of the cases, whereas with rRNA-based DGGE-profiles, samples from eight people having IBS and four healthy controls did not cluster together (data not shown).
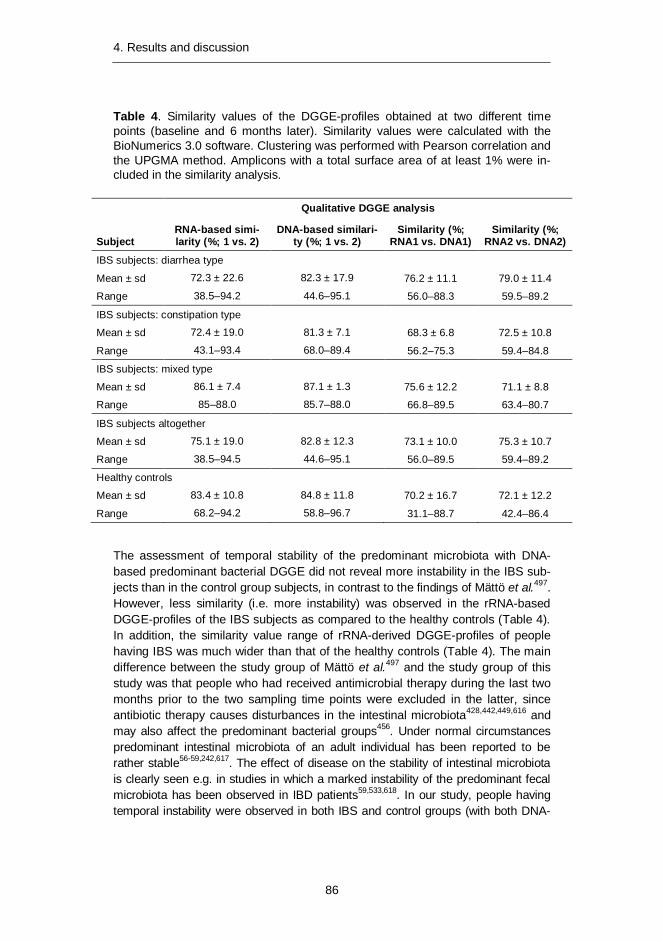
4. Results and discussion
86
Table 4. Similarity values of the DGGE-profiles obtained at two different time points (baseline and 6 months later). Similarity values were calculated with the BioNumerics 3.0 software. Clustering was performed with Pearson correlation and the UPGMA method. Amplicons with a total surface area of at least 1% were in-cluded in the similarity analysis.
Qualitative DGGE analysis
Subject RNA-based simi-larity (%; 1 vs. 2)
DNA-based similari-ty (%; 1 vs. 2)
Similarity (%; RNA1 vs. DNA1)
Similarity (%; RNA2 vs. DNA2)
IBS subjects: diarrhea type
Mean ± sd 72.3 ± 22.6 82.3 ± 17.9 76.2 ± 11.1 79.0 ± 11.4
Range 38.5–94.2 44.6–95.1 56.0–88.3 59.5–89.2
IBS subjects: constipation type
Mean ± sd 72.4 ± 19.0 81.3 ± 7.1 68.3 ± 6.8 72.5 ± 10.8
Range 43.1–93.4 68.0–89.4 56.2–75.3 59.4–84.8
IBS subjects: mixed type
Mean ± sd 86.1 ± 7.4 87.1 ± 1.3 75.6 ± 12.2 71.1 ± 8.8
Range 85–88.0 85.7–88.0 66.8–89.5 63.4–80.7
IBS subjects altogether
Mean ± sd 75.1 ± 19.0 82.8 ± 12.3 73.1 ± 10.0 75.3 ± 10.7
Range 38.5–94.5 44.6–95.1 56.0–89.5 59.4–89.2
Healthy controls
Mean ± sd 83.4 ± 10.8 84.8 ± 11.8 70.2 ± 16.7 72.1 ± 12.2
Range 68.2–94.2 58.8–96.7 31.1–88.7 42.4–86.4
The assessment of temporal stability of the predominant microbiota with DNA-based predominant bacterial DGGE did not reveal more instability in the IBS sub-jects than in the control group subjects, in contrast to the findings of Mättö et al.497. However, less similarity (i.e. more instability) was observed in the rRNA-based DGGE-profiles of the IBS subjects as compared to the healthy controls (Table 4). In addition, the similarity value range of rRNA-derived DGGE-profiles of people having IBS was much wider than that of the healthy controls (Table 4). The main difference between the study group of Mättö et al.497 and the study group of this study was that people who had received antimicrobial therapy during the last two months prior to the two sampling time points were excluded in the latter, since antibiotic therapy causes disturbances in the intestinal microbiota428,442,449,616 and may also affect the predominant bacterial groups456. Under normal circumstances predominant intestinal microbiota of an adult individual has been reported to be rather stable56-59,242,617. The effect of disease on the stability of intestinal microbiota is clearly seen e.g. in studies in which a marked instability of the predominant fecal microbiota has been observed in IBD patients59,533,618. In our study, people having temporal instability were observed in both IBS and control groups (with both DNA-
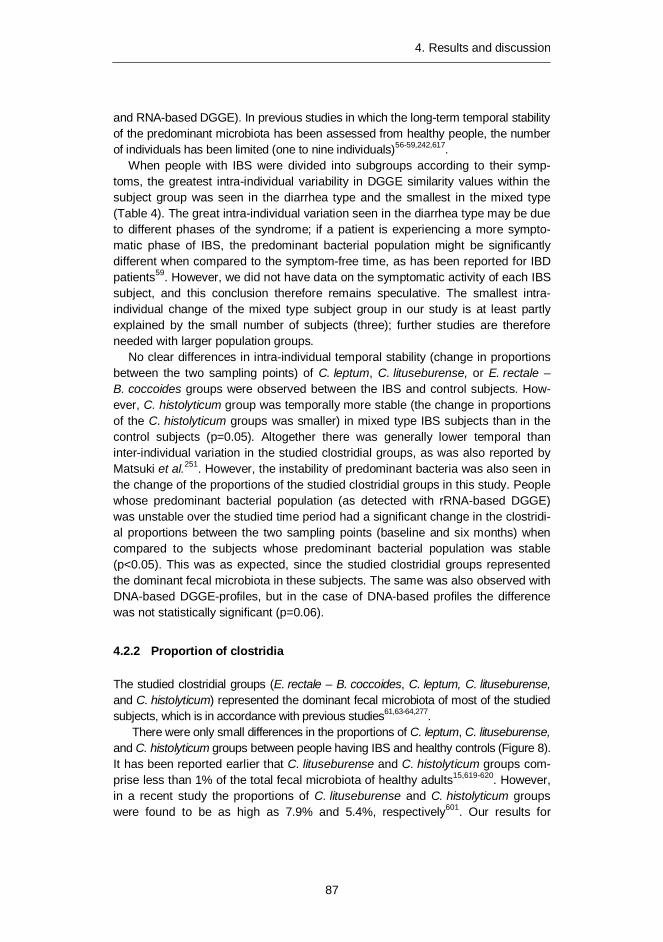
4. Results and discussion
87
and RNA-based DGGE). In previous studies in which the long-term temporal stability of the predominant microbiota has been assessed from healthy people, the number of individuals has been limited (one to nine individuals)56-59,242,617.
When people with IBS were divided into subgroups according to their symp-toms, the greatest intra-individual variability in DGGE similarity values within the subject group was seen in the diarrhea type and the smallest in the mixed type (Table 4). The great intra-individual variation seen in the diarrhea type may be due to different phases of the syndrome; if a patient is experiencing a more sympto-matic phase of IBS, the predominant bacterial population might be significantly different when compared to the symptom-free time, as has been reported for IBD patients59. However, we did not have data on the symptomatic activity of each IBS subject, and this conclusion therefore remains speculative. The smallest intra-individual change of the mixed type subject group in our study is at least partly explained by the small number of subjects (three); further studies are therefore needed with larger population groups.
No clear differences in intra-individual temporal stability (change in proportions between the two sampling points) of C. leptum, C. lituseburense, or E. rectale – B. coccoides groups were observed between the IBS and control subjects. How-ever, C. histolyticum group was temporally more stable (the change in proportions of the C. histolyticum groups was smaller) in mixed type IBS subjects than in the control subjects (p=0.05). Altogether there was generally lower temporal than inter-individual variation in the studied clostridial groups, as was also reported by Matsuki et al.251. However, the instability of predominant bacteria was also seen in the change of the proportions of the studied clostridial groups in this study. People whose predominant bacterial population (as detected with rRNA-based DGGE) was unstable over the studied time period had a significant change in the clostridi-al proportions between the two sampling points (baseline and six months) when compared to the subjects whose predominant bacterial population was stable (p<0.05). This was as expected, since the studied clostridial groups represented the dominant fecal microbiota in these subjects. The same was also observed with DNA-based DGGE-profiles, but in the case of DNA-based profiles the difference was not statistically significant (p=0.06).
Proportion of clostridia 4.2.2
The studied clostridial groups (E. rectale – B. coccoides, C. leptum, C. lituseburense, and C. histolyticum) represented the dominant fecal microbiota of most of the studied subjects, which is in accordance with previous studies61,63-64,277.
There were only small differences in the proportions of C. leptum, C. lituseburense, and C. histolyticum groups between people having IBS and healthy controls (Figure 8). It has been reported earlier that C. lituseburense and C. histolyticum groups com-prise less than 1% of the total fecal microbiota of healthy adults15,619-620. However, in a recent study the proportions of C. lituseburense and C. histolyticum groups were found to be as high as 7.9% and 5.4%, respectively601. Our results for

4. Results and discussion
88
C. lituseburense (mean 1.5–2.3%) and C. histolyticum group (mean 3–5% with corrected values) were thus well in accordance with the previously reported results. The proportions of the C. leptum group found in the healthy controls (mean 12% and 9%, for baseline and 6 month samples, respectively) and IBS subjects (mean 12% and 15%, for baseline and 6 month samples, respectively) were also in agreement with previous studies62-64,70,276.
Figure 10. The proportions of different clostridial groups of IBS and control subject categories at baseline.
The Erec-group was the dominant subgroup of clostridia, accounting on average for 43% of the total bacteria in control subjects and 30% and 50% in irritable bowel syndrome (IBS) subjects affected by constipation and diarrhea, respectively. The proportion of the Erec-group was found to be significantly lower in the constipation type IBS subjects than in the control subjects (p<0.05; Figure 10). The average percentage observed with our healthy controls is somewhat higher than the previ-ously reported 11–35% (range 5–45%) for healthy adults15-16,62-64,66-67,69-70,276. This highlights interindividual differences possibly due to diet and genetic background. In addition, the age distribution in both our subject groups was wider than in most of the other studies. As can be seen in Figures 11 and 12, the proportion of Erec-group was the lowest in healthy younger adults (20–29 years of age; 35%), whereas in the IBS group the lowest Erec-group proportion was found in the age group 50–59 (33%). It should be noted that smaller proportions of Erec-group compared to our results have generally been obtained with FISH, whereas the results of Rigottier-Gois et al.67 obtained with dot blot hybridization were more similar to our study (range 12–55% vs. 18–71% in our study). The FISH analysis measures the propor-tion of the cells containing a sufficient number of ribosomes to be detected, whereas rRNA dot blot hybridization gives an index reflecting the ribosomal content of the cells and the general metabolic activity67, as does the TRAC technique.
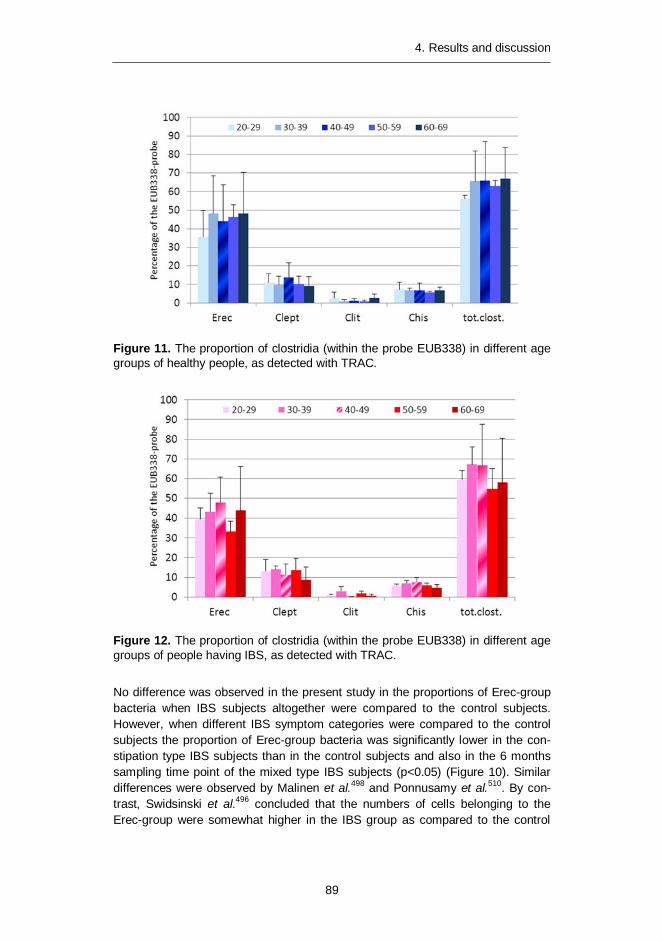
4. Results and discussion
89
Figure 11. The proportion of clostridia (within the probe EUB338) in different age groups of healthy people, as detected with TRAC.
Figure 12. The proportion of clostridia (within the probe EUB338) in different age groups of people having IBS, as detected with TRAC.
No difference was observed in the present study in the proportions of Erec-group bacteria when IBS subjects altogether were compared to the control subjects. However, when different IBS symptom categories were compared to the control subjects the proportion of Erec-group bacteria was significantly lower in the con-stipation type IBS subjects than in the control subjects and also in the 6 months sampling time point of the mixed type IBS subjects (p<0.05) (Figure 10). Similar differences were observed by Malinen et al.498 and Ponnusamy et al.510. By con-trast, Swidsinski et al.496 concluded that the numbers of cells belonging to the Erec-group were somewhat higher in the IBS group as compared to the control
4. Results and discussion
90
group. The Erec-group (Clostridial cluster XIV) is too large of a target to detect subtle variations between microbiota of control and IBS subjects and therefore needs to be divided into smaller subgroups in the further studies.
4.3 Characterization of the fecal microbiota of elderly people during a GOS-yoghurt intervention (Article III)
It was already shown some decades ago that the gastrointestinal microbiota evolves with age341. The numbers of bifidobacteria have been reported to be lower in elderly subjects compared to younger adults in European studies64,204,342,348-350. Bifidobacteria are generally considered beneficial for health, and have widely been used both individually and in combination with lactobacilli in probiotic foods and products. The absence of bifidobacteria, or their low numbers in the elderly, may have metabolic and health consequences for the host, affecting immune system function and a multiplicity of other functions, e.g. synthesis of vitamins and protein, and supplementation in digestion and absorption204, 347. In addition, bifidobacteria are involved in colonization resistance in the bowel204. The number of bifidobacte-ria can be increased in the gut either by continuous supplementation of probiotic bifidobacteria or by adding prebiotics to food products. Prebiotics are non-digestible food ingredients that beneficially affect the host by selectively stimulating the growth, activity, or both of one or a limited number of bacterial species already resident in the colon420. Prebiotics include inulin, FOS, GOS, and lactulose421. GOS, derived from lactose in milk, is a collective term for a group of semi-synthetic non-digestible carbohydrates made using galactosidases as catalysts, and has received less attention than the other prebiotics, although they are con-sidered to have bifidogenic effects in humans239. Since the number of bifidobacte-ria and the diversity of bifidobacterial populations have been reported to decrease with age, we wanted to study the effect of GOS-yoghurt on the bifidobacterial population of elderly people. Both the GOS- and placebo-yoghurts were fermented using a commercial starter culture containing Streptococcus thermophilus, Lacto-bacillus delbrueckii subsp. bulgaricus, Lactobacillus acidophilus, and Bifidobacte-rium animalis subsp. lactis strains.
Fecal microbiota differences between elderly people and younger 4.3.1adults
Temporal stability of the studied bacterial groups (predominant bacteria, Erec-group, lactobacilli, and bifidobacteria) did not differ between the elderly and younger adults, whereas an increase in the predominant bacterial diversity in elderly subjects was observed, as previously reported211,278,343. In addition, the inter-individual variation was greater in the elderly people as compared to the younger adults, as previously reported14, 278,345. The average number of predomi-nant bacterial amplicons in the elderly people was significantly higher than that of
4. Results and discussion
91
the younger adults (42 ± 5 vs. 32 ± 5 amplicons, respectively; p<0.05). In addition, the predominant bacterial DGGE-profiles of the elderly subjects were different according to visual inspection as compared to those of the younger adults. There were amplicons throughout the DGGE-profile (from top to bottom) derived from feces of the elderly subjects (Figure 2A, Article III), whereas in the DGGE-profiles of the younger adults (Figure 4A, Article III) there is usually a small empty gap between the upper part of the DGGE gel (low-medium GC-content; most of the adult fecal microbiota) and the lower part of the gel (high GC-content; bifidobacteria, Coriobacteriaceae, and sulfate-reducing bacteria).
Diversity of the Erec-group bacteria was significantly higher in the elderly sub-jects than in the younger adults (21 ± 4 vs. 15 ± 2 amplicons, respectively; p<0.05). The number of bacteria belonging to the Erec-group – as detected with FISH – has been shown to be higher in French, German, and Swedish elderly subjects as compared to younger adults and lower in Italian and Dutch elderly populations64,348. Since the Finnish diet is close to the Swedish diet, it could be expected that the numbers of bacteria belonging to the Erec-group would be high-er in the elderly subjects than in the younger adults. We did not quantify the num-ber of Erec-group bacteria, but we found significantly more amplicons from the elderly subjects than from the younger adults. In addition, since it was shown in Article II of this thesis that each amplicon corresponded to a phylogenetic cluster, the diversity of the fecal Erec-group of elderly subjects was higher than that of younger adults. Contradictory to these findings, as many operational taxonomic units (OTUs) of Erec-group bacteria have been found in Japanese elderly people as from the younger adults621 and a reduction in Ruminococcus spp. and Roseburia spp. has been observed in Finnish elderly people356. However, some species of the genus Ruminococcus belong to the Erec-group (R. gnavus, R. lactaris, R. obeum, R. torques), whereas others belong phylogenetically to the Clept-group (R. albus, R. bromii, R. cellulosi, R. callidus, R. flavefaciens). The phylogenetic position of the Ruminococcus spp. was not specified in the article of Mäkivuokko et al.356.
Diversity of bifidobacteria was similar in both elderly subjects and younger adults, which is not in agreement with the earlier culture-based studies342,349. However, in a more recent study there were no statistically significant differences in the abundance of bifidobacteria between elderly people and younger adults64.
There was a trend that the diversity of Lactobacillus-group of the elderly subjects was somewhat higher (11 ± 4 amplicons) than that of the younger adults (8 ± 4; P=0.09). The abundance of lactobacilli has been shown to increase or stay stable in many studies, regardless of the nationality of the studied elderly people211,255,347-
348,352,355-356. In addition, the fecal lactobacilli population of elderly subjects in this study was unstable, as has been reported for younger adults58, 260.
4. Results and discussion
92
The effect of GOS-yoghurt consumption on the fecal microbiota of 4.3.2elderly people
DGGE analysis targeted to the predominant bacterial population showed consid-erable intra-individual diversity as well as uniqueness of fecal microbiota before and after the intervention. The intra-individual fecal samples clustered together in all cases (one distinct cluster per subject), irrespective of GOS- or placebo-yoghurt administration. Predominant fecal microbiota was temporally rather stable after both placebo (mean similarity 81.6 ± 10.5%) and GOS-yoghurt consumption (mean similarity 80.9 ± 11.9%). In addition, the number of amplicons after GOS- and placebo-yoghurt consumption was similar to the number of amplicons at the baseline (Figure 2, Article III). This is in agreement with earlier studies, in which it has been found that GOS-containing biscuits had an effect on the RNA-derived predominant bacterial DGGE-profiles but not on the DNA-derived DGGE-profiles in New Zealand elderly people239. In addition, it was shown in one study of younger adults that the probiotics included in a test yoghurt did not have a great effect on the stability of the fecal predominant bacteria186.
The intra-individual diversity and uniqueness of Erec-group DGGE in the fecal samples were similar to those of the predominant bacteria (Figure 2, Article III). Erec-group bacteria remained temporally mostly stable after both placebo (mean similarity 91.1 ± 6.1%) and GOS-yoghurt consumption (mean similarity 87.7 ± 7.9%). In addition, the number of amplicons after GOS- and placebo-yoghurt con-sumption was similar to the number of amplicons at the baseline.
The intra-individual diversity and uniqueness of bifidobacteria DGGE in the fe-cal samples were similar to those of the predominant bacteria and Erec-group bacteria (Figure 2; Article III). However, the intra-individual fecal samples clustered together in only 26/38 subjects (one distinct cluster per subject; data not shown). The subjects whose samples clustered together had an intra-individual temporal similarity value of greater than 85%. The fecal bifidobacterial population was tem-porally mostly rather stable after both GOS-yoghurt consumption (mean similarity 82.3 ± 21.7%) and after placebo-yoghurt consumption (mean similarity 82.0 ± 19.8%). The number of amplicons after GOS- and placebo-yoghurt consumption was similar to the number of amplicons at baseline. We used a PCR-DGGE which did not target the ingested Bifidobacterium animalis subsp. lactis256,610, and there-fore it did not affect the diversity or temporal stability of the fecal bifidobacterial profiles. In several other studies, increase in bifidobacterial abundance has been observed288,370,423. However, it was also shown in one study that even when GOS was administered for many weeks at high doses, some individuals still did not have a bifidogenic response423. This further addresses the question of responders and non-responders in probiotic and prebiotic research.
Lactobacillus-group targeted DGGE analysis showed intra-individual diversity as well as uniqueness of Lactobacillus microbiota before and after intervention (Figure 2; Article III). The intra-individual fecal samples clustered together in only 11 out of 37 subjects (one distinct cluster per subject; six placebo subjects and
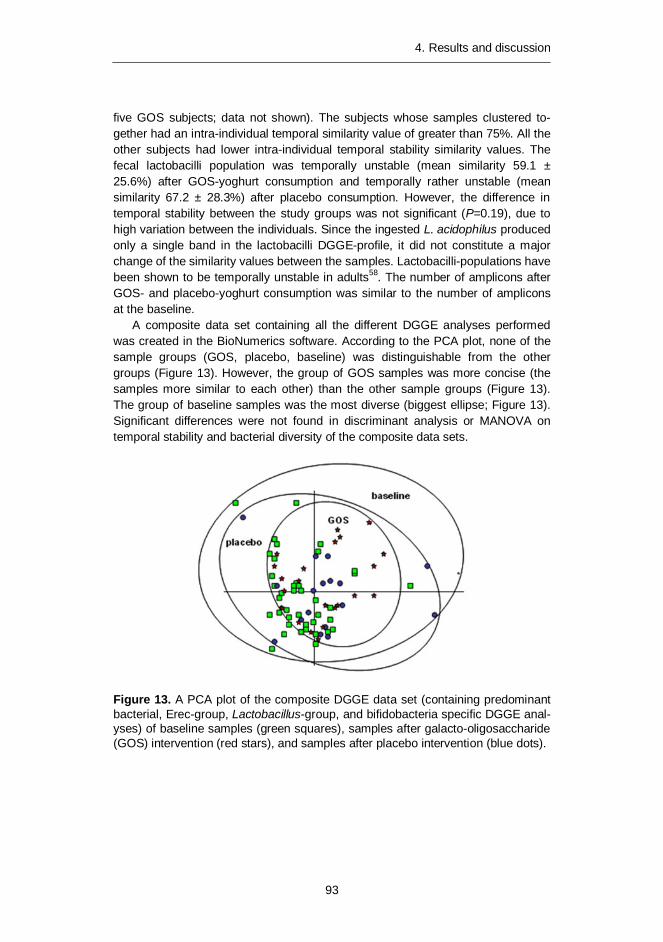
4. Results and discussion
93
five GOS subjects; data not shown). The subjects whose samples clustered to-gether had an intra-individual temporal similarity value of greater than 75%. All the other subjects had lower intra-individual temporal stability similarity values. The fecal lactobacilli population was temporally unstable (mean similarity 59.1 ± 25.6%) after GOS-yoghurt consumption and temporally rather unstable (mean similarity 67.2 ± 28.3%) after placebo consumption. However, the difference in temporal stability between the study groups was not significant (P=0.19), due to high variation between the individuals. Since the ingested L. acidophilus produced only a single band in the lactobacilli DGGE-profile, it did not constitute a major change of the similarity values between the samples. Lactobacilli-populations have been shown to be temporally unstable in adults58. The number of amplicons after GOS- and placebo-yoghurt consumption was similar to the number of amplicons at the baseline.
A composite data set containing all the different DGGE analyses performed was created in the BioNumerics software. According to the PCA plot, none of the sample groups (GOS, placebo, baseline) was distinguishable from the other groups (Figure 13). However, the group of GOS samples was more concise (the samples more similar to each other) than the other sample groups (Figure 13). The group of baseline samples was the most diverse (biggest ellipse; Figure 13). Significant differences were not found in discriminant analysis or MANOVA on temporal stability and bacterial diversity of the composite data sets.
Figure 13. A PCA plot of the composite DGGE data set (containing predominant bacterial, Erec-group, Lactobacillus-group, and bifidobacteria specific DGGE anal-yses) of baseline samples (green squares), samples after galacto-oligosaccharide (GOS) intervention (red stars), and samples after placebo intervention (blue dots).
4. Results and discussion
94
4.4 Confounding factors in the DNA-based studies of fecal samples (Articles IV and V)
During the past ten years, there have been a wealth of studies in which the rela-tionship between the human gut microbiota and human health has been investi-gated. Recently there have been several human health-related microbiota studies with partly contradictory results regarding obesity-related microbiota and bifidobac-terial abundance of infant microbiota. Since it is probable that at least some of the differences could be explained by the methodology applied, we evaluated the impact of commonly used commercial DNA-extraction kits (with several modifica-tions) and storage temperatures on the most prevalent human gut microbial group composition, diversity, and numbers. The effects of various storage temperatures on the fecal microbiota quantity and composition have been studied previously. However, the results are partly contradictory; some show no differences between the different storage conditions280,622, whereas in others differences have been found280,306-307. Moreover, since Bacteroidetes as Gram-negative and Firmicutes as Gram-positive bacteria have different cell wall structures and compositions, the optimal DNA-extraction method for the two groups is different. Gram-negative bacteria are more easily lyzed, and if a too rigorous DNA-extraction method is used it may result in detecting lower numbers and diversity of Bacteroidetes spe-cies. With Firmicutes, however, more rigorous DNA-extraction methods are need-ed, especially when the matrix is as complex as human feces. Even though there are several studies in which the effectiveness of various DNA-extraction protocols has been assessed233,235-236,244,246,308, none of them had combined the effects of both storage conditions and DNA-extractions on the diversity, composition, and numbers of the predominant microbiota.
Besides the possible bias caused by different types of sample handling, we al-so assessed whether the indigenous microbiota itself may cause a bias in the fecal DNA-based experiments. Both ends of the oro-gastrointestinal tract of humans have an abundant microbiota dominated by anaerobically growing bacteria624. The num-ber of bacteria in the oral cavity is approximately 1011 per gram (wet weight) of dental plaque and 108–109 per ml of saliva (culturable bacteria34), whereas in feces the corresponding figure is 6–9 x 10¹⁰ per gram (wet weight) (detected with molecular techniques624). When molecular techniques are applied to study micro-bial communities of the GI-tract, it should be kept in mind that the human oro-GI-tract is an open system – i.e. oral bacteria may also be detected with molecular tech-niques from feces. Although the same bacterial genera can be found in oral and colon-ic samples, there are only a few studies in which the similarity between oral cavity microbiota and fecal microbiota from the same individuals has been investigated27.
4. Results and discussion
95
The effect of sample storage and DNA-extraction on the fecal 4.4.1microbiota results
Our findings showed that the commercial DNA-extraction kits had a significant effect on both composition and numbers of abundant human fecal microbial groups. The numbers and composition of Bacteroides spp. were not significantly affected by the various DNA-extraction protocols, which is in line with the previous findings236. The clostridial populations, namely E. rectale – B. coccoides (Erec) group and C. leptum (Clept) group were significantly affected both in composition and numbers by the used DNA-extraction protocol. The numbers of both clostridial groups were significantly lower when enzymatic DNA-extraction kit was used as compared to the mechanical DNA-extraction kit. In addition, the composition of Erec-group and Clept-group were different when different commercial kits were applied to the same samples.
The highest numbers of most of the studied bacterial groups were detected from fresh samples and from samples stored at -70oC, however, the differences were not significant for any other group than Bacteroides spp. The storage tempera-ture had a significant effect on the quantity of Bacteroides spp., causing >1 log re-duction with all tested storage condition as compared to the same sample as fresh. An intriguing finding was also that the highest numbers of Atopobium group were obtained after initial storage at 4oC.
The use of different mechanical lysis methods (DNA-extraction protocols 2–8; Figure 1, Article V) did not affect the DNA yield of fresh samples, whereas with stored samples both the kit and different modifications to the kits caused great variations in the DNA yield. The highest DNA yield was achieved with the most rigorous mechanical lysis (DNA-extraction protocol 8; 3x60s; 6.5 m/s) at all stor-age temperatures, i.e. 4oC, -20oC, and -70oC. The DNA yield was approximately 60% after gentle mechanical lysis (60s 4.5 m/s; p<0.05) as compared to the rigor-ous DNA-extraction, and only 20% after enzymatic lysis (p<0.05). The storage temperature did not cause significant differences in the DNA yield when the same protocol was applied to the same sample stored at different temperatures.
The storage conditions had a significant effect on the diversity of the predomi-nant fecal bacteria of the studied subjects. Using mechanical DNA-extraction, the predominant bacterial diversity of fresh samples and samples stored at -70oC was significantly higher (p<0.05) than that of those stored initially at -20oC or at 4oC. When enzymatic DNA-extraction was applied, significant storage temperature-dependent differences (p<0.05) were seen only with one subject. However, the predominant bacterial diversity of both subjects was significantly higher (8–13 amplicons; p<0.005) after mechanical DNA-extraction than after enzymatic DNA-extraction at all storage temperatures tested. Furthermore, the bifidobacteria-associated bands in the predominant bacterial DGGE-profile were weaker when a gentle mechanical (60s lysis) DNA-extraction protocol was used as compared to the more rigorous mechanical lysis (3x60s). After clustering of the predominant bacterial DGGE-profiles of both subjects after all different storage – DNA-extraction
4. Results and discussion
96
– PCR combinations, the samples clustered primarily according to the used PCR primers (i.e. V6-V8 region vs. V3-V5 region), secondarily according to the used DNA-extraction kit (regardless of modifications) and thirdly according to the indi-vidual and storage conditions. The similarity between the same samples obtained after DNA-extraction with different commercial kits (e.g. person A, mechanical lysis vs. enzymatic lysis) was 32–38% after amplification of the V6-V8 region (Fig-ure 2, Article V) and 48–54% after PCR of the V3-V5 region (Figure 2, Article V), whereas the similarity of the same samples between different storage conditions was 89–98% when a similar DNA-extraction protocol was applied (data not shown). Furthermore, the storage conditions did not have a significant effect on the quantity of predominant bacteria as detected with qPCR (0.5–1 log unit reduc-tion at 4oC and -20oC), but the difference between the quantity of predominant bacteria after DNA-extraction using different DNA-extraction kits was significant at all storage temperatures (p<0.005; Figure 3; Article V).
After clustering of the Erec-group DGGE-profiles of both subjects after all dif-ferent storage – DNA-extraction – PCR combinations, the samples clustered in three major clusters: cluster 1) subject 1, enzymatic DNA-extraction; cluster 2) subject 2, enzymatic DNA-extraction; and cluster 3) subjects 1 and 2, mechanical DNA-extraction. Within cluster 3, there were further two sub-clusters for differenti-ating the two individuals. The similarity of the same samples obtained after DNA-extraction with different kits (within the same storage conditions) was 42–53% (Figure 2, Article V), whereas the similarity of the same sample after different storage conditions was > 95% when a similar DNA-extraction protocol was ap-plied. Clone library analysis confirmed the different bacterial compositions detect-ed with DGGE (Table 1; Article V). After enzymatic DNA-extraction, the most prevalent genera detected were Roseburia (39% of clones) and Coprococcus (10%), whereas 37% of the clones belonged to unclassified Lachnospiraceae. After mechanical DNA-extraction the most prevalent bacterial genera of Erec-group were Blautia (30% of clones), Coprococcus (13%), and Dorea (10%), whereas 27% of the clones belonged to unclassified Clostridiales; only 10% of the clones belonged to genus Roseburia and 11% to unclassified Lachnospiraceae. A few clones (1.6%) belonging to the genus Anaerostipes were detected only after enzymatic DNA-extraction. The Erec-group diversity remained about the same regardless of the DNA-extraction protocol applied, as detected with both DGGE and clone libraries (Figure S5, Article V). The initial storage at -20oC or 4oC caused a reduction of ~0.5 log as detected with qPCR when similar protocols were compared. However, the difference was not statistically significant. Moreover, the numbers of Erec-group bacteria were significantly higher after mechanical DNA-extraction (p<0.05; ~2 log unit difference; Figure 3, Article V) than after enzymatic DNA-extraction, regardless of the protocol and storage conditions applied.
The samples clustered primarily according to the individual, secondarily (within the primary clusters) according to the used DNA-extraction kit (regardless of modi-fications) and thirdly according to the storage conditions after the Clept-group DGGE. The similarity of the same samples obtained after DNA-extraction with different kits (in the same storage condition) was 80–87% (Figure 2, Article V),
4. Results and discussion
97
whereas the similarity of the same sample after different storage conditions was > 94% when similar DNA-extraction protocols were applied, except for sub-samples stored initially at 4oC for two days. The similarity of samples stored at 4oC was 84–93% as compared to the same samples stored at -20oC or at -70oC using identical DNA-extraction protocols. Clone library analysis confirmed the partly different bacterial compositions detected with DGGE (Table 3, Article V). The most preva-lent Clept-group genera detected after mechanical DNA-extraction were Faecali-bacterium (39%) and Subdoligranulum (37%), whereas after enzymatic DNA-extraction 80% of the clones grouped to genus Subdoligranulum. In addition, the diversity of the Clept-group was higher after mechanical DNA-extraction, as de-tected with both DGGE and clone libraries (Figure S5, Article V). The storage conditions did not have a significant effect (~0.5 log reduction at 4oC and -20oC) on the quantity of Clept-group bacteria as detected with qPCR, when similar pro-tocols were compared. However, the numbers of Clept-group bacteria were signif-icantly higher after mechanical DNA-extraction (p<0.05; ~1.5 log unit difference; Fig. 3) than after enzymatic DNA-extraction, regardless of the protocol and stor-age conditions applied. The significantly improved DNA extraction efficiency of Clept-group by mechanical DNA-extraction has also been noted previously236.
The storage conditions and different DNA-extraction methods had no effect on the diversity and composition of Bacteroides spp. All the profiles of a given person, regardless of the protocol or storage conditions applied, were similar (similarity with Pearson correlation > 90%). However, the storage conditions greatly affected the numbers of the Bacteroides spp. The highest numbers of Bacteroides spp. were obtained from fresh samples as detected with qPCR, whereas after one week’s storage at -20oC the numbers of Bacteroides spp. were significantly lower (1.6 to 2.5 log reduction, depending on the DNA-extraction modification) than those in fresh samples. The storage at -70oC or initially at 4oC resulted in a non-significant reduction of 0.01–1.5 log units, depending on the DNA-extraction modi-fication. Most of the obesity-related studies that have obtained similar results, i.e. that the relative proportion of Bacteroidetes decreases and the relative proportion of Firmicutes increases in obese individuals82, have used QIAmp DNA Stool Mini Kit558-560,562, whereas in those studies in which there has been no difference be-tween obese and lean subjects or the results have been contradictory to the initial findings, a more rigorous DNA-extraction protocol has been applied563-565 or the samples have been studied with fluorescent in situ hybridization378,381,561,564. Since our results demonstrate that the DNA-extraction protocol has a major effect on the clostridial populations while having no effect on the Bacteroides population, it seems that the contradictory results may be caused, at least partly, by different DNA-extraction protocols.
The different storage conditions and DNA-extraction methods did not affect the bifidobacterial diversity or the composition as detected with bifidobacteria specific DGGE. The storage conditions did not have a significant effect on the numbers of bifidobacteria when similar protocols were compared. Interestingly, however, the lowest numbers of bifidobacteria were found in the fresh samples, contrary to e.g. Bacteroides spp. The numbers of bifidobacteria were significantly
4. Results and discussion
98
higher (p<0.05; ~3 log unit difference; Figure 3, Article V) after mechanical DNA-extraction than after enzymatic DNA-extraction as detected with qPCR. A recent example of contradictory findings has involved the bifidobacterial populations of baby feces. Bifidobacterial populations were found to constitute a dominant part of baby feces already decades ago using culture-based methods143,337. However, with molecular techniques the results have been partly contradictory. There are numerous studies conducted with molecular techniques in which bifidobacteria have been shown to dominate baby fecal microbiota225,325,333-334, but there are also some in which bifidobacteria have been found to constitute only a minor part of the infant microbiota311. Similarly to the obesity issue, this inconsistency may also result from the different DNA-extraction techniques applied. In those molecular studies in which bifidobacteria have been shown to predominate in the baby feces, mechanical DNA-extraction has been applied325,334 or the samples have been studied with FISH225,333. In those studies in which the authors have concluded that bifidobacteria constitute only a minor part of the baby fecal microbiota, enzymatic DNA-extraction using the same commercial kit as in our study has been ap-plied311. Since our results showed that with enzymatic DNA-extraction the number of bifidobacteria may be even 3 log units lower than with rigorous mechanical DNA-extraction, differences in DNA-extraction probably explain these contradicto-ry results. In addition, Nakamura et al.310 showed that when enzymatic DNA-extraction was applied bifidobacterial the abundance was 0.1–1.7%, whereas when FISH was applied to the same samples the bifidobacterial abundance in-creased to 20.7–83.5% in baby feces. Furthermore, it has previously been found236 that with more rigorous mechanical disruption the proportion of Actinobacteria (e.g. bifidobacteria and Atopobium group) increased. Interestingly, the protocol which yielded the lowest levels of Actinobacteria was based on the same kit that we used for enzymatic DNA-extraction236. However, we used the kit according to the manufacturer’s instructions, whereas Salonen et al.236 added 3x30 s bead beating and extended the duration of heat lysis in their study. Even with these modifications the proportion of Actinobacteria was low.
The diversity and composition of Lactobacillus group was not significantly af-fected, as detected with specific DGGE, by the storage conditions when mechani-cal DNA-extraction was applied. After enzymatic DNA-extraction, the samples did not amplify with the Lactobacillus group specific PCR at all.
The numbers of Atopobium group bacteria were significantly affected by both stor-age conditions and the used DNA-extraction protocols as detected with qPCR. After mechanical DNA-extraction the number of Atopobium group bacteria was significantly higher (p<0.05; 2.5–4.5 log unit difference; Figure 3, Article V) in all evaluated storage conditions. Unexpectedly, the numbers of Atopobium group bacteria were significantly higher (p<0.05; > 1 log unit difference) after initial storage at -20oC for one week or at 4oC for two days than those from fresh samples or samples stored solely at -70oC. The unexpected effect of storage conditions on Atopobium group numbers was confirmed with FISH (data not shown). The numbers of Atopobium group bacteria were 5–6 log units higher in a sample that was initially stored at 4oC for two days and thereafter at -70oC and when DNA-extraction was performed mechanically (3 x 60s), than on the

4. Results and discussion
99
same sample that was stored at -70oC and the DNA-extraction was performed enzymatically. There was no clear explanation for this phenomenon in the litera-ture. The only possibly relevant finding was that Collinsella spp. (part of the Ato-pobium group) cell wall contains a unique A4β-type peptidoglycan152. Therefore it may be that the cell wall structure is extremely difficult to lyse without the extra stress of storage at 4oC. However, these results may explain why in some studies the Atopobium group bacteria are not considered to be part of the normal human predom-inant microbiota55, whereas in others, especially those conducted with FISH, Atopobi-um group bacteria are shown to constitute 1–8% of the total population of the human gut microbiota63-64,77,251. Moreover, the possible underestimation of Atopobium group bacteria, and Actinobacteria in general have also been reported elsewhere236,309.
Salivary microbiota vs. fecal microbiota 4.4.2
Oral cavity contains different micro-environments (cheeks, palate, tongue, tooth surfaces, gingival areas, and saliva) with their own microbiota18. Salivary microbio-ta reflects a mixture of bacteria washed off from the various surfaces, especially from the tongue34. A large diversity of bacteria has been detected in the oral cavi-ty, including low GC Gram positives (e.g. streptococci and clostridia-group), fuso-bacteria, actinobacteria, different proteobacteria, Prevotella, Porphyromonas, Bacteroides, and spirochetes. Members of the Clostridial cluster XIVa have occa-sionally been detected in oral samples22. In the oral cavity both bifidobacteria and lactobacilli can be detected, but their occurrence is reversed compared to feces: lactobacilli are a common finding in the oral cavity, whereas bifidobacteria are less frequently detected.
The aim was to investigate whether similar features concerning the diversi-ty and temporal stability of the predominant microbiota and selected bacterial groups – namely the Clostridial cluster XIVa, bifidobacteria and lactobacilli – could be detected intra-individually in saliva and feces. Special focus was put on the species distribution of the genera Lactobacillus and Bifidobacterium at these two sites. The subjects consumed a commercial probiotic capsule preparation (Trevis, 54 capsules; Ipex Medical) according to the manufacturer’s instructions (three capsules each day) for 2 weeks. Trevis capsules contain a mixture of Lactobacil-lus acidophilus LaCH-5, Bifidobacterium animalis subsp. lactis Bb-12 and yoghurt starter bacteria, totaling 109–1010 organisms per capsule.
Compliance was evaluated with culture-based techniques and DGGE analysis in this study. Probiotic strains were not found in any of the baseline samples, whereas RAPD types identical to B. animalis subsp. lactis Bb12 were found in all fecal samples during probiotic ingestion. Ingested probiotic strains were not found in any of our salivary samples.
DGGE analysis targeted to the predominant microbiota showed intra-individual diversity as well as uniqueness of both fecal and salivary microbiota (Figure 1A, Article IV). When all the samples were clustered together, salivary samples formed one cluster and fecal samples another. Both sample-type clusters had further
4. Results and discussion
100
individual-based subclusters. The DGGE-profiles of fecal and salivary samples differed substantially (mean similarity 24 ± 7%). The predominant fecal microbiota was tempo-rally relatively stable (mean similarity 83 ± 5%) and the salivary microbiota mostly stable (mean similarity 92 ± 3%) during the study period. These findings are consistent with previous studies in which it has been showed that the fecal and salivary microbio-ta are host specific and temporally relatively stable56,58,242,625. We found a significant difference between the number of amplicons detected in the fecal and salivary profiles (feces > saliva; p<0.05). Since Aas et al.18 found 20–30 different predomi-nant species in most oral sites, our predominant salivary bacterial DGGE results are in accordance with this previous study.
DGGE analysis targeted to the Erec-group showed intra-individual diversity as well as uniqueness of both fecal and salivary microbiota (Figure 1B, Article IV). Erec-profiles of fecal samples clustered together according to the person, whereas in salivary samples individual clustering was noticed in eight out of ten individuals. The similarity between fecal and salivary samples from the same individual at a given time point was very low or non-existent (mean similarity 18 ± 11%). All fecal samples clustered together as one distinct cluster and all salivary samples as another. In an earlier study of this thesis (Article II) it was shown that each band position in DGGE-gels contained only one phylotype. We may therefore assume that the phylotypes present in the feces and saliva are mostly different. Erec-group bacteria were temporally stable in most cases (mean similarity: feces 94 ± 3%, saliva 91 ± 7%) during the study period, as has been described previously242.The Erec-group diversity in salivary samples of this study was significantly lower than in the fecal samples (p<0.05), although 3–12 amplicons were found in each sam-ple, indicating that the diversity of the Erec-group in saliva in some subjects may be slightly greater than has previously been shown with other techniques22,626.
The fecal and salivary Lactobacillus-group DGGE-profiles of this study were more similar to each other (mean similarity 59 ± 11%) than the feces- and saliva-derived profiles of the other studied bacterial groups. In addition, fecal Lactobacillus-group profiles of nearly all the people were rather unstable (mean similarity 69 ± 7%; Figure 1C, Article IV), whereas salivary Lactobacillus-group profiles remained rather stable (mean similarity 90 ± 8%). Based on the comparisons made between differ-ent sampling points (baseline without probiotic consumption vs. samples during probiotic consumption), the ingested L. acidophilus LaCH-5 strain, which was seen in the fecal lactobacilli DGGE-profile during probiotic ingestion, does not alone explain the instability. Since the LaCH-5 strain produced only a single band, it did not constitute a major change in the similarity values between the samples. In the salivary samples there were no amplicons migrating identically to L. acidophilus LaCH-5. In BioNumerics analysis the lack of stable and host-specific Lactobacil-lus-group population resulted in a complete lack of subject grouping in fecal sam-ples and sample type grouping (feces vs. saliva). The lack of subject grouping has also been reported previously for fecal samples58. The number of amplicons de-tected in our study was higher in fecal samples than in salivary samples.
Bifidobacterial DGGE-profiles of fecal samples of a given subject clustered to-gether in nine out of ten people in this study. In these cases the fecal bifidobacte-
4. Results and discussion
101
rial population remained temporally rather stable (Figure 1D, Article IV), as has also been reported previously256. Only approximately half of the salivary samples (17/30 samples) gave a positive PCR-result, although several additional variations of the PCR-protocol were tested. The salivary bifidobacterial populations were temporally stable in three subjects and unstable in one subject. Of the remaining six subjects, only one sample from three subjects and two samples from another subject produced a PCR product – thus not affording temporal stability to be de-termined. The bifidobacterial profiles did not cluster according to the sample type, even though the similarity between fecal samples and salivary samples collected at the same time was low. The fecal samples contained significantly more ampli-cons than the salivary samples at all sampling time points (p<0.05). Since the PCR-primers, which were used for the DGGE-based diversity assessment, did not fully target (1 mismatch) the ingested B. animalis subsp. lactis Bb12610, this strain was not seen in the bifidobacterial DGGE-profiles, and therefore did not affect the temporal stability of the fecal and salivary profiles. However, Bb12 was detected in fecal samples from 7 of the 10 subjects using B. animalis subsp. lactis Bb12 tar-geting DGGE. There were no amplicons migrating identically to B. animalis subsp. lactis Bb-12 in any of the salivary samples.
The number of culturable bacteria remained stable during the probiotic con-sumption in both fecal and salivary samples. The number of culturable anaerobic bacteria was significantly higher in feces (mean log 10.5 cfu/g) than in saliva (mean log 8.3 cfu/g) (p<0.05), whereas the number of culturable aerobic bacteria was significantly higher in saliva (mean log 7.8 cfu/g) than in feces (mean log 7.1 cfu/g) (p<0.05). Mean numbers of culturable bacteria on media without tetracycline at different sampling occasions are shown in Figure 2 of Article IV. The numbers of both bifidobacteria and lactobacilli were significantly higher in feces as com-pared to saliva (p<0.05) (Fig. 2). The numbers of culturable bacteria found in sali-vary and fecal samples were in accordance with previous studies145, 372,627.
Isolates with an identical RAPD type to the ingested B. animalis subsp. lactis Bb-12 strain were recovered from fecal samples but not from the salivary samples of all subjects during probiotic consumption, whereas isolates of L. acidophilus LaCH-5 strain were recovered from fecal samples of all the subjects after 1 week of probiotic consumption and from nine out of ten subjects after 2 weeks.
From each subject 3–6 indigenous salivary lactobacilli RAPD types and 1–5 indigenous fecal lactobacilli RAPD types were detected (Table 3; Article IV). In addition, identical indigenous lactobacilli RAPD types were found in saliva and feces for eight of the ten subjects (Table 3; Article IV). These included L. rhamnosus, L. gasseri, L. paracasei, L. plantarum group (comprising L. plantarum, L. arizo-nensis, and L. pentosus), and a Lactobacillus sp. In a study of Dal Bello & Her-tel27, Lactobacillus-populations of salivary and oral samples of three subjects were compared by culture and RAPD typing in addition to DGGE. They found that L. gasseri, L. paracasei, L. rhamnosus, and L. vaginalis were most commonly detected among the predominant lactobacilli in the saliva and feces of their three sub-jects. However, we found L. vaginalis only from one subject’s saliva and from none of the fecal samples of our subjects. L. gasseri, L. paracasei, and L. rhamnosus were
4. Results and discussion
102
commonly detected from our subjects. The similarity of the fecal and salivary Lac-tobacillus populations found in this and another study27 indicate that at least some Lactobacillus species/strains are able to live in different niches in the human oro-gastrointestinal tract – although the oral cavity and colon differ in several aspects including redox potential, nutrients, mucosal surfaces, and co-existing members of the specific microbial community.
Between 2 and 8 indigenous RAPD types were found per subject from fecal isolates, and 2 to 9 per subject from salivary isolates from Beerens agar. However, only 1–7 fecal and 0–2 salivary RAPD types per subject were confirmed to be bifidobacteria (after bifidobacteria-specific PCR256), indicating that most salivary biotypes from the Beerens agar were not bifidobacteria. By contrast, 80% (37/46) of the fecal biotypes from the Beerens agar were bifidobacteria. No identical indig-enous RAPD types were found between saliva and feces. After sequencing of the different bifidobacteria RAPD types, multiple indigenous bifidobacterial genotypes, including B. longum, B. adolescentis, B. catenulatum/pseudocatenulatum, B. bifi-dum, and B. angulatum were detected in feces within an individual, whereas only B. dentium and B. bifidum were detected from saliva. We found B. dentium from the saliva of five subjects. B. dentium was not found in fecal samples, which is consistent with one published culture-based analysis142. However, it has been found in feces in DNA-based studies145. We used culture-based identification in the present study, since we wanted to determine whether the bifidobacteria de-tected from the feces were alive and therefore most likely to represent autochtho-nous strains. The levels of B. dentium in our salivary samples were 2×10⁵ cfu/ml (mean), which accounts for 106–108 cells per 1000 ml saliva – which is the aver-age quantity of saliva ingested daily34. Therefore the B. dentium strains found in the fecal samples by DNA-based methods may originate from saliva and actually be allochthonous.
5. Summary and conclusions
103
5. Summary and conclusions
The first hypothesis was that the developed molecular tools enable rapid and cost-effective characterization of the human predominant fecal microbiota. As shown in Articles I, II, and V, all the developed methods (rRNA-based predominant bacterial DGGE, rRNA- and DNA-based Eubacterium rectale – Blautia coccoides group (Erec) DGGE, DNA-based C. leptum group (Clept) DGGE, DNA-based Bac-teroides spp. DGGE, and qPCR methods targeting predominant bacteria, Erec-group, Clept-group, Bacteroides spp., bifidobacteria and Atopobium group) proved to be sensitive and highly specific. All the developed methods enabled rapid and cost-effective characterization of the human fecal and salivary predominant microbiota. Predominant bacteria, Erec-group, Clept-group, and Bacteroides spp., populations of healthy adults proved to be temporally rather stable showing intra-individual di-versity and inter-individual variability. Furthermore, the rRNA-based profiles showed more temporal instability than DNA-based profiles of predominant bacteria and Erec-group bacteria.
The second hypothesis was that the fecal microbiota of people having IBS differs from that of healthy adults, and that the difference is distinguishable with molecular microbiological techniques. According to the results, the studied clostridial groups (Erec, Clept, C. lituseburense, and C. histolyticum) represented the dominant fecal microbiota of most of the studied subjects, comprising altogether 29–87% of the total bacteria as determined by the hybridized 16S rRNA of TRAC-analysis. Erec-group was the dominant subgroup of clostridia, accounting on average for 43% of total bacte-ria in control subjects and 30% and 50% in irritable bowel syndrome (IBS) subjects affected by constipation and diarrhea, respectively. The proportion of Erec-group was significantly lower in the constipation type IBS subjects than in the healthy controls. DNA-based and rRNA-based DGGE analyses targeted to the predominant bacterial population showed considerable biodiversity as well as uniqueness of the microbiota in each subject in both control and IBS subject groups. The rRNA-based DGGE profiles of the fecal microbiota of the IBS subjects further indicated higher temporal instability of their microbiota composition as compared to the control subjects. Our observations indicate that in addition to instability of fecal active predominant bacterial population, clostridial microbiota may also be involved in IBS.
The third hypothesis was that the fecal microbiota of elderly people differs from that of younger adults and that the elderly fecal microbiota may be modified with a
5. Summary and conclusions
104
GOS-yoghurt intervention. We did not find any differences between elderly and younger adults in temporal stability of the studied bacterial populations (predomi-nant bacteria, Erec-group, bifidobacteria, and lactobacilli). However, the difference in diversity of predominant bacterial population and Erec-group bacteria was found to be significantly higher in elderly subjects as compared to younger adults. Con-sumption of probiotic yoghurt containing galacto-oligosaccharide (GOS) for three weeks did not significantly affect the diversity or temporal stability of predominant bacterial, bifidobacterial, Lactobacillus-group or Erec-group fecal populations in elderly subjects. On average, the Erec-group bacteria remained stable, the pre-dominant bacterial and bifidobacterial populations remained reasonably stable and the Lactobacillus-group was unstable in both study groups. However, the compo-site data set containing all DGGE analyses of the study showed that the microbial communities from the GOS-supplemented subjects were more similar to each other than those of the control subjects. Therefore, the GOS-yoghurt may have a stabilizing effect on the predominant fecal microbiota of elderly people.
The fourth hypothesis was that there might be confounding factors responsible for the contradictory results obtained in many recent studies – especially differences in storage conditions and DNA-extraction protocols of fecal samples. According to the results, the DNA-extraction did not affect the diversity, composition, or quantity of Bacteroides spp., whereas after one week’s storage at -20oC the numbers of Bac-teroides spp. were 1.6–2.5 log-units lower (p<0.05). Furthermore, the numbers of predominant bacteria, Erec-group, Clept-group, bifidobacteria, and Atopobium-group were 0.5–4 log-units higher (p<0.05) after mechanical DNA-extraction as detected with qPCR, regardless of storage. Furthermore, the bacterial composition of Erec-group differed significantly after different DNA-extractions; after enzymatic DNA-extraction the most prevalent genera detected were Roseburia (39% of clones) and Coprococcus (10%), whereas after mechanical DNA-extraction the most prevalent genera were Blautia (30%), Coprococcus (13%), and Dorea (10%). According to our results, rigorous mechanical lysis leads to the detection of higher bacterial numbers and higher bacterial population diversity in human fecal samples. Since it was shown that the results of clostridial and Actinobacterial populations are highly dependent on the DNA-extraction methods applied, the use of different DNA-extraction protocols may explain the contradictory results previously obtained.
Another part of the hypothesis was whether the microbiota of the upper gastroin-testinal tract may also influence the results obtained from fecal samples with DNA-based methods, since the gastrointestinal tract is an open system. Therefore the similarity of the salivary and fecal microbiota was studied. The predominant bacteria, bifidobacteria, and Erec-group bacteria of the oral cavity and feces were generally stable during probiotic consumption, showing more diversity in feces than in saliva and different species compositions for the two sampling sites. By contrast lactobacilli, which are known to inhabit several ecological niches, showed temporal instability in both feces and saliva. Furthermore, fecal and salivary samples contained identical indigenous Lactobacillus genotypes (L. rhamnosus, L. gasseri, L. paracasei, L. plantarum group, and a Lactobacillus sp.) in most subjects.

6. Future outlook
105
6. Future outlook
In 1959 Jordan concluded with regard to problems related to gut microbiota studies: “Whenever a man gets the idea that he is going to work out the bacteriology of the intestinal tract of any mammal, the time has come to have him quietly removed to some suitable institution”341. A lot has happened in the field of gastrointestinal micro-biota research since those days. Especially after the initiation of the Pro EU Health cluster in the beginning of 21st century and the Human Microbiome Project (HMP) in the U.S. and MetaHit in Europe in recent years, the knowledge of GIT microbiota has greatly advanced. However, occasionally it seems that the culture-based knowledge obtained in the 1960s and 1970s has been forgotten, or regarded as “old-fashioned” or even “out-dated”. Moreover, it appears that the used method is of more importance, than the study design and which method – however “out-dated” – would provide the best possibility to answer the question proposed.
The recent large projects have created vast amounts of sequence data that many times correspond to “uncultured bacterial clones” or genes coding for “un-known functions”. In order to fully exploit the enormous databanks hitherto created, culture-based studies would be needed for the isolation of the currently “uncul-tured bacteria”. Besides using culture-based approaches for the identification of “uncultured bacteria” and determination of their metabolic properties, single-cell genomics together with flow cytometry sorting and/or (microscopic) optical twee-zers would enable the genome analysis of a single bacterium, thus minimizing the possible misinterpretations of giant data sets created with the metagenomic ap-proach. Besides assessing the theoretical metabolic properties obtained with DNA-based metagenomic analysis, more information would be needed on the actual activity of the complex GIT microbial population. Moreover, the combination of proteomics, transcriptomics, and metabolomics would shed more light on the host response.
Another recent hot topic in the field of GIT microbiota research has been the cor-relation of certain bacteria/bacterial groups with certain diseases/disorders. Nowa-days it appears to be easier to list the diseases/disorders that have not been associated with disturbances in the GIT microbiota, than those that have. However, correlation does not equal causality. In order to actually authenticate the relationship between diseases and gut microbiota, large longitudinal population cohorts with all the back-ground information (including diet, medical history, genetics etc.) would be needed.
6. Future outlook
106
In conclusion, although a large amount of data has been generated during the past ten years in the field of GIT microbiota research, many questions still remain unanswered. Therefore, besides having all the relevant background information and numerous samples, more interdisciplinary research across microbiology, immunology, genetics, epigenetics, proteomics, transcriptomics, metabolomics, and physiology would be needed.
107
References
1. Wilson M. Bacteriology of humans. Oxford, UK: Blackwell Publishing; 2008.
2. Kurokawa K, Itoh T, Kuwahara T, Oshima K, Toh H, Toyoda A, et al. Compara-tive metagenomics revealed commonly enriched gene sets in human gut microbiomes. DNA Research 2007;14(4):169–81.
3. Round JL, Mazmanian SK. The gut microbiota shapes intestinal immune re-sponses during health and disease. Nat Rev Immunol 2009;9(5):313–23.
4. Gill SR, Pop M, DeBoy RT, Eckburg PB, Turnbaugh PJ, Samuel BS, et al. Met-agenomic analysis of the human distal gut microbiome. Science 2006;312(5778):1355–9.
5. Cummings JH. Short chain fatty acids in the human colon. Gut 1981;22(9):763–79.
6. Cummings JH, Macfarlane GT. The control and consequences of bacterial fermentation in the human colon. J Appl Bacteriol 1991;70(6):443–59.
7. Hylemon PB, Zhou H, Pandak WM, Ren S, Gil G, Dent P. Bile acids as regula-tory molecules. J Lipid Res 2009;50(8):1509–20.
8. Jones BV, Begley M, Hill C, Gahan CGM, Marchesi JR. Functional and com-parative metagenomic analysis of bile salt hydrolase activity in the hu-man gut microbiome. Proc Natl Acad Sci U S A 2008;105(36):13580–5.
9. Saulnier DM, Kolida S, Gibson GR. Microbiology of the human intestinal tract and approaches for its dietary modulation. Curr Pharm Des 2009; 15(13):1403–14.
10. Rowland IR. Interactions of the gut microflora and the host in toxicology. Toxicol Pathol 1988;16(2):147–53.
11. Goldin BR. The metabolism of the intestinal microflora and its relationship to die-tary fat, colon and breast cancer. Prog Clin Biol Res 1986;222:655–85.
12. Hooper LV, Wong MH, Thelin A, Hansson L, Falk PG, Gordon JI. Molecular analysis of commensal host-microbial relationships in the intestine. Sci-ence 2001;291(5505):881–4.
13. Savage DC. Microbial ecology of the gastrointestinal tract. Annu Rev Microbiol 1977;31:107–33.
14. Finegold SM, Sutter VL, Mathisen GE. Normal indigenous intestinal flora. Human Intestinal Microflora in Health and Disease New York, NY: Aca-demic Press; 1983. p. 3–31.
108
15. Franks AH, Harmsen HJM, Raangs GC, Jansen GJ, Schut F, Welling GW. Variations of bacterial populations in human feces measured by fluores-cent in situ hybridization with group-specific 16S rRNA-targeted oligonu-cleotide probes. Appl Environ Microbiol 1998;64(9):3336–45.
16. Harmsen HJM, Raangs GC, He T, Degener JE, Welling GW. Extensive set of 16S rRNA-based probes for detection of bacteria in human feces. Appl Environ Microbiol 2002;68(6):2982–90.
17. Marchesi J, Shanahan F. The normal intestinal microbiota. Curr Opin Infect Dis 2007;20(5):508–13.
18. Aas JA, Paster BJ, Stokes LN, Olsen I, Dewhirst FE. Defining the normal bac-terial flora of the oral cavity. J Clin Microbiol 2005;43(11):5721–32.
19. Zaura E, Keijser BJ, Huse SM, Crielaard W. Defining the healthy "core micro-biome" of oral microbial communities. BMC Microbiology 2009;9.
20. Jenkinson HF, Lamont RJ. Oral microbial communities in sickness and in health. Trends Microbiol 2005;13(12):589–95.
21. Dewhirst FE, Chen T, Izard J, Paster BJ, Tanner ACR, Yu WH, et al. The human oral microbiome. J Bacteriol 2010;192(19):5002–17.
22. Paster BJ, Boches SK, Galvin JL, Ericson RE, Lau CN, Levanos VA, et al. Bacterial diversity in human subgingival plaque. J Bacteriol 2001;183(12):3770–83.
23. Kroes I, Lepp PW, Relman DA. Bacterial diversity within the human subgingival crevice. Proc Natl Acad Sci U S A 1999;96(25):14547–52.
24. Nasidze I, Li J, Quinque D, Tang K, Stoneking M. Global diversity in the human salivary microbiome. Genome Res 2009;19(4):636–43.
25. Yang F, Zeng X, Ning K, Liu K, Lo C, Wang W, et al. Saliva microbiomes distin-guish caries-active from healthy human populations. ISME J 2012;6(1):1–10.
26. Ahumada MC, Colloca ME, López ME, Pesce De Ruiz Holgado A, Nader-Macias ME. Characterization of lactobacilli isolated from the tongue and gum. Anaerobe 1999;5(3–4):129–35.
27. Dal Bello F, Hertel C. Oral cavity as natural reservoir for intestinal lactobacilli. Syst Appl Microbiol 2006;29(1):69–76.
28. Maiden MFJ, Tanner A, Macuch PJ. Rapid characterization of periodontal bacterial isolates by using fluorogenic substrate tests. J Clin Microbiol 1996;34(2):376–84.

109
29. Jian W, Dong X. Transfer of Bifidobacterium inopinatum and Bifidobacterium denticolens to Scardovia inopinata gen. nov., comb. nov., and Parascar-dovia denticolens gen. nov., comb. nov., respectively. Int J Syst Evol Mi-crobiol 2002;52(3):809–12.
30. Becker MR, Paster BJ, Leys EJ, Moeschberger ML, Kenyon SG, Galvin JL, et al. Molecular analysis of bacterial species associated with childhood caries. J Clin Microbiol 2002;40(3):1001–9.
31. Aas JA, Griffen AL, Dardis SR, Lee AM, Olsen I, Dewhirst FE, et al. Bacteria of dental caries in primary and permanent teeth in children and young adults. J Clin Microbiol 2008;46(4):1407–17.
32. Tanner A. Microbial Succesion in the Development of Periodontal Disease. In: Hamada S, Holt SC, McGhee JR, editors. Tokyo, Japan: Quintessence Publishing Co.; 1991. p. 13–25.
33. Li Y, Ku CYS, Xu J, Saxena D, Caufield PW. Survey of oral microbial diversity using PCR-based denaturing gradient gel electrophoresis. J Dent Res 2005;84(6):559–64.
34. Nisengard RJ, Newman MG. Oral Microbiology and Immunology. 2nd ed. Philadelphia, PA, USA: W.B. Saunders Co; 1994.
35. Greabu M, Battino M, Mohora M, Totan A, Didilescu A, Spinu T, et al. Saliva – a diagnostic window to the body, both in health and in disease. J Med Life 2009;2(2):124–32.
36. Lemon KP, Klepac-Ceraj V, Schiffer HK, Brodie EL, Lynch SV, Kolter R. Com-parative analyses of the Bacterial microbiota of the human nostril and oropharynx. MBio 2010;1(3).
37. Yang L, Lu X, Nossa CW, Francois F, Peek RM, Pei Z. Inflammation and In-testinal Metaplasia of the Distal Esophagus Are Associated With Altera-tions in the Microbiome. Gastroenterol 2009; 8;137(2):588–97.
38. Pajecki D, Zilberstein B, dos Santos MAA, Joa , Quintanilha AG, Cecconello I, et al. Megaesophagus Microbiota: A Qualitative and Quantitative Analysis. J Gastrointest Surg 2002; 10;6(5):723–9.
39. Pei Z, Bini EJ, Yang L, Zhou M, Francois F, Blaser MJ. Bacterial biota in the human distal esophagus. Proc Natl Acad Sci U S A 2004;101(12):4250–5.
40. Li XX, Wong GL, To KF, Wong VW, Lai LH, Chow DK, et al. Bacterial microbi-ota profiling in gastritis without Helicobacter pylori infection or non-steroidal anti-inflammatory drug use. PLoS One 2009;4(11):e7985.
110
41. Andersson AF, Lindberg M, Jakobsson H, Bäckhed F, Nyrén P, Engstrand L. Comparative analysis of human gut microbiota by barcoded pyrose-quencing. PLoS ONE 2008;3(7).
42. Vesper BJ, Jawdi A, Altman KW, Haines GK,3rd, Tao L, Radosevich JA. The effect of proton pump inhibitors on the human microbiota. Curr Drug Metab 2009;10(1):84–9.
43. Adamsson I, Nord CE, Lundquist P, Sjostedt S, Edlund C. Comparative effects of omeprazole, amoxycillin plus metronidazole versus omeprazole, clar-ithromycin plus metronidazole on the oral, gastric and intestinal microflo-ra in Helicobacter pylori-infected patients. J Antimicrob Chemother 1999;44(5):629–40.
44. Bik EM, Eckburg PB, Gill SR, Nelson KE, Purdom EA, Francois F, et al. Mo-lecular analysis of the bacterial microbiota in the human stomach. Proc Natl Acad Sci U S A 2006;103(3):732–7.
45. Dicksved J, Lindberg M, Rosenquist M, Enroth H, Jansson JK, Engstrand L. Molecular characterization of the stomach microbiota in patients with gastric cancer and in controls. J Med Microbiol 2009;58(Pt 4):509–16.
46. Nienstedt W, Hänninen O, Arstila A, Björkqvist S. Ihmisen fysiologia ja anatomia. 15–17 ed. Helsinki, Finland: Werner Söderström Osakeyhtiö; 2008.
47. Booijink CCGM, El-Aidy S, Rajilić-Stojanović M, Heilig HGHJ, Troost FJ, Smidt H, et al. High temporal and inter-individual variation detected in the human ileal microbiota. Environ Microbiol 2010;12(12):3213–27.
48. Hayashi H, Takahashi R, Nishi T, Sakamoto M, Benno Y. Molecular analysis of jejunal, ileal, caecal and recto-sigmoidal human colonic microbiota using 16S rRNA gene libraries and terminal restriction fragment length poly-morphism. J Med Microbiol 2005;54(Pt 11):1093–101.
49. Thadepalli H, Lou MA, Bach VT, Matsui TK, Mandal AK. Microflora of the human small intestine. Am J Surg 1979;138(6):845–50.
50. Stevens J, VanSoest PJ, Robertson JB, Levitsky DA. Mean transit time meas-urement by analysis of a single stool after ingestion of multicolored plastic pellets. Am J Clin Nutr 1987;46(6):1048–54.
51. Cummings JH, Macfarlane GT. Colonic microflora: nutrition and health. Nutri-tion 1997;13(5):476–8.
52. McNeil NI. The contribution of the large intestine to energy supplies in man. Am J Clin Nutr 1984;39(2):338–42.
111
53. Rajilić-Stojanović M, Smidt H, De Vos WM. Diversity of the human gastrointes-tinal tract microbiota revisited. Environ Microbiol 2007;9(9):2125–36.
54. Qin J, Li R, Raes J, Arumugam M, Burgdorf KS, Manichanh C, et al. A human gut microbial gene catalogue established by metagenomic sequencing. Nature 2010;464(7285):59–65.
55. Eckburg PB, Bik EM, Bernstein CN, Purdom E, Dethlefsen L, Sargent M, et al. Microbiology: Diversity of the human intestinal microbial flora. Science 2005;308(5728):1635–8.
56. Zoetendal EG, Akkermans ADL, De Vos WM. Temperature gradient gel elec-trophoresis analysis of 16S rRNA from human fecal samples reveals sta-ble and host-specific communities of active bacteria. Appl Environ Micro-biol 1998;64(10):3854–9.
57. Zoetendal EG, Akkermans ADL, Akkermans-van Vliet WM, De Visser JAGM, De Vos WM. The host genotype affects the bacterial community in the human gastrointestinal tract. Microb Ecol Health Dis 2001;13(3):129–34.
58. Vanhoutte T, Huys G, De Brandt E, Swings J. Temporal stability analysis of the microbiota in human feces by denaturing gradient gel electrophoresis using universal and group-specific 16S rRNA gene primers. FEMS Mi-crobiol Ecol 2004;48(3):437–46.
59. Seksik P, Rigottier-Gois L, Gramet G, Sutren M, Pochart P, Marteau P, et al. Alterations of the dominant faecal bacterial groups in patients with Crohn's disease of the colon. Gut 2003;52(2):237–42.
60. Collins MD, Lawson PA, Willems A, Cordoba JJ, Fernandez-Garayzabal J, Garcia P, et al. The phylogeny of the genus Clostridium: Proposal of five new genera and eleven new species combinations. Int J Syst Bacteriol 1994;44(4):812–26.
61. Suau A, Bonnet R, Sutren M, Godon J, Gibson GR, Collins MD, et al. Direct analysis of genes encoding 16S rRNA from complex communities re-veals many novel molecular species within the human gut. Appl Environ Microbiol 1999;65(11):4799–807.
62. Sghir A, Gramet G, Suau A, Rochet V, Pochart P, Dore J. Quantification of bacterial groups within human fecal flora by oligonucleotide probe hybrid-ization. Appl Environ Microbiol 2000;66(5):2263–6.
63. Lay C, Rigottier-Gois L, Holmstrøm K, Rajilic M, Vaughan EE, De Vos WM, et al. Colonic microbiota signatures across five northern European countries. Appl Environ Microbiol 2005;71(7):4153–5.
112
64. Mueller S, Saunier K, Hanisch C, Norin E, Alm L, Midtvedt T, et al. Differences in fecal microbiota in different European study populations in relation to age, gender, and country: A cross-sectional study. Appl Environ Microbiol 2006;72(2):1027–33.
65. Maukonen J, Satokari R, Mättö J, Söderlund H, Mattila-Sandholm T, Saarela M. Prevalence and temporal stability of selected clostridial groups in irritable bowel syndrome in relation to predominant faecal bacteria. J Med Micro-biol 2006;55(5):625–33.
66. Rochet V, Rigottier-Gois L, Rabot S, Doré J. Validation of fluorescent in situ hybridization combined with flow cytometry for assessing interindividual variation in the composition of human fecal microflora during long-term storage of samples. J Microbiol Methods 2004; 11;59(2):263–70.
67. Rigottier-Gois L, Le Bourhis A-G, Gramet G, Rochet V, Doré J. Fluorescent hybridisation combined with flow cytometry and hybridisation of total RNA to analyse the composition of microbial communities in human fae-ces using 16S rRNA probes. FEMS Microbiol Ecol 2003;43(2):237–45.
68. Hold GL, Schwiertz A, Aminov RI, Blaut M, Flint HJ. Oligonucleotide probes that detect quantitatively significant groups of butyrate-producing bacteria in human feces. Appl Environ Microbiol 2003;69(7):4320–4.
69. Zoetendal EG, Ben-Amor K, Harmsen HJM, Schut F, Akkermans ADL, De Vos WM. Quantification of uncultured Ruminococcus obeum-like bacteria in hu-man fecal samples by fluorescent in situ hybridization and flow cytometry us-ing 16S rRNA-targeted probes. Appl Environ Microbiol 2002;68(9):4225–32.
70. Marteau P, Pochart P, Dore J, Bera-Maillet C, Bernalier A, Corthier G. Com-parative study of bacterial groups within the human cecal and fecal mi-crobiota. Appl Environ Microbiol 2001; 67(10):4939–42.
71. Lay C, Sutren M, Rochet V, Saunier K, Doré J, Rigottier-Gois L. Design and validation of 16S rRNA probes to enumerate members of the Clostridium leptum subgroup in human faecal microbiota. Environ Microbiol 2005;7(7):933–46.
72. Saunier K, Rouge C, Lay C, Rigottier-Gois L, Dore J. Enumeration of bacteria from the Clostridium leptum subgroup in human faecal microbiota using Clep1156 16S rRNA probe in combination with helper and competitor ol-igonucleotides. Syst Appl Microbiol 2005;28(5):454–64.
73. Doré J, Schir A, Hannequart-Gramet G, Corthier G, Pochart P. Design and evaluation of a 16S rRNA-Targeted oligonucleotide probe for specific de-
113
tection and quantitation of human faecal Bacteroides populations. Syst Appl Microbiol 1998;21(1):65–71.
74. Rigottier-Gois L, Rochet V, Garrec N, Suau A, Doré J. Enumeration of Bac-teroides species in human faeces by fluorescent in situ hybridisation combined with flow cytometry using 16S rRNA probes. Syst Appl Micro-biol 2003;26(1):110–8.
75. Collado MC, Derrien M, Isolauri E, De Vos WM, Salminen S. Intestinal integrity and Akkermansia muciniphila, a mucin-degrading member of the intesti-nal microbiota present in infants, adults, and the elderly. Appl Environ Microbiol 2007;73(23):7767–70.
76. Derrien M, Collado MC, Ben-Amor K, Salminen S, De Vos WM. The mucin degrader Akkermansia muciniphila is an abundant resident of the human intestinal tract. Appl Environ Microbiol 2008;74(5):1646–8.
77. Harmsen HJM, Wildeboer-Veloo ACM, Grijpstra J, Knol J, Degener JE, Well-ing GW. Development of 16S rRNA-based probes for the Coriobacterium group and the Atopobium cluster and their application for enumeration of Coriobacteriaceae in human feces from volunteers of different age groups. Appl Environ Microbiol 2000;66(10):4523–7.
78. Gibson GR, Macfarlane GT, Cummings JH. Occurrence of sulphate-reducing bacteria in human faeces and the relationship of dissimilatory sulphate reduc-tion to methanogenesis in the large gut. J Appl Bacteriol 1988;65(2):103–11.
79. Reyes A, Haynes M, Hanson N, Angly FE, Heath AC, Rohwer F, et al. Viruses in the faecal microbiota of monozygotic twins and their mothers. Nature 2010;466(7304):334–8.
80. Doré J, Gramet G, Goderel I, Pochart P. Culture-independent characterisation of human faecal flora using rRNA- targeted hybridisation probes. Genet Sel Evol 1998;30(SUPPL.):S287–96.
81. Tap J, Mondot S, Levenez F, Pelletier E, Caron C, Furet J, et al. Towards the human intestinal microbiota phylogenetic core. Environ Microbiol 2009;11(10):2574–84.
82. Ley RE, Turnbaugh PJ, Klein S, Gordon JI. Microbial ecology: Human gut microbes associated with obesity. Nature 2006;444(7122):1022–3.
83. Turnbaugh PJ, Hamady M, Yatsunenko T, Cantarel BL, Duncan A, Ley RE, et al. A core gut microbiome in obese and lean twins. Nature 2009; 457(7228):480–4.
114
84. Wiegel J, Tanner R, Rainey FA. An introduction to the family Clostridiaceae. Prokaryotes. Stackebrandt, E.; Jones, D.; Holzapfel, W.; Reboli, A.; Far-rar ed. New York, NY: Springer; 2006. p. 654–678.
85. Gupta RS, Gao B. Phylogenomic analyses of clostridia and identification of novel protein signatures that are specific to the genus Clostridium sensu stricto (cluster I). Int J Syst Evol Microbiol 2009;59(2):285–94.
86. Yarza P, Ludwig W, Euzéby J, Amann R, Schleifer K, Glöckner FO, et al. Update of the All-Species Living Tree Project based on 16S and 23S rRNA sequence analyses. Syst Appl Microbiol 2010;33(6):291–9.
87. Schwiertz A, Hold GL, Duncan SH, Gruhl B, Collins MD, Lawson PA, et al. Anaerostipes caccae gen. nov., sp. nov., a new saccharolytic, acetate-utilising, butyrate-producing bacterium from human faeces. Syst Appl Mi-crobiol 2002;25(1):46–51.
88. Liu C, Finegold SM, Song Y, Lawson PA. Reclassification of Clostridium coc-coides, Ruminococcus hansenii, Ruminococcus hydrogenotrophicus, Ruminococcus luti, Ruminococcus productus and Ruminococcus schinkii as Blautia coccoides gen. nov., comb. nov., Blautia hansenii comb. nov., Blautia hydrogenotrophica comb. nov., Blautia luti comb. nov., Blautia producta comb. nov., Blautia schinkii comb. nov. and description of Blautia wexlerae sp. nov. isolated from human faeces. Int J Syst Evol Microbiol 2008;58(8):1896–902.
89. Hespell RB. The Genera Butyrivibrio, Lachnospira, and Roseburia. In: Balows A, Trüper HG, Dworkin M, Harder W, Schleifer K, editors. The Prokaryotes. 2nd ed. New York, NY: Springer-Verlag; 1992. p. 2022–33.
90. Holdeman LV, Moore WEC. New genus, Coprococcus, twelve new species, and emended descriptions of four previously described species of bacteria from human feces. Int J Syst Bacteriol 1974;24(2):260–77.
91. Hippe H, Andreesen JR, Gottschalk G. The Genus Clostridium – Nonmedical. In: Balows A, Trüper HG, Dworkin M, Harder W, Schleifer K, editors. The Prokaryotes. 2nd ed. New York, NY: Springer-Verlag; 1992. p. 1800–66.
92. Taras D, Simmering R, Collins MD, Lawson PA, Blaut M. Reclassification of Eubacterium formicigenerans Holdeman and Moore 1974 as Dorea for-micigenerans gen. nov., comb. nov., and description of Dorea longicate-na sp. nov., isolated from human faeces. Int J Syst Evol Microbiol 2002;52(2):423–8.
93. Andreesen JR. The genus Eubacterium. The Prokaryotes. 2nd ed. New York, NY: Springer-Verlag; 1992. p. 1914–24.
115
94. Blaut M, Schoefer L, Braune A. Transformation of flavonoids by intestinal microorganisms. Int J Vitam Nutr Res 2003;73(2):79–87.
95. Stanton TB, Savage DC. Roseburia cecicola gen. nov., sp. nov., a Motile, Obligately Anaerobic Bacterium from a Mouse Cecum. Int J Syst Bacteriol 1983;33(3):618–27.
96. Duncan SH, Hold GL, Barcenilla A, Stewart CS, Flint HJ. Roseburia intestinalis sp. nov., a novel saccharolytic, butyrate-producing bacterium from hu-man faeces. Int J Syst Evol Microbiol 2002;52(Pt 5):1615–20.
97. Moore WEC, Johnson JL, Holdeman LV. Emendation of Bacteroidaceae and Butyrivibrio and descriptions of Desulfomonas gen. nov. and ten new species in the genera Desulfomonas, Butyrivibrio, Eubacterium, Clostridium, and Ruminococcus. Int J Syst Bacteriol 1976;26(2):238–52.
98. Zellner G, Stackebrandt E, Nagel D, Messner P, Weiss N, Winter J. Anaerofilum pentosovorans gen. nov., sp. nov., and Anaerofilum agile sp. nov., two new, strictly anaerobic, mesophilic, acidogenic bacteria from anaerobic bioreactors. Int J Syst Bacteriol 1996;46(4):871–5.
99. Lawson PA, Song Y, Liu C, Molitoris DR, Väisanen ML, Collins MD, et al. Anaerotruncus colihominis gen. nov., sp. nov., from human faeces. Int J Syst Evol Microbiol 2004;54(Pt 2):413–7.
100. He YL, Ding YF, Long YQ. Two cellulolytic Clostridium species: Clostridium cellulosi sp. nov. and Clostridium cellulofermentans sp. nov. Int J Syst Bacteriol 1991;41(2):306–9.
101. Buckel W, Janssen PH. Clostridium viride sp. Nov., a strictly anaerobic bacte-rium using 5-aminovalerate as growth substrate, previously assigned to Clostridium aminovalericum. Arch Microbiol 1994;162(6):387–94.
102. Wade WG. The genus Eubacterium and related genera. Prokaryotes. Stack-ebrandt, E.; Jones, D.; Holzapfel, W.; Reboli, A.; Farrar, W. ed. New York, NY: Springer; 2006. p. 823–835.
103. Duncan SH, Hold GL, Harmsen HJM, Stewart CS, Flint HJ. Growth require-ments and fermentation products of Fusobacterium prausnitzii, and a proposal to reclassify it as Faecalibacterium prausnitzii gen. nov., comb. nov. Int J Syst Evol Microbiol 2002;52(6):2141–6.
104. Moore WEC, Holdeman LV. Fusobacterium. In: Cato EP, Cummins CS, Holdeman LV, Johnson JL, Moore WEC, Smibert RM, et al, editors. Out-line of Clinical Methods in Anaerobic Bacteriology. 2nd revision ed. Blacksburg, VA, USA: Virginia Polytechnic Institute, Anaerobe Laboratory; 1970.
116
105. Miller TL, Wolin MJ. Formation of hydrogen and formate by Ruminococcus albus. J Bacteriol 1973;116(2):836–46.
106. Ezaki T, Li N, Kawamura Y. The Anaerobic Gram-positive Cocci. In: Dworkin M, Falkow S, Rosenber E, Schleifer K, Stackebrandt E, editors. The Pro-karyotes. 3rd ed. Singapore: Springer; 2006. p. 795–808.
107. Holmstrøm K, Collins MD, Moller T, Falsen E, Lawson PA. Subdoligranulum variabile gen. nov., sp. nov. from human feces. Anaerobe 2004;10(3):197–203.
108. Carlier JP, Bedora-Faure M, K'ouas G, Alauzet C, Mory F. Proposal to unify Clostridium orbiscindens Winter et al. 1991 and Eubacterium plautii (Séguin 1928) Hofstad and Aasjord 1982, with description of Flavonifrac-tor plautii gen. nov., comb. nov., and reassignment of Bacteroides capil-losus to Pseudoflavonifractor capillosus gen. nov., comb. nov. Int J Syst Evol Microbiol 2010;60(3):585–90.
109. Yang JC, Chynoweth DP, Williams DS, Li A. Clostridium aldrichii sp. nov., a cellulolytic mesophile inhabiting a wood-fermenting anaerobic digester. Int J Syst Bacteriol 1990;40(3):268–72.
110. Monserrate E, Leschine SB, Canale-Parola E. Clostridium hungatei sp. nov., a mesophilic, N2-fixing cellulolytic bacterium isolated from soil. Int J Syst Evol Microbiol 2001;51(Pt 1):123–32.
111. Rainey FA. Family X. Veillonellaceae. In: de Vos P, Garrity GM, Jones D, Krieg NR, Ludwig W, Rainey FA, et al, editors. Bergey's Manual of Sys-tematic Bacteriology. 2nd ed. Dordrecht, Germany: Springer; 2009. p. 1059–129.
112. Louis P, Scott KP, Duncan SH, Flint HJ. Understanding the effects of diet on bacterial metabolism in the large intestine. J Appl Microbiol 2007;102(5):1197–208.
113. Smith LDS. The Genus Clostridium – Medical. In: Balows A, Trüper HG, Dworkin M, Harder W, Schleifer K-H, editors. The Prokaryotes New York, NY: Springer-Verlag; 1992. p. 1867–78.
114. Margaret BS, Krywolap GN. Eubacterium yurii subsp. yurii sp. nov. and Eu-bacterium yurii subsp. margaretiae subsp. nov.: Test tube brush bacteria from subgingival dental plaque. Int J Syst Bacteriol 1986;36(2):145–9.
115. Willems A, Collins MD. Phylogenetic relationships of the genera Acetobacte-rium and Eubacterium sensu stricto and reclassification of Eubacterium alactolyticum as Pseudoramibacter alactolyticus gen. nov., comb. nov. Int J Syst Bacteriol 1996;46(4):1083–7.

117
116. Deem AW, Williams CL. The Fermentation Reactions of Erysipelothrix rhusi-opathiae. J Bacteriol 1936;32(3):303–6.
117. Willems A, Moore WEC, Weiss N, Collins MD. Phenotypic and phylogenetic characterization of some eubacterium-like isolates containing a novel type B wall murein from human feces: Description of Holdemania filiform-is gen. nov., sp. nov. Int J Syst Bacteriol 1997;47(4):1201–4.
118. Kaneuchi C, Miyazato T, Shinjo T, Mitsuoka T. Taxonomic study of helically coiled, sporeforming anaerobes isolated from the intestines of humans and other animals: Clostridium cocleatum sp. nov. and Clostridium spi-roforme sp. nov. Int J Syst Bacteriol 1979;29(1):1–12.
119. Clavel T, Lippman R, Gavini F, Dore J, Blaut M. Clostridium saccharogumia sp. nov. and Lactonifactor longoviformis gen. nov., sp. nov., two novel hu-man faecal bacteria involved in the conversion of the dietary phytoestrogen secoisolariciresinol diglucoside. Syst Appl Microbiol 2007;30(1):16–26.
120. Wood BJB, Holzapfel WH. The genera of lactic acid bacteria. 1st ed. Suffolk, Great Britain: Blackie Academic & Professional; 1995.
121. Ludwig W, Schleiffer K-H, Whitman WB. Family IV. Enterococcaceae fam. nov. In: de Vos P, Garrity GM, Jones D, Krieg NR, Ludwig W, Rainey FA, et al, editors. Bergey's Manual of Systematic Bacteriology. 2nd ed. Dor-drecht, Germany: Springer; 2009. p. 594–623.
122. Schleifer K-H. Family I. Lactobacillaceae. In: de Vos P, Garrity GM, Jones D, Krieg NR, Ludwig W, Rainey FA, et al, editors. Bergey's Manual of Sys-tematic Bacteriology. 2nd ed. Dordrecht, Germany: Springer; 2009. p. 465–532.
123. Schleifer K-H. Family V. Leuconostocacaea fam. nov. In: de Vos P, Garrity GM, Jones D, Krieg NR, Ludwig W, Rainey FA, et al, editors. Bergey's Manual of Systematic Bacteriology. 2nd ed. Dordrecht, Germany: Springer; 2009. p. 624–54.
124. Logan NA, de Vos P. Family I. Bacillaceae. In: de Vos P, Garrity GM, Jones D, Krieg NR, Ludwig W, Rainey FA, et al, editors. Bergey's Manual of Sys-tematic Bacteriology. 2nd ed. Dordrecht, Germany: Springer; 2009. p. 20–228.
125. Popoff MR, Poulain B. Bacterial toxins and the nervous system: neurotoxins and multipotential toxins interacting with neuronal cells. Toxins (Basel) 2010;2(4):683–737.
126. Schleifer K-H, Bell JA. Family VIII. Staphylococcaceae fam. nov. In: de Vos P, Garrity GM, Jones D, Krieg NR, Ludwig W, Rainey FA, et al, editors.
118
Bergey's Manual of Systematic Bacteriology. 2nd ed. Dordrecht, Germany: Springer; 2009. p. 392–433.
127. Wexler HM. Bacteroides: The good, the bad, and the nitty-gritty. Clin Microbiol Rev 2007;20(4):593–621.
128. Shah HN, Gharbia SE. Ecophysiology and taxonomy of Bacteroides and related taxa. Clin Infect Dis 1993;16(SUPPL. 4):S160–7.
129. Shah HN. The Genus Bacteroides and Related Taxa. In: Balows A, Trüper HG, Dworkin M, Harder W, Schleifer K-H, editors. The Prokaryotes. 2nd ed. New York, NY: Springer-Verlag; 1992. p. 3593–607.
130. Karlsson FH, Ussery DW, Nielsen J, Nookaew I. A Closer Look at Bac-teroides: Phylogenetic Relationship and Genomic Implications of a Life in the Human Gut. Microb Ecol 2011;61(3):473–85.
131. Shah HN, Collins MD. Proposal to restrict the genus Bacteroides (Castellani and Chalmers) to Bacteroides fragilis and closely related species. Int J Syst Bacteriol 1989;39(1):85–7.
132. Eggerth AH, Gagnon BH. The Bacteroides of Human Feces. J Bacteriol 1933; Apr;25(4):389–413.
133. Sonnenburg JL, Xu J, Leip DD, Chen CH, Westover BP, Weatherford J, et al. Glycan foraging in vivo by an intestine-adapted bacterial symbiont. Sci-ence 2005;307(5717):1955–9.
134. Wang Q, Garrity GM, Tiedje JM, Cole JR. Naïve Bayesian classifier for rapid assignment of rRNA sequences into the new bacterial taxonomy. Appl Environ Microbiol 2007;73(16):5261–7.
135. Sakamoto M, Benno Y. Reclassification of Bacteroides distasonis, Bac-teroides goldsteinii and Bacteroides merdae as Parabacteroides distasonis gen. nov., comb. nov., Parabacteroides goldsteinii comb. nov and Parabac-teroides merdae comb. nov. Int J Syst Evol Microbiol 2006;56(7):1599–605.
136. Morotomi M, Nagai F, Sakon H, Tanaka R. Paraprevotella clara gen. nov., sp. nov. and Paraprevotella xylaniphila sp. nov., members of the family 'Prevotellaceae' isolated from human faeces. Int J Syst Evol Microbiol 2009;59(Pt 8):1895–900.
137. Shah HN, Collins MD. Proposal for reclassification of Bacteroides asaccharo-lyticus, Bacteroides gingivalis, and Bacteroides endodontalis in a new genus, Porphyromonas. Int J Syst Bacteriol 1988;38(1):128–31.

119
138. Sakamoto M, Suzuki M, Umeda M, Ishikawa I, Benno Y. Reclassification of Bacteroides forsythus (Tanner et al. 1986) as Tannerella forsythensis corrig., gen. nov., comb. nov. Int J Syst Evol Microbiol 2002;52(Pt 3):841–9.
139. Rautio M, Eerola E, Väisanen-Tunkelrott ML, Molitoris D, Lawson P, Collins MD, et al. Reclassification of Bacteroides putredinis (Weinberg et al., 1937) in a new genus Alistipes gen. nov., as Alistipes putredinis comb. nov., and description of Alistipes finegoldii sp. nov., from human sources. Syst Appl Microbiol 2003;26(2):182–8.
140. Song Y, Kononen E, Rautio M, Liu C, Bryk A, Eerola E, et al. Alistipes onder-donkii sp. nov. and Alistipes shahii sp. nov., of human origin. Int J Syst Evol Microbiol 2006;56(Pt 8):1985–90.
141. Collins MD, Shah HN, Mitsuoka T. Reclassification of Bacteroides microfusus (Kaneuchi and Mitsuoka) in a new genus Rikenella, as Rikenella micro-fusus comb. nov. Syst Appl Microbiol 1985;6(1):79–81.
142. Mättö J, Malinen E, Suihko M-L, Alander M, Palva A, Saarela M. Genetic heterogeneity and functional properties of intestinal bifidobacteria. J Appl Microbiol 2004;97(3):459–70.
143. Bullen CL, Tearle PV, Willis AT. Bifidobacteria in the intestinal tract of infants: an in vivo study. J Med Microbiol 1976;9(3):325–33.
144. Mangin I, Bouhnik Y, Bisetti N, Decaris B. Molecular monitoring of human intestinal Bifidobacterium strain diversity. Res Microbiol 1999; 6;150(5):343–50.
145. Matsuki T, Watanabe K, Tanaka R, Fukuda M, Oyaizu H. Distribution of bifidobacterial species in human intestinal microflora examined with 16S rRNA-gene-targeted species-specific primers. Appl Environ Microbiol 1999;65(10):4506–12.
146. Scardovi V, Crociani F. Bifidobacterium catenulatum, Bifidobacterium denti-um, and Bifidobacterium angulatum: Three New Species and Their De-oxyribonucleic Acid Homology Relationships. Int J Syst Bacteriol 1974;24(1):6–20.
147. Wade WG, Downes J, Dymock D, Hiom SJ, Weightman AJ, Dewhirst FE, et al. The family Coriobacteriaceae: Reclassification of Eubacterium exiguum (Poco et al, 1996) and Peptostreptococcus heliotrinreducens (Lanigan 1976) as Slackia exigua gen. nov., comb. nov. and Slackia heliotrinire-ducens gen. nov., comb. nov., and Eubacterium lentum (Prevot 1938) as Eggerthella lenta gen. nov., comb. nov. Int J Syst Bacteriol 1999;49(2):595–600.
120
148. Kageyama A, Benno Y, Nakase T. Phylogenic and phenotypic evidence for the transfer of Eubacterium fossor to the genus Atopobium as Atopobium fossor comb. nov. Microbiol Immunol 1999;43(5):389–95.
149. Kageyama A, Benno Y, Nakase T. Phylogenetic evidence for the transfer of Eubacterium lentum to the genus Eggerthella as Eggerthella lenta gen. nov., comb. nov. Int J Syst Bacteriol 1999;49(4):1725–32.
150. Collins MD, Wallbanks S. Comparative sequence analyses of the 16S rRNA genes of Lactobacillus minutus, Lactobacillus rimae and Streptococcus parvulus: proposal for the creation of a new genus Atopobium. FEMS Mi-crobiol Lett 1992;74(2–3):235–40.
151. Haas F, Konig H. Coriobacterium glomerans gen. nov., sp. nov. from the intestinal tract of the red soldier bug. Int J Syst Bacteriol 1988;38(4):382–4.
152. Kageyama A, Benno Y, Nakase T. Phylogenetic and phenotypic evidence for the transfer of Eubacterium aerofaciens to the genus Collinsella as Col-linsella aerofaciens gen. nov., comb. nov. Int J Syst Bacteriol 1999;49(2):557–65.
153. Willis CL, Cummings JH, Neale G, Gibson GR. Nutritional aspects of dissimi-latory sulfate reduction in the human large intestine. Curr Microbiol 1997;35(5):294–8.
154. Loubinoux J, Valente FM, Pereira IA, Costa A, Grimont PA, Le Faou AE. Reclassification of the only species of the genus Desulfomonas, Desul-fomonas pigra, as Desulfovibrio piger comb. nov. Int J Syst Evol Microbi-ol 2002;52(Pt 4):1305–8.
155. Tsai HH, Sunderland D, Gibson GR, Hart CA, Rhodes JM. A novel mucin sulphatase from human faeces: its identification, purification and charac-terization. Clin Sci (Lond) 1992;82(4):447–54.
156. Baron EJ, Summanen P, Downes J, Roberts MC, Wexler H, Finegold SM. Bilophila wadsworthia, gen. nov. and sp. nov., a unique gram-negative anaerobic rod recovered from appendicitis specimens and human fae-ces. J Gen Microbiol 1989;135(12):3405–11.
157. Grimont PDA, Grimont F. Genus XII. Enterobacter. In: Brenner DJ, Krieg NR, Staley JT, editors. Bergey's Manual of Systematic Bacteriology. 2nd ed. New York, NY, USA: Springer; 2005. p. 661–9.
158. Scheutz F, Strockbine NA. Genus I. Escherichia. In: Brenner DJ, Krieg NR, Staley JT, editors. Bergey's Manual of Systematic Bacteriology. 2nd ed. New York, NY, USA: Springer; 2005. p. 607–24.

121
159. Strockbine NA, Maurelli AT. Genus XXXV. Shigella. In: Brenner DJ, Krieg NR, Staley JT, editors. Bergey's Manual of Systematic Bacteriology. 2nd ed. New York, NY, USA: Springer; 2005. p. 811–23.
160. Bottone EJ, Bercovier H, Mollaret HH. Genus XLI. Yersinia. In: Brenner DJ, Krieg NR, Staley JT, editors. Bergey's Manual of Systematic Bacteriology. 2nd ed. New York, NY, USA: Springer; 2005. p. 838–48.
161. Brisse S, Grimont F, Grimont PAD. The Genus Klebsiella. In: Dworkin M, Falkow S, Rosenberg E, Schleifer K-H, Stackebrandt E, editors. The Prokaryotes New York, NY: Springer-Verlag; 2006. p. 159–96.
162. Ellermeier CD, Slauch JM. The Genus Salmonella. In: Dworkin M, Falkow S, Rosenberg E, Schleifer K-H, Stackebrandt E, editors. The Prokaryotes New York, NY: Springer-Verlag; 2006. p. 123–58.
163. Vandamme P, Dewhirst FE, Paster BJ, On SLW. Genus I. Campylobacter. Bergey's Manual of Systematic Bacteriology. 2nd ed. New York, NY, USA: Springer; 2005. p. 1147–60.
164. On SLW, Lee A, O'Rourke JL, Dewhirst FE, Paster BJ, Fox JG, et al. Genus I. Helicobacter. Bergey's Manual of Systematic Bacteriology. 2nd ed. New York, NY, USA: Springer; 2005. p. 1169–89.
165. Derrien M, Vaughan EE, Plugge CM, de Vos WM. Akkermansia municiphila gen. nov., sp. nov., a human intestinal mucin-degrading bacterium. Int J Syst Evol Microbiol 2004;54(5):1469–76.
166. Hofstad T. The Genus Fusobacterium. In: Dworkin M, Falkow S, Rosenberg E, Schleifer K-H, Stackebrandt E, editors. The Prokaryotes New York, NY: Springer-Verlag; 2006. p. 1016–27.
167. Hamilton RD, Zahler SA. A study of Leptotrichia buccalis. J Bacteriol 1957;73(3):386–93.
168. Thauer RK, Kaster A, Seedorf H, Buckel W, Hedderich R. Methanogenic archaea: Ecologically relevant differences in energy conservation. Nature Rev Microbiol 2008;6(8):579–91.
169. Samuel BS, Hansen EE, Manchester JK, Coutinho PM, Henrissat B, Fulton R, et al. Genomic and metabolic adaptations of Methanobrevibacter smithii to the human gut. Proc Natl Acad Sci U S A 2007;104(25):10643–8.
170. Deppenmeier U. The unique biochemistry of methanogenesis. Prog Nucleic Acid Res Mol Biol 2002;71:223–83.
122
171. Miller TL, Wolin MJ, Conway de Macario E, Macario AJ. Isolation of Meth-anobrevibacter smithii from human feces. Appl Environ Microbiol 1982;43(1):227–32.
172. Fricke WF, Seedorf H, Henne A, Kruer M, Liesegang H, Hedderich R, et al. The genome sequence of Methanosphaera stadtmanae reveals why this human intestinal archaeon is restricted to methanol and H2 for methane formation and ATP synthesis. J Bacteriol 2006; 188(2):642–58.
173. Gibson GR, Cummings JH, Macfarlane GT. Competition for hydrogen be-tween sulphate-reducing bacteria and methanogenic bacteria from the human large intestine. J Appl Bacteriol 1988;65(3):241–7.
174. Duncan SH, Louis P, Thomson JM, Flint HJ. The role of pH in determining the species composition of the human colonic microbiota. Environ Micro-biol 2009;11(8):2112–22.
175. Walker AW, Duncan SH, Carol McWilliam Leitch E, Child MW, Flint HJ. pH and peptide supply can radically alter bacterial populations and short-chain fatty acid ratios within microbial communities from the human colon. Appl Environ Microbiol 2005;71(7):3692–700.
176. Belenguer A, Duncan SH, Calder AG, Holtrop G, Louis P, Lobley GE, et al. Two routes of metabolic cross-feeding between Bifidobacterium adoles-centis and butyrate-producing anaerobes from the human gut. Appl Environ Microbiol 2006;72(5):3593–9.
177. Falony G, Vlachou A, Verbrugghe K, De Vuyst L. Cross-feeding between Bifidobacterium longum BB536 and acetate-converting, butyrate-producing colon bacteria during growth on oligofructose. Appl Environ Microbiol 2006;72(12):7835–41.
178. Hehemann JH, Correc G, Barbeyron T, Helbert W, Czjzek M, Michel G. Transfer of carbohydrate-active enzymes from marine bacteria to Japa-nese gut microbiota. Nature 2010; 464(7290):908–12.
179. Kepner Jr. RL, Pratt JR. Use of fluorochromes for direct enumeration of total bacteria in environmental samples: Past and present. Microbiol Rev 1994;58(4):603–15.
180. Lawrence JR, Wolfaardt GM, Neu TR. The study of biofilms using confocal laser scanning microscope. In: Wilkinson MHF, Schut F, editors. Digital Image Analysis of Microbes Chichister, U.K.: John Wiley & Sons Ltd; 1998. p. 431–65.
181. Muller K, Ruska E. Simplified electromagnetic transmission-type microscope for electrons form 40–60 kV. Z Wiss Mikrosk 1955; Jan;62(3):205–19.

123
182. Stewart AD, Boyde A. Ion etching of dental tissues in a scanning electron microscope. Nature 1962;196:81–2.
183. Binnig G, Quate CF, Gerber C. Atomic force microscope. Phys Rev Lett 1986;56(9):930–3.
184. Hughes JB, Hellmann JJ, Ricketts TH, Bohannan BJ. Counting the uncounta-ble: statistical approaches to estimating microbial diversity. Appl Environ Microbiol 2001;67(10):4399–406.
185. Palleroni NJ. Prokaryotic diversity and the importance of culturing. Antonie Van Leeuwenhoek 1997;72(1):3–19.
186. Saarela M, Maukonen J, von Wright A, Vilpponen-Salmela T, Patterson AJ, Scott KP, et al. Tetracycline susceptibility of the ingested Lactobacillus acidophilus LaCH-5 and Bifidobacterium animalis subsp. lactis Bb-12 strains during antibiotic/probiotic intervention. Int J Antimicrob Agents 2007;29(3):271–80.
187. Olsen GJ, Lane DJ, Giovannoni SJ, Pace NR, Stahl DA. Microbial ecology and evolution: a ribosomal RNA approach. Annu Rev Microbiol 1986;40:337–65.
188. Ludwig W. Nucleic acid techniques in bacterial systematics and identification. Int J Food Microbiol 2007;120(3):225–36.
189. Tringe SG, Hugenholtz P. A renaissance for the pioneering 16S rRNA gene. Curr Opin Microbiol 2008;11(5):442–6.
190. Sheridan GE, Masters CI, Shallcross JA, MacKey BM. Detection of mRNA by reverse transcription-PCR as an indicator of viability in Escherichia coli cells. Appl Environ Microbiol 1998;64(4):1313–8.
191. Amann RI, Ludwig W, Schleifer K-H. Phylogenetic identification and in situ detection of individual microbial cells without cultivation. Microbiol Rev 1995;59(1):143–69.
192. Barer MR, Harwood CR. Bacterial viability and culturability. Adv Microb Phys-iol 1999;41:93–137.
193. Wagner M, Roger AJ, Flax JL, Brusseau GA, Stahl DA. Phylogeny of dissimi-latory sulfite reductases supports an early origin of sulfate respiration. J Bacteriol 1998;180(11):2975–82.
194. Friedrich MW. Methyl-coenzyme M reductase genes: unique functional markers for methanogenic and anaerobic methane-oxidizing Archaea. Methods Enzymol 2005;397:428–42.
124
195. Louis P, Young P, Holtrop G, Flint HJ. Diversity of human colonic butyrate-producing bacteria revealed by analysis of the butyryl-CoA:acetate CoA-transferase gene. Environ Microbiol 2010;12(2):304–14.
196. Louis P, Flint HJ. Diversity, metabolism and microbial ecology of butyrate-producing bacteria from the human large intestine. FEMS Microbiol Lett 2009;294(1):1–8.
197. Southern EM. Detection of specific sequences among DNA fragments sepa-rated by gel electrophoresis. J Mol Biol 1975;98(3):503–17.
198. Alwine JC, Kemp DJ, Stark GR. Method for detection of specific RNAs in agarose gels by transfer to diazobenzyloxymethyl-paper and hybridiza-tion with DNA probes. Proc Natl Acad Sci U S A 1977;74(12):5350–4.
199. Stahl DA, Flesher B, Mansfield HR, Montgomery L. Use of phylogenetically based hybridization probes for studies of ruminal microbial ecology. Appl Environ Microbiol 1988;54(5):1079–84.
200. Klappenbach JA, Dunbar JM, Schmidt TM. rRNA operon copy number reflects ecological strategies of bacteria. Appl Environ Microbiol 2000;66(4):1328–33.
201. Vaughan EE, Schut F, Heilig HG, Zoetendal EG, de Vos WM, Akkermans AD. A molecular view of the intestinal ecosystem. Curr Issues Intest Microbiol 2000;1(1):1–12.
202. Simmering R, Kleessen B, Blaut M. Quantification of the flavonoid-degrading bacterium Eubacterium ramulus in human fecal samples with a species-specific oligonucleotide hybridization probe. Appl Environ Microbiol 1999;65(8):3705–9.
203. Hopkins MJ, Macfarlane GT, Furrie E, Fite A, Macfarlane S. Characterisation of intestinal bacteria in infant stools using real-time PCR and northern hybridisation analyses. FEMS Microbiol Ecol 2005;54(1):77–85.
204. Hopkins MJ, Sharp R, Macfarlane GT. Age and disease related changes in intestinal bacterial populations assessed by cell culture, 16S rRNA abun-dance, and community cellular fatty acid profiles. Gut 2001;48(2):198–205.
205. Fodor SP, Rava RP, Huang XC, Pease AC, Holmes CP, Adams CL. Multiplexed biochemical assays with biological chips. Nature 1993;364(6437):555–6.
206. Schena M, Shalon D, Davis RW, Brown PO. Quantitative monitoring of gene expression patterns with a complementary DNA microarray. Science 1995;270(5235):467–70.

125
207. Lockhart DJ, Dong H, Byrne MC, Follettie MT, Gallo MV, Chee MS, et al. Expression monitoring by hybridization to high-density oligonucleotide ar-rays. Nat Biotechnol 1996;14(13):1675–80.
208. Wang RF, Beggs ML, Robertson LH, Cerniglia CE. Design and evaluation of oligonucleotide-microarray method for the detection of human intestinal bacteria in fecal samples. FEMS Microbiol Lett 2002;213(2):175–82.
209. Wang RF, Beggs ML, Erickson BD, Cerniglia CE. DNA microarray analysis of predominant human intestinal bacteria in fecal samples. Mol Cell Probes 2004;18(4):223–34.
210. Paliy O, Kenche H, Abernathy F, Michail S. High-Throughput Quantitative Analysis of the Human Intestinal Microbiota with a Phylogenetic Microarray. Appl Environ Microbiol 2009; 75(11):3572–9.
211. Rajilic-Stojanovic M, Heilig HG, Molenaar D, Kajander K, Surakka A, Smidt H, et al. Development and application of the human intestinal tract chip, a phylogenetic microarray: analysis of universally conserved phylotypes in the abundant microbiota of young and elderly adults. Environ Microbiol 2009;11(7):1736–51.
212. Rigsbee L, Agans R, Foy BD, Paliy O. Optimizing the analysis of human intestinal microbiota with phylogenetic microarray. FEMS Microbiol Ecol 2011;75(2):332–42.
213. Klaassens ES, Ben-Amor K, Vriesema A, Vaughan EE, de Vos W. The fecal bifidobacterial transcriptome of adults: a microarray approach. Gut Mi-crobes 2011;2(4):217–26.
214. Harrington CR, Lucchini S, Ridgway KP, Wegmann U, Eaton TJ, Hinton JC, et al. A short-oligonucleotide microarray that allows improved detection of gastrointestinal tract microbial communities. BMC Microbiol 2008;8:195.
215. Huyghe A, Francois P, Charbonnier Y, Tangomo-Bento M, Bonetti EJ, Paster BJ, et al. Novel microarray design strategy to study complex bacterial com-munities. Appl Environ Microbiol 2008;74(6):1876–85.
216. Colombo AP, Boches SK, Cotton SL, Goodson JM, Kent R, Haffajee AD, et al. Comparisons of subgingival microbial profiles of refractory periodontitis, severe periodontitis, and periodontal health using the human oral mi-crobe identification microarray. J Periodontol 2009; 80(9):1421–32.
217. van den Bogert B, de Vos WM, Zoetendal EG, Kleerebezem M. Microarray analysis and barcoded pyrosequencing provide consistent microbial pro-files depending on the source of human intestinal samples. Appl Environ Microbiol 2011;77(6):2071–80.
126
218. Vianna ME, Horz H-P, Gomes BPFA, Conrads G. Microarrays complement culture methods for identification of bacteria in endodontic infections. Oral Microbiol Immunol 2005;20(4):253–8.
219. Klaassens ES, Boesten RJ, Haarman M, Knol J, Schuren FH, Vaughan EE, et al. Mixed-Species Genomic Microarray Analysis of Fecal Samples Re-veals Differential Transcriptional Responses of Bifidobacteria in Breast- and Formula-Fed Infants. Appl Environ Microbiol 2009;75(9):2668–76.
220. DeLong EF, Wickham GS, Pace NR. Phylogenetic stains: ribosomal RNA-based probes for the identification of single cells. Science 1989;243(4896):1360–3.
221. Amann RI, Krumholz L, Stahl DA. Fluorescent-oligonucleotide probing of whole cells for determinative, phylogenetic, and environmental studies in microbiology. J Bacteriol 1990;172(2):762–70.
222. Walker AW, Duncan SH, Harmsen HJM, Holtrop G, Welling GW, Flint HJ. The species composition of the human intestinal microbiota differs be-tween particle-associated and liquid phase communities. Environ Micro-biol 2008;10(12):3275–83.
223. Aminov RI, Walker AW, Duncan SH, Harmsen HJ, Welling GW, Flint HJ. Molecular diversity, cultivation, and improved detection by fluorescent in situ hybridization of a dominant group of human gut bacteria related to Roseburia spp. or Eubacterium rectale. Appl Environ Microbiol 2006;72(9):6371–6.
224. Lay C, Doré J, Rigottier-Gois L. Separation of bacteria of the Clostridium leptum subgroup from the human colonic microbiota by fluorescence-activated cell sorting or group-specific PCR using 16S rRNA gene oligo-nucleotides. FEMS Microbiol Ecol 2007;60(3):513–20.
225. Fallani M, Young D, Scott J, Norin E, Amarri S, Adam R, et al. Intestinal mi-crobiota of 6-week-old infants across Europe: Geographic influence be-yond delivery mode, breast-feeding, and antibiotics. J Pediatr Gastroen-terol Nutr 2010;51(1):77–84.
226. Fallani M, Amarri S, Uusijärvi A, Adam R, Khanna S, Aguilera M, et al. De-terminants of the human infant intestinal microbiota after the introduction of first complementary foods in infant samples from five European cen-tres. Microbiol 2011;157(5):1385–92.
227. Welling GW, Elfferich P, Raangs GC, Wildeboer-Veloo AC, Jansen GJ, Degener JE. 16S ribosomal RNA-targeted oligonucleotide probes for monitoring of in-testinal tract bacteria. Scand J Gastroenterol Suppl 1997;222:17–9.
127
228. Satokari RM, Kataja K, Söderlund H. Multiplexed quantification of bacterial 16S rRNA by solution hybridization with oligonucleotide probes and af-finity capture. Microb Ecol 2005;50(1):120–7.
229. Wheeler AE, Stahl DA. Extraction of microbial DNA from aquatic sediments. In: Akkermans ADL, van Elsas JD, de Bruijn FJ, editors. Dordrecht, The Netherlands: Kluwer Academic Publishers; 1996. p. 1–29.
230. von Wintzingerode F, Gobel UB, Stackebrandt E. Determination of microbial diversity in environmental samples: pitfalls of PCR-based rRNA analysis. FEMS Microbiol Rev 1997; 21(3):213–29.
231. Wallace DM. Large- and small-scale phenol extractions. Methods Enzymol 1987;152:33–41.
232. Roose-Amsaleg CL, Garnier-Sillam E, Harry M. Extraction and purification of microbial DNA from soil and sediment samples. Applied Soil Ecology 2001;18(1):47–60.
233. Zoetendal EG, Ben-Amor K, Akkermans ADL, Abee T, De Vos WM. DNA isolation protocols affect the detection limit of PCR approaches of bacte-ria in samples from the human gastrointestinal tract. Syst Appl Microbiol 2001;24(3):405–10.
234. Zoetendal EG, Heilig HGHJ, Klaassens ES, Booijink CCGM, Kleerebezem M, Smidt H, et al. Isolation of DNA from bacterial samples of the human gastrointestinal tract. Nature Protocols 2006;1(2):870–3.
235. McOrist AL, Jackson M, Bird AR. A comparison of five methods for extraction of bacterial DNA from human faecal samples. J Microbiol Methods 2002;50(2):131–9.
236. Salonen A, Nikkilä J, Jalanka-Tuovinen J, Immonen O, Rajilić-Stojanović M, Kekkonen RA, et al. Comparative analysis of fecal DNA extraction methods with phylogenetic microarray: Effective recovery of bacterial and archaeal DNA using mechanical cell lysis. J Microbiol Methods 2010;81(2):127–34.
237. Maukonen J, Simões C, Saarela M. The currently used commercial DNA extraction methods give different results of clostridial and Actinobacterial populations derived from human fecal samples. FEMS Microbiol Ecol 2012;79:697–708.
238. Nechvatal JM, Ram JL, Basson MD, Namprachan P, Niec SR, Badsha KZ, et al. Fecal collection, ambient preservation, and DNA extraction for PCR amplification of bacterial and human markers from human feces. J Mi-crobiol Methods 2008;72(2):124–32.

128
239. Tannock GW, Munro K, Bibiloni R, Simon MA, Hargreaves P, Gopal P, et al. Impact of consumption of oligosaccharide-containing biscuits on the fecal microbiota of humans. Appl Environ Microbiol 2004;70(4):2129–36.
240. Nylund L, Heilig HG, Salminen S, de Vos WM, Satokari R. Semi-automated extraction of microbial DNA from feces for qPCR and phylogenetic mi-croarray analysis. J Microbiol Methods 2010;83(2):231–5.
241. Zoetendal EG, Booijink CCGM, Klaassens ES, Heilig HGHJ, Kleerebezem M, Smidt H, et al. Isolation of RNA from bacterial samples of the human gastrointestinal tract. Nat Protoc 2006;1(2):954–9.
242. Maukonen J, Mättö J, Satokari R, Söderlund H, Mattila-Sandholm T, Saarela M. PCR DGGE and RT-PCR DGGE show diversity and short-term temporal stability in the Clostridium coccoides-Eubacterium rectale group in the hu-man intestinal microbiota. FEMS Microbiol Ecol 2006;58(3):517–28.
243. Fitzsimons NA, Akkermans AD, de Vos WM, Vaughan EE. Bacterial gene expression detected in human faeces by reverse transcription-PCR. J Microbiol Methods 2003;55(1):133–40.
244. Li M, Gong J, Cottrill M, Yu H, De Lange C, Burton J, et al. Evaluation of QIAamp® DNA Stool Mini Kit for ecological studies of gut microbiota. J Microbiol Methods 2003;54(1):13–20.
245. Li F, Hullar MA, Lampe JW. Optimization of terminal restriction fragment polymorphism (TRFLP) analysis of human gut microbiota. J Microbiol Methods 2007;68(2):303–11.
246. Ariefdjohan MW, Savaiano DA, Nakatsu CH. Comparison of DNA extraction kits for PCR-DGGE analysis of human intestinal microbial communities from fecal specimens. Nutr J 2010;9(1):23.
247. Mullis KB. Target amplification for DNA analysis by the polymerase chain reaction. Ann Biol Clin (Paris) 1990;48(8):579–82.
248. Reischl U, Kochanowski B. Quantitative PCR. A survey of the present tech-nology. Mol Biotechnol 1995;3(1):55–71.
249. Hoffman AD, Wiedmann M. Comparative evaluation of culture- and BAX polymerase chain reaction-based detection methods for Listeria spp. and Listeria monocytogenes in environmental and raw fish samples. J Food Prot 2001;64(10):1521–6.
250. Matsuki T, Watanabe K, Fujimoto J, Miyamoto Y, Takada T, Matsumoto K, et al. Development of 16S rRNA-gene-targeted group-specific primers for the
129
detection and identification of predominant bacteria in human feces. Appl Environ Microbiol 2002;68(11):5445–51.
251. Matsuki T, Watanabe K, Fujimoto J, Takada T, Tanaka R. Use of 16S rRNA gene-targeted group-specific primers for real-time PCR analysis of predomi-nant bacteria in human feces. Appl Environ Microbiol 2004;70(12):7220–8.
252. Rinttilä T, Kassinen A, Malinen E, Krogius L, Palva A. Development of an extensive set of 16S rDNA-targeted primers for quantification of patho-genic and indigenous bacteria in faecal samples by real-time PCR. J Appl Microbiol 2004;97(6):1166–77.
253. Blaut M, Klaus S. Intestinal microbiota and obesity. Handb Exp Pharmacol 2012;(209):251–73.
254. Mangin I, Suau A, Magne F, Garrido D, Gotteland M, Neut C, et al. Charac-terization of human intestinal bifidobacteria using competitive PCR and PCR-TTGE. FEMS Microbiol Ecol 2006; 55(1):28–37.
255. Mariat D, Firmesse O, Levenez F, Guimarǎes VD, Sokol H, Doré J, et al. The Firmicutes/Bacteroidetes ratio of the human microbiota changes with age. BMC Microbiology 2009;9.
256. Satokari RM, Vaughan EE, Akkermans ADL, Saarela M, De Vos WM. Bifidobacterial diversity in human feces detected by genus-specific PCR and denaturing gradient gel electrophoresis. Appl Environ Microbiol 2001;67(2):504–13.
257. Zoetendal EG, Von Wright A, Vilpponen-Salmela T, Ben-Amor K, Akkermans ADL, De Vos WM. Mucosa-associated bacteria in the human gastrointestinal tract are uniformly distributed along the colon and differ from the community recovered from feces. Appl Environ Microbiol 2002;68(7):3401–7.
258. Zijnge V, Harmsen HJ, Kleinfelder JW, van der Rest ME, Degener JE, Well-ing GW. Denaturing gradient gel electrophoresis analysis to study bacte-rial community structure in pockets of periodontitis patients. Oral Micro-biol Immunol 2003;18(1):59–65.
259. Ledder RG, Gilbert P, Huws SA, Aarons L, Ashley MP, Hull PS, et al. Mo-lecular analysis of the subgingival microbiota in health and disease. Appl Environ Microbiol 2007;73(2):516–23.
260. Maukonen J, Mättö J, Suihko M-L, Saarela M. Intra-individual diversity and simi-larity of salivary and faecal microbiota. J Med Microbiol 2008;57(12):1560–8.
261. Dicksved J, Floistrup H, Bergstrom A, Rosenquist M, Pershagen G, Scheynius A, et al. Molecular fingerprinting of the fecal microbiota of

130
children raised according to different lifestyles. Appl Environ Microbiol 2007;73(7):2284–9.
262. Magne F, Abély M, Boyer F, Morville P, Pochart P, Suau A. Low species diversity and high interindividual variability in faeces of preterm infants as revealed by sequences of 16S rRNA genes and PCR-temporal tempera-ture gradient gel electrophoresis profiles. FEMS Microbiol Ecol 2006;57(1):128–38.
263. Ott SJ, Musfeldt M, Wenderoth DF, Hampe J, Brant O, Folsch UR, et al. Reduction in diversity of the colonic mucosa associated bacterial micro-flora in patients with active inflammatory bowel disease. Gut 2004;53(5):685–93.
264. Hayashi H, Sakamoto M, Benno Y. Fecal microbial diversity in a strict vege-tarian as determined by molecular analysis and cultivation. Microbiol Im-munol 2002;46(12):819–31.
265. Myers RM, Fischer SG, Maniatis T, Lerman LS. Modification of the melting properties of duplex DNA by attachment of a GC-rich DNA sequence as determined by denaturing gradient gel electrophoresis. Nucleic Acids Res 1985;13(9):3111–29.
266. Muyzer G, De Waal EC, Uitterlinden AG. Profiling of complex microbial popu-lations by denaturing gradient gel electrophoresis analysis of polymerase chain reaction-amplified genes coding for 16S rRNA. Appl Environ Mi-crobiol 1993;59(3):695–700.
267. Nübel U, Engelen B, Felske A, Snaidr J, Wieshuber A, Amann RI, et al. Se-quence heterogeneities of genes encoding 16S rRNAs in Paenibacillus polymyxa detected by temperature gradient gel electrophoresis. J Bacte-riol 1996;178(19):5636–43.
268. Felske A, Rheims H, Wolterink A, Stackebrandt E, Akkermans AD. Ribosome analysis reveals prominent activity of an uncultured member of the class Actinobacteria in grassland soils. Microbiology 1997;143(Pt 9):2983–9.
269. Muyzer G, Smalla K. Application of denaturing gradient gel electrophoresis (DGGE) and temperature gradient gel electrophoresis (TGGE) in micro-bial ecology. Antonie Van Leeuwenhoek 1998;73(1):127–41.
270. Favier CF, De Vos WM, Akkermans ADL. Development of bacterial and bifidobacterial communities in feces of newborn babies. Anaerobe 2003;9(5):219–29.
131
271. Goldenberg O, Herrmann S, Marjoram G, Noyer-Weidner M, Hong G, Bereswill S, et al. Molecular monitoring of the intestinal flora by denaturing high perfor-mance liquid chromatography. J Microbiol Methods 2007;68(1):94–105.
272. Barlaan EA, Sugimori M, Furukawa S, Takeuchi K. Profiling and monitoring of microbial populations by denaturing high-performance liquid chromatog-raphy. J Microbiol Methods 2005; 61(3):399–412.
273. Caillaux G, Cochetière MFDL, Carton T, Vacon FL, Rozé JC, Potel G, et al. Application of denaturing high-performance liquid chromatography for intesti-nal microbiota analysis of newborns. J Perinat Med 2010;38(3):339–41.
274. Rougé C, Goldenberg O, Ferraris L, Berger B, Rochat F, Legrand A, et al. Investigation of the intestinal microbiota in preterm infants using different methods. Anaerobe 2010; 8;16(4):362–70.
275. Wagner AO, Malin C, Illmer P. Application of denaturing high-performance liquid chromatography in microbial ecology: fermentor sludge, compost, and soil community profiling. Appl Environ Microbiol 2009;75(4):956–64.
276. Hold GL, Pryde SE, Russell VJ, Furrie E, Flint HJ. Assessment of microbial diversity in human colonic samples by 16S rDNA sequence analysis. FEMS Microbiol Ecol 2002;39(1):33–9.
277. Hayashi H, Sakamoto M, Benno Y. Phylogenetic analysis of the human gut microbiota using 16S rDNA clone libraries and strictly anaerobic culture-based methods. Microbiol Immunol 2002;46(8):535–48.
278. Claesson MJ, Cusack S, O'Sullivan O, Greene-Diniz R, de Weerd H, Flan-nery E, et al. Composition, variability, and temporal stability of the intesti-nal microbiota of the elderly. Proc Natl Acad Sci U S A 2011;108 Suppl 1:4586–91.
279. Armougom F, Raoult D. Use of pyrosequencing and DNA barcodes to monitor variations in Firmicutes and Bacteroidetes communities in the gut micro-biota of obese humans. BMC Genomics 2008;9.
280. Roesch LF, Casella G, Simell O, Krischer J, Wasserfall CH, Schatz D, et al. Influence of fecal sample storage on bacterial community diversity. Open Microbiol J 2009;3:40–6.
281. Claesson MJ, O'Sullivan O, Wang Q, Nikkilä J, Marchesi JR, Smidt H, et al. Comparative analysis of pyrosequencing and a phylogenetic microarray for exploring microbial community structures in the human distal intes-tine. PLoS One 2009;4(8):e6669.
132
282. Wu GD, Lewis JD, Hoffmann C, Chen Y-Y, Knight R, Bittinger K, et al. Sam-pling and pyrosequencing methods for characterizing bacterial communi-ties in the human gut using 16S sequence tags. BMC Microbiology 2010;10.
283. Willing BP, Dicksved J, Halfvarson J, Andersson AF, Lucio M, Zheng Z, et al. A pyrosequencing study in twins shows that gastrointestinal microbial profiles vary with inflammatory bowel disease phenotypes. Gastroenterol 2010;139(6):1844,1854.e1.
284. Turnbaugh PJ, Quince C, Faith JJ, McHardy AC, Yatsunenko T, Niazi F, et al. Organismal, genetic, and transcriptional variation in the deeply se-quenced gut microbiomes of identical twins. Proc Natl Acad Sci U S A 2010;107(16):7503–8.
285. Larsen N, Vogensen FK, van den Berg FW, Nielsen DS, Andreasen AS, Pedersen BK, et al. Gut microbiota in human adults with type 2 diabetes differs from non-diabetic adults. PLoS One 2010;5(2):e9085.
286. Finegold SM, Dowd SE, Gontcharova V, Liu C, Henley KE, Wolcott RD, et al. Pyrosequencing study of fecal microflora of autistic and control children. Anaerobe 2010; 8;16(4):444–53.
287. O'Sullivan O, Coakley M, Lakshminarayanan B, Claesson MJ, Stanton C, O'Toole PW, et al. Correlation of rRNA gene amplicon pyrosequencing and bacterial culture for microbial compositional analysis of faecal sam-ples from elderly Irish subjects. J Appl Microbiol 2011; 111(2):467–73.
288. Davis LM, Martinez I, Walter J, Goin C, Hutkins RW. Barcoded pyrosequencing reveals that consumption of galactooligosaccharides results in a highly specific bifidogenic response in humans. PLoS One 2011;6(9):e25200.
289. Abrahamsson TR, Jakobsson HE, Andersson AF, Björkstén B, Engstrand L, Jenmalm MC. Low diversity of the gut microbiota in infants with atopic eczema. J Allergy Clin Immunol 2012;129(2):434,440.e2.
290. Shendure J, Ji H. Next-generation DNA sequencing. Nat Biotechnol 2008;26(10):1135–45.
291. Metzker ML. Sequencing technologies – the next generation. Nat Rev Genet 2010; 11(1):31–46.
292. Kuczynski J, Lauber CL, Walters WA, Parfrey LW, Clemente JC, Gevers D, et al. Experimental and analytical tools for studying the human microbi-ome. Nat Rev Genet 2011;13(1):47–58.
133
293. Power EG. RAPD typing in microbiology – a technical review. J Hosp Infect 1996; 34(4):247–65.
294. Meunier JR, Grimont PA. Factors affecting reproducibility of random amplified polymorphic DNA fingerprinting. Res Microbiol 1993;144(5):373–9.
295. Cusick SM, O'Sullivan DJ. Use of a single, triplicate arbitrarily primed-PCR procedure for molecular fingerprinting of lactic acid bacteria. Appl Envi-ron Microbiol 2000;66(5):2227–31.
296. Ely B, Gerardot CJ. Use of pulsed-field-gradient gel electrophoresis to con-struct a physical map of the Caulobacter crescentus genome. Gene 1988;68(2):323–33.
297. Kunin V, Copeland A, Lapidus A, Mavromatis K, Hugenholtz P. A bioinformati-cian's guide to metagenomics. Microbiol Mol Biol Rev 2008;72(4):557–78.
298. Kurokawa K, Itoh T, Kuwahara T, Oshima K, Toh H, Toyoda A, et al. Com-parative metagenomics revealed commonly enriched gene sets in human gut microbiomes. DNA Res 2007;14(4):169–81.
299. Peterson DA, Frank DN, Pace NR, Gordon JI. Metagenomic approaches for defining the pathogenesis of inflammatory bowel diseases. Cell Host Mi-crobe 2008;3(6):417–27.
300. Jones BV, Sun F, Marchesi JR. Comparative metagenomic analysis of plas-mid encoded functions in the human gut microbiome. BMC Genomics 2010;11(1).
301. Williams BL, Hornig M, Buie T, Bauman ML, Cho Paik M, Wick I, et al. Im-paired carbohydrate digestion and transport and mucosal dysbiosis in the intestines of children with autism and gastrointestinal disturbances. PLoS One 2011;6(9):e24585.
302. Koenig JE, Spor A, Scalfone N, Fricker AD, Stombaugh J, Knight R, et al. Succession of microbial consortia in the developing infant gut microbi-ome. Proc Natl Acad Sci U S A 2011;108 Suppl 1:4578–85.
303. Brown CT, Davis-Richardson AG, Giongo A, Gano KA, Crabb DB, Mukherjee N, et al. Gut microbiome metagenomics analysis suggests a functional model for the development of autoimmunity for type 1 diabetes. PLoS One 2011;6(10):e25792.
304. Human Microbiome Project Consortium. Structure, function and diversity of the healthy human microbiome. Nature 2012;486(7402):207–14.
134
305. Arboleya S, Ang L, Margolles A, Yiyuan L, Dongya Z, Liang X, et al. Deep 16S rRNA metagenomics and quantitative PCR analyses of the prema-ture infant fecal microbiota. Anaerobe 2012;18(3):378–80
306. Ott SJ, Musfeldt M, Timmis KN, Hampe J, Wenderoth DF, Schreiber S. In vitro alterations of intestinal bacterial microbiota in fecal samples during storage. Diagn Microbiol Infect Dis 2004;50(4):237–45.
307. Molbak L, Sommer HM, Johnsen K, Boye M, Johansen M, Møller K, et al. Freezing at -80°C distorts the DNA composition of bacterial communities in intestinal samples. Curr Issues Intestinal Microbiol 2006;7(1):29–34.
308. Dridi B, Henry M, El Khéchine A, Raoult D, Drancourt M. High prevalence of Methanobrevibacter smithii and Methanosphaera stadtmanae detected in the human gut using an improved DNA detection protocol. PLoS ONE 2009;4(9):e7063.
309. Krogius-Kurikka L, Kassinen A, Paulin L, Corander J, Mäkivuokko H, Tuimala J, et al. Sequence analysis of percent G+C fraction libraries of human faecal bacterial DNA reveals a high number of Actinobacteria. BMC Microbiol 2009;9:68.
310. Nakamura N, Gaskins HR, Collier CT, Nava GM, Rai D, Petschow B, et al. Molecular ecological analysis of fecal bacterial populations from term in-fants fed formula supplemented with selected blends of prebiotics. Appl Environ Microbiol 2009;75(4):1121–8.
311. Palmer C, Bik EM, DiGiulio DB, Relman DA, Brown PO. Development of the human infant intestinal microbiota. PLoS Biology 2007;5(7):1556–73.
312. Maukonen J. Unpublished data.
313. Hoyles L, McCartney AL. What do we mean when we refer to Bacteroidetes populations in the human gastrointestinal microbiota?. FEMS Microbiol Lett 2009;299(2):175–83.
314. Corry JE, Jarvis B, Passmore S, Hedges A. A critical review of measurement uncertainty in the enumeration of food micro-organisms. Food Microbiol 2007;24(3):230–53.
315. Ramette A. Multivariate analyses in microbial ecology. FEMS Microbiol Ecol 2007;62(2):142–60.
316. Rudi K, Zimonja M, Trosvik P, Naes T. Use of multivariate statistics for 16S rRNA gene analysis of microbial communities. Int J Food Microbiol 2007;120(1–2):95–9.
135
317. Bent SJ, Forney LJ. The tragedy of the uncommon: understanding limitations in the analysis of microbial diversity. ISME J 2008;2(7):689–95.
318. Lozupone CA, Hamady M, Kelley ST, Knight R. Quantitative and qualitative beta diversity measures lead to different insights into factors that struc-ture microbial communities. Appl Environ Microbiol 2007;73(5):1576–85.
319. Werner JJ, Koren O, Hugenholtz P, DeSantis TZ, Walters WA, Caporaso JG, et al. Impact of training sets on classification of high-throughput bacterial 16s rRNA gene surveys. ISME J 2012;6(1):94–103.
320. Achtman M, Wagner M. Microbial diversity and the genetic nature of microbi-al species. Nat Rev Microbiol 2008;6(6):431–40.
321. Penders J, Thijs C, Vink C, Stelma FF, Snijders B, Kummeling I, et al. Factors influencing the composition of the intestinal microbiota in early infancy. Pediatrics 2006;118(2):511–21.
322. Alm JS, Swartz J, Björkstén B, Engstrand L, Engström J, Kühn I, et al. An anthroposophic lifestyle and intestinal microflora in infancy. Pediatr Aller-gy Immunol 2002;13(6):402–11.
323. Schwiertz A, Gruhl B, Löbnitz M, Michel P, Radke M, Blaut M. Development of the intestinal bacterial composition in hospitalized preterm infants in com-parison with breast-fed, full-term infants. Pediatr Res 2003;54(3):393–9.
324. Bezirtzoglou E, Tsiotsias A, Welling GW. Microbiota profile in feces of breast- and formula-fed newborns by using fluorescence in situ hybridization (FISH). Anaerobe 2011;17:478–82.
325. Favier CF, Vaughan EE, De Vos WM, Akkermans ADL. Molecular monitoring of succession of bacterial communities in human neonates. Appl Environ Microbiol 2002;68(1):219–26.
326. Rotimi VO, Duerden BI. The development of the bacterial flora in normal neonates. J Med Microbiol 1981;14(1):51–62.
327. Songjinda P, Nakayama J, Kuroki Y, Tanaka S, Fukuda S, Kiyohara C, et al. Molecular monitoring of the developmental bacterial community in the gastrointestinal tract of Japanese infants. Biosci Biotechnol Biochem 2005;69(3):638–41.
328. Wang M, Ahrne S, Antonsson M, Molin G. T-RFLP combined with principal component analysis and 16S rRNA gene sequencing: an effective strategy for comparison of fecal microbiota in infants of different ages. J Microbiol Methods 2004;59(1):53–69.

136
329. Dominguez-Bello MG, Costello EK, Contreras M, Magris M, Hidalgo G, Fierer N, et al. Delivery mode shapes the acquisition and structure of the initial mi-crobiota across multiple body habitats in newborns. Proc Natl Acad Sci U S A 2010;107(26):11971–5.
330. Huurre A, Kalliomäki M, Rautava S, Rinne M, Salminen S, Isolauri E. Mode of delivery – effects on gut microbiota and humoral immunity. Neonatology 2008;93(4):236–40.
331. Arboleya S, Binetti A, Salazar N, Fernández N, Solís G, Hernández-Barranco A, et al. Establishment and development of intestinal microbiota in preterm neonates. FEMS Microbiol Ecol 2012;79(3):763–72.
332. Hall MA, Cole CB, Smith SL, Fuller R, Rolles CJ. Factors influencing the presence of faecal lactobacilli in early infancy. Arch Dis Child 1990;65(2):185–8.
333. Harmsen HJM, Wildeboer-Veloo ACM, Raangs GC, Wagendorp AA, Klijn N, Bindels JG, et al. Analysis of intestinal flora development in breast-fed and formula-fed infants by using molecular identification and detection methods. J Pediatr Gastroenterol Nutr 2000;30(1):61–7.
334. Magne F, Hachelaf W, Suau A, Boudraa G, Mangin I, Touhami M, et al. A longitudinal study of infant faecal microbiota during weaning. FEMS Mi-crobiol Ecol 2006;58(3):563–71.
335. Yatsunenko T, Rey FE, Manary MJ, Trehan I, Dominguez-Bello MG, Contre-ras M, et al. Human gut microbiome viewed across age and geography. Nature 2012;486(7402):222–7.
336. Penders J, Vink C, Driessen C, London N, Thijs C, Stobberingh EE. Quantifi-cation of Bifidobacterium spp., Escherichia coli and Clostridium difficile in faecal samples of breast-fed and formula-fed infants by real-time PCR. FEMS Microbiol Lett 2005;243(1):141–7.
337. Stark PL, Lee A. The microbial ecology of the large bowel of breast-fed and formula-fed infants during the first year of life. J Med Microbiol 1982;15(2):189–203.
338. Collado MC, Isolauri E, Laitinen K, Salminen S. Effect of mother's weight on infant's microbiota acquisition, composition, and activity during early in-fancy: A prospective follow-up study initiated in early pregnancy. Am J Clin Nutr 2010;92(5):1023–30.
339. Partty A, Kalliomäki M, Endo A, Salminen S, Isolauri E. Compositional devel-opment of Bifidobacterium and Lactobacillus microbiota is linked with crying and fussing in early infancy. PLoS One 2012;7(3):e32495.

137
340. Hentges DJ. The anaerobic microflora of the human body. Clin Infect Dis 1993;16 Suppl 4:S175–80.
341. Gorbach SL, Nahas L, Lerner PI, Weinstein L. Studies of intestinal microflora. I. Effects of diet, age, and periodic sampling on numbers of fecal microor-ganisms in man. Gastroenterol 1967;53(6):845–55.
342. Woodmansey EJ, McMurdo ME, Macfarlane GT, Macfarlane S. Comparison of compositions and metabolic activities of fecal microbiotas in young adults and in antibiotic-treated and non-antibiotic-treated elderly subjects. Appl Environ Microbiol 2004;70(10):6113–22.
343. Blaut M, Collins MD, Welling GW, Doré J, van Loo J, de Vos W. Molecular biological methods for studying the gut microbiota: the EU human gut flora project. Br J Nutr 2002;87 Suppl 2:S203–11.
344. Maukonen J, Mättö J, Kajander K, Mattila-Sandholm T, Saarela M. Diversity and temporal stability of fecal bacterial populations in elderly subjects consuming galacto-oligosaccharide containing probiotic yoghurt. Int Dairy J 2008;18(4):386–95.
345. Claesson MJ, Jeffery IB, Conde S, Power SE, O'Connor EM, Cusack S, et al. Gut microbiota composition correlates with diet and health in the elderly. Nature 2012;488:178–84.
346. Benno Y, Endo K, Mizutani T, Namba Y, Komori T, Mitsuoka T. Comparison of fecal microflora of elderly persons in rural and urban areas of Japan. Appl Environ Microbiol 1989; 55(5):1100–5.
347. Mitsuoka T. Intestinal flora and aging. Nutr Rev 1992;50(12):438–46.
348. He T, Harmsen HJM, Raangs GC, Welling GW. Composition of Faecal Mi-crobiota of Elderly People. Microb Ecol Health Dis 2003;15(4):153–9.
349. Hopkins MJ, Sharp R, Macfarlane GT. Variation in human intestinal microbiota with age. Dig Liver Dis 2002;34(SUPPL. 2):S12–8.
350. van Tongeren SP, Slaets JP, Harmsen HJ, Welling GW. Fecal microbiota composition and frailty. Appl Environ Microbiol 2005;71(10):6438–42.
351. Hopkins MJ, Macfarlane GT. Changes in predominant bacterial populations in human faeces with age and with Clostridium difficile infection. J Med Microbiol 2002;51(5):448–54.
352. Saunier K, Dore J. Gastrointestinal tract and the elderly: functional foods, gut microflora and healthy ageing. Dig Liver Dis 2002;34 Suppl 2:S19–24.
138
353. Zwielehner J, Liszt K, Handschur M, Lassl C, Lapin A, Haslberger AG. Combined PCR-DGGE fingerprinting and quantitative-PCR indicates shifts in fecal pop-ulation sizes and diversity of Bacteroides, bifidobacteria and Clostridium clus-ter IV in institutionalized elderly. Exp Gerontol 2009;44(6–7):440–6.
354. Medina M, Izquierdo E, Ennahar S, Sanz Y. Differential immunomodulatory properties of Bifidobacterium logum strains: relevance to probiotic selec-tion and clinical applications. Clin Exp Immunol 2007 150(3):531–8.
355. Enck P, Zimmermann K, Rusch K, Schwiertz A, Klosterhalfen S, Frick JS. The effects of ageing on the colonic bacterial microflora in adults. Z Gas-troenterol 2009;47(7):653–8.
356. Mäkivuokko H, Tiihonen K, Tynkkynen S, Paulin L, Rautonen N. The effect of age and non-steroidal anti-inflammatory drugs on human intestinal mi-crobiota composition. Br J Nutr 2010;103(2):227–34.
357. Hayashi H, Sakamoto M, Kitahara M, Benno Y. Molecular analysis of fecal microbiota in elderly individuals using 16S rDNA library and T-RFLP. Mi-crobiol Immunol 2003;47(8):557–70.
358. Hippe B, Zwielehner J, Liszt K, Lassl C, Unger F, Haslberger AG. Quantifica-tion of butyryl CoA:acetate CoA-transferase genes reveals different bu-tyrate production capacity in individuals according to diet and age. FEMS Microbiol Lett 2011;316(2):130–5.
359. Biagi E, Nylund L, Candela M, Ostan R, Bucci L, Pini E, et al. Through age-ing, and beyond: gut microbiota and inflammatory status in seniors and centenarians. PLoS One 2010; 5(5):e10667.
360. Li M, Wang B, Zhang M, Rantalainen M, Wang S, Zhou H, et al. Symbiotic gut microbes modulate human metabolic phenotypes. Proc Natl Acad Sci U S A 2008;105(6):2117–22.
361. Bertazzoni Minelli E, Benini A, Beghini AM, Cerutti R, Nardo G. Bacterial faecal flora in healthy women of different ages. Microbial Ecol Health Dis 1993;6:43–51.
362. Roger LC, McCartney AL. Longitudinal investigation of the faecal microbiota of healthy full-term infants using fluorescence in situ hybridization and dena-turing gradient gel electrophoresis. Microbiol 2010;156(Pt 11):3317–28.
363. Stewart JA, Chadwick VS, Murray A. Investigations into the influence of host genetics on the predominant eubacteria in the faecal microflora of children. J Med Microbiol 2005;54(Pt 12):1239–42.
139
364. Simões CD, Maukonen J, Kaprio J, Rissanen A, Pietiläinen KH, Saarela M. Habitual dietary intake is associated with the fecal microbiota composition of Finnish monozygotic twins. J Nutr (revised version submitted).
365. Mathan VI, Wiederman J, Dobkin JF, Lindenbaum J. Geographic differences in digoxin inactivation, a metabolic activity of the human anaerobic gut flora. Gut 1989;30(7):971–7.
366. De Filippo C, Cavalieri D, Di Paola M, Ramazzotti M, Poullet JB, Massart S, et al. Impact of diet in shaping gut microbiota revealed by a comparative study in children from Europe and rural Africa. Proc Natl Acad Sci U S A 2010;107(33):14691–6.
367. Hentges DJ, Maier BR, Burton GC, Flynn MA, Tsutakawa RK. Effect of a high-beef diet on the fecal bacterial flora of humans. Cancer Res 1977;37(2):568–71.
368. Russell WR, Gratz SW, Duncan SH, Holtrop G, Ince J, Scobbie L, et al. High-protein, reduced-carbohydrate weight-loss diets promote metabolite pro-files likely to be detrimental to colonic health. Am J Clin Nutr 2011;93(5):1062–72.
369. Tuohy KM, Kolida S, Lustenberger AM, Gibson GR. The prebiotic effects of biscuits containing partially hydrolysed guar gum and fructo-oligosaccharides – a human volunteer study. Br J Nutr 2001;86(3):341–8.
370. Walton GE, van den Heuvel EG, Kosters MH, Rastall RA, Tuohy KM, Gibson GR. A randomised crossover study investigating the effects of galacto-oligosaccharides on the faecal microbiota in men and women over 50 years of age. Br J Nutr 2012;107(10):1466–75.
371. Langlands SJ, Hopkins MJ, Coleman N, Cummings JH. Prebiotic carbohy-drates modify the mucosa associated microflora of the human large bowel. Gut 2004;53(11):1610–6.
372. Tannock GW, Munro K, Harmsen HJ, Welling GW, Smart J, Gopal PK. Anal-ysis of the fecal microflora of human subjects consuming a probiotic product containing Lactobacillus rhamnosus DR20. Appl Environ Micro-biol 2000;66(6):2578–88.
373. Rinne M, Kalliomäki M, Salminen S, Isolauri E. Probiotic intervention in the first months of life: short-term effects on gastrointestinal symptoms and long-term effects on gut microbiota. J Pediatr Gastroenterol Nutr 2006;43(2):200–5.
374. Mohan R, Koebnick C, Schildt J, Schmidt S, Mueller M, Possner M, et al. Effects of Bifidobacterium lactis Bb12 supplementation on intestinal mi-

140
crobiota of preterm infants: a double-blind, placebo-controlled, random-ized study. J Clin Microbiol 2006;44(11):4025–31.
375. Gueimonde M, Sakata S, Kalliomäki M, Isolauri E, Benno Y, Salminen S. Effect of maternal consumption of lactobacillus GG on transfer and es-tablishment of fecal bifidobacterial microbiota in neonates. J Pediatr Gas-troenterol Nutr 2006;42(2):166–70.
376. Koning CJM, Jonkers DMAE, Stobberingh EE, Mulder L, Rombouts FM, Stockbrügger RW. The effect of a multispecies probiotic on the intestinal microbiota and bowel movements in healthy volunteers taking the antibi-otic amoxycillin. Am J Gastroenterol 2008;103(1):178–89.
377. Lyra A, Krogius-Kurikka L, Nikkila J, Malinen E, Kajander K, Kurikka K, et al. Effect of a multispecies probiotic supplement on quantity of irritable bow-el syndrome-related intestinal microbial phylotypes. BMC Gastroenterol 2010;10:110.
378. Duncan SH, Lobley GE, Holtrop G, Ince J, Johnstone AM, Louis P, et al. Human colonic microbiota associated with diet, obesity and weight loss. Int J Obes 2008;32(11):1720–4.
379. Nadal I, Santacruz A, Marcos A, Warnberg J, Garagorri M, Moreno LA, et al. Shifts in clostridia, bacteroides and immunoglobulin-coating fecal bacte-ria associated with weight loss in obese adolescents. Int J Obes 2009;33(7):758–67.
380. Puupponen-Pimiä R, Seppänen-Laakso T, Nohynek L, Maukonen J, Aura A, Tómas Barberan FA, et al. Effects of ellagitannin rich berries on blood li-pid profiles, gut microbiota and metabolism of phenolic compounds in metabolic syndrome. Mol Nutr Food Res (submitted).
381. Duncan SH, Belenguer A, Holtrop G, Johnstone AM, Flint HJ, Lobley GE. Reduced dietary intake of carbohydrates by obese subjects results in de-creased concentrations of butyrate and butyrate-producing bacteria in fe-ces. Appl Environ Microbiol 2007;73(4):1073–8.
382. Flint HJ, Duncan SH, Scott KP, Louis P. Interactions and competition within the microbial community of the human colon: Links between diet and health: Minireview. Environ Microbiol 2007;9(5):1101–11.
383. Magee EA, Richardson CJ, Hughes R, Cummings JH. Contribution of dietary protein to sulfide production in the large intestine: an in vitro and a con-trolled feeding study in humans. Am J Clin Nutr 2000;72(6):1488–94.
384. Pitcher MC, Cummings JH. Hydrogen sulphide: a bacterial toxin in ulcerative colitis? Gut 1996; 39(1):1–4.

141
385. Chan DS, Lau R, Aune D, Vieira R, Greenwood DC, Kampman E, et al. Red and processed meat and colorectal cancer incidence: meta-analysis of prospective studies. PLoS One 2011;6(6):e20456.
386. Aune D, Chan DS, Lau R, Vieira R, Greenwood DC, Kampman E, et al. Dietary fibre, whole grains, and risk of colorectal cancer: systematic review and dose-response meta-analysis of prospective studies. BMJ 2011;343:d6617.
387. Dahm CC, Keogh RH, Spencer EA, Greenwood DC, Key TJ, Fentiman IS, et al. Dietary fiber and colorectal cancer risk: a nested case-control study using food diaries. J Natl Cancer Inst 2010;102(9):614–26.
388. Drasar BS, Crowther JS, Goddard P, Hawksworth G, Hill MJ, Peach S, et al. The relation between diet and the gut microflora in man. Proc Nutr Soc 1973;32(2):49–52.
389. Finegold SM, Attebery HR, Sutter VL. Effect of diet on human fecal flora: compar-ison of Japanese and American diets. Am J Clin Nutr 1974;27(12):1456–69.
390. Drasar BS, Montgomery F, Tomkins AM. Diet and faecal flora in three dietary groups in rural northern Nigeria. J Hyg (Lond) 1986;96(1):59–65.
391. Wu GD, Chen J, Hoffmann C, Bittinger K, Chen YY, Keilbaugh SA, et al. Linking long-term dietary patterns with gut microbial enterotypes. Sci-ence 2011;334(6052):105–8.
392. Zimmer J, Lange B, Frick JS, Sauer H, Zimmermann K, Schwiertz A, et al. A vegan or vegetarian diet substantially alters the human colonic faecal mi-crobiota. Eur J Clin Nutr 2012; 66(1):53–60.
393. Finegold SM, Flora DJ, Attebery HR, Sutter VL. Fecal bacteriology of colonic polyp patients and control patients. Cancer Res 1975;35(11 Pt. 2):3407–17.
394. Finegold SM, Sutter VL, Sugihara PT. Fecal microbial flora in Seventh Day Advent-ist populations and control subjects. Am J Clin Nutr 1977;30(11):1781–92.
395. Blaut M. Relationship of prebiotics and food to intestinal microflora. Eur J Nutr 2002;41(SUPPL. 1):11–6.
396. Barcenilla A, Pryde SE, Martin JC, Duncan SH, Stewart CS, Henderson C, et al. Phylogenetic relationships of butyrate-producing bacteria from the human gut. Appl Environ Microbiol 2000;66(4):1654–61.
397. Pryde SE, Duncan SH, Hold GL, Stewart CS, Flint HJ. The microbiology of butyr-ate formation in the human colon. FEMS Microbiol Lett 2002;217(2):133–9.
398. Benus RF, van der Werf TS, Welling GW, Judd PA, Taylor MA, Harmsen HJ, et al. Association between Faecalibacterium prausnitzii and dietary fibre

142
in colonic fermentation in healthy human subjects. Br J Nutr 2010;104(5):693–700.
399. Marquet P, Duncan SH, Chassard C, Bernalier-Donadille A, Flint HJ. Lactate has the potential to promote hydrogen sulphide formation in the human colon. FEMS Microbiol Lett 2009;299(2):128–34.
400. Karppinen S, Liukkonen K, Aura A-M, Forssell P, Poutanen K. In vitro fer-mentation of polysaccharides of rye, wheat and oat brans and inulin by human faecal bacteria. J Sci Food Agric 2000;80(10):1469–76.
401. Hughes SA, Shewry PR, Gibson GR, McCleary BV, Rastall RA. In vitro fer-mentation of oat and barley derived β-glucans by human faecal microbiota. FEMS Microbiol Ecol 2008;64(3):482–93.
402. Hopkins MJ, Englyst HN, Macfarlane S, Furrie E, Macfarlane GT, McBain AJ. Degradation of Cross-Linked and Non-Cross-Linked Arabinoxylans by the In-testinal Microbiota in Children. Appl Environ Microbiol 2003;69(11):6354–60.
403. Flint HJ, Bayer EA, Rincon MT, Lamed R, White BA. Polysaccharide utiliza-tion by gut bacteria: Potential for new insights from genomic analysis. Nature Rev Microbiol 2008;6(2):121–31.
404. Broekaert WF, Courtin CM, Verbeke K, van de Wiele T, Verstraete W, Delcour JA. Prebiotic and other health-related effects of cereal-derived arabinoxylans, arabinoxylan-oligosaccharides, and xylooligosaccharides. Crit Rev Food Sci Nutr 2011;51(2):178–94.
405. Zhao J, Cheung PC. Fermentation of beta-glucans derived from different sources by bifidobacteria: evaluation of their bifidogenic effect. J Agric Food Chem 2011;59(11):5986–92.
406. De Vuyst L, Leroy F. Cross-feeding between bifidobacteria and butyrate-producing colon bacteria explains bifdobacterial competitiveness, butyrate production, and gas production. Int J Food Microbiol 2011;149(1):73–80.
407. Martinez I, Kim J, Duffy PR, Schlegel VL, Walter J. Resistant starches types 2 and 4 have differential effects on the composition of the fecal microbiota in human subjects. PLoS One 5(11):e15046.
408. Walker AW, Ince J, Duncan SH, Webster LM, Holtrop G, Ze X, et al. Domi-nant and diet-responsive groups of bacteria within the human colonic mi-crobiota. ISME J 2011; 5(2):220–30.
409. Abell GCJ, Cooke CM, Bennett CN, Conlon MA, McOrist AL. Phylotypes related to Ruminococcus bromii are abundant in the large bowel of hu-

143
mans and increase in response to a diet high in resistant starch. FEMS Microbiol Ecol 2008;66(3):505–15.
410. Ehle FR, Robertson JB, Van Soest PJ. Influence of dietary fibers on fermen-tation in the human large intestine. J Nutr 1982;112(1):158–66.
411. Robert C, Bernalier-Donadille A. The cellulolytic microflora of the human colon: Evidence of microcrystalline cellulose-degrading bacteria in me-thane-excreting subjects. FEMS Microbiol Ecol 2003;46(1):81–9.
412. Connolly ML, Lovegrove JA, Tuohy KM. In vitro evaluation of the microbiota modulation abilities of different sized whole oat grain flakes. Anaerobe 2010 16(5):483–8.
413. Leitch EC, Walker AW, Duncan SH, Holtrop G, Flint HJ. Selective coloniza-tion of insoluble substrates by human faecal bacteria. Environ Microbiol 2007;9(3):667–79.
414. Araya M, Morelli L, Reid G, Sanders ME, Stanton C, Pineiro M, et al. Guidelines for the evaluation of probiotics in food. Joint FAO/WHO Work-ing Group Report on Drafting Guidelines for the Evaluation of Probiotics in Food, London (ON, Canada) April 30 and May 1.; 2002.
415. Champagne CP, Ross RP, Saarela M, Hansen KF, Charalampopoulos D. Recommendations for the viability assessment of probiotics as concentrat-ed cultures and in food matrices. Int J Food Microbiol 2011;149(3):185–93.
416. Daly C, Davis R. The biotechnology of lactic acid bacteria with emphasis on applications in food safety and human health. Agricult Food Sci Finland 1998;7:251–65.
417. Donnet-Hughes A, Rochat F, Serrant P, Aeschlimann JM, Schiffrin EJ. Modu-lation of nonspecific mechanisms of defense by lactic acid bacteria: ef-fective dose. J Dairy Sci 1999; 82(5):863–9.
418. Macfarlane GT, Cummings JH. Probiotics and prebiotics: Can regulating the activi-ties of intestinal bacteria benefit health? Br Med J 1999;318(7189):999–1003.
419. Cox MJ, Huang YJ, Fujimura KE, Liu JT, McKean M, Boushey HA, et al. Lactobacillus casei abundance is associated with profound shifts in the infant gut microbiome. PLoS One 2010; Jan 18;5(1):e8745.
420. Gibson GR, Roberfroid MB. Dietary modulation of the human colonic micro-biota: Introducing the concept of prebiotics. J Nutr 1995;125(6):1401–12.
421. Gibson GR, Probert HM, Van Loo J, Rastall RA, Roberfroid MB. Dietary modulation of the human colonic microbiota: Updating the concept of prebiotics. Nutr Res Rev 2004;17(2):259–75.
144
422. Joossens M, Huys G, Van Steen K, Cnockaert M, Vermeire S, Rutgeerts P, et al. High-throughput method for comparative analysis of denaturing gradient gel electrophoresis profiles from human fecal samples reveals significant increases in two bifidobacterial species after inulin-type prebi-otic intake. FEMS Microbiol Ecol 2011;75(2):343–9.
423. Davis LM, Martinez I, Walter J, Hutkins R. A dose dependent impact of prebi-otic galactooligosaccharides on the intestinal microbiota of healthy adults. Int J Food Microbiol 2010; 144(2):285–92.
424. Ramirez-Farias C, Slezak K, Fuller Z, Duncan A, Holtrop G, Louis P. Effect of inulin on the human gut microbiota: stimulation of Bifidobacterium ado-lescentis and Faecalibacterium prausnitzii. Br J Nutr 2009;101(4):541–50.
425. Roberfroid M, Gibson GR, Hoyles L, McCartney AL, Rastall R, Rowland I, et al. Prebiotic effects: metabolic and health benefits. Br J Nutr 2010;104 Suppl 2:S1–63.
426. Rinne MM, Gueimonde M, Kalliomäki M, Hoppu U, Salminen SJ, Isolauri E. Similar bifidogenic effects of prebiotic-supplemented partially hydrolyzed infant formula and breastfeeding on infant gut microbiota. FEMS Immunol Med Microbiol 2005; Jan 1;43(1):59–65.
427. Kohanski MA, Dwyer DJ, Collins JJ. How antibiotics kill bacteria: from targets to networks. Nat Rev Microbiol 2010;8(6):423–35.
428. Sullivan A, Edlund C, Nord CE. Effect of antimicrobial agents on the ecologi-cal balance of human microflora. Lancet Infect Dis 2001;1(2):101–14.
429. Delgado S, Flórez AB, Mayo B. Antibiotic susceptibility of Lactobacillus and Bifidobacterium species from the human gastrointestinal tract. Curr Mi-crobiol 2005;50(4):202–7.
430. Jousimies-Somer HR, Summanen P, Citron DM, Baron EJ, Wexler HM, Fi-negold SM. Wadsworth – KTL Anaerobic Bacteriology Manual. 6th ed. Belmont, CA: Star Publishing Company; 2002.
431. Mättö J, van Hoek AHAM, Domig KJ, Saarela M, Floréz AB, Brockmann E, et al. Susceptibility of human and probiotic Bifidobacterium spp. to selected antibiotics as determined by the Etest method. Int Dairy J 2007;17(9):1123–31.
432. Moubareck C, Gavini F, Vaugien L, Butel MJ, Doucet-Populaire F. Antimicrobial susceptibility of bifidobacteria. J Antimicrob Chemother 2005;55(1):38–44.
433. Saarela M, Mayrhofer S, Domig KJ, Danielsen M, Mayo B, Mättö J. Suscepti-bility of bifidobacteria originating from different sources to tetracycline,
145
erythromycin, streptomycin and vancomycin. Int J Prob Preb 2008;3(4):269–70.
434. Huys G, D'Haene K, Cnockaert M, Tosi L, Danielsen M, Flórez AB, et al. Intra- and interlaboratory performances of two commercial antimicrobial susceptibility testing methods for bifidobacteria and nonenterococcal lac-tic acid bacteria. Antimicrob Agents Chemother 2010;54(6):2567–74.
435. Ferech M, Coenen S, Malhotra-Kumar S, Dvorakova K, Hendrickx E, Suetens C, et al. European Surveillance of Antimicrobial Consumption (ESAC): Outpatient antibiotic use in Europe. J Antimicrob Chemother 2006;58(2):401–7.
436. Edlund C, Nord CE. Effect on the human normal microflora of oral antibiotics for treatment of urinary tract infections. J Antimicrob Chemother 2000;46 Suppl A:41–8.
437. De La Cochetiere MF, Durand T, Lepage P, Bourreille A, Galmiche JP, Doré J. Resilience of the dominant human fecal microbiota upon short-course antibiotic challenge. J Clin Microbiol 2005;43(11):5588–92.
438. Brunser O, Gotteland M, Cruchet S, Figueroa G, Garrido D, Steenhout P. Effect of a milk formula with prebiotics on the intestinal microbiota of in-fants after an antibiotic treatment. Pediatr Res 2006;59(3):451–6.
439. Mangin I, Suau A, Gotteland M, Brunser O, Pochart P. Amoxicillin treatment modifies the composition of Bifidobacterium species in infant intestinal microbiota. Anaerobe 2010; 8;16(4):433–8.
440. Panagiotidis G, Backstrom T, Asker-Hagelberg C, Jandourek A, Weintraub A, Nord CE. Effect of ceftaroline on normal human intestinal microflora. An-timicrob Agents Chemother 2010; 54(5):1811–4.
441. Dethlefsen L, Relman DA. Incomplete recovery and individualized responses of the human distal gut microbiota to repeated antibiotic perturbation. Proc Natl Acad Sci U S A 2011;108 Suppl 1:4554–61.
442. Donskey CJ, Hujer AM, Das SM, Pultz NJ, Bonomo RA, Rice LB. Use of denaturing gradient gel electrophoresis for analysis of the stool microbio-ta of hospitalized patients. J Microbiol Methods 2003;54(2):249–56.
443. Jakobsson HE, Jernberg C, Andersson AF, Sjolund-Karlsson M, Jansson JK, Engstrand L. Short-term antibiotic treatment has differing long-term impacts on the human throat and gut microbiome. PLoS One 2010;5(3):e9836.
146
444. Jernberg C, Lofmark S, Edlund C, Jansson JK. Long-term ecological impacts of antibiotic administration on the human intestinal microbiota. ISME J 2007;1(1):56–66.
445. Heimdahl A, Kager L, Nord CE. Changes in the oropharyngeal and colon microflora in relation to antimicrobial concentrations in saliva and faeces. Scand J Infect Dis Suppl 1985;44:52–8.
446. Nord CE, Heimdahl A. Impact of orally administered antimicrobial agents on human oropharyngeal and colonic microflora. J Antimicrob Chemother 1986;18 Suppl C:159–64.
447. Bjorneklett A, Midtvedt T. Influence of three antimicrobial agents – penicillin, metronidazole, and doxycyclin – on the intestinal microflora of healthy humans. Scand J Gastroenterol 1981;16(4):473–80.
448. Nord CE, Heimdahl A. Impact of different antimicrobial agents on the coloni-sation resistance in the intestinal tract with special reference to doxycy-cline. Scand J Infect Dis Suppl 1988;53:50–8.
449. Mättö J, Maukonen J, Alakomi H-L, Suihko M-L, Saarela M. Influence of oral doxycycline therapy on the diversity and antibiotic susceptibility of human intestinal bifidobacterial population. J Appl Microbiol 2008;105(1):279–89.
450. Borglund E, Hagermark O, Nord CE. Impact of topical clindamycin and sys-temic tetracycline on the skin and colon microflora in patients with acne vulgaris. Scand J Infect Dis Suppl 1984;43:76–81.
451. Alestig K, Lidin-Janson G. The effect of doxycycline and tetracycline hydro-chloride on the aerobic fecal flora, with special reference to Escherichia coli. Scand J Infect Dis 1975;7(4):265–71.
452. Jonsson M, Tunevall G. Selective pressure of tetracyclines on the faecal flora. A comparison between tetracycline and doxycycline. Scand J Infect Dis Suppl 1976;(9)(9):89–93.
453. London N, Nijsten R, Mertens P, v d Bogaard A, Stobberingh E. Effect of antibi-otic therapy on the antibiotic resistance of faecal Escherichia coli in patients attending general practitioners. J Antimicrob Chemother 1994;34(2):239–46.
454. Tannock GW. Analysis of the intestinal microflora using molecular methods. Eur J Clin Nutr 2002;56 Suppl 4:S44–9.
455. Tanaka S, Kobayashi T, Songjinda P, Tateyama A, Tsubouchi M, Kiyohara C, et al. Influence of antibiotic exposure in the early postnatal period on the development of intestinal microbiota. FEMS Immunol Med Microbiol 2009;56(1):80–7.
147
456. Bartosch S, Fite A, Macfarlane GT, McMurdo ME. Characterization of bacte-rial communities in feces from healthy elderly volunteers and hospitalized elderly patients by using real-time PCR and effects of antibiotic treatment on the fecal microbiota. Appl Environ Microbiol 2004; 70(6):3575–81.
457. Dethlefsen L, Huse S, Sogin ML, Relman DA. The pervasive effects of an antibiotic on the human gut microbiota, as revealed by deep 16S rRNA sequencing. PLoS Biol 2008;6(11):e280.
458. Megraud F, Boyanova L, Lamouliatte H. Activity of lansoprazole against Helicobacter pylori. Lancet 1991;337(8755):1486.
459. Nagata K, Sone N, Tamura T. Inhibitory activities of lansoprazole against respiration in Helicobacter pylori. Antimicrob Agents Chemother 2001;45(5):1522–7.
460. Yearsley KA, Gilby LJ, Ramadas AV, Kubiak EM, Fone DL, Allison MC. Pro-ton pump inhibitor therapy is a risk factor for Clostridium difficile-associated diarrhoea. Aliment Pharmacol Ther 2006;24(4):613–9.
461. Lowe DO, Mamdani MM, Kopp A, Low DE, Juurlink DN. Proton pump inhibi-tors and hospitalization for Clostridium difficile-associated disease: A population-based study. Clin Infect Dis 2006;43(10):1272–6.
462. Canani RB, Cirillo P, Roggero P, Romano C, Malamisura B, Terrin G, et al. Therapy with gastric acidity inhibitors increases the risk of acute gastro-enteritis and community-acquired pneumonia in children. Pediatrics 2006;117(5):e817–20.
463. Holdeman LV, Good IJ, Moore WE. Human fecal flora: variation in bacterial composition within individuals and a possible effect of emotional stress. Appl Environ Microbiol 1976;31(3):359–75.
464. Lizko NN. Stress and intestinal microflora. Nahrung 1987;31(5–6):443–7.
465. Lencner AA, Lencner CP, Mikelsaar ME, Tjuri ME, Toom MA, Valjaots ME, et al. The quantitative composition of the intestinal lactoflora before and after space flights of different lengths. Nahrung 1984;28(6–7):607–13.
466. Fujimura KE, Slusher NA, Cabana MD, Lynch SV. Role of the gut microbiota in defining human health. Expert Rev Anti Infect Ther 2010;8(4):435–54.
467. Kolenbrander PE, Egland PG, Diaz PI, Palmer Jr. RJ. Genome-genome interactions: Bacterial communities in initial dental plaque. Trends Micro-biol 2005;13(1):11–5.

148
468. Kolenbrander PE, Palmer RJ, Periasamy S, Jakubovics NS. Oral multi-species biofilm development and the key role of cell-cell distance. Nature Rev Microbiol 2010;8(7):471–80.
469. Darveau RP. Periodontitis: A polymicrobial disruption of host homeostasis. Nature Rev Microbiol 2010;8(7):481–90.
470. Beck JD, Offenbacher S. Systemic effects of periodontitis: Epidemiology of periodontal disease and cardiovascular disease. J Periodontol 2005;76(11 SUPPL.):2089–100.
471. Seymour GJ, Ford PJ, Cullinan MP, Leishman S, Yamazaki K. Relationship between periodontal infections and systemic disease. Clin Microbiol In-fect 2007;13(SUPPL. 4):3–10.
472. Chhour K, Nadkarni MA, Byun R, Martin FE, Jacques NA, Hunter N. Molecu-lar analysis of microbial diversity in advanced caries. J Clin Microbiol 2005;43(2):843–9.
473. Nadkarni MA, Caldon CE, Chhour K, Fisher IP, Martin FE, Jacques NA, et al. Carious dentine provides a habitat for a complex array of novel Prevotel-la-like bacteria. J Clin Microbiol 2004;42(11):5238–44.
474. Tanzer JM, Livingston J, Thompson AM. The microbiology of primary dental caries in humans. J Dent Educ 2001;65(10):1028–37.
475. Fitzgerald RJ, Keyes PH. Ecologic factors in dental caries. The fate of antibiotic-resistant cariogenic streptococci in hamsters. Am J Pathol 1963;42:759–72.
476. Marsh PD. Microbial ecology of dental plaque and its significance in health and disease. Adv Dent Res 1994;8(2):263–71.
477. Theilade E. The non-specific theory in microbial etiology of inflammatory periodontal diseases. J Clin Periodontol 1986;13(10):905–11.
478. Marsh PD. Sugar, fluoride, pH and microbial homeostasis in dental plaque. Proceedings of the Finnish Dental Society.Suomen Hammaslääkäri-seuran Toimituksia 1991;87(4):515–25.
479. Russell RR. Changing concepts in caries microbiology. Am J Dent 2009;22(5):304–10.
480. Stamm JW. Epidemiology of gingivitis. J Clin Periodontol 1986;13(5):360–70.
481. Moore LV, Moore WE, Cato EP, Smibert RM, Burmeister JA, Best AM, et al. Bacteriology of human gingivitis. J Dent Res 1987;66(5):989–95.
482. Page RC. Gingivitis. J Clin Periodontol 1986;13(5):345–59.
149
483. Sakamoto M, Umeda M, Benno Y. Molecular analysis of human oral microbi-ota. J Periodont Res 2005;40(3):277–85.
484. Moore WEC, Holdeman LV, Smibert RM. Bacteriology of severe periodontitis in young adult humans. Infect Immun 1982;38(3):1137–48.
485. Chávez De Paz LE, Molander A, Dahlén G. Gram-positive rods prevailing in teeth with apical periodontitis undergoing root canal treatment. Int Endod J 2004;37(9):579–87.
486. Socransky SS, Haffajee AD, Cugini MA, Smith C, Kent Jr. RL. Microbial complexes in subgingival plaque. J Clin Periodontol 1998;25(2):134–44.
487. Faveri M, Mayer MPA, Feres M, De Figueiredo LC, Dewhirst FE, Paster BJ. Microbiological diversity of generalized aggressive periodontitis by 16S rRNA clonal analysis. Oral Microbiol Immunol 2008;23(2):112–8.
488. Thompson WG, Longstreth GF, Drossman DA, Heaton KW, Irvine EJ, Müller-Lissner SA. Functional bowel disorders and functional abdominal pain. Gut 1999;45(SUPPL. 2).
489. Longstreth GF, Thompson WG, Chey WD, Houghton LA, Mearin F, Spiller RC. Functional bowel disorders. Gastroenterol 2006;130(5):1480–91.
490. Dinan TG, Cryan J, Shanahan F, Keeling PW, Quigley EM. IBS: An epigenet-ic perspective. Nat Rev Gastroenterol Hepatol 2010;7(8):465–71.
491. Spiller R, Lam C. The shifting interface between IBS and IBD. Curr Opin Pharmacol 2011; 11(6):586–92.
492. King TS, Elia M, Hunter JO. Abnormal colonic fermentation in irritable bowel syndrome. Lancet 1998;352(9135):1187–9.
493. Pimentel M, Chow EJ, Lin HC. Eradication of small intestinal bacterial over-growth reduces symptoms of irritable bowel syndrome. Am J Gastroen-terol 2000;95(12):3503–6.
494. Balsari A, Ceccarelli A, Dubini F, Fesce E, Poli G. The fecal microbial popula-tion in the irritable bowel syndrome. Microbiologica 1982;5(3):185–94.
495. Bradley HK, Wyatt GM, Bayliss CE, Hunter JO. Instability in the faecal flora of a patient suffering from food-related irritable bowel syndrome. J Med Mi-crobiol 1987;23(1):29–32.
496. Swidsinski A, Weber J, Loening-Baucke V, Hale LP, Lochs H. Spatial organi-zation and composition of the mucosal flora in patients with inflammatory bowel disease. J Clin Microbiol 2005; 43(7):3380–9.
150
497. Mättö J, Maunuksela L, Kajander K, Palva A, Korpela R, Kassinen A, et al. Composition and temporal stability of gastrointestinal microbiota in irrita-ble bowel syndrome – A longitudinal study in IBS and control subjects. FEMS Immunol Med Microbiol 2005;43(2):213–22.
498. Malinen E, Rinttilä T, Kajander K, Mättö J, Kassinen A, Krogius L, et al. Analy-sis of the fecal microbiota of irritable bowel syndrome patients and healthy controls with real-time PCR. Am J Gastroenterol 2005;100(2):373–82.
499. Kassinen A, Krogius-Kurikka L, Mäkivuokko H, Rinttilä T, Paulin L, Corander J, et al. The fecal microbiota of irritable bowel syndrome patients differs sig-nificantly from that of healthy subjects. Gastroenterol 2007;133(1):24–33.
500. Kerckhoffs APM, Samsom M, van der Rest ME, de Vogel J, Knol J, Ben-Amor K, et al. Lower Bifidobacteria counts in both duodenal mucosa-associated and fecal microbiota in irritable bowel syndrome patients. World J Gastroenterol 2009;15(23):2887–92.
501. Codling C, O'Mahony L, Shanahan F, Quigley EMM, Marchesi JR. A molecu-lar analysis of fecal and mucosal bacterial communities in irritable bowel syndrome. Dig Dis Sci 2010;55(2):392–7.
502. Lyra A, Rinttilä T, Nikkilä J, Krogius-Kurikka L, Kajander K, Malinen E, et al. Diar-rhoea-predominant irritable bowel syndrome distinguishable by 16S rRNA gene phylotype quantification. World J Gastroenterol 2009;15(47):5936–45.
503. Krogius-Kurikka L, Lyra A, Malinen E, Aarnikunnas J, Tuimala J, Paulin L, et al. Microbial community analysis reveals high level phylogenetic altera-tions in the overall gastrointestinal microbiota of diarrhoea-predominant irritable bowel syndrome sufferers. BMC Gastroenterol 2009;9:95.
504. Malinen E, Krogius-Kurikka L, Lyra A, Nikkilä J, Jääskeläinen A, Rinttilä T, et al. Association of symptoms with gastrointestinal microbiota in irritable bowel syndrome. World J Gastroenterol 2010;16(36):4532–40.
505. Noor SO, Ridgway K, Scovell L, Kemsley EK, Lund EK, Jamieson C, et al. Ulcerative colitis and irritable bowel patients exhibit distinct abnormalities of the gut microbiota. BMC Gastroenterol 2010;10:134.
506. Carroll IM, Chang YH, Park J, Sartor RB, Ringel Y. Luminal and mucosal-associated intestinal microbiota in patients with diarrhea-predominant irri-table bowel syndrome. Gut Pathog 2010; 2(1):19.
507. Carroll IM, Ringel-Kulka T, Keku TO, Chang YH, Packey CD, Sartor RB, et al. Molecular analysis of the luminal- and mucosal-associated intestinal mi-crobiota in diarrhea-predominant irritable bowel syndrome. Am J Physiol Gastrointest Liver Physiol 2011;301(5):G799–807.
151
508. Carroll IM, Ringel-Kulka T, Siddle JP, Ringel Y. Alterations in composition and diversity of the intestinal microbiota in patients with diarrhea-predominant irritable bowel syndrome. Neurogastroenterol Motil 2012;24(6):521,30, e248.
509. Kerckhoffs AP, Ben-Amor K, Samsom M, van der Rest ME, de Vogel J, Knol J, et al. Molecular analysis of faecal and duodenal samples reveals sig-nificantly higher prevalence and numbers of Pseudomonas aeruginosa in irritable bowel syndrome. J Med Microbiol 2011;60(Pt 2):236–45.
510. Ponnusamy K, Choi JN, Kim J, Lee SY, Lee CH. Microbial community and metabolomic comparison of irritable bowel syndrome faeces. J Med Mi-crobiol 2011;60(Pt 6):817–27.
511. Rinttilä T, Lyra A, Krogius-Kurikka L, Palva A. Real-time PCR analysis of enteric pathogens from fecal samples of irritable bowel syndrome sub-jects. Gut Pathog 2011;3(1):6.
512. Tana C, Umesaki Y, Imaoka A, Handa T, Kanazawa M, Fukudo S. Altered profiles of intestinal microbiota and organic acids may be the origin of symptoms in irritable bowel syndrome. Neurogastroenterol Motil 2010;22(5):512,9, e114–5.
513. Saulnier DM, Riehle K, Mistretta TA, Diaz MA, Mandal D, Raza S, et al. Gas-trointestinal microbiome signatures of pediatric patients with irritable bowel syndrome. Gastroenterol 2011; 141(5):1782–91.
514. Rajilic-Stojanovic M, Biagi E, Heilig HG, Kajander K, Kekkonen RA, Tims S, et al. Global and deep molecular analysis of microbiota signatures in fe-cal samples from patients with irritable bowel syndrome. Gastroenterol 2011;141(5):1792–801.
515. Si JM, Yu YC, Fan YJ, Chen SJ. Intestinal microecology and quality of life in irritable bowel syndrome patients. World J Gastroenterol 2004;10(12):1802–5.
516. Harper PH, Lee EC, Kettlewell MG, Bennett MK, Jewell DP. Role of the fae-cal stream in the maintenance of Crohn's colitis. Gut 1985;26(3):279–84.
517. Danese S, Fiocchi C. Ulcerative colitis. N Engl J Med 2011;365(18):1713–25.
518. Seksik P. Gut microbiota and IBD. Gastroenterol Clin Biol 2010;34 Suppl 1:S44–51.
519. Sokol H, Seksik P. The intestinal microbiota in inflammatory bowel diseases: time to connect with the host. Curr Opin Gastroenterol 2010;26(4):327–31.
152
520. Swidsinski A, Ladhoff A, Pernthaler A, Swidsinski S, Loening-Baucke V, Ortner M, et al. Mucosal flora in inflammatory bowel disease. Gastroen-terol 2002;122(1):44–54.
521. Frank DN, St Amand AL, Feldman RA, Boedeker EC, Harpaz N, Pace NR. Molecular-phylogenetic characterization of microbial community imbal-ances in human inflammatory bowel diseases. Proc Natl Acad Sci U S A 2007;104(34):13780–5.
522. Walker AW, Sanderson JD, Churcher C, Parkes GC, Hudspith BN, Rayment N, et al. High-throughput clone library analysis of the mucosa-associated microbiota reveals dysbiosis and differences between inflamed and non-inflamed regions of the intestine in inflammatory bowel disease. BMC Mi-crobiol 2011;11:7.
523. Sokol H, Seksik P, Rigottier-Gois L, Lay C, Lepage P, Podglajen I, et al. Specificities of the fecal microbiota in inflammatory bowel disease. In-flamm Bowel Dis 2006;12(2):106–11.
524. Giaffer MH, Holdsworth CD, Duerden BI. The assessment of faecal flora in patients with inflammatory bowel disease by a simplified bacteriological technique. J Med Microbiol 1991; 35(4):238–43.
525. Sokol H, Lepage P, Seksik P, Dore J, Marteau P. Temperature gradient gel electrophoresis of fecal 16S rRNA reveals active Escherichia coli in the microbiota of patients with ulcerative colitis. J Clin Microbiol 2006;44(9):3172–7.
526. Giaffer MH, Holdsworth CD, Duerden BI. Virulence properties of Escherichia coli strains isolated from patients with inflammatory bowel disease. Gut 1992;33(5):646–50.
527. Bullock NR, Booth JC, Gibson GR. Comparative composition of bacteria in the human intestinal microflora during remission and active ulcerative co-litis. Curr Issues Intest Microbiol 2004; 5(2):59–64.
528. Mangin I, Bonnet R, Seksik P, Rigottier-Gois L, Sutren M, Bouhnik Y, et al. Molecular inventory of faecal microflora in patients with Crohn's disease. FEMS Microbiol Ecol 2004;50(1):25–36.
529. Martinez-Medina M, Aldeguer X, Gonzalez-Huix F, Acero D, Garcia-Gil LJ. Abnormal microbiota composition in the ileocolonic mucosa of Crohn's disease patients as revealed by polymerase chain reaction-denaturing gradient gel electrophoresis. Inflamm Bowel Dis 2006; 12(12):1136–45.
530. Martinez-Medina M, Aldeguer X, Lopez-Siles M, Gonzalez-Huix F, Lopez-Oliu C, Dahbi G, et al. Molecular diversity of Escherichia coli in the hu-

153
man gut: new ecological evidence supporting the role of adherent-invasive E. coli (AIEC) in Crohn's disease. Inflamm Bowel Dis 2009; 15(6):872–82.
531. Schwartz D, Shafran I, Romero C, Piromalli C, Biggerstaff J, Naser N, et al. Use of short-term culture for identification of Mycobacterium avium subsp. paratuberculosis in tissue from Crohn's disease patients. Clin Mi-crobiol Infect 2000;6(6):303–7.
532. Hulten K, El-Zimaity HM, Karttunen TJ, Almashhrawi A, Schwartz MR, Gra-ham DY, et al. Detection of Mycobacterium avium subspecies paratuber-culosis in Crohn's diseased tissues by in situ hybridization. Am J Gastro-enterol 2001;96(5):1529–35.
533. Scanlan PD, Shanahan F, O'Mahony C, Marchesi JR. Culture-independent anal-yses of temporal variation of the dominant fecal microbiota and targeted bac-terial subgroups in Crohn's disease. J Clin Microbiol 2006;44(11):3980–8.
534. Manichanh C, Rigottier-Gois L, Bonnaud E, Gloux K, Pelletier E, Frangeul L, et al. Reduced diversity of faecal microbiota in Crohn's disease revealed by a metagenomic approach. Gut 2006;55(2):205–11.
535. Pitcher MC, Beatty ER, Cummings JH. The contribution of sulphate reducing bacteria and 5-aminosalicylic acid to faecal sulphide in patients with ul-cerative colitis. Gut 2000;46(1):64–72.
536. Rowan FE, Docherty NG, Coffey JC, O'Connell PR. Sulphate-reducing bacte-ria and hydrogen sulphide in the aetiology of ulcerative colitis. Br J Surg 2009;96(2):151–8.
537. Jia W, Whitehead RN, Griffiths L, Dawson C, Bai H, Waring RH, et al. Diver-sity and distribution of sulphate-reducing bacteria in human faeces from healthy subjects and patients with inflammatory bowel disease. FEMS Immunol Med Microbiol 2012;65(1):55–68.
538. Fite A, Macfarlane GT, Cummings JH, Hopkins MJ, Kong SC, Furrie E, et al. Identification and quantitation of mucosal and faecal desulfovibrios using real time polymerase chain reaction. Gut 2004;53(4):523–9.
539. Gibson GR, Cummings JH, Macfarlane GT. Growth and activities of sulphate-reducing bacteria in gut contents of healthy subjects and patients with ul-cerative colitis. FEMS Microbiol Ecol 1991;86(2):103–11.
540. Kalliomäki M, Kirjavainen P, Eerola E, Kero P, Salminen S, Isolauri E. Dis-tinct patterns of neonatal gut microflora in infants in whom atopy was and was not developing. J Allergy Clin Immunol 2001;107(1):129–34.

154
541. He F, Ouwehand AC, Isolauri E, Hashimoto H, Benno Y, Salminen S. Com-parison of mucosal adhesion and species identification of bifidobacteria isolated from healthy and allergic infants. FEMS Immunol Med Microbiol 2001;30(1):43–7.
542. Ouwehand AC, Isolauri E, He F, Hashimoto H, Benno Y, Salminen S. Differ-ences in Bifidobacterium flora composition in allergic and healthy infants. J Allergy Clin Immunol 2001; 108(1):144–5.
543. Sjögren YM, Jenmalm MC, Bottcher MF, Björksten B, Sverremark-Ekstrom E. Altered early infant gut microbiota in children developing allergy up to 5 years of age. Clin Exp Allergy 2009;39(4):518–26.
544. Stsepetova J, Sepp E, Julge K, Vaughan E, Mikelsaar M, de Vos WM. Mo-lecularly assessed shifts of Bifidobacterium ssp. and less diverse micro-bial communities are characteristic of 5-year-old allergic children. FEMS Immunol Med Microbiol 2007;51(2):260–9.
545. Songjinda P, Nakayama J, Tateyama A, Tanaka S, Tsubouchi M, Kiyohara C, et al. Differences in developing intestinal microbiota between allergic and non-allergic infants: a pilot study in Japan. Biosci Biotechnol Biochem 2007;71(9):2338–42.
546. Nakayama J, Kobayashi T, Tanaka S, Korenori Y, Tateyama A, Sakamoto N, et al. Aberrant structures of fecal bacterial community in allergic infants profiled by 16S rRNA gene pyrosequencing. FEMS Immunol Med Micro-biol 2011;63(3):397–406.
547. Vael C, Nelen V, Verhulst SL, Goossens H, Desager KN. Early intestinal Bacteroides fragilis colonisation and development of asthma. BMC Pulm Med 2008;8:19.
548. Vael C, Vanheirstraeten L, Desager KN, Goossens H. Denaturing gradient gel electrophoresis of neonatal intestinal microbiota in relation to the de-velopment of asthma. BMC Microbiol 2011;11:68.
549. Wang M, Karlsson C, Olsson C, Adlerberth I, Wold AE, Strachan DP, et al. Reduced diversity in the early fecal microbiota of infants with atopic ec-zema. J Allergy Clin Immunol 2008; 121(1):129–34.
550. Penders J, Thijs C, van den Brandt PA, Kummeling I, Snijders B, Stelma F, et al. Gut microbiota composition and development of atopic manifestations in infancy: the KOALA Birth Cohort Study. Gut 2007;56(5):661–7.
551. Bjorksten B, Sepp E, Julge K, Voor T, Mikelsaar M. Allergy development and the intestinal microflora during the first year of life. J Allergy Clin Immunol 2001;108(4):516–20.

155
552. Mah KW, Bjorksten B, Lee BW, van Bever HP, Shek LP, Tan TN, et al. Dis-tinct pattern of commensal gut microbiota in toddlers with eczema. Int Arch Allergy Immunol 2006;140(2):157–63.
553. Bisgaard H, Li N, Bonnelykke K, Lund Krogsgaard Chawes B, Skov T, Palu-dan-Müller G, et al. Reduced diversity of the intestinal microbiota during infancy is associated with increased risk of allergic disease at school age. J Allergy Clin Immunol 2011;128(3):646–52.
554. Bibiloni R, Membrez M, Chou CJ. Gut microbiota, obesity and diabetes. An-nales Nestle 2009;67(1):39–47.
555. Turnbaugh PJ, Ley RE, Mahowald MA, Magrini V, Mardis ER, Gordon JI. An obesity-associated gut microbiome with increased capacity for energy harvest. Nature 2006;444(7122):1027–31.
556. Ley RE, Bäckhed F, Turnbaugh P, Lozupone CA, Knight RD, Gordon JI. Obesity alters gut microbial ecology. Proc Natl Acad Sci U S A 2005;102(31):11070–5.
557. Armougom F, Henry M, Vialettes B, Raccah D, Raoult D. Monitoring bacterial community of human gut microbiota reveals an increase in Lactobacillus in obese patients and Methanogens in anorexic patients. PLoS ONE 2009;4(9):e7125.
558. Santacruz A, Marcos A, Wärnberg J, Martí A, Martin-Matillas M, Campoy C, et al. Interplay between weight loss and gut microbiota composition in overweight adolescents. Obesity 2009;17(10):1906–15.
559. Balamurugan R, George G, Kabeerdoss J, Hepsiba J, Chandragunasekaran AMS, Ramakrishna BS. Quantitative differences in intestinal Faecalibac-terium prausnitzii in obese Indian children. Br J Nutr 2010;103(3):335–8.
560. Santacruz A, Collado MC, García-Valdés L, Segura MT, Martín-Lagos JA, Anjos T, et al. Gut microbiota composition is associated with body weight, weight gain and biochemical parameters in pregnant women. Br J Nutr 2010;104(1):83–92.
561. Collado MC, Isolauri E, Laitinen K, Salminen S. Distinct composition of gut microbiota during pregnancy in overweight and normal-weight women. Am J Clin Nutr 2008;88(4):894–9.
562. Zhang H, DiBaise JK, Zuccolo A, Kudrna D, Braidotti M, Yu Y, et al. Human gut microbiota in obesity and after gastric bypass. Proc Natl Acad Sci U S A 2009;106(7):2365–70.
156
563. Schwiertz A, Taras D, Schäfer K, Beijer S, Bos NA, Donus C, et al. Microbiota and SCFA in lean and overweight healthy subjects. Obesity 2010;18(1):190–5.
564. Mai V, McCrary QM, Sinha R, Glei M. Associations between dietary habits and body mass index with gut microbiota composition and fecal water genotoxicity: An observational study in African American and Caucasian American volunteers. Nutr J 2009;8(1):49.
565. Arumugam M, Raes J, Pelletier E, Le Paslier D, Yamada T, Mende DR, et al. Enterotypes of the human gut microbiome. Nature 2011;473(7346):174–80.
566. Kalliomäki M, Collado MC, Salminen S, Isolauri E. Early differences in fecal microbiota composition in children may predict overweight. Am J Clin Nutr 2008;87(3):534–8.
567. Ajslev TA, Andersen CS, Gamborg M, Sørensen TIA, Jess T. Childhood overweight after establishment of the gut microbiota: The role of delivery mode, pre-pregnancy weight and early administration of antibiotics. Int J Obes 2011;35(4):522–9.
568. Fleissner CK, Huebel N, Abd El-Bary MM, Loh G, Klaus S, Blaut M. Absence of intestinal microbiota does not protect mice from diet-induced obesity. Br J Nutr 2010;104(6):919–29.
569. Hildebrandt MA, Hoffmann C, Sherrill-Mix SA, Keilbaugh SA, Hamady M, Chen Y, et al. High-Fat Diet Determines the Composition of the Murine Gut Microbiome Independently of Obesity. Gastroenterol 2009;137(5).
570. Bogl LH, Pietiläinen KH, Rissanen A, Kaprio J. Improving the accuracy of self-reports on diet and physical exercise: the co-twin control method. Twin Res Hum Genet 2009;12(6):531–40.
571. Flint HJ. Obesity and the gut microbiota. J Clin Gastroenterol 2011;45 Suppl:S128–32.
572. Eckel RH, Grundy SM, Zimmet PZ. The metabolic syndrome. The Lancet 2005; 4/16–22;365(9468):1415–28.
573. Munukka E, Wiklund P, Pekkala S, Volgyi E, Xu L, Cheng S, et al. Women with and without metabolic disorder differ in their gut microbiota composi-tion. Obesity (Silver Spring) 2012; 20(5):1082–7.
574. Wu X, Ma C, Han L, Nawaz M, Gao F, Zhang X, et al. Molecular characteri-sation of the faecal microbiota in patients with type II diabetes. Curr Mi-crobiol 2010;61(1):69–78.
575. Furet JP, Kong LC, Tap J, Poitou C, Basdevant A, Bouillot JL, et al. Differen-tial adaptation of human gut microbiota to bariatric surgery-induced

157
weight loss: links with metabolic and low-grade inflammation markers. Diabetes 2010;59(12):3049–57.
576. Sokol H, Seksik P, Furet JP, Firmesse O, Nion-Larmurier I, Beaugerie L, et al. Low counts of Faecalibacterium prausnitzii in colitis microbiota. In-flamm Bowel Dis 2009;15(8):1183–9.
577. Polychronakos C, Li Q. Understanding type 1 diabetes through genetics: advances and prospects. Nat Rev Genet 2011;12(11):781–92.
578. Vaarala O, Atkinson MA, Neu J. The "perfect storm" for type 1 diabetes: the complex interplay between intestinal microbiota, gut permeability, and mucosal immunity. Diabetes 2008; 57(10):2555–62.
579. Giongo A, Gano KA, Crabb DB, Mukherjee N, Novelo LL, Casella G, et al. Toward defining the autoimmune microbiome for type 1 diabetes. ISME J 2011;5(1):82–91.
580. Louis P. Does the human gut microbiota contribute to the etiology of autism spectrum disorders? Dig Dis Sci 2012;57(8):1987–9.
581. Finegold SM, Molitoris D, Song Y, Liu C, Väisänen ML, Bolte E, et al. Gastro-intestinal microflora studies in late-onset autism. Clin Infect Dis 2002;35(Suppl 1):S6–S16.
582. Song Y, Liu C, Finegold SM. Real-time PCR quantitation of clostridia in feces of autistic children. Appl Environ Microbiol 2004;70(11):6459–65.
583. Parracho HM, Bingham MO, Gibson GR, McCartney AL. Differences be-tween the gut microflora of children with autistic spectrum disorders and that of healthy children. J Med Microbiol 2005;54(Pt 10):987–91.
584. Adams JB, Johansen LJ, Powell LD, Quig D, Rubin RA. Gastrointestinal flora and gastrointestinal status in children with autism – comparisons to typi-cal children and correlation with autism severity. BMC Gastroenterol 2011;11:22.
585. Wang L, Christophersen CT, Sorich MJ, Gerber JP, Angley MT, Conlon MA. Low relative abundances of the mucolytic bacterium Akkermansia mu-ciniphila and Bifidobacterium spp. in feces of children with autism. Appl Environ Microbiol 2011;77(18):6718–21.
586. Williams BL, Hornig M, Parekh T, Lipkin WI. Application of novel PCR-based methods for detection, quantitation, and phylogenetic characterization of Sutterella species in intestinal biopsy samples from children with autism and gastrointestinal disturbances. MBio 2012; 3(1):10.

158
587. Wang T, Cai G, Qiu Y, Fei N, Zhang M, Pang X, et al. Structural segregation of gut microbiota between colorectal cancer patients and healthy volun-teers. ISME Journal 2012;6(2):320–9.
588. Sobhani I, Tap J, Roudot-Thoraval F, Roperch JP, Letulle S, Langella P, et al. Microbial dysbiosis in colorectal cancer (CRC) patients. PLoS One 2011;6(1):e16393.
589. Kostic AD, Gevers D, Pedamallu CS, Michaud M, Duke F, Earl AM, et al. Genomic analysis identifies association of Fusobacterium with colorectal carcinoma. Genome Res 2012;22(2):292–8.
590. Marchesi JR, Dutilh BE, Hall N, Peters WH, Roelofs R, Boleij A, et al. Towards the human colorectal cancer microbiome. PLoS One 2011;6(5):e20447.
591. Sollid LM. Coeliac disease: dissecting a complex inflammatory disorder. Nat Rev Immunol 2002;2(9):647–55.
592. Decker E, Engelmann G, Findeisen A, Gerner P, Laass M, Ney D, et al. Ce-sarean delivery is associated with celiac disease but not inflammatory bowel disease in children. Pediatrics 2010;125(6):e1433–40.
593. Sanz Y, Sánchez E, Marzotto M, Calabuig M, Torriani S, Dellaglio F. Differ-ences in faecal bacterial communities in coeliac and healthy children as detected by PCR and denaturing gradient gel electrophoresis. FEMS Immunol Med Microbiol 2007;51(3):562–8.
594. Schippa S, Iebba V, Barbato M, Di Nardo G, Totino V, Checchi MP, et al. A distinctive 'microbial signature' in celiac pediatric patients. BMC Microbi-ology 2010;10.
595. Collado MC, Donat E, Ribes-Koninckx C, Calabuig M, Sanz Y. Imbalances in faecal and duodenal Bifidobacterium species composition in active and non-active coeliac disease. BMC Microbiol 2008;8:232.
596. Collado MC, Donat E, Ribes-Koninckx C, Calabuig M, Sanz Y. Specific duo-denal and faecal bacterial groups associated with paediatric coeliac dis-ease. J Clin Pathol 2009;62(3):264–9.
597. De Palma G, Nadal I, Medina M, Donat E, Ribes-Koninckx C, Calabuig M, et al. Intestinal dysbiosis and reduced immunoglobulin-coated bacteria as-sociated with coeliac disease in children. BMC Microbiology 2010;10.
598. Nadal I, Donat E, Ribes-Koninckx C, Calabuig M, Sanz Y. Imbalance in the composition of the duodenal microbiota of children with coeliac disease. J Med Microbiol 2007;56(Pt 12):1669–74.
159
599. Di Cagno R, Rizzello CG, Gagliardi F, Ricciuti P, Ndagijimana M, Francavilla R, et al. Different fecal microbiotas and volatile organic compounds in treat-ed and untreated children with celiac disease. Appl Environ Microbiol 2009;75(12):3963–71.
600. Di Cagno R, De Angelis M, De Pasquale I, Ndagijimana M, Vernocchi P, Ricciuti P, et al. Duodenal and faecal microbiota of celiac children: mo-lecular, phenotype and metabolome characterization. BMC Microbiol 2011;11:219.
601. De Palma G, Nadal I, Collado MC, Sanz Y. Effects of a gluten-free diet on gut microbiota and immune function in healthy adult human subjects. Br J Nutr 2009;102(8):1154–60.
602. Atlas RM. Cary–Blair transport medium. Handbook of Microbiological Media Boca Raton, FL, USA: CRC Press; 1997. p. 253.
603. Rams TE, Feik D, Slots J. Staphylococci in human periodontal diseases. Oral Microbiol Immunol 1990;5(1):29–32.
604. Beerens H. Detection of bifidobacteria by using propionic acid as a selective agent. Appl Environ Microbiol 1991;57(8):2418–9.
605. Alander M, Mättö J, Kneifel W, Johansson M, Kögler B, Crittenden R, et al. Effect of galacto-oligosaccharide supplementation on human faecal mi-croflora and on survival and persistence of Bifidobacterium lactis Bb-12 in the gastrointestinal tract. Int Dairy J 2001;11(10):817–25.
606. Folstein MF, Folstein SE, McHugh PR. "Mini-mental state". A practical meth-od for grading the cognitive state of patients for the clinician. J Psychiatr Res 1975;12(3):189–98.
607. Altschul SF, Gish W, Miller W, Myers EW, Lipman DJ. Basic local alignment search tool. J Mol Biol 1990;215(3):403–10.
608. Cole JR, Wang Q, Cardenas E, Fish J, Chai B, Farris RJ, et al. The Riboso-mal Database Project: Improved alignments and new tools for rRNA analysis. Nucleic Acids Res 2009;37(SUPPL. 1):D141–5.
609.. Amann RI, Binder BJ, Olson RJ, Chisholm SW, Devereux R, Stahl DA. Combination of 16S rRNA-targeted oligonucleotide probes with flow cy-tometry for analyzing mixed microbial populations. Appl Environ Microbiol 1990;56(6):1919–25.
610. Satokari RM, Vaughan EE, Akkermans ADL, Saarela M, De Vos WM. Poly-merase chain reaction and denaturing gradient gel electrophoresis moni-

160
toring of fecal Bifidobacterium populations in a prebiotic and probiotic feeding trial. Syst Appl Microbiol 2001;24(2):227–31.
611. Wilmotte A, Van Der Auwera G, De Wachter R. Structure of the 16S riboso-mal RNA of the thermophilic cyanobacterium Chlorogloeopsis HTF ('Mastigocladus laminosus HTF') strain PCC7518, and phylogenetic analysis. FEBS Lett 1993;317(1–2):96–100.
612. Stackebrandt E, Kramer I, Swiderski J, Hippe H. Phylogenetic basis for a taxonomic dissection of the genus Clostridium. FEMS Immunol Med Mi-crobiol 1999;24(3):253–8.
613. Madden JA, Hunter JO. A review of the role of the gut microflora in irritable bowel syndrome and the effects of probiotics. Br J Nutr 2002;88 Suppl 1:S67–72.
614. Bustin SA, Nolan T. Pitfalls of quantitative real-time reverse-transcription polymerase chain reaction. J Biomol Tech 2004;15(3):155–66.
615. Josephson KL, Gerba CP, Pepper IL. Polymerase chain reaction detection of nonviable bacterial pathogens. Appl Environ Microbiol 1993;59(10):3513–5.
616. Cotter PD, Stanton C, Ross RP, Hill C. The impact of antibiotics on the gut microbiota as revealed by high throughput DNA sequencing. Discov Med 2012;13(70):193–9.
617. Costello EK, Lauber CL, Hamady M, Fierer N, Gordon JI, Knight R. Bacterial community variation in human body habitats across space and time. Science 2009;326(5960):1694–7.
618. Martinez C, Antolin M, Santos J, Torrejon A, Casellas F, Borruel N, et al. Unstable composition of the fecal microbiota in ulcerative colitis during clinical remission. Am J Gastroenterol 2008; 103(3):643–8.
619. Harmsen HJ, Gibson GR, Elfferich P, Raangs GC, Wildeboer-Veloo AC, Argaiz A, et al. Comparison of viable cell counts and fluorescence in situ hybridization using specific rRNA-based probes for the quantification of human fecal bacteria. FEMS Microbiol Lett 2000;183(1):125–9.
620. Kleessen B, Schwarz S, Boehm A, Fuhrmann H, Richter A, Henle T, et al. Jerusalem artichoke and chicory inulin in bakery products affect faecal microbiota of healthy volunteers. Br J Nutr 2007;98(3):540–9.
621. Hayashi H, Sakamoto M, Kitahara M, Benno Y. Diversity of the Clostridium coccoides group in human fecal microbiota as determined by 16S rRNA gene library. FEMS Microbiol Lett 2006; 257(2):202–7.
161
622. Lauber CL, Zhou N, Gordon JI, Knight R, Fierer N. Effect of storage condi-tions on the assessment of bacterial community structure in soil and hu-man-associated samples. FEMS Microbiol Lett 2010;307(1):80–6.
623. Berg RD. The indigenous gastrointestinal microflora. Trends Microbiol 1996;4(11):430–5.
624. Thiel R, Blaut M. An improved method for the automated enumeration of fluorescently labelled bacteria in human faeces. J Microbiol Methods 2005;61(3):369–79.
625. Rasiah IA, Wong L, Anderson SA, Sissons CH. Variation in bacterial DGGE patterns from human saliva: over time, between individuals and in corre-sponding dental plaque microcosms. Arch Oral Biol 2005;50(9):779–87.
626. Downes J, Munson MA, Spratt DA, Könönen E, Tarkka E, Jousimies-Somer H, et al. Characterisation of Eubacterium-like strains isolated from oral in-fections. J Med Microbiol 2001;50(11):947–51.
627. Sanyal B, Russell C. Nonsporing, anaerobic, gram-positive rods in saliva and the gingival crevice of humans. Appl Environ Microbiol 1978;35(4):670–8.

ARTICLE I
Prevalence and temporal stability of selected clostridial
groups in irritable bowel syndrome in relation to
predominant faecal bacteria
In: Journal of Medical Microbiology, 55, pp. 625–633.
Copyright 2006 SGM.Reprinted with permission from the publisher.

I/1
Prevalence and temporal stability of selectedclostridial groups in irritable bowel syndrome inrelation to predominant faecal bacteria
Johanna Maukonen,1 Reetta Satokari,1 Jaana Matto,1 Hans Soderlund,1
Tiina Mattila-Sandholm2 and Maria Saarela1
Correspondence
Johanna Maukonen
1VTT Biotechnology, PO Box 1000 (Tietotie 2), FIN-02044 VTT, Finland
2Valio Ltd, PO Box 30, FIN-00039 Valio, Finland
Received 21 April 2005
Accepted 26 January 2006
The differences in faecal bacterial population between irritable bowel syndrome (IBS) and control
subjects have been reported in several studies. The aim of the present study was to compare the
predominant and clostridial faecal microbiota of IBS subjects and healthy controls by applying
denaturing gradient gel electrophoresis (DGGE) and a recently developed multiplexed and
quantitative hybridization-based technique, transcript analysis with the aid of affinity capture
(TRAC). According to the results, the studied clostridial groups (Clostridium histolyticum,
Clostridium coccoides-Eubacterium rectale, Clostridium lituseburense and Clostridium leptum)
represented the dominant faecal microbiota of most of the studied subjects, comprising altogether
29–87% of the total bacteria as determined by the hybridized 16S rRNA. The C. coccoides-E.
rectale group was the dominant subgroup of clostridia, contributing a mean of 43% of the total
bacteria in control subjects and 30% (constipation type) to 50% (diarrhoea type) in different IBS
symptom category subjects. The proportion of the C. coccoides-E. rectale group was found to
be significantly lower in the constipation-type IBS subjects than in the control subjects. DNA-based
PCR-DGGE and RNA-based RT-PCR-DGGE analyses targeted to the predominant bacterial
population showed considerable biodiversity as well as uniqueness of the microbiota in each
subject, in both control and IBS subject groups. The RT-PCR-DGGE profiles of the IBS subjects
further indicated higher instability of the bacterial population compared to the control subjects. The
observations suggest that clostridial microbiota, in addition to the instability of the active
predominant faecal bacterial population, may be involved in IBS.
INTRODUCTION
The composition of the resident intestinal microbiota variesbetween individuals, and the predominant population isfairly stable under normal conditions (Zoetendal et al., 1998;Harmsen et al., 2002a; Vanhoutte et al., 2004; Matto et al.,2005). However, several factors, such as antibiotic therapy,ageing and disease, may cause disturbances in the intestinalbalance. Transient disturbance of the intestinal microbiotaduring antibiotic therapy has been shown in several studies(Edlund &Nord, 2000; Donskey et al., 2003). Changes in theintestinal microbiota have also been suggested to occur incertain intestinal diseases and disorders, such as inflamma-tory bowel disease (IBD) (Seksik et al., 2003) and irritablebowel syndrome (IBS) (Madden & Hunter, 2002). IBS isan intestinal disorder that involves continuous or recur-rent intestinal pain or discomfort that is relieved during
defecation. In addition, IBS symptoms include bloating,altered stool frequency, form or passage, and passage ofmucus (Thompson et al., 1999). The existence of abnormalcolonic fermentation in IBS (King et al., 1998) and allevia-tion of IBS symptoms by eradication of small intestinalbacterial overgrowth by antibiotic therapy (Pimentel et al.,2000), suggest that the intestinal microbiota has a role inIBS. Some studies have reported differences in the faecal bac-terial population between IBS and control subjects (Balsariet al., 1982; Bradley et al., 1987; Madden & Hunter, 2002;Matto et al., 2005;Malinen et al., 2005). However, the resultsobtained in earlier studies are partly contradictory, and withthe exception of those of Matto et al. (2005) and Malinenet al. (2005), are based on the culture-based analysis of themicrobiota. Therefore, the role of intestinal microbiota inIBS is still poorly known. Since IBS is often linked withextensive gas production in the colon (King et al., 1998),and some bacterial groups are more prone to gas produc-tion than others (Cato et al., 1986), the possible role ofthe composition and/or activity of clostridia and relatedbacteria in intestinal (im)balance warrants further study.
Abbreviations: DGGE, denaturing gradient gel electrophoresis; IBD,inflammatory bowel disease; IBS, irritable bowel syndrome; TRAC,transcript analysis with the aid of affinity capture.
46134 G 2006 SGM Printed in Great Britain 625
Journal of Medical Microbiology (2006), 55, 625–633 DOI 10.1099/jmm.0.46134-0
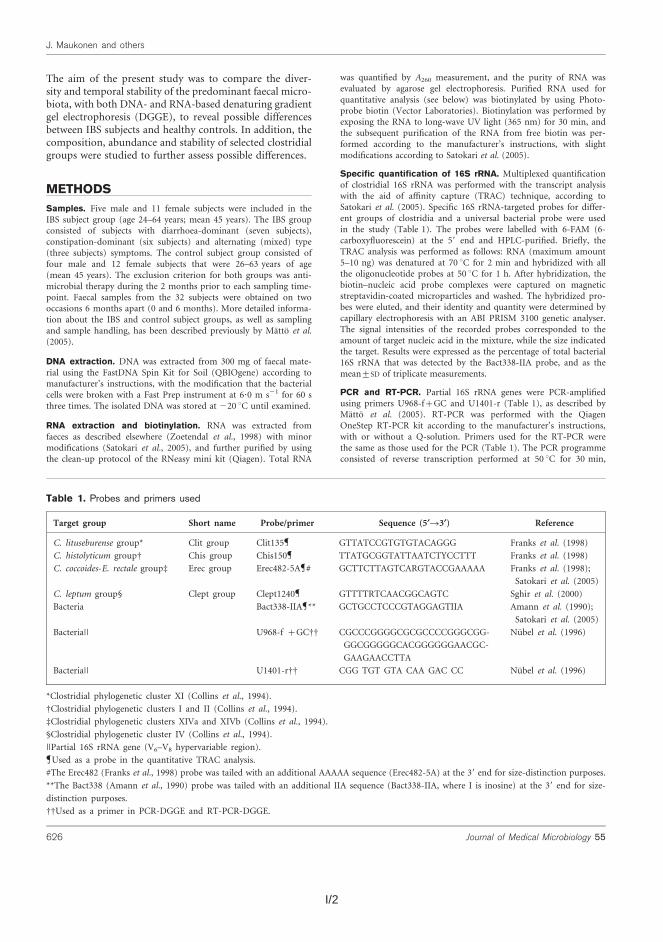
I/2 I/3
followed by denaturation at 95 uC for 15 min. Thereafter, the RT-PCR programme was similar to the PCR programme: 35 cycles ofdenaturing at 94 uC for 30 s, primer annealing at 50 uC for 20 s andelongation at 72 uC for 40 s, and final extension for 10 min at 72 uC.
DGGE analysis of 16S rDNA fragments. DGGE analysis wasperformed as described by Matto et al. (2005). The similarity of thePCR-DGGE profiles of the samples obtained from a single subject atdifferent time-points was compared to evaluate the temporal stabi-lity of the predominant faecal bacterial population. The comparisonof the profiles was performed by visual inspection of the gels bytwo researchers and by calculating the similarity percentage usingBioNumerics software version 3.0 (Applied Maths BVBA). Clus-tering was performed with Pearson correlation and the unweightedpair group method with arithmetic mean (UPGMA). Ampliconswith a total surface area of at least 1% were included in the similar-ity analysis. Similarity value thresholds indicating stable, ratherstable and unstable DGGE profiles were determined according to thevisual inspection. A DGGE profile was defined as stable if profiles atdifferent time-points were identical (had the same amplicons andno/minor intensity differences), rather stable if they were similar(had differences in presence and intensity of few amplicons), andunstable if the profiles were different (had differences in presenceand intensity of several amplicons). Similarity value thresholds forRNA-based and DNA-based profiles were determined separately.
Statistical analysis. The mean and standard deviation were calcu-lated for each experiment. Student’s t test (two-sample assumingunequal variances) was used for the statistical analysis of the results.
RESULTS AND DISCUSSION
In this study, the predominant and clostridial faecal micro-biota of IBS subjects and healthy controls were compared toreveal possible differences in the composition, abundanceand stability of selected groups. Matto et al. (2005) haveshown by DNA-based analysis that IBS subjects have moreinstability in their predominant faecal microbiota thanhealthy controls. We broadened the study by examiningwhether the instability which was seen in the DNA-basedanalysis could also be seen in RNA-based analyses, bothpredominant microbiota and clostridia-targeted. In addi-tion to stability, the composition and abundance of theselected clostridial groups were studied. Clostridia wereselected as a target group in this study, since disturbedmeta-bolism of intestinal gases, as well as increased sensitivity ofthe colon, has been associated with IBS symptoms (Kinget al., 1998). Since clostridia are able to produce gas, theymay play a role in IBS symptoms (Cato et al., 1986).
Temporal stability of predominant bacterialpopulations
The temporal intraindividual stability of the predomi-nant bacteria was studied with DNA-based PCR-DGGEand RNA-based RT-PCR-DGGE to determine whether thestability/instability of clostridial populations correspondedwith the stability/instability of the predominant bacterialpopulation, and if any differences could be observedbetween control and IBS subjects (Fig. 1). DNA-based PCR-DGGE and RNA-based RT-PCR-DGGE analyses targetedto the predominant bacterial population showed consider-able intraindividual biodiversity, as well as uniqueness of
the faecal microbiota in both control and IBS subject groupsin this study. PCR-DGGE and RT-PCR-DGGE analysis withuniversal bacterial primers did not reveal any IBS-specificamplicons. PCR-DGGE and RT-PCR-DGGE profiles wereheterogeneous, containing about 20–30 and 15–25 amp-licons, respectively. The RT-PCR-DGGE profiles of IBSsubjects (16±5 amplicons) and control subjects (16±4amplicons) contained significantly fewer amplicons than thePCR-DGGE profiles (IBS subjects, 21±5 amplicons; controlsubjects, 23±5 amplicons) (P <0?05; Fig. 1). There weredifferences in all parts of the denaturing gradient. Someamplicons were more prominent in the RNA-derived profilethan in the DNA-derived profile, and vice versa. In addition,some bands were missing from the RNA-derived pro-files and some from the DNA-derived profiles. Furthermore,the amplicons with the highest GC content (migrating tothe lower part of the DGGE gel) were mostly missing inthe RT-PCR-DGGE profiles (Fig. 1). The clear differencebetween the DNA- and RNA-derived predominant faecalbacterial populations has also been reported by Tannocket al. (2004). The differences between the DNA- and RNA-derived profiles may be due to several reasons. The resolvingpower of RT-PCR is limited by the efficiency of RNA-to-cDNA conversion (Bustin & Nolan, 2004). In addition,DNA obtained from complex samples does not reflectmetabolic activity (Josephson et al., 1993), whereas rRNA isregarded as an indicator of total bacterial activity (Felskeet al., 1997). Therefore, the amplicons that are missing from
D1 R1 R2 D2 D2D1 R1 R2 D2D1 R1 R2IBS 2 IBS 16 Control 2
Fig. 1. Comparison of DNA-based PCR-DGGE and RNA-basedRT-PCR-DGGE profiles during a 6 month time-period for twoIBS subjects and one control subject. Lanes D1 correspond toDNA-based DGGE profiles at baseline, lanes R1 to RNA-basedDGGE profiles at baseline, lanes R2 to RNA-based DGGE pro-files 6 months later and lanes D2 to DNA-based DGGE profiles6 months later. The panels are from different individuals with IBS(IBS2 and IBS16) and from a healthy control (Control 2).
http://jmm.sgmjournals.org 627
Clostridial and predominant faecal bacteria in IBS
The aim of the present study was to compare the diver-sity and temporal stability of the predominant faecal micro-biota, with both DNA- and RNA-based denaturing gradientgel electrophoresis (DGGE), to reveal possible differencesbetween IBS subjects and healthy controls. In addition, thecomposition, abundance and stability of selected clostridialgroups were studied to further assess possible differences.
METHODS
Samples. Five male and 11 female subjects were included in theIBS subject group (age 24–64 years; mean 45 years). The IBS groupconsisted of subjects with diarrhoea-dominant (seven subjects),constipation-dominant (six subjects) and alternating (mixed) type(three subjects) symptoms. The control subject group consisted offour male and 12 female subjects that were 26–63 years of age(mean 45 years). The exclusion criterion for both groups was anti-microbial therapy during the 2 months prior to each sampling time-point. Faecal samples from the 32 subjects were obtained on twooccasions 6 months apart (0 and 6 months). More detailed informa-tion about the IBS and control subject groups, as well as samplingand sample handling, has been described previously by Matto et al.(2005).
DNA extraction. DNA was extracted from 300 mg of faecal mate-rial using the FastDNA Spin Kit for Soil (QBIOgene) according tomanufacturer’s instructions, with the modification that the bacterialcells were broken with a Fast Prep instrument at 6?0 m s21 for 60 sthree times. The isolated DNA was stored at 220 uC until examined.
RNA extraction and biotinylation. RNA was extracted fromfaeces as described elsewhere (Zoetendal et al., 1998) with minormodifications (Satokari et al., 2005), and further purified by usingthe clean-up protocol of the RNeasy mini kit (Qiagen). Total RNA
was quantified by A260 measurement, and the purity of RNA wasevaluated by agarose gel electrophoresis. Purified RNA used forquantitative analysis (see below) was biotinylated by using Photo-probe biotin (Vector Laboratories). Biotinylation was performed byexposing the RNA to long-wave UV light (365 nm) for 30 min, andthe subsequent purification of the RNA from free biotin was per-formed according to the manufacturer’s instructions, with slightmodifications according to Satokari et al. (2005).
Specific quantification of 16S rRNA. Multiplexed quantificationof clostridial 16S rRNA was performed with the transcript analysiswith the aid of affinity capture (TRAC) technique, according toSatokari et al. (2005). Specific 16S rRNA-targeted probes for differ-ent groups of clostridia and a universal bacterial probe were usedin the study (Table 1). The probes were labelled with 6-FAM (6-carboxyfluorescein) at the 59 end and HPLC-purified. Briefly, theTRAC analysis was performed as follows: RNA (maximum amount5–10 ng) was denatured at 70 uC for 2 min and hybridized with allthe oligonucleotide probes at 50 uC for 1 h. After hybridization, thebiotin–nucleic acid probe complexes were captured on magneticstreptavidin-coated microparticles and washed. The hybridized pro-bes were eluted, and their identity and quantity were determined bycapillary electrophoresis with an ABI PRISM 3100 genetic analyser.The signal intensities of the recorded probes corresponded to theamount of target nucleic acid in the mixture, while the size indicatedthe target. Results were expressed as the percentage of total bacterial16S rRNA that was detected by the Bact338-IIA probe, and as themean±SD of triplicate measurements.
PCR and RT-PCR. Partial 16S rRNA genes were PCR-amplifiedusing primers U968-f+GC and U1401-r (Table 1), as described byMatto et al. (2005). RT-PCR was performed with the QiagenOneStep RT-PCR kit according to the manufacturer’s instructions,with or without a Q-solution. Primers used for the RT-PCR werethe same as those used for the PCR (Table 1). The PCR programmeconsisted of reverse transcription performed at 50 uC for 30 min,
Table 1. Probes and primers used
Target group Short name Probe/primer Sequence (5§R3§) Reference
C. lituseburense group* Clit group Clit135 GTTATCCGTGTGTACAGGG Franks et al. (1998)
C. histolyticum groupD Chis group Chis150 TTATGCGGTATTAATCTYCCTTT Franks et al. (1998)
C. coccoides-E. rectale groupd Erec group Erec482-5A # GCTTCTTAGTCARGTACCGAAAAA Franks et al. (1998);
Satokari et al. (2005)
C. leptum group§ Clept group Clept1240 GTTTTRTCAACGGCAGTC Sghir et al. (2000)
Bacteria Bact338-IIA ** GCTGCCTCCCGTAGGAGTIIA Amann et al. (1990);
Satokari et al. (2005)
Bacteria|| U968-f +GCDD CGCCCGGGGCGCGCCCCGGGCGG-
GGCGGGGGCACGGGGGGAACGC-
GAAGAACCTTA
Nubel et al. (1996)
Bacteria|| U1401-rDD CGG TGT GTA CAA GAC CC Nubel et al. (1996)
*Clostridial phylogenetic cluster XI (Collins et al., 1994).
DClostridial phylogenetic clusters I and II (Collins et al., 1994).
dClostridial phylogenetic clusters XIVa and XIVb (Collins et al., 1994).
§Clostridial phylogenetic cluster IV (Collins et al., 1994).
||Partial 16S rRNA gene (V6–V8 hypervariable region).
Used as a probe in the quantitative TRAC analysis.
#The Erec482 (Franks et al., 1998) probe was tailed with an additional AAAAA sequence (Erec482-5A) at the 39 end for size-distinction purposes.
**The Bact338 (Amann et al., 1990) probe was tailed with an additional IIA sequence (Bact338-IIA, where I is inosine) at the 39 end for size-
distinction purposes.
DDUsed as a primer in PCR-DGGE and RT-PCR-DGGE.
626 Journal of Medical Microbiology 55
J. Maukonen and others
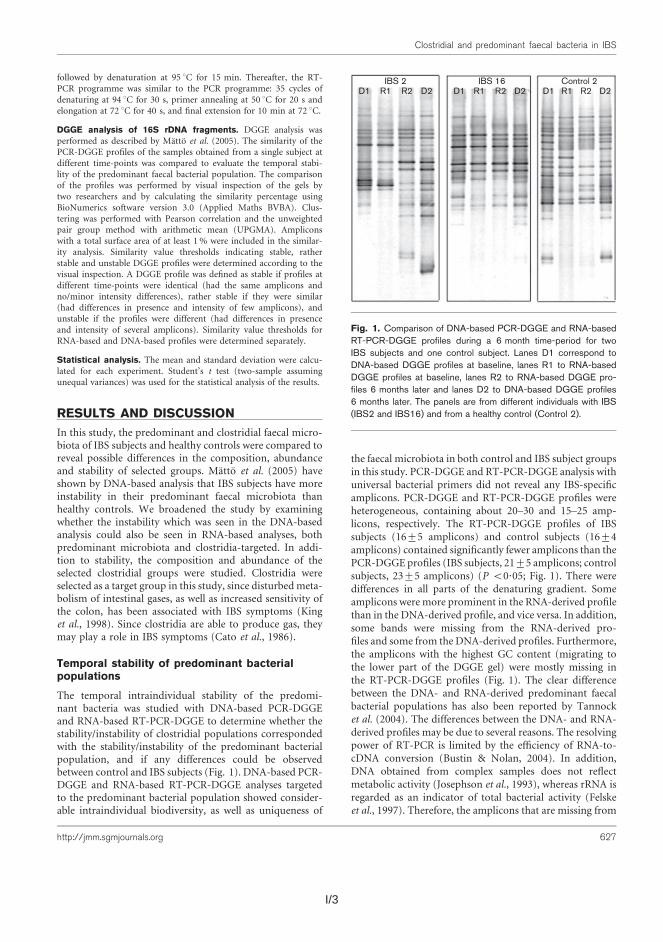
I/3
followed by denaturation at 95 uC for 15 min. Thereafter, the RT-PCR programme was similar to the PCR programme: 35 cycles ofdenaturing at 94 uC for 30 s, primer annealing at 50 uC for 20 s andelongation at 72 uC for 40 s, and final extension for 10 min at 72 uC.
DGGE analysis of 16S rDNA fragments. DGGE analysis wasperformed as described by Matto et al. (2005). The similarity of thePCR-DGGE profiles of the samples obtained from a single subject atdifferent time-points was compared to evaluate the temporal stabi-lity of the predominant faecal bacterial population. The comparisonof the profiles was performed by visual inspection of the gels bytwo researchers and by calculating the similarity percentage usingBioNumerics software version 3.0 (Applied Maths BVBA). Clus-tering was performed with Pearson correlation and the unweightedpair group method with arithmetic mean (UPGMA). Ampliconswith a total surface area of at least 1% were included in the similar-ity analysis. Similarity value thresholds indicating stable, ratherstable and unstable DGGE profiles were determined according to thevisual inspection. A DGGE profile was defined as stable if profiles atdifferent time-points were identical (had the same amplicons andno/minor intensity differences), rather stable if they were similar(had differences in presence and intensity of few amplicons), andunstable if the profiles were different (had differences in presenceand intensity of several amplicons). Similarity value thresholds forRNA-based and DNA-based profiles were determined separately.
Statistical analysis. The mean and standard deviation were calcu-lated for each experiment. Student’s t test (two-sample assumingunequal variances) was used for the statistical analysis of the results.
RESULTS AND DISCUSSION
In this study, the predominant and clostridial faecal micro-biota of IBS subjects and healthy controls were compared toreveal possible differences in the composition, abundanceand stability of selected groups. Matto et al. (2005) haveshown by DNA-based analysis that IBS subjects have moreinstability in their predominant faecal microbiota thanhealthy controls. We broadened the study by examiningwhether the instability which was seen in the DNA-basedanalysis could also be seen in RNA-based analyses, bothpredominant microbiota and clostridia-targeted. In addi-tion to stability, the composition and abundance of theselected clostridial groups were studied. Clostridia wereselected as a target group in this study, since disturbedmeta-bolism of intestinal gases, as well as increased sensitivity ofthe colon, has been associated with IBS symptoms (Kinget al., 1998). Since clostridia are able to produce gas, theymay play a role in IBS symptoms (Cato et al., 1986).
Temporal stability of predominant bacterialpopulations
The temporal intraindividual stability of the predomi-nant bacteria was studied with DNA-based PCR-DGGEand RNA-based RT-PCR-DGGE to determine whether thestability/instability of clostridial populations correspondedwith the stability/instability of the predominant bacterialpopulation, and if any differences could be observedbetween control and IBS subjects (Fig. 1). DNA-based PCR-DGGE and RNA-based RT-PCR-DGGE analyses targetedto the predominant bacterial population showed consider-able intraindividual biodiversity, as well as uniqueness of
the faecal microbiota in both control and IBS subject groupsin this study. PCR-DGGE and RT-PCR-DGGE analysis withuniversal bacterial primers did not reveal any IBS-specificamplicons. PCR-DGGE and RT-PCR-DGGE profiles wereheterogeneous, containing about 20–30 and 15–25 amp-licons, respectively. The RT-PCR-DGGE profiles of IBSsubjects (16±5 amplicons) and control subjects (16±4amplicons) contained significantly fewer amplicons than thePCR-DGGE profiles (IBS subjects, 21±5 amplicons; controlsubjects, 23±5 amplicons) (P <0?05; Fig. 1). There weredifferences in all parts of the denaturing gradient. Someamplicons were more prominent in the RNA-derived profilethan in the DNA-derived profile, and vice versa. In addition,some bands were missing from the RNA-derived pro-files and some from the DNA-derived profiles. Furthermore,the amplicons with the highest GC content (migrating tothe lower part of the DGGE gel) were mostly missing inthe RT-PCR-DGGE profiles (Fig. 1). The clear differencebetween the DNA- and RNA-derived predominant faecalbacterial populations has also been reported by Tannocket al. (2004). The differences between the DNA- and RNA-derived profiles may be due to several reasons. The resolvingpower of RT-PCR is limited by the efficiency of RNA-to-cDNA conversion (Bustin & Nolan, 2004). In addition,DNA obtained from complex samples does not reflectmetabolic activity (Josephson et al., 1993), whereas rRNA isregarded as an indicator of total bacterial activity (Felskeet al., 1997). Therefore, the amplicons that are missing from
D1 R1 R2 D2 D2D1 R1 R2 D2D1 R1 R2IBS 2 IBS 16 Control 2
Fig. 1. Comparison of DNA-based PCR-DGGE and RNA-basedRT-PCR-DGGE profiles during a 6 month time-period for twoIBS subjects and one control subject. Lanes D1 correspond toDNA-based DGGE profiles at baseline, lanes R1 to RNA-basedDGGE profiles at baseline, lanes R2 to RNA-based DGGE pro-files 6 months later and lanes D2 to DNA-based DGGE profiles6 months later. The panels are from different individuals with IBS(IBS2 and IBS16) and from a healthy control (Control 2).
http://jmm.sgmjournals.org 627
Clostridial and predominant faecal bacteria in IBS
I/4 I/5
Table 2. Similarity values of DGGE profiles of a given subject obtained at two different time-points (baseline and 6 monthslater)
The values are grouped according to the RNA similarity/stability. Abbreviations: S, stable; R, rather stable; U, unstable.
Subject Qualitative DGGE analysis Quantitative
Dclostridia (%)D,
1 versus 2RNA-based similarity*,
1 versus 2
DNA-based similarity*,
1 versus 2
Similarity
(%)*, RNA1
versus DNA1
Similarity
(%)*, RNA2
versus DNA2
IBS subjects, diarrhoea type
IBS 1 94?2% Sd§ 91?9% Rd|| 83?2 88?6 6?7
IBS 2 38?5% U 44?6% U 88?3 59?5 50?2
IBS 8 81?0% R 92?0% R 76?8 74?1 9?0
IBS 13 50?1% U 87?7% R 67?7 70?8 5?1
IBS 14 59?9% U 74?4% U 56?0 81?9 15?5
IBS 15 89?6% R 90?1% R 77?0 89?0 15?3
IBS 16 92?5% S 95?1% S 84?4 89?2 3?3
Mean±SD 72?3±22?6 82?3±17?9 76?2±11?1 79?0±11?4 15?0±16?2
Range 38?5–94?2 44?6–95?1 56?0–88?3 59?5–89?2 3?3–50?2
IBS subjects, constipation type
IBS 3 43?1% U 68?0% U 75?3 84?8 22?3
IBS 4 80?5% R 84?3% R 70?6 76?4 8?0
IBS 5 79?0% R 81?3% R 72?0 78?8 0?5
IBS 6 93?4% S 89?4% R 70?4 62?9 11?1
IBS 9 66?1% U 81?8% R 56?2 59?4 28?9
IBS 11 2 83?1% R 65?0 2 6?9
Mean±SD 72?4±19?0 81?3±7?1 68?3±6?8 72?5±10?8 13?0±10?6
Range 43?1–93?4 68?0–89?4 56?2–75?3 59?4–84?8 0?5–28?9
IBS subjects, mixed type
IBS 7 94?5% S 85?7% R 70?6 69?4 8?0
IBS 10 80?6% R 88?0% R 89?5 80?7 11?7
IBS 12 83?2% R 87?7% R 66?8 63?4 20?2
Mean±SD 86?1±7?4 87?1±1?3 75?6±12?2 71?1±8?8 13?3±6?3
Range 85?7–88?0 85?7–88?0 66?8–89?5 63?4–80?7 8?0–20?2
All IBS subjects together
Mean±SD 75?1±19?0 82?8±12?3 73?1±10?0 75?3±10?7 13?9±12?2
Range 38?5–94?5 44?6–95?1 56?0–89?5 59?4–89?2 0?5–50?2
Control subjects
Control 1 85?9% R 88?8% R 75?1 70?7 13?0
Control 2 66?0% U 91?3% R 73?2 64?6 29?8
Control 3 87?8% R 90?0% R 85?9 84?7 42?0
Control 4 92?9% S 86?7% R 83?6 86?4 10?5
Control 5 72?2% R 90?1% R 88?7 75?3 8?6
Control 6 94?2% S 88?4% R 81?4 72?0 7?3
Control 7 91?6% R 58?8% U 42?4 68?1 18?8
Control 8 69?4% U 63?0% U 76?5 73?4 10?1
Control 9 85?5% R 96?3% S 56?9 54?2 8?8
Control 10# 2# 64?1% U 66?9 2# 2#
Control 11 90?7% R 92?2% S 82?3 80?8 25?1
Control 12 92?4% S 90?4% R 56?1 64?8 5?7
Control 13 92?3% S 84?6% R 88?2 86?1 1?8
Control 14 69?9% U 96?7% S 61?9 76?7 14?1
Control 15 68?2% U 90?2% R 72?8 81?5 8?7
Control 16 92?4% S 85?4% R 31?1 42?4 4?8
Mean±SD 83?4±10?8 84?8±11?8 70?2±16?7 72?1±12?2 13?9±10?8
Range 68?2–94?2 58?8–96?7 31?1–88?7 42?4–86?4 1?8–42?0
http://jmm.sgmjournals.org 629
Clostridial and predominant faecal bacteria in IBS
the RNA-derived profiles may reflect a low activity in thatpart of the faecal microbiota.
When DGGE profiles derived from faecal RNA ampliconswere compared to the DGGE profiles derived from faecalDNA amplicons in this study, the temporal intraindivi-dual similarity values of RT-PCR-DGGE and PCR-DGGEprofiles were significantly higher than the intraindividualsimilarity values between DNA- and RNA-based DGGEprofiles at a given time-point in nearly all cases (P <0?05;Table 2). However, since each individual had unique PCR-DGGE and RT-PCR-DGGE profiles, the intraindividualRNA- and DNA-based DGGE profiles resembled each othermore than the interindividual RNA-based profiles (Fig. 1).In the present study, the assessment of temporal stability ofthe predominant microbiota with DNA-based PCR-DGGEdid not reveal more instability in the IBS subjects than in thecontrol group subjects (Table 2), contrary to the findings ofMatto et al. (2005). However, less similarity (i.e. moreinstability) was observed in the DGGE profiles derived fromfaecal RNA amplicons of the IBS subjects than the controlsubjects (Table 2). In addition, the similarity value range ofRNA-derived DGGE profiles of IBS subjects was muchlarger than that of the control subjects (Table 2). The maindifference between the study group of Matto et al. (2005)and the study group in this study was that we did not includesubjects who had received antimicrobial therapy during the2 months prior to the two sampling time-points, sinceantibiotic therapy can cause disturbances in the intestinalmicrobiota (Edlund & Nord, 2000; Donskey et al., 2003),and may also affect the predominant bacterial groups(Bartosch et al., 2004). Under normal circumstances, thepredominant intestinal microbiota of an adult individualhas been reported to be fairly stable (Zoetendal et al., 1998,2001; Seksik et al., 2003; Vanhoutte et al., 2004). Theeffect of disease on the stability of intestinal microbiota isclearly seen in the study of Seksik et al. (2003), in which amarked instability of the predominant faecal microbiotawas observed in four IBD patients. In our study, temporalinstability was observed in both IBS and control subjects(with both DNA- and RNA-based DGGE). In previousstudies in which the long-term temporal stability of thepredominant microbiota from healthy subjects has beenassessed, the number of subjects has been limited (one tofour individuals) (Zoetendal et al., 1998, 2001; Seksik et al.,2003; Vanhoutte et al., 2004).
The intraindividual similarity values of PCR-DGGE andRT-PCR-DGGE profiles of IBS subjects between time-points 1 (baseline) and 2 (6 months) varied between 45 and95%, and between 39 and 95%, respectively, whereas thesimilarity values of control subjects varied between 59 and97%, and between 68 and 94%, respectively (Table 2).When IBS patients were divided into subgroups accordingto their symptoms in our study, the greatest intraindivi-dual variability in DGGE similarity values within the sub-ject group was seen in the diarrhoea-type subgroup andthe smallest in the mixed-type subgroup (Table 2). The
great intraindividual variation seen in the diarrhoea-typesubgroup might be due to different phases of the syndrome.If a patient is experiencing a more symptomatic phase ofIBS, the predominant bacterial population might be signi-ficantly different to that when symptom-free, in a similarmanner to observations for IBD patients (Seksik et al.,2003). However, we did not have data on the symptomaticactivity of each IBS subject, so this conclusion remains spe-culative. Further studies are needed to assess the influenceof the more symptomatic phase of the syndrome on thestability of the faecal microbiota. The smallest intraindivi-dual variability in our study, shown by the mixed-typesubject group, is at least partly explained by the smallnumber of subjects (three), so further studies are neededwith larger patient groups.
Proportion of clostridia
In the present study, the recently developed TRAC techni-que (Satokari et al., 2005) allowed the multiplexed quan-tification of the clostridial groups. The sensitivity of thetechnique allows as little as 0?05 ng of total RNA to bedetected, but the quantification of proportions is limitedby the dynamic range of measurement. In practice, it isfeasible to measure 100–200-fold differences in the amountsof individual target RNAs (Satokari et al., 2005). Accordingto our results, the studied clostridial groups [Clostridium.histolyticum (probe Chis150), Clostridium coccoides-Eubacterium rectale (probe Erec482), Clostridium litusebur-ense (probe Clit135) and Clostridium leptum (probeClept1240) groups] represented the dominant faecal micro-biota in most of the studied subjects (26 out of 32 subjects,including both IBS and control subjects), contributingaltogether 29–87%, as determined by the hybridized 16SrRNA (Table 3). This is in agreement with other studies,where several clostridial groups have been studied fromclone libraries of adult faecal samples (Wilson &Blitchington, 1996; Suau et al., 1999; Hayshi et al., 2002;Mangin et al., 2004). The proportion of each studiedclostridial group showed marked interindividual variation(Table 3).
There were only small differences in the proportions of theC. leptum, C. lituseburense and C. histolyticum groupsbetween IBS and control subjects (Table 3). It has beenreported that the C. lituseburense and C. histolyticum groupscontribute less than 1% of the total faecal microbiota ofhealthy adults (Franks et al., 1998; Harmsen et al., 1999).Our results for the C. lituseburense group (mean 1?5 and2?3%, for the baseline and 6 month samples, respectively)were thus in accordance with the results reported elsewhere.However, we found that the members of the C. histolyticumgroups contributed a mean of 7?4 and 5?5% (for baselineand 6 month samples, respectively) of the faecal bacterialmicrobiota of the 16 healthy control subjects, and 6?2 and6?5% (for baseline and 6 month samples, respectively) ofthe faecal microbiota of the IBS subjects. Satokari et al.(2005) note in their study that the Chis150 probe and assayconditions employed give approximately 3% background
628 Journal of Medical Microbiology 55
J. Maukonen and others

I/5
Table 2. Similarity values of DGGE profiles of a given subject obtained at two different time-points (baseline and 6 monthslater)
The values are grouped according to the RNA similarity/stability. Abbreviations: S, stable; R, rather stable; U, unstable.
Subject Qualitative DGGE analysis Quantitative
Dclostridia (%)D,
1 versus 2RNA-based similarity*,
1 versus 2
DNA-based similarity*,
1 versus 2
Similarity
(%)*, RNA1
versus DNA1
Similarity
(%)*, RNA2
versus DNA2
IBS subjects, diarrhoea type
IBS 1 94?2% Sd§ 91?9% Rd|| 83?2 88?6 6?7
IBS 2 38?5% U 44?6% U 88?3 59?5 50?2
IBS 8 81?0% R 92?0% R 76?8 74?1 9?0
IBS 13 50?1% U 87?7% R 67?7 70?8 5?1
IBS 14 59?9% U 74?4% U 56?0 81?9 15?5
IBS 15 89?6% R 90?1% R 77?0 89?0 15?3
IBS 16 92?5% S 95?1% S 84?4 89?2 3?3
Mean±SD 72?3±22?6 82?3±17?9 76?2±11?1 79?0±11?4 15?0±16?2
Range 38?5–94?2 44?6–95?1 56?0–88?3 59?5–89?2 3?3–50?2
IBS subjects, constipation type
IBS 3 43?1% U 68?0% U 75?3 84?8 22?3
IBS 4 80?5% R 84?3% R 70?6 76?4 8?0
IBS 5 79?0% R 81?3% R 72?0 78?8 0?5
IBS 6 93?4% S 89?4% R 70?4 62?9 11?1
IBS 9 66?1% U 81?8% R 56?2 59?4 28?9
IBS 11 2 83?1% R 65?0 2 6?9
Mean±SD 72?4±19?0 81?3±7?1 68?3±6?8 72?5±10?8 13?0±10?6
Range 43?1–93?4 68?0–89?4 56?2–75?3 59?4–84?8 0?5–28?9
IBS subjects, mixed type
IBS 7 94?5% S 85?7% R 70?6 69?4 8?0
IBS 10 80?6% R 88?0% R 89?5 80?7 11?7
IBS 12 83?2% R 87?7% R 66?8 63?4 20?2
Mean±SD 86?1±7?4 87?1±1?3 75?6±12?2 71?1±8?8 13?3±6?3
Range 85?7–88?0 85?7–88?0 66?8–89?5 63?4–80?7 8?0–20?2
All IBS subjects together
Mean±SD 75?1±19?0 82?8±12?3 73?1±10?0 75?3±10?7 13?9±12?2
Range 38?5–94?5 44?6–95?1 56?0–89?5 59?4–89?2 0?5–50?2
Control subjects
Control 1 85?9% R 88?8% R 75?1 70?7 13?0
Control 2 66?0% U 91?3% R 73?2 64?6 29?8
Control 3 87?8% R 90?0% R 85?9 84?7 42?0
Control 4 92?9% S 86?7% R 83?6 86?4 10?5
Control 5 72?2% R 90?1% R 88?7 75?3 8?6
Control 6 94?2% S 88?4% R 81?4 72?0 7?3
Control 7 91?6% R 58?8% U 42?4 68?1 18?8
Control 8 69?4% U 63?0% U 76?5 73?4 10?1
Control 9 85?5% R 96?3% S 56?9 54?2 8?8
Control 10# 2# 64?1% U 66?9 2# 2#
Control 11 90?7% R 92?2% S 82?3 80?8 25?1
Control 12 92?4% S 90?4% R 56?1 64?8 5?7
Control 13 92?3% S 84?6% R 88?2 86?1 1?8
Control 14 69?9% U 96?7% S 61?9 76?7 14?1
Control 15 68?2% U 90?2% R 72?8 81?5 8?7
Control 16 92?4% S 85?4% R 31?1 42?4 4?8
Mean±SD 83?4±10?8 84?8±11?8 70?2±16?7 72?1±12?2 13?9±10?8
Range 68?2–94?2 58?8–96?7 31?1–88?7 42?4–86?4 1?8–42?0
http://jmm.sgmjournals.org 629
Clostridial and predominant faecal bacteria in IBS

I/6 I/7
control subjects (P=0?05) (Table 3). Altogether, there wasmostly smaller temporal variation in the studied clostridialgroups than interindividual variation, and this has also been
reported byMatsuki et al. (2004). However, the instability ofpredominant bacteria was also seen in the change of theproportions of the studied clostridial groups (Tables 2 and
Table 3. Proportions of studied groups of clostridia, as quantified with the TRAC technique from faecal samples of IBS sub-jects and control subjects on two sampling occasions
See Table 1 for meanings of abbreviations. Values show the percentage of the hybridized total bacteria (with Bact338-IIA probe), mean±SD.
Values in bold type show a statistically significant difference (P <0?05) compared to the control subject group.
Group (number of subjects) Probe
Clept1240* Clit135D Chis150d Erec482§
Baseline 6 months Baseline 6 months Baseline 6 months Baseline 6 months
Diarrhoea type (7)
Proportion 11?0±4?7 14?0±4?3 1?1±2?1 0?4±0?4 6?7±1?5 5?3±1?1 49?8±10?5 45?9±10?1
Range (of proportion) 4?3–16?8 8?4–22?2 0?1–5?9 0?0–1?0 5?4–9?2 4?0–7?3 38?6–68?2 30?2–60?7
Change in proportion|| 4?0±6?3 1?1±2?0 1?4±0?8 8?5±10?2
Range (of change in proportion) 0?8–17?9 0–5?6 0?1–2?7 1?6–30?9
Total change of clostridia 15?0±16?2
Constipation type (6)
Proportion 14?5±5?4 14?8±8?1 1?6±1?1 3?9±2?5 5?9±1?6 7?1±3?0 33?8±5?2 29?5±9?4
Range (of proportion) 5?5–20?1 5?5–25?1 0?4–3?3 0?5–8?0 3?1–7?9 3?1–10?4 24?8–38?7 14?0–40?0
Change in proportion|| 2?6±2?4 2?3±2?6 1?6±1?5 6?4±8?5
Range (of change in proportion) 0–6?1 0?1–7?4 0–3?9 0?4–23?3
Total change of clostridia 13?0±10?6
Mixed type (3)
Proportion 11?5±4?9 17?0±10?6 2?2±0?6 3?2±0?2 5?6±1?3 6?7±0?8 33?6±8?4 30?7±8?1
Range (of proportion) 7?0–16?7 8?7–29?0 1?7–2?9 3?0–3?4 4?6–7?0 5?8–7?4 27?3–43?1 22?2–38?4
Change in proportion|| 5?5±5?9 1?0±0?8 1?2±0?8 5?7±2?1
Range (of change in proportion) 1?7–12?3 0?1–1?6 0?4–1?9 4?3–8?1
Total change of clostridia 13?3±6?3
Overall mean of IBS subjects (16)
Proportion 12?4±4?9 14?9±6?8 1?5±1?6 2?3±2?2 6?2±1?5 6?5±2?1 40?7±11?4 36?9±12?1
Range (of proportion) 4?3–20?1 5?5–29?0 0?1–5?9 0?0–8?0 3?1–9?2 3?1–10?4 24?8–68?2 14?0–60?7
Change in proportion|| 3?8±4?9 1?5±2?1 1?4±1?0 7?2±8?2
Range (of change in proportion) 0–17?9 0–7?4 0–3?9 0?4–30?9
Total change of clostridia 13?9±12?2
Control subjects (16)
Proportion 11?5±5?5 9?4±4?2 1?7±2?0 1?2±1?6 7?4±3?9 5?5±1?8 43?3±16?5 42?3±13?7
Range (of proportion) 4?6–23?6 2?9–18?1 0?1–7?0 0?1–4?8 3?7–19?5 2?4–9?2 17?7–71?2 20?9–66?9
Change in proportion|| 3?3±4?1 1?0±1?6 2?7±2?9 9?2±8?3
Range (of change in proportion) 0–13?2 0–6?4 0?4–12?6 0?2–24?6
Total change of clostridia 13?9±10?8
*The Clept1240 probe (Sghir et al., 2000) targets the C. leptum group, which corresponds to clostridial phylogenetic cluster IV (Collins et al.,
1994).
DThe Clit135 probe (Franks et al., 1998) targets the C. lituseburense group, which corresponds to clostridial phylogenetic cluster XI (Collins et al.,
1994).
dThe Chis150 probe (Franks et al., 1998) targets the C. histolyticum group, which corresponds to clostridial phylogenetic clusters I and II (Collins
et al., 1994).
§The Erec482 probe (Franks et al., 1998) targets the C. coccoides-E. rectale group, which corresponds to clostridial phylogenetic clusters XIVa and
XIVb (Collins et al., 1994).
||The change was defined as: absolute change (D; percentage at baseline minus percentage at 6 months) in the population.
The total change of clostridia was defined as: absolute change (D; percentage at baseline minus percentage at 6 months) in Clept-hybridized
population+absolute change (D) in Clit-hybridized population+absolute change (D) in Chis-hybridized population+absolute change (D) in
Erec-hybridized population.
http://jmm.sgmjournals.org 631
Clostridial and predominant faecal bacteria in IBS
with non-target organisms when compared to the bacterialsignal of the Bact338-IIA probe. Assuming that thebackground signal with the Chis150 probe is more or lessthe same from all mixed bacterial populations, theC. histolyticum group contributed a mean of 3–5% of thetotal population, which is still higher than the previouslyreported <1%. The proportions of the C. leptum groupfound in control subjects (mean 12 and 9%, for baseline and6 month samples, respectively) and IBS subjects (mean 12and 15%, for baseline and 6 month samples, respectively)were in agreement with earlier studies (Sghir et al., 2000;Marteau et al., 2001; Hold et al., 2002).
In the present study, the C. coccoides-E. rectale group was thedominant subgroup of faecal clostridia. It contributed amean of 43% (range 18–71%) of the total bacteria incontrol subjects, and 30% (constipation type) to 50%(diarrhoea type) (range 14–68%) in different IBS symptomcategory subjects. The mean percentage observed with ourcontrol subjects is somewhat higher than the previouslyreported 11–35% (range 5–45%) for healthy adults (Frankset al., 1998; Jansen et al., 1999; Sghir et al., 2000; Marteau etal., 2001; Harmsen et al., 2002a, b; Zoetendal et al., 2002;Hold et al., 2003; Rigottier-Gois et al., 2003; Rochet et al.,2004). This highlights interindividual differences that arepossibly due to diet and genetic background. In addition, theage distribution in both our subject groups was wider thanthat of most other studies. Furthermore, it should be notedthat the smaller proportions of the C. coccoides-E. rectalegroup in other studies compared to our results have beenobtained with fluorescent in situ hybridization (FISH)[except for the studies of Sghir et al. (2000) andMarteau et al.(2001)], whereas the results of Rigottier-Gois et al. (2003)obtained with dot-blot hybridization (mean 22%) weremore similar to those of our study (range 12–55% versus18–71% in our study). The FISH analysis measures theproportion of the cells that contain a sufficient number ofribosomes to be detected, while rRNA dot-blot hybridiza-tion gives an index that reflects the ribosomal content of thecells and the general metabolic activity (Rigottier-Gois et al.,
2003), as does the TRAC technique. The amount of rRNAper cell varies according to the species and the metabolicactivity of the bacterial cell (Klappenbach et al., 2000).Whenthe human faecal microbiota has been analysed with the 16SrDNA library method, bacteria from the C. coccoides-E.rectale group have contributed 10–59% of the total faecalflora (Wilson & Blitchington, 1996; Suau et al., 1999; Hayshiet al., 2002; Hold et al., 2002; Wang et al., 2003), which is inaccordance with our results.
No difference was observed in the present study in theproportions of the C. coccoides-E. rectale group when all IBSsubjects together were compared to the control subjects(Table 3). However, when different IBS symptom categorieswere compared to the control subjects, the proportion of theC. coccoides-E. rectale group of clostridia was significantlylower in the constipation-type IBS subjects than in thecontrol subjects, and also at the 6 months sampling time-point of the mixed-type IBS subjects (P <0?05) (Table 3).Similar differences have been observed by Malinen et al.(2005). In contrast to this, Rinttila et al. (2004) have foundwith real-time PCR that the number of cells belonging to theC. coccoides-E. rectale group is somewhat lower in the IBSgroup than in the control group. However, their subjectgroups contain only three subjects. As a target clostridialgroup, the C. coccoides-E. rectale group (phylogenetic clus-ters XIVa and XIVb) is too large to detect subtle variationsbetween the microbiota of control and IBS subjects, andtherefore needs to be divided into smaller subgroups infurther studies.
Temporal stability of clostridial populations
No clear differences in intraindividual temporal stability(change in proportions between the two sampling points) ofthe C. leptum, C. lituseburense and C. coccoides-E. rectalegroups were observed between the IBS and control subjects.However, the C. histolyticum group was temporally morestable (the change in proportions of the C. histolyticumgroups was smaller) in mixed-type IBS subjects than in the
*Similarity values were counted with BioNumerics 3.0 software. Clustering was performed with Pearson correlation and the unweighted pair
group method with arithmetic mean (UPGMA). Amplicons with a total surface area of at least 1% were included in the similarity analysis.
DQuantitative Dclostridia (%) indicated the total change of clostridia as measured by the TRAC technique, which was defined as: absolute change
(D; percentage at baseline minus percentage at 6 months) in the Clept-hybridized population+absolute change (D) in Clit-hybridized
population+absolute change (D) in Chis-hybridized population+absolute change (D) in Erec-hybridized population. See Table 1 for meanings
of abbreviations.
dSimilarity value thresholds indicating stable, rather stable or unstable DGGE profiles were determined according to the visual inspection of two
researchers. Similarity value thresholds for RNA-based and DNA-based profiles were determined separately.
§RNA-based similarity thresholds: stable (>92?2%), rather stable (70?0–92?1%), unstable (<70?0%).
||DNA-based similarity thresholds: stable (>92?2%), rather stable (75?0–92?1%), unstable (<75?0%).
The RNA of the second sample (time-point 6 months) of the subject IBS 11 did not amplify with RT-PCR sufficiently (for DGGE), regardless of
various modifications to the protocol.
#The quality and amount of RNA of the second sample (time-point 6 months) of the subject Control 10 was not sufficient either for RT-PCR or
the quantitative TRAC analysis. RNA was extracted three times with two different methods.
Table 2. cont.
630 Journal of Medical Microbiology 55
J. Maukonen and others
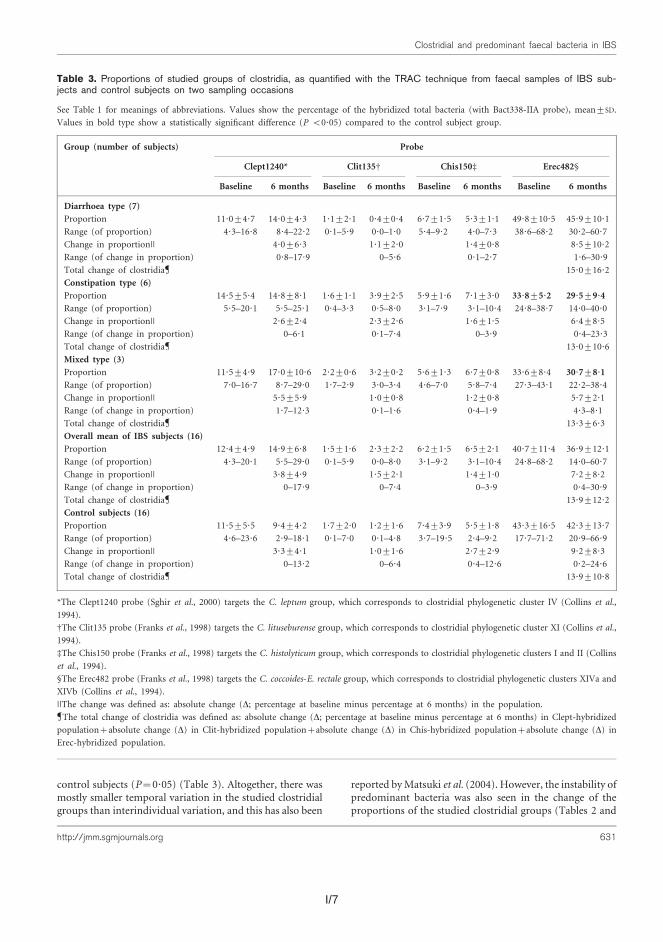
I/7
control subjects (P=0?05) (Table 3). Altogether, there wasmostly smaller temporal variation in the studied clostridialgroups than interindividual variation, and this has also been
reported byMatsuki et al. (2004). However, the instability ofpredominant bacteria was also seen in the change of theproportions of the studied clostridial groups (Tables 2 and
Table 3. Proportions of studied groups of clostridia, as quantified with the TRAC technique from faecal samples of IBS sub-jects and control subjects on two sampling occasions
See Table 1 for meanings of abbreviations. Values show the percentage of the hybridized total bacteria (with Bact338-IIA probe), mean±SD.
Values in bold type show a statistically significant difference (P <0?05) compared to the control subject group.
Group (number of subjects) Probe
Clept1240* Clit135D Chis150d Erec482§
Baseline 6 months Baseline 6 months Baseline 6 months Baseline 6 months
Diarrhoea type (7)
Proportion 11?0±4?7 14?0±4?3 1?1±2?1 0?4±0?4 6?7±1?5 5?3±1?1 49?8±10?5 45?9±10?1
Range (of proportion) 4?3–16?8 8?4–22?2 0?1–5?9 0?0–1?0 5?4–9?2 4?0–7?3 38?6–68?2 30?2–60?7
Change in proportion|| 4?0±6?3 1?1±2?0 1?4±0?8 8?5±10?2
Range (of change in proportion) 0?8–17?9 0–5?6 0?1–2?7 1?6–30?9
Total change of clostridia 15?0±16?2
Constipation type (6)
Proportion 14?5±5?4 14?8±8?1 1?6±1?1 3?9±2?5 5?9±1?6 7?1±3?0 33?8±5?2 29?5±9?4
Range (of proportion) 5?5–20?1 5?5–25?1 0?4–3?3 0?5–8?0 3?1–7?9 3?1–10?4 24?8–38?7 14?0–40?0
Change in proportion|| 2?6±2?4 2?3±2?6 1?6±1?5 6?4±8?5
Range (of change in proportion) 0–6?1 0?1–7?4 0–3?9 0?4–23?3
Total change of clostridia 13?0±10?6
Mixed type (3)
Proportion 11?5±4?9 17?0±10?6 2?2±0?6 3?2±0?2 5?6±1?3 6?7±0?8 33?6±8?4 30?7±8?1
Range (of proportion) 7?0–16?7 8?7–29?0 1?7–2?9 3?0–3?4 4?6–7?0 5?8–7?4 27?3–43?1 22?2–38?4
Change in proportion|| 5?5±5?9 1?0±0?8 1?2±0?8 5?7±2?1
Range (of change in proportion) 1?7–12?3 0?1–1?6 0?4–1?9 4?3–8?1
Total change of clostridia 13?3±6?3
Overall mean of IBS subjects (16)
Proportion 12?4±4?9 14?9±6?8 1?5±1?6 2?3±2?2 6?2±1?5 6?5±2?1 40?7±11?4 36?9±12?1
Range (of proportion) 4?3–20?1 5?5–29?0 0?1–5?9 0?0–8?0 3?1–9?2 3?1–10?4 24?8–68?2 14?0–60?7
Change in proportion|| 3?8±4?9 1?5±2?1 1?4±1?0 7?2±8?2
Range (of change in proportion) 0–17?9 0–7?4 0–3?9 0?4–30?9
Total change of clostridia 13?9±12?2
Control subjects (16)
Proportion 11?5±5?5 9?4±4?2 1?7±2?0 1?2±1?6 7?4±3?9 5?5±1?8 43?3±16?5 42?3±13?7
Range (of proportion) 4?6–23?6 2?9–18?1 0?1–7?0 0?1–4?8 3?7–19?5 2?4–9?2 17?7–71?2 20?9–66?9
Change in proportion|| 3?3±4?1 1?0±1?6 2?7±2?9 9?2±8?3
Range (of change in proportion) 0–13?2 0–6?4 0?4–12?6 0?2–24?6
Total change of clostridia 13?9±10?8
*The Clept1240 probe (Sghir et al., 2000) targets the C. leptum group, which corresponds to clostridial phylogenetic cluster IV (Collins et al.,
1994).
DThe Clit135 probe (Franks et al., 1998) targets the C. lituseburense group, which corresponds to clostridial phylogenetic cluster XI (Collins et al.,
1994).
dThe Chis150 probe (Franks et al., 1998) targets the C. histolyticum group, which corresponds to clostridial phylogenetic clusters I and II (Collins
et al., 1994).
§The Erec482 probe (Franks et al., 1998) targets the C. coccoides-E. rectale group, which corresponds to clostridial phylogenetic clusters XIVa and
XIVb (Collins et al., 1994).
||The change was defined as: absolute change (D; percentage at baseline minus percentage at 6 months) in the population.
The total change of clostridia was defined as: absolute change (D; percentage at baseline minus percentage at 6 months) in Clept-hybridized
population+absolute change (D) in Clit-hybridized population+absolute change (D) in Chis-hybridized population+absolute change (D) in
Erec-hybridized population.
http://jmm.sgmjournals.org 631
Clostridial and predominant faecal bacteria in IBS
I/8 I/9
of irritable bowel syndrome patients and healthy controls. AmJ Gastroenterol 100, 373–382.
Mangin, I., Bonnet, R., Seksik, P. & 8 other authors (2004).Molecular inventory of faecal microflora in patients with Crohn’sdisease. FEMS Microbiol Ecol 50, 25–36.
Marteau, P., Pochart, P., Dore, J., Bera-Maillet, C., Bernalier, A. &Corthier, G. (2001). Comparative study of bacterial groups withinthe human cecal and fecal microbiota. Appl Environ Microbiol 67,4939–4942.
Matsuki, T., Watanabe, K., Fujimoto, J., Takada, T. & Tanaka, R.(2004). Use of 16S rRNA gene-targeted group-specific primers forreal-time PCR analysis of predominant bacteria in human feces. ApplEnviron Microbiol 70, 7220–7228.
Matto, J., Maunuksela, L., Kajander, K., Palva, A., Korpela, R.,Kassinen, A. & Saarela, M. (2005). Composition and temporalstability of gastrointestinal microbiota in irritable bowel syndrome –a longitudinal study in IBS and control subjects. FEMS ImmunolMed Microbiol 43, 213–222.
Nubel, U., Engelen, B., Felske, A., Snaidr, J., Wieshuber, A., Amann,R. I., Ludwig, W. & Backhaus, H. (1996). Sequence heterogeneities ofgenes encoding 16S rRNAs in Paenibacillus polymyxa detected bytemperature gradient gel electrophoresis. J Bacteriol 178, 5636–5643.
Pimentel, M., Chow, E. J. & Lin, H. C. (2000). Eradication of smallintestinal bacterial overgrowth reduces symptoms of irritable bowelsyndrome. Am J Gastroenterol 95, 3503–3506.
Rigottier-Gois, L., Le Bourhis, A.-G., Gramet, G., Rochet, V. &Dore, J. (2003). Fluorescent hybridisation combined with flow cyto-metry and hybridisation of total RNA to analyse the composition ofmicrobial communities in human faeces using 16S rRNA probes.FEMS Microbiol Ecol 43, 237–245.
Rinttila, T., Kassinen, A., Malinen, E., Krogius, L. & Palva, A. (2004).Development of an extensive set of 16S rDNA-targeted primers forquantification of pathogenic and indigenous bacteria in faecalsamples by real-time PCR. J Appl Microbiol 97, 1166–1177.
Rochet, V., Rigottier-Gois, L., Rabot, S. & Dore, J. (2004). Validationof fluorescent in situ hybridization combined with flow cytometryfor assessing interindividual variation in the composition of humanfecal microflora during long-term storage of samples. J MicrobiolMethods 59, 263–270.
Satokari, R. M., Kataja, K. & Soderlund, H. (2005). Multiplexedquantification of bacterial 16S rRNA by solution hybridization witholigonucleotide probes and affinity capture. Microb Ecol 50, 120–127.
Seksik, P., Rigottier-Gois, L., Gramet, G., Sutren, M., Pochart, P.,Marteau, P., Jian, R. & Dore, J. (2003). Alterations of the dominant
faecal bacterial groups in patients with Crohn’s disease of the colon.
Gut 52, 237–242.
Sghir, A., Gramet, G., Suau, A., Rochet, V., Pochart, P. & Dore, J.(2000). Quantification of bacterial groups within human fecal flora
by oligonucleotide probe hybridization. Appl Environ Microbiol 66,
2263–2266.
Suau, A., Bonnet, R., Sutren, M., Godon, J.-J., Gibson, G., Collins,M. D. & Dore, J. (1999). Direct analysis of genes encoding 16S rRNA
from complex communities reveals many novel molecular species
within the human gut. Appl Environ Microbiol 65, 4799–4807.
Tannock, G. W., Munro, K., Biniloni, R., Simon, M. A., Hargreaves, P.,Gopal, P., Harmsen, H. & Welling, G. (2004). Impact of consumption
of oligosaccharide-containing biscuits on the fecal microbiota of
humans. Appl Environ Microbiol 70, 2129–2136.
Thompson, W. G., Longstreth, G. F., Drossman, D. A., Heaton, K. W.,Irvine, E. J. & Muller-Lissner, S. A. (1999). Functional bowel
disorders and functional abdominal pain. Gut 45, supplement 2,
II43–II47.
Vanhoutte, T., Huys, G., De Brandt, E. & Swings, J. (2004).Temporal stability analysis of the microbiota in human feces
by denaturing gradient gel electrophoresis using universal and
group-specific 16S rRNA gene primers. FEMS Microbiol Ecol 48,
437–446.
Wang, X., Heazlewood, S. P., Krause, D. O. & Florin, T. H. J. (2003).Molecular characterization of the microbial species that colonize
human ileal and colonic mucosa by using 16S rDNA sequence
analysis. J Appl Microbiol 95, 508–520.
Wilson, K. H. & Blitchington, R. B. (1996). Human colonic biota
studied by ribosomal DNA sequence analysis. Appl Environ Microbiol
62, 2273–2278.
Zoetendal, E. G., Akkermans, A. D. & de Vos, W. M. (1998).Temperature gradient gel electrophoresis analysis of 16S rRNA from
human fecal samples reveals stable and host-specific communities of
active bacteria. Appl Environ Microbiol 64, 3854–3859.
Zoetendal, E. G., Akkermans, A. D. L., Akkermans-van Vliet, W. M.,de Visser, J. A. G. M. & de Vos, W. M. (2001). The host genotype
affects the bacterial community in the human gastrointestinal tract.
Microbiol Ecol Health Dis 13, 129–134.
Zoetendal, E. G., Ben-Amor, K., Harmsen, H. J. M., Schut, F.,Akkermans, A. D. L. & de Vos, W. M. (2002). Quantification of
uncultured Ruminococcus obeum-like bacteria in human fecal
samples by fluorescent in situ hybridization and flow cytometry
using 16S rRNA-targeted probes. Appl Environ Microbiol 68,
4225–4232.
http://jmm.sgmjournals.org 633
Clostridial and predominant faecal bacteria in IBS
3) in our study. Subjects whose predominant bacterialpopulation (by RT-PCR-DGGE) was unstable over thestudied time-period had a significant change in the pro-portions of the clostridial groups between the two samplingpoints (baseline and 6 months) when compared to thesubjects whose predominant bacterial population was stable(P <0?05). This might be expected, since the studiedclostridial groups represented the dominant faecal micro-biota in these subjects. The same was also noticed withDNA-based DGGE profiles, but the difference with DNA-based profiles was not statistically significant (P=0?06).
Conclusions
The differences in faecal bacterial population between IBSand control subjects have been reported in several studies(Balsari et al., 1982; Bradley et al., 1987; Madden & Hunter,2002; Matto et al., 2005). We found a marked differencein the proportions of the C. coccoides-E. rectale group ofclostridia between constipation-type IBS subjects andcontrol subjects. In addition, there was more instability inthe DGGE profiles derived from faecal RNA amplicons ofthe IBS subjects than those of the control subjects. How-ever, further studies are needed with larger subject groupsto confirm these findings.
ACKNOWLEDGEMENTS
This study was supported by the Finnish Technology Centre (Tekesgrant 954/401/00) and the Academy of Finland. Ms Marja-LiisaJalovaara is greatly acknowledged for her excellent technical assistance.
REFERENCES
Amann, R. I., Binder, B. J., Olson, R. J., Chisholm, S. W., Devereux, R. &Stahl, D. A. (1990). Combination of 16S rRNA-targeted oligonucleo-tide probes with flow cytometry for analyzing mixed microbialpopulations. Appl Environ Microbiol 56, 1919–1925.
Balsari, A., Ceccarelli, A., Dubini, F., Fesce, E. & Poli, G. (1982).The fecal microbial population in the irritable bowel syndrome.Microbiologica 5, 185–194.
Bartosch, S., Fite, A., Macfarlane, G. T. & McMurdo, M. E. T. (2004).Characterization of bacterial communities in feces from healthyelderly volunteers and hospitalized elderly patients by using real-timePCR and effects of antibiotic treatment on the fecal microbiota. ApplEnviron Microbiol 70, 3575–3581.
Bradley, H. K., Wyatt, G. M., Bayliss, C. E. & Hunter, J. O. (1987).Instability in the faecal flora of a patient suffering from food-relatedirritable bowel syndrome. J Med Microbiol 23, 29–32.
Bustin, S. A. & Nolan, T. (2004). Pitfalls of quantitative real-timereverse-transcription polymerase chain reaction. J Biomol Techniq 15,155–166.
Cato, E. P., George, W. L. & Finegold, S. M. (1986). GenusClostridium Prazmowski 1880. In Bergey’s Manual of SystematicBacteriology, vol. 2, pp. 1141–1200. Edited by P. H. A. Sneath, N. S.Mair, M. E. Sharpe & J. G. Holt. Baltimore, MD: Williams &Wilkins.
Collins, M. D., Lawson, P. A., Willems, A., Cordoba, J. J., Fernandez-Garayzabal, J., Gaecia, P., Cai, J., Hippe, H. & Farrow, J. A. E.
(1994). The phylogeny of the genus Clostridium: proposal of five new
genera and eleven new species combinations. Int J Syst Bacteriol 144,
812–826.
Donskey, C. J., Hujer, A. M., Das, S. M., Pultz, N. J., Bonomo, R. A. &Rice, L. B. (2003). Use of denaturing gradient gel electrophoresis for
analysis of the stool microbiota of hospitalized patients. J Microbiol
Methods 54, 249–256.
Edlund, C. & Nord, C. E. (2000). Effect on the human normal micro-
flora of oral antibiotics for treatment of urinary tract infections.
J Antimicrob Chemother 46, Supplement S1, 41–48.
Felske, A., Rheims, H., Wolterink, A., Stackebrandt, E. &Akkermans, A. D. L. (1997). Ribosome analysis reveals prominent
activity of an uncultured member of the class Actinobacteria in
grassland soils. Microbiology 143, 2983–2989.
Franks, A. H., Harmsen, H. J. M., Raangs, G. C., Jansen, G. J., Schut, F.& Welling, G. W. (1998). Variations in bacterial populations in
human feces measured by fluorescent in situ hybridization with group-
specific 16S rRNA-targeted oligonucleotide probes. Appl Environ
Microbiol 64, 3336–3345.
Harmsen, H. J. M., Gibson, G. R., Elfferich, P., Raangs, G. C.,Wideboer-Veloo, A. C. M., Argaiz, A., Roberfroid, M. B. & Welling,G. W. (1999). Comparison of viable cell counts and fluorescence
in situ hybridization using specific rRNA-based probes for the
quantification of human fecal bacteria. FEMS Microbiol Lett 183,
125–129.
Harmsen, H. J. M., Raangs, G. C., Franks, A. H., Wildeboer-Veloo,A. C. M. & Welling, G. W. (2002a). The effect of the prebiotic inulin
and the probiotic Bifidobacterium longum in the fecal microflora of
healthy volunteers measured by FISH and DGGE. Microbiol Ecol
Health Disease 14, 211–219.
Harmsen, H. J. M., Raangs, G. C., He, T., Degener, J. E. & Welling,G. W. (2002b). Extensive set of 16S rRNA-based probes for detection
of bacteria in human feces. Appl Environ Microbiol 68, 2982–2990.
Hayshi, H., Sakamoto, M. & Benno, Y. (2002). Phylogenetic analysis
of the human gut microbiota using 16S rDNA clone libraries and
strictly anaerobic culture-based methods. Microbiol Immunol 46,
535–548.
Hold, G. L., Pryde, S. E., Russell, V. J., Furrie, E. & Flint, H. J. (2002).Assessment of microbial diversity in human colonic samples by 16S
rDNA sequence analysis. FEMS Microbiol Ecol 39, 33–39.
Hold, G. L., Schwiertz, A., Aminov, R. I., Blaut, M. & Flint, H. J.(2003). Oligonucleotide probes that detect quantitatively significant
groups of butyrate-producing bacteria in human feces. Appl Environ
Microbiol 69, 4320–4324.
Jansen, G. J., Wilderboer-Veloo, A. C. M., Tonk, R. H. J., Franks, A. H.& Welling, G. W. (1999). Development and validation of an auto-
mated, microscopy-based method for enumeration of groups of
intestinal bacteria. J Microbiol Methods 37, 215–221.
Josephson, K. L., Gerba, C. P. & Pepper, I. L. (1993). Polymerase
chain reaction detection of nonviable bacterial pathogens. Appl
Environ Microbiol 59, 3513–3515.
King, T. S., Elia, M. & Hunter, J. O. (1998). Abnormal colonic
fermentation in irritable bowel syndrome. Lancet 352, 1187–1189.
Klappenbach, J. A., Dunbar, J. M. & Schmidt, T. M. (2000). rRNAoperon copy number reflects ecological strategies of bacteria. Appl
Environ Microbiol 66, 1328–1333.
Madden, J. A. J. & Hunter, J. O. (2002). A review of the role of the
gut microflora in irritable bowel syndrome and the effects of
probiotics. Br J Nutr 88, S67–S72.
Malinen, E., Rinttila, T., Kajander, K., Matto, J., Kassinen, A.,Krogius, L., Saarela, M., Korpela, R. & Palva, A. (2005). Real-
time PCR analysis reveals differences between the fecal microbiota
632 Journal of Medical Microbiology 55
J. Maukonen and others
I/9
of irritable bowel syndrome patients and healthy controls. AmJ Gastroenterol 100, 373–382.
Mangin, I., Bonnet, R., Seksik, P. & 8 other authors (2004).Molecular inventory of faecal microflora in patients with Crohn’sdisease. FEMS Microbiol Ecol 50, 25–36.
Marteau, P., Pochart, P., Dore, J., Bera-Maillet, C., Bernalier, A. &Corthier, G. (2001). Comparative study of bacterial groups withinthe human cecal and fecal microbiota. Appl Environ Microbiol 67,4939–4942.
Matsuki, T., Watanabe, K., Fujimoto, J., Takada, T. & Tanaka, R.(2004). Use of 16S rRNA gene-targeted group-specific primers forreal-time PCR analysis of predominant bacteria in human feces. ApplEnviron Microbiol 70, 7220–7228.
Matto, J., Maunuksela, L., Kajander, K., Palva, A., Korpela, R.,Kassinen, A. & Saarela, M. (2005). Composition and temporalstability of gastrointestinal microbiota in irritable bowel syndrome –a longitudinal study in IBS and control subjects. FEMS ImmunolMed Microbiol 43, 213–222.
Nubel, U., Engelen, B., Felske, A., Snaidr, J., Wieshuber, A., Amann,R. I., Ludwig, W. & Backhaus, H. (1996). Sequence heterogeneities ofgenes encoding 16S rRNAs in Paenibacillus polymyxa detected bytemperature gradient gel electrophoresis. J Bacteriol 178, 5636–5643.
Pimentel, M., Chow, E. J. & Lin, H. C. (2000). Eradication of smallintestinal bacterial overgrowth reduces symptoms of irritable bowelsyndrome. Am J Gastroenterol 95, 3503–3506.
Rigottier-Gois, L., Le Bourhis, A.-G., Gramet, G., Rochet, V. &Dore, J. (2003). Fluorescent hybridisation combined with flow cyto-metry and hybridisation of total RNA to analyse the composition ofmicrobial communities in human faeces using 16S rRNA probes.FEMS Microbiol Ecol 43, 237–245.
Rinttila, T., Kassinen, A., Malinen, E., Krogius, L. & Palva, A. (2004).Development of an extensive set of 16S rDNA-targeted primers forquantification of pathogenic and indigenous bacteria in faecalsamples by real-time PCR. J Appl Microbiol 97, 1166–1177.
Rochet, V., Rigottier-Gois, L., Rabot, S. & Dore, J. (2004). Validationof fluorescent in situ hybridization combined with flow cytometryfor assessing interindividual variation in the composition of humanfecal microflora during long-term storage of samples. J MicrobiolMethods 59, 263–270.
Satokari, R. M., Kataja, K. & Soderlund, H. (2005). Multiplexedquantification of bacterial 16S rRNA by solution hybridization witholigonucleotide probes and affinity capture. Microb Ecol 50, 120–127.
Seksik, P., Rigottier-Gois, L., Gramet, G., Sutren, M., Pochart, P.,Marteau, P., Jian, R. & Dore, J. (2003). Alterations of the dominant
faecal bacterial groups in patients with Crohn’s disease of the colon.
Gut 52, 237–242.
Sghir, A., Gramet, G., Suau, A., Rochet, V., Pochart, P. & Dore, J.(2000). Quantification of bacterial groups within human fecal flora
by oligonucleotide probe hybridization. Appl Environ Microbiol 66,
2263–2266.
Suau, A., Bonnet, R., Sutren, M., Godon, J.-J., Gibson, G., Collins,M. D. & Dore, J. (1999). Direct analysis of genes encoding 16S rRNA
from complex communities reveals many novel molecular species
within the human gut. Appl Environ Microbiol 65, 4799–4807.
Tannock, G. W., Munro, K., Biniloni, R., Simon, M. A., Hargreaves, P.,Gopal, P., Harmsen, H. & Welling, G. (2004). Impact of consumption
of oligosaccharide-containing biscuits on the fecal microbiota of
humans. Appl Environ Microbiol 70, 2129–2136.
Thompson, W. G., Longstreth, G. F., Drossman, D. A., Heaton, K. W.,Irvine, E. J. & Muller-Lissner, S. A. (1999). Functional bowel
disorders and functional abdominal pain. Gut 45, supplement 2,
II43–II47.
Vanhoutte, T., Huys, G., De Brandt, E. & Swings, J. (2004).Temporal stability analysis of the microbiota in human feces
by denaturing gradient gel electrophoresis using universal and
group-specific 16S rRNA gene primers. FEMS Microbiol Ecol 48,
437–446.
Wang, X., Heazlewood, S. P., Krause, D. O. & Florin, T. H. J. (2003).Molecular characterization of the microbial species that colonize
human ileal and colonic mucosa by using 16S rDNA sequence
analysis. J Appl Microbiol 95, 508–520.
Wilson, K. H. & Blitchington, R. B. (1996). Human colonic biota
studied by ribosomal DNA sequence analysis. Appl Environ Microbiol
62, 2273–2278.
Zoetendal, E. G., Akkermans, A. D. & de Vos, W. M. (1998).Temperature gradient gel electrophoresis analysis of 16S rRNA from
human fecal samples reveals stable and host-specific communities of
active bacteria. Appl Environ Microbiol 64, 3854–3859.
Zoetendal, E. G., Akkermans, A. D. L., Akkermans-van Vliet, W. M.,de Visser, J. A. G. M. & de Vos, W. M. (2001). The host genotype
affects the bacterial community in the human gastrointestinal tract.
Microbiol Ecol Health Dis 13, 129–134.
Zoetendal, E. G., Ben-Amor, K., Harmsen, H. J. M., Schut, F.,Akkermans, A. D. L. & de Vos, W. M. (2002). Quantification of
uncultured Ruminococcus obeum-like bacteria in human fecal
samples by fluorescent in situ hybridization and flow cytometry
using 16S rRNA-targeted probes. Appl Environ Microbiol 68,
4225–4232.
http://jmm.sgmjournals.org 633
Clostridial and predominant faecal bacteria in IBS

ARTICLE II
PCR-DGGE and RT-PCR-DGGE show diversity and short-
term temporal stability in the Clostridium coccoides
Eubacterium rectale group in the human intestinal microbiota
In: FEMS Microbiology Ecology, 58, pp. 517–528.
Copyright 2006 Federation of European Microbiological Societies.
Reprinted with permission from the publisher.

II/1
PCRDGGEandRT-PCRDGGEshowdiversityand short-termtemporalstability intheClostridiumcoccoides^Eubacteriumrectalegroup in the human intestinalmicrobiotaJohanna Maukonen1, Jaana Matto1, Reetta Satokari1, Hans Soderlund1, Tiina Mattila-Sandholm2 &Maria Saarela1
1VTT Technical Research Centre of Finland, Espoo, Finland; and 2Valio Ltd, Helsinki, Finland
Correspondence: Johanna Maukonen,
VTT Technical Research Centre of Finland,
PO Box 1000, Tietotie 2, Espoo, FIN-02044
VTT, Finland. Tel.: 1358 20 722 7183;
fax: 1358 20 722 7170; e-mail:
Received 27 February 2006; revised 3 May
2006; accepted 15 May 2006.
First published online 12 July 2006.
DOI:10.1111/j.1574-6941.2006.00179.x
Editor: Julian Marchesi
Keywords
clostridia; Erec; PCR-DGGE; RT-PCR-DGGE;
faeces.
Abstract
As the Clostridium coccoides–Eubacterium rectale (Erec; clostridial phylogenetic
cluster XIVa) group is one of the major groups of the human intestinal microbiota,
DNA- and RNA-based population analysis techniques (denaturing gradient gel
electrophoresis; DGGE) were developed and applied to assess the diversity and
temporal stability (6 months–2 years) of this faecal clostridial microbiota in 12
healthy adults. The stability of the Erec group was compared with the stability of
the predominant bacterial microbiota, which was also assessed with PCR-DGGE.
In addition, the Erec group was quantified with a hybridization-based method.
According to our results, the Erec group was diverse in each subject, but
interindividual uniqueness was not as clear as that of the predominant bacteria.
The Erec group was found to be temporally as stable as the predominant bacteria.
Over 200 clones obtained from two samples proved the developed method to be
specific. However, the amount of bacteria belonging to the Erec group was not
related to the diversity of that same bacterial group. In conclusion, the newly
developed DGGE method proved to be a valuable and specific tool for the direct
assessment of the stability of the Erec group, demonstrating diversity in addition to
short-term stability in most of the subjects studied.
Introduction
Clostridia are phylogenetically and metabolically highly
diverse bacteria, which together with their close relatives
constitute a predominant fraction of the faecal microbiota
of human adults (Wilson & Blitchington, 1996; Franks et al.,
1998; Zoetendal et al., 1998; Suau et al., 1999). The genus
Clostridium currently contains 146 species. Clostridia and
phylogenetically related bacteria are divided into 19 distinct
clusters (Collins et al., 1994), and most of the clusters
contain species from genera other than Clostridium, for
example Eubacterium, Ruminococcus, Coprococcus, Peptos-
treptococcus, and Faecalibacterium, which are also com-
monly found in the colonic microbiota (e.g. Suau et al.,
1999). The 16S rRNA gene-based phylogeny of clostridia is
still incomplete, and several prevalent species within these
genera have been reclassified as they have been studied more
closely (e.g. Wade et al., 1999). Studies on the characteriza-
tion of faecal microbiota of healthy humans by 16S rRNA
gene sequencing have revealed abundantly, clones of un-
cultured bacteria that are distributed in the clostridial
clusters (Suau et al., 1999; Eckburg et al., 2005). The
predominant intestinal clostridia belong mainly to clusters
XIVa [Clostridium coccoides–Eubacterium rectale (Erec)
group] and IV (Clostridium leptum group) (Franks et al.,
1998; Suau et al., 1999; Sghir et al., 2000; Eckburg et al.,
2005), whereas most of the medically important clostridia
belong to cluster I (Stackebrandt et al., 1999). Many
clostridia are cultivable, but their culture-based quantifica-
tion is impractical owing to the lack of good subgroup-
selective media (with the exception of some clinically
important species). Hence, culture-independent techniques
have great practical relevance in the study of clostridia
(Satokari et al., 2005).
Clostridia contain saccharolytic and/or proteolytic spe-
cies and are able to metabolize a wide variety of substrates
(Cato et al., 1986). In the colon they are likely to have an
important role in the fermentation and putrefaction of
food-derived substances, resulting in various metabolites
such as fatty acids and gases (Konstantinov et al., 2005).
Short-chain fatty acids formed by microbial fermentation
have an important effect on colonic health. Butyrate, in
FEMS Microbiol Ecol 58 (2006) 517–528 c� 2006 Federation of European Microbiological SocietiesPublished by Blackwell Publishing Ltd. All rights reserved
II/2 II/3
were used for the reverse transcription PCR (RT-PCR)
(Table 2). RT-PCR was performed with the Qiagens One-
Step RT-PCR Kit (Qiagen) according to the manufacturer’s
instructions. The PCR program consisted of reverse tran-
scription performed at 50 1C for 30min, followed by dena-
turation at 95 1C for 15min. Thereafter the RT-PCR
program was similar to the PCR-program: 30 cycles of
denaturing at 94 1C for 45 s, primer annealing at 54 1C for
30 s and elongation at 72 1C for 60 s, and a final extension at
72 1C for 30min.
PCR and RT-PCR of the predominant microbiota
The partial 16S rRNA gene was PCR-amplified using
primers U968-f1GC and U1401-r (Table 2) as described by
Matto et al. (2005). RT-PCR was performed with the
Qiagens OneStep RT-PCR Kit according to the manufac-
turer’s instructions. Primers used for the RT-PCR were the
same as those used for the PCR (Table 2). The PCR program
consisted of reverse transcription performed at 50 1C for
30min, followed by denaturation at 95 1C for 15min.
Table 1. Bacteria used in the validation of Clostridium coccoides–Eubacterium rectale-specific PCR and the results of the PCR specificity tests
Clostridial cluster� Species Strainw PCR resultz
XIV Anaerostipes caccae VTT E-052773 (DSM 14662) 1
XIV Clostridium bolteae VTT E-052776 (DSM 15670) 1
XIV Clostridium clostridioforme VTT E-052777 (DSM 933) 1
XIV Clostridium coccoides VTT E-052778 (DSM 935) 1
XIV Clostridium indolis VTT E-042445 (DSM 755) 1
XIV Clostridium symbiosum VTT E-981051 (DSM 934) 1
XIV Dorea longicatena VTT E-052788 (DSM 13814) 1
XIV Eubacterium eligens VTT E-052844 (DSM 33769) 1‰
XIV Eubacterium hallii VTT E-052783 (DSM 3353) 1
XIV Eubacterium ramulus VTT E-052783 (DSM 15684) 1
XIV Lachnospira multipara VTT E-052784 (DSM 3073) 1
XIV Roseburia intestinalis VTT E-052785 (DSM 14610) 1
XIV Ruminococcus productus VTT E-052786 (DSM 2950) 1z
I Clostridium acetobutylicum VTT E-93498 �I Clostridium butyricum VTT E-97426 (DSM 10702) �I Clostridium perfringens VTT E-98861 (ATCC 13124) �II Clostridium histolyticum VTT E-052779 (DSM 2158) �IV Clostridium leptum VTT E-021850 (DSM 753) �IX Megasphera elsdenii VTT E-84221 (DSM 20460) �IX Pectinatus cerevisiiphilis VTT E-79103 (ATCC 29359) �IX Selenomonas lacticifex VTT E-90407 (DSM 20757) �XI Clostridium lituseburense VTT E-021853 (DSM 797) �XIX Fusobacterium necrophorum VTT E-001739 (ATCC 25286) �XIX Fusobacterium nucleatum ssp. nucleatum VTT E-052770 (RHI 4184) �
Atopobium parvulum VTT E-052774 (DSM 20469) �Bacteroides fragilis VTT E-022248 (DSM 2151) �Bifidobacterium longum VTT E-96664 (DSM 20219) �Collinsella aerofaciens VTT E-052787 (DSM 3979) �Desulfovibrio desulfuricans ssp. desulfuricans VTT E-95573 (DSM 642) �Eggerthella lenta VTT E-001735 (ATCC 25559) �Enterococcus faecalis VTT E-93203 (DSM 20478) �Enterococcus faecium VTT E-93204 (DSM 20477) �Escherichia coli VTT E-94564 (DSM 30083) �Lactobacillus salivarius VTT E-97853 (DSM 20555) �Klebsiella terrigena VTT E-96696 �Pediococcus acidilactici VTT E-93493 (DSM 20284) �Prevotella melaninogenica VTT E-052771 (ATCC 25845) �Veillonella parvula VTT E-001737 (ATCC 10790) �
�Clostridial phylogenetic cluster number (Collins et al., 1994).wDSM, www.dsmz.de; ATCC, www.lgcpromochem-atcc.com; VTT, www.inf.vtt.fi/pdf/tiedotteet/1999/T1980.pdf.z1, positive PCR result; � , negative PCR result. Each positive strain produced one strong band in DGGE unless otherwise stated.‰Three strong bands in the DGGE profile, one band in agarose gel after PCR.zTwo strong bands in the DGGE profile, one band in agarose gel after PCR.
FEMS Microbiol Ecol 58 (2006) 517–528 c� 2006 Federation of European Microbiological SocietiesPublished by Blackwell Publishing Ltd. All rights reserved
519Erec-DGGE shows diversity in human intestinal microbiota
particular, has an important role in the metabolism and
normal development of colonic epithelial cells and it has
been implicated in protection against cancer and ulcerative
colitis (Cummings & MacFarlane, 1997). Barcenilla et al.
(2000) showed that 80% of the butyrate-producing isolates
of human faecal origin belonged to the clostridial phyloge-
netic cluster XIVa. On the other hand, Clostridium bolteae,
which also belongs to the clostridial cluster XIVa, is postu-
lated to have a role in childhood autism (Song et al., 2004).
The aim of the present study was to develop both DNA-
and RNA-based denaturing gradient gel electrophoresis
(DGGE) methods using 16S rRNA and its corresponding
gene for the detection of the diversity and temporal stability
of the Erec group (clostridial phylogenetic cluster XIVa)
from human faeces. In addition, the proportion of the Erec
group in the total microbiota was evaluated with a recently
developed multiplexed and quantitative hybridization-based
technique (Satokari et al., 2005). Furthermore, the diversity
and temporal stability of the predominant bacterial micro-
biota were studied with both DNA- and RNA-based DGGE
to assess the possible correlation between the temporal
stability of the E. rectale–C. coccoides group and the pre-
dominant microbiota.
Materials and methods
Bacterial strains
The bacterial reference strains used for the optimization and
validation of PCR and PCR-DGGE of the Erec group (phylo-
genetic cluster XIVa; Collins et al., 1994) are described in Table
1. The reference strains were grown on media recommended
by the culture collections providing the strains.
Human faecal samples
The subject group consisted of three male and nine female
subjects who were 34–63 years of age. Faecal samples were
obtained on two occasions 6 months apart (0 and 6 months;
subjects 5–12). For a longer-term stability study, samples
were obtained on four occasions (0, 3, 6, and 24 months;
subjects 1–4). The main recruiting criterion was a good
(normal) intestinal balance [absence of repeating and/or
persisting gastrointestinal (GI) symptoms]. The exclusion
criteria were regular GI-tract symptoms, lactose intolerance,
celiac disease, and antimicrobial therapy during the 2
months immediately prior to each sampling point. The
subjects defaecated into a plastic container, which was then
made anaerobic with gas generators (Anaerocult A mini,
Merck, Darmstadt, Germany) placed on the lid of the
container. The samples were transported to the laboratory
and processed in an anaerobic workstation (Don Whitley
Scientific Ltd, Shipley, UK) within 0–4 h of the defaecation.
The samples were maintained at � 70 1C until analysed.
The study was approved by the ethical committee of VTT
Technical Research Centre of Finland, Espoo, Finland.
DNA extraction
DNA was extracted from reference strains and 300mg of
faecal material using a FastDNA Spin Kit for Soil (QBIO-
gene, Carlsbad, CA) according to the manufacturer’s in-
structions but with one modification: the bacterial cells were
broken with a Fast Prep instrument (Bio 101 Savant,
Holbrook, NY) at 6.0m s�1 for 60 s from one (reference
strains) to three (some clostridial reference strains and
human faecal samples) times. The isolated DNA was stored
at � 20 1C until examined.
RNA extraction and biotinylation
RNA was extracted from reference strains and faeces as
previously described by Satokari et al. (2005) and further
purified using the clean-up protocol of the RNeasy mini kit
(Qiagen, Hilden, Germany). RNA concentration and purity
were determined spectrophotometrically (A260 nm/A280 nm;
BioPhotometer 6131, Eppendorf, Hamburg, Germany),
and the integrity of RNA was evaluated with agarose gel
electrophoresis in which 23S and 16S RNAwere observed.
Purified RNA used for quantitative analysis (TRAC; see
below) was biotinylated using Photoprobes Biotin (Vector
Laboratories, CA). Biotinylation was performed by exposing
the reaction to long-wave UV light (365 nm) for 30min, and
the subsequent purification of the RNA from free biotin was
performed according to the manufacturer’s instructions and
as described by Satokari et al. (2005).
PCR and reverse transcription PCR of the Erecgroup
Twenty-four primer combinations, four MgCl2 concentra-
tions, BSA and formamide additions, 11 annealing tempera-
tures, and three cycle numbers were tested in preliminary
experiments. The partial 16S rRNA gene of the C. coccoi-
des–E.rectale group was subsequently PCR-amplified for
DGGE using primer pairs Ccoc-f and Ccoc-r1GC in addi-
tion to Ccoc-f1GC and Ccoc-r (Table 2). Optimized PCR
amplifications were performed in a total volume of 50mLcontaining 1 mL of appropriately diluted template DNA,
0.4 mM of both primers, 0.2mM dNTP, and 1.25 units of
Taq polymerase (Invitrogen, Carlsbad, CA) in a reaction
buffer with 20mM Tris-HCl (pH 8.4), 50mM KCl, and
2mM MgCl2. The PCR program consisted of initial dena-
turing at 94 1C for 5min, followed by 30 cycles of denaturing
at 94 1C for 45 s, primer annealing at 54 1C for 30 s, and
elongation at 72 1C for 60 s, and a final extension at 72 1C for
30min. PCR products of the expected size were obtained
with both primer pairs. Primers Ccoc-f and Ccoc-r1GC
FEMS Microbiol Ecol 58 (2006) 517–528c� 2006 Federation of European Microbiological SocietiesPublished by Blackwell Publishing Ltd. All rights reserved
518 J. Maukonen et al.
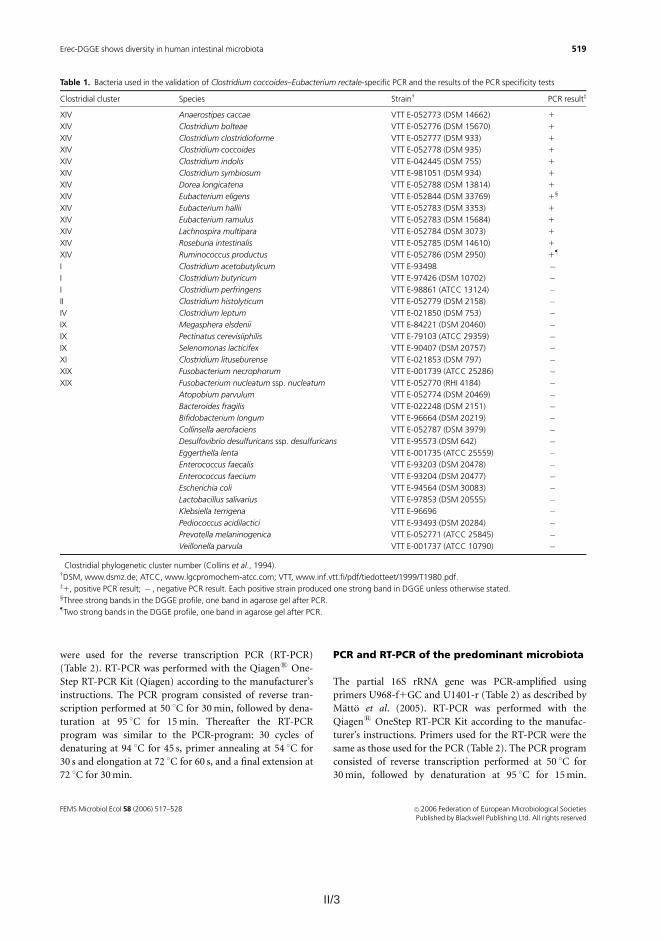
II/3
were used for the reverse transcription PCR (RT-PCR)
(Table 2). RT-PCR was performed with the Qiagens One-
Step RT-PCR Kit (Qiagen) according to the manufacturer’s
instructions. The PCR program consisted of reverse tran-
scription performed at 50 1C for 30min, followed by dena-
turation at 95 1C for 15min. Thereafter the RT-PCR
program was similar to the PCR-program: 30 cycles of
denaturing at 94 1C for 45 s, primer annealing at 54 1C for
30 s and elongation at 72 1C for 60 s, and a final extension at
72 1C for 30min.
PCR and RT-PCR of the predominant microbiota
The partial 16S rRNA gene was PCR-amplified using
primers U968-f1GC and U1401-r (Table 2) as described by
Matto et al. (2005). RT-PCR was performed with the
Qiagens OneStep RT-PCR Kit according to the manufac-
turer’s instructions. Primers used for the RT-PCR were the
same as those used for the PCR (Table 2). The PCR program
consisted of reverse transcription performed at 50 1C for
30min, followed by denaturation at 95 1C for 15min.
Table 1. Bacteria used in the validation of Clostridium coccoides–Eubacterium rectale-specific PCR and the results of the PCR specificity tests
Clostridial cluster� Species Strainw PCR resultz
XIV Anaerostipes caccae VTT E-052773 (DSM 14662) 1
XIV Clostridium bolteae VTT E-052776 (DSM 15670) 1
XIV Clostridium clostridioforme VTT E-052777 (DSM 933) 1
XIV Clostridium coccoides VTT E-052778 (DSM 935) 1
XIV Clostridium indolis VTT E-042445 (DSM 755) 1
XIV Clostridium symbiosum VTT E-981051 (DSM 934) 1
XIV Dorea longicatena VTT E-052788 (DSM 13814) 1
XIV Eubacterium eligens VTT E-052844 (DSM 33769) 1‰
XIV Eubacterium hallii VTT E-052783 (DSM 3353) 1
XIV Eubacterium ramulus VTT E-052783 (DSM 15684) 1
XIV Lachnospira multipara VTT E-052784 (DSM 3073) 1
XIV Roseburia intestinalis VTT E-052785 (DSM 14610) 1
XIV Ruminococcus productus VTT E-052786 (DSM 2950) 1z
I Clostridium acetobutylicum VTT E-93498 �I Clostridium butyricum VTT E-97426 (DSM 10702) �I Clostridium perfringens VTT E-98861 (ATCC 13124) �II Clostridium histolyticum VTT E-052779 (DSM 2158) �IV Clostridium leptum VTT E-021850 (DSM 753) �IX Megasphera elsdenii VTT E-84221 (DSM 20460) �IX Pectinatus cerevisiiphilis VTT E-79103 (ATCC 29359) �IX Selenomonas lacticifex VTT E-90407 (DSM 20757) �XI Clostridium lituseburense VTT E-021853 (DSM 797) �XIX Fusobacterium necrophorum VTT E-001739 (ATCC 25286) �XIX Fusobacterium nucleatum ssp. nucleatum VTT E-052770 (RHI 4184) �
Atopobium parvulum VTT E-052774 (DSM 20469) �Bacteroides fragilis VTT E-022248 (DSM 2151) �Bifidobacterium longum VTT E-96664 (DSM 20219) �Collinsella aerofaciens VTT E-052787 (DSM 3979) �Desulfovibrio desulfuricans ssp. desulfuricans VTT E-95573 (DSM 642) �Eggerthella lenta VTT E-001735 (ATCC 25559) �Enterococcus faecalis VTT E-93203 (DSM 20478) �Enterococcus faecium VTT E-93204 (DSM 20477) �Escherichia coli VTT E-94564 (DSM 30083) �Lactobacillus salivarius VTT E-97853 (DSM 20555) �Klebsiella terrigena VTT E-96696 �Pediococcus acidilactici VTT E-93493 (DSM 20284) �Prevotella melaninogenica VTT E-052771 (ATCC 25845) �Veillonella parvula VTT E-001737 (ATCC 10790) �
�Clostridial phylogenetic cluster number (Collins et al., 1994).wDSM, www.dsmz.de; ATCC, www.lgcpromochem-atcc.com; VTT, www.inf.vtt.fi/pdf/tiedotteet/1999/T1980.pdf.z1, positive PCR result; � , negative PCR result. Each positive strain produced one strong band in DGGE unless otherwise stated.‰Three strong bands in the DGGE profile, one band in agarose gel after PCR.zTwo strong bands in the DGGE profile, one band in agarose gel after PCR.
FEMS Microbiol Ecol 58 (2006) 517–528 c� 2006 Federation of European Microbiological SocietiesPublished by Blackwell Publishing Ltd. All rights reserved
519Erec-DGGE shows diversity in human intestinal microbiota
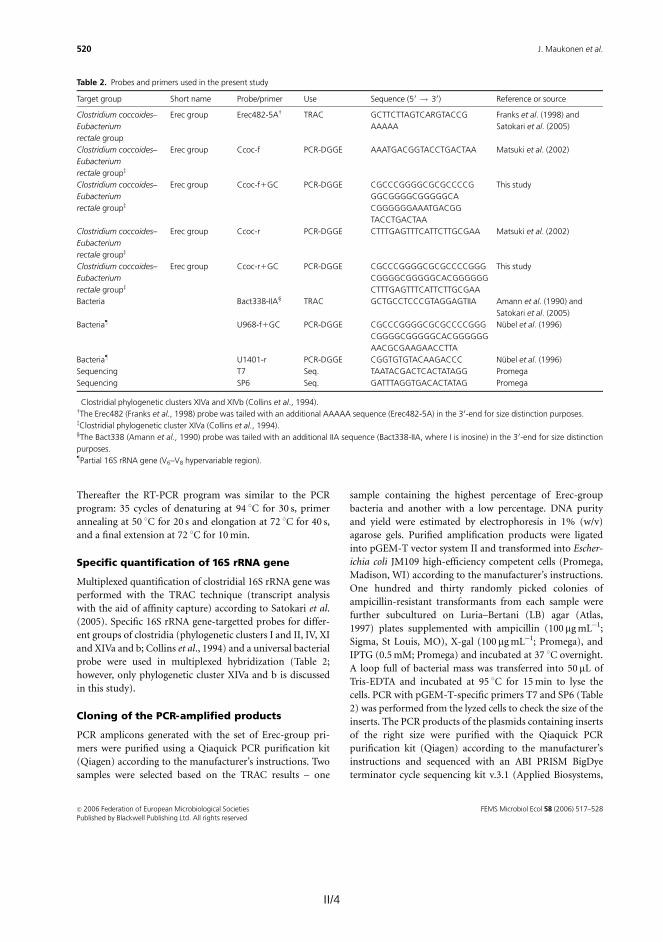
II/4 II/5
Foster City, CA) according to the manufacturer’s instruc-
tions using the primer T7. All the sequences were analysed
with an ABI PRISM 3100 automated capillary DNA cycle
sequencer (Applied Biosystems) and checked and edited
with the CHROMAS program (Technelysium Pty Ltd, Helens-
vale, Australia). CLUSTALW (http://align.genome.jp) was used
for the alignment of the sequences and for checking of the
sequence similarities. All unequal sequences were thereafter
identified through the GenBank database (www.ncbi.nlm.-
nih.gov) using the BLAST (basic local alignment search tool)
algorithm (Altschul et al., 1997) and using the ‘Classifier’
tool of the Ribosomal Database Project (RDP) II (Cole et al.,
2005). CLUSTALW and DNAMAN 4.1 (Lynnon BioSoft) were
used for the creation of operational taxonomic units
(OTUs). An OTU, as employed here, consisted of all
sequences with less than 2% divergence from 440 aligned
homologous sequences (Suau et al., 1999). Phylogenetic
analysis of OTU subgroups was performed with DNAMAN
4.1. One representative of each OTU was deposited in the
GenBank database, and the sequences are available under
the accession numbers DQ307759–DQ307802.
DGGE analysis of 16S rRNA gene fragments
DGGE analysis of predominant bacteria was performed as
described by Matto et al. (2005). The primer pair Ccoc-f and
Ccoc-r1GC was chosen for the analysis of the samples with
DGGE because of specificity and optimal migration. DGGE
analysis of the Erec group of clostridia was similar to the
DGGE analysis of predominant bacteria. Various denaturing
gradients were tested and subsequently a denaturing gradi-
ent from 38 to 60% [where 100% is 7M urea and 40% (v/v)
deionized formamide] was chosen because of optimal
migration and differentiation. The similarity of the PCR-
DGGE profiles of the samples obtained from a single subject
at different sampling points was compared in order to
evaluate the temporal stability of the predominant and
clostridial faecal bacterial populations. The comparison of
the profiles was performed by calculating a similarity
percentage using BIONUMERICS software version 4.01 (Ap-
plied Maths BVBA, Sint-Martens-Latem, Belgium). Cluster-
ing was performed with Pearson correlation and the
unweighted-pair group method (UPGMA). Amplicons with
a total surface area of at least 1% were included in the
similarity analysis.
After sequence analysis of the clones, all the clones with
different sequences were subjected to Erec-PCR-DGGE,
after which the migration of each clone was compared with
the migration of different amplicons in the original sample.
Statistical analysis
The mean and standard deviation were calculated for
each experiment. Student’s t-test (two-sample assuming
unequal variances) was used for the statistical analysis of
the results.
Results
Optimization and validation of PCR-DGGE andRT-PCR-DGGE of the Erec group
When the specificity of primer pairs Ccoc-f�Ccoc-r1GC
and Ccoc-f1GC�Ccoc-r (Table 2) was evaluated with
reference strains, the primers gave positive PCR results for
all the target bacteria belonging to the clostridial phyloge-
netic cluster XIVa (Table 1). No false-positive results were
obtained (Table 1). In most cases only one strong or one
strong and one additive weak band was/were seen in the
DGGE profiles of the reference strains. However, the DGGE
profiles of Ruminococcus productus and Eubacterium eligens
contained two and three strong bands, respectively (Table
1). Most of the amplicons of the used reference strains
migrated differently and could thus be distinguished. How-
ever, the amplicons of Clostridium bolteae, Clostridium
clostridioforme, and C. coccoides migrated to the same
position (data not shown).
Two samples were cloned after Erec-PCR to validate the
specificity of the newly developed method. All the sequenced
205 clones belonged to the Erec clostridial cluster XIVa, as
expected. The 108 clones of subject 4 fell into 21 OTUs, and
the 97 clones of subject 6 into 22 OTUs, when an OTU was
defined as a phylogenetic group that consisted of members
having over 98% sequence similarity to each other. The
DGGE profiles of the cloned samples and the sequence
information obtained from the cloning and Erec-DGGE are
presented in Figs 1 and 2. OTU 5 (band number 9) of subject
4 was divided into two subgroups: OTUs 5A and 5B, since,
according to the BLAST results, OTUs 5A and 5B had 100%
similarity to different species (although having over 98%
similarity to each other; Fig. 1). Similarly, OTU 21 (band
numbers 3, 7, 11, 12, and 13) of subject 6 was divided into
subgroups according to phylogenetic analysis and migration
in the DGGE gel (Fig. 2). When cloned samples 4.1 and 6.1
were run in the same DGGE gel, several amplicons migrated
similarly – for example band number 2 of sample 4.1
migrated similarly to band number 2 of sample 6.1, and
both were identified as Anaerostipes IE4 (Fig. 1).
Proportion, diversity and temporal stability ofthe C. coccoides--E. rectale group from faecalsamples of healthy adults
DNA-based PCR-DGGE and RNA-based RT-PCR-DGGE
analyses targetted to the C. coccoides–E. rectale group
showed intraindividual diversity of the faecal microbiota
(Fig. 3). In addition, the interindividual profiles were
divergent (Figs 3 and 4). After comparison of both DNA-
FEMS Microbiol Ecol 58 (2006) 517–528 c� 2006 Federation of European Microbiological SocietiesPublished by Blackwell Publishing Ltd. All rights reserved
521Erec-DGGE shows diversity in human intestinal microbiota
Thereafter the RT-PCR program was similar to the PCR
program: 35 cycles of denaturing at 94 1C for 30 s, primer
annealing at 50 1C for 20 s and elongation at 72 1C for 40 s,
and a final extension at 72 1C for 10min.
Specific quantification of 16S rRNA gene
Multiplexed quantification of clostridial 16S rRNA gene was
performed with the TRAC technique (transcript analysis
with the aid of affinity capture) according to Satokari et al.
(2005). Specific 16S rRNA gene-targetted probes for differ-
ent groups of clostridia (phylogenetic clusters I and II, IV, XI
and XIVa and b; Collins et al., 1994) and a universal bacterial
probe were used in multiplexed hybridization (Table 2;
however, only phylogenetic cluster XIVa and b is discussed
in this study).
Cloning of the PCR-amplified products
PCR amplicons generated with the set of Erec-group pri-
mers were purified using a Qiaquick PCR purification kit
(Qiagen) according to the manufacturer’s instructions. Two
samples were selected based on the TRAC results – one
sample containing the highest percentage of Erec-group
bacteria and another with a low percentage. DNA purity
and yield were estimated by electrophoresis in 1% (w/v)
agarose gels. Purified amplification products were ligated
into pGEM-T vector system II and transformed into Escher-
ichia coli JM109 high-efficiency competent cells (Promega,
Madison, WI) according to the manufacturer’s instructions.
One hundred and thirty randomly picked colonies of
ampicillin-resistant transformants from each sample were
further subcultured on Luria–Bertani (LB) agar (Atlas,
1997) plates supplemented with ampicillin (100 mgmL�1;
Sigma, St Louis, MO), X-gal (100mgmL�1; Promega), and
IPTG (0.5mM; Promega) and incubated at 37 1C overnight.
A loop full of bacterial mass was transferred into 50 mL of
Tris-EDTA and incubated at 95 1C for 15min to lyse the
cells. PCR with pGEM-T-specific primers T7 and SP6 (Table
2) was performed from the lyzed cells to check the size of the
inserts. The PCR products of the plasmids containing inserts
of the right size were purified with the Qiaquick PCR
purification kit (Qiagen) according to the manufacturer’s
instructions and sequenced with an ABI PRISM BigDye
terminator cycle sequencing kit v.3.1 (Applied Biosystems,
Table 2. Probes and primers used in the present study
Target group Short name Probe/primer Use Sequence (50 ! 30) Reference or source
Clostridium coccoides–
Eubacterium
rectale group�
Erec group Erec482-5Aw TRAC GCTTCTTAGTCARGTACCG
AAAAA
Franks et al. (1998) and
Satokari et al. (2005)
Clostridium coccoides–
Eubacterium
rectale groupz
Erec group Ccoc-f PCR-DGGE AAATGACGGTACCTGACTAA Matsuki et al. (2002)
Clostridium coccoides–
Eubacterium
rectale groupz
Erec group Ccoc-f1GC PCR-DGGE CGCCCGGGGCGCGCCCCG
GGCGGGGCGGGGGCA
CGGGGGGAAATGACGG
TACCTGACTAA
This study
Clostridium coccoides–
Eubacterium
rectale groupz
Erec group Ccoc-r PCR-DGGE CTTTGAGTTTCATTCTTGCGAA Matsuki et al. (2002)
Clostridium coccoides–
Eubacterium
rectale groupz
Erec group Ccoc-r1GC PCR-DGGE CGCCCGGGGCGCGCCCCGGG
CGGGGCGGGGGCACGGGGGG
CTTTGAGTTTCATTCTTGCGAA
This study
Bacteria Bact338-IIA‰ TRAC GCTGCCTCCCGTAGGAGTIIA Amann et al. (1990) and
Satokari et al. (2005)
Bacteriaz U968-f1GC PCR-DGGE CGCCCGGGGCGCGCCCCGGG
CGGGGCGGGGGCACGGGGGG
AACGCGAAGAACCTTA
Nubel et al. (1996)
Bacteriaz U1401-r PCR-DGGE CGGTGTGTACAAGACCC Nubel et al. (1996)
Sequencing T7 Seq. TAATACGACTCACTATAGG Promega
Sequencing SP6 Seq. GATTTAGGTGACACTATAG Promega
�Clostridial phylogenetic clusters XIVa and XIVb (Collins et al., 1994).wThe Erec482 (Franks et al., 1998) probe was tailed with an additional AAAAA sequence (Erec482-5A) in the 3 0-end for size distinction purposes.zClostridial phylogenetic cluster XIVa (Collins et al., 1994).‰The Bact338 (Amann et al., 1990) probe was tailed with an additional IIA sequence (Bact338-IIA, where I is inosine) in the 30-end for size distinction
purposes.zPartial 16S rRNA gene (V6–V8 hypervariable region).
FEMS Microbiol Ecol 58 (2006) 517–528c� 2006 Federation of European Microbiological SocietiesPublished by Blackwell Publishing Ltd. All rights reserved
520 J. Maukonen et al.
II/5
Foster City, CA) according to the manufacturer’s instruc-
tions using the primer T7. All the sequences were analysed
with an ABI PRISM 3100 automated capillary DNA cycle
sequencer (Applied Biosystems) and checked and edited
with the CHROMAS program (Technelysium Pty Ltd, Helens-
vale, Australia). CLUSTALW (http://align.genome.jp) was used
for the alignment of the sequences and for checking of the
sequence similarities. All unequal sequences were thereafter
identified through the GenBank database (www.ncbi.nlm.-
nih.gov) using the BLAST (basic local alignment search tool)
algorithm (Altschul et al., 1997) and using the ‘Classifier’
tool of the Ribosomal Database Project (RDP) II (Cole et al.,
2005). CLUSTALW and DNAMAN 4.1 (Lynnon BioSoft) were
used for the creation of operational taxonomic units
(OTUs). An OTU, as employed here, consisted of all
sequences with less than 2% divergence from 440 aligned
homologous sequences (Suau et al., 1999). Phylogenetic
analysis of OTU subgroups was performed with DNAMAN
4.1. One representative of each OTU was deposited in the
GenBank database, and the sequences are available under
the accession numbers DQ307759–DQ307802.
DGGE analysis of 16S rRNA gene fragments
DGGE analysis of predominant bacteria was performed as
described by Matto et al. (2005). The primer pair Ccoc-f and
Ccoc-r1GC was chosen for the analysis of the samples with
DGGE because of specificity and optimal migration. DGGE
analysis of the Erec group of clostridia was similar to the
DGGE analysis of predominant bacteria. Various denaturing
gradients were tested and subsequently a denaturing gradi-
ent from 38 to 60% [where 100% is 7M urea and 40% (v/v)
deionized formamide] was chosen because of optimal
migration and differentiation. The similarity of the PCR-
DGGE profiles of the samples obtained from a single subject
at different sampling points was compared in order to
evaluate the temporal stability of the predominant and
clostridial faecal bacterial populations. The comparison of
the profiles was performed by calculating a similarity
percentage using BIONUMERICS software version 4.01 (Ap-
plied Maths BVBA, Sint-Martens-Latem, Belgium). Cluster-
ing was performed with Pearson correlation and the
unweighted-pair group method (UPGMA). Amplicons with
a total surface area of at least 1% were included in the
similarity analysis.
After sequence analysis of the clones, all the clones with
different sequences were subjected to Erec-PCR-DGGE,
after which the migration of each clone was compared with
the migration of different amplicons in the original sample.
Statistical analysis
The mean and standard deviation were calculated for
each experiment. Student’s t-test (two-sample assuming
unequal variances) was used for the statistical analysis of
the results.
Results
Optimization and validation of PCR-DGGE andRT-PCR-DGGE of the Erec group
When the specificity of primer pairs Ccoc-f�Ccoc-r1GC
and Ccoc-f1GC�Ccoc-r (Table 2) was evaluated with
reference strains, the primers gave positive PCR results for
all the target bacteria belonging to the clostridial phyloge-
netic cluster XIVa (Table 1). No false-positive results were
obtained (Table 1). In most cases only one strong or one
strong and one additive weak band was/were seen in the
DGGE profiles of the reference strains. However, the DGGE
profiles of Ruminococcus productus and Eubacterium eligens
contained two and three strong bands, respectively (Table
1). Most of the amplicons of the used reference strains
migrated differently and could thus be distinguished. How-
ever, the amplicons of Clostridium bolteae, Clostridium
clostridioforme, and C. coccoides migrated to the same
position (data not shown).
Two samples were cloned after Erec-PCR to validate the
specificity of the newly developed method. All the sequenced
205 clones belonged to the Erec clostridial cluster XIVa, as
expected. The 108 clones of subject 4 fell into 21 OTUs, and
the 97 clones of subject 6 into 22 OTUs, when an OTU was
defined as a phylogenetic group that consisted of members
having over 98% sequence similarity to each other. The
DGGE profiles of the cloned samples and the sequence
information obtained from the cloning and Erec-DGGE are
presented in Figs 1 and 2. OTU 5 (band number 9) of subject
4 was divided into two subgroups: OTUs 5A and 5B, since,
according to the BLAST results, OTUs 5A and 5B had 100%
similarity to different species (although having over 98%
similarity to each other; Fig. 1). Similarly, OTU 21 (band
numbers 3, 7, 11, 12, and 13) of subject 6 was divided into
subgroups according to phylogenetic analysis and migration
in the DGGE gel (Fig. 2). When cloned samples 4.1 and 6.1
were run in the same DGGE gel, several amplicons migrated
similarly – for example band number 2 of sample 4.1
migrated similarly to band number 2 of sample 6.1, and
both were identified as Anaerostipes IE4 (Fig. 1).
Proportion, diversity and temporal stability ofthe C. coccoides--E. rectale group from faecalsamples of healthy adults
DNA-based PCR-DGGE and RNA-based RT-PCR-DGGE
analyses targetted to the C. coccoides–E. rectale group
showed intraindividual diversity of the faecal microbiota
(Fig. 3). In addition, the interindividual profiles were
divergent (Figs 3 and 4). After comparison of both DNA-
FEMS Microbiol Ecol 58 (2006) 517–528 c� 2006 Federation of European Microbiological SocietiesPublished by Blackwell Publishing Ltd. All rights reserved
521Erec-DGGE shows diversity in human intestinal microbiota

II/6 II/7
Fig. 2. The cloned and sequenced bands from
the Clostridium coccoides–Eubacterium rectale
group-specific PCR-DGGE of the baseline sam-
ple of subject 6 (n.d., the clone is not visible in
the community profile).
Fig. 3. DNA-based long-term stability study from faeces of three healthy adults with Clostridium coccoides–Eubacterium rectale group-specific PCR-
DGGE. The samples were obtained at time points 0 (1.1, 2.1, 3.1), 3 months (1.2, 2.2, 3.2), 6 months (1.3, 2.3, 3.3), and 2 years (1.4, 2.4, 3.4). EM, Erec
marker.
FEMS Microbiol Ecol 58 (2006) 517–528 c� 2006 Federation of European Microbiological SocietiesPublished by Blackwell Publishing Ltd. All rights reserved
523Erec-DGGE shows diversity in human intestinal microbiota
and RNA-based profiles with BIONUMERICS software – using
Pearson correlation for similarity analysis and UPGMA
for clustering of the profiles – all samples of a given
subject clustered together in most of the cases (nine out
of 12 subjects). Only samples of three subjects (subjects 1, 9,
and 11) clustered within another subject’s cluster
(Fig. 4). The DNA-based profiles of 10 out of 12 subjects
and the RNA-based profiles of eight out of 12 subjects
were stable or rather stable in the 6-month follow-up study
(Fig. 4). When DNA- and RNA-based profiles from the
same time point of a given subject were compared, nine
DNA vs. RNA profiles out of 12 from baseline and 10
out of 12 from the 6-month sampling point were similar
(data not shown). The long-term study (2-year period)
showed that the DNA-based profiles of subjects 3 and 1
were unstable or rather unstable, respectively, and the
profiles of subjects 2 and 4 contained minor differences
(Figs 3 and 5).
The C. coccoides–E. rectale group comprised an average of
45% (range 18–71%) of the total bacteria from human
faecal samples as detected with the hybridization-based
TRAC technique (Table 3). There were clear differences in
intraindividual temporal stability (change in proportions
between the two sampling points; Table 3).
Stability and diversity of the predominantbacteria from faecal samples of healthy adults
Both DNA- and RNA-based DGGE analyses targetted to the
predominant bacterial population showed considerable in-
traindividual diversity as well as uniqueness of the faecal
microbiota. The DNA- and RNA-based profiles in the
follow-up study (6 months) were stable or rather stable in
nine out of 12 subjects (data not shown), and in the DNA-
based long-term study (2 years) in two out of four subjects
(Fig. 5). When DNA- and RNA-based profiles from the same
time point of a given subject were compared, the temporal
intraindividual similarity values of RT-PCR-DGGE and
PCR-DGGE profiles were significantly higher than the
intraindividual similarity values between DNA- and RNA-
based DGGE profiles (Po 0.05) (data not shown). How-
ever, since each individual had unique PCR-DGGE and RT-
PCR-DGGE profiles, the intraindividual RNA- and DNA-
based DGGE profiles resembled each other more than the
interindividual RNA-based profiles (data not shown).
Discussion
The aim of this study was to develop both DNA- and RNA-
based population analysis techniques (DGGE) for the
Fig. 1. The cloned and sequenced bands from
the Clostridium coccoides–Eubacterium rectale-
specific PCR-DGGE of the baseline sample of
subject 4 (n.d., the clone is not visible in the
community profile).
FEMS Microbiol Ecol 58 (2006) 517–528c� 2006 Federation of European Microbiological SocietiesPublished by Blackwell Publishing Ltd. All rights reserved
522 J. Maukonen et al.
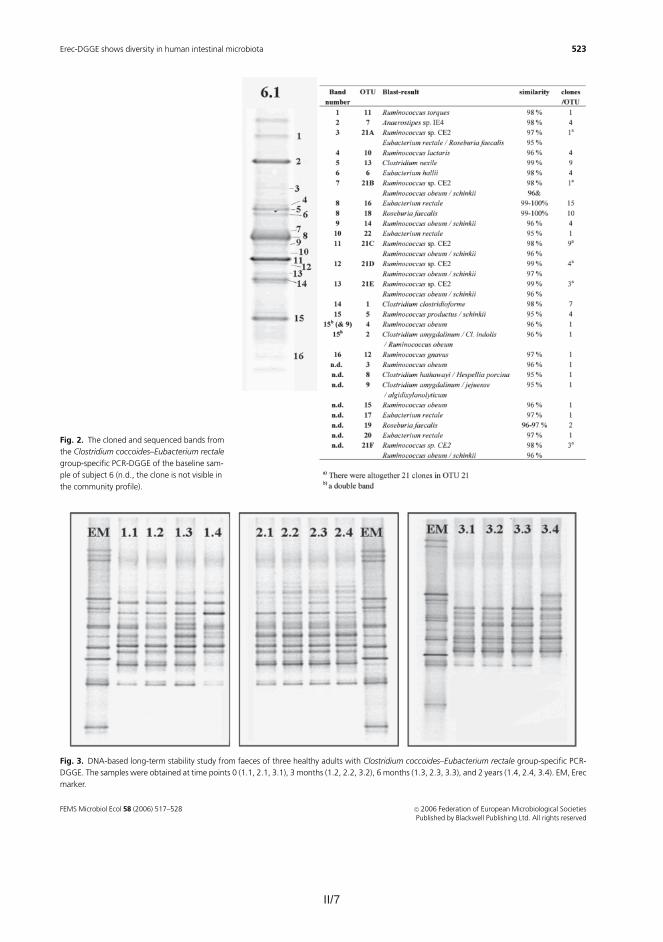
II/7
Fig. 2. The cloned and sequenced bands from
the Clostridium coccoides–Eubacterium rectale
group-specific PCR-DGGE of the baseline sam-
ple of subject 6 (n.d., the clone is not visible in
the community profile).
Fig. 3. DNA-based long-term stability study from faeces of three healthy adults with Clostridium coccoides–Eubacterium rectale group-specific PCR-
DGGE. The samples were obtained at time points 0 (1.1, 2.1, 3.1), 3 months (1.2, 2.2, 3.2), 6 months (1.3, 2.3, 3.3), and 2 years (1.4, 2.4, 3.4). EM, Erec
marker.
FEMS Microbiol Ecol 58 (2006) 517–528 c� 2006 Federation of European Microbiological SocietiesPublished by Blackwell Publishing Ltd. All rights reserved
523Erec-DGGE shows diversity in human intestinal microbiota
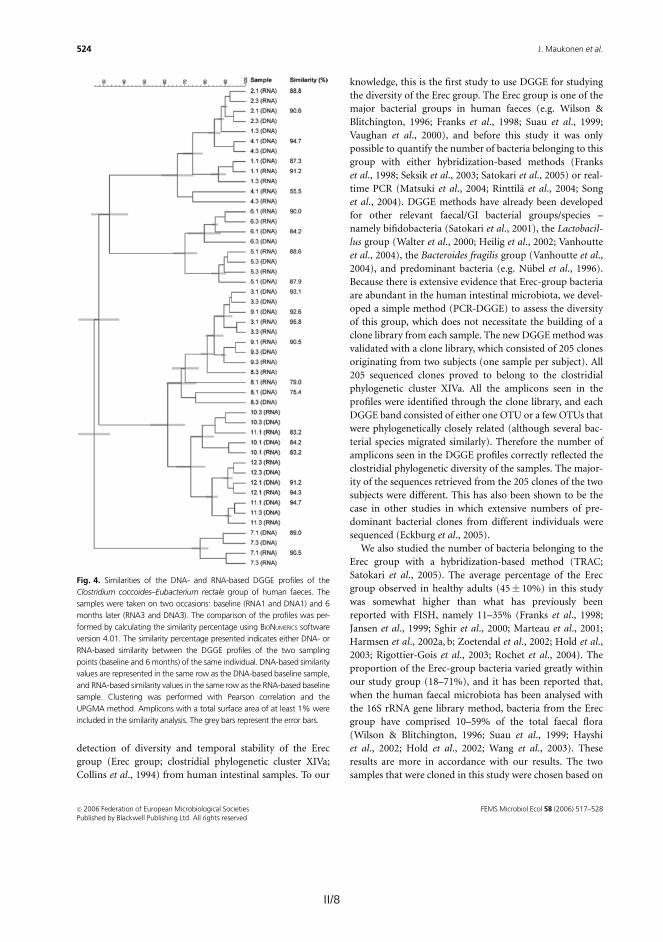
II/8 II/9
the results obtained from our hybridization studies – one
sample contained a high percentage of Erec-group bacteria
and the other a low percentage. Our results showed that the
amount of bacteria belonging to the Erec group was not
related to the diversity of that same bacterial group. One
sample (subject 4, baseline sample) containing 71% of Erec-
group bacteria had 15 DGGE bands representing 21OTUs,
whereas another sample containing 27% of Erec-group
Fig. 5. Similarities of the DNA-based DGGE
profiles of the long-term (24 months) study. The
dendogram on the left is based on the profile
similarities of the Clostridium coccoides–Eubac-
terium rectale group, whereas the dendogram
on the right is based on the profile similarities of
the predominant bacterial microbiota. The
comparison of the profiles was performed by
calculating the similarity percentage using BIO-
NUMERICS software version 4.01. Clustering was
performed with Pearson correlation and the
UPGMAmethod. Amplicons with a total surface
area of at least 1% were included in the similar-
ity analysis. The samples were obtained at time
points 0 (1.1, 2.1, 3.1, 4.1), 3 months (1.2, 2.2,
3.2, 4.2), 6 months (1.3, 2.3, 3.3, 4.3), and
2 years (1.4, 2.4, 3.4, 4.4). The grey bars
represent the error bars.
Table 3. Similarity values of DGGE profiles of human faecal samples obtained at two different time points from 12 healthy subjects (baseline and
6 months later) with primers specific to the Clostridium coccoides–Eubacterium rectale (Erec) group of clostridia and with primers that target
predominant microbiota in addition to proportions of the Erec group as quantified with the TRAC technique
Mean� SD Range
Qualitative DGGE analysis
With Erec primers
RNA-based similarity (%)� Baseline vs. 6 months 85.5�10.6 55.5–95.8
DNA-based similarity (%)� Baseline vs. 6 months 88.2�5.8 75.4–94.7
RNA-based diversityw Baseline 13.3�2.3 10–16
RNA-based diversityw 6 months 13.8�1.7 12–17
DNA-based diversityw Baseline 14.3�1.6 12–17
DNA-based diversityw 6 months 14.3�1.9 12–18
With universal bacterial primers
RNA-based similarity (%)� Baseline vs. 6 months 84.2�10.0 68.2–92.4
DNA-based similarity (%)� Baseline vs. 6 months 83.4�13.4 58.8–96.7
RNA-based diversityw Baseline 18.5�3.2 12–25
RNA-based diversityw 6 months 19.0�2.0 16–22
DNA-based diversityw Baseline 32.9�7.4 24–51
DNA-based diversityw 6 months 31.5�5.9 24–42
Quantitative TRAC analysis
Erec (%)z Baseline 44.7�16.0 17.7–71.2
Erec (%)z 6 months 46.0�10.1 35.1–66.9
DErec (%)‰ 9.3�7.9 0.2–22.7
�Similarity values were counted with BIONUMERICS 4.01 software using Pearson correlation. Amplicons with a total surface area of at least 1% were
included in the similarity analysis.wDiversity is presented as the number of amplicons detected by the BIONUMERICS 4.01 software.zPercentage of bacteria that hybridized with the Erec482 probe as determined in triplicate.‰Difference in proportions (%) between the two sampling points.
FEMS Microbiol Ecol 58 (2006) 517–528 c� 2006 Federation of European Microbiological SocietiesPublished by Blackwell Publishing Ltd. All rights reserved
525Erec-DGGE shows diversity in human intestinal microbiota
detection of diversity and temporal stability of the Erec
group (Erec group; clostridial phylogenetic cluster XIVa;
Collins et al., 1994) from human intestinal samples. To our
knowledge, this is the first study to use DGGE for studying
the diversity of the Erec group. The Erec group is one of the
major bacterial groups in human faeces (e.g. Wilson &
Blitchington, 1996; Franks et al., 1998; Suau et al., 1999;
Vaughan et al., 2000), and before this study it was only
possible to quantify the number of bacteria belonging to this
group with either hybridization-based methods (Franks
et al., 1998; Seksik et al., 2003; Satokari et al., 2005) or real-
time PCR (Matsuki et al., 2004; Rinttila et al., 2004; Song
et al., 2004). DGGE methods have already been developed
for other relevant faecal/GI bacterial groups/species –
namely bifidobacteria (Satokari et al., 2001), the Lactobacil-
lus group (Walter et al., 2000; Heilig et al., 2002; Vanhoutte
et al., 2004), the Bacteroides fragilis group (Vanhoutte et al.,
2004), and predominant bacteria (e.g. Nubel et al., 1996).
Because there is extensive evidence that Erec-group bacteria
are abundant in the human intestinal microbiota, we devel-
oped a simple method (PCR-DGGE) to assess the diversity
of this group, which does not necessitate the building of a
clone library from each sample. The new DGGEmethod was
validated with a clone library, which consisted of 205 clones
originating from two subjects (one sample per subject). All
205 sequenced clones proved to belong to the clostridial
phylogenetic cluster XIVa. All the amplicons seen in the
profiles were identified through the clone library, and each
DGGE band consisted of either one OTU or a few OTUs that
were phylogenetically closely related (although several bac-
terial species migrated similarly). Therefore the number of
amplicons seen in the DGGE profiles correctly reflected the
clostridial phylogenetic diversity of the samples. The major-
ity of the sequences retrieved from the 205 clones of the two
subjects were different. This has also been shown to be the
case in other studies in which extensive numbers of pre-
dominant bacterial clones from different individuals were
sequenced (Eckburg et al., 2005).
We also studied the number of bacteria belonging to the
Erec group with a hybridization-based method (TRAC;
Satokari et al., 2005). The average percentage of the Erec
group observed in healthy adults (45� 10%) in this study
was somewhat higher than what has previously been
reported with FISH, namely 11–35% (Franks et al., 1998;
Jansen et al., 1999; Sghir et al., 2000; Marteau et al., 2001;
Harmsen et al., 2002a, b; Zoetendal et al., 2002; Hold et al.,
2003; Rigottier-Gois et al., 2003; Rochet et al., 2004). The
proportion of the Erec-group bacteria varied greatly within
our study group (18–71%), and it has been reported that,
when the human faecal microbiota has been analysed with
the 16S rRNA gene library method, bacteria from the Erec
group have comprised 10–59% of the total faecal flora
(Wilson & Blitchington, 1996; Suau et al., 1999; Hayshi
et al., 2002; Hold et al., 2002; Wang et al., 2003). These
results are more in accordance with our results. The two
samples that were cloned in this study were chosen based on
Fig. 4. Similarities of the DNA- and RNA-based DGGE profiles of the
Clostridium coccoides–Eubacterium rectale group of human faeces. The
samples were taken on two occasions: baseline (RNA1 and DNA1) and 6
months later (RNA3 and DNA3). The comparison of the profiles was per-
formed by calculating the similarity percentage using BIONUMERICS software
version 4.01. The similarity percentage presented indicates either DNA- or
RNA-based similarity between the DGGE profiles of the two sampling
points (baseline and 6 months) of the same individual. DNA-based similarity
values are represented in the same row as the DNA-based baseline sample,
and RNA-based similarity values in the same row as the RNA-based baseline
sample. Clustering was performed with Pearson correlation and the
UPGMA method. Amplicons with a total surface area of at least 1% were
included in the similarity analysis. The grey bars represent the error bars.
FEMS Microbiol Ecol 58 (2006) 517–528c� 2006 Federation of European Microbiological SocietiesPublished by Blackwell Publishing Ltd. All rights reserved
524 J. Maukonen et al.
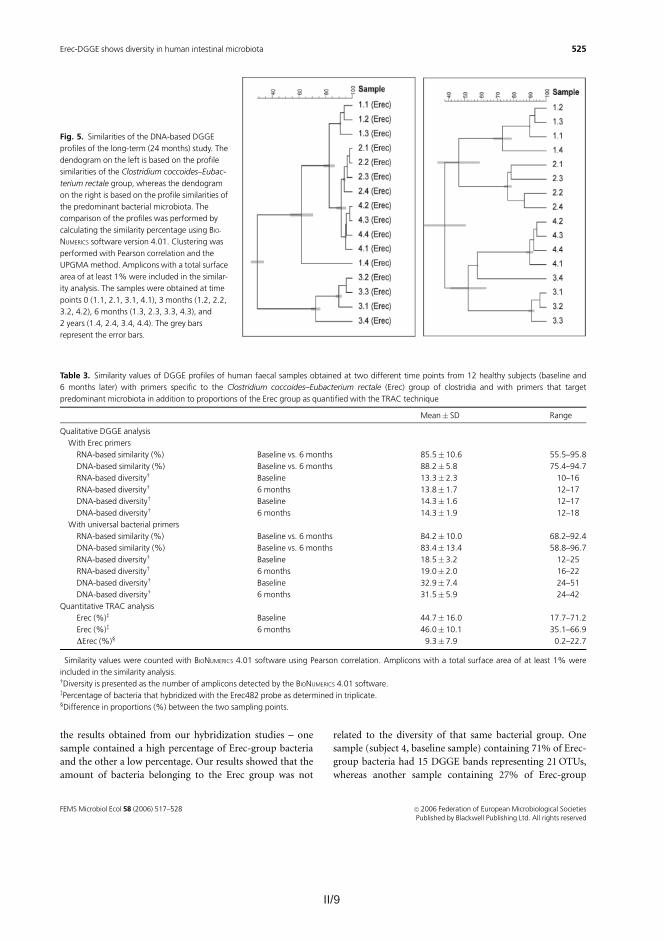
II/9
the results obtained from our hybridization studies – one
sample contained a high percentage of Erec-group bacteria
and the other a low percentage. Our results showed that the
amount of bacteria belonging to the Erec group was not
related to the diversity of that same bacterial group. One
sample (subject 4, baseline sample) containing 71% of Erec-
group bacteria had 15 DGGE bands representing 21OTUs,
whereas another sample containing 27% of Erec-group
Fig. 5. Similarities of the DNA-based DGGE
profiles of the long-term (24 months) study. The
dendogram on the left is based on the profile
similarities of the Clostridium coccoides–Eubac-
terium rectale group, whereas the dendogram
on the right is based on the profile similarities of
the predominant bacterial microbiota. The
comparison of the profiles was performed by
calculating the similarity percentage using BIO-
NUMERICS software version 4.01. Clustering was
performed with Pearson correlation and the
UPGMAmethod. Amplicons with a total surface
area of at least 1% were included in the similar-
ity analysis. The samples were obtained at time
points 0 (1.1, 2.1, 3.1, 4.1), 3 months (1.2, 2.2,
3.2, 4.2), 6 months (1.3, 2.3, 3.3, 4.3), and
2 years (1.4, 2.4, 3.4, 4.4). The grey bars
represent the error bars.
Table 3. Similarity values of DGGE profiles of human faecal samples obtained at two different time points from 12 healthy subjects (baseline and
6 months later) with primers specific to the Clostridium coccoides–Eubacterium rectale (Erec) group of clostridia and with primers that target
predominant microbiota in addition to proportions of the Erec group as quantified with the TRAC technique
Mean� SD Range
Qualitative DGGE analysis
With Erec primers
RNA-based similarity (%)� Baseline vs. 6 months 85.5�10.6 55.5–95.8
DNA-based similarity (%)� Baseline vs. 6 months 88.2�5.8 75.4–94.7
RNA-based diversityw Baseline 13.3�2.3 10–16
RNA-based diversityw 6 months 13.8�1.7 12–17
DNA-based diversityw Baseline 14.3�1.6 12–17
DNA-based diversityw 6 months 14.3�1.9 12–18
With universal bacterial primers
RNA-based similarity (%)� Baseline vs. 6 months 84.2�10.0 68.2–92.4
DNA-based similarity (%)� Baseline vs. 6 months 83.4�13.4 58.8–96.7
RNA-based diversityw Baseline 18.5�3.2 12–25
RNA-based diversityw 6 months 19.0�2.0 16–22
DNA-based diversityw Baseline 32.9�7.4 24–51
DNA-based diversityw 6 months 31.5�5.9 24–42
Quantitative TRAC analysis
Erec (%)z Baseline 44.7�16.0 17.7–71.2
Erec (%)z 6 months 46.0�10.1 35.1–66.9
DErec (%)‰ 9.3�7.9 0.2–22.7
�Similarity values were counted with BIONUMERICS 4.01 software using Pearson correlation. Amplicons with a total surface area of at least 1% were
included in the similarity analysis.wDiversity is presented as the number of amplicons detected by the BIONUMERICS 4.01 software.zPercentage of bacteria that hybridized with the Erec482 probe as determined in triplicate.‰Difference in proportions (%) between the two sampling points.
FEMS Microbiol Ecol 58 (2006) 517–528 c� 2006 Federation of European Microbiological SocietiesPublished by Blackwell Publishing Ltd. All rights reserved
525Erec-DGGE shows diversity in human intestinal microbiota

II/10 II/11
Franks AH, Harmsen HJM, Raangs GC, Jansen GJ, Schut F &
Welling GW (1998) Variations in bacterial populations in
human faeces measured by fluorescent in situ hybridization
with group-specific 16S rRNA-targeted oligonucleotide
probes. Appl Environ Microbiol 64: 3336–3345.
Harmsen HJM, Raangs GC, Franks AH,Wildeboer-Veloo ACM&
Welling GW (2002a) The effect of the prebiotic inulin and the
probiotic Bifidobacterium longum in the fecal microflora of
healthy volunteers measured by FISH and DGGE. Microbiol
Ecol Health Dis 14: 211–219.
Harmsen HJM, Raangs GC, He T, Degener JE & Welling GW
(2002b) Extensive set of 16S rRNA-based probes for detection
of bacteria in human feces. Appl Environ Microbiol 68:
2982–2990.
Hayshi H, Sakamoto M & Benno Y (2002) Phylogenetic analysis
of the human gut microbiota using 16S rDNA clone libraries
and strictly anaerobic culture-based methods. Microbiol
Immunol 46: 535–548.
Heilig HGHJ, Zoetendal EG, Vaughan EE, Marteau P, Akkermans
ADL & de Vos WM (2002) Molecular diversity of Lactobacillus
spp. and other lactic acid bacteria in the human intestine as
determined by specific amplification of 16S ribosomal DNA.
Appl Environ Microbiol 68: 114–123.
Hold GL, Pryde SE, Russell VJ, Furrie E & Flint HJ (2002)
Assessment of microbial diversity in human colonic samples
by 16S rDNA sequence analysis. FEMS Microbiol Ecol 39:
33–39.
Hold GL, Schwiertz A, Aminov RI, Blaut M & Flint HJ (2003)
Oligonucleotide probes that detect quantitatively significant
groups of butyrate-producing bacteria in human feces. Appl
Environ Microbiol 69: 4320–4324.
Jansen GJ, Wildeboer-Veloo ACM, Tonk RHJ, Franks AH &
Welling GW (1999) Development and validation of an
automated, microscopy-based method for enumeration of
groups of intestinal bacteria. J Microbiol Methods 37: 215–221.
Konstantinov SR, Smidt H & Akkermans ADL (2005) Ecology
and activity of clostridia in the intestine of mammals.
Handbook of Clostridia (Durre P, ed), pp. 785–794. CRC Press,
Boca Raton, FL.
Marteau P, Pochart P, Dore J, Bera-Maillet C, Bernalier A &
Corthier G (2001) Comparative study of bacterial groups
within the human cecal and fecal microbiota. Appl Environ
Microbiol 67: 4939–4942.
Matsuki T, Watanabe K, Fujimoto J, Miyamoto Y, Takada T,
Matsumoto K, Oyaizu H & Tanaka R (2002) Development of
16S rRNA-gene-targeted group-specific primers for the
detection and identification of predominant bacteria in
human feces. Appl Environ Microbiol 68: 5445–5451.
Matsuki T, Watanabe K, Fujimoto J, Takada T & Tanaka R (2004)
Use of 16S rRNA gene-targeted group-specific primers for
real-time PCR analysis of predominant bacteria in human
feces. Appl Environ Microbiol 70: 7220–7228.
Matto J, Maunuksela L, Kajander K, Palva A, Korpela R, Kassinen
A & Saarela M (2005) Composition and temporal stability of
gastrointestinal microbiota in irritable bowel syndrome – a
longitudinal study in IBS and control subjects. FEMS Immunol
Med Microbiol 43: 213–222.
Muyzer G, de Waal EC & Uitterlinden AG (1993) Profiling of
complex microbial populations by denaturing gradient gel
electrophoresis analysis of polymerase chain reaction-
amplified genes coding for 16S rRNA. Appl Environ Microbiol
59: 695–700.
Nubel U, Engelen B, Felske A, Snaidr J, Wieshuber A, Amann RI,
Ludwig W & Backhaus H (1996) Sequence heterogeneities of
genes encoding 16S rRNAs in Paenibacillus polymyxa detected
by temperature gradient gel electrophoresis. J Bacteriol 178:
5636–5643.
Rigottier-Gois L, Le Bourhis A-G, Gramet G, Rochet V & Dore J
(2003) Fluorescent hybridisation combined with flow
cytometry and hybridisation of total RNA to analyse the
composition of microbial communities in human faeces using
16S rRNA probes. FEMS Microbiol Ecol 43: 237–245.
Rinttila T, Kassinen A, Malinen E, Krogius L & Palva A (2004)
Development of an extensive set of 16S rDNA-targeted
primers for quantification of pathogenic and indigenous
bacteria in fecal samples by real-time PCR. J Appl Microbiol 97:
1166–1177.
Rochet V, Rigottier-Gois L, Rabot S & Dore J (2004) Validation of
fluorescent in situ hybridization combined with flow
cytometry for assessing inter-individual variation in the
composition of human fecal microflora during long-term
storage of samples. J Microbiol Methods 59: 263–270.
Satokari RM, Vaughan EE, Akkermans ADL, Saarela M & de Vos
VM (2001) Bifidobacterial diversity in human feces detected
by genus-specific PCR and denaturing gradient gel
electrophoresis. Appl Environ Microbiol 67: 504–513.
Satokari RM, Kataja K & Soderlund H (2005) Multiplexed
quantification of bacterial 16S rRNA by solution hybridization
with oligonucleotide probes and affinity capture. Microbiol
Ecol 50: 120–127.
Seksik P, Rigottier-Gois L, Gramet G, Sutren M, Pochart P,
Marteau P, Jian R & Dore J (2003) Alterations of the dominant
faecal bacterial groups in patients with Crohn’s disease of the
colon. Gut 52: 237–242.
Sghir A, Gramet G, Suau A, Rochet V, Pochart P & Dore J (2000)
Quantification of bacterial groups within human fecal flora by
oligonucleotide probe hybridization. Appl Environ Microbiol
66: 2263–2266.
Song Y, Liu C & Finegold SM (2004) Real-time PCR quantitation
of clostridia in feces of autistic children. Appl Environ
Microbiol 70: 6459–6465.
Stackebrandt E, Kramer I, Swiderski J & Hippe H (1999)
Phylogenetic basis for a taxonomic dissection of the genus
Clostridium. FEMS Immunol Med Microbiol 24: 253–258.
Suau A, Bonnet R, Sutren M, Godon JJ, Gibson G, Collins MD &
Dore J (1999) Direct analysis of genes encoding 16S rRNA
from complex communities reveals many novel molecular
species within the human gut. Appl Environ Microbiol 65:
4799–4807.
FEMS Microbiol Ecol 58 (2006) 517–528 c� 2006 Federation of European Microbiological SocietiesPublished by Blackwell Publishing Ltd. All rights reserved
527Erec-DGGE shows diversity in human intestinal microbiota
bacteria (subject 6, baseline sample) had 16 DGGE bands
representing 22 OTUs.
The Erec group was found to be temporally as stable or
unstable as the predominant bacteria in this study. In the
2-year stability study, the DGGE profiles of two subjects
(1 and 3) were unstable/rather unstable, and two subjects
(2 and 4) had minor differences with both predominant
bacterial DGGE and Erec DGGE. In the shorter follow-up
study (6 months) nearly all of the profiles that were
unstable/rather unstable with either RNA- or DNA-based
(or both) Erec DGGE were also unstable with predominant
bacterial DGGE. However, the hybridization-detected pro-
portional stability was not found to correlate with the
DGGE-based stability. Five subjects showed instability in
the proportion of the Erec group as detected with TRAC,
whereas the DGGE profiles of only two of these subjects
were found to be rather unstable. This finding further
addresses the above-discussed difference between the pro-
portion and diversity of a given bacterial group.
We found considerable intraindividual diversity as well as
uniqueness of the predominant faecal bacterial population
with both DNA-based (24–51 amplicons per sample) and
RNA-based (12–25 amplicons per sample) PCR-DGGE
analyses. The same intraindividual diversity was not ob-
served in Erec-group DGGE profiles (12–18 amplicons per
DNA sample; 10–17 amplicons per RNA sample), even
though this group comprised the majority of the microbiota
in some individuals according to the hybridization results.
However, since it is possible to detect only those bacteria
that constitute over 1% of the total population with DGGE
(Muyzer et al., 1993), we were able to detect the majority of
the Erec-group bacteria, as can be seen from our clone-
library results. The interindividual uniqueness of Erec
profiles was not as clear as was the inter-individual unique-
ness of the predominant bacterial profiles. Regardless of this,
samples of a single subject clustered together in most cases.
In addition, the clone libraries of the two subjects (4 and 6)
indicated that, even though the DGGE profiles resembled
each other and contained several similar OTUs, less than
20% of their sequences were identical.
RNA-based DGGE profiles of the predominant micro-
biota contained significantly fewer bands than the DNA-
based DGGE profiles in this study. The differences were seen
in all parts of the denaturing gradient. A clear difference
between the DNA- and RNA-derived predominant faecal
bacterial populations has also been reported by Tannock
et al. (2004). However, this was not observed as commonly
in our Erec-group DGGE profiles. Most of the intraindivi-
dual DNA- and RNA-based profiles were quite similar (10
out of 12 subjects).
In conclusion, the newly developed PCR-DGGE and RT-
PCR-DGGE methods for the Erec group proved to be
specific and useful in studying the diversity and stability of
the human faecal microbiota. The DGGE profiles of all 12
healthy adults studied were diverse. In addition, the devel-
oped DGGE method proved to be a valuable tool for the
direct assessment of the stability of the Erec group, demon-
strating stability in most of the subjects studied.
Acknowledgements
This study was supported by the Academy of Finland
and the VTT Technical Research Centre of Finland.
Ms Marja-Liisa Jalovaara is gratefully acknowledged for her
excellent technical assistance. Prof. Sirkka Asikainen is
thanked for providing three bacterial strains for validation
(Fusobacterium nucleatum, Prevotella melaninogenica, Veil-
lonella parvula).
References
Altschul S, Madden TL, Schaffer AA, Zhang J, Zhang Z, Miller W
& Lipman DJ (1997) Gapped BLAST and PSI-BLAST: a new
generation of protein database search programs. Nucleic Acids
Res 25: 3389–3402.
Amann RI, Binder BJ, Olson RJ, Chisholm SW, Devereux R &
Stahl DA (1990) Combination of 16S rRNA-targeted
oligonucleotide probes with flow cytometry for analyzing
mixed microbial populations. Appl Environ Microbiol 56:
1919–1925.
Atlas RM (1997) LB-agar. Handbook of Microbiological Media,
2nd edn (Parks LC, ed), p. 743. CRC Press Inc, Boca Raton, FL.
Barcenilla A, Pryde SE, Martin JC, Duncan SH, Stewart CS,
Henderson C & Flint HJ (2000) Phylogenetic relationship of
butyrate-producing bacteria from the human gut. Appl
Environ Microbiol 66: 1654–1661.
Cato EP, George WL & Finegold SM (1986) Genus Clostridium
Prazmowski 1880. Bergey’s Manual of Systematic Bacteriology,
Vol. 2 (Sneath PAH, Mair NS, Sharpe ME & Holt JG, eds),
pp. 1141–1200. Williams & Wilkins, Baltimore, MD.
Cole JR, Chai B, Farris RJ, Wang Q, Kulam SA, McGarrell DM,
Garrity GM & Tiedje JM (2005) The ribosomal database
project (RDP-II): sequences and tools for high-throughput
rRNA analysis. Nucleic Acids Res 33 (Database Issue):
D294–D296.
Collins MD, Lawson PA, Willems A, Cordoba JJ, Fernandez-
Garayzabal J, Gaecia P, Cai J, Hippe H & Farrow JAE (1994)
The phylogeny of the genus Clostridium: proposal of five new
genera and eleven new species combinations. Int J Syst
Bacteriol 144: 812–826.
Cummings JH & MacFarlane GT (1997) Colonic microflora:
nutrition and health. Nutrition 13: 476–478.
Eckburg PB, Bik EM, Bernstein CN, Purdom E, Dethlefsen L,
Sargent M, Gill SR, Nelson KE & Relman DA (2005) Diversity
of the human intestinal microbial flora. Science 308:
1635–1638.
FEMS Microbiol Ecol 58 (2006) 517–528c� 2006 Federation of European Microbiological SocietiesPublished by Blackwell Publishing Ltd. All rights reserved
526 J. Maukonen et al.

II/11
Franks AH, Harmsen HJM, Raangs GC, Jansen GJ, Schut F &
Welling GW (1998) Variations in bacterial populations in
human faeces measured by fluorescent in situ hybridization
with group-specific 16S rRNA-targeted oligonucleotide
probes. Appl Environ Microbiol 64: 3336–3345.
Harmsen HJM, Raangs GC, Franks AH,Wildeboer-Veloo ACM&
Welling GW (2002a) The effect of the prebiotic inulin and the
probiotic Bifidobacterium longum in the fecal microflora of
healthy volunteers measured by FISH and DGGE. Microbiol
Ecol Health Dis 14: 211–219.
Harmsen HJM, Raangs GC, He T, Degener JE & Welling GW
(2002b) Extensive set of 16S rRNA-based probes for detection
of bacteria in human feces. Appl Environ Microbiol 68:
2982–2990.
Hayshi H, Sakamoto M & Benno Y (2002) Phylogenetic analysis
of the human gut microbiota using 16S rDNA clone libraries
and strictly anaerobic culture-based methods. Microbiol
Immunol 46: 535–548.
Heilig HGHJ, Zoetendal EG, Vaughan EE, Marteau P, Akkermans
ADL & de Vos WM (2002) Molecular diversity of Lactobacillus
spp. and other lactic acid bacteria in the human intestine as
determined by specific amplification of 16S ribosomal DNA.
Appl Environ Microbiol 68: 114–123.
Hold GL, Pryde SE, Russell VJ, Furrie E & Flint HJ (2002)
Assessment of microbial diversity in human colonic samples
by 16S rDNA sequence analysis. FEMS Microbiol Ecol 39:
33–39.
Hold GL, Schwiertz A, Aminov RI, Blaut M & Flint HJ (2003)
Oligonucleotide probes that detect quantitatively significant
groups of butyrate-producing bacteria in human feces. Appl
Environ Microbiol 69: 4320–4324.
Jansen GJ, Wildeboer-Veloo ACM, Tonk RHJ, Franks AH &
Welling GW (1999) Development and validation of an
automated, microscopy-based method for enumeration of
groups of intestinal bacteria. J Microbiol Methods 37: 215–221.
Konstantinov SR, Smidt H & Akkermans ADL (2005) Ecology
and activity of clostridia in the intestine of mammals.
Handbook of Clostridia (Durre P, ed), pp. 785–794. CRC Press,
Boca Raton, FL.
Marteau P, Pochart P, Dore J, Bera-Maillet C, Bernalier A &
Corthier G (2001) Comparative study of bacterial groups
within the human cecal and fecal microbiota. Appl Environ
Microbiol 67: 4939–4942.
Matsuki T, Watanabe K, Fujimoto J, Miyamoto Y, Takada T,
Matsumoto K, Oyaizu H & Tanaka R (2002) Development of
16S rRNA-gene-targeted group-specific primers for the
detection and identification of predominant bacteria in
human feces. Appl Environ Microbiol 68: 5445–5451.
Matsuki T, Watanabe K, Fujimoto J, Takada T & Tanaka R (2004)
Use of 16S rRNA gene-targeted group-specific primers for
real-time PCR analysis of predominant bacteria in human
feces. Appl Environ Microbiol 70: 7220–7228.
Matto J, Maunuksela L, Kajander K, Palva A, Korpela R, Kassinen
A & Saarela M (2005) Composition and temporal stability of
gastrointestinal microbiota in irritable bowel syndrome – a
longitudinal study in IBS and control subjects. FEMS Immunol
Med Microbiol 43: 213–222.
Muyzer G, de Waal EC & Uitterlinden AG (1993) Profiling of
complex microbial populations by denaturing gradient gel
electrophoresis analysis of polymerase chain reaction-
amplified genes coding for 16S rRNA. Appl Environ Microbiol
59: 695–700.
Nubel U, Engelen B, Felske A, Snaidr J, Wieshuber A, Amann RI,
Ludwig W & Backhaus H (1996) Sequence heterogeneities of
genes encoding 16S rRNAs in Paenibacillus polymyxa detected
by temperature gradient gel electrophoresis. J Bacteriol 178:
5636–5643.
Rigottier-Gois L, Le Bourhis A-G, Gramet G, Rochet V & Dore J
(2003) Fluorescent hybridisation combined with flow
cytometry and hybridisation of total RNA to analyse the
composition of microbial communities in human faeces using
16S rRNA probes. FEMS Microbiol Ecol 43: 237–245.
Rinttila T, Kassinen A, Malinen E, Krogius L & Palva A (2004)
Development of an extensive set of 16S rDNA-targeted
primers for quantification of pathogenic and indigenous
bacteria in fecal samples by real-time PCR. J Appl Microbiol 97:
1166–1177.
Rochet V, Rigottier-Gois L, Rabot S & Dore J (2004) Validation of
fluorescent in situ hybridization combined with flow
cytometry for assessing inter-individual variation in the
composition of human fecal microflora during long-term
storage of samples. J Microbiol Methods 59: 263–270.
Satokari RM, Vaughan EE, Akkermans ADL, Saarela M & de Vos
VM (2001) Bifidobacterial diversity in human feces detected
by genus-specific PCR and denaturing gradient gel
electrophoresis. Appl Environ Microbiol 67: 504–513.
Satokari RM, Kataja K & Soderlund H (2005) Multiplexed
quantification of bacterial 16S rRNA by solution hybridization
with oligonucleotide probes and affinity capture. Microbiol
Ecol 50: 120–127.
Seksik P, Rigottier-Gois L, Gramet G, Sutren M, Pochart P,
Marteau P, Jian R & Dore J (2003) Alterations of the dominant
faecal bacterial groups in patients with Crohn’s disease of the
colon. Gut 52: 237–242.
Sghir A, Gramet G, Suau A, Rochet V, Pochart P & Dore J (2000)
Quantification of bacterial groups within human fecal flora by
oligonucleotide probe hybridization. Appl Environ Microbiol
66: 2263–2266.
Song Y, Liu C & Finegold SM (2004) Real-time PCR quantitation
of clostridia in feces of autistic children. Appl Environ
Microbiol 70: 6459–6465.
Stackebrandt E, Kramer I, Swiderski J & Hippe H (1999)
Phylogenetic basis for a taxonomic dissection of the genus
Clostridium. FEMS Immunol Med Microbiol 24: 253–258.
Suau A, Bonnet R, Sutren M, Godon JJ, Gibson G, Collins MD &
Dore J (1999) Direct analysis of genes encoding 16S rRNA
from complex communities reveals many novel molecular
species within the human gut. Appl Environ Microbiol 65:
4799–4807.
FEMS Microbiol Ecol 58 (2006) 517–528 c� 2006 Federation of European Microbiological SocietiesPublished by Blackwell Publishing Ltd. All rights reserved
527Erec-DGGE shows diversity in human intestinal microbiota
II/12 1
Tannock GW, Munro K, Biniloni R, Simon MA, Hargreaves P,
Gopal P, Harmsen H & Welling G (2004) Impact of
consumption of oligosaccharide-containing biscuits on the
fecal microbiota of humans. Appl Environ Microbiol 70:
2129–2136.
Vanhoutte T, Huys G, de Brandt E & Swings J (2004) Temporal
stability analysis of the microbiota in human feces by
denaturing gradient gel electrophoresis using universal and
group-specific 16S rRNA gene primers. FEMS Microbiol Ecol
48: 437–446.
Vaughan EE, Schut F, Heilig HGHJ, Zoetendal EG, de Vos WM
& Akkermans ADL (2000) A molecular view of the intestinal
ecosystem. Curr Issues Intest Microbiol 1: 1–12.
Wade WG, Downes J, Dymock D, Hiom SJ, Weightman AJ,
Dewhirst FE, Paster BJ, Tzellas N & Coleman B (1999) The
family Coriobacteriaceae: reclassification of Eubacterium
exiguum (Poco et al. 1996) and Peptostreptococcus
heliotrinreducens (Lanigan 1976) as Slackia exigua gen. nov.,
comb. nov. and Slackia heliotrinireducens gen. nov.,
comb. nov., and Eubacterium lentum (Prevot 1938) as
Eggerthella lenta gen. nov., comb. nov. Int J Syst Bacteriol 49:
595–600.
Walter J, Tannock GW, Tilsala-Timisjarvi A, Rodtong S, Loach
DM, Munro K & Alatossava T (2000) Detection and
identification of gastrointestinal Lactobacillus species by using
denaturing gradient gel electrophoresis and species-specific
PCR primers. Appl Environ Microbiol 66: 297–303.
Wang X, Heazlewood SP, Krause DO & Florin THJ (2003)
Molecular characterization of the microbial species that
colonize human ileal and colonic mucosa by using 16S rDNA
sequence analysis. J Appl Microbiol 95: 508–520.
Wilson KH & Blitchington RB (1996) Human colonic biota
studied by ribosomal DNA sequence analysis. Appl Environ
Microbiol 62: 2273–2278.
Zoetendal EG, Akkermans AD & de Vos WM (1998) Temperature
gradient gel electrophoresis analysis of 16S rRNA from human
fecal samples reveals stable and host-specific communities of
active bacteria. Appl Environ Microbiol 64: 3854–3859.
Zoetendal EG, Ben-Amor K, Harmsen HJM, Schut F, Akkermans
ADL & de Vos WM (2002) Quantification of uncultured
Ruminococcus obeum – like bacteria in human fecal samples by
fluorescent in situ hybridization and flow cytometry using 16S
rRNA – targeted probes. Appl Environ Microbiol 48:
4225–4232.
FEMS Microbiol Ecol 58 (2006) 517–528c� 2006 Federation of European Microbiological SocietiesPublished by Blackwell Publishing Ltd. All rights reserved
528 J. Maukonen et al.

1
ARTICLE III
Diversity and temporal stability of fecal bacterial populations
in elderly subjects consuming galacto-oligosaccharide
containing probiotic yoghurt
In: International Dairy Journal 2008, 18, pp. 386–395.
Copyright 2007 Elsevier.Reprinted with permission from the publisher.

III/1
International Dairy Journal 18 (2008) 386–395
Diversity and temporal stability of fecal bacterial populations in elderlysubjects consuming galacto-oligosaccharide containing
probiotic yoghurt
Johanna Maukonena,�, Jaana Mattob, Kajsa Kajanderc,d,Tiina Mattila-Sandholmc, Maria Saarelaa
aVTT, Biotechnology, P.O. Box 1000, FI-02044 VTT, FinlandbThe Finnish Red Cross Blood Service, Kivihaantie 7, 00310 Helsinki, Finland
cValio Ltd., R&D, P.O. Box 30, FI-00039 Valio, FinlanddInstitute of Biomedicine, Pharmacology, University of Helsinki, P.O. Box 63, FI-00014 Helsinki, Finland
Received 20 December 2006; accepted 19 October 2007
Abstract
Denaturing gradient gel electrophoresis was applied to study the effect of 3-week consumption of probiotic yoghurt containing
galacto-oligosaccharides (GOS) on intra-individual diversity and temporal stability of predominant bacterial, bifidobacterial,
Lactobacillus-group, and Erec-group Eubacterium rectale–Clostridium coccoides fecal populations of elderly subjects. Diversity and
temporal stability of the selected bacterial groups of elderly subjects were compared with those obtained from younger adults in our
previous studies. In the present study, GOS-yoghurt consumption did not significantly affect diversity or temporal stability of the
selected bacterial groups. On average, the Erec-group and the predominant bacterial and bifidobacterial populations remained almost
stable, and the Lactobacillus-group was unstable in elderly subjects. No differences were found between elderly and younger adults in
temporal stability of studied bacterial populations. However, the difference in diversity of predominant bacterial population and Erec-
group bacteria was significantly higher in elderly subjects of this study as compared with younger adults from our previous studies.
r 2007 Elsevier Ltd. All rights reserved.
Keywords: Elderly; Fecal bacteria; DGGE; Yoghurt; GOS
1. Introduction
It was shown several decades ago that the gastrointest-inal microbiota evolves with age (Gorbach, Nahas, Lerner,& Weinstein, 1967). As life expectancy in the western worldhas rapidly risen, interest in the gastrointestinal microbiotaof elderly subjects has increased. Asian elderly subjectshave been reported to have a lower level of bifidobacteriaand higher levels of clostridia, lactobacilli, streptococci,and Enterobacteriaceae in culture-based studies (Bennoet al., 1989; Mitsuoka, 1992). In European culture-basedand molecular biology based studies, however, results havebeen partly contradictory (He, Harmsen, Raangs, &
Welling, 2003; Hopkins, Sharp, & Macfarlane, 2001,2002; Mueller et al., 2006; van Tongeren, Slaets, Harmsen,& Welling, 2005; Woodmansey, McMurdo, Macfarlane, &Macfarlane, 2004). Moreover, the difference in severalbacterial groups between elderly and younger adults hasbeen shown to be dependent on geographical location(Mueller et al., 2006). The number of bifidobacteria werefound to be lower in elderly subjects compared withyounger adults in European studies (Hopkins et al., 2001,2002; Mueller et al., 2006; van Tongeren et al., 2005;Woodmansey et al., 2004).Bifidobacteria are generally considered beneficial for
health, and have been widely used, both individually and incombination with lactobacilli, in probiotic foods andproducts to increase the probiotic content in the humangastro-intestinal tract (Salminen, Deighton, Benno, &
ARTICLE IN PRESS
www.elsevier.com/locate/idairyj
0958-6946/$ - see front matter r 2007 Elsevier Ltd. All rights reserved.
doi:10.1016/j.idairyj.2007.10.003
�Corresponding author. Tel.: +358 20 722 7183; fax: +358 20 722 7071.
E-mail address: [email protected] (J. Maukonen).
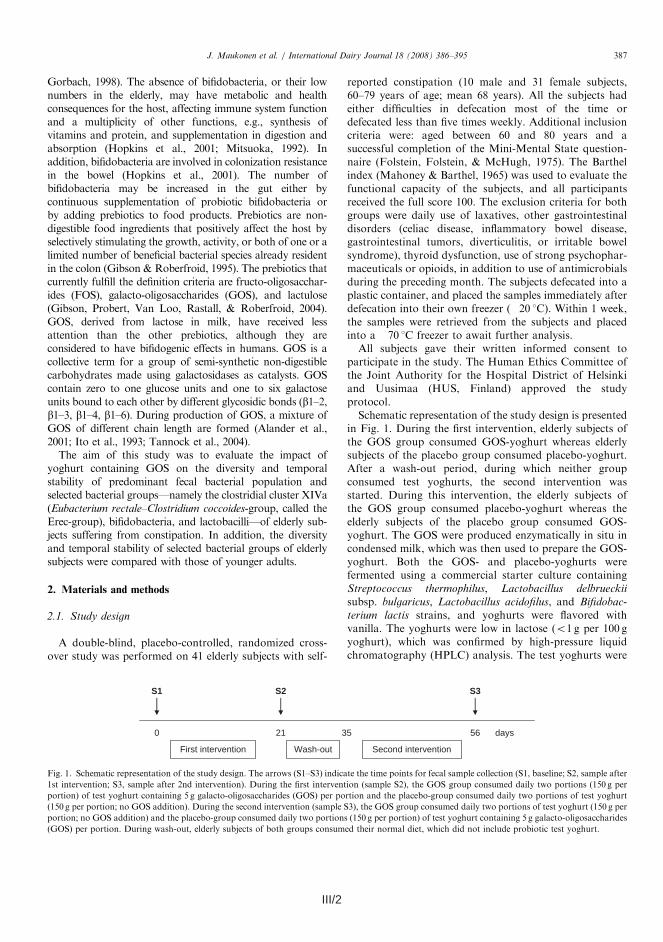
III/2 III/3
Gorbach, 1998). The absence of bifidobacteria, or their lownumbers in the elderly, may have metabolic and healthconsequences for the host, affecting immune system functionand a multiplicity of other functions, e.g., synthesis ofvitamins and protein, and supplementation in digestion andabsorption (Hopkins et al., 2001; Mitsuoka, 1992). Inaddition, bifidobacteria are involved in colonization resistancein the bowel (Hopkins et al., 2001). The number ofbifidobacteria may be increased in the gut either bycontinuous supplementation of probiotic bifidobacteria orby adding prebiotics to food products. Prebiotics are non-digestible food ingredients that positively affect the host byselectively stimulating the growth, activity, or both of one or alimited number of beneficial bacterial species already residentin the colon (Gibson & Roberfroid, 1995). The prebiotics thatcurrently fulfill the definition criteria are fructo-oligosacchar-ides (FOS), galacto-oligosaccharides (GOS), and lactulose(Gibson, Probert, Van Loo, Rastall, & Roberfroid, 2004).GOS, derived from lactose in milk, have received lessattention than the other prebiotics, although they areconsidered to have bifidogenic effects in humans. GOS is acollective term for a group of semi-synthetic non-digestiblecarbohydrates made using galactosidases as catalysts. GOScontain zero to one glucose units and one to six galactoseunits bound to each other by different glycosidic bonds (b1–2,b1–3, b1–4, b1–6). During production of GOS, a mixture ofGOS of different chain length are formed (Alander et al.,2001; Ito et al., 1993; Tannock et al., 2004).
The aim of this study was to evaluate the impact ofyoghurt containing GOS on the diversity and temporalstability of predominant fecal bacterial population andselected bacterial groups—namely the clostridial cluster XIVa(Eubacterium rectale–Clostridium coccoides-group, called theErec-group), bifidobacteria, and lactobacilli—of elderly sub-jects suffering from constipation. In addition, the diversityand temporal stability of selected bacterial groups of elderlysubjects were compared with those of younger adults.
2. Materials and methods
2.1. Study design
A double-blind, placebo-controlled, randomized cross-over study was performed on 41 elderly subjects with self-
reported constipation (10 male and 31 female subjects,60–79 years of age; mean 68 years). All the subjects hadeither difficulties in defecation most of the time ordefecated less than five times weekly. Additional inclusioncriteria were: aged between 60 and 80 years and asuccessful completion of the Mini-Mental State question-naire (Folstein, Folstein, & McHugh, 1975). The Barthelindex (Mahoney & Barthel, 1965) was used to evaluate thefunctional capacity of the subjects, and all participantsreceived the full score 100. The exclusion criteria for bothgroups were daily use of laxatives, other gastrointestinaldisorders (celiac disease, inflammatory bowel disease,gastrointestinal tumors, diverticulitis, or irritable bowelsyndrome), thyroid dysfunction, use of strong psychophar-maceuticals or opioids, in addition to use of antimicrobialsduring the preceding month. The subjects defecated into aplastic container, and placed the samples immediately afterdefecation into their own freezer (�20 1C). Within 1 week,the samples were retrieved from the subjects and placedinto a �70 1C freezer to await further analysis.All subjects gave their written informed consent to
participate in the study. The Human Ethics Committee ofthe Joint Authority for the Hospital District of Helsinkiand Uusimaa (HUS, Finland) approved the studyprotocol.Schematic representation of the study design is presented
in Fig. 1. During the first intervention, elderly subjects ofthe GOS group consumed GOS-yoghurt whereas elderlysubjects of the placebo group consumed placebo-yoghurt.After a wash-out period, during which neither groupconsumed test yoghurts, the second intervention wasstarted. During this intervention, the elderly subjects ofthe GOS group consumed placebo-yoghurt whereas theelderly subjects of the placebo group consumed GOS-yoghurt. The GOS were produced enzymatically in situ incondensed milk, which was then used to prepare the GOS-yoghurt. Both the GOS- and placebo-yoghurts werefermented using a commercial starter culture containingStreptococcus thermophilus, Lactobacillus delbrueckii
subsp. bulgaricus, Lactobacillus acidofilus, and Bifidobac-
terium lactis strains, and yoghurts were flavored withvanilla. The yoghurts were low in lactose (o1 g per 100 gyoghurt), which was confirmed by high-pressure liquidchromatography (HPLC) analysis. The test yoghurts were
ARTICLE IN PRESS
S2 S3
0 21 35 days
S1
56
First intervention Wash-out Second intervention
Fig. 1. Schematic representation of the study design. The arrows (S1–S3) indicate the time points for fecal sample collection (S1, baseline; S2, sample after
1st intervention; S3, sample after 2nd intervention). During the first intervention (sample S2), the GOS group consumed daily two portions (150 g per
portion) of test yoghurt containing 5 g galacto-oligosaccharides (GOS) per portion and the placebo-group consumed daily two portions of test yoghurt
(150 g per portion; no GOS addition). During the second intervention (sample S3), the GOS group consumed daily two portions of test yoghurt (150 g per
portion; no GOS addition) and the placebo-group consumed daily two portions (150 g per portion) of test yoghurt containing 5 g galacto-oligosaccharides
(GOS) per portion. During wash-out, elderly subjects of both groups consumed their normal diet, which did not include probiotic test yoghurt.
J. Maukonen et al. / International Dairy Journal 18 (2008) 386–395 387
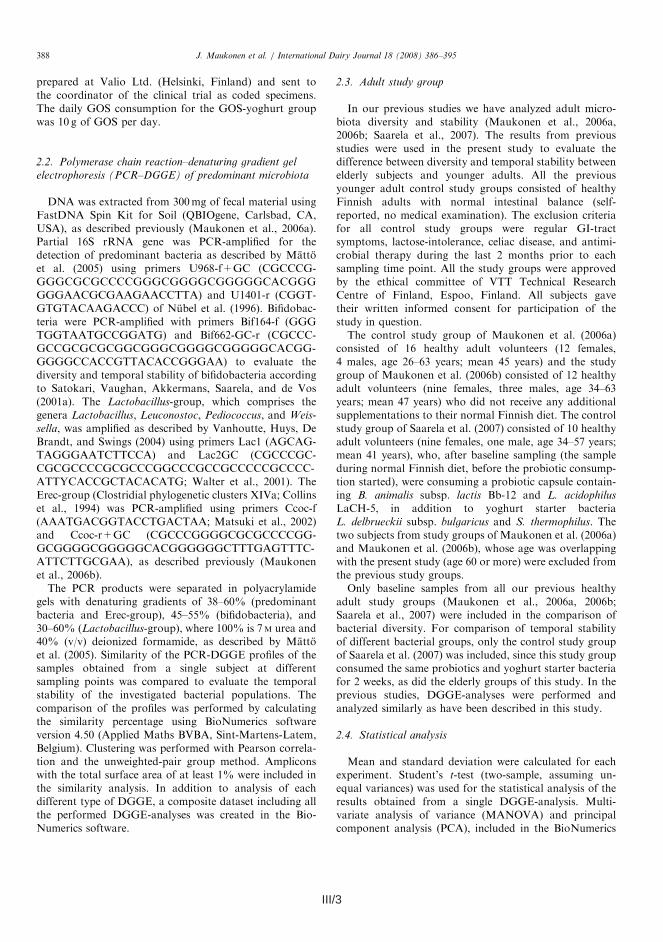
III/3
prepared at Valio Ltd. (Helsinki, Finland) and sent tothe coordinator of the clinical trial as coded specimens.The daily GOS consumption for the GOS-yoghurt groupwas 10 g of GOS per day.
2.2. Polymerase chain reaction–denaturing gradient gel
electrophoresis (PCR–DGGE) of predominant microbiota
DNA was extracted from 300mg of fecal material usingFastDNA Spin Kit for Soil (QBIOgene, Carlsbad, CA,USA), as described previously (Maukonen et al., 2006a).Partial 16S rRNA gene was PCR-amplified for thedetection of predominant bacteria as described by Mattoet al. (2005) using primers U968-f+GC (CGCCCG-GGGCGCGCCCCGGGCGGGGCGGGGGCACGGGGGGAACGCGAAGAACCTTA) and U1401-r (CGGT-GTGTACAAGACCC) of Nubel et al. (1996). Bifidobac-teria were PCR-amplified with primers Bif164-f (GGGTGGTAATGCCGGATG) and Bif662-GC-r (CGCCC-GCCGCGCGCGGCGGGCGGGGCGGGGGCACGG-GGGGCCACCGTTACACCGGGAA) to evaluate thediversity and temporal stability of bifidobacteria accordingto Satokari, Vaughan, Akkermans, Saarela, and de Vos(2001a). The Lactobacillus-group, which comprises thegenera Lactobacillus, Leuconostoc, Pediococcus, and Weis-
sella, was amplified as described by Vanhoutte, Huys, DeBrandt, and Swings (2004) using primers Lac1 (AGCAG-TAGGGAATCTTCCA) and Lac2GC (CGCCCGC-CGCGCCCCGCGCCCGGCCCGCCGCCCCCGCCCC-ATTYCACCGCTACACATG; Walter et al., 2001). TheErec-group (Clostridial phylogenetic clusters XIVa; Collinset al., 1994) was PCR-amplified using primers Ccoc-f(AAATGACGGTACCTGACTAA; Matsuki et al., 2002)and Ccoc-r+GC (CGCCCGGGGCGCGCCCCGG-GCGGGGCGGGGGCACGGGGGGCTTTGAGTTTC-ATTCTTGCGAA), as described previously (Maukonenet al., 2006b).
The PCR products were separated in polyacrylamidegels with denaturing gradients of 38–60% (predominantbacteria and Erec-group), 45–55% (bifidobacteria), and30–60% (Lactobacillus-group), where 100% is 7M urea and40% (v/v) deionized formamide, as described by Mattoet al. (2005). Similarity of the PCR-DGGE profiles of thesamples obtained from a single subject at differentsampling points was compared to evaluate the temporalstability of the investigated bacterial populations. Thecomparison of the profiles was performed by calculatingthe similarity percentage using BioNumerics softwareversion 4.50 (Applied Maths BVBA, Sint-Martens-Latem,Belgium). Clustering was performed with Pearson correla-tion and the unweighted-pair group method. Ampliconswith the total surface area of at least 1% were included inthe similarity analysis. In addition to analysis of eachdifferent type of DGGE, a composite dataset including allthe performed DGGE-analyses was created in the Bio-Numerics software.
2.3. Adult study group
In our previous studies we have analyzed adult micro-biota diversity and stability (Maukonen et al., 2006a,2006b; Saarela et al., 2007). The results from previousstudies were used in the present study to evaluate thedifference between diversity and temporal stability betweenelderly subjects and younger adults. All the previousyounger adult control study groups consisted of healthyFinnish adults with normal intestinal balance (self-reported, no medical examination). The exclusion criteriafor all control study groups were regular GI-tractsymptoms, lactose-intolerance, celiac disease, and antimi-crobial therapy during the last 2 months prior to eachsampling time point. All the study groups were approvedby the ethical committee of VTT Technical ResearchCentre of Finland, Espoo, Finland. All subjects gavetheir written informed consent for participation of thestudy in question.The control study group of Maukonen et al. (2006a)
consisted of 16 healthy adult volunteers (12 females,4 males, age 26–63 years; mean 45 years) and the studygroup of Maukonen et al. (2006b) consisted of 12 healthyadult volunteers (nine females, three males, age 34–63years; mean 47 years) who did not receive any additionalsupplementations to their normal Finnish diet. The controlstudy group of Saarela et al. (2007) consisted of 10 healthyadult volunteers (nine females, one male, age 34–57 years;mean 41 years), who, after baseline sampling (the sampleduring normal Finnish diet, before the probiotic consump-tion started), were consuming a probiotic capsule contain-ing B. animalis subsp. lactis Bb-12 and L. acidophilus
LaCH-5, in addition to yoghurt starter bacteriaL. delbrueckii subsp. bulgaricus and S. thermophilus. Thetwo subjects from study groups of Maukonen et al. (2006a)and Maukonen et al. (2006b), whose age was overlappingwith the present study (age 60 or more) were excluded fromthe previous study groups.Only baseline samples from all our previous healthy
adult study groups (Maukonen et al., 2006a, 2006b;Saarela et al., 2007) were included in the comparison ofbacterial diversity. For comparison of temporal stabilityof different bacterial groups, only the control study groupof Saarela et al. (2007) was included, since this study groupconsumed the same probiotics and yoghurt starter bacteriafor 2 weeks, as did the elderly groups of this study. In theprevious studies, DGGE-analyses were performed andanalyzed similarly as have been described in this study.
2.4. Statistical analysis
Mean and standard deviation were calculated for eachexperiment. Student’s t-test (two-sample, assuming un-equal variances) was used for the statistical analysis of theresults obtained from a single DGGE-analysis. Multi-variate analysis of variance (MANOVA) and principalcomponent analysis (PCA), included in the BioNumerics
ARTICLE IN PRESSJ. Maukonen et al. / International Dairy Journal 18 (2008) 386–395388
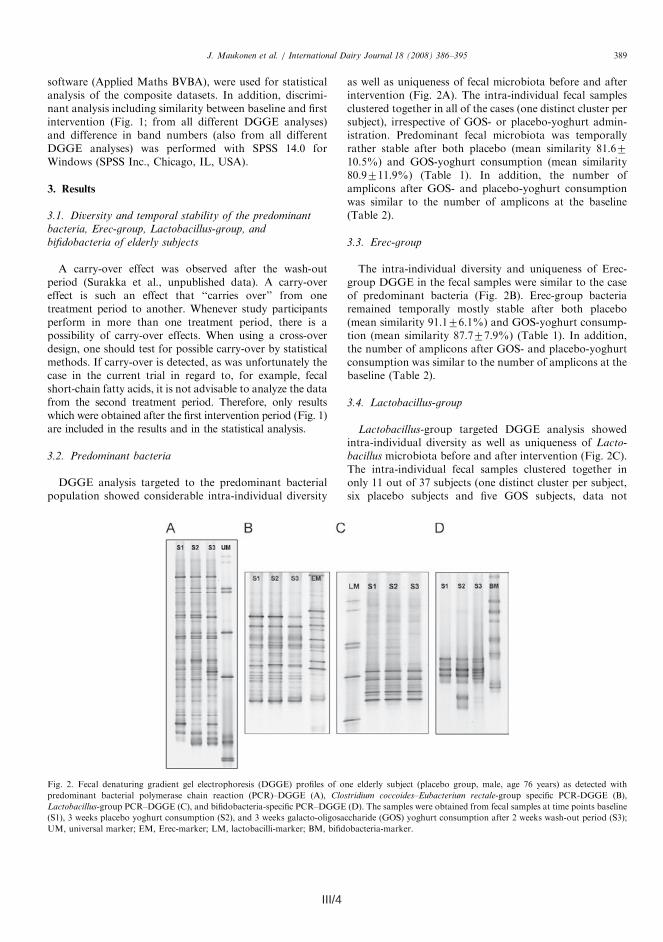
III/4 III/5
shown). The subjects whose samples clustered togetherhad an intra-individual temporal stability similarityvalue of (approx.) greater than 75%. All the other subjects
had lower intra-individual temporal stability similarityvalues (data not shown). The samples of one subject didnot amplify at all with the Lactobacillus-group PCR,
ARTICLE IN PRESS
Table 1
Temporal stability ( ¼ similarity values) of denaturing gradient gel electrophoresis (DGGE) profiles of human fecal samples obtained at baseline and after
consumption of test yoghurt with or without GOS supplementation from 41 elderly subjects with primers specific to Clostridium coccoides–Eubacterium
rectale (Erec) group of clostridia, Lactobacillus-group, and bifidobacteria, in addition to primers that target predominant bacterial microbiotaa
Analysis Similarity (%)b (baseline vs. 1st intervention) Similarity (%)a in adultsc
GOS Placebo All togetherd
Predominant bacteria
Mean7SD 80.9711.9 81.6710.5 81.2711.2 81.077.6
Range 51.4–95.5 58.6–94.9 51.4–95.5 70.0–90.6
Erec-group of clostridia
Mean7SD 87.777.9 91.176.1 89.177.3 92.374.7
Range 69.7–96.6 73.9–96.9 69.9–96.9 81.6–97.5
Lactobacillus-group
Mean7SD 59.1725.6 67.2728.3 62.6726.7 68.2711.9
Range 0.0–98.3 8.1–98.8 0.0–98.8 50.0–85.7
Bifidobacteria
Mean7SD 82.3721.7 82.0719.8 82.2720.6 87.1710.8
Range 0.5–99.3 17.3–97.8 0.5–99.3 68.2–97.8
aTemporal stability of DGGE profiles from an adult study group is also presented for the above-mentioned bacterial groups.bSimilarity values were counted with BioNumerics 4.50 software. Amplicons with the total surface area of at least 1% were included in the similarity
analysis.cSimilarity values were counted from a healthy Finnish adult study group, which was consuming Bifidobacterium animalis subsp. lactis Bb-12 and
Lactobacillus acidophilus LaCH-5, in addition to yoghurt starter bacteria L. delbrueckii subsp. bulgaricus, and Streptococcus thermophilus (Saarela et al.,
2007; Maukonen et al., unpublished results).dAll together ¼ GOS-group+placebo-group.
Table 2
Diversity of denaturing gradient gel electrophoresis (DGGE) profiles of human fecal samples obtained at baseline and after first intervention from 41
elderly subjects with primers specific to the Erec group of clostridia, Lactobacillus-group, and bifidobacteria, in addition to primers that target
predominant bacterial microbiotaa
Analysis Diversity (number of bands)b in elderly subjects Difference in diversityc (between
1st intervention and baseline)
Diversity (number of
bands)b in adultsd
Baseline GOS Placebo GOS Placebo
Predominant bacteria
Mean7SD 42.175.0� 42.074.6 43.675.0 0.1473.27 0.6574.53 32.474.7�
Range 35–57 35–51 35–52 �4–7 �8–11 24–40
Erec-group of clostridia
Mean7SD 20.773.6� 20.873.5 21.073.0 �0.2372.81 0.2971.86 14.772.1�
Range 14–28 14–26 16�26 �6–5 �3–3 11–19
Lactobacillus-group
Mean7SD 10.774.0 11.975.6 11.872.8 0.5774.93 2.1972.69 8.273.9
Range 2–17 5–30 7–18 �7–13 �2–7 4–17
Bifidobacteria
Mean7SD 8.673.2 8.572.7 9.573.2 0.1971.03 0.7172.31 9.172.8
Range 3–14 4–14 5–17 �2–2 �4–6 6–15
aThe difference in diversity between baseline sample and a sample after first intervention is also presented. In addition, diversity of DGGE profiles from
previous adult study groups is also presented for the above-mentioned bacterial groups.bDiversity is presented as the number of bands detected by the BioNumerics 4.50 software (Applied Maths BVBA).cDifference in diversity was calculated as (number of bands after 1st intervention)—(number of bands at baseline), therefore negative results indicate
that there were less bands after the 1st intervention than at baseline, and positive results indicate that there were more bands after the 1st intervention than
at the baseline. �Significant differences (Po0.05) in diversity between baseline samples of elderly subjects and adults.dDiversity of DGGE-profiles in adults was calculated by combining the diversity of the baseline samples from healthy Finnish adult study groups of
Maukonen et al. (2006a, 2006b, unpublished results) and Saarela et al. (2007). None of the subjects in the adult study groups had any supplementation to
their normal Finnish diet at the time of the baseline sample.
J. Maukonen et al. / International Dairy Journal 18 (2008) 386–395390
software (Applied Maths BVBA), were used for statisticalanalysis of the composite datasets. In addition, discrimi-nant analysis including similarity between baseline and firstintervention (Fig. 1; from all different DGGE analyses)and difference in band numbers (also from all differentDGGE analyses) was performed with SPSS 14.0 forWindows (SPSS Inc., Chicago, IL, USA).
3. Results
3.1. Diversity and temporal stability of the predominant
bacteria, Erec-group, Lactobacillus-group, and
bifidobacteria of elderly subjects
A carry-over effect was observed after the wash-outperiod (Surakka et al., unpublished data). A carry-overeffect is such an effect that ‘‘carries over’’ from onetreatment period to another. Whenever study participantsperform in more than one treatment period, there is apossibility of carry-over effects. When using a cross-overdesign, one should test for possible carry-over by statisticalmethods. If carry-over is detected, as was unfortunately thecase in the current trial in regard to, for example, fecalshort-chain fatty acids, it is not advisable to analyze the datafrom the second treatment period. Therefore, only resultswhich were obtained after the first intervention period (Fig. 1)are included in the results and in the statistical analysis.
3.2. Predominant bacteria
DGGE analysis targeted to the predominant bacterialpopulation showed considerable intra-individual diversity
as well as uniqueness of fecal microbiota before and afterintervention (Fig. 2A). The intra-individual fecal samplesclustered together in all of the cases (one distinct cluster persubject), irrespective of GOS- or placebo-yoghurt admin-istration. Predominant fecal microbiota was temporallyrather stable after both placebo (mean similarity 81.6710.5%) and GOS-yoghurt consumption (mean similarity80.9711.9%) (Table 1). In addition, the number ofamplicons after GOS- and placebo-yoghurt consumptionwas similar to the number of amplicons at the baseline(Table 2).
3.3. Erec-group
The intra-individual diversity and uniqueness of Erec-group DGGE in the fecal samples were similar to the caseof predominant bacteria (Fig. 2B). Erec-group bacteriaremained temporally mostly stable after both placebo(mean similarity 91.176.1%) and GOS-yoghurt consump-tion (mean similarity 87.777.9%) (Table 1). In addition,the number of amplicons after GOS- and placebo-yoghurtconsumption was similar to the number of amplicons at thebaseline (Table 2).
3.4. Lactobacillus-group
Lactobacillus-group targeted DGGE analysis showedintra-individual diversity as well as uniqueness of Lacto-
bacillus microbiota before and after intervention (Fig. 2C).The intra-individual fecal samples clustered together inonly 11 out of 37 subjects (one distinct cluster per subject,six placebo subjects and five GOS subjects, data not
ARTICLE IN PRESS
Fig. 2. Fecal denaturing gradient gel electrophoresis (DGGE) profiles of one elderly subject (placebo group, male, age 76 years) as detected with
predominant bacterial polymerase chain reaction (PCR)–DGGE (A), Clostridium coccoides–Eubacterium rectale-group specific PCR-DGGE (B),
Lactobacillus-group PCR–DGGE (C), and bifidobacteria-specific PCR–DGGE (D). The samples were obtained from fecal samples at time points baseline
(S1), 3 weeks placebo yoghurt consumption (S2), and 3 weeks galacto-oligosaccharide (GOS) yoghurt consumption after 2 weeks wash-out period (S3);
UM, universal marker; EM, Erec-marker; LM, lactobacilli-marker; BM, bifidobacteria-marker.
J. Maukonen et al. / International Dairy Journal 18 (2008) 386–395 389

III/5
shown). The subjects whose samples clustered togetherhad an intra-individual temporal stability similarityvalue of (approx.) greater than 75%. All the other subjects
had lower intra-individual temporal stability similarityvalues (data not shown). The samples of one subject didnot amplify at all with the Lactobacillus-group PCR,
ARTICLE IN PRESS
Table 1
Temporal stability ( ¼ similarity values) of denaturing gradient gel electrophoresis (DGGE) profiles of human fecal samples obtained at baseline and after
consumption of test yoghurt with or without GOS supplementation from 41 elderly subjects with primers specific to Clostridium coccoides–Eubacterium
rectale (Erec) group of clostridia, Lactobacillus-group, and bifidobacteria, in addition to primers that target predominant bacterial microbiotaa
Analysis Similarity (%)b (baseline vs. 1st intervention) Similarity (%)a in adultsc
GOS Placebo All togetherd
Predominant bacteria
Mean7SD 80.9711.9 81.6710.5 81.2711.2 81.077.6
Range 51.4–95.5 58.6–94.9 51.4–95.5 70.0–90.6
Erec-group of clostridia
Mean7SD 87.777.9 91.176.1 89.177.3 92.374.7
Range 69.7–96.6 73.9–96.9 69.9–96.9 81.6–97.5
Lactobacillus-group
Mean7SD 59.1725.6 67.2728.3 62.6726.7 68.2711.9
Range 0.0–98.3 8.1–98.8 0.0–98.8 50.0–85.7
Bifidobacteria
Mean7SD 82.3721.7 82.0719.8 82.2720.6 87.1710.8
Range 0.5–99.3 17.3–97.8 0.5–99.3 68.2–97.8
aTemporal stability of DGGE profiles from an adult study group is also presented for the above-mentioned bacterial groups.bSimilarity values were counted with BioNumerics 4.50 software. Amplicons with the total surface area of at least 1% were included in the similarity
analysis.cSimilarity values were counted from a healthy Finnish adult study group, which was consuming Bifidobacterium animalis subsp. lactis Bb-12 and
Lactobacillus acidophilus LaCH-5, in addition to yoghurt starter bacteria L. delbrueckii subsp. bulgaricus, and Streptococcus thermophilus (Saarela et al.,
2007; Maukonen et al., unpublished results).dAll together ¼ GOS-group+placebo-group.
Table 2
Diversity of denaturing gradient gel electrophoresis (DGGE) profiles of human fecal samples obtained at baseline and after first intervention from 41
elderly subjects with primers specific to the Erec group of clostridia, Lactobacillus-group, and bifidobacteria, in addition to primers that target
predominant bacterial microbiotaa
Analysis Diversity (number of bands)b in elderly subjects Difference in diversityc (between
1st intervention and baseline)
Diversity (number of
bands)b in adultsd
Baseline GOS Placebo GOS Placebo
Predominant bacteria
Mean7SD 42.175.0� 42.074.6 43.675.0 0.1473.27 0.6574.53 32.474.7�
Range 35–57 35–51 35–52 �4–7 �8–11 24–40
Erec-group of clostridia
Mean7SD 20.773.6� 20.873.5 21.073.0 �0.2372.81 0.2971.86 14.772.1�
Range 14–28 14–26 16�26 �6–5 �3–3 11–19
Lactobacillus-group
Mean7SD 10.774.0 11.975.6 11.872.8 0.5774.93 2.1972.69 8.273.9
Range 2–17 5–30 7–18 �7–13 �2–7 4–17
Bifidobacteria
Mean7SD 8.673.2 8.572.7 9.573.2 0.1971.03 0.7172.31 9.172.8
Range 3–14 4–14 5–17 �2–2 �4–6 6–15
aThe difference in diversity between baseline sample and a sample after first intervention is also presented. In addition, diversity of DGGE profiles from
previous adult study groups is also presented for the above-mentioned bacterial groups.bDiversity is presented as the number of bands detected by the BioNumerics 4.50 software (Applied Maths BVBA).cDifference in diversity was calculated as (number of bands after 1st intervention)—(number of bands at baseline), therefore negative results indicate
that there were less bands after the 1st intervention than at baseline, and positive results indicate that there were more bands after the 1st intervention than
at the baseline. �Significant differences (Po0.05) in diversity between baseline samples of elderly subjects and adults.dDiversity of DGGE-profiles in adults was calculated by combining the diversity of the baseline samples from healthy Finnish adult study groups of
Maukonen et al. (2006a, 2006b, unpublished results) and Saarela et al. (2007). None of the subjects in the adult study groups had any supplementation to
their normal Finnish diet at the time of the baseline sample.
J. Maukonen et al. / International Dairy Journal 18 (2008) 386–395390

III/6 III/7
samples of both GOS- and placebo-yoghurt groups wereincluded. Temporal stability of studied bacterial groups didnot differ between elderly and younger adults (Table 1).Diversity of predominant bacterial population was foundto be significantly higher (Po0.001) in elderly subjects ascompared to younger adults (4275 amplicons vs. 3275amplicons, respectively; Table 2, Fig. 4A). In addition,diversity of Erec-group bacteria was significantly higher(Po0.001) in elderly subjects than in younger adults (2174amplicons vs. 1572 amplicons, respectively; Table 2,Fig. 4B). Diversity of Lactobacillus-group of elderlysubjects (1174 amplicons) was somewhat higher thanthat of younger adults (874; P ¼ 0.09; Fig. 4C), whereasdiversity of bifidobacteria was similar in both elderlysubjects and younger adults (973 amplicons; Table 2,Fig. 4D).
4. Discussion
The present study was designed as a cross-over study tominimize the effect of inter-individual variation on fecalmicrobiota. However, the 2-week wash-out period was notlong enough for the present elderly subjects—probably dueto their mild constipation—even though according toliterature (Alander et al., 2001; Tannock et al., 2004) a2-week wash-out period should have been sufficient foringestion of GOS-supplemented foods. Therefore, we couldnot use the samples after the wash-out, which substantially
reduced the number of subjects in both study groups. Inaddition, since our new study groups composed of differentsubjects, we cannot exclude possible minor changes to theinvestigated bacterial populations, which could have beenseen at a person level, but could not be seen at a grouplevel. The possible side effects of GOS were not investi-gated in this study, but according to earlier studies, theamount of GOS used in this study (10 g per day) is well-tolerated (Sairanen, Piirainen, Nevala, & Korpela, 2007;Teuri & Korpela, 1998). In addition, only one GOSconcentration was used, but no differences regarding thebifidogenic effect were found between different GOS dosesin an earlier study by Bouhnik et al. (2004). The effect ofage on gastro-intestinal microbiota has been investigatedmainly by enumeration techniques, either by cultivation,fluorescent in situ hybridization, or by real-time PCR(e.g., Bartosch, Fite, Macfarlane, & McMurdo, 2004; Heet al., 2003; Hopkins et al., 2001, 2002; Mitsuoka, 1992;Mueller et al., 2006; van Tongeren et al., 2005; Wood-mansey et al., 2004), whereas stability and diversity of fecalmicrobiota of elderly subjects has received less attention(Blaut et al., 2002; Hayashi, Sakamoto, Kitahara, &Benno, 2003; He et al., 2003; Hopkins & Macfarlane,2002). We found only one study in which DGGE wasapplied to follow the stability and diversity of human fecalmicrobiota—predominant bacteria and bifidobacteria—during GOS ingestion (Tannock et al., 2004). However,the ages of the subjects (15 subjects) belonging to the study
ARTICLE IN PRESS
Fig. 4. Fecal denaturing gradient gel electrophoresis (DGGE) profiles of one healthy adult subject (female, 41 years old) as detected with predominant
bacterial polymerase chain reaction (PCR)–DGGE (part of the study group of Saarela et al., 2007) (A); Clostridium coccoides–Eubacterium rectale-group
specific PCR–DGGE (Maukonen et al., unpublished data) (B); Lactobacillus-group PCR–DGGE (Maukonen et al., unpublished data) (C); and
bifidobacteria-specific PCR–DGGE (Maukonen et al., unpublished data) (D). The samples were obtained from fecal samples at time points baseline (A1),
after 1-week probiotic capsule (containing Bifidobacterium animalis subsp. lactis Bb-12 and Lactobacillus acidophilus LaCH-5, in addition to yoghurt
starter bacteria L. delbrueckii subsp. bulgaricus and Streptococcus thermophilus) consumption (A2), and 2 weeks probiotic capsule consumption (A3); UM,
universal marker; EM, Erec-marker; LM, lactobacilli-marker; BM, bifidobacteria-marker.
J. Maukonen et al. / International Dairy Journal 18 (2008) 386–395392
although the procedure was repeated with differentamounts of DNA template for several times (data notshown).
The fecal lactobacilli population was temporally un-stable (mean similarity 59.1725.6%) after GOS-yoghurtconsumption and temporally rather unstable (mean simi-larity 67.2728.3%) after placebo consumption (Table 1).However, the difference in temporal stability between thestudy groups was not significant (P ¼ 0.19). The number ofamplicons after GOS- and placebo-yoghurt consumptionwas similar to the number of amplicons at the baseline(Table 2).
3.5. Bifidobacteria
The intra-individual diversity and uniqueness of bifido-bacteria DGGE in the fecal samples were similar to thecase of predominant bacteria and Erec-group bacteria(Fig. 2D). However, the intra-individual fecal samplesclustered together in only 26/38 subjects (one distinctcluster per subject; data not shown). The subjects whosesamples clustered together had an intra-individual tempor-al stability similarity value of (approx.) greater than 85%.The fecal bifidobacterial population was temporallymostly rather stable after both GOS-yoghurt consumption(mean similarity 82.3721.7%) and after placebo-yoghurtconsumption (mean similarity 82.0719.8%) (Table 1). The
number of amplicons after GOS- and placebo-yoghurtconsumption was similar to the number of amplicons atbaseline (Table 2).
3.6. Composite DGGE dataset
A composite dataset containing all different DGGEanalyses was created in the BioNumerics software.According to a PCA plot, none of the sample groups(GOS, placebo, baseline) was distinguishable from theother groups (Fig. 3). However, the group of GOS sampleswas more concise (the samples more similar to each other)than the other sample groups (Fig. 3). The group ofbaseline samples was the most diverse (biggest ellipse;Fig. 3). Significant differences were not found in discrimi-nant analysis or MANOVA on temporal stability andbacterial diversity on composite datasets.
3.7. Difference in diversity and temporal stability of the
predominant bacteria, Erec-group, Lactobacillus-group, and
bifidobacteria between elderly subjects and younger adults
In the comparison between elderly subjects of this studyand younger adults of our previous studies (Maukonenet al., 2006a, 2006b; Saarela et al., 2007), only the placebo-yoghurt group was included in the comparison of temporalstability. For comparison of bacterial diversity, the baseline
ARTICLE IN PRESS
GOS
placebo
baseline
Fig. 3. A PCA plot of the composite denaturing gradient gel electrophoresis (DGGE) dataset (containing predominant bacterial, Erec-group,
Lactobacillus-group, and bifidobacteria specific DGGE analyses) of baseline samples (light gray squares), samples after galacto-oligosaccharide (GOS)
intervention (black stars), and samples after placebo intervention (dark gray dots).
J. Maukonen et al. / International Dairy Journal 18 (2008) 386–395 391
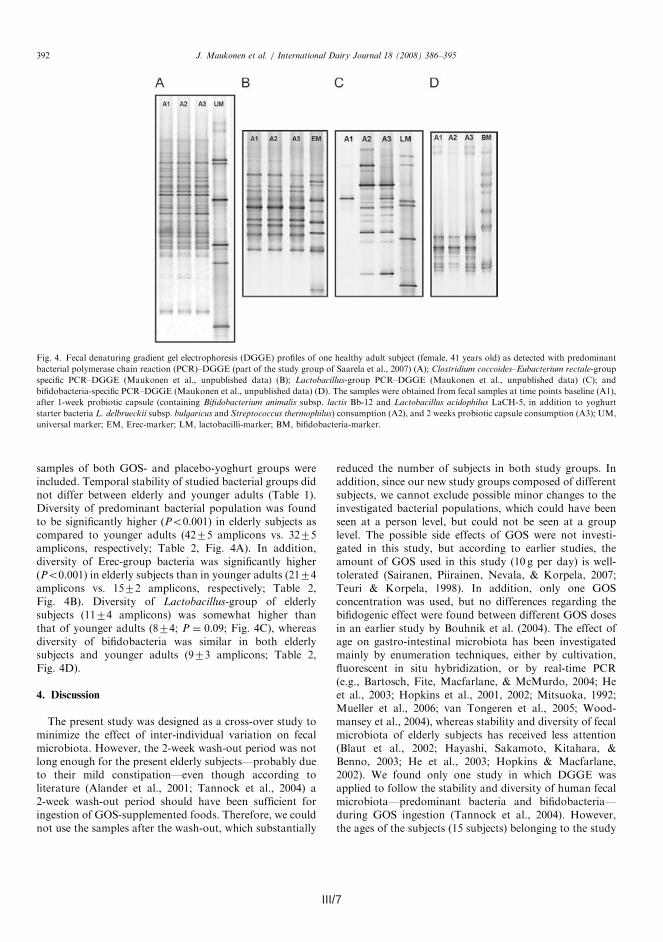
III/7
samples of both GOS- and placebo-yoghurt groups wereincluded. Temporal stability of studied bacterial groups didnot differ between elderly and younger adults (Table 1).Diversity of predominant bacterial population was foundto be significantly higher (Po0.001) in elderly subjects ascompared to younger adults (4275 amplicons vs. 3275amplicons, respectively; Table 2, Fig. 4A). In addition,diversity of Erec-group bacteria was significantly higher(Po0.001) in elderly subjects than in younger adults (2174amplicons vs. 1572 amplicons, respectively; Table 2,Fig. 4B). Diversity of Lactobacillus-group of elderlysubjects (1174 amplicons) was somewhat higher thanthat of younger adults (874; P ¼ 0.09; Fig. 4C), whereasdiversity of bifidobacteria was similar in both elderlysubjects and younger adults (973 amplicons; Table 2,Fig. 4D).
4. Discussion
The present study was designed as a cross-over study tominimize the effect of inter-individual variation on fecalmicrobiota. However, the 2-week wash-out period was notlong enough for the present elderly subjects—probably dueto their mild constipation—even though according toliterature (Alander et al., 2001; Tannock et al., 2004) a2-week wash-out period should have been sufficient foringestion of GOS-supplemented foods. Therefore, we couldnot use the samples after the wash-out, which substantially
reduced the number of subjects in both study groups. Inaddition, since our new study groups composed of differentsubjects, we cannot exclude possible minor changes to theinvestigated bacterial populations, which could have beenseen at a person level, but could not be seen at a grouplevel. The possible side effects of GOS were not investi-gated in this study, but according to earlier studies, theamount of GOS used in this study (10 g per day) is well-tolerated (Sairanen, Piirainen, Nevala, & Korpela, 2007;Teuri & Korpela, 1998). In addition, only one GOSconcentration was used, but no differences regarding thebifidogenic effect were found between different GOS dosesin an earlier study by Bouhnik et al. (2004). The effect ofage on gastro-intestinal microbiota has been investigatedmainly by enumeration techniques, either by cultivation,fluorescent in situ hybridization, or by real-time PCR(e.g., Bartosch, Fite, Macfarlane, & McMurdo, 2004; Heet al., 2003; Hopkins et al., 2001, 2002; Mitsuoka, 1992;Mueller et al., 2006; van Tongeren et al., 2005; Wood-mansey et al., 2004), whereas stability and diversity of fecalmicrobiota of elderly subjects has received less attention(Blaut et al., 2002; Hayashi, Sakamoto, Kitahara, &Benno, 2003; He et al., 2003; Hopkins & Macfarlane,2002). We found only one study in which DGGE wasapplied to follow the stability and diversity of human fecalmicrobiota—predominant bacteria and bifidobacteria—during GOS ingestion (Tannock et al., 2004). However,the ages of the subjects (15 subjects) belonging to the study
ARTICLE IN PRESS
Fig. 4. Fecal denaturing gradient gel electrophoresis (DGGE) profiles of one healthy adult subject (female, 41 years old) as detected with predominant
bacterial polymerase chain reaction (PCR)–DGGE (part of the study group of Saarela et al., 2007) (A); Clostridium coccoides–Eubacterium rectale-group
specific PCR–DGGE (Maukonen et al., unpublished data) (B); Lactobacillus-group PCR–DGGE (Maukonen et al., unpublished data) (C); and
bifidobacteria-specific PCR–DGGE (Maukonen et al., unpublished data) (D). The samples were obtained from fecal samples at time points baseline (A1),
after 1-week probiotic capsule (containing Bifidobacterium animalis subsp. lactis Bb-12 and Lactobacillus acidophilus LaCH-5, in addition to yoghurt
starter bacteria L. delbrueckii subsp. bulgaricus and Streptococcus thermophilus) consumption (A2), and 2 weeks probiotic capsule consumption (A3); UM,
universal marker; EM, Erec-marker; LM, lactobacilli-marker; BM, bifidobacteria-marker.
J. Maukonen et al. / International Dairy Journal 18 (2008) 386–395392
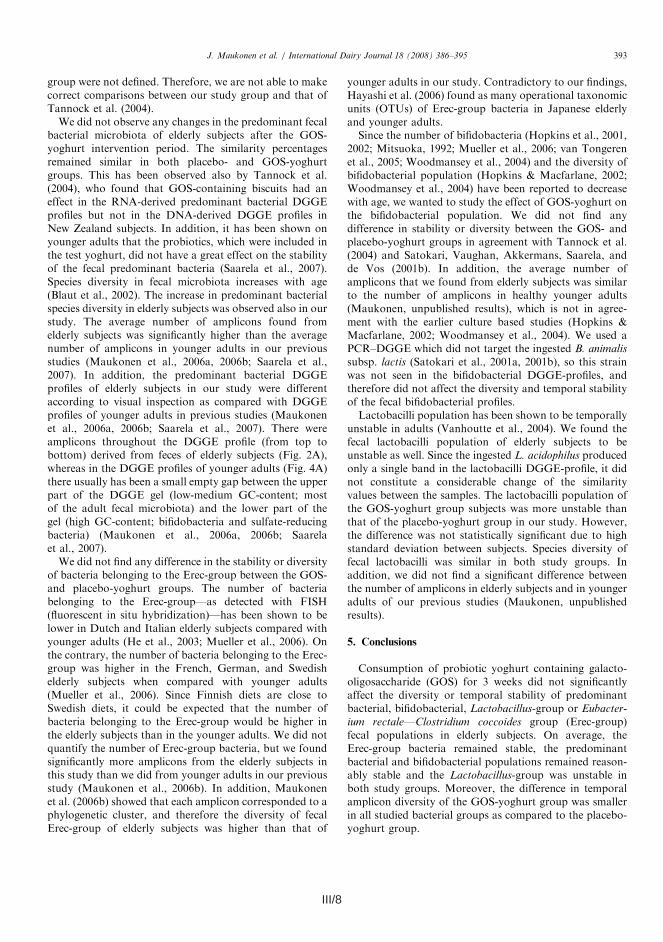
III/8 III/9
We did not find any differences between elderly andyounger adults in temporal stability of studied bacterialpopulations. However, the difference in diversity ofpredominant bacterial population and Erec-group bacteriawas found to be significantly higher in elderly subjects ascompared to younger adults.
Acknowledgments
This study was supported by the Academy ofFinland and VTT Technical Research Centre of Finland.Ms. Marja-Liisa Jalovaara is greatly acknowledged for herexcellent technical assistance.
References
Alander, M., Matto, J., Kneifel, W., Johansson, M., Kogler, B.,
Crittenden, R., et al. (2001). Effect of galacto-oligosaccharide
supplementation on human faecal microflora and on survival and
persistence of Bifidobacterium lactis Bb-12 in the gastrointestinal tract.
International Dairy Journal, 11, 817–825.
Bartosch, S., Fite, A., Macfarlane, G. T., & McMurdo, M. E. T. (2004).
Characterization of bacterial communities in feces from healthy elderly
volunteers and hospitalized elderly patients by using real-time PCR
and effects of antibiotic treatment on the fecal microbiota. Applied and
Environmental Microbiology, 70, 3575–3581.
Benno, Y., Endo, K., Mizutani, T., Namba, Y., Komori, T., & Mitsuoka,
T. (1989). Comparison of fecal microflora of elderly persons in rural
and urban areas of Japan. Applied and Environmental Microbiology,
55, 1100–1105.
Blaut, M., Collins, M. D., Welling, G. W., Dore, J., van Loo, J., & de Vos,
W. (2002). Molecular biological methods for studying the gut
microbiota: The EU human gut flora project. British Journal of
Nutrition, 87, S203–S211.
Bouhnik, Y., Raskine, L., Simoneau, G., Vicaut, E., Neut, C., Flourie, B.,
et al. (2004). The capacity of nondigestible carbohydrates to stimulate
fecal bifidobacteria in healthy humans: A double-blind, randomized,
placebo-controlled, parallel-group, dose-response relation study. The
American Journal of Clinical Nutrition, 80, 1658–1664.
Collins, M. D., Lawson, P. A., Willems, A., Cordoba, J. J., Fernandez-
Garayzabal, J., Garcia, P., et al. (1994). The phylogeny of the genus
Clostridium: proposal of five new genera and eleven new species
combinations. International Journal of Systematic Bacteriology, 144,
812–826.
Folstein, M. F., Folstein, S. E., & McHugh, P. R. (1975). ‘‘Mini-mental
state’’. A practical method for grading the cognitive state of patients
for the clinician. Journal of Psychiatric Research, 12, 189–198.
Gibson, G. R., Probert, H. M., Van Loo, J., Rastall, R. A., & Roberfroid,
M. B. (2004). Dietary modulation of the human colonic microbiota:
Updating the concept of prebiotics. Nutrition Research Reviews, 17,
259–275.
Gibson, G. R., & Roberfroid, M. B. (1995). Dietary modulation of the
human colonic microbiota: Introducing the concept of prebiotics.
Journal of Nutrition, 125, 1401–1412.
Gorbach, S. L., Nahas, L., Lerner, P. I., & Weinstein, L. (1967). Studies of
intestinal microflora. I. Effects of diet, age, and periodic sampling on
numbers of fecal microorganisms in man. Gastroenterology, 53,
845–855.
Hayashi, H., Sakamoto, M., Kitahara, M., & Benno, Y. (2003). Molecular
analysis of fecal microbiota in elderly individuals using 16S rDNA
library and T-RFLP. Microbiology and Immunology, 47, 557–570.
Hayashi, H., Sakamoto, M., Kitahara, & Benno, Y. (2006). Diversity of
the Clostridium coccoides group in human fecal microbiota as
determined by 16S rRNA gene library. FEMS Microbiological Letters,
257, 202–207.
He, T., Harmsen, H. J. M., Raangs, G. C., & Welling, G. W. (2003).
Composition of faecal microbiota of elderly people. Microbial Ecology
in Health and Disease, 15, 153–159.
Hopkins, M. J., & Macfarlane, G. T. (2002). Changes in pre-
dominant bacterial populations in human faeces with age and with
Clostridium difficile infection. Journal of Medical Microbiology, 51,
448–454.
Hopkins, M. J., Sharp, R., & Macfarlane, G. T. (2001). Age and disease
related changes in intestinal bacterial population assessed by cell
culture, 16S rRNA abundance, and community cellular fatty acid
profiles. Gut, 48, 198–205.
Hopkins, M. J., Sharp, R., & Macfarlane, G. T. (2002). Variation in
human intestinal microbiota with age. Digestive and Liver Disease, 34,
S12–S18.
Ito, M., Deguchi, Y., Matsumoto, K., Kimura, M., Onodera, N., &
Yajima, T. (1993). Influence of galacto-oligosaccharides on human
faecal microflora. Journal of Nutritional Science and Vitaminology, 39,
635–640.
Mahoney, F. I., & Barthel, D. W. (1965). Functional evaluation: The
Barthel index. Maryland State Medical Journal, 14, 61–65.
Matsuki, T., Watanabe, K., Fujimoto, J., Miyamoto, Y., Takada, T.,
Matsumoto, K., et al. (2002). Development of 16S rRNA-gene-
targeted group-specific primers for the detection and identification of
predominant bacteria in human feces. Applied and Environmental
Microbiology, 68, 5445–5451.
Matto, J., Maunuksela, L., Kajander, K., Palva, A., Korpela, R.,
Kassinen, A., et al. (2005). Composition and temporal stability of
gastrointestinal microbiota in irritable bowel syndrome—a long-
itudinal study in IBS and control subjects. FEMS Immunology and
Medical Microbiology, 43, 213–222.
Maukonen, J., Satokari, R., Matto, J., Soderlund, H., Mattila-Sandholm,
T., & Saarela, M. (2006a). Prevalence and temporal stability of selected
clostridial groups in irritable bowel syndrome in relation to
predominant fecal bacteria. Journal of Medical Microbiology, 55,
625–633.
Maukonen, J., Matto, J., Satokari, R., Soderlund, H., Mattila-Sandholm,
T., & Saarela, M. (2006b). PCR-DGGE and RT-PCR-DGGE show
diversity and short-term temporal stability in Clostridium coccoides–
Eubacterium rectale group in human intestinal microbiota. FEMS
Microbiology Ecology, 58, 517–528.
Mitsuoka, T. (1992). Intestinal flora and aging. Nutrition Reviews, 50,
438–446.
Mueller, S., Saunier, K., Hanisch, C., Norin, E., Alm, L., Midvedt, T.,
et al. (2006). Differences in fecal microbiota in different European
study populations in relation to age, gender, and country: A cross-
sectional study. Applied and Environmental Microbiology, 72,
1027–1033.
Nubel, U., Engelen, B., Felske, A., Snaidr, J., Wieshuber, A., Amann,
R. I., et al. (1996). Sequence heterogeneities of genes encoding 16S
rRNAs in Paenibacillus polymyxa detected by temperature gradient gel
electrophoresis. Journal of Bacteriology, 178, 5636–5643.
Saarela, M., Maukonen, J., von Wright, A., Vilpponen-Salmela, T.,
Patterson, A. J., Scott, K. P., et al. (2007). Tetracycline susceptibility of
the ingested Lactobacillus acidophilus LaCH-5 and Bifidobacterium
animalis subsp. lactis Bb-12 strains during antibiotic–probiotic
intervention. International Journal of Antimicrobial Agents, 29,
271–280.
Sairanen, U., Piirainen, L., Nevala, R., & Korpela, R. (2007). Yoghurt
containing galacto-oligosaccharides, prunes and linseed reduces the
severity of mild constipation in elderly subjects. European Journal of
Clinical Nutrition. Advance online publication, 14 February 2007;
doi:10.1038/sj.ejcn.1602670.
Salminen, S., Deighton, M. A., Benno, Y., & Gorbach, S. (1998). Lactic
acid bacteria in health and disease. In S. Salminen, & A. von Wright
(Eds.), Lactic acid bacteria, microbiology and functional aspects (2nd
ed, pp. 211–253). New York, NY, USA: Marcel Dekker.
Satokari, R., Vaughan, E., Akkermans, A., Saarela, M., & de Vos, W.
(2001a). Bifidobacterial diversity in human feces detected by
ARTICLE IN PRESSJ. Maukonen et al. / International Dairy Journal 18 (2008) 386–395394
group were not defined. Therefore, we are not able to makecorrect comparisons between our study group and that ofTannock et al. (2004).
We did not observe any changes in the predominant fecalbacterial microbiota of elderly subjects after the GOS-yoghurt intervention period. The similarity percentagesremained similar in both placebo- and GOS-yoghurtgroups. This has been observed also by Tannock et al.(2004), who found that GOS-containing biscuits had aneffect in the RNA-derived predominant bacterial DGGEprofiles but not in the DNA-derived DGGE profiles inNew Zealand subjects. In addition, it has been shown onyounger adults that the probiotics, which were included inthe test yoghurt, did not have a great effect on the stabilityof the fecal predominant bacteria (Saarela et al., 2007).Species diversity in fecal microbiota increases with age(Blaut et al., 2002). The increase in predominant bacterialspecies diversity in elderly subjects was observed also in ourstudy. The average number of amplicons found fromelderly subjects was significantly higher than the averagenumber of amplicons in younger adults in our previousstudies (Maukonen et al., 2006a, 2006b; Saarela et al.,2007). In addition, the predominant bacterial DGGEprofiles of elderly subjects in our study were differentaccording to visual inspection as compared with DGGEprofiles of younger adults in previous studies (Maukonenet al., 2006a, 2006b; Saarela et al., 2007). There wereamplicons throughout the DGGE profile (from top tobottom) derived from feces of elderly subjects (Fig. 2A),whereas in the DGGE profiles of younger adults (Fig. 4A)there usually has been a small empty gap between the upperpart of the DGGE gel (low-medium GC-content; mostof the adult fecal microbiota) and the lower part of thegel (high GC-content; bifidobacteria and sulfate-reducingbacteria) (Maukonen et al., 2006a, 2006b; Saarelaet al., 2007).
We did not find any difference in the stability or diversityof bacteria belonging to the Erec-group between the GOS-and placebo-yoghurt groups. The number of bacteriabelonging to the Erec-group—as detected with FISH(fluorescent in situ hybridization)—has been shown to belower in Dutch and Italian elderly subjects compared withyounger adults (He et al., 2003; Mueller et al., 2006). Onthe contrary, the number of bacteria belonging to the Erec-group was higher in the French, German, and Swedishelderly subjects when compared with younger adults(Mueller et al., 2006). Since Finnish diets are close toSwedish diets, it could be expected that the number ofbacteria belonging to the Erec-group would be higher inthe elderly subjects than in the younger adults. We did notquantify the number of Erec-group bacteria, but we foundsignificantly more amplicons from the elderly subjects inthis study than we did from younger adults in our previousstudy (Maukonen et al., 2006b). In addition, Maukonenet al. (2006b) showed that each amplicon corresponded to aphylogenetic cluster, and therefore the diversity of fecalErec-group of elderly subjects was higher than that of
younger adults in our study. Contradictory to our findings,Hayashi et al. (2006) found as many operational taxonomicunits (OTUs) of Erec-group bacteria in Japanese elderlyand younger adults.Since the number of bifidobacteria (Hopkins et al., 2001,
2002; Mitsuoka, 1992; Mueller et al., 2006; van Tongerenet al., 2005; Woodmansey et al., 2004) and the diversity ofbifidobacterial population (Hopkins & Macfarlane, 2002;Woodmansey et al., 2004) have been reported to decreasewith age, we wanted to study the effect of GOS-yoghurt onthe bifidobacterial population. We did not find anydifference in stability or diversity between the GOS- andplacebo-yoghurt groups in agreement with Tannock et al.(2004) and Satokari, Vaughan, Akkermans, Saarela, andde Vos (2001b). In addition, the average number ofamplicons that we found from elderly subjects was similarto the number of amplicons in healthy younger adults(Maukonen, unpublished results), which is not in agree-ment with the earlier culture based studies (Hopkins &Macfarlane, 2002; Woodmansey et al., 2004). We used aPCR–DGGE which did not target the ingested B. animalis
subsp. lactis (Satokari et al., 2001a, 2001b), so this strainwas not seen in the bifidobacterial DGGE-profiles, andtherefore did not affect the diversity and temporal stabilityof the fecal bifidobacterial profiles.Lactobacilli population has been shown to be temporally
unstable in adults (Vanhoutte et al., 2004). We found thefecal lactobacilli population of elderly subjects to beunstable as well. Since the ingested L. acidophilus producedonly a single band in the lactobacilli DGGE-profile, it didnot constitute a considerable change of the similarityvalues between the samples. The lactobacilli population ofthe GOS-yoghurt group subjects was more unstable thanthat of the placebo-yoghurt group in our study. However,the difference was not statistically significant due to highstandard deviation between subjects. Species diversity offecal lactobacilli was similar in both study groups. Inaddition, we did not find a significant difference betweenthe number of amplicons in elderly subjects and in youngeradults of our previous studies (Maukonen, unpublishedresults).
5. Conclusions
Consumption of probiotic yoghurt containing galacto-oligosaccharide (GOS) for 3 weeks did not significantlyaffect the diversity or temporal stability of predominantbacterial, bifidobacterial, Lactobacillus-group or Eubacter-ium rectale—Clostridium coccoides group (Erec-group)fecal populations in elderly subjects. On average, theErec-group bacteria remained stable, the predominantbacterial and bifidobacterial populations remained reason-ably stable and the Lactobacillus-group was unstable inboth study groups. Moreover, the difference in temporalamplicon diversity of the GOS-yoghurt group was smallerin all studied bacterial groups as compared to the placebo-yoghurt group.
ARTICLE IN PRESSJ. Maukonen et al. / International Dairy Journal 18 (2008) 386–395 393
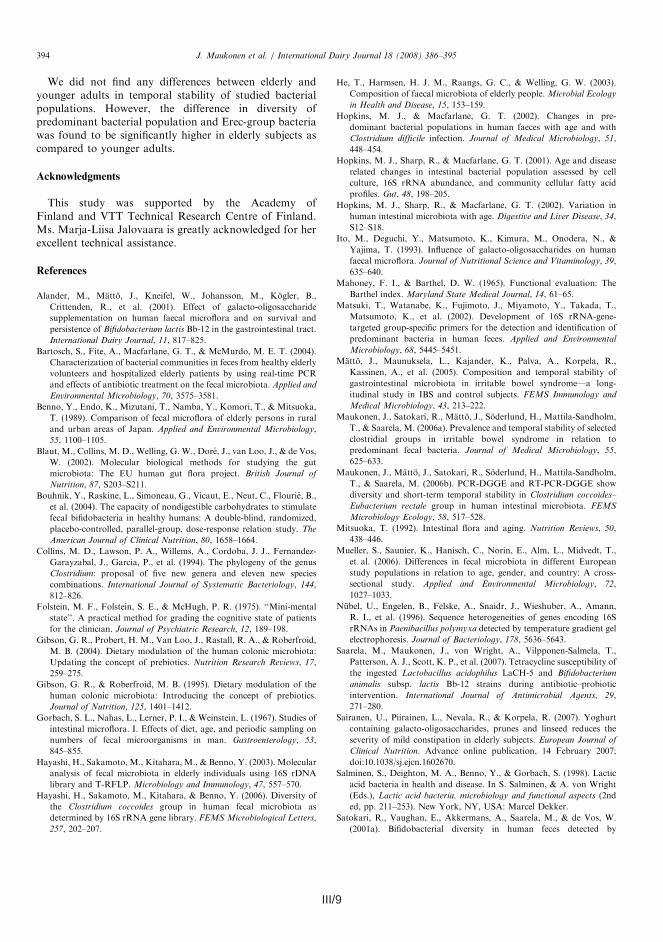
III/9
We did not find any differences between elderly andyounger adults in temporal stability of studied bacterialpopulations. However, the difference in diversity ofpredominant bacterial population and Erec-group bacteriawas found to be significantly higher in elderly subjects ascompared to younger adults.
Acknowledgments
This study was supported by the Academy ofFinland and VTT Technical Research Centre of Finland.Ms. Marja-Liisa Jalovaara is greatly acknowledged for herexcellent technical assistance.
References
Alander, M., Matto, J., Kneifel, W., Johansson, M., Kogler, B.,
Crittenden, R., et al. (2001). Effect of galacto-oligosaccharide
supplementation on human faecal microflora and on survival and
persistence of Bifidobacterium lactis Bb-12 in the gastrointestinal tract.
International Dairy Journal, 11, 817–825.
Bartosch, S., Fite, A., Macfarlane, G. T., & McMurdo, M. E. T. (2004).
Characterization of bacterial communities in feces from healthy elderly
volunteers and hospitalized elderly patients by using real-time PCR
and effects of antibiotic treatment on the fecal microbiota. Applied and
Environmental Microbiology, 70, 3575–3581.
Benno, Y., Endo, K., Mizutani, T., Namba, Y., Komori, T., & Mitsuoka,
T. (1989). Comparison of fecal microflora of elderly persons in rural
and urban areas of Japan. Applied and Environmental Microbiology,
55, 1100–1105.
Blaut, M., Collins, M. D., Welling, G. W., Dore, J., van Loo, J., & de Vos,
W. (2002). Molecular biological methods for studying the gut
microbiota: The EU human gut flora project. British Journal of
Nutrition, 87, S203–S211.
Bouhnik, Y., Raskine, L., Simoneau, G., Vicaut, E., Neut, C., Flourie, B.,
et al. (2004). The capacity of nondigestible carbohydrates to stimulate
fecal bifidobacteria in healthy humans: A double-blind, randomized,
placebo-controlled, parallel-group, dose-response relation study. The
American Journal of Clinical Nutrition, 80, 1658–1664.
Collins, M. D., Lawson, P. A., Willems, A., Cordoba, J. J., Fernandez-
Garayzabal, J., Garcia, P., et al. (1994). The phylogeny of the genus
Clostridium: proposal of five new genera and eleven new species
combinations. International Journal of Systematic Bacteriology, 144,
812–826.
Folstein, M. F., Folstein, S. E., & McHugh, P. R. (1975). ‘‘Mini-mental
state’’. A practical method for grading the cognitive state of patients
for the clinician. Journal of Psychiatric Research, 12, 189–198.
Gibson, G. R., Probert, H. M., Van Loo, J., Rastall, R. A., & Roberfroid,
M. B. (2004). Dietary modulation of the human colonic microbiota:
Updating the concept of prebiotics. Nutrition Research Reviews, 17,
259–275.
Gibson, G. R., & Roberfroid, M. B. (1995). Dietary modulation of the
human colonic microbiota: Introducing the concept of prebiotics.
Journal of Nutrition, 125, 1401–1412.
Gorbach, S. L., Nahas, L., Lerner, P. I., & Weinstein, L. (1967). Studies of
intestinal microflora. I. Effects of diet, age, and periodic sampling on
numbers of fecal microorganisms in man. Gastroenterology, 53,
845–855.
Hayashi, H., Sakamoto, M., Kitahara, M., & Benno, Y. (2003). Molecular
analysis of fecal microbiota in elderly individuals using 16S rDNA
library and T-RFLP. Microbiology and Immunology, 47, 557–570.
Hayashi, H., Sakamoto, M., Kitahara, & Benno, Y. (2006). Diversity of
the Clostridium coccoides group in human fecal microbiota as
determined by 16S rRNA gene library. FEMS Microbiological Letters,
257, 202–207.
He, T., Harmsen, H. J. M., Raangs, G. C., & Welling, G. W. (2003).
Composition of faecal microbiota of elderly people. Microbial Ecology
in Health and Disease, 15, 153–159.
Hopkins, M. J., & Macfarlane, G. T. (2002). Changes in pre-
dominant bacterial populations in human faeces with age and with
Clostridium difficile infection. Journal of Medical Microbiology, 51,
448–454.
Hopkins, M. J., Sharp, R., & Macfarlane, G. T. (2001). Age and disease
related changes in intestinal bacterial population assessed by cell
culture, 16S rRNA abundance, and community cellular fatty acid
profiles. Gut, 48, 198–205.
Hopkins, M. J., Sharp, R., & Macfarlane, G. T. (2002). Variation in
human intestinal microbiota with age. Digestive and Liver Disease, 34,
S12–S18.
Ito, M., Deguchi, Y., Matsumoto, K., Kimura, M., Onodera, N., &
Yajima, T. (1993). Influence of galacto-oligosaccharides on human
faecal microflora. Journal of Nutritional Science and Vitaminology, 39,
635–640.
Mahoney, F. I., & Barthel, D. W. (1965). Functional evaluation: The
Barthel index. Maryland State Medical Journal, 14, 61–65.
Matsuki, T., Watanabe, K., Fujimoto, J., Miyamoto, Y., Takada, T.,
Matsumoto, K., et al. (2002). Development of 16S rRNA-gene-
targeted group-specific primers for the detection and identification of
predominant bacteria in human feces. Applied and Environmental
Microbiology, 68, 5445–5451.
Matto, J., Maunuksela, L., Kajander, K., Palva, A., Korpela, R.,
Kassinen, A., et al. (2005). Composition and temporal stability of
gastrointestinal microbiota in irritable bowel syndrome—a long-
itudinal study in IBS and control subjects. FEMS Immunology and
Medical Microbiology, 43, 213–222.
Maukonen, J., Satokari, R., Matto, J., Soderlund, H., Mattila-Sandholm,
T., & Saarela, M. (2006a). Prevalence and temporal stability of selected
clostridial groups in irritable bowel syndrome in relation to
predominant fecal bacteria. Journal of Medical Microbiology, 55,
625–633.
Maukonen, J., Matto, J., Satokari, R., Soderlund, H., Mattila-Sandholm,
T., & Saarela, M. (2006b). PCR-DGGE and RT-PCR-DGGE show
diversity and short-term temporal stability in Clostridium coccoides–
Eubacterium rectale group in human intestinal microbiota. FEMS
Microbiology Ecology, 58, 517–528.
Mitsuoka, T. (1992). Intestinal flora and aging. Nutrition Reviews, 50,
438–446.
Mueller, S., Saunier, K., Hanisch, C., Norin, E., Alm, L., Midvedt, T.,
et al. (2006). Differences in fecal microbiota in different European
study populations in relation to age, gender, and country: A cross-
sectional study. Applied and Environmental Microbiology, 72,
1027–1033.
Nubel, U., Engelen, B., Felske, A., Snaidr, J., Wieshuber, A., Amann,
R. I., et al. (1996). Sequence heterogeneities of genes encoding 16S
rRNAs in Paenibacillus polymyxa detected by temperature gradient gel
electrophoresis. Journal of Bacteriology, 178, 5636–5643.
Saarela, M., Maukonen, J., von Wright, A., Vilpponen-Salmela, T.,
Patterson, A. J., Scott, K. P., et al. (2007). Tetracycline susceptibility of
the ingested Lactobacillus acidophilus LaCH-5 and Bifidobacterium
animalis subsp. lactis Bb-12 strains during antibiotic–probiotic
intervention. International Journal of Antimicrobial Agents, 29,
271–280.
Sairanen, U., Piirainen, L., Nevala, R., & Korpela, R. (2007). Yoghurt
containing galacto-oligosaccharides, prunes and linseed reduces the
severity of mild constipation in elderly subjects. European Journal of
Clinical Nutrition. Advance online publication, 14 February 2007;
doi:10.1038/sj.ejcn.1602670.
Salminen, S., Deighton, M. A., Benno, Y., & Gorbach, S. (1998). Lactic
acid bacteria in health and disease. In S. Salminen, & A. von Wright
(Eds.), Lactic acid bacteria, microbiology and functional aspects (2nd
ed, pp. 211–253). New York, NY, USA: Marcel Dekker.
Satokari, R., Vaughan, E., Akkermans, A., Saarela, M., & de Vos, W.
(2001a). Bifidobacterial diversity in human feces detected by
ARTICLE IN PRESSJ. Maukonen et al. / International Dairy Journal 18 (2008) 386–395394
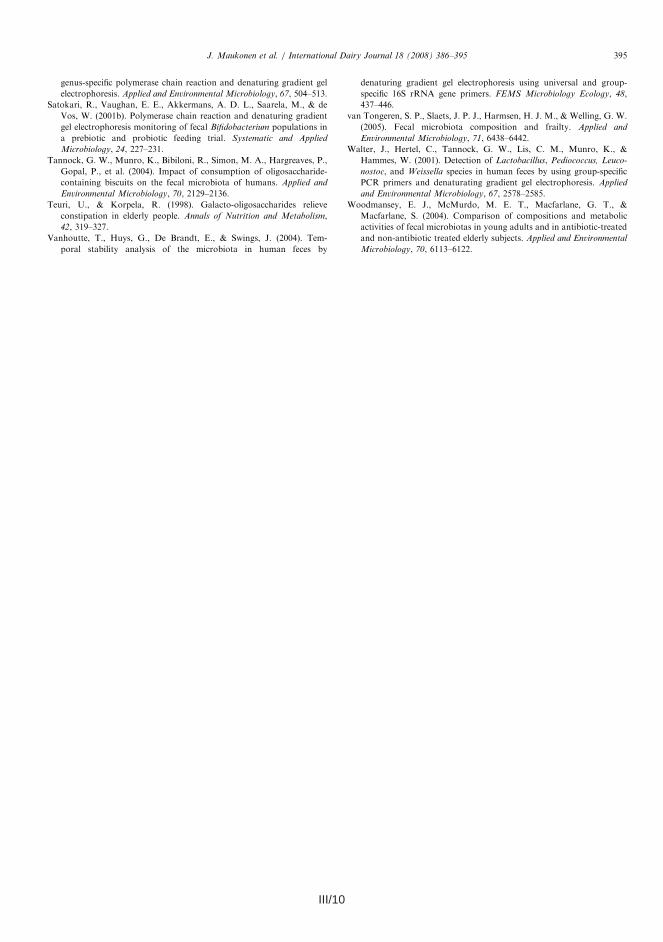
III/10 1
genus-specific polymerase chain reaction and denaturing gradient gel
electrophoresis. Applied and Environmental Microbiology, 67, 504–513.
Satokari, R., Vaughan, E. E., Akkermans, A. D. L., Saarela, M., & de
Vos, W. (2001b). Polymerase chain reaction and denaturing gradient
gel electrophoresis monitoring of fecal Bifidobacterium populations in
a prebiotic and probiotic feeding trial. Systematic and Applied
Microbiology, 24, 227–231.
Tannock, G. W., Munro, K., Bibiloni, R., Simon, M. A., Hargreaves, P.,
Gopal, P., et al. (2004). Impact of consumption of oligosaccharide-
containing biscuits on the fecal microbiota of humans. Applied and
Environmental Microbiology, 70, 2129–2136.
Teuri, U., & Korpela, R. (1998). Galacto-oligosaccharides relieve
constipation in elderly people. Annals of Nutrition and Metabolism,
42, 319–327.
Vanhoutte, T., Huys, G., De Brandt, E., & Swings, J. (2004). Tem-
poral stability analysis of the microbiota in human feces by
denaturing gradient gel electrophoresis using universal and group-
specific 16S rRNA gene primers. FEMS Microbiology Ecology, 48,
437–446.
van Tongeren, S. P., Slaets, J. P. J., Harmsen, H. J. M., & Welling, G. W.
(2005). Fecal microbiota composition and frailty. Applied and
Environmental Microbiology, 71, 6438–6442.
Walter, J., Hertel, C., Tannock, G. W., Lis, C. M., Munro, K., &
Hammes, W. (2001). Detection of Lactobacillus, Pediococcus, Leuco-
nostoc, and Weissella species in human feces by using group-specific
PCR primers and denaturating gradient gel electrophoresis. Applied
and Environmental Microbiology, 67, 2578–2585.
Woodmansey, E. J., McMurdo, M. E. T., Macfarlane, G. T., &
Macfarlane, S. (2004). Comparison of compositions and metabolic
activities of fecal microbiotas in young adults and in antibiotic-treated
and non-antibiotic treated elderly subjects. Applied and Environmental
Microbiology, 70, 6113–6122.
ARTICLE IN PRESSJ. Maukonen et al. / International Dairy Journal 18 (2008) 386–395 395
1
ARTICLE IV
Intra-individual diversity and similarity of salivary
and faecal microbiota
In: Journal of Medical Microbiology, 57, pp. 1560–1568.
Copyright 2008 SGM.Reprinted with permission from the publisher.

IV/1
IV/1
Intra-individual diversity and similarity of salivary andfaecal microbiota
Johanna Maukonen, Jaana Matto,3 Maija-Liisa Suihko and Maria Saarela
Correspondence
Johanna Maukonen
VTT Technical Research Centre, PO Box 1000, FI-02044 VTT, Finland
Received 18 April 2007
Accepted 24 August 2008
In the present study, polyphasic analysis [cultivation, combined with the fingerprinting of individual
isolates, and denaturing gradient gel electrophoresis (DGGE)] was applied to study whether
similar features concerning the diversity and temporal stability of selected bacterial groups could
be detected intra-individually in two different niches – the oral cavity and the colon – from ten
adult volunteers consuming probiotics. The predominant bacterial microbiota, Clostridium
coccoides–Eubacterium rectale group and bifidobacterial populations, were generally stable in
salivary and faecal samples, with the greater diversity seen in faeces. Furthermore, different
species predominated at the two different sites. Lactobacillus group DGGE profiles were
unstable, yet the intra-individual profiles from faecal and salivary samples collected at the same
time resembled each other. The ingested probiotic product did not affect the stability of the
bacterial groups studied. The culture-based analysis showed that most subjects harboured
identical indigenous Lactobacillus genotypes in saliva and faeces (Lactobacillus rhamnosus,
Lactobacillus gasseri, Lactobacillus paracasei and Lactobacillus plantarum group). Thus,
identical indigenous lactobacilli were able to inhabit both ends of the orogastrointestinal tract,
whereas the composition of the other bacterial groups studied varied between the two sites.
INTRODUCTION
Both ends of the orogastrointestinal tract of humans havean abundant microbiota dominated by anaerobicallygrowing bacteria (Berg, 1996). The number of bacteria inthe oral cavity is about 1011 (g wet weight dental plaque)21
and 108–109 (ml saliva)21 (culturable bacteria; Nisengard& Newman, 1994; Li et al., 2005), whereas in faeces thecorresponding figure is 6–961010 (g wet weight)21
(detected with molecular techniques; Thiel & Blaut,2005). Although the same bacterial genera can be foundin oral and colonic samples, to the best of our knowledgeonly one intra-individual comparative study of bacterialpopulations (in this case lactobacilli) of these two samplingsites has been performed previously in humans (Dal Bello& Hertel, 2006).
The faecal microbiota is dominated by the Clostridiumcoccoides–Eubacterium rectale (Erec) group, Clostridiumleptum group and Bacteroidetes group (Franks et al., 1998;Suau et al., 1999; Sghir et al., 2000; Eckburg et al., 2005),which account for over 70% of faecal bacteria (Sghir et al.,2000). The bacteria belonging to the Erec group (clostridial
cluster XIVa) (Collins et al., 1994) comprise 10–59% of thetotal faecal bacteria depending on the detection methodused (Franks et al., 1998; Suau et al., 1999; Sghir et al.,2000; Eckburg et al., 2005; Maukonen et al., 2006a).Bifidobacterium and Lactobacillus, although found in mostsubjects, comprise smaller populations among faecalbacteria in adults (bifidobacteria, 1–5%; lactobacilli, ,1–2%; Franks et al., 1998; Sghir et al., 2000). The oral cavitycontains different micro-environments (cheeks, palate,tongue, tooth surfaces, gingival areas and saliva), eachwith their own microbiota (Aas et al., 2005). The salivarymicrobiota reflects a mixture of bacteria washed off fromthe various surfaces, especially from the tongue (Nisengard& Newman, 1994). A large diversity of bacteria has beendetected in the oral cavity, including low-mol% G+C-content Gram positive organisms (e.g. streptococci andClostridia group), fusobacteria, actinobacteria, differentproteobacteria, Prevotella, Porphyromonas, Bacteroides andspirochaetes. Members of the clostridial cluster XIVa haveoccasionally been detected in oral samples (Paster et al.,2001). In the oral cavity, both bifidobacteria andlactobacilli can be detected, but their occurrence is reversedcompared with faeces: lactobacilli are a common finding inthe oral cavity, whereas bifidobacteria are detected lessfrequently.
The aim of this study was to investigate whether similarfeatures concerning the diversity and temporal stability ofthe predominant microbiota and selected bacterial groups
Abbreviations: DDGE, denaturing gradient gel electrophoresis; Erec,Clostridium coccoides–Eubacterium rectale; RAPD, randomly amplifiedpolymorphic DNA.
3Present address: Finnish Red Cross Blood Service, Kivihaantie 7,00310 Helsinki, Finland.
Journal of Medical Microbiology (2008), 57, 1560–1568 DOI 10.1099/jmm.0.47352-0
1560 47352 G 2008 SGM Printed in Great Britain
IV/2 IV/3
oral and faecal bacterial populations have been comparedintra-individually using molecular techniques (Dal Bello &Hertel, 2006). The probiotic product used in our study didnot notably affect the stability of the predominant micro-biota profile, Erec group profile or bifidobacterial profile(using non-modified primers that targeted only theintestinal bifidobacteria and not the ingested probioticbifidobacteria), as the baseline DGGE profiles (beforeprobiotic ingestion) were highly similar to those of thesamples after 1 and 2 weeks of probiotic ingestion. All ofthese bacterial groups remained relatively stable in most ofthe subjects. Our study showed that, in the cases ofpredominant microbiota, bifidobacteria and Erec groupbacteria, the faecal microbiota was more diverse than that insaliva. In addition, salivary and faecal DGGE profiles of thesegroups appeared to be substantially different. Interestingly,most subjects’ faecal and salivary samples containedidentical indigenous Lactobacillus species and genotypes.
Compliance was evaluated with culture-based techniquesand DGGE analysis in this study. Probiotic strains were notfound in any of the baseline samples, whereas RAPD typesidentical to B. animalis subsp. lactis Bb-12 were found fromall faecal samples during probiotic ingestion (after 1 and 2weeks). Ingested probiotic strains were not found in any ofour salivary samples.
Diversity and temporal stability of the predominantbacterial microbiota, Erec group, Lactobacillusgroup and bifidobacteria as detected with DGGE
Predominant bacterial microbiotaDGGE analysis targeted to the predominant microbiotashowed intra-individual diversity as well as uniqueness of
both faecal and salivary microbiota (Fig. 1a). Aftercomparison of all faecal- and saliva-based profiles, faecalprofiles and salivary profiles formed two distinct clusters,with individual-based subclusters (data not shown).Indeed, the DGGE profiles of faecal and salivary samplesdiffered substantially (mean similarity 23.7±7.1%; Table1). The predominant faecal microbiota was relatively stabletemporally (mean similarity 83.3±5.3%) and the salivarymicrobiota was mostly stable (mean similarity92.2±2.5 %) during the study period (Table 2). This isconsistent with previous work, which showed that thefaecal microbiota is host specific and relatively stabletemporally (Zoetendal et al., 1998; Vanhoutte et al., 2004;Maukonen et al., 2006b). Likewise, in a recent study byRasiah et al. (2005), it was shown that the predominantsalivary microbiota remained stable in one subject for7 years. We found a significant difference between thenumber of amplicons detected in the faecal and salivaryprofiles (faeces.saliva; P,0.05) (Table 2). Aas et al. (2005)showed that 20–30 different predominant species werefound from most oral sites, utilizing 16S rRNA gene clonelibraries. Our universal DGGE results are in accordancewith this previous work.
Erec groupDGGE analysis targeted to the Erec group showed intra-individual diversity as well as uniqueness of both faecal andsalivary microbiota (Fig. 1b). Erec profiles of faecal samplesclustered together according to subject, whereas salivarysamples clustered according to subject in eight cases (datanot shown). The similarity between faecal samples andsalivary samples from the same subject at a given timepoint was very low or non-existent (mean similarity
Fig. 1. Faecal and salivary DGGE profiles of a healthy subject. (a) Universal primers; (b) Erec group primers; (c) Lactobacillusgroup primers; (d) bifidobacteria primers. DNA was obtained from faecal samples (8F) and salivary samples (8S) at baseline(before probiotic consumption; lane 0), and after 1 and 2 weeks of probiotic consumption (lanes 1 and 2, respectively). BM,Bifidobacterial marker; EM, Erec group marker; LM, lactobacillus marker; UM, universal marker.
J. Maukonen and others
1562 Journal of Medical Microbiology 57
– namely the clostridial cluster XIVa, bifidobacteria andlactobacilli – could be detected intra-individually in twodifferent niches: the oral cavity and the colon. Special focuswas also put on the species distribution of the generaLactobacillus and Bifidobacterium at these two sites.
METHODS
Sample handling. Faecal and salivary (5 ml saliva collected with
paraffin stimulation) samples were collected from ten adult volunteers
(nine females, one male, aged 34–57 years) at three sampling time
points (at baseline before probiotic consumption and after 1 and
2 weeks of probiotic consumption). The subjects consumed a
commercial probiotic capsule preparation (Trevis, 54 capsules; Ipex
Medical) according to the manufacturer’s instructions (three capsules
each day) for 2 weeks. Trevis capsules contain a mixture of
Lactobacillus acidophilus LaCH-5, Bifidobacterium animalis subsp. lactis
Bb-12 and yoghurt starter bacteria, totalling 109–1010 organisms per
capsule. The main recruiting criterion was a normal intestinal balance
(absence of repeating and/or persisting gastrointestinal symptoms).
The exclusion criteria were regular gastrointestinal tract symptoms,
lactose intolerance, coeliac disease and antimicrobial therapy during
the 2 months prior to the study. The study was approved by the ethical
committee of the VTT Technical Research Centre of Finland. All
subjects gave written informed consent for participation in the study.
Part of the faecal sample was transferred to Cary–Blair transport
medium (Atlas, 1997) and part of the salivary sample to VMGA III
medium (Rams et al., 1990), and these were analysed by culture
within 1–2 days. The stability of the studied bacterial groups in the
transport medium was confirmed by culturing four samples
immediately after sampling and after storage for 2 days in the
appropriate transport medium. The rest of the samples were frozen at
270 uC for DNA-based analyses.
Culture-based analysis
The samples were serially diluted in pre-reduced peptone saline
containing 0.5 g L-cysteine/HCl l21 (pH 6.3; Merck) and plated on
culture medium in an anaerobic workstation (Don Whitley
Scientific). The following culture media and incubation conditions
were used (incubation at 37 uC): supplemented Brucella blood agar
(Tammer-Tutkan Maljat) for anaerobes (anaerobic incubation for
7 days), sheep blood agar for aerobes (Tammer-Tutkan Maljat)
(aerobic incubation for 4 days) and Beerens agar for bifidobacteria
(Beerens, 1991) (anaerobic incubation for 4 days). For the detection
of B. animalis subsp. lactis Bb-12, the samples were also acid pre-
treated (Alander et al., 2001). Rogosa agar was used for the detection
of lactobacilli (anaerobic incubation for 3 days). For the detection of
L. acidophilus LaCH-5, the Rogosa plates were incubated micro-
aerophilically. Beerens and Rogosa agars were also used with
tetracycline supplementation (8 mg ml21), as B. animalis subsp. lactis
Bb-12 is intermediately resistant to tetracycline.
Isolates representing all of the different potential Lactobacillus and
Bifidobacterium colony morphologies, or, in the case of uniform colony
morphology, random isolates, were collected from Beerens- and
Rogosa-based media (five isolates from each medium where possible)
for comparison of the species distribution in saliva and faeces.
Fingerprinting of bifidobacteria and lactobacilli by randomly
amplified polymorphic DNA (RAPD). A total of 587 isolates from
Beerens medium were analysed by RAPD using primer OPA-2 (59-TGCCGAGCTG-39) and 574 isolates from Rogosa were analysed by
RAPD using primer OPA-3 (59-AGTCAGCCAC-39) as described
previously (Alander et al., 2001). The RAPD fingerprints of faecal and
salivary isolates were compared with those of the B. animalis subsp.
lactis Bb-12 and L. acidophilus LaCH-5 strains by visual inspection.
All types that looked different to the ingested probiotic strains were
selected for further characterization.
Partial 16S rRNA gene sequencing. Isolates representing different
RAPD types were identified by partial 16S rRNA gene sequencing.
Beerens isolates were amplified with Bif164-f (59-GGGTGGTAATG-CCGGATG-39) and Bif662-GC-r (59-CGCCCGCCGCGCGCGGCG-GGCGGGGCGGGGGCACGGGGGGCCACCGTTACACCGGGAA-39)as described by Satokari et al. (2001a). Rogosa isolates were amplified
with BSF8/20 (59-AGAGTTTGATCCTGGCTCAG-39) and BSR1541/20
(59-AAGGAGGTGATCCAGCCGCA-39) (Wilmotte et al., 1993). The
lactobacilli PCR mixture contained 0.2 mM each dNTP, 0.2 mM primer
and 3 U Dynazyme II DNA polymerase in 16 Dynazyme buffer. PCR
amplification was carried out in a thermocycler (UnoII, Biometra; 35
cycles with an annealing temperature of 56 uC). The amplification
products were checked, purified and further sequenced with primers
Bif164-f or BSF8/20 as described previously (Maukonen et al., 2006b).
PCR-denaturing gradient gel electrophoresis (DGGE) analysis.DNA was extracted as described by Maukonen et al. (2006b). Part of
the 16S rRNA gene (V6–V8 hypervariable region) was PCR amplified
for the detection of predominant bacterial microbiota using primers
U968-f+GC (59-CGCCCGGGGCGCGCCCCGGGCGGGGCGGGG-GCACGGGGGGAACGCGAAGAACCTTA-39) and U1401-r (59-CGGTGTGTACAAGACCC-39) (Nubel et al., 1996), as described by
Matto et al. (2005). Primers Bif164-f and Bif662-GC-r were used to
evaluate the diversity and temporal stability of bifidobacteria
according to Satokari et al. (2001a). Primers Bif164mod-f (59-GGGTGGTAATACCGGATG-39) and Bif662-GC-r (Satokari et al.,
2001b) were used for the detection of B. animalis subsp. lactis Bb-12.
The Lactobacillus group, which comprises the genera Lactobacillus,
Leuconostoc, Pediococcus and Weissella, was amplified using primers
Lac1 (59-AGCAGTAGGGAATCTTCCA-39 and Lac2GC (59-CGCCC-GCCGCGCCCCGCGCCCGGCCCGCCG CCCCCGCCCCATTYCA-
CCGCTACACATG-39) (Walter et al., 2001), as described by
Vanhoutte et al. (2004). The Erec group was PCR amplified using
primers Ccoc-f (59-AAATGACGGTACCTGACTAA-39; Matsuki et al.,
2002) and Ccoc-r+GC (59-CGCCCGGGGCGCGCCCCGGGCGG-GGCGGGGGCACGGGGGGCTTTGAGTTTCATTCTTGCGAA-39)according to Maukonen et al. (2006b).
PCR products were separated by polyacrylamide gels with a
denaturing gradient of 38–60% (predominant bacterial microbiota
and Erec group), 45–55% (bifidobacteria) or 30–60% (Lactobacillus
group) [where 100% is 7 M urea and 40% (v/v) deionized
formamide] as described by Matto et al. (2005). L. acidophilus
LaCH-5 was added as a probiotic control lane to each Lactobacillus
group-specific DGGE. Comparison of the PCR-DGGE profiles was
performed as described previously (Maukonen et al., 2006b).
Statistical analysis. Means±SD were calculated for each experi-
ment. Results with microbial numbers below the detection limit (log
4 for all microbial groups) were excluded from statistical analysis
using Student’s t-test (two-sample test assuming unequal variances).
RESULTS AND DISCUSSION
In the present study, both the culture-based approach(combined with fingerprinting of individual isolates) andPCR-DGGE were applied to study the intra-individualdiversity and temporal stability of microbiota at twodifferent sites, the oral cavity and the colon. To the best ofour knowledge, there is only one previous study where the
Intra-individual analysis of salivary/faecal microbiota
http://jmm.sgmjournals.org 1561
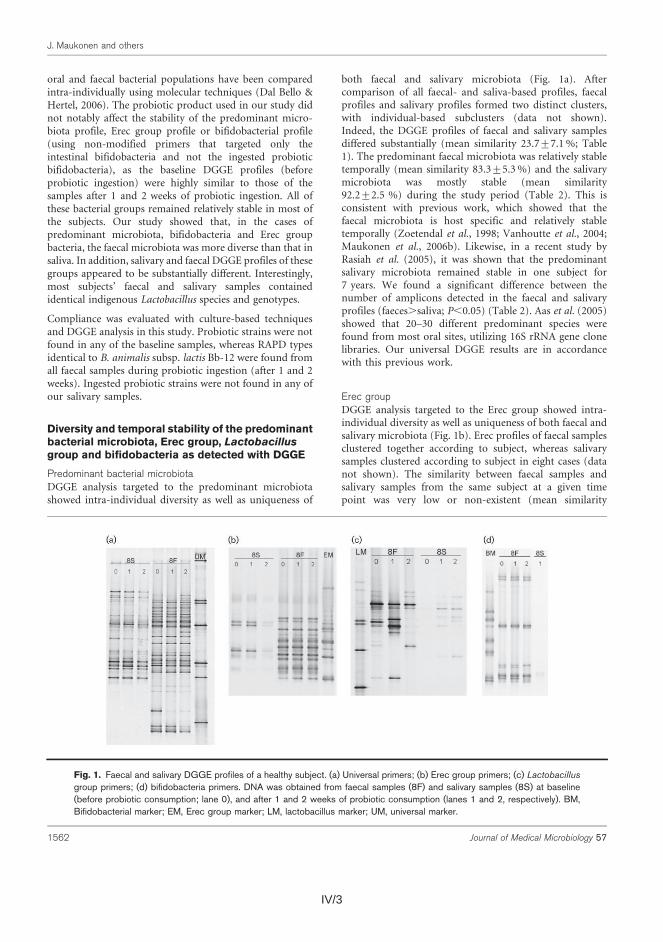
IV/3
oral and faecal bacterial populations have been comparedintra-individually using molecular techniques (Dal Bello &Hertel, 2006). The probiotic product used in our study didnot notably affect the stability of the predominant micro-biota profile, Erec group profile or bifidobacterial profile(using non-modified primers that targeted only theintestinal bifidobacteria and not the ingested probioticbifidobacteria), as the baseline DGGE profiles (beforeprobiotic ingestion) were highly similar to those of thesamples after 1 and 2 weeks of probiotic ingestion. All ofthese bacterial groups remained relatively stable in most ofthe subjects. Our study showed that, in the cases ofpredominant microbiota, bifidobacteria and Erec groupbacteria, the faecal microbiota was more diverse than that insaliva. In addition, salivary and faecal DGGE profiles of thesegroups appeared to be substantially different. Interestingly,most subjects’ faecal and salivary samples containedidentical indigenous Lactobacillus species and genotypes.
Compliance was evaluated with culture-based techniquesand DGGE analysis in this study. Probiotic strains were notfound in any of the baseline samples, whereas RAPD typesidentical to B. animalis subsp. lactis Bb-12 were found fromall faecal samples during probiotic ingestion (after 1 and 2weeks). Ingested probiotic strains were not found in any ofour salivary samples.
Diversity and temporal stability of the predominantbacterial microbiota, Erec group, Lactobacillusgroup and bifidobacteria as detected with DGGE
Predominant bacterial microbiotaDGGE analysis targeted to the predominant microbiotashowed intra-individual diversity as well as uniqueness of
both faecal and salivary microbiota (Fig. 1a). Aftercomparison of all faecal- and saliva-based profiles, faecalprofiles and salivary profiles formed two distinct clusters,with individual-based subclusters (data not shown).Indeed, the DGGE profiles of faecal and salivary samplesdiffered substantially (mean similarity 23.7±7.1%; Table1). The predominant faecal microbiota was relatively stabletemporally (mean similarity 83.3±5.3%) and the salivarymicrobiota was mostly stable (mean similarity92.2±2.5 %) during the study period (Table 2). This isconsistent with previous work, which showed that thefaecal microbiota is host specific and relatively stabletemporally (Zoetendal et al., 1998; Vanhoutte et al., 2004;Maukonen et al., 2006b). Likewise, in a recent study byRasiah et al. (2005), it was shown that the predominantsalivary microbiota remained stable in one subject for7 years. We found a significant difference between thenumber of amplicons detected in the faecal and salivaryprofiles (faeces.saliva; P,0.05) (Table 2). Aas et al. (2005)showed that 20–30 different predominant species werefound from most oral sites, utilizing 16S rRNA gene clonelibraries. Our universal DGGE results are in accordancewith this previous work.
Erec groupDGGE analysis targeted to the Erec group showed intra-individual diversity as well as uniqueness of both faecal andsalivary microbiota (Fig. 1b). Erec profiles of faecal samplesclustered together according to subject, whereas salivarysamples clustered according to subject in eight cases (datanot shown). The similarity between faecal samples andsalivary samples from the same subject at a given timepoint was very low or non-existent (mean similarity
Fig. 1. Faecal and salivary DGGE profiles of a healthy subject. (a) Universal primers; (b) Erec group primers; (c) Lactobacillusgroup primers; (d) bifidobacteria primers. DNA was obtained from faecal samples (8F) and salivary samples (8S) at baseline(before probiotic consumption; lane 0), and after 1 and 2 weeks of probiotic consumption (lanes 1 and 2, respectively). BM,Bifidobacterial marker; EM, Erec group marker; LM, lactobacillus marker; UM, universal marker.
J. Maukonen and others
1562 Journal of Medical Microbiology 57
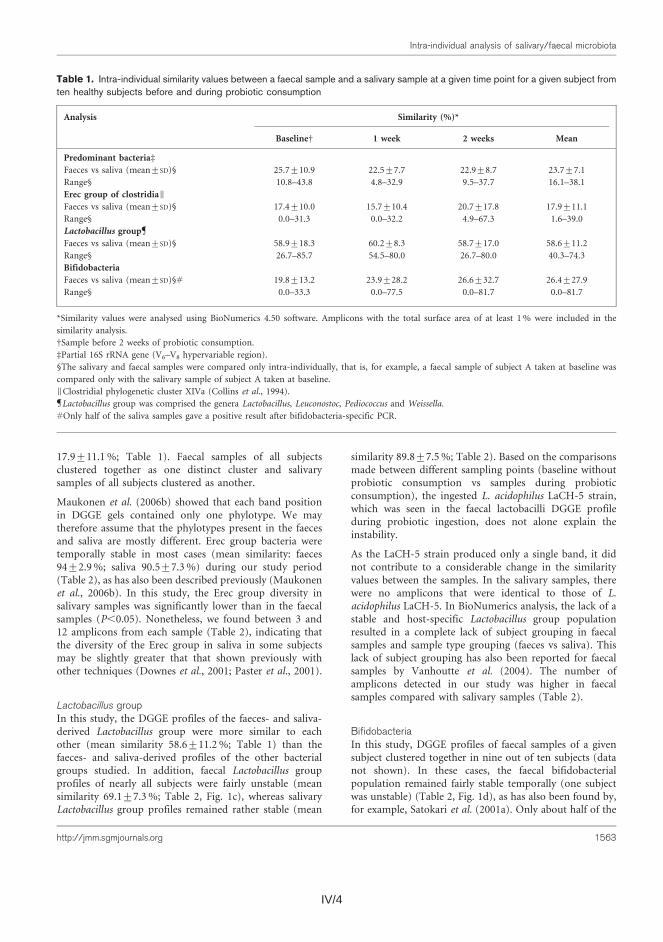
IV/4 IV/5
salivary samples (17/30 samples) gave a positive PCRresult, although several additional variations to the PCRprotocol were tested (data not shown). The salivarybifidobacterial populations were temporally stable in threesubjects and unstable in one subject (a different subjectfrom the one who had an unstable faecal bifidobacterialpopulation; data not shown). Of the remaining six subjects,only one sample from three subjects and two samples fromanother subject produced a PCR product, thus notallowing temporal stability to be determined. The bifido-bacterial profiles did not cluster according to sample type,even though the similarity between faecal and salivarysamples collected at the same time was low. The faecalsamples contained significantly more amplicons than thesalivary samples at all sampling time points (P,0.05)(Table 2). As the PCR primers used for the DGGE-baseddiversity assessment had one base mismatch (Satokari etal., 2001b) with the sequence of the ingested B. animalissubsp. lactis Bb-12, this strain was not seen in thebifidobacterial DGGE profiles and therefore did not affect
the temporal stability of the faecal and salivary profiles.However, Bb-12 was detected in faecal samples from sevenof the ten subjects using DGGE targeting B. animalis subsp.lactis Bb-12. There were no amplicons that migrated atidentical positions to those of B. animalis subsp. lactis Bb-12 in any of the salivary samples.
Culture
Mean numbers of culturable bacteria on media withouttetracycline at different sampling occasions are shown inFig. 2. The number of culturable bacteria remained stableduring probiotic consumption in both faecal and salivarysamples. The number of culturable anaerobic bacteria wassignificantly higher in faeces (mean log 10.5 c.f.u. g21) thanin saliva (mean log 8.3 c.f.u. g21) (P,0.05), whereas thenumber of culturable aerobic bacteria was significantlyhigher in saliva (mean log 7.8 c.f.u. g21) than in faeces(mean log 7.1 c.f.u. g21) (P,0.05). The numbers of bothbifidobacteria and lactobacilli were significantly higher in
Table 2. Intra-individual similarity values and diversity of DGGE profiles of human faecal and salivary samples obtained at threedifferent time points from ten healthy subjects
Analysis Similarity (%)* DiversityD
0 vs 1 0 vs 2 1 vs 2 Mean 0 week 1 week 2 weeks Mean
Predominant
bacteriad
Faeces (mean±SD) 84.3±7.8 81.0±7.6 84.7±4.9 83.3±5.3 33.7±4.2 35.8±4.4 35.1±4.4 34.9±4.0
Range 70.3–92.8 70.0–90.6 75.6–92.2 72.0–90.9 25–39 27–42 27–41 26.3–40.7
Saliva (mean±SD) 92.1±3.3 91.4±2.5 93.2±4.4 92.2±2.5 23.9±2.9 23.1±2.2 23.8±2.9 23.6±2.4
Range 86.0–95.8 87.2–94.2 82.9–98.0 88.8–95.3 20–27 19–26 19–28 19.3–26.7
Erec group§
Faeces (mean±SD) 95.1±2.8 92.3±4.7 94.8±2.0 94.0±2.9 15.1±2.4 15.5±2.3 14.8±1.9 15.1±2.0
Range 89.9–98.6 81.6–97.5 90.0–97.3 87.1–96.9 11–19 13–19 12–19 12.3–18.7
Saliva (mean±SD) 92.9±7.7 86.7±11.8 92.0±9.2 90.5±7.3 7.4±2.1 7.4±1.6 7.7±2.0 7.5±1.7
Range 73.8–98.2 66.5–98.0 70.0–99.4 77.2–98.0 3–11 5–10 5–12 4.7–9.7
Lactobacillus group||
Faeces (mean±SD) 70.0±8.1 68.2±11.9 70.7±14.0 69.1±7.3 12.0±5.3 10.9±2.8 11.0±2.4 11.5±3.0
Range 60.0–85.7 50.0–85.7 50.0–88.9 61.0–85.7 7–22 7–15 7–14 8.0–16.3
Saliva (mean±SD) 92.2±13.9 87.6±11.0 89.5±6.5 89.8±7.5 7.0±2.8 7.9±3.1 7.0±3.4 7.3±2.9
Range 66.7–100 66.7–100 80.0–100 76.9–100 3–13 5–14 4–15 3.7–14.0
Bifidobacteria
Faeces (mean±SD) 94.0±3.5 87.1±10.8 82.3±16.2 87.8±9.6 9.1±2.8 8.8±2.4 9.1±3.2 9.0±2.6
Range 90.9–99.6 68.2–97.8 52.5–98.1 70.7–97.1 6–15 7–15 4–14 5.3–14.7
Saliva (mean±SD) 84.7±17.9 97.9±2.0 89.2±15.7 86.4±16.0 4.5±1.9 5.8±1.5 4.0±1.7 4.4±1.4
Range 62.3–98.9 95.5–99.7 65.6–98.0 62.3–98.0 2–7 4–8 2–7 3.0–6.7
*Similarity values were calculated using BioNumerics 4.50 software. Amplicons with a total surface area of at least 1% were included in the
similarity analysis. 0, baseline (before probiotic consumption); 1, 1 week of probiotic consumption; 2, 2 weeks of probiotic consumption.
DDiversity is presented as the number of bands making up .1% of the total profile as detected by the BioNumerics 4.50 software.
dPartial 16S rRNA gene (V6–V8 hypervariable region).
§Clostridial phylogenetic cluster XIVa (Collins et al., 1994).
||Lactobacillus group was comprised the genera Lactobacillus, Leuconostoc, Pediococcus and Weissella.
Only half of the salivary samples gave a positive result after bifidobacteria-specific PCR.
J. Maukonen and others
1564 Journal of Medical Microbiology 57
17.9±11.1%; Table 1). Faecal samples of all subjectsclustered together as one distinct cluster and salivarysamples of all subjects clustered as another.
Maukonen et al. (2006b) showed that each band positionin DGGE gels contained only one phylotype. We maytherefore assume that the phylotypes present in the faecesand saliva are mostly different. Erec group bacteria weretemporally stable in most cases (mean similarity: faeces94±2.9%; saliva 90.5±7.3%) during our study period(Table 2), as has also been described previously (Maukonenet al., 2006b). In this study, the Erec group diversity insalivary samples was significantly lower than in the faecalsamples (P,0.05). Nonetheless, we found between 3 and12 amplicons from each sample (Table 2), indicating thatthe diversity of the Erec group in saliva in some subjectsmay be slightly greater that that shown previously withother techniques (Downes et al., 2001; Paster et al., 2001).
Lactobacillus groupIn this study, the DGGE profiles of the faeces- and saliva-derived Lactobacillus group were more similar to eachother (mean similarity 58.6±11.2%; Table 1) than thefaeces- and saliva-derived profiles of the other bacterialgroups studied. In addition, faecal Lactobacillus groupprofiles of nearly all subjects were fairly unstable (meansimilarity 69.1±7.3%; Table 2, Fig. 1c), whereas salivaryLactobacillus group profiles remained rather stable (mean
similarity 89.8±7.5%; Table 2). Based on the comparisonsmade between different sampling points (baseline withoutprobiotic consumption vs samples during probioticconsumption), the ingested L. acidophilus LaCH-5 strain,which was seen in the faecal lactobacilli DGGE profileduring probiotic ingestion, does not alone explain theinstability.
As the LaCH-5 strain produced only a single band, it didnot contribute to a considerable change in the similarityvalues between the samples. In the salivary samples, therewere no amplicons that were identical to those of L.acidophilus LaCH-5. In BioNumerics analysis, the lack of astable and host-specific Lactobacillus group populationresulted in a complete lack of subject grouping in faecalsamples and sample type grouping (faeces vs saliva). Thislack of subject grouping has also been reported for faecalsamples by Vanhoutte et al. (2004). The number ofamplicons detected in our study was higher in faecalsamples compared with salivary samples (Table 2).
BifidobacteriaIn this study, DGGE profiles of faecal samples of a givensubject clustered together in nine out of ten subjects (datanot shown). In these cases, the faecal bifidobacterialpopulation remained fairly stable temporally (one subjectwas unstable) (Table 2, Fig. 1d), as has also been found by,for example, Satokari et al. (2001a). Only about half of the
Table 1. Intra-individual similarity values between a faecal sample and a salivary sample at a given time point for a given subject fromten healthy subjects before and during probiotic consumption
Analysis Similarity (%)*
BaselineD 1 week 2 weeks Mean
Predominant bacteriad
Faeces vs saliva (mean±SD)§ 25.7±10.9 22.5±7.7 22.9±8.7 23.7±7.1
Range§ 10.8–43.8 4.8–32.9 9.5–37.7 16.1–38.1
Erec group of clostridiaIFaeces vs saliva (mean±SD)§ 17.4±10.0 15.7±10.4 20.7±17.8 17.9±11.1
Range§ 0.0–31.3 0.0–32.2 4.9–67.3 1.6–39.0
Lactobacillus group
Faeces vs saliva (mean±SD)§ 58.9±18.3 60.2±8.3 58.7±17.0 58.6±11.2
Range§ 26.7–85.7 54.5–80.0 26.7–80.0 40.3–74.3
Bifidobacteria
Faeces vs saliva (mean±SD)§# 19.8±13.2 23.9±28.2 26.6±32.7 26.4±27.9
Range§ 0.0–33.3 0.0–77.5 0.0–81.7 0.0–81.7
*Similarity values were analysed using BioNumerics 4.50 software. Amplicons with the total surface area of at least 1% were included in the
similarity analysis.
DSample before 2 weeks of probiotic consumption.
dPartial 16S rRNA gene (V6–V8 hypervariable region).
§The salivary and faecal samples were compared only intra-individually, that is, for example, a faecal sample of subject A taken at baseline was
compared only with the salivary sample of subject A taken at baseline.
IClostridial phylogenetic cluster XIVa (Collins et al., 1994).
Lactobacillus group was comprised the genera Lactobacillus, Leuconostoc, Pediococcus and Weissella.#Only half of the saliva samples gave a positive result after bifidobacteria-specific PCR.
Intra-individual analysis of salivary/faecal microbiota
http://jmm.sgmjournals.org 1563
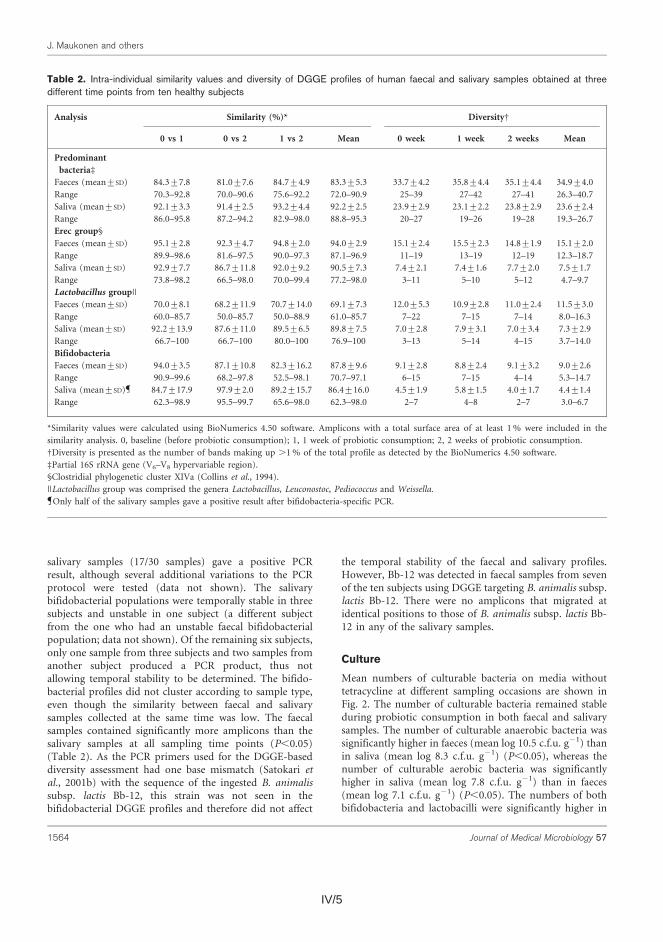
IV/5
salivary samples (17/30 samples) gave a positive PCRresult, although several additional variations to the PCRprotocol were tested (data not shown). The salivarybifidobacterial populations were temporally stable in threesubjects and unstable in one subject (a different subjectfrom the one who had an unstable faecal bifidobacterialpopulation; data not shown). Of the remaining six subjects,only one sample from three subjects and two samples fromanother subject produced a PCR product, thus notallowing temporal stability to be determined. The bifido-bacterial profiles did not cluster according to sample type,even though the similarity between faecal and salivarysamples collected at the same time was low. The faecalsamples contained significantly more amplicons than thesalivary samples at all sampling time points (P,0.05)(Table 2). As the PCR primers used for the DGGE-baseddiversity assessment had one base mismatch (Satokari etal., 2001b) with the sequence of the ingested B. animalissubsp. lactis Bb-12, this strain was not seen in thebifidobacterial DGGE profiles and therefore did not affect
the temporal stability of the faecal and salivary profiles.However, Bb-12 was detected in faecal samples from sevenof the ten subjects using DGGE targeting B. animalis subsp.lactis Bb-12. There were no amplicons that migrated atidentical positions to those of B. animalis subsp. lactis Bb-12 in any of the salivary samples.
Culture
Mean numbers of culturable bacteria on media withouttetracycline at different sampling occasions are shown inFig. 2. The number of culturable bacteria remained stableduring probiotic consumption in both faecal and salivarysamples. The number of culturable anaerobic bacteria wassignificantly higher in faeces (mean log 10.5 c.f.u. g21) thanin saliva (mean log 8.3 c.f.u. g21) (P,0.05), whereas thenumber of culturable aerobic bacteria was significantlyhigher in saliva (mean log 7.8 c.f.u. g21) than in faeces(mean log 7.1 c.f.u. g21) (P,0.05). The numbers of bothbifidobacteria and lactobacilli were significantly higher in
Table 2. Intra-individual similarity values and diversity of DGGE profiles of human faecal and salivary samples obtained at threedifferent time points from ten healthy subjects
Analysis Similarity (%)* DiversityD
0 vs 1 0 vs 2 1 vs 2 Mean 0 week 1 week 2 weeks Mean
Predominant
bacteriad
Faeces (mean±SD) 84.3±7.8 81.0±7.6 84.7±4.9 83.3±5.3 33.7±4.2 35.8±4.4 35.1±4.4 34.9±4.0
Range 70.3–92.8 70.0–90.6 75.6–92.2 72.0–90.9 25–39 27–42 27–41 26.3–40.7
Saliva (mean±SD) 92.1±3.3 91.4±2.5 93.2±4.4 92.2±2.5 23.9±2.9 23.1±2.2 23.8±2.9 23.6±2.4
Range 86.0–95.8 87.2–94.2 82.9–98.0 88.8–95.3 20–27 19–26 19–28 19.3–26.7
Erec group§
Faeces (mean±SD) 95.1±2.8 92.3±4.7 94.8±2.0 94.0±2.9 15.1±2.4 15.5±2.3 14.8±1.9 15.1±2.0
Range 89.9–98.6 81.6–97.5 90.0–97.3 87.1–96.9 11–19 13–19 12–19 12.3–18.7
Saliva (mean±SD) 92.9±7.7 86.7±11.8 92.0±9.2 90.5±7.3 7.4±2.1 7.4±1.6 7.7±2.0 7.5±1.7
Range 73.8–98.2 66.5–98.0 70.0–99.4 77.2–98.0 3–11 5–10 5–12 4.7–9.7
Lactobacillus group||
Faeces (mean±SD) 70.0±8.1 68.2±11.9 70.7±14.0 69.1±7.3 12.0±5.3 10.9±2.8 11.0±2.4 11.5±3.0
Range 60.0–85.7 50.0–85.7 50.0–88.9 61.0–85.7 7–22 7–15 7–14 8.0–16.3
Saliva (mean±SD) 92.2±13.9 87.6±11.0 89.5±6.5 89.8±7.5 7.0±2.8 7.9±3.1 7.0±3.4 7.3±2.9
Range 66.7–100 66.7–100 80.0–100 76.9–100 3–13 5–14 4–15 3.7–14.0
Bifidobacteria
Faeces (mean±SD) 94.0±3.5 87.1±10.8 82.3±16.2 87.8±9.6 9.1±2.8 8.8±2.4 9.1±3.2 9.0±2.6
Range 90.9–99.6 68.2–97.8 52.5–98.1 70.7–97.1 6–15 7–15 4–14 5.3–14.7
Saliva (mean±SD) 84.7±17.9 97.9±2.0 89.2±15.7 86.4±16.0 4.5±1.9 5.8±1.5 4.0±1.7 4.4±1.4
Range 62.3–98.9 95.5–99.7 65.6–98.0 62.3–98.0 2–7 4–8 2–7 3.0–6.7
*Similarity values were calculated using BioNumerics 4.50 software. Amplicons with a total surface area of at least 1% were included in the
similarity analysis. 0, baseline (before probiotic consumption); 1, 1 week of probiotic consumption; 2, 2 weeks of probiotic consumption.
DDiversity is presented as the number of bands making up .1% of the total profile as detected by the BioNumerics 4.50 software.
dPartial 16S rRNA gene (V6–V8 hypervariable region).
§Clostridial phylogenetic cluster XIVa (Collins et al., 1994).
||Lactobacillus group was comprised the genera Lactobacillus, Leuconostoc, Pediococcus and Weissella.
Only half of the salivary samples gave a positive result after bifidobacteria-specific PCR.
J. Maukonen and others
1564 Journal of Medical Microbiology 57
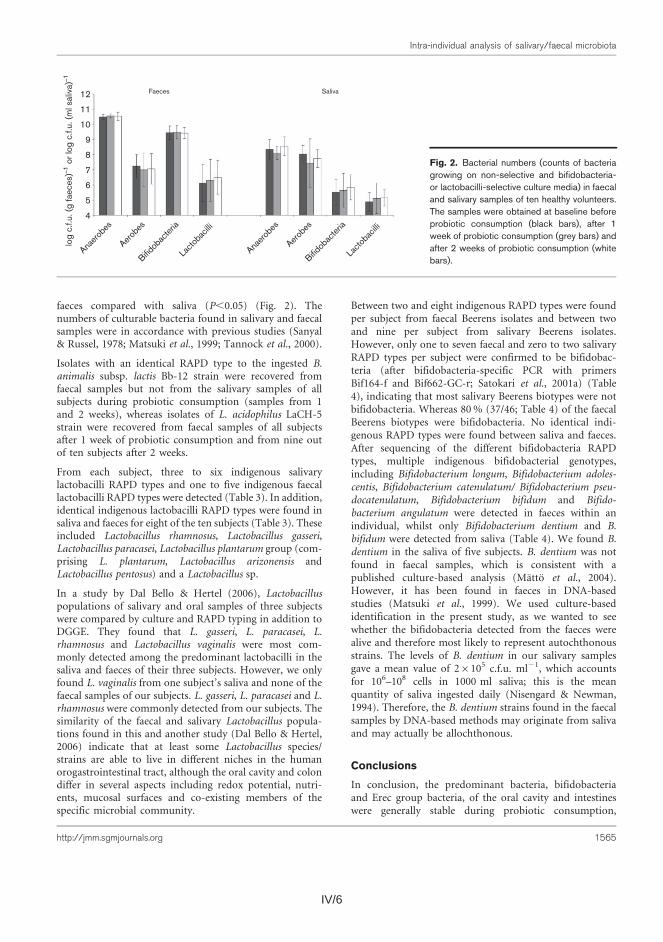
IV/6 IV/7
faeces compared with saliva (P,0.05) (Fig. 2). Thenumbers of culturable bacteria found in salivary and faecalsamples were in accordance with previous studies (Sanyal& Russel, 1978; Matsuki et al., 1999; Tannock et al., 2000).
Isolates with an identical RAPD type to the ingested B.animalis subsp. lactis Bb-12 strain were recovered fromfaecal samples but not from the salivary samples of allsubjects during probiotic consumption (samples from 1and 2 weeks), whereas isolates of L. acidophilus LaCH-5strain were recovered from faecal samples of all subjectsafter 1 week of probiotic consumption and from nine outof ten subjects after 2 weeks.
From each subject, three to six indigenous salivarylactobacilli RAPD types and one to five indigenous faecallactobacilli RAPD types were detected (Table 3). In addition,identical indigenous lactobacilli RAPD types were found insaliva and faeces for eight of the ten subjects (Table 3). Theseincluded Lactobacillus rhamnosus, Lactobacillus gasseri,Lactobacillus paracasei, Lactobacillus plantarum group (com-prising L. plantarum, Lactobacillus arizonensis andLactobacillus pentosus) and a Lactobacillus sp.
In a study by Dal Bello & Hertel (2006), Lactobacilluspopulations of salivary and oral samples of three subjectswere compared by culture and RAPD typing in addition toDGGE. They found that L. gasseri, L. paracasei, L.rhamnosus and Lactobacillus vaginalis were most com-monly detected among the predominant lactobacilli in thesaliva and faeces of their three subjects. However, we onlyfound L. vaginalis from one subject’s saliva and none of thefaecal samples of our subjects. L. gasseri, L. paracasei and L.rhamnosus were commonly detected from our subjects. Thesimilarity of the faecal and salivary Lactobacillus popula-tions found in this and another study (Dal Bello & Hertel,2006) indicate that at least some Lactobacillus species/strains are able to live in different niches in the humanorogastrointestinal tract, although the oral cavity and colondiffer in several aspects including redox potential, nutri-ents, mucosal surfaces and co-existing members of thespecific microbial community.
Between two and eight indigenous RAPD types were foundper subject from faecal Beerens isolates and between twoand nine per subject from salivary Beerens isolates.However, only one to seven faecal and zero to two salivaryRAPD types per subject were confirmed to be bifidobac-teria (after bifidobacteria-specific PCR with primersBif164-f and Bif662-GC-r; Satokari et al., 2001a) (Table4), indicating that most salivary Beerens biotypes were notbifidobacteria. Whereas 80% (37/46; Table 4) of the faecalBeerens biotypes were bifidobacteria. No identical indi-genous RAPD types were found between saliva and faeces.After sequencing of the different bifidobacteria RAPDtypes, multiple indigenous bifidobacterial genotypes,including Bifidobacterium longum, Bifidobacterium adoles-centis, Bifidobacterium catenulatum/ Bifidobacterium pseu-docatenulatum, Bifidobacterium bifidum and Bifido-bacterium angulatum were detected in faeces within anindividual, whilst only Bifidobacterium dentium and B.bifidum were detected from saliva (Table 4). We found B.dentium in the saliva of five subjects. B. dentium was notfound in faecal samples, which is consistent with apublished culture-based analysis (Matto et al., 2004).However, it has been found in faeces in DNA-basedstudies (Matsuki et al., 1999). We used culture-basedidentification in the present study, as we wanted to seewhether the bifidobacteria detected from the faeces werealive and therefore most likely to represent autochthonousstrains. The levels of B. dentium in our salivary samplesgave a mean value of 26105 c.f.u. ml21, which accountsfor 106–108 cells in 1000 ml saliva; this is the meanquantity of saliva ingested daily (Nisengard & Newman,1994). Therefore, the B. dentium strains found in the faecalsamples by DNA-based methods may originate from salivaand may actually be allochthonous.
Conclusions
In conclusion, the predominant bacteria, bifidobacteriaand Erec group bacteria, of the oral cavity and intestineswere generally stable during probiotic consumption,
12 Faeces Saliva
11
10
9
8
7
6
5
log
c.f.u
. (g
faec
es)_ 1 o
r log
c.f.
u. (m
l sal
iva)
_ 1
4
Anaer
obes
Aerob
es
Bifidob
acter
ia
Lacto
bacil
li
Anaer
obes
Aerob
es
Bifidob
acter
ia
Lacto
bacil
li
Fig. 2. Bacterial numbers (counts of bacteriagrowing on non-selective and bifidobacteria-or lactobacilli-selective culture media) in faecaland salivary samples of ten healthy volunteers.The samples were obtained at baseline beforeprobiotic consumption (black bars), after 1week of probiotic consumption (grey bars) andafter 2 weeks of probiotic consumption (whitebars).
Intra-individual analysis of salivary/faecal microbiota
http://jmm.sgmjournals.org 1565

IV/7
Table 3. Heterogeneity of indigenous Lactobacillus populations
Subject Saliva Faeces Comparison of saliva and faeces
No. of RAPD
types
Species* No. of RAPD types Species* Identical RAPD
types
Species*
1 5 L. rhamnosus, L. casei/L. paracasei,
L. brevis
5 L. brevis 0 –
2 4 L. rhamnosus, L. gasseri, L. paracasei 4 L. rhamnosus, L. gasseri, L. sakei, L. parabuchneri 2 L. rhamnosus, L. gasseri
3 4 L. rhamnosus, L. gasseri, L. brevis,
L. plantarum groupD
1 L. gasseri 1 L. gasseri
4 6 L. rhamnosus, L. paracasei, L.
parabuchneri, L. plantarum groupD
2 L. rhamnosus, L. parabuchneri/L. ferintoshensis 1 L. rhamnosus
5 5 L. rhamnosus, L. paracasei,
L. jensenii
3 L. rhamnosus, L. paracasei 1 L. paracasei
6 5 L. gasseri, L. paracasei,
L. parabuchneri, L. fermentum
4 L. gasseri, L. paracasei, L. rhamnosus 1 L. gasseri
7 5 L. rhamnosus, L. paracasei,
L. vaginalis, L. plantarum groupD
4 L. rhamnosus, L. crispatus, L. plantarum groupD 2 L. rhamnosus, L. plan-
tarum groupD
8 6 L. gasseri, L. paracasei, L. salivarius,
L. fermentum, L. kitasonis/L. cris-
patus
1 L. gasseri 0 –
9 3 L. rhamnosus, L. brevis, Lactobacillus
sp.
4 L. paracasei, L. plantarum groupD, Lactobacillus sp. 1 Lactobacillus sp.
10 3 L. rhamnosus, L. gasseri, L. casei/L.
paracasei
4 L. rhamnosus, L. gasseri, L. barabucneri 1 L. gasseri
*Determined by 16S rRNA gene sequencing.
DL. plantarum group: L. plantarum, L. arizonensis and L. pentosus.
J.Maukonen
andothers
1566
Journal
ofMed
icalMicro
biology
57
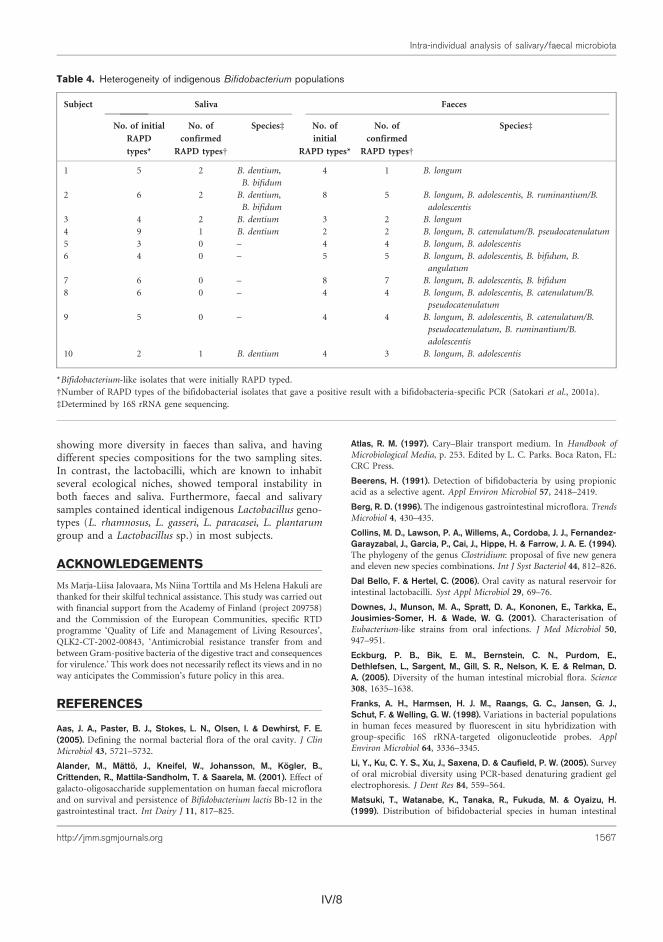
IV/8 IV/9
microflora examined with 16S rRNA-gene-targeted species-specificprimers. Appl Environ Microbiol 65, 4506–4512.
Matsuki, T., Watanabe, K., Fujimoto, J., Miyamoto, Y., Takada, T.,Matsumoto, K., Oyaizu, H. & Tanaka, R. (2002). Development of 16SrRNA-gene-targeted group-specific primers for the detection andidentification of predominant bacteria in human feces. Appl EnvironMicrobiol 68, 5445–5451.
Matto, J., Malinen, E., Suihko, M.-L., Alander, M., Palva, A. & Saarela, M.(2004). Genetic heterogeneity and functional properties of intestinalbifidobacteria. J Appl Microbiol 97, 459–470.
Matto, J., Maunuksela, L., Kajander, K., Palva, A., Korpela, R.,Kassinen, A. & Saarela, M. (2005). Composition and temporalstability of gastrointestinal microbiota in irritable bowel syndrome – alongitudinal study in IBS and control subjects. FEMS Immunol MedMicrobiol 43, 213–222.
Maukonen, J., Satokari, R., Matto, J., Soderlund, H., Mattila-Sandholm, T. & Saarela, M. (2006a). Prevalence and temporalstability of selected clostridial groups in irritable bowel syndrome inrelation to predominant fecal bacteria. J Med Microbiol 55, 625–633.
Maukonen, J., Matto, J., Satokari, R., Soderlund, H., Mattila-Sandholm, T. & Saarela, M. (2006b). PCR-DGGE and RT-PCR-DGGE show diversity and short-term temporal stability inClostridium coccoides–Eubacterium rectale group in human intestinalmicrobiota. FEMS Microbiol Ecol 58, 517–528.
Nisengard, R. J. & Newman, M. G. (1994). Oral Microbiology andImmunology, Philadelphia, PA: W.B. Saunders.
Nubel, U., Engelen, B., Felske, A., Snaidr, J., Wieshuber, A., Amann,R. I., Ludwig, W. & Backhaus, H. (1996). Sequence heterogeneities ofgenes encoding 16S rRNAs in Paenibacillus polymyxa detected bytemperature gradient gel electrophoresis. J Bacteriol 178, 5636–5643.
Paster, B. J., Boches, S. K., Galvin, J. L., Ericson, R. E., Lau, C. N.,Levanos, V. A., Sahasrabudhe, A. & Dewhirst, F. E. (2001). Bacterialdiversity in human subgingival plaque. J Bacteriol 183, 3770–3783.
Rams, T. E., Feik, D. & Slots, J. (1990). Staphylococci in humanperiodontal diseases. Oral Microbiol Immunol 5, 29–32.
Rasiah, I. A., Wong, L., Anderson, S. A. & Sissons, C. H. (2005).Variation in bacterial DGGE patterns from human saliva: over time,between individuals and in corresponding dental plaque microcosm.Arch Oral Biol 50, 779–787.
Sanyal, B. & Russel, C. (1978). Nonsporing, Gram-positive rods insaliva and the gingival crevice of humans. Appl Environ Microbiol 35,670–678.
Satokari, R. M., Vaughan, E. E., Akkermans, A. D., Saarela, M. & deVos, W. M. (2001a). Bifidobacterial diversity in human feces detected
by genus-specific polymerase chain reaction and denaturing gradient
gel electrophoresis. Appl Environ Microbiol 67, 504–513.
Satokari, R. M., Vaughan, E. E., Akkermans, A. D. L., Saarela, M. & deVos, W. M. (2001b). Polymerase chain reaction and denaturing
gradient gel electrophoresis monitoring of fecal Bifidobacterium
populations in a prebiotic and probiotic feeding trial. Syst Appl
Microbiol 24, 227–231.
Sghir, A., Gramet, G., Suau, A., Rochet, V., Pochart, P. & Dore, J.(2000).Quantification of bacterial groups within human fecal flora by
oligonucleotide probe hybridization. Appl Environ Microbiol 66,2263–2266.
Suau, A., Bonnet, R., Sutren, M., Godon, J. J., Gibson, G., Collins,M. D. & Dore, J. (1999). Direct analysis of genes encoding 16S rRNA
from complex communities reveals many novel molecular species
within the human gut. Appl Environ Microbiol 65, 4799–4807.
Tannock, G. W., Munro, K., Harmsen, H. J. M., Welling, G. W., Smart, J.& Gopal, P. K. (2000). Analysis of the fecal microflora of human
subjects consuming a probiotic product containing Lactobacillus
rhamnosus DR20. Appl Environ Microbiol 66, 2578–2588.
Thiel, R. & Blaut, M. (2005). An improved method for the automated
enumeration of fluorescently labelled bacteria in human faeces.
J Microbiol Methods 61, 369–379.
Vanhoutte, T., Huys, G., de Brandt, E. & Swings, J. (2004). Temporal
stability analysis of the microbiota in human feces by denaturing
gradient gel electrophoresis using universal and group-specific 16S
rRNA gene primers. FEMS Microbiol Ecol 48, 437–446.
Walter, J., Hertel, C., Tannock, G. W., Lis, C. M., Munro, K. & Hammes, W.(2001).Detection of Lactobacillus, Pediococcus, Leuconostoc, andWeissella
species in human feces by using group-specific PCR primers and
denaturating gradient gel electrophoresis. Appl Environ Microbiol 67,2578–2585.
Wilmotte, A., van der Auwera, G. & de Wachter, R. (1993). Structureof the 16S ribosomal RNA of the thermophilic cyanobacterium
Chlorogloeopsis HTF (‘Mastigocladus laminosus HTF’) strain
PCC7518, and phylogenetic analysis. FEBS Lett 317, 96–100.
Zoetendal, E. G., Akkermans, A. D. & de Vos, W. M. (1998).Temperature gradient gel electrophoresis analysis of 16S rRNA from
human fecal samples reveals stable and host-specific communities of
active bacteria. Appl Environ Microbiol 64, 3854–3859.
J. Maukonen and others
1568 Journal of Medical Microbiology 57
showing more diversity in faeces than saliva, and havingdifferent species compositions for the two sampling sites.In contrast, the lactobacilli, which are known to inhabitseveral ecological niches, showed temporal instability inboth faeces and saliva. Furthermore, faecal and salivarysamples contained identical indigenous Lactobacillus geno-types (L. rhamnosus, L. gasseri, L. paracasei, L. plantarumgroup and a Lactobacillus sp.) in most subjects.
ACKNOWLEDGEMENTS
Ms Marja-Liisa Jalovaara, Ms Niina Torttila and Ms Helena Hakuli are
thanked for their skilful technical assistance. This study was carried out
with financial support from the Academy of Finland (project 209758)
and the Commission of the European Communities, specific RTD
programme ‘Quality of Life and Management of Living Resources’,
QLK2-CT-2002-00843, ‘Antimicrobial resistance transfer from and
between Gram-positive bacteria of the digestive tract and consequences
for virulence.’ This work does not necessarily reflect its views and in no
way anticipates the Commission’s future policy in this area.
REFERENCES
Aas, J. A., Paster, B. J., Stokes, L. N., Olsen, I. & Dewhirst, F. E.(2005). Defining the normal bacterial flora of the oral cavity. J Clin
Microbiol 43, 5721–5732.
Alander, M., Matto, J., Kneifel, W., Johansson, M., Kogler, B.,Crittenden, R., Mattila-Sandholm, T. & Saarela, M. (2001). Effect ofgalacto-oligosaccharide supplementation on human faecal microflora
and on survival and persistence of Bifidobacterium lactis Bb-12 in the
gastrointestinal tract. Int Dairy J 11, 817–825.
Atlas, R. M. (1997). Cary–Blair transport medium. In Handbook ofMicrobiological Media, p. 253. Edited by L. C. Parks. Boca Raton, FL:CRC Press.
Beerens, H. (1991). Detection of bifidobacteria by using propionicacid as a selective agent. Appl Environ Microbiol 57, 2418–2419.
Berg, R. D. (1996). The indigenous gastrointestinal microflora. TrendsMicrobiol 4, 430–435.
Collins, M. D., Lawson, P. A., Willems, A., Cordoba, J. J., Fernandez-Garayzabal, J., Garcia, P., Cai, J., Hippe, H. & Farrow, J. A. E. (1994).The phylogeny of the genus Clostridium: proposal of five new generaand eleven new species combinations. Int J Syst Bacteriol 44, 812–826.
Dal Bello, F. & Hertel, C. (2006). Oral cavity as natural reservoir forintestinal lactobacilli. Syst Appl Microbiol 29, 69–76.
Downes, J., Munson, M. A., Spratt, D. A., Kononen, E., Tarkka, E.,Jousimies-Somer, H. & Wade, W. G. (2001). Characterisation ofEubacterium-like strains from oral infections. J Med Microbiol 50,947–951.
Eckburg, P. B., Bik, E. M., Bernstein, C. N., Purdom, E.,Dethlefsen, L., Sargent, M., Gill, S. R., Nelson, K. E. & Relman, D.A. (2005). Diversity of the human intestinal microbial flora. Science308, 1635–1638.
Franks, A. H., Harmsen, H. J. M., Raangs, G. C., Jansen, G. J.,Schut, F. & Welling, G. W. (1998). Variations in bacterial populationsin human feces measured by fluorescent in situ hybridization withgroup-specific 16S rRNA-targeted oligonucleotide probes. ApplEnviron Microbiol 64, 3336–3345.
Li, Y., Ku, C. Y. S., Xu, J., Saxena, D. & Caufield, P. W. (2005). Surveyof oral microbial diversity using PCR-based denaturing gradient gelelectrophoresis. J Dent Res 84, 559–564.
Matsuki, T., Watanabe, K., Tanaka, R., Fukuda, M. & Oyaizu, H.(1999). Distribution of bifidobacterial species in human intestinal
Table 4. Heterogeneity of indigenous Bifidobacterium populations
Subject Saliva Faeces
No. of initial
RAPD
types*
No. of
confirmed
RAPD typesD
Speciesd No. of
initial
RAPD types*
No. of
confirmed
RAPD typesD
Speciesd
1 5 2 B. dentium,
B. bifidum
4 1 B. longum
2 6 2 B. dentium,
B. bifidum
8 5 B. longum, B. adolescentis, B. ruminantium/B.
adolescentis
3 4 2 B. dentium 3 2 B. longum
4 9 1 B. dentium 2 2 B. longum, B. catenulatum/B. pseudocatenulatum
5 3 0 – 4 4 B. longum, B. adolescentis
6 4 0 – 5 5 B. longum, B. adolescentis, B. bifidum, B.
angulatum
7 6 0 – 8 7 B. longum, B. adolescentis, B. bifidum
8 6 0 – 4 4 B. longum, B. adolescentis, B. catenulatum/B.
pseudocatenulatum
9 5 0 – 4 4 B. longum, B. adolescentis, B. catenulatum/B.
pseudocatenulatum, B. ruminantium/B.
adolescentis
10 2 1 B. dentium 4 3 B. longum, B. adolescentis
*Bifidobacterium-like isolates that were initially RAPD typed.
DNumber of RAPD types of the bifidobacterial isolates that gave a positive result with a bifidobacteria-specific PCR (Satokari et al., 2001a).
dDetermined by 16S rRNA gene sequencing.
Intra-individual analysis of salivary/faecal microbiota
http://jmm.sgmjournals.org 1567
IV/9
microflora examined with 16S rRNA-gene-targeted species-specificprimers. Appl Environ Microbiol 65, 4506–4512.
Matsuki, T., Watanabe, K., Fujimoto, J., Miyamoto, Y., Takada, T.,Matsumoto, K., Oyaizu, H. & Tanaka, R. (2002). Development of 16SrRNA-gene-targeted group-specific primers for the detection andidentification of predominant bacteria in human feces. Appl EnvironMicrobiol 68, 5445–5451.
Matto, J., Malinen, E., Suihko, M.-L., Alander, M., Palva, A. & Saarela, M.(2004). Genetic heterogeneity and functional properties of intestinalbifidobacteria. J Appl Microbiol 97, 459–470.
Matto, J., Maunuksela, L., Kajander, K., Palva, A., Korpela, R.,Kassinen, A. & Saarela, M. (2005). Composition and temporalstability of gastrointestinal microbiota in irritable bowel syndrome – alongitudinal study in IBS and control subjects. FEMS Immunol MedMicrobiol 43, 213–222.
Maukonen, J., Satokari, R., Matto, J., Soderlund, H., Mattila-Sandholm, T. & Saarela, M. (2006a). Prevalence and temporalstability of selected clostridial groups in irritable bowel syndrome inrelation to predominant fecal bacteria. J Med Microbiol 55, 625–633.
Maukonen, J., Matto, J., Satokari, R., Soderlund, H., Mattila-Sandholm, T. & Saarela, M. (2006b). PCR-DGGE and RT-PCR-DGGE show diversity and short-term temporal stability inClostridium coccoides–Eubacterium rectale group in human intestinalmicrobiota. FEMS Microbiol Ecol 58, 517–528.
Nisengard, R. J. & Newman, M. G. (1994). Oral Microbiology andImmunology, Philadelphia, PA: W.B. Saunders.
Nubel, U., Engelen, B., Felske, A., Snaidr, J., Wieshuber, A., Amann,R. I., Ludwig, W. & Backhaus, H. (1996). Sequence heterogeneities ofgenes encoding 16S rRNAs in Paenibacillus polymyxa detected bytemperature gradient gel electrophoresis. J Bacteriol 178, 5636–5643.
Paster, B. J., Boches, S. K., Galvin, J. L., Ericson, R. E., Lau, C. N.,Levanos, V. A., Sahasrabudhe, A. & Dewhirst, F. E. (2001). Bacterialdiversity in human subgingival plaque. J Bacteriol 183, 3770–3783.
Rams, T. E., Feik, D. & Slots, J. (1990). Staphylococci in humanperiodontal diseases. Oral Microbiol Immunol 5, 29–32.
Rasiah, I. A., Wong, L., Anderson, S. A. & Sissons, C. H. (2005).Variation in bacterial DGGE patterns from human saliva: over time,between individuals and in corresponding dental plaque microcosm.Arch Oral Biol 50, 779–787.
Sanyal, B. & Russel, C. (1978). Nonsporing, Gram-positive rods insaliva and the gingival crevice of humans. Appl Environ Microbiol 35,670–678.
Satokari, R. M., Vaughan, E. E., Akkermans, A. D., Saarela, M. & deVos, W. M. (2001a). Bifidobacterial diversity in human feces detected
by genus-specific polymerase chain reaction and denaturing gradient
gel electrophoresis. Appl Environ Microbiol 67, 504–513.
Satokari, R. M., Vaughan, E. E., Akkermans, A. D. L., Saarela, M. & deVos, W. M. (2001b). Polymerase chain reaction and denaturing
gradient gel electrophoresis monitoring of fecal Bifidobacterium
populations in a prebiotic and probiotic feeding trial. Syst Appl
Microbiol 24, 227–231.
Sghir, A., Gramet, G., Suau, A., Rochet, V., Pochart, P. & Dore, J.(2000).Quantification of bacterial groups within human fecal flora by
oligonucleotide probe hybridization. Appl Environ Microbiol 66,2263–2266.
Suau, A., Bonnet, R., Sutren, M., Godon, J. J., Gibson, G., Collins,M. D. & Dore, J. (1999). Direct analysis of genes encoding 16S rRNA
from complex communities reveals many novel molecular species
within the human gut. Appl Environ Microbiol 65, 4799–4807.
Tannock, G. W., Munro, K., Harmsen, H. J. M., Welling, G. W., Smart, J.& Gopal, P. K. (2000). Analysis of the fecal microflora of human
subjects consuming a probiotic product containing Lactobacillus
rhamnosus DR20. Appl Environ Microbiol 66, 2578–2588.
Thiel, R. & Blaut, M. (2005). An improved method for the automated
enumeration of fluorescently labelled bacteria in human faeces.
J Microbiol Methods 61, 369–379.
Vanhoutte, T., Huys, G., de Brandt, E. & Swings, J. (2004). Temporal
stability analysis of the microbiota in human feces by denaturing
gradient gel electrophoresis using universal and group-specific 16S
rRNA gene primers. FEMS Microbiol Ecol 48, 437–446.
Walter, J., Hertel, C., Tannock, G. W., Lis, C. M., Munro, K. & Hammes, W.(2001).Detection of Lactobacillus, Pediococcus, Leuconostoc, andWeissella
species in human feces by using group-specific PCR primers and
denaturating gradient gel electrophoresis. Appl Environ Microbiol 67,2578–2585.
Wilmotte, A., van der Auwera, G. & de Wachter, R. (1993). Structureof the 16S ribosomal RNA of the thermophilic cyanobacterium
Chlorogloeopsis HTF (‘Mastigocladus laminosus HTF’) strain
PCC7518, and phylogenetic analysis. FEBS Lett 317, 96–100.
Zoetendal, E. G., Akkermans, A. D. & de Vos, W. M. (1998).Temperature gradient gel electrophoresis analysis of 16S rRNA from
human fecal samples reveals stable and host-specific communities of
active bacteria. Appl Environ Microbiol 64, 3854–3859.
J. Maukonen and others
1568 Journal of Medical Microbiology 57

ARTICLE V
The currently used commercial DNA-extraction methods give different results of clostridial
and actinobacterial populations derived from human fecal
samples
In: FEMS Microbiology Ecology 2012, 79, pp. 697–708.
Copyright 2011 Federation of European Microbiological Societies.
Reprinted with permission from the publisher.

V/1
V/1
R E S EA RCH AR T I C L E
The currently used commercial DNA-extraction methods givedifferent results of clostridial and actinobacterial populations
derived from human fecal samples
Johanna Maukonen, Catarina Simoes & Maria Saarela
VTT, Biotechnology, Espoo, Finland
Correspondence: Johanna Maukonen, VTT
Technical Research Centre of Finland, PO Box
1000 (Tietotie 2), FI-02044 VTT,
Espoo, Finland. Tel.: +358 20 722
7183; fax: +358 20 722 7071;
e-mail: [email protected]
Received 11 August 2011; revised 28
October 2011; accepted 2 November 2011.
Final version published online 13 December
2011.
DOI: 10.1111/j.1574-6941.2011.01257.x
Editor: Julian Marchesi
Keywords
gut microbiota; clostridia; Actinobacteria;
DNA-extraction; storage.
Abstract
Recently several human health-related microbiota studies have had partly
contradictory results. As some differences may be explained by methodolo-
gies applied, we evaluated how different storage conditions and commonly
used DNA-extraction kits affect bacterial composition, diversity, and numbers
of human fecal microbiota. According to our results, the DNA-extraction
did not affect the diversity, composition, or quantity of Bacteroides spp.,
whereas after a week’s storage at �20 °C, the numbers of Bacteroides spp.
were 1.6–2.5 log units lower (P < 0.05). Furthermore, the numbers of pre-
dominant bacteria, Eubacterium rectale (Erec)-group, Clostridium leptum
group, bifidobacteria, and Atopobium group were 0.5–4 log units higher
(P < 0.05) after mechanical DNA-extraction as detected with qPCR, regard-
less of storage. Furthermore, the bacterial composition of Erec-group differed
significantly after different DNA-extractions; after enzymatic DNA-extraction,
the most prevalent genera detected were Roseburia (39% of clones) and
Coprococcus (10%), whereas after mechanical DNA-extraction, the most pre-
valent genera were Blautia (30%), Coprococcus (13%), and Dorea (10%).
According to our results, rigorous mechanical lysis enables detection of
higher bacterial numbers and diversity from human fecal samples. As it was
shown that the results of clostridial and actinobacterial populations are
highly dependent on the DNA-extraction methods applied, the use of differ-
ent DNA-extraction protocols may explain the contradictory results previ-
ously obtained.
Introduction
In the past 10 years, there has been a wealth of studies
in which the relationship between the human gut micro-
biota and human health has been investigated. After the
findings of Turnbaugh et al. (2006) and Ley et al.
(2006) that the relative proportion of Bacteroidetes
decreased and the relative proportion of Firmicutes
increased in obese mice (Ley et al., 2005; Turnbaugh
et al., 2006) and men (Ley et al., 2006) as compared to
their lean counterparts, obesity-related gut microbiota
studies have drawn a lot of attention. After the initial
findings, there have been several related studies in
which the findings have been similar (Armougom et al.,
2009; Santacruz et al., 2009; Turnbaugh et al., 2009;
Balamurugan et al., 2010; Santacruz et al., 2010) to
those of Ley et al. (2005, 2006) and Turnbaugh et al.
(2006). Moreover, there have also been studies in which
the findings have been contradictory or there has not
been any statistically significant differences between Fir-
micutes and Bacteroidetes in obese and normal weight
people (Duncan & Flint, 2008; Duncan et al., 2008;
Zhang et al., 2009; Santacruz et al., 2010; Schwiertz
et al., 2010). Some differences may be explained by the
different detection methods applied [i.e. clone libraries
(Ley et al., 2005, 2006; Turnbaugh et al., 2009; Zhang
et al., 2009) vs. quantitative PCR (Armougom et al.,
2009; Santacruz et al., 2009; Zhang et al., 2009; Bala-
murugan et al., 2010; Santacruz et al., 2010; Schwiertz
et al., 2010) vs. FISH (Duncan et al., 2008)] and
FEMS Microbiol Ecol 79 (2012) 697–708 ª 2011 Federation of European Microbiological SocietiesPublished by Blackwell Publishing Ltd. All rights reserved
MIC
ROBI
OLO
GY
EC
OLO
GY

V/2 V/3
DNA-extraction
For DNA-extraction experiments six different protocols
(FastPrep lysis) (1) 60 s 4.5 m s�1; (2) 60 s 6.5 m s�1;
(3) 60 s + 30 s 6.5 m s�1; (4) 60 s + 60 s 6.5 m s�1; (5)
60 s + 60 s + 30 s 6.5 m s�1; (6) 60 s + 60 s + 60 s
6.5 m s�1) with FastDNA Spin kit for Soil (MP Biomedi-
cals, Solon, OH; from hereon referred to as ‘mechanical
DNA-extraction’) and two different protocols (1) Gram-
negative bacteria and (2) Gram-positive bacteria with
QIAamp DNA Stool Mini kit (Qiagen, from hereon
referred to as ‘enzymatic DNA-extraction’) were evaluated
from different storage conditions (Fig. 1). All the DNA-
extraction experiments were performed in duplicate.
DNA was extracted as previously described (Maukonen
et al., 2006b) from the 0.2 g of samples that were used
for studying of the diversity and stability of the Clept-
group and Bacteroides spp.
PCR of C. leptum group (Clept-group)
Six different primer combinations, four MgCl2-concentra-
tions, 11 different annealing temperatures, and three dif-
ferent cycle numbers were tested in preliminary PCR-
DGGE experiments. Partial 16S rRNA gene of Clept-
group was PCR-amplified for DGGE using primer pairs
Clept-933 f and Clept-1240-r+GC (Table S2) in addition
to Clept-933 f+GC and Clept-1240-r. Optimized PCR
amplifications were performed in a total volume of 30 lL
containing 1 lL of appropriately diluted template DNA,
0.4 lM of both primers, 0.2 mM dNTP, 1.25 units of
Taq polymerase (Invitrogen, Carlsbad, CA) in a reaction
buffer with 20 mM Tris–HCl (pH 8.4), 50 mM KCl, and
2.5 mM MgCl2. The PCR program consisted of initial
denaturing at 94 °C for 5 min, followed by 30 cycles of
denaturing at 94 °C for 45 s, primer annealing at 60 °Cfor 30 s and elongation at 72 °C for 60 s, and a final
extension for 30 min at 72 °C.
PCR of Bacteroides spp.
Ten different primer combinations, six MgCl2-concentra-
tions, 12 different annealing temperatures, and two differ-
ent cycle numbers were tested in preliminary PCR-DGGE
experiments. Partial 16S rRNA gene of Bacteroides spp.
was PCR-amplified for DGGE using primer pairs
Bact596f and Bacto1080r+GC in addition to Bact596f+GCand Bacto1080r (Table S2). Optimized PCR amplifica-
tions were performed in a total volume of 30 lL contain-
ing 1 lL of appropriately diluted template DNA, 0.4 lMof both primers, 0.2 mM dNTP, 1.25 units of Taq poly-
merase (Invitrogen) in a reaction buffer with 20 mM Tris
–HCl (pH 8.4), 50 mM KCl, and 1.5 mM MgCl2. The
PCR program consisted of initial denaturing at 94 °C for
5 min, followed by 30 cycles of denaturing at 94 °C for
45 s, primer annealing at 58 °C for 30 s and elongation
at 72 °C for 60 s, and a final extension for 30 min at
72 °C.
Fig. 1. The study plan. Univ, predominant bacteria; Erec, Eubacterium rectale – Blautia coccoides group; Clept, Clostridium leptum group; Bfra,
Bacteroides spp. ; Lab, Lactobacillus group (comprises of genera Lactobacillus, Leuconostoc, Pediococcus, and Weissella); Ato, Atopobium group
(comprises e.g. of genera Atopobium, Eggerthella, and Collinsella).
FEMS Microbiol Ecol 79 (2012) 697–708 ª 2011 Federation of European Microbiological SocietiesPublished by Blackwell Publishing Ltd. All rights reserved
DNA-extraction affects human fecal microbiota results 699
different targets (Phylum Bacteroidetes vs. genus Bactero-
ides and Phylum Firmicutes vs. Families Ruminococcaceae
and Lachnospiraceae + Incertae Sedis XIV (Clostridial
clusters IV and XIV, respectively (Collins et al., 1994) in
addition to lactobacilli) and by different study popula-
tions, because for example in Europe differences in mic-
robiota can be seen in people living in different areas
(Mueller et al., 2006).
As Bacteroidetes as Gram-negative and Firmicutes as
Gram-positive bacteria have different cell wall structures
and compositions, the optimal DNA-extraction method
for the two groups is different. Gram-negative bacteria
are more easily lyzed and if too rigorous DNA-extraction
method is used, it may result in detecting lower numbers
and diversity of Bacteroidetes species. With Firmicutes,
instead, more rigorous DNA-extraction methods are
needed, especially when the matrix is as complex as a
human fecal sample. The most commonly used commer-
cial fecal DNA-extraction kit (QIAamp DNA Stool Mini
kit; Qiagen, Hilden, Germany, based on heat lysis and
enzymatic digestion), which is nowadays considered as
the ‘golden standard’ (Dridi et al., 2009), has been origi-
nally validated using universal-denaturing gradient gel
electrophoresis (DGGEs; Li et al., 2003), and/or spiking
experiments (McOrist et al., 2002). However, more recent
studies have been shown that mechanical cell disruption
results in the detection of the highest bacterial diversity.
Furthermore, as compared to enzymatic DNA-extraction,
significantly improved DNA-extraction efficiency of Clos-
tridium leptum group (Salonen et al., 2010) [clostridial
cluster IV (Collins et al., 1994)] and methanogens (Dridi
et al., 2009) is obtained.
The effect of various storage temperatures on the fecal
microbiota quantity and composition has also been stud-
ied. However, the results are partly contradictory. In a
few recent studies, it was shown that storage for a short
period of time at different temperatures does not signifi-
cantly influence the bacterial community structure as
detected with pyrosequencing (Roesch et al., 2009; Lauber
et al., 2010). In contrast, in several older studies, the stor-
age temperature has been shown to influence the results
derived from gut microbiota as detected with terminal-
restriction fragment length polymorphism, single-stranded
conformation polymorphism analysis, and real-time PCR
(Ott et al., 2004; Molbak et al., 2006; Roesch et al.,
2009).
The aim of this study was to evaluate whether different
storage conditions and the DNA-extraction methods
affect the detection of Firmicutes [Eubacterium rectale –Blautia coccoides group (Lachnospiraceae), C. leptum
group (Ruminococcaceae), and lactobacilli], Bacteroides,
bifidobacteria, and Atopobium group in human fecal sam-
ples. Furthermore, two new PCR-DGGE methods – for
Bacteroides spp. and C. leptum –group – were optimized
and validated in this study.
Materials and methods
Bacterial strains
The 83 bacterial reference strains used for the optimization
and validation of PCR and PCR-DGGE for Bacteroides
spp. and C. leptum group and quantitative PCR (qPCR) of
predominant bacteria, Bacteroides spp., C. leptum group,
and E. rectale – B. coccoides group, bifidobacteria and
Atopobium group are listed in Supporting Information,
Table S1. After optimization, negative and positive controls
were included in the experiments with samples as well.
Human fecal samples
The fecal samples for sample storage and DNA-extraction
analyses were obtained fresh from a healthy female sub-
ject (subject 1) (44 years old) and a healthy male subject
(subject 2) (51 years old). The main recruiting criterion
was a good (normal) intestinal balance (absence of
repeating and/or persisting gastrointestinal symptoms).
The exclusion criteria were regular GI-tract symptoms,
lactose-intolerance, celiac disease, and antimicrobial ther-
apy during the last 2 months prior to the sampling point.
The subjects defecated into a plastic container, which was
made anaerobic with gas-generators (Anaerocult A mini,
Merck, Darmstadt, Germany) placed on the lid of the
container. The samples were transported to the labora-
tory, homogenized, and divided into subsamples in an
anaerobic workstation (Don Whitley Scientific Ltd, Ship-
ley, UK) within 0–4 h from the defecation. Part of the
sample was further processed fresh, second subsample
was stored at 4 °C for 2 days after which it was trans-
ferred to �70 °C, third subsample was stored at �20 °Cfor a week and thereafter at �70 °C, and fourth subsam-
ple was transferred directly to �70 °C for storage. The
study plan is presented in Fig. 1.
The fecal samples for optimization and validation of
Bacteroides spp. and C. leptum (Clept) group protocols
were obtained from two healthy females (34 and 39 years
old). The larger study group for diversity and stability
studies of Bacteroides spp. and Clept-group consisted of
10 subjects that were 34–62 years of age (three males and
seven females). Fecal samples were obtained on three
occasions 3 months apart (0, 3, and 6 months). The main
recruiting and exclusion criteria were as above. The sam-
ples were collected as earlier and maintained at �70 °Cuntil analyzed. Human studies were approved by the
ethical committee of VTT Technical Research Centre of
Finland, Espoo, Finland.
ª 2011 Federation of European Microbiological Societies FEMS Microbiol Ecol 79 (2012) 697–708Published by Blackwell Publishing Ltd. All rights reserved
698 J. Maukonen et al.
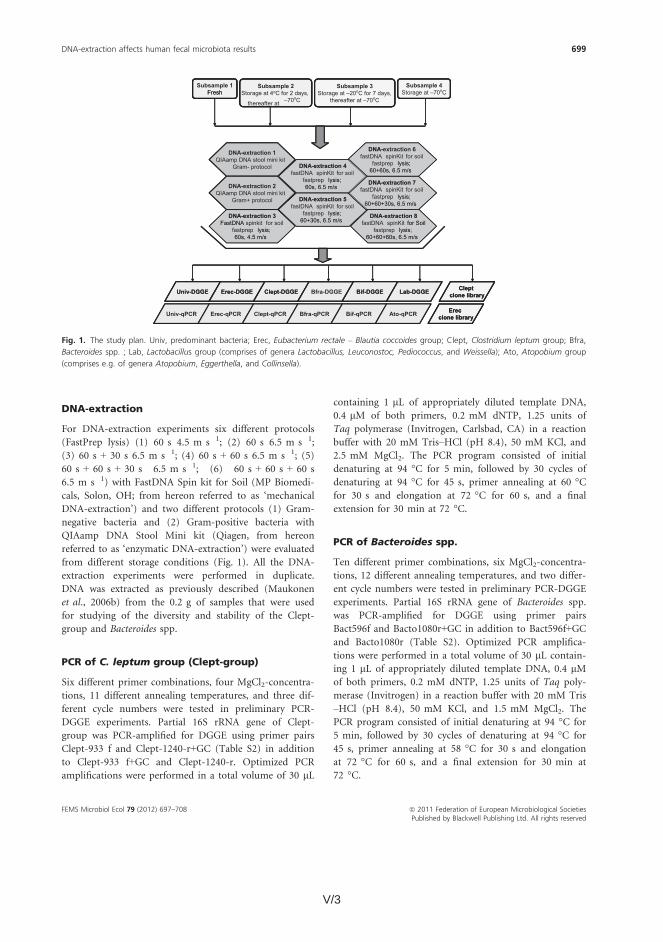
V/3
DNA-extraction
For DNA-extraction experiments six different protocols
(FastPrep lysis) (1) 60 s 4.5 m s�1; (2) 60 s 6.5 m s�1;
(3) 60 s + 30 s 6.5 m s�1; (4) 60 s + 60 s 6.5 m s�1; (5)
60 s + 60 s + 30 s 6.5 m s�1; (6) 60 s + 60 s + 60 s
6.5 m s�1) with FastDNA Spin kit for Soil (MP Biomedi-
cals, Solon, OH; from hereon referred to as ‘mechanical
DNA-extraction’) and two different protocols (1) Gram-
negative bacteria and (2) Gram-positive bacteria with
QIAamp DNA Stool Mini kit (Qiagen, from hereon
referred to as ‘enzymatic DNA-extraction’) were evaluated
from different storage conditions (Fig. 1). All the DNA-
extraction experiments were performed in duplicate.
DNA was extracted as previously described (Maukonen
et al., 2006b) from the 0.2 g of samples that were used
for studying of the diversity and stability of the Clept-
group and Bacteroides spp.
PCR of C. leptum group (Clept-group)
Six different primer combinations, four MgCl2-concentra-
tions, 11 different annealing temperatures, and three dif-
ferent cycle numbers were tested in preliminary PCR-
DGGE experiments. Partial 16S rRNA gene of Clept-
group was PCR-amplified for DGGE using primer pairs
Clept-933 f and Clept-1240-r+GC (Table S2) in addition
to Clept-933 f+GC and Clept-1240-r. Optimized PCR
amplifications were performed in a total volume of 30 lL
containing 1 lL of appropriately diluted template DNA,
0.4 lM of both primers, 0.2 mM dNTP, 1.25 units of
Taq polymerase (Invitrogen, Carlsbad, CA) in a reaction
buffer with 20 mM Tris–HCl (pH 8.4), 50 mM KCl, and
2.5 mM MgCl2. The PCR program consisted of initial
denaturing at 94 °C for 5 min, followed by 30 cycles of
denaturing at 94 °C for 45 s, primer annealing at 60 °Cfor 30 s and elongation at 72 °C for 60 s, and a final
extension for 30 min at 72 °C.
PCR of Bacteroides spp.
Ten different primer combinations, six MgCl2-concentra-
tions, 12 different annealing temperatures, and two differ-
ent cycle numbers were tested in preliminary PCR-DGGE
experiments. Partial 16S rRNA gene of Bacteroides spp.
was PCR-amplified for DGGE using primer pairs
Bact596f and Bacto1080r+GC in addition to Bact596f+GCand Bacto1080r (Table S2). Optimized PCR amplifica-
tions were performed in a total volume of 30 lL contain-
ing 1 lL of appropriately diluted template DNA, 0.4 lMof both primers, 0.2 mM dNTP, 1.25 units of Taq poly-
merase (Invitrogen) in a reaction buffer with 20 mM Tris
–HCl (pH 8.4), 50 mM KCl, and 1.5 mM MgCl2. The
PCR program consisted of initial denaturing at 94 °C for
5 min, followed by 30 cycles of denaturing at 94 °C for
45 s, primer annealing at 58 °C for 30 s and elongation
at 72 °C for 60 s, and a final extension for 30 min at
72 °C.
Fig. 1. The study plan. Univ, predominant bacteria; Erec, Eubacterium rectale – Blautia coccoides group; Clept, Clostridium leptum group; Bfra,
Bacteroides spp. ; Lab, Lactobacillus group (comprises of genera Lactobacillus, Leuconostoc, Pediococcus, and Weissella); Ato, Atopobium group
(comprises e.g. of genera Atopobium, Eggerthella, and Collinsella).
FEMS Microbiol Ecol 79 (2012) 697–708 ª 2011 Federation of European Microbiological SocietiesPublished by Blackwell Publishing Ltd. All rights reserved
DNA-extraction affects human fecal microbiota results 699

V/4 V/5
denaturing at 95 °C for 10 s, primer annealing at 60 °Cfor 15 s and elongation at 72 °C for 20 s; Erec-group: 45
cycles of denaturing at 95 °C for 15 s, primer annealing
at 64 °C for 20 s and elongation at 72 °C for 25 s; Bacte-
roides spp.: 45 cycles of denaturing at 95 °C for 15 s, pri-
mer annealing at 58 °C for 20 s and elongation at 72 °Cfor 25 s; bifidobacteria: 45 cycles of denaturing at 95 °Cfor 10 s, primer annealing at 60 °C for 15 s and elonga-
tion at 72 °C for 20 s; and Atopobium group: 45 cycles of
denaturing at 95 °C for 10 s, primer annealing at 64 °Cfor 15 s and elongation at 72 °C for 20 s. All the qPCRs
were performed in duplicate (from duplicate DNA-extrac-
tions that is all together four replicates). Negative and
positive controls were included in all the experiments.
Standard curves were created with the help of DNA
extracted from a known number of culturable representa-
tives of the bacterial groups (B. coccoides for predominant
bacteria and Erec-group, Anaerotruncus colihominis for
Clept-group, Bacteroides fragilis for Bacteroides spp., Bifi-
dobacterium longum for bifidobacteria and Atopobium
parvulum for Atopobium group) and thereafter qPCR was
performed in duplicate from serially diluted standard-
DNA as described earlier.
Statistical analysis
The qPCR data were transformed to logarithmic scale to
be able to use parametric statistical methods. Mean and
standard deviation were calculated for each experiment.
Student’s t-test (two-sample assuming equal or unequal
variances, depending on data-set) was used for the statis-
tical analyses of the results.
Results
Optimization and validation of Clept-group and
Bacteroides spp. specific DGGEs
When the specificity of primer pairs Clept-933 f–Clept-1240-r+GC and Bact596f–Bacto-1080r+GC was evaluated
using reference strains, the primers gave positive PCR
results for all the target bacteria belonging to the Clept-
group or genus Bacteroides, respectively. No false-positive
results were obtained. All amplicons of the reference
strains for Clept-group and Bacteroides spp. migrated dif-
ferently and could thus be distinguished (data not
shown). Two samples were cloned after Clept PCR and
Bacteroides PCR to validate the specificity. All the
sequenced 204 Clept PCR clones belonged to the C. lep-
tum clostridial cluster IV and 240 Bacteroides PCR clones
to Bacteroides spp. The DGGE profiles of the cloned
samples and the sequence information obtained from the
cloning of Clept-group are presented in Figs S1 and S2.
The same information in regard of Bacteroides spp. is pre-
sented in Figs S3 and S4.
Clept-group and Bacteroides spp. diversities were on
average 20.9 and 9.2 amplicons per sample, respectively.
Intraindividual similarity of the follow-up samples was
higher than interindividual similarity in both groups that
is in 8/10 subjects all the samples from a given subject
clustered together (each individual created his/her own
cluster, data not shown). The intraindividual similarities
of Clept-group and Bacteroides spp. of samples taken
3 months apart were 87.5 ± 9.2% and 85.4 ± 12.1%,
respectively, whereas the intraindividual similarities of
Clept-group and Bacteroides spp. of samples taken half a
year apart were in average 81.7 ± 11.7% and 82.0 ±16.2%, respectively.
The effect of different DNA-extraction methods
and storage conditions on DNA yield
The use of different mechanical lysis methods (DNA-
extraction protocols 2–8; Fig. 1) did not affect the DNA
yield from fresh samples, whereas with stored samples
both the kit and different modifications to the kits caused
variations on the DNA yield. The highest DNA yield was
achieved with the most rigorous mechanical lysis (DNA-
extraction protocol 8; 3 9 60 s; 6.5 m s�1) at all storage
temperatures. The DNA yield was about 60% after gentle
mechanical lysis (60 s 4.5 m s�1; P < 0.05) and 20% after
enzymatic lysis (P < 0.05) as compared to the rigorous
DNA-extraction. The storage temperature did not cause
significant differences in the DNA yield when the same
protocol was applied to the same sample stored at differ-
ent temperatures.
The effect of different DNA-extraction methods
and storage conditions on the diversity and
quantity of predominant bacteria
The storage conditions had a significant effect on the
diversity of the predominant fecal bacteria of the studied
subjects. With mechanical DNA-extraction, the predomi-
nant bacterial diversity of fresh samples and samples
stored at �70 °C was significantly higher (P < 0.05) than
those stored initially at �20 or at 4 °C. When enzymatic
DNA-extraction was applied, significant, storage tempera-
ture dependent, differences (P < 0.05) were seen only
with one subject. However, the predominant bacterial
diversity of both subjects was significantly higher
(P < 0.005) after mechanical DNA-extraction than after
enzymatic DNA-extraction at all storage temperatures
tested. Furthermore, the bifidobacteria-associated bands
in the predominant bacterial DGGE-profile were weaker
when a gentle mechanical (60 s lysis) DNA-extraction
FEMS Microbiol Ecol 79 (2012) 697–708 ª 2011 Federation of European Microbiological SocietiesPublished by Blackwell Publishing Ltd. All rights reserved
DNA-extraction affects human fecal microbiota results 701
PCR of predominant microbiota, E. rectale –
B. coccoides clostridial group (Erec-group),
bifidobacteria, and Lactobacillus group
Partial 16S rRNA gene for the analysis of predominant
bacteria was amplified using primers U968-f+GC and
U1401-r (Table S2) as described previously (Matto et al.,
2005) and primers 358f+GC and 534r (Table S2) as previ-
ously described (Maukonen et al., 2006a) Erec-group was
amplified using primers Ccoc-f and Ccoc-r+GC, bifido-bacteria with primers Bif164-f and Bif662-GC-r, and Lac-
tobacillus group with primers Lac1 and Lac2GC (Table
S1) as previously described (Maukonen et al., 2006b;
Maukonen et al., 2008),
Cloning of the PCR-amplified products
PCR amplicons of Clept-group and Bacteroides spp. for
DGGE-method validation and PCR amplicons of Clept-
group and Erec-group for DNA-extraction method vali-
dation were purified using a Qiaquick PCR purification
kit (Qiagen) according to the manufacturer’s instructions.
Thereafter the cloning and analysis of the clones were
performed as previously described (Maukonen et al.,
2006b). Altogether 144 clones were collected from each
specific PCR and sequenced. The good quality sequences
(c. 110–140 clones / PCR) were subjected to CLUSTALW
analysis (http://www.ebi.ac.uk/Tools/clustalw2/index.html?)
for checking of the sequence similarities. All unequal
sequences were thereafter identified through the GenBank
database (http://blast.ncbi.nlm.nih.gov/Blast.cgi) using the
BLAST algorithm (Altschul et al., 1990) or using the ‘Clas-
sifier’ tool of the Ribosomal Database Project (RDP) II
(Wang et al., 2007). Library compare of RDPII (Cole
et al., 2009) was used for the classification of sequences
derived from DNA-extraction optimization into the phy-
logenetically consistent higher-order bacterial taxonomy.
Each different clone was deposited in the GenBank data-
base and the sequences are available under the accession
numbers JN206701–JN207127. Phylogenetic analyses were
performed using the Kodon software (Applied Mathemat-
ics, Sint-Martens-Latem, Belgium).
DGGE analysis of 16S rRNA gene fragments
DGGE analyses of predominant bacteria, Erec-group, Lac-
tobacillus group, and bifidobacteria were performed as
described previously (Maukonen et al., 2008). The primer
pair Clept-933 f and Clept-1240-r+GC was chosen for the
Clept-group DGGE analysis and primer pair Bact596f and
Bacto1080r+GC for the DGGE analysis of Bacteroides spp.
because of specificity and optimal migration. DGGE anal-
yses of Clept-group and Bacteroides spp. were performed
as previously described (Maukonen et al., 2008), with sev-
eral modifications. Various denaturing gradients were
tested and subsequently denaturing gradient from 30% to
60% [where 100% is 7 M urea and 40% (v/v) deionized
formamide] was chosen because of optimal amplicon
migration and differentiation. Similarity of the
PCR-DGGE profiles of the samples obtained from a
single subject at different sampling points was compared
to evaluate the diversity and temporal stability of the
selected bacterial populations. The comparison of the
profiles was performed by calculating a similarity percent-
age using BIONUMERICS software version 5.1 (Applied
Mathematics BVBA). Clustering was performed with
Pearson correlation and the unweighted-pair group
method (UPGMA). Amplicons with the total surface area
of at least 1% were included in the similarity analysis.
After sequence analysis of the clones from the newly
developed Clep-DGGE and Bacteroides DGGE, all the
clones with different sequences were subjected to either
Bacteroides DGGE or Clept-DGGE, after which the migra-
tion of each clone was compared to the migration of dif-
ferent amplicons in the original sample.
Quantitative PCR (qPCR) of ‘all’ bacteria, Clept-
group, Erec-group, Bacteroides spp.,
bifidobacteria, and Atopobium group
The specificity of various different primer pair combina-
tions for quantitative amplification were optimized and
validated for amplification of partial 16S rRNA gene of
predominant bacteria, Clept-group, Erec-group, Bactero-
ides spp., bifidobacteria, and Atopobium group using the
bacteria listed in Table S1. Subsequently the following
primer pairs were chosen; 358f and 534r for predominant
bacteria, Clept-F and Clept-R3 for Clept-group, g-Ccoc-F
and g-Ccoc-R for Erec-group, g-Bfra-F and g-Bfra-R for
Bacteroides spp., Bifid-f and Bifid-r for bifidobacteria, and
Atopo-f and Atopo-r for Atopobium group (Table S2).
High Resolution Melting Master kit (Roche, Mannheim,
Germany) using Sybr-Green like chemistry with Reso-
Light high-resolution melting dye with MgCl2 concentra-
tion of 2.5 mM (predominant bacteria and Clept-group),
1.9 mM (Erec-group), 3.1 mM (Bacteroides spp.),
2.5 mM (bifidobacteria), or 2.5 mM (Atopobium group)
were used according to the manufacturer’s instructions in
LightCycler 480 II instrument (Roche). The initial dena-
turing at 95 °C for 10 min, high-resolution melting (95 °C1 min, 40 °C 1 min, 65 °C 1 s, 95 °C), and cooling (40 °C,30 s) steps were identical to all the protocols. The rest of
the amplification protocols were as follows: predominant
bacteria: initial denaturing at 45 cycles of denaturing at
95 °C for 15 s, primer annealing at 50 °C for 20 s and
elongation at 72 °C for 25 s; Clept-group: 45 cycles of
ª 2011 Federation of European Microbiological Societies FEMS Microbiol Ecol 79 (2012) 697–708Published by Blackwell Publishing Ltd. All rights reserved
700 J. Maukonen et al.
V/5
denaturing at 95 °C for 10 s, primer annealing at 60 °Cfor 15 s and elongation at 72 °C for 20 s; Erec-group: 45
cycles of denaturing at 95 °C for 15 s, primer annealing
at 64 °C for 20 s and elongation at 72 °C for 25 s; Bacte-
roides spp.: 45 cycles of denaturing at 95 °C for 15 s, pri-
mer annealing at 58 °C for 20 s and elongation at 72 °Cfor 25 s; bifidobacteria: 45 cycles of denaturing at 95 °Cfor 10 s, primer annealing at 60 °C for 15 s and elonga-
tion at 72 °C for 20 s; and Atopobium group: 45 cycles of
denaturing at 95 °C for 10 s, primer annealing at 64 °Cfor 15 s and elongation at 72 °C for 20 s. All the qPCRs
were performed in duplicate (from duplicate DNA-extrac-
tions that is all together four replicates). Negative and
positive controls were included in all the experiments.
Standard curves were created with the help of DNA
extracted from a known number of culturable representa-
tives of the bacterial groups (B. coccoides for predominant
bacteria and Erec-group, Anaerotruncus colihominis for
Clept-group, Bacteroides fragilis for Bacteroides spp., Bifi-
dobacterium longum for bifidobacteria and Atopobium
parvulum for Atopobium group) and thereafter qPCR was
performed in duplicate from serially diluted standard-
DNA as described earlier.
Statistical analysis
The qPCR data were transformed to logarithmic scale to
be able to use parametric statistical methods. Mean and
standard deviation were calculated for each experiment.
Student’s t-test (two-sample assuming equal or unequal
variances, depending on data-set) was used for the statis-
tical analyses of the results.
Results
Optimization and validation of Clept-group and
Bacteroides spp. specific DGGEs
When the specificity of primer pairs Clept-933 f–Clept-1240-r+GC and Bact596f–Bacto-1080r+GC was evaluated
using reference strains, the primers gave positive PCR
results for all the target bacteria belonging to the Clept-
group or genus Bacteroides, respectively. No false-positive
results were obtained. All amplicons of the reference
strains for Clept-group and Bacteroides spp. migrated dif-
ferently and could thus be distinguished (data not
shown). Two samples were cloned after Clept PCR and
Bacteroides PCR to validate the specificity. All the
sequenced 204 Clept PCR clones belonged to the C. lep-
tum clostridial cluster IV and 240 Bacteroides PCR clones
to Bacteroides spp. The DGGE profiles of the cloned
samples and the sequence information obtained from the
cloning of Clept-group are presented in Figs S1 and S2.
The same information in regard of Bacteroides spp. is pre-
sented in Figs S3 and S4.
Clept-group and Bacteroides spp. diversities were on
average 20.9 and 9.2 amplicons per sample, respectively.
Intraindividual similarity of the follow-up samples was
higher than interindividual similarity in both groups that
is in 8/10 subjects all the samples from a given subject
clustered together (each individual created his/her own
cluster, data not shown). The intraindividual similarities
of Clept-group and Bacteroides spp. of samples taken
3 months apart were 87.5 ± 9.2% and 85.4 ± 12.1%,
respectively, whereas the intraindividual similarities of
Clept-group and Bacteroides spp. of samples taken half a
year apart were in average 81.7 ± 11.7% and 82.0 ±16.2%, respectively.
The effect of different DNA-extraction methods
and storage conditions on DNA yield
The use of different mechanical lysis methods (DNA-
extraction protocols 2–8; Fig. 1) did not affect the DNA
yield from fresh samples, whereas with stored samples
both the kit and different modifications to the kits caused
variations on the DNA yield. The highest DNA yield was
achieved with the most rigorous mechanical lysis (DNA-
extraction protocol 8; 3 9 60 s; 6.5 m s�1) at all storage
temperatures. The DNA yield was about 60% after gentle
mechanical lysis (60 s 4.5 m s�1; P < 0.05) and 20% after
enzymatic lysis (P < 0.05) as compared to the rigorous
DNA-extraction. The storage temperature did not cause
significant differences in the DNA yield when the same
protocol was applied to the same sample stored at differ-
ent temperatures.
The effect of different DNA-extraction methods
and storage conditions on the diversity and
quantity of predominant bacteria
The storage conditions had a significant effect on the
diversity of the predominant fecal bacteria of the studied
subjects. With mechanical DNA-extraction, the predomi-
nant bacterial diversity of fresh samples and samples
stored at �70 °C was significantly higher (P < 0.05) than
those stored initially at �20 or at 4 °C. When enzymatic
DNA-extraction was applied, significant, storage tempera-
ture dependent, differences (P < 0.05) were seen only
with one subject. However, the predominant bacterial
diversity of both subjects was significantly higher
(P < 0.005) after mechanical DNA-extraction than after
enzymatic DNA-extraction at all storage temperatures
tested. Furthermore, the bifidobacteria-associated bands
in the predominant bacterial DGGE-profile were weaker
when a gentle mechanical (60 s lysis) DNA-extraction
FEMS Microbiol Ecol 79 (2012) 697–708 ª 2011 Federation of European Microbiological SocietiesPublished by Blackwell Publishing Ltd. All rights reserved
DNA-extraction affects human fecal microbiota results 701
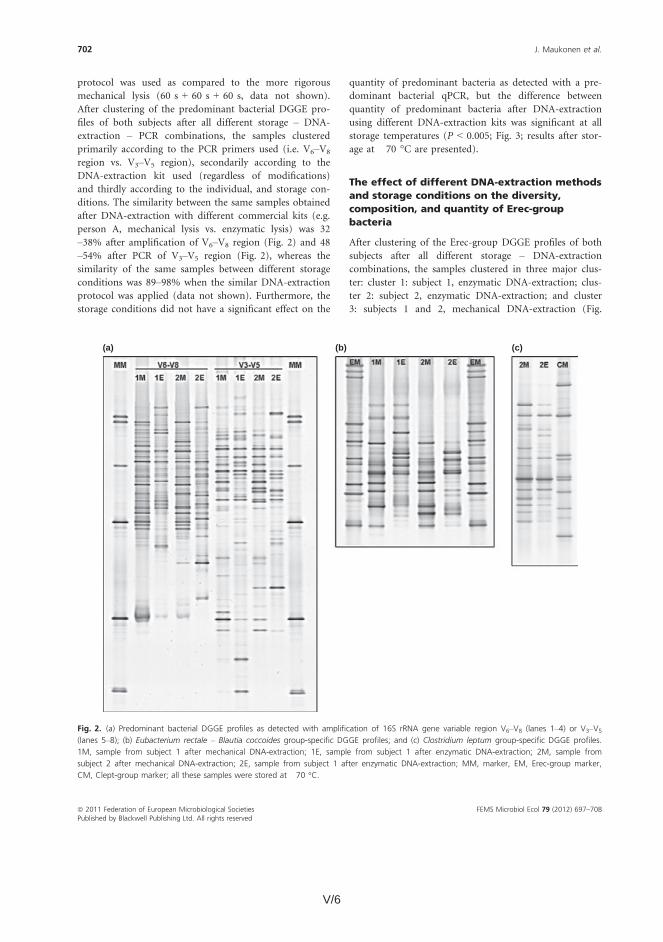
V/6 V/7
S5). Within cluster 3, there were further two sub-clusters
for differentiating the two individuals. The similarity of
the same samples obtained after DNA-extraction with
different kits (within the same storage conditions) was
42–53% (Fig. 2), whereas the similarity of the same sam-
ple after different storage conditions was > 95% when
similar DNA-extraction protocol was applied (Fig. S5).
Clone library analysis confirmed the different bacterial
compositions detected with DGGE (Table 1). After enzy-
matic DNA-extraction, the most prevalent genera
detected were Roseburia (39% of clones) and Coprococcus
(10%), whereas 37% of the clones belonged to unclassi-
fied Lachnospiraceae. After mechanical DNA-extraction,
the most prevalent bacterial genera of Erec-group were
Blautia (30% of clones), Coprococcus (13%), and Dorea
(10%), whereas 27% of the clones belonged to unclassi-
fied Clostridiales; only 10% of the clones belonged to
genus Roseburia and 11% to unclassified Lachnospiraceae.
A few clones (1.6%) belonging to the genus Anaerostipes
were detected only after enzymatic DNA-extraction. The
Erec-group diversity stayed about the same regardless of
the DNA-extraction protocol applied, as detected with
both DGGE and clone libraries (Fig. S6). The storage
conditions did not have a significant effect on the quan-
tity of Erec-group bacteria as detected with qPCR, when
similar protocols were compared. However, the numbers
of Erec-group bacteria were significantly higher after
mechanical DNA-extraction (P < 0.05; ~2 log unit differ-
ence; Fig. 3) than after enzymatic DNA-extraction,
regardless of the protocol and storage conditions
applied.
The effect of different DNA-extraction methods
and storage conditions on the diversity,
composition, and quantity of Clept-group
bacteria
After clustering of the Clept-group DGGE profiles of both
subjects after all different storage – DNA-extraction com-
binations, the samples clustered primarily according to
the individual, secondarily (within the primary clusters)
according to the used DNA-extraction kit and thirdly
according to the storage conditions. The similarity of the
same samples obtained after DNA-extraction with differ-
ent kits (at the same storage condition) was 80–87%(Fig. 2), whereas the similarity of the same sample after
different storage conditions was > 94% when similar
DNA-extraction protocol was applied (Fig. S7), except for
sub-samples stored initially at 4 °C for 2 days. The simi-
larity of samples stored at 4 °C was 84–93% as compared
to the same samples stored at �20 or at �70 °C (using
identical DNA-extraction protocol). Clone library analysis
confirmed the partly different bacterial composition
detected with DGGE (Table 2 ). The most prevalent
Clept-group genera detected after mechanical DNA-
extraction were Faecalibacterium (39%) and Subdoligranu-
lum (37%), whereas after enzymatic DNA-extraction 80%
of the clones grouped to genus Subdoligranulum. In addi-
tion, the diversity of the Clept-group was higher after
mechanical DNA-extraction, as detected with both DGGE
and clone libraries (Fig. S6). The storage conditions did
not have a significant effect on the quantity of Clept-
group bacteria as detected with qPCR, when similar
protocols were compared. However, the numbers of
Clept-group bacteria were significantly higher after
–1
0
1
2
3
4
5
Univ Bfra Erec Clept Bif Ato
Log
(diff
eren
ce in
num
bers
)
Subject 1 Subject 2
Fig. 3. Difference between numbers of bacterial groups obtained
after different DNA-extraction protocols and qPCR from samples
stored at �70 °C. The results are expressed as log-values (mechanical
lysis – enzymatic lysis; i.e. positive number indicates more efficient
mechanical lysis). All other differences, except Bacteroides spp., were
statistically significant (P < 0.05). Univ, predominant bacteria, Bfra,
Bacteroides spp., Erec, Eubacterium rectale – Blautia coccoides group,
Clept, Clostridium leptum group, Bif, bifidobacteria, Ato, Atopobium
group.
Table 1. Phylogenetic classification as determined with the Library
compare of RDPII (Cole et al., 2009) of the Eubacterium rectale –
Blautia coccoides group clone libraries derived from a single sample
(library 1 = enzymatic DNA-extraction; library 2 = mechanical; and
chemical DNA-extraction)
Rank Name
Library
1
Library
2 Significance
Phylum ‘Firmicutes’ 126 126 1E0
Order Clostridiales 126 126 1E0
Family ‘Lachnospiraceae’ 111 54 6E�14
Genus Dorea 1 12 1.83E�3
Genus Coprococcus 13 16 5.55E�1
Genus Anaerostipes 2 0 2.5E�1
Genus Roseburia 49 12 6.68E�8
Unclassified
‘Lachnospiraceae’
46 14 NA
Family Incertae Sedis XIV 3 38 5.63E�9
Genus Blautia 3 38 5.63E�9
Unclassified Clostridiales 12 34 NA
FEMS Microbiol Ecol 79 (2012) 697–708 ª 2011 Federation of European Microbiological SocietiesPublished by Blackwell Publishing Ltd. All rights reserved
DNA-extraction affects human fecal microbiota results 703
protocol was used as compared to the more rigorous
mechanical lysis (60 s + 60 s + 60 s, data not shown).
After clustering of the predominant bacterial DGGE pro-
files of both subjects after all different storage – DNA-
extraction – PCR combinations, the samples clustered
primarily according to the PCR primers used (i.e. V6–V8
region vs. V3–V5 region), secondarily according to the
DNA-extraction kit used (regardless of modifications)
and thirdly according to the individual, and storage con-
ditions. The similarity between the same samples obtained
after DNA-extraction with different commercial kits (e.g.
person A, mechanical lysis vs. enzymatic lysis) was 32
–38% after amplification of V6–V8 region (Fig. 2) and 48
–54% after PCR of V3–V5 region (Fig. 2), whereas the
similarity of the same samples between different storage
conditions was 89–98% when the similar DNA-extraction
protocol was applied (data not shown). Furthermore, the
storage conditions did not have a significant effect on the
quantity of predominant bacteria as detected with a pre-
dominant bacterial qPCR, but the difference between
quantity of predominant bacteria after DNA-extraction
using different DNA-extraction kits was significant at all
storage temperatures (P < 0.005; Fig. 3; results after stor-
age at �70 °C are presented).
The effect of different DNA-extraction methods
and storage conditions on the diversity,
composition, and quantity of Erec-group
bacteria
After clustering of the Erec-group DGGE profiles of both
subjects after all different storage – DNA-extraction
combinations, the samples clustered in three major clus-
ter: cluster 1: subject 1, enzymatic DNA-extraction; clus-
ter 2: subject 2, enzymatic DNA-extraction; and cluster
3: subjects 1 and 2, mechanical DNA-extraction (Fig.
(a) (b) (c)
Fig. 2. (a) Predominant bacterial DGGE profiles as detected with amplification of 16S rRNA gene variable region V6–V8 (lanes 1–4) or V3–V5
(lanes 5–8); (b) Eubacterium rectale – Blautia coccoides group-specific DGGE profiles; and (c) Clostridium leptum group-specific DGGE profiles.
1M, sample from subject 1 after mechanical DNA-extraction; 1E, sample from subject 1 after enzymatic DNA-extraction; 2M, sample from
subject 2 after mechanical DNA-extraction; 2E, sample from subject 1 after enzymatic DNA-extraction; MM, marker, EM, Erec-group marker,
CM, Clept-group marker; all these samples were stored at �70 °C.
ª 2011 Federation of European Microbiological Societies FEMS Microbiol Ecol 79 (2012) 697–708Published by Blackwell Publishing Ltd. All rights reserved
702 J. Maukonen et al.
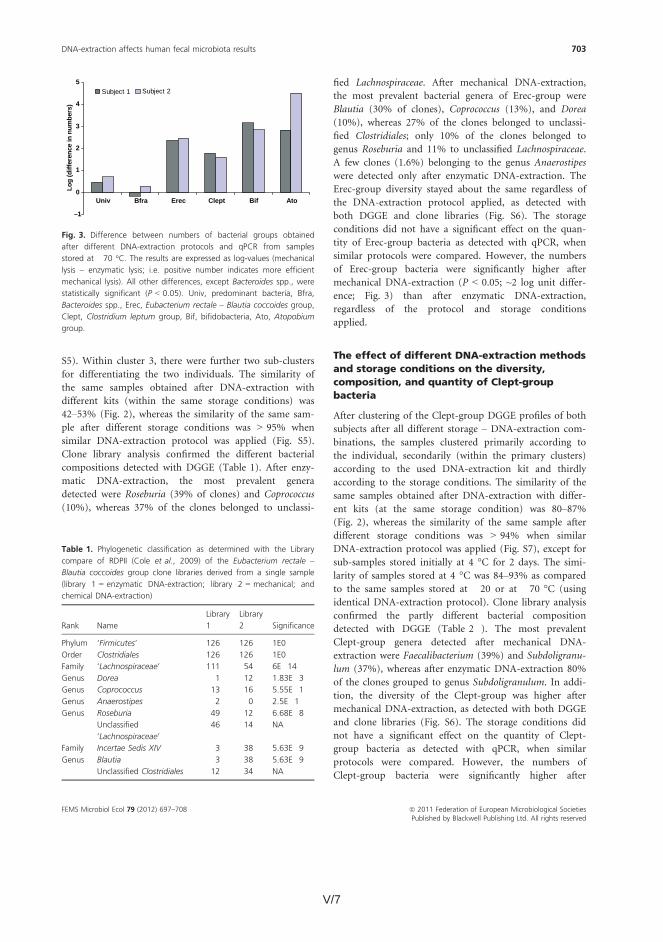
V/7
S5). Within cluster 3, there were further two sub-clusters
for differentiating the two individuals. The similarity of
the same samples obtained after DNA-extraction with
different kits (within the same storage conditions) was
42–53% (Fig. 2), whereas the similarity of the same sam-
ple after different storage conditions was > 95% when
similar DNA-extraction protocol was applied (Fig. S5).
Clone library analysis confirmed the different bacterial
compositions detected with DGGE (Table 1). After enzy-
matic DNA-extraction, the most prevalent genera
detected were Roseburia (39% of clones) and Coprococcus
(10%), whereas 37% of the clones belonged to unclassi-
fied Lachnospiraceae. After mechanical DNA-extraction,
the most prevalent bacterial genera of Erec-group were
Blautia (30% of clones), Coprococcus (13%), and Dorea
(10%), whereas 27% of the clones belonged to unclassi-
fied Clostridiales; only 10% of the clones belonged to
genus Roseburia and 11% to unclassified Lachnospiraceae.
A few clones (1.6%) belonging to the genus Anaerostipes
were detected only after enzymatic DNA-extraction. The
Erec-group diversity stayed about the same regardless of
the DNA-extraction protocol applied, as detected with
both DGGE and clone libraries (Fig. S6). The storage
conditions did not have a significant effect on the quan-
tity of Erec-group bacteria as detected with qPCR, when
similar protocols were compared. However, the numbers
of Erec-group bacteria were significantly higher after
mechanical DNA-extraction (P < 0.05; ~2 log unit differ-
ence; Fig. 3) than after enzymatic DNA-extraction,
regardless of the protocol and storage conditions
applied.
The effect of different DNA-extraction methods
and storage conditions on the diversity,
composition, and quantity of Clept-group
bacteria
After clustering of the Clept-group DGGE profiles of both
subjects after all different storage – DNA-extraction com-
binations, the samples clustered primarily according to
the individual, secondarily (within the primary clusters)
according to the used DNA-extraction kit and thirdly
according to the storage conditions. The similarity of the
same samples obtained after DNA-extraction with differ-
ent kits (at the same storage condition) was 80–87%(Fig. 2), whereas the similarity of the same sample after
different storage conditions was > 94% when similar
DNA-extraction protocol was applied (Fig. S7), except for
sub-samples stored initially at 4 °C for 2 days. The simi-
larity of samples stored at 4 °C was 84–93% as compared
to the same samples stored at �20 or at �70 °C (using
identical DNA-extraction protocol). Clone library analysis
confirmed the partly different bacterial composition
detected with DGGE (Table 2 ). The most prevalent
Clept-group genera detected after mechanical DNA-
extraction were Faecalibacterium (39%) and Subdoligranu-
lum (37%), whereas after enzymatic DNA-extraction 80%
of the clones grouped to genus Subdoligranulum. In addi-
tion, the diversity of the Clept-group was higher after
mechanical DNA-extraction, as detected with both DGGE
and clone libraries (Fig. S6). The storage conditions did
not have a significant effect on the quantity of Clept-
group bacteria as detected with qPCR, when similar
protocols were compared. However, the numbers of
Clept-group bacteria were significantly higher after
–1
0
1
2
3
4
5
Univ Bfra Erec Clept Bif Ato
Log
(diff
eren
ce in
num
bers
)
Subject 1 Subject 2
Fig. 3. Difference between numbers of bacterial groups obtained
after different DNA-extraction protocols and qPCR from samples
stored at �70 °C. The results are expressed as log-values (mechanical
lysis – enzymatic lysis; i.e. positive number indicates more efficient
mechanical lysis). All other differences, except Bacteroides spp., were
statistically significant (P < 0.05). Univ, predominant bacteria, Bfra,
Bacteroides spp., Erec, Eubacterium rectale – Blautia coccoides group,
Clept, Clostridium leptum group, Bif, bifidobacteria, Ato, Atopobium
group.
Table 1. Phylogenetic classification as determined with the Library
compare of RDPII (Cole et al., 2009) of the Eubacterium rectale –
Blautia coccoides group clone libraries derived from a single sample
(library 1 = enzymatic DNA-extraction; library 2 = mechanical; and
chemical DNA-extraction)
Rank Name
Library
1
Library
2 Significance
Phylum ‘Firmicutes’ 126 126 1E0
Order Clostridiales 126 126 1E0
Family ‘Lachnospiraceae’ 111 54 6E�14
Genus Dorea 1 12 1.83E�3
Genus Coprococcus 13 16 5.55E�1
Genus Anaerostipes 2 0 2.5E�1
Genus Roseburia 49 12 6.68E�8
Unclassified
‘Lachnospiraceae’
46 14 NA
Family Incertae Sedis XIV 3 38 5.63E�9
Genus Blautia 3 38 5.63E�9
Unclassified Clostridiales 12 34 NA
FEMS Microbiol Ecol 79 (2012) 697–708 ª 2011 Federation of European Microbiological SocietiesPublished by Blackwell Publishing Ltd. All rights reserved
DNA-extraction affects human fecal microbiota results 703
V/8 V/9
valent fecal bacterial groups are studied from the same
samples.
Our findings showed that the commercial DNA-extrac-
tion kits had a significant effect on both composition and
numbers of abundant human fecal microbial groups. The
numbers and composition of Bacteroides spp. were not
significantly affected by the various DNA-extraction pro-
tocols, which is in line with the previous findings (Salo-
nen et al., 2010). However, the storage temperature had a
significant effect on the quantity of Bacteroides spp., caus-
ing > 1 log reduction with all tested storage condition as
compared to the same sample as fresh. These findings
may partly explain why no Bacteroidetes were found in
the study of Gill et al. (2006). The clostridial populations,
namely E. rectale – B. coccoides (Erec) group and C. lep-
tum (Clept) group, were significantly affected in both
composition and numbers by the DNA-extraction proto-
col used. The numbers of both clostridial groups were
significantly lower when enzymatic DNA-extraction kit
was used (~2 log reduction) as compared to mechanical
DNA-extraction kit. In addition, the composition of
Erec-group was different when different commercial kits
were applied to the same samples. The most prevalent
genus detected after enzymatic DNA-extraction was
Roseburia (39% of clones), whereas after mechanical
DNA-extraction, the most prevalent genus was Blautia
(30% of clones). The same phenomenon was also noticed
with the Clept-group bacteria; the most prevalent Clept-
group genera detected after mechanical DNA-extraction
were Faecalibacterium (39%) and Subdoligranulum (37%),
whereas after enzymatic DNA-extraction, 80% of the
clones grouped to genus Subdoligranulum. The higher
proportion of genus Faecalibacterium after rigorous
DNA-extraction has also been noted in earlier studies
with different protocols (Salonen et al., 2010).
Most of the obesity-related studies that have obtained
similar results, that is, that the relative proportion of
Bacteroidetes decreases and the relative proportion of
Firmicutes increases in obese human (Ley et al., 2006),
have used QIAmp DNA Stool Mini Kit (Santacruz et al.,
2009; Zhang et al., 2009; Balamurugan et al., 2010; San-
tacruz et al., 2010), whereas in those studies, in which
there has been no difference between obese and lean
subjects or the results have been contradictory to the
initial findings, a more rigorous DNA-extraction proto-
col has been applied (Mai et al., 2009; Schwiertz et al.,
2010; Arumugam et al., 2011) or the samples have been
studied with fluorescent in situ hybridization (Duncan
et al., 2007; Collado et al., 2008; Duncan et al., 2008;
Mai et al., 2009). As our results demonstrate that the
DNA-extraction protocol has a major effect on the clos-
tridial populations while having no effect on the Bacte-
roides population, it may be that the contradictory
results are, at least partly, caused by different DNA-
extraction protocols.
Another recent example of contradictory findings has
involved the bifidobacterial populations of baby feces.
Bifidobacterial populations have been found to constitute
a dominant part of baby feces many decades ago by cul-
ture-based methods (Bullen et al., 1976; Stark & Lee,
1982). With molecular techniques the results have, how-
ever, been partly contradictory. There are numerous stud-
ies conducted with molecular techniques in which
bifidobacteria have been shown to dominate baby fecal
microbiota (Harmsen et al., 2000b; Favier et al., 2002;
Magne et al., 2006; Fallani et al., 2010), but then there
are those in which bifidobacteria have been found to con-
stitute only a minor part of the infant microbiota (Palmer
et al., 2007). Similarly to the obesity issue, also this
inconsistency may result from different DNA-extraction
techniques applied. In those molecular studies where bifi-
dobacteria have been shown to predominate in the baby
feces, mechanical DNA-extraction has been applied
(Favier et al., 2002; Magne et al., 2006) or the samples
have been studied with FISH (Harmsen et al., 2000b; Fal-
lani et al., 2010). In those studies where the authors have
concluded that bifidobacteria constitute only a minor part
of the baby fecal microbiota, enzymatic DNA-extraction
using the same commercial kit as in this study has been
applied (Palmer et al., 2007). Because our results showed
that with enzymatic DNA-extraction, the number of
bifidobacteria may be even 3 log units lower than with
rigorous mechanical DNA-extraction, differences in
DNA-extraction likely explain these contradictory results.
In addition, Nakamura et al. (2009) showed that when
enzymatic DNA-extraction was applied bifidobacterial
abundance was 0.1–1.7%, whereas when FISH was
applied to the same samples the bifidobacterial abundance
increased to 20.7–83.5% in baby feces. Furthermore, pre-
viously it has been found (Salonen et al., 2010) that with
more rigorous mechanical disruption, the proportion of
Actinobacteria (e.g., bifidobacteria and Atopobium group)
increased. Interestingly, the protocol that yielded the low-
est levels of Actinobacteria was based on the same kit that
we used for enzymatic DNA-extraction (Salonen et al.,
2010). However, we used the kit according to the manu-
facturer’s instructions, whereas Salonen et al. (2010)
added 3 9 30 s bead beating and extended the duration
of heat lysis in their study. Even with these modifications,
the proportion of Actinobacteria was low.
The highest numbers of most of the studied bacterial
groups were detected from fresh samples and from sam-
ples stored at �70 °C. Unexpectedly, the highest numbers
of Atopobium group were detected after an initial storage
at 4 °C for 2 days. The unexpected effect of storage con-
ditions on Atopobium group numbers was confirmed with
FEMS Microbiol Ecol 79 (2012) 697–708 ª 2011 Federation of European Microbiological SocietiesPublished by Blackwell Publishing Ltd. All rights reserved
DNA-extraction affects human fecal microbiota results 705
mechanical DNA-extraction (P < 0.05; ~1.5 log unit dif-
ference; Fig. 3) than after enzymatic DNA-extraction,
regardless of the protocol and storage conditions applied.
The effect of different DNA-extraction methods
and storage conditions on the diversity and
quantity of Bacteroides spp.
The storage conditions and different DNA-extraction
methods did not have an effect on the diversity and com-
position of Bacteroides spp. All the profiles of a given per-
son, regardless of the protocol or storage conditions
applied, were similar (similarity with Pearson correlation
> 90%). However, the storage conditions greatly affected
the numbers of the Bacteroides spp. The highest numbers
of Bacteroides spp. were obtained from fresh samples as
detected with qPCR, whereas after a week’s storage at
�20 °C, the numbers of Bacteroides spp. were signifi-
cantly lower (1.6–2.5 log reduction, depending on the
DNA-extraction modification) than those in fresh samples
(Fig. S8).
The effect of different DNA-extraction methods
and storage conditions on the diversity and/or
quantity of bifidobacteria, Lactobacillus group,
and Atopobium group
The different storage conditions and DNA-extraction
methods did not affect the bifidobacterial diversity or the
composition as detected with bifidobacteria-specific
DGGE (data not shown). The storage conditions did not
have a significant effect on the numbers of bifidobacteria
when similar protocols were compared. However, the
numbers of bifidobacteria were significantly higher
(P < 0.05; ~3 log unit difference; Fig. 3) after mechanical
DNA-extraction than after enzymatic DNA-extraction as
detected with qPCR.
The diversity and composition of Lactobacillus group
were not significantly affected, as detected with specific
DGGE, by the storage conditions when mechanical DNA-
extraction was applied. After enzymatic DNA-extraction,
the samples did not amplify with the Lactobacillus group-
specific PCR at all.
The numbers of Atopobium group bacteria were signifi-
cantly affected by both storage conditions and used
DNA-extraction protocols as detected with qPCR. After
mechanical DNA-extraction, the number of Atopobium
group bacteria was significantly higher (P < 0.05; 2.5–4.5log unit difference; Fig. 3) at all evaluated storage condi-
tions. Furthermore, the numbers of Atopobium group
bacteria were significantly higher (P < 0.05; > 1 log unit
difference) after initial storage at �20 °C for a week or at
4 °C for 2 days than those from fresh samples or samples
stored solely at �70 °C.
Discussion
Recently there have been several human health-related
microbiota studies with partly contradictory results
regarding obesity-related microbiota and bifidobacterial
abundance of baby microbiota. As it is likely that at least
some of the differences could be explained by the meth-
odology applied, we evaluated the impact of commonly
used commercial DNA-extraction kits (with several mod-
ifications) and storage temperatures on most prevalent
human gut microbial groups. There are a few recent
(Dridi et al., 2009; Ariefdjohan et al., 2010; Salonen
et al., 2010) and older (Zoetendal et al., 2001; McOrist
et al., 2002; Li et al., 2003) studies in which the effect of
DNA-extraction on results derived from human fecal
samples has been studied. However, in those studies
where the commonly used commercial kits have been
applied, only the ‘universal’ level of predominant bacte-
ria has been studied (McOrist et al., 2002; Li et al.,
2003; Ariefdjohan et al., 2010), or the study has focused
on a specific microbial group, such as methanogens
(Dridi et al., 2009). On the other hand, in a recent study
(Salonen et al., 2010) in which the gut microbiota was
studied in more detail, different DNA-extraction proto-
cols – as compared to the ones we used – were applied.
The impact of storage conditions on diversity and com-
position of fecal microbiota has also been studied (Mol-
bak et al., 2006; Roesch et al., 2009; Lauber et al., 2010),
but to our knowledge, this is the first study in which
both the effect of DNA-extraction and storage conditions
on diversity, composition, and numbers of the most pre-
Table 2. Phylogenetic classification as determined with the Library
compare of RDPII (Cole et al., 2009) of the Clostiriudm leptum group
clone libraries derived from a single sample (library 1 = enzymatic
DNA-extraction; library 2 = mechanical and chemical DNA-extraction)
Rank Name
Library
1
Library
2 Significance
Phylum ‘Firmicutes’ 112 116 9.99E�1
Class ‘Clostridia’ 111 113 8.96E�1
Order Clostridiales 110 113 9.5E�1
Family ‘Ruminococcaceae’ 110 112 8.98E�1
Genus Faecalibacterium 6 45 1.98E�9
Genus Subdoligranulum 90 43 4.13E�11
Genus Butyricicoccus 1 2 6.52E�1
Genus Anaerotruncus 1 0 4.83E�1
Unclassified
‘Ruminococcaceae’
12 22 NA
Unclassified Clostridiales 0 1 NA
Unclassified ‘Clostridia’ 1 0 NA
Unclassified ‘Firmicutes’ 1 3 NA
ª 2011 Federation of European Microbiological Societies FEMS Microbiol Ecol 79 (2012) 697–708Published by Blackwell Publishing Ltd. All rights reserved
704 J. Maukonen et al.

V/9
valent fecal bacterial groups are studied from the same
samples.
Our findings showed that the commercial DNA-extrac-
tion kits had a significant effect on both composition and
numbers of abundant human fecal microbial groups. The
numbers and composition of Bacteroides spp. were not
significantly affected by the various DNA-extraction pro-
tocols, which is in line with the previous findings (Salo-
nen et al., 2010). However, the storage temperature had a
significant effect on the quantity of Bacteroides spp., caus-
ing > 1 log reduction with all tested storage condition as
compared to the same sample as fresh. These findings
may partly explain why no Bacteroidetes were found in
the study of Gill et al. (2006). The clostridial populations,
namely E. rectale – B. coccoides (Erec) group and C. lep-
tum (Clept) group, were significantly affected in both
composition and numbers by the DNA-extraction proto-
col used. The numbers of both clostridial groups were
significantly lower when enzymatic DNA-extraction kit
was used (~2 log reduction) as compared to mechanical
DNA-extraction kit. In addition, the composition of
Erec-group was different when different commercial kits
were applied to the same samples. The most prevalent
genus detected after enzymatic DNA-extraction was
Roseburia (39% of clones), whereas after mechanical
DNA-extraction, the most prevalent genus was Blautia
(30% of clones). The same phenomenon was also noticed
with the Clept-group bacteria; the most prevalent Clept-
group genera detected after mechanical DNA-extraction
were Faecalibacterium (39%) and Subdoligranulum (37%),
whereas after enzymatic DNA-extraction, 80% of the
clones grouped to genus Subdoligranulum. The higher
proportion of genus Faecalibacterium after rigorous
DNA-extraction has also been noted in earlier studies
with different protocols (Salonen et al., 2010).
Most of the obesity-related studies that have obtained
similar results, that is, that the relative proportion of
Bacteroidetes decreases and the relative proportion of
Firmicutes increases in obese human (Ley et al., 2006),
have used QIAmp DNA Stool Mini Kit (Santacruz et al.,
2009; Zhang et al., 2009; Balamurugan et al., 2010; San-
tacruz et al., 2010), whereas in those studies, in which
there has been no difference between obese and lean
subjects or the results have been contradictory to the
initial findings, a more rigorous DNA-extraction proto-
col has been applied (Mai et al., 2009; Schwiertz et al.,
2010; Arumugam et al., 2011) or the samples have been
studied with fluorescent in situ hybridization (Duncan
et al., 2007; Collado et al., 2008; Duncan et al., 2008;
Mai et al., 2009). As our results demonstrate that the
DNA-extraction protocol has a major effect on the clos-
tridial populations while having no effect on the Bacte-
roides population, it may be that the contradictory
results are, at least partly, caused by different DNA-
extraction protocols.
Another recent example of contradictory findings has
involved the bifidobacterial populations of baby feces.
Bifidobacterial populations have been found to constitute
a dominant part of baby feces many decades ago by cul-
ture-based methods (Bullen et al., 1976; Stark & Lee,
1982). With molecular techniques the results have, how-
ever, been partly contradictory. There are numerous stud-
ies conducted with molecular techniques in which
bifidobacteria have been shown to dominate baby fecal
microbiota (Harmsen et al., 2000b; Favier et al., 2002;
Magne et al., 2006; Fallani et al., 2010), but then there
are those in which bifidobacteria have been found to con-
stitute only a minor part of the infant microbiota (Palmer
et al., 2007). Similarly to the obesity issue, also this
inconsistency may result from different DNA-extraction
techniques applied. In those molecular studies where bifi-
dobacteria have been shown to predominate in the baby
feces, mechanical DNA-extraction has been applied
(Favier et al., 2002; Magne et al., 2006) or the samples
have been studied with FISH (Harmsen et al., 2000b; Fal-
lani et al., 2010). In those studies where the authors have
concluded that bifidobacteria constitute only a minor part
of the baby fecal microbiota, enzymatic DNA-extraction
using the same commercial kit as in this study has been
applied (Palmer et al., 2007). Because our results showed
that with enzymatic DNA-extraction, the number of
bifidobacteria may be even 3 log units lower than with
rigorous mechanical DNA-extraction, differences in
DNA-extraction likely explain these contradictory results.
In addition, Nakamura et al. (2009) showed that when
enzymatic DNA-extraction was applied bifidobacterial
abundance was 0.1–1.7%, whereas when FISH was
applied to the same samples the bifidobacterial abundance
increased to 20.7–83.5% in baby feces. Furthermore, pre-
viously it has been found (Salonen et al., 2010) that with
more rigorous mechanical disruption, the proportion of
Actinobacteria (e.g., bifidobacteria and Atopobium group)
increased. Interestingly, the protocol that yielded the low-
est levels of Actinobacteria was based on the same kit that
we used for enzymatic DNA-extraction (Salonen et al.,
2010). However, we used the kit according to the manu-
facturer’s instructions, whereas Salonen et al. (2010)
added 3 9 30 s bead beating and extended the duration
of heat lysis in their study. Even with these modifications,
the proportion of Actinobacteria was low.
The highest numbers of most of the studied bacterial
groups were detected from fresh samples and from sam-
ples stored at �70 °C. Unexpectedly, the highest numbers
of Atopobium group were detected after an initial storage
at 4 °C for 2 days. The unexpected effect of storage con-
ditions on Atopobium group numbers was confirmed with
FEMS Microbiol Ecol 79 (2012) 697–708 ª 2011 Federation of European Microbiological SocietiesPublished by Blackwell Publishing Ltd. All rights reserved
DNA-extraction affects human fecal microbiota results 705
V/10 V/11
rRNA-based probes for the Coriobacterium group and the
Atopobium cluster and their application for enumeration of
Coriobacteriaceae in human feces from volunteers of
different age groups. Appl Environ Microbiol 66: 4523–4527.Harmsen HJM, Wildeboer-Veloo ACM, Raangs GC,
Wagendorp AA, Klijn N, Bindels JG & Welling GW (2000b)
Analysis of intestinal flora development in breast-fed and
formula-fed infants by using molecular identification and
detection methods. J Pediatr Gastroenterol Nutr 30: 61–67.Kageyama A, Benno Y & Nakase T (1999) Phylogenetic and
phenotypic evidence for the transfer of Eubacterium
aerofaciens to the genus Collinsella as Collinsella aerofaciens
gen. nov., comb. nov. Int J Syst Bacteriol 49: 557–565.Lauber CL, Zhou N, Gordon JI, Knight R & Fierer N (2010)
Effect of storage conditions on the assessment of bacterial
community structure in soil and human-associated samples.
FEMS Microbiol Lett 307: 80–86.Lay C, Rigottier-Gois L, Holmstrøm K, et al. (2005) Colonic
microbiota signatures across five northern European
countries. Appl Environ Microbiol 71: 4153–4155.Ley RE, Backhed F, Turnbaugh P, Lozupone CA, Knight RD &
Gordon JI (2005) Obesity alters gut microbial ecology. P
Natl Acad Sci USA 102: 11070–11075.Ley RE, Turnbaugh PJ, Klein S & Gordon JI (2006) Microbial
ecology: human gut microbes associated with obesity.
Nature 444: 1022–1023.Li M, Gong J, Cottrill M, Yu H, De Lange C, Burton J &
Topp E (2003) Evaluation of QIAamp® DNA Stool Mini
Kit for ecological studies of gut microbiota. J Microbiol
Methods 54: 13–20.Magne F, Hachelaf W, Suau A, Boudraa G, Mangin I,
Touhami M, Bouziane-Nedjadi K & Pochart P (2006) A
longitudinal study of infant faecal microbiota during
weaning. FEMS Microbiol Ecol 58: 563–571.Mai V, McCrary QM, Sinha R & Glei M (2009) Associations
between dietary habits and body mass index with gut
microbiota composition and fecal water genotoxicity: an
observational study in African American and Caucasian
American volunteers. Nutr J 8: 49.
Matsuki T, Watanabe K, Fujimoto J, Takada T & Tanaka R
(2004) Use of 16S rRNA gene-targeted group-specific
primers for real-time PCR analysis of predominant bacteria
in human feces. Appl Environ Microbiol 70: 7220–7228.Matto J, Maunuksela L, Kajander K, Palva A, Korpela R,
Kassinen A & Saarela M (2005) Composition and temporal
stability of gastrointestinal microbiota in irritable bowel
syndrome – A longitudinal study in IBS and control
subjects. FEMS Immunol Med Microbiol 43: 213–222.Maukonen J, Saarela M & Raaska L (2006a)
Desulfovibrionales-related bacteria in a paper mill
environment as detected with molecular techniques and
culture. J Ind Microbiol Biotechnol 33: 45–54.Maukonen J, Matto J, Satokari R, Soderlund H, Mattila-
Sandholm T & Saarela M (2006b) PCR DGGE and RT-PCR
DGGE show diversity and short-term temporal stability in
the Clostridium coccoides-Eubacterium rectale group in the
human intestinal microbiota. FEMS Microbiol Ecol 58: 517–528.
Maukonen J, Matto J, Suihko M & Saarela M (2008) Intra-
individual diversity and similarity of salivary and faecal
microbiota. J Med Microbiol 57: 1560–1568.McOrist AL, Jackson M & Bird AR (2002) A comparison of
five methods for extraction of bacterial DNA from human
faecal samples. J Microbiol Methods 50: 131–139.Molbak L, Sommer HM, Johnsen K, Boye M, Johansen M,
Møller K & Leser TD (2006) Freezing at �80°C distorts the
DNA composition of bacterial communities in intestinal
samples. Curr Issues Intest Microbiol 7: 29–34.Mueller S, Saunier K, Hanisch C, et al. (2006) Differences in
fecal microbiota in different European study populations in
relation to age, gender, and country: a cross-sectional study.
Appl Environ Microbiol 72: 1027–1033.Nakamura N, Gaskins HR, Collier CT, et al. (2009) Molecular
ecological analysis of fecal bacterial populations from term
infants fed formula supplemented with selected blends of
prebiotics. Appl Environ Microbiol 75: 1121–1128.Ott SJ, Musfeldt M, Timmis KN, Hampe J, Wenderoth DF &
Schreiber S (2004) In vitro alterations of intestinal bacterial
microbiota in fecal samples during storage. Diagn Microbiol
Infect Dis 50: 237–245.Palmer C, Bik EM, DiGiulio DB, Relman DA & Brown PO
(2007) Development of the human infant intestinal
microbiota. PLoS Biol 5: 1556–1573.Roesch LF, Casella G, Simell O, Krischer J, Wasserfall CH,
Schatz D, Atkinson MA, Neu J & Triplett EW (2009)
Influence of fecal sample storage on bacterial community
diversity. Open Microbiol J 3: 40–46.Salonen A, Nikkila J, Jalanka-Tuovinen J, Immonen O, Rajilic-
Stojanovic M, Kekkonen RA, Palva A & de Vos WM (2010)
Comparative analysis of fecal DNA extraction methods with
phylogenetic microarray: effective recovery of bacterial and
archaeal DNA using mechanical cell lysis. J Microbiol
Methods 81: 127–134.Santacruz A, Marcos A, Warnberg J, et al. (2009) Interplay
between weight loss and gut microbiota composition in
overweight adolescents. Obesity 17: 1906–1915.Santacruz A, Collado MC, Garcıa-Valdes L, et al. (2010) Gut
microbiota composition is associated with body weight,
weight gain and biochemical parameters in pregnant
women. Br J Nutr 104: 83–92.Schwiertz A, Taras D, Schafer K, Beijer S, Bos NA, Donus C &
Hardt PD (2010) Microbiota and SCFA in lean and
overweight healthy subjects. Obesity 18: 190–195.Stark PL & Lee A (1982) The microbial ecology of the large
bowel of breast-fed and formula-fed infants during the first
year of life. J Med Microbiol 15: 189–203.Turnbaugh PJ, Ley RE, Mahowald MA, Magrini V, Mardis ER
& Gordon JI (2006) An obesity-associated gut microbiome
with increased capacity for energy harvest. Nature 444:
1027–1031.
FEMS Microbiol Ecol 79 (2012) 697–708 ª 2011 Federation of European Microbiological SocietiesPublished by Blackwell Publishing Ltd. All rights reserved
DNA-extraction affects human fecal microbiota results 707
FISH (data not shown). The numbers of Atopobium
group bacteria were 5–6 log units higher in a sample that
was initially stored at 4 °C for 2 days and thereafter at
�70 °C and when DNA-extraction was performed
mechanically (3 9 60 s) than on the same sample that
was stored at �70 °C and the DNA-extraction was per-
formed enzymatically. There was no clear explanation for
this phenomenon in the literature. The only possibly rele-
vant finding was that Collinsella spp. cell wall contains a
unique A4b-type peptidoglycan (Kageyama et al., 1999).
Therefore it is possible that the cell wall structure is
extremely difficult to lyse without the extra stress of stor-
age at 4 °C. However, these results may explain, why in
some studies the Atopobium group bacteria are not con-
sidered to be part of the normal dominant microbiota
(Eckburg et al., 2005), whereas in others, especially those
conducted with FISH, Atopobium group bacteria are
shown to constitute 1–8% of the total population of the
human gut microbiota (Harmsen et al., 2000a; Matsuki
et al., 2004; Lay et al., 2005; Mueller et al., 2006).
In conclusion, rigorous mechanical lysis enables detec-
tion of higher bacterial numbers and diversity from
human fecal samples. As it was shown that the results of
clostridial and actinobacterial populations are highly
dependent on the DNA-extraction methods applied, the
use of different DNA-extraction protocols may partly
explain the contradictory results previously obtained in
regard of obesity related and infant microbiota.
Acknowledgements
This study was supported by EU-funded projects TOR-
NADO (FP7-KBBE-222720) and ETHERPATHS (FP7-
KBBE-222639), TEKES funded FIBREFECTS and by the
Portuguese Foundation for Science and Technology, refer-
ence SFRH/BD/40920/2007. Ms Marja-Liisa Jalovaara and
Ms Tiina Hyytiainen are greatly acknowledged for their
excellent technical assistance.
References
Altschul SF, Gish W, Miller W, Myers EW & Lipman DJ
(1990) Basic local alignment search tool. J Mol Biol 215:
403–410.Ariefdjohan MW, Savaiano DA & Nakatsu CH (2010)
Comparison of DNA extraction kits for PCR-DGGE analysis
of human intestinal microbial communities from fecal
specimens. Nutr J 9: 23.
Armougom F, Henry M, Vialettes B, Raccah D & Raoult D
(2009) Monitoring bacterial community of human gut
microbiota reveals an increase in Lactobacillus in obese
patients and methanogens in anorexic patients. PLoS ONE
4: e7125.
Arumugam M, Raes J, Pelletier E, et al. (2011) Enterotypes of
the human gut microbiome. Nature 473: 174–180.Balamurugan R, George G, Kabeerdoss J, Hepsiba J,
Chandragunasekaran AMS & Ramakrishna BS (2010)
Quantitative differences in intestinal Faecalibacterium
prausnitzii in obese Indian children. Br J Nutr 103: 335–338.Bullen CL, Tearle PV & Willis AT (1976) Bifidobacteria in the
intestinal tract of infants: an in vivo study. J Med Microbiol
9: 325–333.Cole JR, Wang Q, Cardenas E, et al. (2009) The Ribosomal
Database Project: improved alignments and new tools for
rRNA analysis. Nucleic Acids Res 37: D141–D145.Collado MC, Isolauri E, Laitinen K & Salminen S (2008)
Distinct composition of gut microbiota during pregnancy in
overweight and normal-weight women. Am J Clin Nutr 88:
894–899.Collins MD, Lawson PA, Willems A, Cordoba JJ, Fernandez-
Garayzabal J, Garcia P, Cai J, Hippe H & Farrow JAE
(1994) The phylogeny of the genus Clostridium: proposal of
five new genera and eleven new species combinations. Int J
Syst Bacteriol 44: 812–826.Dridi B, Henry M, El Khechine A, Raoult D & Drancourt M
(2009) High prevalence of Methanobrevibacter smithii and
Methanosphaera stadtmanae detected in the human gut
using an improved DNA detection protocol. PLoS ONE 4:
e7063.
Duncan SH & Flint HJ (2008) Proposal of a neotype strain
(A1-86) for Eubacterium rectale. Request for an Opinion. Int
J Syst Evol Microbiol 58: 1735–1736.Duncan SH, Belenguer A, Holtrop G, Johnstone AM, Flint HJ
& Lobley GE (2007) Reduced dietary intake of
carbohydrates by obese subjects results in decreased
concentrations of butyrate and butyrate-producing bacteria
in feces. Appl Environ Microbiol 73: 1073–1078.Duncan SH, Lobley GE, Holtrop G, Ince J, Johnstone AM,
Louis P & Flint HJ (2008) Human colonic microbiota
associated with diet, obesity and weight loss. Int J Obes 32:
1720–1724.Eckburg PB, Bik EM, Bernstein CN, Purdom E, Dethlefsen L,
Sargent M, Gill SR, Nelson KE & Relman DA (2005)
Microbiology: diversity of the human intestinal microbial
flora. Science 308: 1635–1638.Fallani M, Young D, Scott J, et al. (2010) Intestinal microbiota
of 6-week-old infants across Europe: geographic influence
beyond delivery mode, breast-feeding, and antibiotics.
J Pediatr Gastroenterol Nutr 51: 77–84.Favier CF, Vaughan EE, De Vos WM & Akkermans ADL
(2002) Molecular monitoring of succession of bacterial
communities in human neonates. Appl Environ Microbiol 68:
219–226.Gill SR, Pop M, DeBoy RT, Eckburg PB, Turnbaugh PJ,
Samuel BS, Gordon JI, Relman DA, Fraser-Liggett CM &
Nelson KE (2006) Metagenomic analysis of the human
distal gut microbiome. Science 312: 1355–1359.Harmsen HJM, Wildeboer-Veloo ACM, Grijpstra J, Knol J,
Degener JE & Welling GW (2000a) Development of 16S
ª 2011 Federation of European Microbiological Societies FEMS Microbiol Ecol 79 (2012) 697–708Published by Blackwell Publishing Ltd. All rights reserved
706 J. Maukonen et al.
V/11
rRNA-based probes for the Coriobacterium group and the
Atopobium cluster and their application for enumeration of
Coriobacteriaceae in human feces from volunteers of
different age groups. Appl Environ Microbiol 66: 4523–4527.Harmsen HJM, Wildeboer-Veloo ACM, Raangs GC,
Wagendorp AA, Klijn N, Bindels JG & Welling GW (2000b)
Analysis of intestinal flora development in breast-fed and
formula-fed infants by using molecular identification and
detection methods. J Pediatr Gastroenterol Nutr 30: 61–67.Kageyama A, Benno Y & Nakase T (1999) Phylogenetic and
phenotypic evidence for the transfer of Eubacterium
aerofaciens to the genus Collinsella as Collinsella aerofaciens
gen. nov., comb. nov. Int J Syst Bacteriol 49: 557–565.Lauber CL, Zhou N, Gordon JI, Knight R & Fierer N (2010)
Effect of storage conditions on the assessment of bacterial
community structure in soil and human-associated samples.
FEMS Microbiol Lett 307: 80–86.Lay C, Rigottier-Gois L, Holmstrøm K, et al. (2005) Colonic
microbiota signatures across five northern European
countries. Appl Environ Microbiol 71: 4153–4155.Ley RE, Backhed F, Turnbaugh P, Lozupone CA, Knight RD &
Gordon JI (2005) Obesity alters gut microbial ecology. P
Natl Acad Sci USA 102: 11070–11075.Ley RE, Turnbaugh PJ, Klein S & Gordon JI (2006) Microbial
ecology: human gut microbes associated with obesity.
Nature 444: 1022–1023.Li M, Gong J, Cottrill M, Yu H, De Lange C, Burton J &
Topp E (2003) Evaluation of QIAamp® DNA Stool Mini
Kit for ecological studies of gut microbiota. J Microbiol
Methods 54: 13–20.Magne F, Hachelaf W, Suau A, Boudraa G, Mangin I,
Touhami M, Bouziane-Nedjadi K & Pochart P (2006) A
longitudinal study of infant faecal microbiota during
weaning. FEMS Microbiol Ecol 58: 563–571.Mai V, McCrary QM, Sinha R & Glei M (2009) Associations
between dietary habits and body mass index with gut
microbiota composition and fecal water genotoxicity: an
observational study in African American and Caucasian
American volunteers. Nutr J 8: 49.
Matsuki T, Watanabe K, Fujimoto J, Takada T & Tanaka R
(2004) Use of 16S rRNA gene-targeted group-specific
primers for real-time PCR analysis of predominant bacteria
in human feces. Appl Environ Microbiol 70: 7220–7228.Matto J, Maunuksela L, Kajander K, Palva A, Korpela R,
Kassinen A & Saarela M (2005) Composition and temporal
stability of gastrointestinal microbiota in irritable bowel
syndrome – A longitudinal study in IBS and control
subjects. FEMS Immunol Med Microbiol 43: 213–222.Maukonen J, Saarela M & Raaska L (2006a)
Desulfovibrionales-related bacteria in a paper mill
environment as detected with molecular techniques and
culture. J Ind Microbiol Biotechnol 33: 45–54.Maukonen J, Matto J, Satokari R, Soderlund H, Mattila-
Sandholm T & Saarela M (2006b) PCR DGGE and RT-PCR
DGGE show diversity and short-term temporal stability in
the Clostridium coccoides-Eubacterium rectale group in the
human intestinal microbiota. FEMS Microbiol Ecol 58: 517–528.
Maukonen J, Matto J, Suihko M & Saarela M (2008) Intra-
individual diversity and similarity of salivary and faecal
microbiota. J Med Microbiol 57: 1560–1568.McOrist AL, Jackson M & Bird AR (2002) A comparison of
five methods for extraction of bacterial DNA from human
faecal samples. J Microbiol Methods 50: 131–139.Molbak L, Sommer HM, Johnsen K, Boye M, Johansen M,
Møller K & Leser TD (2006) Freezing at �80°C distorts the
DNA composition of bacterial communities in intestinal
samples. Curr Issues Intest Microbiol 7: 29–34.Mueller S, Saunier K, Hanisch C, et al. (2006) Differences in
fecal microbiota in different European study populations in
relation to age, gender, and country: a cross-sectional study.
Appl Environ Microbiol 72: 1027–1033.Nakamura N, Gaskins HR, Collier CT, et al. (2009) Molecular
ecological analysis of fecal bacterial populations from term
infants fed formula supplemented with selected blends of
prebiotics. Appl Environ Microbiol 75: 1121–1128.Ott SJ, Musfeldt M, Timmis KN, Hampe J, Wenderoth DF &
Schreiber S (2004) In vitro alterations of intestinal bacterial
microbiota in fecal samples during storage. Diagn Microbiol
Infect Dis 50: 237–245.Palmer C, Bik EM, DiGiulio DB, Relman DA & Brown PO
(2007) Development of the human infant intestinal
microbiota. PLoS Biol 5: 1556–1573.Roesch LF, Casella G, Simell O, Krischer J, Wasserfall CH,
Schatz D, Atkinson MA, Neu J & Triplett EW (2009)
Influence of fecal sample storage on bacterial community
diversity. Open Microbiol J 3: 40–46.Salonen A, Nikkila J, Jalanka-Tuovinen J, Immonen O, Rajilic-
Stojanovic M, Kekkonen RA, Palva A & de Vos WM (2010)
Comparative analysis of fecal DNA extraction methods with
phylogenetic microarray: effective recovery of bacterial and
archaeal DNA using mechanical cell lysis. J Microbiol
Methods 81: 127–134.Santacruz A, Marcos A, Warnberg J, et al. (2009) Interplay
between weight loss and gut microbiota composition in
overweight adolescents. Obesity 17: 1906–1915.Santacruz A, Collado MC, Garcıa-Valdes L, et al. (2010) Gut
microbiota composition is associated with body weight,
weight gain and biochemical parameters in pregnant
women. Br J Nutr 104: 83–92.Schwiertz A, Taras D, Schafer K, Beijer S, Bos NA, Donus C &
Hardt PD (2010) Microbiota and SCFA in lean and
overweight healthy subjects. Obesity 18: 190–195.Stark PL & Lee A (1982) The microbial ecology of the large
bowel of breast-fed and formula-fed infants during the first
year of life. J Med Microbiol 15: 189–203.Turnbaugh PJ, Ley RE, Mahowald MA, Magrini V, Mardis ER
& Gordon JI (2006) An obesity-associated gut microbiome
with increased capacity for energy harvest. Nature 444:
1027–1031.
FEMS Microbiol Ecol 79 (2012) 697–708 ª 2011 Federation of European Microbiological SocietiesPublished by Blackwell Publishing Ltd. All rights reserved
DNA-extraction affects human fecal microbiota results 707
V/12 PB
Turnbaugh PJ, Hamady M, Yatsunenko T, et al. (2009) A core
gut microbiome in obese and lean twins. Nature 457: 480–484.
Wang Q, Garrity GM, Tiedje JM & Cole JR (2007) Naıve
Bayesian classifier for rapid assignment of rRNA sequences
into the new bacterial taxonomy. Appl Environ Microbiol 73:
5261–5267.Zhang H, DiBaise JK, Zuccolo A, et al. (2009) Human gut
microbiota in obesity and after gastric bypass. P Natl Acad
Sci USA 106: 2365–2370.Zoetendal EG, Ben-Amor K, Akkermans ADL, Abee T & De
Vos WM (2001) DNA isolation protocols affect the
detection limit of PCR approaches of bacteria in samples
from the human gastrointestinal tract. Syst Appl Microbiol
24: 405–410.
Supporting Information
Additional Supporting Information may be found in the
online version of this article:
Fig. S1. The cloned and sequenced bands from the Clos-
tridium leptum group-specific PCR-DGGE of the subject
B1 (n.d. = the clone is not visible in the community pro-
file).
Fig. S2. The cloned and sequenced bands from the Clos-
tridium leptum group-specific PCR-DGGE of the subject
B2 (n.d. = the clone is not visible in the community pro-
file).
Fig. S3. The cloned and sequenced bands from the genus
Bacteroides-specific PCR-DGGE of the subject B1 (n.d.
= the clone is not visible in the community profile).
Fig. S4. The cloned and sequenced bands from the genus
Bacteroides-specific PCR-DGGE of the subject B2 (n.d.
= the clone is not visible in the community profile).
Fig. S5. Clustering of Erec-group DGGE profiles of both
subjects after different storage – DNA-extraction combi-
nations.
Fig. S6. Rarefaction curves of different clones per sample.
Fig. S7. Clustering of Clept-group DGGE profiles of both
subjects after different storage – DNA-extraction combi-
nations.
Fig. S8. Difference in numbers of Bacteroides spp. after all
different storage combinations and mechanical DNA-
extraction.
Table S1. Bacterial pure cultures used in this study for
optimization of group-specific PCR-DGGEs and real-time
PCR methods.
Table S2. Primers used in the present study.
Please note: Wiley-Blackwell is not responsible for the
content or functionality of any supporting materials sup-
plied by the authors. Any queries (other than missing
material) should be directed to the corresponding author
for the article.
ª 2011 Federation of European Microbiological Societies FEMS Microbiol Ecol 79 (2012) 697–708Published by Blackwell Publishing Ltd. All rights reserved
708 J. Maukonen et al.
1
Maukonen et al. FEMS Microbiol Ecol 2012, 79, 697-708. Supplementary information
Table S1. Bacterial pure cultures used in this study for optimization of group-specific PCR-DGGEs and real-time PCR methods.
Table S2. Primers used in the present study.
Figure S1. The cloned and sequenced bands from the Clostridium leptum group specific PCR-DGGE of the subject B1 (n.d. = the clone is not visible in the community profile).
Figure S2. The cloned and sequenced bands from the Clostridium leptum group specific PCR-DGGE of the subject B2 (n.d. = the clone is not visible in the community profile)
Figure S3. The cloned and sequenced bands from the genus Bacteroides specific PCR-DGGE of the subject B1 (n.d. = the clone is not visible in the community profile).
Figure S4. The cloned and sequenced bands from the genus Bacteroides specific PCR-DGGE of the subject B2 (n.d. = the clone is not visible in the community profile).
Figure S5. Clustering of Erec-group DGGE-profiles of both subjects after different storage – DNA-extraction combinations. Only one of the replicate samples was included in the presented clustering.
Figure S6. Rarefaction curves of different clones per sample
Figure S7. Clustering of Clept-group DGGE-profiles of both subjects after different storage – DNA-extraction combinations.
Figure S8. Difference in numbers of Bacteroides spp. after all different storage combinations and mechanical DNA-extraction. The results are expressed as log-values (fresh – storage; i.e. positive numbers indicate higher numbers in fresh samples.
Supplementary references
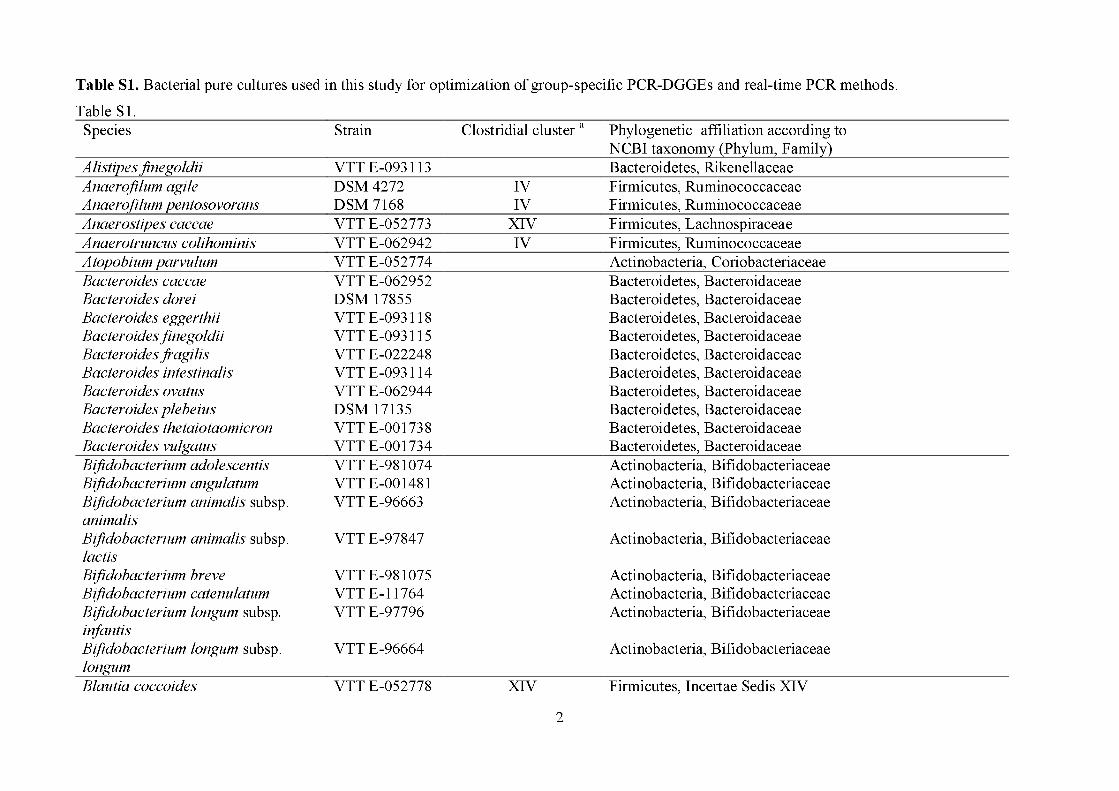
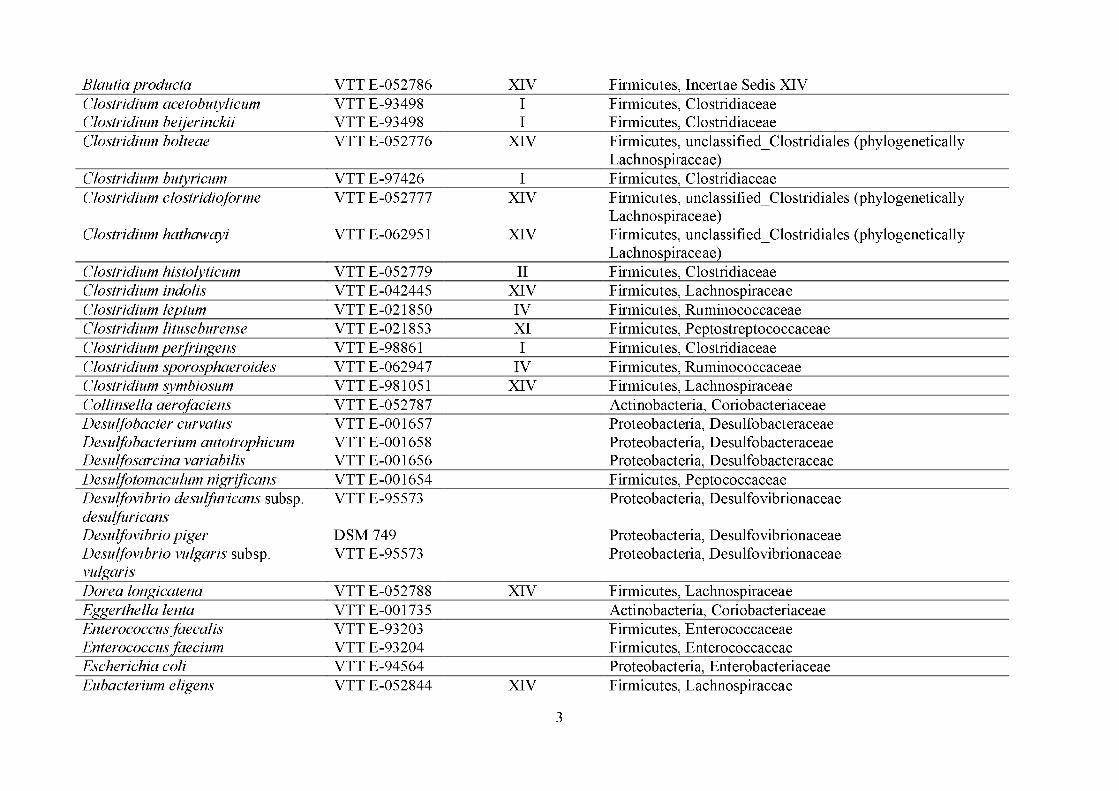
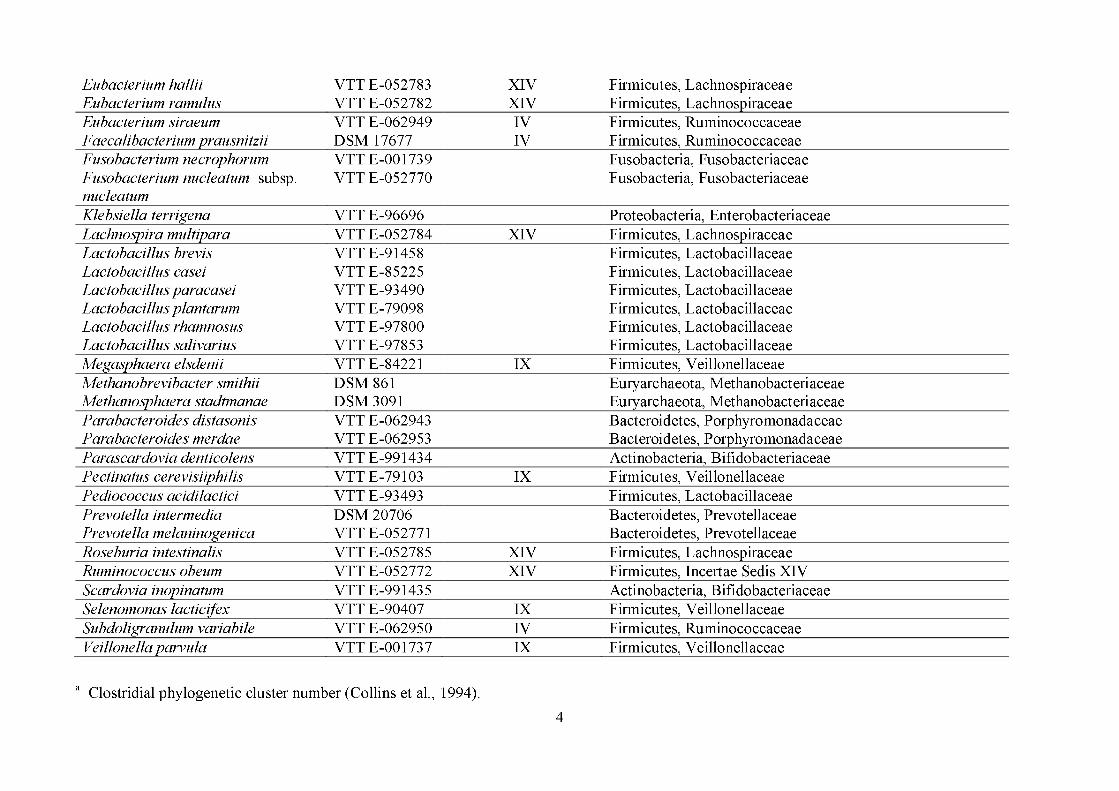
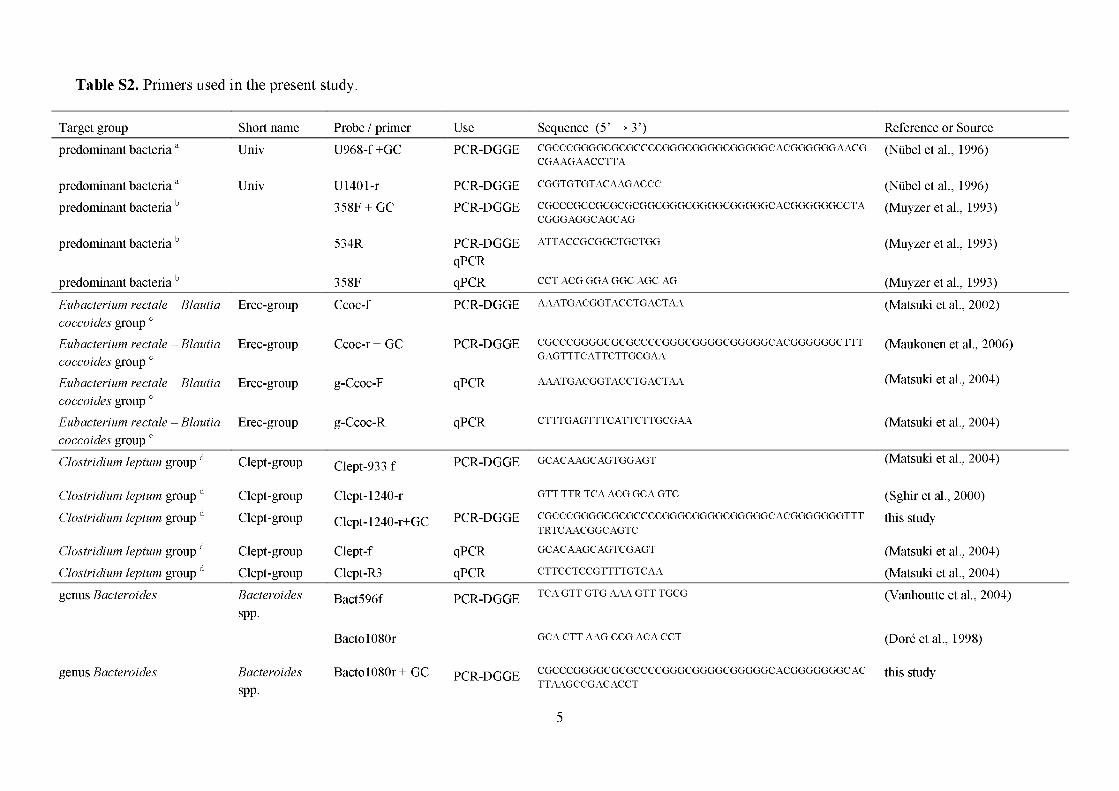
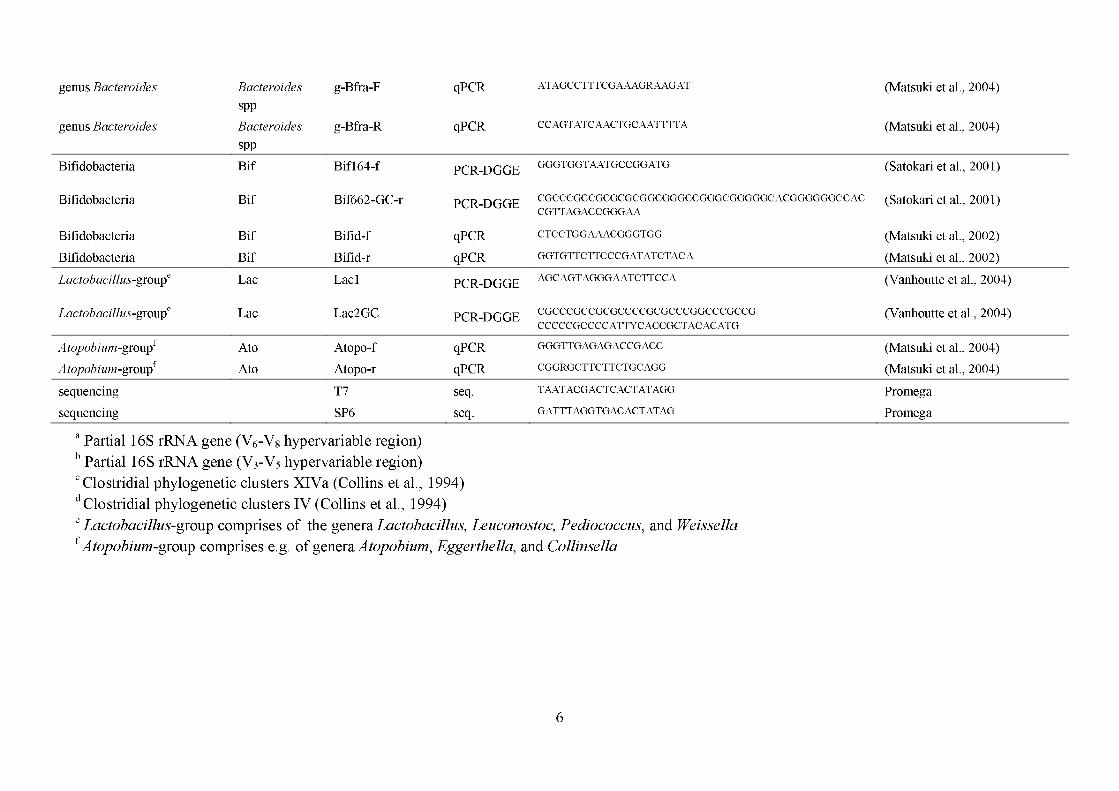
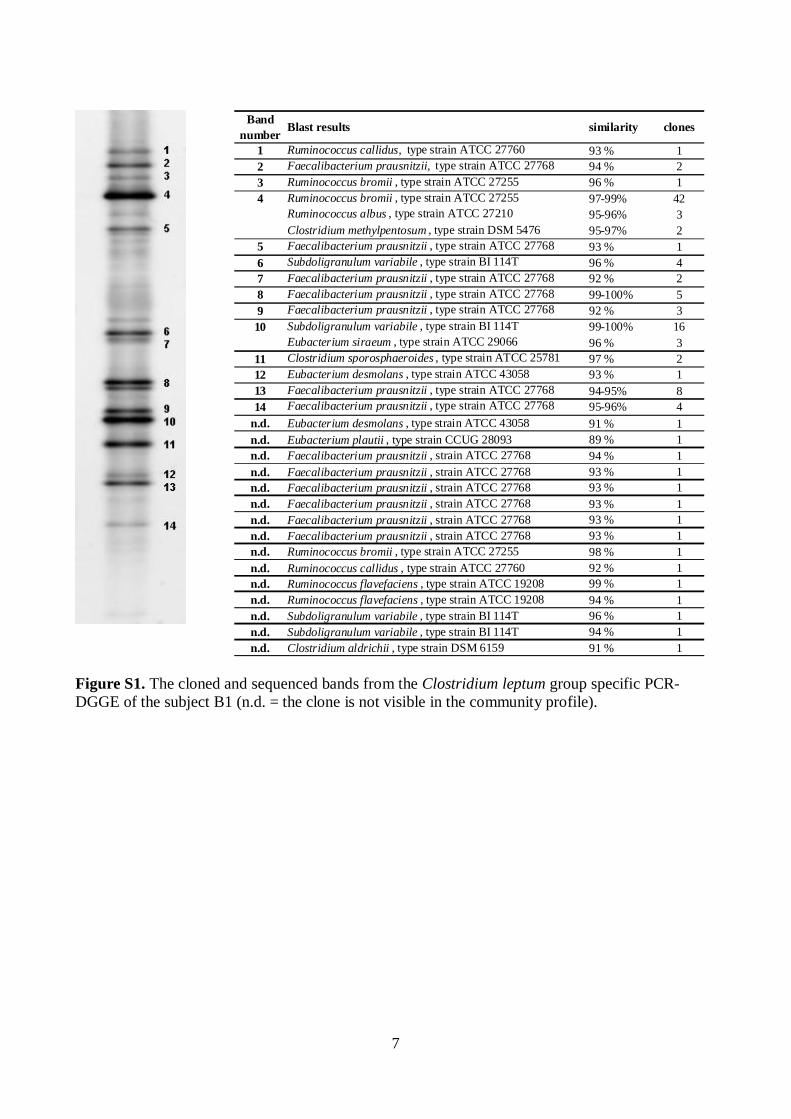
7
Figure S1. The cloned and sequenced bands from the Clostridium leptum group specific PCR-DGGE of the subject B1 (n.d. = the clone is not visible in the community profile).
Bandnumber
1 Ruminococcus callidus, type strain ATCC 27760 93 % 12 Faecalibacterium prausnitzii, type strain ATCC 27768 94 % 23 Ruminococcus bromii , type strain ATCC 27255 96 % 14 Ruminococcus bromii , type strain ATCC 27255 97-99% 42
Ruminococcus albus , type strain ATCC 27210 95-96% 3Clostridium methylpentosum , type strain DSM 5476 95-97% 2
5 Faecalibacterium prausnitzii , type strain ATCC 27768 93 % 16 Subdoligranulum variabile , type strain BI 114T 96 % 47 Faecalibacterium prausnitzii , type strain ATCC 27768 92 % 28 Faecalibacterium prausnitzii , type strain ATCC 27768 99-100% 59 Faecalibacterium prausnitzii , type strain ATCC 27768 92 % 310 Subdoligranulum variabile , type strain BI 114T 99-100% 16
Eubacterium siraeum , type strain ATCC 29066 96 % 311 Clostridium sporosphaeroides , type strain ATCC 25781 97 % 212 Eubacterium desmolans , type strain ATCC 43058 93 % 113 Faecalibacterium prausnitzii , type strain ATCC 27768 94-95% 814 Faecalibacterium prausnitzii , type strain ATCC 27768 95-96% 4
n.d. Eubacterium desmolans , type strain ATCC 43058 91 % 1n.d. Eubacterium plautii , type strain CCUG 28093 89 % 1n.d. Faecalibacterium prausnitzii , strain ATCC 27768 94 % 1n.d. Faecalibacterium prausnitzii , strain ATCC 27768 93 % 1n.d. Faecalibacterium prausnitzii , strain ATCC 27768 93 % 1n.d. Faecalibacterium prausnitzii , strain ATCC 27768 93 % 1n.d. Faecalibacterium prausnitzii , strain ATCC 27768 93 % 1n.d. Faecalibacterium prausnitzii , strain ATCC 27768 93 % 1n.d. Ruminococcus bromii , type strain ATCC 27255 98 % 1n.d. Ruminococcus callidus , type strain ATCC 27760 92 % 1n.d. Ruminococcus flavefaciens , type strain ATCC 19208 99 % 1n.d. Ruminococcus flavefaciens , type strain ATCC 19208 94 % 1n.d. Subdoligranulum variabile , type strain BI 114T 96 % 1n.d. Subdoligranulum variabile , type strain BI 114T 94 % 1n.d. Clostridium aldrichii , type strain DSM 6159 91 % 1
Blast results similarity clones
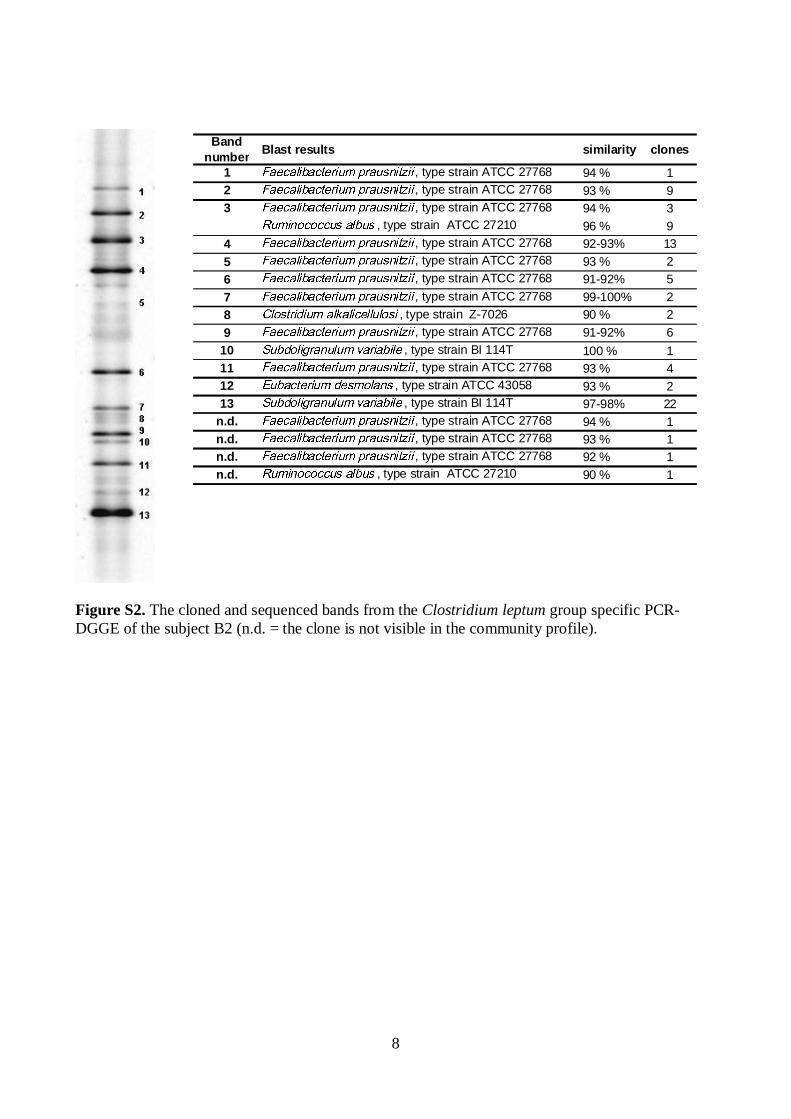
8
Figure S2. The cloned and sequenced bands from the Clostridium leptum group specific PCR-DGGE of the subject B2 (n.d. = the clone is not visible in the community profile).
Bandnumber
1 , type strain ATCC 27768 94 % 12 , type strain ATCC 27768 93 % 93 , type strain ATCC 27768 94 % 3
, type strain ATCC 27210 96 % 94 , type strain ATCC 27768 92-93% 135 , type strain ATCC 27768 93 % 26 , type strain ATCC 27768 91-92% 57 , type strain ATCC 27768 99-100% 28 , type strain Z-7026 90 % 29 , type strain ATCC 27768 91-92% 6
10 , type strain BI 114T 100 % 111 , type strain ATCC 27768 93 % 412 , type strain ATCC 43058 93 % 213 , type strain BI 114T 97-98% 22
n.d. , type strain ATCC 27768 94 % 1n.d. , type strain ATCC 27768 93 % 1n.d. , type strain ATCC 27768 92 % 1n.d. , type strain ATCC 27210 90 % 1
clonesBlast results similarity
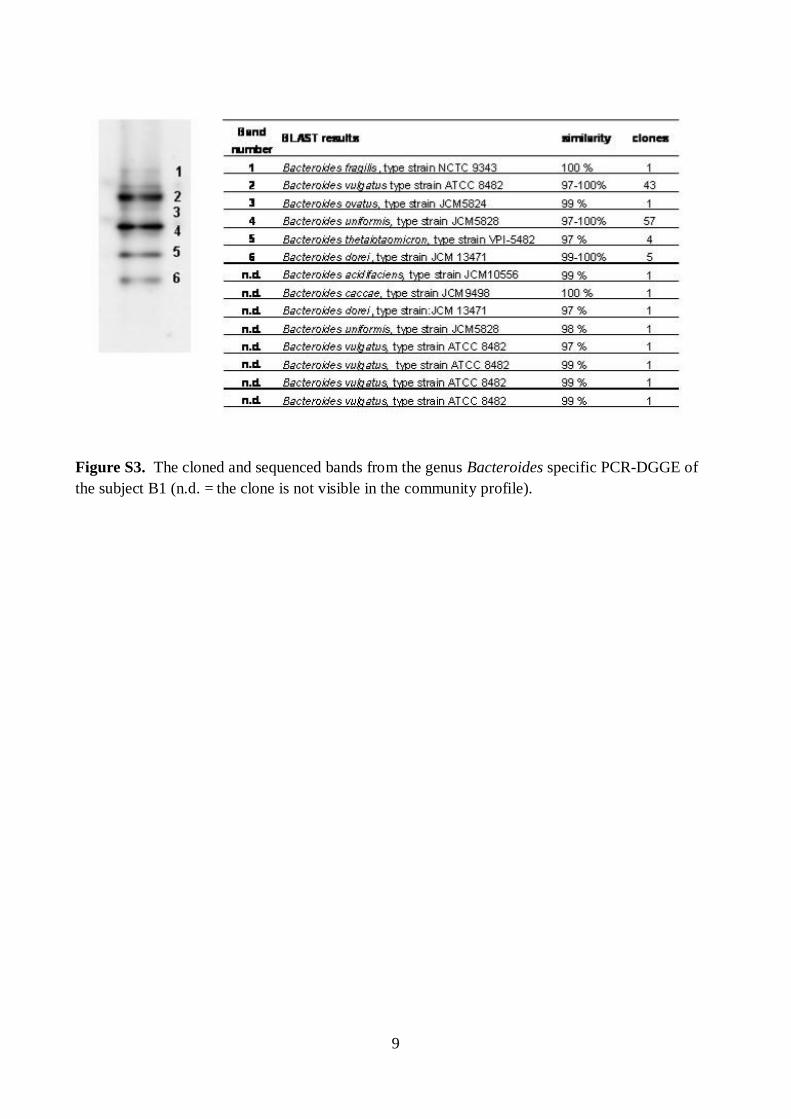
9
Figure S3. The cloned and sequenced bands from the genus Bacteroides specific PCR-DGGE of the subject B1 (n.d. = the clone is not visible in the community profile).
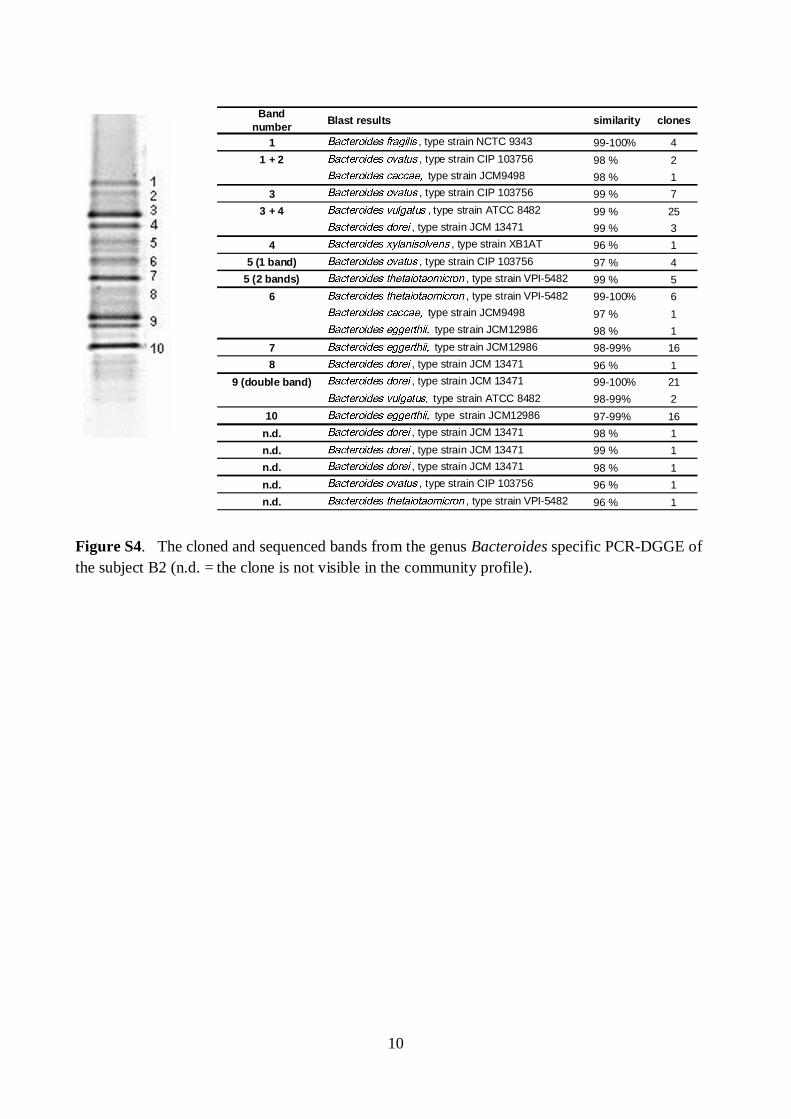
10
Figure S4. The cloned and sequenced bands from the genus Bacteroides specific PCR-DGGE of the subject B2 (n.d. = the clone is not visible in the community profile).
Bandnumber
1 , type strain NCTC 9343 99-100% 41 + 2 , type strain CIP 103756 98 % 2
type strain JCM9498 98 % 13 , type strain CIP 103756 99 % 7
3 + 4 , type strain ATCC 8482 99 % 25, type strain JCM 13471 99 % 3
4 , type strain XB1AT 96 % 15 (1 band) , type strain CIP 103756 97 % 4
5 (2 bands) , type strain VPI-5482 99 % 56 , type strain VPI-5482 99-100% 6
type strain JCM9498 97 % 1type strain JCM12986 98 % 1
7 type strain JCM12986 98-99% 168 , type strain JCM 13471 96 % 1
9 (double band) , type strain JCM 13471 99-100% 21type strain ATCC 8482 98-99% 2
10 type strain JCM12986 97-99% 16n.d. , type strain JCM 13471 98 % 1n.d. , type strain JCM 13471 99 % 1n.d. , type strain JCM 13471 98 % 1n.d. , type strain CIP 103756 96 % 1n.d. , type strain VPI-5482 96 % 1
Blast results similarity clones

11
Figure S5. Clustering of Erec-group DGGE-profiles of both subjects after different storage – DNA-extraction combinations. Only one of the replicate samples was included in the presented clustering.
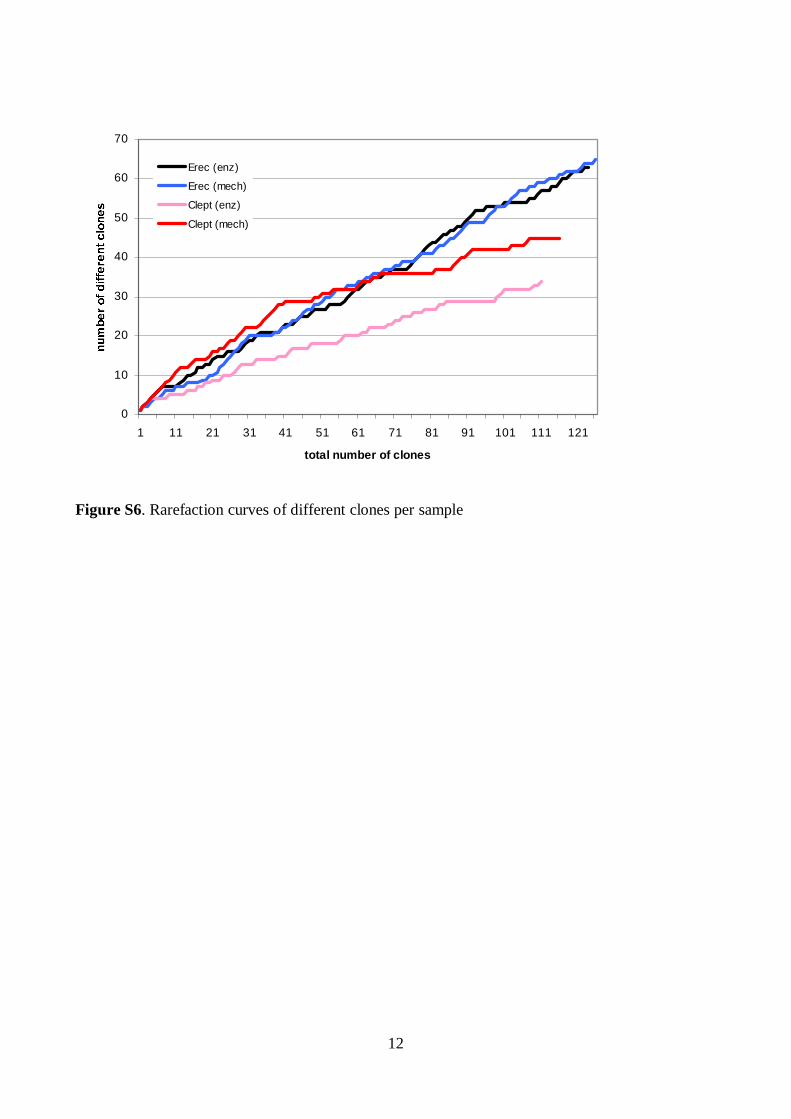
12
0
10
20
30
40
50
60
70
1 11 21 31 41 51 61 71 81 91 101 111 121
total number of clones
Erec (enz)
Erec (mech)
Clept (enz)
Clept (mech)
Figure S6. Rarefaction curves of different clones per sample
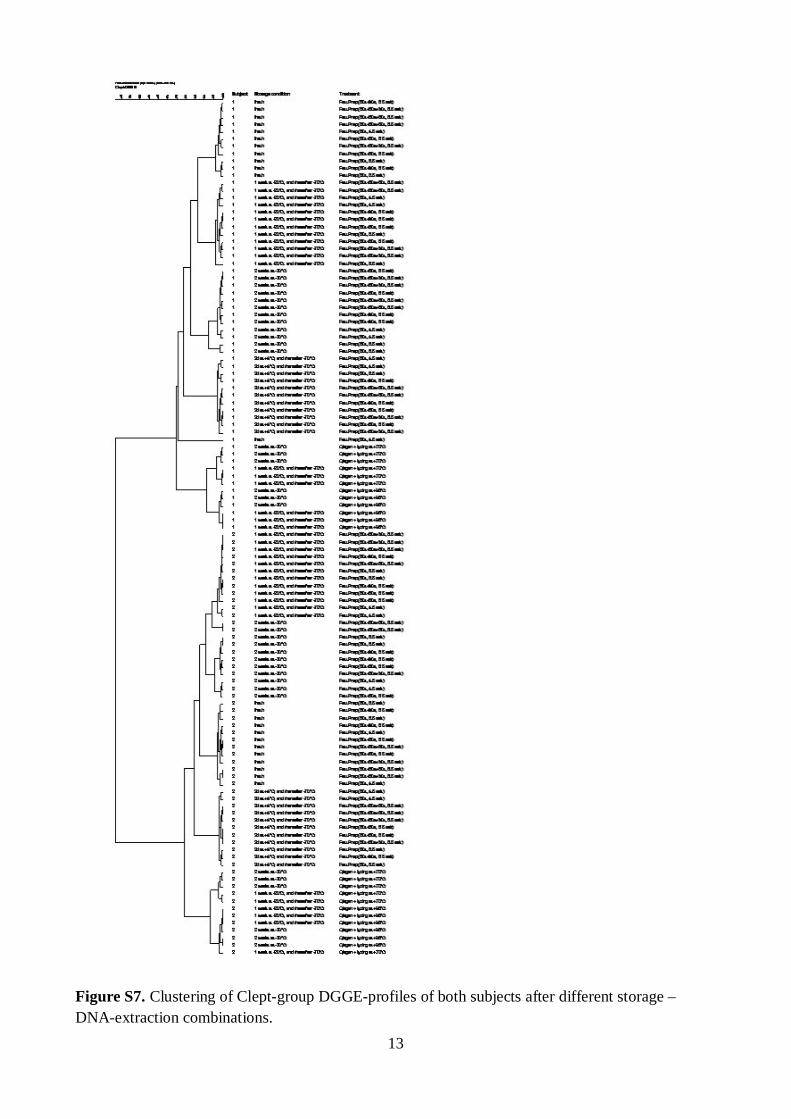
13
Figure S7. Clustering of Clept-group DGGE-profiles of both subjects after different storage – DNA-extraction combinations.
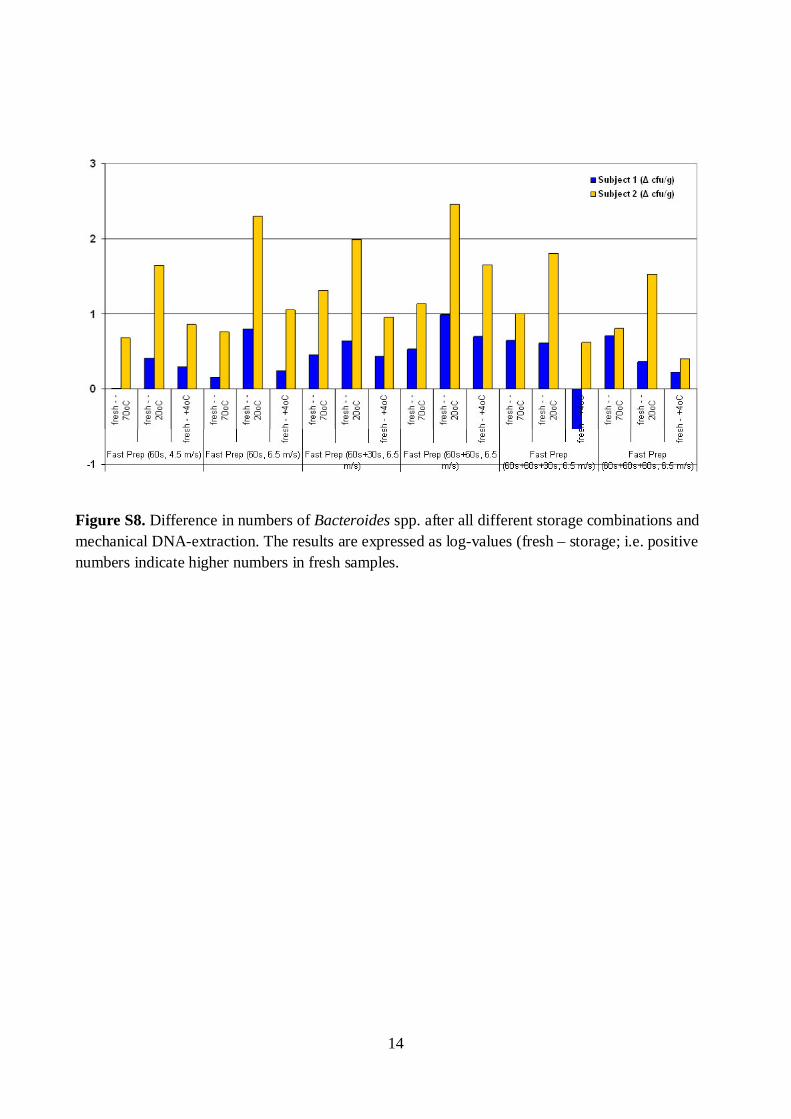
14
Figure S8. Difference in numbers of Bacteroides spp. after all different storage combinations and mechanical DNA-extraction. The results are expressed as log-values (fresh – storage; i.e. positive numbers indicate higher numbers in fresh samples.
15
Supplementary references
Collins MD, Lawson PA, Willems A, Cordoba JJ, Fernandez-Garayzabal J, Garcia P, Cai J, Hippe H & Farrow JAE (1994) The phylogeny of the genus Clostridium: Proposal of five new genera and eleven new species combinations. Int J Syst Bacteriol 44: 812-826.
Doré J, Schir A, Hannequart-Gramet G, Corthier G & Pochart P (1998) Design and evaluation of a 16S rRNA-Targeted oligonucleotide probe for specific detection and quantitation of human faecal Bacteroides populations. Syst Appl Microbiol 21: 65-71.
Matsuki T, Watanabe K, Fujimoto J, Takada T & Tanaka R (2004) Use of 16S rRNA gene-targeted group-specific primers for real-time PCR analysis of predominant bacteria in human feces. Appl Environ Microbiol 70: 7220-7228.
Matsuki T, Watanabe K, Fujimoto J, Miyamoto Y, Takada T, Matsumoto K, Oyaizu H & Tanaka R (2002) Development of 16S rRNA-gene-targeted group-specific primers for the detection and identification of predominant bacteria in human feces. Appl Environ Microbiol 68: 5445-5451.
Maukonen J, Mättö J, Satokari R, Söderlund H, Mattila-Sandholm T & Saarela M (2006) PCR DGGE and RT-PCR DGGE show diversity and short-term temporal stability in the Clostridium coccoides-Eubacterium rectale group in the human intestinal microbiota. FEMS Microbiol Ecol 58:517-528.
Muyzer G, De Waal EC & Uitterlinden AG (1993) Profiling of complex microbial populations by denaturing gradient gel electrophoresis analysis of polymerase chain reaction-amplified genes coding for 16S rRNA. Appl Environ Microbiol 59: 695-700.
Nübel U, Engelen B, Felsre A, Snaidr J, Wieshuber A, Amann RI, Ludwig W & Backhaus H (1996) Sequence heterogeneities of genes encoding 16S rRNAs in Paenibacillus polymyxa detected by temperature gradient gel electrophoresis. J Bacteriol 178: 5636-5643.
Satokari RM, Vaughan EE, Akkermans ADL, Saarela M & De Vos WM (2001) Bifidobacterialdiversity in human feces detected by genus-specific PCR and denaturing gradient gel electrophoresis. Appl Environ Microbiol 67: 504-513.
Sghir A, Gramet G, Suau A, Rochet V, Pochart P & Dore J (2000) Quantification of bacterial groups within human fecal flora by oligonucleotide probe hybridization. Appl Environ Microbiol66: 2263-2266.
Vanhoutte T, Huys G, De Brandt E & Swings J (2004) Temporal stability analysis of the microbiota in human feces by denaturing gradient gel electrophoresis using universal and group-specific 16S rRNA gene primers. FEMS Microbiol Ecol 48: 437-446.
Series title and number VTT Science 26
Title Characterization of the human predominant fecal microbiota With special focus on the Clostridial clusters IV and XIVa
Author(s) Johanna Maukonen
Abstract The human gut microbiota is considered to be a complex fermentor with a metabolic potential rivaling that of the liver. In addition to its primary function in digestion, the indigenous microbial community has an important influence on host physiological, nutritional and immunological processes. The primary aim of this study was to characterize human predominant fecal microbiota with a special focus on Clostridial clusters XIV (Lachnospi-raceae, Eubacterium rectale – Blautia coccoides group) and IV (Ruminococcaceae, Clostridium leptum group). The specific aims were: 1) To develop molecular methods for characterization of the human predominant fecal microbiota; 2) To assess the specificity, practicality, and usability of the developed methods for human fecal samples in healthy adults, elderly people, and people having IBS; 3) To assess possible confounding factors in the analysis of human fecal samples.
Molecular tools were developed for sensitive and highly specific characterization of the human predomi-nant fecal and salivary microbiota. DNA- and rRNA-based denaturing gradient gel electrophoresis methods (DGGE) were developed for Eubacterium rectale – Blautia coccoides group (Erec), rRNA-based DGGE method for predominant bacteria, and DNA-based DGGE methods for Clostridium leptum group (Clept) and Bacteroides spp. In addition, quantitative real-time PCR (qPCR) methods targeting predominant bacteria, Erec-group, Clept-group, Bacteroides spp., bifidobacteria, and Atopobium group were developed. Predominant bacterial, Erec-group, Clept-group, and Bacteroides spp. populations of healthy adults were temporally rather stable, showing intra-individual diversity and inter-individual variability. The rRNA-based profiles showed more temporal instability than DNA-based profiles. The enumerated clostridial groups (Erec, Clept, C. lituseburense, and C. histolyticum) represented the dominant fecal microbiota of most of the studied subjects, comprising altogether 29–87% of the total bacteria. Erec-group was the dominant group, accounting on average for 43% of total bacteria in control subjects, and 30% and 50% in irritable bowel syndrome (IBS) subjects affected by constipation and diarrhea, respectively. The observations indicated that in addition to temporal instability of the active predominant fecal bacterial population, clostridial microbiota may be involved in IBS. Differences in the predominant fecal microbiota between elderly people and younger adults were also assessed. Temporal stabilities of the studied bacterial populations (predominant bacteria, Erec-group, bifidobacteria, and lactobacil-li) were similar in both age groups. However, the diversity of predominant bacteria and Erec-group bacteria was significantly higher in elderly subjects as compared to younger adults. Consumption of probiotic yoghurt containing galacto-oligosaccharide (GOS) for three weeks did not significantly affect the diversity or temporal stability of the studied bacterial groups. However, the composite data set containing all DGGE analyses of the study showed that the microbial communities from the GOS-supplemented subjects were more similar to each other than those of the control subjects.
The similarity of the salivary and fecal microbiota was studied to assess whether the upper gastrointestinal tract microbiota influence the results obtained with DNA-based methods from feces. The predominant bacteria, bifidobacteria, and Erec-group bacteria of the oral cavity and feces were generally stable during probiotic con-sumption, showing more diversity in feces than in saliva and different species composi-tions for the two sampling sites. Lactobacilli, however, showed temporal instability in both feces and saliva. Furthermore, fecal and salivary samples contained identical indigenous Lactobacillus genotypes in most subjects.
The effects of storage conditions and DNA-extraction protocols of fecal samples on the results were also evaluated. The DNA-extraction did not affect the diversity, composition, or quantity of Bacteroides spp., whereas after one week’s storage at -20oC the numbers of Bacteroides spp. were 1.6–2.5 log-units lower. Furthermore, the numbers of predominant bacteria, Erec-group, Clept-group, bifidobacteria, and Atopobium-group were 0.5–4 log-units higher after mechanical DNA-extraction than after enzymatic DNA-extraction as detected with qPCR, regardless of the storage. The bacterial composition of Erec-group differed significantly depending on the DNA-extraction protocol;. According to the results, rigorous mechanical lysis leads to the detection of higher bacterial numbers and diversity from human fecal samples than enzymatic DNA-extraction. Since it was shown that the results of Clostridial and Actinobacterial populations are highly dependent on the DNA-extraction methods applied, the use of different DNA-extraction protocols may partly explain the contra-dictory results previously obtained in regard of obesity related and infant microbiota.
ISBN, ISSN ISBN 978-951-38-7954-9 (soft back ed.) ISSN 2242-119X (soft back ed.) ISBN 978-951-38-7955-6 (URL: http://www.vtt.fi/publications/index.jsp) ISSN 2242-1203 (URL: http://www.vtt.fi/publications/index.jsp)
Date November 2012
Language English, Finnish abstract
Pages 161 p. + app. 62 p.
Keywords human fecal microbiota, human salivary microbiota, DGGE, qPCR, IBS, elderly, GOS, DNA-extraction, Erec, Clept, Bacteroides spp., bifidobacteria, lactobacilli
Publisher VTT Technical Research Centre of Finland P.O. Box 1000, FI-02044 VTT, Finland, Tel. 020 722 111

Julkaisun sarja ja numero VTT Science 26
Nimeke Ihmisen vallitsevan ulostemikrobiston karakterisointi Painopiste erityisesti klostridien fylogeneettisissä ryhmissä IV ja XIVa
Tekijä(t) Johanna Maukonen
Tiivistelmä Suolistomikrobiston ensisijainen tehtävä on auttaa ruoansulatuksessa; paksusuolen mikrobit käyttävät hyödyk-seen useita ravintoaineita, jotka eivät imeydy ohutsuolessa. Ihminen puolestaan hyödyntää mikrobien aineen-vaihduntatuotteita. Suolistomikrobisto vaikuttaa ihmiseen monella muullakin tavoin: se edesauttaa immuunijär-jestelmän kehittymistä, tuottaa kaasuja sekä lyhytketjuisia rasvahappoja, muuttaa sappihappojen muotoa, tuottaa vitamiineja, ja muodostaa mahdollisesti myös mutageenisiä, toksisia sekä karsinogeenisiä yhdisteitä. Niinpä ihmisen suolistomikrobistolla on merkittävä vaikutus ihmisen fysiologisiin, ravitsemuksellisiin ja immuno-logisiin toimintoihin. Tämän tutkimuksen tavoitteena oli kehittää menetelmiä ihmisen suolistomikrobiston tärkeimpien bakteeriryhmien karakterisointiin ja kvantitointiin, sekä todentaa kehitettyjen menetelmien soveltu-vuus ihmisen uloste- ja sylkinäytteiden analysointiin.
Tässä työssä kehitettiin spesifiset ja herkät rRNA-pohjaiset PCR – denaturoiva gradientti geeli elektrofo-reesi (DGGE) -menetelmät vallitsevan bakteeriston ja Eubacterium rectale – Blautia coccoides -klostridiryhmän (Erec) karakterisointiin sekä DNA-pohjaiset PCR-DGGE menetelmät Clostridium leptum -klostridiryhmän (Clept), sekä Bacteroides-suvun karakterisointiin. Lisäksi kehitettiin reaaliaikaiset PCR-menetelmät (qPCR) vallitsevan bakteeriston, Erec-ryhmän, Clept-ryhmän, Bacteroides-suvun, bifidobakteerien ja Atopobium-ryhmän kvantitointiin. Terveiden aikuisten vallitseva bakteeriston, Erec-klostridiryhmän, Clept-klostridiryhmän sekä Bacteroides-suvun bakteeripopulaatiot olivat ajallisesti melko stabiileja. Bakteeripopulaatioprofiilit olivat monimuotoisia ja kullekin ihmiselle ominaisia. rRNA:han pohjautuvat bakteeriprofiilit olivat sekä terveillä aikuisilla että ärtyneen suolen oireyhtymästä (IBS) kärsivillä aikuisilla ajallisesti epästabiilimpia kuin DNA-pohjaiset bakteeriprofiilit. Lisäksi IBS-potilaiden rRNA-pohjaiset vallitsevan bakteeriston profiilit olivat ajallisesti epästabiilimpia kuin terveiden aikuisten. Tutkittujen klostridiryhmien (Erec, Clept, C. lituseburense –ryhmä sekä C. histolyticum –ryhmä) bakteerit muodostivat valtaosan (29–87 %) ulostemikrobistosta. Erec-ryhmän klostridit muodostivat keskimäärin 43 % terveiden aikuisten ulostemikrobistosta, kun taas IBS-potilailla Erec-ryhmän klostridit muodostivat 30 % (ummetustyyppi) tai 50 % (ripulityyppi) ulostemikrobistosta. Aikuisten ja vanhempi-en ihmisten (yli 60 v.) välillä ei ollut eroja tutkittujen bakteeriryhmien ajallisessa stabiilisuudessa (vallitseva bakteeristo, Erec- ryhmän klostridit, bifidobakteerit ja laktobasillit). Vanhempien ihmisten vallitseva bakteeristo sekä Erec-klostridiryhmä olivat kuitenkin monimuotoisempia kuin nuorempien aikuisten.
Koska DNA-pohjaisilla menetelmillä voitaisiin periaatteessa detektoida ulosteesta myös sylkibakteereita, tutkimuksesssa selvitettiin myös löytyykö syljestä samoja bakteereita kuin ulosteesta. Sekä syljen että ulosteen vallitseva bakteeristo, Erec-ryhmän klostridit, bifidobakteeri- ja laktobasillipopulaatiot pysyivät melko stabiileina probiootti-syöttöjakson aikana. Ulostenäytteiden bakteeripopulaatiot olivat monimuotoisempia kuin syljen bakteeripopulaatiot. Lisäksi näiden bakteerisuvut/lajit olivat pääasiallisesti erilaisia. Ainoan selkeän poikkeuk-sen muodostivat laktobasillit; useimpien koehenkilöiden syljestä ja ulosteesta löytyi samoja laktobasilli-lajeja ja toisinaan jopa kantoja.
Viimeisessä osatyössä tutkittiin ulostenäytteiden säilytyslämpötilojen sekä eri DNA-eristysmenetelmien vaikutusta näytteistä saataviin tuloksiin. Näytteiden säilytys -20oC:ssa viikon ajan alensi Bacteroides-suvun bakteerien lukumäärää 1,6–2,5 log-yksikön verran, kun taas eri DNA-eristysmenetelmillä ei ollut vaikutusta Bacteroides-suvun bakteerien määrään tai populaation monimuotoisuuteen tai koostumukseen. Säilytyslämpö-tila ei vaikuttanut merkitsevästi muiden tutkittujen bakteeriryhmien määriin eikä myöskään populaatioiden monimuotoisuuteen tai koostumukseen. Käytetyllä DNA-eristysmenetelmällä sen sijaan oli merkittävä vaikutus: Vallitseva bakteeriston, Erec-ryhmän klostridien, Clept-ryhmän klostridien, bifidobakteerien ja Atopobium-ryhmän bakteerien määrät olivat 0,5–4 log-yksikköä korkeammat mekaanista DNA-eristystä käytettäessä kuin entsymaattista DNA-eristystä käytettäessä. Lisäksi käytetyllä DNA-eristysmenetelmällä oli merkittävä vaikutus Erec-ryhmän bakteerikoostumukseen. Käytetyllä DNA-eristysmenetelmällä on saatujen tulosten perusteella huomattava merkitys etenkin klostridi- sekä aktinobakteeripopulaatioden detektointiin ja kvantitointiin. Eri DNA-eristysmenetelmien käyttö saattaakin osittain selittää viimeaikoina saatuja ristiriitaisia tuloksia liittyen esim. suolistomikrobiston rooliin lihavuudessa, sekä bifidobakteerien määrään vauvojen suolistossa.
ISBN, ISSN ISBN 978-951-38-7954-9 (nid.) ISSN 2242-119X (nid.) ISBN 978-951-38-7955-6 (URL: http://www.vtt.fi/publications/index.jsp) ISSN 2242-1203 (URL: http://www.vtt.fi/publications/index.jsp)
Julkaisuaika Marraskuu 2012
Kieli Englanti, suomenkielinen tiivistelmä
Sivumäärä 160 s. + liitt. 62 s.
Avainsanat human fecal microbiota, human salivary microbiota, DGGE, qPCR, IBS, elderly, GOS, DNA-extraction, Erec, Clept, Bacteroides spp., bifidobacteria, lactobacilli
Julkaisija VTT PL 1000, 02044 VTT, Puh. 020 722 111
VT
T S
CIE
NC
E 2
6
Ch
ara
cte
rizatio
n o
f the h
um
an
pre
do
min
an
t fecal m
icro
bio
ta . W
ith sp
ecia
l...
ISBN 978-951-38-7954-9 (soft back ed.) ISBN 978-951-38-7955-6 (URL: http://www.vtt.fi/publications/index.jsp)ISSN 2242-119X (soft back ed.) ISSN 2242-1203 (URL: http://www.vtt.fi/publications/index.jsp)
Characterization of the human predominant fecal microbiota With special focus on the Clostridial clusters IV and XIVa
The human gut microbiota is considered to be a complex fermentor with a metabolic potential rivaling that of the liver. In addition to its primary function in digestion, the indigenous microbial community has an important influence on host physiological, nutritional and immunological processes.
Molecular tools were developed for rapid, sensitive, and highly specific characterization of the human predominant fecal and salivary microbiota. Predominant bacterial, Eubacterium rectale – Blautia coccoides group (Erec), Clostridium leptum group (Clept), and Bacteroides spp. populations of healthy adults were temporally rather stable, showing intra-individual diversity and inter-individual variability. However, rRNA-based denaturing gradient gel electrophoresis (DGGE) profiles showed more temporal instability than DNA-based profiles. Moreover, the diversity of predominant bacteria and Erec-group bacteria was significantly higher in elderly subjects as compared to younger adults. Clostridial populations represented the dominant fecal microbiota of most of the studied subjects. However, the proportion of Erec-group was significantly lower in the constipation type IBS subjects than in the healthy adults. Altogether, the observations indicated that in addition to temporal instability of the active predominant fecal bacterial population, clostridial microbiota may be involved in IBS. Thereafter, the similarity of the salivary and fecal microbiota was studied to assess whether the upper gastrointestinal tract microbiota influence the results obtained with DNA-based methods from feces. The predominant bacteria, bifidobacteria, and Erec-group bacteria of the oral cavity and feces showed more diversity in feces than in saliva and different species compositions for the two sampling sites. However, fecal and salivary samples contained identical indigenous Lactobacillus genotypes in most subjects. The effects of storage conditions and DNA-extraction protocols of fecal samples on the results were also evaluated. The DNA-extraction did not affect the diversity, composition, or quantity of Bacteroides spp., whereas after one week’s storage at -20°C the numbers of Bacteroides spp. were significantly lower. Furthermore, the numbers of predominant bacteria, Erec-group, Clept-group, bifidobacteria, and Atopobium-group were 0.5–4 log-units higher after mechanical DNA-extraction than after enzymatic DNA-extraction, regardless of the storage. Moreover, the bacterial composition of Erec-group differed significantly depending on the DNA-extraction protocol applied. According to the results, rigorous mechanical lysis leads to the detection of higher bacterial numbers and diversity from human fecal samples than enzymatic DNA-extraction.