Como Vamos
57
COMO VAMOS A OCTUBRE SUPERMERCADOS GERENCIA CUENTAS CLAVES
-
Upload
gestiongcc -
Category
Entertainment & Humor
-
view
161 -
download
0
Transcript of Como Vamos

COMO VAMOS A OCTUBRESUPERMERCADOS
GERENCIA CUENTAS CLAVES

28,3%
6,6%
38,6%
12,2%
14,3%
Participación 2009 x Tipo de Cliente
Tradicional
Foodservice
Supermercados
Distribuidores
Industriales
28,9%
6,6%
39,1%
11,1%
14,4%
Participación 2010 x Tipo de Cliente
Tradicional
Foodservice
Supermercados
Distribuidores
Industriales
Total Gerencia Cuentas Claves 65,1%
Total Gerencia Cuentas Claves 64,6%
PARTICIPACIÓN x TIPO DE CLIENTE2009 vs 2010
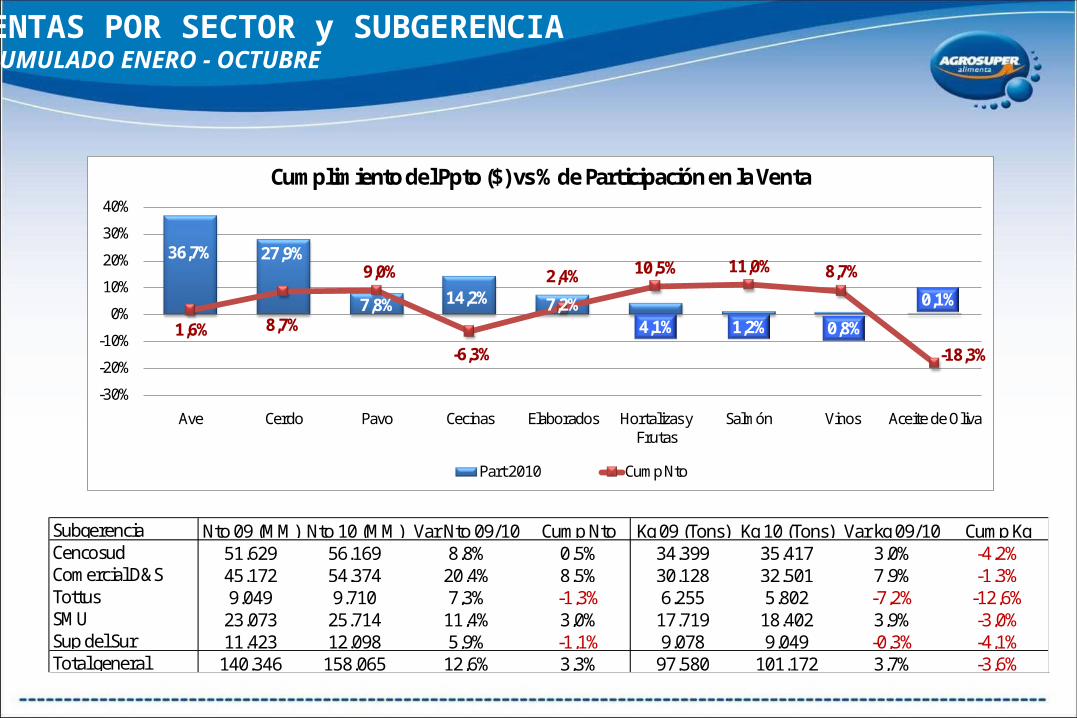
VENTAS POR SECTOR y SUBGERENCIAACUMULADO ENERO - OCTUBRE
36,7% 27,9%
7,8% 14,2% 7,2%4,1% 1,2% 0,8%
0,1%
1,6% 8,7%
9,0%
-6,3%
2,4% 10,5% 11,0% 8,7%
-18,3%
-30%
-20%
-10%
0%
10%
20%
30%
40%
Ave Cerdo Pavo Cecinas Elaborados Hortalizas y Frutas
Salmón Vinos Aceite de Oliva
Cumplimiento del Ppto ($) vs % de Participación en la Venta
Part 2010 Cump Nto
Subgerencia Nto 09 (MM) Nto 10 (MM) Var Nto 09/10 Cump Nto Kg 09 (Tons) Kg 10 (Tons) Var kg 09/10 Cump KgCencosud 51.629 56.169 8,8% 0,5% 34.399 35.417 3,0% -4,2%Comercial D&S 45.172 54.374 20,4% 8,5% 30.128 32.501 7,9% -1,3%Tottus 9.049 9.710 7,3% -1,3% 6.255 5.802 -7,2% -12,6%SMU 23.073 25.714 11,4% 3,0% 17.719 18.402 3,9% -3,0%Sup del Sur 11.423 12.098 5,9% -1,1% 9.078 9.049 -0,3% -4,1%Total general 140.346 158.065 12,6% 3,3% 97.580 101.172 3,7% -3,6%

TENDENCIA DE CUMPLIMIENTO DEL PRESUPUESTO ($)x SUBGERENCIA ACUMULADO ENERO A OCTUBRE
3,3%
0,5%
8,5%
-15%-10%
-5%0%5%
10%15%
Ene Feb Mar Abr May Jun Jul Ago Sep Oct
Tendencia Total Sectores Total Cadenas
-30%-20%-10%
0%10%20%
Ene Feb Mar Abr May Jun Jul Ago Sep Oct
Tendencia Total Sectores Cencosud
-10%
0%
10%
20%
30%
Ene Feb Mar Abr May Jun Jul Ago Sep Oct
Tendencia Total Sectores D&S

-1,3%
3,0%
-1,1%
-30%-20%-10%
0%10%20%
Ene Feb Mar Abr May Jun Jul Ago Sep Oct
Tendencia Total Sectores Tottus
-20%-10%
0%10%20%30%40%
Ene Feb Mar Abr May Jun Jul Ago Sep Oct
Tendencia Total Sectores SMU
-20%
-10%
0%
10%
20%
Ene Feb Mar Abr May Jun Jul Ago Sep Oct
Tendencia Total Sectores Sup del Sur
TENDENCIA DE CUMPLIMIENTO DEL PRESUPUESTO ($)x SUBGERENCIA ACUMULADO ENERO A OCTUBRE

NIVEL DE SERVICIO x SUBGERENCIAACUMULADO ENERO - OCTUBRE
79,7%
40%50%60%70%80%90%
100%
Ari
ca
Iqui
que
Ant
ofag
asta
Cala
ma
Copi
apó
La S
eren
a
Ova
lle
Val
lena
r
Hiju
elas
San
Ant
onio
Viñ
a de
l Mar
San
Felip
e
Hue
chur
aba
Lo E
spej
o
Qui
lin
Ranc
agua
Conc
epci
on
Chill
an
Los A
ngel
es
Parr
al
Tem
uco
Puer
to M
ontt
Oso
rno
Val
divi
a
Punt
a A
rena
s
Puer
to N
atal
es
Norte 63,7%
Centro Costa 83,3%
Santiago 77,8%
Centro Sur 83,3%
Sur 81,3%
Nivel de Servicio Total Sectores x Oficina de Ventas
Cencosud D&STottus
SMUSup del Sur
Total Cadenas
83%79% 77% 78% 81% 81%
75% 73% 71% 72% 73% 73%
Nivel de Servicio Total Sectores x SubgerenciaAcumulado (Ene - Sep) Octubre
70%
75%
80%
85%
90%
95%
Ene Feb Mar Abr May Jun Jul Ago Sep Oct
Tendencia Nivel de Servicio Total Cadenas
NS
Meta

PRESENCIA x SUBGERENCIAACUMULADO ENERO - OCTUBRE
46,1%
Cencosud D&STottus
SMUSup del Sur
Total general
42% 48% 53%42% 55%
45%
61% 63% 60%51% 63% 59%
Presencia Total Sectores x SubgerenciaAcumulado (Ene - Sep) Octubre
35%
40%
45%
50%
55%
60%
Ene Feb Mar Abr May Jun Jul Ago Sep Oct
Tendencia Presencia Total Sectores 2010
Presencia
Meta
20%
30%
40%
50%
60%
70%
Ari
ca
Iqui
que
Ant
ofag
asta
Cala
ma
Copi
apo
La S
eren
a
Hiju
elas
San
Ant
onio
Viñ
a de
l Mar
San
Felip
e
Hue
chur
aba
Lo E
spej
o
Qui
lin
Ranc
agua
Conc
epci
ón
Chill
an
Los A
ngel
es
Curi
co
Talc
a
Tem
uco
Puer
to M
ontt
Oso
rno
Val
divi
a
Punt
a A
rena
s
Puer
to N
atal
es
Norte 41,1%
Centro Costa 45,7%
Santiago 44,3%
Centro Sur 50,3%
Distr 44,5%
Sur 51,3%
Presencia Total Sectores x Oficina de Ventas

PROFUNDIDAD x SUBGERENCIAACUMULADO ENERO - OCTUBRE
36,8%
Cencosud D&STottus
SMUSup del Sur
Total general
50%38% 51%
29%27% 37%
53%39% 52%
31% 29% 39%
Profundidad Total Sectores x SubgerenciaAcumulado (Ene - Sep) Octubre
35%36%37%38%39%40%41%
Ene Feb Mar Abr May Jun Jul Ago Sep Oct
Tendencia Profundidad Total Sectores 2010
Profundidad
Meta
20%25%30%35%40%45%50%
Ari
ca
Iqui
que
Ant
ofag
asta
Cala
ma
Copi
apó
La S
eren
a
Ova
lle
Val
lena
r
Hiju
elas
San
Ant
onio
Viñ
a de
l Mar
San
Felip
e
Hue
chur
aba
Lo E
spej
o
Qui
lin
Ranc
agua
Conc
epci
on
Chill
an
Los A
ngel
es
Parr
al
Tem
uco
Puer
to M
ontt
Oso
rno
Val
divi
a
Punt
a A
rena
s
Puer
to N
atal
es
Norte 39,3%
Centro Costa 39,1%
Santiago 39,1%
Centro Sur 32,9%
Sur 35,1%
Profundidad Total Sectores x Oficina de Ventas
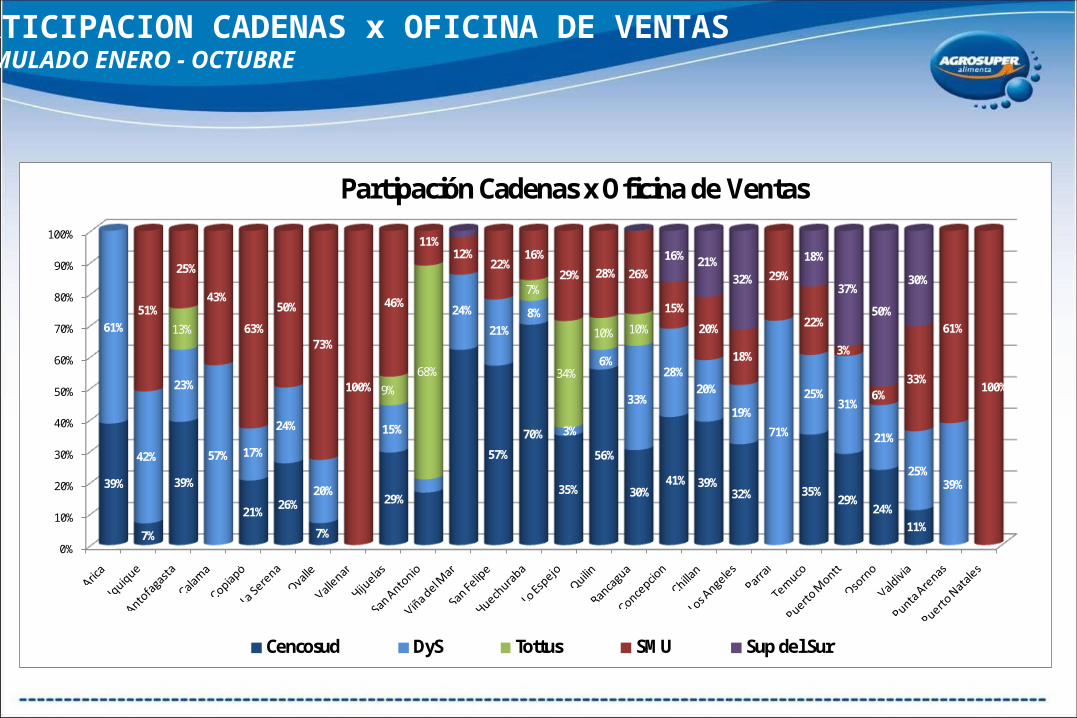
PARTICIPACION CADENAS x OFICINA DE VENTASACUMULADO ENERO - OCTUBRE
0%
10%
20%
30%
40%
50%
60%
70%
80%
90%
100%
39%
7%
39%
21% 26%
7%
29%
57%
70%
35%
56%
30%41% 39%
32% 35%29%
24%11%
61%
42%
23%
57% 17%
24%
20%
15%
24%
21%8%
3%
6%
33%
28%20%
19%
71%
25%31%
21%
25%39%
13%
9%68%
7%
34%
10% 10%
51%
25%
43%
63%
50%
73%
100%
46%
11%12%
22%16%
29% 28% 26%
15%
20%
18%
29%
22%
3%
6%33%
61%
100%
16% 21%32%
18%
37%
50%
30%
Cencosud DyS Tottus SMU Sup del Sur
Partipación Cadenas x Oficina de Ventas
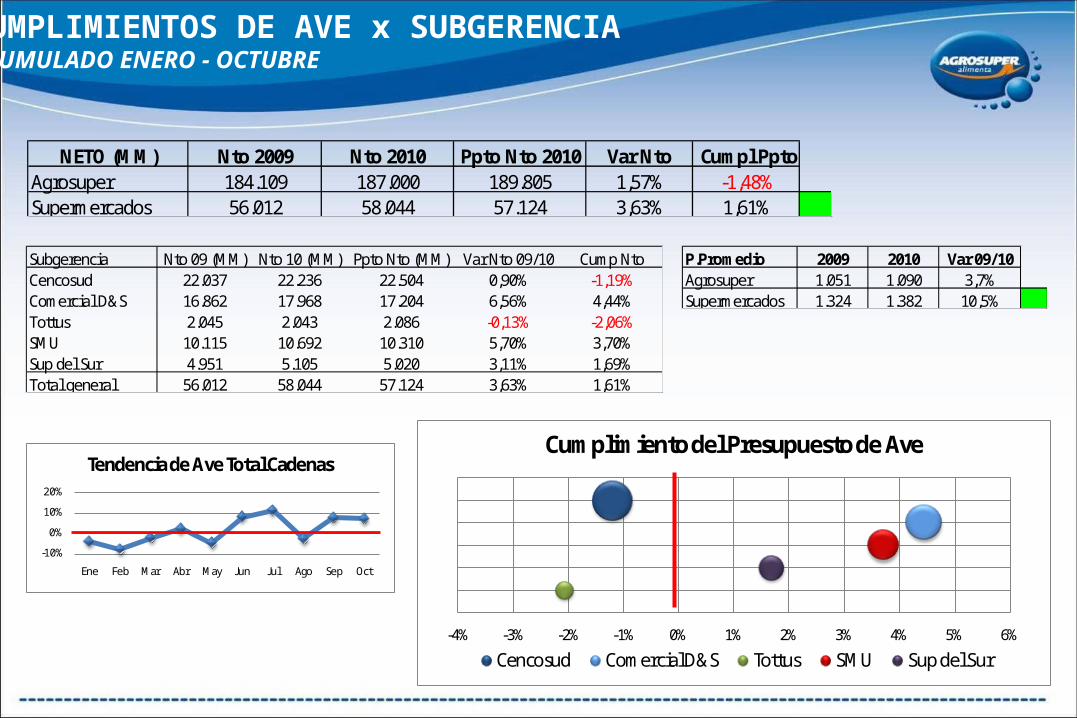
CUMPLIMIENTOS DE AVE x SUBGERENCIAACUMULADO ENERO - OCTUBRE
NETO (MM) Nto 2009 Nto 2010 Ppto Nto 2010 Var Nto Cumpl PptoAgrosuper 184.109 187.000 189.805 1,57% -1,48%Supermercados 56.012 58.044 57.124 3,63% 1,61%
P.Promedio 2009 2010 Var 09/10Agrosuper 1.051 1.090 3,7%Supermercados 1.324 1.382 10,5%
Subgerencia Nto 09 (MM) Nto 10 (MM) Ppto Nto (MM) Var Nto 09/10 Cump NtoCencosud 22.037 22.236 22.504 0,90% -1,19%Comercial D&S 16.862 17.968 17.204 6,56% 4,44%Tottus 2.045 2.043 2.086 -0,13% -2,06%SMU 10.115 10.692 10.310 5,70% 3,70%Sup del Sur 4.951 5.105 5.020 3,11% 1,69%Total general 56.012 58.044 57.124 3,63% 1,61%
-10%
0%
10%
20%
Ene Feb Mar Abr May Jun Jul Ago Sep Oct
Tendencia de Ave Total Cadenas
-4% -3% -2% -1% 0% 1% 2% 3% 4% 5% 6%
Cumplimiento del Presupuesto de Ave
Cencosud Comercial D&S Tottus SMU Sup del Sur
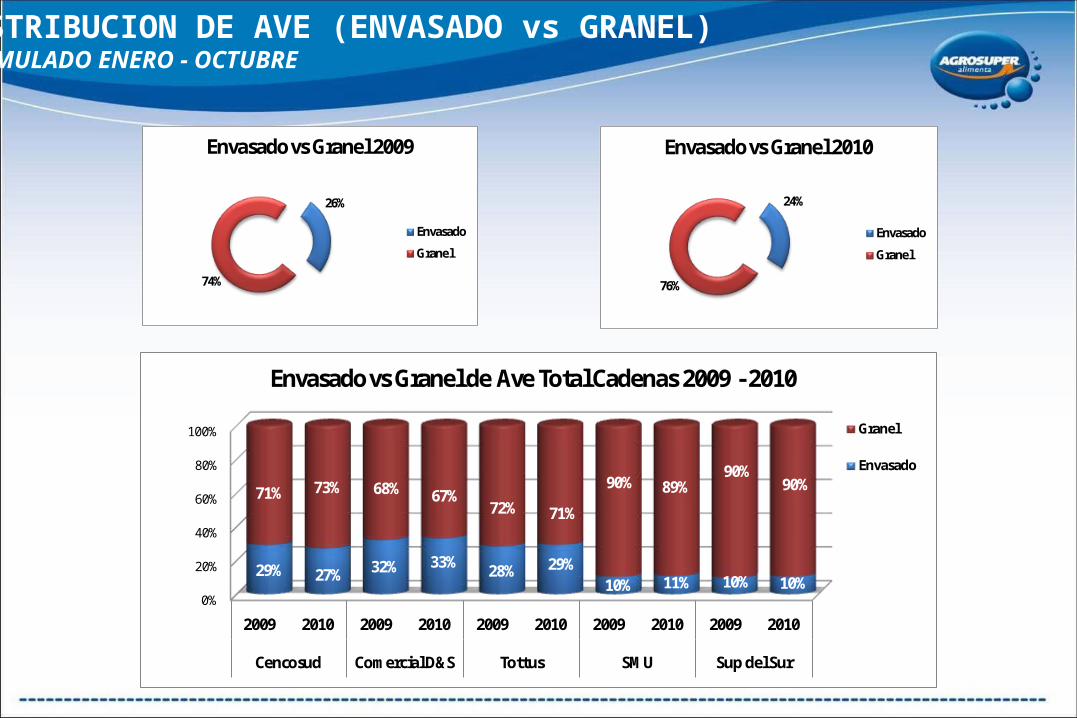
DISTRIBUCION DE AVE (ENVASADO vs GRANEL)ACUMULADO ENERO - OCTUBRE
26%
74%
Envasado vs Granel 2009
Envasado
Granel
24%
76%
Envasado vs Granel 2010
Envasado
Granel
0%
20%
40%
60%
80%
100%
2009 2010 2009 2010 2009 2010 2009 2010 2009 2010
Cencosud Comercial D&S Tottus SMU Sup del Sur
29% 27% 32% 33% 28% 29%10% 11% 10% 10%
71% 73% 68% 67%72% 71%
90% 89%90%
90%
Envasado vs Granel de Ave Total Cadenas 2009 - 2010
Granel
Envasado

NIVEL DE SERVICIO DE AVE x SUBGERENCIAACUMULADO ENERO - OCTUBRE
83,6%
Cencosud D&S Tottus SMUSup del Sur
Total Cadenas
86%84% 80% 82% 85% 84%
81% 79%75% 77% 78% 79%
Nivel de Servicio de Ave x Subgerencia
Acumulado (Ene - Sep) Octubre
70%
75%
80%
85%
90%
95%
Ene Feb Mar Abr May Jun Jul Ago Sep Oct
Tendencia Nivel de Servicio de Ave 2010
NS
Meta
40%50%60%70%80%90%
100%
Ari
ca
Iqui
que
Ant
ofag
asta
Cala
ma
Copi
apó
La S
eren
a
Ova
lle
Val
lena
r
Hiju
elas
San
Ant
onio
Viñ
a de
l Mar
San
Felip
e
Hue
chur
aba
Lo E
spej
o
Qui
lin
Ranc
agua
Conc
epci
on
Chill
an
Los A
ngel
es
Parr
al
Tem
uco
Puer
to M
ontt
Oso
rno
Val
divi
a
Punt
a A
rena
s
Puer
to N
atal
es
Norte 69,5%
Centro Costa 88,1%
Santiago 80,9%
Centro Sur 86,5%
Sur 86,8%
Nivel de Servicio de Ave x Oficina de Ventas

PRESENCIA DE AVE x SUBGERENCIAACUMULADO ENERO - OCTUBRE
47,2%
Cencosud D&STottus
SMUSup del Sur
Total general
46% 51% 48%39% 55%
46%
67% 73%50% 54% 65% 62%
Presencia de Ave x SubgerenciaAcumulado (Ene - Sep) Octubre
35%40%45%50%55%60%65%
Ene Feb Mar Abr May Jun Jul Ago Sep Oct
Tendencia Presencia de Ave 2010
Presencia
Meta
10%20%30%40%50%60%70%80%
Ari
ca
Iqui
que
Ant
ofag
asta
Cala
ma
Copi
apo
La S
eren
a
Hiju
elas
San
Ant
onio
Viñ
a de
l Mar
San
Felip
e
Hue
chur
aba
Lo E
spej
o
Qui
lin
Ranc
agua
Conc
epci
ón
Chill
an
Los A
ngel
es
Curi
co
Talc
a
Tem
uco
Puer
to M
ontt
Oso
rno
Val
divi
a
Punt
a A
rena
s
Puer
to N
atal
es
Norte 40,1%
Centro Costa 46,9%
Santiago 44,3%
Centro Sur 52,8%
Distr 52,9%
Sur 53,3%
Presencia de Ave x Oficina de Ventas

PROFUNDIDAD DE AVE x SUBGERENCIAACUMULADO ENERO - OCTUBRE
Cencosud D&STottus
SMUSup del Sur
Total general
72% 73% 75%49%
44% 58%
74% 75% 78%57% 49% 64%
Profundidad de Ave x SubgerenciaAcumulado (Ene - Sep) Octubre
50%
55%
60%
65%
70%
Ene Feb Mar Abr May Jun Jul Ago Sep Oct
Tendencia Profundidad de Ave 2010
Profundidad
Meta
10%20%30%40%50%60%70%80%90%
Ari
ca
Iqui
que
Ant
ofag
asta
Cala
ma
Copi
apó
La S
eren
a
Ova
lle
Val
lena
r
Hiju
elas
San
Ant
onio
Viñ
a de
l Mar
San
Felip
e
Hue
chur
aba
Lo E
spej
o
Qui
lin
Ranc
agua
Conc
epci
on
Chill
an
Los A
ngel
es
Parr
al
Tem
uco
Puer
to M
ontt
Oso
rno
Val
divi
a
Punt
a A
rena
s
Puer
to N
atal
es
Norte 72,3%
Centro Costa 59,0%
Santiago 62,8%
Centro Sur 51,2%
Sur 58,9%
Profundidad de Ave x Oficina de Ventas 58,8%

CUMPLIMIENTOS DE CERDO x SUBGERENCIAACUMULADO ENERO - OCTUBRE
NETO (MM) Nto 2009 Nto 2010 Ppto Nto 2010 Var Nto Cumpl PptoAgrosuper 150.050 173.412 157.702 15,57% 9,96%Supermercados 39.167 44.040 40.525 12,44% 8,67%
P.Promedio 2009 2010 Var 09/10Agrosuper 1.091 1.269 16,3%Supermercados 1.463 1.640 18,2%
Subgerencia Nto 09 (MM) Nto 10 (MM) Ppto Nto (MM) Var Nto 09/10 Cump NtoCencosud 12.023 13.459 12.454 11,94% 8,07%Comercial D&S 12.343 14.486 12.773 17,36% 13,40%Tottus 4.242 4.266 4.387 0,56% -2,76%SMU 7.056 7.933 7.300 12,42% 8,67%Sup del Sur 3.502 3.897 3.611 11,28% 7,92%Total general 39.167 44.040 40.525 12,44% 8,67%
-20%-10%
0%10%20%30%
Ene Feb Mar Abr May Jun Jul Ago Sep Oct
Tendencia de Cerdo Total Cadenas
-10% -5% 0% 5% 10% 15% 20%
Cumplimiento del Presupuesto de Cerdo
Cencosud Comercial D&S Tottus SMU Sup del Sur

DISTRIBUCION DE CERDO (ENVASADO vs GRANEL)ACUMULADO ENERO - OCTUBRE
21%
79%
Envasado vs Granel 2009
Envasado
Granel
23%
77%
Envasado vs Granel 2010
Envasado
Granel
0%10%20%30%40%50%60%70%80%90%
100%
2009 2010 2009 2010 2009 2010 2009 2010 2009 2010
Cencosud Comercial D&S Tottus SMU Sup del Sur
25% 27% 28% 35%15% 17% 6% 6% 2% 3%
75% 73% 72% 65%
85%83%
94% 94%98% 97%
Envasado vs Granel de Cerdo Cadenas 2009 vs 2010
Granel
Envasado
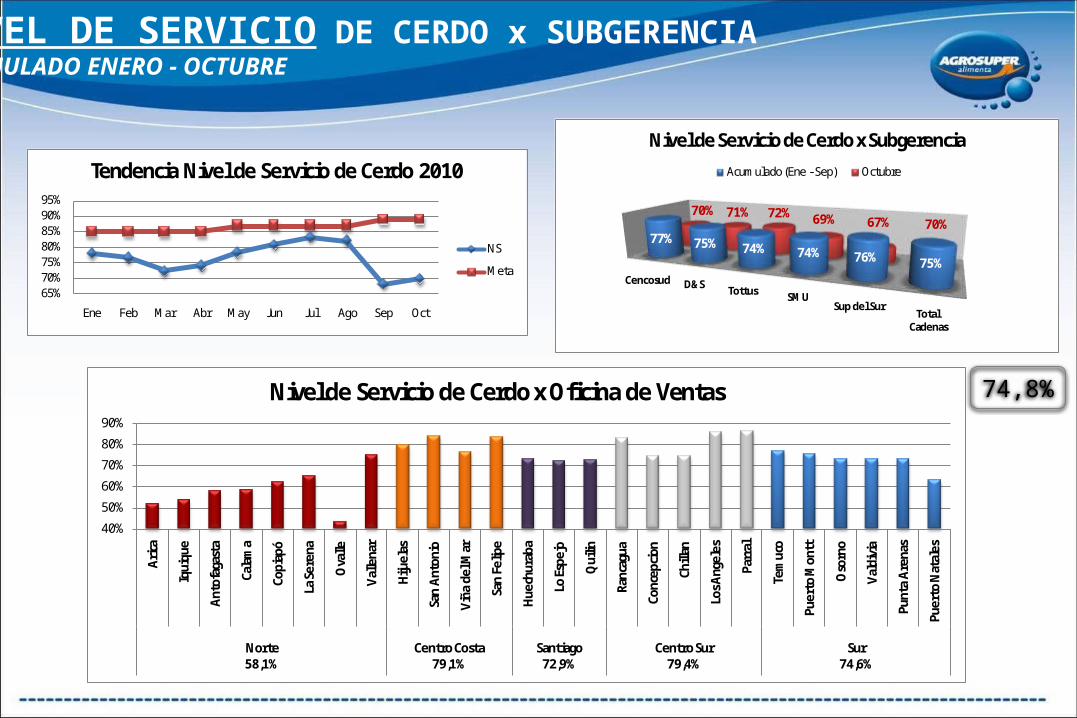
NIVEL DE SERVICIO DE CERDO x SUBGERENCIAACUMULADO ENERO - OCTUBRE
74,8%
Cencosud D&S Tottus SMUSup del Sur
Total Cadenas
77% 75% 74% 74% 76% 75%
70% 71% 72% 69% 67% 70%
Nivel de Servicio de Cerdo x Subgerencia
Acumulado (Ene - Sep) Octubre
65%70%75%80%85%90%95%
Ene Feb Mar Abr May Jun Jul Ago Sep Oct
Tendencia Nivel de Servicio de Cerdo 2010
NS
Meta
40%
50%
60%
70%
80%
90%
Ari
ca
Iqui
que
Ant
ofag
asta
Cala
ma
Copi
apó
La S
eren
a
Ova
lle
Val
lena
r
Hiju
elas
San
Ant
onio
Viñ
a de
l Mar
San
Felip
e
Hue
chur
aba
Lo E
spej
o
Qui
lin
Ranc
agua
Conc
epci
on
Chill
an
Los A
ngel
es
Parr
al
Tem
uco
Puer
to M
ontt
Oso
rno
Val
divi
a
Punt
a A
rena
s
Puer
to N
atal
es
Norte 58,1%
Centro Costa 79,1%
Santiago 72,9%
Centro Sur 79,4%
Sur 74,6%
Nivel de Servicio de Cerdo x Oficina de Ventas

PRESENCIA DE CERDO x SUBGERENCIAACUMULADO ENERO - OCTUBRE
27,8%
Cencosud D&STottus
SMUSup del Sur
Total general
28% 30% 30%20% 40%
27%
49% 45% 39%31%
56%42%
Presencia de Cerdo x SubgerenciaAcumulado (Ene - Sep) Octubre
10%
20%
30%
40%
50%
Ene Feb Mar Abr May Jun Jul Ago Sep Oct
Tendencia Presencia de Cerdo 2010
Presencia
Meta
0%10%20%30%40%50%60%
Ari
ca
Iqui
que
Ant
ofag
asta
Cala
ma
Copi
apo
La S
eren
a
Hiju
elas
San
Ant
onio
Viñ
a de
l Mar
San
Felip
e
Hue
chur
aba
Lo E
spej
o
Qui
lin
Ranc
agua
Conc
epci
ón
Chill
an
Los A
ngel
es
Curi
co
Talc
a
Tem
uco
Puer
to M
ontt
Oso
rno
Val
divi
a
Punt
a A
rena
s
Puer
to N
atal
es
Norte 23,7%
Centro Costa 25,5%
Santiago 26,6%
Centro Sur 31,6%
Distr 26,3%
Sur 34,0%
Presencia de Cerdo x Oficina de Ventas

PROFUNDIDAD DE CERDO x SUBGERENCIAACUMULADO ENERO - OCTUBRE
Cencosud D&STottus
SMUSup del Sur
Total general
61% 56% 66%42%
36% 49%
58% 54% 61%41% 37% 48%
Profundidad de Cerdo x SubgerenciaAcumulado (Ene - Sep) Octubre
40%
45%
50%
55%
Ene Feb Mar Abr May Jun Jul Ago Sep Oct
Tendencia Profundidad de Cerdo 2010
Profundidad
Meta
0%10%20%30%40%50%60%70%
Ari
ca
Iqui
que
Ant
ofag
asta
Cala
ma
Copi
apó
La S
eren
a
Ova
lle
Val
lena
r
Hiju
elas
San
Ant
onio
Viñ
a de
l Mar
San
Felip
e
Hue
chur
aba
Lo E
spej
o
Qui
lin
Ranc
agua
Conc
epci
on
Chill
an
Los A
ngel
es
Parr
al
Tem
uco
Puer
to M
ontt
Oso
rno
Val
divi
a
Punt
a A
rena
s
Puer
to N
atal
es
Norte 51,9%
Centro Costa 49,2%
Santiago 51,1%
Centro Sur 44,0%
Sur 49,4%
Profundidad de Cerdo x Oficina de Ventas 48,8%
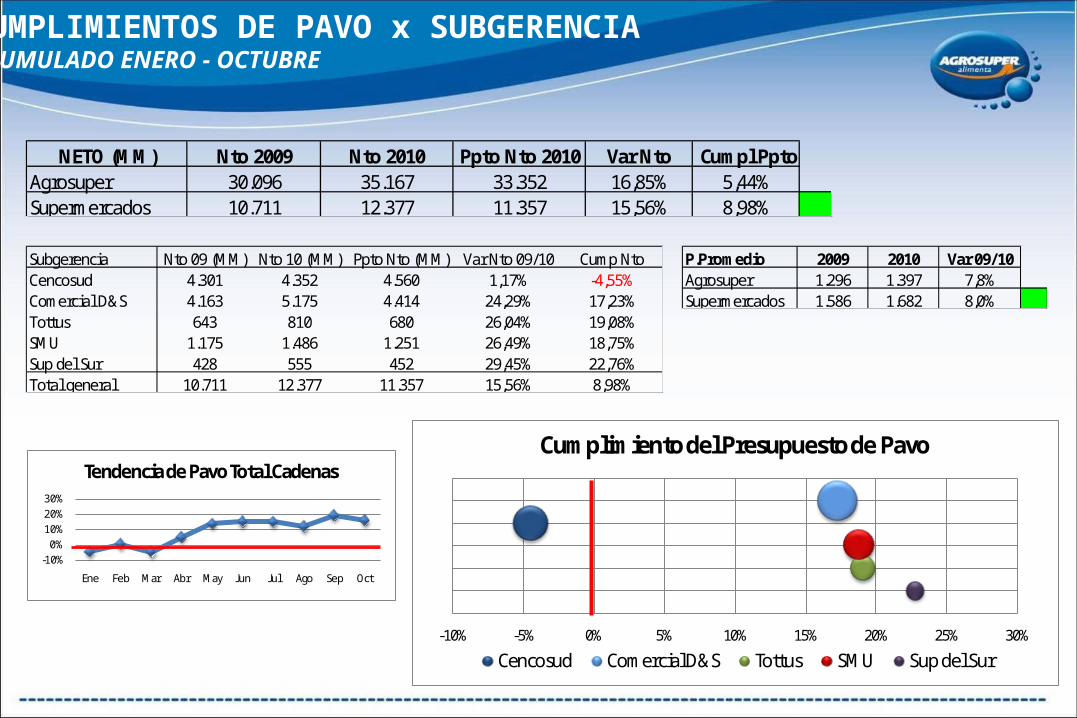
CUMPLIMIENTOS DE PAVO x SUBGERENCIAACUMULADO ENERO - OCTUBRE
NETO (MM) Nto 2009 Nto 2010 Ppto Nto 2010 Var Nto Cumpl PptoAgrosuper 30.096 35.167 33.352 16,85% 5,44%Supermercados 10.711 12.377 11.357 15,56% 8,98%
P.Promedio 2009 2010 Var 09/10Agrosuper 1.296 1.397 7,8%Supermercados 1.586 1.682 8,0%
Subgerencia Nto 09 (MM) Nto 10 (MM) Ppto Nto (MM) Var Nto 09/10 Cump NtoCencosud 4.301 4.352 4.560 1,17% -4,55%Comercial D&S 4.163 5.175 4.414 24,29% 17,23%Tottus 643 810 680 26,04% 19,08%SMU 1.175 1.486 1.251 26,49% 18,75%Sup del Sur 428 555 452 29,45% 22,76%Total general 10.711 12.377 11.357 15,56% 8,98%
-10%0%
10%20%30%
Ene Feb Mar Abr May Jun Jul Ago Sep Oct
Tendencia de Pavo Total Cadenas
-10% -5% 0% 5% 10% 15% 20% 25% 30%
Cumplimiento del Presupuesto de Pavo
Cencosud Comercial D&S Tottus SMU Sup del Sur

DISTRIBUCION DE PAVO (ENVASADO vs GRANEL)ACUMULADO ENERO - OCTUBRE
54%
46%
Envasado vs Granel 2009
Envasado
Granel
56%
44%
Envasado vs Granel 2010
Envasado
Granel
0%
20%
40%
60%
80%
100%
2009 2010 2009 2010 2009 2010 2009 2010 2009 2010
Cencosud Comercial D&S Tottus SMU Sup del Sur
49% 50%65% 72%
49% 45% 37% 36%8% 13%
51% 50%35% 28%
51% 55% 63%64%
92%87%
Envasado vs Granel de Pavo Cadenas 2009 vs 2010
Granel
Envasado
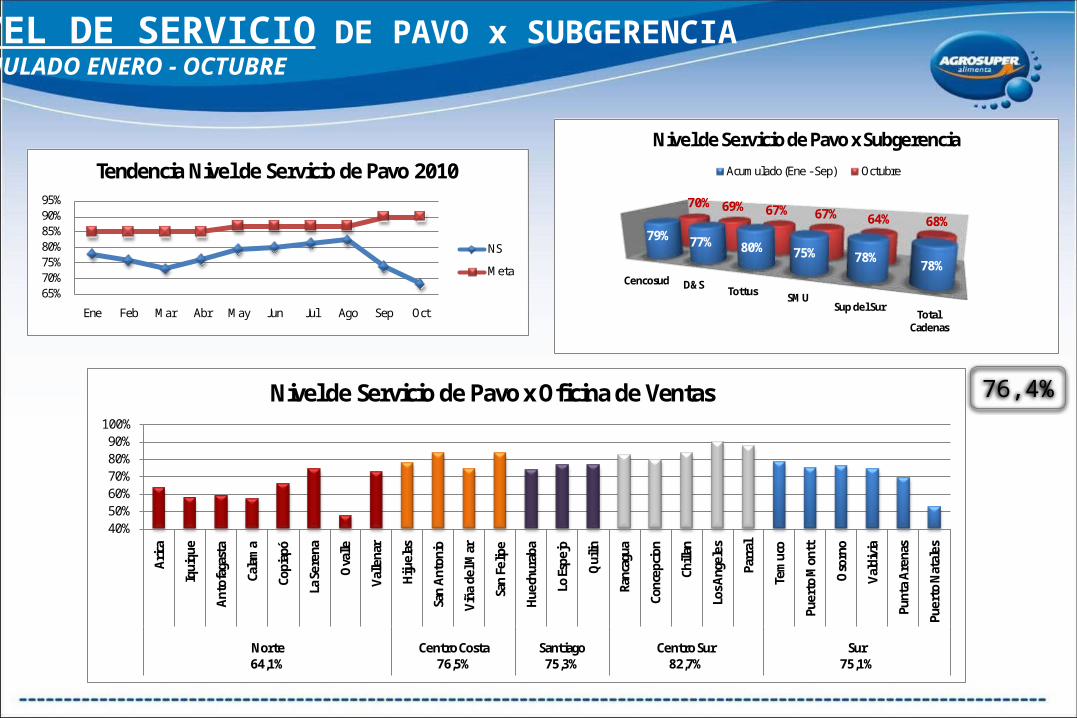
NIVEL DE SERVICIO DE PAVO x SUBGERENCIAACUMULADO ENERO - OCTUBRE
76,4%
Cencosud D&S Tottus SMUSup del Sur
Total Cadenas
79% 77% 80% 75% 78%78%
70% 69% 67% 67% 64% 68%
Nivel de Servicio de Pavo x Subgerencia
Acumulado (Ene - Sep) Octubre
40%50%60%70%80%90%
100%
Ari
ca
Iqui
que
Ant
ofag
asta
Cala
ma
Copi
apó
La S
eren
a
Ova
lle
Val
lena
r
Hiju
elas
San
Ant
onio
Viñ
a de
l Mar
San
Felip
e
Hue
chur
aba
Lo E
spej
o
Qui
lin
Ranc
agua
Conc
epci
on
Chill
an
Los A
ngel
es
Parr
al
Tem
uco
Puer
to M
ontt
Oso
rno
Val
divi
a
Punt
a A
rena
s
Puer
to N
atal
es
Norte 64,1%
Centro Costa 76,5%
Santiago 75,3%
Centro Sur 82,7%
Sur 75,1%
Nivel de Servicio de Pavo x Oficina de Ventas
65%70%75%80%85%90%95%
Ene Feb Mar Abr May Jun Jul Ago Sep Oct
Tendencia Nivel de Servicio de Pavo 2010
NS
Meta
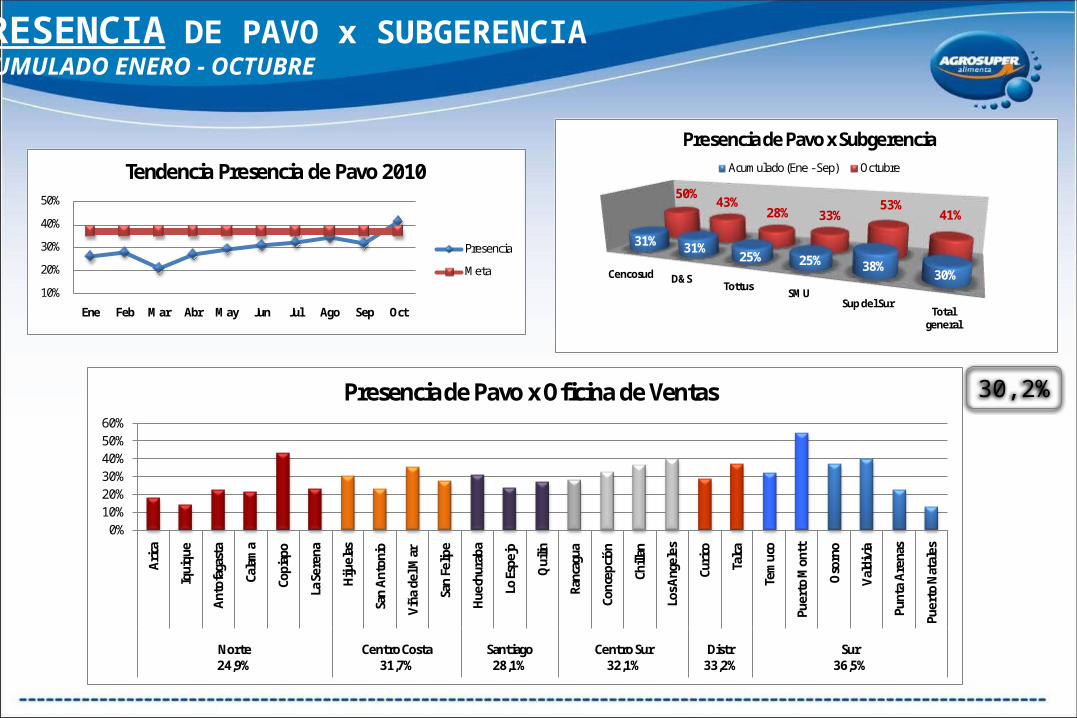
PRESENCIA DE PAVO x SUBGERENCIAACUMULADO ENERO - OCTUBRE
30,2%
Cencosud D&STottus
SMUSup del Sur
Total general
31% 31%25% 25% 38%
30%
50%43%
28% 33%53%
41%
Presencia de Pavo x SubgerenciaAcumulado (Ene - Sep) Octubre
10%
20%
30%
40%
50%
Ene Feb Mar Abr May Jun Jul Ago Sep Oct
Tendencia Presencia de Pavo 2010
Presencia
Meta
0%10%20%30%40%50%60%
Ari
ca
Iqui
que
Ant
ofag
asta
Cala
ma
Copi
apo
La S
eren
a
Hiju
elas
San
Ant
onio
Viñ
a de
l Mar
San
Felip
e
Hue
chur
aba
Lo E
spej
o
Qui
lin
Ranc
agua
Conc
epci
ón
Chill
an
Los A
ngel
es
Curi
co
Talc
a
Tem
uco
Puer
to M
ontt
Oso
rno
Val
divi
a
Punt
a A
rena
s
Puer
to N
atal
es
Norte 24,9%
Centro Costa 31,7%
Santiago 28,1%
Centro Sur 32,1%
Distr 33,2%
Sur 36,5%
Presencia de Pavo x Oficina de Ventas

PROFUNDIDAD DE PAVO x SUBGERENCIAACUMULADO ENERO - OCTUBRE
Cencosud D&STottus
SMUSup del Sur
Total general
63% 60%69%
34%22% 45%
68% 62% 67%40%
26%51%
Profundidad de Pavo x SubgerenciaAcumulado (Ene - Sep) Octubre
40%42%44%46%48%50%52%
Ene Feb Mar Abr May Jun Jul Ago Sep Oct
Tendencia Profundidad de Pavo 2010
Profundidad
Meta
45,1%
0%10%20%30%40%50%60%70%80%
Ari
ca
Iqui
que
Ant
ofag
asta
Cala
ma
Copi
apó
La S
eren
a
Ova
lle
Val
lena
r
Hiju
elas
San
Ant
onio
Viñ
a de
l Mar
San
Felip
e
Hue
chur
aba
Lo E
spej
o
Qui
lin
Ranc
agua
Conc
epci
on
Chill
an
Los A
ngel
es
Parr
al
Tem
uco
Puer
to M
ontt
Oso
rno
Val
divi
a
Punt
a A
rena
s
Puer
to N
atal
es
Norte 54,3%
Centro Costa 52,1%
Santiago 50,9%
Centro Sur 35,6%
Sur 38,9%
Profundidad de Pavo x Oficina de Ventas

CUMPLIMIENTOS DE TOTAL CECINAS x SUBGERENCIAACUMULADO ENERO - OCTUBRE
NETO (MM) Nto 2009 Nto 2010 Ppto Nto 2010 Var Nto Cumpl PptoAgrosuper 36.123 46.776 52.748 29,49% -11,32%Supermercados 15.750 22.474 23.988 42,69% -6,31%
P.Promedio 2009 2010 Var 09/10Agrosuper 1.725 1.883 9,2%Supermercados 2.622 2.441 9,3%
Subgerencia Nto 09 (MM) Nto 10 (MM) Ppto Nto (MM) Var Nto 09/10 Cump NtoCencosud 5.746 7.899 8.330 37,47% -5,18%Comercial D&S 5.800 9.544 9.290 64,55% 2,74%Tottus 978 1.417 1.453 44,90% -2,44%SMU 1.979 2.277 3.157 15,09% -27,86%Sup del Sur 1.247 1.337 1.758 7,16% -23,97%Total general 15.750 22.474 23.988 42,69% -6,31%
-40%-20%
0%20%40%
Ene Feb Mar Abr May Jun Jul Ago Sep Oct
Tendencia de Cecinas Total Cadenas
-35% -30% -25% -20% -15% -10% -5% 0% 5% 10%
Cumplimiento del Presupuesto de Cecinas
Cencosud Comercial D&S Tottus SMU Sup del Sur

CUMPLIMIENTOS CECINAS x MARCAACUMULADO ENERO - OCTUBRE
3,8% 7,2%
52,2%
28,0%
8,7%
Distribucion Neto 2009 x Marca
KING (KI)
LA CRIANZA (LC)
SOPRAVAL (SO)
SUPER CERDO (SC)
SUPER POLLO (SP)
4,4% 7,4%
50,4%
26,9%
11,0%
Distribucion Neto 2010 x Marca
KING (KI)
LA CRIANZA (LC)
SOPRAVAL (SO)
SUPER CERDO (SC)
SUPER POLLO (SP)
NETO (MM) Nto 2009 Nto 2010 Ppto Nto 2010 Var Nto Cumpl PptoKING (KI) 533 960 1.084 80,15% -11,44%LA CRIANZA (LC) 969 1.658 2.204 71,14% -24,76%SOPRAVAL (SO) 9.140 11.385 10.653 24,56% 6,87%SUPER CERDO (SC) 3.887 5.968 7.306 53,55% -18,31%SUPER POLLO (SP) 1.222 2.502 2.741 104,85% -8,70%
NETO (MM) Nto 2009 Nto 2010 Ppto Nto 2010 Var Nto Cumpl PptoSOPRAVAL (SO) 9.140 11.385 10.653 24,56% 6,87%RESTO 6.610 11.089 13.334 67,76% -16,84%TOTAL CECINAS 15.750 22.474 23.988 42,69% -6,31%

DISTRIBUCION TOTAL CECINAS (ENVASADO vs GRANEL)ACUMULADO ENERO - OCTUBRE
30%
70%
Envasado vs Granel 2009
Envasado
Granel
35%
65%
Envasado vs Granel 2010
Envasado
Granel
0%10%20%30%40%50%60%70%80%90%
100%
2009 2010 2009 2010 2009 2010 2009 2010 2009 2010
Cencosud Comercial D&S Tottus SMU Sup del Sur
30% 32% 32% 39% 29% 28% 29% 34%20%
34%
70% 68% 68%61%
71%72%
71%
66% 80% 66%
Envasado vs Granel Cecinas Cadenas 2009 - 2010
Granel
Envasado

NIVEL DE SERVICIO TOTAL CECINAS x SUBGERENCIAACUMULADO ENERO - OCTUBRE
76,8%
Cencosud D&S Tottus SMUSup del Sur
Total Cadenas
81% 76% 81% 74% 78% 79%
65% 54% 63% 56% 66% 61%
Nivel de Servicio de Cecinas x Subgerencia
Acumulado (Ene - Sep) Octubre
20%30%40%50%60%70%80%90%
Ari
ca
Iqui
que
Ant
ofag
asta
Cala
ma
Copi
apó
La S
eren
a
Ova
lle
Val
lena
r
Hiju
elas
San
Ant
onio
Viñ
a de
l Mar
San
Felip
e
Hue
chur
aba
Lo E
spej
o
Qui
lin
Ranc
agua
Conc
epci
on
Chill
an
Los A
ngel
es
Parr
al
Tem
uco
Puer
to M
ontt
Oso
rno
Val
divi
a
Punt
a A
rena
s
Puer
to N
atal
es
Norte 47,9%
Centro Costa 81,3%
Santiago 78,2%
Centro Sur 76,5%
Sur 78,2%
Nivel de Servicio de Cecinas x Oficina de Ventas
60%
70%
80%
90%
100%
Ene Feb Mar Abr May Jun Jul Ago Sep Oct
Tendencia Nivel de Servicio de Cecinas 2010
NS
Meta
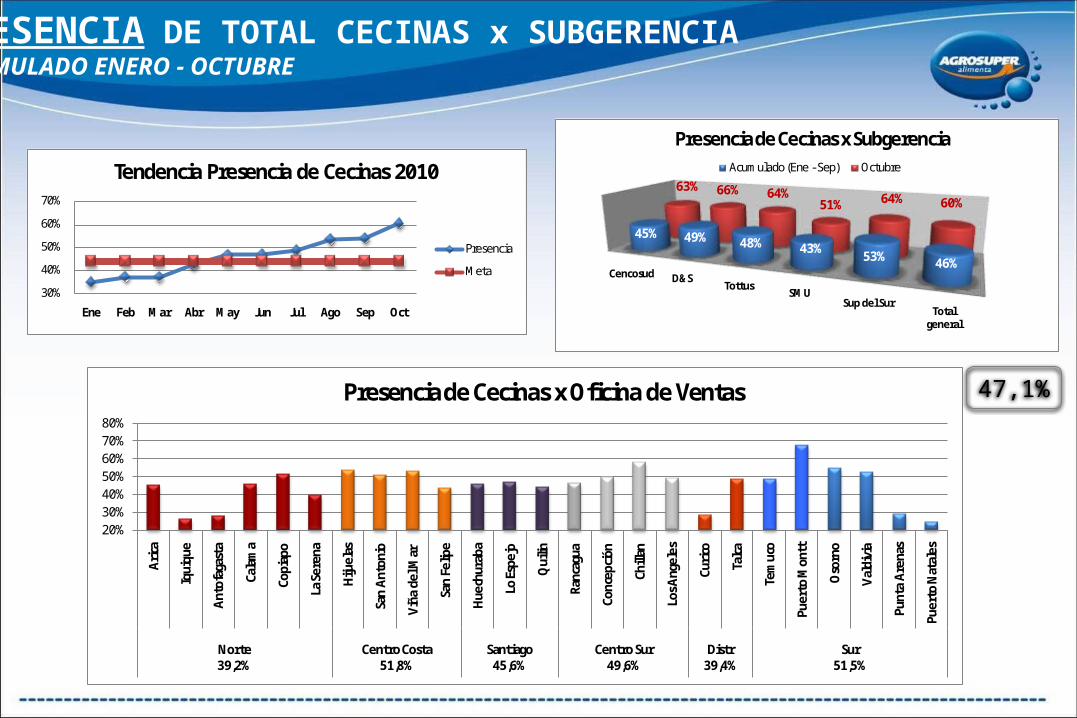
PRESENCIA DE TOTAL CECINAS x SUBGERENCIAACUMULADO ENERO - OCTUBRE
47,1%
Cencosud D&STottus
SMUSup del Sur
Total general
45% 49% 48% 43%53% 46%
63% 66% 64%51% 64% 60%
Presencia de Cecinas x SubgerenciaAcumulado (Ene - Sep) Octubre
30%
40%
50%
60%
70%
Ene Feb Mar Abr May Jun Jul Ago Sep Oct
Tendencia Presencia de Cecinas 2010
Presencia
Meta
20%30%40%50%60%70%80%
Ari
ca
Iqui
que
Ant
ofag
asta
Cala
ma
Copi
apo
La S
eren
a
Hiju
elas
San
Ant
onio
Viñ
a de
l Mar
San
Felip
e
Hue
chur
aba
Lo E
spej
o
Qui
lin
Ranc
agua
Conc
epci
ón
Chill
an
Los A
ngel
es
Curi
co
Talc
a
Tem
uco
Puer
to M
ontt
Oso
rno
Val
divi
a
Punt
a A
rena
s
Puer
to N
atal
es
Norte 39,2%
Centro Costa 51,8%
Santiago 45,6%
Centro Sur 49,6%
Distr 39,4%
Sur 51,5%
Presencia de Cecinas x Oficina de Ventas

PROFUNDIDAD DE TOTAL CECINAS x SUBGERENCIAACUMULADO ENERO - OCTUBRE
Cencosud D&STottus
SMUSup del Sur
Total general
42%
27%47%
23% 27%31%
46%
28%47%
21% 26% 30%
Profundidad de Cecinas x SubgerenciaAcumulado (Ene - Sep) Octubre
24%
26%
28%
30%
32%
34%
Ene Feb Mar Abr May Jun Jul Ago Sep Oct
Tendencia Profundidad de Cecinas 2010
Profundidad
Meta
30,5%
5%10%15%20%25%30%35%40%45%
Ari
ca
Iqui
que
Ant
ofag
asta
Cala
ma
Copi
apó
La S
eren
a
Ova
lle
Val
lena
r
Hiju
elas
San
Ant
onio
Viñ
a de
l Mar
San
Felip
e
Hue
chur
aba
Lo E
spej
o
Qui
lin
Ranc
agua
Conc
epci
on
Chill
an
Los A
ngel
es
Parr
al
Tem
uco
Puer
to M
ontt
Oso
rno
Val
divi
a
Punt
a A
rena
s
Puer
to N
atal
es
Norte 28,2%
Centro Costa 34,1%
Santiago 31,3%
Centro Sur 27,7%
Sur 29,8%
Profundidad de Cecinas x Oficina de Ventas
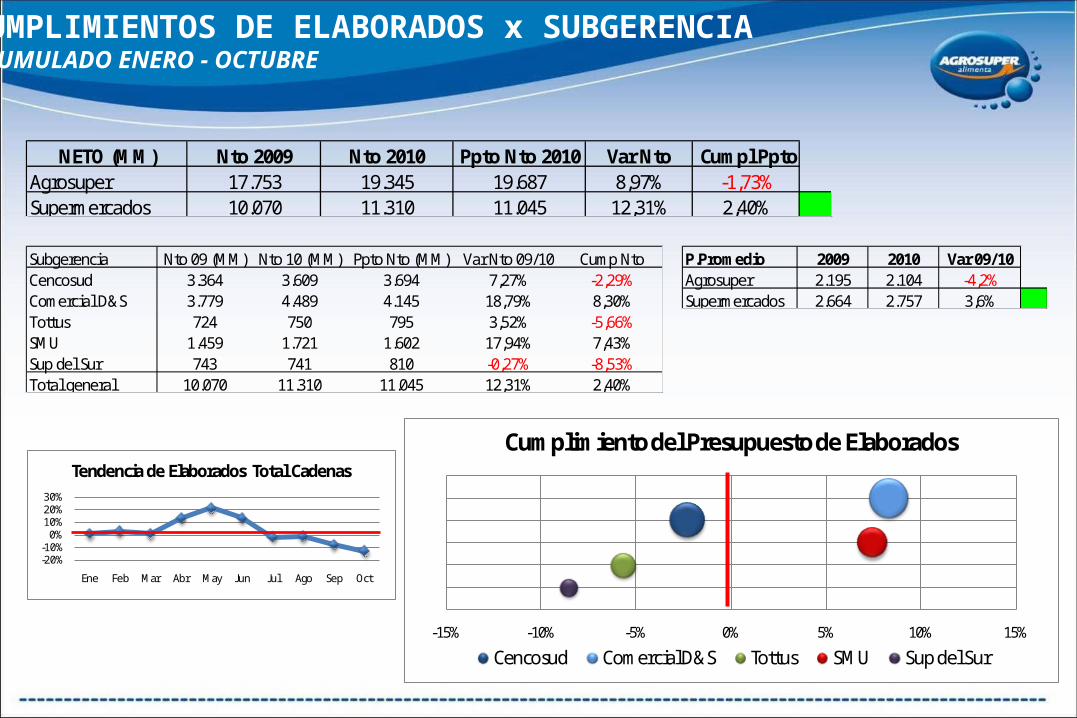
CUMPLIMIENTOS DE ELABORADOS x SUBGERENCIAACUMULADO ENERO - OCTUBRE
NETO (MM) Nto 2009 Nto 2010 Ppto Nto 2010 Var Nto Cumpl PptoAgrosuper 17.753 19.345 19.687 8,97% -1,73%Supermercados 10.070 11.310 11.045 12,31% 2,40%
P.Promedio 2009 2010 Var 09/10Agrosuper 2.195 2.104 -4,2%Supermercados 2.664 2.757 3,6%
Subgerencia Nto 09 (MM) Nto 10 (MM) Ppto Nto (MM) Var Nto 09/10 Cump NtoCencosud 3.364 3.609 3.694 7,27% -2,29%Comercial D&S 3.779 4.489 4.145 18,79% 8,30%Tottus 724 750 795 3,52% -5,66%SMU 1.459 1.721 1.602 17,94% 7,43%Sup del Sur 743 741 810 -0,27% -8,53%Total general 10.070 11.310 11.045 12,31% 2,40%
-20%-10%
0%10%20%30%
Ene Feb Mar Abr May Jun Jul Ago Sep Oct
Tendencia de Elaborados Total Cadenas
-15% -10% -5% 0% 5% 10% 15%
Cumplimiento del Presupuesto de Elaborados
Cencosud Comercial D&S Tottus SMU Sup del Sur

NIVEL DE SERVICIO DE ELABORADOS x SUBGERENCIAACUMULADO ENERO - OCTUBRE
77,1%
Cencosud D&S Tottus SMUSup del Sur
Total Cadenas
79%73% 78% 78% 83% 78%
72% 74% 69% 65% 73% 71%
Nivel de Servicio de Elaborados x Subgerencia
Acumulado (Ene - Sep) Octubre
40%50%60%70%80%90%
100%
Ari
ca
Iqui
que
Ant
ofag
asta
Cala
ma
Copi
apó
La S
eren
a
Ova
lle
Val
lena
r
Hiju
elas
San
Ant
onio
Viñ
a de
l Mar
San
Felip
e
Hue
chur
aba
Lo E
spej
o
Qui
lin
Ranc
agua
Conc
epci
on
Chill
an
Los A
ngel
es
Parr
al
Tem
uco
Puer
to M
ontt
Oso
rno
Val
divi
a
Punt
a A
rena
s
Puer
to N
atal
es
Norte 62,1%
Centro Costa 82,2%
Santiago 71,8%
Centro Sur 83,2%
Sur 84,3%
Nivel de Servicio de Elaborados x Oficina de Ventas
50%
60%
70%
80%
90%
100%
Ene Feb Mar Abr May Jun Jul Ago Sep Oct
Tendencia Nivel de Servicio de Elaborados 2010
NS
Meta

PRESENCIA DE ELABORADOS x SUBGERENCIAACUMULADO ENERO - OCTUBRE
68,3%
Cencosud D&STottus
SMUSup del Sur
Total general
68% 70% 78% 62%64% 68%
74% 83% 79%73% 68% 75%
Presencia de Elaborados x SubgerenciaAcumulado (Ene - Sep) Octubre
50%55%60%65%70%75%80%
Ene Feb Mar Abr May Jun Jul Ago Sep Oct
Tendencia Presencia de Elaborados 2010
Presencia
Meta
40%
50%
60%
70%
80%
90%
Ari
ca
Iqui
que
Ant
ofag
asta
Cala
ma
Copi
apo
La S
eren
a
Hiju
elas
San
Ant
onio
Viñ
a de
l Mar
San
Felip
e
Hue
chur
aba
Lo E
spej
o
Qui
lin
Ranc
agua
Conc
epci
ón
Chill
an
Los A
ngel
es
Curi
co
Talc
a
Tem
uco
Puer
to M
ontt
Oso
rno
Val
divi
a
Punt
a A
rena
s
Puer
to N
atal
es
Norte 64,0%
Centro Costa 67,8%
Santiago 68,8%
Centro Sur 75,3%
Distr 58,9%
Sur 68,1%
Presencia de Elaborados x Oficina de Ventas
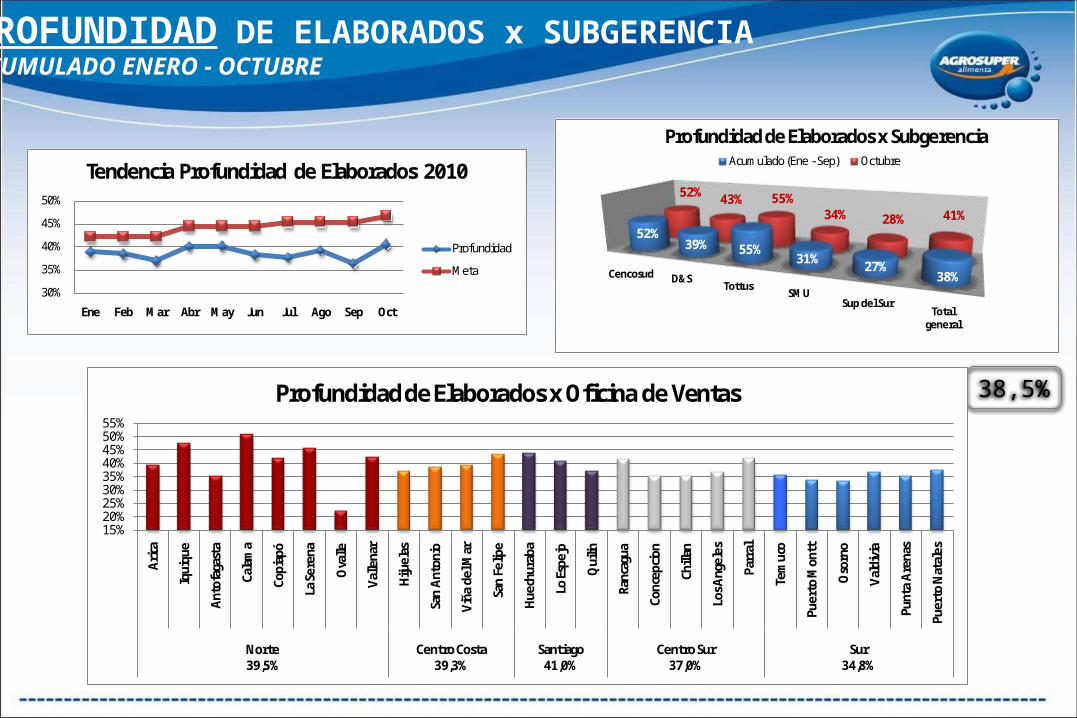
PROFUNDIDAD DE ELABORADOS x SUBGERENCIAACUMULADO ENERO - OCTUBRE
Cencosud D&STottus
SMUSup del Sur
Total general
52%39% 55%
31% 27%38%
52% 43% 55%34% 28% 41%
Profundidad de Elaborados x SubgerenciaAcumulado (Ene - Sep) Octubre
30%
35%
40%
45%
50%
Ene Feb Mar Abr May Jun Jul Ago Sep Oct
Tendencia Profundidad de Elaborados 2010
Profundidad
Meta
38,5%
15%20%25%30%35%40%45%50%55%
Ari
ca
Iqui
que
Ant
ofag
asta
Cala
ma
Copi
apó
La S
eren
a
Ova
lle
Val
lena
r
Hiju
elas
San
Ant
onio
Viñ
a de
l Mar
San
Felip
e
Hue
chur
aba
Lo E
spej
o
Qui
lin
Ranc
agua
Conc
epci
on
Chill
an
Los A
ngel
es
Parr
al
Tem
uco
Puer
to M
ontt
Oso
rno
Val
divi
a
Punt
a A
rena
s
Puer
to N
atal
es
Norte 39,5%
Centro Costa 39,3%
Santiago 41,0%
Centro Sur 37,0%
Sur 34,8%
Profundidad de Elaborados x Oficina de Ventas

CUMPLIMIENTOS DE HORTALIZAS y FRUTAS x SUBGERENCIAACUMULADO ENERO - OCTUBRE
NETO (MM) Nto 2009 Nto 2010 Ppto Nto 2010 Var Nto Cumpl PptoAgrosuper 12.529 12.654 13.239 0,99% -4,42%Supermercados 5.589 6.476 5.861 15,87% 10,49%
P.Promedio 2009 2010 Var 09/10Agrosuper 1.231 1.174 -4,7%Supermercados 1.777 1.763 4,8%
Subgerencia Nto 09 (MM) Nto 10 (MM) Ppto Nto (MM) Var Nto 09/10 Cump NtoCencosud 2.953 3.484 3.098 17,98% 12,45%Comercial D&S 970 1.152 1.018 18,69% 13,14%Tottus 288 280 302 -2,73% -7,27%SMU 983 1.239 1.031 25,99% 20,10%Sup del Sur 395 322 412 -18,41% -21,82%Total general 5.589 6.476 5.861 15,87% 10,49%
-20%
0%
20%
40%
Ene Feb Mar Abr May Jun Jul Ago Sep Oct
Tendencia de Hortalizas Total Cadenas
-30% -20% -10% 0% 10% 20% 30%
Cumplimiento del Presupuesto de Hortalizas
Cencosud Comercial D&S Tottus SMU Sup del Sur

NIVEL DE SERVICIO DE HORTALIZAS y FRUTAS x SUBGERENCIAACUMULADO ENERO - OCTUBRE
81,5%
Cencosud D&STottus SMU
Sup del SurTotal
Cadenas
85%76% 87%
79% 88% 84%
71% 68% 68% 66% 71% 69%
Nivel de Servicio de Hortalizas x Subgerencia
Acumulado (Ene - Sep) Octubre
30%40%50%60%70%80%90%
100%
Ari
ca
Iqui
que
Ant
ofag
asta
Cala
ma
Copi
apó
La S
eren
a
Ova
lle
Val
lena
r
Hiju
elas
San
Ant
onio
Viñ
a de
l Mar
San
Felip
e
Hue
chur
aba
Lo E
spej
o
Qui
lin
Ranc
agua
Conc
epci
on
Chill
an
Los A
ngel
es
Parr
al
Tem
uco
Puer
to M
ontt
Oso
rno
Val
divi
a
Punt
a A
rena
s
Puer
to N
atal
es
Norte 56,8%
Centro Costa 79,0%
Santiago 83,7%
Centro Sur 83,2%
Sur 84,3%
Nivel de Servicio de Hortalizas y Frutas x Oficina de Ventas
60%
70%
80%
90%
100%
Ene Feb Mar Abr May Jun Jul Ago Sep Oct
Tendencia Nivel de Servicio de Hortalizas 2010
NS
Meta

PRESENCIA DE HORTALIZAS Y FRUTAS x SUBGERENCIAACUMULADO ENERO - OCTUBRE
59,9%
Cencosud D&STottus
SMUSup del Sur
Total general
53% 62% 68% 62%63%
60%
63% 59% 70% 66% 62% 64%
Presencia de Hortalizas x SubgerenciaAcumulado (Ene - Sep) Octubre
50%
55%
60%
65%
70%
75%
Ene Feb Mar Abr May Jun Jul Ago Sep Oct
Tendencia Presencia de Hortalizas 2010
Presencia
Meta
40%
50%
60%
70%
80%
90%
Ari
ca
Iqui
que
Ant
ofag
asta
Cala
ma
Copi
apo
La S
eren
a
Hiju
elas
San
Ant
onio
Viñ
a de
l Mar
San
Felip
e
Hue
chur
aba
Lo E
spej
o
Qui
lin
Ranc
agua
Conc
epci
ón
Chill
an
Los A
ngel
es
Curi
co
Talc
a
Tem
uco
Puer
to M
ontt
Oso
rno
Val
divi
a
Punt
a A
rena
s
Puer
to N
atal
es
Norte 62,1%
Centro Costa 54,9%
Santiago 60,2%
Centro Sur 59,7%
Distr 57,2%
Sur 62,8%
Presencia de Hortalizas y Frutas x Oficina de Ventas
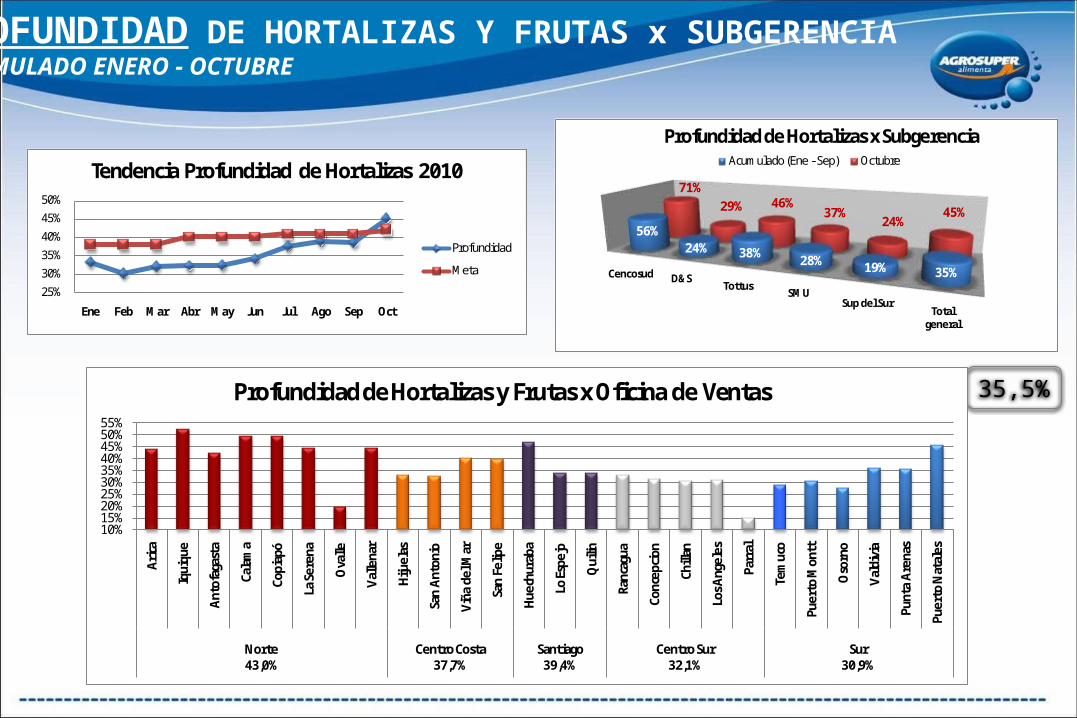
PROFUNDIDAD DE HORTALIZAS Y FRUTAS x SUBGERENCIAACUMULADO ENERO - OCTUBRE
Cencosud D&STottus
SMUSup del Sur
Total general
56%24% 38% 28% 19% 35%
71%29% 46%
37%24%
45%
Profundidad de Hortalizas x SubgerenciaAcumulado (Ene - Sep) Octubre
25%
30%
35%
40%
45%
50%
Ene Feb Mar Abr May Jun Jul Ago Sep Oct
Tendencia Profundidad de Hortalizas 2010
Profundidad
Meta
35,5%
10%15%20%25%30%35%40%45%50%55%
Ari
ca
Iqui
que
Ant
ofag
asta
Cala
ma
Copi
apó
La S
eren
a
Ova
lle
Val
lena
r
Hiju
elas
San
Ant
onio
Viñ
a de
l Mar
San
Felip
e
Hue
chur
aba
Lo E
spej
o
Qui
lin
Ranc
agua
Conc
epci
on
Chill
an
Los A
ngel
es
Parr
al
Tem
uco
Puer
to M
ontt
Oso
rno
Val
divi
a
Punt
a A
rena
s
Puer
to N
atal
es
Norte 43,0%
Centro Costa 37,7%
Santiago 39,4%
Centro Sur 32,1%
Sur 30,9%
Profundidad de Hortalizas y Frutas x Oficina de Ventas

CUMPLIMIENTOS DE SALMÓN x SUBGERENCIAACUMULADO ENERO - OCTUBRE
NETO (MM) Nto 2009 Nto 2010 Ppto Nto 2010 Var Nto Cumpl PptoAgrosuper 2.618 2.772 2.695 5,88% 2,86%Supermercados 1.788 1.938 1.746 8,37% 10,98%
P.Promedio 2009 2010 Var 09/10Agrosuper 3.226 3.966 18,2%Supermercados 3.099 3.552 34,9%
Subgerencia Nto 09 (MM) Nto 10 (MM) Ppto Nto (MM) Var Nto 09/10 Cump NtoCencosud 672 585 658 -13,03% -11,10%Comercial D&S 878 1.098 856 25,09% 28,29%Tottus 61 68 59 11,70% 14,68%SMU 134 145 131 8,21% 10,72%Sup del Sur 44 43 43 -2,46% -0,09%Total general 1.788 1.938 1.746 8,37% 10,98%
-50%0%
50%100%150%
Ene Feb Mar Abr May Jun Jul Ago Sep Oct
Tendencia de Salmón Total Cadenas
-20% -10% 0% 10% 20% 30% 40%
Cumplimiento del Presupuesto de Salmón
Cencosud Comercial D&S Tottus SMU Sup del Sur
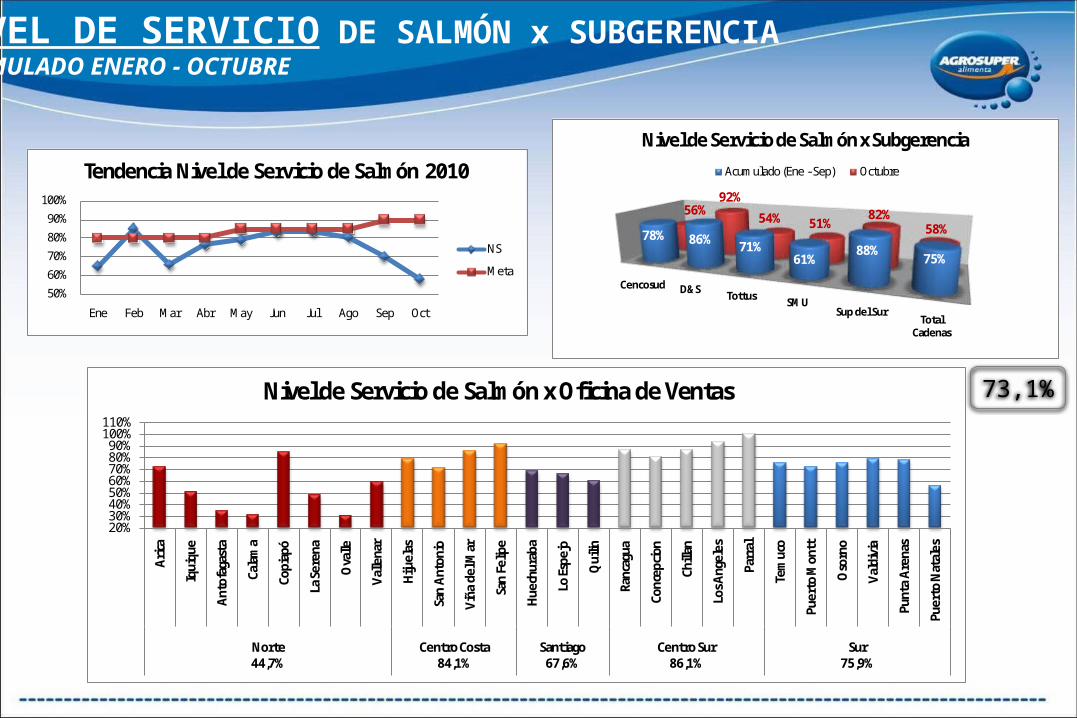
NIVEL DE SERVICIO DE SALMÓN x SUBGERENCIAACUMULADO ENERO - OCTUBRE
73,1%
Cencosud D&STottus SMU
Sup del SurTotal
Cadenas
78% 86% 71%61%
88%75%
56%92%
54% 51%82%
58%
Nivel de Servicio de Salmón x Subgerencia
Acumulado (Ene - Sep) Octubre
20%30%40%50%60%70%80%90%
100%110%
Ari
ca
Iqui
que
Ant
ofag
asta
Cala
ma
Copi
apó
La S
eren
a
Ova
lle
Val
lena
r
Hiju
elas
San
Ant
onio
Viñ
a de
l Mar
San
Felip
e
Hue
chur
aba
Lo E
spej
o
Qui
lin
Ranc
agua
Conc
epci
on
Chill
an
Los A
ngel
es
Parr
al
Tem
uco
Puer
to M
ontt
Oso
rno
Val
divi
a
Punt
a A
rena
s
Puer
to N
atal
es
Norte 44,7%
Centro Costa 84,1%
Santiago 67,6%
Centro Sur 86,1%
Sur 75,9%
Nivel de Servicio de Salmón x Oficina de Ventas
50%
60%
70%
80%
90%
100%
Ene Feb Mar Abr May Jun Jul Ago Sep Oct
Tendencia Nivel de Servicio de Salmón 2010
NS
Meta
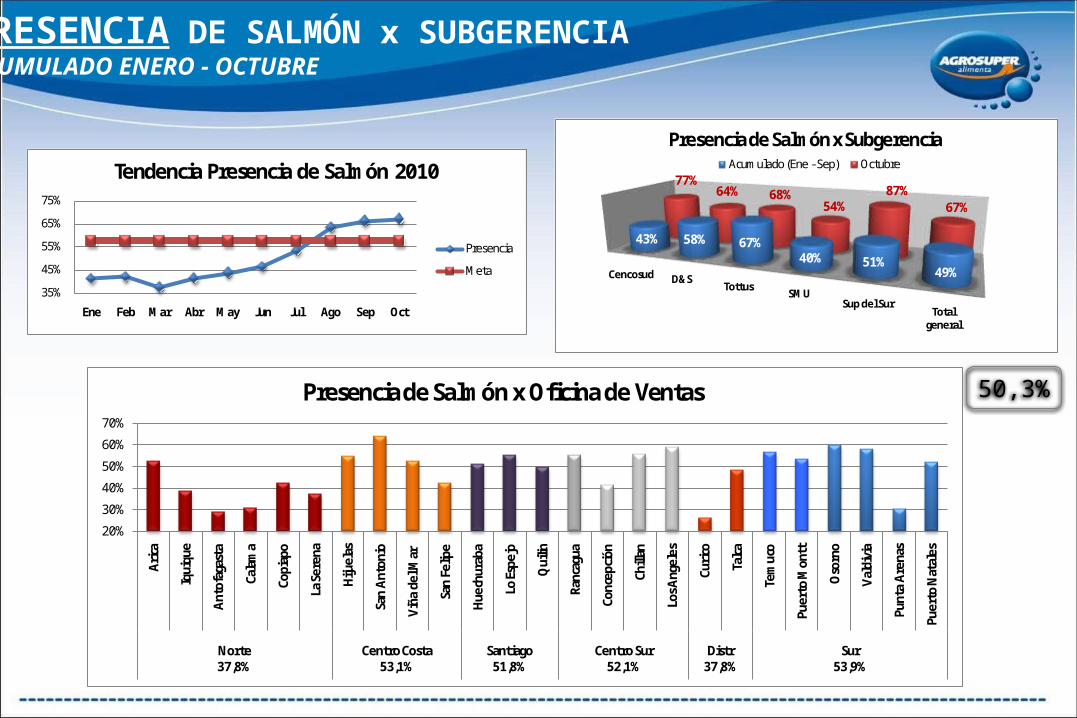
PRESENCIA DE SALMÓN x SUBGERENCIAACUMULADO ENERO - OCTUBRE
50,3%
Cencosud D&STottus
SMUSup del Sur
Total general
43% 58% 67%40% 51%
49%
77%64% 68%
54%87%
67%
Presencia de Salmón x SubgerenciaAcumulado (Ene - Sep) Octubre
35%
45%
55%
65%
75%
Ene Feb Mar Abr May Jun Jul Ago Sep Oct
Tendencia Presencia de Salmón 2010
Presencia
Meta
20%
30%
40%
50%
60%
70%
Ari
ca
Iqui
que
Ant
ofag
asta
Cala
ma
Copi
apo
La S
eren
a
Hiju
elas
San
Ant
onio
Viñ
a de
l Mar
San
Felip
e
Hue
chur
aba
Lo E
spej
o
Qui
lin
Ranc
agua
Conc
epci
ón
Chill
an
Los A
ngel
es
Curi
co
Talc
a
Tem
uco
Puer
to M
ontt
Oso
rno
Val
divi
a
Punt
a A
rena
s
Puer
to N
atal
es
Norte 37,8%
Centro Costa 53,1%
Santiago 51,8%
Centro Sur 52,1%
Distr 37,8%
Sur 53,9%
Presencia de Salmón x Oficina de Ventas

PROFUNDIDAD DE SALMÓN x SUBGERENCIAACUMULADO ENERO - OCTUBRE
Cencosud D&STottus
SMUSup del Sur
Total general
46%4% 51%
22%12% 27%
54%
3%
68%
25% 17% 32%
Profundidad de Salmón x SubgerenciaAcumulado (Ene - Sep) Octubre
20%
25%
30%
35%
Ene Feb Mar Abr May Jun Jul Ago Sep Oct
Tendencia Profundidad de Salmón 2010
Profundidad
Meta
27,4%
0%10%20%30%40%50%60%
Ari
ca
Iqui
que
Ant
ofag
asta
Cala
ma
Copi
apó
La S
eren
a
Ova
lle
Val
lena
r
Hiju
elas
San
Ant
onio
Viñ
a de
l Mar
San
Felip
e
Hue
chur
aba
Lo E
spej
o
Qui
lin
Ranc
agua
Conc
epci
on
Chill
an
Los A
ngel
es
Parr
al
Tem
uco
Puer
to M
ontt
Oso
rno
Val
divi
a
Punt
a A
rena
s
Puer
to N
atal
es
Norte 22,4%
Centro Costa 31,7%
Santiago 33,2%
Centro Sur 24,1%
Sur 17,9%
Profundidad de Salmón x Oficina de Ventas
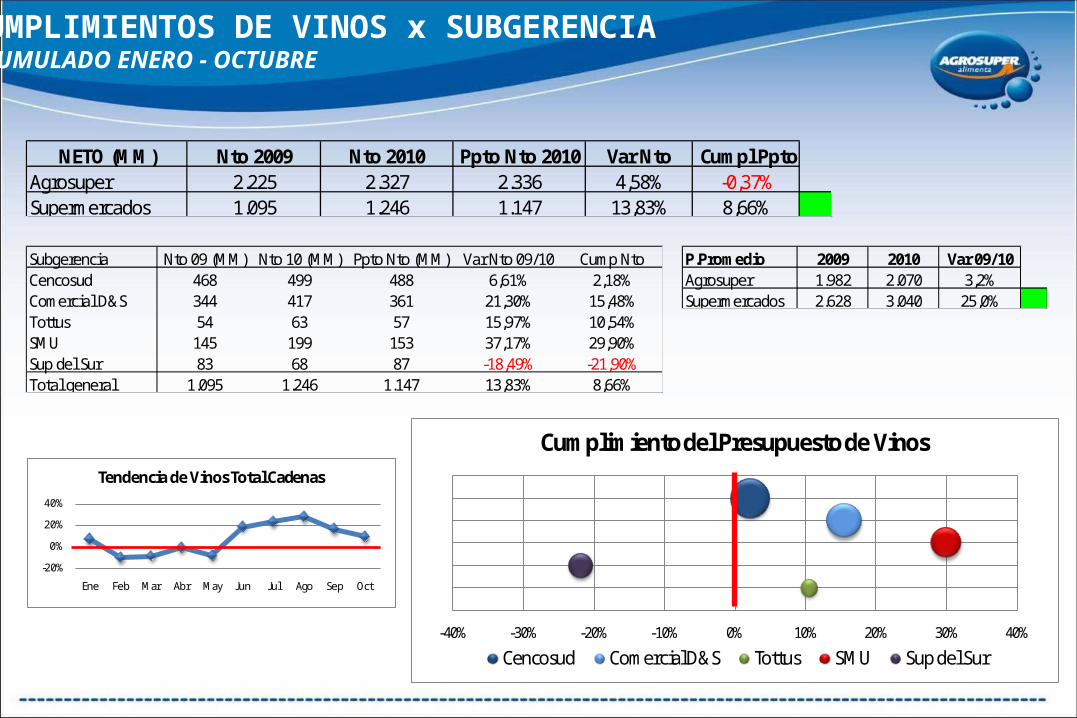
CUMPLIMIENTOS DE VINOS x SUBGERENCIAACUMULADO ENERO - OCTUBRE
NETO (MM) Nto 2009 Nto 2010 Ppto Nto 2010 Var Nto Cumpl PptoAgrosuper 2.225 2.327 2.336 4,58% -0,37%Supermercados 1.095 1.246 1.147 13,83% 8,66%
P.Promedio 2009 2010 Var 09/10Agrosuper 1.982 2.070 3,2%Supermercados 2.628 3.040 25,0%
Subgerencia Nto 09 (MM) Nto 10 (MM) Ppto Nto (MM) Var Nto 09/10 Cump NtoCencosud 468 499 488 6,61% 2,18%Comercial D&S 344 417 361 21,30% 15,48%Tottus 54 63 57 15,97% 10,54%SMU 145 199 153 37,17% 29,90%Sup del Sur 83 68 87 -18,49% -21,90%Total general 1.095 1.246 1.147 13,83% 8,66%
-20%
0%
20%
40%
Ene Feb Mar Abr May Jun Jul Ago Sep Oct
Tendencia de Vinos Total Cadenas
-40% -30% -20% -10% 0% 10% 20% 30% 40%
Cumplimiento del Presupuesto de Vinos
Cencosud Comercial D&S Tottus SMU Sup del Sur
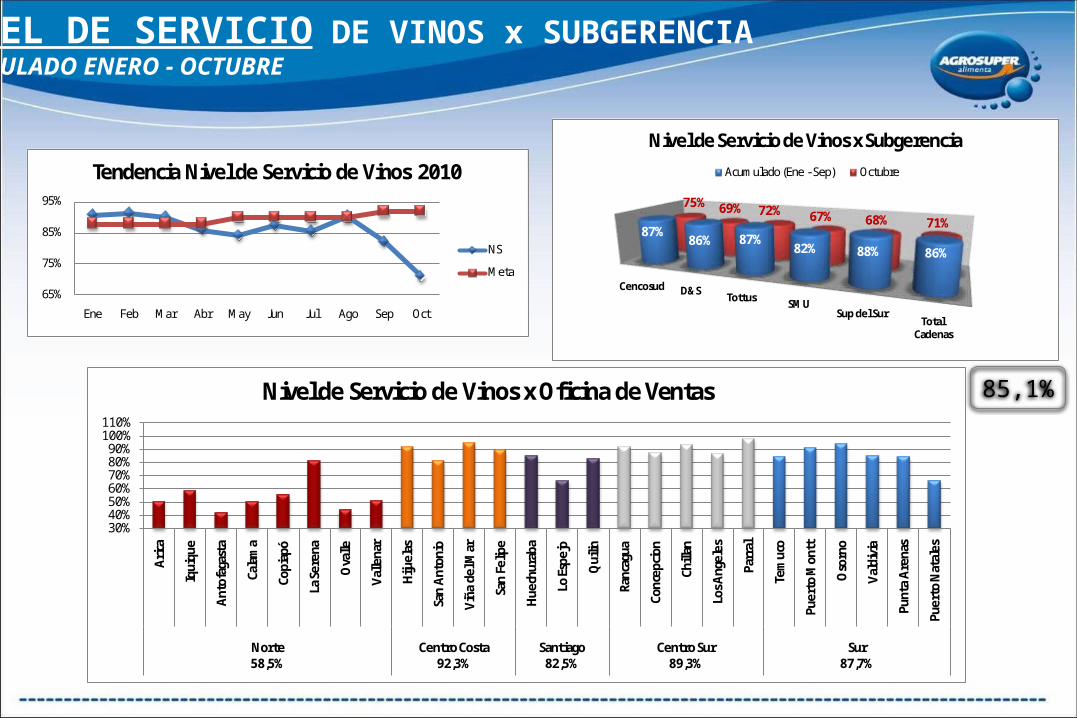
NIVEL DE SERVICIO DE VINOS x SUBGERENCIAACUMULADO ENERO - OCTUBRE
85,1%
Cencosud D&STottus SMU
Sup del SurTotal
Cadenas
87%86% 87%
82% 88% 86%
75% 69% 72% 67% 68% 71%
Nivel de Servicio de Vinos x Subgerencia
Acumulado (Ene - Sep) Octubre
30%40%50%60%70%80%90%
100%110%
Ari
ca
Iqui
que
Ant
ofag
asta
Cala
ma
Copi
apó
La S
eren
a
Ova
lle
Val
lena
r
Hiju
elas
San
Ant
onio
Viñ
a de
l Mar
San
Felip
e
Hue
chur
aba
Lo E
spej
o
Qui
lin
Ranc
agua
Conc
epci
on
Chill
an
Los A
ngel
es
Parr
al
Tem
uco
Puer
to M
ontt
Oso
rno
Val
divi
a
Punt
a A
rena
s
Puer
to N
atal
es
Norte 58,5%
Centro Costa 92,3%
Santiago 82,5%
Centro Sur 89,3%
Sur 87,7%
Nivel de Servicio de Vinos x Oficina de Ventas
65%
75%
85%
95%
Ene Feb Mar Abr May Jun Jul Ago Sep Oct
Tendencia Nivel de Servicio de Vinos 2010
NS
Meta

PRESENCIA DE VINOS x SUBGERENCIAACUMULADO ENERO - OCTUBRE
47,0%
Cencosud D&STottus
SMUSup del Sur
Total general
43% 42% 72%42% 61%
46%
61% 63% 79%
45% 59% 59%
Presencia de Vinos x SubgerenciaAcumulado (Ene - Sep) Octubre
35%40%45%50%55%60%65%
Ene Feb Mar Abr May Jun Jul Ago Sep Oct
Tendencia Presencia de Vinos 2010
Presencia
Meta
10%20%30%40%50%60%70%
Ari
ca
Iqui
que
Ant
ofag
asta
Cala
ma
Copi
apo
La S
eren
a
Hiju
elas
San
Ant
onio
Viñ
a de
l Mar
San
Felip
e
Hue
chur
aba
Lo E
spej
o
Qui
lin
Ranc
agua
Conc
epci
ón
Chill
an
Los A
ngel
es
Curi
co
Talc
a
Tem
uco
Puer
to M
ontt
Oso
rno
Val
divi
a
Punt
a A
rena
s
Puer
to N
atal
es
Norte 39,7%
Centro Costa 45,5%
Santiago 45,6%
Centro Sur 50,3%
Distr 49,4%
Sur 53,3%
Presencia de Vinos x Oficina de Ventas

PROFUNDIDAD DE VINOS x SUBGERENCIAACUMULADO ENERO - OCTUBRE
Cencosud D&STottus
SMUSup del Sur
Total general
12% 13%12%
4% 4% 8%
7% 8%6%
3% 5% 5%
Profundidad de Vinos x SubgerenciaAcumulado (Ene - Sep) Octubre
4%
5%
6%
7%
8%
9%
Ene Feb Mar Abr May Jun Jul Ago Sep Oct
Tendencia Profundidad de Vinos 2010
Profundidad
Meta
7,2%
0%2%4%6%8%
10%12%14%
Ari
ca
Iqui
que
Ant
ofag
asta
Cala
ma
Copi
apó
La S
eren
a
Ova
lle
Val
lena
r
Hiju
elas
San
Ant
onio
Viñ
a de
l Mar
San
Felip
e
Hue
chur
aba
Lo E
spej
o
Qui
lin
Ranc
agua
Conc
epci
on
Chill
an
Los A
ngel
es
Parr
al
Tem
uco
Puer
to M
ontt
Oso
rno
Val
divi
a
Punt
a A
rena
s
Puer
to N
atal
es
Norte 6,1%
Centro Costa 8,0%
Santiago 7,9%
Centro Sur 5,6%
Sur 7,4%
Profundidad de Vinos x Oficina de Ventas
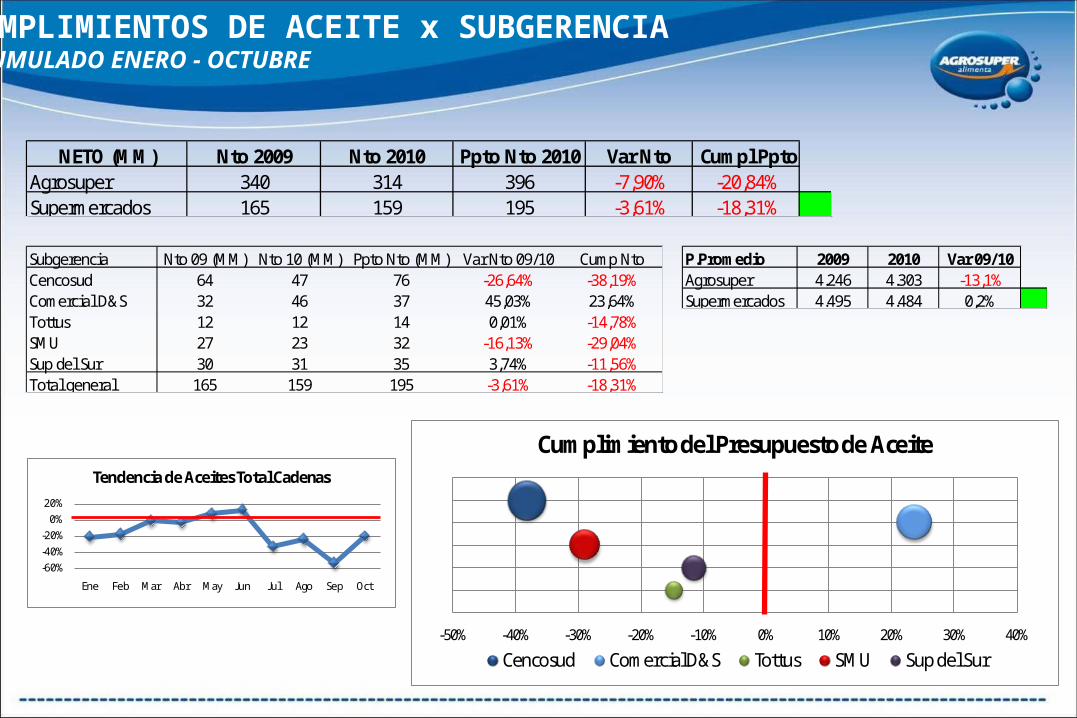
CUMPLIMIENTOS DE ACEITE x SUBGERENCIAACUMULADO ENERO - OCTUBRE
NETO (MM) Nto 2009 Nto 2010 Ppto Nto 2010 Var Nto Cumpl PptoAgrosuper 340 314 396 -7,90% -20,84%Supermercados 165 159 195 -3,61% -18,31%
P.Promedio 2009 2010 Var 09/10Agrosuper 4.246 4.303 -13,1%Supermercados 4.495 4.484 0,2%
Subgerencia Nto 09 (MM) Nto 10 (MM) Ppto Nto (MM) Var Nto 09/10 Cump NtoCencosud 64 47 76 -26,64% -38,19%Comercial D&S 32 46 37 45,03% 23,64%Tottus 12 12 14 0,01% -14,78%SMU 27 23 32 -16,13% -29,04%Sup del Sur 30 31 35 3,74% -11,56%Total general 165 159 195 -3,61% -18,31%
-60%-40%-20%
0%20%
Ene Feb Mar Abr May Jun Jul Ago Sep Oct
Tendencia de Aceites Total Cadenas
-50% -40% -30% -20% -10% 0% 10% 20% 30% 40%
Cumplimiento del Presupuesto de Aceite
Cencosud Comercial D&S Tottus SMU Sup del Sur

NIVEL DE SERVICIO DE ACEITE x SUBGERENCIAACUMULADO ENERO - OCTUBRE
84,1%
Cencosud D&STottus SMU
Sup del SurTotal
Cadenas
85%84% 88%
80% 89% 85%
73%83%
80% 70% 77% 76%
Nivel de Servicio de Aceites x Subgerencia
Acumulado (Ene - Sep) Octubre
30%40%50%60%70%80%90%
100%110%
Ari
ca
Iqui
que
Ant
ofag
asta
Cala
ma
Copi
apó
La S
eren
a
Ova
lle
Val
lena
r
Hiju
elas
San
Ant
onio
Viñ
a de
l Mar
San
Felip
e
Hue
chur
aba
Lo E
spej
o
Qui
lin
Ranc
agua
Conc
epci
on
Chill
an
Los A
ngel
es
Tem
uco
Puer
to M
ontt
Oso
rno
Val
divi
a
Punt
a A
rena
s
Puer
to N
atal
es
Norte 63,7%
Centro Costa 88,1%
Santiago 80,5%
Centro Sur 86,1%
Sur 88,0%
Nivel de Servicio de Aceites x Oficina de Ventas
70%
75%
80%
85%
90%
95%
Ene Feb Mar Abr May Jun Jul Ago Sep Oct
Tendencia Nivel de Servicio de Aceites 2010
NS
Meta

PRESENCIA DE ACEITE DE OLIVA x SUBGERENCIAACUMULADO ENERO - OCTUBRE
71,1%
Cencosud D&STottus
SMUSup del Sur
Total general
70% 76% 96%
48%90%
70%
78% 91% 96%
64%96%
82%
Presencia de Aceites x SubgerenciaAcumulado (Ene - Sep) Octubre
50%
60%
70%
80%
90%
Ene Feb Mar Abr May Jun Jul Ago Sep Oct
Tendencia Presencia de Aceites 2010
Presencia
Meta
30%40%50%60%70%80%90%
100%
Ari
ca
Iqui
que
Ant
ofag
asta
Cala
ma
Copi
apo
La S
eren
a
Hiju
elas
San
Ant
onio
Viñ
a de
l Mar
San
Felip
e
Hue
chur
aba
Lo E
spej
o
Qui
lin
Ranc
agua
Conc
epci
ón
Chill
an
Los A
ngel
es
Curi
co
Talc
a
Tem
uco
Puer
to M
ontt
Oso
rno
Val
divi
a
Punt
a A
rena
s
Puer
to N
atal
es
Norte 73,3%
Centro Costa 71,9%
Santiago 65,2%
Centro Sur 77,0%
Distr 76,3%
Sur 76,9%
Presencia de Aceites x Oficina de Ventas

PROFUNDIDAD DE ACEITE DE OLIVA x SUBGERENCIAACUMULADO ENERO - OCTUBRE
Cencosud D&STottus
SMUSup del Sur
Total general
13% 18% 25%4% 18%
11%
18% 21% 21%
4%18%
12%
Profundidad de Aceites x SubgerenciaAcumulado (Ene - Sep) Octubre
9%
10%
11%
12%
13%
Ene Feb Mar Abr May Jun Jul Ago Sep Oct
Tendencia Profundidad de Aceites 2010
Profundidad
Meta
11,1%
0%
5%
10%
15%
20%
25%
Ari
ca
Iqui
que
Ant
ofag
asta
Cala
ma
Copi
apó
La S
eren
a
Ova
lle
Val
lena
r
Hiju
elas
San
Ant
onio
Viñ
a de
l Mar
San
Felip
e
Hue
chur
aba
Lo E
spej
o
Qui
lin
Ranc
agua
Conc
epci
on
Chill
an
Los A
ngel
es
Parr
al
Tem
uco
Puer
to M
ontt
Oso
rno
Val
divi
a
Punt
a A
rena
s
Puer
to N
atal
es
Norte 6,9%
Centro Costa 10,8%
Santiago 9,1%
Centro Sur 13,3%
Sur 13,2%
Profundidad de Aceites x Oficina de Ventas
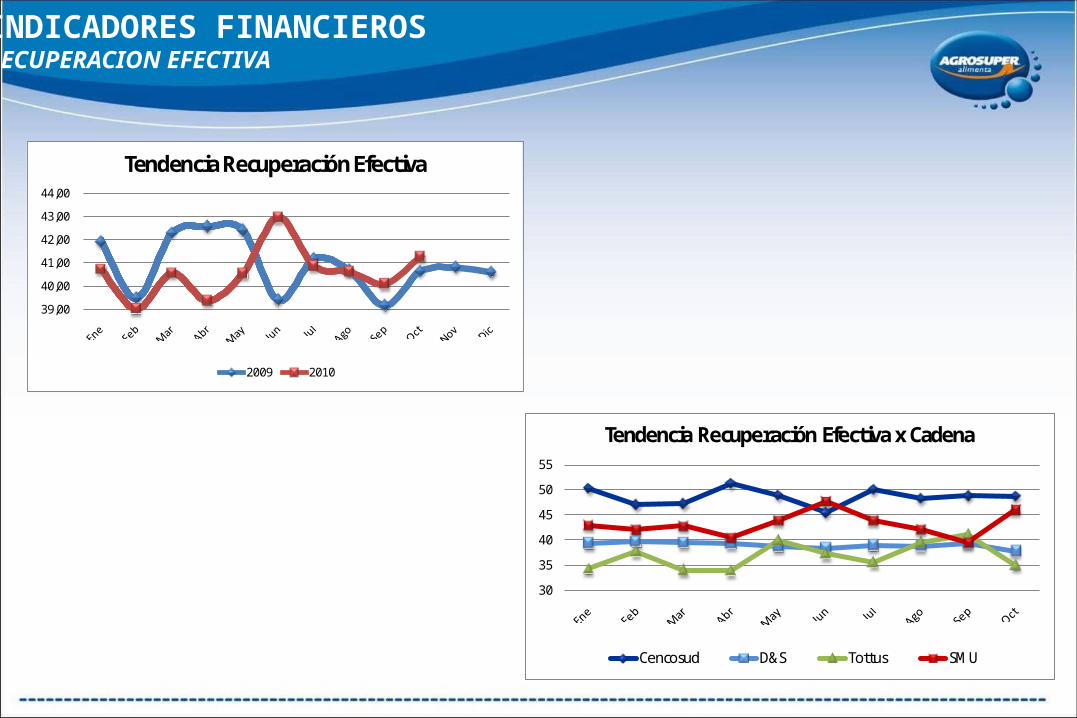
INDICADORES FINANCIEROSRECUPERACION EFECTIVA
39,00
40,00
41,00
42,00
43,00
44,00
Tendencia Recuperación Efectiva
2009 2010
30
35
40
45
50
55
Tendencia Recuperación Efectiva x Cadena
Cencosud D&S Tottus SMU

INDICADORES FINANCIEROSMOROSIDAD
9%
14%
19%
24%
29%
Tendencia Morosidad 2009 vs 2010
2009 2010
0%
50%
100%
Cencosud 5,27%
D&S 30,53%
Tottus 17,45%
SMU 21,31%
612 3.176 210 1.057
11.601 10.403 1.201 4.958
Morosidad x Cadena
Vencido Deuda Total
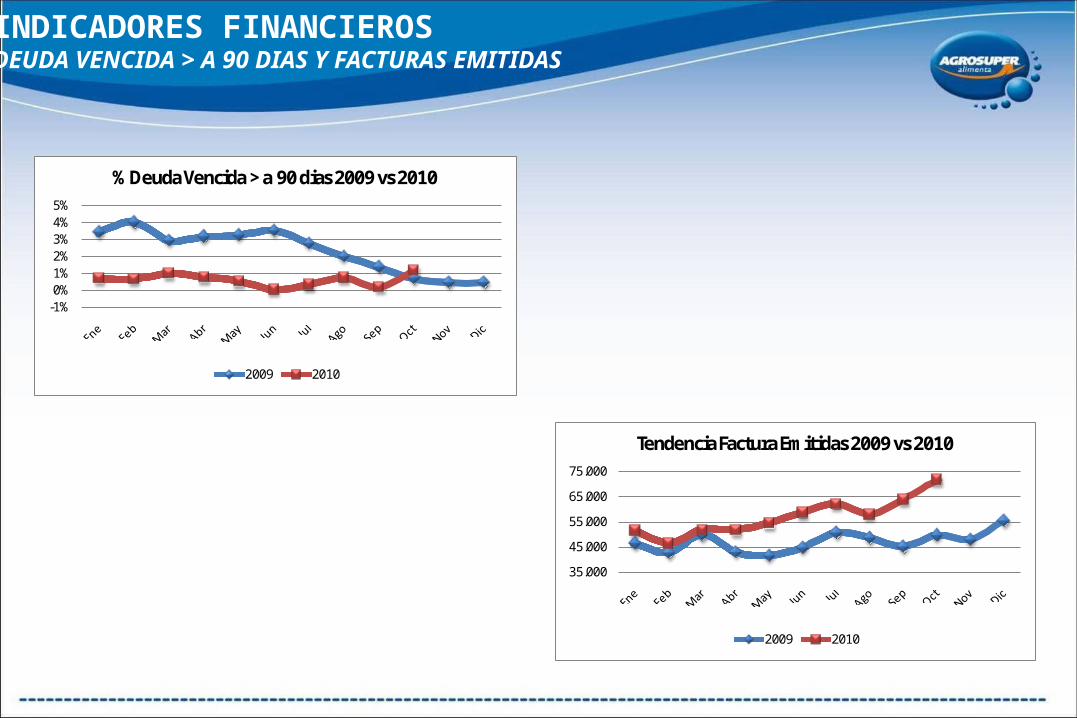
INDICADORES FINANCIEROSDEUDA VENCIDA > A 90 DIAS Y FACTURAS EMITIDAS
-1%0%1%2%3%4%5%
% Deuda Vencida > a 90 dias 2009 vs 2010
2009 2010
35.000
45.000
55.000
65.000
75.000
Tendencia Factura Emitidas 2009 vs 2010
2009 2010
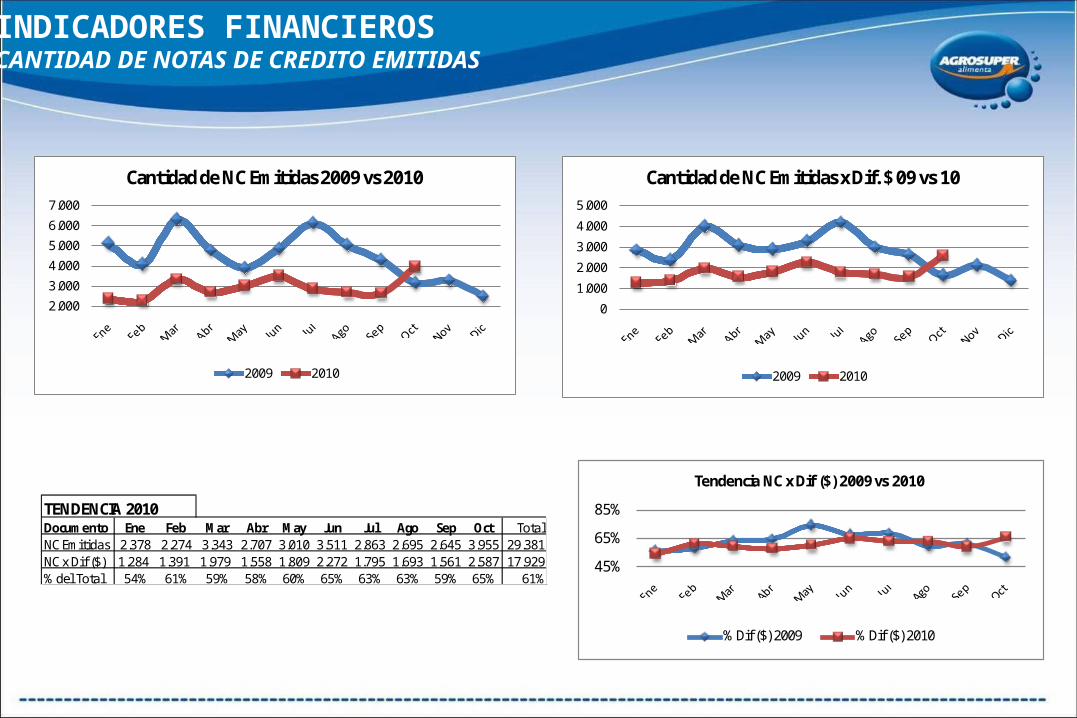
INDICADORES FINANCIEROSCANTIDAD DE NOTAS DE CREDITO EMITIDAS
2.000
3.000
4.000
5.000
6.000
7.000
Cantidad de NC Emitidas 2009 vs 2010
2009 2010
0
1.000
2.000
3.000
4.000
5.000
Cantidad de NC Emitidas x Dif. $ 09 vs 10
2009 2010
Documento Ene Feb Mar Abr May Jun Jul Ago Sep Oct TotalNC Emitidas 2.378 2.274 3.343 2.707 3.010 3.511 2.863 2.695 2.645 3.955 29.381NC x Dif ($) 1.284 1.391 1.979 1.558 1.809 2.272 1.795 1.693 1.561 2.587 17.929% del Total 54% 61% 59% 58% 60% 65% 63% 63% 59% 65% 61%
TENDENCIA 2010
45%
65%
85%
Tendencia NC x Dif ($) 2009 vs 2010
% Dif ($) 2009 % Dif ($) 2010
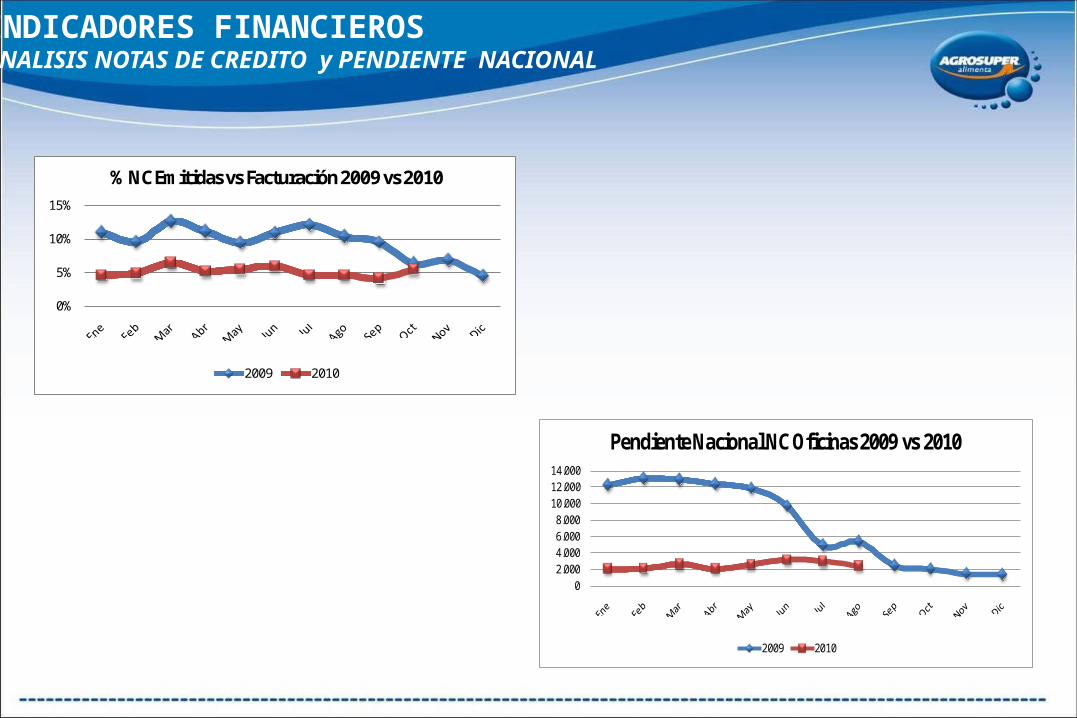
INDICADORES FINANCIEROSANALISIS NOTAS DE CREDITO y PENDIENTE NACIONAL
0%
5%
10%
15%
% NC Emitidas vs Facturación 2009 vs 2010
2009 2010
02.0004.0006.0008.000
10.00012.00014.000
Pendiente Nacional NC Oficinas 2009 vs 2010
2009 2010

INDICADORES FINANCIEROSANALISIS COSTO NOTAS DE CREDITO
0,0
5,0
10,0
15,0
20,0
Tendencia Costo NC Emitidas 2009 vs 2010
2009 MM$ 2010 MM$
0,0
5,0
10,0
15,0
Tendencia NC Emitidas x Dif. Precio 2009 vs 2010
2009 MM$ 2010 MM$
El costo x emisión de NC es de $3.000 x docto.
Si tienes dudas, comentarios o aportes al informe, no dudes en contactarnos a través de la pagina o al correo [email protected].