Desarrollo de La Mezcla SMA
34
NCAT Report No. 97-3 DEVELOPMENT OF A MIXTURE DESIGN PROCEDURE FOR STONE MATRIX ASPHALT (SMA) by E. R. Brown John E. Haddock Rajib B. Mallick Todd A. Lynn March 1997
-
Upload
juan-van-der-tapia -
Category
Documents
-
view
218 -
download
0
Transcript of Desarrollo de La Mezcla SMA
8/9/2019 Desarrollo de La Mezcla SMA
http://slidepdf.com/reader/full/desarrollo-de-la-mezcla-sma 1/34
NCAT Report No. 97-3
DEVELOPMENT OF AMIXTURE DESIGN
PROCEDURE FOR STONE
MATRIX ASPHALT (SMA)
by
E. R. Brown
John E. Haddock
Rajib B. Mallick
Todd A. Lynn
March 1997

8/9/2019 Desarrollo de La Mezcla SMA
http://slidepdf.com/reader/full/desarrollo-de-la-mezcla-sma 2/34
DEVELOPMENT OF A MIXTURE DESIGN PROCEDURE FOR STONE
MATRIX ASPHALT (SMA)
by
E. R. Brown
Director
National Center for Asphalt Technology
Auburn University, Alabama
John E. Haddock
Section Engineer
Indiana Department of Transportation
West Lafayette, Indiana
Rajib B. Mallick
Senior Research Associate
National Center for Asphalt Technology
Auburn University, Alabama
and
Todd A. Lynn
Graduate Student
National Center for Asphalt Technology
Auburn University, Alabama
NCAT Report No. 97-3
March 1997
“The contents of this report reflect the views of the authors who are solely responsible for the
facts and the accuracy of the data presented herein. The contents do not necessarily reflect the
official views and policies of the National Center for Asphalt Technology of Auburn University.
This report does not constitute a standard, specification, or regulation.”
8/9/2019 Desarrollo de La Mezcla SMA
http://slidepdf.com/reader/full/desarrollo-de-la-mezcla-sma 3/34
1 Respectively, Director, National Center for Asphalt Technology, Auburn University, Alabama; Section
Engineer, Indiana Department of Transportation, Division of Research, West Lafayette, Indiana; Senior Research
Associate, and Graduate Student, National Center for Asphalt Technology, National Center for Asphalt
Technology, Auburn University, Alabama.
DEVELOPMENT OF A MIXTURE DESIGN PROCEDURE FOR STONE MATRIX
ASPHALT (SMA)
E. R. Brown, John E. Haddock, Rajib B. Mallick, and Todd A. Lynn1
ABSTRACT
Stone Matrix Asphalt (SMA) has been used successfully in Europe for over 20 years to
provide better rutting resistance and to resist studded tire wear. Since 1991, the use of SMA has
increased steadily in the United States. At present, some states routinely use SMA even though a
standard mixture design procedure is not available. A mixture design procedure that provides
guidance on material properties, aggregate gradation, determination of optimum asphalt content,
and mixture properties is needed. This paper presents a mixture design procedure for SMA
mixtures developed by the National Center for Asphalt Technology. Data for the development of
the procedure was collected from a laboratory study conducted with various samples of
aggregates, fillers, asphalt binders, and stabilizing additives. Compacted mixtures were tested to
evaluate the effects of aggregate structure, asphalt binder, and binder-fine aggregate mortar.
Specific conclusions from this study were: (1) The Los Angeles abrasion loss showed good
correlation with aggregate breakdown, (2) It appeared that the 3:1 or 2:1 flat and elongated
particles provided much better classification for the various aggregates than a 5:1 ratio, (3) The
flat and elongated particle ratio showed excellent correlation with aggregate breakdown, (4) In a
SMA mix, the percent passing the 4.75 mm sieve must be below 30 percent to ensure proper
stone-on-stone contact, (5) The percent passing the 0.02 mm sieve did not show a correlation
8/9/2019 Desarrollo de La Mezcla SMA
http://slidepdf.com/reader/full/desarrollo-de-la-mezcla-sma 4/34
with mortar stiffness. However, the dry compacted volume, as obtained from the Penn State test
method, did show a good correlation with mortar stiffness and can be utilized to characterize the
shape of fillers. Generally, a more angular filler tends to produce a higher air voids result in this
test, (6) In-place results from about 86 projects showed that very little rutting has occurred in
SMA pavements constructed in the United States since 1991. However, for the pavements with
air voids falling below the 3 percent range, some rutting was observed. (7) A VMA significantly
lower than specified VMA can be obtained due to aggregate breakdown. Hence, the mix designer
must consider aggregate type, compactor type and compactive effort along with the gradation in
meeting the required VMA criteria. Specifying a minimum asphalt content can result in different
requirements for aggregates with different specific gravity, (8) Fifty blows of Marshall hammer
were found to be approximately equal to 100 revolutions of the Superpave gyratory compactor in
terms of resultant density. The Superpave gyratory compacter was found to produce less
aggregate breakdown than the Marshall hammer, (9) Fiber stabilizers were found to be more
effective in reducing draindown than polymer stabilizers. However, mixes modified with polymer
showed better resistance to rutting in laboratory wheel tracking tests.
8/9/2019 Desarrollo de La Mezcla SMA
http://slidepdf.com/reader/full/desarrollo-de-la-mezcla-sma 5/34
Brown, Haddock, Mallick, and Lynn 1
DEVELOPMENT OF A MIXTURE DESIGN PROCEDURE FOR STONE MATRIX
ASPHALT (SMA)
INTRODUCTION
Background
Stone Matrix Asphalt (SMA) is a type of hot mix asphalt (HMA) consisting of a coarse
aggregate skeleton and a high binder content mortar. This type of mixture has been used in
Europe for over 20 years to provide better rutting resistance, and to resist studded tire wear.
Because of its success in Europe, five states, through the cooperation of the Federal Highway
Administration (FHWA), constructed SMA pavements in the United States in 1991 (1). Since that
time, the use of SMA in the U.S. has increased significantly. At present, some states routinely use
SMA even though a standard mixture design procedure is not available. A mixture design
procedure that provides guidance on material properties, aggregate gradation, determination of
optimum asphalt content, and mixture properties is needed. The goal of the mixture design
procedure should be to design a high quality SMA mixture by using a simple, straightforward, and
repeatable method. This paper presents a mixture design procedure for SMA, developed by the
National Center for Asphalt Technology (NCAT). The work was funded by the National
Cooperative Highway Research Program (NCHRP) Project 9-8 “Designing Stone Matrix Asphalt
Mixtures. ”
Objective
The objective of this study was to develop a simple, straightforward, and practical mixture
design procedure for SMA. Material and mixture criteria for SMA mixtures were also evaluated.
8/9/2019 Desarrollo de La Mezcla SMA
http://slidepdf.com/reader/full/desarrollo-de-la-mezcla-sma 6/34
Brown, Haddock, Mallick, and Lynn 2
Scope
A mixture design procedure was developed for SMA using either the Marshall hammer or
Superpave gyratory compactor (SGC) to compact specimens. Data was collected from a
laboratory study conducted with various types of aggregates, fillers, asphalt binders, and
stabilizing additives. The effects of varying different SMA mixture material components were
evaluated. Compacted mixtures were tested to evaluate the effects of aggregate structure, asphalt
binder, and mortar. Background information was collected from the FHWA sponsored SMA
Technical Working Group (TWG) in publication IS 118 (2).
This paper consists of an overview of SMA and the presentation of important aspects of
the mixture design procedure. Data to support the design procedure is also presented. Details of
the results from this study can be found in References (3) and (4).
SMA MIXTURE DESIGN PROCEDURE OVERVIEW
The SMA mixture design procedure was developed to ensure that SMA mixtures have an
adequate coarse aggregate skeleton and satisfactory mixture volumetric. No strength test is
recommended as part of this procedure; it is anticipated that the testing protocol eventually
adopted for Superpave will also be used for evaluating the quality of SMA mixtures.
The five basic steps in the mixture design procedure are:
1. Select materials,
2. Determine optimum aggregate gradation,
3. Determine optimum asphalt binder content,
4. Evaluate asphalt binder draindown potential, and

8/9/2019 Desarrollo de La Mezcla SMA
http://slidepdf.com/reader/full/desarrollo-de-la-mezcla-sma 7/34
Brown, Haddock, Mallick, and Lynn 3
5. Evaluate moisture susceptibility using AASHTO T 283.
Many of the specifications for material properties, gradation, and volumetric were established by
the TWG (2). As a result of this study, many of these requirements were verified or modified;
in some cases, new requirements were developed.
Table 1 lists the suggested requirements developed by the TWG (2) as well as those
parameters evaluated as part of this study. As indicated in Table 1, the SMA mixture design
study investigated aggregate toughness, flat and elongated particles, mixture aggregate gradation,
percent passing 0.020-mm sieve, stone-on-stone contact, Voids in the Total Mixture (VTM),
Voids in the Mineral Aggregate (VMA), asphalt binder content, compactive effort, and asphalt
binder draindown. These variables were chosen for inclusion in the study, because they seemed
to more directly affect the mixture design procedure than those factors that were not included.
For those elements not evaluated in this study, it is recommended that the requirements proposed
by the TWG be used. For those variables evaluated in this study, a discussion of the findings is
provided below.
DISCUSSION OF RESULTS
Aggregate Toughness
Aggregate toughness as measured by the Los Angeles abrasion test (AASHTO T 96) can
potentially affect aggregate breakdown and hence should be considered when designing all types
of HMA mixtures. A maximum loss value of 30 percent is specified in the TWG guidelines. In
evaluating aggregate toughness, the answers to two questions were sought: 1) Does the Los
Angeles abrasion loss correlate well with aggregate breakdown, and if so, 2) What should be
8/9/2019 Desarrollo de La Mezcla SMA
http://slidepdf.com/reader/full/desarrollo-de-la-mezcla-sma 8/34
Brown, Haddock, Mallick, and Lynn 4
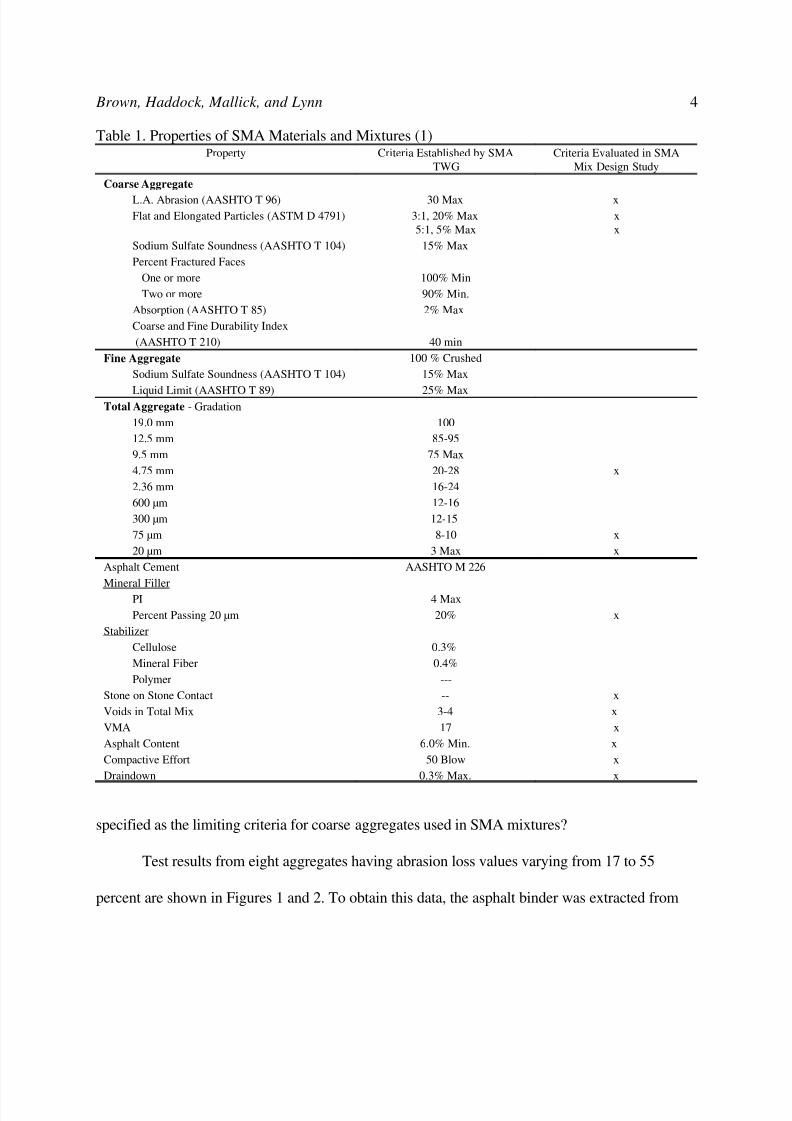
Table 1. Properties of SMA Materials and Mixtures (1)Property Criteria Established by SMA
TWG
Criteria Evaluated in SMA
Mix Design Study
Coarse Aggregate
L.A. Abrasion (AASHTO T 96) 30 Max x
Flat and Elongated Particles (ASTM D 4791) 3:1, 20% Max
5:1, 5% Max
x
x
Sodium Sulfate Soundness (AASHTO T 104) 15% Max
Percent Fractured Faces
One or more 100% Min
Two or more 90% Min.
Absorption (AASHTO T 85) 2% Max
Coarse and Fine Durability Index
(AASHTO T 210) 40 min
Fine Aggregate 100 % Crushed
Sodium Sulfate Soundness (AASHTO T 104) 15% Max
Liquid Limit (AASHTO T 89) 25% MaxTotal Aggregate - Gradation
19.0 mm 100
12.5 mm 85-95
9.5 mm 75 Max
4.75 mm 20-28 x
2.36 mm 16-24
600 µm 12-16
300 µm 12-15
75 µm 8-10 x
20 µm 3 Max x
Asphalt Cement AASHTO M 226
Mineral Filler
PI 4 Max
Percent Passing 20 µm 20% x
Stabilizer
Cellulose 0.3%
Mineral Fiber 0.4%
Polymer ---
Stone on Stone Contact -- x
Voids in Total Mix 3-4 x
VMA 17 x
Asphalt Content 6.0% Min. x
Compactive Effort 50 Blow x
Draindown 0.3% Max. x
specified as the limiting criteria for coarse aggregates used in SMA mixtures?
Test results from eight aggregates having abrasion loss values varying from 17 to 55
percent are shown in Figures 1 and 2. To obtain this data, the asphalt binder was extracted from

8/9/2019 Desarrollo de La Mezcla SMA
http://slidepdf.com/reader/full/desarrollo-de-la-mezcla-sma 9/34
Brown, Haddock, Mallick, and Lynn 5
Figure 1. Los Angeles abrasion loss versus change in percent passing 4.75 mm sieve(50 blow marshall compaction).
the compacted samples and the remaining aggregate graded according to AASHTO T27 and T
11. This after compaction gradation was then compared to the before compaction gradation to
establish the amount of aggregate breakdown during compaction. Figure 1 shows the correlation
between aggregate breakdown and aggregate toughness as measured by the abrasion loss for
Marshall compacted (50 blows) SMA samples. Figure 2 shows the same comparison for
8/9/2019 Desarrollo de La Mezcla SMA
http://slidepdf.com/reader/full/desarrollo-de-la-mezcla-sma 10/34
Brown, Haddock, Mallick, and Lynn 6
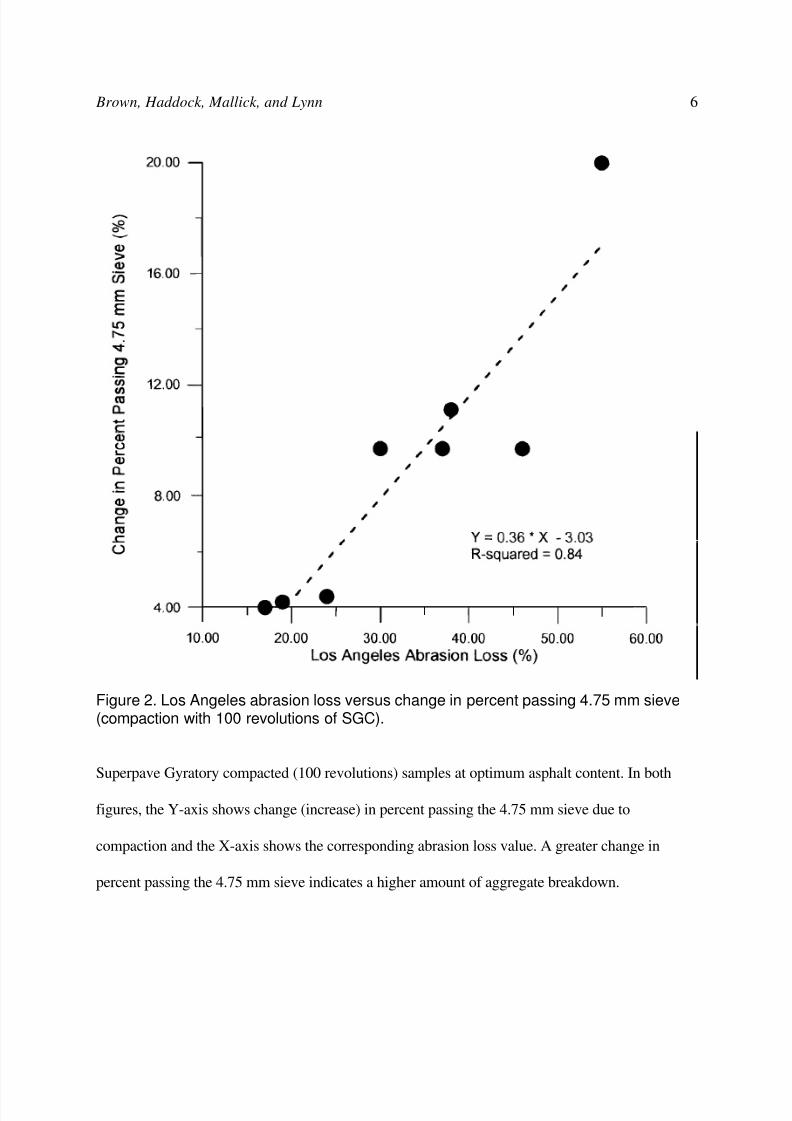
Figure 2. Los Angeles abrasion loss versus change in percent passing 4.75 mm sieve(compaction with 100 revolutions of SGC).
Superpave Gyratory compacted (100 revolutions) samples at optimum asphalt content. In both
figures, the Y-axis shows change (increase) in percent passing the 4.75 mm sieve due to
compaction and the X-axis shows the corresponding abrasion loss value. A greater change in
percent passing the 4.75 mm sieve indicates a higher amount of aggregate breakdown.

8/9/2019 Desarrollo de La Mezcla SMA
http://slidepdf.com/reader/full/desarrollo-de-la-mezcla-sma 11/34
Brown, Haddock, Mallick, and Lynn 7
Figures 1 and 2 indicate that there is a good correlation between aggregate toughness as
measured by the Los Angeles abrasion test for both Marshall (R2 = 0.62) and SGC (R2 = O. 84)
compaction. For both compactors, the amount of breakdown is approximately 8-10 percent for an
abrasion loss of 30 percent. This number increases to 12-14 percent at an abrasion loss value of
40 percent. However, while there is an evident correlation between aggregate toughness and
breakdown, the data does not show clearly that a 30 percent Los Angeles abrasion requirement is
satisfactory for SMA aggregates; it does show that increasing the permissible Los Angeles
abrasion loss value can result in greater aggregate breakdown. Therefore, an appropriate method
of establishing an abrasion loss criteria for SMA coarse aggregates may be to first determine the
amount of breakdown that occurs during SMA production and placement. After collecting this
data, the relationships in Figures 1 and 2 can be applied in selecting an acceptable abrasion loss
value.
Flat and Elongated Particle Content for Aggregate
To evaluate the effect of flat and elongated particles, aggregates from one source were
crushed using two different methods. One method produced flat and elongated particles, the other
more cubical particles. Using these two fractions in various proportions provided SMA mixtures
with varying amounts of flat and elongated particles. Mixtures were prepared with the 100
percent flat and elongated aggregate fraction, 75/25 percent flat and elongated/cubical, 50/50
percent flat and elongated/cubical, 25/75 percent flat and elongated/cubical, and 100 percent
cubical aggregate to provide five different SMA mixtures. Samples of these five mixtures were
compacted with 50 blows of the Marshall hammer and their before and after compaction
8/9/2019 Desarrollo de La Mezcla SMA
http://slidepdf.com/reader/full/desarrollo-de-la-mezcla-sma 12/34
Brown, Haddock, Mallick, and Lynn 8
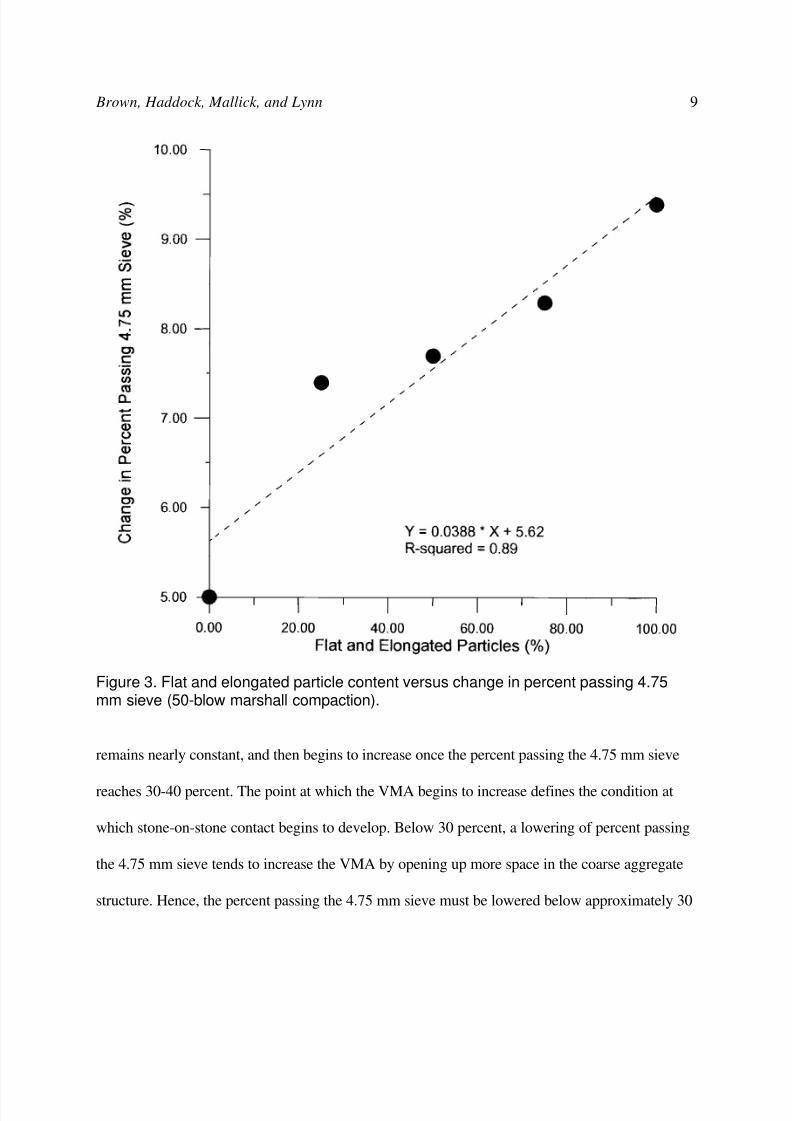
gradations were compared as described previously. The results are shown in Figure 3. The change
in percent passing the 4.75 mm sieve shows an increase (more breakdown) with increasing flat
and elongated particle content. There is an excellent correlation between flat and elongated
particle content and aggregate breakdown (R2 = 0.89).
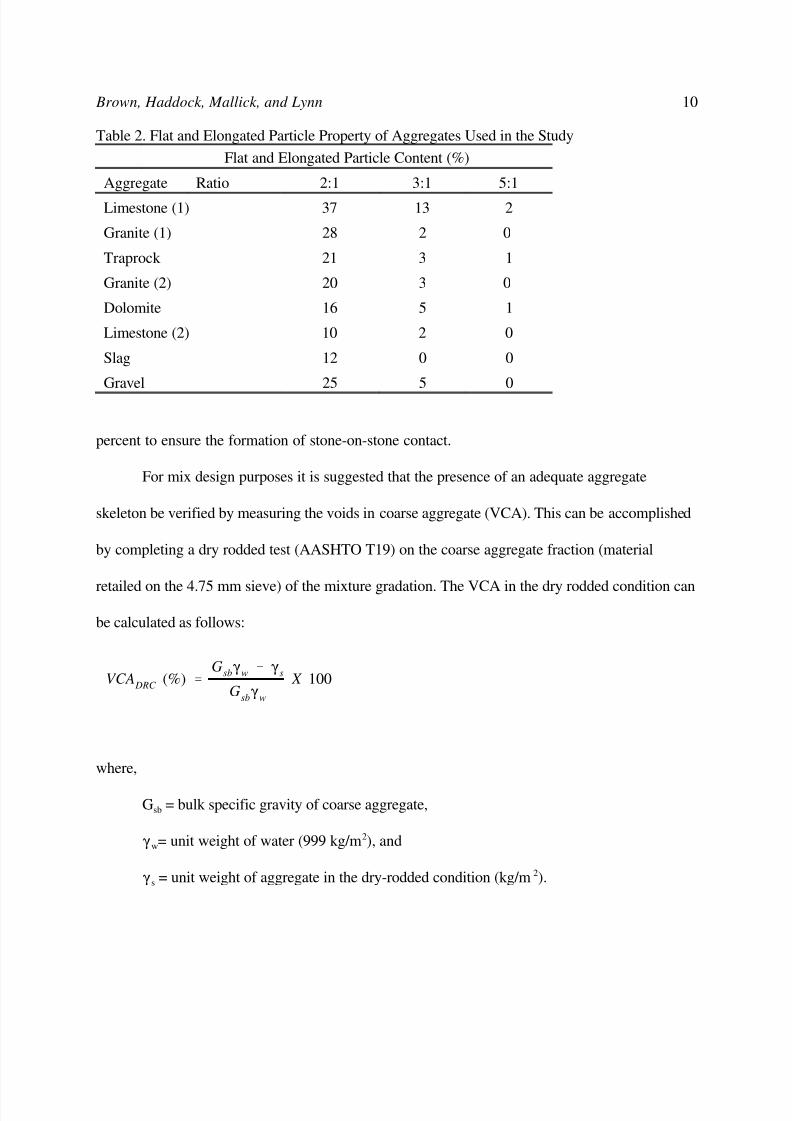
Current TWG guidelines specify limiting ratios of 3 to 1 and 5 to 1 for flat and elongated
particles. Of the eight aggregates selected for this study (two limestones, two granites, traprock,
dolomite, gravel, and slag), only the most flat and elongated aggregate had 2 percent of the
particles failing to meet the 5 to 1 ratio, whereas two of the aggregates had more than 10 percent
failing to meet the 3 to 1 ratio (Table 2). From an aggregate breakdown standpoint a limit needs
to be placed on the percentage of flat and elongated particles allowed in SMA coarse aggregates.
Note that the 5 to 1 ratio does not differentiate between the eight aggregates. In fact, not one of
the eight aggregates fails to meet the current TWG guidelines. More work is needed to better
establish these limits.
SMA Mixture Aggregate Gradation
The strength of SMA is primarily derived from a stone-on-stone contact skeleton structure
provided by properly graded aggregate material. The TWG aggregate gradation guidelines
suggest a range of 20-28 percent passing the 4.75 mm sieve to help ensure the formation of a
proper coarse aggregate skeleton and stone-on-stone contact in the SMA mixture. Previous work
by NCAT (5) has shown that the percent passing the 4.75 mm sieve is a critical factor in the
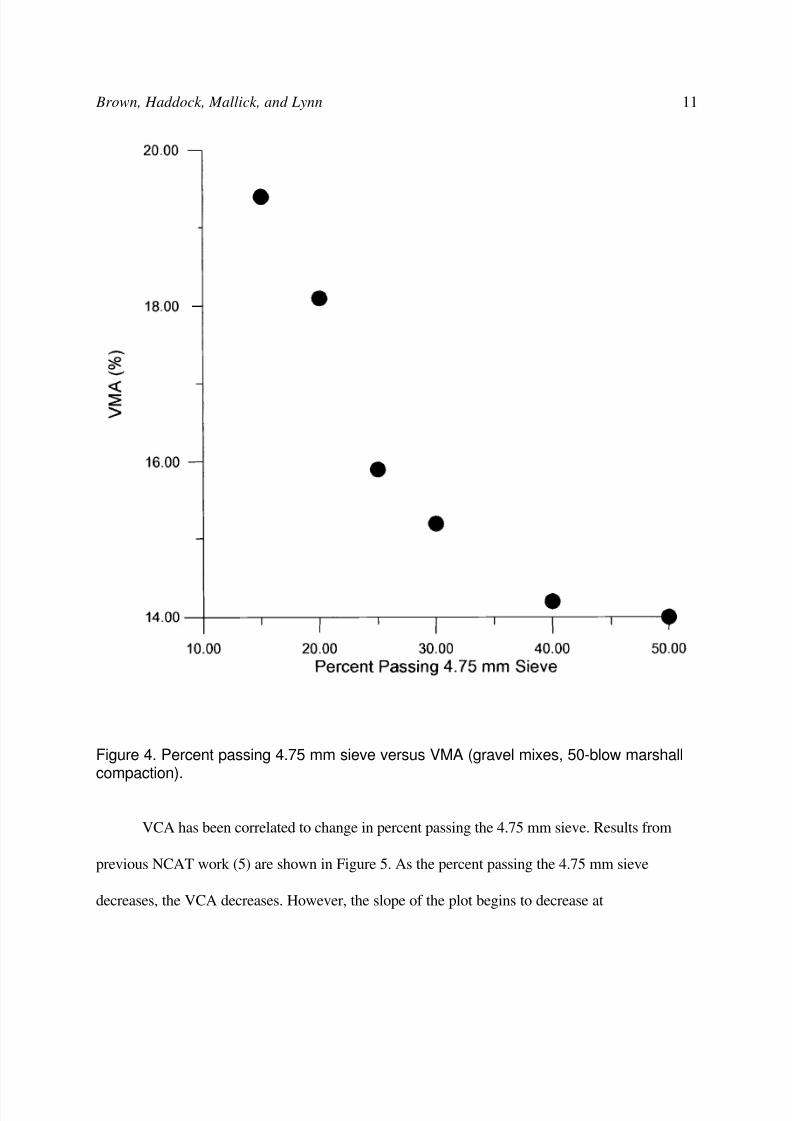
formation of stone-on-stone contact in SMA. Figure 4 shows the change in VMA with change in
percent passing the 4.75 mm sieve. As the percent passing the 4.75 mm sieve decreases, the VMA
8/9/2019 Desarrollo de La Mezcla SMA
http://slidepdf.com/reader/full/desarrollo-de-la-mezcla-sma 13/34
Brown, Haddock, Mallick, and Lynn 9
Figure 3. Flat and elongated particle content versus change in percent passing 4.75mm sieve (50-blow marshall compaction).
remains nearly constant, and then begins to increase once the percent passing the 4.75 mm sieve
reaches 30-40 percent. The point at which the VMA begins to increase defines the condition at
which stone-on-stone contact begins to develop. Below 30 percent, a lowering of percent passing
the 4.75 mm sieve tends to increase the VMA by opening up more space in the coarse aggregate
structure. Hence, the percent passing the 4.75 mm sieve must be lowered below approximately 30
8/9/2019 Desarrollo de La Mezcla SMA
http://slidepdf.com/reader/full/desarrollo-de-la-mezcla-sma 14/34
Brown, Haddock, Mallick, and Lynn 10
VCA DRC
(%) 'G
sb(
w& (
s
Gsb(
w
X 100
Table 2. Flat and Elongated Particle Property of Aggregates Used in the Study
Flat and Elongated Particle Content (%)
Aggregate Ratio 2:1 3:1 5:1
Limestone (1) 37 13 2
Granite (1) 28 2 0
Traprock 21 3 1
Granite (2) 20 3 0
Dolomite 16 5 1
Limestone (2) 10 2 0
Slag 12 0 0
Gravel 25 5 0
percent to ensure the formation of stone-on-stone contact.
For mix design purposes it is suggested that the presence of an adequate aggregate
skeleton be verified by measuring the voids in coarse aggregate (VCA). This can be accomplished
by completing a dry rodded test (AASHTO T19) on the coarse aggregate fraction (material
retailed on the 4.75 mm sieve) of the mixture gradation. The VCA in the dry rodded condition can
be calculated as follows:
where,
Gsb = bulk specific gravity of coarse aggregate,
(w= unit weight of water (999 kg/m2), and
(s = unit weight of aggregate in the dry-rodded condition (kg/m2).
8/9/2019 Desarrollo de La Mezcla SMA
http://slidepdf.com/reader/full/desarrollo-de-la-mezcla-sma 15/34
Brown, Haddock, Mallick, and Lynn 11
Figure 4. Percent passing 4.75 mm sieve versus VMA (gravel mixes, 50-blow marshallcompaction).
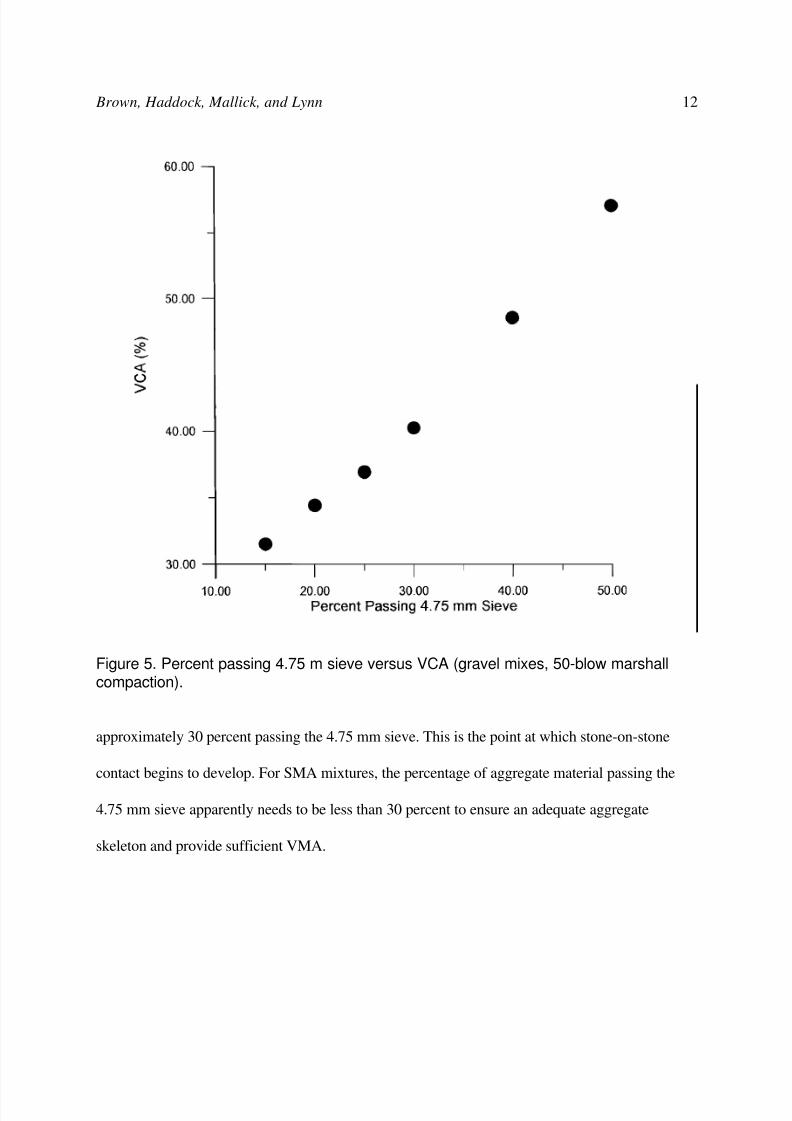
VCA has been correlated to change in percent passing the 4.75 mm sieve. Results from
previous NCAT work (5) are shown in Figure 5. As the percent passing the 4.75 mm sieve
decreases, the VCA decreases. However, the slope of the plot begins to decrease at
8/9/2019 Desarrollo de La Mezcla SMA
http://slidepdf.com/reader/full/desarrollo-de-la-mezcla-sma 16/34
Brown, Haddock, Mallick, and Lynn 12
Figure 5. Percent passing 4.75 m sieve versus VCA (gravel mixes, 50-blow marshallcompaction).
approximately 30 percent passing the 4.75 mm sieve. This is the point at which stone-on-stone
contact begins to develop. For SMA mixtures, the percentage of aggregate material passing the
4.75 mm sieve apparently needs to be less than 30 percent to ensure an adequate aggregate
skeleton and provide sufficient VMA.
8/9/2019 Desarrollo de La Mezcla SMA
http://slidepdf.com/reader/full/desarrollo-de-la-mezcla-sma 17/34
Brown, Haddock, Mallick, and Lynn 13
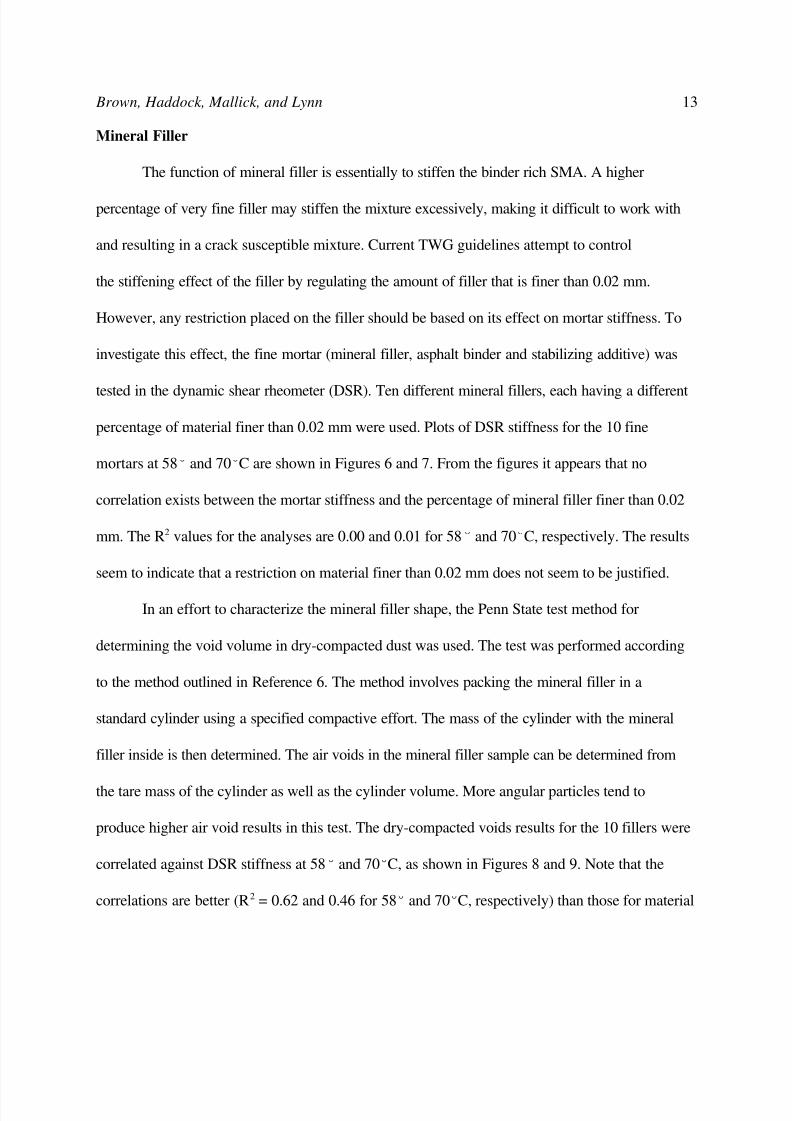
Mineral Filler
The function of mineral filler is essentially to stiffen the binder rich SMA. A higher
percentage of very fine filler may stiffen the mixture excessively, making it difficult to work with
and resulting in a crack susceptible mixture. Current TWG guidelines attempt to control
the stiffening effect of the filler by regulating the amount of filler that is finer than 0.02 mm.
However, any restriction placed on the filler should be based on its effect on mortar stiffness. To
investigate this effect, the fine mortar (mineral filler, asphalt binder and stabilizing additive) was
tested in the dynamic shear rheometer (DSR). Ten different mineral fillers, each having a different
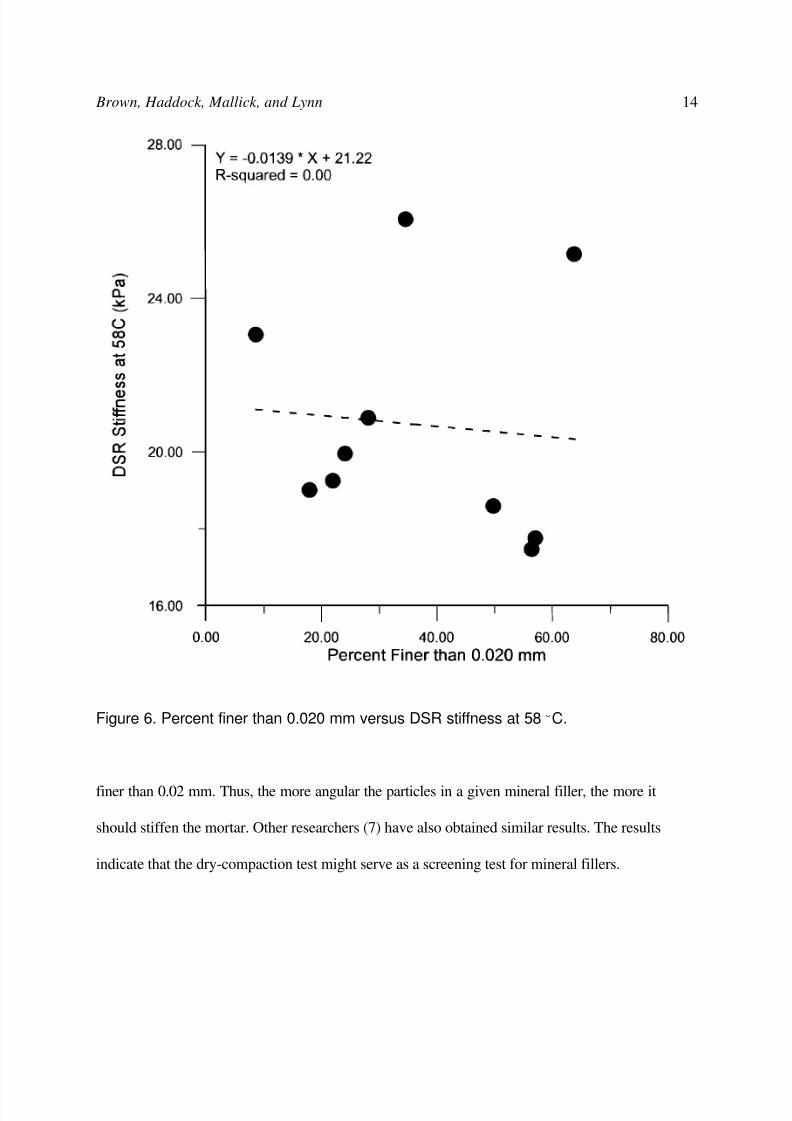
percentage of material finer than 0.02 mm were used. Plots of DSR stiffness for the 10 fine
mortars at 58E and 70EC are shown in Figures 6 and 7. From the figures it appears that no
correlation exists between the mortar stiffness and the percentage of mineral filler finer than 0.02
mm. The R2 values for the analyses are 0.00 and 0.01 for 58E and 70EC, respectively. The results
seem to indicate that a restriction on material finer than 0.02 mm does not seem to be justified.
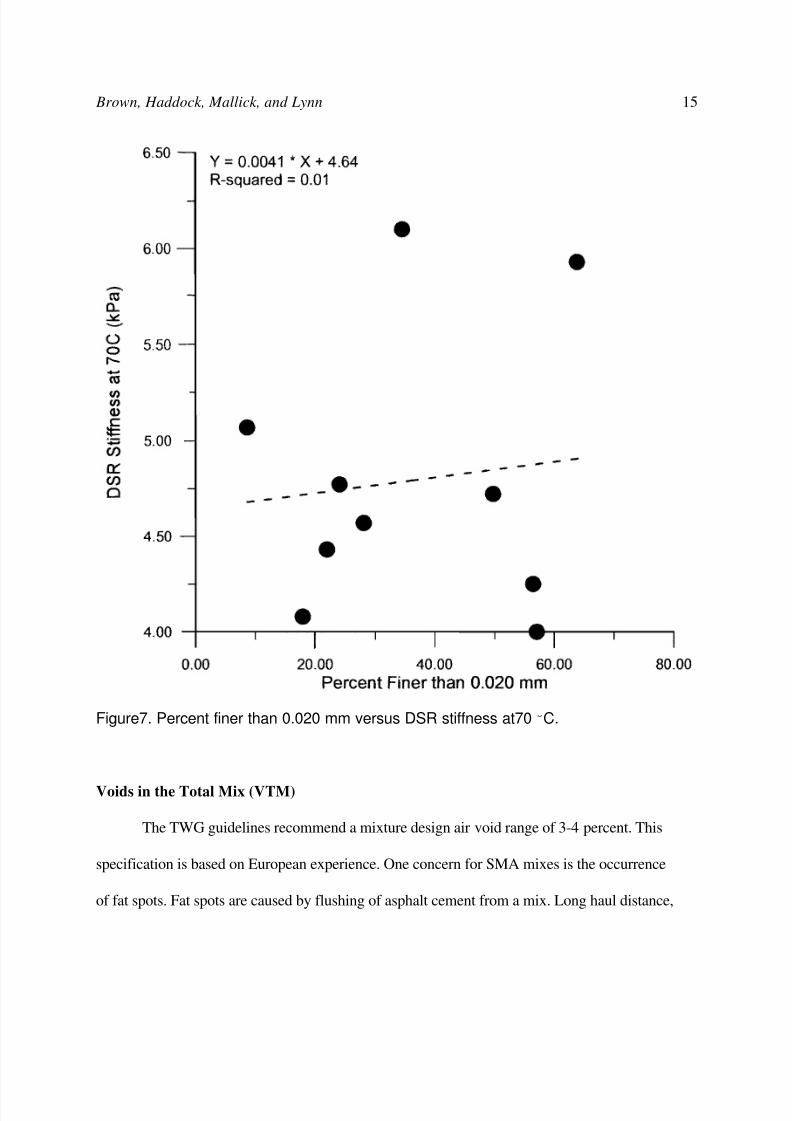
In an effort to characterize the mineral filler shape, the Penn State test method for
determining the void volume in dry-compacted dust was used. The test was performed according
to the method outlined in Reference 6. The method involves packing the mineral filler in a
standard cylinder using a specified compactive effort. The mass of the cylinder with the mineral
filler inside is then determined. The air voids in the mineral filler sample can be determined from
the tare mass of the cylinder as well as the cylinder volume. More angular particles tend to
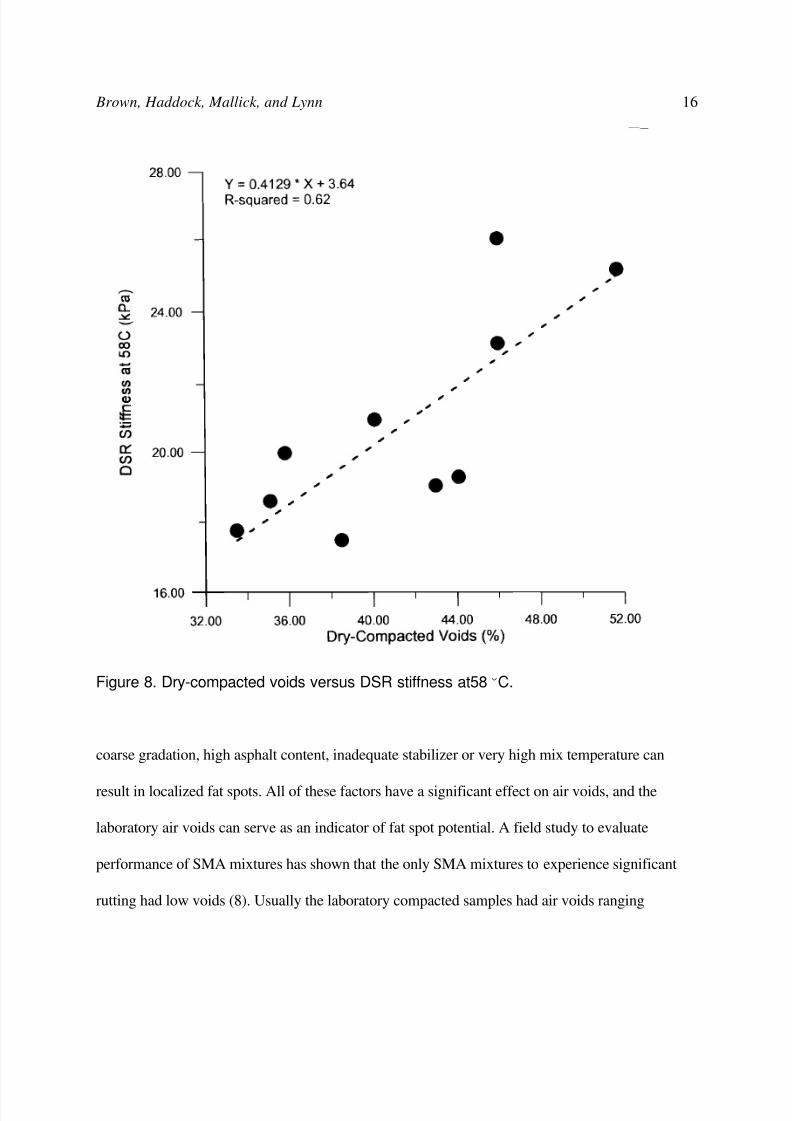
produce higher air void results in this test. The dry-compacted voids results for the 10 fillers were
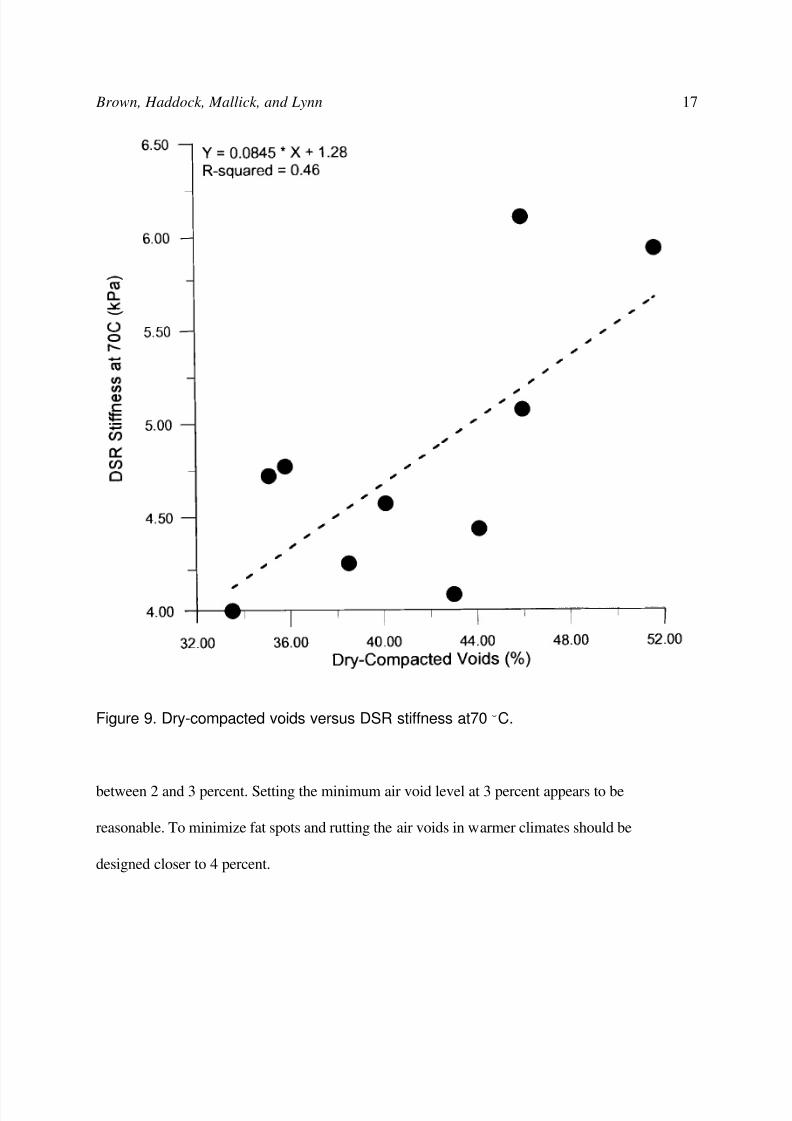
correlated against DSR stiffness at 58E and 70EC, as shown in Figures 8 and 9. Note that the
correlations are better (R2 = 0.62 and 0.46 for 58E and 70EC, respectively) than those for material
8/9/2019 Desarrollo de La Mezcla SMA
http://slidepdf.com/reader/full/desarrollo-de-la-mezcla-sma 18/34
Brown, Haddock, Mallick, and Lynn 14
Figure 6. Percent finer than 0.020 mm versus DSR stiffness at 58EC.
finer than 0.02 mm. Thus, the more angular the particles in a given mineral filler, the more it
should stiffen the mortar. Other researchers (7) have also obtained similar results. The results
indicate that the dry-compaction test might serve as a screening test for mineral fillers.
8/9/2019 Desarrollo de La Mezcla SMA
http://slidepdf.com/reader/full/desarrollo-de-la-mezcla-sma 19/34
Brown, Haddock, Mallick, and Lynn 15
Figure7. Percent finer than 0.020 mm versus DSR stiffness at70EC.
Voids in the Total Mix (VTM)
The TWG guidelines recommend a mixture design air void range of 3-4 percent. This
specification is based on European experience. One concern for SMA mixes is the occurrence
of fat spots. Fat spots are caused by flushing of asphalt cement from a mix. Long haul distance,
8/9/2019 Desarrollo de La Mezcla SMA
http://slidepdf.com/reader/full/desarrollo-de-la-mezcla-sma 20/34
Brown, Haddock, Mallick, and Lynn 16
Figure 8. Dry-compacted voids versus DSR stiffness at58EC.
coarse gradation, high asphalt content, inadequate stabilizer or very high mix temperature can
result in localized fat spots. All of these factors have a significant effect on air voids, and the
laboratory air voids can serve as an indicator of fat spot potential. A field study to evaluate
performance of SMA mixtures has shown that the only SMA mixtures to experience significant
rutting had low voids (8). Usually the laboratory compacted samples had air voids ranging
8/9/2019 Desarrollo de La Mezcla SMA
http://slidepdf.com/reader/full/desarrollo-de-la-mezcla-sma 21/34
Brown, Haddock, Mallick, and Lynn 17
Figure 9. Dry-compacted voids versus DSR stiffness at70EC.
between 2 and 3 percent. Setting the minimum air void level at 3 percent appears to be
reasonable. To minimize fat spots and rutting the air voids in warmer climates should be
designed closer to 4 percent.
8/9/2019 Desarrollo de La Mezcla SMA
http://slidepdf.com/reader/full/desarrollo-de-la-mezcla-sma 22/34
Brown, Haddock, Mallick, and Lynn 18
Voids in the Mineral Aggregate (VMA)
The primary purpose of the VMA requirement is to ensure a reasonably high asphalt
content. This can be accomplished by specifying a minimum asphalt content or a minimum VMA.
The best approach is to specify minimum VMA because it is calculated on a volume basis
and is not affected by aggregate specific gravity. Also, it is often difficult to meet minimum
asphalt content requirements when high specific gravity aggregates are used.
Establishing the gradation limits so that 20-28 percent of the aggregate passes the 4.75
mm sieve helps to ensure that minimum VMA requirements are met. However, aggregates that
tend to break down excessively during compaction may not provide a mixture that meets VMA
requirements. Generally speaking, when the Los Angeles abrasion loss value is low
(approximately 20 and lower), meeting VMA requirements is not difficult; when the abrasion loss
is high (approximately 40 and higher), meeting the VMA requirement is more difficult.
Based on a number of mixture designs and limited field experience, it appears that a VMA
requirement of 17 percent minimum is reasonable and should continue to be specified.
Asphalt Content
The TWG (2) has recommended that a minimum asphalt binder content of 6 percent be
used in SMA mixtures. This requirement can be used but is not needed as long as minimum VMA
requirements are met. The minimum asphalt binder content requirement should therefore be
deleted in favor of the minimum VMA requirement.
8/9/2019 Desarrollo de La Mezcla SMA
http://slidepdf.com/reader/full/desarrollo-de-la-mezcla-sma 23/34
Brown, Haddock, Mallick, and Lynn 19
Compactive Method and Effort
The compactive effort specified by the TWG (2) is 50 blows of the mechanical Marshall
hammer. This was based on European experience where 50-blow Marshall has long been used for
compacting SMA. With the advent of the Superpave system, it is now important for the mix
designer to have the option of using the SGC for SMA mixtures. Recent work done by NCAT (5)
indicates that 50 blows of the Marshall hammer produces a density in SMA mixtures
approximately equivalent to 100 revolutions of the SGC. To investigate this, two mixture designs
were completed for each of the eight aggregates used in the study. One design used 50-blow
Marshall to compact the laboratory specimens. The second design used 100 revolutions of the
SGC to compact specimens. The resulting data is shown in Figure 10 and indicates that 100
revolutions of the SGC, on the average results in the same optimum asphalt binder content and
thus the same density as produced by 50-blow Marshall compaction. Until further guidance is
provided, it is recommended that SMA mixtures be compacted with 50-blow Marshall or 100
revolutions of the SGC.
Aggregate Breakdown
The amount of aggregate breakdown produced by 50-blow Marshall and 100 revolutions
of the SGC was quantified and compared. This was done by extracting the asphalt binder from
compacted specimens, performing a gradation analysis, and comparing the results to the pre-
compaction gradation. The results for the 4.75 and 0.075 mm sieves are shown in Figures 11 and
12, respectively. The results show that the SGC produces less aggregate breakdown than does the
Marshall hammer.

8/9/2019 Desarrollo de La Mezcla SMA
http://slidepdf.com/reader/full/desarrollo-de-la-mezcla-sma 24/34
Brown, Haddock, Mallick, and Lynn 20
Figure 10. Optimum asphalt content from marshall compaction versus optimum asphaltContent from SGC compaction.
A further investigation of aggregate breakdown was done by comparing the amount of
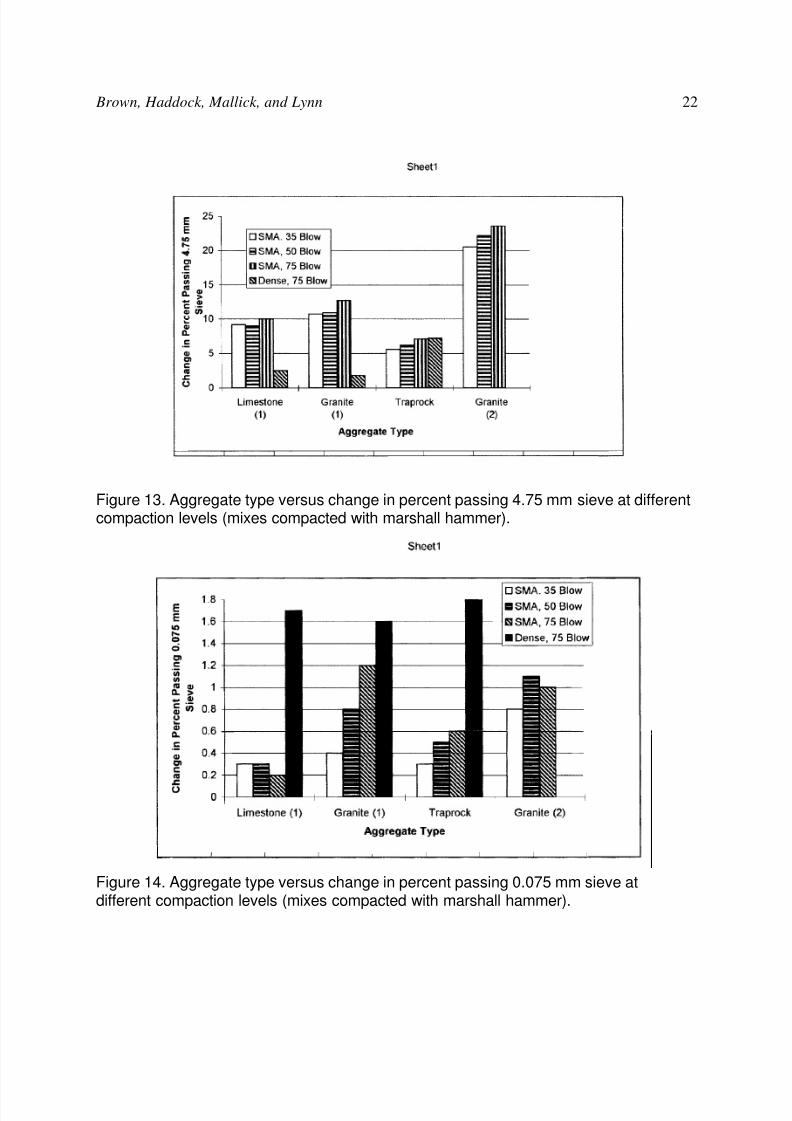
breakdown produced at different levels of Marshall and SGC compaction. Figures 13 and 14
show plots of changes in percent passing the 4.75 and 0.075 mm sieves for four different mixtures
each compacted with 35, 50 and 75 blows of Marshall hammer. Results from dense-graded

8/9/2019 Desarrollo de La Mezcla SMA
http://slidepdf.com/reader/full/desarrollo-de-la-mezcla-sma 25/34
Brown, Haddock, Mallick, and Lynn 21
Figure 11. Aggregate type versus change in percent passing 4.75 mm sieve.
Figure 12. Aggregate type versus change in percent passing 0.075 m sieve.
8/9/2019 Desarrollo de La Mezcla SMA
http://slidepdf.com/reader/full/desarrollo-de-la-mezcla-sma 26/34
Brown, Haddock, Mallick, and Lynn 22
Figure 13. Aggregate type versus change in percent passing 4.75 mm sieve at differentcompaction levels (mixes compacted with marshall hammer).
Figure 14. Aggregate type versus change in percent passing 0.075 mm sieve atdifferent compaction levels (mixes compacted with marshall hammer).
8/9/2019 Desarrollo de La Mezcla SMA
http://slidepdf.com/reader/full/desarrollo-de-la-mezcla-sma 27/34
Brown, Haddock, Mallick, and Lynn 23
mixtures for three aggregates and compacted with 75 blows are also shown. The data shows that
the amount of aggregate breakdown does increase as the blow count increases. The amount of
breakdown is also dependent on aggregate type for both the 4.75 and 0.075 mm sieves. When the
breakdown of SMA and dense-graded mixtures is compared, it is observed that for the amount of
coarse aggregate breakdown is higher for SMA mixtures than for dense-graded mixtures.
However, the increase in dust (material passing the 0.075 mm sieve) is higher for the dense-
graded mixture. One plausible explanation for this is that since the dense-graded mixtures have a
graded aggregate structure, the coarse aggregate is not broken into smaller coarse aggregate
particles, but rather they are degraded into much finer size. When added together this yields a
significant increase in the amount passing the 0.075 mm sieve. In comparison, the SMA mixtures
are gap graded and the majority of breakdown occurs in the coarse aggregate sizes where the
particles are broken into smaller coarse aggregate particles.
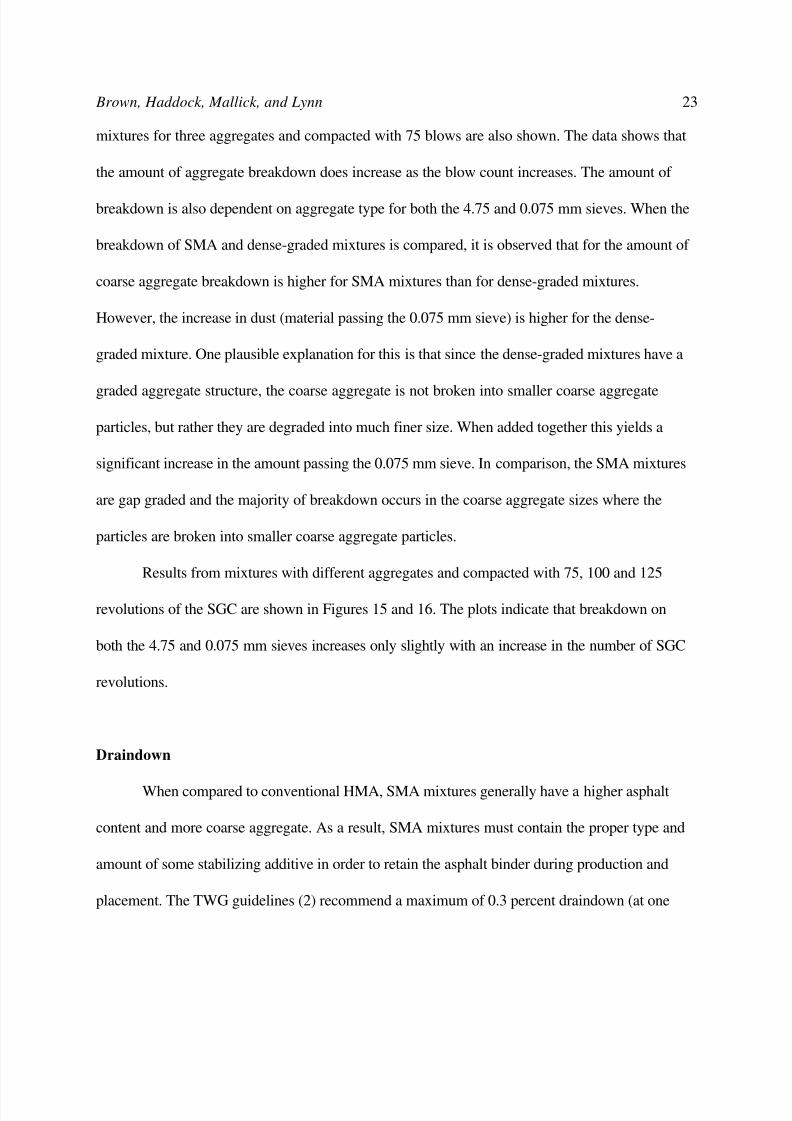
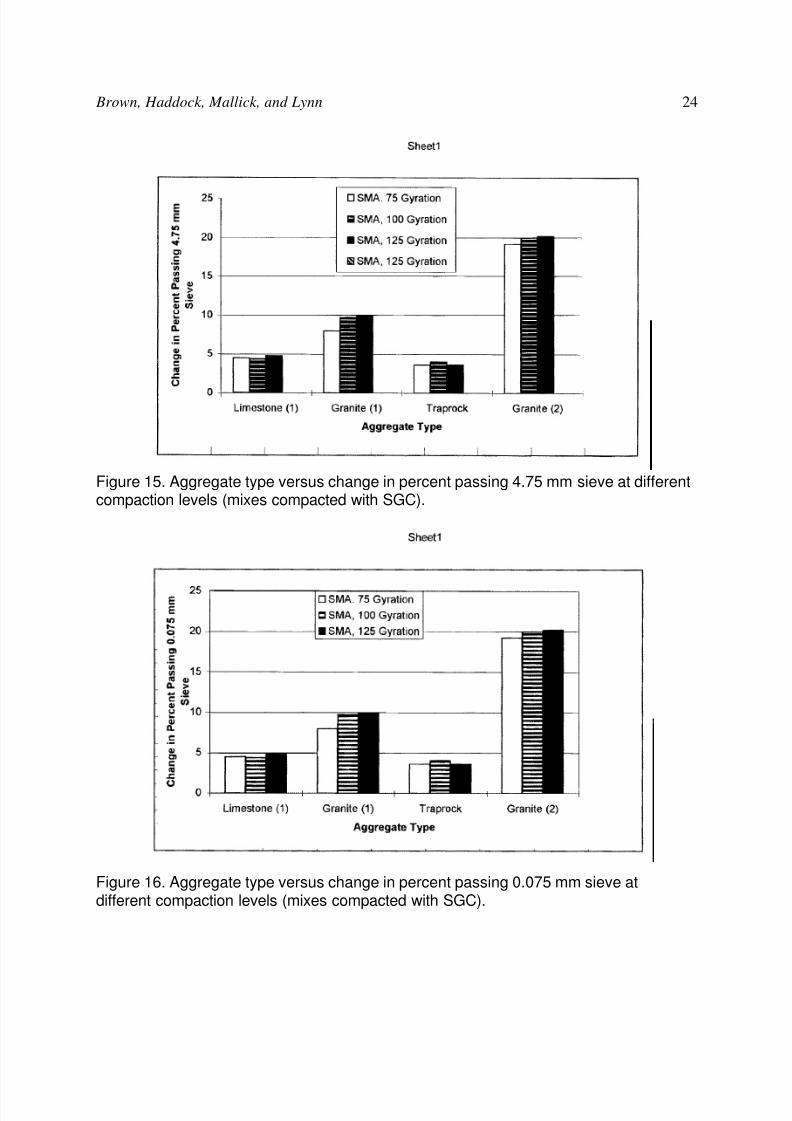
Results from mixtures with different aggregates and compacted with 75, 100 and 125
revolutions of the SGC are shown in Figures 15 and 16. The plots indicate that breakdown on
both the 4.75 and 0.075 mm sieves increases only slightly with an increase in the number of SGC
revolutions.
Draindown
When compared to conventional HMA, SMA mixtures generally have a higher asphalt
content and more coarse aggregate. As a result, SMA mixtures must contain the proper type and
amount of some stabilizing additive in order to retain the asphalt binder during production and
placement. The TWG guidelines (2) recommend a maximum of 0.3 percent draindown (at one
8/9/2019 Desarrollo de La Mezcla SMA
http://slidepdf.com/reader/full/desarrollo-de-la-mezcla-sma 28/34
Brown, Haddock, Mallick, and Lynn 24
Figure 15. Aggregate type versus change in percent passing 4.75 mm sieve at differentcompaction levels (mixes compacted with SGC).
Figure 16. Aggregate type versus change in percent passing 0.075 mm sieve atdifferent compaction levels (mixes compacted with SGC).

8/9/2019 Desarrollo de La Mezcla SMA
http://slidepdf.com/reader/full/desarrollo-de-la-mezcla-sma 29/34
Brown, Haddock, Mallick, and Lynn 25
Figure 17. Stabilizer type versus draindown.
hour), as indicated by the NCAT Draindown Test. This fast and inexpensive test has been shown
to be capable of evaluating the effect of mixture design parameters such as percent passing the
4.75 mm sieve, asphalt content, and type and amount of stabilizer. It should be noted that the
results shown here are from laboratory tests. The draindown test can also be used as a field check
tool. When used in the field, a lower specified value of draindown may be necessary to allow for
variations.
To evaluate the effect of stabilizer type, five mixtures were tested in the draindown test.
Each of the mixtures was equivalent except for the type of stabilizer employed. The stabilizer
types were SBS, polyolefin, cellulose fiber, and rock wool fiber. The fifth mixture was a control
and contained no stabilizing additive. The results at 140E, 155E, and 170EC are shown in Figure
17. The results clearly indicate the importance of using the proper type of stabilizing additive.

8/9/2019 Desarrollo de La Mezcla SMA
http://slidepdf.com/reader/full/desarrollo-de-la-mezcla-sma 30/34
Brown, Haddock, Mallick, and Lynn 26
Note that fibers act to prevent draindown better than polymers.
Rut Resistance
The primary reason for using SMA mixtures is that they have proven to be superior to
conventional HMA in terms of rutting resistance. However, the type of stabilizer can have an
effect on SMA rut resistance capabilities. To evaluate this effect laboratory wheel tracking tests
were conducted. Slab samples of SMA were prepared with traprock aggregates at optimum
asphalt content, and using two different stabilizers, SBS polymer and rock wool fiber. Slabs with
no stabilizer were also tested. The slabs were tested for rutting rate with a Danish wheel tracking
device at 55EC. Temperature is maintained by water immersion. The total and the last hour
rutting rate were obtained and are shown in Figure 18. Note that the mixture with no stabilizer
has the highest rutting rate. Of the two mixtures with stabilizers, the SBS polymer mix has a
significantly lower rutting late compared to the rock wool fiber mix. Hence, the indication is that
polymer stabilizers produce better rut resistant mixes, but fiber stabilizers are superior in
preventing draindown in SMA mixes. As noted elsewhere (9), a combination of fibers and
polymers may provide the best properties in SMA mixtures.
SUMMARY
A list of requirements for SMA mixture design and construction was published by the
National Asphalt Pavement Association in 1991. These requirements were developed by the SMA
TWG and were based on the European experience with SMA. Hence, the criteria indicated by the
SMA TWG in the NAPA report needed to be evaluated on the basis of mixture design and

8/9/2019 Desarrollo de La Mezcla SMA
http://slidepdf.com/reader/full/desarrollo-de-la-mezcla-sma 31/34
Brown, Haddock, Mallick, and Lynn 27
Figure 18. Stabilizer type versus rutting rate.
construction practices in the United States.
This study has produced a mixture design procedure and material evaluation procedure for
SMA mixtures. Factors evaluated were Los Angeles abrasion loss, flat and elongated particle
content, mixture aggregate gradation, percent of filler finer than 0.02 mm, stone-on-stone contact,
VTM, VMA, asphalt binder content, compactive effort, draindown sensitivity, and rutting
potential. The specific conclusions are as follows:
(1) Aggregate toughness as measured by the Los Angeles abrasion test showed good
correlation with aggregate breakdown. An increase in abrasion loss resulted in an
increase in aggregate breakdown for mixtures compacted with both the Marshall
8/9/2019 Desarrollo de La Mezcla SMA
http://slidepdf.com/reader/full/desarrollo-de-la-mezcla-sma 32/34
Brown, Haddock, Mallick, and Lynn 28
hammer and Superpave gyratory compactor. Therefore, a limit on abrasion loss is
justified to help minimize aggregate breakdown. The limit of 30 recommended by the
SMA TWG appears to be reasonable.
(2) The 5 to 1 flat and elongated particle content criteria appear to be too liberal. It
appears that the 2 to 1 or 3 to 1 flat and elongated particles criterion will provide a
much better separation between the various aggregates than the 5 to 1 ratio.
(3) The flat and elongated particle content shows excellent correlation with aggregate
breakdown. Aggregate breakdown increased with an increase in flat and elongated
particle content.
(4) In a SMA mix, the percent passing 4.75 mm sieve must be below 30 percent to
ensure proper stone-on-stone contact. Stone-on-stone contact can be evaluated by
plotting VMA or VCA versus the percent passing the 4.75 mm sieve. The dry
rodded test, as outlined in AASHTO T19 can be used to determine the limiting VCA
for a SMA mixture.
(5) The percent of filler finer than 0.02 mm did not correlate with mortar stiffness.
Hence, the criterion for limiting the percent finer than 0.02 mm should be removed
from the guidelines. The dry-compacted volume as obtained from the Penn State test
method showed a better correlation with mortar stiffness and can be utilized to
characterize the shape of filler. Generally, a more angular filler tends to produce a
higher air voids result in this test.
(6) A field study showed that rutting has been negligible in SMA pavements constructed
in the United States since 1991. However, for the pavements with air voids falling
8/9/2019 Desarrollo de La Mezcla SMA
http://slidepdf.com/reader/full/desarrollo-de-la-mezcla-sma 33/34
Brown, Haddock, Mallick, and Lynn 29
below the 3 percent range, some rutting has been observed.
(7) The VMA of a SMA mixture can be significantly lowered due to aggregate
breakdown. Hence, the mix designer must consider aggregate type, compactor type,
and compactive effort along with the gradation when attempting to design SMA and
meet the required VMA criterion. Specifying a minimum asphalt content can result
in significant differences in optimum asphalt binder content due to different
aggregate specific gravities. Even with sufficiently high VMA values, the optimum
asphalt content by weight may be relatively low when using aggregates with high
specific gravities.
(8) Fifty blows of the Marshall hammer is approximately equal to 100 revolutions of the
Superpave gyratory compacter in terms of resultant SMA density. The Superpave
gyratory compacter produces less aggregate breakdown than the Marshall hammer.
However, for both compactors, the amount of breakdown is affected by aggregate
type and compactive effort.
(9) Fiber stabilizers are found to be more effective in reducing draindown than polymer
stabilizers. However, mixtures modified with polymers show better resistance to
rutting in laboratory wheel tracking tests.
REFERENCES
1. Bukowski, J. Stone Mastic Asphalt Test and Evaluation Project No. 18. Office of
Technology Applications, FHWA, December 1991.
2. National Asphalt Pavement Association. Guidelines for Materials, Production, and
8/9/2019 Desarrollo de La Mezcla SMA
http://slidepdf.com/reader/full/desarrollo-de-la-mezcla-sma 34/34
Brown, Haddock, Mallick, and Lynn 30
Placement of Stone Matrix Asphalt (SMA), IS 118, 1994.
3. Brown, E. R., J. E. Haddock, C. Crawford, C. S. Hughes, and T. A. Lynn. Designing
Stone Matrix Asphalt Mixtures Volume II - Research Results. Interim Report Prepared
for National Cooperative Highway Research Program, TRB, National Research Council.
National Center for Asphalt Technology, Auburn University, AL 36849-5354, May 1995.
4. Brown, E. R., J. E. Haddock, T. A. Lynn, and Rajib B. Mallick. Designing Stone Matrix
Asphalt Mixtures Volume II - Research Results. Final Report Prepared for National
Cooperative Highway Research Program, TRB, National Research Council. National
Center for Asphalt Technology, Auburn University, AL 36849-5354, September 1996.
5. Brown, E. R. and Rajib B. Mallick. Stone Matrix Asphalt Properties Related to Mixture
Design. Report No. 94-2. National Center for Asphalt Technology, Auburn University,
AL 36849-5354, February 1994.
6. National Asphalt Pavement Association. Guidelines on the Use of Baghouse Fines, IS 101,
1987.
7. Harris, Basil M., and Kevin D. Stuart. Analysis of Mineral Fillers and Mastics Used in
Stone Matrix Asphalt. Proceedings of the Association of Asphalt Paving Technologists,
Vol. 64, 1995.
8. Brown, E. R., Rajib B. Mallick, John E. Haddock, and John Bukowski. Performance of
Stone Matrix Asphalt (SMA) Mixtures in the United States. Proceedings of the
Association of Asphalt Paving Technologists, Volume 66, 1997.
9. Stuart, K. D. Stone Mastic Asphalt (SMA) Mixture Design. Report No. FHWA-RD-92-
006 FHWA March 1992