
DR. RODRIGO DONOSO MACUADA SERVICIO … Viabilidad.pdf · Diseño del estudio: 16 obstetras y 15...
45
DR. RODRIGO DONOSO MACUADA SERVICIO NEONATOLOGÍA HOSPITAL PUERTO MONTT
-
Upload
truongthuy -
Category
Documents
-
view
214 -
download
0
Transcript of DR. RODRIGO DONOSO MACUADA SERVICIO … Viabilidad.pdf · Diseño del estudio: 16 obstetras y 15...
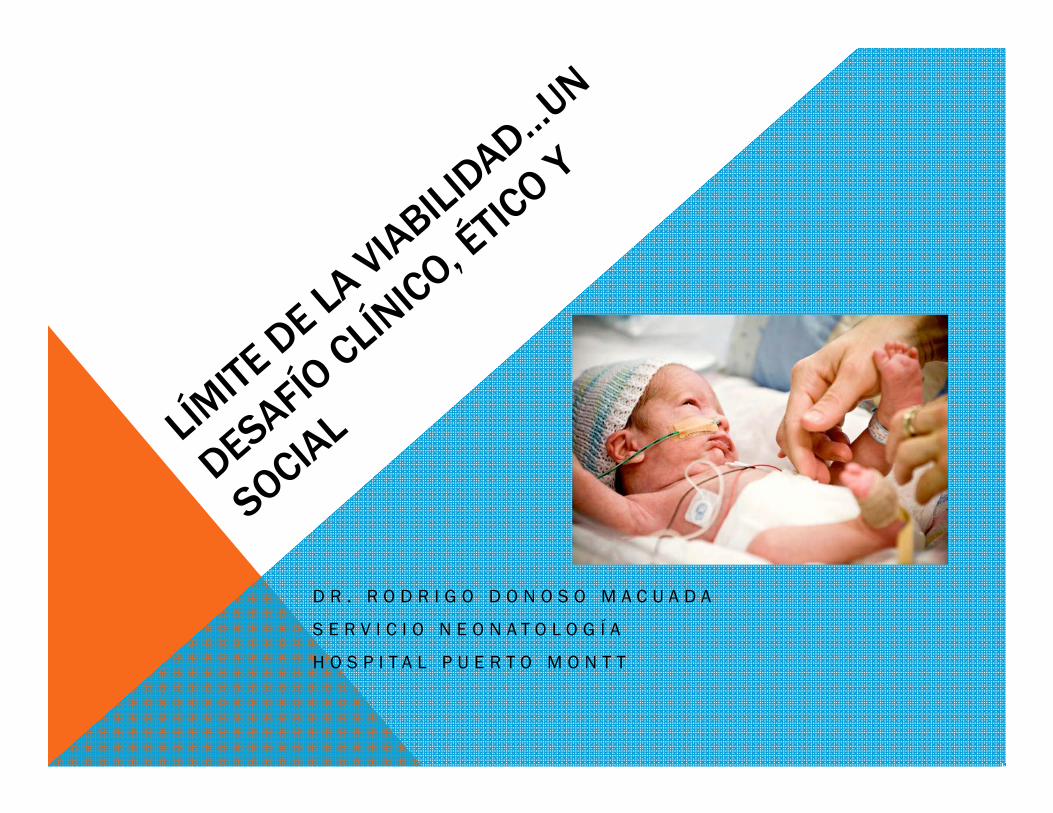
D R . R O D R I G O D O N O S O M A C U A D A
S E R V I C I O N E O N A T O L O G Í A
H O S P I T A L P U E R T O M O N T T
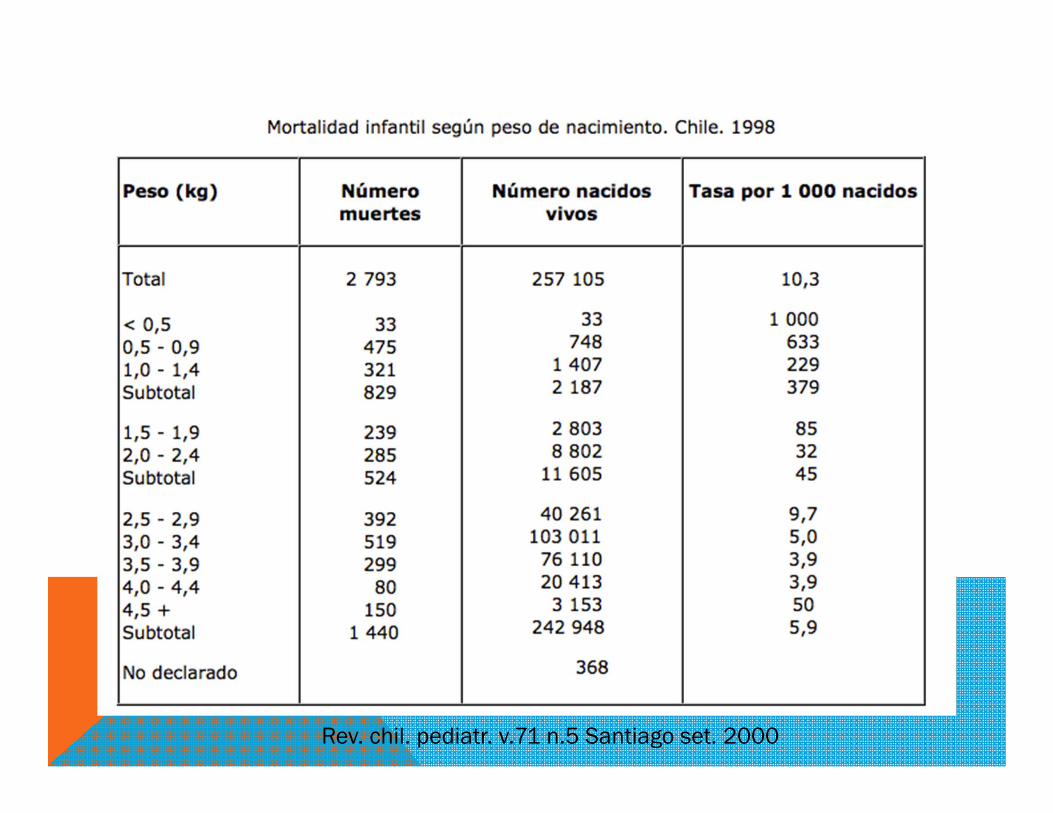
Rev. chil. pediatr. v.71 n.5 Santiago set. 2000
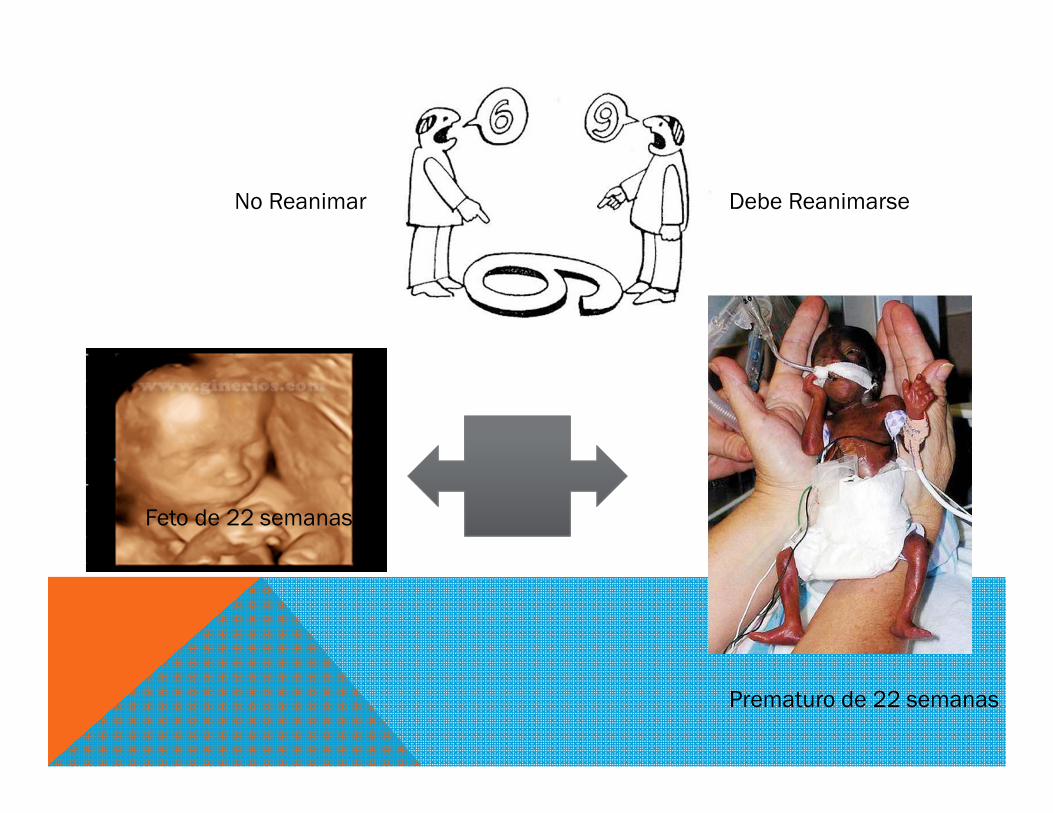
Feto de 22 semanas
Prematuro de 22 semanas
No Reanimar Debe Reanimarse

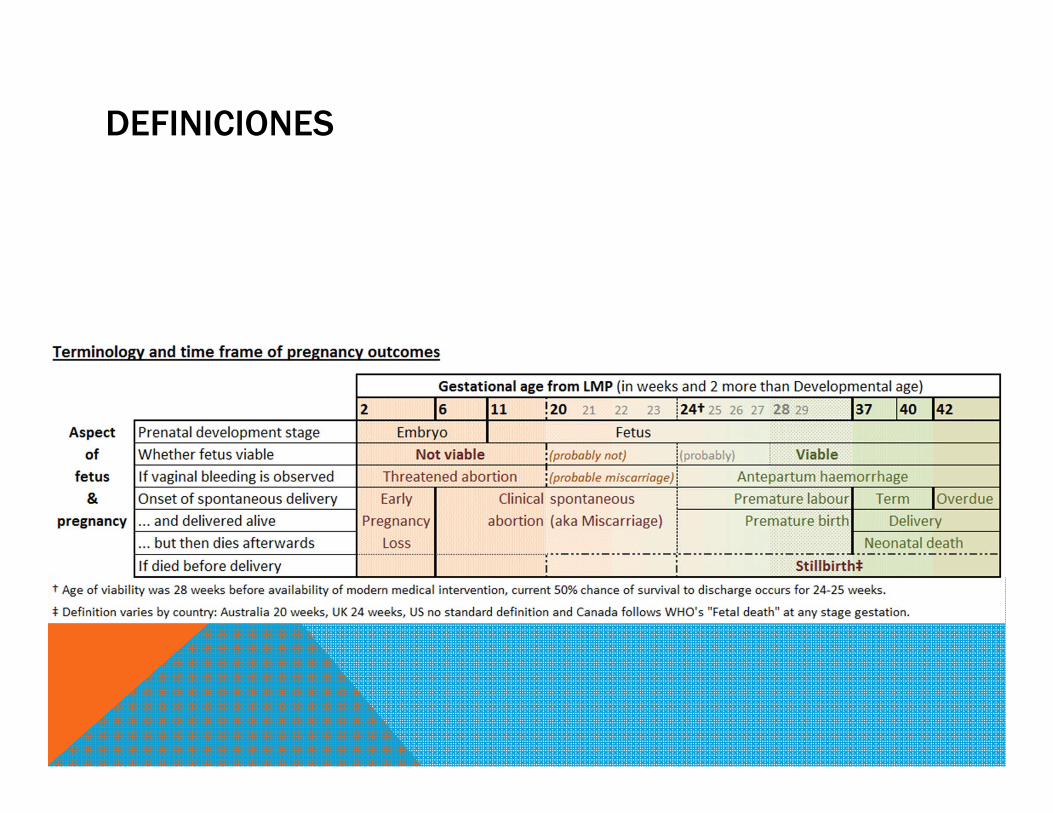
DEFINICIONES

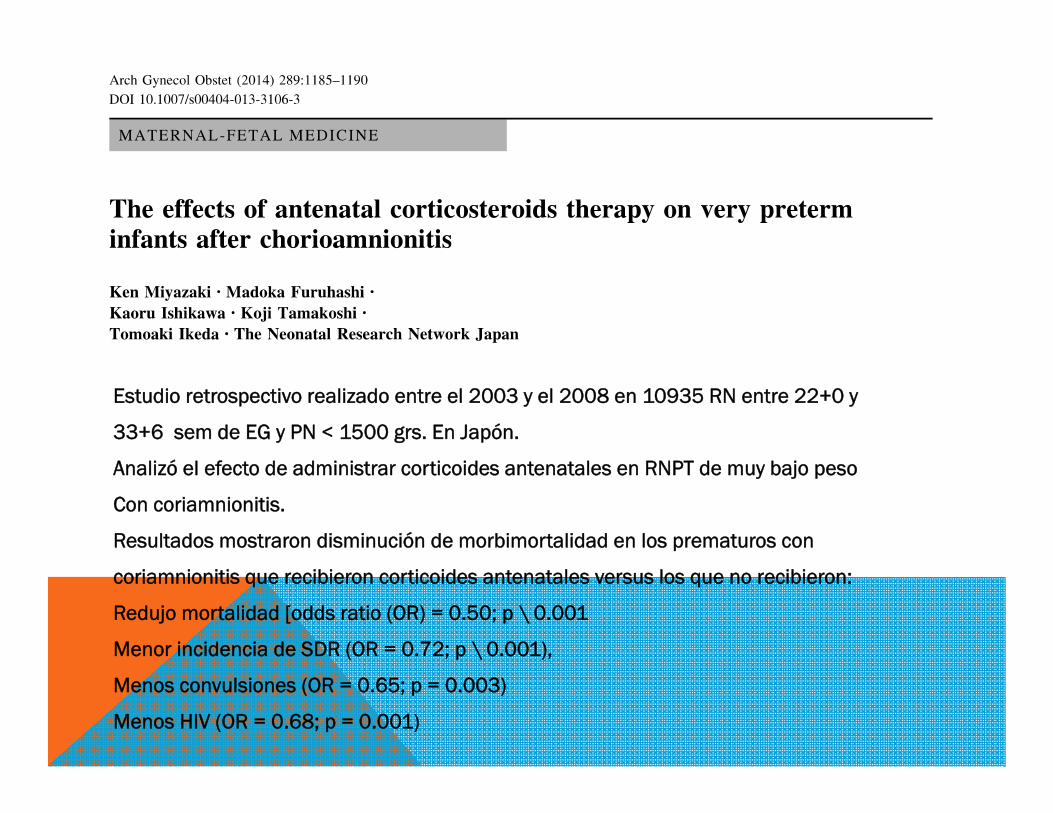
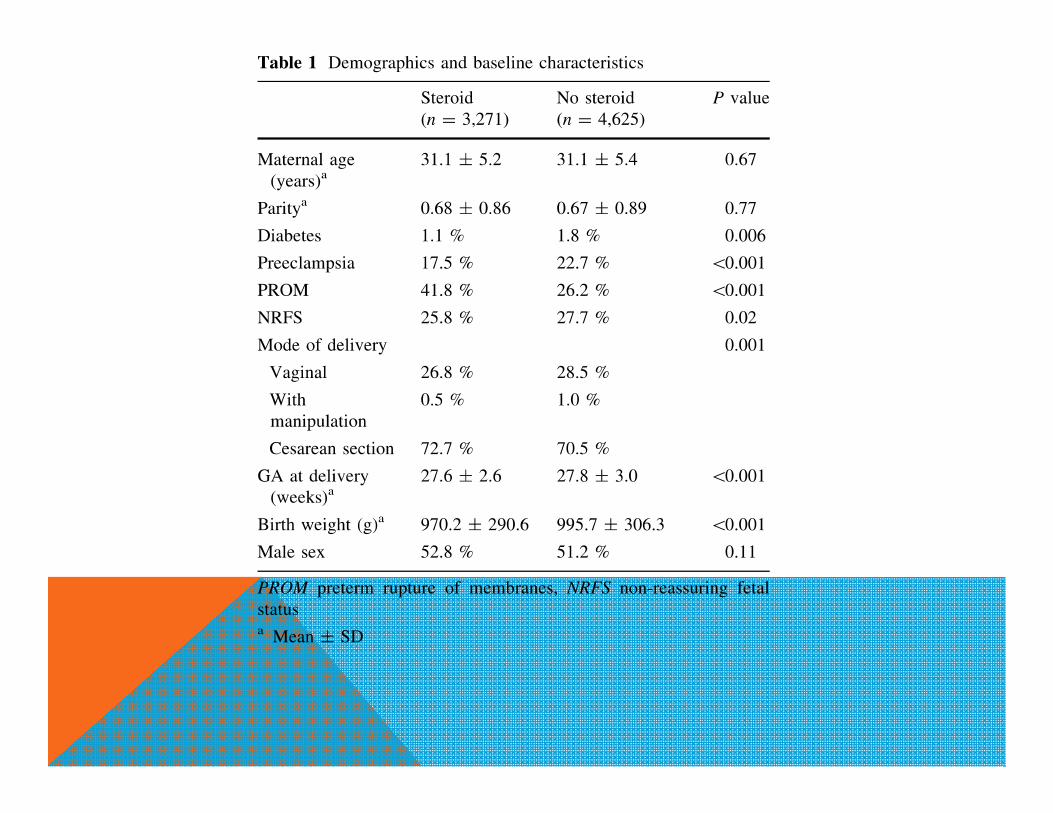
Estudio retrospectivo realizado entre el 2003 y el 2008 en 10935 RN entre 22+0 y
33+6 sem de EG y PN < 1500 grs. En Japón.
Analizó el efecto de administrar corticoides antenatales en RNPT de muy bajo peso
Con coriamnionitis.
Resultados mostraron disminución de morbimortalidad en los prematuros con
coriamnionitis que recibieron corticoides antenatales versus los que no recibieron:
Redujo mortalidad [odds ratio (OR) = 0.50; p \ 0.001
Menor incidencia de SDR (OR = 0.72; p \ 0.001),
Menos convulsiones (OR = 0.65; p = 0.003)
Menos HIV (OR = 0.68; p = 0.001)
MINISTERIO DE SALUD. Guía Clínica PREVENCIÓN PARTO PREMATURO. Santiago: MINSAL, 2010.
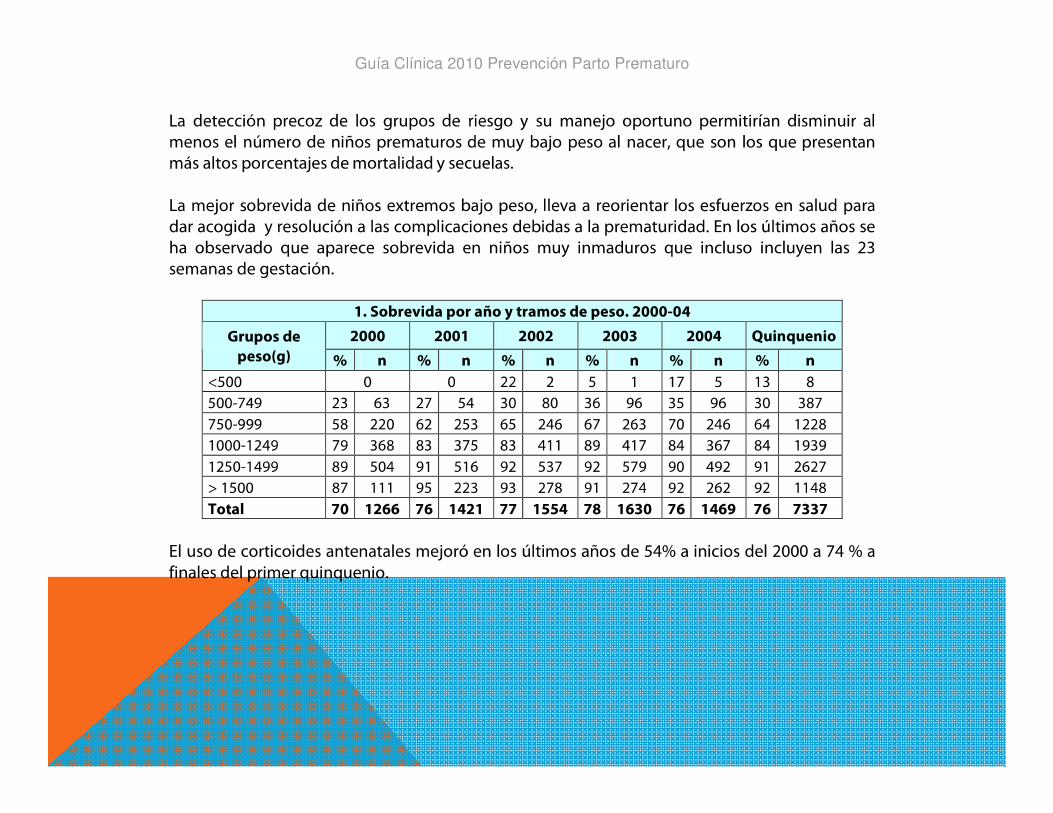
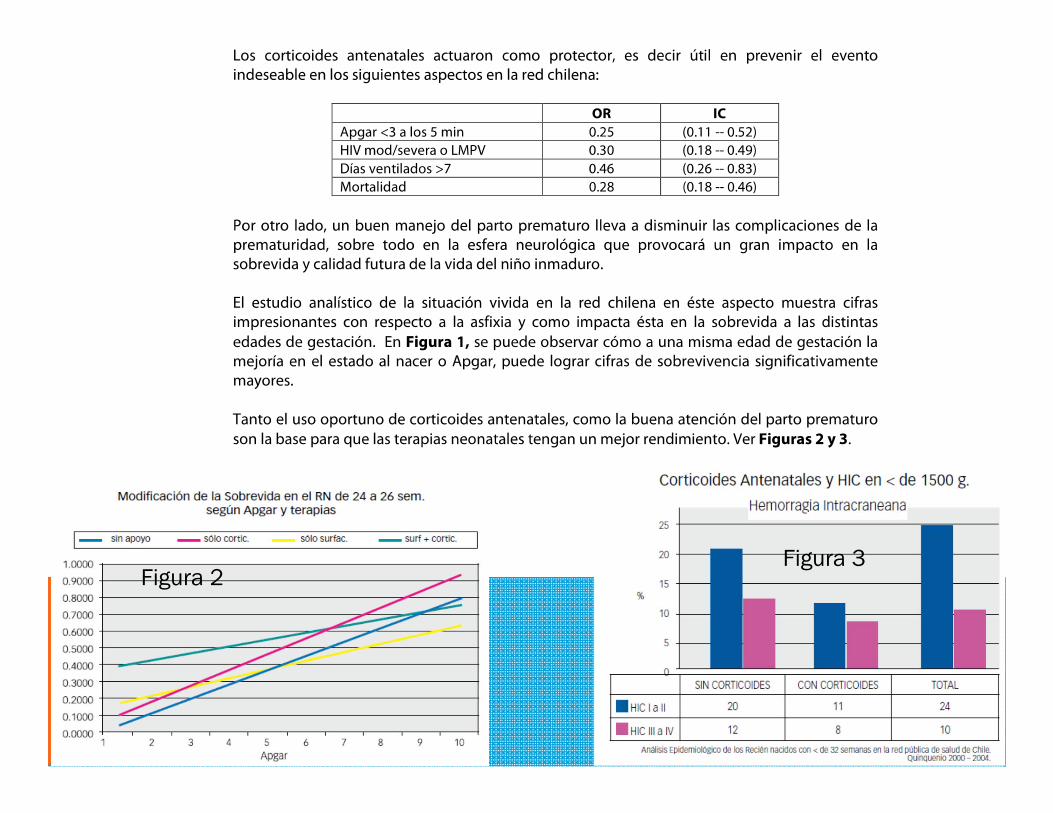
Figura 2Figura 3
ESTIMACIÓN DEL PESO FETAL…UN FACTOR A CONSIDERAR
Review
Fetal Diagn Ther 2014;36:1–8 DOI: 10.1159/000358518
Factors Influencing the Accuracy of Fetal Weight Estimation with a Focus on Preterm Birth at the Limit of Viability: A Systematic Literature Review
Chantal Huber Jarmila A. Zdanowicz Martin Mueller Daniel Surbek Department of Obstetrics and Gynaecology, Bern University Hospital, Bern , Switzerland
Received: September 8, 2013 Accepted: January 3, 2014 Published online: May 23, 2014
FACTORS INFLUENCING THE ACCURACY OF FETAL WEIGHT …
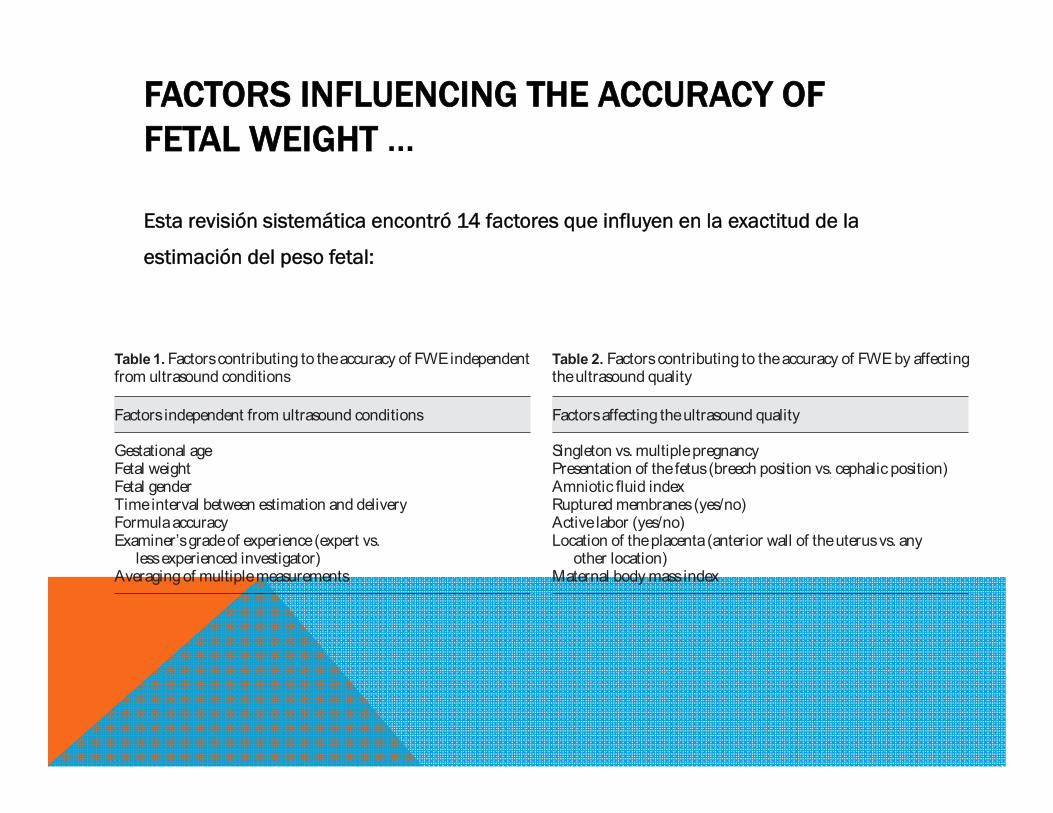
Esta revisión sistemática encontró 14 factores que influyen en la exactitud de la
estimación del peso fetal:
Table 1. Factors contributing to the accuracy of FWE independent from ultrasound conditions
Factors independent from ultrasound conditions
Gestational ageFetal weightFetal genderTime interval between estimation and deliveryFormula accuracyExaminer’s grade of experience (expert vs.
less experienced investigator)Averaging of multiple measurements
Table 2. Factors contributing to the accuracy of FWE by affecting the ultrasound quality
Factors affecting the ultrasound quality
Singleton vs. multiple pregnancyPresentation of the fetus (breech position vs. cephalic position)Amniotic fluid indexRuptured membranes (yes/no)Active labor (yes/no)Location of the placenta (anterior wall of the uterus vs. any
other location)Maternal body mass index
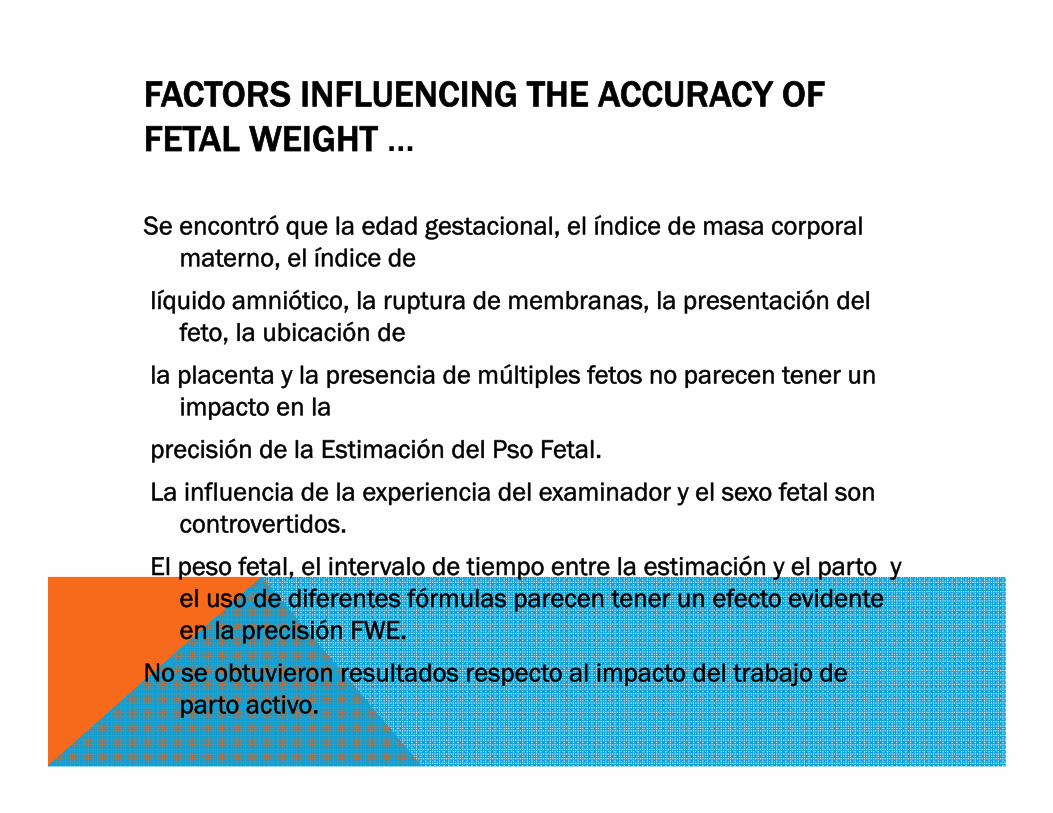
Se encontró que la edad gestacional, el índice de masa corporal materno, el índice de
líquido amniótico, la ruptura de membranas, la presentación del feto, la ubicación de
la placenta y la presencia de múltiples fetos no parecen tener un impacto en la
precisión de la Estimación del Pso Fetal.
La influencia de la experiencia del examinador y el sexo fetal son controvertidos.
El peso fetal, el intervalo de tiempo entre la estimación y el parto y el uso de diferentes fórmulas parecen tener un efecto evidente en la precisión FWE.
No se obtuvieron resultados respecto al impacto del trabajo de parto activo.
FACTORS INFLUENCING THE ACCURACY OF FETAL WEIGHT …

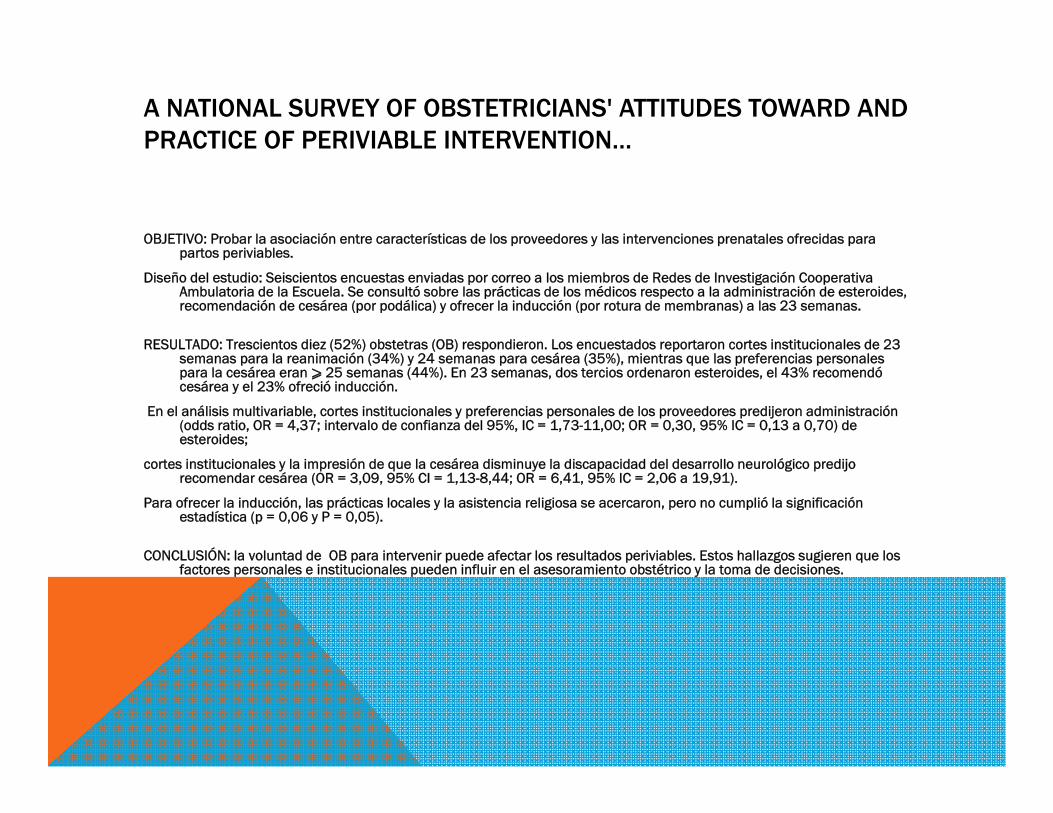
A NATIONAL SURVEY OF OBSTETRICIANS' ATTITUDES TOWARD AND PRACTICE OF PERIVIABLE INTERVENTION…
OBJETIVO: Probar la asociación entre características de los proveedores y las intervenciones prenatales ofrecidas para partos periviables.
Diseño del estudio: Seiscientos encuestas enviadas por correo a los miembros de Redes de Investigación Cooperativa Ambulatoria de la Escuela. Se consultó sobre las prácticas de los médicos respecto a la administración de esteroides, recomendación de cesárea (por podálica) y ofrecer la inducción (por rotura de membranas) a las 23 semanas.
RESULTADO: Trescientos diez (52%) obstetras (OB) respondieron. Los encuestados reportaron cortes institucionales de 23 semanas para la reanimación (34%) y 24 semanas para cesárea (35%), mientras que las preferencias personales para la cesárea eran ⩾ 25 semanas (44%). En 23 semanas, dos tercios ordenaron esteroides, el 43% recomendó cesárea y el 23% ofreció inducción.
En el análisis multivariable, cortes institucionales y preferencias personales de los proveedores predijeron administración (odds ratio, OR = 4,37; intervalo de confianza del 95%, IC = 1,73-11,00; OR = 0,30, 95% IC = 0,13 a 0,70) de esteroides;
cortes institucionales y la impresión de que la cesárea disminuye la discapacidad del desarrollo neurológico predijo recomendar cesárea (OR = 3,09, 95% CI = 1,13-8,44; OR = 6,41, 95% IC = 2,06 a 19,91).
Para ofrecer la inducción, las prácticas locales y la asistencia religiosa se acercaron, pero no cumplió la significación estadística (p = 0,06 y P = 0,05).
CONCLUSIÓN: la voluntad de OB para intervenir puede afectar los resultados periviables. Estos hallazgos sugieren que los factores personales e institucionales pueden influir en el asesoramiento obstétrico y la toma de decisiones.
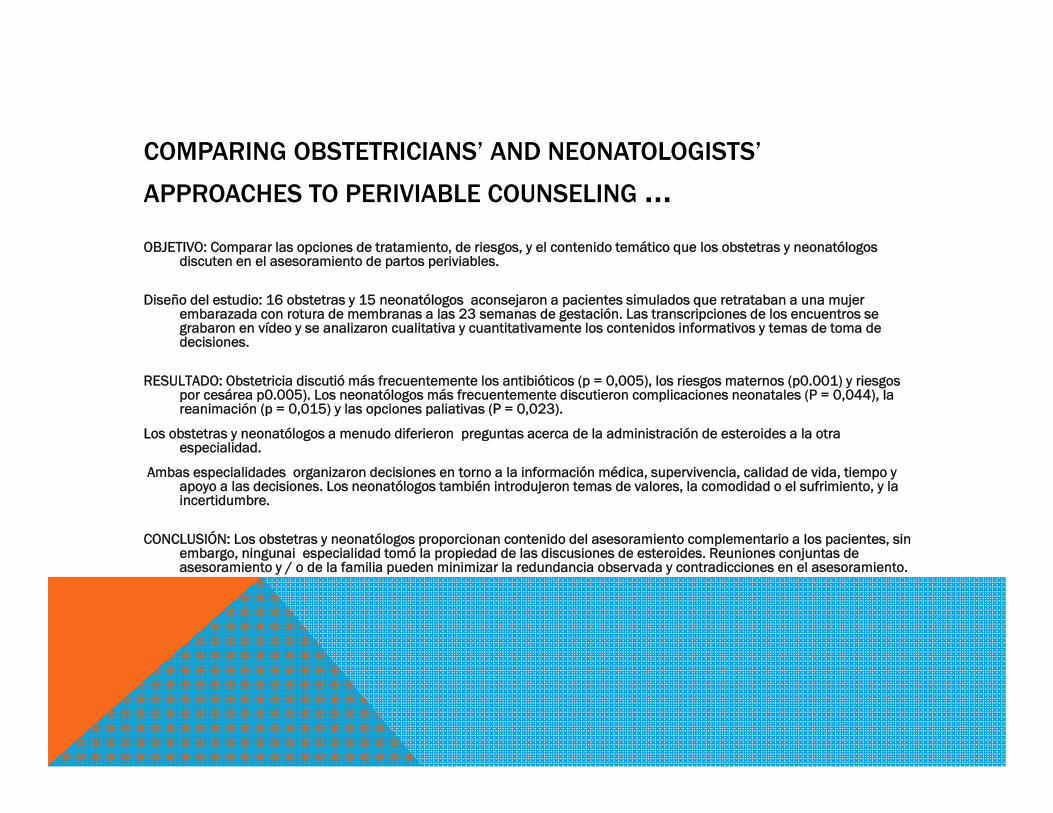
COMPARING OBSTETRICIANS’ AND NEONATOLOGISTS’
APPROACHES TO PERIVIABLE COUNSELING …OBJETIVO: Comparar las opciones de tratamiento, de riesgos, y el contenido temático que los obstetras y neonatólogos
discuten en el asesoramiento de partos periviables.
Diseño del estudio: 16 obstetras y 15 neonatólogos aconsejaron a pacientes simulados que retrataban a una mujer embarazada con rotura de membranas a las 23 semanas de gestación. Las transcripciones de los encuentros se grabaron en vídeo y se analizaron cualitativa y cuantitativamente los contenidos informativos y temas de toma de decisiones.
RESULTADO: Obstetricia discutió más frecuentemente los antibióticos (p = 0,005), los riesgos maternos (p0.001) y riesgos por cesárea p0.005). Los neonatólogos más frecuentemente discutieron complicaciones neonatales (P = 0,044), la reanimación (p = 0,015) y las opciones paliativas (P = 0,023).
Los obstetras y neonatólogos a menudo diferieron preguntas acerca de la administración de esteroides a la otra especialidad.
Ambas especialidades organizaron decisiones en torno a la información médica, supervivencia, calidad de vida, tiempo y apoyo a las decisiones. Los neonatólogos también introdujeron temas de valores, la comodidad o el sufrimiento, y la incertidumbre.
CONCLUSIÓN: Los obstetras y neonatólogos proporcionan contenido del asesoramiento complementario a los pacientes, sin embargo, ningunai especialidad tomó la propiedad de las discusiones de esteroides. Reuniones conjuntas de asesoramiento y / o de la familia pueden minimizar la redundancia observada y contradicciones en el asesoramiento.
Original Paper
Neonatology 2014;105:79–84 DOI: 10.1159/000355818
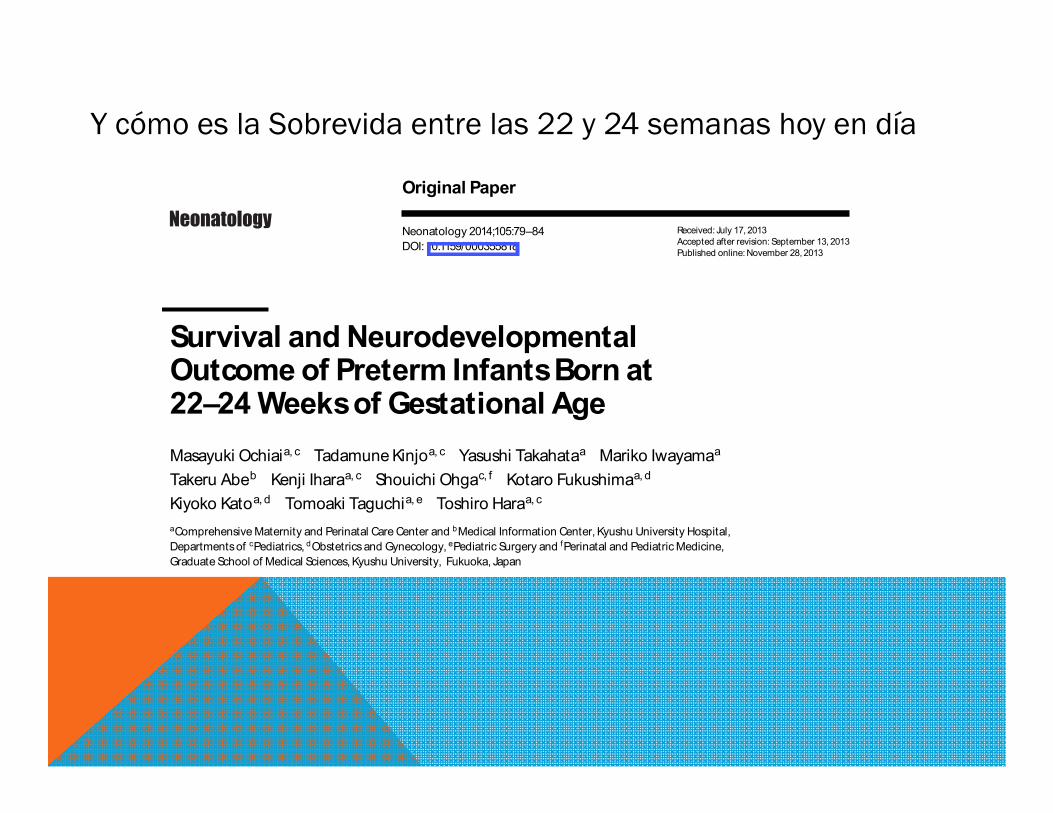
Survival and Neurodevelopmental Outcome of Preterm Infants Born at 22–24 Weeks of Gestational Age Masayuki Ochiai a, c Tadamune Kinjo a, c Yasushi Takahata a Mariko Iwayama a Takeru Abe b Kenji Ihara a, c Shouichi Ohga c, f Kotaro Fukushima a, d Kiyoko Kato a, d Tomoaki Taguchi a, e Toshiro Hara a, c a Comprehensive Maternity and Perinatal Care Center and b Medical Information Center, Kyushu University Hospital, Departments of c Pediatrics, d Obstetrics and Gynecology, e Pediatric Surgery and f Perinatal and Pediatric Medicine, Graduate School of Medical Sciences, Kyushu University, Fukuoka , Japan
Received: July 17, 2013 Accepted after revision: September 13, 2013 Published online: November 28, 2013
Y cómo es la Sobrevida entre las 22 y 24 semanas hoy en día
SURVIVAL AND NEURODEVELOPMENTAL OUTCOME OF PRETERM INFANTS BORN AT 22–24 WEEKS OF GESTATIONAL AGE
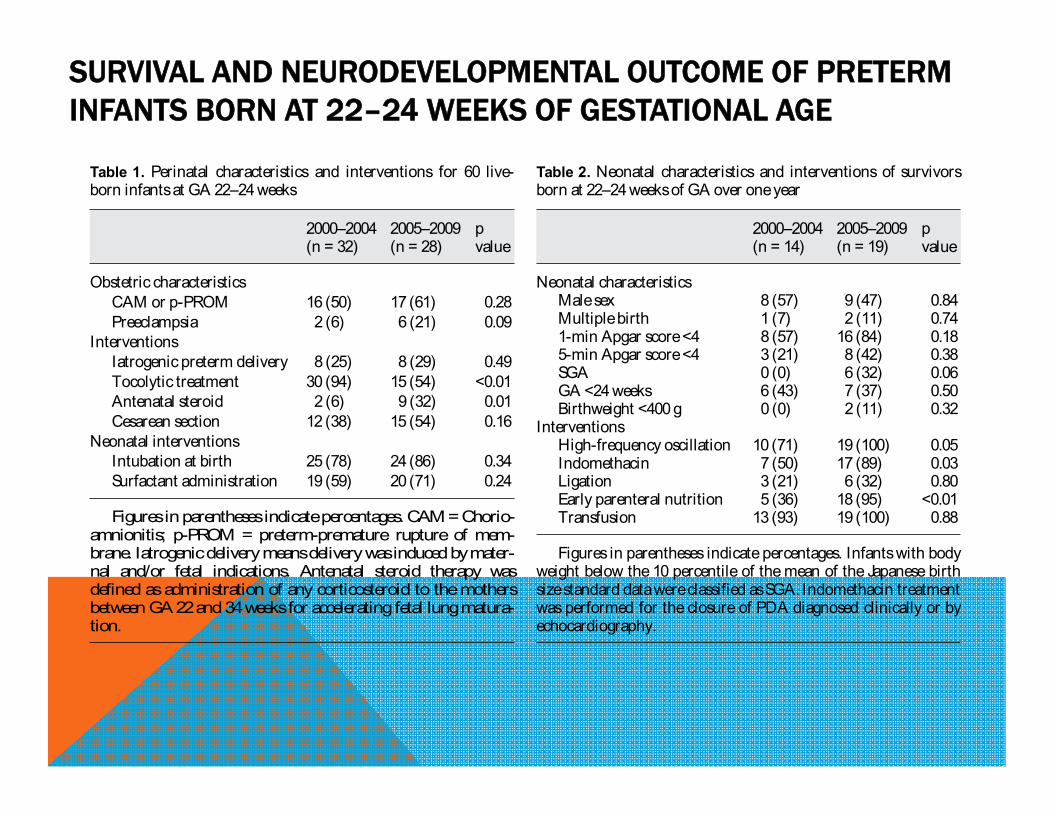
Table 1. Perinatal characteristics and interventions for 60 live-born infants at GA 22–24 weeks
2000–2004 2005–2009 p value(n = 32) (n = 28)
Obstetric characteristicsCAM or p-PROM 16 (50) 17 (61) 0.28Preeclampsia 2 (6) 6 (21) 0.09
InterventionsIatrogenic preterm delivery 8 (25) 8 (29) 0.49Tocolytic treatment 30 (94) 15 (54) <0.01Antenatal steroid 2 (6) 9 (32) 0.01Cesarean section 12 (38) 15 (54) 0.16
Neonatal interventionsIntubation at birth 25 (78) 24 (86) 0.34Surfactant administration 19 (59) 20 (71) 0.24
Figures in parentheses indicate percentages. CAM = Chorio-amnionitis; p-PROM = preterm-premature rupture of mem-brane. Iatrogenic delivery means delivery was induced by mater-nal and/or fetal indications. Antenatal steroid therapy was defined as administration of any corticosteroid to the mothers between GA 22 and 34 weeks for accelerating fetal lung matura-tion.
Table 2. Neonatal characteristics and interventions of survivors born at 22–24 weeks of GA over one year
2000–2004 2005–2009 pvalue(n = 14) (n = 19)
Neonatal characteristicsMale sex 8 (57) 9 (47) 0.84Multiple birth 1 (7) 2 (11) 0.741-min Apgar score <4 8 (57) 16 (84) 0.185-min Apgar score <4 3 (21) 8 (42) 0.38SGA 0 (0) 6 (32) 0.06GA <24 weeks 6 (43) 7 (37) 0.50Birthweight <400 g 0 (0) 2 (11) 0.32
InterventionsHigh-frequency oscillation 10 (71) 19 (100) 0.05Indomethacin 7 (50) 17 (89) 0.03Ligation 3 (21) 6 (32) 0.80Early parenteral nutrition 5 (36) 18 (95) <0.01Transfusion 13 (93) 19 (100) 0.88
Figures in parentheses indicate percentages. Infants with body weight below the 10 percentile of the mean of the Japanese birth size standard data were classified as SGA. Indomethacin treatment was performed for the closure of PDA diagnosed clinically or by echocardiography.
SURVIVAL AND NEURODEVELOPMENTAL OUTCOME OF PRETERM INFANTS BORN AT 22–24 WEEKS OF GESTATIONAL AGE
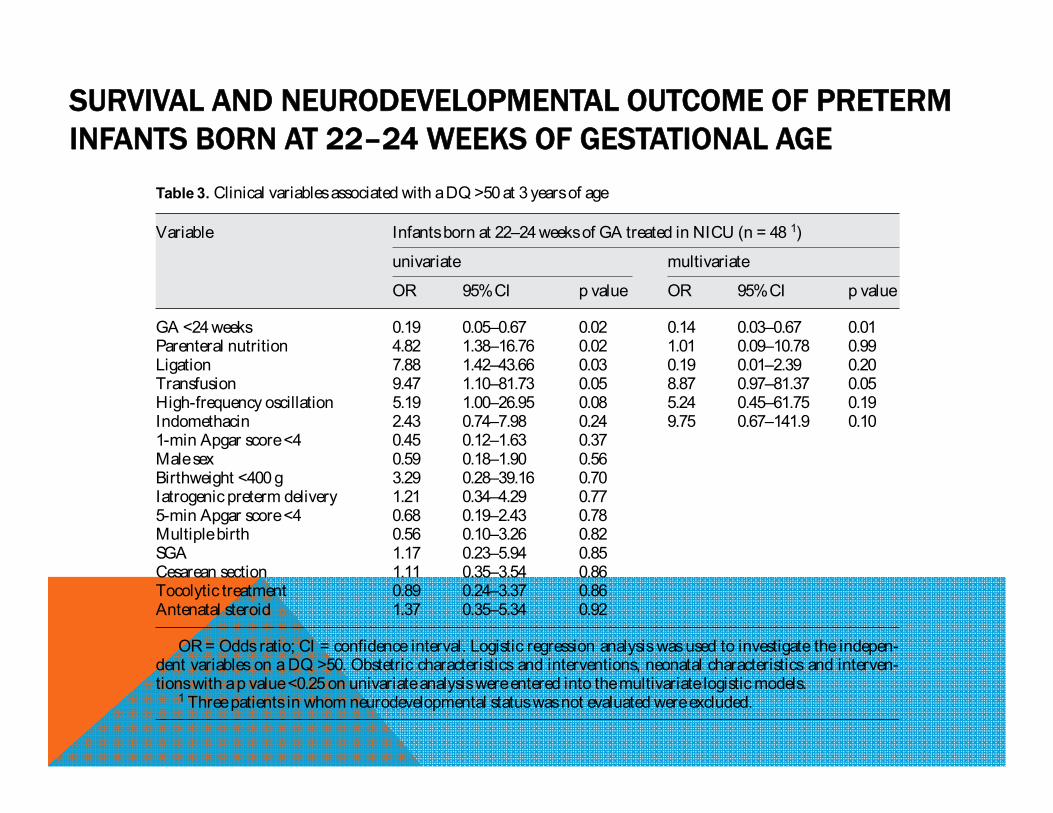
Table 3. Clinical variables associated with a DQ >50 at 3 years of age
Variable Infants born at 22–24 weeks of GA treated in NICU (n = 48 1)
univariate multivariate
OR 95% CI p value OR 95% CI p value
GA <24 weeks 0.19 0.05–0.67 0.02 0.14 0.03–0.67 0.01Parenteral nutrition 4.82 1.38–16.76 0.02 1.01 0.09–10.78 0.99Ligation 7.88 1.42–43.66 0.03 0.19 0.01–2.39 0.20Transfusion 9.47 1.10–81.73 0.05 8.87 0.97–81.37 0.05High-frequency oscillation 5.19 1.00–26.95 0.08 5.24 0.45–61.75 0.19Indomethacin 2.43 0.74–7.98 0.24 9.75 0.67–141.9 0.101-min Apgar score <4 0.45 0.12–1.63 0.37Male sex 0.59 0.18–1.90 0.56Birthweight <400 g 3.29 0.28–39.16 0.70Iatrogenic preterm delivery 1.21 0.34–4.29 0.775-min Apgar score <4 0.68 0.19–2.43 0.78Multiple birth 0.56 0.10–3.26 0.82SGA 1.17 0.23–5.94 0.85Cesarean section 1.11 0.35–3.54 0.86Tocolytic treatment 0.89 0.24–3.37 0.86Antenatal steroid 1.37 0.35–5.34 0.92
OR = Odds ratio; CI = confidence interval. Logistic regression analysis was used to investigate the indepen-dent variables on a DQ >50. Obstetric characteristics and interventions, neonatal characteristics and interven-tions with a p value <0.25 on univariate analysis were entered into the multivariate logistic models.
1 Three patients in whom neurodevelopmental status was not evaluated were excluded.
NEURODEVELOPMENTAL OUTCOMES OF EXTREMELY PRETERM INFANTSCLIN PERINATOL 41 (2014) 241–255
(ARTÍCULO DE REVISIÓN)
NEURODEVELOPMENTAL OUTCOMES OF EXTREMELY PRETERM INFANTSCLIN PERINATOL 41 (2014) 241–255
(ARTÍCULO DE REVISIÓN)
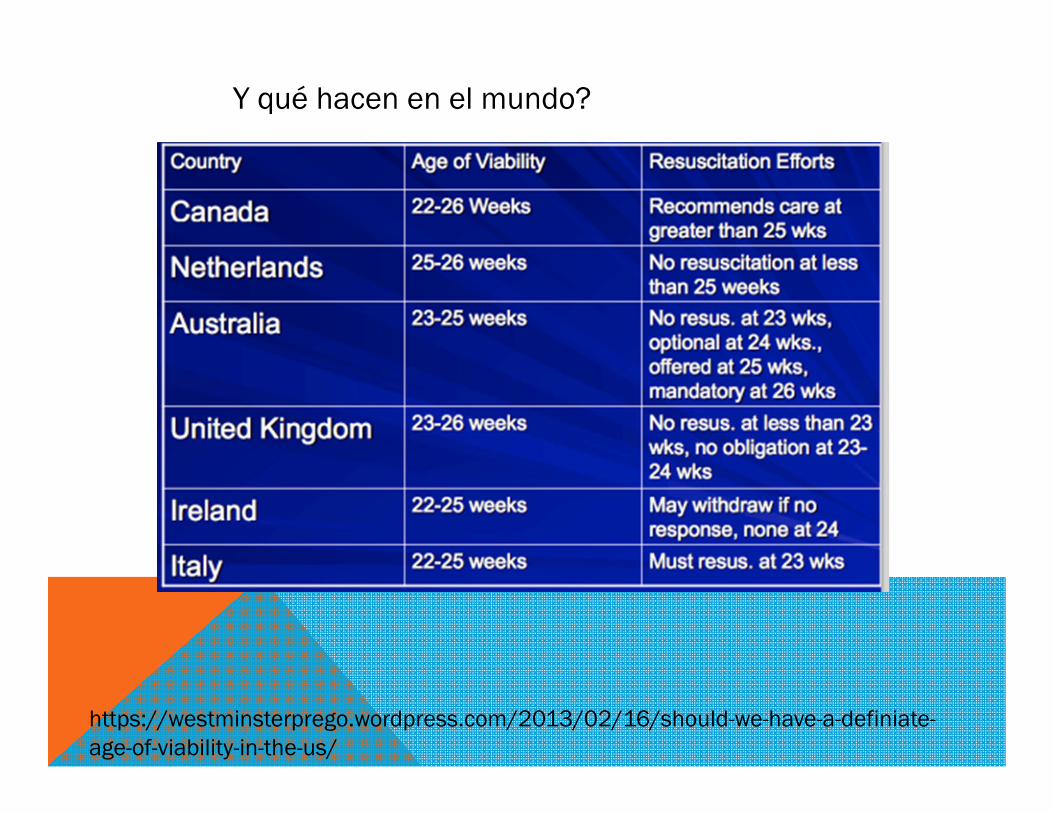
https://westminsterprego.wordpress.com/2013/02/16/should-we-have-a-definiate-age-of-viability-in-the-us/
Y qué hacen en el mundo?
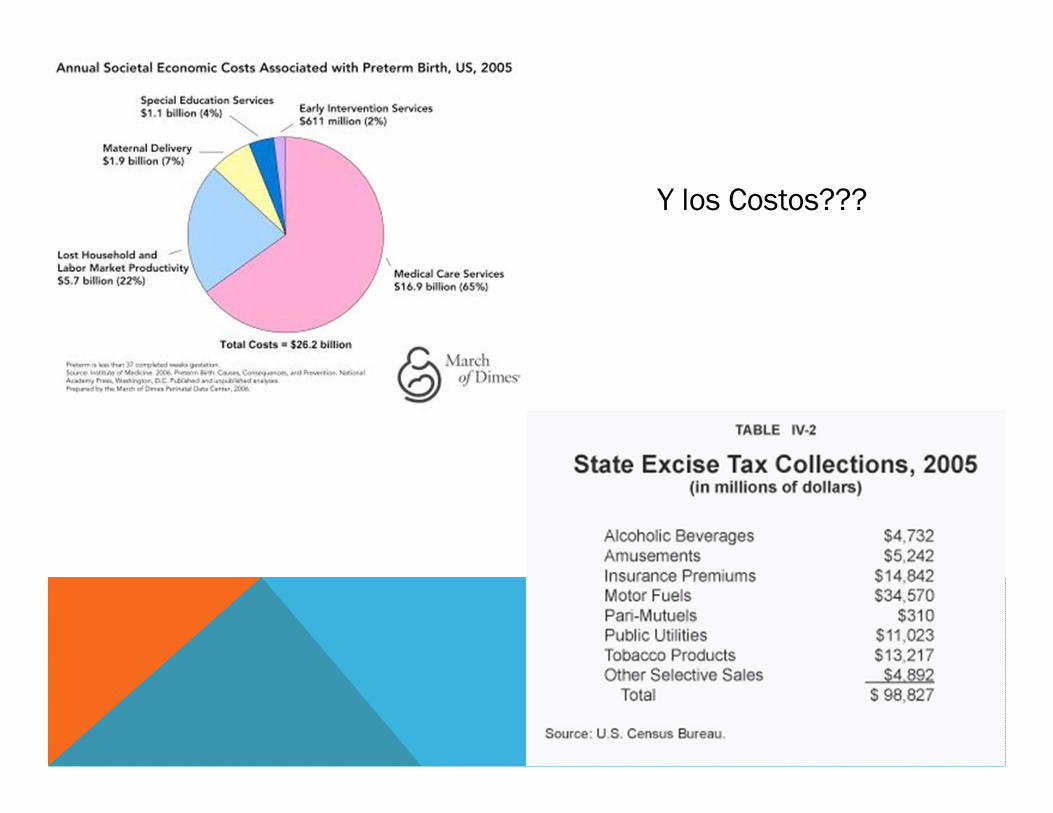
Y los Costos???
Original Paper
Neonatology 2015;107:120–129 DOI: 10.1159/000368881
Changes in Perinatal Care and Outcomes in Newborns at the Limit of Viability in Spain: The EPI-SEN Study Fermín García-Muñoz Rodrigo a Ana Lucía Díez Recinos a Afredo García-Alix Pérez b Josep Figueras Aloy c Máximo Vento Torres d and the SEN1500 Network of the Spanish Neonatal Society (Sociedad Española de Neonatología) a Division of Neonatology, Complejo Hospitalario Universitario Insular-Materno-Infantil, Las Palmas , b Division of Neonatology, Hospital Sant Joan de Deu, and c Division of Neonatology, Hospital Clinic, Barcelona , and d Division of Neonatology, Hospital Universitario y Politécnico La Fe, Valencia , Spain
Received: July 15, 2014 Accepted after revision: October 2, 2014 Published online: December 10, 2014
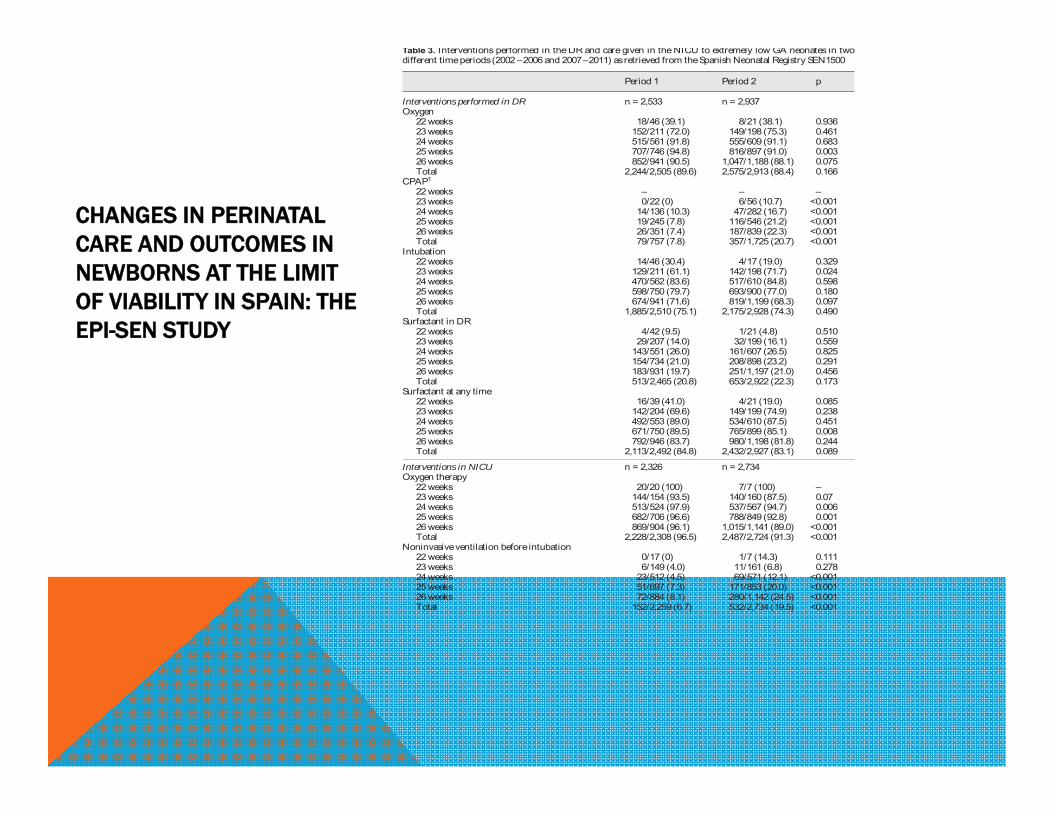
CHANGES IN PERINATAL CARE AND OUTCOMES IN NEWBORNS AT THE LIMITOF VIABILITY IN SPAIN: THEEPI-SEN STUDY
Period 1 Period 2 p
Interventions performed in DR n = 2,533 n = 2,937Oxygen
22 weeks 18/46 (39.1) 8/21 (38.1) 0.93623 weeks 152/211 (72.0) 149/198 (75.3) 0.46124 weeks 515/561 (91.8) 555/609 (91.1) 0.68325 weeks 707/746 (94.8) 816/897 (91.0) 0.00326 weeks 852/941 (90.5) 1,047/1,188 (88.1) 0.075Total 2,244/2,505 (89.6) 2,575/2,913 (88.4) 0.166
CPAP1
22 weeks – – –23 weeks 0/22 (0) 6/56 (10.7) <0.00124 weeks 14/136 (10.3) 47/282 (16.7) <0.00125 weeks 19/245 (7.8) 116/546 (21.2) <0.00126 weeks 26/351 (7.4) 187/839 (22.3) <0.001Total 79/757 (7.8) 357/1,725 (20.7) <0.001
Intubation22 weeks 14/46 (30.4) 4/17 (19.0) 0.32923 weeks 129/211 (61.1) 142/198 (71.7) 0.02424 weeks 470/562 (83.6) 517/610 (84.8) 0.59825 weeks 598/750 (79.7) 693/900 (77.0) 0.18026 weeks 674/941 (71.6) 819/1,199 (68.3) 0.097Total 1,885/2,510 (75.1) 2,175/2,928 (74.3) 0.490
Surfactant in DR22 weeks 4/42 (9.5) 1/21 (4.8) 0.51023 weeks 29/207 (14.0) 32/199 (16.1) 0.55924 weeks 143/551 (26.0) 161/607 (26.5) 0.82525 weeks 154/734 (21.0) 208/898 (23.2) 0.29126 weeks 183/931 (19.7) 251/1,197 (21.0) 0.456Total 513/2,465 (20.8) 653/2,922 (22.3) 0.173
Surfactant at any time22 weeks 16/39 (41.0) 4/21 (19.0) 0.08523 weeks 142/204 (69.6) 149/199 (74.9) 0.23824 weeks 492/553 (89.0) 534/610 (87.5) 0.45125 weeks 671/750 (89.5) 765/899 (85.1) 0.00826 weeks 792/946 (83.7) 980/1,198 (81.8) 0.244Total 2,113/2,492 (84.8) 2,432/2,927 (83.1) 0.089
Interventions in NICU n = 2,326 n = 2,734Oxygen therapy
22 weeks 20/20 (100) 7/7 (100) –23 weeks 144/154 (93.5) 140/160 (87.5) 0.0724 weeks 513/524 (97.9) 537/567 (94.7) 0.00625 weeks 682/706 (96.6) 788/849 (92.8) 0.00126 weeks 869/904 (96.1) 1,015/1,141 (89.0) <0.001Total 2,228/2,308 (96.5) 2,487/2,724 (91.3) <0.001
Noninvasive ventilation before intubation22 weeks 0/17 (0) 1/7 (14.3) 0.11123 weeks 6/149 (4.0) 11/161 (6.8) 0.27824 weeks 23/512 (4.5) 69/571 (12.1) <0.00125 weeks 51/697 (7.3) 171/853 (20.0) <0.00126 weeks 72/884 (8.1) 280/1,142 (24.5) <0.001Total 152/2,259 (6.7) 532/2,734 (19.5) <0.001
Table 3. Interventions performed in the DR and care given in the NICU to extremely low GA neonates in two different time periods (2002 – 2006 and 2007 – 2011) as retrieved from the Spanish Neonatal Registry SEN1500
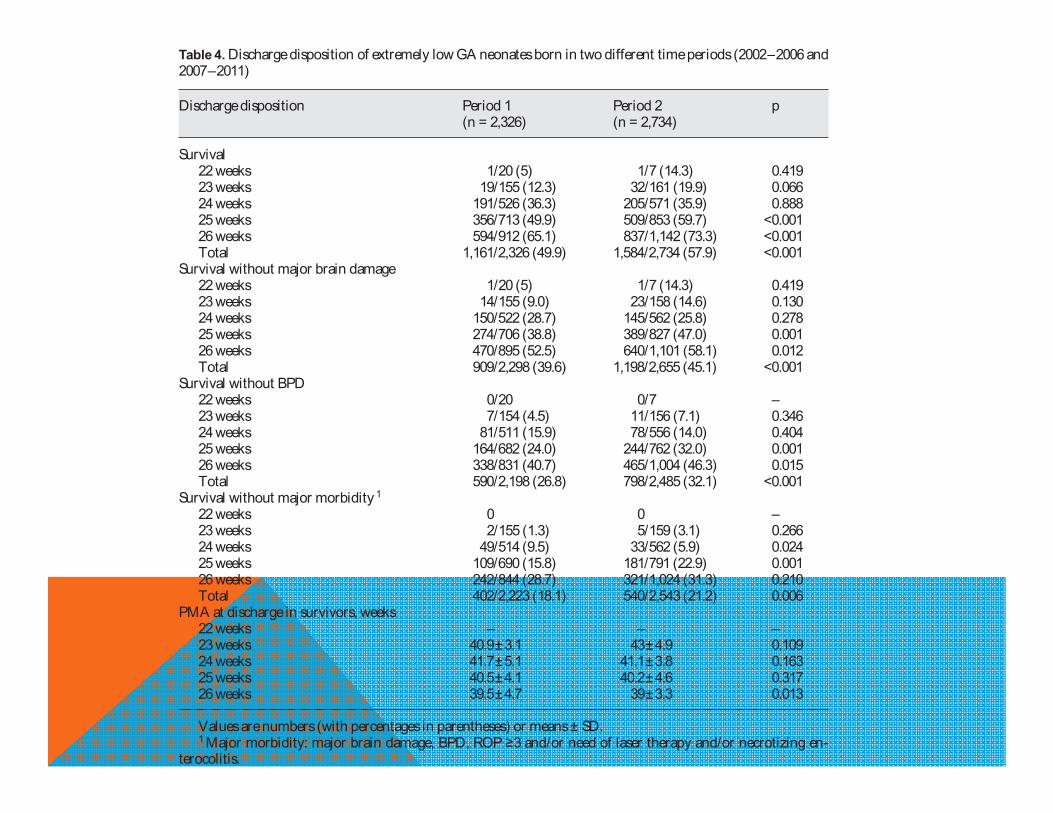
Table 4. Discharge disposition of extremely low GA neonates born in two different time periods (2002 – 2006 and 2007 – 2011)
Discharge disposition Period 1 Period 2 p(n = 2,326) (n = 2,734)
Survival22 weeks 1/20 (5) 1/7 (14.3) 0.41923 weeks 19/155 (12.3) 32/161 (19.9) 0.06624 weeks 191/526 (36.3) 205/571 (35.9) 0.88825 weeks 356/713 (49.9) 509/853 (59.7) <0.00126 weeks 594/912 (65.1) 837/1,142 (73.3) <0.001Total 1,161/2,326 (49.9) 1,584/2,734 (57.9) <0.001
Survival without major brain damage22 weeks 1/20 (5) 1/7 (14.3) 0.41923 weeks 14/155 (9.0) 23/158 (14.6) 0.13024 weeks 150/522 (28.7) 145/562 (25.8) 0.27825 weeks 274/706 (38.8) 389/827 (47.0) 0.00126 weeks 470/895 (52.5) 640/1,101 (58.1) 0.012Total 909/2,298 (39.6) 1,198/2,655 (45.1) <0.001
Survival without BPD22 weeks 0/20 0/7 –23 weeks 7/154 (4.5) 11/156 (7.1) 0.34624 weeks 81/511 (15.9) 78/556 (14.0) 0.40425 weeks 164/682 (24.0) 244/762 (32.0) 0.00126 weeks 338/831 (40.7) 465/1,004 (46.3) 0.015Total 590/2,198 (26.8) 798/2,485 (32.1) <0.001
Survival without major morbidity1
22 weeks 0 0 –23 weeks 2/155 (1.3) 5/159 (3.1) 0.26624 weeks 49/514 (9.5) 33/562 (5.9) 0.02425 weeks 109/690 (15.8) 181/791 (22.9) 0.00126 weeks 242/844 (28.7) 321/1,024 (31.3) 0.210Total 402/2,223 (18.1) 540/2,543 (21.2) 0.006
PMA at discharge in survivors, weeks22 weeks – – –23 weeks 40.9 ± 3.1 43 ± 4.9 0.10924 weeks 41.7 ± 5.1 41.1 ± 3.8 0.16325 weeks 40.5 ± 4.1 40.2 ± 4.6 0.31726 weeks 39.5 ± 4.7 39 ± 3.3 0.013
Values are numbers (with percentages in parentheses) or means ± SD.1 Major morbidity: major brain damage, BPD, ROP ≥3 and/or need of laser therapy and/or necrotizing en-
terocolitis.
http://informahealthcare.com/jmfISSN: 1476-7058 (print), 1476-4954 (electronic)
J Matern Fetal Neonatal Med, 2014; 27(16): 1620–1626! 2014 Informa UK Ltd. DOI: 10.3109/14767058.2013.871699
ORIGINAL ARTICLE
Long-term outcome at age 7–10 years after extreme prematurity –a prospective, two centre cohort study of children born before25 completed weeks of gestation (1999–2003)Susanne Herber-Jonat1, Silke Streiftau2, Eva Knauss3, Friedrich Voigt3, Andreas W. Flemmer1, Helmut D. Hummler4,Andreas Schulze1, and Harald Bode2
1Division of Neonatology, Perinatal Centre, Klinikum Großhadern, Dr. von Hauner Children’s Hospital, University of Munich, Munich, Germany,2Division of Social Pediatrics and Child Neurology, Children’s Hospital, University of Ulm, Ulm, Germany, 3Social Pediatric Center and Clinic forSocial Pediatric Rehabilitation (kbo-Kinderzentrum), Munich, Germany, and 4Division of Neonatology and Pediatric Critical Care, Children’sHospital, University of Ulm, Ulm, Germany
PRONÓSTICO A LARGO PLAZO
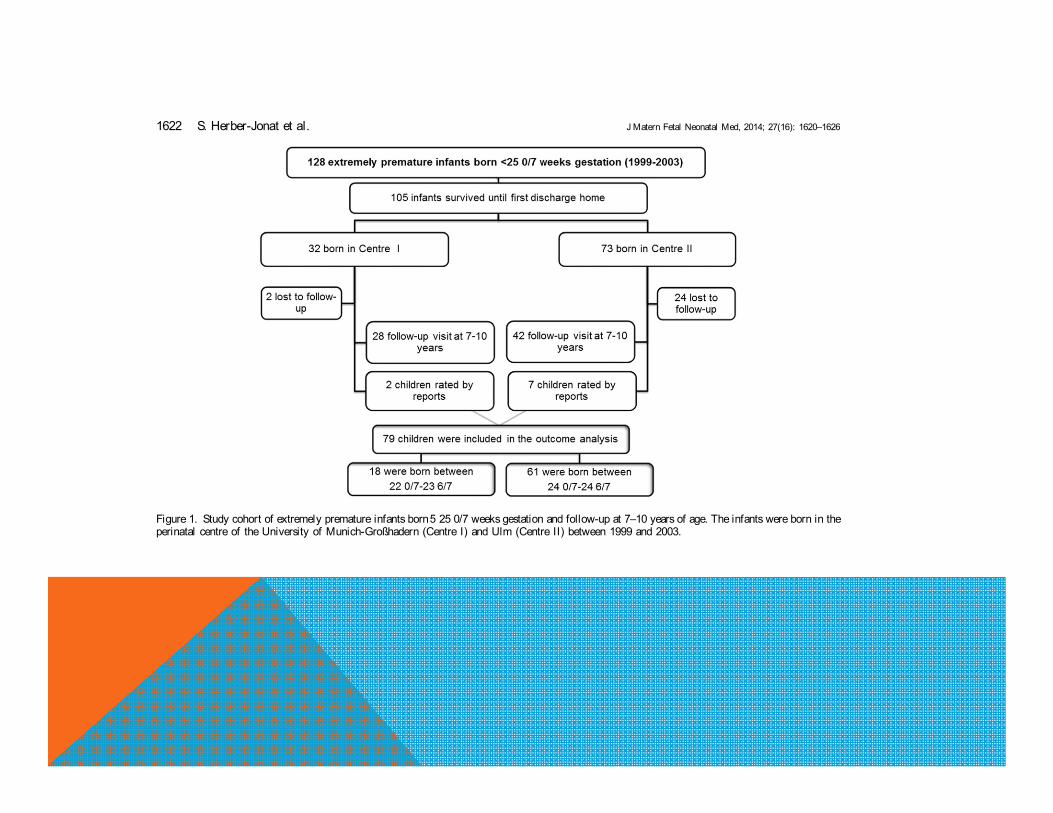
Figure 1. Study cohort of extremely premature infants born5 25 0/7 weeks gestation and follow-up at 7–10 years of age. The infants were born in theperinatal centre of the University of Munich-Großhadern (Centre I) and Ulm (Centre II) between 1999 and 2003.
1622 S. Herber-Jonat et al. J Matern Fetal Neonatal Med, 2014; 27(16): 1620–1626
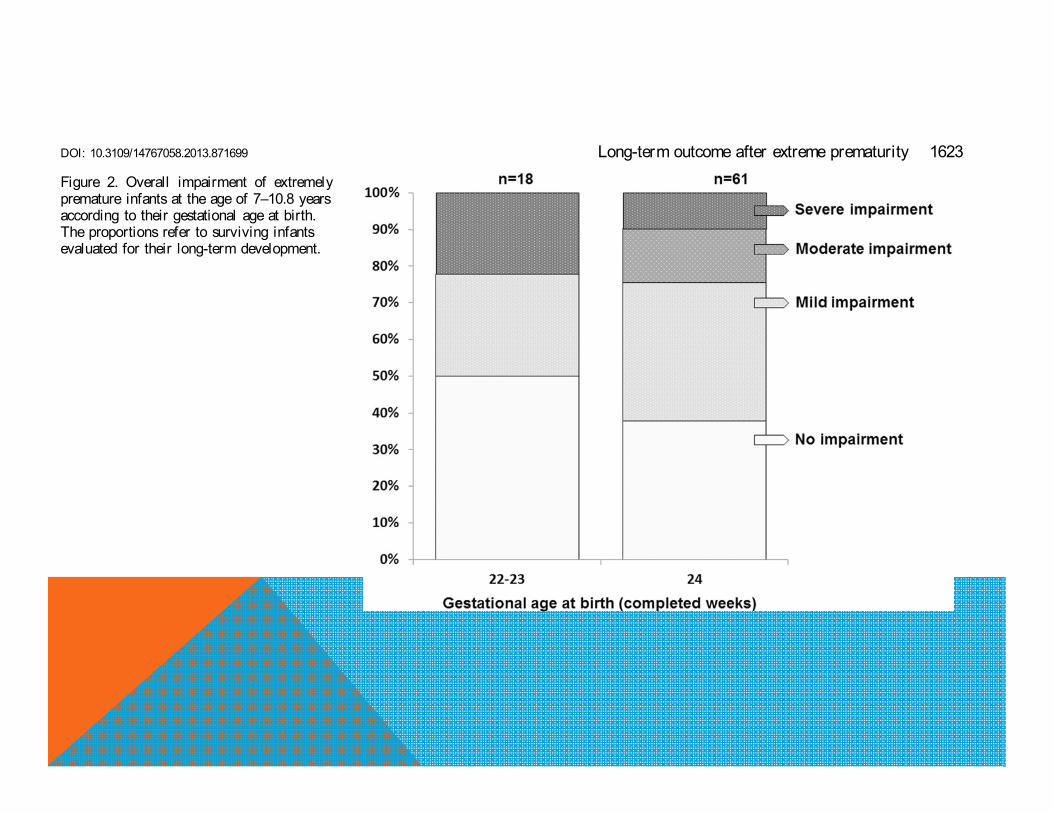
Figure 2. Overall impairment of extremelypremature infants at the age of 7–10.8 yearsaccording to their gestational age at birth.The proportions refer to surviving infantsevaluated for their long-term development.
DOI: 10.3109/14767058.2013.871699 Long-term outcome after extreme prematurity 1623
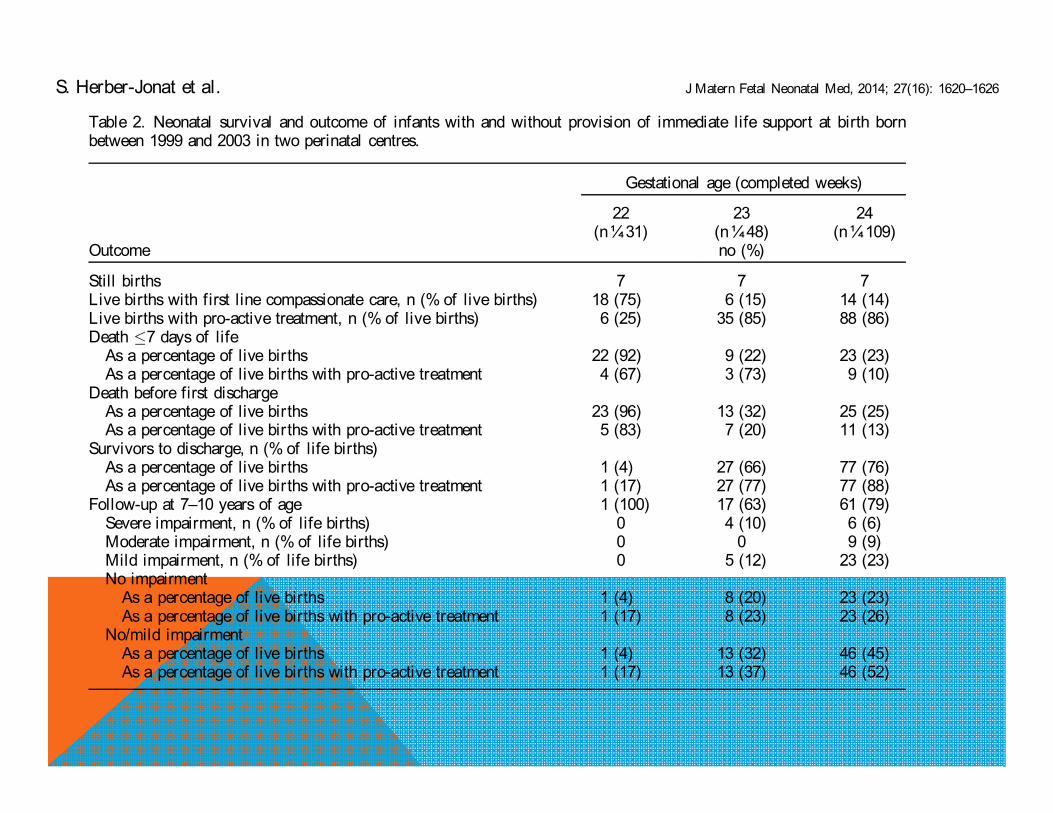
Table 2. Neonatal survival and outcome of infants with and without provision of immediate life support at birth bornbetween 1999 and 2003 in two perinatal centres.
Gestational age (completed weeks)
22 23 24(n¼31) (n¼48) (n¼109)
Outcome no (%)
Still births 7 7 7Live births with first line compassionate care, n (% of live births) 18 (75) 6 (15) 14 (14)Live births with pro-active treatment, n (% of live births) 6 (25) 35 (85) 88 (86)Death 7 days of life
As a percentage of live births 22 (92) 9 (22) 23 (23)As a percentage of live births with pro-active treatment 4 (67) 3 (73) 9 (10)
Death before first dischargeAs a percentage of live births 23 (96) 13 (32) 25 (25)As a percentage of live births with pro-active treatment 5 (83) 7 (20) 11 (13)
Survivors to discharge, n (% of life births)As a percentage of live births 1 (4) 27 (66) 77 (76)As a percentage of live births with pro-active treatment 1 (17) 27 (77) 77 (88)
Follow-up at 7–10 years of age 1 (100) 17 (63) 61 (79)Severe impairment, n (% of life births) 0 4 (10) 6 (6)Moderate impairment, n (% of life births) 0 0 9 (9)Mild impairment, n (% of life births) 0 5 (12) 23 (23)No impairment
As a percentage of live births 1 (4) 8 (20) 23 (23)As a percentage of live births with pro-active treatment 1 (17) 8 (23) 23 (26)
No/mild impairmentAs a percentage of live births 1 (4) 13 (32) 46 (45)As a percentage of live births with pro-active treatment 1 (17) 13 (37) 46 (52)
S. Herber-Jonat et al. J Matern Fetal Neonatal Med, 2014; 27(16): 1620–1626
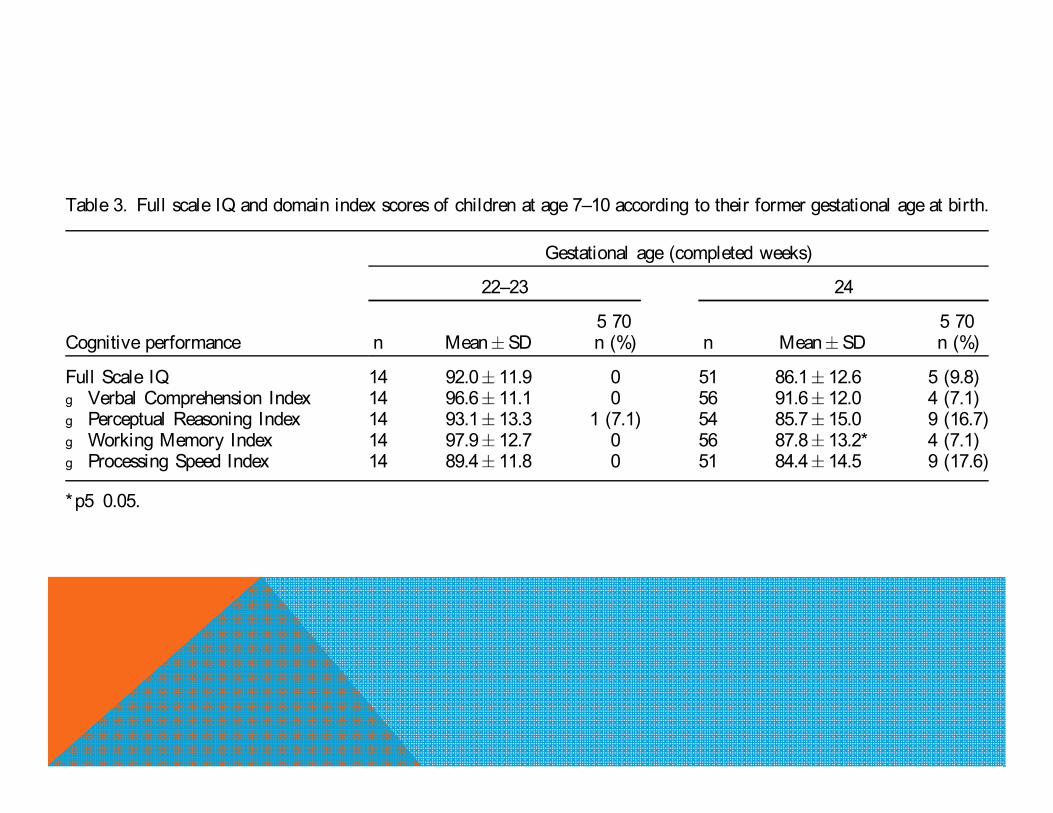
Table 3. Full scale IQ and domain index scores of children at age 7–10 according to their former gestational age at birth.
Gestational age (completed weeks)
22–23 24
5 70 5 70Cognitive performance n Mean SD n (%) n Mean SD n (%)
Full Scale IQ 14 92.0 11.9 0 51 86.1 12.6 5 (9.8)g Verbal Comprehension Index 14 96.6 11.1 0 56 91.6 12.0 4 (7.1)g Perceptual Reasoning Index 14 93.1 13.3 1 (7.1) 54 85.7 15.0 9 (16.7)g Working Memory Index 14 97.9 12.7 0 56 87.8 13.2* 4 (7.1)g Processing Speed Index 14 89.4 11.8 0 51 84.4 14.5 9 (17.6)
*p5 0.05.
CONDUCTAS ACTIVAS VERSUS NO ACTIVAS
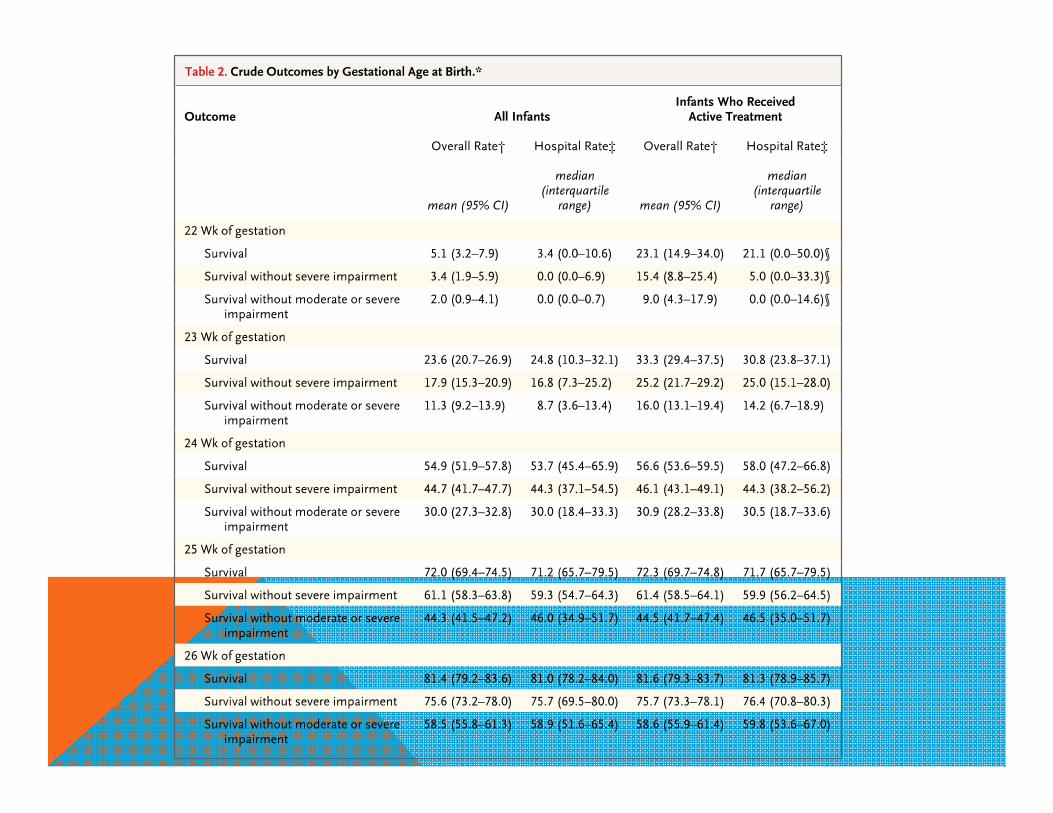
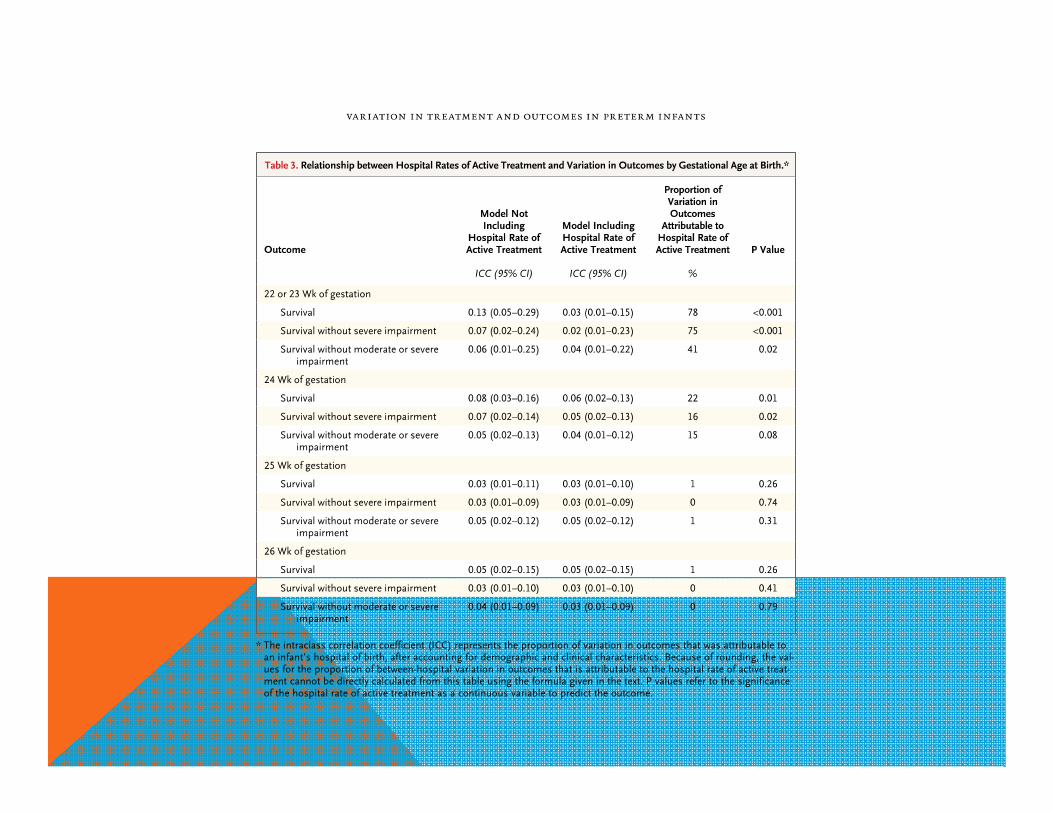
n engl j med 372;19 nejm.org May 7, 2015

Y CUAL ES NUESTRA REALIDAD?
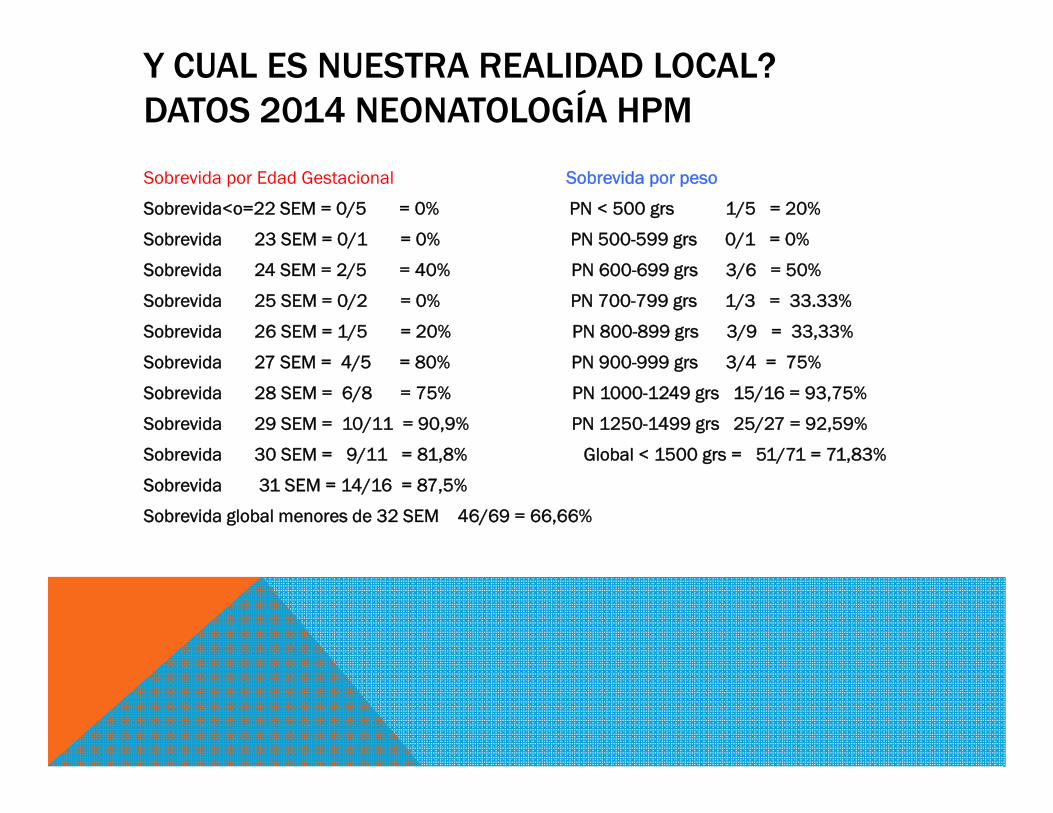
Y CUAL ES NUESTRA REALIDAD LOCAL?DATOS 2014 NEONATOLOGÍA HPM
Sobrevida por Edad Gestacional Sobrevida por peso
Sobrevida<o=22 SEM = 0/5 = 0% PN < 500 grs 1/5 = 20%
Sobrevida 23 SEM = 0/1 = 0% PN 500-599 grs 0/1 = 0%
Sobrevida 24 SEM = 2/5 = 40% PN 600-699 grs 3/6 = 50%
Sobrevida 25 SEM = 0/2 = 0% PN 700-799 grs 1/3 = 33.33%
Sobrevida 26 SEM = 1/5 = 20% PN 800-899 grs 3/9 = 33,33%
Sobrevida 27 SEM = 4/5 = 80% PN 900-999 grs 3/4 = 75%
Sobrevida 28 SEM = 6/8 = 75% PN 1000-1249 grs 15/16 = 93,75%
Sobrevida 29 SEM = 10/11 = 90,9% PN 1250-1499 grs 25/27 = 92,59%
Sobrevida 30 SEM = 9/11 = 81,8% Global < 1500 grs = 51/71 = 71,83%
Sobrevida 31 SEM = 14/16 = 87,5%
Sobrevida global menores de 32 SEM 46/69 = 66,66%
Gracias!