
Energy planning and management during battery manufacturing · 2.1 Lead-acid battery manufacturing...
14
Gest. Prod., São Carlos, v. 26, n. 4, e3928, 2019 https://doi.org/http://dx.doi.org/10.1590/0104-530X3928-19 ISSN 0104-530X (Print) ISSN 1806-9649 (Online) Original Article 1/14 Resumen: El objetivo de este estudio es mejorar el rendimiento energético en una fábrica de baterías en Colombia mediante la introducción del enfoque de gestión energética definido en ISO 50001. En el estudio, los principales consumos de energía se identificaron en la formación de la batería, el sistema de aire comprimido y la gran red eléctrica motores. Se realizó una revisión energética en la fábrica utilizando equipos de medición y técnicas estadísticas. Se propusieron diferentes acciones para mejorar el rendimiento energético. Como resultado, se logró una reducción del 3,48% en el consumo de electricidad durante la implementación de las medidas propuestas. Palabras clave: Planificación energética; Eficiencia energética; ISO 50001. Abstract: The aim of this study is to improve energy performance at a battery factory in Colombia by introducing the energy management approach defined in ISO 50001. In the study, the main energy consumptions were identified in the battery formation, the compressed air system and the large electric motors. An energy review was performed in the factory using measurement equipment and statistical techniques. Different actions were proposed to improve energy performance. As a result, a 3.48% reduction in electricity consumption was achieved during the implementation of the proposed measures. Keywords: Energy planning; Energy efficiency; ISO 50001. How to cite: Noriega Angarita, E., Cabello Eras, J. J., Hernández Herrera, H., Sousa Santos, V., Balbis Morejón, M., Silva Ortega, J. I., & Sagastume Gutiérrez, A. (2019). Energy planning and management during battery manufacturing. Gestão & Produção, 26(4), e3928. https://doi.org/10.1590/0104-530X3928-19 Energy planning and management during battery manufacturing Planificación y gestión energética durante la fabricación de baterías Eliana Noriega Angarita 1 Juan José Cabello Eras 1 Hernán Hernández Herrera 2 Vladimir Sousa Santos 1 Milen Balbis Morejón 1 Jorge Ivan Silva Ortega 1 Alexis Sagastume Gutiérrez 1 1 Grupo de Investigación en Optimización Energética – GIOPEN, Departamento de Energía, Universidad de la Costa – CUC, Calle 58 No 55-66, Barranquilla, Colombia, e-mail: [email protected]; [email protected]; [email protected]; [email protected]; [email protected]; [email protected] 2 Facultad de Ingeniería, Universidad Simón Bolívar, Carrera 59 No. 59-65, Barranquilla, Colombia, e-mail: hernan.hernandez@ unisimonbolivar.edu.co Received Apr. 26, 2017 - Accepted Nov. 24, 2017 Financial support: None. 1 Introduction Since the late 20th century, energy issues have been a top priority at all levels of discussion. This is because energy consumption is growing faster than the population, and the use of primarily fossil fuels is an evident cause of climate change, which poses a major threat to sustainability (Kaygusuz, 2012; Camioto et al., 2015; Castro et al., 2015). Manufacturing is one of the activities that most consumes energy, accounting for 29% of total global consumption (Fawkes et al., 2016). However, it is also one of the areas with the greatest potential in terms of savings, estimated at around 20% of consumption, equivalent to a reduction of 974 million tons of oil equivalent (mtoe) (Chan & Kantamaneni, 2015; Fawkes et al., 2016). One of the main paths to realizing such potential is through energy efficiencies (EE) achieved through improvements in energy management (EM) (Abdelaziz et al., 2011).
Transcript of Energy planning and management during battery manufacturing · 2.1 Lead-acid battery manufacturing...
Gest. Prod., São Carlos, v. 26, n. 4, e3928, 2019https://doi.org/http://dx.doi.org/10.1590/0104-530X3928-19
ISSN 0104-530X (Print)ISSN 1806-9649 (Online)
Original Article
1/14
Resumen: El objetivo de este estudio es mejorar el rendimiento energético en una fábrica de baterías en Colombia mediante la introducción del enfoque de gestión energética definido en ISO 50001. En el estudio, los principales consumos de energía se identificaron en la formación de la batería, el sistema de aire comprimido y la gran red eléctrica motores. Se realizó una revisión energética en la fábrica utilizando equipos de medición y técnicas estadísticas. Se propusieron diferentes acciones para mejorar el rendimiento energético. Como resultado, se logró una reducción del 3,48% en el consumo de electricidad durante la implementación de las medidas propuestas.Palabras clave: Planificación energética; Eficiencia energética; ISO 50001.
Abstract: The aim of this study is to improve energy performance at a battery factory in Colombia by introducing the energy management approach defined in ISO 50001. In the study, the main energy consumptions were identified in the battery formation, the compressed air system and the large electric motors. An energy review was performed in the factory using measurement equipment and statistical techniques. Different actions were proposed to improve energy performance. As a result, a 3.48% reduction in electricity consumption was achieved during the implementation of the proposed measures.Keywords: Energy planning; Energy efficiency; ISO 50001.
How to cite: Noriega Angarita, E., Cabello Eras, J. J., Hernández Herrera, H., Sousa Santos, V., Balbis Morejón, M., Silva Ortega, J. I., & Sagastume Gutiérrez, A. (2019). Energy planning and management during battery manufacturing. Gestão & Produção, 26(4), e3928. https://doi.org/10.1590/0104-530X3928-19
Energy planning and management during battery manufacturing
Planificación y gestión energética durante la fabricación de baterías
Eliana Noriega Angarita1 Juan José Cabello Eras1
Hernán Hernández Herrera2
Vladimir Sousa Santos1
Milen Balbis Morejón1
Jorge Ivan Silva Ortega1
Alexis Sagastume Gutiérrez1
1 Grupo de Investigación en Optimización Energética – GIOPEN, Departamento de Energía, Universidad de la Costa – CUC, Calle 58 No 55-66, Barranquilla, Colombia, e-mail: [email protected]; [email protected]; [email protected]; [email protected]; [email protected]; [email protected]
2 Facultad de Ingeniería, Universidad Simón Bolívar, Carrera 59 No. 59-65, Barranquilla, Colombia, e-mail: [email protected]
Received Apr. 26, 2017 - Accepted Nov. 24, 2017Financial support: None.
1 IntroductionSince the late 20th century, energy issues have
been a top priority at all levels of discussion. This is because energy consumption is growing faster than the population, and the use of primarily fossil fuels is an evident cause of climate change, which poses a major threat to sustainability (Kaygusuz, 2012; Camioto et al., 2015; Castro et al., 2015).
Manufacturing is one of the activities that most consumes energy, accounting for 29% of total global
consumption (Fawkes et al., 2016). However, it is also one of the areas with the greatest potential in terms of savings, estimated at around 20% of consumption, equivalent to a reduction of 974 million tons of oil equivalent (mtoe) (Chan & Kantamaneni, 2015; Fawkes et al., 2016). One of the main paths to realizing such potential is through energy efficiencies (EE) achieved through improvements in energy management (EM) (Abdelaziz et al., 2011).
2/14
Noriega Angarita, E. et al. Gest. Prod., São Carlos, v. 26, n. 4, e3928, 2019
EM is defined by Abdelaziz et al. (2011) and Cabello Eras et al. (2016) as a set of activities carried out to minimize the costs and environmental impacts of energy use without affecting production levels and quality, which involves the continuous improvement of energy performance through control, monitoring, planning and development of actions and strategies to increase EE (Bunse et al., 2011; Aragon et al., 2013).
Even though many countries have made substantial progress in implementing EM (Cabello Eras et al., 2015; Christoffersen et al., 2006; Gielen & Taylor, 2009; Hens et al., 2017; Palamutcu, 2010; Posch et al., 2015; Rudberg et al., 2013; Vine, 2005; Weinert et al., 2011), it is widely acknowledged that there is still a long way to go in terms of optimizing the potential of EM and EE for reducing energy consumption and the environmental impact of manufacturing (Bunse et al., 2011; Cagno & Trianni, 2014; EC, 2014; Giacone & Mancò, 2012; ISO, 2014; Ospino-Castro, 2010; Weinert et al., 2011).
Electric batteries are essential components in numerous applications. The most widely used type is the lead-acid battery, of which three types are produced: starter, traction and stationary batteries. These are used in motor vehicles, electric vehicles and energy storage applications, respectively.
The bulk of production is in starter batteries, of which close to 41.5 billion dollars were sold in 2012 (Miloloza, 2013). Manufacturing of such batteries is highly energy-intensive, as the process uses large quantities of electricity and other energy carriers (Pavlov, 2011; Report Buyer Ltd., 2015; Rydh, 1999; Sullivan & Gaines, 2012). According to (Rydh & Sandén, 2005), each kilo of battery production consumes between 15 and 34 MJ, depending on whether the raw materials are recycled or virgin. The production process accounts for 30% of such energy, primarily in machine operation, heat-based processes for the transformation of materials, battery assembly, and ancillary systems such as compressed air. The stage of the process that consumes most energy is battery formation (Jung et al., 2016; Pavlov, 2011; Sullivan & Gaines, 2012), during which batches of batteries are charged simultaneously for the first time. This is a critical process, as the useful life and performance of the battery largely depends on the manner in which this process is performed.
Heat energy is used primarily in the lead melting process involved in manufacturing battery components. According to (Rantik, 1999), the most widely used energy carrier is electricity (4.8 MJ/kg of batteries), followed by heat (1.68 MJ/kg) and liquefied petroleum gas (LPG) (1.3 MJ/kg).
Despite the high energy-intensiveness of the lead-acid battery manufacturing process, only a handful of studies in the specialized literature address this topic.
The primary objective of this study is to improve energy performance through the implementation of the energy planning process described in the ISO 50001 standard at a Colombian battery factory (ISO, 2011).
The study also aims to lay the foundations for the implementation of an Energy Management System, which over the medium term will complement the Integrated Management System at the company, which holds certifications in ISO 9000 “Quality Management System”, ISO 14000 “Environmental Management System” and ISO 45001 “Work Health and Safety Management System”, contributing substantially to improving overall performance at the company (Cañizares et al., 2015).
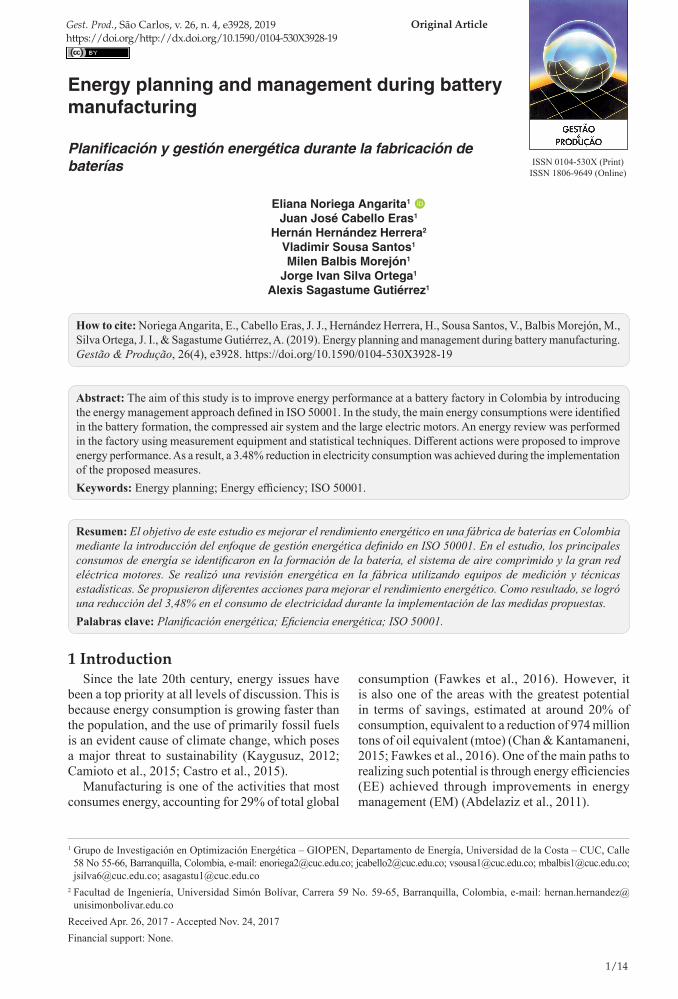
2 Material and methods2.1 Lead-acid battery manufacturing
processFigure 1 represents the lead-acid battery manufacturing
process and its main energy inputs.In the cell manufacturing process, the raw material
is a lead alloy. The cells are manufactured by means of casting in book molds, or through continuous processes such as stamping, extrusion or continuous casting with subsequent rolling. In this process the most widely used energy carrier is heat, which is used to melt the lead, and is usually generated from LPG or oil, followed by electric power for the machines (Jung et al., 2016).
Lead oxide is the main active component of the batteries’ positive and negative electrodes and it is used to coat the cells. They are produced using high purity lead, which is molten in a container and stirred rapidly with a rotating paddle to bring it into contact with an air stream. During this stage energy is consumed primarily in the form of heat to melt the lead, followed by compressed air and powering of machines.
During the pasting process the cells are filled and covered with the lead oxide paste. During this stage electricity is used to power the machines. Afterwards they are cured in a temperature-controlled room during 32 hours; during this phase heat is used to prepare the paste and to control the room’s temperature (Jung et al., 2016).
In the assembly process all the battery components are fitted into the body; once the battery is sealed it is ready to receive the electrolyte. During this stage energy is consumed primarily in terms of electricity and compressed air to power the machines and the devices involved in the assembly (Jung et al., 2016).
The battery formation process consists in charging the battery for the first time; it involves chemical processes in the grids that transform them into active positive and negative electrodes. This process is crucial for the battery’s performance and useful
3/14
Energy planning and management… Gest. Prod., São Carlos, v. 26, n. 4, e3928, 2019
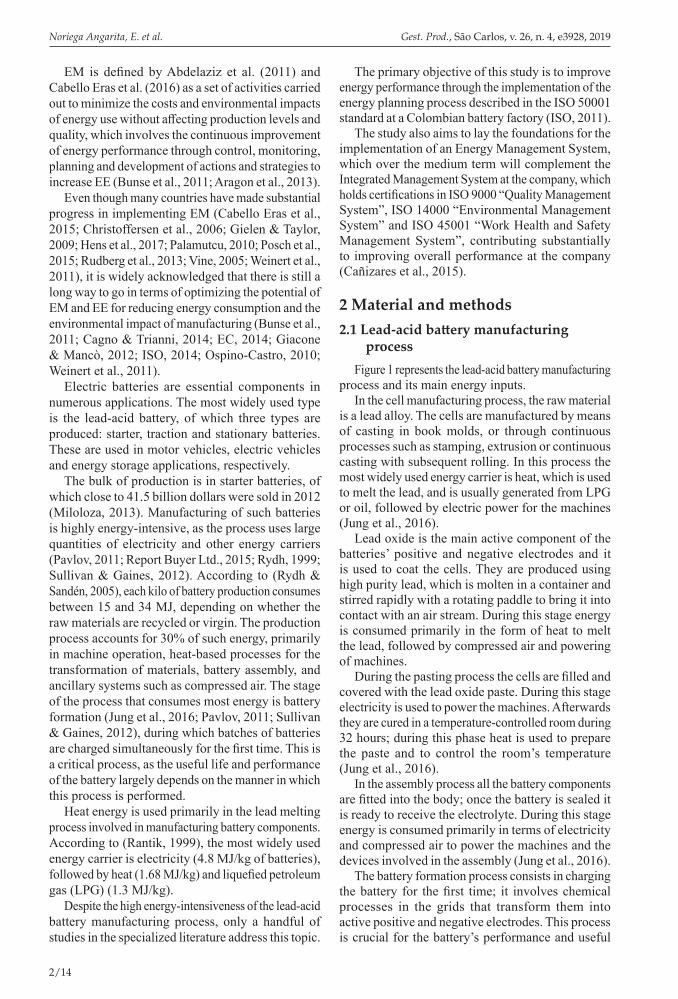
involves the identification of the areas that have the most effect on energy consumption; forecasting and planning of energy consumption; identification of potential savings, and action plans to achieve such savings. The standard describes a four-stage process: energy policy, energy planning, implementation and verification, all as part of a continuous improvement cycle (Soto et al., 2014).
The energy planning phase and the activities that form part of it are considered the core of the EMS. This phase sets the foundations for the development of energy performance improvement strategies by setting specific and attainable objectives and by establishing measures to ensure their fulfillment. Figure 2 provides a schematic view of this phase.
life, and consequently it is performed based on pre-established patterns regarding voltage and current (Pavlov, 2011). In starter batteries, the formation process is performed in special facilities called battery charging units (BCU), which perform the process in batches. This is the process that consumes most electric energy in the starter battery manufacturing process (Jung et al., 2016).
2.2 MethodologyApproval of the ISO 50001 standard in 2011 was
a fundamental step in the development of EM at the international level, because it established the general requirements for Energy Management Systems (EMS). Among other aspects, application of this standard
Figure 1. Lead-acid battery manufacturing process. LPG = Liquefied Petroleum Gas.
Figure 2. Energy Planning.

4/14
Noriega Angarita, E. et al. Gest. Prod., São Carlos, v. 26, n. 4, e3928, 2019
In five of the months it was observed that the behavior of electricity consumption and production were not proportional: In February 2011, May 2012 and November 2014 battery production increased but electric power consumption dropped because most of the batteries produced were of lower capacity. In November 2011 the number of batteries produced fell and electric power consumption dropped only slightly because most batteries produced were of greater capacity. In March 2014 production decreased and power consumption increased because during that month a technical shut-down of the plant took place over several days, during which energy was consumed but no batteries were produced. Despite these exceptions, overall we find that electric power consumption is proportional to the number of batteries produced. The relationship between these two parameters is to be used as the energy performance indicator (EPIn) at the factory.
3.2 Finding the energy baseline and goal lineThe energy baseline (EBL) is used as a benchmark
against which to measure progress and shortcomings in the organization’s energy performance. It establishes the status of energy use at the beginning of the intervention.
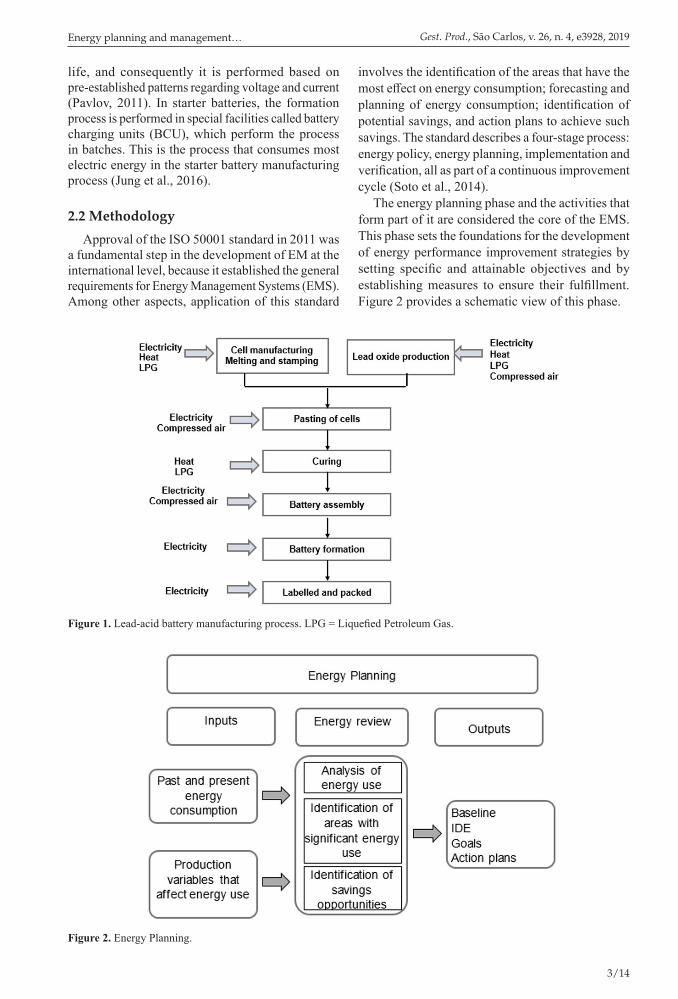
In order to find the EBL, correlation analysis was performed between monthly electricity consumption and monthly battery production from 2011 to 2014; the results are displayed in Figure 4.
All the points included in the correlation analysis reflect actual operating conditions at the factory; statistical analysis of consumption values produced a standardized bias of 0.49 and standardized kurtosis of 0.24. Because the values are within the range of -2 and +2, we can assume that the data are normally
In line with what is established by the ISO 50004 (ISO, 2014) standard, the methodology used in this study has 6 steps:
1. Analysis of energy consumption and use;
2. Finding the energy baseline and goal line;
3. Developing energy performance indicators (EPIn);
4. Identification of areas with significant energy use;
5. Identification of opportunities to improve energy performance;
6. Implementation and evaluation.
3 Results and discussionThe study was carried out at a Colombian battery
factory whose production has increased at a rate of 14% per year between 2012 (742,600 batteries) and 2015 (1,110,900 batteries), in an assortment of 168 battery types. The study reviewed consumption and production data between 2011 and 2014; the proposed improvement measures were implemented in early 2015, and the results were assessed during the same year.
3.1 Analysis of electricity consumptionFigure 3 displays monthly battery production and
electric power consumption between 2011 and 2014, indicating that consumption has risen in line with production, which implies that improving energy efficiency is an important priority given its high incidence on production costs.
Figure 3. Monthly behavior of production and electricity consumption. 2011-2014.
5/14
Energy planning and management… Gest. Prod., São Carlos, v. 26, n. 4, e3928, 2019
electricity consumption and the number of batteries produced at a 95% confidence level.
The lineal correlation found for EBL has a coefficient of determination R2 = 0.7519; since it is greater than 0.6, according to the specialized literature (Becken et al., 2001; Bohdanowicz & Martinac, 2007; Deng, 2003; Matson & Piette, 2005), the relationship between batteries produced and energy consumption may be used to develop an EPIn, and the baseline equation can be used for electricity consumption planning and evaluation purposes.
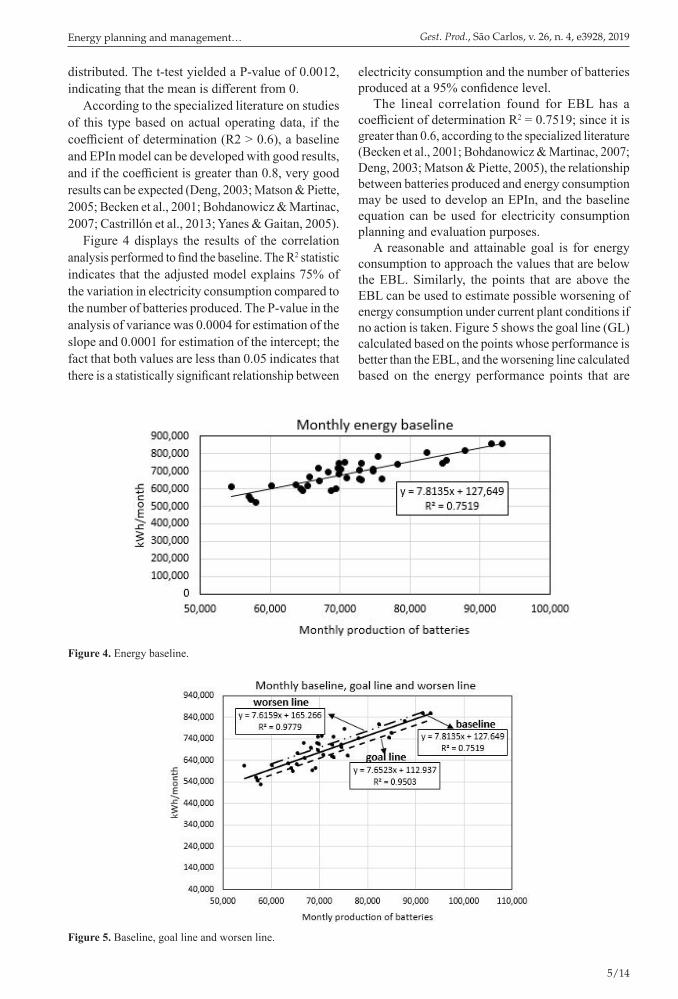
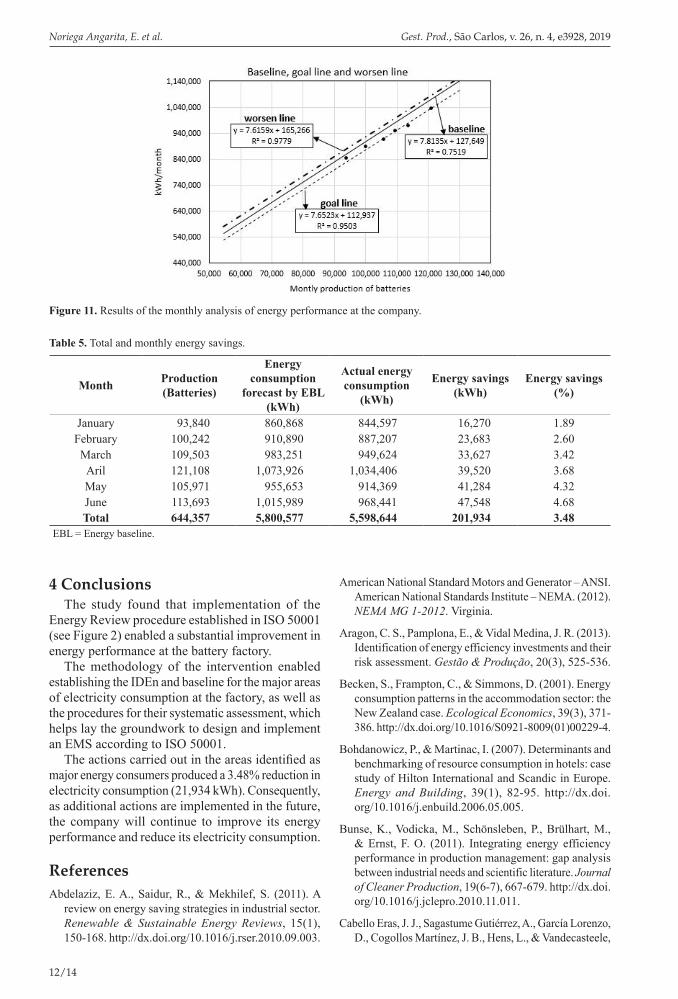
A reasonable and attainable goal is for energy consumption to approach the values that are below the EBL. Similarly, the points that are above the EBL can be used to estimate possible worsening of energy consumption under current plant conditions if no action is taken. Figure 5 shows the goal line (GL) calculated based on the points whose performance is better than the EBL, and the worsening line calculated based on the energy performance points that are
distributed. The t-test yielded a P-value of 0.0012, indicating that the mean is different from 0.
According to the specialized literature on studies of this type based on actual operating data, if the coefficient of determination (R2 > 0.6), a baseline and EPIn model can be developed with good results, and if the coefficient is greater than 0.8, very good results can be expected (Deng, 2003; Matson & Piette, 2005; Becken et al., 2001; Bohdanowicz & Martinac, 2007; Castrillón et al., 2013; Yanes & Gaitan, 2005).
Figure 4 displays the results of the correlation analysis performed to find the baseline. The R2 statistic indicates that the adjusted model explains 75% of the variation in electricity consumption compared to the number of batteries produced. The P-value in the analysis of variance was 0.0004 for estimation of the slope and 0.0001 for estimation of the intercept; the fact that both values are less than 0.05 indicates that there is a statistically significant relationship between
Figure 4. Energy baseline.
Figure 5. Baseline, goal line and worsen line.
6/14
Noriega Angarita, E. et al. Gest. Prod., São Carlos, v. 26, n. 4, e3928, 2019
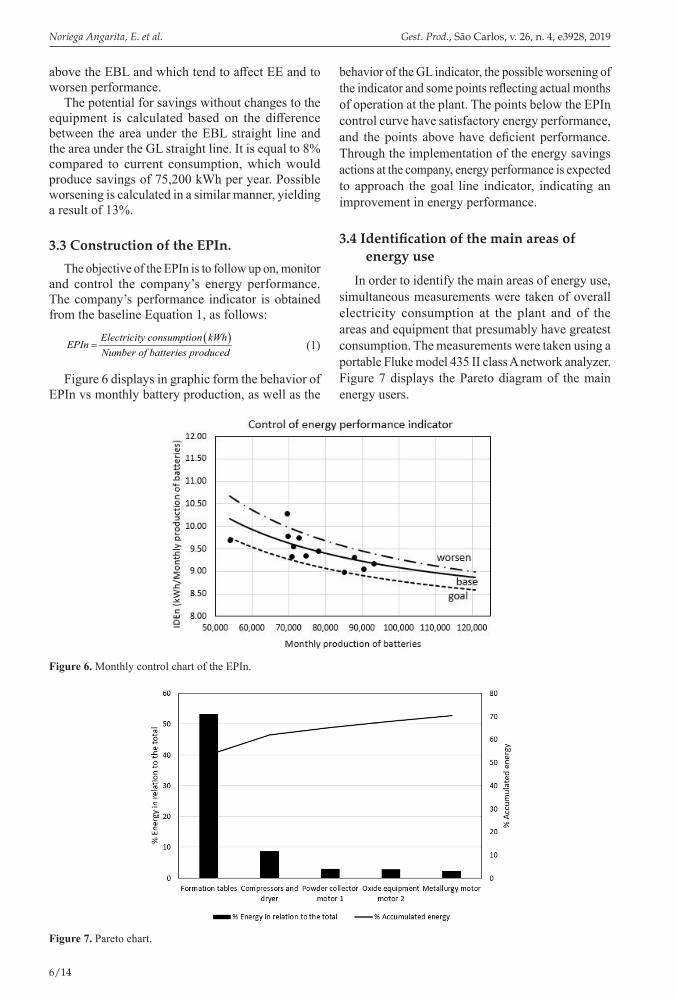
behavior of the GL indicator, the possible worsening of the indicator and some points reflecting actual months of operation at the plant. The points below the EPIn control curve have satisfactory energy performance, and the points above have deficient performance. Through the implementation of the energy savings actions at the company, energy performance is expected to approach the goal line indicator, indicating an improvement in energy performance.
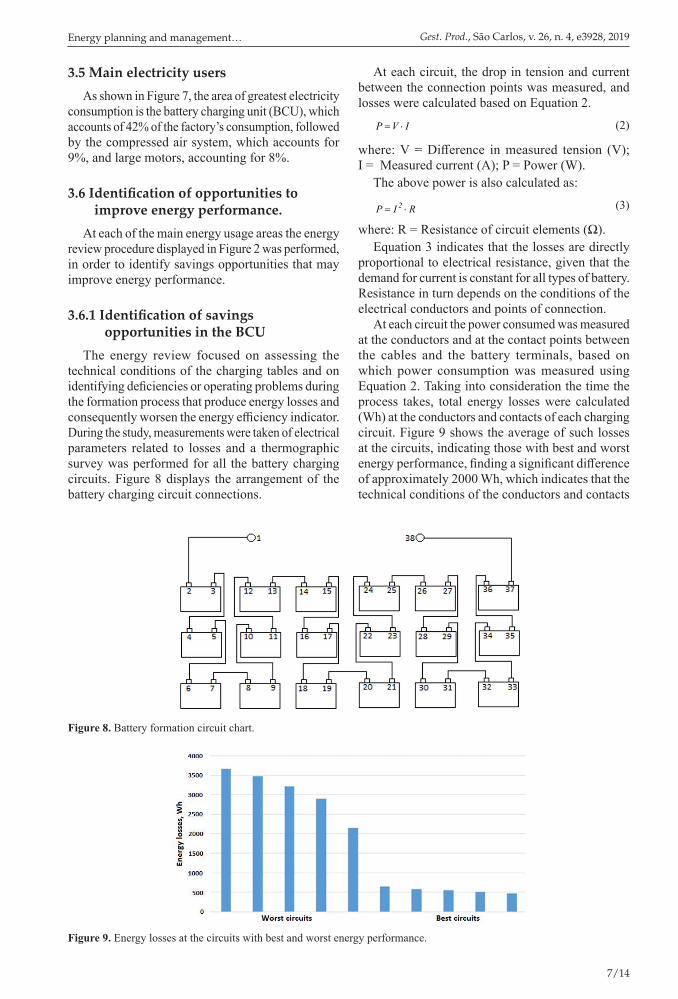
3.4 Identification of the main areas of energy use
In order to identify the main areas of energy use, simultaneous measurements were taken of overall electricity consumption at the plant and of the areas and equipment that presumably have greatest consumption. The measurements were taken using a portable Fluke model 435 II class A network analyzer. Figure 7 displays the Pareto diagram of the main energy users.
above the EBL and which tend to affect EE and to worsen performance.
The potential for savings without changes to the equipment is calculated based on the difference between the area under the EBL straight line and the area under the GL straight line. It is equal to 8% compared to current consumption, which would produce savings of 75,200 kWh per year. Possible worsening is calculated in a similar manner, yielding a result of 13%.
3.3 Construction of the EPIn.The objective of the EPIn is to follow up on, monitor
and control the company’s energy performance. The company’s performance indicator is obtained from the baseline Equation 1, as follows:
( )Electricity consumption kWhEPIn
Number of batteries produced= (1)
Figure 6 displays in graphic form the behavior of EPIn vs monthly battery production, as well as the
Figure 6. Monthly control chart of the EPIn.
Figure 7. Pareto chart.
7/14
Energy planning and management… Gest. Prod., São Carlos, v. 26, n. 4, e3928, 2019
At each circuit, the drop in tension and current between the connection points was measured, and losses were calculated based on Equation 2.
P V I= ⋅ (2)
where: V = Difference in measured tension (V); I = Measured current (A); P = Power (W).
The above power is also calculated as:2P I R= ⋅ (3)
where: R = Resistance of circuit elements (Ω).Equation 3 indicates that the losses are directly
proportional to electrical resistance, given that the demand for current is constant for all types of battery. Resistance in turn depends on the conditions of the electrical conductors and points of connection.
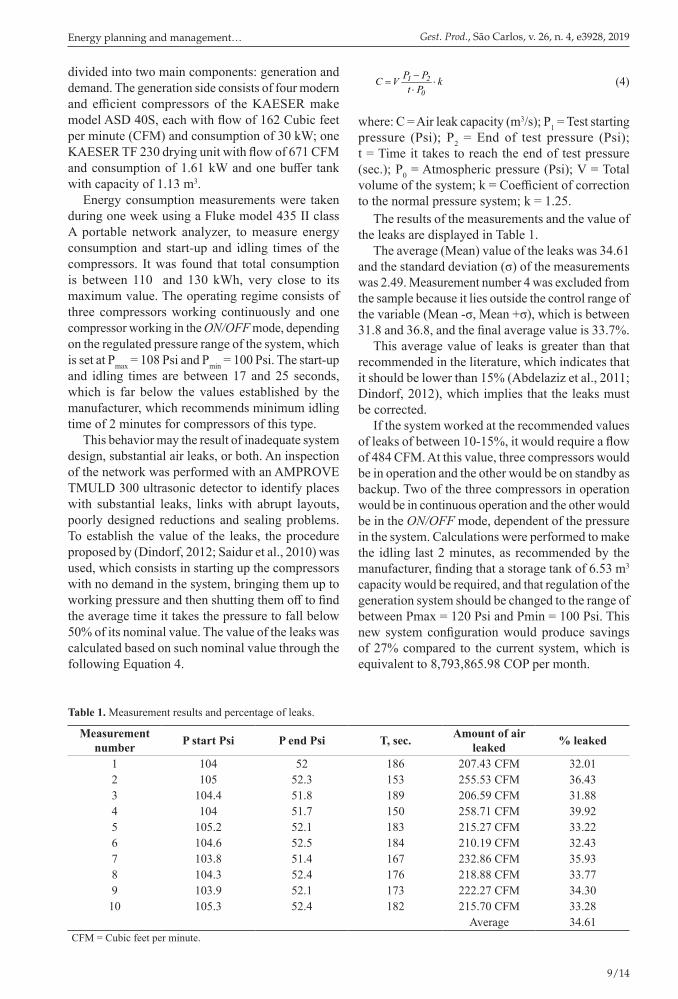
At each circuit the power consumed was measured at the conductors and at the contact points between the cables and the battery terminals, based on which power consumption was measured using Equation 2. Taking into consideration the time the process takes, total energy losses were calculated (Wh) at the conductors and contacts of each charging circuit. Figure 9 shows the average of such losses at the circuits, indicating those with best and worst energy performance, finding a significant difference of approximately 2000 Wh, which indicates that the technical conditions of the conductors and contacts
3.5 Main electricity usersAs shown in Figure 7, the area of greatest electricity
consumption is the battery charging unit (BCU), which accounts of 42% of the factory’s consumption, followed by the compressed air system, which accounts for 9%, and large motors, accounting for 8%.
3.6 Identification of opportunities to improve energy performance.
At each of the main energy usage areas the energy review procedure displayed in Figure 2 was performed, in order to identify savings opportunities that may improve energy performance.
3.6.1 Identification of savings opportunities in the BCU
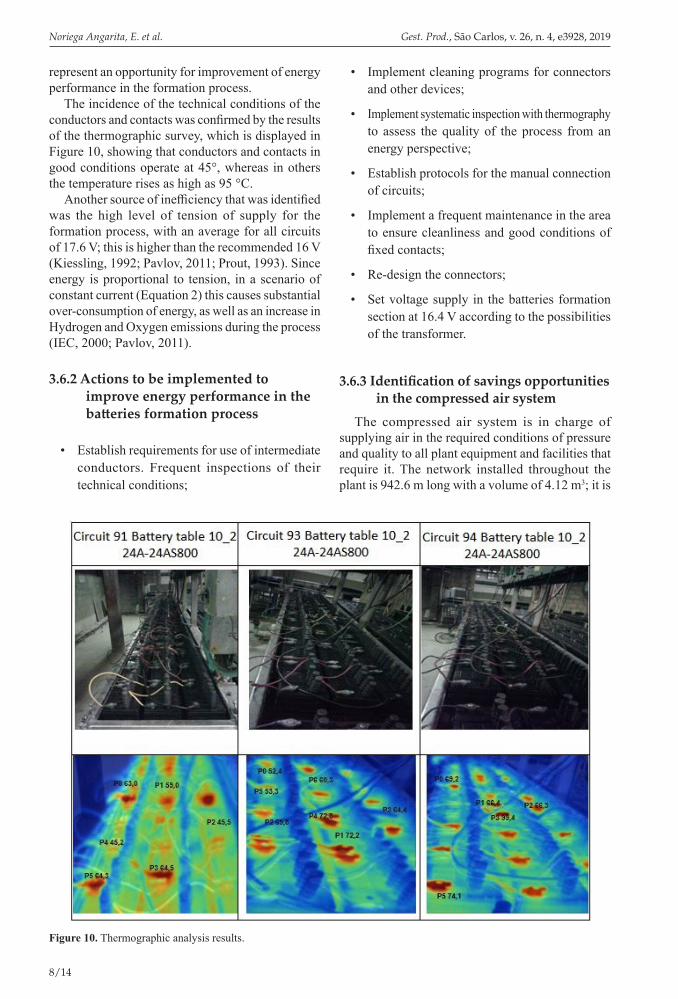
The energy review focused on assessing the technical conditions of the charging tables and on identifying deficiencies or operating problems during the formation process that produce energy losses and consequently worsen the energy efficiency indicator. During the study, measurements were taken of electrical parameters related to losses and a thermographic survey was performed for all the battery charging circuits. Figure 8 displays the arrangement of the battery charging circuit connections.
Figure 8. Battery formation circuit chart.
Figure 9. Energy losses at the circuits with best and worst energy performance.
8/14
Noriega Angarita, E. et al. Gest. Prod., São Carlos, v. 26, n. 4, e3928, 2019
• Implement cleaning programs for connectors and other devices;
• Implement systematic inspection with thermography to assess the quality of the process from an energy perspective;
• Establish protocols for the manual connection of circuits;
• Implement a frequent maintenance in the area to ensure cleanliness and good conditions of fixed contacts;
• Re-design the connectors;
• Set voltage supply in the batteries formation section at 16.4 V according to the possibilities of the transformer.
3.6.3 Identification of savings opportunities in the compressed air system
The compressed air system is in charge of supplying air in the required conditions of pressure and quality to all plant equipment and facilities that require it. The network installed throughout the plant is 942.6 m long with a volume of 4.12 m3; it is
represent an opportunity for improvement of energy performance in the formation process.
The incidence of the technical conditions of the conductors and contacts was confirmed by the results of the thermographic survey, which is displayed in Figure 10, showing that conductors and contacts in good conditions operate at 45°, whereas in others the temperature rises as high as 95 °C.
Another source of inefficiency that was identified was the high level of tension of supply for the formation process, with an average for all circuits of 17.6 V; this is higher than the recommended 16 V (Kiessling, 1992; Pavlov, 2011; Prout, 1993). Since energy is proportional to tension, in a scenario of constant current (Equation 2) this causes substantial over-consumption of energy, as well as an increase in Hydrogen and Oxygen emissions during the process (IEC, 2000; Pavlov, 2011).
3.6.2 Actions to be implemented to improve energy performance in the batteries formation process
• Establish requirements for use of intermediate conductors. Frequent inspections of their technical conditions;
Figure 10. Thermographic analysis results.
9/14
Energy planning and management… Gest. Prod., São Carlos, v. 26, n. 4, e3928, 2019
1 2
0
P PC V kt P−
= ⋅⋅
(4)
where: C = Air leak capacity (m3/s); P1 = Test starting pressure (Psi); P2 = End of test pressure (Psi); t = Time it takes to reach the end of test pressure (sec.); P0 = Atmospheric pressure (Psi); V = Total volume of the system; k = Coefficient of correction to the normal pressure system; k = 1.25.
The results of the measurements and the value of the leaks are displayed in Table 1.
The average (Mean) value of the leaks was 34.61 and the standard deviation (σ) of the measurements was 2.49. Measurement number 4 was excluded from the sample because it lies outside the control range of the variable (Mean -σ, Mean +σ), which is between 31.8 and 36.8, and the final average value is 33.7%.
This average value of leaks is greater than that recommended in the literature, which indicates that it should be lower than 15% (Abdelaziz et al., 2011; Dindorf, 2012), which implies that the leaks must be corrected.
If the system worked at the recommended values of leaks of between 10-15%, it would require a flow of 484 CFM. At this value, three compressors would be in operation and the other would be on standby as backup. Two of the three compressors in operation would be in continuous operation and the other would be in the ON/OFF mode, dependent of the pressure in the system. Calculations were performed to make the idling last 2 minutes, as recommended by the manufacturer, finding that a storage tank of 6.53 m3 capacity would be required, and that regulation of the generation system should be changed to the range of between Pmax = 120 Psi and Pmin = 100 Psi. This new system configuration would produce savings of 27% compared to the current system, which is equivalent to 8,793,865.98 COP per month.
divided into two main components: generation and demand. The generation side consists of four modern and efficient compressors of the KAESER make model ASD 40S, each with flow of 162 Cubic feet per minute (CFM) and consumption of 30 kW; one KAESER TF 230 drying unit with flow of 671 CFM and consumption of 1.61 kW and one buffer tank with capacity of 1.13 m3.
Energy consumption measurements were taken during one week using a Fluke model 435 II class A portable network analyzer, to measure energy consumption and start-up and idling times of the compressors. It was found that total consumption is between 110 and 130 kWh, very close to its maximum value. The operating regime consists of three compressors working continuously and one compressor working in the ON/OFF mode, depending on the regulated pressure range of the system, which is set at Pmax = 108 Psi and Pmin = 100 Psi. The start-up and idling times are between 17 and 25 seconds, which is far below the values established by the manufacturer, which recommends minimum idling time of 2 minutes for compressors of this type.
This behavior may the result of inadequate system design, substantial air leaks, or both. An inspection of the network was performed with an AMPROVE TMULD 300 ultrasonic detector to identify places with substantial leaks, links with abrupt layouts, poorly designed reductions and sealing problems. To establish the value of the leaks, the procedure proposed by (Dindorf, 2012; Saidur et al., 2010) was used, which consists in starting up the compressors with no demand in the system, bringing them up to working pressure and then shutting them off to find the average time it takes the pressure to fall below 50% of its nominal value. The value of the leaks was calculated based on such nominal value through the following Equation 4.
Table 1. Measurement results and percentage of leaks.
Measurement number P start Psi P end Psi T, sec. Amount of air
leaked % leaked
1 104 52 186 207.43 CFM 32.012 105 52.3 153 255.53 CFM 36.433 104.4 51.8 189 206.59 CFM 31.884 104 51.7 150 258.71 CFM 39.925 105.2 52.1 183 215.27 CFM 33.226 104.6 52.5 184 210.19 CFM 32.437 103.8 51.4 167 232.86 CFM 35.938 104.3 52.4 176 218.88 CFM 33.779 103.9 52.1 173 222.27 CFM 34.3010 105.3 52.4 182 215.70 CFM 33.28
Average 34.61CFM = Cubic feet per minute.
10/14
Noriega Angarita, E. et al. Gest. Prod., São Carlos, v. 26, n. 4, e3928, 2019
motor was performed using a method based on the data on the motor plates and catalogs (Hasanuzzaman et al., 2011). The assessment considers the effects of the harmonics generated by the frequency drives, by means of the model for losses due to the effect of harmonics indicated in the standard (ANSI, 2012).
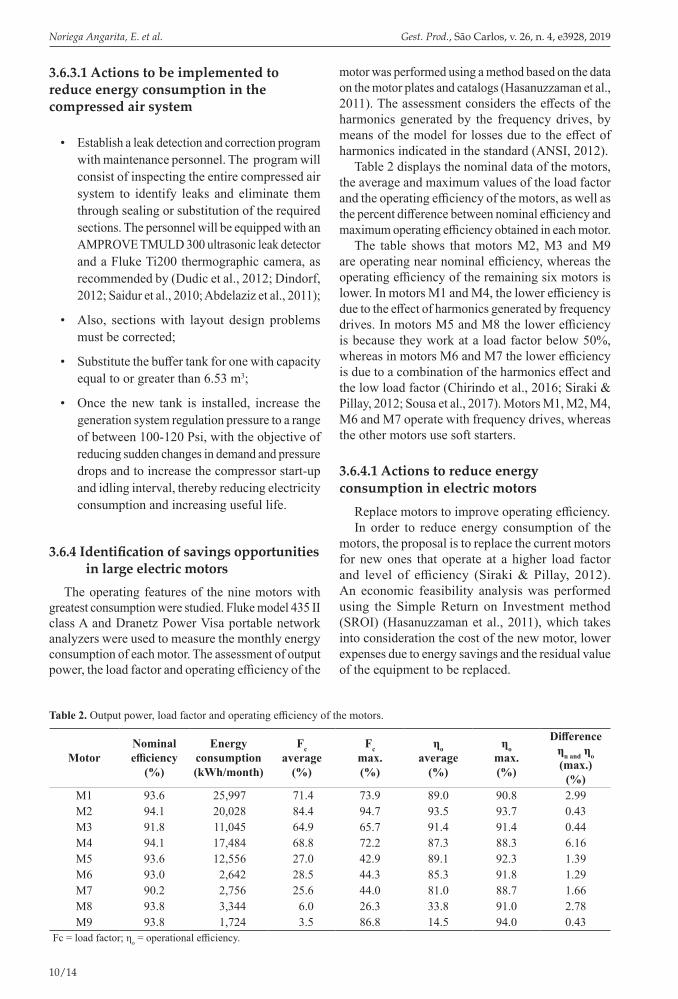
Table 2 displays the nominal data of the motors, the average and maximum values of the load factor and the operating efficiency of the motors, as well as the percent difference between nominal efficiency and maximum operating efficiency obtained in each motor.
The table shows that motors M2, M3 and M9 are operating near nominal efficiency, whereas the operating efficiency of the remaining six motors is lower. In motors M1 and M4, the lower efficiency is due to the effect of harmonics generated by frequency drives. In motors M5 and M8 the lower efficiency is because they work at a load factor below 50%, whereas in motors M6 and M7 the lower efficiency is due to a combination of the harmonics effect and the low load factor (Chirindo et al., 2016; Siraki & Pillay, 2012; Sousa et al., 2017). Motors M1, M2, M4, M6 and M7 operate with frequency drives, whereas the other motors use soft starters.
3.6.4.1 Actions to reduce energy consumption in electric motors
Replace motors to improve operating efficiency.In order to reduce energy consumption of the
motors, the proposal is to replace the current motors for new ones that operate at a higher load factor and level of efficiency (Siraki & Pillay, 2012). An economic feasibility analysis was performed using the Simple Return on Investment method (SROI) (Hasanuzzaman et al., 2011), which takes into consideration the cost of the new motor, lower expenses due to energy savings and the residual value of the equipment to be replaced.
3.6.3.1 Actions to be implemented to reduce energy consumption in the compressed air system
• Establish a leak detection and correction program with maintenance personnel. The program will consist of inspecting the entire compressed air system to identify leaks and eliminate them through sealing or substitution of the required sections. The personnel will be equipped with an AMPROVE TMULD 300 ultrasonic leak detector and a Fluke Ti200 thermographic camera, as recommended by (Dudic et al., 2012; Dindorf, 2012; Saidur et al., 2010; Abdelaziz et al., 2011);
• Also, sections with layout design problems must be corrected;
• Substitute the buffer tank for one with capacity equal to or greater than 6.53 m3;
• Once the new tank is installed, increase the generation system regulation pressure to a range of between 100-120 Psi, with the objective of reducing sudden changes in demand and pressure drops and to increase the compressor start-up and idling interval, thereby reducing electricity consumption and increasing useful life.
3.6.4 Identification of savings opportunities in large electric motors
The operating features of the nine motors with greatest consumption were studied. Fluke model 435 II class A and Dranetz Power Visa portable network analyzers were used to measure the monthly energy consumption of each motor. The assessment of output power, the load factor and operating efficiency of the
Table 2. Output power, load factor and operating efficiency of the motors.
MotorNominal efficiency
(%)
Energy consumption(kWh/month)
Fcaverage
(%)
Fcmax.(%)
ηoaverage
(%)
ηomax.(%)
Differenceηn and ηo (max.)
(%)M1 93.6 25,997 71.4 73.9 89.0 90.8 2.99M2 94.1 20,028 84.4 94.7 93.5 93.7 0.43M3 91.8 11,045 64.9 65.7 91.4 91.4 0.44M4 94.1 17,484 68.8 72.2 87.3 88.3 6.16M5 93.6 12,556 27.0 42.9 89.1 92.3 1.39M6 93.0 2,642 28.5 44.3 85.3 91.8 1.29M7 90.2 2,756 25.6 44.0 81.0 88.7 1.66M8 93.8 3,344 6.0 26.3 33.8 91.0 2.78M9 93.8 1,724 3.5 86.8 14.5 94.0 0.43
Fc = load factor; ηo = operational efficiency.
11/14
Energy planning and management… Gest. Prod., São Carlos, v. 26, n. 4, e3928, 2019
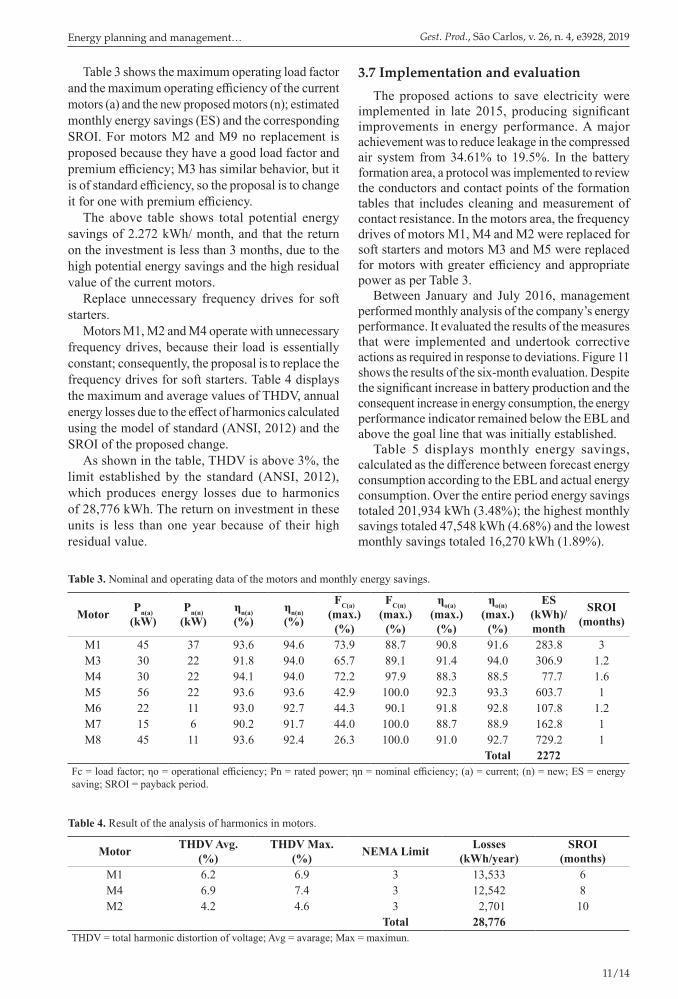
Table 3 shows the maximum operating load factor and the maximum operating efficiency of the current motors (a) and the new proposed motors (n); estimated monthly energy savings (ES) and the corresponding SROI. For motors M2 and M9 no replacement is proposed because they have a good load factor and premium efficiency; M3 has similar behavior, but it is of standard efficiency, so the proposal is to change it for one with premium efficiency.
The above table shows total potential energy savings of 2.272 kWh/ month, and that the return on the investment is less than 3 months, due to the high potential energy savings and the high residual value of the current motors.
Replace unnecessary frequency drives for soft starters.
Motors M1, M2 and M4 operate with unnecessary frequency drives, because their load is essentially constant; consequently, the proposal is to replace the frequency drives for soft starters. Table 4 displays the maximum and average values of THDV, annual energy losses due to the effect of harmonics calculated using the model of standard (ANSI, 2012) and the SROI of the proposed change.
As shown in the table, THDV is above 3%, the limit established by the standard (ANSI, 2012), which produces energy losses due to harmonics of 28,776 kWh. The return on investment in these units is less than one year because of their high residual value.
3.7 Implementation and evaluationThe proposed actions to save electricity were
implemented in late 2015, producing significant improvements in energy performance. A major achievement was to reduce leakage in the compressed air system from 34.61% to 19.5%. In the battery formation area, a protocol was implemented to review the conductors and contact points of the formation tables that includes cleaning and measurement of contact resistance. In the motors area, the frequency drives of motors M1, M4 and M2 were replaced for soft starters and motors M3 and M5 were replaced for motors with greater efficiency and appropriate power as per Table 3.
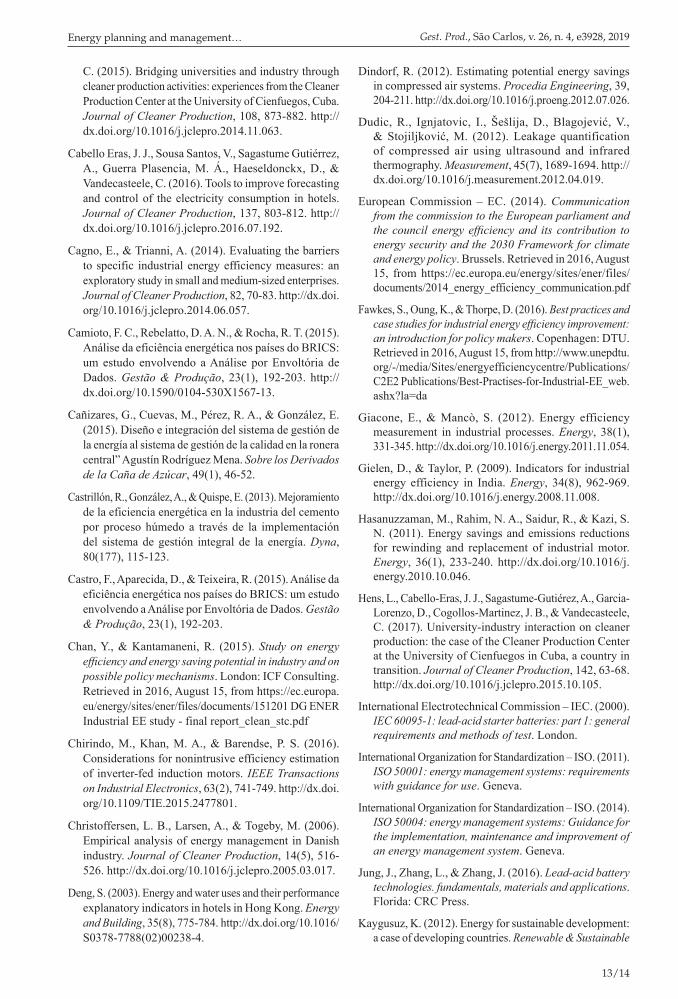
Between January and July 2016, management performed monthly analysis of the company’s energy performance. It evaluated the results of the measures that were implemented and undertook corrective actions as required in response to deviations. Figure 11 shows the results of the six-month evaluation. Despite the significant increase in battery production and the consequent increase in energy consumption, the energy performance indicator remained below the EBL and above the goal line that was initially established.
Table 5 displays monthly energy savings, calculated as the difference between forecast energy consumption according to the EBL and actual energy consumption. Over the entire period energy savings totaled 201,934 kWh (3.48%); the highest monthly savings totaled 47,548 kWh (4.68%) and the lowest monthly savings totaled 16,270 kWh (1.89%).
Table 3. Nominal and operating data of the motors and monthly energy savings.
Motor Pn(a)(kW)
Pn(n)(kW)
ηn(a)(%)
ηn(n)(%)
FC(a) (max.)
(%)
FC(n)(max.)
(%)
ηo(a)(max.)
(%)
ηo(n)(max.)
(%)
ES(kWh)/month
SROI(months)
M1 45 37 93.6 94.6 73.9 88.7 90.8 91.6 283.8 3M3 30 22 91.8 94.0 65.7 89.1 91.4 94.0 306.9 1.2M4 30 22 94.1 94.0 72.2 97.9 88.3 88.5 77.7 1.6M5 56 22 93.6 93.6 42.9 100.0 92.3 93.3 603.7 1M6 22 11 93.0 92.7 44.3 90.1 91.8 92.8 107.8 1.2M7 15 6 90.2 91.7 44.0 100.0 88.7 88.9 162.8 1M8 45 11 93.6 92.4 26.3 100.0 91.0 92.7 729.2 1
Total 2272Fc = load factor; ηo = operational efficiency; Pn = rated power; ηn = nominal efficiency; (a) = current; (n) = new; ES = energy saving; SROI = payback period.
Table 4. Result of the analysis of harmonics in motors.
Motor THDV Avg. (%)
THDV Max. (%) NEMA Limit Losses
(kWh/year)SROI
(months)M1 6.2 6.9 3 13,533 6M4 6.9 7.4 3 12,542 8M2 4.2 4.6 3 2,701 10
Total 28,776THDV = total harmonic distortion of voltage; Avg = avarage; Max = maximun.
12/14
Noriega Angarita, E. et al. Gest. Prod., São Carlos, v. 26, n. 4, e3928, 2019
4 ConclusionsThe study found that implementation of the
Energy Review procedure established in ISO 50001 (see Figure 2) enabled a substantial improvement in energy performance at the battery factory.
The methodology of the intervention enabled establishing the IDEn and baseline for the major areas of electricity consumption at the factory, as well as the procedures for their systematic assessment, which helps lay the groundwork to design and implement an EMS according to ISO 50001.
The actions carried out in the areas identified as major energy consumers produced a 3.48% reduction in electricity consumption (21,934 kWh). Consequently, as additional actions are implemented in the future, the company will continue to improve its energy performance and reduce its electricity consumption.
ReferencesAbdelaziz, E. A., Saidur, R., & Mekhilef, S. (2011). A
review on energy saving strategies in industrial sector. Renewable & Sustainable Energy Reviews, 15(1), 150-168. http://dx.doi.org/10.1016/j.rser.2010.09.003.
American National Standard Motors and Generator – ANSI. American National Standards Institute – NEMA. (2012). NEMA MG 1-2012. Virginia.
Aragon, C. S., Pamplona, E., & Vidal Medina, J. R. (2013). Identification of energy efficiency investments and their risk assessment. Gestão & Produção, 20(3), 525-536.
Becken, S., Frampton, C., & Simmons, D. (2001). Energy consumption patterns in the accommodation sector: the New Zealand case. Ecological Economics, 39(3), 371-386. http://dx.doi.org/10.1016/S0921-8009(01)00229-4.
Bohdanowicz, P., & Martinac, I. (2007). Determinants and benchmarking of resource consumption in hotels: case study of Hilton International and Scandic in Europe. Energy and Building, 39(1), 82-95. http://dx.doi.org/10.1016/j.enbuild.2006.05.005.
Bunse, K., Vodicka, M., Schönsleben, P., Brülhart, M., & Ernst, F. O. (2011). Integrating energy efficiency performance in production management: gap analysis between industrial needs and scientific literature. Journal of Cleaner Production, 19(6-7), 667-679. http://dx.doi.org/10.1016/j.jclepro.2010.11.011.
Cabello Eras, J. J., Sagastume Gutiérrez, A., García Lorenzo, D., Cogollos Martínez, J. B., Hens, L., & Vandecasteele,
Figure 11. Results of the monthly analysis of energy performance at the company.
Table 5. Total and monthly energy savings.
Month Production(Batteries)
Energy consumption
forecast by EBL (kWh)
Actual energy consumption
(kWh)
Energy savings(kWh)
Energy savings (%)
January 93,840 860,868 844,597 16,270 1.89February 100,242 910,890 887,207 23,683 2.60March 109,503 983,251 949,624 33,627 3.42Aril 121,108 1,073,926 1,034,406 39,520 3.68May 105,971 955,653 914,369 41,284 4.32June 113,693 1,015,989 968,441 47,548 4.68Total 644,357 5,800,577 5,598,644 201,934 3.48
EBL = Energy baseline.
13/14
Energy planning and management… Gest. Prod., São Carlos, v. 26, n. 4, e3928, 2019
C. (2015). Bridging universities and industry through cleaner production activities: experiences from the Cleaner Production Center at the University of Cienfuegos, Cuba. Journal of Cleaner Production, 108, 873-882. http://dx.doi.org/10.1016/j.jclepro.2014.11.063.
Cabello Eras, J. J., Sousa Santos, V., Sagastume Gutiérrez, A., Guerra Plasencia, M. Á., Haeseldonckx, D., & Vandecasteele, C. (2016). Tools to improve forecasting and control of the electricity consumption in hotels. Journal of Cleaner Production, 137, 803-812. http://dx.doi.org/10.1016/j.jclepro.2016.07.192.
Cagno, E., & Trianni, A. (2014). Evaluating the barriers to specific industrial energy efficiency measures: an exploratory study in small and medium-sized enterprises. Journal of Cleaner Production, 82, 70-83. http://dx.doi.org/10.1016/j.jclepro.2014.06.057.
Camioto, F. C., Rebelatto, D. A. N., & Rocha, R. T. (2015). Análise da eficiência energética nos países do BRICS: um estudo envolvendo a Análise por Envoltória de Dados. Gestão & Produção, 23(1), 192-203. http://dx.doi.org/10.1590/0104-530X1567-13.
Cañizares, G., Cuevas, M., Pérez, R. A., & González, E. (2015). Diseño e integración del sistema de gestión de la energía al sistema de gestión de la calidad en la ronera central” Agustín Rodríguez Mena. Sobre los Derivados de la Caña de Azúcar, 49(1), 46-52.
Castrillón, R., González, A., & Quispe, E. (2013). Mejoramiento de la eficiencia energética en la industria del cemento por proceso húmedo a través de la implementación del sistema de gestión integral de la energía. Dyna, 80(177), 115-123.
Castro, F., Aparecida, D., & Teixeira, R. (2015). Análise da eficiência energética nos países do BRICS: um estudo envolvendo a Análise por Envoltória de Dados. Gestão & Produção, 23(1), 192-203.
Chan, Y., & Kantamaneni, R. (2015). Study on energy efficiency and energy saving potential in industry and on possible policy mechanisms. London: ICF Consulting. Retrieved in 2016, August 15, from https://ec.europa.eu/energy/sites/ener/files/documents/151201 DG ENER Industrial EE study - final report_clean_stc.pdf
Chirindo, M., Khan, M. A., & Barendse, P. S. (2016). Considerations for nonintrusive efficiency estimation of inverter-fed induction motors. IEEE Transactions on Industrial Electronics, 63(2), 741-749. http://dx.doi.org/10.1109/TIE.2015.2477801.
Christoffersen, L. B., Larsen, A., & Togeby, M. (2006). Empirical analysis of energy management in Danish industry. Journal of Cleaner Production, 14(5), 516-526. http://dx.doi.org/10.1016/j.jclepro.2005.03.017.
Deng, S. (2003). Energy and water uses and their performance explanatory indicators in hotels in Hong Kong. Energy and Building, 35(8), 775-784. http://dx.doi.org/10.1016/S0378-7788(02)00238-4.
Dindorf, R. (2012). Estimating potential energy savings in compressed air systems. Procedia Engineering, 39, 204-211. http://dx.doi.org/10.1016/j.proeng.2012.07.026.
Dudic, R., Ignjatovic, I., Šešlija, D., Blagojević, V., & Stojiljković, M. (2012). Leakage quantification of compressed air using ultrasound and infrared thermography. Measurement, 45(7), 1689-1694. http://dx.doi.org/10.1016/j.measurement.2012.04.019.
European Commission – EC. (2014). Communication from the commission to the European parliament and the council energy efficiency and its contribution to energy security and the 2030 Framework for climate and energy policy. Brussels. Retrieved in 2016, August 15, from https://ec.europa.eu/energy/sites/ener/files/ documents/2014_energy_efficiency_communication.pdf
Fawkes, S., Oung, K., & Thorpe, D. (2016). Best practices and case studies for industrial energy efficiency improvement: an introduction for policy makers. Copenhagen: DTU. Retrieved in 2016, August 15, from http://www.unepdtu.org/-/media/Sites/energyefficiencycentre/Publications/C2E2 Publications/Best-Practises-for-Industrial-EE_web.ashx?la=da
Giacone, E., & Mancò, S. (2012). Energy efficiency measurement in industrial processes. Energy, 38(1), 331-345. http://dx.doi.org/10.1016/j.energy.2011.11.054.
Gielen, D., & Taylor, P. (2009). Indicators for industrial energy efficiency in India. Energy, 34(8), 962-969. http://dx.doi.org/10.1016/j.energy.2008.11.008.
Hasanuzzaman, M., Rahim, N. A., Saidur, R., & Kazi, S. N. (2011). Energy savings and emissions reductions for rewinding and replacement of industrial motor. Energy, 36(1), 233-240. http://dx.doi.org/10.1016/j.energy.2010.10.046.
Hens, L., Cabello-Eras, J. J., Sagastume-Gutiérez, A., Garcia-Lorenzo, D., Cogollos-Martinez, J. B., & Vandecasteele, C. (2017). University-industry interaction on cleaner production: the case of the Cleaner Production Center at the University of Cienfuegos in Cuba, a country in transition. Journal of Cleaner Production, 142, 63-68. http://dx.doi.org/10.1016/j.jclepro.2015.10.105.
International Electrotechnical Commission – IEC. (2000). IEC 60095-1: lead-acid starter batteries: part 1: general requirements and methods of test. London.
International Organization for Standardization – ISO. (2011). ISO 50001: energy management systems: requirements with guidance for use. Geneva.
International Organization for Standardization – ISO. (2014). ISO 50004: energy management systems: Guidance for the implementation, maintenance and improvement of an energy management system. Geneva.
Jung, J., Zhang, L., & Zhang, J. (2016). Lead-acid battery technologies. fundamentals, materials and applications. Florida: CRC Press.
Kaygusuz, K. (2012). Energy for sustainable development: a case of developing countries. Renewable & Sustainable
14/14
Noriega Angarita, E. et al. Gest. Prod., São Carlos, v. 26, n. 4, e3928, 2019
Rudberg, M., Waldemarsson, M., & Lidestam, H. (2013). Strategic perspectives on energy management: a case study in the process industry. Applied Energy, 104, 487-496. http://dx.doi.org/10.1016/j.apenergy.2012.11.027.
Rydh, C. J. (1999). Environmental assessment of vanadium redox and lead-acid batteries for stationary energy storage. Journal of Power Sources, 80(1-2), 21-29. http://dx.doi.org/10.1016/S0378-7753(98)00249-3.
Rydh, C. J., & Sandén, B. A. (2005). Energy analysis of batteries in photovoltaic systems. Part I: performance and energy requirements. Energy Conversion and Management, 46(11-12), 1957-1979. http://dx.doi.org/10.1016/j.enconman.2004.10.003.
Saidur, R., Rahim, N. A., & Hasanuzzaman, M. (2010). A review on compressed-air energy use and energy savings. Renewable & Sustainable Energy Reviews, 14(4), 1135-1153. http://dx.doi.org/10.1016/j.rser.2009.11.013.
Siraki, A. G., & Pillay, P. (2012). An in situ efficiency estimation technique for induction machines working with unbalanced supplies. IEEE Transactions on Energy Conversion, 27(1), 85-95. http://dx.doi.org/10.1109/TEC.2011.2168563.
Soto, J., Borroto, A., Bah, M. A., González, R., Curbelo, M., & Díaz, A. M. (2014). Diseño y aplicación de un procedimiento para la planificación energética según la NC-ISO 50001: 2011. Ingeniería Energética, 35(1), 38-47.
Sousa, V., Hernández Herrera, H., Quispe, E. C., Viego, P. R., & Gómez, J. R. (2017). Harmonic distortion evaluation generated by PWM motor drives in electrical industrial systems. Iranian Journal of Electrical and Computer Engineering, 7(6), 3207-3216. http://dx.doi.org/10.11591/ijece.v7i6.pp3207-3216.
Sullivan, J. L., & Gaines, L. (2012). Status of life cycle inventories for batteries. Energy Conversion and Management, 58, 134-148. http://dx.doi.org/10.1016/j.enconman.2012.01.001.
Vine, E. (2005). An international survey of the energy service company ESCO industry. Energy Policy, 33(5), 691-704. http://dx.doi.org/10.1016/j.enpol.2003.09.014.
Weinert, N., Chiotellis, S., & Seliger, G. (2011). Methodology for planning and operating energy-efficient production systems. CIRP Annals Manufacturing Technology, 60(1), 41-44. http://dx.doi.org/10.1016/j.cirp.2011.03.015.
Yanes, J. P. M., & Gaitan, O. G. (2005). Herramientas para la gestión energética empresarial. Sciences et Techniques, 3(29), 169-174.
Energy Reviews, 16(2), 1116-1126. http://dx.doi.org/10.1016/j.rser.2011.11.013.
Kiessling, R. (1992). Lead acid battery formation techniques. Shelton: Digatron Firing Circuits. Retrieved in 2016, August 15, from http://www.digatron.com/fileadmin/pdf/lead_acid.pdf
Matson, N. E., & Piette, M. A. (2005). High performance commercial building systems: review of California and National Benchmarking Methods. Working Draft. Berkeley: United States Government. Retrieved in 2016, August 15, from https://www.semanticscholar.org/paper/Review-of-California-and-National-Benchmarking-Piette-Lawrence/8c0a3ecbe7c21ddcb43625a2104e445136c2f009
Miloloza, I. (2013). Tendencies of development of global battery market with emphasis on Republic of Croatia. Interdisciplinary Description of Complex Systems, 11(3), 318-333. http://dx.doi.org/10.7906/indecs.11.3.3.
Ospino-Castro, A. (2010). Análisis del potencial energético solar en la Región Caribe para el diseño de un sistema fotovoltaico. INGECUC, 6(6), 1-8. Retrieved in 2016, August 15, from http://revistascientificas.cuc.edu.co/index.php/ingecuc/article/view/296
Palamutcu, S. (2010). Electric energy consumption in the cotton textile processing stages. Energy, 35(7), 2945-2952. http://dx.doi.org/10.1016/j.energy.2010.03.029.
Pavlov, D. (2011). Lead-acid batteries: science and technology: a handbook of lead-acid battery technology and its Influence on the product. Amsterdam: Elsevier.
Posch, A., Brudermann, T., Braschel, N., & Gabriel, M. (2015). Strategic energy management in energy-intensive enterprises: a quantitative analysis of relevant factors in the Austrian paper and pulp industry. Journal of Cleaner Production, 90, 291-299. http://dx.doi.org/10.1016/j.jclepro.2014.11.044.
Prout, L. (1993). Aspects of lead/acid battery technology 4: plate formation. Journal of Power Sources, 41(1-2), 195-219. http://dx.doi.org/10.1016/0378-7753(93)80038-Q.
Rantik, M. (1999). Life cycle assessment of five batteries for electric vehicles under different charging regimes (KFB-Meddelande, 28). Goteborg: KFB.
Report Buyer Ltd. (2015). Global and China lead-acid battery industry report, 2015-2018. London. Retrieved in 2016, August 15, from http://www.prnewswire.com/news-releases/global-and-china-lead-acid-battery-industry-report-2015-2018-300200529.html