
Essays on Absorptive Capacity, ICT, Spatial Externalities...
167
Essays on Absorptive Capacity, ICT, Spatial Externalities, and Regional Growth Juan Jung ADVERTIMENT. La consulta d’aquesta tesi queda condicionada a l’acceptació de les següents condicions d'ús: La difusió d’aquesta tesi per mitjà del servei TDX (www.tdx.cat) i a través del Dipòsit Digital de la UB (diposit.ub.edu) ha estat autoritzada pels titulars dels drets de propietat intel·lectual únicament per a usos privats emmarcats en activitats d’investigació i docència. No s’autoritza la seva reproducció amb finalitats de lucre ni la seva difusió i posada a disposició des d’un lloc aliè al servei TDX ni al Dipòsit Digital de la UB. No s’autoritza la presentació del seu contingut en una finestra o marc aliè a TDX o al Dipòsit Digital de la UB (framing). Aquesta reserva de drets afecta tant al resum de presentació de la tesi com als seus continguts. En la utilització o cita de parts de la tesi és obligat indicar el nom de la persona autora. ADVERTENCIA. La consulta de esta tesis queda condicionada a la aceptación de las siguientes condiciones de uso: La difusión de esta tesis por medio del servicio TDR (www.tdx.cat) y a través del Repositorio Digital de la UB (diposit.ub.edu) ha sido autorizada por los titulares de los derechos de propiedad intelectual únicamente para usos privados enmarcados en actividades de investigación y docencia. No se autoriza su reproducción con finalidades de lucro ni su difusión y puesta a disposición desde un sitio ajeno al servicio TDR o al Repositorio Digital de la UB. No se autoriza la presentación de su contenido en una ventana o marco ajeno a TDR o al Repositorio Digital de la UB (framing). Esta reserva de derechos afecta tanto al resumen de presentación de la tesis como a sus contenidos. En la utilización o cita de partes de la tesis es obligado indicar el nombre de la persona autora. WARNING. On having consulted this thesis you’re accepting the following use conditions: Spreading this thesis by the TDX (www.tdx.cat) service and by the UB Digital Repository (diposit.ub.edu) has been authorized by the titular of the intellectual property rights only for private uses placed in investigation and teaching activities. Reproduction with lucrative aims is not authorized nor its spreading and availability from a site foreign to the TDX service or to the UB Digital Repository. Introducing its content in a window or frame foreign to the TDX service or to the UB Digital Repository is not authorized (framing). Those rights affect to the presentation summary of the thesis as well as to its contents. In the using or citation of parts of the thesis it’s obliged to indicate the name of the author.
Transcript of Essays on Absorptive Capacity, ICT, Spatial Externalities...
Essays on Absorptive Capacity, ICT, Spatial Externalities, and Regional Growth
Juan Jung
ADVERTIMENT. La consulta d’aquesta tesi queda condicionada a l’acceptació de les següents condicions d'ús: La difusió d’aquesta tesi per mitjà del servei TDX (www.tdx.cat) i a través del Dipòsit Digital de la UB (diposit.ub.edu) ha estat autoritzada pels titulars dels drets de propietat intel·lectual únicament per a usos privats emmarcats en activitats d’investigació i docència. No s’autoritza la seva reproducció amb finalitats de lucre ni la seva difusió i posada a disposició des d’un lloc aliè al servei TDX ni al Dipòsit Digital de la UB. No s’autoritza la presentació del seu contingut en una finestra o marc aliè a TDX o al Dipòsit Digital de la UB (framing). Aquesta reserva de drets afecta tant al resum de presentació de la tesi com als seus continguts. En la utilització o cita de parts de la tesi és obligat indicar el nom de la persona autora. ADVERTENCIA. La consulta de esta tesis queda condicionada a la aceptación de las siguientes condiciones de uso: La difusión de esta tesis por medio del servicio TDR (www.tdx.cat) y a través del Repositorio Digital de la UB (diposit.ub.edu) ha sido autorizada por los titulares de los derechos de propiedad intelectual únicamente para usos privados enmarcados en actividades de investigación y docencia. No se autoriza su reproducción con finalidades de lucro ni su difusión y puesta a disposición desde un sitio ajeno al servicio TDR o al Repositorio Digital de la UB. No se autoriza la presentación de su contenido en una ventana o marco ajeno a TDR o al Repositorio Digital de la UB (framing). Esta reserva de derechos afecta tanto al resumen de presentación de la tesis como a sus contenidos. En la utilización o cita de partes de la tesis es obligado indicar el nombre de la persona autora. WARNING. On having consulted this thesis you’re accepting the following use conditions: Spreading this thesis by the TDX (www.tdx.cat) service and by the UB Digital Repository (diposit.ub.edu) has been authorized by the titular of the intellectual property rights only for private uses placed in investigation and teaching activities. Reproduction with lucrative aims is not authorized nor its spreading and availability from a site foreign to the TDX service or to the UB Digital Repository. Introducing its content in a window or frame foreign to the TDX service or to the UB Digital Repository is not authorized (framing). Those rights affect to the presentation summary of the thesis as well as to its contents. In the using or citation of parts of the thesis it’s obliged to indicate the name of the author.

PhD in Economics
Juan
Ju
ng
PhD
in E
cono
mic
s
Juan Jung
Essays on Absorptive Capacity, ICT, Spatial Externalities, and Regional Growth
2017
Thesis title:
PhD student:
Juan Jung
Advisor:
Enrique López-Bazo
Date:May 2017
PhD in Economics
Essays on Absorptive Capacity, ICT, Spatial Externalities, and Regional Growth

Para Gaby, Fran y Emi
iii

iv

Acknowledgments
This thesis is dedicated to my wife Gaby, and my two beautiful daughters, Francisca and Emilia. I am extremely grateful to Gaby, who followed me unconditionally in this journey, since we left our comfortable life in Uruguay in 2010 to pursue the uncertain adventure of studying abroad, in a process which was not exempt of difficulties. This thesis was a family teamwork, as it would not have been possible without their patience, sacrifice, and permanent support.
I would like to offer a deep gratitude to Enrique LópezBazo for all his help and support as my thesis supervisor. I am proud to have had the opportunity of working with him. His dedication and flexibility have been crucial for this project to come to a satisfactory end. I am grateful to have been part of the Regional Quantitative Analysis Group, and the UB School of Economics family. I also want to remember my fellow Master colleagues from whom I learned and with whom I share many good memories from my days in Barcelona. Furthermore, I would like to thank Elisabet Viladecans, for always being supportive, and Jordi Roca for his continuous help in all administrative tasks.
I want to thank my parents Andrés and Marty, for all their support and help since I started to look for opportunities to study abroad, and more importantly, for always believing in me. My father, with whom I share this profession, has always been available to help me exchanging comments and sharing views during the process of elaboration of this thesis.
Likewise, I wish to thank Pablo Bello, my boss and friend, who allowed me to combine my working activity with my research duties. Without his flexibility and support, it would have been very difficult to finish this thesis.
Finally, I recognize that this process would not have been possible without financial assistance from the Erasmus Mundus program of the European Commission, which funded my Master degree, and the Cátedra Telefónica de Política y Regulación de las Telecomunicaciones e Internet América Latina – Europa, which granted me a Junior Fellowship at the Institut Barcelona d’Estudis Internacionals. Those two grants have been crucial for the development of the chapters 2 and 3 of this dissertation. I would also
v

like to thank Matteo Grazzi, who generously invited me to participate in the book Firm Innovation and Productivity in Latin America and the Caribbean , research activity that was key for the later development of the chapter 4 in this thesis.
vi
Abstract This dissertation consists of three essays with a clear empirical orientation. The first essay provides evidence concerning the relationship between regional productivity, capital deepening, technological spillovers and local absorptive capacity. The second essay analyzes regional inequalities in the impact of broadband on productivity, giving insights on which local attributes contribute to making the most of those efficiency gains. Finally, the third essay performs a firmlevel study of the linkages between internet adoption and use with productivity, considering also heterogeneities as the empirical analysis is performed at different points of the productivity distribution. The three essays conform the chapters of this thesis, entitled respectively: “Factor Accumulation, Externalities and Absorptive Capacity in Regional Growth: Evidence from Europe”, “On the regional impact of broadband on productivity: the case of Brazil”, and “Internet and enterprise productivity: evidence from Latin America”.
Factor Accumulation, Externalities and Absorptive Capacity in Regional Growth: Evidence from Europe (coauthored with Enrique LópezBazo).
This chapter proposes a model which incorporates capital accumulation and spatial spillovers across economies, while allowing for regional differences in absorptive capacity. This model is estimated using a sample of EU regions, over a period including the enlargement of the singlemarket area in the mid2000´s. Results confirm the relevance of local absorptive capacity, that is directly linked with the process of making the most of externalities. Capital deepening reduced the role of capital in explaining the regional productivity gap, but was not enough to help lagging regions to equal the return to human capital investments reached by most advanced regions.
vii
On the regional impact of broadband on productivity: the case of Brazil (coauthored with Enrique LópezBazo).
This chapter analyses the incidence of broadband on regional productivity in Brazil, intending to find out if the economic impact is uniform across all territories of the country. The possibility of performing a regional approach, instead of the usual countrylevel analysis, means an opportunity to disentangle the economic impact of broadband at territories which share a common institutional and regulatory framework as are the regions inside a country. Results suggest that the impact of broadband on productivity is positive although not uniform across regions. On the one hand, it seems to depend on connection quality and network effects. Faster download speed and criticalmass accounting for network externalities in the region enhance the economic impact of broadband. On the other hand, higher productivity gains are estimated for the less developed regions. The fact that the less productive regions in Brazil seem to be benefiting more from broadband may suggest that it can constitute a factor favoring regional convergence in the country.
Internet and enterprise productivity: evidence from Latin America (coauthored with Enrique LópezBazo and Matteo Grazzi).
This chapter tests three hypotheses regarding the link between internet and firm productivity: i) internet adoption and use constitute a source of productivity growth for firms in Latin America, ii) the intensity of its use also matters, and iii) the link between the new technologies and productivity levels is not uniform over the whole productivity distribution. The evidence in this chapter fills the gap of scarce and fragmented literature focused on Latin America, and is aligned with previous research for more developed regions which has generally recognized that Information and Communication Technologies have radically changed how modern business are conducted, benefitting firm performances through several channels, such as increasing the efficiency of internal processes, expanding market reach or increasing innovation. The findings suggest that low and medium
viii

productive firms benefit more from an expansion in internet adoption and use, in comparison with the most productive ones. If this evidence is supposed to reflect longterm effects, then public policies oriented to massify internet adoption and promote internet use intensively will surely contribute to reduce inequalities of enterprise’s productivity levels, promoting a level playing field among Latin American firms, something especially relevant for the most unequal region of the world.
ix

x
Table of Contents Chapter 1. Introduction……………………………………………….…..1 Chapter 2. Factor Accumulation, Externalities and Absorptive Capacity in Regional Growth: Evidence from Europe . ……...…..…..…11
2.1 Introduction . . … .……………………………………..…..…...11 2.2 A model with externalities and absorptive capacity . ………..15 2.3 Data and descriptive analysis . ……………………………....22 2.4 Results . ………………………………………………….......26 2.5 Conclusions . ………………………………………...………39 Appendix ………………………………………………………......42
Chapter 3. On the regional impact of broadband on productivity: the case of Brazil………………………………………………………...…....49
3.1 Introduction . ………………………………………….…......49 3.2 Literature review……………………………………...…….51 3.3 Theoretical framework and empirical specification ………..54 3.4 Dataset and variables ………………………………….……59 3.5 Descriptive analysis . …………………………………….…..62 3.6 Results…………….……………………………………...…67 3.7 Conclusions . ………………………………………………...75 Appendix . ... . …………………………………………………….......78
Chapter 4. Internet and enterprise productivity: evidence from Latin America…………………………………………………………………...81
4.1 Introduction . …………………………………………….......81 4.2 Literature Review and Hypothesis . ………………………....85 4.3 Dataset and variables . ……………………………………….90 4.4 Descriptive Analysis . ………………………………………..99 4.5 Model specification . …..…………………………………...105 4.6 Results … ………………………………………………… .. 108 4.7 Final remarks . ……………………………………………...118 Appendix … ………………………………………………………. . 121
Chapter 5. Conclusions and Policy Implications . ………………...…...133 5.1 Main results and contributions . …………………………....133 5.2 Policy recommendations…………………………………..134 5.3 Limitations and future research………………………....... 136
Bibliography . …………………………………………………………….139
xi
List of Tables Table 2.1. Variables description . .…………………...………………...........23 Table 2.2. Spatial autocorrelation statistics .. ……………………………….26 Table 2.3. Maximum likelihood estimation results.……….………...…….28 Table 2.4. Average productivity elasticities in groups of EU regions …….34 Table 3.1. Variables used in the empirical analysis . ……………………….60 Table 3.2. Descriptive statistics . …………………………………………...63 Table 3.3. Estimation of the baseline model . ………………………….…...68 Table 3.4. Estimation allowing for regionally heterogenous effects . …...…72 Table 3.5. Region clustering according to productivity . …………………...73 Table A3.1. First Stage estimates………………………………………….78 Table A3.2. Estimation of the Broadband effect in each region . …………..79 Table A3.3. Additional variables used in the empirical analysis . ……….....80 Table 4.1. Internet related variables . …...…………………...……………...92 Table 4.2. Internet Intensity variables.…………………………………….93 Table 4.3. Variables used for TFP estimation ....…………………...……...95 Table 4.4. Control variables . ……………………………………......……...97 Table 4.5. Descriptive statistics of internet indicators …... .......................100 Table 4.6. Correlation of internetrelated variables . . …. …..........................100 Table 4.7. Differences in mean of log(TFP) depending on internet adoption and use .. …………………………………………………………………...101 Table 4.8. Differences in distribution of log(TFP) depending on internet adoption and use………………………………………………………….104 Table 4.9. OLS estimations at the mean .. ………………………………....110 Table A4.1. Production function estimates . …………………...…….…....121 Table A4.2. Correlation of TFP estimators……………………………....122 Table A4.3. Sectoral classification Intermediatelevel SNA/ISIC aggregation……………………………………………………...………..123 Table A4.4. OLS estimations with lagged internet variables……...…..…124 Table A4.5. Instruments used……………………………………….....…126 Table A4.6. Instrumental Variables estimates (Group 1 of instruments)...128 Table A4.7. Instrumental Variables estimates (Group 2 of instruments)...129 Table A4.8. Instrumental Variables estimates (Group 3 of instruments)...130 Table A4.9. UQR estimates ………………………………………...……132
xii
List of Figures Figure 1.1. TFP evolution for selected countries (base 1990=1) . ...................1 Figure 1.2. TFP annual growth rate for selected regions (19902016) . ..........2 Figure 2.1. Kernel density of GVA per worker and physical capital per worker.……………………………………………………………………..24 Figure 2.2. Kernel density of human capital. … ……………………………24 Figure 2.3. Kernel densities of local and overall elasticities of physical capital . ………………………………………………………………….......31 Figure 2.4. Kernel density of human capital elasticity .. …………………....32 Figure 2.5. Capital contribution in 1999 and 2008 – averages by decile .. …36 Figure 2.6. Capital contribution 1999 and 2008 – averages by groups of regions……………………………………………………………………..38 Figure A2.1. Maps of estimated productivityphysical capital local elasticities . …………………………………………………………………46 Figure A2.2. Maps of estimated productivityphysical capital overall elasticities………………………………………………………………….46 Figure A2.3. Maps of estimated productivityhuman capital elasticities . ....47 Figure 3.1. Gross value added per worker in Brazilian states . ………...…..64 Figure 3.2. Broadband across Brazilian states . ………………………….....65 Figure 3.3. Productivity and broadband in the Brazilian states ………...…66 Figure A3.1. Average broadband download speed across Brazilian states..80 Figure 4.1. log(TFP) kernel density by internet adoption and use … ……..103 Figure 4.2. log(TFP) kernel density by Internet Intensity…………..…....104 Figure 4.3. UQR estimated coefficients of internet variables . ……………116
xiii

xiv
Chapter 1. Introduction “Productivity isn’t everything, but in the long run it is almost everything. A country’s ability to improve its standard of living over time depends almost entirely on its ability to raise its output per worker.”
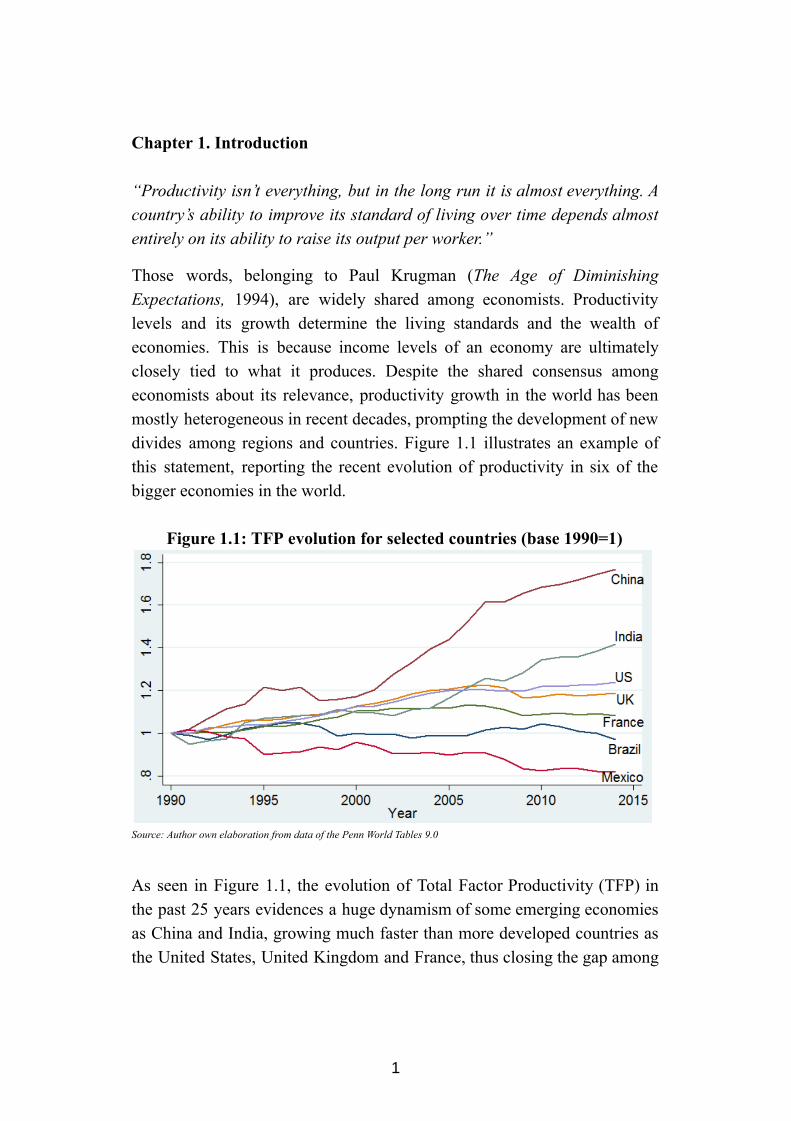
Those words, belonging to Paul Krugman ( The Age of Diminishing Expectations, 1994), are widely shared among economists. Productivity levels and its growth determine the living standards and the wealth of economies. This is because income levels of an economy are ultimately closely tied to what it produces. Despite the shared consensus among economists about its relevance, productivity growth in the world has been mostly heterogeneous in recent decades, prompting the development of new divides among regions and countries. Figure 1.1 illustrates an example of this statement, reporting the recent evolution of productivity in six of the bigger economies in the world.
Figure 1.1: TFP evolution for selected countries (base 1990=1)
Source: Author own elaboration from data of the Penn World Tables 9.0
As seen in Figure 1.1, the evolution of Total Factor Productivity (TFP) in the past 25 years evidences a huge dynamism of some emerging economies as China and India, growing much faster than more developed countries as the United States, United Kingdom and France, thus closing the gap among
1
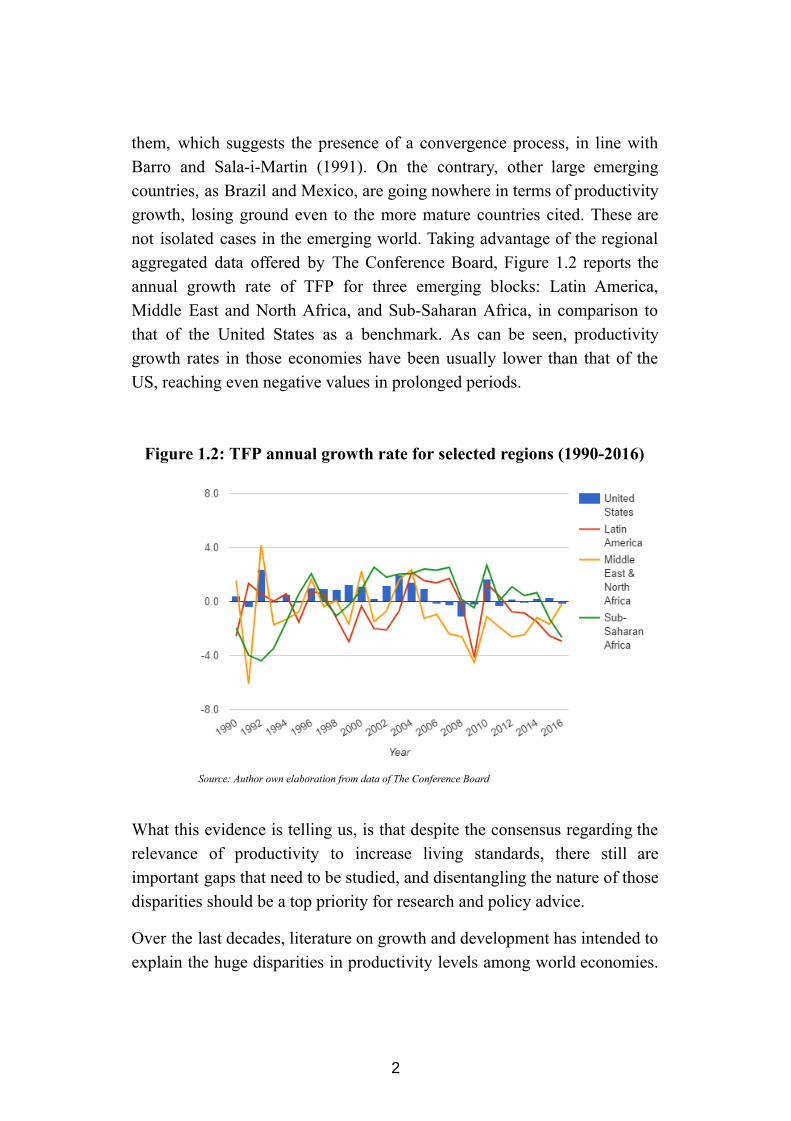
them, which suggests the presence of a convergence process, in line with Barro and SalaiMartin (1991). On the contrary, other large emerging countries, as Brazil and Mexico, are going nowhere in terms of productivity growth, losing ground even to the more mature countries cited. These are not isolated cases in the emerging world. Taking advantage of the regional aggregated data offered by The Conference Board, Figure 1.2 reports the annual growth rate of TFP for three emerging blocks: Latin America, Middle East and North Africa, and SubSaharan Africa, in comparison to that of the United States as a benchmark. As can be seen, productivity growth rates in those economies have been usually lower than that of the US, reaching even negative values in prolonged periods. Figure 1.2: TFP annual growth rate for selected regions (19902016)
Source: Author own elaboration from data of The Conference Board
What this evidence is telling us, is that despite the consensus regarding the relevance of productivity to increase living standards, there still are important gaps that need to be studied, and disentangling the nature of those disparities should be a top priority for research and policy advice.
Over the last decades, literature on growth and development has intended to explain the huge disparities in productivity levels among world economies.
2

For lagging economies, it is particularly important to understand its shortcomings in order to prompt or boost the convergence process to the standards of the richest economies. While the sources of productivity disparities may be extremely varied, this dissertation will focus specifically in addressing the topics described below.
Original neoclassical theorists tended to assume that the level and growth rate of productivity was roughly the same across different economies; hence disparities were mainly explained by differences in saving rates and capital stocks (e.g. Solow, 1956). Years later, some authors found empirical evidence that disparities were mainly accounted by factor accumulation, as Mankiw et al (1992) and Young (1994, 1995). In contrast, other empirical findings suggested that cross country differentials in physical capital accounted for a small part of disparities in income per capita (e.g. Denison, 1962, 1967; King and Levine, 1994). These findings enhanced further the discussion and added elements to the debate. As stated by Caselli (2005), if factors were found to account for most of the disparities, then development economics should focus on explaining low rates of factor accumulation. On the contrary, if efficiency differences play a larger role in explaining disparities, then research should have to focus on decoding why some economies are able to extract more from factor endowments.
As for efficiency improvements, innovation has been identified as one of its principal sources. Innovation activities may contribute to technological change at enterprises, thus improving productivity, which may be extrapolated to economic growth at a macro level. As stated by Schumpeter (1934), innovation activity and technological advances at a micro level are significantly important, as they contribute to increase production and employment, and may play a significant role as a catalyst of important technological changes. At a macro level, for instance, literature on endogenous economic growth has analyzed the role of technological innovation activity as a potential source of economic growth (e.g. Grossman and Helpman, 1991; Aghion and Howitt, 1991; Romer, 1990).
Related literature also identifies the process of learningbydoing (Arrow, 1962) as a potential source of productivity gains. Learningbydoing refers to the capability of workers to improve their productivity by repeating the
3
same actions. The increased productivity is achieved through practice, selfperfection and minor innovations. At the aggregate level, economies with higher physical capital per worker may be benefited by this type of externality, which makes learningbydoing a potential source of disparities.
Technological advances as those described above might also spillover across different economic actors. In particular, diffusion of knowledge spillovers across economies may be linked with geography. For instance Keller (2002) found that technological spillovers were local, not global, as the benefits from foreign externalities decreased with distance. The idea of spatially bounded spillovers, in addition to the stylized fact of a spatial distribution of wealth and poverty in the world plus the developments in the New Economic Geography literature (see for instance Krugman, 1991), made the spatial dependence patterns becoming relevant to consider in productivity analysis. Traderelated flow of ideas across regions and countries is believed to be a particular channel of geography incidence in spillovers (Coe and Helpman, 1995; Koch, 2008; RodriguezPose and Crescenzi, 2008). In recent years, the empirical analysis performed by LópezBazo et al (2004), Fingleton and LópezBazo (2006), and Koch (2008), among other authors, showed the relevance of incorporating spatial externalities to the analysis of productivity disparities.
The extant literature has identified Information and Communications Technologies (ICTs) as an important potential source of productivity growth, for various reasons. In first place, because investment in ICTs contributes to capital deepening and therefore helps raising productivity. Second, rapid technological progress in the production of ICT goods and services may contribute to growth in the efficiency of capital and labour, or TFP, in the ICTproducing sector. And third, greater use of ICT throughout the whole economy may help firms increase their overall efficiency, thus raising TFP. Moreover, greater use of ICT may contribute to network effects, such as lower transaction costs and more rapid innovation, which should also improve productivity levels (see for instance Pilat, 2004). Many other authors suggest that ICT generates externalities in the form of spillovers through efficiency gains in the production process, and through the accumulation of intangible organizational capital accompanying
4
investment in ICT capital (Stiroh, 2002). Such positive externalities, or spillover effects, can accelerate factor productivity growth in ICTusing industries. In the past, some aggregate empirical evidence suggested limited productivity impacts of ICT in many countries, despite substantial investments (see Solow’s productivity paradox; Solow, 1987). In more recent years, the evidence suggests that the use of ICTs does have positive impacts on firm performance and productivity, although there are gaps in the literature that remain largely unstudied, as the role of the quality of the networks and the heterogeneous effects across different economic agents.
Finally, some of the above mentioned externalities may not always be incorporated automatically by those concerned, because there can be differences in the absorptive capacities of the different economic units. This may be reflected through a wide range of social and institutional conditions, which may include educational achievements, productive employment of human resources, among many others.
The above reported literature still evidences some unsolved issues which require to be addressed through further empirical research. For instance, while literature has usually proven that technological spillovers take place through spatial interactions, it is still not clear if these processes take place regardless of local characteristics, or if on the contrary, some economic agents are able to absorb those externalities in a higher degree than others. On the other hand, it is not clear whether the sources of efficiency gains, either those deriving by learningbydoing or by ICTs adoption and use, are uniform across different economic agents, and if they’re not, which are the conditions required to maximize its potential. Another question mark is under which conditions those spillovers can become instruments to promote convergence, and thus reduce disparities between economic agents –at the micro level– and across economies –at the macro level. These are key questions for policy purposes.
All in all, the objective of this thesis is to make a theoretical and empirical contribution, decoding the nature of productivity disparities across different economic actors, focusing on the sources described above, and providing reflections for policy advice. In particular, we aim to contribute to the extant literature by providing answers to the questions raised in the previous
5
paragraph. In that sense, one of the main hypothesis of this dissertation is that efficiencyoriginated productivity gains vary largely among different economic units, as the degree of the economic impact will surely depend significantly on some characteristics of the agents under analysis (firms or regional economies). Given our manifest purpose of making contributions which can enrich advice in publicpolicies, this thesis will focus particularly in mostdisadvantaged economic units, intending to find out which circumstances can help them to converge to the most productive ones.
We will work with samples which exhibit important disparities and are especially suitable to test our main hypotheses. While countrylevel analysis can be useful to get some insights of the concerned topics, the possibility of working with more disaggregated data is much more propitious for our purposes, as are much closer to where the concerned dynamics effectively take place. In the first place, we will exploit the information from a sample of European regions, provided by Cambridge Econometrics, which constitutes a suitable framework to study the role of spatial externalities. European regions exhibit large internal disparities, especially since the inclusion of several countries from Central and Eastern Europe in the mid2000´s. Given the relevance of the spatial patterns for the diffusion of externalities, this sample will provide us an opportunity to study the role played by the local context in the process of making the most of that spillovers. In the second place, we will also conduct an empirical analysis for the set of Brazilian regions, which means an opportunity to disentangle the productivity disparities and the role played by ICTs at territories which despite evidencing important disparities, still share a common institutional and regulatory framework, as are the regions inside a country. The data, mainly provided by Instituto Brasileiro de Geografia e Estatística and Telebrasil, consist in a panel of 27 states for 20072011. Finally, we will also conduct firmlevel estimates, as the enterprises are the main economic agent where production effectively takes place, therefore being the most important part for any productivity analysis. In particular, firmlevel data may help in understanding the ICT dynamics for productivity improvements, as it can point to factors that cannot be observed at more aggregated levels. For that reason, we will also perform empirical analysis with the World Bank Enterprise Surveys database, for a
6
sample of Latin American firms, a region which constitutes an appealing case of analysis due to its inequality, its lagging position in adoption of advanced technologies and slow productivity growth, which will provide us the possibility of finding out the distributional effects of our key variables of interest.
This dissertation provides novel evidence on the relevance of absorptive capacities for the region’s ability to obtain productivity gains from efficiency spillovers, particularly those arising from learningbydoing externalities, as well as of spatial interactions. Also, the evidence in the thesis is consistent with ICT having a positive but heterogeneous impact on productivity. In that sense, both regionlevel and firmlevel empirical analyses provided evidence that the less productive actors are those which exhibit the bigger potential gains from internet adoption and use. Therefore, public policies oriented to promote ICT massification can help to reduce disparities, both across firms and regions. The quality of broadband networks and the degree in the intensity of ICT use are also relevant in order to maximize productivity gains.
The elaboration of this thesis has been a rich process of exchange and discussion. Previous versions of the different chapters were subsequently published as working papers or book chapters, and presented in various academic seminars, in order to get feedback to enrich the analysis. In particular, this thesis is based on the following publications:
Jung, J. and LópezBazo, E. (2017) Factor Accumulation, Externalities and Absorptive Capacity in Regional Growth: Evidence from Europe, Journal of Regional Science , 57, 266–89.
Previous versions:
Jung, J. and LópezBazo, E. (2014) Factor Accumulation, Externalities and Absorptive Capacity in Regional Growth: Evidence from Europe, Working Paper 2014/16, Research Institute of Applied Economics (University of Barcelona).
Presented in the following instances: XVIII Encuentro de Economía Aplicada,
Alicante, Spain, June 2015
7
Jung, J. (2012) Externalities and Absorptive Capacity in a context of Spatial Dependence: The Case of European Regions, Working paper No.22/12 Department of Economics, Faculty of Social Sciences (University of the Republic, Uruguay).
Presented in the following instances: Montevideo Economics Meeting,
December 2012 Department of Economics seminar
(University of the Republic, Uruguay), November 2012
AQR Lunch Seminar (University of Barcelona), June 2012
Jung, J. and LópezBazo, E. (2017) On the regional impact of broadband on productivity: the case of Brazil, Working Paper 2017/08, Research Institute of Applied Economics (University of Barcelona).
This article is a later development of an initial study published as book chapter:
Jung, J. (2015) Digital Inclusion and Economic Development: A Regional Analysis from Brazil, in Dutta, S., Geiger, T. and Lanvin, B. (eds), The Global Information Technology Report 2015 , World Economic Forum, 1019.
Previous versions:
Jung, J. (2015) Regional Inequalities in the Impact of Broadband on Productivity. Evidence from Brazil, IBEI Working Papers 2015/47.
Presented in the following instances: IBEI Research Seminar Cátedra
Telefónica, March 2014.
Jung, J., LópezBazo, E. and Grazzi, M. (2017) Internet and enterprise productivity: evidence from Latin America, Working Paper 2017/09, Research Institute of Applied Economics (University of Barcelona).
This article is a later development of an initial study published
8
as book chapter:
Grazzi, M. and Jung, J. (2016) Information and Communication Technologies, Innovation, and Productivity: evidence from Firms in Latin America and the Caribbean, in Grazzi, M. and Pietrobelli, C. (eds), Firm Innovation and Productivity in Latin America and the Caribbean , Palgrave Macmillan US , 10335.
Presented in the following instances: CPR Latam conference, June 2016 AQR Lunch Seminar (University of
Barcelona), February 2015 InterAmerican Development Bank
workshop “Determinants of Firm Performance in LAC: What Does the Micro Evidence Tell Us?”, June 2014
The thesis is divided into three main chapters, each one containing an introduction of the topic and a review of the literature to describe the current state of the art and to delineate the hypotheses. In all cases, a model is proposed in order to contrast empirically the hypotheses. Together with a description of the data to be used, each chapter includes an exploratory analysis of the variables of interest. The presentation and discussion of the main results is followed by some conclusions and policy implications. At the end of this dissertation, general conclusions are exposed.
9

10
Chapter 2. Factor Accumulation, Externalities and Absorptive Capacity in Regional Growth: Evidence from Europe 1
2.1 Introduction
Over the last decades, literature on growth and development has intended to explain the huge disparities in productivity levels among world economies. This field of study is important, because decoding the sources of disparities will surely provide a useful input which should guide the agenda for research and policy advice. As stated by Caselli (2005), if factors were found to account for most of disparities, then development economics should focus on explaining low rates of factor accumulation. In contrast, if efficiency differences were found to play a large role, the task would consist in explaining why some economies are able to extract more output than others from their inputs. Additionally, following the advances in the literature, adding the role of the local context and that of spillovers into the equation may produce a more global and realistic perspective, in which decoding the interactions among them will surely provide useful information. For instance, if local conditions produce differences in absorptive capacity, then similar policies may produce different results in diverse regions. As an example, in isolated regions with poor local conditions the investment in physical capital may not yield the expected return, because of inadequate local socialfilter and its geographical location, which may make them low exposed to spillovers. This must be taken into account when designing policies, as for example the European cohesion programs, which are oriented to regions which have in common the fact that are poorer in comparison with the core, but that may differ in terms of geographical location and local context.
1 Published as: Jung, J. and LópezBazo, E. (2017) Factor Accumulation, Externalities and Absorptive Capacity in Regional Growth: Evidence from Europe. Journal of Regional Science , 57, 266–89. The author gratefully thank the anonymous reviewers and, particularly, the coeditor Prof. Coulson for useful suggestions and encouragement. E. LópezBazo acknowledges financial support provided by the Spanish Ministry of Economics and Competitiveness, National Program of R&D, under grant ECO201459493R and Fundación BBVA “I Convocatoria de Ayudas a Proyectos de Investigación 2014 (área de socioeconomía)”.
11
Nelson and Phelps (1966) were among the first to assert the crucial role of absorptive capacity on growth, emphasizing the link between higher education and technological diffusion. Their approach assigned an indirect role for human capital (through its incidence in technology), rather than the more conventional consideration of human capital as an additional input of production. In the same line, Cohen and Levinthal (1990) argued that the ability to exploit external knowledge is largely a function of prior related knowledge which depends, among other factors, on the advanced technical training of workers; whereas Benhabib and Spiegel (1994) claimed that the ability of an economy to adopt and implement external technology depends on its human capital stock. Recent empirical evidence has provided support to the role of human capital as a key determinant of absorptive capacity. For example, results on the entrepreneurial activity in the US metropolitan areas in Qian et al (2013) led the authors to conclude that the chief contribution of human capital is on building entrepreneurial absorptive capacity rather than creating knowledgebased entrepreneurial opportunities. On the other hand, technological diffusion soon became linked with geography. For instance, Keller (2002) found that technological spillovers were local, not global, as the benefits from foreign externalities decreased with distance. The idea of spatially bounded spillovers, in addition to the stylized fact of a spatial distribution of wealth and poverty in the world, plus the development of the New Economic Geography literature (see for instance Krugman, 1991) made the spatial dependence patterns almost impossible to ignore in the analysis. In recent years, LópezBazo et al (2004), Fingleton and LópezBazo (2006), Ertur and Koch (2007), and Koch (2008, 2010) proposed growth models which explicitly accounted for spatial dependence and externalities. Basile et al (2012) even claim that other forms of proximity, such as technological, relational and social, reinforce the effects of geographical proximity.
Numerous studies have focused on regional growth disparities in Europe (see for instance SalaiMartin, 1996; Quah, 1996; LópezBazo et al, 1999; Magrini, 2004; Bosker, 2009; Koch, 2010). Some of them have also incorporated the spatial dimension to their analysis, which was found to play a crucial role (see, among others, Fingleton and LópezBazo, 2006; Basile, 2008). The relevance of the spatial patterns in the distribution of
12
wealth and poverty in Europe revealed in these studies makes that regional analyses of economic growth should take this characteristic into account. This is even more important since the enlargement of the European Union (EU) towards countries of the Centre and East of Europe (hereafter CEE countries), which has exacerbated the amount of regional disparities. Actually, the enlargement provided a challenge to the EU regional cohesion policy. With the inclusion of 10 countries in 2004 plus Bulgaria and 2
Romania in 2007, the EU became a 27country singlemarket area. As many of these countries had at that time income levels around 40 per cent of the EU average, the enlargement increased inequalities and produced the replacement of the former North/South polarization towards a new NorthWest/East pattern (Mora et al, 2004; Ertur and Koch, 2006; Marrocu et al, 2013). Existing evidence indicate that dispersion in Gross Domestic Product (GDP) per head had been reduced since latenineties to 2008, but despite that, inequalities persist, and have even increased within some CEE countries (European Commission, 2010; Monastiriotis, 2014). In that context, it seems worth to study the sources behind the evolution of regional inequalities in the entire EU in a period including years before and after the enlargement of the mid2000s.
The openness of CEE economies prompted the inflows of external capital through Foreign Direct Investment (FDI), as stated by Bijsterbosch and Kolasa (2010) and European Commission (2010). For that reason, capital deepening and technological catchup should not be analyzed in isolation, as capital accumulation through FDI may also act as vehicle for economic restructuring and technological diffusion (Bijsterbosch and Kolasa, 2010). Because of that, the reference model should consider not only capital accumulation as an engine of growth, but also additional sources, as for example a learningbydoing process (Arrow, 1962). Additionally, according to Klenow and RodriguezClare (2005), FDI flows have a relation with geographical distance and, therefore, spatial dependence should be also considered. The incidence of geography can take place through other channels. In this sense, traderelated flow of ideas across
2 The 2004 enlargement process included Cyprus, Czech Republic, Estonia, Hungary, Latvia, Lithuania, Malta, Poland, Slovakia and Slovenia.
13
countries is believed to be another channel of geography incidence in spillovers (Coe and Helpman, 1995; Koch, 2008; RodriguezPose and Crescenzi, 2008). The strength of these spillovers can be seen, for instance, as related to the intensity of trade between economies. In that sense, geography is again expected to play an important role in the process of technological diffusion. For all those reasons, spatial interactions should be considered as additional sources of spillovers. Finally, these externalities may not always be incorporated automatically by those concerned, as there can be regional differences in absorptive capacity. This may be reflected through a wide range of social and institutional conditions, constituting a socialfilter which may include educational achievements, productive employment of human resources, and demographic structure (RodriguezPose and Crescenzi, 2008).
In the light of the reduction of income disparities which took place in period 19992007 (European Commission, 2010), the analysis in this chapter focuses in decoding its sources (capital intensity and/or technological catchup), and in the role played by the local context (through absorptive capacity) in the process of making the most of externalities. In this regard, the strategy followed by this chapter is twofold. On the one hand, a theoretical model is proposed, consisting in an extension of the framework developed by Ertur and Koch (2007) and Koch (2008, 2010), but going a step further, as it allows for differences across regions in local absorptive capacity. In a second step, that model is fitted for a set of EU regions in the period 19992008. Finally, the estimate of the parameters of the model is used to perform a development accounting exercise, following Easterly and Levine (2001), intending to find how much of the gap between rich and poor EU regions can be attributed to differences in physical capital, and how much can be attributed to technology. In this regard, it should be mentioned that King and Levine (1994) concluded that capital accounted for around half of disparities in a sample of 102 countries, whereas results in Young (1994, 1995) suggested that the “miracle” of the eastern Asian countries in the second half of the twentieth century was mainly a case of factor accumulation. In his recent contribution, Koch (2008) showed that incorporating spatial externalities to the analysis made physical capital to increase dramatically its contribution, accounting in some cases for 90 per
14
cent of the development gap among a sample of 91 countries in 1995. He concluded that neglecting spatial interactions might potentially bias the role of physical capital in the development process. His model, however, did not account for differences in local absorptive capacity. It may also be the case that the contribution of factor accumulation and that of technology to disparities across regions differ from those across countries. In contrast, the hypothesis that guides the analysis in this chapter is that local absorptive capacity is crucial for explaining the sources of regional disparities in EU.
The rest of the chapter is structured as follows. Section 2.2 sketches the theoretical model which takes into account externalities across regions and assumes that they differ in their abilities to make the most of these spillovers. Section 2.3 introduces the data and descriptive analysis, while the estimation of the coefficients of the model and the results of the development decomposition are discussed in section 2.4. Finally section 2.5 concludes.
2.2 A model with externalities and absorptive capacity
We build our model on that proposed by Ertur and Koch (2007) and Koch (2008), in which for each regional economy i a CobbDouglas production function exhibits constant returns to scale in labour ( L ) and physical capital ( K ):
[1]K L Y i = Ai* iα
i1 α−
The aggregate level of technology in , , depends on some proportion of i Ai* exogenous technology, common to every region, (Ω * ), and also on learningbydoing physical capital externalities and on technological interdependence between economies:
[2]k Ai* = Ω*i (∅+λh )* i ∏
N
j≠iAj
(γw +δh w )* 1ij i 2ij
15
where is defined as physical capital per worker, since as pointed out byki* Ertur and Koch (2007), knowledge is supposed to be embodied in physical capital per worker and not in levels, in order to avoid scale effects. h i represents endowment of human capital per worker, which intends to measure regional differences in the abilities to adopt and implement technological externalities, whereas w 1ij and w 2ij denote the measures of the amount of interaction between regions i and j , that may be similar or different.
The production technology in this chapter does not consider thus human capital as a conventional input. Instead, human capital is incorporated as an argument of the aggregate level of technology. There have been some papers which were unable to find a significant impact of human capital as a standard input. On the other hand, Nelson and Phelps (1966) and Benhabib 3
and Spiegel (1994) found evidence of human capital incidence through technology, as it constitutes an important element to be able to incorporate technological advances generated abroad. In this spirit, our model incorporates human capital as a measure of local absorptive capacity. It is 4
understood that part of the learningbydoing externalities may have an impact on technology regardless of the level of human capital, because even if workers are not highly embodied with education, they may still learn something in the process (this effect is measured through the parameter ∅≥0). At the same time, this learning process will be accelerated the higher the skills of the workers (this is measured through λ≥0). In a similar way, absorptive capacity will play a key role in the technological interdependence across economies. As before, it is assumed that some benefit is obtained from interaction regardless of human capital (γ≥0), but the absorptive capacity will be enhanced with higher levels of skills (δ≥0).
3 Benhabib and Spiegel (1994) estimated several growth accounting regressions considering human capital as a conventional input, which was found to enter insignificantly, and almost always with a negative coefficient. 4 From a complementary perspective, Cohen and Levinthal (1990) and subsequent studies have provided arguments for the critical role of absorptive capacity at the firm level. This strand of the literature has also pointed to human capital as a key determinant of firm’s absorptive capacity (e.g. Qian et al, 2013). We thank an anonymous referee for suggesting this remark.
16

Therefore, in contrast with the specification for the aggregate level of technology in Ertur and Koch (2007) and in Koch (2008), we assume that the effect of externalities from capital accumulation in region i on its level of technology depends positively on the existing stock of human capital in that region. The same applies in the case of technical progress generated elsewhere. Its effect on the level of technology in region i is assumed to depend on its absorptive capacity that, in turn, is determined by the endowment of human capital. The model in the abovementioned papers imposes a similar rate of absorption in all regions regardless of the endowment of human capital. In such a case, λ=δ=0. Instead of imposing such a constraint, in this chapter we advocate the existence of differences across regions in the absorptive capacity linked to the availability of human capital in each region.
The interpretation of the parameters in [2] is the key of the model. If ∅=0 (γ=0), then learningbydoing (technological spatial interdependence) will not take place in the absence of skilled workers. At the same time, λ=0 (δ=0) will reflect a negligible role of human capital in enhancing learningbydoing (interregional technological spillovers). On the contrary, if λ>0 and/or δ>0, regions highly endowed with human capital will have higher capacity for technology adoption. Similarly, poor regions will face difficulties in catchingup with the rich areas unless they are endowed with a certain level of human capital. If learningbydoing externalities were verified, then a capital deepening process will indirectly produce a technology improvement in the economy, making a twosource growth process (for instance, convergence as a result of capital stock and technological catchup). Finally, if ∅=λ=γ=δ=0, the specification is the original model proposed by Solow (1956), whereas, as mentioned above, the one in Ertur and Koch (2007) and Koch (2008) results if λ=δ=0. In the former case, capital deepening does not have an impact on technological catchup, while in the latter it takes place but regardless of the availability of skilled labor in each region.
Technological spatial spillovers imply that regions must be analyzed as an interdependent system. In doing so, it is convenient to write down the model in matrix terms for a system with N regions, and to express the
17
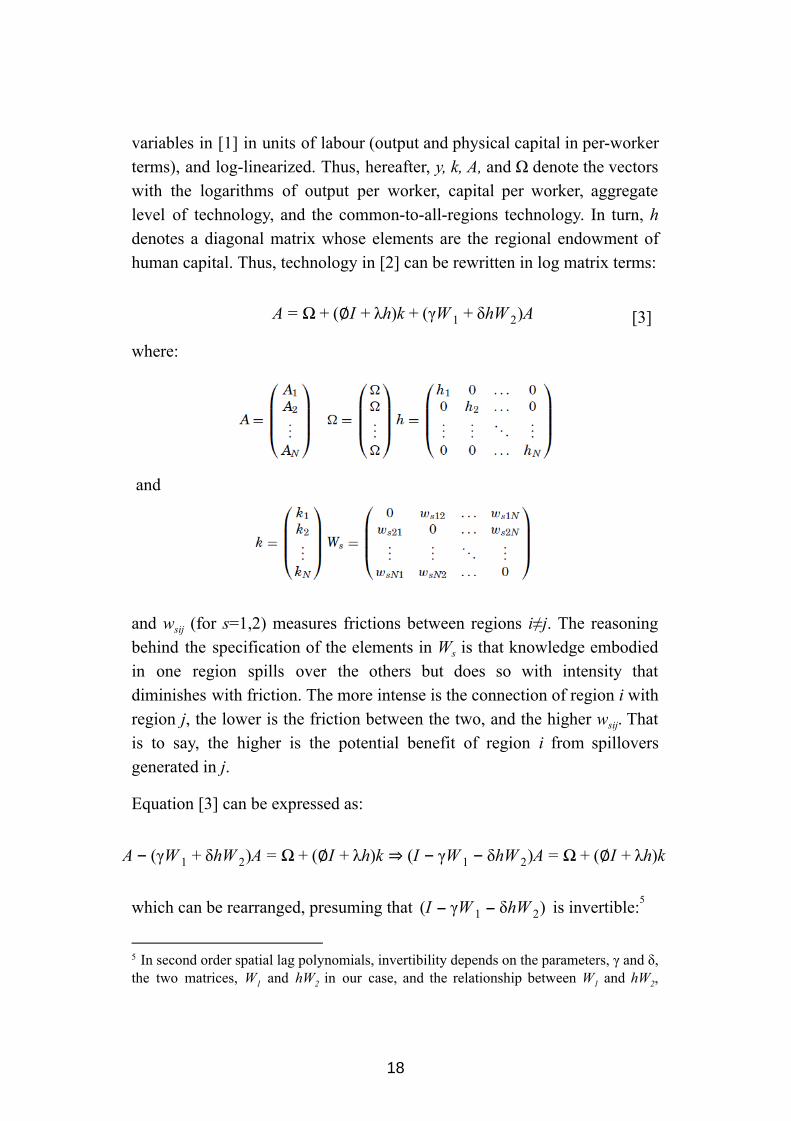
variables in [1] in units of labour (output and physical capital in perworker terms), and loglinearized. Thus, hereafter, y, k, A, and Ω denote the vectors with the logarithms of output per worker, capital per worker, aggregate level of technology, and the commontoallregions technology. In turn, h denotes a diagonal matrix whose elements are the regional endowment of human capital. Thus, technology in [2] can be rewritten in log matrix terms:
[3]∅I h)k γW hW )A A = Ω + ( + λ + ( 1 + δ 2
where:
and
and w sij (for s =1,2) measures frictions between regions i≠j . The reasoning behind the specification of the elements in W s is that knowledge embodied in one region spills over the others but does so with intensity that diminishes with friction. The more intense is the connection of region i with region j , the lower is the friction between the two, and the higher w sij . That is to say, the higher is the potential benefit of region i from spillovers generated in j .
Equation [3] can be expressed as:
γW hW )A ∅I h)k ⇒ (I W hW )A ∅I h)k A − ( 1 + δ 2 = Ω + ( + λ − γ 1 − δ 2 = Ω + ( + λ
which can be rearranged, presuming that is invertible:I W hW ) ( − γ 1 − δ 2 5
5 In second order spatial lag polynomials, invertibility depends on the parameters, γ and δ, the two matrices, W 1 and hW 2 in our case, and the relationship between W 1 and hW 2 ,
18
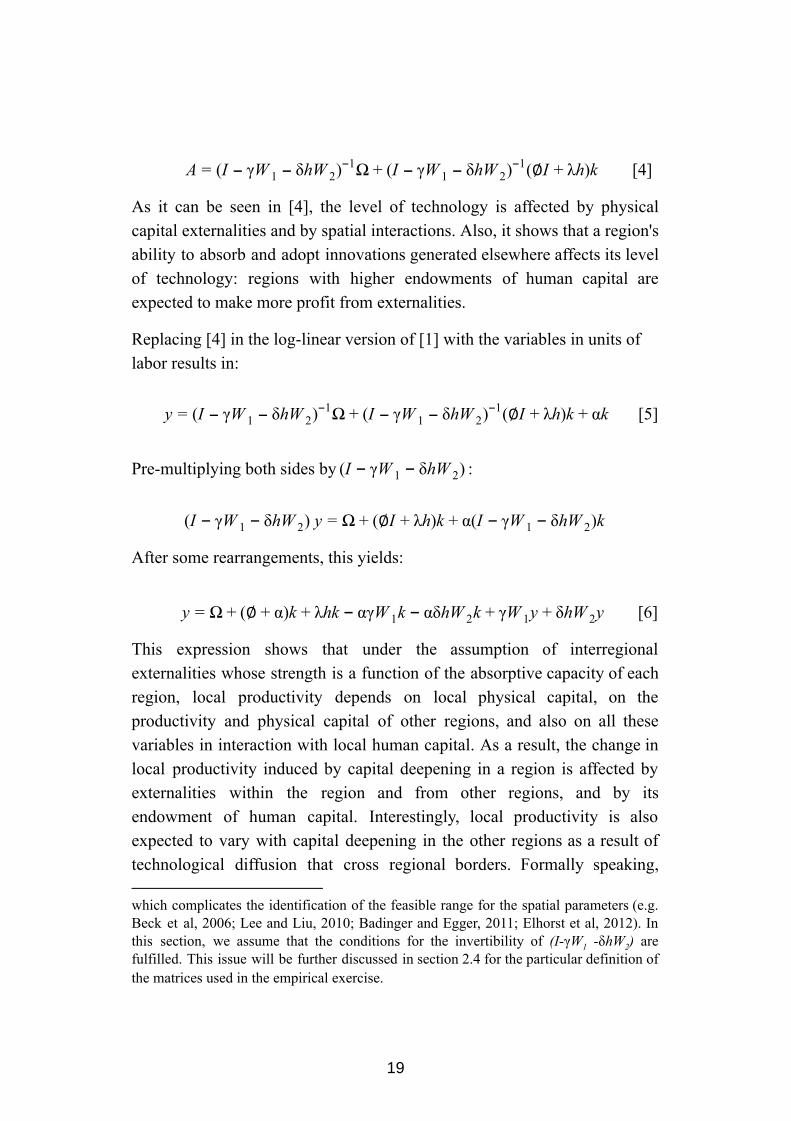
[4]Ω (∅I h)k A = (I W hW )− γ 1 − δ 21− + (I W hW )− γ 1 − δ 2
1− + λ
As it can be seen in [4], the level of technology is affected by physical capital externalities and by spatial interactions. Also, it shows that a region's ability to absorb and adopt innovations generated elsewhere affects its level of technology: regions with higher endowments of human capital are expected to make more profit from externalities.
Replacing [4] in the loglinear version of [1] with the variables in units of labor results in:
[5]Ω (∅I h)k k y = (I W hW )− γ 1 − δ 21− + (I W hW )− γ 1 − δ 2
1− + λ + α
Premultiplying both sides by :I W hW ) ( − γ 1 − δ 2
I W hW ) y ∅I h)k (I W hW )k ( − γ 1 − δ 2 = Ω + ( + λ + α − γ 1 − δ 2
After some rearrangements, this yields:
[6]∅ )k hk γW k δhW k W y hW y y = Ω + ( + α + λ − α 1 − α 2 + γ 1 + δ 2
This expression shows that under the assumption of interregional externalities whose strength is a function of the absorptive capacity of each region, local productivity depends on local physical capital, on the productivity and physical capital of other regions, and also on all these variables in interaction with local human capital. As a result, the change in local productivity induced by capital deepening in a region is affected by externalities within the region and from other regions, and by its endowment of human capital. Interestingly, local productivity is also expected to vary with capital deepening in the other regions as a result of technological diffusion that cross regional borders. Formally speaking,
which complicates the identification of the feasible range for the spatial parameters (e.g. Beck et al, 2006; Lee and Liu, 2010; Badinger and Egger, 2011; Elhorst et al, 2012). In this section, we assume that the conditions for the invertibility of (I γ W 1 δ hW 2 ) are fulfilled. This issue will be further discussed in section 2.4 for the particular definition of the matrices used in the empirical exercise.
19
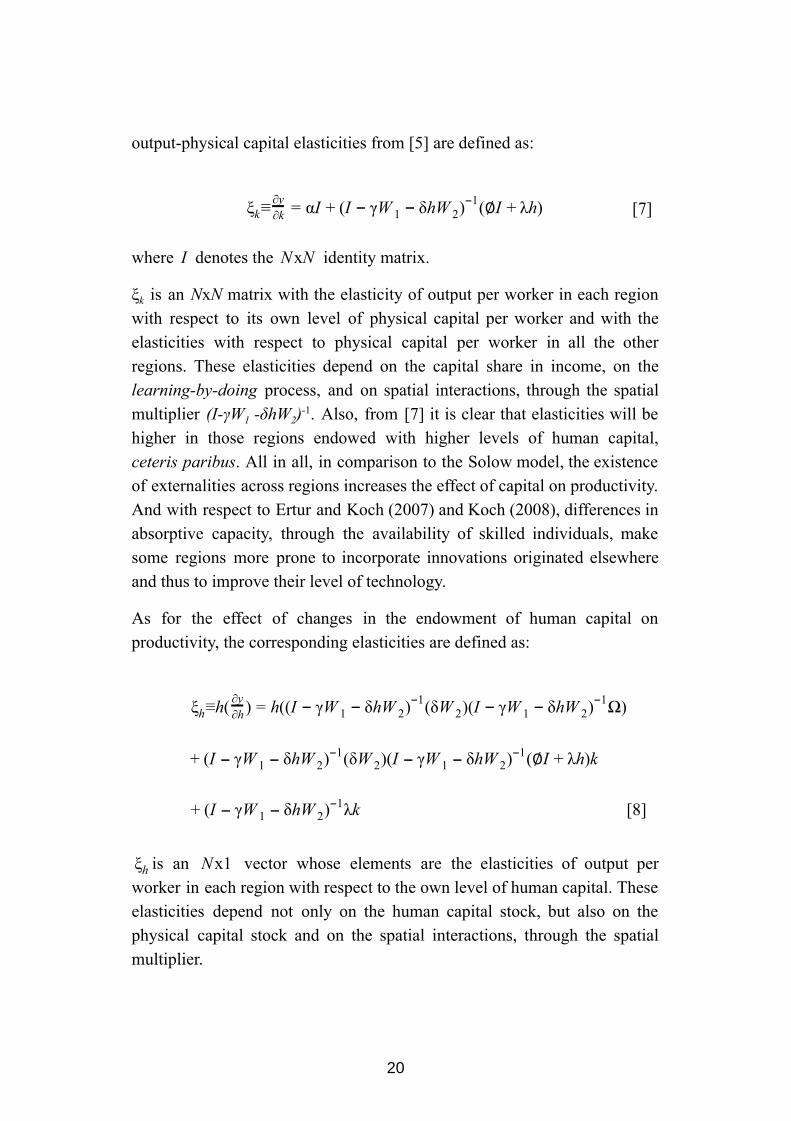
outputphysical capital elasticities from [5] are defined as:
[7]≡ I (∅I h) ξk ∂k∂y = α + (I W hW )− γ 1 − δ 2
1− + λ
where denotes the identity matrix.I хNN
ξ k is an N x N matrix with the elasticity of output per worker in each region with respect to its own level of physical capital per worker and with the elasticities with respect to physical capital per worker in all the other regions. These elasticities depend on the capital share in income, on the learningbydoing process, and on spatial interactions, through the spatial multiplier (IγW 1 δhW 2 ) 1 . Also, from [7] it is clear that elasticities will be higher in those regions endowed with higher levels of human capital, ceteris paribus . All in all, in comparison to the Solow model, the existence of externalities across regions increases the effect of capital on productivity. And with respect to Ertur and Koch (2007) and Koch (2008), differences in absorptive capacity, through the availability of skilled individuals, make some regions more prone to incorporate innovations originated elsewhere and thus to improve their level of technology.
As for the effect of changes in the endowment of human capital on productivity, the corresponding elasticities are defined as:
≡h( ) ((I W hW ) (δW )(I W hW ) Ω) ξh ∂h∂y = h − γ 1 − δ 2
1−2 − γ 1 − δ 2
1−
(δW )(I W hW ) (∅I h)k + (I W hW )− γ 1 − δ 21−
2 − γ 1 − δ 21− + λ
[8]λk + (I W hW )− γ 1 − δ 21−
is an vector whose elements are the elasticities of output perξh х1N worker in each region with respect to the own level of human capital. These elasticities depend not only on the human capital stock, but also on the physical capital stock and on the spatial interactions, through the spatial multiplier.
20
Finally, it needs to be mentioned that the inclusion of the mechanism of absorptive capacity modifies the decomposition of the gap in the level of output per worker suggested by Easterly and Levine (2001), and adapted to the case of the existence of spillovers across economies by Koch (2008). Defining κ as the log of the capitaloutput ratio, and y * , κ * , and h * as y , κ and h in relative terms with respect to a reference region, equation [5] can be expressed as:
(I W h W ) Ω (∅I h ))(κ ) y* = − γ 1 − δ *2
1− + (αI I W h W )+ ( − γ 1 − δ *2
1− + λ * * + y*
Defining a diagonal matrix whose elements are the output per worker in D each region in relative terms with respect to the reference region, and premultiplying both sides of the previous equation by the inverse of D results in:
(I W h W ) Ω D y1− * = D 1− − γ 1 − δ *2
1−
(∅I h ))κ + (αD (I W h W )1− + D 1− − γ 1 − δ *2
1−+ λ * *
(I W h W ) (∅I h ))y + α1 D+ ( 1− − γ 1 − δ *2
1− + λ * *
where 1 is a column vector with all elements equal to . After someα α arrangements, the contribution of capital to the gap in the level of development is obtained as:
1 (∅I h ))κ ϒk = α + (αD (I W h W )1− + D 1− − γ 1 − δ *2
1−+ λ * *
[9](I W h W ) (∅I h ))y (D+ 1− − γ 1 − δ *2
1− + λ * *
As in Koch (2008), the contribution of physical capital depends on three terms: the capital share in income, the capitaloutput ratio, and finally the spatial distribution of productivity. However, in the second and third terms in [9], the region’s ability to adopt technology enhances the influence of capital, as it strengths the externalities.
21
In order to easier comparisons, the percentage gap in output for each region i relative to a reference region r is calculated:
[10]00 х GAP i = 1 (Y ∕L)r(Y ∕L) (Y ∕L)i− r
Then, for a given region , the contribution of capital to accounting fori disparities with respect to the reference region is ϒ ki х GAP i .
2.3 Data and descriptive analysis
Our empirical exercise aims at providing evidence on the effect of spatial spillovers and differences in absorptive capacity in the level of productivity of the EU regions. To estimate the coefficients in equation [6] we used data on Gross Value Added (GVA) per worker and on the physical capital stock per worker for all sectors (both measured in constant 2000 Euros), from the Cambridge Econometrics database. As for the absorptive capacity, it was proxied by a measure of human capital. In particular, following the previous literature which indicates that high skills are a requisite to assimilate new technology (e.g. Leiponen, 2005; Manca, 2012; Qian et al, 2013) we opted for using data on the percentage of workers with tertiarylevel education over the whole workforce. The source of the data for this variable is the Eurostat Regio database. However, the lack of available data for the share of high skilled workers imposed some constraints in terms of the sample of regions included in the analysis as well as for the time period under consideration. Among the first 15entry countries, regional data on the share of workers with tertiary education is not available for Denmark, Sweden, and Luxembourg. In turn, such information is only available for 4 of the CEE countries that acceded the EU in 2004: the Czech Republic, Hungary, Poland, and Slovakia. Finally, no regional data on educational attainment is available yet for a longenough period for Bulgaria and Romania, the two countries that joined the EU in 2007. Still, the lack of data for some regions before 1999 forced us to define the period under analysis from this year to 2008 that is the last year covered by the Regio database when this study was carried out.
22
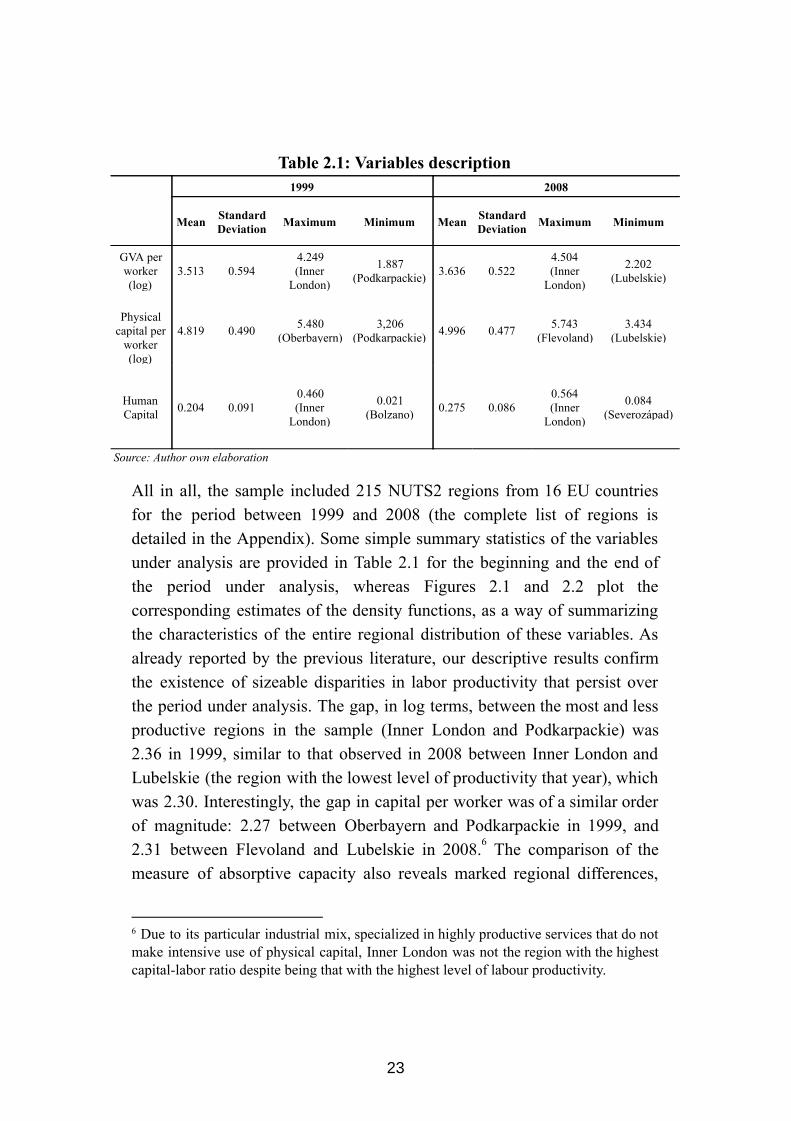
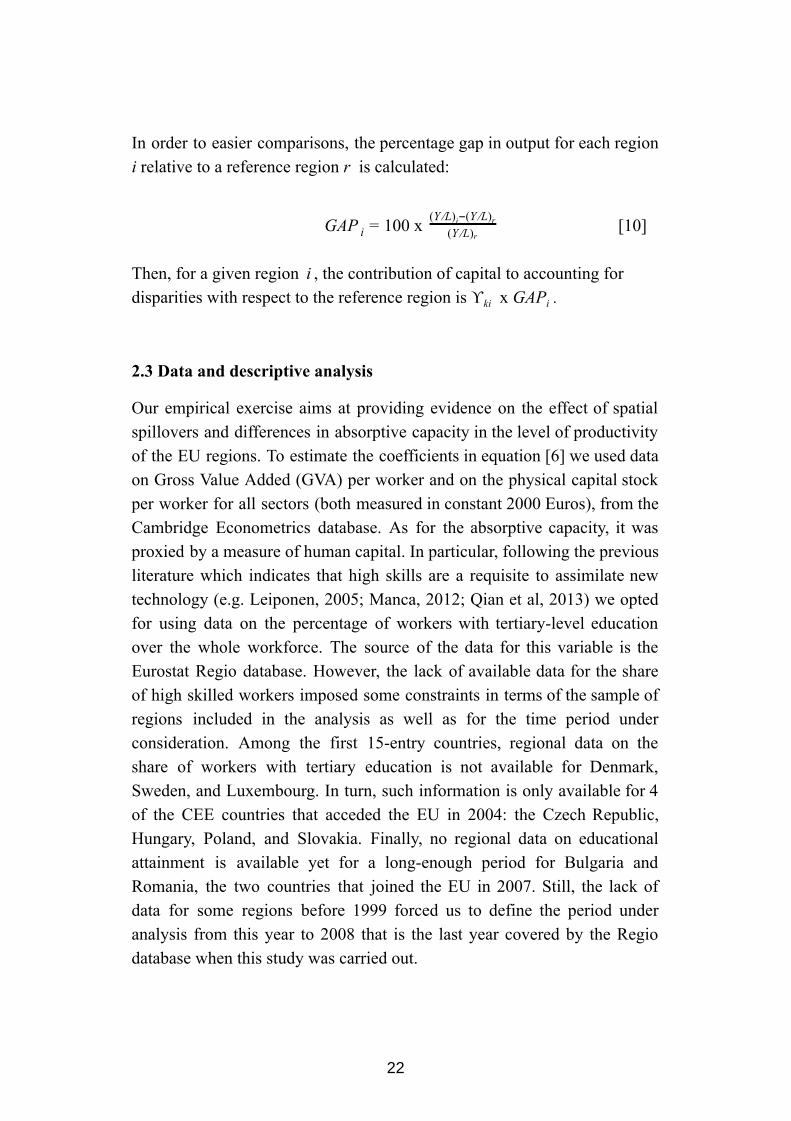
Table 2.1: Variables description
1999 2008
Mean Standard Deviation Maximum Minimum Mean Standard
Deviation Maximum Minimum
GVA per worker (log)
3.513 0.594 4.249 (Inner London)
1.887 (Podkarpackie) 3.636 0.522
4.504 (Inner London)
2.202 (Lubelskie)
Physical capital per worker (log)
4.819 0.490 5.480 (Oberbayern)
3,206 (Podkarpackie) 4.996 0.477 5.743
(Flevoland) 3.434
(Lubelskie)
Human Capital 0.204 0.091
0.460 (Inner London)
0.021 (Bolzano) 0.275 0.086
0.564 (Inner London)
0.084 (Severozápad)
Source: Author own elaboration
All in all, the sample included 215 NUTS2 regions from 16 EU countries for the period between 1999 and 2008 (the complete list of regions is detailed in the Appendix). Some simple summary statistics of the variables under analysis are provided in Table 2.1 for the beginning and the end of the period under analysis, whereas Figures 2.1 and 2.2 plot the corresponding estimates of the density functions, as a way of summarizing the characteristics of the entire regional distribution of these variables. As already reported by the previous literature, our descriptive results confirm the existence of sizeable disparities in labor productivity that persist over the period under analysis. The gap, in log terms, between the most and less productive regions in the sample (Inner London and Podkarpackie) was 2.36 in 1999, similar to that observed in 2008 between Inner London and Lubelskie (the region with the lowest level of productivity that year), which was 2.30. Interestingly, the gap in capital per worker was of a similar order of magnitude: 2.27 between Oberbayern and Podkarpackie in 1999, and 2.31 between Flevoland and Lubelskie in 2008. The comparison of the 6
measure of absorptive capacity also reveals marked regional differences,
6 Due to its particular industrial mix, specialized in highly productive services that do not make intensive use of physical capital, Inner London was not the region with the highest capitallabor ratio despite being that with the highest level of labour productivity.
23
with Inner London as the region that made the most intensive use of high skilled labor all over the period.
Figure 2.1: Kernel density of GVA per worker (left) and physical capital per worker (right).
Source: Author own elaboration
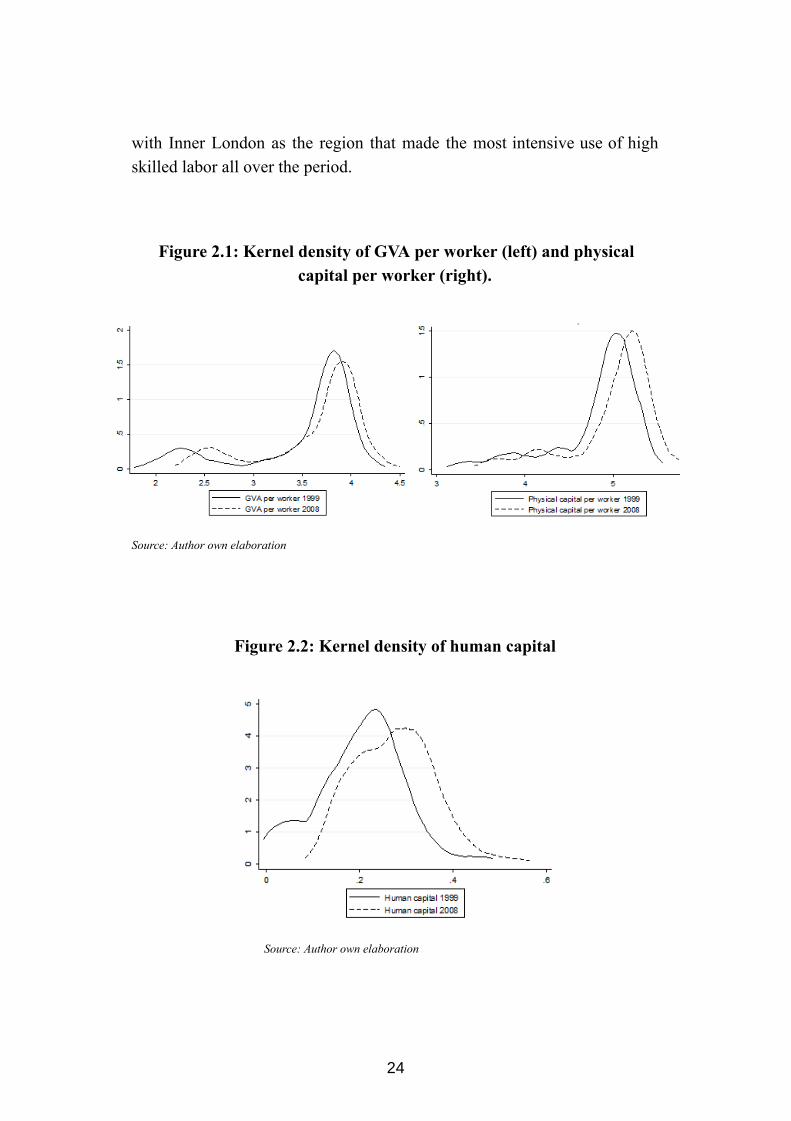
Figure 2.2: Kernel density of human capital
Source: Author own elaboration
24

The estimated density functions in Figures 2.1 and 2.2 reveal that disparities went beyond those for the regions with the highest and lowest values for the variables under analysis. The one corresponding to labor productivity reveals a bimodal distribution, with an important amount of regions near the core, and a less numerous but distant group at the left, which constitutes a periphery (mainly of CEE regions). The distance between the two modes is rather high and remained stable over the period under analysis. In turn, the density of capital per worker has a long left tail but without a clear mode in that area, which indicates larger dispersion for values below the average than in the case of productivity. In fact, the comparison of the densities for the two variables suggests that polarization in the distribution of productivity was not just caused by the distribution of the capitallabor ratio. In agreement with our hypothesis in this chapter, differences in the level of technology and in the absorption capacity might well have played a role. The density for the measure of absorptive capacity, the share of workers highly endowed with human capital, provides preliminary support to this hypothesis, since it reveals a substantial mass of probability at the left of the distribution, corresponding to regions with much lower endowments of human capital. It is worthwhile noting that the increase in the endowment of education in the entire EU over the period under analysis caused a shift to the right in the distribution which, in any case, did not prevent the presence of strong regional disparities in the share of workers with tertiary education in 2008.
As an additional element of the simple descriptive analysis in this section, we want to mention that the distribution of the variables under analysis is characterized by a clear geographical or spatial pattern. The representation in maps of labor productivity, capital per worker, and the measure of human capital provides the wellknown coreperiphery pattern commonly reported 7
for the EU. Broadly speaking, the lowest levels of productivity, physical capital, and human capital are found in the south and CEE regions, while the highest levels are seen in the traditional core. This brings about a distribution of the variables that is characterized by strong spatial dependence. Using the Moran's I and Geary's C statistics to measure the
7 Not included here to save space but available upon request
25
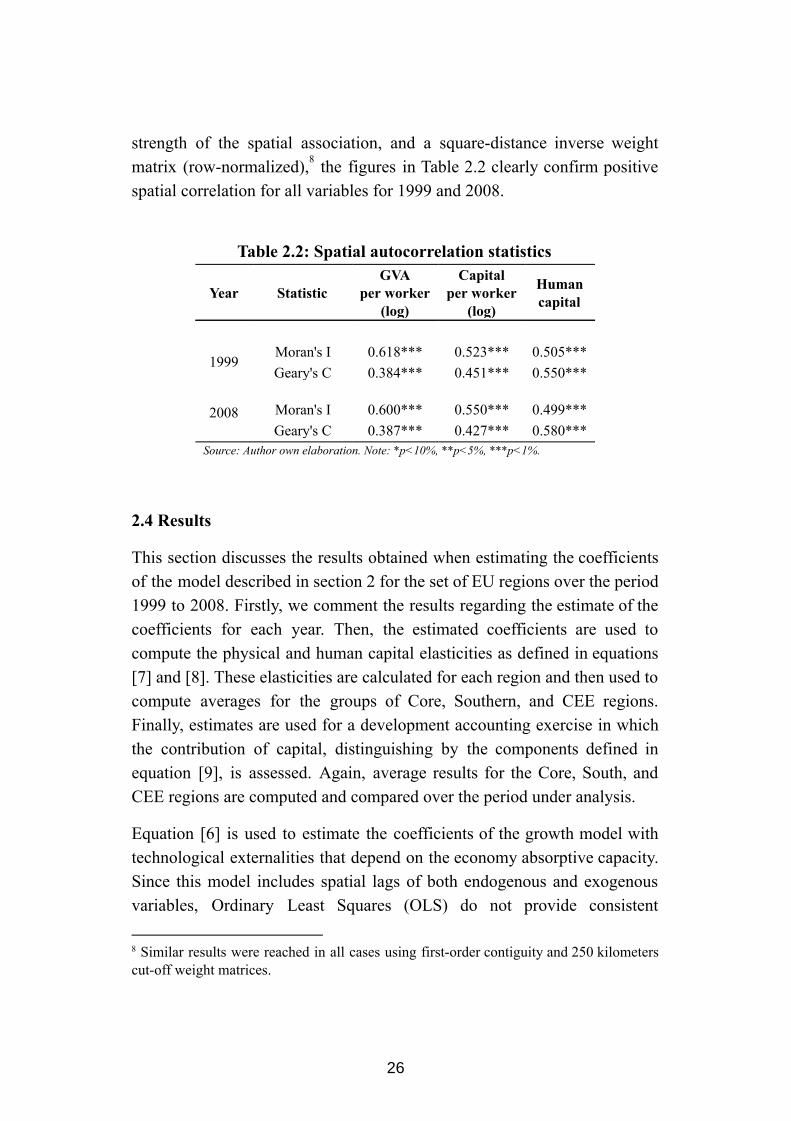
strength of the spatial association, and a squaredistance inverse weight matrix (rownormalized), the figures in Table 2.2 clearly confirm positive 8
spatial correlation for all variables for 1999 and 2008.
Table 2.2: Spatial autocorrelation statistics
Year Statistic GVA
per worker (log)
Capital per worker
(log)
Human capital
1999 Moran's I 0.618*** 0.523*** 0.505*** Geary's C 0.384*** 0.451*** 0.550***
2008
Moran's I
0.600***
0.550***
0.499*** Geary's C 0.387*** 0.427*** 0.580***
Source: Author own elaboration. Note: *p<10%, **p<5%, ***p<1%.
2.4 Results
This section discusses the results obtained when estimating the coefficients of the model described in section 2 for the set of EU regions over the period 1999 to 2008. Firstly, we comment the results regarding the estimate of the coefficients for each year. Then, the estimated coefficients are used to compute the physical and human capital elasticities as defined in equations [7] and [8]. These elasticities are calculated for each region and then used to compute averages for the groups of Core, Southern, and CEE regions. Finally, estimates are used for a development accounting exercise in which the contribution of capital, distinguishing by the components defined in equation [9], is assessed. Again, average results for the Core, South, and CEE regions are computed and compared over the period under analysis.
Equation [6] is used to estimate the coefficients of the growth model with technological externalities that depend on the economy absorptive capacity. Since this model includes spatial lags of both endogenous and exogenous variables, Ordinary Least Squares (OLS) do not provide consistent
8 Similar results were reached in all cases using firstorder contiguity and 250 kilometers cutoff weight matrices.
26

estimates of the coefficients. Instead a Maximum Likelihood estimator, which ensures the desired properties, is applied. Also, we account for the fact that the empirical specification in [6] includes nonlinear restrictions in the coefficients (see the Appendix for details of the estimation procedure). 9
Estimation of equation [6] involves some other issues that are worth discussing. Firstly, as stated by LeSage and Pace (2009), W 1 and hW 2 are required to be not functionally related. That technical limitation prevents using the same weights matrix for W 1 and W 2 . As a result, it will be supposed that for spatial externalities that do not rely on local absorptive capacity, interaction will take place with its closest neighbours. For that reason, W 1 will be represented by a firstorder contiguity matrix. For technological externalities whose absorption in each region depends on local human capital levels, it will be assumed that interactions have a higher spatial scope, taking place among regions within a radius of 250 kilometers. This distance is consistent with the evidence in, for instance, Moreno, Paci and Usai (2005) and RodriguezPose and Crescenzi (2008) for the scope of technological externalities in Europe. Therefore, W 2 will be represented by 10
a 250km cutoff distance matrix. Matrices W 1 and W 2 may still share some overlapping information, but this is not believed to be a problem, as W 2 is premultiplied by h , and the resulting matrix hW 2 appears to be sufficiently differentiated with respect to W 1 to avoid identification problems.
11
9 The specification may be extended to a panel data setting, therefore controlling for unobserved regional heterogeneity (see Lee and Yu, 2010). However, in addition to the obvious complications caused by the nonlinearity of the specification, it should be noticed that pooling the data for the period under study would have hampered the analysis since the matrix hW 2 evolves with the endowment of human capital and the spatial parameters, γ and δ, are likely to vary over time. For that reason, the estimates of the coefficients in this section exploit only the information in the crosssection dimension, although we admit it would be interesting to explore the effect of unobserved regional heterogeneity in future analysis. We thank an anonymous referee for raising this point. 10 RodriguezPose and Crescenzi (2008) suggest a threshold of a 3hour drive for innovation spillovers. 11 We analyzed in detail the two spatial matrices used in the study, particularly with respect to the issue of overlapping information. In this respect, it should be said that the number of links (nonzero elements) in W 2 is 12.15 percent of all possible interactions, whereas this figure is only 4.04 percent in the case of W 1 . Similarly, the mean number of links is much higher for the distancebased matrix, 13, than for the contiguity matrix, 4.32. Overall, comparison of the two matrices suggests that they actually include different
27
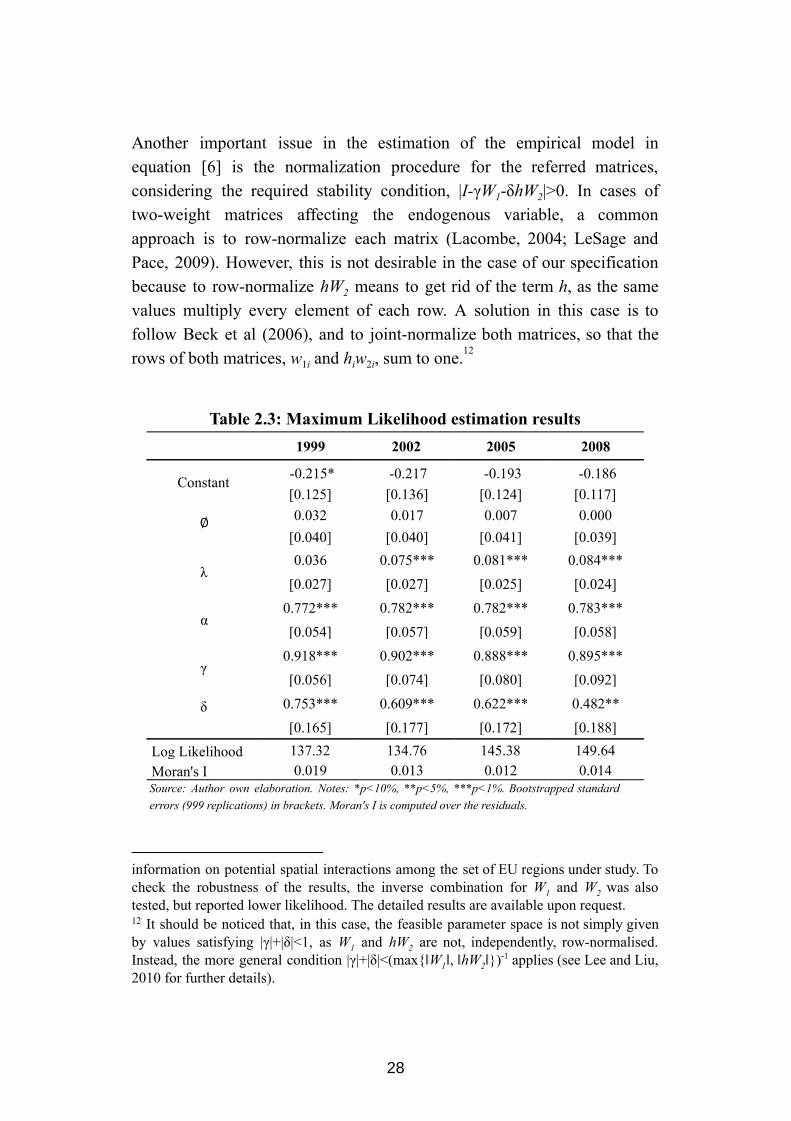
Another important issue in the estimation of the empirical model in equation [6] is the normalization procedure for the referred matrices, considering the required stability condition, | I γ W 1 δ hW 2 |>0. In cases of twoweight matrices affecting the endogenous variable, a common approach is to rownormalize each matrix (Lacombe, 2004; LeSage and Pace, 2009). However, this is not desirable in the case of our specification because to rownormalize hW 2 means to get rid of the term h , as the same values multiply every element of each row. A solution in this case is to follow Beck et al (2006), and to jointnormalize both matrices, so that the rows of both matrices, w 1 i and h i w 2 i , sum to one. 12
Table 2.3: Maximum Likelihood estimation results 1999 2002 2005 2008
Constant 0.215* 0.217 0.193 0.186 [0.125] [0.136] [0.124] [0.117]
∅ 0.032 0.017 0.007 0.000 [0.040] [0.040] [0.041] [0.039]
λ 0.036 0.075*** 0.081*** 0.084*** [0.027] [0.027] [0.025] [0.024]
α 0.772*** 0.782*** 0.782*** 0.783*** [0.054] [0.057] [0.059] [0.058]
γ 0.918*** 0.902*** 0.888*** 0.895*** [0.056] [0.074] [0.080] [0.092]
δ
0.753*** 0.609*** 0.622*** 0.482** [0.165] [0.177] [0.172] [0.188]
Log Likelihood 137.32 134.76 145.38 149.64 Moran's I 0.019 0.013 0.012 0.014 Source: Author own elaboration. Notes: *p<10%, **p<5%, ***p<1%. Bootstrapped standard errors (999 replications) in brackets. Moran's I is computed over the residuals.
information on potential spatial interactions among the set of EU regions under study. To check the robustness of the results, the inverse combination for W 1 and W 2 was also tested, but reported lower likelihood. The detailed results are available upon request. 12 It should be noticed that, in this case, the feasible parameter space is not simply given by values satisfying |γ|+|δ|<1, as W 1 and hW 2 are not, independently, rownormalised. Instead, the more general condition |γ|+|δ|<(max‖ W 1 ‖, ‖ hW 2 ‖)
1 applies (see Lee and Liu, 2010 for further details).
28
The estimation results are summarized in Table 2.3, for years 1999, 2002, 2005 and 2008. Before discussing results of the estimated coefficients it 13
should be said that the specification seems to account fully for the spatial dependence in productivity. Although Lagrange multiplier tests to detect remaining spatial dependence cannot be applied in this case due to the model nonlinearity, a Moran's I test was applied to the residuals of each regression, with results suggesting no further spatial dependence in any case.
A first look at the results confirm a high value for , averaging 0.78 for the α four years of analysis. This is higher than the typical capital share in income in national accounts, usually onethird (as found by Koch, 2010), but closer to Koch (2008) results of 0.460.52 for a Spatial Durbin Model, and 0.680.70 for a Spatial Error Model (although Koch works with a different sample, consisting of 91 countries). Another important confirmation is the presence of both kinds of externalities affecting the TFP: learningbydoing and spatial interaction. The pattern is clear as regards the first type of external effects: ∅ is never significant, while λ is significant at 1 per cent in all years excepting 1999. This means that human capital seems to have a direct role in the absorption of spillovers from capital accumulation. This may explain why in Koch's results the parameter ∅ is not significant as in the absence of interaction with local conditions these externalities do not seem to have an incidence on technological levels. This result suggests 14
that the presence of a high skilled workforce enhances the return to physical capital investment. This means that two economies which have made a similar investment in physical capital may have a different return depending on its human capital endowment. Significance of λ implies a higher return for physical capital investment for those regions with highest skilled
13 Results for each year in the period under analysis are not included to save space, but they are available upon request. In any case, estimates for the years not reported are similar to those in Table 2.3 for the closest periods. 14 Koch (2010) found ∅ to be not significant in European regions, while Koch (2008) estimated six regressions for 91 countries, varying weight matrices and depreciation rates, and only in one case ∅ was significant, at a 10 percent level (pvalue of 0.094).
29
workforce, suggesting that both types of capital are complementary. This may have some important consequences for regional development, as regions with poor human capital endowment (especially from the periphery) will have little technological benefit from capital accumulation spillovers and as a result will face difficulties to catchup. As stated before, some peripheral regions received important amount of FDI during the period. It can be supposed that these capital flows were mostly endowed with advanced technology (in contrast to local stocks), and in the light of these results, possibly only the relatively good human capitalendowed regions have been able to make the most of that advances.
With respect to the effect of technology generated beyond the borders of the region, that is to say of spatial spillovers in technology, the estimates of the corresponding coefficients (γ and δ) are significant at 1 per cent in all years (δ at 1.04 per cent in 2008). The coefficient of the direct measure of technological absorption, γ, averages stable values of 0.9, while that of the measure which incorporates absorptive capacity through human capital, δ, decreases over the period from 0.75 in 1999 to 0.48 in 2008. However, 15
this trend should not be seen as a declining in the role of local abilities, because average levels of human capital increased during the period. Combining the estimated value of the coefficient with the average share of tertiary education in the workforce results in only a slight decrease over the period (0.15 in 1999 versus 0.13 in 2008). In any case, the estimates confirm that the absorption of technology generated beyond the borders of the region was enhanced by local capabilities, which results in differences in the absorptive capacity. In other words, although all regions benefited from technical progress generated elsewhere, those EU regions with high endowments of skilled workers made the most of it. This result thus qualifies the recent evidence reported in Vogel (2015) for a sample of EU 15 regions, which assigns a negligible effect of human capital on region’s absorptive capacity.
All in all, these results confirm that studies aiming at estimating the effect of physical capital accumulation on regional disparities in productivity, and the contribution corresponding to technology diffusion, should account for
15 These values ensure stability as the required condition of | I γ W 1 δ hW 2 |>0 is verified.
30
differences across regions in the absorptive capacity as a consequence of differences across regions in the endowment of human capital. Next, the estimates in Table 2.3 are used to compute the capitalproductivity elasticities and to perform a development accounting analysis for the EU regions in the period under analysis.
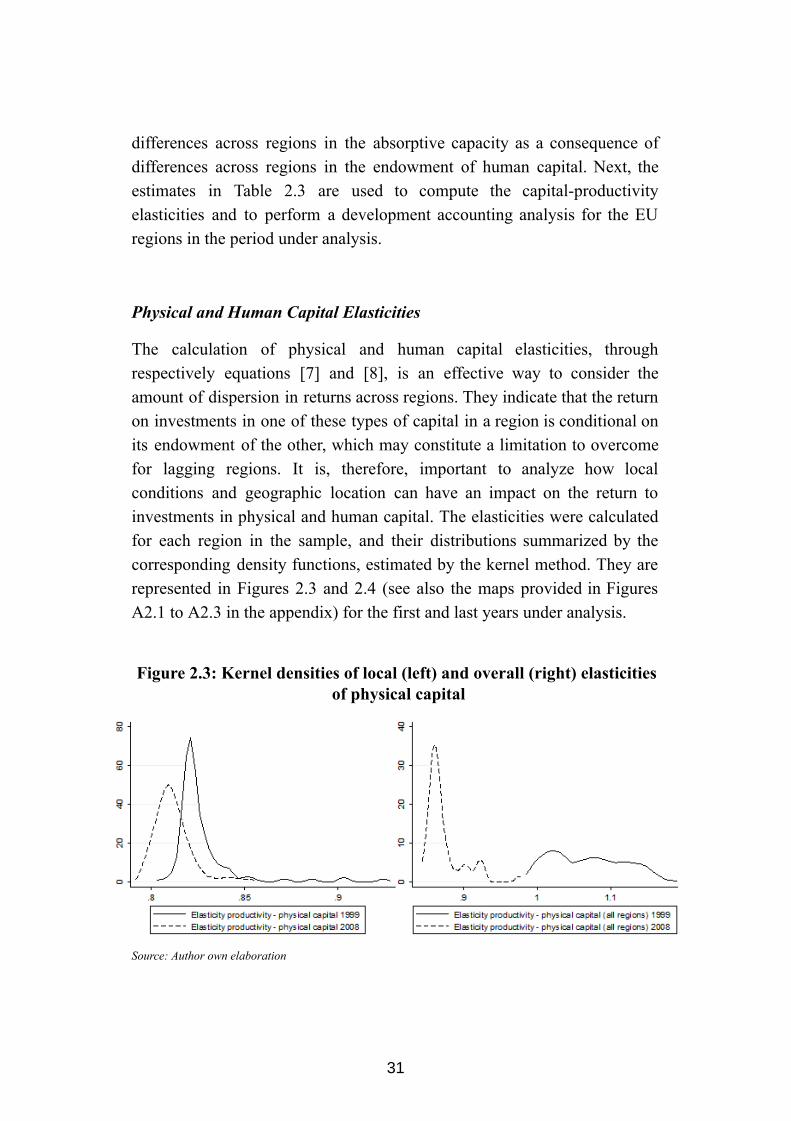
Physical and Human Capital Elasticities
The calculation of physical and human capital elasticities, through respectively equations [7] and [8], is an effective way to consider the amount of dispersion in returns across regions. They indicate that the return on investments in one of these types of capital in a region is conditional on its endowment of the other, which may constitute a limitation to overcome for lagging regions. It is, therefore, important to analyze how local conditions and geographic location can have an impact on the return to investments in physical and human capital. The elasticities were calculated for each region in the sample, and their distributions summarized by the corresponding density functions, estimated by the kernel method. They are represented in Figures 2.3 and 2.4 (see also the maps provided in Figures A2.1 to A2.3 in the appendix) for the first and last years under analysis.
Figure 2.3: Kernel densities of local (left) and overall (right) elasticities of physical capital
Source: Author own elaboration
31
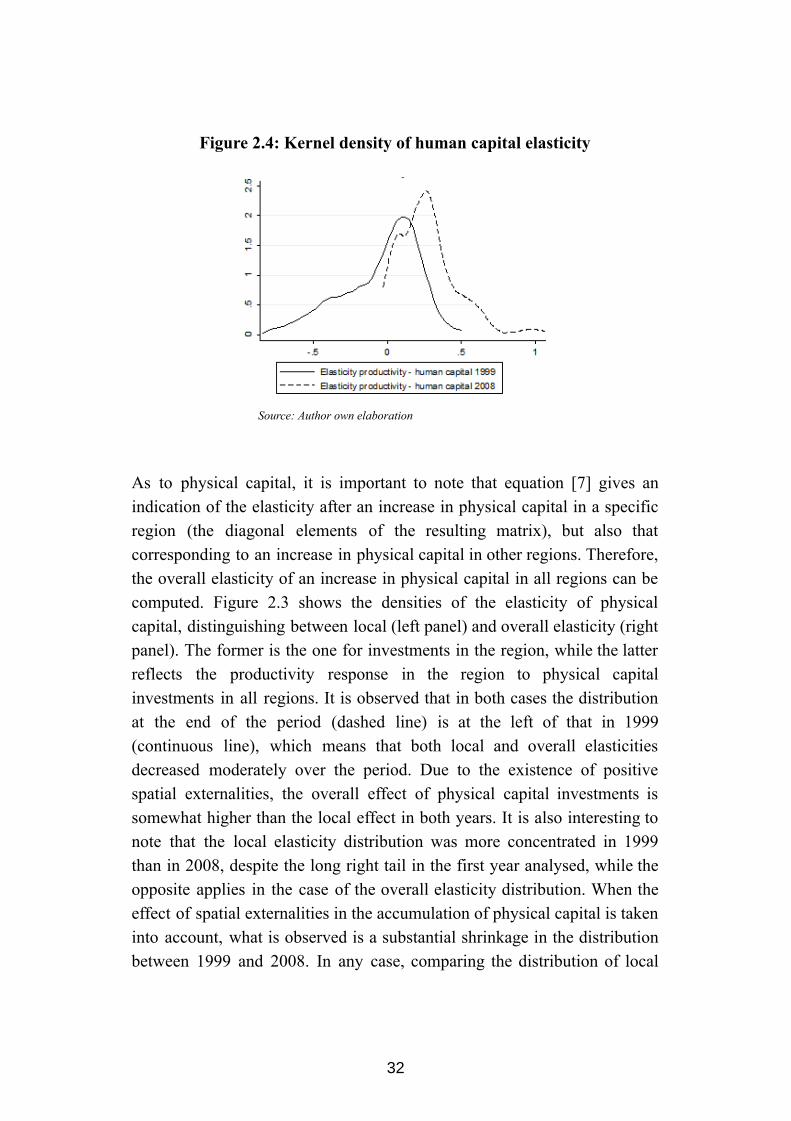
Figure 2.4: Kernel density of human capital elasticity
Source: Author own elaboration
As to physical capital, it is important to note that equation [7] gives an indication of the elasticity after an increase in physical capital in a specific region (the diagonal elements of the resulting matrix), but also that corresponding to an increase in physical capital in other regions. Therefore, the overall elasticity of an increase in physical capital in all regions can be computed. Figure 2.3 shows the densities of the elasticity of physical capital, distinguishing between local (left panel) and overall elasticity (right panel). The former is the one for investments in the region, while the latter reflects the productivity response in the region to physical capital investments in all regions. It is observed that in both cases the distribution at the end of the period (dashed line) is at the left of that in 1999 (continuous line), which means that both local and overall elasticities decreased moderately over the period. Due to the existence of positive spatial externalities, the overall effect of physical capital investments is somewhat higher than the local effect in both years. It is also interesting to note that the local elasticity distribution was more concentrated in 1999 than in 2008, despite the long right tail in the first year analysed, while the opposite applies in the case of the overall elasticity distribution. When the effect of spatial externalities in the accumulation of physical capital is taken into account, what is observed is a substantial shrinkage in the distribution between 1999 and 2008. In any case, comparing the distribution of local
32

and overall elasticities for the last year under analysis allows us to conclude that spatial interactions led to an increase in the effect of physical capital investments while, at the same time, contributed to homogenize this effect across regions. This is true except for a group of regions in which the overall elasticity is well above that of most EU regions (mass of probability at around 0.9 and beyond).
In turn, the densities of the human capital elasticity distributions are shown in Figure 2.4. As indicated in section 2.2, the role of human capital in our model is constrained to facilitate absorption of technology, generated in the region or elsewhere. Therefore, the return of investments in this type of capital is thought not to spill over other regions. Accordingly, there is not an overall elasticity in the case of human capital, but just the local effect. On the other hand, it should be kept in mind that, as equation [8] indicates, the elasticity of human capital depends on the regional endowment of both types of capital. As a result, disparities across regions in physical capital endowments shapes the regional distribution of returns to investments in human capital. It is observed that the density for 2008 is to the right of that for 1999, which means that, in general, the elasticity of human capital increased over the period analyzed. In fact, inspection of the density for 1999 reveals that the elasticity of human capital was negative in a large number of EU regions at the eve of the new century. In contrast, the density for 2008 suggests that such worrisome negative effect disappeared in the course of the last decade. Investments in human capital had a positive effect on productivity in all EU regions at the end of the period. This was mostly caused by a process of physical capital deepening in regions that departed from rather low values. Still, the density for 2008 reveals a nonnegligible mass of probability at the left of the mode (low values of the elasticity) and also at the opposite edge of the distribution (values for the elasticity in the range 0.5 to 1). 16
16 In order to check for the effect of the inclusion of human capital as a determinant of the region’s absorptive capacity, elasticities were computed from the model that does not consider the interaction between h and W 2 , but only W 2 in the last term of the RHS of equation [3], using the corresponding estimates of the coefficients. In all cases, the distribution of the elasticities computed from the model that accounts for the region’s absorptive capacity differs clearly from the one that is obtained when that specific role of
33
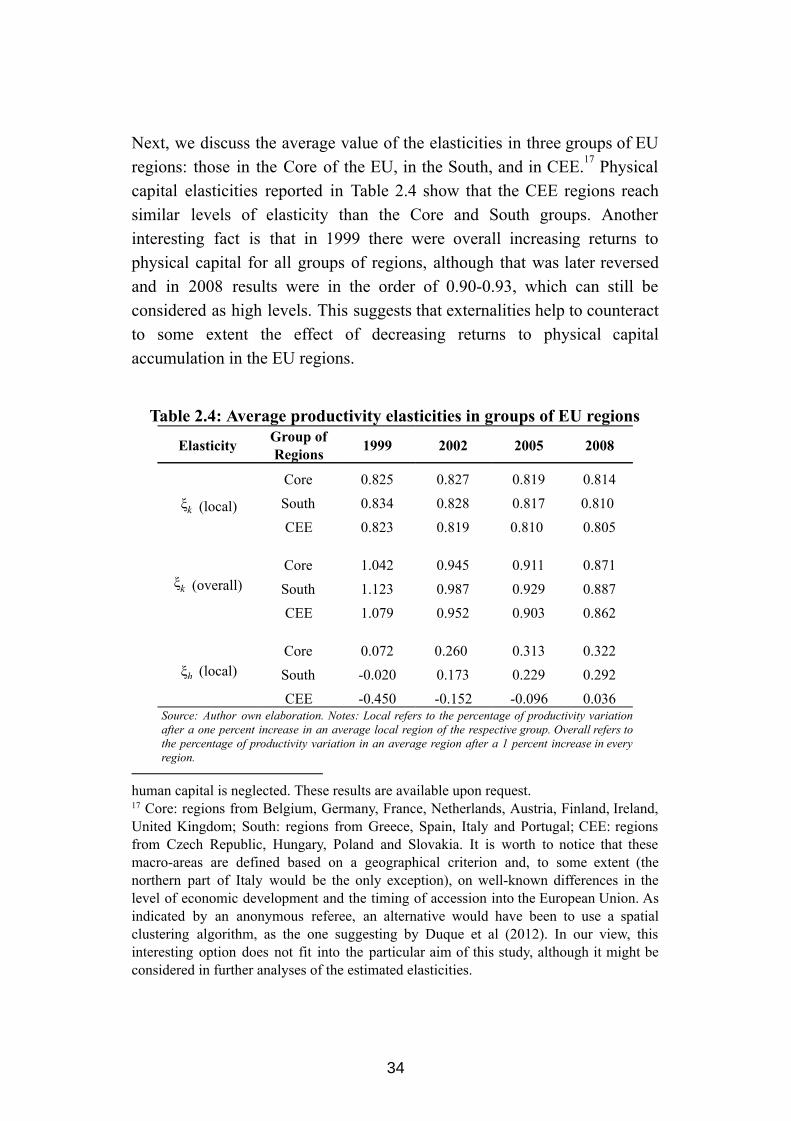
Next, we discuss the average value of the elasticities in three groups of EU regions: those in the Core of the EU, in the South, and in CEE. Physical 17
capital elasticities reported in Table 2.4 show that the CEE regions reach similar levels of elasticity than the Core and South groups. Another interesting fact is that in 1999 there were overall increasing returns to physical capital for all groups of regions, although that was later reversed and in 2008 results were in the order of 0.900.93, which can still be considered as high levels. This suggests that externalities help to counteract to some extent the effect of decreasing returns to physical capital accumulation in the EU regions.
Table 2.4: Average productivity elasticities in groups of EU regions
Elasticity Group of Regions 1999 2002 2005 2008
(local) ξk
Core 0.825 0.827 0.819 0.814 South 0.834 0.828 0.817 0.810 . CEE 0.823 0.819 0.810 . 0.805
(overall) ξk
Core 1.042 0.945 0.911 0.871 South 1.123 0.987 0.929 0.887 CEE 1.079 0.952 0.903 0.862
(local) ξh
Core 0.072 0.260 . 0.313 0.322 South 0.020 . 0.173 0.229 0.292 CEE 0.450 . 0.152 0.096 0.036
Source: Author own elaboration. Notes: Local refers to the percentage of productivity variation after a one percent increase in an average local region of the respective group. Overall refers to the percentage of productivity variation in an average region after a 1 percent increase in every region.
human capital is neglected. These results are available upon request. 17 Core: regions from Belgium, Germany, France, Netherlands, Austria, Finland, Ireland, United Kingdom; South: regions from Greece, Spain, Italy and Portugal; CEE: regions from Czech Republic, Hungary, Poland and Slovakia. It is worth to notice that these macroareas are defined based on a geographical criterion and, to some extent (the northern part of Italy would be the only exception), on wellknown differences in the level of economic development and the timing of accession into the European Union. As indicated by an anonymous referee, an alternative would have been to use a spatial clustering algorithm, as the one suggesting by Duque et al (2012). In our view, this interesting option does not fit into the particular aim of this study, although it might be considered in further analyses of the estimated elasticities.
34
Regarding the effect of human capital, results in Table 2.4 show that the highest elasticities are estimated for the regions in the Core, followed by Southern and CEE regions respectively. As stated before, the low levels of the human capital elasticity for peripheral regions (especially CEE regions in which negative values for the elasticity are estimated) seem to be explained by their low endowment of physical capital per worker. In the case of the Southern regions, geographic distance to the Core may also constitute a limitation for having lower returns to human capital investment visàvis the most developed regions in the core of the EU.
An interesting pattern derived from the results in Table 2.4 is the increasing trend of the elasticity of human capital in the period under analysis, which is more pronounced in the South and, especially, in CEE regions. In the latter group, the large negative elasticity at the beginning of the period analyzed may well reflect that these economies were still in the early stages of the transition from communism. They lacked the capability for obtaining a return from the human capital of their populations due to the insufficient and obsolete endowment of physical capital, the inadequate system of incentives at the time, and the still low level of ties with economies of Western Europe. In the following years, after the accession to the EU and the openness process that led to important FDI inflows, the increase and modernization of the physical capital endowment along with a more suitable institutional framework, favored that these regions were able to start extracting positive returns to human capital investments at the end of the last decade. This is consistent with a rapid process of skilled biased technical change in these economies, as they experienced a fast shift in technology that favored skilled labor by increasing its relative productivity. This interpretation goes in the same direction as the conclusions reached in some other studies, as for example Esposito and Stehrer (2009), who found evidence of this process in Hungary and Poland between 1995 and 2003. 18
In a lesser degree, southern regions may still have undergone through a similar process, reaching higher returns to human capital while its development increased through the years.
18 This process happened before in more developed countries. In particular, Berman et al (1998) found evidence of skilledbiased technical change for OECD countries after 1979.
35
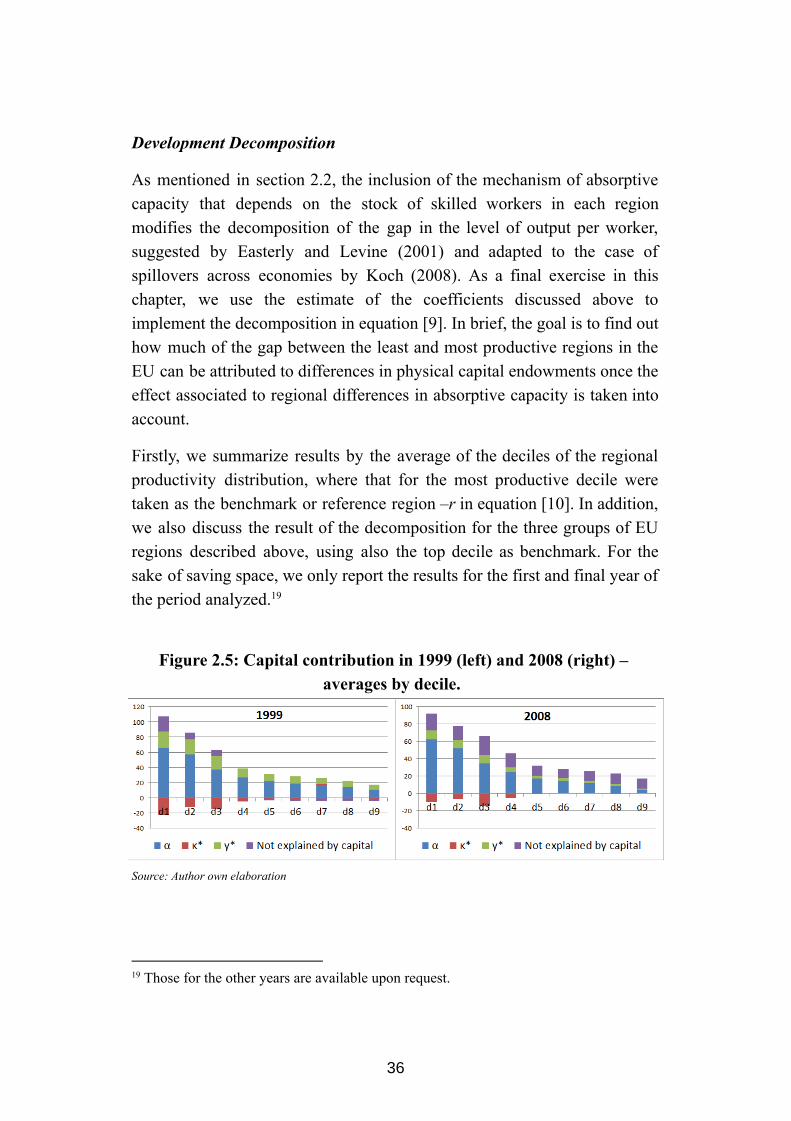
Development Decomposition
As mentioned in section 2.2, the inclusion of the mechanism of absorptive capacity that depends on the stock of skilled workers in each region modifies the decomposition of the gap in the level of output per worker, suggested by Easterly and Levine (2001) and adapted to the case of spillovers across economies by Koch (2008). As a final exercise in this chapter, we use the estimate of the coefficients discussed above to implement the decomposition in equation [9]. In brief, the goal is to find out how much of the gap between the least and most productive regions in the EU can be attributed to differences in physical capital endowments once the effect associated to regional differences in absorptive capacity is taken into account.
Firstly, we summarize results by the average of the deciles of the regional productivity distribution, where that for the most productive decile were taken as the benchmark or reference region – r in equation [10]. In addition, we also discuss the result of the decomposition for the three groups of EU regions described above, using also the top decile as benchmark. For the sake of saving space, we only report the results for the first and final year of the period analyzed. 19
Figure 2.5: Capital contribution in 1999 (left) and 2008 (right) – averages by decile.
Source: Author own elaboration
19 Those for the other years are available upon request.
36
Average results by deciles shown in Figure 2.5 suggest that for the less productive regions (first three deciles), an important amount of the gap with respect to the highest decile is explained by the contribution of physical capital. The detailed decomposition provides additional insights on the sources of this contribution. It is observed that most of it is due to the return to physical capital (α), whereas the contribution of differences in the capitaloutput ratio (κ * ) is negative. This result is explained by the lesser physical capital requirements of high valueadded activities that are more abundant in the most productive EU regions. The capitaloutput ratio is lower for highly productive activities in the industrial and service sectors located in core economies. In contrast, a relatively high capitaloutput ratio is observed in mature industrial activities in some of the less productive regions in the EU. On the other hand, it is observed that the unequal 20
spatial distribution of productivity (y * ) also adds to the contribution of physical capital in the lowest deciles, particularly in 1999.
Results in Figure 2.5 also reveal that there was a part of the gap not attributable to physical capital, and thus corresponding to technology, at the beginning of the period analyzed. However, this seems to be important only in the case of the less productive regions (first three deciles). Interestingly, the amount of the gap explained by physical capital slightly reduced in 2008 in comparison with 1999 in these regions. In other words, there is an increasing portion of the gap for the less productive regions that cannot be explained by physical capital over the period analyzed. This may be the result of a process of capital intensity as a consequence of the deepening in economic integration following the accession to the EU in lagging regions. Correspondingly, it can be deduced an increasing role of technology in explaining productivity differentials between the most and less productive regions in Europe. This phenomenon is also clearly observed for regions with levels of productivity at the median and upper part of the distribution. While almost all the gap was explained by physical capital in 1999, the contribution of technology is similar or even greater to that corresponding to physical capital in the deciles at the right of the distribution in 2008. That is to say that technology is responsible of a big deal of the differences
20 For instance, in 2008, the average capitaloutput ratio for first decile regions was 4.9, in contrast to an average of 3.7 for the highest decile.
37
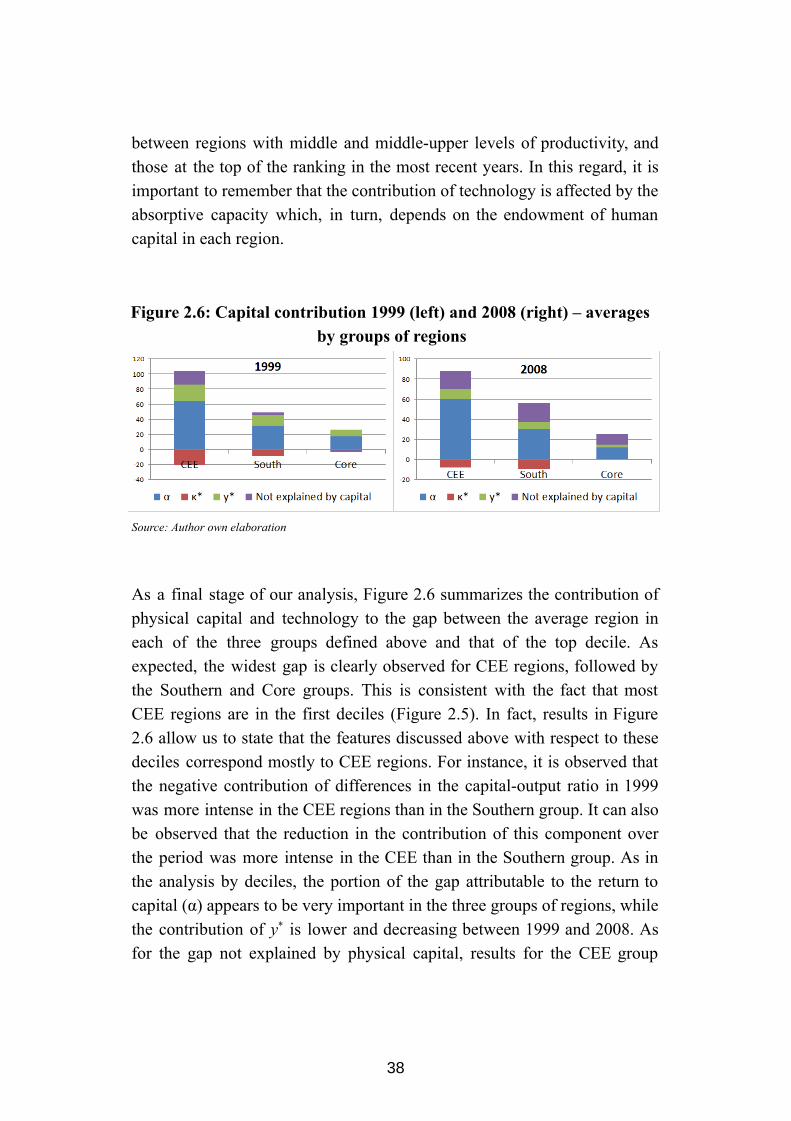
between regions with middle and middleupper levels of productivity, and those at the top of the ranking in the most recent years. In this regard, it is important to remember that the contribution of technology is affected by the absorptive capacity which, in turn, depends on the endowment of human capital in each region.
Figure 2.6: Capital contribution 1999 (left) and 2008 (right) – averages by groups of regions
Source: Author own elaboration
As a final stage of our analysis, Figure 2.6 summarizes the contribution of physical capital and technology to the gap between the average region in each of the three groups defined above and that of the top decile. As expected, the widest gap is clearly observed for CEE regions, followed by the Southern and Core groups. This is consistent with the fact that most CEE regions are in the first deciles (Figure 2.5). In fact, results in Figure 2.6 allow us to state that the features discussed above with respect to these deciles correspond mostly to CEE regions. For instance, it is observed that the negative contribution of differences in the capitaloutput ratio in 1999 was more intense in the CEE regions than in the Southern group. It can also be observed that the reduction in the contribution of this component over the period was more intense in the CEE than in the Southern group. As in the analysis by deciles, the portion of the gap attributable to the return to capital (α) appears to be very important in the three groups of regions, while the contribution of y * is lower and decreasing between 1999 and 2008. As for the gap not explained by physical capital, results for the CEE group
38
point to an increase in the contribution of differences in technology. However, the rise in the portion of the gap attributable to technology over the period is even more important for the Southern and Core regions in the EU. It can be observed how this component was almost negligible for both groups in 1999, whereas it accounted for about one third of the gap observed in 2008 for the Southern group and a bit less than one half for the Core.
To sum up, the decomposition of the regional productivity gap in the EU based on the empirical specification that includes spillovers from physical capital accumulation and diffusion of technology across regions, both shaped by absorption capacity in each region which, in turn, depends on the human capital endowment, reveals that most of the gap is attributable to differences in physical capital. However, a clear trend is observed towards an increasing role of technological differentials. This is so for the less developed regions in the CEE and the South, and also for those in the Core. According with the main hypothesis in this chapter, this feature is explained by the role played by human capital as a fundamental factor for the absorption of technology.
2.5 Conclusions
This chapter has proposed a theoretical model that combines technological externalities and differences across regional economies in local absorptive capacity. Its main assumption is that externalities have a crucial role in regional development, although not all regions can make the most of them, as their real impact on productivity is by local absorptive capacity, which in turn depends on the human capital endowment of the region. We have shown that the consideration of externalities across regions and local absorptive capacity affects the elasticity of both physical and human capital. Interestingly, the development decomposition derived from such a model has revealed that, in addition to externalities, the local absorptive capacity also plays a substantive role to the contribution of differences in physical capital endowments.
The key coefficients of the model, capturing the effect of externalities and
39
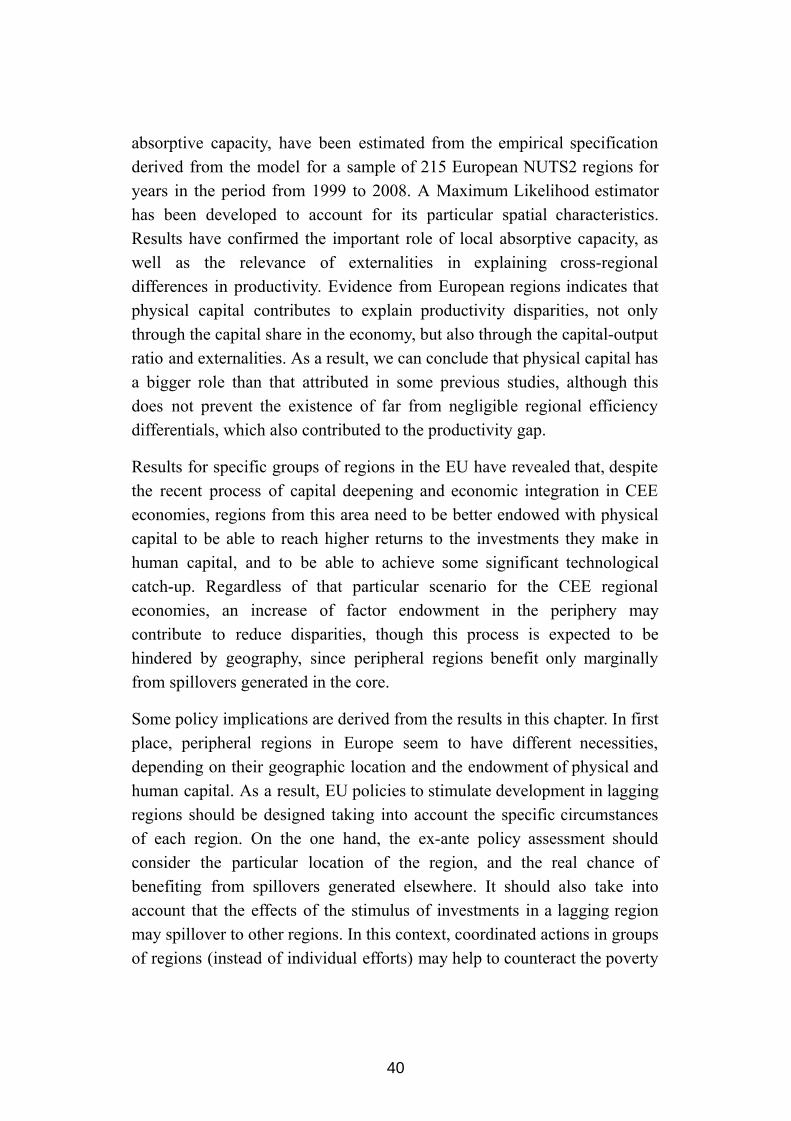
absorptive capacity, have been estimated from the empirical specification derived from the model for a sample of 215 European NUTS2 regions for years in the period from 1999 to 2008. A Maximum Likelihood estimator has been developed to account for its particular spatial characteristics. Results have confirmed the important role of local absorptive capacity, as well as the relevance of externalities in explaining crossregional differences in productivity. Evidence from European regions indicates that physical capital contributes to explain productivity disparities, not only through the capital share in the economy, but also through the capitaloutput ratio and externalities. As a result, we can conclude that physical capital has a bigger role than that attributed in some previous studies, although this does not prevent the existence of far from negligible regional efficiency differentials, which also contributed to the productivity gap.
Results for specific groups of regions in the EU have revealed that, despite the recent process of capital deepening and economic integration in CEE economies, regions from this area need to be better endowed with physical capital to be able to reach higher returns to the investments they make in human capital, and to be able to achieve some significant technological catchup. Regardless of that particular scenario for the CEE regional economies, an increase of factor endowment in the periphery may contribute to reduce disparities, though this process is expected to be hindered by geography, since peripheral regions benefit only marginally from spillovers generated in the core.
Some policy implications are derived from the results in this chapter. In first place, peripheral regions in Europe seem to have different necessities, depending on their geographic location and the endowment of physical and human capital. As a result, EU policies to stimulate development in lagging regions should be designed taking into account the specific circumstances of each region. On the one hand, the exante policy assessment should consider the particular location of the region, and the real chance of benefiting from spillovers generated elsewhere. It should also take into account that the effects of the stimulus of investments in a lagging region may spillover to other regions. In this context, coordinated actions in groups of regions (instead of individual efforts) may help to counteract the poverty
40

trap generated by geographical location. On the other hand, regional development policies should continue stimulating investments in human capital in the less developed areas. However, for these policies to be effective and human capital investments to have a positive return, a simultaneous deepening in physical capital accumulation is required. Modernization of economic structures and improvements in the institutional framework that favor attraction of investments in physical capital are thus crucial.
41

Appendix
Sample of Regions
Belgium: Région de BruxellesCapitale / Brussels Hoofdstedelijk Gewest; Prov. Antwerpen; Prov. Limburg (BE); Prov. OostVlaanderen; Prov. VlaamsBrabant; Prov. WestVlaanderen; Prov. Brabant Wallon; Prov. Hainaut; Prov. Liège; Prov. Luxembourg (BE); Prov. Namur.
Czech Republic: Praha; Strední Cechy; Jihozápad; Severozápad; Severovýchod; Jihovýchod; Strední Morava; Moravskoslezsko.
Germany: Stuttgart; Karlsruhe; Freiburg; Tübingen; Oberbayern; Niederbayern; Oberpfalz; Oberfranken; Mittelfranken; Unterfranken; Schwaben; Berlin; Bremen; Hamburg; Darmstadt; Gieben; Kassel; MecklenburgVorpommern; Braunschweig; Hannover; Lüneburg; WeserEms; Düsseldorf; Köln; Münster; Detmold; Arnsberg; Saarland; SchleswigHolstein; Thüringen.
Ireland: Border; Midland and Western; Southern and Eastern.
Greece: Anatoliki Makedonia, Thraki; Kentriki Makedonia; Dytiki Makedonia; Thessalia; Ipeiros; Ionia Nisia; Dytiki Ellada; Sterea Ellada; Peloponnisos; Attiki; Voreio Aigaio; Notio Aigaio; Kriti.
Spain: Galicia; Principado de Asturias; Cantabria; País Vasco; Comunidad Foral de Navarra; La Rioja; Aragón; Comunidad de Madrid; Castilla y León; Castillala Mancha; Extremadura; Cataluña; Comunidad Valenciana; Illes Balears; Andalucía; Región de Murcia; Canarias (ES).
France: Île de France; ChampagneArdenne; Picardie; HauteNormandie; Centre (FR); BasseNormandie; Bourgogne; Nord PasdeCalais; Lorraine; Alsace; FrancheComté; Pays de la Loire; Bretagne; PoitouCharentes; Aquitaine; MidiPyrénées; Limousin; RhôneAlpes; Auvergne; LanguedocRoussillon; ProvenceAlpesCôte d'Azur; Corse.
Italy: Piemonte; Valle d'Aosta / Vallée d'Aoste; Liguria; Lombardia; Provincia Autonoma Bolzano/Bozen; Provincia Autonoma Trento;
42

Veneto; FriuliVenezia Giulia; EmiliaRomagna; Toscana; Umbria; Marche; Lazio; Abruzzo; Molise; Campania; Puglia; Basilicata; Calabria; Sicilia; Sardegna.
Hungary: KözépMagyarország; KözépDunántúl; NyugatDunántúl; DélDunántúl; ÉszakMagyarország; ÉszakAlföld; DélAlföld.
Netherlands: Groningen; Friesland (NL); Drenthe; Overijssel; Gelderland; Flevoland; Utrecht; NoordHolland; ZuidHolland; Zeeland; NoordBrabant; Limburg (NL).
Austria: Burgenland (AT); Niederösterreich; Wien; Kärnten; Steiermark; Oberösterreich; Salzburg; Tirol; Vorarlberg.
Poland: Lódzkie; Mazowieckie; Malopolskie; Slaskie; Lubelskie; Podkarpackie; Swietokrzyskie; Podlaskie; Wielkopolskie; Zachodniopomorskie; Lubuskie; Dolnoslaskie; Opolskie; KujawskoPomorskie; WarminskoMazurskie; Pomorskie.
Portugal: Norte; Algarve; Centro (PT); Lisboa; Alentejo.
Slovakia: Bratislavský kraj; Západné Slovensko; Stredné Slovensko; Východné Slovensko.
Finland: ItäSuomi; EteläSuomi; LänsiSuomi; PohjoisSuomi; Aland.
United Kingdom: Tees Valley and Durham; Northumberland and Tyne and Wear; Cumbria; Cheshire; Greater Manchester; Lancashire; Merseyside; East Yorkshire and Northern Lincolnshire; North Yorkshire; South Yorkshire; West Yorkshire; Derbyshire and Nottinghamshire; Leicestershire, Rutland and Northamptonshire; Lincolnshire; Herefordshire, Worcestershire and Warwickshire; Shropshire and Staffordshire; West Midlands; East Anglia; Bedfordshire and Hertfordshire; Essex; Inner London; Outer London; Berkshire, Buckinghamshire and Oxfordshire; Surrey, East and West Sussex; Hampshire and Isle of Wight; Kent; Gloucestershire, Wiltshire and Bristol/Bath area; Dorset and Somerset; Cornwall and Isles of Scilly; Devon; West Wales and The Valleys; East Wales; Northern Ireland (UK).
43
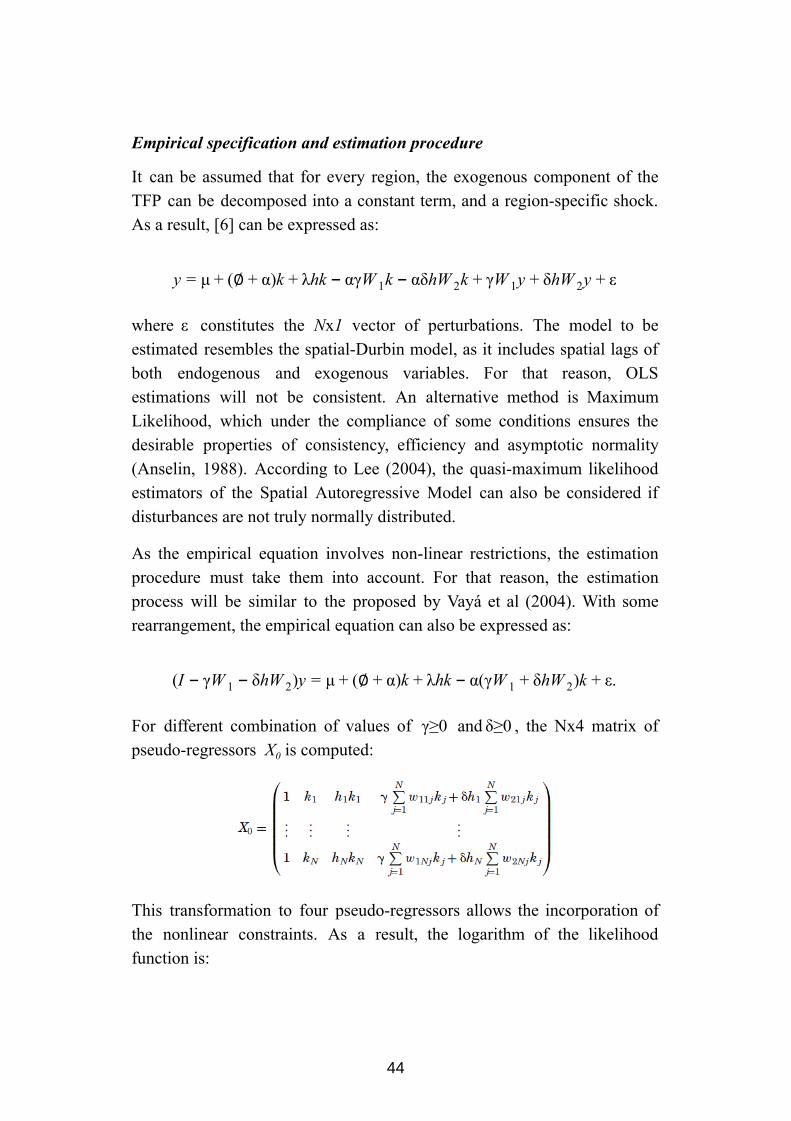
Empirical specification and estimation procedure
It can be assumed that for every region, the exogenous component of the TFP can be decomposed into a constant term, and a regionspecific shock. As a result, [6] can be expressed as:
∅ )k hk γW k δhW k W y hW y y = μ + ( + α + λ − α 1 − α 2 + γ 1 + δ 2 + ε
where constitutes the N x 1 vector of perturbations. The model to beε estimated resembles the spatialDurbin model, as it includes spatial lags of both endogenous and exogenous variables. For that reason, OLS estimations will not be consistent. An alternative method is Maximum Likelihood, which under the compliance of some conditions ensures the desirable properties of consistency, efficiency and asymptotic normality (Anselin, 1988). According to Lee (2004), the quasimaximum likelihood estimators of the Spatial Autoregressive Model can also be considered if disturbances are not truly normally distributed.
As the empirical equation involves nonlinear restrictions, the estimation procedure must take them into account. For that reason, the estimation process will be similar to the proposed by Vayá et al (2004). With some rearrangement, the empirical equation can also be expressed as:
I W hW )y ∅ )k hk (γW hW )k . ( − γ 1 − δ 2 = μ + ( + α + λ − α 1 + δ 2 + ε
For different combination of values of and , the Nx4 matrix of ≥0γ ≥0δ pseudoregressors X 0 is computed:
This transformation to four pseudoregressors allows the incorporation of the nonlinear constraints. As a result, the logarithm of the likelihood function is:
44

n L n ∣I W hW ∣ ln σ l = l − γ 1 − δ 2 − 2N 2
[(I W hW )y β] [(I W hW )y β] , − 12σ2 − γ 1 − δ 2 − X0
′ − γ 1 − δ 2 − X0
where is a vector of parameters. Then, OLS is applied to the followingβ equations: (i) X 0 on y , (ii) X 0 on W 1 y , and (iii) X 0 on hW 2 y , obtaining the 4x1 parameters vectors β 0 , β L 1 , β L 2 . From those regressions the following residuals are obtained: e 0 , e L1 , and e L2 . With those residuals, the logarithm of the concentrated likelihood function can be expressed as:
n L n ∣I W hW ∣ ln ⟨ ⟩ l C = C + l − γ 1 − δ 2 − 2N
N(e γe δe ) (e γe δe )0− L1− L2 ′ 0− L1− L2
where C is a constant. This process is performed for each combination of γ and δ. These parameters γ and δ are chosen in order to maximize the concentrated likelihood function. Then, the remaining parameters are obtained following the next expression:
βML = β0 − γβL1 − δβL2
represents a 4x1 vector of parameters. With those estimations, theβML structural parameters (μ, ∅, λ, α) can be easily recovered and all restrictions are fulfilled. Asymptotic variances for the estimated parameters are obtained by computing the inverse of the information matrix. The variance of the implied parameter ∅ is computed through the delta method.
45
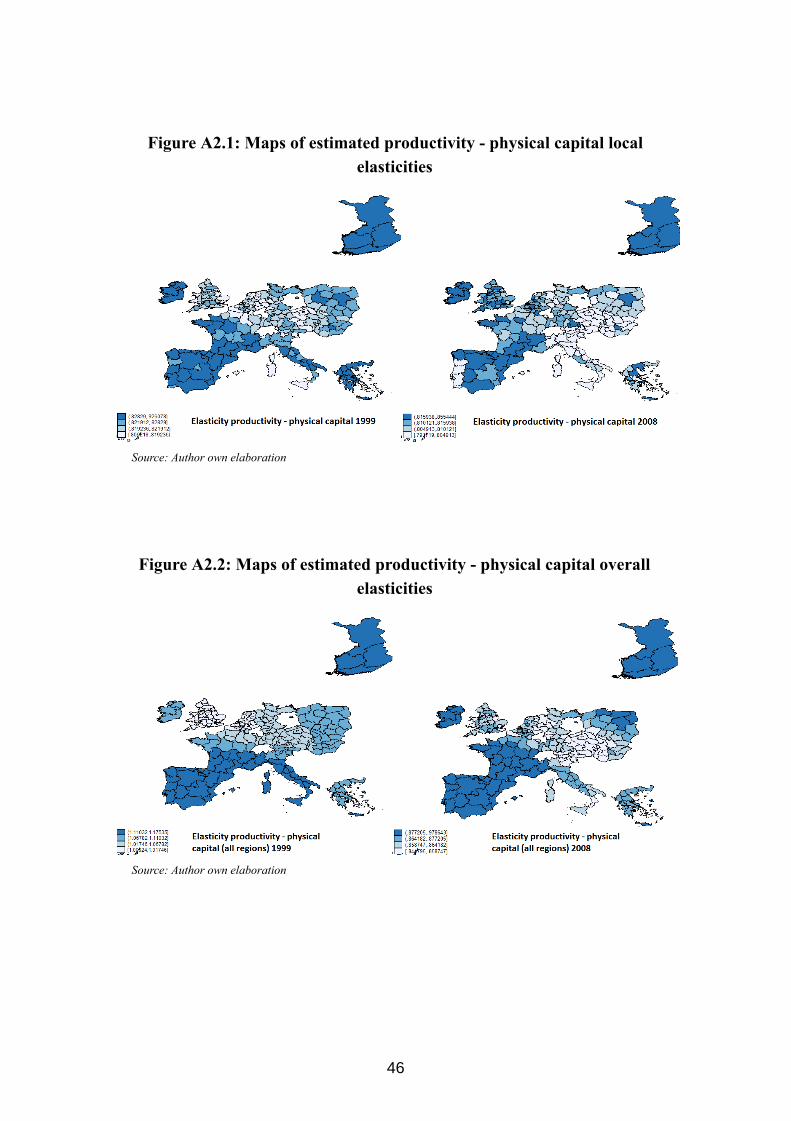
Figure A2.1: Maps of estimated productivity physical capital local elasticities
Source: Author own elaboration
Figure A2.2: Maps of estimated productivity physical capital overall elasticities
Source: Author own elaboration
46
Figure A2.3: Maps of estimated productivity human capital elasticities
Source: Author own elaboration
47

48
Chapter 3. On the regional impact of broadband on productivity: the case of Brazil 21
3.1 Introduction
Information and Communication Technologies (ICT) in general, and broadband in particular, have been extensively studied in the economic literature as a potential source for raising employment and economic growth. There are, however, some gaps in the literature that remain unfilled and that motivate the present research.
In the first place, while the bulk of the literature has focused on either at countryaggregate or firm levels, evidence of subnationalregional analysis of broadband impact on local productivity is still scarce, and mainly limited to the United States. In the second place, those empirical studies that have addressed the regional level usually have replicated the analysis performed at crossnational level, ignoring the regional perspective. For regional analysis, it is a key element to understand if broadband might have a uniform impact on productivity across the regions of a country. In that sense, if the impact of broadband on productivity is found to differ territorially inside a country, then the analysis will have to contemplate the regional dimension, intending to find out why some regions are able to extract more productivity spillovers from technology in comparison with others. The impact of broadband on productivity may depend on a variety of regional attributes, such as the quality of its network infrastructures, the presence of network externalities, and the level of development, among others.
The possibility of working at a regional scale provides some advantages.
21 Published as: Jung, J. and LópezBazo, E. (2017) On the regional impact of broadband on productivity: the case of Brazil, Working Paper 2017/08 Research Institute of Applied Economics (University of Barcelona). The author gratefully thank useful comments provided by José María Castellano and José Ignacio Antón. J.Jung acknowledges the award of a Junior Fellowship at the Institut Barcelona d’Estudis Internacionals (IBEI) to research regulation of Information and Communications Technology (ICT) in Latin America, granted by Cátedra Telefónica de Política y Regulación de las Telecomunicaciones e Internet América Latina – Europa.
49
Countrylevel analysis is usually affected by important heterogeneities across countries in terms of institutions, culture, regulations, etc. Even if some of these heterogeneities are timeinvariant (and as a result can be tackled by fixed effects), others may vary over time. In contrast to the countrylevel approach, regional analysis provides a more homogeneous framework which allows filtering for those potential heterogeneities and as a result it may allow to measure the impact of broadband on productivity more accurately.
To find out if there are differences in the regional productivity impact of broadband, additional factors will be considered as potential enablers, like connection quality and criticalmass externalities. The possibility of getting homogeneous data on download speeds provides the possibility of considering quality differentials in network infrastructures across regions. A question that motivates this approach is to find out if continuous improvements in speed levels of current connections should also constitute a priority for operators and policymakers, along with universalization.
The empirical analysis focuses in Brazil, which is an emerging country which has reached important economic growth over the last decades, prior to the current political turmoil. A recent report by Centre for Economics and Business Research (CEBR, 2013) forecasted that Brazil will become the world’s fifth largest economy in 2023, overtaking UK and Germany. Despite currently facing an economic and political crisis, the country has been able to reduce significantly the levels of poverty since 2000, combining social policies with economic growth in most of those years. As a result of its potentiality, Brazil has been classified as one of the BRICs (the others being Russia, India and China). A key of this process was the openness of its economy for foreign investment. Since the nineties when many state industries were privatized, the presence of Brazilian multinationals in the world has grown considerably, as well. Its entrance onto the world stage has been reinforced by the highprofile international events that have been hosted in the country: the football World Cup in 2014, and the Olympic Games 2016 in Rio de Janeiro.
Considering the importance of broadband as an essential infrastructure, the Federal Government of Brazil launched the "Programa Nacional de Banda
50
Larga”, with the objective of extending the provision of broadband, especially in regions lacking connectivity. The plan, launched at mid2010, targeted 40 million of connections in a period of 4 years, acting on several fronts, such as expansion of optic fiber networks and price reduction programs, including the implementation of a “popular broadband” tariff for connections of 1 Mbps per 35 Reais per month. Analysis on the implementation of this plan is out of the scope of this chapter because it was not until mid2011 that it started to be implemented in the first towns chosen by the authorities. Despite not being considered in the analysis, the present chapter may bring out some inputs to estimate the future economic impact of this initiative across the Brazilian states.
The rest of the chapter is structured as follows. The next section reviews the recent literature on ICT and broadband economic impact while section 3.3 presents a theoretical framework that serves as the basis for the econometric analysis in this study. The dataset and variables used in the analysis are introduced in section 3.4 and described in section 3.5. The results of the estimation of the effect of broadband on regional productivity are presented and discussed in section 3.6. Finally, section 3.7 briefly summarizes the main conclusions of the work, with some remarks and policy implications.
3.2 Literature review
The economic impact of infrastructures has been widely studied in the economic growth literature, following the initial contribution of Aschauer (1989), who included public capital as a productivity determinant. The impact of telecommunications infrastructure has also been studied, being Roller and Waverman (2001) an important contribution in the field. The diversity of channels through which ICT can contribute to productivity and economic growth has been extensively studied in the literature (for a complete review see, for instance, Cardona et al, 2013).
In the last few years most of ICTderived contributions to productivity has come from the development of broadband highspeed internet connections, which has been classified as a General Purpose Technology by some authors (Mack and Faggian, 2013; Czernich et al, 2011). Because of its
51
attributes, they state that the new technologies influence productivity beyond the effect of regular capital goods. According to Mack and Faggian (2013) and Jordan and De Leon (2011), broadband now constitutes a key part of the necessary infrastructure for development, in the same way as oldest types of infrastructures such as railroads, roads and electricity.
Recent empirical analysis has mainly concentrated on analyzing the broadband impact on economic growth. Czernich et al (2011) studied a sample of 25 OECD countries for the period 19962007 and found that a 10% increase in broadband penetration raises annual growth in GDP per capita by 0.91.5 percentage points. Koutroumpis (2009) studied a sample of 22 OECD countries for the period 20022007, finding that a 10% increase in broadband penetration contributed to 0.25% in GDP growth. For a sample of 120 countries, Qiang et al (2009) found that a 10% increase in broadband penetration contributed to more than 1% of increase in GDP per capita growth. As it can be seen, most empirical analyses focus on the broadband incidence on GDP growth rather than on productivity.
At a regional level, research has been much scarcer, and mostly referred to the United States. For instance, Crandall et al (2009) studied the effects of broadband deployment on output and employment in the US States for the period 20032005. They found a positive association of employment and broadband use in several industries, but were unable to find a significant association between output and broadband. Mack and Faggian (2013) analyzed the regional impact of broadband provision for the US counties, finding that it had a positive impact on productivity only when accompanied with high skills. Lehr et al (2005) studied the impact of broadband at the US communities, finding out a positive impact of broadband on economic growth.
An ongoing debate in the literature is related to the link between the new technologies and underdeveloped regions. It is believed that ICTs may open possibilities for isolated regions to overcome traditional disadvantages associated to their remote location. As a result, new technologies and internet diffusion could reduce the role played by agglomerations. Some authors even talk about the “death of distance” as a result of an eventual widespread deployment of ICTs (Cairncross, 2001). According to this view,
52
distance would be less important and peripheral regions would benefit from opportunities that were not available before (Bonaccorsi et al, 2005; Quah, 2000; Kelly, 1998; Negroponte, 1995).
In some cases, the presence of broadband infrastructure facilitates the development of poor regions, enhancing some degree of territorial equilibrium (Suriñach et al, 2007). Isolated regions may present some advantages as lower wages and housing costs, which can be fully exploited if good broadband infrastructure is available. In that case, it can attract companies to locate in these regions, especially those which can suffer from congestion costs in more developed regions, increasing demand and activity in isolated areas. This might lead to a positive spiral of increased activity that may help even people who is not a user of broadband.
Even if not related to regional analysis, Thompson and Garbacz (2011) find that broadband has a relatively more favorable economic impact in lowincome countries than in highincome countries. Similarly, Qiang et al (2009) suggested that the growth effects of broadband, as well as those of other technologies, were higher in lowincome countries than in highincome economies. According to FernándezArdèvol and Vázquez Grenno (2011), the economic impact of mobile phones was larger in Latin America than in OECD countries.
Conversely, other authors argue that the economic impact should be bigger in high income economies. For instance, for a countrylevel analysis, Katz (2012) stated that economies with lower internet penetration tend to exhibit a lesser contribution of broadband to economic growth. The reason for this statement is linked to network externalities resulting from larger broadband penetration. This criticalmass effect might lead to increasing returns to broadband penetration. Other authors argue that ICTs can exacerbate disparities between regions, both within and across countries, because regions may differ not only in ICT endowments, but also in the possibilities to make a productive use of it (Gareis and Osimo, 2004). Billón et al (2009) argue that agglomerations and internet may be complementaries rather than substitutes. According to Bonaccorsi et al (2005), disparities and inequalities seemed to be reinforced, rather than reduced, by ICT diffusion. Along with that, the importance of complementarities (e.g., ICTs and
53
human capital), sectoral composition and institutional framework may contribute to a higher economic impact in more developed economies. At the same time, the decrease of the role of distance as a result of the new technologies may be overoptimistic, referred to earlier, as only codified knowledge can be transmitted through ICTs, meaning that distance will remain to be relevant for tacit knowledge diffusion.
A relatively unstudied aspect of broadband impact is that related to differences in the quality of the infrastructure (proxied by downloading speed). A recent paper by Rohman and Bohlin (2013), based on a sample of 34 OECD countries during the period 20082010, suggests that doubling the broadband speed contributes to 0.3% growth compared with the growth rate in a base year. They performed its estimates in two stages in order to tackle concerns regarding reverse causality between broadband speed and output. The relevance of quality is explained because low transmission capacity and speed of dialup internet severely limit access to contentdense applications. Howell and Grimes (2010) argue that fast internet access is considered a productivityenhancing factor. As a result, quality of connections should also be considered as a potential factor which may contribute to regional differences in the economic impact of broadband.
All the previous arguments may give an insight that broadband should have a positive impact on productivity, and that the impact may be different across regions, even inside the same country. The possibility of performing the analysis in a big country as Brazil, which exhibits important regional inequalities, may provide a better understanding of the regional dimension of the impact of broadband in productivity, and may contribute to evaluate its suitability as an instrument for regional cohesion in emerging economies.
3.3 Theoretical framework and empirical specification
In this section we build our model on the basis of an augmented Solow (1956) framework, where economies are supposed to produce according to a CobbDouglas production function with various input factors:
54
[1] Y K L H it = Aitαit
βit
γit
represents output, K is physical capital stock, L is labour and H denotesY human capital, approximated as H = e h , where h reflects the efficiency of a unit of labour, in a similar fashion as Hall and Jones (1999). Subscripts i and t denote respectively regions and time periods. The term A represents Total Factor Productivity (TFP), which reflects differences in production efficiency across regions over time. TFP can be expressed as:
[2] A (X) BB it = Ωit itΦ
TFP is stipulated to depend on some regionspecific characteristics, represented by Ω (X) , a term which is influenced by a vector of control variables X , varying across regions and over time, and by time invariant idiosyncratic productivity effects, which may make some regions more productive per se because of unobserved characteristics. As it is supposed that broadband contributes to increase productivity, and to facilitate the development of new products and processes, and the adoption of new technologies devised by others, A is assumed to depend positively on the level broadband infrastructure denoted by BB . The stock of broadband infrastructure is used, instead of investment, because users demand infrastructure and not investment per se (Koutroumpis, 2009). A positive value for Φ is expected indicating the productivity gains derived from broadband.
The empirical specification will be derived omitting the subscripts for region and time period for the sake of simplicity. The lack of available data for statelevel physical capital stocks in Brazil require of some assumptions and rearrangements to derive a workable empirical specification. Adopting the assumption that markets are competitive, capital earns its marginal product (Romer, 2006), and thus firms in this economy will acquire physical capital until its marginal productivity equals its price, usually approximated by the real interest rate r :
55

αK L H∂K∂Y = A α 1− β γ = r
From this expression, the demand for physical capital can be derived as:
K = [ ]rαAL Hβ γ
11 α−
Inserting the derived demand for physical capital in [1], yields an expression for output which does not depend on physical capital on the righthand side:
[ ] L HY = A rαAL Hβ γ
α1 α− β γ
Under the assumption of constant returns to scale for physical capital and 22
labour, α+β=1, the previous expression can be easily manipulated to obtain a measure of labour productivity which does not depend on the stock of physical capital:
LY =
r[ ]α1 α−
α A H[ ]α1 α− [ ]1
1 α− γ[ ]11 α−
Inserting the expression for TFP in [2] and loglinearising results in:
og [ ] ]log α ]log Ω(X) ]Φlog BB ]γh ]log r l LY = [ 1
1 α− + [ 11 α− + [ 1
1 α− + [ 11 α− − [ α
1 α−
The interest rate is easily assumed to be the same across the regions because financial markets are integrated inside the country. Similarly, it is assumed as constant as the longterm rate is supposed to vary little over the time period analyzed. 23
22 This assumption has been made before in empirical research for the Brazilian case (see for instance da Silva Filho, 2002 ) 23 In any case, any difference will be absorbed by the region fixed effects.
56
Renaming the constant factor , and the Γ ]log α ]log r 0 = [11 α− − [ α
1 α− following parameters successively as Γ i , the empirical specification can be written as:
[3]og [ ] log Ω(X) log BB h l LY = Γ0 + Γ1 + Γ2 + Γ3
As a result, the empirical specification relates labour productivity to broadband, human capital, and some controls. The parameter α cannot be identified from the empirical specification, so the figure for the physical capital share in income from the Brazilian national accounts will be used to recover the structural parameters associated to broadband: Φ = Γ 2 (1 α). 24
The previous specification is a sort of baseline empirical model that is useful to obtain a commonregional measure of the impact of broadband on productivity, but is inappropriate to explore the existence of differences across regions in the impact. As a result, the empirical exercise in this chapter will consider further strategies which will require of slight modifications to the TFP term expressed in [2]. On the one hand, the economic impact of broadband may vary depending on other characteristics of the infrastructure, such as the quality of the connection, and the presence of network externalities. Similarly, as stated in the literature review, broadband may have a different impact depending on the degree of economic development of the region. To explore these matters, we will consider a more general expression for [2] to account for heterogeneities in the effect of broadband on productivity:
[2´](X) BB A = Ω (δ +δ Z)0 1
where Z refers to the set of factors which may have an incidence on the economic impact of broadband, to be defined on course, and the vector of parameters δ 1 reflects the incidence of the other factors in interaction with
24 It is important to note that this implies a return to physical capital which is common to all regions. Lack of constraints in the interregional mobility of capital in Brazil favours such assumption, although severe differences in the industrial mix could lead to cast some doubts under imperfect intersectoral mobility. This issue will be further discussed in section 3.6.
57
broadband. The procedure to derive the empirical specification and the strategy for recovering structural parameters is similar to that indicated in the baseline model.
The availability of a panel data set for the Brazilian states allows to account for region fixed effects, or in other words to control for timeinvariant unobserved region characteristics. As a result, the pernicious influence of confounding factors omitted in the specification (e.g. the effect of geography and differences across regions in managerial talent that evolves smoothly over time) is less a concern in our empirical exercise. Still, a common critique of ICT and broadband estimations is that the results could determine correlation rather than a causal effect on productivity, because investment in ICT may be considered as a driver, but also a result of productivity and economic growth (Cardona et al, 2013). This likely reverse causality may arise because individuals and firms in highincome economies may also have higher resources to pay for broadband. Some authors exploit the structure of panel data by using lagged variables for ICT (Bloom et al, 2010; Hempell, 2005; Tambe and Hitt, 2001; Brynjolfsson and Hitt, 1995). Other strategies may be structural multiequation models (Röller and Waverman, 2001; Koutroumpis, 2009), and Instrumental Variables estimation (IV), with a firststage diffusion equation (Bertschek et al, 2013; Czernich et al, 2011). In this study, we take the latter approach. 25
Bertschek et al (2013) firmlevel analysis uses ADSL availability as an instrument for broadband. Their results suggested that the IV approach resulted in higher coefficients for broadband incidence in productivity, although less precise than OLS as the standard errors increase, leaving the broadband coefficient as weakly significant. In Czernich et al (2011) countrylevel analysis uses fixedline voice telephony and Cable TV preexisting networks as instruments for broadband. Its estimations suggested that IV results are slightly larger than OLS, concluding that OLS regressions are downward biased.
Following Czernich et al (2011), in the empirical exercise we will build on
25 We decided not to use lagged values of the broadband measure due to the high persistence in this variable.
58
the idea that most common broadband rollout (i.e.: ADSL or Cable Modem) rely on the copper wire of preexisting voicetelephony networks. As stated by Czernich, the required access to an existing infrastructure built for other purposes, such as that of fixed telephony, make this a suitable instrument for this estimation strategy. The instrument in this case is the number of voicetelecommunication fixed access lines per 100 inhabitants with a fiveyear lag. In addition, as broadband deployments may depend on demographic factors, population density will be added as instrument, but using variables from the beginning of the last century (census performed between years 1920 and 1950). The instruments were lagged considerably to break any possibility of being affected by contemporary shocks. That is to say, to guarantee that the exclusion restriction are meet which implies that the measure of density does not affect in a direct way the region’s productivity but only indirectly through its effect on BB .
3.4 Dataset and variables
To test the effect of broadband connections on regional productivity, this study estimates the key parameters of the empirical model sketched in the previous section using data from the 27 Brazilian states (including Brasilia D.F.) in the period from 2007 to 2011. Table 3.1 provides the precise definition and source of the key variables to be used in the empirical analysis. As for the dependent variable, labour productivity is computed as the ratio of Gross Value Added (GVA) to employment in each state and year. GVA, that subtracts intermediate inputs from the gross output, is usually considered a more accurate measure of the actual surplus created by the regional economy (Cardona et al, 2013). The data, extracted from the Instituto Brasileiro de Geografia e Estatística (IBGE) database, is deflated to 2000 constant Reais prices. Data for the workforce, total number of workers in each state, comes from the Instituto de Pesquisa Econômica Aplicada (IPEA). For cases of missing 2010 employment information, interpolation using data for 2009 and 2011 was used to fulfill the gaps.
Regarding the key variable in the study, broadband, some preliminary comments are in order. Considering the importance of ICT to increase the
59
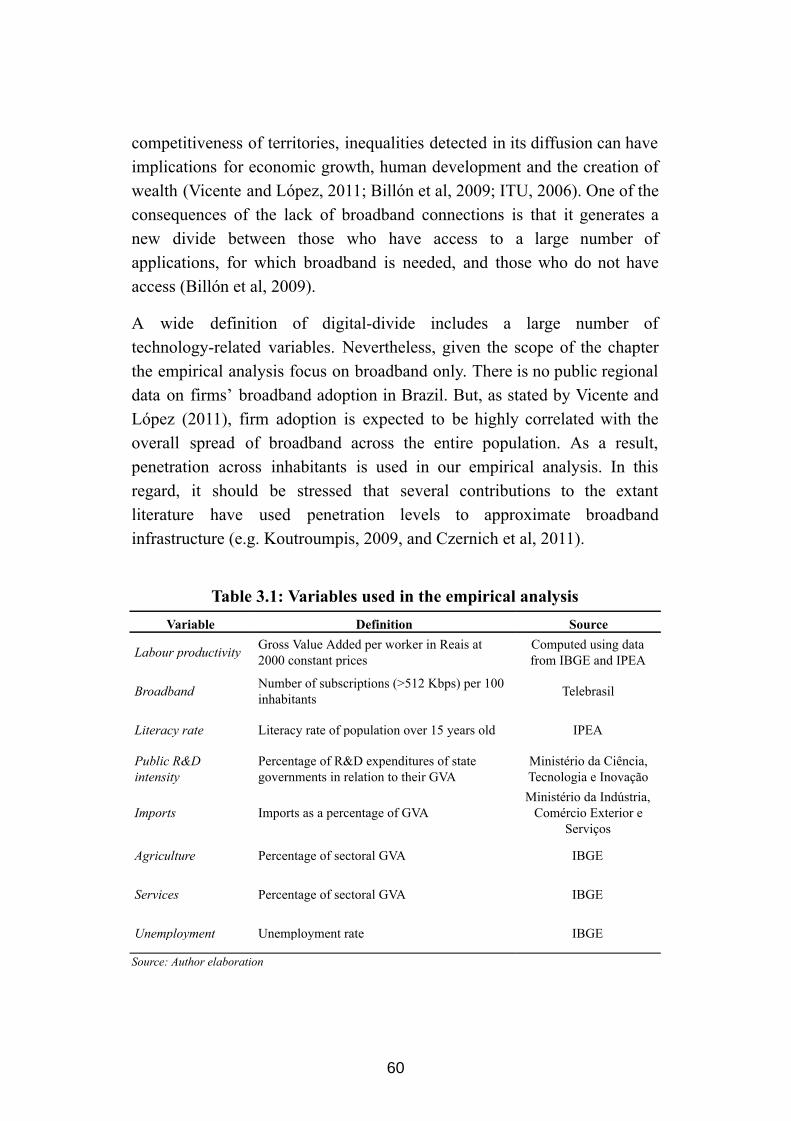
competitiveness of territories, inequalities detected in its diffusion can have implications for economic growth, human development and the creation of wealth (Vicente and López, 2011; Billón et al, 2009; ITU, 2006). One of the consequences of the lack of broadband connections is that it generates a new divide between those who have access to a large number of applications, for which broadband is needed, and those who do not have access (Billón et al, 2009).
A wide definition of digitaldivide includes a large number of technologyrelated variables. Nevertheless, given the scope of the chapter the empirical analysis focus on broadband only. There is no public regional data on firms’ broadband adoption in Brazil. But, as stated by Vicente and López (2011), firm adoption is expected to be highly correlated with the overall spread of broadband across the entire population. As a result, penetration across inhabitants is used in our empirical analysis. In this regard, it should be stressed that several contributions to the extant literature have used penetration levels to approximate broadband infrastructure (e.g. Koutroumpis, 2009, and Czernich et al, 2011).
Table 3.1: Variables used in the empirical analysis
Variable Definition Source
Labour productivity Gross Value Added per worker in Reais at 2000 constant prices
Computed using data from IBGE and IPEA
Broadband Number of subscriptions (>512 Kbps) per 100 inhabitants Telebrasil
Literacy rate Literacy rate of population over 15 years old IPEA
Public R&D intensity
Percentage of R&D expenditures of state governments in relation to their GVA
Ministério da Ciência, Tecnologia e Inovação
Imports Imports as a percentage of GVA Ministério da Indústria, Comércio Exterior e
Serviços
Agriculture Percentage of sectoral GVA IBGE
Services Percentage of sectoral GVA IBGE
Unemployment Unemployment rate IBGE
Source: Author elaboration
60
Broadband is defined as internet access provided at a certain high level of speed capacity (considering the standards for the period under analysis). In Brazil, most internet available at the end of the 90s and beginning of the 2000s were based on slow dialup connections, which imposed restrictions for its usability and ability to make full use and take full advantage of internet applications. The introduction of broadband allowed the possibility of exploiting internet full potential. The OECD in 2006, and the 26
International Telecommunications Union (ITU) in 2007 defined 27
broadband as those internet connections with speeds above 256 Kbps. In this case, Telebrasil (the Brazilian Association of Telecommunications) classified internet connections by speed considering a threshold of 512 Kbps. Therefore, for the purpose of this research, only broadband connections that reach at least 512 Kbps or more were considered for the study. In our opinion this constitutes a much more realistic approximation for broadband than that based on a threshold of 256 Kbps, which hardly served for the most advanced applications during the period under analysis. As a result, Broadband is defined as the number of connections above the 512 Kbps threshold per 100 inhabitants in the region.
As for human capital, it is proxied by the literacy rate, which despite being a measure of the basic skills of the population, is appropriate in our study as they are far from being universal in the case of the Brazilian regions. 28
Finally, as stated before, TFP is assumed to depend on some regionspecific characteristics. Most of them may surely constitute time invariant regional features, such as idiosyncrasy, culture, geographic location, climate, natural resources, etc. Therefore, region fixed effects are expected to capture all
26 http://www.oecd.org/sti/broadband/oecdbroadbandstatisticstodecember2006.htm 27 https://www.itu.int/ITUD/ict/material/IndDef_e_v2007.pdf 28 As stated by Caselli (2005), more conventional measures of human capital as data on years of schooling for population over 25 years old may seem appropriate for developed countries with a large share of college graduates, but it is not appropriate for most developing countries. In order to proxy for more advanced skill levels than literacy rate, we also considered to add school enrollment from the population aged between 15 and 17 years old (lagged 5years), but its coefficient was always insignificant while the main results remained unchanged.
61
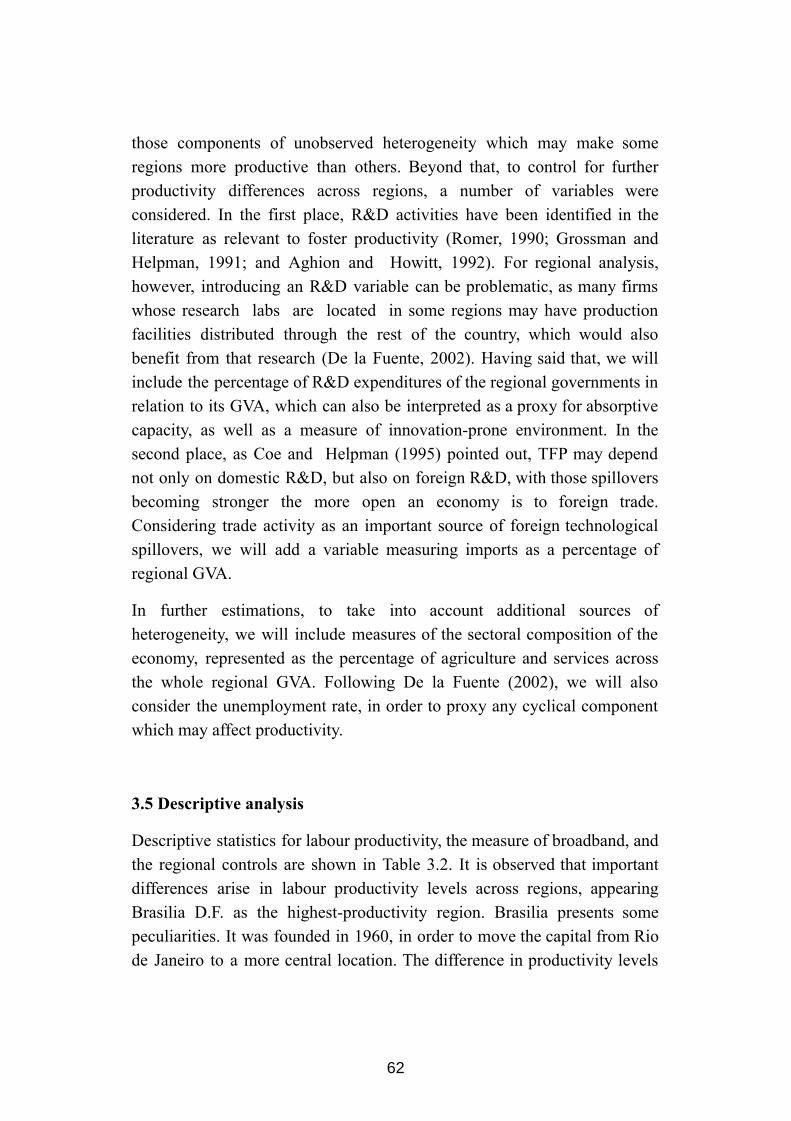
those components of unobserved heterogeneity which may make some regions more productive than others. Beyond that, to control for further productivity differences across regions, a number of variables were considered. In the first place, R&D activities have been identified in the literature as relevant to foster productivity (Romer, 1990; Grossman and Helpman, 1991; and Aghion and Howitt, 1992). For regional analysis, however, introducing an R&D variable can be problematic, as many firms whose research labs are located in some regions may have production facilities distributed through the rest of the country, which would also benefit from that research (De la Fuente, 2002). Having said that, we will include the percentage of R&D expenditures of the regional governments in relation to its GVA, which can also be interpreted as a proxy for absorptive capacity, as well as a measure of innovationprone environment. In the second place, as Coe and Helpman (1995) pointed out, TFP may depend not only on domestic R&D, but also on foreign R&D, with those spillovers becoming stronger the more open an economy is to foreign trade. Considering trade activity as an important source of foreign technological spillovers, we will add a variable measuring imports as a percentage of regional GVA.
In further estimations, to take into account additional sources of heterogeneity, we will include measures of the sectoral composition of the economy, represented as the percentage of agriculture and services across the whole regional GVA. Following De la Fuente (2002), we will also consider the unemployment rate, in order to proxy any cyclical component which may affect productivity.
3.5 Descriptive analysis
Descriptive statistics for labour productivity, the measure of broadband, and the regional controls are shown in Table 3.2. It is observed that important differences arise in labour productivity levels across regions, appearing Brasilia D.F. as the highestproductivity region. Brasilia presents some peculiarities. It was founded in 1960, in order to move the capital from Rio de Janeiro to a more central location. The difference in productivity levels
62
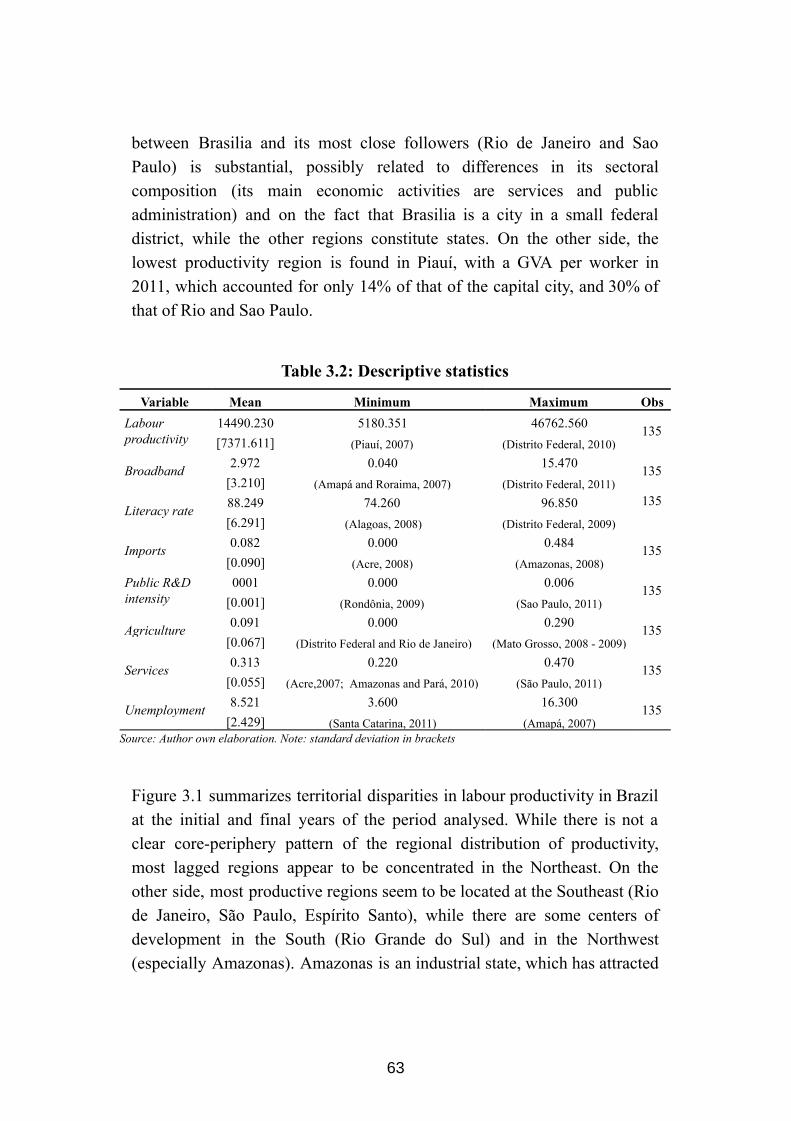
between Brasilia and its most close followers (Rio de Janeiro and Sao Paulo) is substantial, possibly related to differences in its sectoral composition (its main economic activities are services and public administration) and on the fact that Brasilia is a city in a small federal district, while the other regions constitute states. On the other side, the lowest productivity region is found in Piauí, with a GVA per worker in 2011, which accounted for only 14% of that of the capital city, and 30% of that of Rio and Sao Paulo.
Table 3.2: Descriptive statistics
Variable Mean Minimum Maximum Obs Labour productivity
14490.230 5180.351 46762.560 135 [7371.611] (Piauí, 2007) (Distrito Federal, 2010)
Broadband 2.972 0.040 15.470 135 [3.210] (Amapá and Roraima, 2007) (Distrito Federal, 2011)
Literacy rate 88.249 74.260 96.850 135 [6.291] (Alagoas, 2008) (Distrito Federal, 2009)
Imports 0.082 0.000 0.484 135 [0.090] (Acre, 2008) (Amazonas, 2008)
Public R&D intensity
0001 0.000 0.006 135 [0.001] (Rondônia, 2009) (Sao Paulo, 2011)
Agriculture 0.091 0.000 0.290 135 [0.067] (Distrito Federal and Rio de Janeiro) (Mato Grosso, 2008 2009)
Services 0.313 0.220 0.470 135 [0.055] (Acre,2007; Amazonas and Pará, 2010) (São Paulo, 2011)
Unemployment 8.521 3.600 16.300 135 [2.429] (Santa Catarina, 2011) (Amapá, 2007)
Source: Author own elaboration. Note: standard deviation in brackets
Figure 3.1 summarizes territorial disparities in labour productivity in Brazil at the initial and final years of the period analysed. While there is not a clear coreperiphery pattern of the regional distribution of productivity, most lagged regions appear to be concentrated in the Northeast. On the other side, most productive regions seem to be located at the Southeast (Rio de Janeiro, São Paulo, Espírito Santo), while there are some centers of development in the South (Rio Grande do Sul) and in the Northwest (especially Amazonas). Amazonas is an industrial state, which has attracted
63
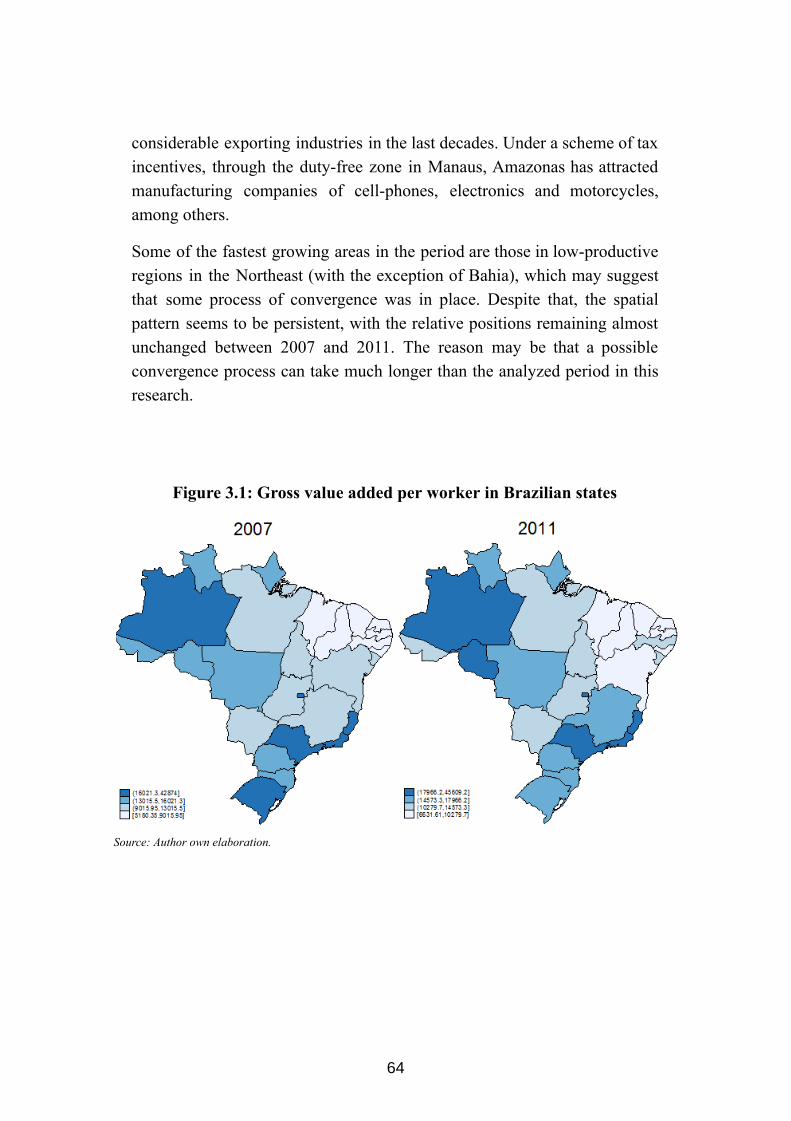
considerable exporting industries in the last decades. Under a scheme of tax incentives, through the dutyfree zone in Manaus, Amazonas has attracted manufacturing companies of cellphones, electronics and motorcycles, among others.
Some of the fastest growing areas in the period are those in lowproductive regions in the Northeast (with the exception of Bahia), which may suggest that some process of convergence was in place. Despite that, the spatial pattern seems to be persistent, with the relative positions remaining almost unchanged between 2007 and 2011. The reason may be that a possible convergence process can take much longer than the analyzed period in this research.
Figure 3.1: Gross value added per worker in Brazilian states
Source: Author own elaboration.
64
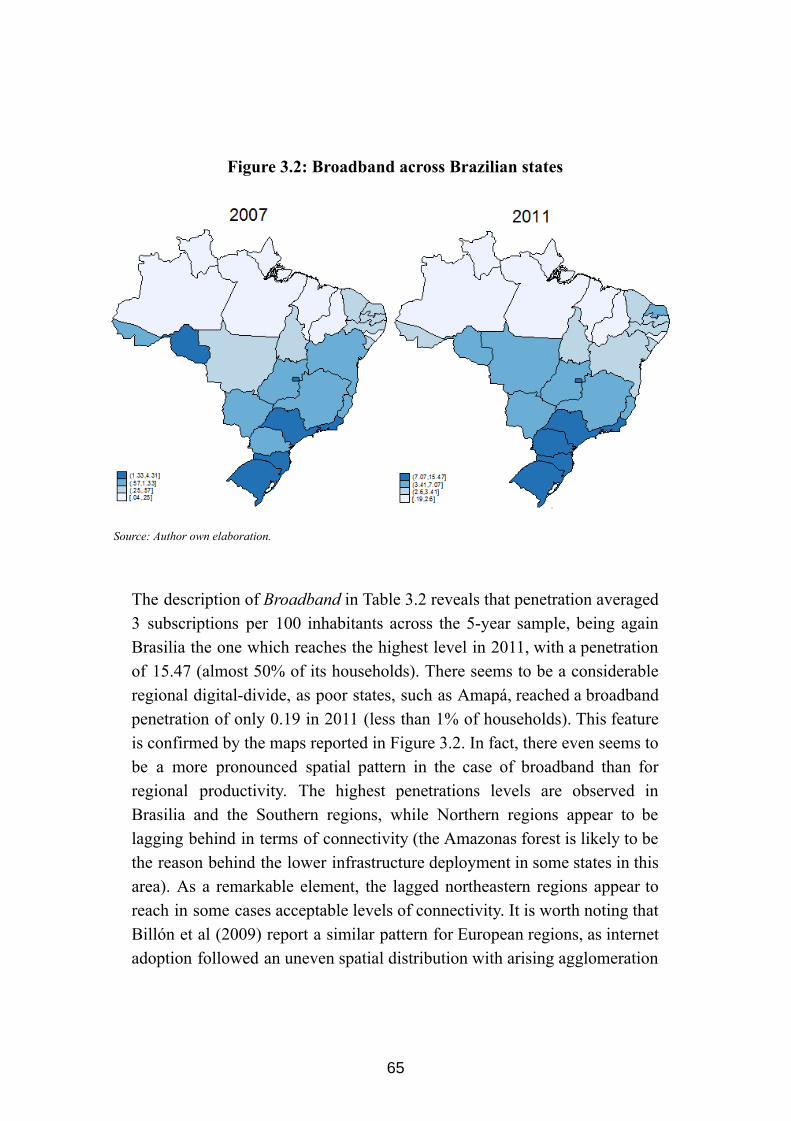
Figure 3.2: Broadband across Brazilian states
Source: Author own elaboration.
The description of Broadband in Table 3.2 reveals that penetration averaged 3 subscriptions per 100 inhabitants across the 5year sample, being again Brasilia the one which reaches the highest level in 2011, with a penetration of 15.47 (almost 50% of its households). There seems to be a considerable regional digitaldivide, as poor states, such as Amapá, reached a broadband penetration of only 0.19 in 2011 (less than 1% of households). This feature is confirmed by the maps reported in Figure 3.2. In fact, there even seems to be a more pronounced spatial pattern in the case of broadband than for regional productivity. The highest penetrations levels are observed in Brasilia and the Southern regions, while Northern regions appear to be lagging behind in terms of connectivity (the Amazonas forest is likely to be the reason behind the lower infrastructure deployment in some states in this area). As a remarkable element, the lagged northeastern regions appear to reach in some cases acceptable levels of connectivity. It is worth noting that Billón et al (2009) report a similar pattern for European regions, as internet adoption followed an uneven spatial distribution with arising agglomeration
65
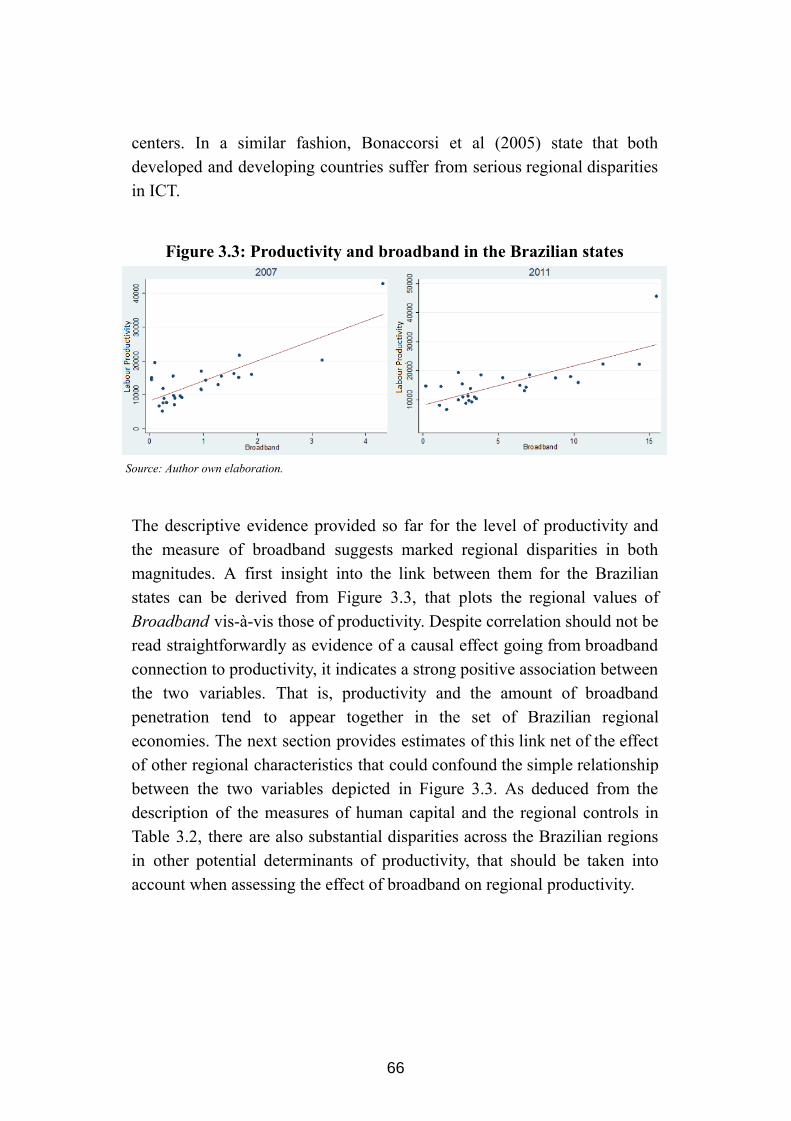
centers. In a similar fashion, Bonaccorsi et al (2005) state that both developed and developing countries suffer from serious regional disparities in ICT.
Figure 3.3: Productivity and broadband in the Brazilian states
Source: Author own elaboration.
The descriptive evidence provided so far for the level of productivity and the measure of broadband suggests marked regional disparities in both magnitudes. A first insight into the link between them for the Brazilian states can be derived from Figure 3.3, that plots the regional values of Broadband visàvis those of productivity. Despite correlation should not be read straightforwardly as evidence of a causal effect going from broadband connection to productivity, it indicates a strong positive association between the two variables. That is, productivity and the amount of broadband penetration tend to appear together in the set of Brazilian regional economies. The next section provides estimates of this link net of the effect of other regional characteristics that could confound the simple relationship between the two variables depicted in Figure 3.3. As deduced from the description of the measures of human capital and the regional controls in Table 3.2, there are also substantial disparities across the Brazilian regions in other potential determinants of productivity, that should be taken into account when assessing the effect of broadband on regional productivity.
66
3.6 Results
Baseline specification
This section presents and discusses the results of the estimation of the effect of broadband on productivity in the Brazilian regions, using the specifications described in section 3.3. As mentioned in that section, it is not possible to identify α directly from the estimated coefficients. To do so, additional information on the capital share in income from the Brazilian economy is used. In that sense, Feenstra et al (2015), using the Penn World Table data (PWT), find that the labour share in the income of Brazil averaged 0.55 in the period 20072011. Under the assumption of constant returns to scale, this implies α=0.45, value that will be used to recover the structural parameter of interest. Table 3.3 reports estimates of the baseline model that assumes no interaction between broadband penetration and regional attributes.
Column (i) in Table 3.3 reports the Ordinary Least Squares (OLS) results for the baseline model. The coefficient of Broadband is found to be highly significant and sizeable in magnitude. The implied estimated effect, Φ, suggests that a 10% increase in broadband penetration improved regional productivity by 0.2%. To assess the magnitude of this effect is worthwhile taking into consideration that the overall average of Broadband in the sample is 3 connections per 100 inhabitants, the 10% increase represents moving that value up to 3.3 connections per 100 inhabitants. As for the estimate of the coefficients of the other regressors, it is obtained a positive and significant (at 5%) effect of the literacy rate on productivity. This suggests that differences in the endowment of basic skills in the population contribute to explaining productivity disparities among brazilian regions. On the other hand, conditional to the other observable and unobservable regional characteristics, public spending in R&D as a percentage of the region’s GVA does not exert a significant effect on productivity. In contrast, the effect of the relative amount of regional imports is positive and significant, which suggests that more open regions benefit from foreign R&D embodied in traded goods and, as a result, tend to be more productive.
67
Table 3.3: Estimation of the baseline model
Estimation (i) (ii) (iii) (iv)
Iog(Broadband) 0.037*** 0.036*** 0.030** 0.030** [0.013] [0.012] [0.015] [0.013]
Literacy rate 0.022** 0.022** 0.024*** 0.024*** [0.008] [0.008] [0.008] [0.008]
Imports 0.599** 0.545** 0.608** 0.545** [0.242] [0.246] [0.239] [0.231]
Public R&D intensity 0.327 0.262 0.334 0.261 [0.258] [0.274] [0.225] [0.228]
Agriculture 0.189 0.213 [0.444] [0.420]
Services 1.024** 1.021*** [0.470] [0.367]
Unemployment 0.000 0.001 [0.005] [0.004]
Implied Φ 0.020 0.020 0.017 0.017
Observations 135 135 132 132 Rsquared 0.643 0.670 0.537 0.572 Method OLS OLS IV IV
Weak identification test 62.183 60.239 Overid test statistic 1.731 2.598 Source: Author analysis. Notes: *p<10%, **p<5%, ***p<1%. Robust standard errors in brackets. All estimates include region fixed effects. Instruments for Broadband in IV: telephone fixed voice lines per 100 inhabitants (lagged 5 years), and population density at the beginning of the XX century (census 19201950). First step estimates for columns (iii) and (iv) in Table A3.1 are in the Appendix. StockYogo weak identification test critical values: 8.68 (10% maximal LIML size).
Although the magnitude of this estimate of the effect of broadband penetration is similar to that in other empirical studies in the literature, additional estimations will be performed to evaluate its robustness. In the first place, column (ii) in Table 3.3 includes additional regressors, with the aim of controlling for the existence of further regional specific differences in Ω. Particularly, three additional variables are included: the sectoral composition (percentages of agricultural and service activities in local GVA) and the unemployment rate, as a proxy for any cyclical component which may affect productivity. Results in column (ii) reveal that only the coefficient of the share of services in total GVA is statistically significant and, most importantly, that the inclusion of these controls does not alter the
68
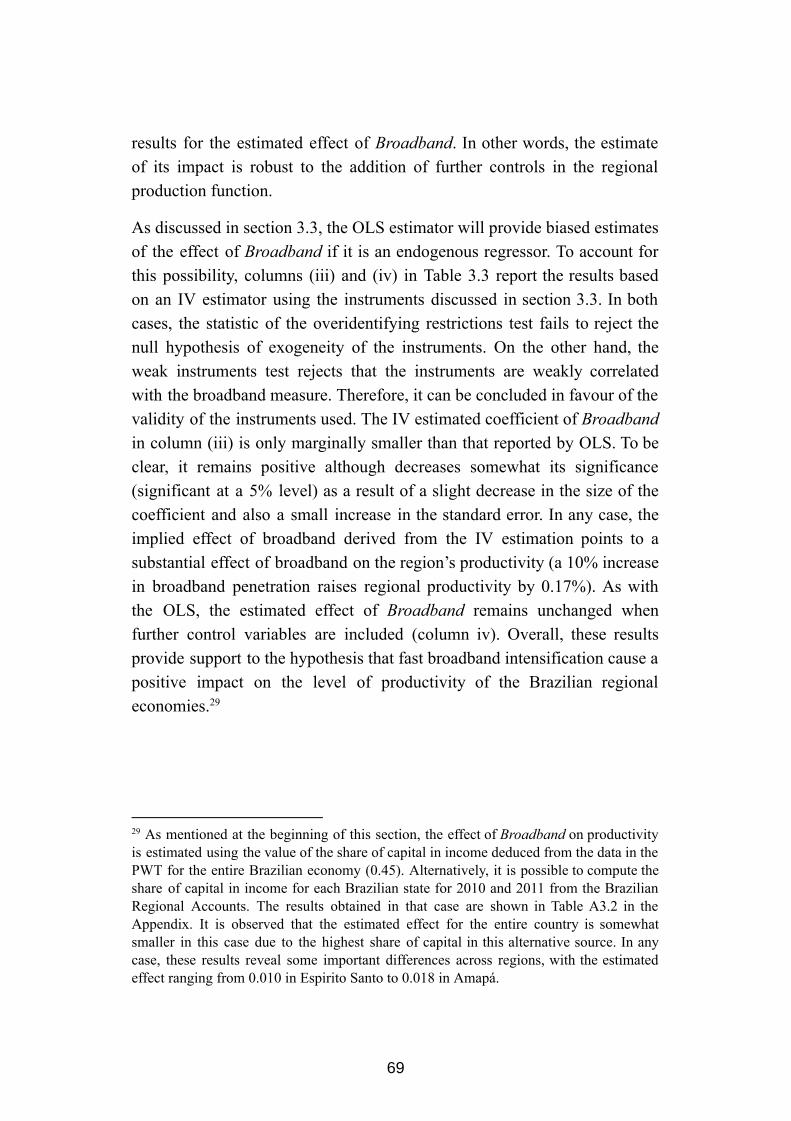
results for the estimated effect of Broadband . In other words, the estimate of its impact is robust to the addition of further controls in the regional production function.
As discussed in section 3.3, the OLS estimator will provide biased estimates of the effect of Broadband if it is an endogenous regressor. To account for this possibility, columns (iii) and (iv) in Table 3.3 report the results based on an IV estimator using the instruments discussed in section 3.3. In both cases, the statistic of the overidentifying restrictions test fails to reject the null hypothesis of exogeneity of the instruments. On the other hand, the weak instruments test rejects that the instruments are weakly correlated with the broadband measure. Therefore, it can be concluded in favour of the validity of the instruments used. The IV estimated coefficient of Broadband in column (iii) is only marginally smaller than that reported by OLS. To be clear, it remains positive although decreases somewhat its significance (significant at a 5% level) as a result of a slight decrease in the size of the coefficient and also a small increase in the standard error. In any case, the implied effect of broadband derived from the IV estimation points to a substantial effect of broadband on the region’s productivity (a 10% increase in broadband penetration raises regional productivity by 0.17%). As with the OLS, the estimated effect of Broadband remains unchanged when further control variables are included (column iv). Overall, these results provide support to the hypothesis that fast broadband intensification cause a positive impact on the level of productivity of the Brazilian regional economies. 29
29 As mentioned at the beginning of this section, the effect of Broadband on productivity is estimated using the value of the share of capital in income deduced from the data in the PWT for the entire Brazilian economy (0.45). Alternatively, it is possible to compute the share of capital in income for each Brazilian state for 2010 and 2011 from the Brazilian Regional Accounts. The results obtained in that case are shown in Table A3.2 in the Appendix. It is observed that the estimated effect for the entire country is somewhat smaller in this case due to the highest share of capital in this alternative source. In any case, these results reveal some important differences across regions, with the estimated effect ranging from 0.010 in Espirito Santo to 0.018 in Amapá.
69
Regional heterogeneity in the effect of broadband
Once the impact of broadband on the productivity of the Brazilian regional economies has been verified, it seems interesting to assess whether the impact is uniform across states or if, on the contrary, it varies with some characteristics of the infrastructure and with the level of development of the territorial units. With this aim, the empirical model is modified to accommodate the TFP function in equation [2´]. In the first place, it is assumed that there is a certain criticalmass required to get benefits from network externalities. To be clear, the TFP function in [2´] is specified as:
(X) BB A = Ω (δ +δ Mass)0M
1M
where Mass is a binary variable defined as a function of a given threshold of broadband penetration: it equals 1 for regions with level of penetration above the threshold, and 0 otherwise. To define the threshold, it should be taken into account that even the lowest thresholds considered in previous studies for the OECD countries were found to be far above from the Brazilian standards during the period under analysis. Therefore, after 30
analysing the distribution of the values of the variable, a minimum threshold of 6% penetration is adopted, a level which means approximately 20% of households with broadband connection. Under this specification, 31
regions in which penetration was below this threshold are supposed to get no productivity gains of increases in Broadband. It is when reaching the threshold that improvements in Broadband start leading to higher productivity in the region. Therefore, we expect δ 1 M > 0. 32
Another important aspect that could shape the impact of broadband on regional productivity is the existence of differentials in the quality of connections. To approximate quality, following Rohman and Bohlin (2013), the measure to be used is the average speed of connections in the region.
30 For instance, Koutroumpis (2009) considers as critical the threshold of 20% penetration per inhabitant, while Czernich et al (2011) measure network externalities from a 10% level. 31 The average size of Brazilian households is 3.2 persons. 32 16% of the observations in the sample are above the threshold ( Mass =1). The percentage increased over the analysed period from 0% in 2007 to 37% in 2011.
70
Available data from Telebrasil allows considering differences in average bandwidths across regions. Broadband download average speed is constructed with data which classifies subscriptions to different groups depending on its speed. More precisely, it is obtained by summing the average speed for each interval weighted by the corresponding penetration level. The description of this variable, Quality , is in Table A3.3 and Figure 33
A3.1 of the Appendix.
In this case, the specification of equation [2´] is as follows:
(X) BB A = Ω (δ +δ Quality)0Q 1
Q
The moderating effect of the average quality of connections in the region is hypothesised to be positive, i.e. δ 1 Q > 0. In other words, for two regions with
the same relative amount of broadband connections, we expect to observe a higher impact on productivity for the regions with higher average speeds.
The results of the IV estimation of the parameters of the specifications allowing for these types of heterogeneities in the effect of Broadband are reported in the first block of columns in Table 3.4. In both cases, two 34
groups of instruments have been used to account for the interaction between the corresponding variable ( Mass or Quality ) and (the log of) Broadband . In the first place –columns (i) and (iii)–, the interaction between the variable and the two instruments used before are added to the list of instruments. This assumes that Mass and Quality are exogenous regressors. Since the instruments based on the interactions would not be appropriate if Mass and
33 Telebrasil offers data on fixed broadband connections across the following speed intervals: (1) 512 Kbps 2 Mbps; (2) 2 Mbps 34 Mbps; and (3) higher than 34 Mbps. The formula for computing average download speed for region i at time t is: Quality it =1.25*[BB(1) it ]+18*[BB(2) it ]+50*[BB(3) it ], where BB(i) refer to share of connections in speed interval i (=1, 2, 3). Assigned speed values for intervals (1) and (2) correspond to the mean of the corresponding interval. Speed for the interval (3) is rightcensored, and the election of 50 mbps is somewhat arbitrary, although results are not sensible to different approximations. The equivalence formula is 1 Mbps = 1024 Kbps. 34 Only the specification that does not include the sector and unemployment controls is considered in this subsection given that their addition to the list of regressors does not modify the estimate of the key parameters. The corresponding results are available upon request.
71
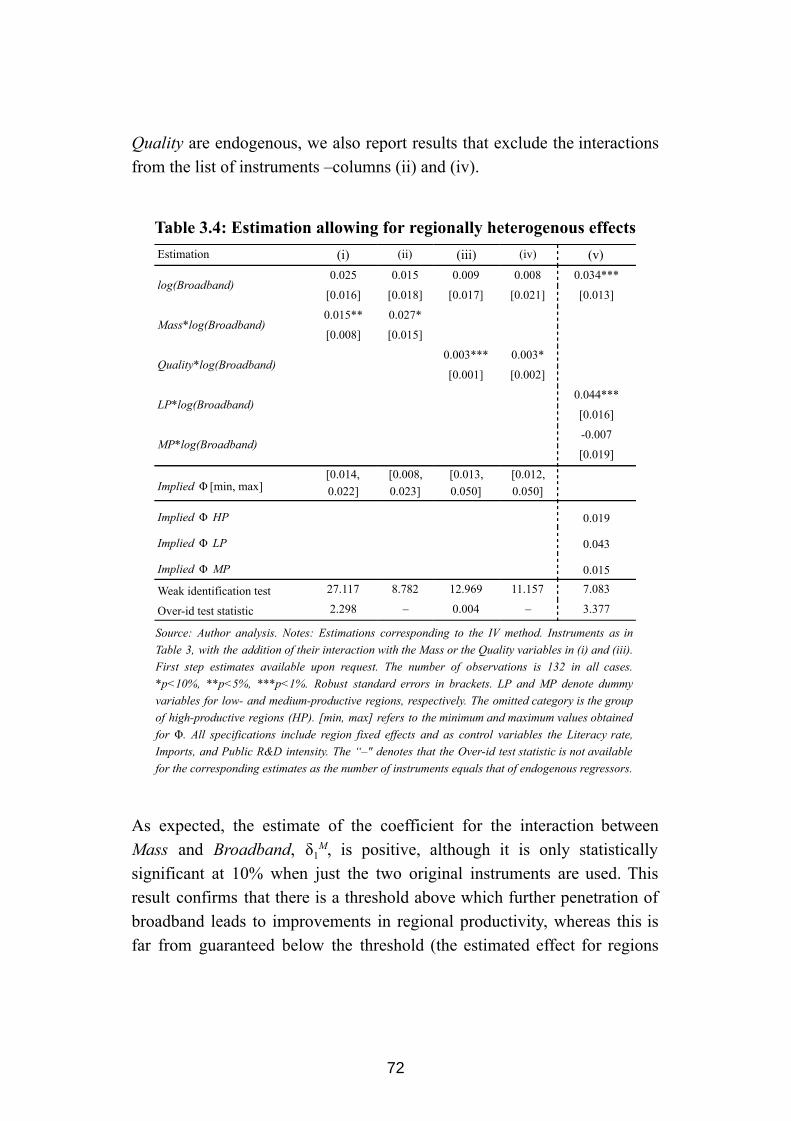
Quality are endogenous, we also report results that exclude the interactions from the list of instruments –columns (ii) and (iv).
Table 3.4: Estimation allowing for regionally heterogenous effects
Estimation (i) (ii) (iii) (iv) (v)
log(Broadband) 0.025 0.015 0.009 0.008 0.034***
[0.016] [0.018] [0.017] [0.021] [0.013]
Mass*log(Broadband) 0.015** 0.027* [0.008] [0.015]
Quality*log(Broadband) 0.003*** 0.003*
[0.001] [0.002]
LP*log(Broadband) 0.044***
[0.016]
MP*log(Broadband) 0.007
[0.019]
Implied [min, max]Φ [0.014, 0.022]
[0.008, 0.023]
[0.013, 0.050]
[0.012, 0.050]
Implied HPΦ 0.019
Implied LPΦ 0.043
Implied MPΦ 0.015
Weak identification test 27.117 8.782 12.969 11.157 7.083
Overid test statistic 2.298 – 0.004 – 3.377
Source: Author analysis. Notes: Estimations corresponding to the IV method. Instruments as in Table 3, with the addition of their interaction with the Mass or the Quality variables in (i) and (iii). First step estimates available upon request. The number of observations is 132 in all cases. *p<10%, **p<5%, ***p<1%. Robust standard errors in brackets. LP and MP denote dummy variables for low and mediumproductive regions, respectively. The omitted category is the group of highproductive regions (HP). [min, max] refers to the minimum and maximum values obtained for Φ . All specifications include region fixed effects and as control variables the Literacy rate, Imports, and Public R&D intensity. The “–" denotes that the Overid test statistic is not available for the corresponding estimates as the number of instruments equals that of endogenous regressors.
As expected, the estimate of the coefficient for the interaction between Mass and Broadband , δ 1 M , is positive, although it is only statistically significant at 10% when just the two original instruments are used. This result confirms that there is a threshold above which further penetration of broadband leads to improvements in regional productivity, whereas this is far from guaranteed below the threshold (the estimated effect for regions
72

below the threshold, i.e. Mass =0, is not statistically significant).
As for the moderating effect of quality, results confirm the hypothesis that the impact of Broadband is increasing with the average speed in the region. At the overall average speed in the sample, the implied Φ is estimated at 0.022, whereas it takes a value of 0.013 and 0.050 at the minimum and maximum values of speed, respectively. That is to say, the impact of broadband on productivity is fourfold in the region with the highest average speed with respect to the one in the region in which the average speed was the lowest. This confirms that quality of the connection matters for the impact of broadband on productivity. As in the case of the interaction 35
involving Mass , there is a decrease in the significance of the coefficient of the interaction when only the original instruments are used. This seems to be caused by the higher standard error as the magnitude of the coefficient remains the same in the two estimations.
Table 3.5: Region clustering according to productivity
LowProductive regions MediumProductive regions HighProductive regions Piauí Tocantins Mato Grosso
Maranhão Goiás Rondônia Ceará Pará Santa Catarina Paraíba Mato Grosso do Sul Espírito Santo Alagoas Minas Gerais Rio Grande do Sul
Rio Grande do Norte Acre Amazonas Bahia Amapá Rio de Janeiro
Pernambuco Paraná São Paulo Sergipe Roraima Distrito Federal
Source: Author elaboration
Finally, we explore the relationship between the size of the effect of Broadband and the level of development in the region. The hypothesis is that more peripheral regions, with lower density of economic activity and, thus, less developed, may obtain higher productivity gains from broadband
35 Consistent with the specification, the estimate of the coefficient of log(Broadband) in columns (iii) and (iv) is not statistically different from zero. This is the expected effect when the average speed in the region is zero.
73
connections as this technology will allow economic agents in that regions to keep away from some of the costs of peripherality, making location in the region more attractive for production. To test this hypothesis, regions are classified in three groups according to the level of development, measured through the average GVA per worker in the period under analysis. The composition of the three groups is shown in Table 3.5. Based on this classification, binary variables were created to identify the regions belonging to each group ( LP , MP and HP for low, medium, and highproductive, respectively).
Using this information, the specification of equation [2´] is defined as:
(X) BB A = Ω (δ +δ MP+δ LP ) HP
MP
LP
where measures the effect of Broadband for the group of most δ HP developed regions, and that for the other two groups is obtained by adding the corresponding parameter, δ MP or δ LP . A conspicuous way of checking the hypothesis under analysis is testing that δ MP = δ LP = 0. The last column in Table 3.4 summarises the results of the IV estimation of this specification. They confirm that important differences among regions do in fact exist, and that they are linked to the level of development. All regions benefit from broadband, but the less developed appear to obtain much larger productivity gains through broadband than medium and highly developed regions. To be clear, the increase in regional productivity induced by increasing broadband penetration by 10% is estimated to be 0.19% and 0.15%, respectively, in the groups of regions with high and medium levels of development, while it raises up to 0.43% in the group of the less developed Brazilian regions. Therefore, on average, these results suggests that the impact of broadband on productivity is particularly high for regional economies with low levels of productivity and, therefore, of development, and declines to about the half as regions become more developed. Overall, these results support the hypothesis in this chapter about the regionally differentiated impact of broadband on productivity.
74
3.7 Conclusions
This chapter has aimed to provide robust evidence on the impact of broadband on productivity in Brazil and, particularly, on the fact that these effects are not uniform across the territory. In fact, broadband seems to be yielding higher productivity gains for regions which exhibit a minimum threshold of penetration levels (providing evidence of network effects), as well as regions with higher quality in its internet infrastructures, denoted by the broadband speed. Moreover, further analysis provided evidence of a higher effect of broadband on productivity for less developed regions. However, due to data unavailability, we were unable to contrast other possible sources of regional heterogeneity in the impact of broadband on productivity, which may explain why less developed regions are extracting more benefits from this technology. A complete understanding of those aspects should have to be addressed in future research.
Even if a convergence analysis remained out of the scope of this chapter, our results suggest that broadband connectivity might constitute a factor favoring regional cohesion in Brazil. In the past, Barrios et al (2008) find that ICT investments have contributed significantly to regional convergence in Spain. They also state that the development of ICT activities constitute a potentially good candidate for promoting regional development. In the same line, Ding et al (2008) suggest that telecommunication infrastructure contributed significantly to regional convergence in China, supporting investment policies in telecom in lagged regions of developing countries. They state that facilitating telecommunications infrastructure is important for assisting economic growth in the least developed regions of developing countries with poorly developed telecom infrastructure. To confirm that assertion for the case of Brazil, further research will be required, especially when long enough time series data is available to perform a longterm growthregression analysis.
In any case, broadband connectivity appears to be a source of productivity gains in Brazil, something that provides empirical support to the recently deployed public program of connectivity "Programa Nacional de Banda Larga”.
75
To conclude, some policy implications can be derived from the analysis. The importance of broadband for regional development makes that all levels of government should implement policies that encourage broadband deployment. Although referring to the case of Europe, Barrios and Navajas (2008) state the importance to adopt, together with countrylevel initiatives, regional policies, because the nature of technological change and innovation have a strong regional component that makes that public policies must be designed taking the regional dimension into account. In Brazil, some states have started to follow this strategy, as for instance Paraná and Amapá, which have launched statebased broadband public plans, as aiming to complement the abovementioned national plan. Barrios and Navajas (2008) highlight the importance that regional cohesion policies consider the relevance of ICT infrastructure, aiming to favor the attractiveness of the less developed regions. They even call for differentiated intervention, even among regions within a country. Regional policies should also promote ICT skills and the use of ICT by small and medium size enterprises (Barrios et al, 2008).
In this context, investment from service providers in broadband infrastructure is critical, both in terms of coverage and speed. As stated by Crandall et al (2009), it is essential that regulatory policies do not reduce investment incentives for carriers. In particular, policymakers should adopt measures that promote, or at least do not inhibit, the growth of broadband. In densitypopulated areas, private competition will surely provide the required incentives which will lead to higher investments and better connectivity. In those markets, it will be necessary from federal and state governments to reduce entry barriers and promote investment by incumbents and new service providers. In contrast, in distant areas, with low levels of population and economic density, or affected by adverse geographical conditions, public intervention will definitely become vital for infrastructure deployment. At those cases, universalization policies might become crucial. As stated by Frieden (2005), broadband investment requires of important levels of public and private cooperation. The results in this chapter prove that the return to these policies is likely to be quite high.
Policy will also need to promote connectivity from the demandside. Lower
76
prices are necessary to increase penetration, because, as stated by Galperin and Ruzzier (2013), broadband demand is elastic. Promoting flexibility in commercial offers, as well as tax reductions for lowincome segments, and smalllow productive firms, may constitute feasible alternatives to tackle affordability barriers. Additionally, to maximize demand and social returns to broadband deployment, policymakers should address eventual ICTrelated skills among the workforce.
Downloading speed is, as seen before, relevant to enhance the economic impact of broadband, and it will probably become more important in the future, as data traffic through the networks is increasing and will start to strain current infrastructures.
Although not addressed by this research, mobile broadband may also constitute an opportunity to close the digitaldivide, especially through its potential to connect isolated distant areas (Katz, 2012). In that sense, spectrum allocations will be required to provide necessarily resources for deployment of new generation services as LTE and 5G.
77
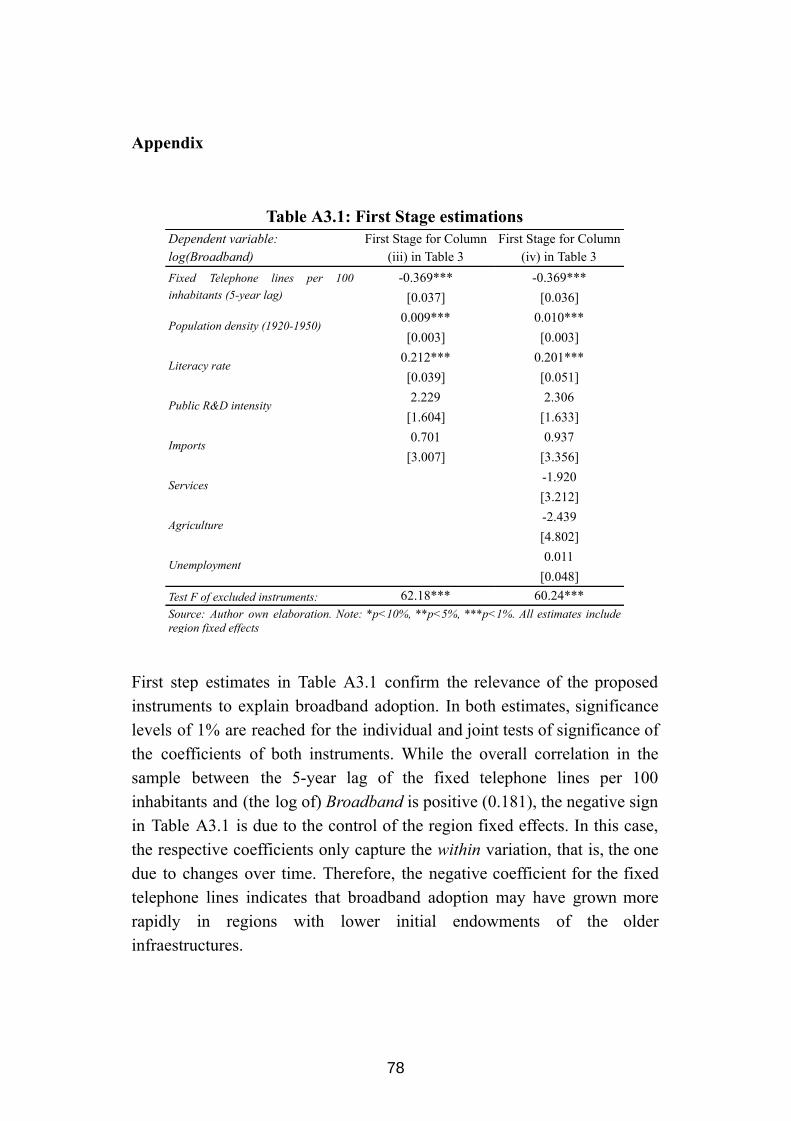
Appendix
Table A3.1: First Stage estimations Dependent variable: log(Broadband)
First Stage for Column (iii) in Table 3
First Stage for Column (iv) in Table 3
Fixed Telephone lines per 100 inhabitants (5year lag)
0.369*** 0.369*** [0.037] [0.036]
Population density (19201950) 0.009*** 0.010*** [0.003] [0.003]
Literacy rate 0.212*** 0.201*** [0.039] [0.051]
Public R&D intensity 2.229 2.306 [1.604] [1.633]
Imports 0.701 0.937 [3.007] [3.356]
Services 1.920 [3.212]
Agriculture 2.439 [4.802]
Unemployment 0.011 [0.048]
Test F of excluded instruments: 62.18*** 60.24*** Source: Author own elaboration. Note: *p<10%, **p<5%, ***p<1%. All estimates include region fixed effects
First step estimates in Table A3.1 confirm the relevance of the proposed instruments to explain broadband adoption. In both estimates, significance levels of 1% are reached for the individual and joint tests of significance of the coefficients of both instruments. While the overall correlation in the sample between the 5year lag of the fixed telephone lines per 100 inhabitants and (the log of) Broadband is positive (0.181), the negative sign in Table A3.1 is due to the control of the region fixed effects. In this case, the respective coefficients only capture the within variation, that is, the one due to changes over time. Therefore, the negative coefficient for the fixed telephone lines indicates that broadband adoption may have grown more rapidly in regions with lower initial endowments of the older infraestructures.
78
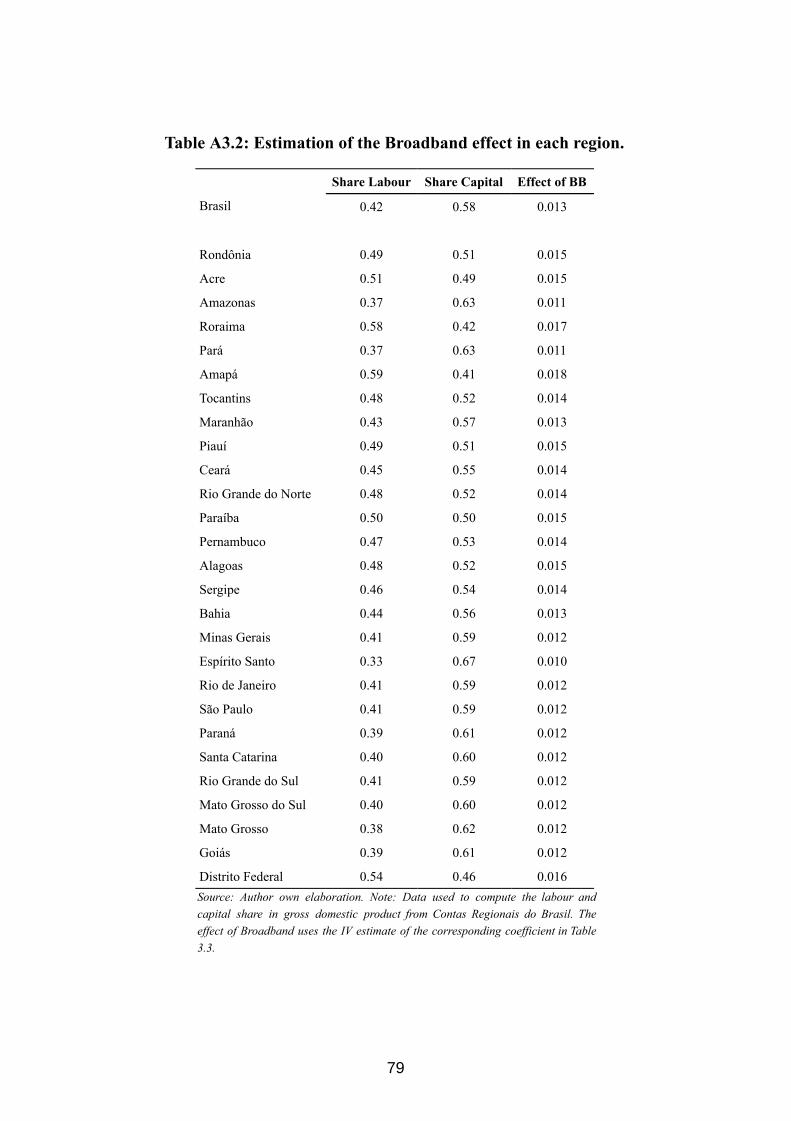
Table A3.2: Estimation of the Broadband effect in each region.
Share Labour Share Capital Effect of BB
Brasil 0.42 0.58 0.013
Rondônia 0.49 0.51 0.015
Acre 0.51 0.49 0.015
Amazonas 0.37 0.63 0.011
Roraima 0.58 0.42 0.017
Pará 0.37 0.63 0.011
Amapá 0.59 0.41 0.018
Tocantins 0.48 0.52 0.014
Maranhão 0.43 0.57 0.013
Piauí 0.49 0.51 0.015
Ceará 0.45 0.55 0.014
Rio Grande do Norte 0.48 0.52 0.014
Paraíba 0.50 0.50 0.015
Pernambuco 0.47 0.53 0.014
Alagoas 0.48 0.52 0.015
Sergipe 0.46 0.54 0.014
Bahia 0.44 0.56 0.013
Minas Gerais 0.41 0.59 0.012
Espírito Santo 0.33 0.67 0.010
Rio de Janeiro 0.41 0.59 0.012
São Paulo 0.41 0.59 0.012
Paraná 0.39 0.61 0.012
Santa Catarina 0.40 0.60 0.012
Rio Grande do Sul 0.41 0.59 0.012
Mato Grosso do Sul 0.40 0.60 0.012
Mato Grosso 0.38 0.62 0.012
Goiás 0.39 0.61 0.012
Distrito Federal 0.54 0.46 0.016 Source: Author own elaboration. Note: Data used to compute the labour and capital share in gross domestic product from Contas Regionais do Brasil. The effect of Broadband uses the IV estimate of the corresponding coefficient in Table 3.3.
79
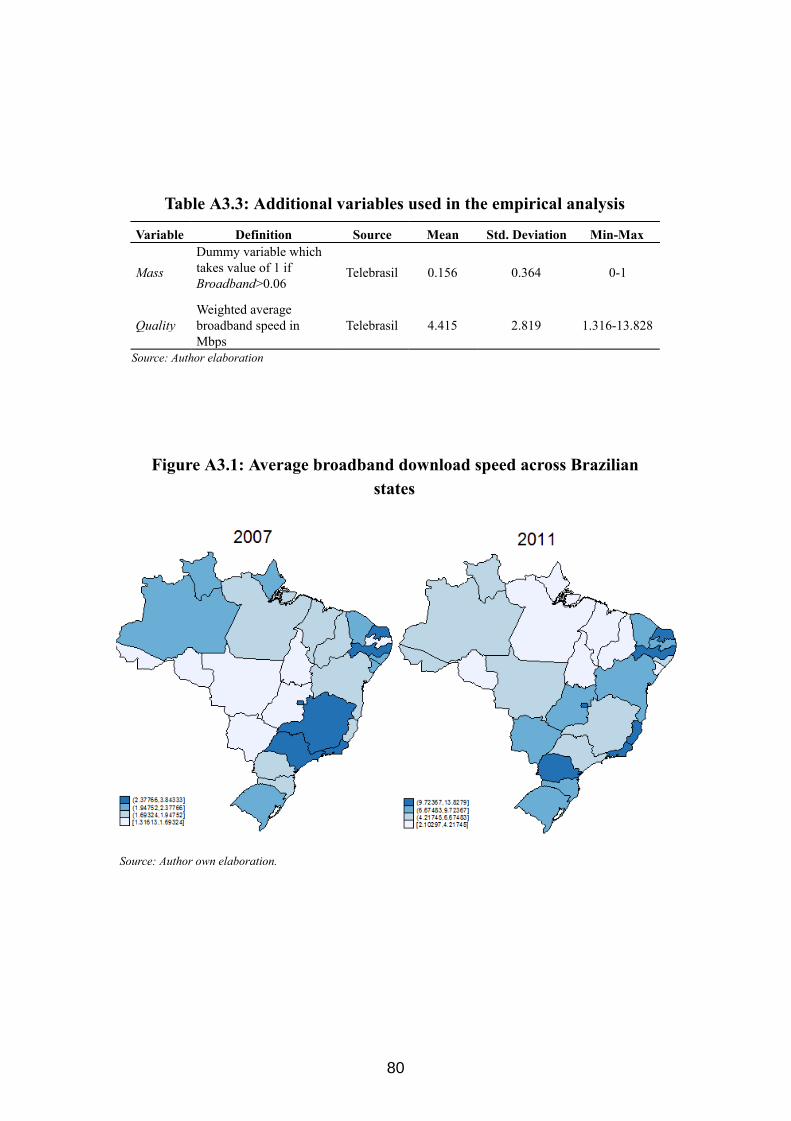
Table A3.3: Additional variables used in the empirical analysis
Variable Definition Source Mean Std. Deviation MinMax
Mass Dummy variable which takes value of 1 if Broadband >0.06
Telebrasil 0.156 0.364 01
Quality Weighted average broadband speed in Mbps
Telebrasil 4.415 2.819 1.31613.828
Source: Author elaboration
Figure A3.1: Average broadband download speed across Brazilian states
Source: Author own elaboration.
80
Chapter 4. Internet and enterprise productivity: evidence from Latin
America 36
4.1 Introduction
Over the last decades, the economic literature has progressively recognized the links between Information and Communication Technologies (ICTs) and economic growth. In particular, a large body of research has clearly shown the relationship between the acceleration of productivity growth and ICT diffusion in the context of growth accounting (Oliner and Sichel, 1994 and 2002; Jorgenson, 2001).
Firms are the economic units where this relationship effectively takes place. ICT adoption can be related to improvements in business performance through various channels. ICTs allow faster communications and quicker processing of information, decreasing internal coordination costs, and facilitating the decision making processes (Cardona et al, 2013; Arvanitis and Loukis, 2009; Atrostic et al, 2004; Gilchrist et al, 2001). ICTs may also promote substantial firm restructuring, making internal processes more flexible and rational, and reducing capital requirements, by improving equipment utilization and inventory reduction. Moreover, the possibility of developing better communication channels with suppliers, clients, knowledge providers, and competitors may increase innovation capacities.
As a result, ICTs seem to allow firms to use new processes and business practices which, in turns, are linked to performance improvements. However, ICTdriven productivity gains are expected to vary largely across countries, regions, industries, and even between enterprises within the same industry and economy, suggesting that simple diffusion may be not
36 Published as: Jung, J., LópezBazo, E., and Grazzi, M. (2017) Internet and enterprise productivity: evidence from Latin America, Working Paper 2017/09 Research Institute of Applied Economics (University of Barcelona). This chapter was produced as part of the InterAmerican Development Bank research project, Policies and Institutions for Productivity in Latin America and the Caribbean (RGT1861). The opinions expressed in this chapter are those of the author and do not necessarily reflect the views of the InterAmerican Development Bank, its Board of Directors, or the countries they represent.
81
sufficient to take full advantage of the potential of ICTs. Empirical evidence indicates that firmspecific operational and organizational characteristics determine the expected benefit derived from ICT adoption. Therefore, complementary investment in areas such as organizational change and human capital appears necessary to both increasing absorptive capacity and maximizing the real impact of new technologies (Brynjolfsson and Hitt, 2000). Institutional framework and other environmental factors may also be crucial in exploiting ICTs full potential.
Given the complexities described above, it is a key element to understand more about the link of ICT with productivity, and whether the strength of this link varies across firms. A complete understanding of these dynamics is central in order to design effective public policies to promote ICT adoption and increase firm productivity. Past research has already suggested that the effect of ICTs on economic performance may vary across different economic agents, although main evidence has been developed at a countrylevel (see for instance Thompson and Garbacz, 2011; Qiang et al, 2009; or FernándezArdèvol and Vázquez Grenno, 2011), while firmlevel analysis is still scarce, being the most relevant recent contribution that of Paunov and Rollo (2016).
Clearly, the concept of ICT includes a variety of different technologies and applications, with different potential impact on firm’s performance (hardware, software, telecommunications, etc). Recently, broadband internet connection has been indicated as one of the most effective, because of its potential to enable a wide set of productivityenhancing services. Some authors stated that broadband has become a necessary infrastructure for economic and social development, as it has happened before with advances such as railroads, roads, and electricity (Mack and Faggian, 2013; and Jordan and De León, 2011). As a result of that, while inspired in ICTs in general, our analysis will focus exclusively in the adoption and use of internet, as it has emerged as the main component of these technologies nowadays. 37
37 Given that variables about adoption of computers are unavailable in our sample, it's not possible to distinguish between effect of the Internet and a potential effect of other ICTs such as computers (not connected to the net).
82
Rather than exploring the impact of internet based on aggregated data (at country, region, or industry levels), this chapter assesses its distributional effects at the firmlevel. This is a key aspect since having a complete understanding of the distributional effects is crucial for public policies. As stated by Frölich and Melly (2013), from a policy perspective, a public intervention that helps to raise the lower tail of an outcome distribution should be more appreciated than an intervention that shifts the median, even if the average treatment effects are similar. For instance, if the effect of increasing the use of internet was found to be stronger in lowproductive firms, a policy intervention related to the adoption and use of these technologies –for instance, a national broadband deployment plan– will help reduce productivity disparities between firms. On the contrary, if most productive firms were found to be mostly related to internetderived gains, then a massification of these technologies would increase disparities.
While the bulk of the literature has focused so far on developed countries, evidence from emerging economies is still scarce and dispersed. In this regard, some of the most recent contributions have analysed the effect of ICTs on productivity exploiting the firmlevel data from the World Bank Enterprise Survey (WBES) for specific groups of developing countries (e.g. Cirera et al, 2016; Paunov and Rollo, 2016). In a similar vein, this chapter aims to contribute to this literature by exploring the relationship of internet with productivity in the context of the Latin America region, which constitutes an appealing case of analysis for a number of reasons. Firms in the region seem to be less innovative and productive when compared to those belonging to more advanced economies, and one possible reason is related to internet diffusion and use, which is still relatively low. In fact, although internet has significantly increased its diffusion in the region, there is still a notable divide between Latin America and the developed countries, especially in the most advanced technologies. Although the region’s GDP has been growing fast since the beginning of the 2000s –mainly driven by high commodity prices–, advances in productivity levels have been much poorer, and ICTs can surely provide a powerful opportunity to catchup. On the other hand, Latin America is the region in the world with the highest levels of inequality. From that perspective, the possibility of finding out the distributional effects of internet, and the implications of public interventions
83
aimed to foster the diffusion and use of this new technology, will surely constitute a useful input for policy makers.
This chapter provides important contributions to the literature. The possibility of performing an empirical analysis at a micro level –in contrast to one based on aggregated region/country/sector data– is especially relevant as the firm is the main economic actor in the internetproductivity relationship. On the other hand, our measure of firm performance will be a Total Factor Productivity (TFP) indicator built following the procedure suggested by Levinsohn and Petrin (2003), instead of performing the analysis on less suitable measures as labour productivity. To the best of 38
our knowledge, this is the first effort to provide comprehensive evidence at a firmlevel in Latin America about the effect of internet on TFP throughout the overall distribution of this indicator, not just at its mean, something which is crucial to provide inputs for public policies oriented to promote the adoption and intensive use of new technologies.
Paunov and Rollo (2016) is the closest study to ours in terms of approach and scope. However, our study differs in a series of aspects. In the first place, their main focus is to study the effect of ICTrelated industry spillovers on firm’s labour productivity. In the second place, we will follow an Unconditional Quantile Regression approach (UQR; e.g. Firpo, 2007) in order to characterize the effect of internet on the firm’s TFP throughout the overall distribution of productivity. In our opinion, this is a more appropriate choice when the aim is on the distributional impact of internet, as the estimated effects of internet in this case corresponds to the unconditional distribution of productivity, which is the variable of interest. In contrast, Paunov and Rollo (2016) apply the more conventional Conditional Quantile Regression approach (CQR; Koenker and Bassett, 1978), whose estimated effects refer to the conditional distribution of productivity, which may substantially differ from the actual (unconditional) one. Finally, their sample is composed by firms from emerging economies
38 Labour productivity is often seen as an incomplete measure of efficiency. On the contrary, TFP is a measure that captures efficiency considering all factor inputs, being as a result, a more complete indicator of the use of resources by productive agents.
84

in general, while our analysis is particularly focused in Latin American enterprises.
Our study, however, encountered some limitations. Due to data unavailability, we are unable to perform paneldata estimations and, therefore, to control for unobservables that may affect productivity and internet at the same time, confounding the estimated effect as a result. On the other hand, the link between internet and productivity may be bidirectional, as high productive firms are more expected to adopt ICTs, and to make better use of them once adopted. To control for potential endogeneity, we implement an Instrumental Variables estimator (IV). However, this is only feasible for the analysis at the mean of the distribution, as to the author's knowledge there has not yet been developed a similar consistent estimation procedure for the UQR approach. Therefore, although some robustness checks are performed to address the endogeneity concern, we should be cautious when deriving conclusions from the results in terms of causal effects.
The rest of the chapter is organized as follows. In Section 4.2, we review the related theoretical and empirical literature, from where we will outline our main hypotheses. In Section 4.3, the dataset and variables to be used in the empirical analysis are presented. In Section 4.4, we include a descriptive analysis of the variables of interest. In Section 4.5, we specify the empirical model to explore the relationship between internet adoption and use on productivity. In Section 4.6, we discuss the main results of the empirical estimations. Finally, concluding remarks are provided in Section 4.7.
4.2 Literature Review and Hypothesis
The link between economic performance and ICTs has received considerable attention in the literature, and over the last few years, many firmlevel empirical studies have identified multiple channels through which ICT can have a positive effect on enterprise performance. For example, Mack and Faggian (2013) stated that ICTs have dramatically changed every aspect of modern life, including business management,
85
which has been revolutionized by the new capacity of finding, sharing, and storing information.
In fact, ICTs have the potential to generate a large impact on the internal communication processes of a firm. For example, it is usually argued that ICTs can help to reduce internal communication costs (Jorgenson, 2001), allowing quicker information processing, lower coordination costs, fewer supervisors required (reduction in labour costs), and an easier facilitation of the decision making process (Cardona et al, 2013; Arvanitis and Loukis, 2009; Atrostic et al, 2004; Gilchrist et al, 2001). In turn, the reduction in communication costs can spur additional investments (Colecchia and Schreyer, 2002). Moreover, ICTs may enable the development of new processes and new work practices (Mack and Faggian, 2013), and facilitate substantial firm restructuring (Brynjolfsson and Hitt, 2000), making internal processes more flexible and rational, and reducing capital requirements through better equipment utilization and inventory reduction. These improvements may also allow firms to improve the quality of their outputs. In addition, the adoption of ICTs opens the possibility to improve external communication channels with suppliers, clients and, other firms, facilitating innovation processes, arranging new distribution systems and prompting knowledge spillovers across firms and regions (Czernich et al, 2011). Cheaper information dissemination can facilitate the adoption of new technologies devised elsewhere. As knowledge is increasingly becoming crucial for economic activity, the potential of ICT to generate more efficient external collaboration may promote the creation of new knowledge (Forman and Zeebroeck, 2010). From a market perspective, ICT development can contribute to lower entry barriers and to promote transparency, fostering competition and development of new products, processes and business models (Czernich et al, 2011).
As a result of all the above, ICTs have become a substantial part of the modern business environment (Cardona et al, 2013), allowing factor productivity gains in industries that are intensive in ICT utilization. In a seminal study, Brynjolfsson and Hitt (2003) explored the effect of computerization on productivity and output growth in a sample of US firms over the period 19871994, finding a positive association. This relation has
86

been confirmed through the years by several empirical studies in various contexts. For example, Hempell (2005) found significant evidence of the productivity effects of ICT using a generalized method of moments estimator on a panel data of German firms in the period 19941999. Arvanitis and Loukis (2009) and Kaiser and Bertschek (2004) confirmed those findings using data from Greece and Switzerland, and Germany, respectively. Among emerging regions, Cirera et al (2016) conducted a study based on a sample of SubSaharan African countries, following the CDM approach (Crepon et al, 1998), finding positive and robustly 39
significant impact of ICT on innovation, although the link to productivity was found to be less clear and dependent on the different innovation measures. For the Latin America region, Gutierrez (2011) found a positive and significant effect of ICT investments in labour productivity in Colombian manufacturing enterprises. Aboal and Tacsir (2015), for a sample of Uruguayan firms, found evidence of a positive association between ICT and productivity in manufacturing and services sectors. Alvarez (2016) found evidence of a positive contribution of ICT to productivity levels in a sample of Chilean enterprises. In this context, the first hypothesis in this chapter is to check if this effect can be generalised to the entire set of firms in the Latin America region:
H1: Internet adoption and its use are a source of productivity gains for Latin American firms.
Beyond adoption and individual uses, the link of internet on productivity is possibly related to the intensity of its use. In this sense, using internet simultaneously in various aspects of business activity should be expected to be relevant beyond the individual uses. Thus, we can delineate the second hypothesis as:
H2: The higher the intensity of internet use, the greater the effect on productivity.
39 Since the seminal contribution of Crepon et al (1998), the CDM strategy has become popular in studies analysing the effect of the determinants of R&D, innovation, and productivity. In brief, it first model the determinants of R&D, then those of innovation, including R&D, and finally it considers the effect of innovation on productivity.
87
The impact of ICT may be conditioned to certain characteristics of the internal context of the firm. In particular, some authors have highlighted the importance of complementary investments, pointing out that ICT adoption may increase its productivity impact if combined with human capital investment or internal restructuring (Brynjolfsson and Hitt, 2000). Knowledge stock and skills constitute determinants of absorptive capacity, which may influence firm capabilities to make the most of new technologies (Benhabib and Spiegel, 1994; Cohen and Levinthal, 1990). Organizational complements and intangible assets are considered crucial for ICT influence on productivity.
External factors may also be important to determine the dimension of the impact. In fact, potential gains derived from ICTs may depend on the linkages of the firm with external organizations. Network externalities may also be present when the benefits of having adopted a technology depend on the adoption decisions of other users. In the case of internet connection, it means that economic returns to connectivity should rise once a certain threshold of connectivity penetration in the society is achieved. On the other hand, the degree of impact of ICTs will surely depend on the firm’s previous access to knowledge. As stated by Paunov and Rollo (2016), all else equal, firms that are connected to rich (poor) offline knowledge networks may possibly have fewer (stronger) productivity performance gains from adopting and using internet intensively. Moreover, by adopting and using ICTs, smaller firms may be able to perform tasks which previously were exclusive to the bigger ones, like enlarging its interactions with clients and suppliers, or to increase the scope of its diffusion activities. This is particularly relevant in the case of emerging regions, as ICTs may help lagging firms to overcome restrictions derived from the socioeconomic and institutional frameworks. Considering that, extending the use of ICTs to all enterprises in Latin America may contribute to reduce the productivity gaps across enterprises.
Previous research has already found some insights regarding heterogeneities in the impact of ICTs on economic performance. In a countrylevel analysis, Thompson and Garbacz (2011) found that broadband
88

had a relatively more favorable economic impact in lowincome countries than in highincome economies. In the same fashion, Qiang et al (2009) suggested that the growth effects of broadband, as well as those of other technologies, were higher in lowincome countries than in highincome economies. According to FernándezArdèvol and Vázquez Grenno (2011), the economic impact of mobile phones was larger in Latin America than in OECD countries. Empirical evidence has also been found within most advanced regions. Cardona et al (2013) argued that ICTs contributed more to United States than to Europe’s productivity, explaining that the reason behind this may be related to differences in organizational and managerial capabilities. On the other hand, Bloom et al (2012) found differences in the productivity of ICT capital across a sample of firms operating in the United Kingdom, reaching higher levels those USowned establishments.
At a firm level, Paunov and Rollo (2016) found evidence of the positive impact of industry internet use spillovers on enterprise performance in emerging countries, and the benefit was higher for smaller firms, and those located in smaller agglomerations and nonexporters; although their quantile regressions analysis show that relatively larger benefits arose only for the most productive firms among those groups. However, they followed the CQR approach which refers to the effect in specific points in the output distribution conditional on the set of observable factors considered in the analysis. In other words, it measures the effect on different parts of the overall conditional productivity distribution. Conversely, our study estimates the effect on the unconditional productivity distribution to test the following hypothesis:
H3: The effect of increasing the internet adoption and use is stronger for lowmedium productivity firms than for firms at the upper end of the productivity distribution. As a result, extending the use of this ICT technologies contributes to reduce productivity inequality in Latin American firms.
89
4.3 Dataset and variables
The Dataset
The data for the empirical analysis comes from the WBES database, 40
which provides representative samples of the population of firms in the private sector of the countries covered. The surveys cover a broad range of topics relevant to business including, among others, innovation, ICTs, access to finance, corruption, infrastructure, crime, competition, and performance measures.
The WBES are answered through facetoface interviews with top managers and business owners. Typically 12001800 interviews are conducted in larger economies, 360 interviews are conducted in mediumsized economies, and for smaller economies, 150 interviews take place. The manufacturing and services are the primary business sectors of interest for the survey. Formal (registered) companies with 5 or more employees are 41
targeted for interview. Firms with 100% government or state ownership are not eligible to participate. In each country, businesses in the cities or regions of major economic activity are interviewed.
The WBES follow a stratified random sampling, as all population units are grouped within homogeneous groups and simple random samples are selected within each one. The strata for the WBES are firm size, business sector, and geographic region within a country. Ideally the survey sample frame is derived from the universe of eligible firms obtained from the country’s statistical office. Sometimes the master list of firms is obtained from other government agencies such as tax or business licensing authorities, while in some cases, the list of firms is obtained from business associations or marketing databases.
Since 2002, the World Bank has been collecting these data in over 155,000 companies in 148 economies. However, it is worth to mention that
40 http://www.enterprisesurveys.org/aboutus 41 This corresponds to firms classified with ISIC codes 1537, 45, 5052, 55, 6064, and 72 (ISIC Rev.3.1).
90
information is not available on a regular basis for all countries. While the WBES have been increasingly intending to produce paneldata, there is still some limitations in its availability. For instance, for Latin America, surveys were mainly conducted across two waves, 2006 and 2010, and while there are some firms that were surveyed in both years (conforming a panel), there is still some critical information missing from the first wave. Unfortunately, this is the case for most ICT and innovation related data.
Therefore, we will use the twoperiod panel (2006 and 2010) to conduct the TFP estimation, while due to information unavailability, the dataset to be used for our main empirical estimation linking TFP with internetrelated variables will consist in a 2010 crosssection sample of enterprises from 19 Latin American countries, most of which belonging to the manufacturing 42
sector. 43
Internet related variables
Table 4.1 summarizes the information about the internetrelated variables available in the dataset, including the specific question from the survey questionnaire, as well as the answer options applicable for each case. The internet adoption variable consist in highspeed broadband being adopted by the firm. Therefore, this definition excludes the older and slower dialup internet connections, which do not seem to be suitable for intensive uses in the period under analysis. Additionally, we extend the analysis, by 44
considering not only broadband adoption, but also the degree of exploitation of its potential, measured through a series of internet uses, which rank from those with the lowest intensity (email), to those more sophisticated as research and development of ideas on new products and
42 Argentina, Bolivia, Chile, Colombia, Costa Rica, Dominican Republic, Ecuador, El Salvador, Guatemala, Honduras, Jamaica, México, Nicaragua, Panamá, Paraguay, Perú, Trinidad and Tobago, Uruguay and Venezuela. 43 The sample refers to firms located in Latin America. Therefore, it includes foreignowned enterprises located in the region, while it excludes Latin America owned firms located abroad. 44 However, within the broadband category, there could still be very big differences in the quality of the connections, that we cannot capture with this data.
91
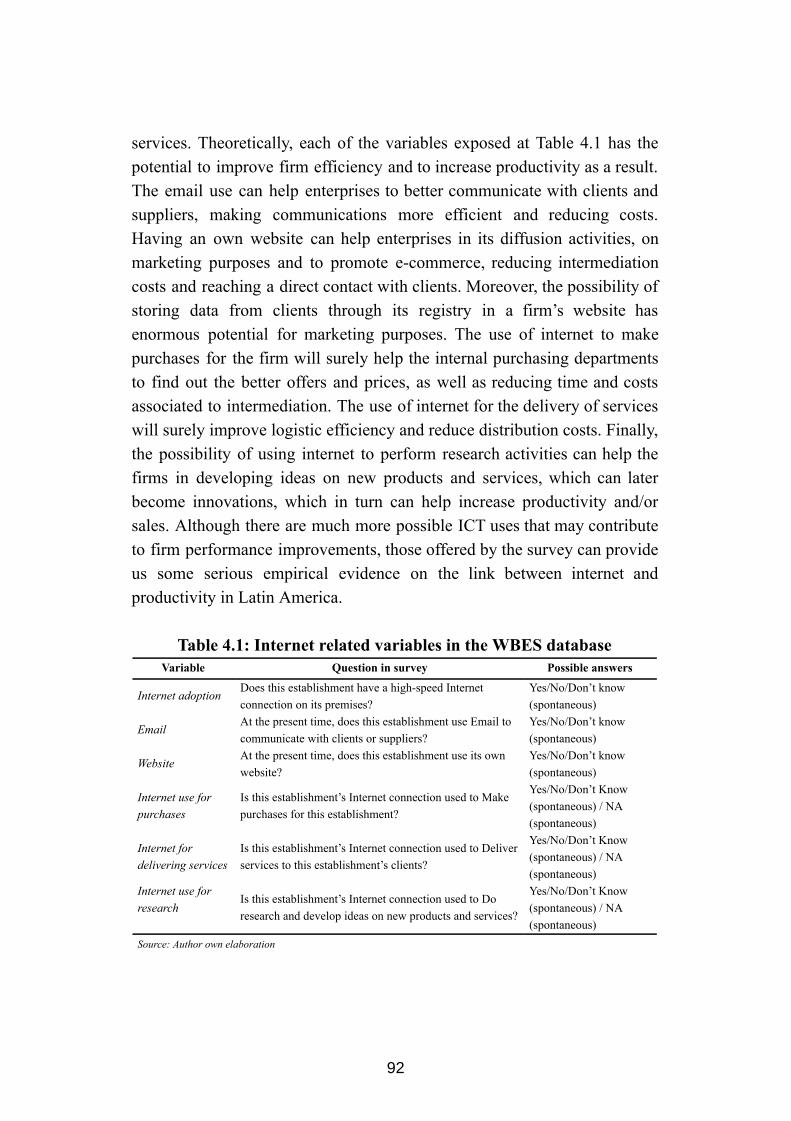
services. Theoretically, each of the variables exposed at Table 4.1 has the potential to improve firm efficiency and to increase productivity as a result. The email use can help enterprises to better communicate with clients and suppliers, making communications more efficient and reducing costs. Having an own website can help enterprises in its diffusion activities, on marketing purposes and to promote ecommerce, reducing intermediation costs and reaching a direct contact with clients. Moreover, the possibility of storing data from clients through its registry in a firm’s website has enormous potential for marketing purposes. The use of internet to make purchases for the firm will surely help the internal purchasing departments to find out the better offers and prices, as well as reducing time and costs associated to intermediation. The use of internet for the delivery of services will surely improve logistic efficiency and reduce distribution costs. Finally, the possibility of using internet to perform research activities can help the firms in developing ideas on new products and services, which can later become innovations, which in turn can help increase productivity and/or sales. Although there are much more possible ICT uses that may contribute to firm performance improvements, those offered by the survey can provide us some serious empirical evidence on the link between internet and productivity in Latin America.
Table 4.1: Internet related variables in the WBES database Variable Question in survey Possible answers
Internet adoption Does this establishment have a highspeed Internet connection on its premises?
Yes/No/Don’t know (spontaneous)
Email At the present time, does this establishment use Email to communicate with clients or suppliers?
Yes/No/Don’t know (spontaneous)
Website At the present time, does this establishment use its own website?
Yes/No/Don’t know (spontaneous)
Internet use for purchases
Is this establishment’s Internet connection used to Make purchases for this establishment?
Yes/No/Don’t Know (spontaneous) / NA (spontaneous)
Internet for delivering services
Is this establishment’s Internet connection used to Deliver services to this establishment’s clients?
Yes/No/Don’t Know (spontaneous) / NA (spontaneous)
Internet use for research
Is this establishment’s Internet connection used to Do research and develop ideas on new products and services?
Yes/No/Don’t Know (spontaneous) / NA (spontaneous)
Source: Author own elaboration
92
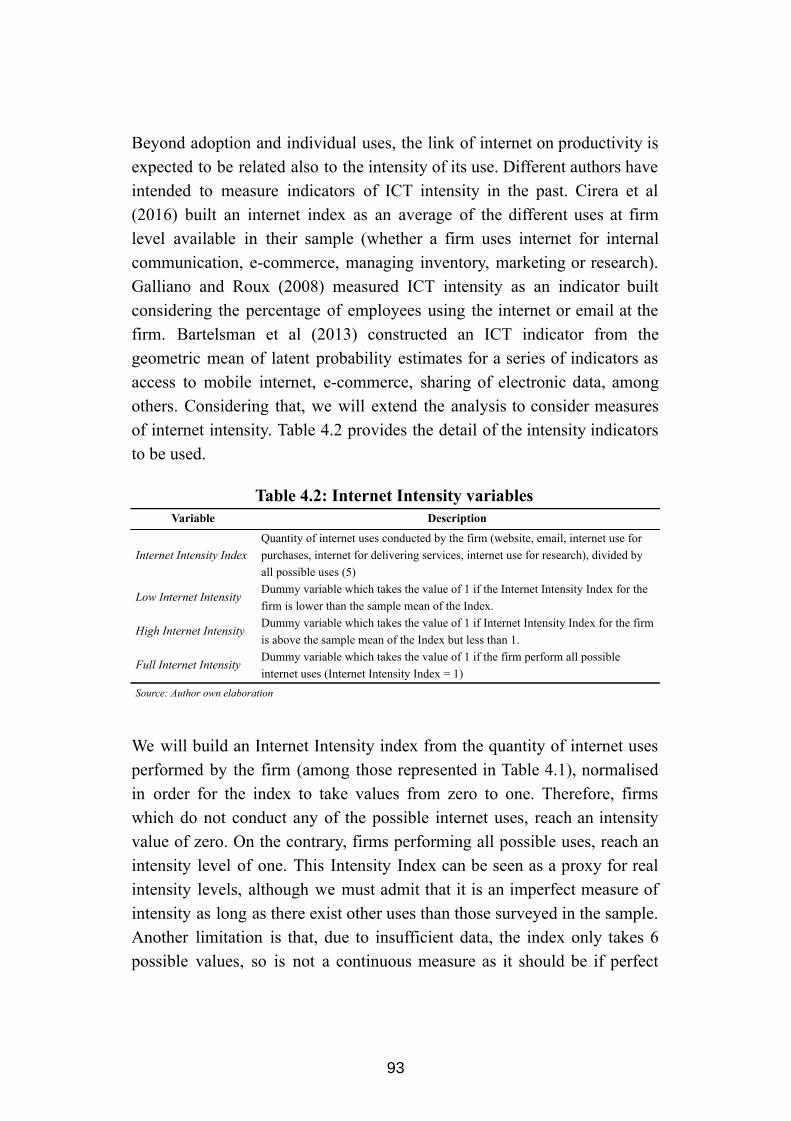
Beyond adoption and individual uses, the link of internet on productivity is expected to be related also to the intensity of its use. Different authors have intended to measure indicators of ICT intensity in the past. Cirera et al (2016) built an internet index as an average of the different uses at firm level available in their sample (whether a firm uses internet for internal communication, ecommerce, managing inventory, marketing or research). Galliano and Roux (2008) measured ICT intensity as an indicator built considering the percentage of employees using the internet or email at the firm. Bartelsman et al (2013) constructed an ICT indicator from the geometric mean of latent probability estimates for a series of indicators as access to mobile internet, ecommerce, sharing of electronic data, among others. Considering that, we will extend the analysis to consider measures of internet intensity. Table 4.2 provides the detail of the intensity indicators to be used.
Table 4.2: Internet Intensity variables Variable Description
Internet Intensity Index Quantity of internet uses conducted by the firm (website, email, internet use for purchases, internet for delivering services, internet use for research), divided by all possible uses (5)
Low Internet Intensity Dummy variable which takes the value of 1 if the Internet Intensity Index for the firm is lower than the sample mean of the Index.
High Internet Intensity Dummy variable which takes the value of 1 if Internet Intensity Index for the firm is above the sample mean of the Index but less than 1.
Full Internet Intensity Dummy variable which takes the value of 1 if the firm perform all possible internet uses (Internet Intensity Index = 1)
Source: Author own elaboration
We will build an Internet Intensity index from the quantity of internet uses performed by the firm (among those represented in Table 4.1), normalised in order for the index to take values from zero to one. Therefore, firms which do not conduct any of the possible internet uses, reach an intensity value of zero. On the contrary, firms performing all possible uses, reach an intensity level of one. This Intensity Index can be seen as a proxy for real intensity levels, although we must admit that it is an imperfect measure of intensity as long as there exist other uses than those surveyed in the sample. Another limitation is that, due to insufficient data, the index only takes 6 possible values, so is not a continuous measure as it should be if perfect
93
information were available. In any case, the analysis will be complemented with the use of binary variables that identify three categories based on the values of the index (low, high, and full internet intensity). For that purpose we will consider lowintensity as the baseline category, and will add the dummy variables representing high intensity levels (those enterprises which exhibit intensity index levels above the mean, but do not perform all 45
possible uses) and full intensity levels, for the case of firms conducting all possible uses (intensity index=1).
The measure of Total Factor Productivity
To measure the effect of internet adoption and its use on the firm’s productivity, we need to compute a suitable measure of the level of productivity of the firm. There is now wide consensus that the most appropriate one is that of the firm’s TFP. Accordingly, we will compute the TFP level for each firm in the sample based on the estimation of the production function. In doing so, different approaches suggested in the literature were considered: Ordinary Least Squares (OLS), Fixed Effects (FE), and the methods proposed by OlleyPakes (OP) and LevinsohnPetrin (LP). It has been argued that OLS provides biased estimates because it does not consider the correlation between unobservable productivity shocks and input levels. The FE estimator solves the problem only if the unobserved firmspecific productivity is timeinvariant. Olley and Pakes (1996) develop an estimator using investment as a proxy for these unobservable shocks. More recently, Levinsohn and Petrin (2003) argued about the problems related to investment as proxy, as it will not respond so smoothly to shocks, and proposed instead an estimator using intermediate inputs as proxies.
In brief, a firmlevel CobbDouglas production function is specified:
[1]og(V A) log(L) β log(K)l it = β0 + βL it + K it + ωit + ηit
45 Bartelsman et al (2013) define a threshold of 0.6 to differentiate low and high intensity, which was found to be insufficient in our case, as it is considerably below the mean of our index (0.72).
94
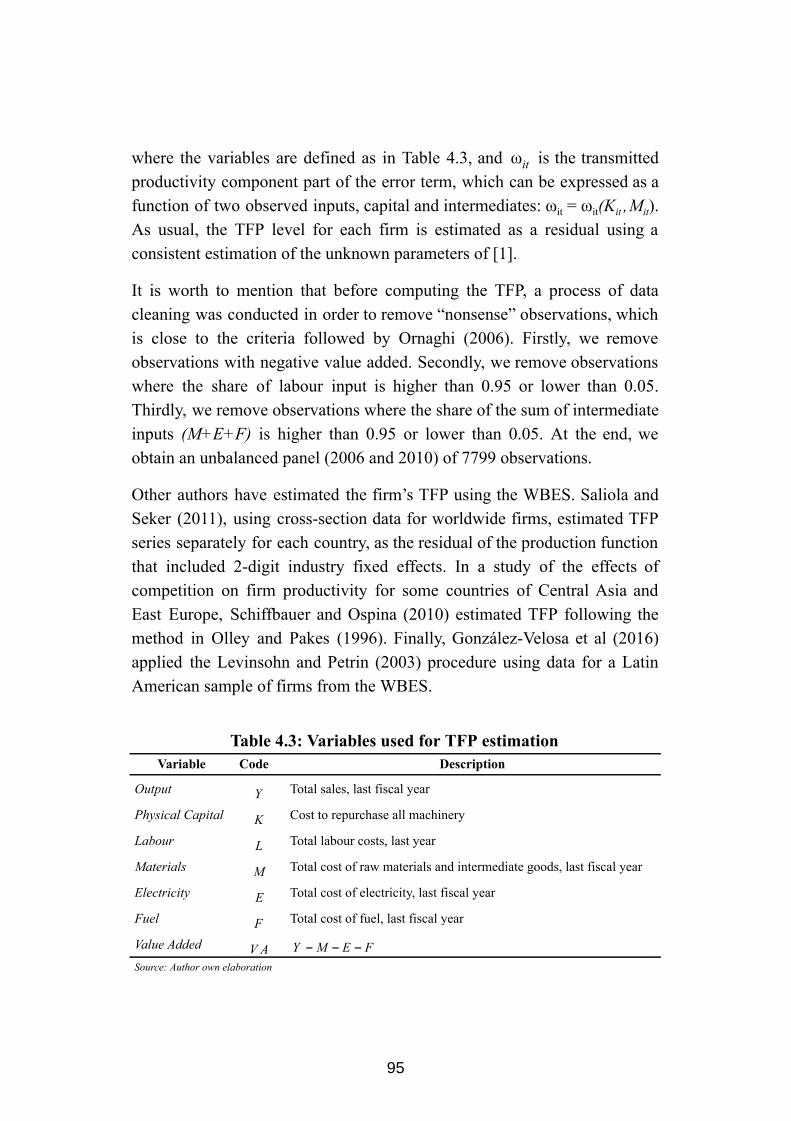
where the variables are defined as in Table 4.3, and is the transmitted ωit productivity component part of the error term, which can be expressed as a function of two observed inputs, capital and intermediates: ω it = ω it (K it , M it ). As usual, the TFP level for each firm is estimated as a residual using a consistent estimation of the unknown parameters of [1].
It is worth to mention that before computing the TFP, a process of data cleaning was conducted in order to remove “nonsense” observations, which is close to the criteria followed by Ornaghi (2006). Firstly, we remove observations with negative value added. Secondly, we remove observations where the share of labour input is higher than 0.95 or lower than 0.05. Thirdly, we remove observations where the share of the sum of intermediate inputs (M+E+F) is higher than 0.95 or lower than 0.05. At the end, we obtain an unbalanced panel (2006 and 2010) of 7799 observations.
Other authors have estimated the firm’s TFP using the WBES. Saliola and Seker (2011), using crosssection data for worldwide firms, estimated TFP series separately for each country, as the residual of the production function that included 2digit industry fixed effects. In a study of the effects of competition on firm productivity for some countries of Central Asia and East Europe, Schiffbauer and Ospina (2010) estimated TFP following the method in Olley and Pakes (1996). Finally, GonzálezVelosa et al (2016) applied the Levinsohn and Petrin (2003) procedure using data for a Latin American sample of firms from the WBES.
Table 4.3: Variables used for TFP estimation
Variable Code Description
Output Y Total sales, last fiscal year
Physical Capital K Cost to repurchase all machinery
Labour L Total labour costs, last year
Materials M Total cost of raw materials and intermediate goods, last fiscal year
Electricity E Total cost of electricity, last fiscal year
Fuel F Total cost of fuel, last fiscal year
Value Added AV Y −M − E − F
Source: Author own elaboration
95
Tables A4.1 and A4.2 in the Appendix summarize the main comparisons performed among the estimates based on OLS, FE, OP and LP. After an exhaustive analysis, the LP method was chosen as the preferred approach as it controls for simultaneity while using intermediate inputs as proxy, since they adjust more smoothly to shocks than investment. In any case, it should be mentioned that in order to reduce the impact of any potential bias, we will be computing the TFP by means of sectorspecific estimates of the production function in [1]. Sector classification considered for TFP computation was defined following the Intermediatelevel SNA/ISIC aggregation criteria. Table A4.3 in the Appendix summarizes the sectoral classification, which exhibit important differences in K/L and Y/K ratios, making worth the effort of performing sectorspecific estimations.
The estimation of the production function parameters was performed using panel data observations for 2006 and 2010. Then, the TFP was computed for all firms, including those with only 2010 data available, using the estimated parameters. Equation [1] was estimated separately for each sector when there were enough observations for doing so (sectors with aggregation code 4, 5, 6, 10, 11, 13, 14, 15 in Table A4.3 in the Appendix). In each case, TFP values were computed after estimation. For sectors with insufficient observations for the LP estimation, the procedure was modified as follows: (i) estimation of equation [1] for the complete sample, (ii) use this estimation to predict TFP only for sectors with insufficient observations.
Control variables
In order to assess properly the effect of internet on TFP we should control for a comprehensive set of firm characteristics. Otherwise, its effect may be confounded with that of some productive features of the firm, as long as they correlate with the adoption and use of internet. For that reason, we have revised extensively the literature to find out which sources of firmlevel characteristics may explain differences in their productivity. Therefore, the control list was determined to be sufficiently exhaustive in order to pick all possible heterogeneity sources which may be affecting the
96
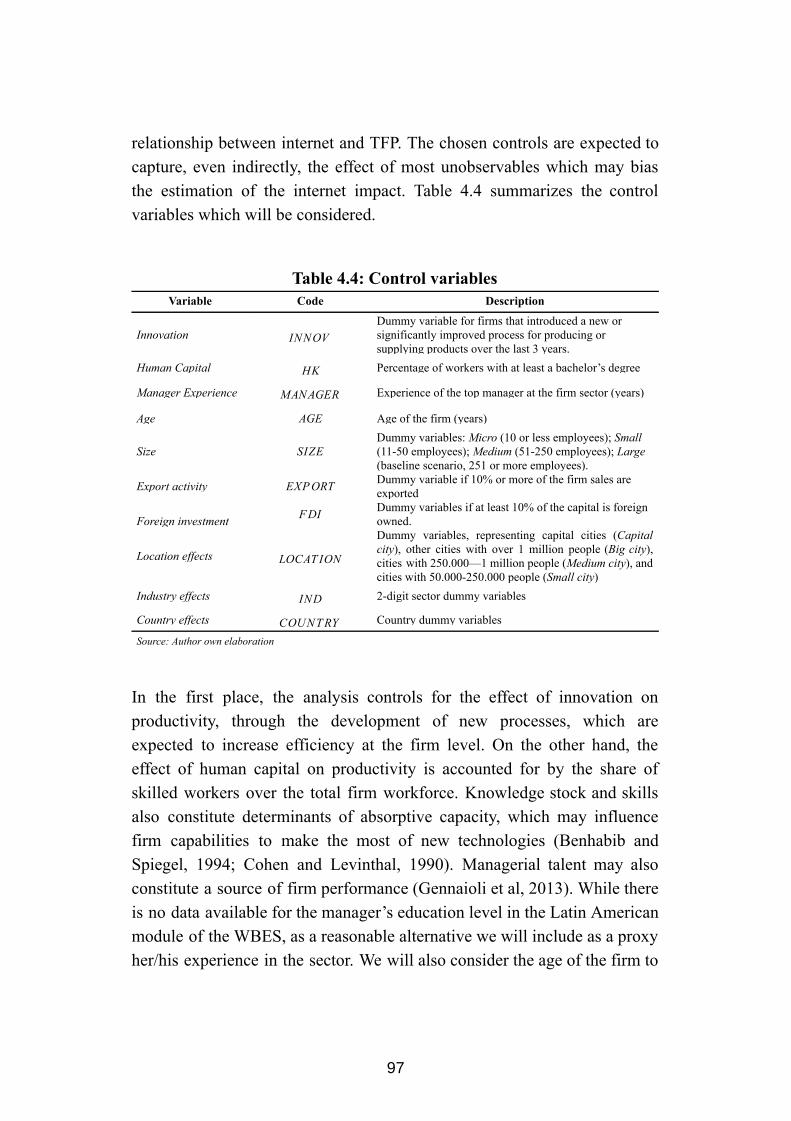
relationship between internet and TFP. The chosen controls are expected to capture, even indirectly, the effect of most unobservables which may bias the estimation of the internet impact. Table 4.4 summarizes the control variables which will be considered.
Table 4.4: Control variables Variable Code Description
Innovation NNOVI Dummy variable for firms that introduced a new or significantly improved process for producing or supplying products over the last 3 years.
Human Capital KH Percentage of workers with at least a bachelor’s degree
Manager Experience MANAGER Experience of the top manager at the firm sector (years)
Age GE A Age of the firm (years)
Size IZE S Dummy variables: Micro (10 or less employees); Small (1150 employees); Medium (51250 employees); Large (baseline scenario, 251 or more employees).
Export activity XPORT E Dummy variable if 10% or more of the firm sales are exported
Foreign investment DI F
Dummy variables if at least 10% of the capital is foreign owned.
Location effects OCAT IONL
Dummy variables, representing capital cities ( Capital city ), other cities with over 1 million people ( Big city ), cities with 250.000—1 million people ( Medium city ), and cities with 50.000250.000 people ( Small city )
Industry effects NDI 2digit sector dummy variables
Country effects OUNTRYC Country dummy variables
Source: Author own elaboration
In the first place, the analysis controls for the effect of innovation on productivity, through the development of new processes, which are expected to increase efficiency at the firm level. On the other hand, the effect of human capital on productivity is accounted for by the share of skilled workers over the total firm workforce. Knowledge stock and skills also constitute determinants of absorptive capacity, which may influence firm capabilities to make the most of new technologies (Benhabib and Spiegel, 1994; Cohen and Levinthal, 1990). Managerial talent may also constitute a source of firm performance (Gennaioli et al, 2013). While there is no data available for the manager’s education level in the Latin American module of the WBES, as a reasonable alternative we will include as a proxy her/his experience in the sector. We will also consider the age of the firm to
97
proxy its technological experience. The role of firm age is not theoretically straightforward. In fact, on the one hand, older firms are supposedly better equipped to assess the risks and benefits of the introduction of new technologies, which in turn should increase productivity; but on the other hand, younger enterprises are supposed to be more flexible to organizational changes which may also have an incidence on firm performance. Literature on productivity at firm level considers size as a main source of heterogeneity of firm’s performance. Past research has found that big companies can amortize sunk costs, present more capacity for risk diversification, and have lower financial constraints (see for example Acs and Audretsch, 1988; or Cohen and Klepper, 1996). As a result, large firms are expected to be more productive than small ones. Castany et al (2005) argue that this may respond to the scale economies effect, the scope economies effect, the experience effect and the organization effect. International links of the company can also have an incidence on firm performance. In fact, it is possible that companies exposed to international markets face a stronger pressure to innovate, in order to remain competitive. If exporting firms benefit from the technical expertise and best practices of their buyers, then some part of the efficiency of exportled firms may be attributed to externalities derived from exporting learning by exporting (Evenson and Westphal, 1995; Clerides et al, 1998). In the past, empirical studies have found that exporting firms are more efficient than their domestically oriented counterparts (Bernard and Jensen, 1995). R&D spillovers of trade partners may also become a source of productivity increases (see for instance Coe and Helpman, 1995, for a country level analysis, or Higon, 2007, for firm level evidence). On the other hand, Foreign Direct Investment (FDI) may also constitute a channel for international knowledge spillovers, if the organizational structure and governance of the multinational companies allow it. In particular, Glass and Saggi (1988) stipulate that openness can benefit technological development because local players can have access to new knowledge, technologies, and competencies from more advanced countries. Chou et al (2008), for instance, specifies a model, which includes FDI to explain productivity. Additionally, the fact that a firm is located in an urban or densely populated area can contribute to generate agglomeration economies, which may have
98
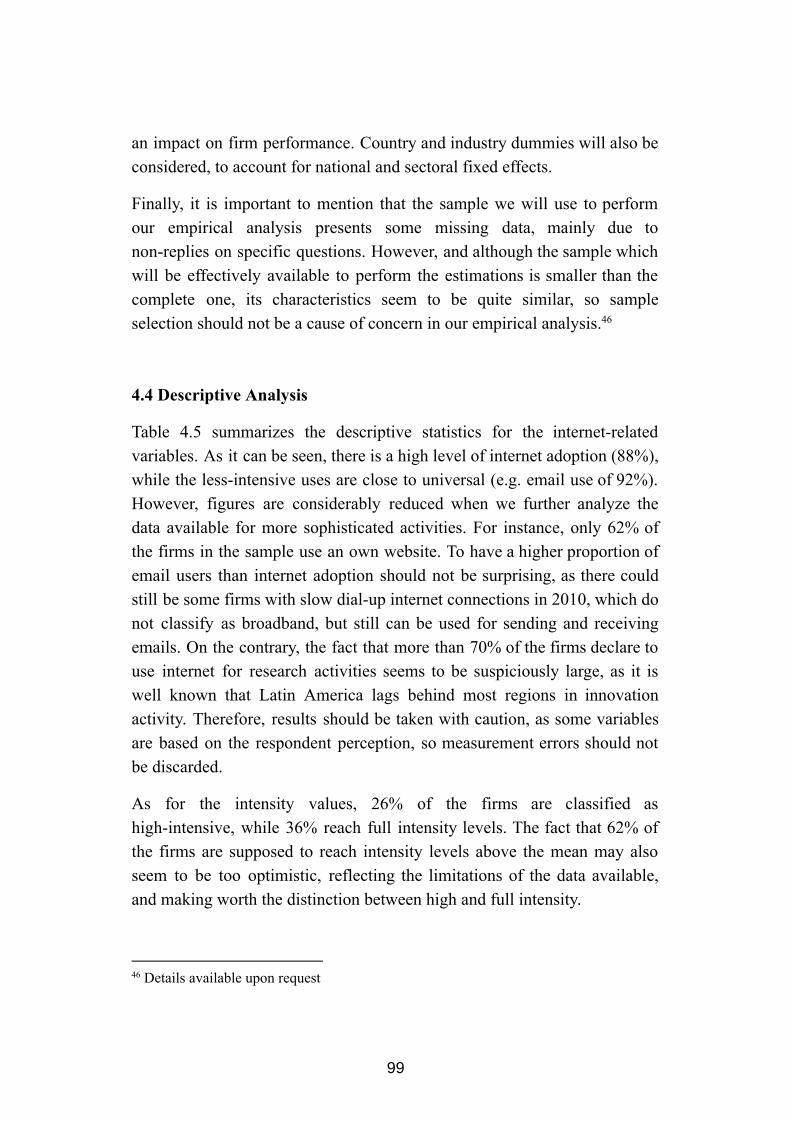
an impact on firm performance. Country and industry dummies will also be considered, to account for national and sectoral fixed effects.
Finally, it is important to mention that the sample we will use to perform our empirical analysis presents some missing data, mainly due to nonreplies on specific questions. However, and although the sample which will be effectively available to perform the estimations is smaller than the complete one, its characteristics seem to be quite similar, so sample selection should not be a cause of concern in our empirical analysis. 46
4.4 Descriptive Analysis
Table 4.5 summarizes the descriptive statistics for the internetrelated variables. As it can be seen, there is a high level of internet adoption (88%), while the lessintensive uses are close to universal (e.g. email use of 92%). However, figures are considerably reduced when we further analyze the data available for more sophisticated activities. For instance, only 62% of the firms in the sample use an own website. To have a higher proportion of email users than internet adoption should not be surprising, as there could still be some firms with slow dialup internet connections in 2010, which do not classify as broadband, but still can be used for sending and receiving emails. On the contrary, the fact that more than 70% of the firms declare to use internet for research activities seems to be suspiciously large, as it is well known that Latin America lags behind most regions in innovation activity. Therefore, results should be taken with caution, as some variables are based on the respondent perception, so measurement errors should not be discarded.
As for the intensity values, 26% of the firms are classified as highintensive, while 36% reach full intensity levels. The fact that 62% of the firms are supposed to reach intensity levels above the mean may also seem to be too optimistic, reflecting the limitations of the data available, and making worth the distinction between high and full intensity.
46 Details available upon request
99
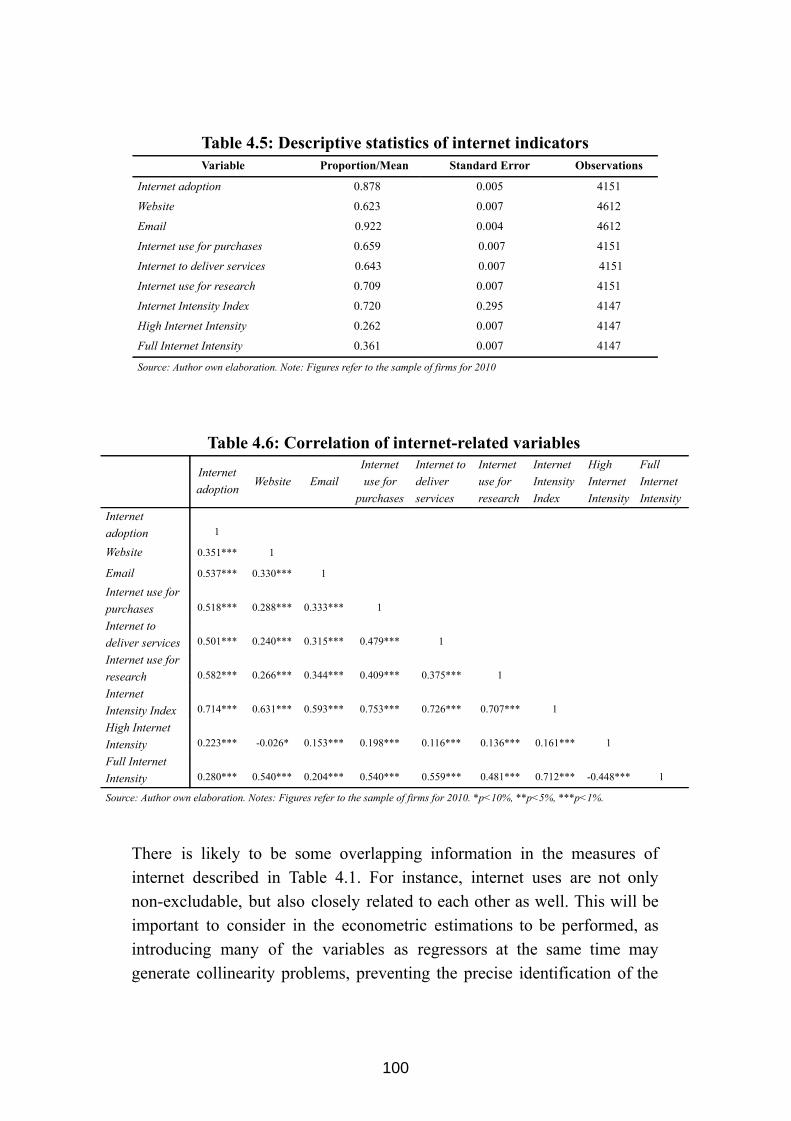
Table 4.5: Descriptive statistics of internet indicators Variable Proportion/Mean Standard Error Observations
Internet adoption 0.878 0.005 4151
Website 0.623 0.007 4612
Email 0.922 0.004 4612
Internet use for purchases 0.659 0.007 4151
Internet to deliver services 0.643 0.007 4151
Internet use for research 0.709 0.007 4151
Internet Intensity Index 0.720 0.295 4147
High Internet Intensity 0.262 0.007 4147
Full Internet Intensity 0.361 0.007 4147
Source: Author own elaboration. Note: Figures refer to the sample of firms for 2010
Table 4.6: Correlation of internetrelated variables
Internet adoption
Website Email Internet use for purchases
Internet to deliver services
Internet use for research
Internet Intensity Index
High Internet Intensity
Full Internet Intensity
Internet adoption 1
Website 0.351*** 1
Email 0.537*** 0.330*** 1
Internet use for purchases 0.518*** 0.288*** 0.333*** 1
Internet to deliver services 0.501*** 0.240*** 0.315*** 0.479*** 1
Internet use for research 0.582*** 0.266*** 0.344*** 0.409*** 0.375*** 1
Internet Intensity Index 0.714*** 0.631*** 0.593*** 0.753*** 0.726*** 0.707*** 1
High Internet Intensity 0.223*** 0.026* 0.153*** 0.198*** 0.116*** 0.136*** 0.161*** 1
Full Internet Intensity 0.280*** 0.540*** 0.204*** 0.540*** 0.559*** 0.481*** 0.712*** 0.448*** 1
Source: Author own elaboration. Notes: Figures refer to the sample of firms for 2010. *p<10%, **p<5%, ***p<1%.
There is likely to be some overlapping information in the measures of internet described in Table 4.1. For instance, internet uses are not only nonexcludable, but also closely related to each other as well. This will be important to consider in the econometric estimations to be performed, as introducing many of the variables as regressors at the same time may generate collinearity problems, preventing the precise identification of the
100
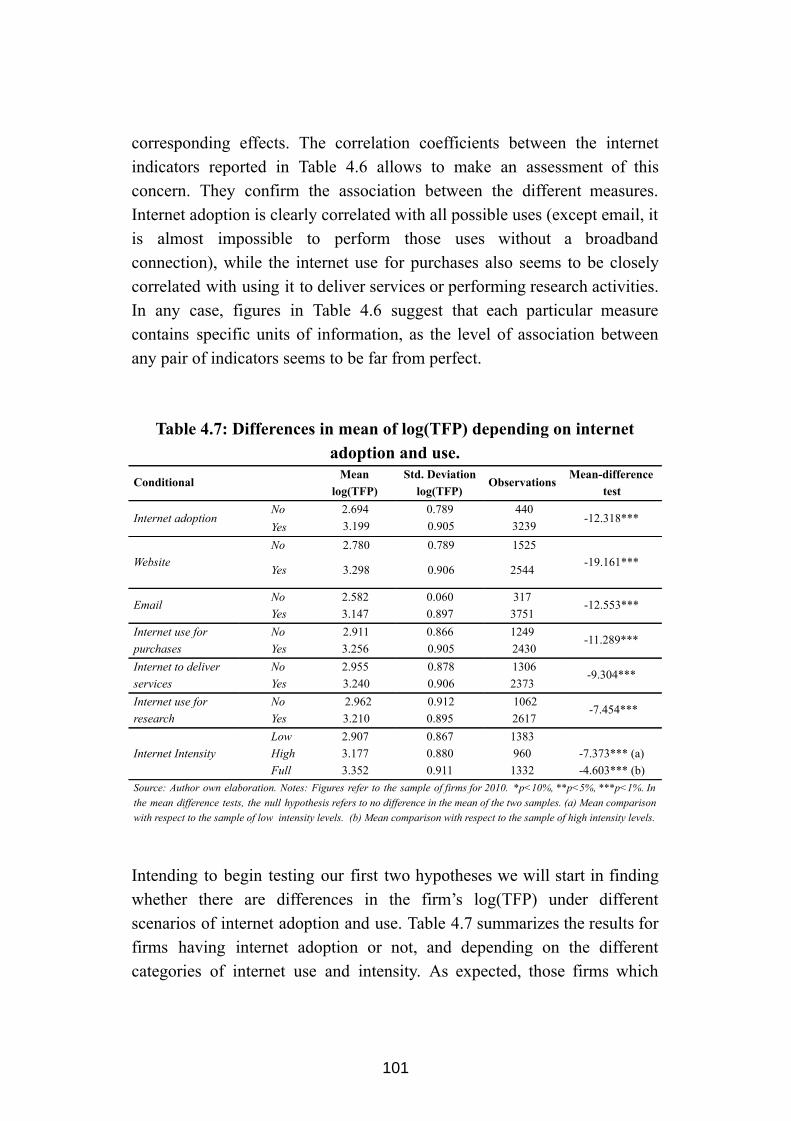
corresponding effects. The correlation coefficients between the internet indicators reported in Table 4.6 allows to make an assessment of this concern. They confirm the association between the different measures. Internet adoption is clearly correlated with all possible uses (except email, it is almost impossible to perform those uses without a broadband connection), while the internet use for purchases also seems to be closely correlated with using it to deliver services or performing research activities. In any case, figures in Table 4.6 suggest that each particular measure contains specific units of information, as the level of association between any pair of indicators seems to be far from perfect.
Table 4.7: Differences in mean of log(TFP) depending on internet adoption and use.
Conditional Mean
log(TFP) Std. Deviation log(TFP)
Observations Meandifference
test
Internet adoption No 2.694 0.789 440
12.318*** Yes 3.199 0.905 3239
Website No 2.780 0.789 1525
19.161***
Yes 3.298 0.906 2544
Email No 2.582 0.060 317
12.553*** Yes 3.147 0.897 3751
Internet use for purchases
No 2.911 0.866 1249
11.289*** Yes 3.256 0.905 2430
Internet to deliver services
No 2.955 0.878 1306
9.304*** Yes 3.240 0.906 2373
Internet use for research
No 2.962 0.912 1062
7.454*** Yes 3.210 0.895 2617
Low 2.907 0.867 1383 Internet Intensity High 3.177 0.880 960 7.373*** (a) Full 3.352 0.911 1332 4.603*** (b) Source: Author own elaboration. Notes: Figures refer to the sample of firms for 2010. *p<10%, **p<5%, ***p<1%. In the mean difference tests, the null hypothesis refers to no difference in the mean of the two samples. (a) Mean comparison with respect to the sample of low intensity levels. (b) Mean comparison with respect to the sample of high intensity levels.
Intending to begin testing our first two hypotheses we will start in finding whether there are differences in the firm’s log(TFP) under different scenarios of internet adoption and use. Table 4.7 summarizes the results for firms having internet adoption or not, and depending on the different categories of internet use and intensity. As expected, those firms which
101
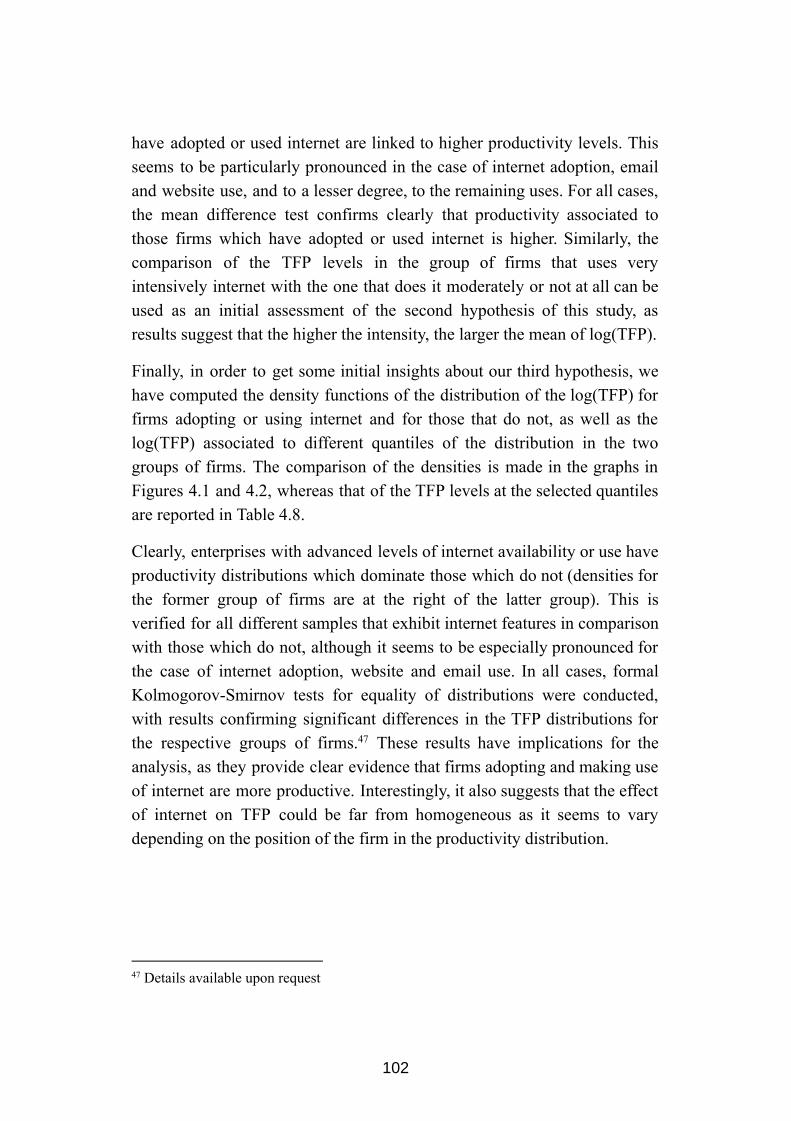
have adopted or used internet are linked to higher productivity levels. This seems to be particularly pronounced in the case of internet adoption, email and website use, and to a lesser degree, to the remaining uses. For all cases, the mean difference test confirms clearly that productivity associated to those firms which have adopted or used internet is higher. Similarly, the comparison of the TFP levels in the group of firms that uses very intensively internet with the one that does it moderately or not at all can be used as an initial assessment of the second hypothesis of this study, as results suggest that the higher the intensity, the larger the mean of log(TFP).
Finally, in order to get some initial insights about our third hypothesis, we have computed the density functions of the distribution of the log(TFP) for firms adopting or using internet and for those that do not, as well as the log(TFP) associated to different quantiles of the distribution in the two groups of firms. The comparison of the densities is made in the graphs in Figures 4.1 and 4.2, whereas that of the TFP levels at the selected quantiles are reported in Table 4.8.
Clearly, enterprises with advanced levels of internet availability or use have productivity distributions which dominate those which do not (densities for the former group of firms are at the right of the latter group). This is verified for all different samples that exhibit internet features in comparison with those which do not, although it seems to be especially pronounced for the case of internet adoption, website and email use. In all cases, formal KolmogorovSmirnov tests for equality of distributions were conducted, with results confirming significant differences in the TFP distributions for the respective groups of firms. These results have implications for the 47
analysis, as they provide clear evidence that firms adopting and making use of internet are more productive. Interestingly, it also suggests that the effect of internet on TFP could be far from homogeneous as it seems to vary depending on the position of the firm in the productivity distribution.
47 Details available upon request
102
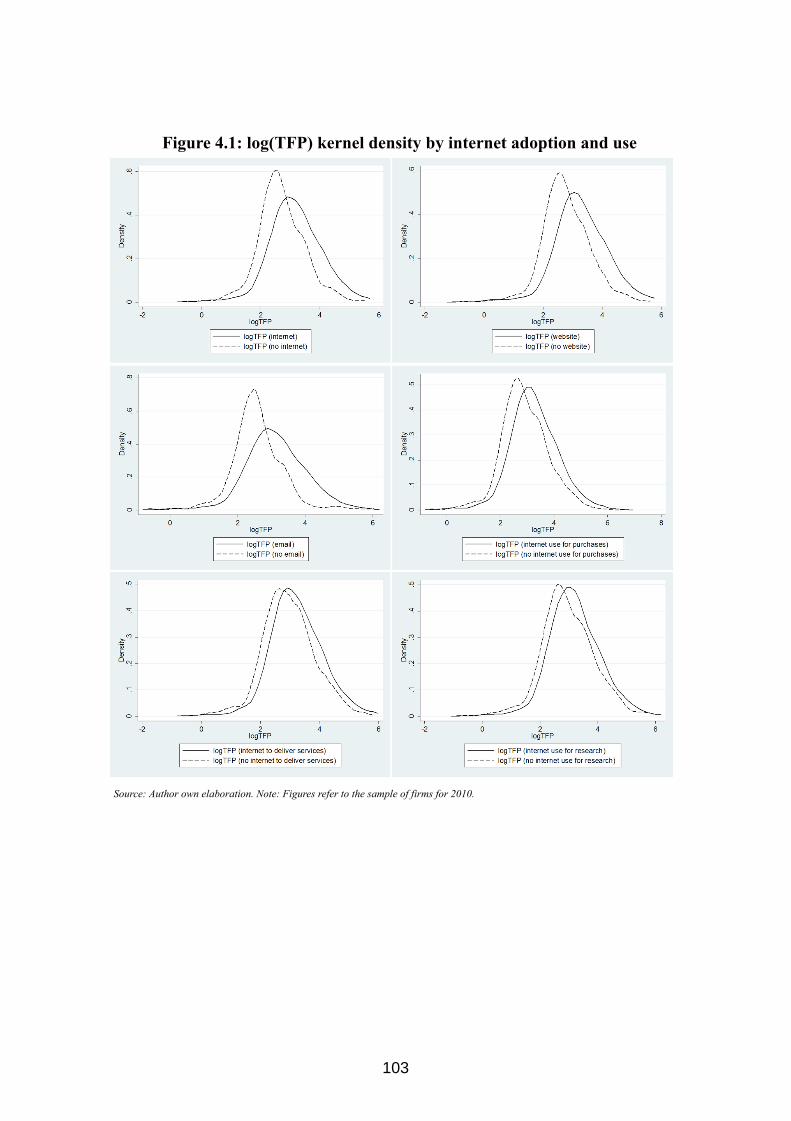
Figure 4.1: log(TFP) kernel density by internet adoption and use
Source: Author own elaboration. Note: Figures refer to the sample of firms for 2010.
103
Figure 4.2: log(TFP) kernel density by Internet Intensity
Source: Author own elaboration. Note: Figures refer to the sample of firms for 2010
Table 4.8: Differences in distribution of log(TFP) depending on internet adoption and use.
Quantile of log(TFP)
0.1 0.3 0.5 0.7 0.9
Internet adoption No 1.866 2.327 2.642 3.013 3.640
Yes 2.169 2.732 3.144 3.606 4.349
Website No 1.916 2.378 2.713 3.133 3.787
Yes 2.299 2.850 3.237 3.710 4.435
Email No 1.830 2.262 2.511 2.797 3.419
Yes 2.128 2.694 3.091 3.545 4.292
Internet use for purchases
No 1.965 2.460 2.820 3.318 4.031
Yes 2.250 2.797 3.193 3.662 4.395
Internet to deliver services
No 1.964 2.508 2.902 3.364 4.121
Yes 2.230 2.765 3.170 3.643 4.386
Internet use for research
No 1.942 2.508 2.879 3.398 4.131
Yes 2.181 2.740 3.150 3.601 4.351
Internet Intensity
Low 1.940 2.465 2.828 3.317 4.025
High 2.175 2.725 3.112 3.571 4.288
Full 2.346 2.893 3.284 3.776 4.486
Source: Author own elaboration. Note: Figures refer to the sample of firms for 2010.
104

Overall, the descriptive analysis is consistent with the hypotheses in this chapter, although a deeper analysis is required before reaching a solid conclusion. To be clear, the observed association, at the mean and in different parts of the TFP distribution, between the internet indicators and the level of firm’s TFP could be explained by other characteristics that affect both productivity and internet adoption and use. Therefore, the precise measure of the effect of internet should be estimated conditioned to the set of these other firm characteristics.
4.5 Model specification In this section, we outline the model to empirically study the link between internet and firm productivity in Latin America. We will follow a similar specification as other articles in the literature (Castany et al, 2005; De Stefano et al, 2016; GonzálezVelosa et al, 2016), using the estimated measure of TFP (in logs) as the dependent variable and considering the set of variables related to internet adoption and use, and the firm controls introduced in section 4.3 (see Tables 4.1, 4.2 and 4.4):
og(TFP ) INTERNET INNOV HK MANAGER l i = β0 + β1 i + β2 i + β3 i + β4 i
AGE SIZE EXPORT FDI LOCATION IND + β5 i + β6 i + β7 i + β8 i + β9 i + β10 i
[2]COUNTRY + β11 i + μi
where is a wellbehaved error term for firm i .μi
As stated before, possible endogeneity of the measures of internet is a potential cause of concern in the estimation of equation [2]. Endogeneity 48
can arise as a result of different reasons. On the one hand, omitted internal to the firm factors which can have an incidence in TFP and at the same time
48 It should be mentioned that endogeneity is not treated or even discussed in some previous similar studies in the literature. For instance, in their recent study Paunov and Rollo (2016) instrumented the industry adoption internet rates but did not consider an issue the endogeneity of the firmlevel internet use.
105
be related to the internet variables, as managerial talent or organizational capital for which we have no data available (as stated before, we can proxy managerial talent only through the manager experience due to the lack of data on the manager education in the sample of Latin American firms). As a positive relationship is expected between those unobservables with TFP and internet, the OLS estimation of the effect of internet will be upwardly biased. Another potential source of endogeneity is simultaneity. A common critique in this type of studies is that the estimated effect of ICT and broadband is just capturing the correlation with the firm’s productivity from which a causality effect should not be inferred. The reason is that investment in ICT may be considered as a driver of productivity, but also react to changes in productivity (Cardona et al, 2013). This reverse causality arise because mostproductive firms would have higher resources to face the costs associated to ICTs. As a result, the OLS estimated parameter would be capturing also the effect going from productivity to ICT. Finally, another source of endogeneity can be the existence of measurement errors. Examples of this can be misreporting, or internet indicators that do not fully capture its real using levels by the firm. In this case, we can expect an attenuation bias in the OLS coefficients of the internet measures, providing an estimate that is lower than the actual impact of internet on productivity.
Different actions have been carried out to tackle the issue of endogeneity of the measures of ICT. In the first place, a comprehensive list of controls for observable characteristics that are known to affect the firm’s level of productivity has been included in [2]. This is crucial due to the impossibility to directly control for firm unobservable characteristics in a crosssection setting. Besides accounting for the direct effect of these characteristics and for differences across industries and countries, they may well capture a big deal of the effect of most of the unobservables that could distort the estimation of the effect of internet on productivity. For instance, as long as innovation is affected by managerial talent, the inclusion of the former variable would be capturing in an indirect manner the effect on productivity of the latter. As a result, the pernicious impact of the omission of managerial talent in [2] on the estimated effect of internet is expected to be much lower. Similarly, FDI may also include the effect of other
106
unobservables, as foreign enterprises are usually expected to adopt better organizational practices and to have higher capability to compete in international markets. In addition, we have obtained estimates substituting the contemporaneous measures of internet when available by their corresponding lagged values, to assess the effect that simultaneity could have on the estimated effect of internet. This is a procedure used frequently in the extant literature to mitigate the problem of endogeneity due to simultaneity. Finally, the parameters in [2] have been estimated by the instrumental variables (IV) method. As usual in these situations, the major challenge is to find suitable instruments for the measures of internet. In any case, the aim of this part of the study will be to obtain the most robust empirical evidence possible to test our first two hypotheses.
In order to be able to test the third hypothesis, referred to analyze possible differences in the link between internet and TFP along the productivity distribution, we need to follow a different approach, as the methods mentioned so far only provide estimates of the coefficients at the mean. Through the descriptive analysis some insights suggested the presence of this heterogeneous link, although a more robust approach was needed in order to obtain clearer evidence. To take into account this kind of heterogeneities, the framework that has prevaded in applied economics is the CQR approach developed by Koenker and Bassett (1978), which has been used, for example, by Paunov and Rollo (2016) in their study of the effect of the industry's adoption of internet on the firm's productivity and innovation performance. The CQR estimations refer to specific points in the conditional productivity distribution, where all individuals are assumed to have the same observed characteristics, meaning that they do not correspond to the impact on the overall productivity distribution of the Latin American firms. In other words, CQR provides the estimated impact of a covariate on a quantile of the productivity distribution conditional to specific values of the other covariates. As a result of that, CQR generate results that may not be generalizable or interpretable in a policy or population context. Conversely, the UQR provides more interpretable results as it marginalizes the effect over the distributions of the other covariates in the model. As a result, in contrast with the CQR, the UQR is more appropriate when the ultimate object of interest is the effect on the
107
unconditional distribution. In the case under study, the unconditional second decile refers to low productive firms, whereas the conditional second decile refers to low productive firms conditional to the set of firm characteristics included as covariates in the specification, firms that however may not necessarily be low productive overall. Therefore, as we are especially concerned with the effect of increasing the internet adoption and use on the unconditional productivity distribution and, more precisely, on the amount of inequality in this distribution, the UQR is far more suitable to test our hypothesis.
Among the methods proposed so far to implement the UQR, we choose that proposed by Firpo et al (2009) due to its easy of computation (other alternatives include the methods by Rothe, 2010 and Frölich and Melly, 2013). The procedure by Firpo et al (2009) consists of running a regression of a transformation —a (recentered) influence function— of the outcome variable on the explanatory variables. The influence function IF(Y; νFY) of a distributional statistic ν(FY) represents the influence of an individual observation on that distributional statistic. Adding back the statistic ν(FY) to the influence function yields what the authors call as “recentered influence function” ( RIF ). As a result, the dependent variable in the regression is the RIF , and a simple OLS regression of this new dependent variable can be run on the covariates. 4.6 Results
Effects at the mean of the productivity distribution
Table 4.9 summarizes results of the OLS estimation of equation [2], using each of the available indicators of internet adoption and use introduced in section 4.3. Internet adoption seems to be related to an 11% increase in TFP in Latin American firms. In other words, firms that adopted internet are 11% more productive than similar firms that did not. The available internetrelated uses exert also a significantly positive effect, with the only exception of performing research activities. The insignificance of the
108
coefficient associated to using internet for research may be due to the fact that this kind of activities may not reach immediate effects, possibly because it takes some time to translate research into innovations and eventually to productivity gains. Another possible reason is measurement error in this variable because, as shown in the descriptive analysis, an unexpected high proportion of firms declared to use internet for research. Beyond that, there seem to be differences in the magnitude of the effect for the other internet use variables. For instance, while using an own website seems to be related with a 20% increase in TFP (significant at 1%), using internet for delivering services “only” seems to increase TFP by 8% (significant at 5%). Further estimations (columns (iv) and (viii) in Table 4.9) were considered for specifications that include more than one internetuse variables at a time. To minimize collinearity among the internet indicators, and taking into account the distinction between input and outputbased measures, we group them in two categories: those corresponding to “inputs” or “use channels”, as email and having an own website, and those proxying for final uses or “outputs”, as making purchases, delivering services, and performing research activities. Adding together website and email (column (iv) in Table 4.9) keep unchanged the coefficient and significance level for the first variable, whilst the effect for the email appears to vanish. This seems to confirm a strong link between having a website and productivity, helping the firms in its diffusion activities and improving the communication channels with potential clients and suppliers. In contrast, there does not seem to be any productivity gain for firms using email once controlling for having a website. Regarding the specifications that include all the indicators of final uses, results in column (viii) of Table 4.9 show that their estimated effects are reduced. In fact, only the effect of internet use for purchases remains as strongly statistically significant, while that for deliver services is marginally significant (at 10%) and reduces its magnitude substantially compared to the specification that includes only this use of internet (column (vi)). In order to verify the robustness of these results, additional contrasts were conducted after estimation, verifying the joint significance for all internet uses.
109
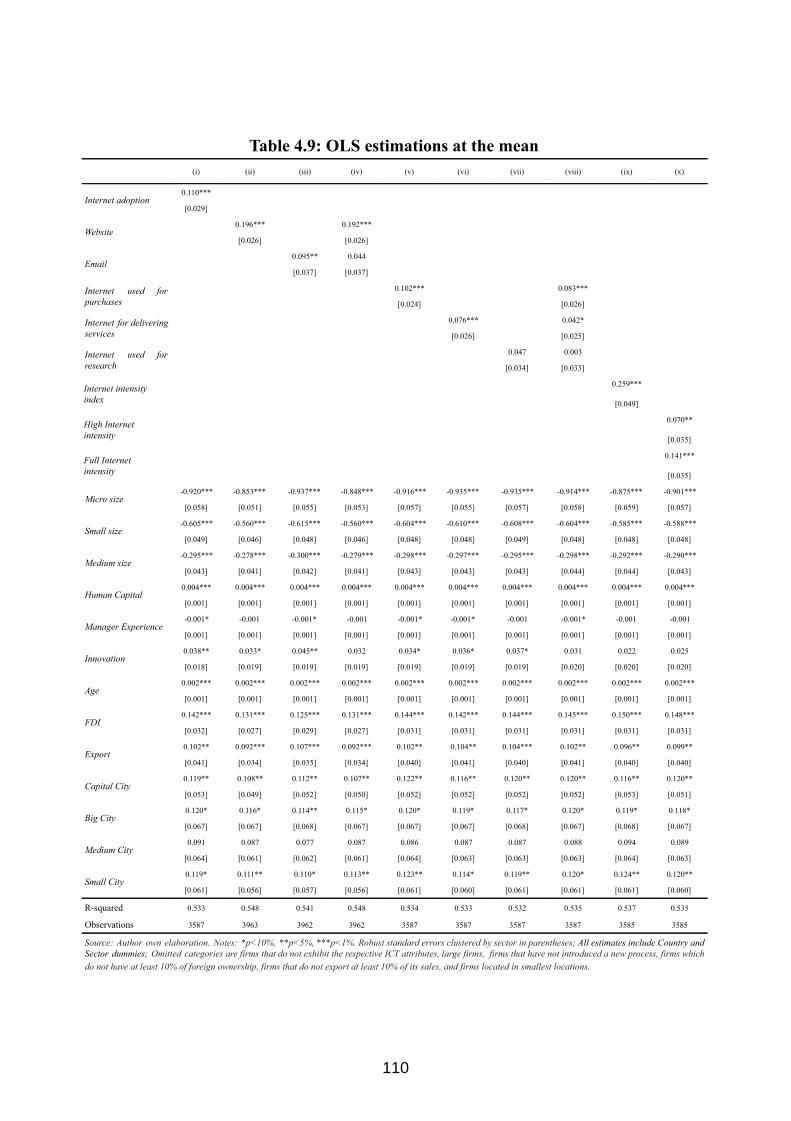
Table 4.9: OLS estimations at the mean (i) (ii) (iii) (iv) (v) (vi) (vii) (viii) (ix) (x)
Internet adoption 0.110***
[0.029]
Website 0.196*** 0.192***
[0.026] [0.026]
Email 0.095** 0.044
[0.037] [0.037]
Internet used for purchases
0.102*** 0.083***
[0.024] [0.026]
Internet for delivering services
0.076*** 0.042*
[0.026] [0.025]
Internet used for research
0.047 0.003
[0.034] [0.033]
Internet intensity index
0.259***
[0.049]
High Internet intensity
0.070**
[0.035]
Full Internet intensity
0.141***
[0.035]
Micro size 0.920*** 0.853*** 0.937*** 0.848*** 0.916*** 0.935*** 0.935*** 0.914*** 0.875*** 0.901***
[0.058] [0.051] [0.055] [0.053] [0.057] [0.055] [0.057] [0.058] [0.059] [0.057]
Small size 0.605*** 0.560*** 0.615*** 0.560*** 0.604*** 0.610*** 0.608*** 0.604*** 0.585*** 0.588***
[0.049] [0.046] [0.048] [0.046] [0.048] [0.048] [0.049] [0.048] [0.048] [0.048]
Medium size 0.295*** 0.278*** 0.300*** 0.279*** 0.298*** 0.297*** 0.295*** 0.298*** 0.292*** 0.290***
[0.043] [0.041] [0.042] [0.041] [0.043] [0.043] [0.043] [0.044] [0.044] [0.043]
Human Capital 0.004*** 0.004*** 0.004*** 0.004*** 0.004*** 0.004*** 0.004*** 0.004*** 0.004*** 0.004***
[0.001] [0.001] [0.001] [0.001] [0.001] [0.001] [0.001] [0.001] [0.001] [0.001]
Manager Experience 0.001* 0.001 0.001* 0.001 0.001* 0.001* 0.001 0.001* 0.001 0.001
[0.001] [0.001] [0.001] [0.001] [0.001] [0.001] [0.001] [0.001] [0.001] [0.001]
Innovation 0.038** 0.033* 0.045** 0.032 0.034* 0.036* 0.037* 0.031 0.022 0.025
[0.018] [0.019] [0.019] [0.019] [0.019] [0.019] [0.019] [0.020] [0.020] [0.020]
Age 0.002*** 0.002*** 0.002*** 0.002*** 0.002*** 0.002*** 0.002*** 0.002*** 0.002*** 0.002***
[0.001] [0.001] [0.001] [0.001] [0.001] [0.001] [0.001] [0.001] [0.001] [0.001]
FDI 0.142*** 0.131*** 0.125*** 0.131*** 0.144*** 0.142*** 0.144*** 0.145*** 0.150*** 0.148***
[0.032] [0.027] [0.029] [0.027] [0.031] [0.031] [0.031] [0.031] [0.031] [0.031]
Export 0.102** 0.092*** 0.107*** 0.092*** 0.102** 0.104** 0.104*** 0.102** 0.096** 0.099**
[0.041] [0.034] [0.035] [0.034] [0.040] [0.041] [0.040] [0.041] [0.040] [0.040]
Capital City 0.119** 0.108** 0.112** 0.107** 0.122** 0.116** 0.120** 0.120** 0.116** 0.120**
[0.053] [0.049] [0.052] [0.050] [0.052] [0.052] [0.052] [0.052] [0.053] [0.051]
Big City 0.120* 0.116* 0.114** 0.115* 0.120* 0.119* 0.117* 0.120* 0.119* 0.118*
[0.067] [0.067] [0.068] [0.067] [0.067] [0.067] [0.068] [0.067] [0.068] [0.067]
Medium City 0.091 0.087 0.077 0.087 0.086 0.087 0.087 0.088 0.094 0.089
[0.064] [0.061] [0.062] [0.061] [0.064] [0.063] [0.063] [0.063] [0.064] [0.063]
Small City 0.119* 0.111** 0.110* 0.113** 0.123** 0.114* 0.119** 0.120* 0.124** 0.120**
[0.061] [0.056] [0.057] [0.056] [0.061] [0.060] [0.061] [0.061] [0.061] [0.060]
Rsquared 0.533 0.548 0.541 0.548 0.534 0.533 0.532 0.535 0.537 0.535
Observations 3587 3963 3962 3962 3587 3587 3587 3587 3585 3585
Source: Author own elaboration. Notes: *p<10%, **p<5%, ***p<1%. Robust standard errors clustered by sector in parentheses; All estimates include Country and Sector dummies; Omitted categories are firms that do not exhibit the respective ICT attributes, large firms, firms that have not introduced a new process, firms which do not have at least 10% of foreign ownership, firms that do not export at least 10% of its sales, and firms located in smallest locations .
110
Finally, the last two columns in Table 4.9 summarise results obtained when using the internet intensity variables, which synthesizes the information contained in all the internet measures. In column (ix), the original index is included as a regressor, whereas the results when using the three categories defined based on the values of the index (low, high, and full internet intensity) are shown in column (x). Results are very clear in the sense that, as hypothesized, a higher intensity of use is linked to more productive firms. An increase of one standard deviation in the intensity index raises 0.013% the level of TFP, an estimated effect that is highly significant. Similarly, results in column (x) for the dummy variables denoting firms with high and full intensive uses of internet confirm the productivityenhancing effect of using internet intensively: the TFP level for firms with a high intensive use is about 7 percentage points higher than otherwise similar firms that make a low use. The gap increases even further for firms that perform all possible uses, up to 14 percentage points. This is reasonable in the sense that internet connectivity does not guarantee productivity gains per se, but only if used in activities that allow the firm to reduce production and distribution costs, improve the management and control of the different processes, increase the amount of relevant information, and the like. The positive and significant coefficients of these intensity indicators confirm the importance of simultaneously using internet in various aspects of business activity in order to obtain productivity gains. The combined use of internet for different activities seems to be relevant beyond the individual uses. Overall, these results seem to confirm that simple access to technology is not sufficient to obtain a performance improvement, instead using it adequately is necessary in order to fully exploit its potential. Therefore, these results provide evidence supporting our second hypothesis.
Although they are not the main focus of the analysis in this chapter, it is worth mentioning that the estimated effect of all the firm characteristics included in the model as control variables is in line with that expected on a priori grounds, and consistent with what has been reported in the previous literature. Firm size is positively associated with productivity, as the coefficients for the micro, small and medium sized firms are, in all cases, significantly negative (the omitted category is large firms). Once controlling
111
by size, the productivity of the Latin American firms increase with their age in a quite robust manner. There is also a significant positive association with productivity of human capital and internationalization, both in terms of FDI and export activity. The estimated effect of innovation is also positive although it is only marginally significant in some specifications, whereas the manager’s experience does not seem to affect the level of productivity once the other sources of heterogeneity have been taken into account. On the other hand, estimates for the coefficients of the location variables support somehow the existence of benefits linked to agglomeration/urbanization economies, despite some of the estimated effects are only marginally significant, and it seems that firms in small cities have on average similar levels of productivity to those in big cities, and even in capital cities. Finally, the significance of the industry and country fixed effects confirms the existence of differences between firms in different sectors of activity and in different countries. 49
However, as discussed before, the OLS method is likely to provide biased estimates of the causal effect of internet if the variables proxying for this factor are endogenous. As discussed in section 4.5, the comprehensive list of observable characteristics included in the specifications used to estimate the effect of internet should, hopefully, mitigate the pernicious effect of endogeneity. Still, as a sort of robustness check, we have considered all the possibilities at hand to address this issue. In the first place, we took advantage of the fact that the Latin America 2006 wave of the WBES included information about two of the internet related variables: email and website. As a result, we were able to replace the contemporaneous values for these measures with the values reported in 2006, for a subsample of enterprises. Using lagged values of the firm characteristics has been common practice in the literature related, for instance, to innovation (Seker, 2012). Due to data limitations, only 606 enterprises could be considered in this analysis, which is exposed in detail in Table A4.4 in Appendix. Parameters estimated using the contemporaneous values (observed in 2010) and those reported in 2006 seem to be close in comparison, which suggests that any estimation bias using the contemporaneous data seems to be
49 Joint significance tests were conducted respectively to sectoral and country variables in order to confirm this assertion.
112
limited. It is worth noting that this argument would be valid only under the assumption of far from perfect persistence in the measures of internet. In other words, if there is not high correlation between the values observed in 2010 and 2006, which seems to be the case in our exercise (correlation for email is 0.310 and for website 0.394). It is also worth to mention that the characteristics of the subsample for which this check was implemented are roughly similar to the full one, implying that sample selection is not a concern. With due caution, our reading of these results is that the OLS 50
estimates discussed above should not be strongly affected by reverse causality.
Regarding the implementation of the IV estimator, as was already mentioned in section 4.5 it has been quite challenging to find suitable instruments for the measures of the firm's adoption and use of internet. Highly conditioned by the availability of information in the WBES dataset, we have considered different sets of variables as instruments. In the first place, the 4year lagged values of the email and website indicators for the subsample of firms for which they are available. As indicated above, these lagged indicators correlate with the contemporaneous measures and are supposed not to affect directly the current level of productivity once the contemporaneous values are included in the model. Secondly, we have computed a set of instruments by interacting countrylevel telecom indicators measured a decade before (fixed telephone lines and internet users every 100 inhabitants, with a 10year lag) with the firm age and size (further details on these instruments are provided in the Appendix). The idea behind these instruments is that higher adoption and use is expected for firms in environments that are more prone to the telecom technology. It is also assumed that this effect of the environment is likely to vary within each country depending on the age and size of the firms. In brief, the internet adoption and use by firms observed in 2010 are supposed to correlate with the penetration of the telecom technologies in the country ten years before, with differences across firms depending on the age and size. On the other hand, it is assumed that these aggregate measures do not correlate with the
50 Detail available upon request
113
shocks that affect the productivity of single firms (error term in equation [2]).
All the IV estimations using these instruments were performed following the limitedinformation maximum likelihood (IVLIML) procedure, which has proven to be more suitable than the TwoStage Least Squares in the presence of weak instruments (coefficients and standard deviations estimated through IVLIML should be less affected by the weakness of the instruments). Instruments based on lagged email and website variables were found to be strong, but presented concerns in terms of the compliance of the exclusion restrictions. On the other hand, countrylevel instruments verify clearly with exclusion restrictions, but seemed to be significantly weaker. Results are exposed in detail in Tables A4.6 to A4.8 in the Appendix, suggesting that the effect of internet adoption and use on TFP could be higher than those suggested by the OLS estimations. Therefore, with due caution due to the concerns about the suitability of the instruments, we can consider the OLS estimated coefficients to represent a lowerbound of the causal effect of internet on TFP.
Effects along the productivity distribution
In order to test our third hypothesis, i.e. the heterogenous effect of internet along the productivity distribution and, consequently, the impact that the increase in the internet adoption and use could have on productivity inequality among Latin American firms, we extend the analysis to consider results from UQR. Before discussing the results, two comments are in order. The first one has to do with the interpretation of the estimated effects in this case. As mentioned in section 4.5, UQR allow estimating the impact of a change in the variable of interest on each quantile of the actual (unconditional) productivity distribution. Adapting the argument in Fournier and Koske (2012) to the case of this study, UQR allow estimating the effect on the level of productivity of a particular quantile of increasing by 1 percentage point the share of firms using internet, holding the other firm characteristics constant. In addition, implications for the impact on the amount of inequality in the productivity distribution can be inferred from
114
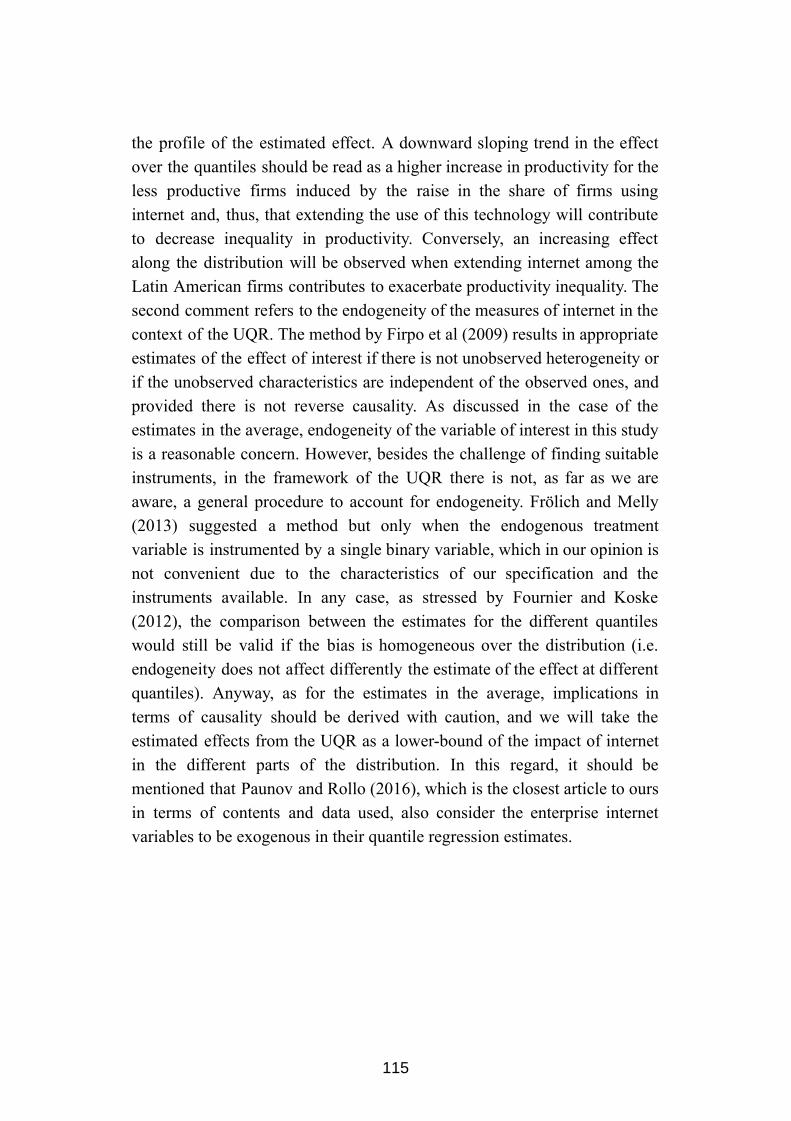
the profile of the estimated effect. A downward sloping trend in the effect over the quantiles should be read as a higher increase in productivity for the less productive firms induced by the raise in the share of firms using internet and, thus, that extending the use of this technology will contribute to decrease inequality in productivity. Conversely, an increasing effect along the distribution will be observed when extending internet among the Latin American firms contributes to exacerbate productivity inequality. The second comment refers to the endogeneity of the measures of internet in the context of the UQR. The method by Firpo et al (2009) results in appropriate estimates of the effect of interest if there is not unobserved heterogeneity or if the unobserved characteristics are independent of the observed ones, and provided there is not reverse causality. As discussed in the case of the estimates in the average, endogeneity of the variable of interest in this study is a reasonable concern. However, besides the challenge of finding suitable instruments, in the framework of the UQR there is not, as far as we are aware, a general procedure to account for endogeneity. Frölich and Melly (2013) suggested a method but only when the endogenous treatment variable is instrumented by a single binary variable, which in our opinion is not convenient due to the characteristics of our specification and the instruments available. In any case, as stressed by Fournier and Koske (2012), the comparison between the estimates for the different quantiles would still be valid if the bias is homogeneous over the distribution (i.e. endogeneity does not affect differently the estimate of the effect at different quantiles). Anyway, as for the estimates in the average, implications in terms of causality should be derived with caution, and we will take the estimated effects from the UQR as a lowerbound of the impact of internet in the different parts of the distribution. In this regard, it should be mentioned that Paunov and Rollo (2016), which is the closest article to ours in terms of contents and data used, also consider the enterprise internet variables to be exogenous in their quantile regression estimates.
115
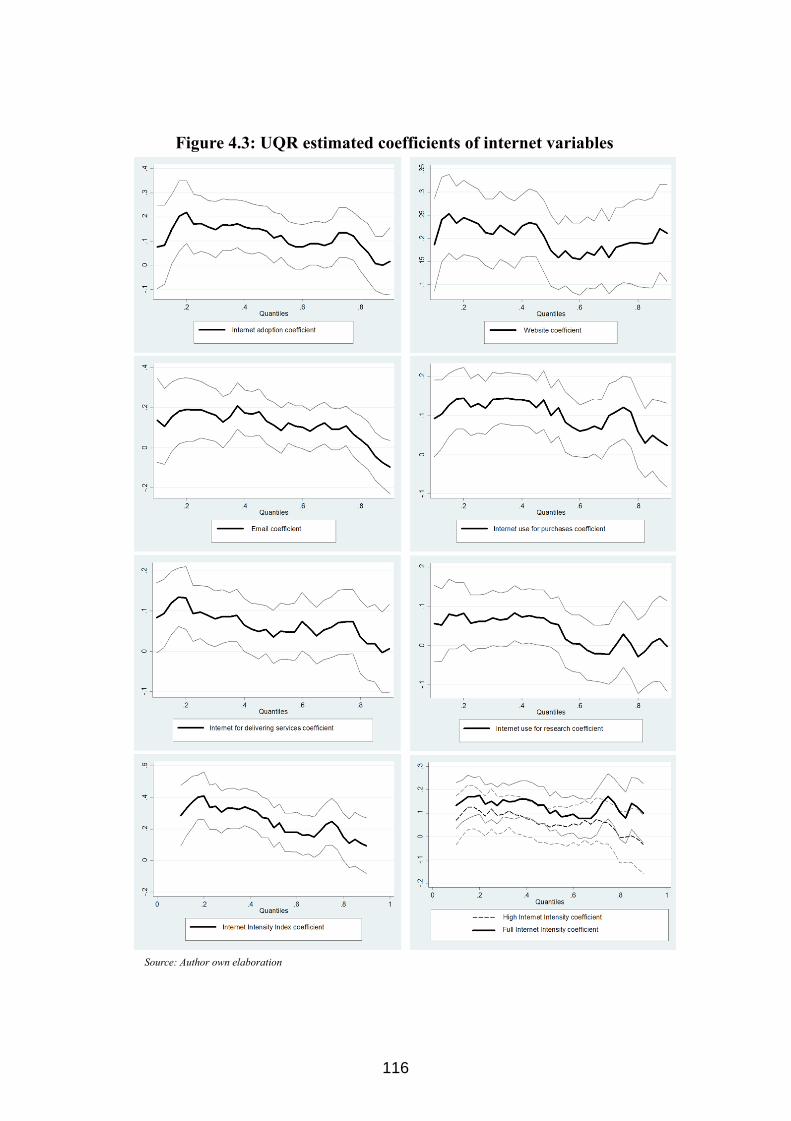
Figure 4.3: UQR estimated coefficients of internet variables
Source: Author own elaboration
116
The unconditional effect of the different measures of internet has been estimated at different points of the log(TFP) distribution. Figure 4.3 summarizes the estimated coefficients, for each internet variable, along with their respective 95% confidence intervals (further details are provided in Table A4.9 in the Appendix). For instance, it can be observed that if the percentage of firms adopting internet increases in 10 percentage points, the TFP at the second decile will increase by 2.2%, by 1.6% at the median, while TFP on the seventh decile will only increase by 1%. In most cases, the effect at the median seems to be close to that estimated for the mean, with higher values at the left of the distribution and lower at the right. The highest coefficients are reached in most cases at the second decile, after which the coefficients start to decrease consistently to become negligible in most cases at the rightend of the productivity distribution.
This is consistent with a situation in which enterprises with lower levels of productivity are able to yield bigger gains as a results of the extension in the use of internet than more productive firms, as are playing catchup, with higher potential to grow as are starting from behind. As stated before, firms that are lagging behind surely faced important constraints in comparison to the most advanced ones, as having lower access to offline knowledge networks, and facing bigger difficulties to enlarge its interactions with clients and suppliers, as well as facing other restrictions derived from its environment. By adopting and using internet, those difficulties may be partially reverted, yielding as a result productivity performance gains that are comparatively larger than those of more productive firms. The economic implications in this case suggest that internet adoption and use may contribute to decrease TFP differences between enterprises in the long term –promoting a level playing field–, as inequalities on TFP distribution seem to be reduced. Similar conclusions can be drawn with respect to most of the alternative internet uses (email use, internet used for purchases, internet for deliver services, and internet used for research), as the impact on productivity of increasing the share of firms making these uses seems to be much higher at lower quantiles of the productivity distribution. In the case of using an own website, the effect is higher for the less productive firms, as the coefficient evidences decreasing results from the median, although it increases for the most productive firms. This should be
117
explained by the fact that it is possible that having an own website presents the potential for higher productivity gains if used intensively, something than only the more productive firms should have the resources to fully exploit. For instance, most productive firms may have more developed websites, which could be used as platforms for ecommerce and interaction with customers, in contrast with more disadvantaged firms that may have more primitive sites. Moreover, the possibility of registering clients in the firm’s website creates the opportunity to collect, store and manipulate massive data from customers, which provides very useful statistical reports and predictive models for business analysis that can give key information to the firm, in order to understand the necessities of its clients, design better offers, and conduct more sophisticated diffusion and marketing activities. This kind of tasks are well beyond the capabilities of smaller or less productive firms.
Beyond individual internet adoption and use, intensity levels were also tested through the UQR approach. As can be seen, in this case also the highest coefficients are reached at the lower end of the distribution, decreasing from that point. However, significant and positive coefficients are still reached at some upper deciles, meaning that extending the intensive use of internet seems to also provide higher returns for firms with high levels of productivity.
Overall, the downwardsloping trend over the TFP distribution of the effect of increasing the share of firms using internet, and doing it intensively, provides support to the third hypothesis of this chapter. That is to say, the evidence suggest that extending the use of these ICT technologies among Latin American firms contributes to reduce inequality in productivity levels. This is a result that, as far as we are aware, has not been reported in the extant literature neither for the Latin America region nor for any other developed or developing economy or group of economies.
4.7 Final remarks
To summarize, this chapter contributes to the empirical literature by exploring the link between internet and productivity in Latin American
118
firms. Through our empirical analysis, we found robust empirical evidence on the positive relationship between internet and firmperformance. In particular, internet adoption and use seems to constitute a source of productivity growth for Latin American firms. Secondly, higher intensity of internet use in firms seems to be linked with bigger productivity gains. These results seem to prove our two first hypotheses, and are aligned with previous ICT literature in the developed world, which suggests that internet plays an important role as innovation enabler and productivity enhancer. In third place, and providing novel evidence in the literature, lowmedium productive firms seem to benefit more from internet adoption and use, in comparison with those with higher productivity levels, verifying our third hypothesis that the impact of the new technologies on productivity levels does not seem to be uniform for all enterprises. In fact, it seems that internet adoption contributes to decrease TFP differences between enterprises, as inequalities on its distribution seem to be reduced.
The availability of this new empirical evidence specific for Latin America may offer useful insights to policymakers for the design and implementation of initiatives aimed at fostering productivity by increasing broadband connectivity. From a policy perspective, the evidence found in this article supports the initiatives that have been promoting most Latin American governments, as Digital Agendas and National Broadband plans, as well as the effort being made by the telecommunications industry, under the form of investments for network deployments. In the case of governments, promoting internet adoption and use at firm level may be seen as a tool to reduce disparities among enterprises, promoting a level playing field, something which is especially relevant for Latin America, as one of the most unequal regions in the world. From a longterm perspective, these results can potentially suggest very important consequences for Latin America.
However, our analysis has been limited by two main reasons. In first place, while we were able to perform robustness analysis controlling endogeneity in estimations at the mean, it has not been possible to extend those controls to the UQR analysis. For that reason, causality implications of our UQR analysis must be taken with caution, and will have to be further addressed
119
in future research. In second place, limitations on data availability prevented us to make a much richer analysis. Future research should intend to find out why some firms are able to extract more productivity gains from technology in comparison with others. Also, further research may also look at the role of the national ICT industry. For example, the possibility of a country to produce software adapted to the needs of local firms may play a role not only on ICTs adoption decisions, but also in the impact of ICTs on the firm performance, once adopted. These extensions may provide a deeper understanding of the linkages between ICTs and firm performance, and on the characteristics that effective public policies should have.
120
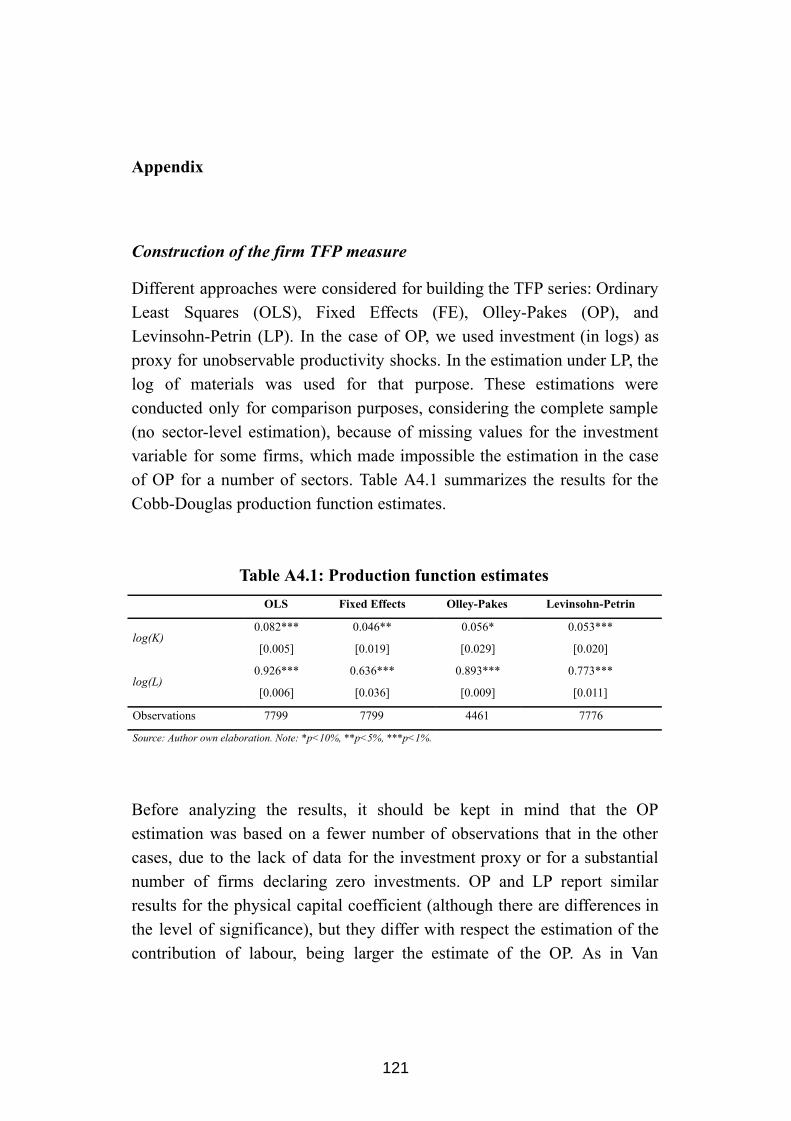
Appendix
Construction of the firm TFP measure
Different approaches were considered for building the TFP series: Ordinary Least Squares (OLS), Fixed Effects (FE), OlleyPakes (OP), and LevinsohnPetrin (LP). In the case of OP, we used investment (in logs) as proxy for unobservable productivity shocks. In the estimation under LP, the log of materials was used for that purpose. These estimations were conducted only for comparison purposes, considering the complete sample (no sectorlevel estimation), because of missing values for the investment variable for some firms, which made impossible the estimation in the case of OP for a number of sectors. Table A4.1 summarizes the results for the CobbDouglas production function estimates.
Table A4.1: Production function estimates OLS Fixed Effects OlleyPakes LevinsohnPetrin
log(K) 0.082*** 0.046** 0.056* 0.053***
[0.005] [0.019] [0.029] [0.020]
log(L) 0.926*** 0.636*** 0.893*** 0.773***
[0.006] [0.036] [0.009] [0.011]
Observations 7799 7799 4461 7776
Source: Author own elaboration. Note: *p<10%, **p<5%, ***p<1%.
Before analyzing the results, it should be kept in mind that the OP estimation was based on a fewer number of observations that in the other cases, due to the lack of data for the investment proxy or for a substantial number of firms declaring zero investments. OP and LP report similar results for the physical capital coefficient (although there are differences in the level of significance), but they differ with respect the estimation of the contribution of labour, being larger the estimate of the OP. As in Van
121
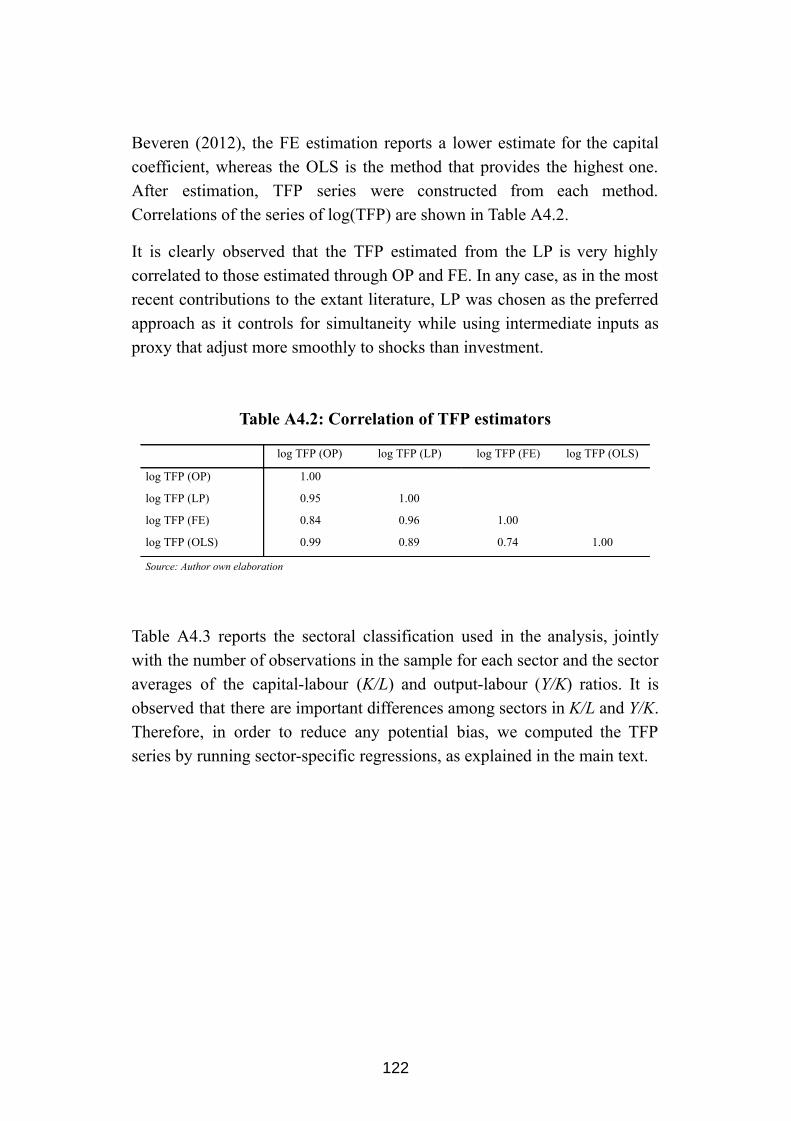
Beveren (2012), the FE estimation reports a lower estimate for the capital coefficient, whereas the OLS is the method that provides the highest one. After estimation, TFP series were constructed from each method. Correlations of the series of log(TFP) are shown in Table A4.2.
It is clearly observed that the TFP estimated from the LP is very highly correlated to those estimated through OP and FE. In any case, as in the most recent contributions to the extant literature, LP was chosen as the preferred approach as it controls for simultaneity while using intermediate inputs as proxy that adjust more smoothly to shocks than investment.
Table A4.2: Correlation of TFP estimators
log TFP (OP) log TFP (LP) log TFP (FE) log TFP (OLS)
log TFP (OP) 1.00
log TFP (LP) 0.95 1.00
log TFP (FE) 0.84 0.96 1.00
log TFP (OLS) 0.99 0.89 0.74 1.00
Source: Author own elaboration Table A4.3 reports the sectoral classification used in the analysis, jointly with the number of observations in the sample for each sector and the sector averages of the capitallabour ( K/L ) and outputlabour ( Y/K ) ratios. It is observed that there are important differences among sectors in K/L and Y/K . Therefore, in order to reduce any potential bias, we computed the TFP series by running sectorspecific regressions, as explained in the main text.
122
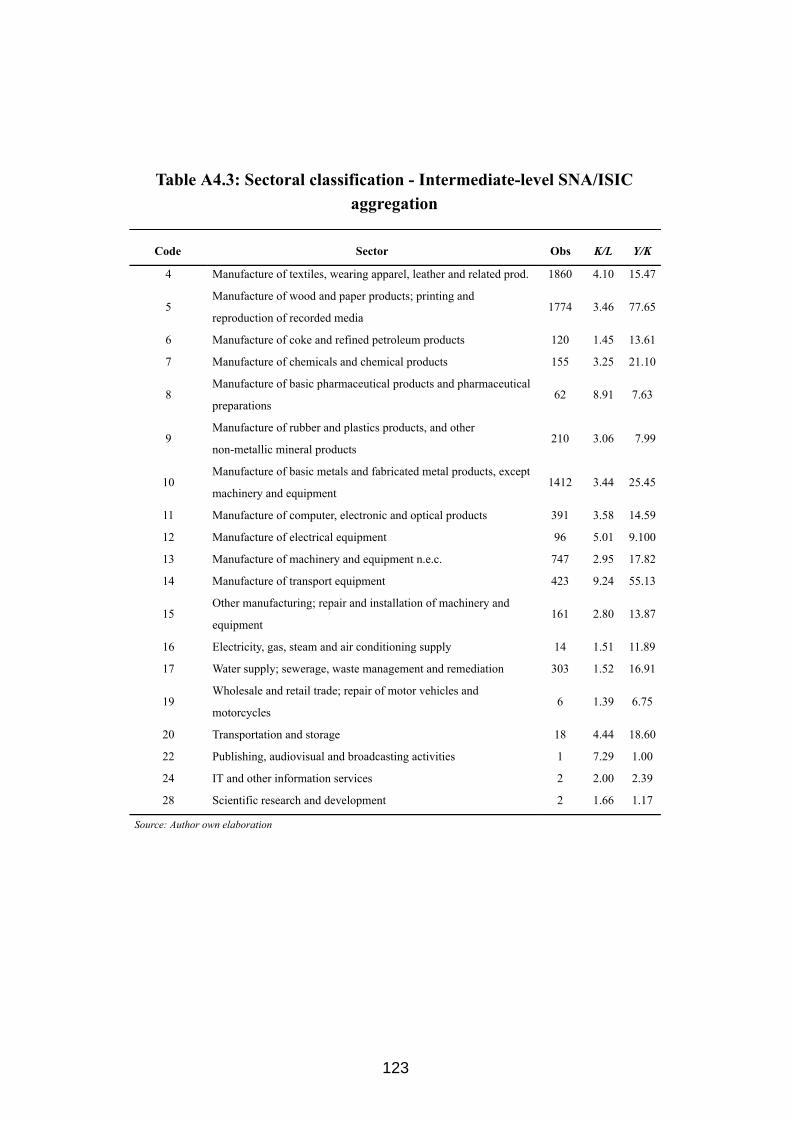
Table A4.3: Sectoral classification Intermediatelevel SNA/ISIC aggregation
Code Sector Obs K/L Y/K
4 Manufacture of textiles, wearing apparel, leather and related prod. 1860 4.10 15.47
5 Manufacture of wood and paper products; printing and
reproduction of recorded media 1774 3.46 77.65
6 Manufacture of coke and refined petroleum products 120 1.45 13.61
7 Manufacture of chemicals and chemical products 155 3.25 21.10
8 Manufacture of basic pharmaceutical products and pharmaceutical
preparations 62 8.91 7.63
9 Manufacture of rubber and plastics products, and other
nonmetallic mineral products 210 3.06 7.99
10 Manufacture of basic metals and fabricated metal products, except
machinery and equipment 1412 3.44 25.45
11 Manufacture of computer, electronic and optical products 391 3.58 14.59
12 Manufacture of electrical equipment 96 5.01 9.100
13 Manufacture of machinery and equipment n.e.c. 747 2.95 17.82
14 Manufacture of transport equipment 423 9.24 55.13
15 Other manufacturing; repair and installation of machinery and
equipment 161 2.80 13.87
16 Electricity, gas, steam and air conditioning supply 14 1.51 11.89
17 Water supply; sewerage, waste management and remediation 303 1.52 16.91
19 Wholesale and retail trade; repair of motor vehicles and
motorcycles 6 1.39 6.75
20 Transportation and storage 18 4.44 18.60
22 Publishing, audiovisual and broadcasting activities 1 7.29 1.00
24 IT and other information services 2 2.00 2.39
28 Scientific research and development 2 1.66 1.17
Source: Author own elaboration
123
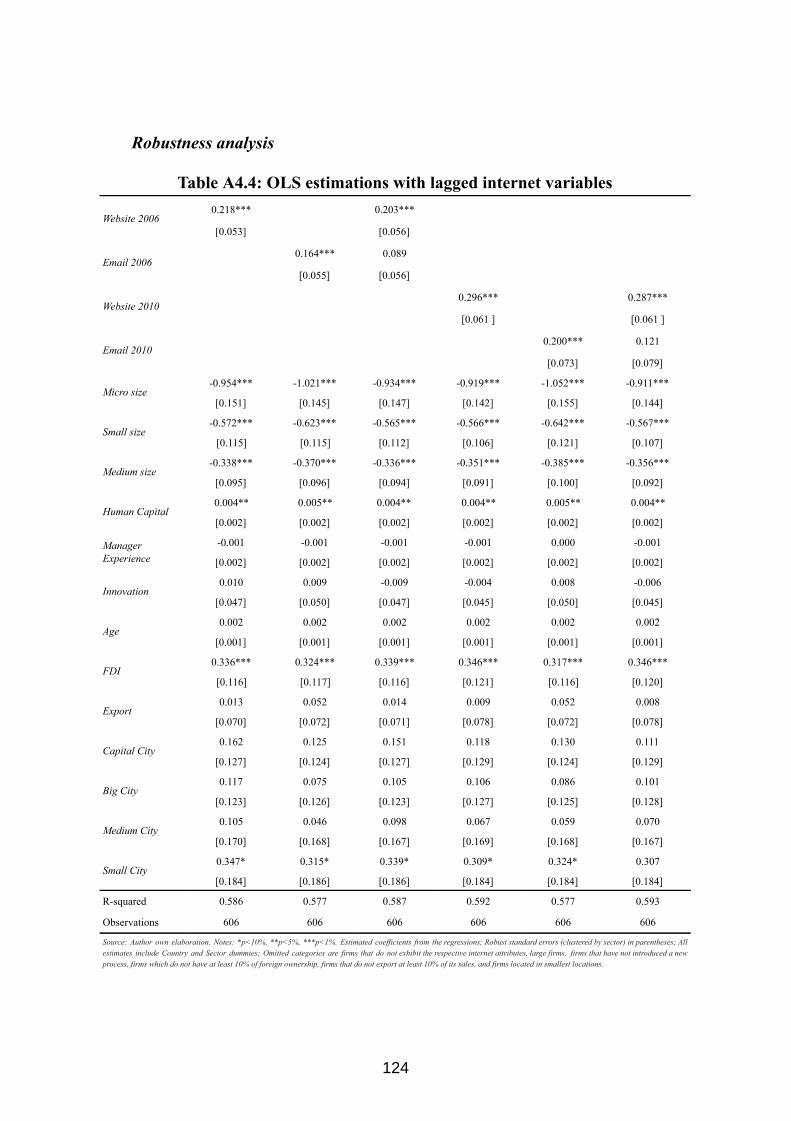
Robustness analysis
Table A4.4: OLS estimations with lagged internet variables
Website 2006 0.218*** 0.203***
[0.053] [0.056]
Email 2006 0.164*** 0.089 [0.055] [0.056]
Website 2010 0.296*** 0.287*** [0.061 ] [0.061 ]
Email 2010 0.200*** 0.121 [0.073] [0.079]
Micro size 0.954*** 1.021*** 0.934*** 0.919*** 1.052*** 0.911*** [0.151] [0.145] [0.147] [0.142] [0.155] [0.144]
Small size 0.572*** 0.623*** 0.565*** 0.566*** 0.642*** 0.567*** [0.115] [0.115] [0.112] [0.106] [0.121] [0.107]
Medium size 0.338*** 0.370*** 0.336*** 0.351*** 0.385*** 0.356*** [0.095] [0.096] [0.094] [0.091] [0.100] [0.092]
Human Capital 0.004** 0.005** 0.004** 0.004** 0.005** 0.004** [0.002] [0.002] [0.002] [0.002] [0.002] [0.002]
Manager Experience
0.001 0.001 0.001 0.001 0.000 0.001 [0.002] [0.002] [0.002] [0.002] [0.002] [0.002]
Innovation 0.010 0.009 0.009 0.004 0.008 0.006 [0.047] [0.050] [0.047] [0.045] [0.050] [0.045]
Age 0.002 0.002 0.002 0.002 0.002 0.002 [0.001] [0.001] [0.001] [0.001] [0.001] [0.001]
FDI 0.336*** 0.324*** 0.339*** 0.346*** 0.317*** 0.346*** [0.116] [0.117] [0.116] [0.121] [0.116] [0.120]
Export 0.013 0.052 0.014 0.009 0.052 0.008 [0.070] [0.072] [0.071] [0.078] [0.072] [0.078]
Capital City 0.162 0.125 0.151 0.118 0.130 0.111 [0.127] [0.124] [0.127] [0.129] [0.124] [0.129]
Big City 0.117 0.075 0.105 0.106 0.086 0.101 [0.123] [0.126] [0.123] [0.127] [0.125] [0.128]
Medium City 0.105 0.046 0.098 0.067 0.059 0.070 [0.170] [0.168] [0.167] [0.169] [0.168] [0.167]
Small City 0.347* 0.315* 0.339* 0.309* 0.324* 0.307 [0.184] [0.186] [0.186] [0.184] [0.184] [0.184]
Rsquared 0.586 0.577 0.587 0.592 0.577 0.593 Observations 606 606 606 606 606 606 Source: Author own elaboration. Notes: *p<10%, **p<5%, ***p<1%. Estimated coefficients from the regressions; Robust standard errors (clustered by sector) in parentheses; All estimates include Country and Sector dummies; Omitted categories are firms that do not exhibit the respective internet attributes, large firms, firms that have not introduced a new process, firms which do not have at least 10% of foreign ownership, firms that do not export at least 10% of its sales, and firms located in smallest locations.
124
In line with previous studies, a way to mitigate the pernicious effect of endogeneity is to use the lagged value of the endogenous regressor rather than the contemporaneous value. For instance, in an study of the impact of trade on innovation and labour growth for a firmlevel sample of emerging regions, Seker (2012) use a 3period lag of its export and import variables to check for the robustness of the results.
In our case, we have lagged email and website use variables for a subsample of 606 enterprises. Results using these lagged values are summarised in Table A4.4, jointly with those obtained when using the contemporaneous values (for 2010) of the internet variables for the same subsample of 606 firms. Parameters estimated using the lagged and actual values seem to be close in comparison, which suggests that any estimation bias using internet contemporary data is likely to be limited, assuming that the coefficient of the lagged variable allows to isolate the effect on TFP. This supposition is supported by the significant partial correlation between the lagged and actual values of the internet variables (0.394 for website and 0.310 for email), once controlling for the other firm characteristics. In our view, this validates the OLS results, obtained using the values for 2010 of the internet variables.
For the IV estimations, we will consider different sets of instruments which, given data availability, seem to be appropriate for this case (details in Table A4.5). In the first place, we will build on the idea that broadband rollouts (i.e.: ADSL or Cable Modem) rely on the copper wire of preexisting voicetelephony networks. As stated by Czernich et al (2011), the required access to an existing infrastructure built for other purposes, such as that of fixed telephony, make this a suitable instrument for this estimation strategy. This approach is similar to that followed by Bertschek et al (2013), which in a firmlevel analysis uses ADSL availability as an instrument for broadband, and Czernich et al (2011), who uses fixedline voice telephony and Cable TV preexisting networks as instruments for broadband in a nationallevel analysis. In our case, the instrument to be used is the number of voicetelecommunication fixed access lines per 100 inhabitants 10 years before, in interaction with firm characteristics such as age and size. In addition, to take into account differences in internet uses, countrylevel
125
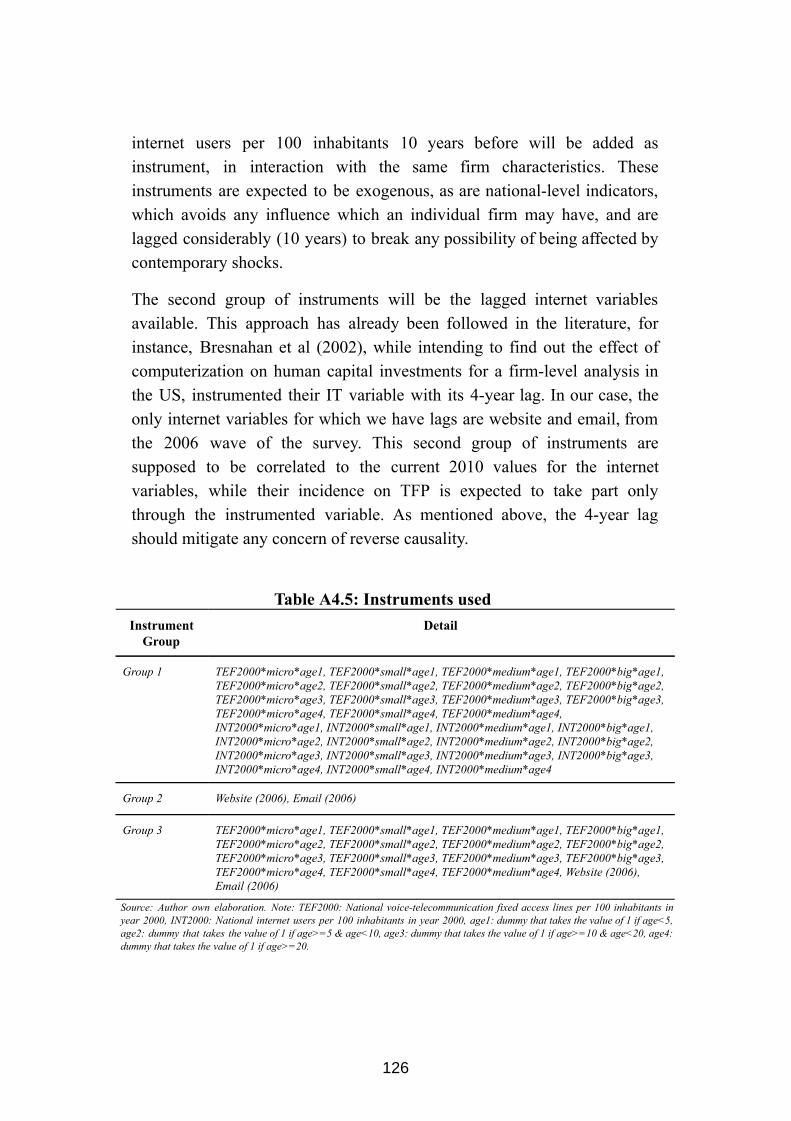
internet users per 100 inhabitants 10 years before will be added as instrument, in interaction with the same firm characteristics. These instruments are expected to be exogenous, as are nationallevel indicators, which avoids any influence which an individual firm may have, and are lagged considerably (10 years) to break any possibility of being affected by contemporary shocks.
The second group of instruments will be the lagged internet variables available. This approach has already been followed in the literature, for instance, Bresnahan et al (2002), while intending to find out the effect of computerization on human capital investments for a firmlevel analysis in the US, instrumented their IT variable with its 4year lag. In our case, the only internet variables for which we have lags are website and email, from the 2006 wave of the survey. This second group of instruments are supposed to be correlated to the current 2010 values for the internet variables, while their incidence on TFP is expected to take part only through the instrumented variable. As mentioned above, the 4year lag should mitigate any concern of reverse causality.
Table A4.5: Instruments used Instrument Group
Detail
Group 1 TEF2000*micro*age1, TEF2000*small*age1, TEF2000*medium*age1, TEF2000*big*age1, TEF2000*micro*age2, TEF2000*small*age2, TEF2000*medium*age2, TEF2000*big*age2, TEF2000*micro*age3, TEF2000*small*age3, TEF2000*medium*age3, TEF2000*big*age3, TEF2000*micro*age4, TEF2000*small*age4, TEF2000*medium*age4, INT2000*micro*age1, INT2000*small*age1, INT2000*medium*age1, INT2000*big*age1, INT2000*micro*age2, INT2000*small*age2, INT2000*medium*age2, INT2000*big*age2, INT2000*micro*age3, INT2000*small*age3, INT2000*medium*age3, INT2000*big*age3, INT2000*micro*age4, INT2000*small*age4, INT2000*medium*age4
Group 2 Website (2006), Email (2006)
Group 3 TEF2000*micro*age1, TEF2000*small*age1, TEF2000*medium*age1, TEF2000*big*age1, TEF2000*micro*age2, TEF2000*small*age2, TEF2000*medium*age2, TEF2000*big*age2, TEF2000*micro*age3, TEF2000*small*age3, TEF2000*medium*age3, TEF2000*big*age3, TEF2000*micro*age4, TEF2000*small*age4, TEF2000*medium*age4, Website (2006), Email (2006)
Source: Author own elaboration. Note: TEF2000: National voicetelecommunication fixed access lines per 100 inhabitants in year 2000, INT2000: National internet users per 100 inhabitants in year 2000, age1: dummy that takes the value of 1 if age<5, age2: dummy that takes the value of 1 if age>=5 & age<10, age3: dummy that takes the value of 1 if age>=10 & age<20, age4: dummy that takes the value of 1 if age>=20.
126
Finally, the third group of instruments will be a mix of the previous two: on the one hand the number of voicetelecommunication fixed access lines per 100 inhabitants 10 years before, in interaction with firm characteristics such as age and size; plus the lagged website and email values from 2006. For the reasons described above, this set of instruments should be strong, while overall exogeneity should be verified.
Results are shown in Tables A4.6 to A4.8. All estimations were performed following the IVLIML approach, which has proven to be more suitable in the presence of weak instruments. In any case, it has to be said that is complicated to derive a clear conclusion as in a number of cases the instruments do not seem to be valid. As seen in Tables A4.6 to A4.8, in all estimations the results suggest that the instrumental variables approach resulted in higher estimates of the coefficients. It is also observed that the estimates from the IVLIML are less precise than those from the OLS, as the standard errors increase considerably in the former case. This is similar to the findings of Czernich et al (2011) for a nationallevel analysis, and Bertschek et al (2013) for a firmlevel approach, being a wellknown result when the IV approach is used.
The estimations performed with the first group of instruments (Table A4.6) clearly verify the exogeneity conditions, as suggested by the overidentification test, but in contrast, fears seem to be confirmed with respect to the weakness of the instruments, as suggested by the weak instrument test. As a result, while the exclusion restrictions are clearly fulfilled, the correlation between the instruments and the internet variables does not seem to be strong enough, therefore casting doubts over the quality of the estimates. Despite that, coefficients associated to internet adoption, email, and website appear to be positive and statistically significant. The only estimations of this group that seem to slightly overcome the weak identification test are those shown in columns (iv) (internet for purchases), (v) (internet for delivering services) and (vii) (intensity indicator), although the standard deviation is so large that the coefficients remain statistically insignificant.
127
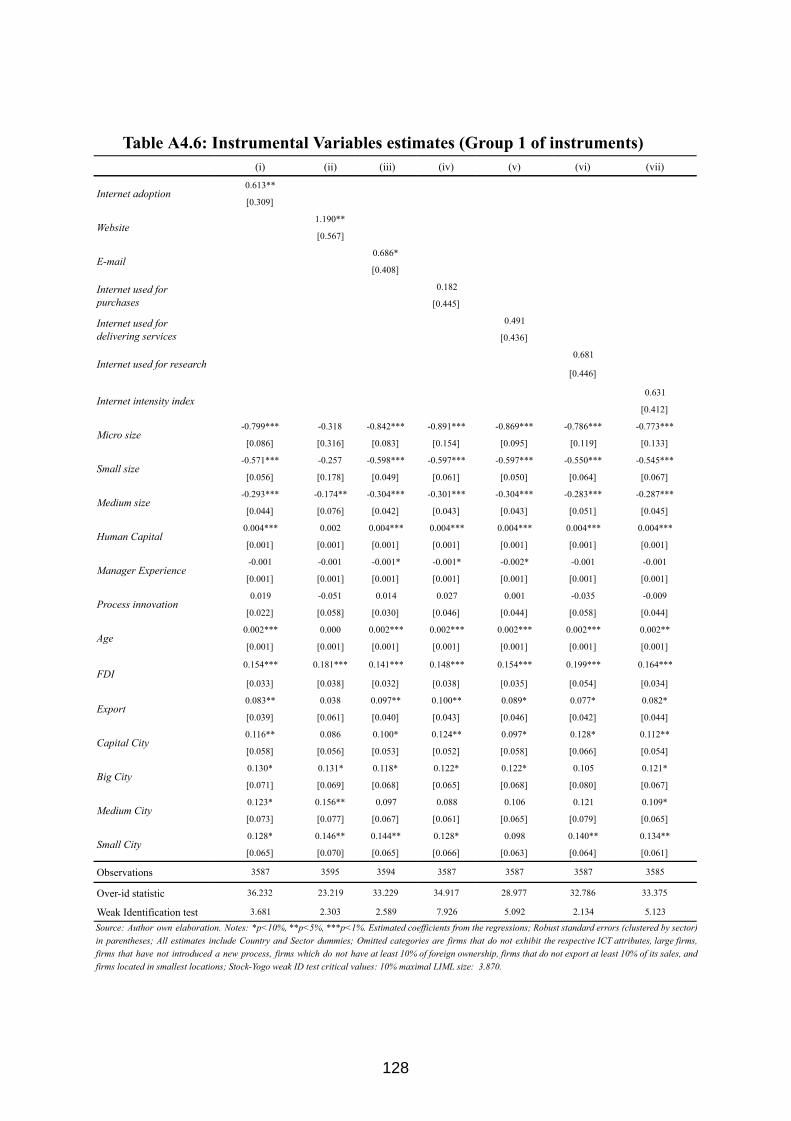
Table A4.6: Instrumental Variables estimates (Group 1 of instruments) (i) (ii) (iii) (iv) (v) (vi) (vii)
Internet adoption 0.613**
[0.309]
Website 1.190**
[0.567]
Email 0.686*
[0.408]
Internet used for purchases
0.182
[0.445]
Internet used for delivering services
0.491
[0.436]
Internet used for research 0.681
[0.446]
Internet intensity index 0.631
[0.412]
Micro size 0.799*** 0.318 0.842*** 0.891*** 0.869*** 0.786*** 0.773***
[0.086] [0.316] [0.083] [0.154] [0.095] [0.119] [0.133]
Small size 0.571*** 0.257 0.598*** 0.597*** 0.597*** 0.550*** 0.545***
[0.056] [0.178] [0.049] [0.061] [0.050] [0.064] [0.067]
Medium size 0.293*** 0.174** 0.304*** 0.301*** 0.304*** 0.283*** 0.287***
[0.044] [0.076] [0.042] [0.043] [0.043] [0.051] [0.045]
Human Capital 0.004*** 0.002 0.004*** 0.004*** 0.004*** 0.004*** 0.004***
[0.001] [0.001] [0.001] [0.001] [0.001] [0.001] [0.001]
Manager Experience 0.001 0.001 0.001* 0.001* 0.002* 0.001 0.001
[0.001] [0.001] [0.001] [0.001] [0.001] [0.001] [0.001]
Process innovation 0.019 0.051 0.014 0.027 0.001 0.035 0.009
[0.022] [0.058] [0.030] [0.046] [0.044] [0.058] [0.044]
Age 0.002*** 0.000 0.002*** 0.002*** 0.002*** 0.002*** 0.002**
[0.001] [0.001] [0.001] [0.001] [0.001] [0.001] [0.001]
FDI 0.154*** 0.181*** 0.141*** 0.148*** 0.154*** 0.199*** 0.164***
[0.033] [0.038] [0.032] [0.038] [0.035] [0.054] [0.034]
Export 0.083** 0.038 0.097** 0.100** 0.089* 0.077* 0.082*
[0.039] [0.061] [0.040] [0.043] [0.046] [0.042] [0.044]
Capital City 0.116** 0.086 0.100* 0.124** 0.097* 0.128* 0.112**
[0.058] [0.056] [0.053] [0.052] [0.058] [0.066] [0.054]
Big City 0.130* 0.131* 0.118* 0.122* 0.122* 0.105 0.121*
[0.071] [0.069] [0.068] [0.065] [0.068] [0.080] [0.067]
Medium City 0.123* 0.156** 0.097 0.088 0.106 0.121 0.109*
[0.073] [0.077] [0.067] [0.061] [0.065] [0.079] [0.065]
Small City 0.128* 0.146** 0.144** 0.128* 0.098 0.140** 0.134**
[0.065] [0.070] [0.065] [0.066] [0.063] [0.064] [0.061]
Observations 3587 3595 3594 3587 3587 3587 3585
Overid statistic 36.232 23.219 33.229 34.917 28.977 32.786 33.375
Weak Identification test 3.681 2.303 2.589 7.926 5.092 2.134 5.123
Source: Author own elaboration. Notes: *p<10%, **p<5%, ***p<1%. Estimated coefficients from the regressions; Robust standard errors (clustered by sector) in parentheses; All estimates include Country and Sector dummies; Omitted categories are firms that do not exhibit the respective ICT attributes, large firms, firms that have not introduced a new process, firms which do not have at least 10% of foreign ownership, firms that do not export at least 10% of its sales, and firms located in smallest locations; StockYogo weak ID test critical values: 10% maximal LIML size: 3.870.
128
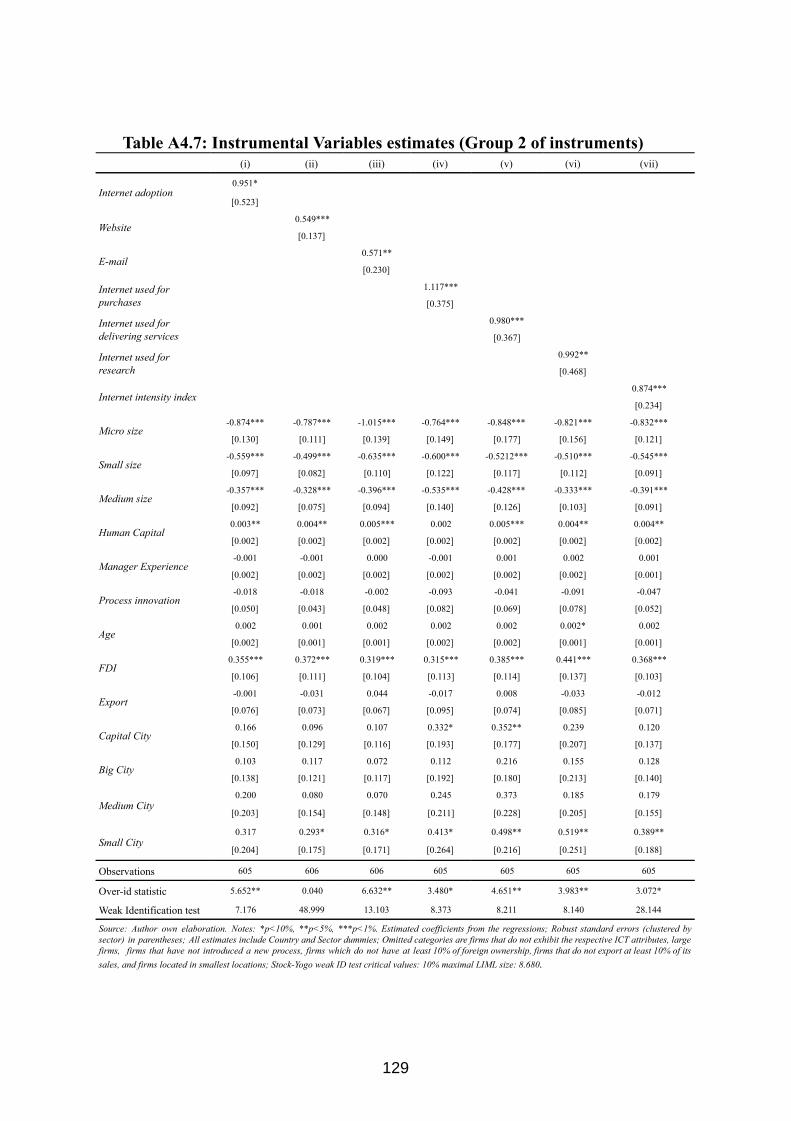
Table A4.7: Instrumental Variables estimates (Group 2 of instruments) (i) (ii) (iii) (iv) (v) (vi) (vii)
Internet adoption 0.951*
[0.523]
Website 0.549***
[0.137]
Email 0.571**
[0.230]
Internet used for purchases
1.117***
[0.375]
Internet used for delivering services
0.980***
[0.367]
Internet used for research
0.992**
[0.468]
Internet intensity index 0.874***
[0.234]
Micro size 0.874*** 0.787*** 1.015*** 0.764*** 0.848*** 0.821*** 0.832***
[0.130] [0.111] [0.139] [0.149] [0.177] [0.156] [0.121]
Small size 0.559*** 0.499*** 0.635*** 0.600*** 0.5212*** 0.510*** 0.545***
[0.097] [0.082] [0.110] [0.122] [0.117] [0.112] [0.091]
Medium size 0.357*** 0.328*** 0.396*** 0.535*** 0.428*** 0.333*** 0.391***
[0.092] [0.075] [0.094] [0.140] [0.126] [0.103] [0.091]
Human Capital 0.003** 0.004** 0.005*** 0.002 0.005*** 0.004** 0.004**
[0.002] [0.002] [0.002] [0.002] [0.002] [0.002] [0.002]
Manager Experience 0.001 0.001 0.000 0.001 0.001 0.002 0.001
[0.002] [0.002] [0.002] [0.002] [0.002] [0.002] [0.001]
Process innovation 0.018 0.018 0.002 0.093 0.041 0.091 0.047
[0.050] [0.043] [0.048] [0.082] [0.069] [0.078] [0.052]
Age 0.002 0.001 0.002 0.002 0.002 0.002* 0.002
[0.002] [0.001] [0.001] [0.002] [0.002] [0.001] [0.001]
FDI 0.355*** 0.372*** 0.319*** 0.315*** 0.385*** 0.441*** 0.368***
[0.106] [0.111] [0.104] [0.113] [0.114] [0.137] [0.103]
Export 0.001 0.031 0.044 0.017 0.008 0.033 0.012
[0.076] [0.073] [0.067] [0.095] [0.074] [0.085] [0.071]
Capital City 0.166 0.096 0.107 0.332* 0.352** 0.239 0.120
[0.150] [0.129] [0.116] [0.193] [0.177] [0.207] [0.137]
Big City 0.103 0.117 0.072 0.112 0.216 0.155 0.128
[0.138] [0.121] [0.117] [0.192] [0.180] [0.213] [0.140]
Medium City 0.200 0.080 0.070 0.245 0.373 0.185 0.179
[0.203] [0.154] [0.148] [0.211] [0.228] [0.205] [0.155]
Small City 0.317 0.293* 0.316* 0.413* 0.498** 0.519** 0.389**
[0.204] [0.175] [0.171] [0.264] [0.216] [0.251] [0.188]
Observations 605 606 606 605 605 605 605
Overid statistic 5.652** 0.040 6.632** 3.480* 4.651** 3.983** 3.072*
Weak Identification test 7.176 48.999 13.103 8.373 8.211 8.140 28.144
Source: Author own elaboration. Notes: *p<10%, **p<5%, ***p<1%. Estimated coefficients from the regressions; Robust standard errors (clustered by sector) in parentheses; All estimates include Country and Sector dummies; Omitted categories are firms that do not exhibit the respective ICT attributes, large firms, firms that have not introduced a new process, firms which do not have at least 10% of foreign ownership, firms that do not export at least 10% of its sales, and firms located in smallest locations; StockYogo weak ID test critical values: 10% maximal LIML size: 8.680 .
129
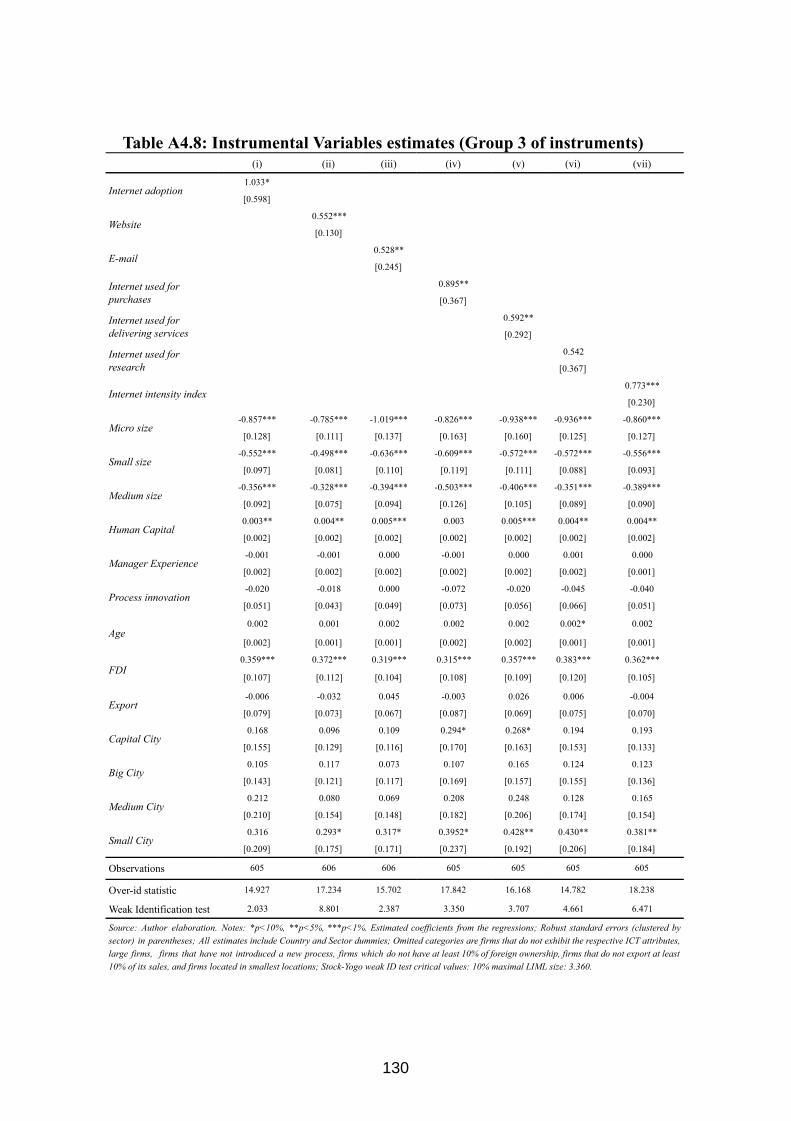
Table A4.8: Instrumental Variables estimates (Group 3 of instruments) (i) (ii) (iii) (iv) (v) (vi) (vii)
Internet adoption 1.033*
[0.598]
Website 0.552***
[0.130]
Email 0.528**
[0.245]
Internet used for purchases
0.895**
[0.367]
Internet used for delivering services
0.592**
[0.292]
Internet used for research
0.542
[0.367]
Internet intensity index 0.773***
[0.230]
Micro size 0.857*** 0.785*** 1.019*** 0.826*** 0.938*** 0.936*** 0.860***
[0.128] [0.111] [0.137] [0.163] [0.160] [0.125] [0.127]
Small size 0.552*** 0.498*** 0.636*** 0.609*** 0.572*** 0.572*** 0.556***
[0.097] [0.081] [0.110] [0.119] [0.111] [0.088] [0.093]
Medium size 0.356*** 0.328*** 0.394*** 0.503*** 0.406*** 0.351*** 0.389***
[0.092] [0.075] [0.094] [0.126] [0.105] [0.089] [0.090]
Human Capital 0.003** 0.004** 0.005*** 0.003 0.005*** 0.004** 0.004**
[0.002] [0.002] [0.002] [0.002] [0.002] [0.002] [0.002]
Manager Experience 0.001 0.001 0.000 0.001 0.000 0.001 0.000
[0.002] [0.002] [0.002] [0.002] [0.002] [0.002] [0.001]
Process innovation 0.020 0.018 0.000 0.072 0.020 0.045 0.040
[0.051] [0.043] [0.049] [0.073] [0.056] [0.066] [0.051]
Age 0.002 0.001 0.002 0.002 0.002 0.002* 0.002
[0.002] [0.001] [0.001] [0.002] [0.002] [0.001] [0.001]
FDI 0.359*** 0.372*** 0.319*** 0.315*** 0.357*** 0.383*** 0.362***
[0.107] [0.112] [0.104] [0.108] [0.109] [0.120] [0.105]
Export 0.006 0.032 0.045 0.003 0.026 0.006 0.004
[0.079] [0.073] [0.067] [0.087] [0.069] [0.075] [0.070]
Capital City 0.168 0.096 0.109 0.294* 0.268* 0.194 0.193
[0.155] [0.129] [0.116] [0.170] [0.163] [0.153] [0.133]
Big City 0.105 0.117 0.073 0.107 0.165 0.124 0.123
[0.143] [0.121] [0.117] [0.169] [0.157] [0.155] [0.136]
Medium City 0.212 0.080 0.069 0.208 0.248 0.128 0.165
[0.210] [0.154] [0.148] [0.182] [0.206] [0.174] [0.154]
Small City 0.316 0.293* 0.317* 0.3952* 0.428** 0.430** 0.381**
[0.209] [0.175] [0.171] [0.237] [0.192] [0.206] [0.184]
Observations 605 606 606 605 605 605 605
Overid statistic 14.927 17.234 15.702 17.842 16.168 14.782 18.238
Weak Identification test 2.033 8.801 2.387 3.350 3.707 4.661 6.471
Source: Author elaboration. Notes: *p<10%, **p<5%, ***p<1%. Estimated coefficients from the regressions; Robust standard errors (clustered by sector) in parentheses; All estimates include Country and Sector dummies; Omitted categories are firms that do not exhibit the respective ICT attributes, large firms, firms that have not introduced a new process, firms which do not have at least 10% of foreign ownership, firms that do not export at least 10% of its sales, and firms located in smallest locations; StockYogo weak ID test critical values: 10% maximal LIML size: 3.360.
130
The estimations performed with the second group of instruments (Table A4.7) indicate that the instruments are strongly correlated with the internet variables, and that higher significance levels are achieved for the respective coefficients. However, concerns arise regarding the exogeneity of the instruments, as derived from the overidentification test. In this case, only the estimations summarised in columns (ii) (website use), (iv) (internet use for purchases) and (vii) (intensity index) seem to verify the double condition of strong instruments and validity of the exclusion restrictions.
Finally, the third group of instruments (Table A4.8) seem to verify the double condition for columns (ii) (website), (v) (internet for delivering services), (vi) (internet use for research), and (vii) (intensity index) which suggest a positive and significant effect on TFP in most cases, with the exception of internet use for research, something which is aligned with the OLS results described at the main text.
To sum up, while it is difficult to reach a definitive conclusion, the results described above suggest that OLS may be underestimating the true effect of ICT on TFP. This is in line with the evidence reported in previous studies in the field, such as those by Czernich et al (2011) and Bertschek et al (2013).
Unconditional Quantile Regressions
Table A4.9 reports results for UQR estimates. For the sake of simplicity, only the coefficients associated to the internet variables are shown. 51
51 The full set of results is available upon request.
131
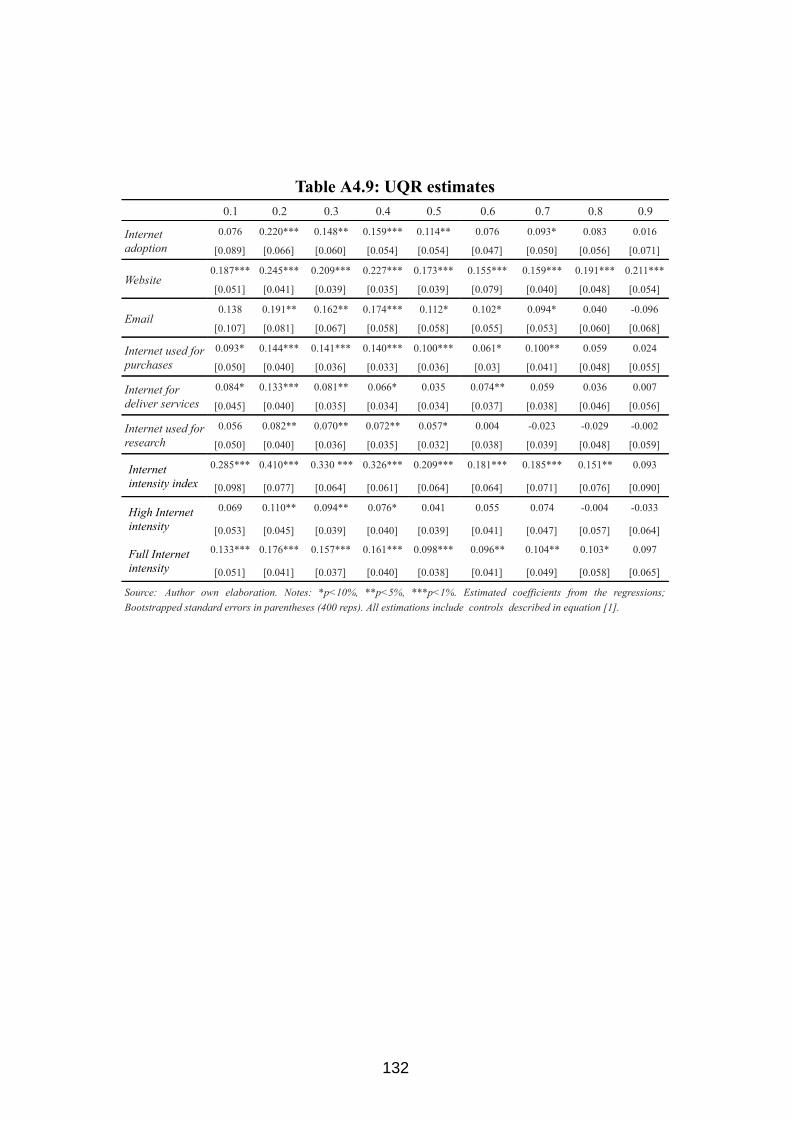
Table A4.9: UQR estimates 0.1 0.2 0.3 0.4 0.5 0.6 0.7 0.8 0.9
Internet adoption
0.076 0.220*** 0.148** 0.159*** 0.114** 0.076 0.093* 0.083 0.016
[0.089] [0.066] [0.060] [0.054] [0.054] [0.047] [0.050] [0.056] [0.071]
Website 0.187*** 0.245*** 0.209*** 0.227*** 0.173*** 0.155*** 0.159*** 0.191*** 0.211***
[0.051] [0.041] [0.039] [0.035] [0.039] [0.079] [0.040] [0.048] [0.054]
Email 0.138 0.191** 0.162** 0.174*** 0.112* 0.102* 0.094* 0.040 0.096
[0.107] [0.081] [0.067] [0.058] [0.058] [0.055] [0.053] [0.060] [0.068]
Internet used for purchases
0.093* 0.144*** 0.141*** 0.140*** 0.100*** 0.061* 0.100** 0.059 0.024
[0.050] [0.040] [0.036] [0.033] [0.036] [0.03] [0.041] [0.048] [0.055]
Internet for deliver services
0.084* 0.133*** 0.081** 0.066* 0.035 0.074** 0.059 0.036 0.007
[0.045] [0.040] [0.035] [0.034] [0.034] [0.037] [0.038] [0.046] [0.056]
Internet used for research
0.056 0.082** 0.070** 0.072** 0.057* 0.004 0.023 0.029 0.002
[0.050] [0.040] [0.036] [0.035] [0.032] [0.038] [0.039] [0.048] [0.059]
Internet intensity index
0.285*** 0.410*** 0.330 *** 0.326*** 0.209*** 0.181*** 0.185*** 0.151** 0.093
[0.098] [0.077] [0.064] [0.061] [0.064] [0.064] [0.071] [0.076] [0.090]
High Internet intensity
0.069 0.110** 0.094** 0.076* 0.041 0.055 0.074 0.004 0.033
[0.053] [0.045] [0.039] [0.040] [0.039] [0.041] [0.047] [0.057] [0.064]
Full Internet intensity
0.133*** 0.176*** 0.157*** 0.161*** 0.098*** 0.096** 0.104** 0.103* 0.097
[0.051] [0.041] [0.037] [0.040] [0.038] [0.041] [0.049] [0.058] [0.065]
Source: Author own elaboration. Notes: *p<10%, **p<5%, ***p<1%. Estimated coefficients from the regressions; Bootstrapped standard errors in parentheses (400 reps). All estimations include controls described in equation [1].
132
Chapter 5. Conclusions and Policy Implications
5.1 Main results and contributions Through this thesis we were able to contribute to the literature with novel empirical evidence that allowed us to draw some important conclusions. In Chapter 2, we proposed a theoretical model that combines technological externalities and differences across regional economies in local absorptive capacity. The model was empirically estimated for a sample of 215 European NUTS2 regions for years in the period from 1999 to 2008, through a Maximum Likelihood estimator. The results confirmed the important role of local absorptive capacity, as well as the relevance of externalities in explaining crossregional differences in productivity. The evidence suggested that physical capital contributes to explain productivity disparities across European regions, not only through the capital share in the economy, but also through the capitaloutput ratio and externalities. As a result, physical capital has a bigger role than that attributed in some previous studies, although this does not prevent the existence of far from negligible regional efficiency differentials, which have also contributed to the productivity gap. As for peripheral regions in Central and Eastern Europe, despite the recent process of capital deepening and economic integration in the single market, regions from this area need to be better endowed with physical capital to be able to reach higher returns to the investments they make in human capital, and to be able to achieve some significant technological catchup. Further increases in factor endowments may contribute to reduce disparities, although this process is expected to be hindered by geography, since these peripheral regions benefit only marginally from spillovers generated in the core.
Chapter 3 introduced the ICTs to the analysis of productivity disparities. A theoretical framework was proposed, considering broadband as an enabler of productivity gains, and allowing heterogeneities across regions in its effect. The model derived from this framework was tested empirically for a sample of 27 Brazilian regions for the period 20072011. Results provided robust evidence on the impact of broadband on productivity in Brazil and,
133
particularly, on the fact that these effects are not uniform across the territory. Broadband connectivity seems to be yielding higher productivity gains for regions which exhibit a minimum threshold of penetration levels (providing evidence of network effects), as well as regions with higher quality in its internet infrastructures, denoted by the broadband speed. In addition, allowing for heterogeneities depending on the level of development, evidence was found of a higher effect of broadband on productivity for the less developed regions. These results suggest that broadband connectivity might constitute a factor favoring regional cohesion, at least in the case of Brazil.
Finally, Chapter 4 contributed to the empirical literature by exploring the link between internet and productivity in Latin American firms, finding robust empirical evidence on the positive relationship between internet and firmperformance. Our empirical analysis confirmed the role of internet as a source of productivity growth for Latin American firms, and that impact was found to be larger as the intensity of its use is increased. Providing novel evidence in the literature, the empirical analysis also suggested important heterogeneities of that impact across enterprises, as lowmedium productive firms seem to benefit more from a deepening in the internet adoption and use by firms in the Latin American countries, in comparison with those at the upper part of the productivity distribution. This suggests that internet adoption and use contributes to decrease productivity differences between enterprises. In other words, we can foreseen a decrease in the amount of inequality in the distribution of productivity with the further extension of internet in the Latin American firms.
5.2 Policy recommendations The results reported in this thesis allow us to formulate some important recommendations for policymakers.
From a regional perspective, it seems clear that peripheral regions are heterogeneous and as a result have different necessities, depending on their geographic location and the endowment of physical and human capital, as
134
well of ICTs. Policies to stimulate development in lagging regions should be designed taking into account the specific circumstances of each region, considering its particular location, and the real chance of benefiting from spillovers generated elsewhere. Regional development policies should stimulate investments in human capital and broadband deployment in the less productive areas, as those investments has been found to be relevant to reduce disparities across regions. Investment in both human and physical capital in general, and in ICT infrastructures in particular, will surely favor the attractiveness of undeveloped regions. In particular, regulatory frameworks should be designed in order to stimulate deployments of new generation networks, such as fibre optic and 5G, as the quality of the connection was found to be relevant to make the most of the benefits of broadband. Creating conditions to favour network deployments can mean, for instance, to promote publicprivate cooperation, through a stable and longterm framework which can provide certainty to investors. To provide the required conditions for sustainable competition across enterprises being part of the digital ecosystem is also a key topic in this sense. Modernization of economic structures and improvements in the institutional framework that favor attraction of investments are also crucial.
Governments should also promote internet adoption and intensive use at a firmlevel, with programs and incentives designed especially for the most disadvantaged enterprises, as this constitutes a source to reduce disparities in productivity. Allowing telecom operators to deliver flexible commercial offers, as well as tax reductions for smalllow productive firms, may constitute feasible alternatives to tackle affordability barriers. Also, and even if it was not addressed by this thesis, we can expect human capital and ICTs to be highly complementary, being possible that adoption of those technologies may depend to a large extent on the skills of the managers and workers. Therefore, in order to maximize demand and social returns to broadband deployment, policymakers should address eventual ICTrelated skills among the workforce, especially for most disadvantaged firms.
All this will become increasingly more important in the future, as disadvantaged firms will need to be prepared to make the most of the new era of Internet of Things, Big Data and Industry 4.0, in order to the
135
reduction of disparities to effectively take place.
5.3 Limitations and future research
Through the process of elaboration of this thesis, we encountered some limitations which prevented us to perform the analysis as we would have liked in perfect circumstances.
In Chapter 2, data unavailability, particularly as regards the stock of physical capital which is only available up to 2008, prevented us to expand the period under analysis in order to assess the impact of the recession and debt crisis in EU countries, especially considering a potential differentiated effect for regions of southern economies. This exercise would have allowed us to test if those circumstances changed the role of capital deepening, externalities and human capital. Data unavailability also prevented us to contrast other possible sources of regional heterogeneity in the impact of broadband on productivity in Chapter 3, in order to find out why less developed regions are extracting more benefits from connectivity. Similarly, the lack of longenough time series data prevented us to perform a longterm growthregression analysis in that chapter. In Chapter 4, limitations on data availability also prevented us to enrich our analysis, particularly through paneldata estimates to control for unobserved firm heterogeneities. Data limitations also restricted our robustness analysis in that chapter, as the process to find suitable instruments for the IV estimates was highly challenging.
Complexities in estimation approaches also constrained us to some degree. In the first place, we were unable to extend the estimates in Chapter 2 to a paneldata setting. Although it was not our preferred approach for that estimates (as the parameters γ and δ were likely to vary over time), the nonlinearity of the specification complicated that possibility, preventing us to add further robustness to the analysis, by controlling for timeinvariant unobserved heterogeneity. In the second place, the lack of a general procedure to account for endogeneity under the UQR method prevented us
136

to extend our robustness checks in Chapter 4 to the analysis across the different points of the productivity distribution.
All in all, and considering that these extensions should have to be further addressed in the future, we expect that this thesis contributes to the existing literature by further disentangling the sources behind productivity disparities, therefore marking the way for upcoming research and providing useful inputs for the design of effective public policies.
137

138
Bibliography
Aboal, D. and Tacsir, E. (2015) Innovation and Productivity in Services and Manufacturing: The Role of ICT Investment (No. IDBWP658), IDB Working Paper Series.
Acs, Z.J. and Audretsch, D. (1988) Innovation in Large and Small Firms: An Empirical Analysis, American Economic Review , American Economic Association, 78, 67890.
Aghion, P. and Howitt, P. (1992) A Model of Growth Through Creative Destruction, Econometrica, 60, 32351.
Álvarez, R. (2016) The Impact of R&D and ICT Investment on Innovation and Productivity in Chilean Firms, InterAmerican Development Bank.
Anselin, L. (1988) Spatial Econometrics: Methods and Models , Dordrecht: Kluwer Academic Publishers.
Arvanitis, S. and Loukis, E.N. (2009) Information and communication technologies, human capital, workplace organization and labour productivity: A comparative study based on firmlevel data for Greece and Switzerland, Information Economics and Policy , 21, 4361.
Arrow, K. (1962) The Economic Implications of Learning by Doing, Review of Economic Studies , 29, 155–73.
Aschauer, D.A. (1989) Is Public Expenditure Productive? Journal of Monetary Economics , 23, 177200.
Atrostic, B.K., BoeghNielsen, P., Motohashi, K. and Nguyen, S. (2004) IT, Productivity and Growth in Enterprises: Evidence from new international micro data, The Economic Impact of ICT–Measurement, Evidence and Implications .
Badinger, H. and Egger, P. (2011) Estimation of Higherorder Spatial Autoregressive Crosssection Models with Heteroscedastic Disturbances, Papers in Regional Science , 90, 213–35.
139

Barrios, S. and Navajas, E. (2008) The Location of ICT activities in EU regions. Implications for regional policies, Investigaciones Regionales, 13, 179210.
Barrios, S., Mas, M., Navajas, E. and Quesada, J. (2008) Mapping the ICT in EU Regions: Location, Employment, Factors of Attractiveness and Economic Impact, JRC Scientific and Technical Reports No. EU 23067, 1113.
Barro, R. and SalaiMartin, X. (1991) Convergence Across States and Regions, Brookings Papers on Economic Activity , 1, 10782.
Basile, R. (2008) Regional Economic Growth in Europe: A Semiparametric Spatial Dependence Approach, Papers in Regional Science , 87, 527–44.
Basile, R., Capello, R. and Caragliu, A. (2012) Technological Interdependence and Regional Growth in Europe: Proximity and Synergy in Knowledge Spillovers, Papers in Regional Science , 91, 697–722.
Bartelsman, E.J., Hagsten, E. and Polder, M. (2013) Crosscountry analysis of ICT impact using firmlevel data: Micro Moments Database and Research Infrastructure. Eurostat .
Beck, N., Gleditsch, K.S. and Beardsley, K. (2006) Space is More than Geography: Using Spatial Econometrics in the Study of Political Economy, International Studies Quarterly , 50, 27–44.
Benhabib, J. and Spiegel, M. (1994) The Role of Human Capital in Economic Development. Evidence from Aggregate Crosscountry Data , Journal of Monetary Economics , 34, 143–73.
Berman, E., Bound, J. and Machin, S. (1998) Implications of SkillBiased Technological Change: International Evidence, The Quarterly Journal of Economics , 113, 1245–80.
Bernard, A.B. and Jensen, J.B. (1995) Exceptional Exporter Performance: Cause, Effects, or Both? mimeo, 1995.
Bertschek, I., Cerquera, D. and Klein, G. (2013) More Bits – More Bucks? Measuring the Impact of Broadband Internet on Firm Performance,
140
Information Economics and Policy 25, 190203.
Bijsterbosch, M. and Kolasa, M. (2010) FDI and Productivity Convergence in Central and Eastern Europe: An Industrylevel Investigation, Review of World Economics , 145, 689–712.
Billón, M., Ezcurra, R. and LeraLópez, F. (2009) Spatial Effects in Website Adoption by Firms in European Regions, Growth and Change , 40, 54–84.
Billón, M., Marco, R. and LeraLópez, F. (2009) Disparities in ICT adoption: A multidimensional approach to study the crosscountry digital divide, Telecommunications Policy, 33, 596–610.
Bonaccorsi, A., Piscitello, L. and Rossi Lamastra, C. (2005) The ICT Diffusion: A Spatial Econometric Approach. SSRN eLibrary.
Bosker, M. (2009) The Spatial Evolution of Regional GDP Disparities in the 'Old' and the 'New' Europe, Papers in Regional Science , 88, 3–27.
Bresnahan, T.F., Brynjolfsson, E. and Hitt, L.M. (2002) Information Technology, Workplace Organization, and the Demand for Skilled Labor: FirmLevel Evidence, The Quarterly Journal of Economics, 117, 33976.
Brynjolfsson, E. and Hitt, L.M. (1995) Information Technology As A Factor Of Production: The Role Of Differences Among Firms. Economics of Innovation and New Technology, 3, 183200.
Brynjolfsson, E. and Hitt, L.M. (2000) Beyond Computation: Information Technology, Organizational Transformation and Business Performance, The Journal of Economic Perspectives , 14, 2348.
Brynjolfsson, E. and Hitt, L.M. (2003) Computing Productivity: FirmLevel Evidence, The Review of Economics and Statistics , 85, 793808.
Cairncross, F. (2001) The Death of Distance: How the Communications Revolution Is Changing Our Lives , Harvard Business School Press, Cambridge, MA, USA.
Cardona, M., Kretschmer, T. and Strobel, T. (2013) ICT and Productivity: Conclusions from the Empirical Literature, Information Economics and
141
Policy , 25, 10925.
Caselli, F. (2005) Accounting for CrossCountry Income Differences, Handbook of Economic Growth , 1, 679741.
Castany, L., LópezBazo, E. and Moreno, R. (2005) Differences in Total Factor Productivity Across Firm Size. A Distributional Analysis, Knowledge and Regional Economic Development Open Conference 2005, June, 9, 10 and 11th. Barcelona, Spain.
Chou, Y.C., Chuang, H.H.C. and Shao, B.B. (2014) The impacts of information technology on total factor productivity: A look at externalities and innovations, International Journal of Production Economics , 158, 2909
Cirera, X., Lage, F. and Sabetti, L. (2016) ICT Use, Innovation, and Productivity: Evidence from SubSaharan Africa, Policy Research Working Paper No. 7868. World Bank, Washington, DC.
Clerides, S.K., Lach, S. and Tybout, J.R. (1998) Is Learning by Exporting Important? MicroDynamic Evidence from Colombia, Mexico, and Morocco, The Quarterly Journal of Economics , 113, 90347.
Coe, D. and Helpman, E. (1995) International R&D Spillovers, European Economic Review , 39, 859–97.
Cohen, W.M. and Klepper, S. (1996) Firm Size and the Nature of Innovation within Industries: The Case of Process and Product R&D, The Review of Economics and Statistics , 78, 23243.
Cohen, W. and Levinthal, D. (1990) Absorptive Capacity: A New Perspective on Learning and Innovation, Administrative Science Quarterly , 35, 128–52.
Colecchia, A. and Schreyer, P. (2002) ICT Investment and Economic Growth in the 1990s: Is the United States a Unique Case? A Comparative Study of Nine OECD Countries, Review of Economic Dynamics, 5, 40842.
Crandall, R.W., Lehr, W. and Litan, R.E. (2007) The Effects of Broadband Deployment on Output and Employment: A Crosssectional Analysis of US
142
Data. Brookings Institution.
Crepon, B., Duguet, E. and Mairesse, J. (1998) Research, Innovation and Productivity: An Econometric Analysis at the Firm Level, Economics of Innovation and New Technology, 7, 11558.
Czernich, N., Falck, O., Kretschmer, T. and Woessman, L. (2011) Broadband Infrastructure and Economic Growth, The Economic Journal, 121, 50532.
da Silva Filho, T.N.T. (2002) Estimating Brazilian Potential Output: A Production Function Approach. BCB Documento de trabajo, 17.
De la Fuente, A. (2002) On the Sources of Convergence: A Close Look at the Spanish Regions, European Economic Review , 46, 56999.
De Stefano, T., Kneller, R. and Timmis, J. (2016) Information Communication Technologies and Firm Performance: Evidence for UK Firms, Discussion Papers, University of Nottingham, School of Economics
Denison, E. (1962) The sources of Economic Growth in the United States and the Alternatives before Us. Washington, DC: Committee for Economic Development.
Denison, E. (1967) Why Growth Rates Differ. Washington, DC: The Brookings Institution.
Ding, L., Haynes, K.E. and Liu, Y. (2008) Telecommunications Infrastructure and Regional Income Convergence in China: Panel Data Approaches. The Annals of Regional Science , 42, 84361.
Duque, J., Anselin, L. and Rey, S. (2012) The MaxPRegions Problem, Journal of Regional Science , 52, 397–419.
Easterly, W. and Levine, R. (2001) It’s Not Factor Accumulation: Stylized Facts and Growth Models, The World Bank Economic Review , 15, 177–219.
Elhorst, P., Lacombe, D. and Piras, G. (2012) On Model Specification and Parameter Space Definitions in Higher Order Spatial Econometric Models, Regional Science and Urban Economics , 42, 211–20.
143
Ertur, C. and Koch, W. (2006) Regional Disparities in the European Union and the Enlargement Process: An Exploratory Spatial Data Analysis, 1995–2000, The Annals of Regional Science , 40, 723–65.
Ertur, C. and Koch, W. (2007) Growth, Technological Interdependence and Spatial Externalities: Theory and Evidence, Journal of Applied Econometrics , 22, 1033–62.
Esposito, P. and Stehrer, R. (2009) The Sector Bias of Skillbiased Technical Change and the Rising Skill Premium in Transition Economies, Empirica , 36, 351–64.
European Commission (2010) Investing in Europe’s Future . Fifth Report on Economic, Social and Territorial Cohesion . Luxembourg: European Commission, DirectorateGeneral for Regional Policy.
Evenson, R. and Westphal, L. (1995) Technological Change and Technology Strategy, in Srinivasan, T.N. and Behrman, J. (eds), Handbook of Development Economics , 3.
Feenstra, R.C., Inklaar, R. and Timmer, M.P. (2015) The Next Generation of the Penn World Table, American Economic Review, 105, 315082.
FernándezArdèvol, M. and Vázquez Grenno J. (2011) Estimación de la contribución de la telefonía móvil al crecimiento y reducción de la pobreza, in FernándezArdèvol, M., Galperin, H. and Castells, M. (eds), Comunicación móvil y desarrollo económico y social en América Latina , Barcelona, Spain: Ariel, Fundación Telefónica, 81131.
Fingleton, B. and LópezBazo, E. (2006) Empirical Growth Models with Spatial Effects, Papers in Regional Science , 85, 177–98.
Firpo, S., Fortin, N.M. and Lemieux, T. (2009) Unconditional Quantile Regressions. Econometrica , 77, 953–73.
Firpo, S. (2007) Efficient Semiparametric Estimation of Quantile Treatment Effects, Econometrica , 71, 25976.
144
Forman, C. and van Zeebroeck, N. (2010) From Wires to Partners: How the Internet has Fostered R&D Collaborations Within Firms, SSRN eLibrary No. 1725780.
Frieden, R. (2005) Lessons from broadband development in Canada, Japan, Korea and the United States, Telecommunications Policy , 29, 595613.
Frölich, M. and Melly, B. (2013) Unconditional Quantile Treatment Effects Under Endogeneity, Journal of Business & Economic Statistics , 31, 34657.
Galliano, D. and Roux, P. (2008) Organisational motives and spatial effects in Internet adoption and intensity of use: evidence from French industrial firms, The Annals of Regional Science , 42, 42548
Galperin, H. and Ruzzier, C.A. (2013) Price elasticity of demand for broadband: Evidence from Latin America and the Caribbean. Telecommunications Policy , 37, 42938.
Gareis, K. and Osimo, D. (2004) Benchmarking Regional Performance in the Information Society: Turning It into Practice, Paper presented at the Workshop “Measuring the information society: what, how, for whom and what?” in the context of the 5th Annual Conference of the Association of Internet Researchers, 18 September 2004, Brighton.
Gennaioli, N., Porta, R.L., LopezdeSilanes, F. and Shleifer, A. (2013) Human Capital and Regional Development, The Quarterly Journal of Economics , 128, 105–64.
Glass, A.J. Saggi, K. (1998) International technology transfer and the technology gap, Journal of Development Economics, 55, 369–98.
GonzálezVelosa, C., Rosas, D. and Flores, R. (2016) OntheJob Training in Latin America and the Caribbean: Recent Evidence, in Grazzi, M. and Pietrobelli, C. (eds), Firm Innovation and Productivity in Latin America and the Caribbean, Palgrave Macmillan US, 13766.
Griffith, R., Redding, S. and Van Reenen, J. (2004) Mapping the Two Faces of R&D: Productivity Growth in a Panel of OECD Industries, The Review of Economics and Statistics, 86, 88395.
145
Grossman, G. and Helpman, E. (1991) Innovation and Growth in the Global Economy, Cambridge, MA: The MIT Press.
Gutiérrez, L.H. (2011) ICT and labor productivity in Colombian manufacturing industry, in Balboni, M., Rovira S. and Vergara S. (eds), ICT in Latin America: A microdata analysis . Santiago, Chile: United Nations.
Hall, B. (2011) Innovation and Productivity, NBER Working Paper No. 17178.
Hall, R.E. and Jones, C.I. (1999) Why Do Some Countries Produce so much more Output per Worker than Others, The Quarterly Journal of Economics , 114, 83–116.
Hempell, T. (2005) Does Experience Matter? Innovations and the Productivity of Information and Communication Technologies in German services, Economics of Innovation and New Technology , 14, 277303.
Hempell, T. (2005) What’s Spurious, What’s Real? Measuring the Productivity Impacts of ICT at the firmlevel, Empirical Economics, 30, 42764.
Higon, D.A. (2007) The impact of R&D spillovers on UK manufacturing TFP: A dynamic panel approach, Research Policy , 36, 96479.
Howell, B. and Grimes, A. (2010) Feeding a Need for Speed or Funding a Fibre ‘Arms Race’? Communications and Strategies , 78, 12745.
International Telecommunication Union (2006) World Telecommunication/ICT Development Report 2006. Measuring ICT for Social and Economic Development. Geneva, ITU.
Jordán, V. and de León, O. (2011) Broadband and the digital revolution, in Jordán, V. and Galperín, H. (eds), Fasttracking the digital revolution: Broadband for Latin America and the Caribbean, Santiago, Chile: United Nations, 1348.
Jorgenson, D.W. (2001) Information Technology and the US Economy, American Economic Review, 91, 132.
146
Kaiser, U. and Bertschek, I. (2004) Productivity Effects of Organizational Change: Microeconometric Evidence, Management Science , 50, 394404.
Katz, R. (2012) Impact of Broadband on the Economy. Broadband Series. Telecommunication Development Sector. International Telecommunications Union.
Keller, W. (2002) Geographic Localization of International Technology Diffusion, American Economic Review , 92, 120–42.
Kelly, K. (1998) New Rules for the New Economy. 10 Ways the Network Economy is Changing Everything , Fourth Estate, London, UK.
King, R. and Levine, R. (1994) Capital Fundamentalism, Economic Development and Economic Growth, CarnegieRochester Conference Series on Public Policy , 40, 259–92.
Klenow, P. and RodriguezClare, A. (2005) Externalities and Growth, in Aghion, P. and Durlauf, S. (eds), Handbook of Economic Growth , 1, 679–741.
Koch, W. (2008) Development Accounting with Spatial Effects, Spatial Economic Analysis , 3, 321–42.
Koch, W. (2010) Growth and Spatial Dependence in Europe, in Páez, A., Gallo, J., Buliung, R. and Dall'erba, S. (eds), Progress in Spatial Analysis, Methods and Applications , Berlin: Springer, 465–82.
Koenker, R. and Bassett, G. (1978) Regression Quantiles, Econometrica, 46, 33–50.
Koutroumpis, P. (2009) The economic impact of broadband on growth: a simultaneous approach, Telecommunications Policy , 33, 47185.
Krugman, P. (1991) Increasing Returns and Economic Geography, The Journal of Political Economy , 99, 483–99.
Krugman, P. (1994) The Age of Diminishing Expectations : US Economic Policy in the 1990s.
Lacombe, D. (2004) Does Econometric Methodology Matter? An Analysis
147
of Public Policy Using Spatial Econometric Techniques, Geographical Analysis , 36, 105–18.
Lee, L.F. (2004) Asymptotic Distributions of QuasiMaximum Likelihood Estimators for Spatial Autoregressive Models, Econometrica , 72, 1899–925.
Lee, L.F. and Liu, X. (2010) Efficient GMM estimation of High Order Spatial Autoregressive Models with Autoregressive Disturbances, Econometric Theory , 26, 187–230.
Lee, L.F. and Yu, J. (2010) Estimation of Spatial Autorregressive Panel Data Models with Fixed Effects, Journal of Econometrics , 154, 165–85.
Lehr, W.H., Osorio, C.A., Gillett, S.E. and Sirbu, M.A. (2005) Measuring Broadband’s Economic Impact, Tepper School of Business, Paper 457.
Leiponen, A. (2005) Skills and Innovation, International Journal of Industrial Organization , 23, 303–23.
LeSage, J. and Pace, R.K. (2009) Introduction to Spatial Econometrics . Boca Ratón: Chapman and Hall/CRC.
Levinsohn, J. and Petrin, A. (2003) Estimating Production Functions Using Inputs to Control for Unobservables, The Review of Economic Studies , 70, 31741.
LópezBazo, E., Vayá, E., Mora, T. and Suriñach, J. (1999) Regional Economic Dynamics and Convergence in the European Union, The Annals of Regional Science , 33, 343–70.
LópezBazo, E., Vayá, E. and Artís, M. (2004) Regional Externalities and Growth: Evidence From European Regions, Journal of Regional Science , 44, 43–73.
Mack, E. and Faggian, A. (2013) Productivity and Broadband: The Human Factor, International Regional Science Review , 36, 392423.
Magrini, S. (2004) Regional (Di)Convergence, in Henderson, J.V. and Thisse, J.F. (eds), Handbook of Regional and Urban Economics , 4,
148
2741–96.
Manca, F. (2012) Human Capital Composition and Economic Growth at the Regional Level, Regional Studies, 46, 1367–88.
Mankiw, G., Romer, D. and Weil, D. (1992) A Contribution to the Empirics of Economic Growth, The Quarterly Journal of Economics, 107, 40737.
Marrocu, E., Paci, R. and Usai, S. (2013) Productivity Growth in the Old and New Europe: The Role of Agglomeration Externalities, Journal of Regional Science , 53, 418–42.
Mas, M. and Quesada, J. (2005) ICT and Economic Growth: A Quantification of Productivity Growth in Spain 19852002, OECD Statistics Working Papers, 2005/04 OECD Publishing.
Mas, M. and Quesada, J. (2005) Déficit tecnológico y crecimiento económico en España, Instituto Valenciano de Investigaciones Económicas, Universitat de Valencia. MPRA Paper No. 15836.
Milgrom, P. and Roberts, J. (1990) The Economics of Modern Manufacturing: Technology, Strategy, and Organization, American Economic Review , 80, 51128.
Monastiriotis, V. (2014) Regional Growth and National Development: Transition in Central and Eastern Europe and the Regional Kuznets Curve in the East and the West, Spatial Economic Analysis , 9, 142–61.
Mora, T., Vayá, E. and Suriñach, J. (2004) The Enlargement of the European Union and the Spatial Distribution of Economic Activity, Eastern European Economics , 42, 6–35.
Moreno, R., Paci, R. and Usai, S. (2005) Spatial Spillovers and Innovation Activity in European Regions, Environment and Planning , 37, 1793–812.
Negroponte, N. (1995) Being Digital, Knopf, New York, NJ, USA.
Nelson, R. and Phelps, E. (1966) Investment in Humans, Technological Diffusion, and Economic Growth, American Economic Review , 56, 69–75.
OECD (2003) ICT and Economic Growth –Evidence from OECD
149
Countries, Industries and Firms, OECD, Paris.
OECD (2004) The Economic Impact of ICT – Measurement, Evidence and Implications, OECD, Paris.
Oliner, S.D. and Sichel, D. (1994) Computers and Output Growth: How Big is the Puzzle? Papers in Economic Activity , 2, 273–334.
Oliner, S.D. and Sichel, D. (2002) Information Technology and Productivity: Where Are We Now and Where Are We Going? Federal Reserve Bank of Atlanta Review, 87, 15–44.
Olley, G.S. and Pakes, A. (1996) The Dynamics of Productivity in the Telecommunications Equipment Industry, Econometrica, 64, 1263–97.
Ornaghi, C. (2006) Spillovers in product and process innovation: Evidence from manufacturing firms, International Journal of Industrial Organization , 24, 34980.
Paunov, C. and Rollo, V. (2016) Has the Internet Fostered Inclusive Innovation in the Developing World? World Development, 78, 587–609.
Pilat, D. (2004) The ICT Productivity Paradox: Insights from Micro Data, OECD Economic Studies No. 38, 2004/1
Qian, H., Acs, Z. and Stough, R. (2013) Regional Systems of Entrepreneurship: the Nexus of Human Capital, Knowledge and New Firm Formation, Journal of Economic Geography , 13, 559–87.
Qiang, C.Z.W., Rossotto, C.M. and Kimura, K. (2009) Economic impacts of broadband. Information and Communications for Development 2009: Extending Reach and Increasing Impact, World Bank, Washington DC (2009) (35).
Quah, D. (1996) Regional Convergence Clusters across Europe, European Economic Review , 40, 951–58.
Quah, D. (2000) Internet Cluster Emergence, European Economic Review , 44, 103244.
RodriguezPose, A. and Crescenzi, R. (2008) Research and Development,
150

Spillovers, Innovation Systems, and the Genesis of Regional Growth in Europe, Regional Studies , 42, 51–67.
Rohman, I.K. and Bohlin, E. (2012) Does Broadband Speed Really Matter for Driving Economic Growth? Investigating OECD countries, International Journal of Management and Network Economics , 2, 33656.
Röller, L.H. and Waverman, L. (2001) Telecommunications Infrastructure and Economic Development: a Simultaneous Approach, American Economic Review, 91, 90923.
Romer, D. (2006) Advanced Macroeconomics, McGraw Hill, New York.
Romer, P. (1990) Endogenous Technological Change, Journal of Political Economy, 98, S71102.
Rothe, C. (2010) Nonparametric Estimation of Distributional Policy Effects, Journal of Econometrics, 55, 5670.
SalaiMartin, X. (1996) Regional Cohesion: Evidence and Theories of Regional Growth and Convergence, European Economic Review , 40, 1325–52.
Saliola, F. and Seker, M. (2011) Total Factor Productivity Across the Developing World. Research Note. The World Bank.
Schiffbauer, M. and Ospina, S. (2010) Competition and Firm Productivity: Evidence from FirmLevel Data (No. 1067) International Monetary Fund.
Şeker, M. (2012) Importing, Exporting, and Innovation in Developing Countries, Review of International Economics, 20, 299314.
Solow, R. (1956) A Contribution to the Theory of Economic Growth, The Quarterly Journal of Economics , 70, 65–94.
Solow, R. (1987) We’d Better Watch Out. New York Times, July 12, Book Review, No. 36.
Stiroh, K. (2002) Are ICT Spillovers Driving the New Economy? Review of Income and Wealth , 48, 33–57.
151
Suriñach, J., Romaní, J. and Termes, M. (2007) ¿Afecta la banda ancha al crecimiento económico? Evidencia sobre agentes y territorio, Investigaciones Regionales , 10, 20735.
Tambe, P. and Hitt, L.M. (2011) The Productivity of Information Technology Investments: New Evidence from IT Labor Data. SSRN eLibrary.
Thompson, H.G. and Garbacz, C. (2011) Economic Impacts of Mobile versus Fixed Broadband. Telecommunications Policy, 35, 9991009.
Van Beveren, I. (2012) Total Factor Productivity Estimation: A Practical Review, Journal of Economic Surveys, 26, 98128.
Vayá, E., LópezBazo, E., Moreno, R. and Suriñach, J. (2004) Growth and Externalities Across Economies: An Empirical Analysis Using Spatial Econometrics, in Anselin, L., Florax, R.J.G.M. and Rey S.J. (eds), Advances in Spatial Econometrics , Methodology, Tools and Applications . Berlin: Springer, 433–55.
Vicente, M.R. and López, A.J. (2011) Assessing the regional digitaldivide across the European Union27, Telecommunications Policy , 35, 22037.
Vogel, J. (2015) The Two Faces of R&D and Human Capital: Evidence from Western European Regions, Papers in Regional Science , 94, 525–51.
Young, A. (1994) Lessons from the East Asian NICs: A Contrarian View, European Economic Review , 38, 964–73.
Young, A. (1995) The Tyranny of Numbers: Confronting the Statistical Realities of the East Asian Growth Experience, The Quarterly Journal of Economics , 110, 641–80.
152