Estácio: BTG CEO Conference Presentation
30
Estácio Participações Corporate Presentation September 2015
-
Upload
estacio-participacoes -
Category
Investor Relations
-
view
236 -
download
3
Transcript of Estácio: BTG CEO Conference Presentation

Estácio ParticipaçõesCorporate Presentation
September 2015

Estácio: National Coverage & One Single Brand
University College UniversityCenter
Note: (1) As of September 2, 2015.(2) Distance Learning (DL)
RevenuesEBITDA
% marginMarket cap1
2,773.8
659.1
23.8%
3,987
LTM(R$ mm)
6 regionals
9,000+ professors and 5,000+ staff members
Nationwide presence: on-campus and DL2 centers
90 campuses in 45 major cities
170 active DL2 centers
78 career programs
Over 501,500 students
134,000 DL2 students
62,000 graduate students
2
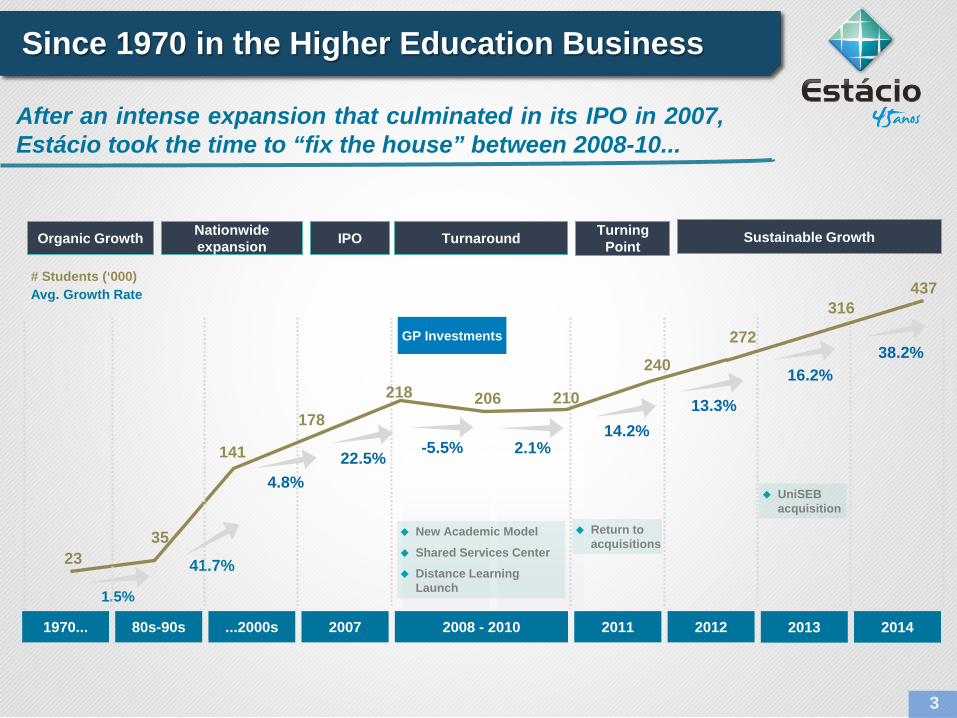
Since 1970 in the Higher Education Business
Organic Growth Nationwide expansion IPO Turnaround Turning
Point
1970... 80s-90s ...2000s 2008 - 2010 2011 2012
2335
141
178218 206 210
240
272
1.5%
41.7%
4.8%22.5% -5.5% 2.1%
14.2%
New Academic Model
Shared Services Center
Distance Learning Launch
GP Investments
# Students (‘000)Avg. Growth Rate
13.3%
2013
16.2%
UniSEBacquisition
316
2014
Sustainable Growth
437
2007
Return to acquisitions
3
After an intense expansion that culminated in its IPO in 2007,Estácio took the time to “fix the house” between 2008-10...
38.2%
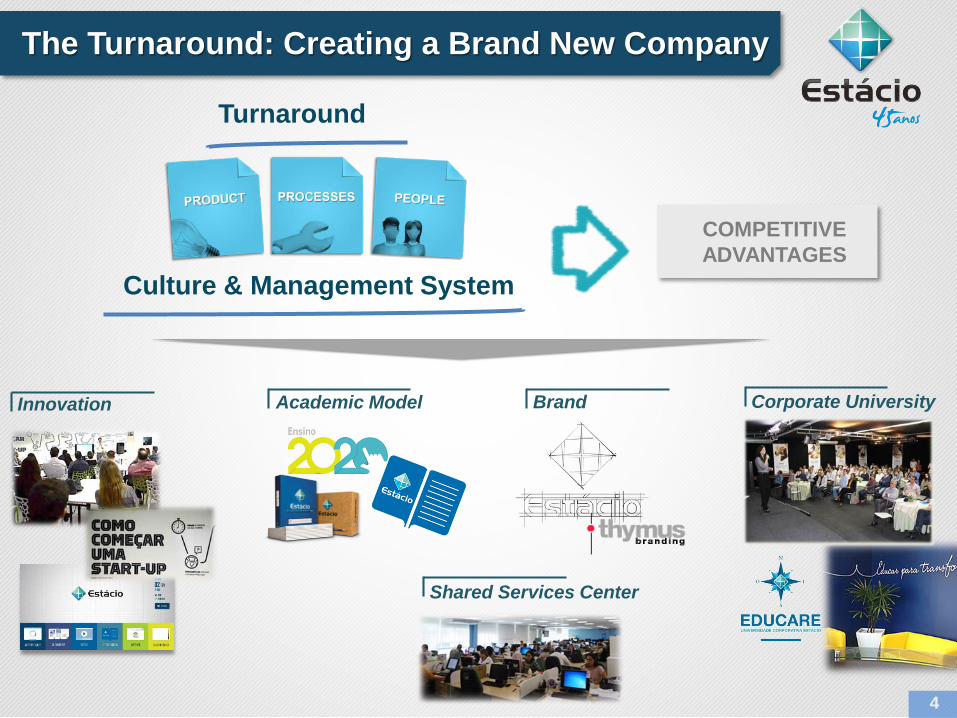
The Turnaround: Creating a Brand New Company
4
Culture & Management System
Turnaround
COMPETITIVE ADVANTAGES
Shared Services Center
Innovation Academic Model Corporate UniversityBrand

218 206 210240
272316
438
2008 2009 2010 2011 2012 2013 2014
Higher Education Student Base (‘000)
65 95 92 123210
320
5336,6%
9,4% 9,1%10,7%
15,2%
18,5%
22,2%
0,0 %
5,0 %
10, 0%
15, 0%
20, 0%
25, 0%
0
100
200
300
400
500
600
2008 2009 2010 2011 2012 2013 2014
EBITDA (R$ mn)
980 1,009 1,016 1,1481,383
1,731
2,405
2008 2009 2010 2011 2012 2013 2014
Net Revenue (R$ mn)
Net Income (R$ mn)
5
3764 81 70
110
245
426
0
50
100
150
200
250
300
350
400
450
2008 2009 2010 2011 2012 2013 2014
After the Turnaround: a Solid Track Record
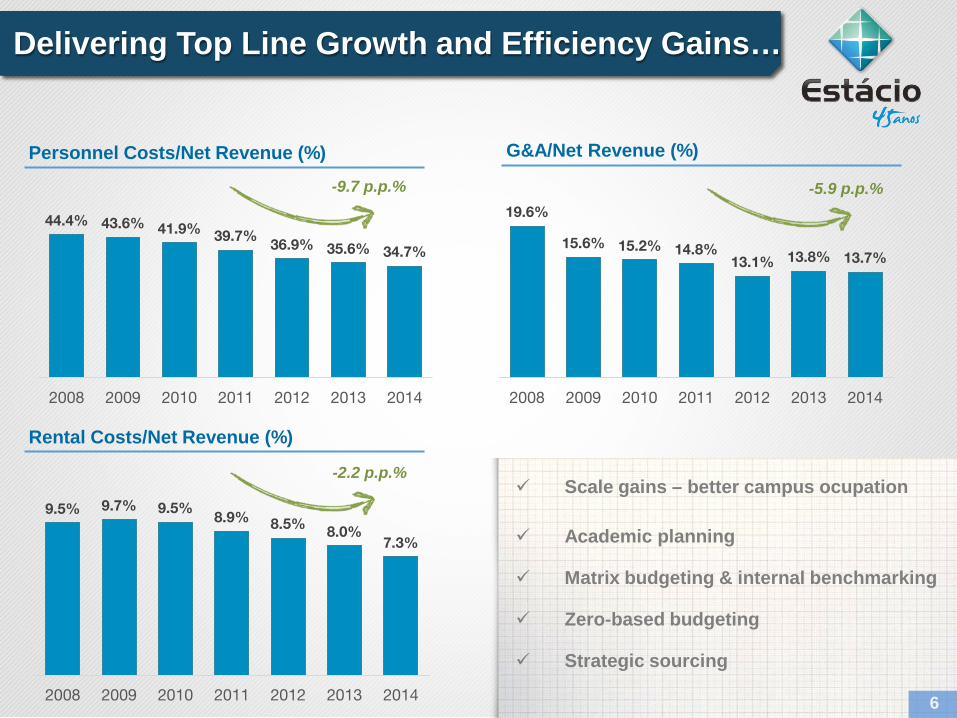
Personnel Costs/Net Revenue (%) G&A/Net Revenue (%)
44.4% 43.6% 41.9% 39.7%36.9% 35.6% 34.7%
2008 2009 2010 2011 2012 2013 2014
19.6%
15.6% 15.2% 14.8%13.1% 13.8% 13.7%
2008 2009 2010 2011 2012 2013 2014
9.5% 9.7% 9.5%8.9% 8.5% 8.0%
7.3%
2008 2009 2010 2011 2012 2013 2014
Rental Costs/Net Revenue (%)
-9.7 p.p.% -5.9 p.p.%
-2.2 p.p.% Scale gains – better campus ocupation
Academic planning
Matrix budgeting & internal benchmarking
Zero-based budgeting
Strategic sourcing
6
Delivering Top Line Growth and Efficiency Gains…

58%60%
64% 64%67% 68%
73%
2008 2009 2010 2011 2012 2013 2014
56% 56%
62%65% 65%
68%
73%
2008 2009 2010 2011 2012 2013 2014
Employee SatisfactionPESA – Student Satisfaction Survey (On-Campus)
PESA – Student Satisfaction Survey (DL)
63%58% 59%
72%77%
2010 2011 2012 2013 2014
Significant improvement in the satisfaction
of our students, with the highlight going to
the DL segment
Substantial improvement in our
organizational climate in 2014, + 5 p.p. –
10.8k survey participants
… but Taking Care of the Satisfaction…
7
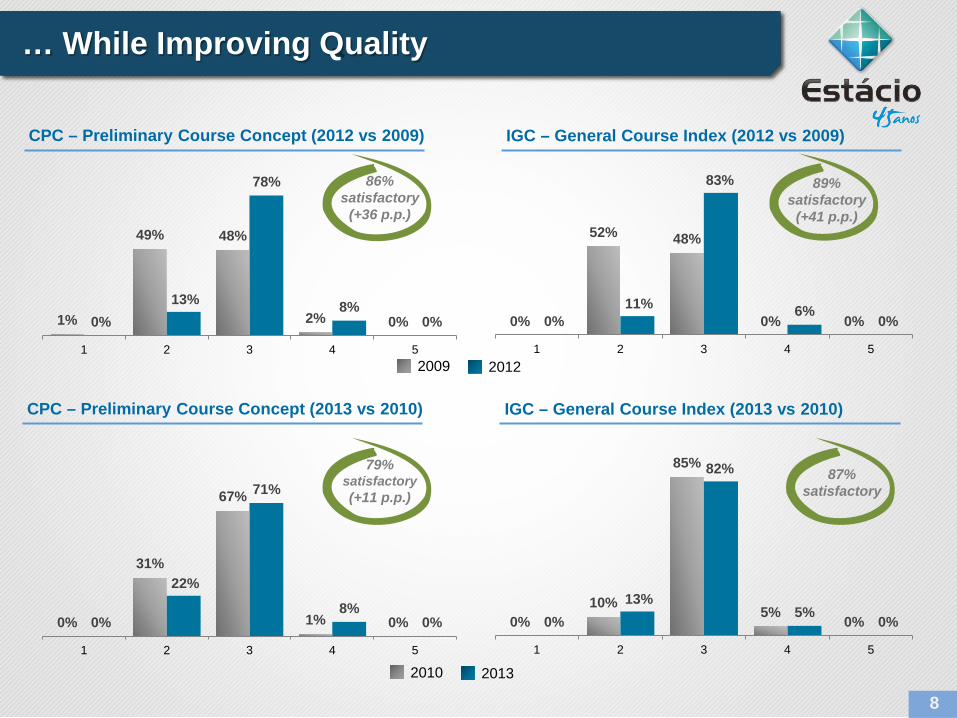
1%
49% 48%
2% 0%0%13%
78%
8%0%
1 2 3 4 5
0%
52% 48%
0% 0%0%11%
83%
6%0%
1 2 3 4 5
CPC – Preliminary Course Concept (2012 vs 2009) IGC – General Course Index (2012 vs 2009)
CPC – Preliminary Course Concept (2013 vs 2010) IGC – General Course Index (2013 vs 2010)
0%
31%
67%
1% 0%0%
22%
71%
8%0%
1 2 3 4 5
0%10%
85%
5% 0%0%13%
82%
5% 0%
1 2 3 4 5
79% satisfactory(+11 p.p.)
87% satisfactory
86% satisfactory
(+36 p.p.)
89% satisfactory
(+41 p.p.)
2009 2012
2010 2013
… While Improving Quality
8

Today Estácio is in a Very Different Stage…
2010 2014
9
% of Rio de Janeiro Exposure
# Campuses 69 85
# DL Centers 52 163
% of DL Share in the Student Base 12% 27%
Market Cap (R$ mn) 2,215 7,457
# Cities 115+
39%54%
35

94%
76% 74%62%
45%32% 29% 27%
… In a Sector with Strong Fundamentals
The positive fundamentals of the sector remain in place andEstácio is a well-run company ready to benefit from them.
Snapshot of the Brazilian Education Plan (2014 Law)
Main Goals
It is not possible for the Government to reach its targetsfor Higher Education without the private sector
It is not possible to reach the targets without FIES orother financing alternative
Private SectorRole
(18-24 years) 2013Census PNE Target
Net enrollment rate1 16.5% 33.0%Gross enrollment rate2 32.3% 50.0%Total students enrolled inhigher education 7.3 million 10.0 million
• Demographic Bonus
• “C class” population increased and now believethey can have a higher education degree
• High returns after graduationOECD
average
256 211
191 188 184 179 169 167 167 164 153
Average Wage Increase with Undergrad. Degree
In Brazil, wages are 2.5x higher with a degree
10
Higher Education Penetration2
Notes: (1) Students from 18 to 24 years old in higher education / Total 18 to 24 years old population(2) Students in postsecondary education / Total 18 to 24 years old population.
Fundamentals remain the same
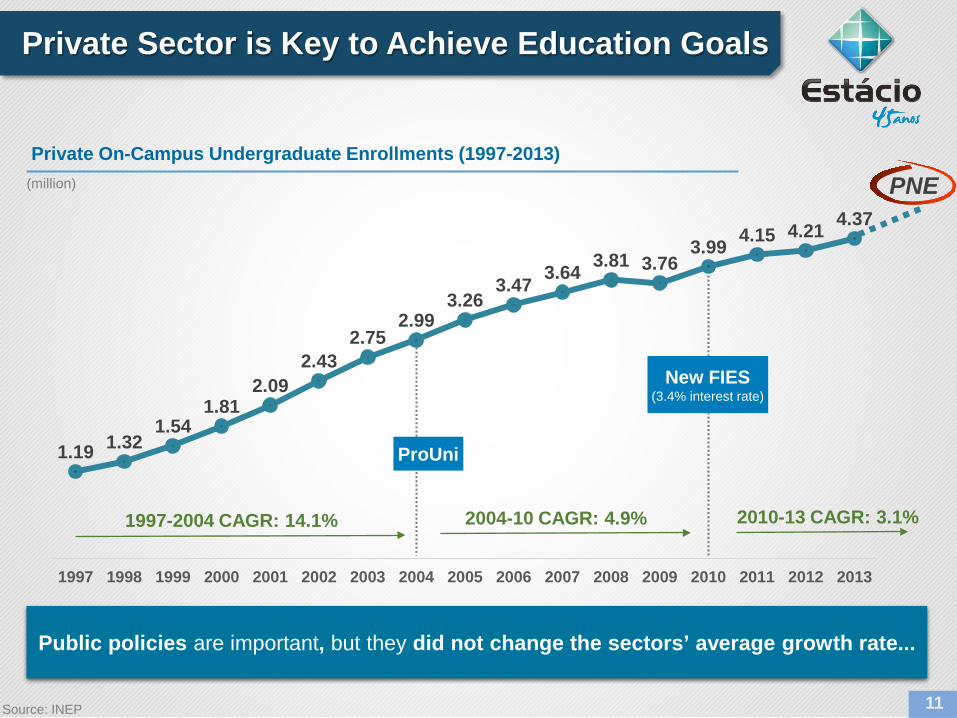
Source: INEP
Private Sector is Key to Achieve Education Goals
1.19 1.321.54
1.812.09
2.432.75
2.993.26
3.47 3.64 3.81 3.763.99 4.15 4.21 4.37
1997 1998 1999 2000 2001 2002 2003 2004 2005 2006 2007 2008 2009 2010 2011 2012 2013
Private On-Campus Undergraduate Enrollments (1997-2013)(million)
New FIES (3.4% interest rate)
ProUni
1997-2004 CAGR: 14.1% 2004-10 CAGR: 4.9% 2010-13 CAGR: 3.1%
Public policies are important, but they did not change the sectors’ average growth rate...
11
PNE
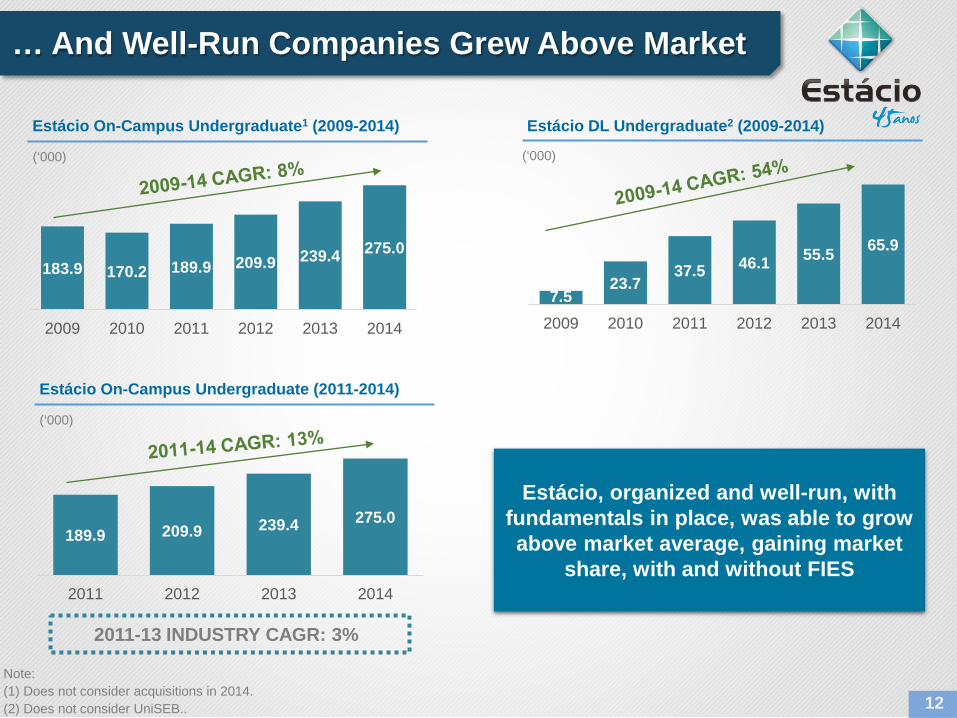
183.9 170.2 189.9 209.9 239.4 275.0
2009 2010 2011 2012 2013 2014
Estácio On-Campus Undergraduate1 (2009-2014)
(‘000)
Estácio DL Undergraduate2 (2009-2014)
7.523.7
37.5 46.1 55.5 65.9
2009 2010 2011 2012 2013 2014
(‘000)
Note: (1) Does not consider acquisitions in 2014. (2) Does not consider UniSEB..
… And Well-Run Companies Grew Above Market
12
Estácio, organized and well-run, with fundamentals in place, was able to grow above market average, gaining market
share, with and without FIES189.9 209.9 239.4 275.0
2011 2012 2013 2014
Estácio On-Campus Undergraduate (2011-2014)
(‘000)
2011-13 INDUSTRY CAGR: 3%

Lower consumer confidence
Higher unemployment
Macroeconomic deterioration
Political instability
FIES
2015: Changes in the Scenario?
13

“FIES 1.5”: Adjusting for Sustainability
14
Fiscal adjustment demanded a lower volume of new contracts – 314k in 2015
Conditions changing to make FIES more sustainable in the future
Cash flow constraint: PN#23 should be valid only in 2015 (postponement of 4 monthly tuitions)
FIES budget for 2016 at R$18.8 billion: should allow for a level of new contracts similar to 2015 and the normalization of FIES tuition payments
Before 2010 From 2010 to 1H15 2H15
Interest Rate 6.5% p.a. 3.4% p.a. 6.5% p.a.
Grace Period 6 months 18 months 18 months
Duration 2x course length 3x course length + 12 months 3x course length
Income Criteria - Up to 20 minimum wages per family
Up to 2.5 minimum wages per capita
Priority Regions - - N/NE/MW (ex-DF)
Minimum Quality Metrics CC >= 3 CC >= 3 CC >=3, but with priority for grades 4 and 5
Priority Courses - - Health/Engineering/Teaching
Minimum Student Eligibilility - ENEM 450 points in ENEM/ > 0 in ENEM essay
Average Ticket Discount - - 5%
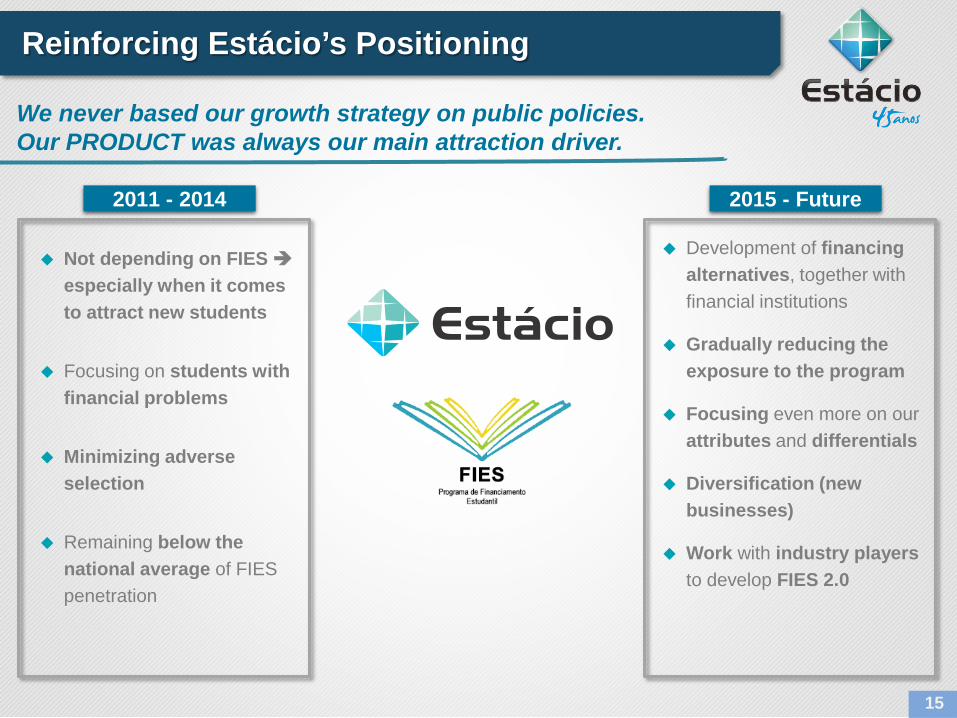
Reinforcing Estácio’s Positioning
Not depending on FIES especially when it comes to attract new students
Focusing on students with financial problems
Minimizing adverse selection
Remaining below the national average of FIES penetration
2011 - 2014
Development of financing alternatives, together with financial institutions
Gradually reducing the exposure to the program
Focusing even more on our attributes and differentials
Diversification (new businesses)
Work with industry players to develop FIES 2.0
2015 - Future
15
We never based our growth strategy on public policies.Our PRODUCT was always our main attraction driver.
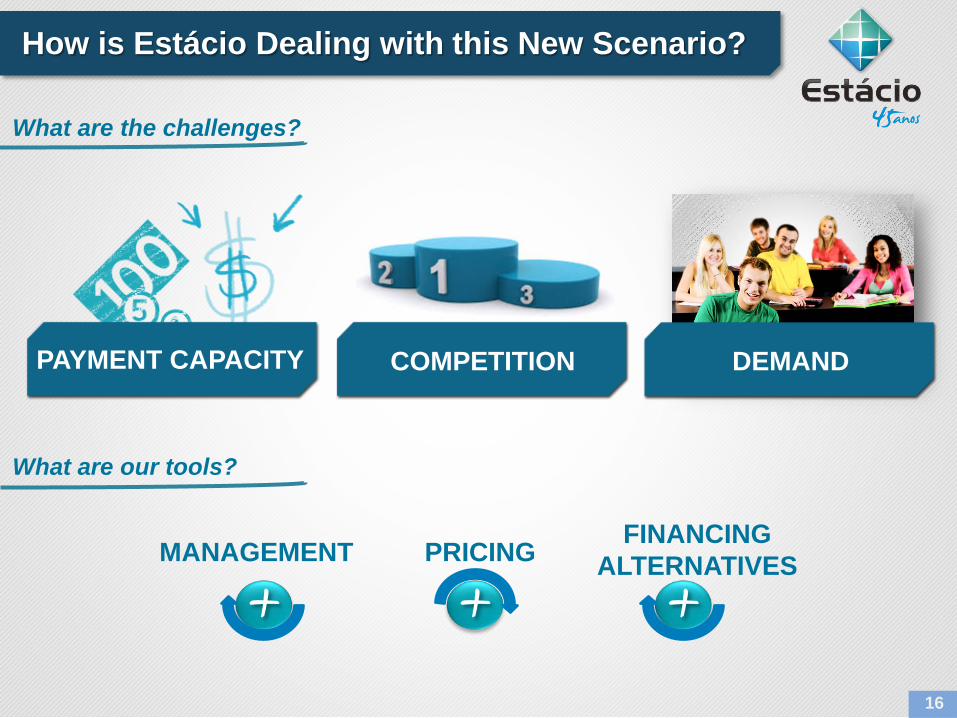
How is Estácio Dealing with this New Scenario?
MANAGEMENT PRICING FINANCING ALTERNATIVES
PAYMENT CAPACITY COMPETITION DEMAND
16
What are the challenges?
What are our tools?
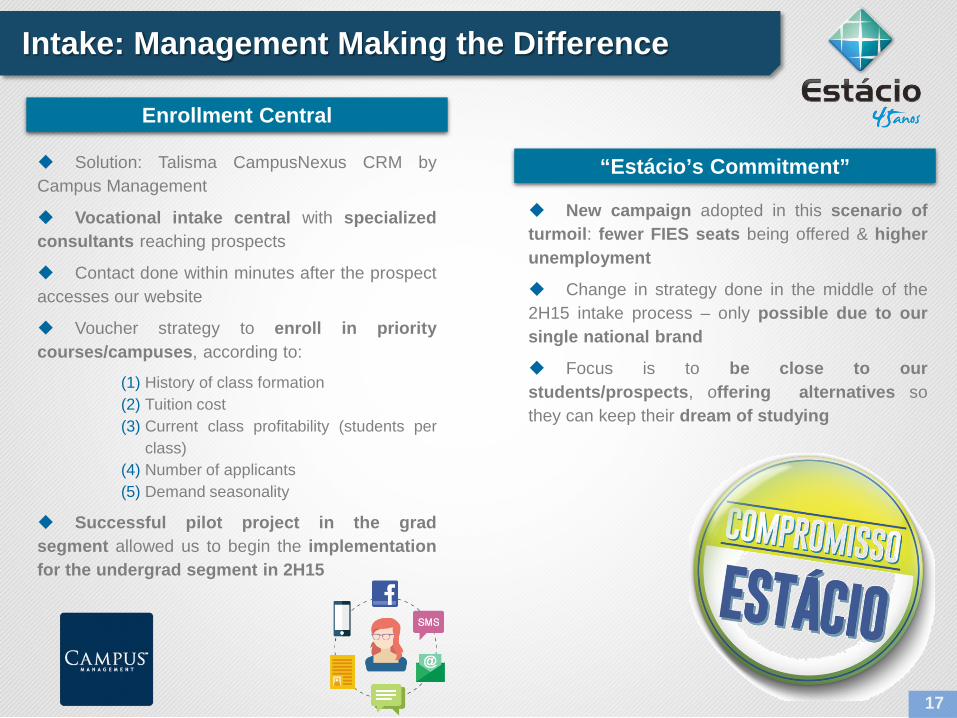
Intake: Management Making the Difference
Solution: Talisma CampusNexus CRM byCampus Management
Vocational intake central with specializedconsultants reaching prospects
Contact done within minutes after the prospectaccesses our website
Voucher strategy to enroll in prioritycourses/campuses, according to:
(1) History of class formation(2) Tuition cost(3) Current class profitability (students per
class)(4) Number of applicants(5) Demand seasonality
Successful pilot project in the gradsegment allowed us to begin the implementationfor the undergrad segment in 2H15
17
New campaign adopted in this scenario ofturmoil: fewer FIES seats being offered & higherunemployment
Change in strategy done in the middle of the2H15 intake process – only possible due to oursingle national brand
Focus is to be close to ourstudents/prospects, offering alternatives sothey can keep their dream of studying
Enrollment Central
“Estácio’s Commitment”
Retention: Management Making the Difference
18
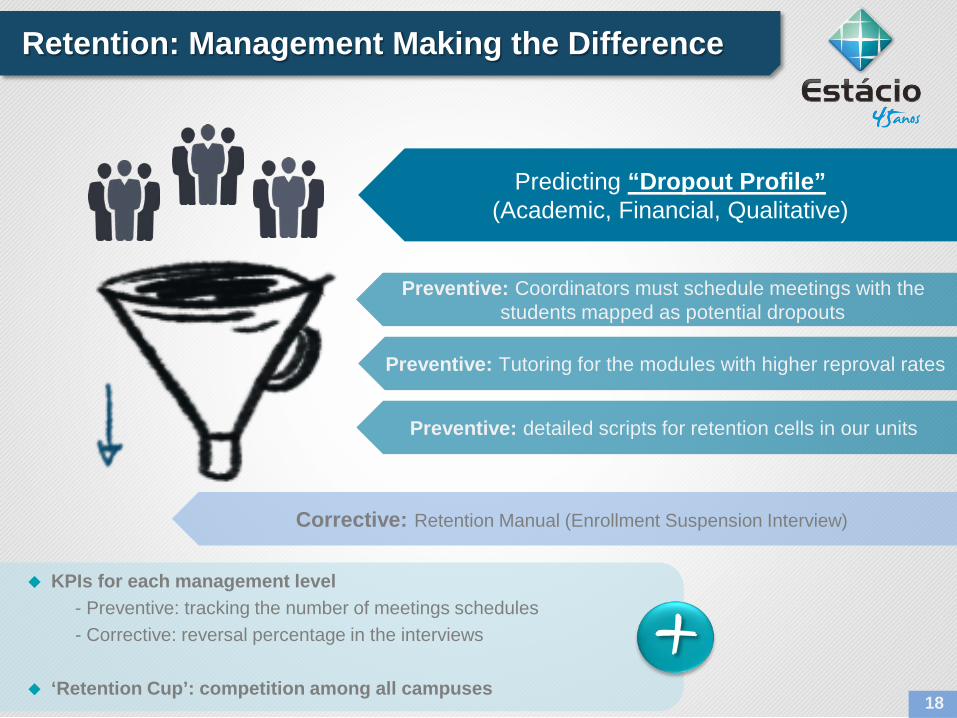
Predicting “Dropout Profile”(Academic, Financial, Qualitative)
Preventive: Coordinators must schedule meetings with thestudents mapped as potential dropouts
Preventive: Tutoring for the modules with higher reproval rates
Preventive: detailed scripts for retention cells in our units
Corrective: Retention Manual (Enrollment Suspension Interview)
KPIs for each management level- Preventive: tracking the number of meetings schedules- Corrective: reversal percentage in the interviews
‘Retention Cup’: competition among all campuses

Management Making the Difference
303.6 349.3
79.496.0
56.2
2Q14 2Q15
(‘000)
DLOn-Campus Acquisitions
+15.1%
+20.9%
Expectation3Q15 vs. 3Q14
3Q15 renewal rates at the same levels recorded in 3Q14, both in on-campus
and distance learning segments
19
2Q15 dropout rates under control
On-Campus Undergraduate
Distance Learning Undergraduate
+3 to +6%
+8 to +12%
1H15 STUDENT BASE 2H15 INTAKE & RENEWAL

Pricing Strategy Defined by Location
Price-elasticity studies conducted per location maintaining margins and market share
20
Public and demand analysis per location/neighborhood
No price wars
Offering of less expensive options (“EAD” and “EAD Mais”)
Strategic discounts
Payment alternatives
Price and discount decisions are defined by course and location .

Financing Alternatives
PraValerFull payment to be done in twice the course duration
Installments: 50% of the montly tuition + IPCA, without interests for the student
Estácio subsidizes the interest rate: 1.82% p.m.
We receive the whole semester tuitions upfront
PraValer assumes the default of contracted students
Around 5,000 contracts signed (June)
Payment in InstallmentsFocus on credit cards (8x without interest, 12x with interest)
Specific conditions for each type of student – academic and financialconditions analysis
Special conditions for students who lost FIES
Educational Insurance Other financing alternatives for 2016
21

Other Potential Impacts?
22
Average Ticket Delinquency

Average Ticket Should Grow…
23
544.1 503.6 525.6538.9 595.9 565.0 593.2 565.6
627.7
199.0 195.5 179.6 192.9 194.4 169.7 189.7 185.7 194.6
2Q13 3Q13 4Q13 1Q14 2Q14 3Q14 4Q14 1Q15 2Q15
On-CampusDistance Learning
NET AVERAGE TICKET(R$)
11.4%6.0% 5.9%
10.0% 9.5%12.2% 12.9%
5.0% 5.3%6.0%2.5%
-6.6%
-0.4% -2.3%
-13.2%
5.6%
-3.7%-0.4%
2Q13 3Q13 4Q13 1Q14 2Q14 3Q14 4Q14 1Q15 2Q15
On-CampusDistance Learning
NET AVERAGE TICKET CHANGE (YoY)
…but probably at a softer pace
New Scenario in 2015
Course mix effect
Higher price sensitivity
So Far, Delinquency is Under Control
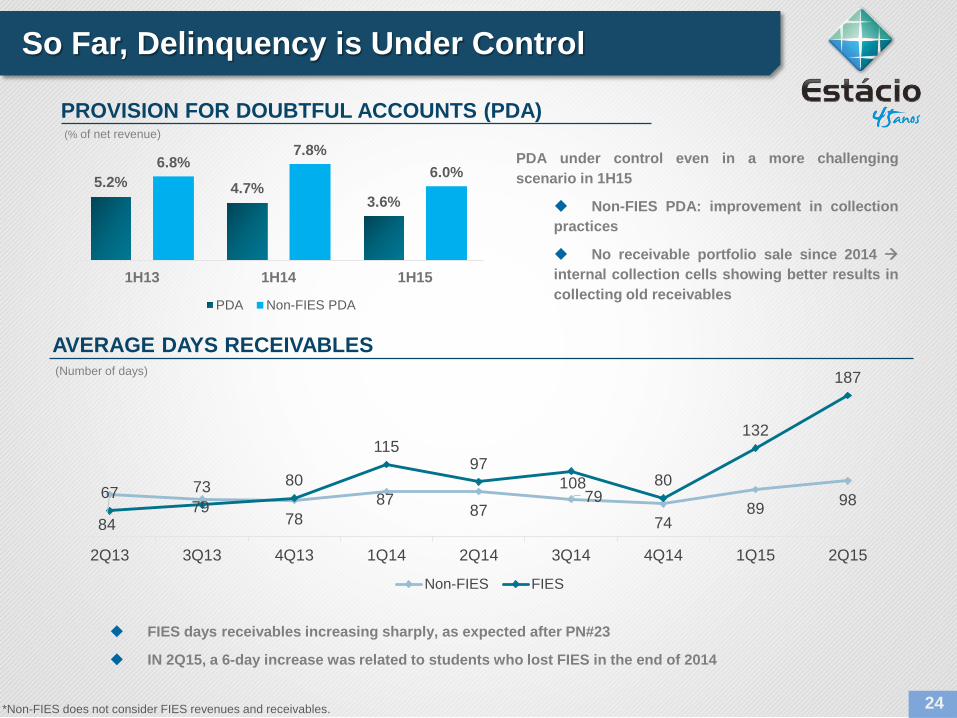
5.2% 4.7%3.6%
6.8%7.8%
6.0%
1H13 1H14 1H15
PDA Non-FIES PDA
PROVISION FOR DOUBTFUL ACCOUNTS (PDA)(% of net revenue)
PDA under control even in a more challengingscenario in 1H15
Non-FIES PDA: improvement in collectionpractices
No receivable portfolio sale since 2014 internal collection cells showing better results incollecting old receivables
8479
7887
8779
7489 9867 73 80
11597
108 80
132
187
2Q13 3Q13 4Q13 1Q14 2Q14 3Q14 4Q14 1Q15 2Q15
Non-FIES FIES
AVERAGE DAYS RECEIVABLES(Number of days)
*Non-FIES does not consider FIES revenues and receivables. 24
FIES days receivables increasing sharply, as expected after PN#23
IN 2Q15, a 6-day increase was related to students who lost FIES in the end of 2014

New Scenario Generates Opportunities…
Cash flow constraints will affect the small players
Smaller companies have a weaker balance sheet and/or may over-rely on FIES
Multiple de-rating could create very interesting consolidation opportunities
Pipeline of targets remains active
Big/transformational acquisitions are not ruled out, especially in this scenario
Consolidation opportunities as smaller players suffer with crisis…
Strategy of acquiring small and mid-sized acquisitions remains in place
Paying more attention to more sizeable opportunities
25
In July, we announced the acquisiton of FNC, located inCarapicuíba/SP, with 8,700 students and more than 16,000seats, for R$90 million

Distance Learning Gains Importance
More Distance Learning in our mix contributes to margin gains
10 26
39 49 61
117 134
2009 2010 2011 2012 2013 2014 1H15
Distance Learning Student Base Evolution (‘000)
DL Share in Revenues (% of Total Net Revenue)
3%
5%
8% 8% 8%9%
1H10 1H11 1H12 1H13 1H14 1H15
• Until 1H15, this increase was all organic• Now with the integration of UniSEB, the
distance learning share in our mix should increase faster
DL is a less expensive alternative that can fit the students’ pockets – more FIES favors demand for on-campus courses
Ramp-up of UniSEB’S operation (increase in the number of students per center)
Capillarity increase to distribute Estácio’s scalable 100% online model
Another 225 requests for new centers being analyzed by the Ministry of Education (MEC)
Average center size
Estácio: around 1,600 students/centerUniSEB: around 300 students/centers
Scale gains opportunity
*Note: Considering UniSEB only in 1Q15. 26

Organic Expansion Continues
27
1 unit in Bauru 2 units in São José do Rio Preto
Expansion in Rio de JaneiroExpansion in Niterói
1 unit in Contagem1 unit in Barbacena
1 unit in Goiânia1 unit in Jataí
1 unit in Cachoeiro de Itapemirim1 unit in São Mateus
1 unit in Manaus
1 unit in Imperatriz1 unit in Marabá1 unit in Belém
1 unit in Cuiabá
Expansion in Maceió
Expansion in Aracajú
Expansion in S. Paulo
Also, we should open 5 Medicine courses in new cities in 2016 (“Mais Médicos” program)
1 unit in Volta Redonda1 unit in Angra dos Reis1 unit in Teresópolis
1 unit in Jaboatão do Guararapes
1 unit in Ananindeua
1 unit in Cascavel,1 unit in S. J. dos Pinhais1 unit in Maringá
1 unit in Passos1 unit in Muriaé
Angra dos Reis
Alagoinhas Juazeiro
Jaraguá do Sul“Mais Médicos”
Greenfields
Greenfields (TBC)
Organic Expansion
Expansion in Belo HorizonteExpansion in Juiz de Fora
Expansion in Macapá
Expansion in Ceará
Ijuí
24 authorization requests for new greenfields, besides thelaunch of 5 new units where we have autonomy
Cash Flow Suffered the Most in 2015
28
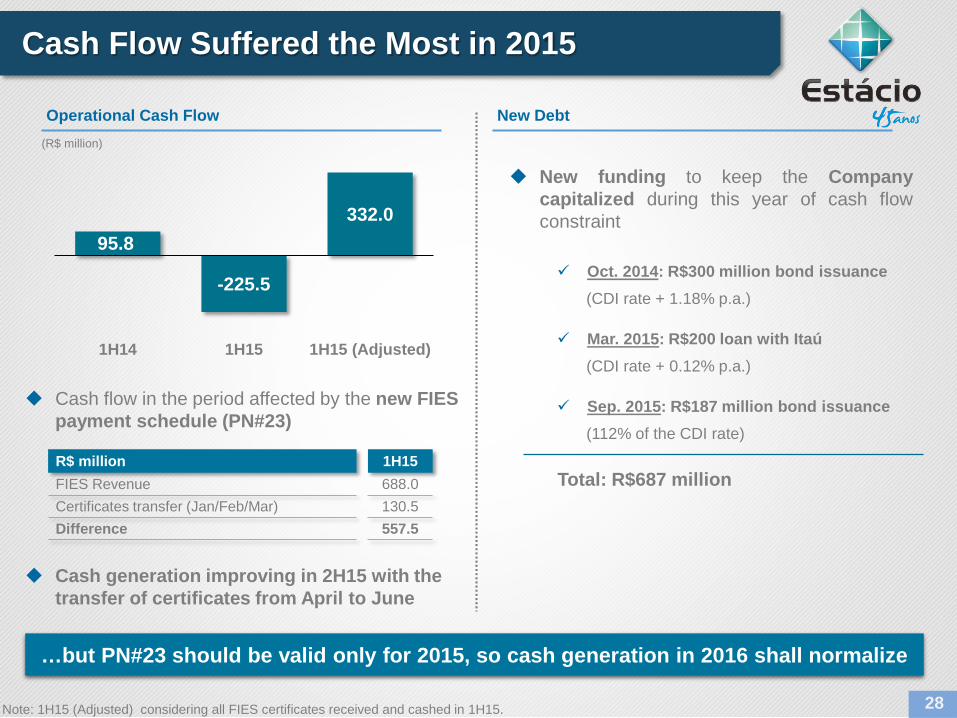
95.8
-225.5
332.0
1H14 1H15 1H15 (Adjusted)
Cash flow in the period affected by the new FIES payment schedule (PN#23)
Cash generation improving in 2H15 with the transfer of certificates from April to June
R$ million 1H15FIES Revenue 688.0 Certificates transfer (Jan/Feb/Mar) 130.5 Difference 557.5
…but PN#23 should be valid only for 2015, so cash generation in 2016 shall normalize
Note: 1H15 (Adjusted) considering all FIES certificates received and cashed in 1H15.
(R$ million)
New funding to keep the Companycapitalized during this year of cash flowconstraint
Oct. 2014: R$300 million bond issuance(CDI rate + 1.18% p.a.)
Mar. 2015: R$200 loan with Itaú(CDI rate + 0.12% p.a.)
Sep. 2015: R$187 million bond issuance(112% of the CDI rate)
Operational Cash Flow New Debt
Total: R$687 million

Estácio is Ready to Benefit from the Opportunities
Target audience sees Education as an achievement and as a way to preserve their recent social/income gains
Sector long-term fundamentals: Brazil’s Higher Education market is highly underpenetrated
Internal surveys indicate that Education is a top priority for Brazillian average families during the crisis
Estácio is ready to continue growing even in a more challenging scenario after preparing itself for the last 7years
Consolidation and new businesses lines are very present in our radar screen
29

Investor [email protected]+55 21 3311 9789
This presentation may contain forward-looking statements concerning the industry’sprospects and Estácio Participações’ estimated financial and operating results; these are ereprojections and. as such. are based solely on the Company management’s expectationsregarding the future of the business and its continuous access to capital to finance EstácioParticipações’ business plan. These considerations depend substantially on changes in marketconditions. government rules. competitive pressures and the performance of the sector andthe Brazilian economy as well as other factors and are. therefore. subject to changes withoutprevious notice. Information presented for comparison purposes should not be considered as abasis for calculation of dividends. taxes or for any other corporate purposes. 30