Experimental Analysis of Porosity and Permeability …...micromachines Article Experimental Analysis...
8
micromachines Article Experimental Analysis of Porosity and Permeability in Pressed Paper Juhwan Park, Joong Ho Shin and Je-Kyun Park * Department of Bio and Brain Engineering, Korea Advanced Institute of Science and Technology (KAIST), 291 Daehak-ro, Yuseong-gu, Daejeon 34141, Republic of Korea; [email protected] (J.P.); [email protected] (J.H.S.) * Correspondence: [email protected]; Tel.: +82-42-350-4315 Academic Editors: Nam-Trung Nguyen and Sergey S. Shevkoplyas Received: 28 January 2016; Accepted: 10 March 2016; Published: 14 March 2016 Abstract: In this paper, we report an analysis of pressed paper in terms of porosity and permeability. Previously, we reported a pressed paper that exhibits decreased porosity and permeability. Additionally, its applications into programmed sample delivery as well as flow rate control were reported. However, there is a need for a theoretical analysis of pressed paper in terms of porosity and permeability for a more precise design principle and its applications because porosity and permeability are important factors in determining fluidic behavior. Here, we propose a theoretical model for analyzing decreased porosity and permeability in pressed paper. Porosity and permeability of pressed paper were quantitatively calculated using experimental results with a theoretical model. Furthermore, based on the analyzed results of porosity and permeability in pressed paper, a porosity–permeability relationship was investigated. Keywords: paper-based microfluidics; porosity; permeability; pressed paper 1. Introduction Paper has been widely used as a detection platform because of its advantages, including low cost, wide availability, and capillary driven simple operation principle [1–4]. Recently, a number of microfluidic paper-based analytical devices (μPADs) have been developed by realizing patterned paper in various forms to perform biological assays [5–10]. Although μPADs confined fluid flow along capillary channel by forming hydrophobic barriers on paper, they did not control fluid flow along capillary channels. However, there is a need for controlling the fluid flow along capillary channels in order to develop μPADs that can handle complicated reaction steps. To realize complicated reaction steps, many methods for controlling fluid flow on paper have been reported, including surfactant based fluidic diode valves [11], geometry modification of fluidic channel [12,13], dissolvable barriers for time delays [14], and paraffin infused paper [15]. However, the above-mentioned methods require complicated fabrication processes, such as chemical treatment and spatially limited geometry modification. As a simple method for controlling fluid flow on paper, we recently reported on pressed paper and its application to flow rate control and programmed sample delivery [16]. Controlling fluid flow was easily demonstrated by collapsing the porous network. On the other hand, the physical collapse of porous network usually occurs in a calendering process, which is conventionally used to finalize paper manufacturing to provide a smooth and shiny surface. Moreover, the effects of the calendering process have been studied regarding morphology of fibers and surface properties of paper [17–19]. However, in this paper, capillary flow was controlled by collapsing the porous network, which results in decreased porosity and permeability. In general, for porous materials, porosity and permeability are important factors in determining characteristic of fluidic behavior [20,21]. To date, many theoretical Micromachines 2016, 7, 48; doi:10.3390/mi7030048 www.mdpi.com/journal/micromachines
Transcript of Experimental Analysis of Porosity and Permeability …...micromachines Article Experimental Analysis...
micromachines
Article
Experimental Analysis of Porosity and Permeabilityin Pressed Paper
Juhwan Park, Joong Ho Shin and Je-Kyun Park *
Department of Bio and Brain Engineering, Korea Advanced Institute of Science and Technology (KAIST),291 Daehak-ro, Yuseong-gu, Daejeon 34141, Republic of Korea; [email protected] (J.P.);[email protected] (J.H.S.)* Correspondence: [email protected]; Tel.: +82-42-350-4315
Academic Editors: Nam-Trung Nguyen and Sergey S. ShevkoplyasReceived: 28 January 2016; Accepted: 10 March 2016; Published: 14 March 2016
Abstract: In this paper, we report an analysis of pressed paper in terms of porosity and permeability.Previously, we reported a pressed paper that exhibits decreased porosity and permeability. Additionally,its applications into programmed sample delivery as well as flow rate control were reported. However,there is a need for a theoretical analysis of pressed paper in terms of porosity and permeability fora more precise design principle and its applications because porosity and permeability are importantfactors in determining fluidic behavior. Here, we propose a theoretical model for analyzing decreasedporosity and permeability in pressed paper. Porosity and permeability of pressed paper werequantitatively calculated using experimental results with a theoretical model. Furthermore, basedon the analyzed results of porosity and permeability in pressed paper, a porosity–permeabilityrelationship was investigated.
Keywords: paper-based microfluidics; porosity; permeability; pressed paper
1. Introduction
Paper has been widely used as a detection platform because of its advantages, including lowcost, wide availability, and capillary driven simple operation principle [1–4]. Recently, a number ofmicrofluidic paper-based analytical devices (µPADs) have been developed by realizing patternedpaper in various forms to perform biological assays [5–10]. Although µPADs confined fluid flowalong capillary channel by forming hydrophobic barriers on paper, they did not control fluid flowalong capillary channels. However, there is a need for controlling the fluid flow along capillarychannels in order to develop µPADs that can handle complicated reaction steps. To realize complicatedreaction steps, many methods for controlling fluid flow on paper have been reported, includingsurfactant based fluidic diode valves [11], geometry modification of fluidic channel [12,13], dissolvablebarriers for time delays [14], and paraffin infused paper [15]. However, the above-mentionedmethods require complicated fabrication processes, such as chemical treatment and spatially limitedgeometry modification.
As a simple method for controlling fluid flow on paper, we recently reported on pressed paperand its application to flow rate control and programmed sample delivery [16]. Controlling fluid flowwas easily demonstrated by collapsing the porous network. On the other hand, the physical collapseof porous network usually occurs in a calendering process, which is conventionally used to finalizepaper manufacturing to provide a smooth and shiny surface. Moreover, the effects of the calenderingprocess have been studied regarding morphology of fibers and surface properties of paper [17–19].However, in this paper, capillary flow was controlled by collapsing the porous network, which resultsin decreased porosity and permeability. In general, for porous materials, porosity and permeability areimportant factors in determining characteristic of fluidic behavior [20,21]. To date, many theoretical
Micromachines 2016, 7, 48; doi:10.3390/mi7030048 www.mdpi.com/journal/micromachines
Micromachines 2016, 7, 48 2 of 8
studies for capillary flow in various paper-based microfluidic devices, including two-dimensionalpaper networks [22], wax-printed paper [23], and porous membrane in complex shape [24], have beenreported in order to understand fluid dynamics. Therefore, a theoretical and experimental analysis fordecreased porosity and permeability in pressed paper is required to understand controlled capillaryflow in pressed paper. Moreover, an analysis of decreased porosity and permeability is also required fora more precise design principle and its applications. Additionally, permeability is usually representedas a function of porosity in porous material such that porosity–permeability relationships have beenstudied with many theoretical models [25,26]. In this sense, an analysis of decreased porosity andpermeability in pressed paper would be helpful in understanding porosity–permeability relationshipsin porous material.
Here, we present a theoretical and quantitative analysis of porosity and permeability in pressedpaper. Pressed paper exhibits decreased porosity and permeability, which results in a decreasedflow rate as well as delayed fluid flow. To understand these phenomena in detail, we constructeda theoretical model for analyzing porosity and permeability in pressed paper. Additionally, fora precise design of paper-based microfluidic devices that include pressed regions, the porosity andpermeability of pressed paper were calculated quantitatively. Finally, based on the analysis of porosityand permeability in pressed paper, a porosity–permeability relationship was investigated.
2. Experimental
2.1. Materials
Tartrazine (yellow dye) and erioglaucine (blue dye) were purchased from Sigma-Aldrich (St. Louis,MO, USA). An absorbent pad (grade 222) and sample pad (grade 319) were purchased from Ahlstrom(Helsinki, Finland). A glass fiber pad (GFCP103000) was purchased from Millipore (Billerica, MA, USA).A nitrocellulose (NC) membrane (CNPC-SS12, 15 µm) was purchased from Advanced Microdevices(Ambala Cantt, India).
2.2. Thickness Measurement of Pressed Paper
A NC membrane was cut into strips (width = 4 mm) using a knife. After an acrylic plate wasplaced on a desirable position of the NC membrane strip, it was partially pressed with a hand pressmachine (SWP-HP180-120S; SamWoo, Siheung, Korea). The amount of applied pressure was measuredby monitoring an indicator connected to load cell (CLS-1 T; Curiosity Technology, Paju, Korea), whichis placed on the hand press machine. The side view of pressed NC membrane strip was capturedwith a scanning electron microscope (SEM). The thickness of the pressed region in the pressed NCmembrane strip was analyzed with ImageJ software (http://rsbweb.nih.gov, NIH, Bethesda, MD, USA).
2.3. Measurement of Decreased Flow Rate in Pressed Paper for Analyzing Decreased Permeability
A NC membrane was cut into the desired shape via laser cutting (laser cutter C40-60W; Coryart,Anyang, Korea). To compare flow rates along different paper fluidic channels, a channel partitionwas developed to divide the NC membrane into two different channels. One channel was pressedwith a hand press machine with different amounts of applied pressure, and the other channel wasunpressed. A 1-mM tartrazine solution (yellow dye) and a 1-mM erioglaucine solution (blue dye) weresupplied into each channel along the glass fiber and sample pad. Fluid flow along the NC membranecontinued until each flow reached equilibrium by placing an absorbent pad at the end of the NCmembrane. After fluid flow along both channels reached equilibrium, wetted portions of each dyesolution in a detection region were analyzed with ImageJ software.
2.4. Porosity Measurement of Unpressed Paper
Porosity of an unpressed NC membrane was experimentally measured. Void volume in the NCmembrane strip (5 mm ˆ 30 mm) was obtained by measuring the absorbed volume of distilled water.
Micromachines 2016, 7, 48 3 of 8
Then, porosity of the unpressed NC membrane was calculated by dividing the absorbed volume ofdistilled water by the whole volume of the unpressed NC membrane strip.
2.5. Darcy’s Law
When infinite sample volume is supplied at source, and the capacity of absorbent pad is infinite,the flow rate along the paper fluidic channel at fully-wetted flow can be described by Darcy’s law, asper the following equation:
Q “ ´κWHµL
∆P (1)
where Q is the volumetric flow rate, κ is the permeability of paper, W is the width of paper, H is thethickness of paper, µ is the viscosity of fluid, L is the length of paper, and ∆P is the pressure differencealong the paper fluidic channel.
3. Results and Discussion
3.1. Pressed Paper
The porous network of paper collapses when it is exposed to applied pressure. As shown inFigure 1, the pressed region shows a decreased pore size and thickness that can be understood asa decrease in permeability according to the increasing amount of applied pressure. The collapsedporous network plays a role in fluid resistance that results in a delayed fluid flow and decreased flowrate. In the case of the wet-out process, the quantity of fluid flow that can penetrate a pressed regiondecreases with respect to the increasing amount of applied pressure. As the quantity of fluid flow thatpasses through a pressed region decreases, a wicking time for the left portion of the paper after thepressed region increases. Therefore, a delayed fluid flow occurred in the pressed paper during thewet-out process. On the other hand, during fully-wetted flow, a decreased flow rate in the pressedpaper can be understood in terms of decreased permeability and thickness in Darcy’s law. Finally, flowrate along the pressed paper decreases with an increasing amount of applied pressure.
Micromachines 2016, 7, 48 3 of 8
3
Then, porosity of the unpressed NC membrane was calculated by dividing the absorbed volume of distilled water by the whole volume of the unpressed NC membrane strip.
2.5. Darcy’s Law
When infinite sample volume is supplied at source, and the capacity of absorbent pad is infinite, the flow rate along the paper fluidic channel at fully-wetted flow can be described by Darcy’s law, as per the following equation:
𝑄𝑄 = −κ𝑊𝑊𝑊𝑊µ𝐿𝐿
∆𝑃𝑃 (1)
where Q is the volumetric flow rate, κ is the permeability of paper, W is the width of paper, H is the thickness of paper, μ is the viscosity of fluid, L is the length of paper, and ΔP is the pressure difference along the paper fluidic channel.
3. Results and Discussion
3.1. Pressed Paper
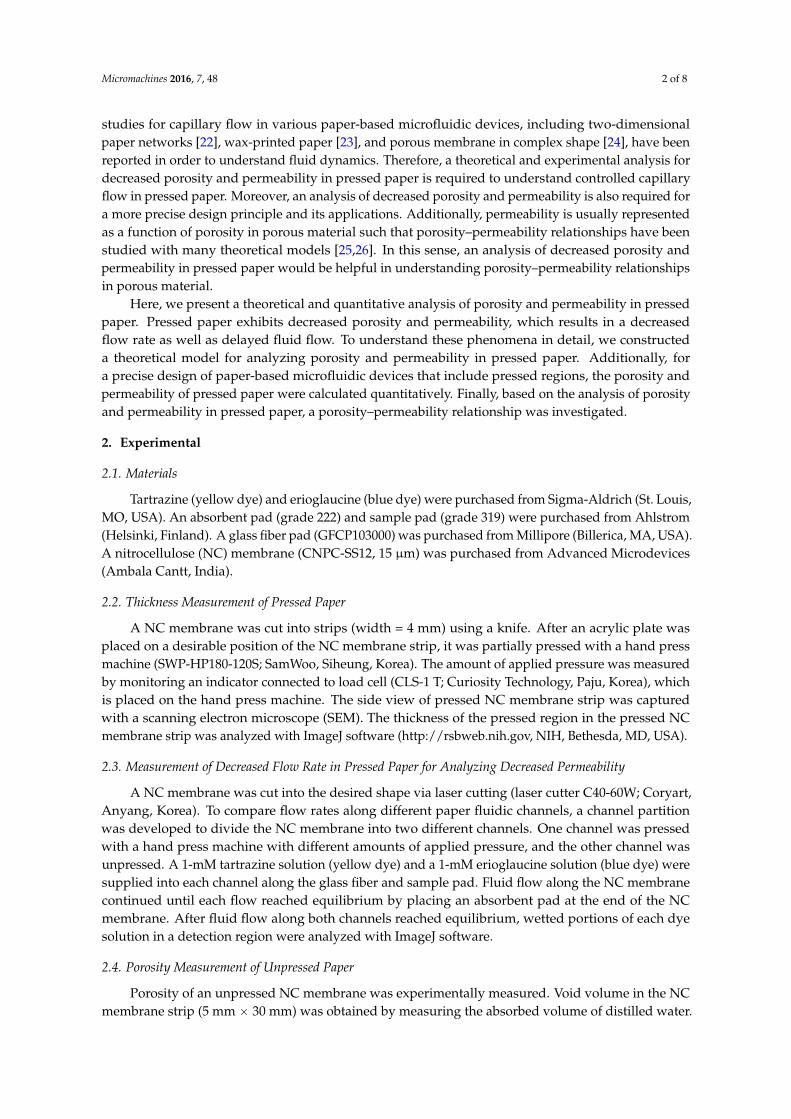
The porous network of paper collapses when it is exposed to applied pressure. As shown in Figure 1, the pressed region shows a decreased pore size and thickness that can be understood as a decrease in permeability according to the increasing amount of applied pressure. The collapsed porous network plays a role in fluid resistance that results in a delayed fluid flow and decreased flow rate. In the case of the wet-out process, the quantity of fluid flow that can penetrate a pressed region decreases with respect to the increasing amount of applied pressure. As the quantity of fluid flow that passes through a pressed region decreases, a wicking time for the left portion of the paper after the pressed region increases. Therefore, a delayed fluid flow occurred in the pressed paper during the wet-out process. On the other hand, during fully-wetted flow, a decreased flow rate in the pressed paper can be understood in terms of decreased permeability and thickness in Darcy’s law. Finally, flow rate along the pressed paper decreases with an increasing amount of applied pressure.
Figure 1. Schematic of pressed paper. Top view (scale bar = 20 μm) and side view (scale bar = 50 μm) of scanning electron microscope (SEM) images in pressed region.
3.2. Porosity of Pressed Paper
Porosity is a measure of the void space, which is an important factor in determining the characteristics of porous materials. The porosity of paper can be calculated with the following equation:
Porosity (𝑝𝑝) = 1 −𝑉𝑉′
𝑉𝑉 (2)
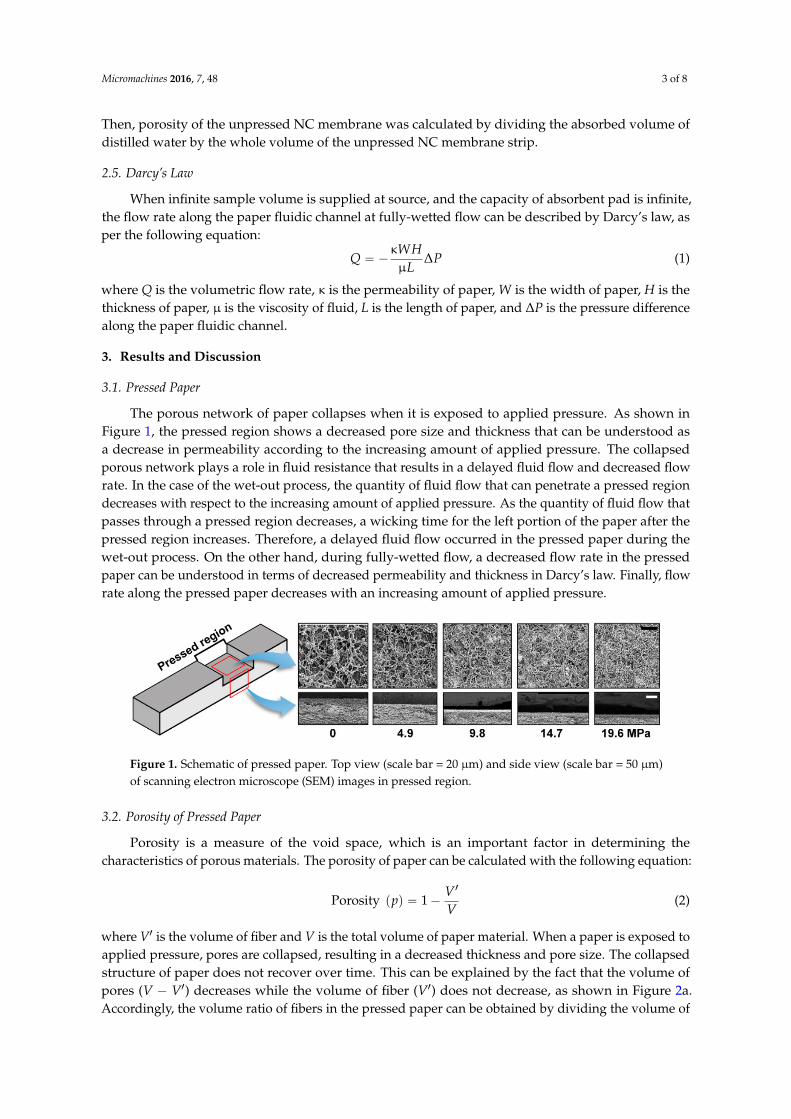
where V’ is the volume of fiber and V is the total volume of paper material. When a paper is exposed to applied pressure, pores are collapsed, resulting in a decreased thickness and pore size. The collapsed structure of paper does not recover over time. This can be explained by the fact that the volume of pores (V − V’) decreases while the volume of fiber (V’) does not decrease, as shown in Figure 2a. Accordingly, the volume ratio of fibers in the pressed paper can be obtained by dividing the volume of fiber (V’) by the entire volume of the pressed paper (V·(H2/H1)). After that, the porosity of the pressed paper can be calculated by subtracting the volume ratio of fibers ((V’/V)·(H1/H2)) in the
Figure 1. Schematic of pressed paper. Top view (scale bar = 20 µm) and side view (scale bar = 50 µm)of scanning electron microscope (SEM) images in pressed region.
3.2. Porosity of Pressed Paper
Porosity is a measure of the void space, which is an important factor in determining thecharacteristics of porous materials. The porosity of paper can be calculated with the following equation:
Porosity ppq “ 1´V1
V(2)
where V1 is the volume of fiber and V is the total volume of paper material. When a paper is exposed toapplied pressure, pores are collapsed, resulting in a decreased thickness and pore size. The collapsedstructure of paper does not recover over time. This can be explained by the fact that the volume ofpores (V ´ V1) decreases while the volume of fiber (V1) does not decrease, as shown in Figure 2a.Accordingly, the volume ratio of fibers in the pressed paper can be obtained by dividing the volume of
Micromachines 2016, 7, 48 4 of 8
fiber (V1) by the entire volume of the pressed paper (V¨ (H2/H1)). After that, the porosity of the pressedpaper can be calculated by subtracting the volume ratio of fibers ((V1/V)¨ (H1/H2)) in the pressed paper.Finally, the porosity of the pressed paper can be calculated in terms of the unpressed paper’s porosity(p) and the decreased ratio of thickness in the pressed paper (H1/H2), as per the following equation:
Porosity of pressed paper`
p1˘
“ 1´H1
H2p1´ pq (3)
where H1 is the thickness of the unpressed paper and H2 is the thickness of the pressed paper.The thickness of the pressed region decreased according to the increase in applied pressure (Figure 2b).Because a decrease in thickness of the pressed region was almost saturated after 19.6 MPa, wedetermined a range of measurements from 0 to 19.6 MPa. Based on an average value of thickness inthe pressed paper, we calculated the porosity of the pressed paper quantitatively using Equation (3).Porosity of the unpressed NC membrane was experimentally obtained by measuring the absorbedvolume of distilled water into a NC membrane. It was found to be 0.76 ˘ 0.03 (n = 10). Accordingly,the calculated porosities of pressed papers were 0.69, 0.60, 0.54 and 0.44, respectively.
Micromachines 2016, 7, 48 4 of 8
4
pressed paper. Finally, the porosity of the pressed paper can be calculated in terms of the unpressed paper’s porosity (p) and the decreased ratio of thickness in the pressed paper (H1/H2), as per the following equation:
Porosity of pressed paper (𝑝𝑝′) = 1 −𝑊𝑊1𝑊𝑊2
(1 − 𝑝𝑝) (3)
where H1 is the thickness of the unpressed paper and H2 is the thickness of the pressed paper. The thickness of the pressed region decreased according to the increase in applied pressure (Figure 2b). Because a decrease in thickness of the pressed region was almost saturated after 19.6 MPa, we determined a range of measurements from 0 to 19.6 MPa. Based on an average value of thickness in the pressed paper, we calculated the porosity of the pressed paper quantitatively using Equation (3). Porosity of the unpressed NC membrane was experimentally obtained by measuring the absorbed volume of distilled water into a NC membrane. It was found to be 0.76 ± 0.03 (n = 10). Accordingly, the calculated porosities of pressed papers were 0.69, 0.60, 0.54 and 0.44, respectively.
Figure 2. Analysis of porosity in pressed paper. (a) A schematic of decreased porosity in pressed paper. (b) Graph of decreased thickness in pressed region according to increasing amount of applied pressure.
3.3. Flow Rate along Pressed Paper
By using an analogy of an electric circuit, Q can be considered as current, ΔP can be considered as voltage, and μL/κWH can be considered as resistance in Darcy’s law (Equation (1)). Based on this analogy, the paper strip that includes many different segments can be considered a serial connection of different resistances [22]. Therefore, the flow rate along the pressed paper can be calculated by dividing ΔP by the sum of three different resistances (μL1/κ1WH1 + μL2/κ2WH2 + μL3/κ1WH1) (Figure 3). Because the overall length of pressed paper L can be represented as the sum of the length of each segment (L1+ L2+ L3), the flow rate in pressed paper can be calculated with the following equation:
𝑄𝑄 = −𝑊𝑊∆𝑃𝑃
µ( 𝐿𝐿κ1𝑊𝑊1
+ 𝐿𝐿2( 1κ2𝑊𝑊2
− 1κ1𝑊𝑊1
)) (4)
Based on Equation (4), it is supposed that the flow rate along the pressed paper is affected by the length, the permeability, and the thickness of the pressed region. Decreased flow rate along the pressed paper can be explained in terms of decreased permeability and the thickness of the pressed region [16]. Although we already demonstrated a decreased flow rate in pressed paper according to different amounts of pressure, it is supposed that flow rate can be controlled by differentiating the length of the pressed region. Moreover, on the basis of Equation (4), we can suppose that a decreased flow rate along the pressed region would not be affected by the position of the pressed region. It is worth noting that the amount of pressure and the length of the pressed region is a control factor of flow rate control, regardless of the position of the pressed region. Furthermore, the flow rate of the pressed paper that includes multiple pressed regions can be easily analyzed by the same analogy as above.
Figure 2. Analysis of porosity in pressed paper. (a) A schematic of decreased porosity in pressed paper;(b) Graph of decreased thickness in pressed region according to increasing amount of applied pressure.
3.3. Flow Rate along Pressed Paper
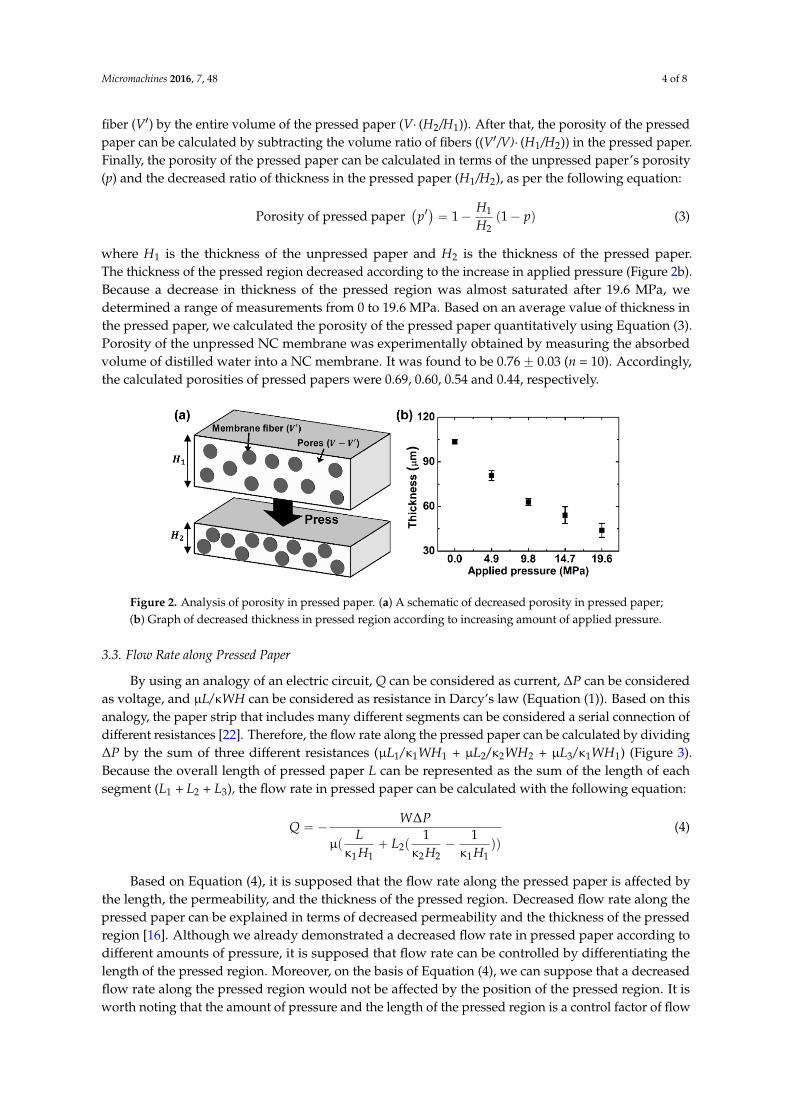
By using an analogy of an electric circuit, Q can be considered as current, ∆P can be consideredas voltage, and µL/κWH can be considered as resistance in Darcy’s law (Equation (1)). Based on thisanalogy, the paper strip that includes many different segments can be considered a serial connection ofdifferent resistances [22]. Therefore, the flow rate along the pressed paper can be calculated by dividing∆P by the sum of three different resistances (µL1/κ1WH1 + µL2/κ2WH2 + µL3/κ1WH1) (Figure 3).Because the overall length of pressed paper L can be represented as the sum of the length of eachsegment (L1 + L2 + L3), the flow rate in pressed paper can be calculated with the following equation:
Q “ ´W∆P
µpL
κ1H1` L2p
1κ2H2
´1
κ1H1qq
(4)
Based on Equation (4), it is supposed that the flow rate along the pressed paper is affected bythe length, the permeability, and the thickness of the pressed region. Decreased flow rate along thepressed paper can be explained in terms of decreased permeability and the thickness of the pressedregion [16]. Although we already demonstrated a decreased flow rate in pressed paper according todifferent amounts of pressure, it is supposed that flow rate can be controlled by differentiating thelength of the pressed region. Moreover, on the basis of Equation (4), we can suppose that a decreasedflow rate along the pressed region would not be affected by the position of the pressed region. It isworth noting that the amount of pressure and the length of the pressed region is a control factor of flow

Micromachines 2016, 7, 48 5 of 8
rate control, regardless of the position of the pressed region. Furthermore, the flow rate of the pressedpaper that includes multiple pressed regions can be easily analyzed by the same analogy as above.
Micromachines 2016, 7, 48 5 of 8
5
Figure 3. Pressed paper and its comparison with electrical circuit for calculating flow rate.
3.4. Permeability of Pressed Paper
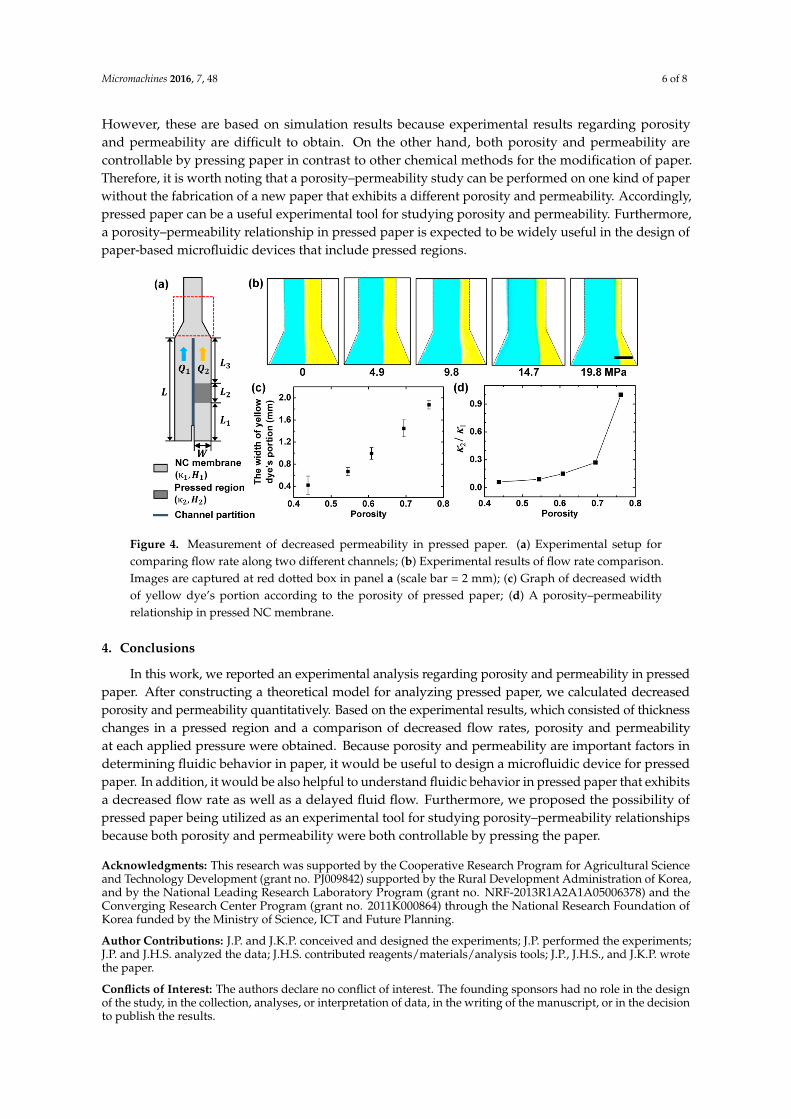
Generally, the permeability of paper can be calculated by utilizing Darcy’s law. To calculate the decreased amount of permeability, the decreased flow rate in the pressed paper (Equation (4)) was compared with the flow rate in the unpressed paper (−κ1WH1ΔP/μL). Therefore, we designed a pressed paper-based microfluidic device, as shown in Figure 4a. By comparing the flow rate along two different channels, where one includes a pressed region while the other does not, κ2/κ1 can be calculated with Equation (5) assuming that the pressure difference (ΔP) along each channel and the viscosity (μ) of each solution are almost the same.
𝜅𝜅2𝜅𝜅1
=𝐿𝐿2𝑊𝑊1𝑊𝑊2
𝐿𝐿 �𝑄𝑄1𝑄𝑄2− 1� + 𝐿𝐿2
(5)
To calculate κ2/κ1 quantitatively, Q1/Q2 and H1/H2 is required in Equation (5). Q1/Q2 was easily obtained by measuring the width of each dye’s portion at different amounts of pressure because the flow rate along each channel can be represented in terms of the width of each dye’s portion (Figure 4b) [13]. Therefore, we measured the width of the yellow dye’s portion at the detection region after the flow along both channels reached equilibrium. The width of the yellow dye’s portion decreases with an increasing amount of pressure, which means a decrease in flow rate along a channel that includes a pressed region. The width of the yellow dye’s portion increased with the increasing porosity of the pressed paper (Figure 4c). Finally, by analyzing the average value of Q1/Q2 obtained from Figure 4c and the average value of H1/H2 obtained from Figure 2b, κ2/κ1 was calculated quantitatively (L = 2.5 cm and L2 = 0.5 cm). Each value of κ2/κ1 in the pressed paper was 0.06, 0.09, 0.15 and 0.27, respectively. It is expected to be useful for designing a delayed fluid flow as well as a decreased flow rate in pressed paper. Although we represented a ratio of decreased permeability instead of a real value of permeability due to the limited experimental setup in the laboratory, the real value of permeability in pressed paper can easily be calculated by measuring the permeability of unpressed paper using a reported method [27].
Furthermore, we studied a porosity–permeability relationship by comparing a decreased porosity and permeability in pressed paper. Permeability was dramatically decreased with respect to decreasing porosity (Figure 4d). More detailed studies for a porosity–permeability relationship can be achieved by measuring porosity and permeability at a dynamic range of applied pressure for the pressed region. Additionally, many kinds of NC membranes could be adjusted for a more practical study. Although it is clear that fluid cannot easily wick into paper when porosity is low, a quantitative analysis of decreased permeability with respect to decreasing porosity should be studied. In this sense, many theoretical models for a porosity–permeability relationship in porous materials have been reported [25,26]. However, these are based on simulation results because experimental results regarding porosity and permeability are difficult to obtain. On the other hand, both porosity and permeability are controllable by pressing paper in contrast to other chemical methods for the modification of paper. Therefore, it is worth noting that a porosity–permeability study can be performed on one kind of paper without the fabrication of a new paper that exhibits a different porosity and permeability. Accordingly, pressed paper can be a useful experimental tool
Figure 3. Pressed paper and its comparison with electrical circuit for calculating flow rate.
3.4. Permeability of Pressed Paper
Generally, the permeability of paper can be calculated by utilizing Darcy’s law. To calculatethe decreased amount of permeability, the decreased flow rate in the pressed paper (Equation (4))was compared with the flow rate in the unpressed paper (´κ1WH1∆P/µL). Therefore, we designeda pressed paper-based microfluidic device, as shown in Figure 4a. By comparing the flow rate alongtwo different channels, where one includes a pressed region while the other does not, κ2/κ1 can becalculated with Equation (5) assuming that the pressure difference (∆P) along each channel and theviscosity (µ) of each solution are almost the same.
κ2
κ1“
L2H1
H2
Lˆ
Q1
Q2´ 1
˙
` L2
(5)
To calculate κ2/κ1 quantitatively, Q1/Q2 and H1/H2 is required in Equation (5). Q1/Q2 was easilyobtained by measuring the width of each dye’s portion at different amounts of pressure becausethe flow rate along each channel can be represented in terms of the width of each dye’s portion(Figure 4b) [13]. Therefore, we measured the width of the yellow dye’s portion at the detection regionafter the flow along both channels reached equilibrium. The width of the yellow dye’s portion decreaseswith an increasing amount of pressure, which means a decrease in flow rate along a channel thatincludes a pressed region. The width of the yellow dye’s portion increased with the increasing porosityof the pressed paper (Figure 4c). Finally, by analyzing the average value of Q1/Q2 obtained fromFigure 4c and the average value of H1/H2 obtained from Figure 2b, κ2/κ1 was calculated quantitatively(L = 2.5 cm and L2 = 0.5 cm). Each value of κ2/κ1 in the pressed paper was 0.06, 0.09, 0.15 and 0.27,respectively. It is expected to be useful for designing a delayed fluid flow as well as a decreased flowrate in pressed paper. Although we represented a ratio of decreased permeability instead of a real valueof permeability due to the limited experimental setup in the laboratory, the real value of permeabilityin pressed paper can easily be calculated by measuring the permeability of unpressed paper usinga reported method [27].
Furthermore, we studied a porosity–permeability relationship by comparing a decreased porosityand permeability in pressed paper. Permeability was dramatically decreased with respect to decreasingporosity (Figure 4d). More detailed studies for a porosity–permeability relationship can be achievedby measuring porosity and permeability at a dynamic range of applied pressure for the pressed region.Additionally, many kinds of NC membranes could be adjusted for a more practical study. Although it isclear that fluid cannot easily wick into paper when porosity is low, a quantitative analysis of decreasedpermeability with respect to decreasing porosity should be studied. In this sense, many theoreticalmodels for a porosity–permeability relationship in porous materials have been reported [25,26].
Micromachines 2016, 7, 48 6 of 8
However, these are based on simulation results because experimental results regarding porosityand permeability are difficult to obtain. On the other hand, both porosity and permeability arecontrollable by pressing paper in contrast to other chemical methods for the modification of paper.Therefore, it is worth noting that a porosity–permeability study can be performed on one kind of paperwithout the fabrication of a new paper that exhibits a different porosity and permeability. Accordingly,pressed paper can be a useful experimental tool for studying porosity and permeability. Furthermore,a porosity–permeability relationship in pressed paper is expected to be widely useful in the design ofpaper-based microfluidic devices that include pressed regions.
Micromachines 2016, 7, 48 6 of 8
6
for studying porosity and permeability. Furthermore, a porosity–permeability relationship in pressed paper is expected to be widely useful in the design of paper-based microfluidic devices that include pressed regions.
Figure 4. Measurement of decreased permeability in pressed paper. (a) Experimental setup for comparing flow rate along two different channels. (b) Experimental results of flow rate comparison. Images are captured at red dotted box in panel a (scale bar = 2 mm). (c) Graph of decreased width of yellow dye’s portion according to the porosity of pressed paper. (d) A porosity–permeability relationship in pressed NC membrane.
4. Conclusions
In this work, we reported an experimental analysis regarding porosity and permeability in pressed paper. After constructing a theoretical model for analyzing pressed paper, we calculated decreased porosity and permeability quantitatively. Based on the experimental results, which consisted of thickness changes in a pressed region and a comparison of decreased flow rates, porosity and permeability at each applied pressure were obtained. Because porosity and permeability are important factors in determining fluidic behavior in paper, it would be useful to design a microfluidic device for pressed paper. In addition, it would be also helpful to understand fluidic behavior in pressed paper that exhibits a decreased flow rate as well as a delayed fluid flow. Furthermore, we proposed the possibility of pressed paper being utilized as an experimental tool for studying porosity–permeability relationships because both porosity and permeability were both controllable by pressing the paper.
Acknowledgments: This research was supported by the Cooperative Research Program for Agricultural Science and Technology Development (grant no. PJ009842) supported by the Rural Development Administration of Korea, and by the National Leading Research Laboratory Program (grant no. NRF-2013R1A2A1A05006378) and the Converging Research Center Program (grant no. 2011K000864) through the National Research Foundation of Korea funded by the Ministry of Science, ICT and Future Planning.
Author Contributions: J.P. and J.K.P. conceived and designed the experiments; J.P. performed the experiments; J.P. and J.H.S. analyzed the data; J.H.S. contributed reagents/materials/analysis tools; J.P., J.H.S., and J.K.P. wrote the paper.
Conflicts of Interest: The authors declare no conflict of interest. The founding sponsors had no role in the design of the study, in the collection, analyses, or interpretation of data, in the writing of the manuscript, or in the decision to publish the results.
References
1. Cate, D.M.; Adkins, J.A.; Mettakoonpitak, J.; Henry, C.S. Recent developments in paper-based microfluidic devices. Anal. Chem. 2014, 87, 19–41.
Figure 4. Measurement of decreased permeability in pressed paper. (a) Experimental setup forcomparing flow rate along two different channels; (b) Experimental results of flow rate comparison.Images are captured at red dotted box in panel a (scale bar = 2 mm); (c) Graph of decreased widthof yellow dye’s portion according to the porosity of pressed paper; (d) A porosity–permeabilityrelationship in pressed NC membrane.
4. Conclusions
In this work, we reported an experimental analysis regarding porosity and permeability in pressedpaper. After constructing a theoretical model for analyzing pressed paper, we calculated decreasedporosity and permeability quantitatively. Based on the experimental results, which consisted of thicknesschanges in a pressed region and a comparison of decreased flow rates, porosity and permeabilityat each applied pressure were obtained. Because porosity and permeability are important factors indetermining fluidic behavior in paper, it would be useful to design a microfluidic device for pressedpaper. In addition, it would be also helpful to understand fluidic behavior in pressed paper that exhibitsa decreased flow rate as well as a delayed fluid flow. Furthermore, we proposed the possibility ofpressed paper being utilized as an experimental tool for studying porosity–permeability relationshipsbecause both porosity and permeability were both controllable by pressing the paper.
Acknowledgments: This research was supported by the Cooperative Research Program for Agricultural Scienceand Technology Development (grant no. PJ009842) supported by the Rural Development Administration of Korea,and by the National Leading Research Laboratory Program (grant no. NRF-2013R1A2A1A05006378) and theConverging Research Center Program (grant no. 2011K000864) through the National Research Foundation ofKorea funded by the Ministry of Science, ICT and Future Planning.
Author Contributions: J.P. and J.K.P. conceived and designed the experiments; J.P. performed the experiments;J.P. and J.H.S. analyzed the data; J.H.S. contributed reagents/materials/analysis tools; J.P., J.H.S., and J.K.P. wrotethe paper.
Conflicts of Interest: The authors declare no conflict of interest. The founding sponsors had no role in the designof the study, in the collection, analyses, or interpretation of data, in the writing of the manuscript, or in the decisionto publish the results.
Micromachines 2016, 7, 48 7 of 8
References
1. Cate, D.M.; Adkins, J.A.; Mettakoonpitak, J.; Henry, C.S. Recent developments in paper-based microfluidic devices.Anal. Chem. 2014, 87, 19–41. [CrossRef] [PubMed]
2. Li, X.; Ballerini, D.R.; Shen, W. A perspective on paper-based microfluidics: Current status and future trends.Biomicrofluidics 2012, 6, 011301. [CrossRef] [PubMed]
3. Mahadeva, S.K.; Walus, K.; Stoeber, B. Paper as a platform for sensing applications and other devices:A review. ACS Appl. Mater. Interfaces 2015, 7, 8345–8362. [CrossRef] [PubMed]
4. Yetisen, A.K.; Akram, M.S.; Lowe, C.R. Paper-based microfluidic point-of-care diagnostic devices. Lab Chip2013, 13, 2210–2251. [CrossRef] [PubMed]
5. Carrilho, E.; Martinez, A.W.; Whitesides, G.M. Understanding wax printing: A simple micropatterningprocess for paper-based microfluidics. Anal. Chem. 2009, 81, 7091–7095. [CrossRef] [PubMed]
6. Wang, J.; Monton, M.R.N.; Zhang, X.; Filipe, C.D.; Pelton, R.; Brennan, J.D. Hydrophobic sol–gel channelpatterning strategies for paper-based microfluidics. Lab Chip 2014, 14, 691–695. [CrossRef] [PubMed]
7. Martinez, A.W.; Phillips, S.T.; Butte, M.J.; Whitesides, G.M. Patterned paper as a platform for inexpensive,low-volume, portable bioassays. Angew. Chem. Int. Ed. 2007, 46, 1318–1320. [CrossRef] [PubMed]
8. Asano, H.; Shiraishi, Y. Development of paper-based microfluidic analytical device for iron assay using photomaskprinted with 3D printer for fabrication of hydrophilic and hydrophobic zones on paper by photolithography.Anal. Chim. Acta 2015, 883, 55–60. [CrossRef] [PubMed]
9. Gallibu, C.; Gallibu, C.; Avoundjian, A.; Gomez, F.A. Easily fabricated microfluidic devices using permanentmarker inks for enzyme assays. Micromachines 2016, 7, 6. [CrossRef]
10. Yu, J.H.; Jeong, S.-G.; Lee, C.-S.; Hwang, J.-Y.; Kang, K.-T.; Kang, H.; Lee, S.-H. Fabrication of a paper-basedanalytical device for multiple colorimetric analysis via inkjet-printing and paper-cutting. BioChip J. 2015, 9,139–143. [CrossRef]
11. Chen, H.; Cogswell, J.; Anagnostopoulos, C.; Faghri, M. A fluidic diode, valves, and a sequential-loadingcircuit fabricated on layered paper. Lab Chip 2012, 12, 2909–2913. [CrossRef] [PubMed]
12. Fu, E.; Liang, T.; Spicar-Mihalic, P.; Houghtaling, J.; Ramachandran, S.; Yager, P. Two-dimensional papernetwork format that enables simple multistep assays for use in low-resource settings in the context of malariaantigen detection. Anal. Chem. 2012, 84, 4574–4579. [CrossRef] [PubMed]
13. Osborn, J.L.; Lutz, B.; Fu, E.; Kauffman, P.; Stevens, D.Y.; Yager, P. Microfluidics without pumps: Reinventingthe T-sensor and H-filter in paper networks. Lab Chip 2010, 10, 2659–2665. [CrossRef] [PubMed]
14. B Lutz, B.; Liang, T.; Fu, E.; Ramachandran, S.; Kauffman, P.; Yager, P. Dissolvable fluidic time delaysfor programming multi-step assays in instrument-free paper diagnostics. Lab Chip 2013, 13, 2840–2847.[CrossRef] [PubMed]
15. Noh, H.; Phillips, S.T. Fluidic timers for time-dependent, point-of-care assays on paper. Anal. Chem. 2010, 82,8071–8078. [CrossRef] [PubMed]
16. Shin, J.H.; Park, J.; Kim, S.H.; Park, J.-K. Programmed sample delivery on a pressed paper. Biomicrofluidics2014, 8, 054121. [CrossRef] [PubMed]
17. Vernhes, P.; Bloch, J.-F.; Blayo, A.; Pineaux, B. Effect of calendering on paper surface micro-structure:A multi-scale analysis. J. Mater. Process. Technol. 2009, 209, 5204–5210. [CrossRef]
18. Vernhes, P.; Dubé, M.; Bloch, J.-F. Effect of calendering on paper surface properties. Appl. Surf. Sci. 2010, 256,6923–6927. [CrossRef]
19. Litvinov, V.; Farnood, R. Modeling of the compression of coated papers in a soft rolling nip. J. Mater. Sci.2010, 45, 216–226. [CrossRef]
20. Whitaker, S. Flow in porous media I: A theoretical derivation of Darcy's law. Transp. Porous Med. 1986, 1,3–25. [CrossRef]
21. Washburn, E.W. The dynamics of capillary flow. Phys. Rev. 1921, 17, 273. [CrossRef]22. Fu, E.; Ramsey, S.A.; Kauffman, P.; Lutz, B.; Yager, P. Transport in two-dimensional paper networks.
Microfluid. Nanofluid. 2011, 10, 29–35. [CrossRef] [PubMed]23. Hong, S.; Kim, W. Dynamics of water imbibition through paper channels with wax boundaries. Microfluid.
Nanofluid. 2015, 19, 845–853. [CrossRef]
Micromachines 2016, 7, 48 8 of 8
24. Mendez, S.; Fenton, E.M.; Gallegos, G.R.; Petsev, D.N.; Sibbett, S.S.; Stone, H.A.; Zhang, Y.; López, G.P.Imbibition in porous membranes of complex shape: Quasi-stationary flow in thin rectangular segments.Langmuir 2009, 26, 1380–1385. [CrossRef] [PubMed]
25. Nabovati, A.; Llewellin, E.W.; Sousa, A.C. A general model for the permeability of fibrous porous mediabased on fluid flow simulations using the lattice Boltzmann method. Compos. A Appl. Sci. Manuf. 2009, 40,860–869. [CrossRef]
26. Costa, A. Permeability-porosity relationship: a reexamination of the Kozeny-Carman equation based ona fractal pore-space geometry assumption. Geophys. Res. Lett. 2006, 33, L02318. [CrossRef]
27. Rasi, M. Permeability Properties of Paper Materials. Ph.D. Thesis, University of Jyväskylä, Jyväskylä, Finland,17 December 2013.
© 2016 by the authors; licensee MDPI, Basel, Switzerland. This article is an open accessarticle distributed under the terms and conditions of the Creative Commons by Attribution(CC-BY) license (http://creativecommons.org/licenses/by/4.0/).