Facultad de Ciencias - Universidad de...
146
Facultad de Ciencias Effect of hypoxia on caveolin-1 expression, caveolae structure and insulin signaling Maider Varela Guruceaga
Transcript of Facultad de Ciencias - Universidad de...

Facu l tad de C ienc ias
Effect of hypoxia on caveolin-1 expression,
caveolae structure and insulin signaling
Maider Varela Guruceaga

F a c u l t a d d e C i e n c i a s
Effect of hypoxia on caveolin-1 expression, caveolae structure
and insulin signaling
Memoria presentada por Dª Maider Varela Guruceaga para aspirar al grado de Doctor
por la Universidad de Navarra.
El presente trabajo ha sido realizado bajo nuestra dirección en el Departamento de
Bioquímica y Genética y autorizo su presentación ante el Tribunal que lo ha de juzgar.
Pamplona, 12 de diciembre de 2016.
Dr. Carlos de Miguel Vázquez Dr. Fermín Milagro Yoldi


Este trabajo ha sido realizado gracias a la financiación de la Asociación de Amigos de la
Universidad de Navarra (Beca predoctoral 2012-2016) además de la Línea Especial de
“Nutrition, Obesity and Health” de la Universidad de Navarra (LE/97) y los proyectos
CIBERobn y Nutrigenio (Ref. AGL2013-45554-R, MINECO, Gobierno de España)


“Hermoso es lo que vemos. Más hermoso es lo que sabemos.
Pero mucho más hermoso es lo que no conocemos”
Niels Steensen
“Beautiful is what we see. More beautiful is what we know. But
much more beautiful is what we do not know”
Niels Steensen


A mis padres
A mis hermanas
A mis abuelos


A Diego


Aknowledgments
i
AKNOWLEDGMENTS
Me parece increíble éste momento. ¡Estoy acabando mi tesis! Nunca olvidaré cuando
empecé mi carrera en Venezuela y admiraba a los estudiantes de doctorado que más
tarde se convirtieron en mi modelo a seguir. Han sido muchos los que han apoyado y
compartido conmigo este camino duro, pero también lleno de experiencias increíbles
que me han hecho crecer y ser mejor persona y profesional.
En primer lugar, agradezco a la Universidad de Navarra y a la Facultad de Ciencias por
abrirme sus puertas y darme la oportunidad de hacer el máster y posteriormente el
doctorado en ella. Ha sido una gran experiencia que me ha fortalecido mucho, con lo
cual, ¡muchas gracias!
Muchas gracias a la Asociación de Amigos de la Universidad de Navarra, por depositar
su confianza en mí y concederme la beca pre-doctoral para la realización de este
trabajo. Sin duda alguna hubiese sido imposible llevarlo a cabo sin su apoyo. Por otro
lado, tengo que agradecer a la EMBO por concederme la beca que me permitió realizar
mi estancia en el extranjero y poder optar al doctorado internacional.
A mis directores de tesis, el Dr. Carlos de Miguel y el Dr. Fermín Milagro. A ustedes les
debo un agradecimiento especial por aceptarme en su grupo para llevar a cabo este
trabajo y cumplir este gran objetivo profesional. Gracias por dirigir este trabajo y
siempre plantearme retos que me han enseñado a ser independiente en mi trabajo y
desarrollar mi criterio científico. Sé que son herramientas, sin duda, indispensables
para mi futuro próximo. Gracias Carlos por siempre estar disponible para mí, por tu
comprensión y por preocuparte por mí en todos los buenos y malos momentos de la
tesis y también personales a lo largo de estos años. Gracias Fermín por tu increíble
apoyo, por venir siempre a buscarme con una solución o unas palabras de aliento para
continuar trabajando cuando me he sentido perdida y frustrada. Muchas gracias a los
dos por escuchar mis opiniones y mis ideas, sé que a veces he sido demasiado
insistente, pero les aseguro que siempre ha sido con las ganas de mejorar el trabajo.
Gracias a todos los que forman parte del departamento de Bioquímica y Genética por
acogerme tan bien desde el primer día. A los profesores: María Jesús Lopez Zabalza,
Juan José Martinez Irujo, Eduardo Ansorena, Guillermo Zalba, María Iraburu y Silvia
Cenoz. A Marijose y a los que son o han sido doctorandos durante estos años, Aitor,
Javier, Alvaro, Antonia, Sara, todos los alumnos de TFG y másteres. Realmente han
hecho que me sintiera como en casa desde que llegue del otro lado del mundo.
Muchas gracias a todos por los momentos compartidos a lo largo de este trabajo y por
amenizar este proceso.
Esta tesis me deja también grandes amistades para toda la vida. Gracias a los que se
han convertido en mi segunda familia. María Martínez, no hay palabras suficientes
para darte las gracias por todo lo que hemos vivido juntas. Gracias por tu apoyo

Aknowledgments
ii
incondicional tanto a nivel técnico como personal. Por tu gran energía y positivismo. Es
lo que sin duda necesita todo doctorado durante la tesis. No sé qué hubiese hecho sin
ti. A Marina, por ser mi ejemplo profesional, por escucharme siempre con atención y
poder tener discusiones científicas de nivel, por tus increíbles gastro-consejos y por
ayudarme a descubrir esta hermosa ciudad que se ha convertido en mi hogar. Sin duda
tu amistad es una de las mejores cosas que me deja este trabajo. A Ali, porque a pesar
de que estuviste poco tiempo en el departamento, dejaste tu gran huella. Muchas
gracias por ser mi amiga y espero poder verte más a menudo. A Gabriel, porque
realmente has sido mi colega latino en este proceso de hacer la tesis. Por tus consejos
científicos y no científicos y por ayudarme a desahogar todos los momentos no tan
buenos. No sabes cuanta ayuda me has dado. Después de esto, te espera una visita por
Estocolmo. A Amaia, por darme un ejemplo de valentía, fortaleza e integridad que a
este mundo le viene tan bien, por escucharme siempre. Te mereces una gran tesis y
estoy segura de que lo vas a conseguir. Mucho ánimo para lo que te queda, no es fácil,
pero ten presente que después de superar esto, seguro que podemos con todo. A
Paulo, por tu gran apoyo para muchos experimentos, por siempre mostrarte tan
colaborador y por tu amistad en estos años de doctorado. Te deseo muchísima suerte
en la recta final y que logres lo que te propongas. ¡¡Mil gracias familia!! Espero que no
pase mucho tiempo hasta que podamos reencontrarnos todos con una buena copa de
vino por estas calles.
I have to write a special thanks to all the people who work on Le laboratoire Stress
oxydant et pathologies métaboliques (SOPAM). A big thanks to Dr. Soazig Le Lay, for
your confidence on my work, for your closeness and for giving me the amazing
opportunity to stay at your lab and to learn from a great researcher like you. Thanks to
the heads of the lab, Dr. Ramaroson Andriantsitohaina and Dr. Maria del Carmen
Martinez and all the Ph.D students, engineer and other staff for accepting me and
make me feel like one of you. It has been an important and productive experience
about scientific collaboration and reminds me how much I enjoy this work. Thank you
very much!
Gracias a mi segundo departamento, ciencias de la alimentación y fisiología, por ser
tan majos y acogerme siempre como una más. Agradezco especialmente al Dr. Alfredo
Martinez Hernandez por permitirme formar parte del Centro de Investigación en
Nutrición. A todos los demás miembros del centro porque, aunque es verdad que
trabajamos en espacios diferentes, eso no fue un problema para que me brindaran
ayuda o simplemente un “¿qué tal vas?”. Especialmente quiero agradecer a Ana
Lorente, por la paciencia que has tenido enseñándome los entresijos del ChIP y
compartiendo mucho la frustración que conlleva muchas veces trabajar con mis
adipocitos dándome ánimos y mostrando siempre una sonrisa.
Quiero agradecer también a los que me inspiraron para conseguir esta meta, al
laboratorio de neuropéptidos. A la Dra. Anita Stern, por enseñarme que la búsqueda

Aknowledgments
iii
del saber es uno de los oficios más bonitos y esenciales para el desarrollo de una
sociedad y la clave para un futuro mejor. A la Dra. Chary por mostrarme el lado amable
y positivo de dedicarle tantas horas y esfuerzo a este trabajo. Al Dr. Carlos
Ciangherotti, gracias porque siempre creíste en mí y por enseñarme a que siempre
puedes hacer un mejor trabajo. Gracias porque sin ustedes, no hubiese descubierto
esta profesión que tanto me gusta y que me ha traído tantas cosas buenas.
Gracias a los mejores roomates del mundo mundial. A Santi por tu infinita paciencia
escuchando toda clase de problemas con el western blot aunque no entendieras del
todo y A Marcos por tu apoyo técnico y ayudarme en momentos de estrés. Quiero que
sepan que siempre lo he apreciado mucho y que han sido grandes amigos.
Por último, pero no menos importante, quiero darle gracias infinitas a mi familia,
porque sin ellos hubiese sido imposible llegar hasta aquí.
Gracias a mi familia de Portalondo, su apoyo ha sido incalculable para mí. No hay
forma de que yo pueda devolverles toda su ayuda. Gracias por recibirme como un
miembro más de la familia sin siquiera conocerme. Por estar siempre ahí, sobre todo
en los inicios, cuando me sentía desubicada en un lugar que no era el mío, ustedes
estuvieron ahí para hacerme sentir como en casa de amama. Debo de dar un
agradecimiento muy especial a Arantza y a Gurutz porque su apoyo y preocupación fue
muchas veces fundamental no sólo al inicio, sino también al final de toda esta etapa.
Por el apoyo que también le han dado a mi familia en este momento tan crítico. No
tengo mucho más que estas palabras para darles las gracias infinitas por todo.
Como no agradecer a mis padres, a quienes va dedicada esta tesis porque sin lugar a
dudas, este trabajo hubiese sido impensable si ustedes no hubiesen buscado siempre
el mejor futuro para mí. Especial agradecimiento a mi mamá, porque has estado para
apoyarme en todos los momentos de mi vida y este no ha sido la excepción. Por
resistir como una campeona tantos años de infinita distancia y diferencia horaria. A
amama y aitona, otras personas fundamentales para todos mis avances y logros en
esta vida. ¡Ustedes son mis segundos padres! Y por eso esta tesis lleva también su
nombre. A mis increíbles hermanas, porque creo que tengo a las mejores!. Porque las
dos son un ejemplo a seguir de esfuerzo, trabajo duro y fortaleza. Gracias Karenina por
emocionarte siempre por mis aciertos y defenderme y apoyarme en los desaciertos.
Gracias Vicky, porque tu apoyo, sobretodo en esta recta final ha sido incalculable para
mí. No se preocupen chicas que algún día seremos muy grandes. De eso no tengo
ninguna duda.
Este último párrafo quiero dedicárselo a mi fiel compañero en todo este trabajo, a mi
chico, mi mejor amigo, mi mejor consejero, mi científico favorito, mi vida entera. Sólo
tú sabes bien lo que he trabajado por esto, y por todos los buenos y malos momentos
que he pasado. Nunca me imaginé que la decisión de cruzar el charco por perseguir
una gran meta me iba a conducir además a conocer a la persona con la que espero

Aknowledgments
iv
construir un gran futuro. Gracias por hacer de estos años de trabajo una emocionante
y hermosa aventura que volvería a repetir a tu lado sin pensarlo. ¡Te amo!
A todos los que he nombrado y a los que no, ¡GRACIAS TOTALES!

List of abbreviations
v
LIST OF ABBREVIATIONS
Adipoq Adiponectin
ARNT Aryl hydrocarbon nuclear translocator
AS160 Akt substrate of 160 kDa
BCA Bicinchoninic acid
BMI Body mass index
C/EBP CCAAT/enhancer binding proteins
Cav-1 Caveolin-1
Cav-2 Caveolin-2
Cav-3 Caveolin-3
CBS Calf bovine serum
COPD Chronic obstructive pulmonary disease
COX-1 Cyclooxygenase-1
CSD Caveolin scaffolding domain
ChIP Chromatin immunoprecipitation
Dex Dexamethasone
DPBS Dulbecco's Phosphate-Buffered Saline
EGF Epidermal growth factor
EHD2 EH-domain containing 2
EM Electron microscopy
EMSA Electrophoretic mobility shift assay
Eno2 Enolase-2
eNOS Endothelial nitric oxide synthase
FBS Fetal bovine serum
FFA Free fatty acid
FRET Fluorescence energy transfer
GDP Guanosine diphosphate
GH Growth hormone
Ghrh Growth hormone releasing hormone
GLUT1 Glucose transporter type 1
GLUT3 Glucose transporter type 3

List of abbreviations
vi
GLUT4 Glucose transporter type 4
GSVs GLUT4 storage vesicles
GTP Guanosine triphosphate
HAoEC Human aortic endothelial cells
HES Drosophila hairy/Enhancer of split
HIF-1 Hypoxia inducible factor-1
HRE Hypoxia response element
IBMX Isobutilmethylxanthine
IGF-1 Insulin-like growth factor-1
IGF-1R Insulin-like growth factor 1 receptor
IF Immunofluorescence
IH Intermittent hypoxia
IL-6 Interleukin-6
IL-8 Interleukin-8
IR Insulin receptor
IRβ Beta subunit of insulin receptor
IRE1 Inositol-requiring protein 1
IRS-1 Insulin receptor substrate 1
LPL Lipoprotein lipase
MCP-1 Monocyte chemoattractant protein-1
MIF Macrophage migration inhibitory factor
MMP2 Matrix metalloproteinase-2
mTOR Mammalian target of rapamycin
MURC Muscle related coiled-coil protein
NO Nitric oxide
NRF-1 Nuclear respiratory factor 1
ORO Oil red O
OSA Obstructive sleep apnea
PAI-1 Plasminogen activator inhibitor-1
PBS Phosphate-buffered saline
PDK-1 3-phosphoinositide dependent protein kinase-1
List of abbreviations
vii
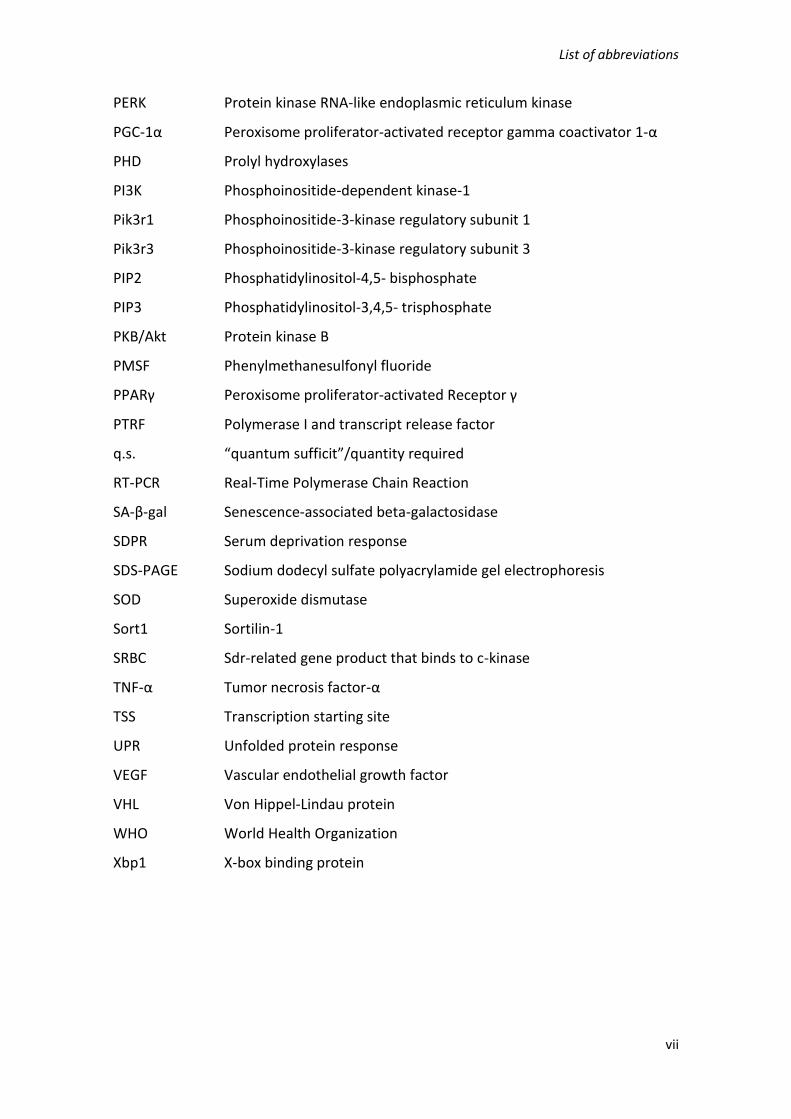
PERK Protein kinase RNA-like endoplasmic reticulum kinase
PGC-1α Peroxisome proliferator-activated receptor gamma coactivator 1-α
PHD Prolyl hydroxylases
PI3K Phosphoinositide-dependent kinase-1
Pik3r1 Phosphoinositide-3-kinase regulatory subunit 1
Pik3r3 Phosphoinositide-3-kinase regulatory subunit 3
PIP2 Phosphatidylinositol-4,5- bisphosphate
PIP3 Phosphatidylinositol-3,4,5- trisphosphate
PKB/Akt Protein kinase B
PMSF Phenylmethanesulfonyl fluoride
PPARγ Peroxisome proliferator-activated Receptor γ
PTRF Polymerase I and transcript release factor
q.s. “quantum sufficit”/quantity required
RT-PCR Real-Time Polymerase Chain Reaction
SA-β-gal Senescence-associated beta-galactosidase
SDPR Serum deprivation response
SDS-PAGE Sodium dodecyl sulfate polyacrylamide gel electrophoresis
SOD Superoxide dismutase
Sort1 Sortilin-1
SRBC Sdr-related gene product that binds to c-kinase
TNF-α Tumor necrosis factor-α
TSS Transcription starting site
UPR Unfolded protein response
VEGF Vascular endothelial growth factor
VHL Von Hippel-Lindau protein
WHO World Health Organization
Xbp1 X-box binding protein


Table of contents
TABLE OF CONTENTS
Aknowledgments ....................................................................................................... i
List of abbreviations .................................................................................................. v
INTRODUCTION ........................................................................................................ 1
1. Obesity .............................................................................................................. 1
1.1. Definition ........................................................................................................... 1
1.2. Prevalence .............................................................................................................. 1
2. Insulin resistance ............................................................................................... 2
Introduction ....................................................................................................... 2
Insulin signaling .................................................................................................. 4
3. Hypoxia ............................................................................................................. 6
3.1. Hypoxia signaling pathways ............................................................................... 7
3.1.1. Hypoxia-inducible factor signaling ............................................................. 7
3.1.2. mTOR signaling pathway ............................................................................ 8
3.1.3. Unfolded protein response (UPR) .............................................................. 9
3.2. Hypoxia in obesity .............................................................................................. 9
3.3. Hypoxia and adipocyte dysfunction................................................................. 11
3.3.1. Secretory pattern of adipokines ............................................................... 11
3.3.2. Lipid oxidation and oxidative metabolism ............................................... 12
3.3.3. Glucose utilization .................................................................................... 13
3.3.4. Lactate production ................................................................................... 14
3.4. Insulin resistance and other metabolic disturbances related to hypoxia ....... 15
4. Caveolae: caveolins and cavins ........................................................................ 17
4.1. Biogenesis of caveolae ..................................................................................... 18
4.2. Caveolae functions ........................................................................................... 20
4.2.1. Endocytosis ............................................................................................... 21
4.2.2. Lipid homeostasis ..................................................................................... 21
4.2.3. Signal transduction ................................................................................... 22
4.2.4. Mechanoprotection .................................................................................. 23
4.3. Caveolae and insulin signaling ......................................................................... 23
4.4. Insulin resistance and caveolae ....................................................................... 24
HYPOTHESIS AND AIMS .......................................................................................... 27
1. Hypothesis ...................................................................................................... 27

Table of contents
2. General aim ..................................................................................................... 27
3. Specific objectives ........................................................................................... 27
MATERIAL AND METHODS ...................................................................................... 33
1. Cell culture ...................................................................................................... 33
1.1. Culture of 3T3-L1 fibroblasts (ATCC® CL173™, Rockville) .............................. 33
1.2. Human Aortic Endothelial Cells (HAoEC) ......................................................... 33
2. Experimental design ........................................................................................ 34
2.1. 3T3-L1 experiments ......................................................................................... 34
2.2. Intermittent hypoxia experimental model ...................................................... 34
2.3. HAoEC experiments ......................................................................................... 35
3. Oil red O (ORO) staining ................................................................................... 36
4. 2-[C14]-Deoxyglucose uptake assay................................................................... 36
5. Determination of caveolae density in plasma membrane. ................................ 37
6. Extracellular measurement of lactate levels ..................................................... 37
7. Determination of specific proteins by immunogenic methods .......................... 38
7.1. Extraction of total proteins .............................................................................. 38
7.2. Determination of protein concentration ......................................................... 38
7.2.1. BCA (bicinchoninic acid) protein Assay .................................................... 38
7.2.2. Bradford Protein Assay ............................................................................. 39
7.3. Western Blot .................................................................................................... 39
7.4. Immunofluorescence (IF) ................................................................................. 41
7.4.1. HAoEC cells ............................................................................................... 41
7.4.2. 3T3-L1 adipocytes ..................................................................................... 41
8. Extraction and analysis of RNA ......................................................................... 42
8.1. Total RNA extraction ........................................................................................ 42
8.1.1. 3T3-L1 adipocytes ..................................................................................... 42
8.1.2. HAoEC and adipose tissue samples .......................................................... 42
8.2. Treatment with DNase ..................................................................................... 43
8.3. Reverse transcription ....................................................................................... 43
8.3.1. 3T3-L1 adipocytes ..................................................................................... 43
8.3.2. HAoEC and adipose tissue samples .......................................................... 44
8.4. Real time Polymerase Chain Reaction (RT-PCR) .............................................. 45
8.4.1. Real time PCR: Taqman probes reaction protocol ................................... 45
8.4.2. Real time PCR: SYBR Green I reaction protocol ........................................ 46
8.5. RNA microarray ................................................................................................ 46

Table of contents
9. Extraction and analysis of DNA ........................................................................ 47
9.1. Chromatin Immunoprecipitation (ChIP) assay ................................................ 47
9.1.1. Preparation of sheared chromatin ........................................................... 48
9.1.1.1. Cell fixation ........................................................................................... 48
9.1.1.2. Chromatin shearing .............................................................................. 49
9.1.2. DNA clean-up ............................................................................................ 50
9.1.2.1. DNA extraction ...................................................................................... 50
9.1.3. Chromatin immunoprecipitation .............................................................. 51
9.1.4. PCR analysis .............................................................................................. 52
10. Statistical analysis ........................................................................................... 52
RESULTS ................................................................................................................. 57
1. Effect of hypoxia on 3T3-L1 adipocytes. ........................................................... 57
2. Effect of intermittent hypoxia in mouse white adipose tissue........................... 73
3. Effect of hypoxia in the caveolae structure of human aortic endothelial cells. .. 76
DISCUSION ............................................................................................................. 81
1. Effect of hypoxia in the 3T3-L1 differentiation process ..................................... 81
2. Effect of hypoxia on the structure and function of caveolae in 3T3-L1 cells ....... 83
3. Effect of hypoxia on the structure and function of caveolae in endothelial cells 85
4. Effect of hypoxia on caveolin-1 phosphorylation .............................................. 87
5. Hypoxia as an important factor for insulin resistance development .................. 87
6. Gene expression profile induced by hypoxia .................................................... 91
7. Strengths and limitations ................................................................................. 93
8. Corollary.......................................................................................................... 94
CONCLUSIONS ........................................................................................................ 97
REFERENCES ......................................................................................................... 101


INTRODUCTION


Introduction
1
INTRODUCTION
1. Obesity
1.1. Definition
World Health Organization (WHO) defines obesity as abnormal or excessive fat
accumulation being usually estimated by body mass index (BMI), which is the ratio of
weight over height expressed in kilograms per square meter (Després, 2012). The
excessive fat accumulation is often produced by an imbalance between the food intake
and the energy expenditure due to detrimental lifestyle changes, and it could be
influenced by genetic and epigenetic predisposition (Hurt et al., 2011; Sellayah et al.,
2014; Speakman, 2013).
1.2. Prevalence
Obesity is recognized as a growing public health problem in both, developed and
developing countries (Speakman, 2013), and is a causal factor in a number of
metabolic and endocrine disorders, including metabolic syndrome, cardiovascular
disease, type 2 diabetes, bone and joint dysfunctions, and some forms of cancer
(Sellayah et al., 2014). The worldwide prevalence of obesity nearly doubled between
1980 and 2008 (Barja-Fernández et al., 2014). In 2014, 39% of adults were overweight
and 13% were obese, which has driven WHO to consider obesity the world epidemic of
21st century (Barja-Fernández et al., 2014).
When fat accumulation is excessive, a large number of associated comorbidities are
developed (i.e., type 2 diabetes, obstructive sleep apnea, hypertension, atherosclerosis
and hyperlipidemias), increasing morbidity and mortality (Sellayah et al., 2014; Wells,
2012; Williams et al., 2015). In fact, obesity and its related health problems represent
an important burden to the healthcare system worldwide. Recent estimation
calculated that roughly $150 billion are spent per year as a direct consequence of this
disease together with the social impact and emotional distress associated (Sellayah et
al., 2014; Wyatt et al., 2006).

Introduction
2
Figure I1. Age-standardized prevalence of obesity in men aged 18 years and over (BMI ≥30 kg/m2). Global status report on NCDs 2014. World Health Organization.
In order to reduce the prevalence of obesity and the associated comorbidities, several
strategies at both levels, public health and clinical, have been developed with modest
success (Holdsworth et al., 2013; Wells, 2012) . This situation could be due, in part, to
the poor understanding of the physiological mechanism involved in the regulation of
energy homeostasis (Barja-Fernández et al., 2014; Wells, 2012).
It has been well established that one of the most important mechanisms leading to the
comorbidities associated with obesity, including type 2 diabetes and cardiovascular
diseases is the appearance of insulin resistance (Ginsberg, 2000; Qatanani and Lazar,
2007). In addition to this, there is also ample evidence of a reduction in the oxygen
supply in obese adipose tissue, which is usually accompanied by an inflammatory
process. These two conditions contribute to the development of insulin resistance and
all the complications linked to obesity (Ye, 2009).
2. Insulin resistance
Introduction
Insulin is an anabolic hormone released by the pancreatic β-cells which exerts its
primary action in skeletal and cardiac muscle, adipose tissue and liver. Insulin plays

Introduction
3
important roles in development, growth, cell differentiation, lipid and protein
metabolism, glucose homeostasis and nitric oxide (NO) synthesis (Low Wang et al.,
2004; Sesti, 2006).
Insulin resistance is classically defined as a significantly diminished responsiveness of
target cells to normal circulating levels of insulin (Henry, 2003; Mlinar et al., 2007). As
a consequence, a compensatory hyperinsulinemia is needed to maintain glucose and
lipid homeostasis (Mlinar et al., 2007). Nevertheless, when insulin secreted by
pancreas is insufficient to compensate for insulin resistance, circulating glucose
concentration rises until it produces a sustained hyperglycemia (Bailey, 2005). Both,
insulin resistance and resulting hyperglycemia have deleterious effects in the
organism. Hyperglycemia is responsible of the microvascular complications of type 2
diabetes (diabetic retinopathy, loss of vision, and nephropathy), whereas insulin
resistance increases cardiovascular risks leading to one of the most significant causes
of death (Bailey, 2005; Klein, 1995).
The development of insulin resistance, as well as obesity, is dependent of genetic and
environmental factors including food intake, reduced physical activity, aging and the
administration of drugs (Lopes et al., 2016; Mlinar et al., 2007). Therefore, obesity is an
important condition that predisposes for insulin resistance. It has been calculated that
around 23% of people with a BMI<25 kg/m2 develop insulin resistance, whereas 48.7%
of overweight patients appear to be insulin resistant and the incidence of this
condition reaches up to 66.3% in obese patients (Govers, 2015).

Introduction
4
Figure I2. Causes and effects of insulin resistance. Insulin resistance can develop through genetic or environmental factors, commonly mixtures of both, giving rise to disturbances of nutrient metabolism and varying cardiovascular risks. CRP, C-reactive protein; FFA, free fatty acids; HGO, hepatic glucose output; HIV, human immunodeficiency virus; IL-6, interleukin-6; PAI-1, plasminogen activator inhibitor-1; sdLDL, small dense low-density lipoprotein; TNF-α, tumor necrosis factor-α; VLDL, very-low-density lipoprotein (Bailey, 2005).
Insulin signaling
Insulin signaling pathway regulates glucose entry in adipocytes and skeletal muscle
cells and gluconeogenesis in the liver. This process is mediated by the translocation of
the facilitative glucose transporter GLUT4 to the plasma membrane, allowing the
uptake of glucose into the cell. Insulin actions represent the first step for the energy
storage and synthesis of lipids, proteins and carbohydrates.
Under fasting condition, when circulating insulin levels are low, GLUT4 is sequestered
in vesicles in the cytoplasm and only a small percentage of this protein is located in the
plasma membrane. When carbohydrates are ingested, insulin is secreted by the
pancreas and binds to the insulin receptor (IR), triggering the signaling cascade that
ends with GLUT4 translocation (Wilcox, 2005).
IR is a heterotetrameric complex composed by two extracellular α-subunits and two
intracellular β-subunits with tyrosine kinase activity linked by disulphide bonds.
Circulating insulin, through its direct interaction with the α-subunit, induces the

Introduction
5
activation of the intrinsic tyrosine kinase activity of the β-subunit. This results in the
autophosphorylation of the receptor in specific tyrosine residues (Y1158, Y1162,
Y1163), followed by the recruitment of several substrates including Insulin Receptor
Substrates (IRS-1 and IRS-2) (Hubbard, 1997). Tyrosine phosphorylation of IRSs by IR
induces the exposure of hidden recognition sites, producing the recruiting of additional
molecules that contain Src homology 2 (SH2) domains, including phosphatidylinositol
3-kinase (PI3K), which is a heterodimer comprised of a regulatory subunit, P85, and a
catalytic subunit, P110 (Jiménez et al., 2002; Di Zazzo et al., 2014). When PI3K is
located in close proximity to the plasma membrane and, therefore, to its lipid
substrates, the inhibitory role of P85 is reduced and P110 converts
phosphatidylinositol-4,5-bisphosphate (PIP2) to phosphatidylinositol 3,4,5
trisphosphate (PIP3) at the plasma membrane (Choi et al., 2002; Liu et al., 2009). PIP3
acts as a second messenger recruiting PDK1 and protein kinase B (PKB/Akt) (Liu et al.,
2009). In these circumstances, PDK1 activates PKB/Akt by phosphorylation and after
several subsequent phosphorylation steps of various downstream proteins, GLUT4
transporter is finally translocated to the plasma membrane allowing glucose uptake
from the extracellular space (Christian K.Roberts, Andrea L.Hevener, 2014; Liu et al.,
2009).
Figure I3. PI3K-dependent insulin signaling. Insulin activates the insulin receptor, which
phosphorylates and recruits substrate adaptors such as the IRS family of proteins. Tyrosine-
phosphorylated IRS then displays binding sites for numerous signaling partners. Among them,
PI3K has a major role in insulin function, mainly via the activation of the Akt/PKB. AS160 is
rapidly phosphorylated by Akt/PKB leading to GLUT4 translocation to the plasma membrane to
allow the entrance of glucose.
Introduction
6
GLUT4 belongs to a family of glucose transporter isoforms (GLUTs), constituted by 12
transmembrane domains, which catalyze the facilitative diffusion transport of hexoses
across the plasma membrane. Particularly, in absence of insulin, GLUT4 is essentially
located in intracellular compartments called GLUT4-storage vesicles (GSVs) (Bruno et
al., 2016).
Recent evidence indicates that translocation of GLUT4 to the plasma membrane
induced by insulin is regulated by Rab-GTPase proteins, which play an important role in
the vesicle transport process (Huang and Czech, 2007). Recently, multiple members of
this family of proteins including RAB10, RABA4 and RAB5 have been found in GSVs
(Bruno et al., 2016). Classically, Rabs function as molecular switches; when GTP is
bound Rab is active, whereas hydrolysis of GTP to GDP inactivates this protein.
AS160 is one of the major proteins of the Rab-GTPase family that has been involved in
the regulation of GLUT4 translocation. AS160 is a putative target of Akt at Thr642 and
in multiple serine residues. Unlike the classic mechanism of activation-inactivation of
the Rab-GTPase protein family, AS160 is shown to be regulated by phosphorylation
(Sano, 2003). Nonphosphorylated AS160 bound to GSVs inhibits GLUT4 trafficking and
translocation to the plasma membrane. However, insulin stimulation results in the
rapid phosphorylation of AS160 and its dissociation from GSVs, leading to a significant
increase in GLUT4 translocation (Christian K.Roberts, Andrea L.Hevener, 2014; Tan et
al., 2012).
3. Hypoxia
Oxygen is necessary at a molecular level for most metabolic processes (Trayhurn,
2014). The cell exposure to oxygen could vary depending on the tissue, from 16% in
the pulmonary alveoli to less than 6% in other organs of the body (Semenza, 2001).
Cell oxygen levels are rigorously regulated primarily by mitochondrial oxidative
phosphorylation and oxygen delivery by erythrocytes through capillary networks
(Hagen et al., 2003; Taylor, 2008). The alteration of oxygen homeostasis due to an
increase in oxygen demand and the insufficient supply of this molecule by the capillary
networks induce a hypoxia situation in the tissue (Fridlyand and Philipson, 2006).

Introduction
7
Hypoxia has been pointed as a crucial feature in the pathophysiology of heart disease,
cancer, obesity, cerebrovascular disease and chronic lung disease, which represent
important causes of mortality in western countries (Losso and Bawadi, 2005; Semenza,
2001).
3.1. Hypoxia signaling pathways
Since oxygen is an essential factor required for metabolism, including the production
of ATP, metazoans have evolved multiple mechanisms in order to adapt and survive
periods of hypoxia (Kaelin and Ratcliffe, 2008; Zepeda et al., 2013).
3.1.1. Hypoxia-inducible factor signaling
The primary signaling pathway activated by hypoxia is driven by the hypoxia-inducible
factor (HIF) family of proteins. HIFs are basic helix-loop-helix transcription factors that
function as heterodimers consisting of two subunits, an oxygen sensitive α-subunit and
a constitutively expressed β-subunit (HIF-1β), also known as the aryl hydrocarbon
receptor nuclear translocator (ARNT) (Deng et al., 2016; Lee et al., 2011).
Conversely to β-subunit, three α-subunits have been described—HIF-1α, HIF-2α, and
HIF-3α. HIF-1α has received the most attention and is considered as the master
regulator of oxygen homeostasis (Glück et al., 2015; Trayhurn, 2014). Under normoxia
condition, HIF-1α subunit is hydroxylated by activated prolyl hydroxylases (PHDs). As a
result, HIF-1α is bound to the tumour suppressor Von Hippel–Lindau (VHL) protein.
This interaction causes HIF-1α to become ubiquitylated and targeted to the
proteasome, where it is degraded (Harris, 2002). At low oxygen concentrations, PHDs
are inactivated, preventing HIF-1α from being degraded. HIF-1α is therefore
accumulated in the nucleus, where it associates to the HIF-1β subunit. This complex
activates gene transcription by binding to specific HIF-responsive elements (HREs)
present in target genes (Glück et al., 2015).

Introduction
8
Figure I4. HIF-1 signaling pathway. In the presence of oxygen (O2), prolyl hydroxylase modifies hypoxia-inducible transcription factor (HIF)-1α, allowing it to interact with the Von Hippel–Lindau (VHL) complex. VHL is part of a larger complex that includes elongin-B, elongin-C, CUL2, RBX1 and an ubiquitin-conjugating enzyme (E2). This complex, together with an ubiquitin-activating enzyme (E1), mediates the ubiquitylation (Ub) of HIF-1α and subsequent proteasome degradation. In the absence of oxygen, prolyl hydroxylase cannot modify HIF-1α, and the protein remains stable. Stabilized HIF-1α is translocated to the nucleus, where it interacts with cofactors such as aryl hydrocarbon receptor nuclear translocator (ARNT), CBP/p300 and the DNA polymerase II (Pol II) complex to bind to hypoxia-responsive element (HREs) and activate transcription of target genes. Figure adapted from: Harris, 2002.
HIF-1 regulates more than 100 different genes involved in a multiplicity of cellular
processes, including glucose utilization, inflammation, extracellular matrix (ECM)
metabolism, and apoptosis (Trayhurn, 2014; Zepeda et al., 2013).
More recently, two HIF-1 independent pathways have been related to the cellular
response to hypoxia inducing important effects in gene expression: the mammalian
target of rapamycin (mTOR) pathway and the unfolded protein response (UPR)
(Wouters and Koritzinsky, 2008).
3.1.2. mTOR signaling pathway
mTOR is a ubiquitous serine/threonine kinase that stimulates proliferation and survival
under stress. To achieve this objective, two interacting complexes, mTORC1 and
Introduction
9
mTORC2, promote the transcription of genes involved in carbohydrate metabolism and
lipogenesis, enhance protein translation, and inhibit autophagy (Perl, 2015). Arsham
and colleagues showed that brief incubation of HEK293 cells in hypoxia (1.5% O2)
prevented the phosphorylation of mTOR and its effectors: 4E-BP1, p70S6K, rpS6, and
eIF4G (Arsham et al., 2003). Through this HIF-1 independent mechanism, hypoxia
induced protein synthesis and reduced the autophagy and apoptosis process (Arsham
et al., 2003).
3.1.3. Unfolded protein response (UPR)
The unfolded protein response (UPR) is an adaptive response initiated by reticulum
stress. UPR signaling is initiated by three ER-transmembrane transducers: PERK (PKR-
like ER kinase), inositol-requiring protein 1 (IRE1) and ATF6 (Ruiz de Galarreta et al.,
2016). The UPR controls multiple downstream processes, including production,
maturation and degradation of proteins, cell metabolism and cell death.
Recently, it has been demonstrated in human diploid fibroblasts and transformed cells
that incubation in anoxia or hypoxia (1% O2) led to phosphorylation of PERK and its
substrate, eIF2α. This effect was correlated with a decrease in the rates of protein
synthesis and was independent of the function of HIF-1 (Koumenis et al., 2002).
Phosphorylation of eIF2α was also increased in several cell lines obtained from normal
or cancer tissues after culture in hypoxic atmosphere (Koritzinsky et al., 2007; Wouters
and Koritzinsky, 2008).
In addition, it has been shown that hypoxia is able to activate IRE1, increasing the
splicing rate and the transcription of X-box binding protein (XBP1). XBP1-deficient cells
present a reduced capacity to survive in a hypoxic microenvironment, indicating the
importance of this pathway to the adaptation to hypoxic microenvironment (Romero-
Ramírez et al., 2004).
3.2. Hypoxia in obesity
It has been well established that, in obesity, there exists hypertrophy (increase of cell
size) and hyperplasia (increase in the number of cells) of adipocytes, which enlarge the
mass of adipose tissue. Considering the adipose tissue expansion, it was proposed that
white fat depots show hypoxic areas leading to the establishment of the inflammatory
Introduction
10
response observed in the tissue. This hypothesis has been supported in part by
evidence, indicating that the limited vascularization of the adipose tissue in obesity is
insufficient to maintain normal oxygen levels throughout the organ (Trayhurn, 2014;
Trayhurn and Wood, 2004; Yin et al., 2009). Consistent results indicate that fasting and
postprandial blood flow in adipose tissue is decreased in obese insulin-resistant versus
lean insulin-sensitive subjects (Goossens and Blaak, 2015; Karpe et al.). Another
argument to support the development of hypoxia in obese adipose tissue is that the
diameter of hypertrophic adipocytes (150-200 µM) could exceed the normal diffusion
distance of oxygen across tissues (100-200 µM) (Goossens and Blaak, 2015; Trayhurn,
2014). In this context, partial pressure of oxygen of almost zero has been reported at
only 100 µM from blood vessels in some tissues (Brahimi-Horn and Pouysségur, 2007).
All these observations represent important evidences, but do not really demonstrate
that hypoxia occurs in the obese adipose tissue. In this sense, several key in vivo
studies have been performed to determine the real O2 levels in adipose tissue using
pimonidazole hydrochloride staining, which forms a colored adduct in hypoxic tissues.
These experiments have shown that weight gain in ob/ob, KKAy (type 2 diabetes
model), and dietary-induced obese mice, induced the development of hypoxia in
parametrial and epididymal white adipose tissue (Hosogai et al., 2007; Rausch et al.,
2008; Ye et al., 2007). Moreover, the expression of hypoxia-responsive genes, including
HIF-1α (Hif1a), GLUT1 (Slc2a1), leptin (Lep), plasminogen activator inhibitor-1 (PAI-1 or
Serpine1), matrix metalloproteinase-2 (Mmp2) and adrenomedullin (Adm), were
upregulated in white adipose tissue of ob/ob mice and diet-induced obese mice
compared to normal mice (Hosogai et al., 2007; Rausch et al., 2008; Ye et al., 2007).
The lactate production was determined in white adipose tissue of high-fat diet fed
mice and KKAy mice and showed an important increase of 1.7- and 1.5-fold higher than
those of normal-diet fed mice and control, respectively (Hosogai et al., 2007). There
are also studies using a needle-type fiber optic O2 sensor allowing the quantification of
pO2. Ye J and colleagues have demonstrated markedly lower levels of O2 in epididymal
and retroperitoneal adipose tissue in obese mouse models compared to lean mice.
More precisely, pO2 was reduced threefold in the first such study: 15.2 versus 47.9 mm
Hg (Ye et al., 2007).

Introduction
11
Taken together, there is substantial evidence that the hypertrophy of adipocytes and
the subsequent fat depot expansion result in the development of hypoxia in the tissue.
This situation is involved in the dysfunction of adipocytes and the related metabolic
diseases derived from obesity.
3.3. Hypoxia and adipocyte dysfunction
3.3.1. Secretory pattern of adipokines
The effects of hypoxia on the expression of specific adipokines have been determined
by several groups. Lolmede and colleagues showed that the exposure of mouse 3T3-
F442A adipocytes to a low O2 tension (5%) resulted in increased expression and release
of leptin, vascular endothelial growth factor (VEGF), matrix metalloproteinase-2
(MMP2) and -9 (MMP9), compared to the cells cultured in normoxia condition
(Lolmède et al., 2003). The second major hormone released by adipocytes is
adiponectin, which has important functions as insulin sensitizer and as anti-
inflammatory. It has been shown that adiponectin is downregulated after 12 hours of
hypoxia (1% O2) in murine 3T3-L1 adipocytes (Chen et al., 2006; Hosogai et al., 2007).
Moreover, adipocyte-specific HIF-1α knock-out mice increase the expression of
adiponectin in contrast to the wild-type mice (Jiang et al., 2013). Since adiponectin is
an important hormone which induces insulin response and anti-inflammatory effects
in adipocytes, this evidence has a particular significance since low plasma levels of
adiponectin are associated with the development of obesity-related insulin resistance
and cardiovascular disease (Kadowaki et al., 2006). Similar effects in the leptin and
adiponectin production induced by hypoxia have been observed in human adipocytes.
Taken together, these results indicate that reduction in pO2 is the primary mechanism
for the rise in the production of leptin and for the downregulation of adiponectin
(Trayhurn, 2014).
Besides leptin and adiponectin, other major inflammation-related adipokines have
been shown to be modulated by hypoxia. The protein serum amyloid A (SAA)-3, which
is also released by mature adipocytes and induces tumor necrosis factor-α (TNF-α), IL-
6, IL-8 and monocyte chemotactic protein-1 (MCP-1) release, is increased in 3T3-L1
adipocytes incubated in hypoxia (1% O2) (De Oliveira et al., 2013). Furthermore, the

Introduction
12
expression and secretion of FIAF/angiopoietin-like protein 4, IL-6, macrophage
migration inhibitory factor (MIF) and VEGF, are stimulated by hypoxia in human
adipocytes (Wang et al., 2007).
Figure I5. Effects of hypoxia on the expression of key genes in human adipocytes (↑ increased, ↓ decreased expression). Genes encoding both adipokines and proteins involved in general cellular metabolism are shown. Angptl3, angiopoietin-like protein 3; FABP3, fatty acid binding protein 3; GLUT, glucose transporter; IL-6, interleukin-6; MCT, monocarboxylate transporter; MMP, matrix metalloproteinase; pO2, oxygen partial pressure; PAI, plasminogen activator inhibitor; PGC, peroxisome proliferator-activated receptor-gamma coactivator; PPAR, peroxisome proliferator-activated receptor; UCP2, uncoupling protein-2; VEGF, vascular endothelial growth factor. Figure from: Trayhurn, 2014.
3.3.2. Lipid oxidation and oxidative metabolism
It is known that lipid oxidation and lipolysis are among the most prominent pathways
modulated by hypoxia in adipocytes. Hashimoto and colleagues found that modest
hypoxia (5% O2) decreased the size of lipid droplets and lipid storage, increased basal
lipolysis and augmented fatty acid release in 3T3-L1 adipocytes (Hashimoto et al.,
2013). Moreover, experiments made in human adipocytes showed that hypoxia
inhibits lipogenesis and induces basal lipolysis probably due to inhibition of
hexosamine biosynthesis (O’Rourke et al., 2013).

Introduction
13
On the other hand, hypoxia has been shown to downregulate the expression of
important genes involved in mitochondrial metabolism and oxidative phosphorylation.
In renal carcinoma cells lacking the VHL tumor suppressor, HIF-1 negatively regulates
mitochondrial biogenesis and O2 consumption (Zhang et al., 2007). In 3T3-L1
adipocytes, hypoxia (2% O2) decreases ATP production, NADH dehydrogenase activity,
mitochondrial membrane potential, and expression of mitochondria-related genes
including NRF-1, PGC-1α, COX1 and SOD. Microarrays studies also demonstrate that
hypoxia downregulates genes related to oxidative metabolism (Mazzatti et al., 2012).
3.3.3. Glucose utilization
One of the main metabolic consequences of hypoxia is a shift towards anaerobic
metabolism, which induces a change in the glucose mobilization mechanism.
It has been demonstrated that GLUT1, a facilitative glucose transporter independent of
insulin, is a direct target of HIF-1 and is presumed to be the main transporter
responsible for basal glucose uptake (Hayashi et al., 2004). Experiments in human
SGBS-differentiated adipocytes showed that hypoxia (1% O2) for up to 24 h resulted in
significant increases in GLUT1 (9.2-fold), GLUT3 (9.6-fold peak at 8 h), and GLUT5 (8.9-
fold) mRNA levels compared to adipocytes maintained in normoxia (21% O2) (Wood et
al., 2007). This result is consistent with the strong increase (6-fold) detected in basal
glucose uptake measured by 2-deoxyglucose uptake assay after 24 hours of hypoxia in
human adipocytes (Wang et al., 2007). Furthermore, recent evidence suggests that
basal glucose uptake is also enhanced in adipocytes as an acute response to hypoxia
(Lu et al., 2016).
Glucose uptake in adipocytes is mainly regulated by insulin. In normoxia, insulin
induces a 10-fold increase in glucose transport in 3T3-L1 differentiated adipocytes.
However, incubation of murine adipocytes in hypoxia for 16 hours shows inhibited
insulin-induced glucose transport. Protein expression of GLUT4 was not altered in this
experiment (Regazzetti et al., 2009).
Introduction
14
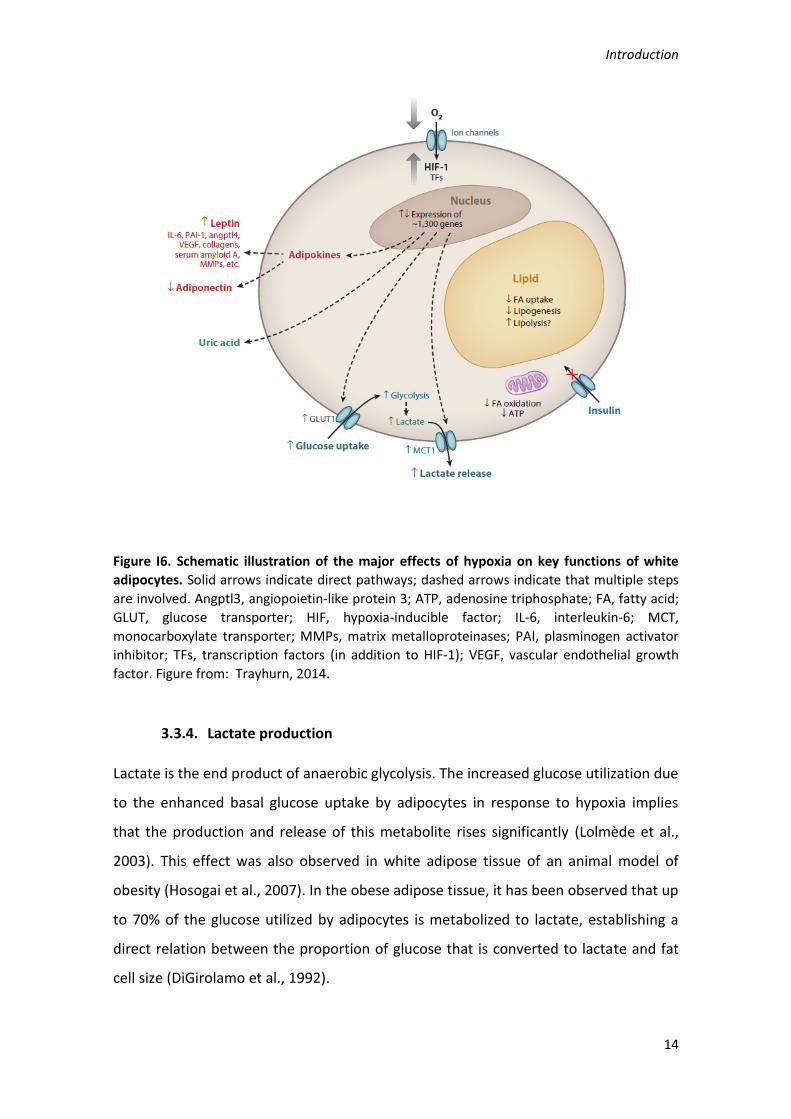
Figure I6. Schematic illustration of the major effects of hypoxia on key functions of white
adipocytes. Solid arrows indicate direct pathways; dashed arrows indicate that multiple steps
are involved. Angptl3, angiopoietin-like protein 3; ATP, adenosine triphosphate; FA, fatty acid;
GLUT, glucose transporter; HIF, hypoxia-inducible factor; IL-6, interleukin-6; MCT,
monocarboxylate transporter; MMPs, matrix metalloproteinases; PAI, plasminogen activator
inhibitor; TFs, transcription factors (in addition to HIF-1); VEGF, vascular endothelial growth
factor. Figure from: Trayhurn, 2014.
3.3.4. Lactate production
Lactate is the end product of anaerobic glycolysis. The increased glucose utilization due
to the enhanced basal glucose uptake by adipocytes in response to hypoxia implies
that the production and release of this metabolite rises significantly (Lolmède et al.,
2003). This effect was also observed in white adipose tissue of an animal model of
obesity (Hosogai et al., 2007). In the obese adipose tissue, it has been observed that up
to 70% of the glucose utilized by adipocytes is metabolized to lactate, establishing a
direct relation between the proportion of glucose that is converted to lactate and fat
cell size (DiGirolamo et al., 1992).

Introduction
15
Recent evidence also suggests that lactate is more than a metabolic product of
glycolysis and may behave as a signaling molecule involved in the inflammatory
response and the induction of insulin resistance in skeletal muscle cells (Choi et al.,
2002; Samuvel et al., 2009).
3.4. Insulin resistance and other metabolic disturbances related to hypoxia
Dysregulation of adipocyte function as a consequence of hypoxia, discussed previously,
promotes the appearance of insulin resistance, which may finally induce the
development of type 2 diabetes. The reduced levels of adiponectin in hypoxic adipose
tissue and the rise in the release of the pro-inflammatory cytokine IL-6 by low oxygen
concentration constitute a mechanism by which insulin sensitivity is impaired (Wang et
al., 2007).
A further hypoxia effect that promotes insulin resistance in adipose tissue is the
reduced activity showed by the insulin-induced glucose transporter, GLUT4. The
exposure of adipocytes to prolonged hypoxia (48 hours) induced downregulation of
the GLUT4 gene (Slc2a4) (Wood et al., 2009). Moreover, the glucose uptake induced by
insulin and measured by 2-deoxyglucose assay is strongly reduced in adipocytes after
incubation in a hypoxic microenvironment (Regazzetti et al., 2009).
Insulin signaling pathway has been shown to be impaired in adipocytes incubated in
hypoxic conditions, occurring an inhibition of the phosphorylation of the insulin
receptor, PKB/Akt and AS160 and the subsequent inhibition of PI3K pathway. This
direct effect of low oxygen concentration is crucial for the development of insulin
resistance within adipose tissue (Regazzetti et al., 2009).
Not only chronic hypoxia, but also intermittent hypoxia (IH) has been positively
correlated with the development of insulin resistance and glucose intolerance. IH
occurs in obese patients with obstructive sleep apnea (OSA) and is produced by the
recurrent collapse of the upper airway during sleep, resulting in a cyclical pattern of
oxygen desaturation that lasts 15-60 s, followed by reoxygenation (Dewan et al.,
2015). OSA can lead to many comorbidities, such as hypertension and coronary heart
disease (Polotsky et al., 2003). Ip et al., showed in humans that sleep disorder
indicators of OSA patients tightly correlated with insulin resistance parameters (fasting

Introduction
16
serum insulin levels and the insulin resistance index) in both obese and non-obese
patients (Ip et al., 2002). Other clinical studies in humans have also demonstrated that
IH impairs insulin sensitivity (Louis and Punjabi, 2009). In mice, exposure to IH
decreases whole-body insulin sensitivity and muscle-specific glucose utilization in
C57Bl/6J mice (Iiyori et al., 2007; Poulain et al., 2015).
Hypoxia is also involved in the generation of endothelial dysfunction. IH leads to
oxidative stress characterized by the increased levels of ROS (Lévy et al., 2008).
Furthermore, hypoxia reduces nitric oxide (NO) bioavailability and induces the
formation of peroxynitrite (ONOO-), which results from the reaction between nitric
oxide and the superoxide ion (O2·-). Peroxynitrite has been involved in the endothelial
damage inhibiting the activity of endothelial nitric oxide synthase (eNOS) (Zou et al.,
2002) and catalase, a known antioxidant enzyme (Bauer G 2015). Oxidative stress also
induced the activation of an inflammatory cascade producing the expression of
adhesion molecules (Ohga et al., 2003) and the activation of leukocytes (Schulz et al.,
2000). Moreover, adipose tissue contributes to endothelial dysfunction by releasing
adipokines involved in vascular and endothelial physiology including TNF-α,
interleukin-6, complement factors, angiotensinogen, resistin and adipocyte
differentiation factor (Lévy et al., 2008).
Introduction
17
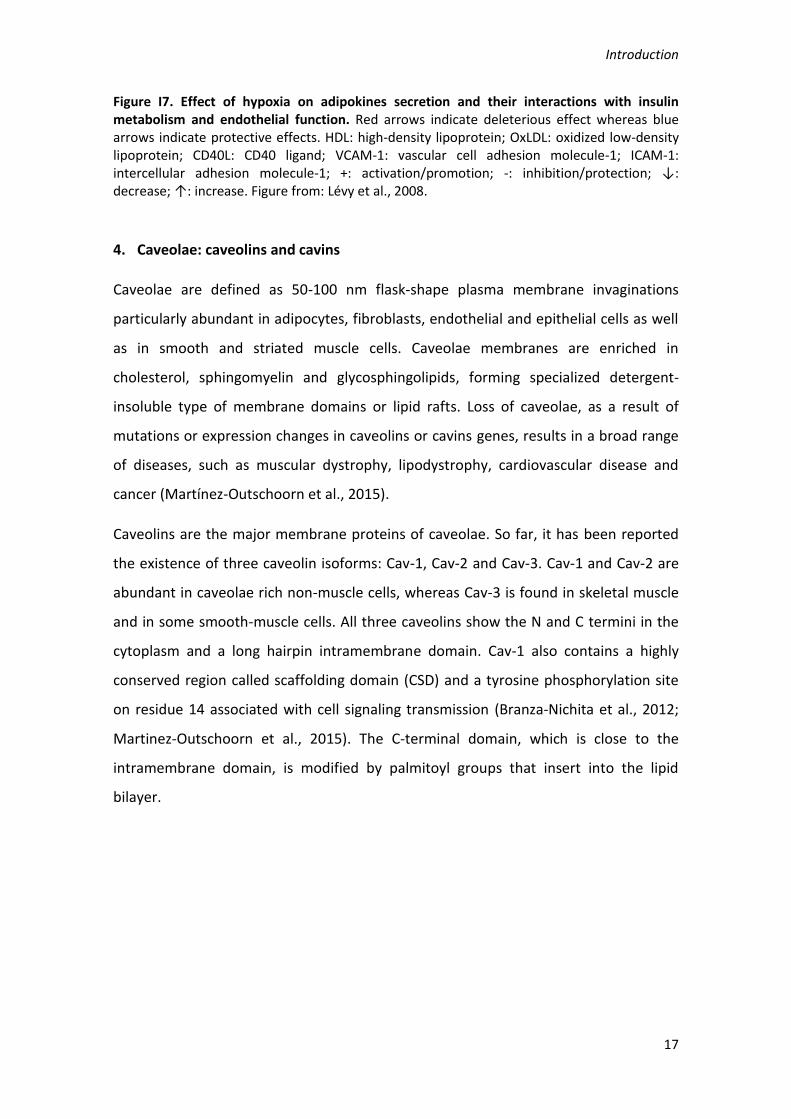
Figure I7. Effect of hypoxia on adipokines secretion and their interactions with insulin metabolism and endothelial function. Red arrows indicate deleterious effect whereas blue arrows indicate protective effects. HDL: high-density lipoprotein; OxLDL: oxidized low-density lipoprotein; CD40L: CD40 ligand; VCAM-1: vascular cell adhesion molecule-1; ICAM-1: intercellular adhesion molecule-1; +: activation/promotion; -: inhibition/protection; ↓: decrease; ↑: increase. Figure from: Lévy et al., 2008.
4. Caveolae: caveolins and cavins
Caveolae are defined as 50-100 nm flask-shape plasma membrane invaginations
particularly abundant in adipocytes, fibroblasts, endothelial and epithelial cells as well
as in smooth and striated muscle cells. Caveolae membranes are enriched in
cholesterol, sphingomyelin and glycosphingolipids, forming specialized detergent-
insoluble type of membrane domains or lipid rafts. Loss of caveolae, as a result of
mutations or expression changes in caveolins or cavins genes, results in a broad range
of diseases, such as muscular dystrophy, lipodystrophy, cardiovascular disease and
cancer (Martínez-Outschoorn et al., 2015).
Caveolins are the major membrane proteins of caveolae. So far, it has been reported
the existence of three caveolin isoforms: Cav-1, Cav-2 and Cav-3. Cav-1 and Cav-2 are
abundant in caveolae rich non-muscle cells, whereas Cav-3 is found in skeletal muscle
and in some smooth-muscle cells. All three caveolins show the N and C termini in the
cytoplasm and a long hairpin intramembrane domain. Cav-1 also contains a highly
conserved region called scaffolding domain (CSD) and a tyrosine phosphorylation site
on residue 14 associated with cell signaling transmission (Branza-Nichita et al., 2012;
Martinez-Outschoorn et al., 2015). The C-terminal domain, which is close to the
intramembrane domain, is modified by palmitoyl groups that insert into the lipid
bilayer.

Introduction
18
Figure I8. Caveolae and caveolins. Caveolin is inserted into the caveolar membrane, with the N and C termini facing the cytoplasm and a ‘hairpin’ intramembrane domain embedded within the membrane bilayer. The scaffolding domain is indicated with red circles. The C-terminal domain, which is close to the intramembrane domain, is modified by palmitoyl groups that insert into the lipid bilayer. Figure from: Parton and Simons, 2007.
Caveolins are not the only structural component of caveolae. Over the past few years,
a new family of cytoplasmic proteins with previously identified functions, and now
known as cavins, has been also found as essential for caveolae structure. The cavin
family includes cavin-1 (PTRF; Polymerase I and Transcript Release Factor), cavin-2
(SDPR; serum deprivation response protein), cavin-3 (SRBC; Sdr-related gene product
that binds to c-kinase, also known as PRKCDBP; Protein Kinase C Delta Binding Protein)
and cavin-4 (MURC; Muscle Related Coiled-Coil Protein). Cavins are cytoplasmic
proteins with amino‑terminal coiled-coil domains that form large heteromeric
complexes recruited to caveolae in cells expressing caveolins.
4.1. Biogenesis of caveolae
Caveolins and cavins are essential and play an important role in caveolae formation.
The importance of Cav-1 in the biogenesis of caveolae has been well established.
Studies in Cav-1 knockout mice have shown that, in these animals, caveolae structures

Introduction
19
were absent in non-muscle tissues (Drab et al., 2001; Razani et al., 2001, 2002).
Moreover, the transient expression of Cav-1 in a lymphocyte cell line, which has no
detectable levels of this protein, promotes de novo formation of caveolae (Fra et al.,
1995). Walser et al showed, in an elegant manner, that Cav-1 expression drives the
formation of caveolae structure by its expression in a bacterium which lacks any
intracellular membrane system (Walser et al., 2012). It has been reported that
generation of caveolae structures involves the binding of Cav-1 to cholesterol
molecules in the plasma membrane (Murata et al., 1995), where it could form
oligomers (Monier et al., 1996) inducing the typical curvature of caveolae.
Recently, the importance of cavins for the formation of caveolae has been
demonstrated. As occurs with Cav-1, cavin-1 and cavin-2 ablation in mice causes loss of
caveolae in their tissues (Hansen et al., 2009, 2013; Liu et al., 2008). Moreover,
absence of cavin-1 induces endocytosis and subsequent degradation of Cav-1, leading
to dramatically reducing the levels of this protein (Liu and Pilch, 2008). On the other
hand, cooperation between Cav-1 and cavin-1 is required for the formation of
caveolae, as demonstrated by the generation of caveolae structure when cavin-1
expression is induced in cells that lack endogenous cavins, but express endogenous
Cav-1 (Hill et al., 2008). A recent study showed that cavin-2 is necessary for the stable
expression of cavin-1 and Cav-1 and is involved in the generation of caveolar
membrane curvature (Hansen et al., 2009). Less is known about the role of cavin-3 in
caveolae, but it is thought to be implicated in the traffic of the caveolar vesicle
(McMahon et al., 2009).

Introduction
20
Figure I9. Caveolins and cavins gene structure. A) Schematic representation of Cav-1 and Cav-3 gene. Numbers above the lines correspond to the amino acid in mammalian caveolins. Palmitoylation (Palm) sites in CAV1 are indicated in green, a Tyr phosphorylation site in red (potential phosphorylation sites in CAV3 are not shown). Disease-associated amino acid substitutions in CAV1 and CAV3 are shown in blue. B) Schematic illustration showing the predicted domains of the four mammalian cavins. The conserved predicted coiled-coil domains implicated in protein–protein interactions are indicated in blue and the basic regions implicated in membrane association are shown in yellow. BC, breast cancer; DM, distal myopathy, FHCK, familial hyperCKemia; LGMD1C, limb girdle muscular dystrophy 1C; Myo, myopathy; RMD, Rippling muscle disease; SHCK, spontaneous hyperCKemia. Figure from: Parton and del Pozo, 2013.
4.2. Caveolae functions
Caveolae have been described to be involved in several cell processes including
endocytosis, regulation of membrane lipid composition, and as a signaling platform.
These specialized regions of the plasma membrane contain a number of signaling
components (receptors, transducers, channels, pumps and exchangers) responsible for
initiating many of the major cell signaling pathways. More recently, cell protection
against mechanical stress within the plasma membrane has been also attributed to
caveolae.
A
B

Introduction
21
4.2.1. Endocytosis
The understanding of the dynamic of caveolae is still object of investigation. However,
experiments using microscopy and gene editing technologies have shown that only
around 5% of the total population of caveolae undergoes endocytosis. This low
contribution to total endocytosis is consistent with other reports indicating that these
invaginations have specific cargoes, including GPI-anchored proteins, the insulin
receptor, Shiga and cholera toxins, cholesterol, albumin and simian virus 40 (SV40).
The regulation of endocytosis mediated by caveolae is dependent on several adaptor
proteins including EH-domain containing 2 (EHD2), pacsin 2, and dynamin-2, which
have been implicated in the caveolar scission and budding from plasma membrane
(Senju and Suetsugu, 2016). The presence of cavin-3 has been also reported to
facilitate the release of caveolae from the membrane (McMahon et al., 2009).
4.2.2. Lipid homeostasis
Considerable in vivo and in vitro evidence supports a role for caveolae in adipocyte
lipid metabolism. Mice and human models lacking caveolae, through Cav-1 or cavin-1
ablation, develop lipodystrophy and exhibit loss of subcutaneous fat and glucose
intolerance (Ardissone et al., 2013; Rochford, 2014; Schrauwen et al., 2015). It has
been reported that caveolae could protect cells, including adipocytes, from
lipotoxicity. In this line, overexpression of Cav-1 and Cav-3 in HEK293 cells induced
resistance to the lipotoxic effect of prolonged incubation with high levels of fatty acids
(Simard et al., 2010). Moreover, Cav-1 deletion in adipocytes increases the rate of
lipolysis in these cells (Meshulam et al., 2011). On the other hand, Cav-1 deficiency
also leads to altered lipid composition and distribution in the plasma membrane
affecting Ras signaling pathway (Ariotti et al., 2014). These data suggest that the role
of Cav-1, and therefore of caveolae, in the lipid membrane composition is important
for the correct functioning of both, lipid metabolism and efficient signal transduction
pathways.

Introduction
22
4.2.3. Signal transduction
Caveolae serves as a communication platform promoting the interaction between
protein mediators in cell signaling processes (Billaud et al., 2014). Indeed, caveolins
have been involved in the regulation of multiple signaling pathways in a negative or
positive manner (Boscher and Nabi, 2012). Important evidence in this sense is the
identification of multitude of receptors integrated within the caveolae structure.
Moreover, the scaffolding domain of Cav-1 has been related to the recruitment of
various signaling proteins, exerting differential regulatory roles. In this way, it has been
reported that the activities of epidermal growth factor (EGF) receptor, nitric oxide
synthase, G proteins, protein kinase C and Src family proteins are negatively regulated
by this interaction, whereas insulin receptor (IR), Eph receptors or estrogen receptor
are activated (Cheng and Nichols, 2016; Martínez-Outschoorn et al., 2015; Parton and
del Pozo, 2013; Parton and Simons, 2007)
Figure I10. Organization and signaling function of lipid rafts and caveolae. Caveolae are specialized regions of the plasma membrane (green zones), rich in cholesterol and sphingomyelin. Caveolae are constituted having a cytoplasmic coat of caveolin molecules (yellow). They contain a number of signaling components (receptors, transducers, channels, pumps and exchangers) responsible for the initiation of many of the major cell signalling pathways. Figure from: http://www.cellsignallingbiology.org/csb/006/csb006fig6_caveolae_organization.htm.

Introduction
23
4.2.4. Mechanoprotection
Since caveolae are highly abundant in mechanically stressed cells, such as muscle cells,
fibroblasts, endothelial cells and adipocytes, the role of this structure in
mechanoprotection mechanisms has been recently addressed by several laboratories.
Experiments using electron microscopy have demonstrated that caveolae are
associated with actin cytoskeleton, particularly the stress fibers which are very
sensitive to mechanical stress (Echarri and Del Pozo, 2015). Furthermore, Cav-1 and
cavin-4 activate RhoA signaling, the main pathway involved in mechanosensing
response, resulting in the actomyosin contractility (Echarri and Del Pozo, 2015). On the
other hand, mechanical stress produces flattening of caveolae by the dissociation of
cavins from the plasma membrane (Sinha et al., 2011). Shear stress, which is
constantly suffered by endothelial cells, induces a relocation of caveolae to the trailing
edge of the cells (Cheng and Nichols, 2016; Isshiki et al., 2002). Furthermore, Cav-1
knockout mice result in an impaired response to blood flow changes in vessels (Yu et
al., 2006). Recently, Nolwenn Briand and colleagues demonstrated for the first time
the role of caveolae in the mechanosensing of lipid store fluctuation and the
importance of the relation between caveolins and cavins in this function (Briand et al.,
2014).
4.3. Caveolae and insulin signaling
Early evidence indicates the importance of caveolae in the regulation of insulin
signaling (Yamamoto et al., 1998). A direct interaction between Cav-1 and IR through
the scaffolding domain in Cav-1 structure has been demonstrated (Kabayama et al.,
2007; Nystrom et al., 1999). Furthermore, ultrastructural experiments also indicate
that IR is highly enriched in caveolae in adipocytes plasma membrane (Gustavsson et
al., 1999; Sekimoto et al., 2012). This co-localization is also observed in myocytes,
hepatocytes, endothelial cells and pancreatic β-cells. In vitro studies showed that the
stimulation of adipocytes with insulin results in the translocation of glucose
transporter GLUT4 within caveolae (Gustavsson et al., 1996). Moreover, insulin
stimulation induces IR autophosphorylation and internalization in a process mediated
by the rapid tyrosine phosphorylation of Cav-1 (Fagerholm et al., 2009). Further
investigation in adipocytes highlighted the importance of caveolae and Cav-1 in insulin-

Introduction
24
induced glucose uptake. Repression of Cav-1 protein expression leads to a decrease in
GLUT4 translocation to the plasma membrane, triggering the reduction of the insulin-
stimulated glucose transport and inhibiting IR phosphorylation (González-Muñoz et al.,
2009). The role of the other components of caveolae in the insulin signaling pathway
has been also addressed. In cardiomyocytes, fluorescence energy transfer (FRET)
experiments have shown that Cav-3 directly interacts with IR. Likewise,
haploinsufficiency for Cav-3 in this kind of cells increases the susceptibility to high-fat-
induced insulin resistance (Talukder et al., 2016). On the other hand, there is no direct
evidence about the role of cavins in the transmission of insulin signaling. However,
cavin-1 knockout mice show significantly reduced glucose tolerance and
hyperinsulinemia, indicating a potential implication of this protein in the insulin
function (Liu et al., 2008). In contrast, cavin-3 ablation in mice has no significant effect
in body weight and fat mass when compared to wild type animals, fed with either
normal chow or high-fat diets (Liu et al., 2008). Moreover, glucose tolerance is not
affected in cavin-3 null mice after both diets (Liu et al., 2014). All these results suggest
that cavin-3 is not required for the metabolic function of caveolae in vivo.
4.4. Insulin resistance and caveolae
An extensive line of evidence has demonstrated the importance of caveolae in the
development of insulin resistance. One of the first reports was the characterization of
Cav-1 knockout mice. These mice present postprandial hyperinsulinemia after being
fed a high-fat diet (Cohen et al., 2003). Moreover, Cav-1 null mice fed a normal chow
diet are significantly unresponsive to insulin due to drastically reduced IR protein
levels, without changes in IR mRNA expression, suggesting the stabilization role of Cav-
1 over IR in plasma membrane in vivo (Cohen et al., 2003). Consistent with this result,
skeletal muscle of Cav-3 null mice is insulin resistant, as exemplified by decreased
glucose uptake, reduced glucose tolerance test and increased serum lipids. At a
molecular level, Cav-3 ablation inhibits insulin-stimulated phosphorylation of IR and
downstream molecules, such as IRS-1 (Oshikawa et al., 2004). Furthermore,
identification of mutations located in the Cav-1 binding motif of IR supports the clinical
importance of the caveolins–IR interaction in the pathogenesis of insulin resistance in
humans (Schwencke et al., 2006). Gain of function experiments have demonstrated
Introduction
25
that caveolin potently enhances IR signaling when overexpressed in the liver of
diabetic obese mice (Otsu et al., 2010).
Low grade chronic inflammation is one of the underlying mechanisms involved in
obesity-induced insulin resistance. Treatment of adipocytes with TNF-α, a
proinflammatory cytokine, reduces to one fifth the relative ratio of caveolae-
associated IR than in normal adipocytes (Sekimoto et al., 2012).
As previously mentioned, obesity results in hypoxia development within adipose
tissue, and in this regard results recently obtained by Regazzetti et al suggested a role
of caveolae in the hypoxia-induced impairment of insulin signaling in adipocytes. In
that work, hypoxia reduced caveolae density in the plasma membrane of adipocytes
and downregulated cavin-1 and cavin-2 in 3T3-L1 adipocytes and in epididymal adipose
tissue of mice. This effect led to the inhibition of insulin signaling in a HIF-1-dependent
mechanism, leading to the establishment of insulin resistance (Regazzetti et al., 2015).


HYPOTHESIS AND AIMS


Hypothesis and aims
29
HYPOTHESIS AND AIMS
1. Hypothesis
Obesity is an important health problem worldwide and courses with hyperplasia and
hypertrophy of adipocytes. This situation produces hypoxia within adipose tissue,
which has been related to dysregulation of adipocytes function, including development
of insulin resistance. It is well known that insulin receptor is located on caveolae, a
specialized plasma membrane invagination constituted mainly by two families of
proteins: caveolins and cavins. Thus, caveolae promotes the interaction of signaling
molecules and therefore, facilitates the appropriate response to stimulus.
Taken all these observations together, our hypothesis is that hypoxia plays an
important role in the development of insulin resistance. This effect could be mediated
by the disruption of caveolae as a consequence of dysregulation in the expression and
activation of caveolins and cavins and the subsequent inhibition of insulin signaling.
2. General aim
The general goal of this project is to explore the effect of hypoxia on caveolae function
and insulin signaling, using different experimental models.
3. Specific objectives
1. To study the effect of chronic hypoxia on the differentiation of 3T3-L1
adipocytes.
2. To study the impact of continuous hypoxia (24-48 h) in the expression of
caveolae related proteins and insulin response in 3T3-L1 adipocytes.
3. To determine the effect of intermittent hypoxia on caveolae integrity in mouse
adipose tissue.
4. To analyze the effect of continuous hypoxia on caveolae structure in human
aortic endothelial cells.


MATERIAL AND METHODS


Material and methods
33
MATERIAL AND METHODS
1. Cell culture
1.1. Culture of 3T3-L1 fibroblasts (ATCC® CL173™, Rockville)
3T3-L1 cells are able to differentiate from a fibroblast-like phenotype to adipocytes
under appropriate conditions and have been widely used for the study of adipogenesis
and adipocyte physiopathologies such as inflammation, insulin resistance, type 2
diabetes, etc.
3T3-L1 fibroblasts were maintained in the growing media Dulbecco's Modified Eagle
Medium (DMEM; Invitrogen, Carlsbad, CL, USA) with High Glucose (4,5 g/L), 110 mg/L
pyruvate and supplemented with 10% of calf bovine serum (Invitrogen, Carlsbad, CL,
USA) and 100 U/mL penicillin-streptomycin (Invitrogen, Carlsbad, CL, USA). Two days
after confluence, adipocyte differentiation was induced by incubating the cells in
DMEM (Invitrogen, Carlsbad, CL, USA) supplemented with 10% Fetal Bovine Serum
(FBS) (Invitrogen, Carlsbad, CL, USA), insulin (1 mg/mL) (Sigma-Aldrich, St. Louis, MO,
USA), water-soluble dexamethasone (1 mM) (Sigma-Aldrich, St. Louis, MO, USA) and 3-
isobutyl-1-methylxanthine (IBMX) (0.5 mM) (Sigma-Aldrich, St. Louis, MO, USA) for 48
hours. The medium was then replaced with DMEM containing 10% FBS and insulin (1
mg/mL) (Sigma-Aldrich, St. Louis, MO, USA) for an additional 48 hours and then
maintained with DMEM, 10% FBS without insulin until day 8 of differentiation when
cells are considered as mature adipocytes. The cells were cultured in a humidified
incubator at 37°C and 5% CO2.
1.2. Human Aortic Endothelial Cells (HAoEC)
HAoEC (PromoCell®, Heidelberg, Germany) were maintained in Endothelial Cell Growth
Medium MV2 (PromoCell®, Heidelberg, Germany) supplemented with 5% Fetal Calf
Serum (FCS), 5 ng/mL epidermal growth factor (recombinant human), 10 ng/mL basic
fibroblast growth factor (recombinant human), 20 ng/mL insulin-like growth factor
(Long R3 IGF-1), 0.5 ng/mL vascular endothelial growth factor 165 (recombinant
human), 1 µg/mL ascorbic acid, 0.2 µg/mL (hydrocortisone and 100 U/mL penicillin-
streptomycin. All reagents from PromoCell® (Heidelberg, Germany). The cells were
cultured in a humidified incubator at 37°C, 5% CO2.
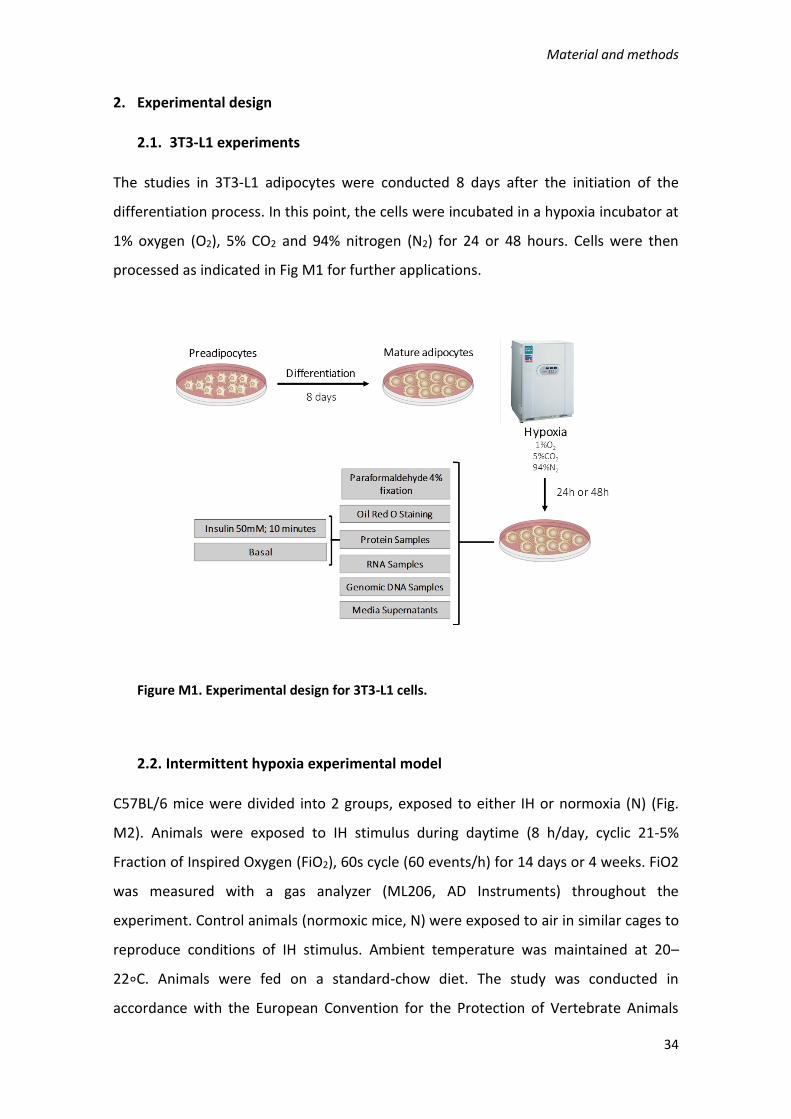
Material and methods
34
2. Experimental design
2.1. 3T3-L1 experiments
The studies in 3T3-L1 adipocytes were conducted 8 days after the initiation of the
differentiation process. In this point, the cells were incubated in a hypoxia incubator at
1% oxygen (O2), 5% CO2 and 94% nitrogen (N2) for 24 or 48 hours. Cells were then
processed as indicated in Fig M1 for further applications.
Figure M1. Experimental design for 3T3-L1 cells.
2.2. Intermittent hypoxia experimental model
C57BL/6 mice were divided into 2 groups, exposed to either IH or normoxia (N) (Fig.
M2). Animals were exposed to IH stimulus during daytime (8 h/day, cyclic 21-5%
Fraction of Inspired Oxygen (FiO2), 60s cycle (60 events/h) for 14 days or 4 weeks. FiO2
was measured with a gas analyzer (ML206, AD Instruments) throughout the
experiment. Control animals (normoxic mice, N) were exposed to air in similar cages to
reproduce conditions of IH stimulus. Ambient temperature was maintained at 20–
22∘C. Animals were fed on a standard-chow diet. The study was conducted in
accordance with the European Convention for the Protection of Vertebrate Animals

Material and methods
35
Used for Experimental and Other Scientific Purposes (Council of Europe, European
Treaties ETS 123, Strasbourg, 18 March 1986) and with the Guide for Care and Use of
Laboratory Animals (NIH Publication no. 85-23, revised 1996).
Figure M2. Experimental design to study intermittent hypoxia in adipose tissue
2.3. HAoEC experiments
HAoEC were cultured until confluence and seeded on 6-well plates during 24 hours.
The plates were then cultured in hypoxic biosafety cabin during 16 hours. Cells were
then processed as indicated in Fig M3 for further applications.
Figure M3. Experimental design for HAoEC

Material and methods
36
3. Oil red O (ORO) staining
ORO (Sigma-Aldrich, St. Louis, MO, USA), is a fat-soluble diazole dye which stains
neutral lipids and cholesterol esters but not biological membranes. In this work ORO
staining was used to estimate the degree of adipocyte differentiation. 3T3-L1 pre-
adipocytes (day 0) and mature adipocytes at days 8 and 10, incubated in normoxia or
hypoxia, were washed twice with phosphate-buffered saline (PBS) and fixed with
formaldehyde 3,7% during 15 minutes. After washing three times with isopropanol
60%, cells were stained with ORO stock solution (0.3%w/v in isopropanol), diluted to
40% with water for 30 minutes at room temperature. Cells were then washed four
times with PBS and photographed in a light microscope (Olympus Ck2, 40 X
magnifications). Finally, incorporated ORO dye was extracted with isopropanol and
quantified using a spectrophotometer (Multiskan Spectrum, Thermo Electron
Corporation, MA, USA) at 540 nm.
4. 2-[C14]-Deoxyglucose uptake assay
3T3-L1 cells were differentiated as described previously during 8 days (point 1.1). 2-
[C14]-Deoxyglucose uptake in 3T3-L1 adipocytes cultured in normoxia or hypoxia with
or without 50 µM of a HIF-1 inhibitor LW6 (Millipore, MA, USA; 1:200), was analyzed at
both basal state and after insulin stimulation. Cells were incubated in DMEM serum
and glucose free for 2 hours in a humidified incubator at 37°C, 5% CO2, before insulin
stimulation Subsequently, cells were stimulated or not with insulin (50 nM) for 10
minutes. 2-C14-deoxyglucose uptake was then initiated by the addition of DMEM, free
of serum and glucose, containing 2-deoxyglucose (50 mM) and 2-C14-deoxyglucose
(0.075 mCi/mL, (American radiolabeled, Saint Louis, MO, USA). Incubation was
continued for 10 minutes and the reaction was terminated by washing cells three
times with pre-cold PBS containing 0.05 M glucose. Cells were then incubated with
1mL of lysis buffer (0.1 M NaOH, 0.1% SDS) at 37°C for two hours and the cell lysate
was transferred to a tube containing 2 mL of scintillation liquid for radioactivity
counting in a scintillation counter (HIDEX 300 SL). 2-Deoxyglucose uptake is reported
as [C14] radioactivity, normalized to protein content from the remaining cell lysate, as
determined by bicinchoninic acid (BCA) analysis (Thermo Fisher Scientific, Waltham,

Material and methods
37
MA, USA) (point 7.2.1). Measurements were performed in triplicate under conditions
where hexose uptake was linear.
5. Determination of caveolae density in plasma membrane.
Caveolae density in plasma membrane was determined by electron microscopy (EM).
Cells were seeded on 6-well plates over a EM coverslip. The day of the experiment the
cells were washed with 0.1 M phosphate buffer (pH 7.4) and fixed in 1.6%
glutaraldehyde for three days. All the procedure was made at 4°C. After fixation, the
cells were rinsed in 0.1 M cacodylate buffer, and postfixed for 1 hour in 1% osmium
tetroxide and 1% potassium ferrocyanide in 0.1 M cacodylate buffer to enhance the
staining of membranes.
Cells were washed in cold distilled H2O, quickly dehydrated in cold ethanol, and lastly
embedded in epoxy resin. Contrasted ultrathin sections (70 nm) were analyzed under a
JEOL 1400 transmission electron microscope (EM) mounted with a Morada Olympus
charge-coupled device camera.
6. Extracellular measurement of lactate levels
Lactic acid is the final product of anaerobic glycolysis and is considered to be a good
marker of the state of oxygenation in tissues. Lactate level was measured in
supernatants of 3T3-L1 cells using ABX Pentra Lactic Acid reagent (Horiba medical,
Montpellier, France).
It is an enzymatic colorimetric assay kit which contains two reagents mixed at the
moment of use. Briefly, reagent 2 contains lactate oxidase which catalyzes the
oxidation of lactate present in the sample, triggering the release of hydrogen peroxide.
This product reacts with 4-aminoantipyrine (AAP) and N-ethyl-N-sulfopropyl-m-
anisidine (ESPAS) contained in the reagent 1, producing a coloured complex in the
presence of peroxidase (Fig. M4). The intensity of the colouring is proportional to the
amount of lactate present in the sample and was measured by the ABX Pentra C200
analyzer. Samples were 3 fold-diluted by triplicate. Both, the reagent vial and the
samples tube, were placed in the available racks in the ABX Pentra C200 analyzer in
order to start the assay.
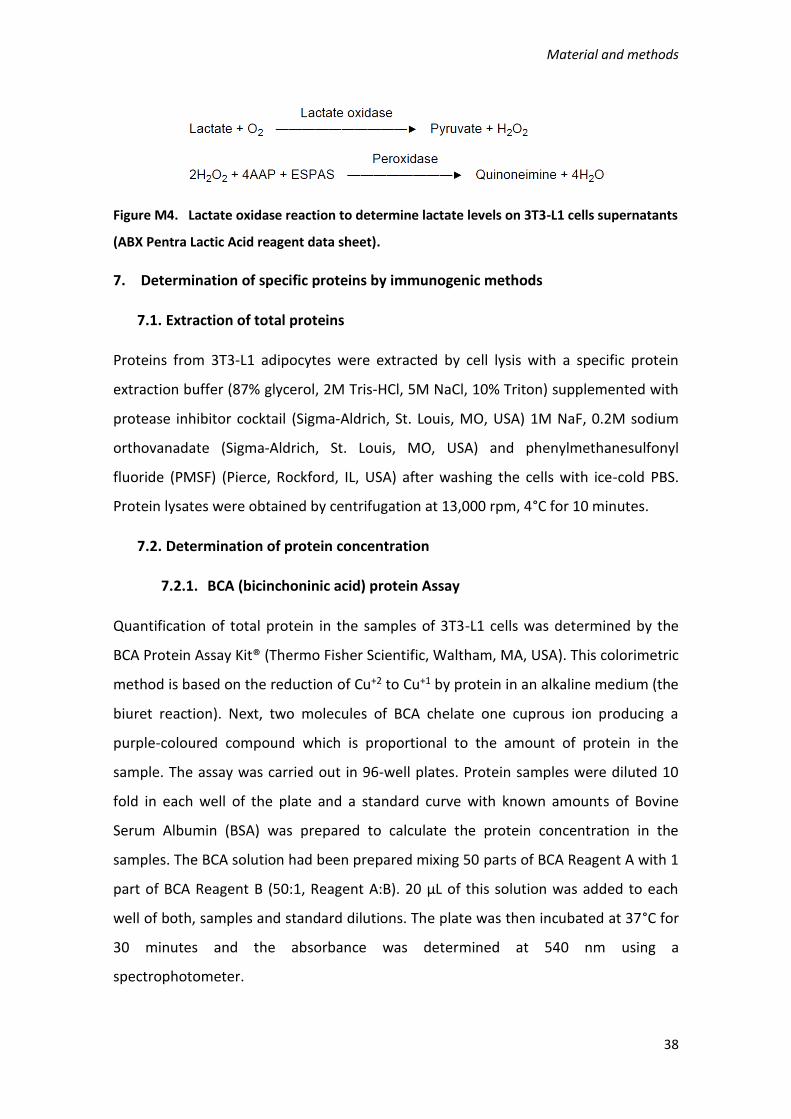
Material and methods
38
Figure M4. Lactate oxidase reaction to determine lactate levels on 3T3-L1 cells supernatants
(ABX Pentra Lactic Acid reagent data sheet).
7. Determination of specific proteins by immunogenic methods
7.1. Extraction of total proteins
Proteins from 3T3-L1 adipocytes were extracted by cell lysis with a specific protein
extraction buffer (87% glycerol, 2M Tris-HCl, 5M NaCl, 10% Triton) supplemented with
protease inhibitor cocktail (Sigma-Aldrich, St. Louis, MO, USA) 1M NaF, 0.2M sodium
orthovanadate (Sigma-Aldrich, St. Louis, MO, USA) and phenylmethanesulfonyl
fluoride (PMSF) (Pierce, Rockford, IL, USA) after washing the cells with ice-cold PBS.
Protein lysates were obtained by centrifugation at 13,000 rpm, 4°C for 10 minutes.
7.2. Determination of protein concentration
7.2.1. BCA (bicinchoninic acid) protein Assay
Quantification of total protein in the samples of 3T3-L1 cells was determined by the
BCA Protein Assay Kit® (Thermo Fisher Scientific, Waltham, MA, USA). This colorimetric
method is based on the reduction of Cu+2 to Cu+1 by protein in an alkaline medium (the
biuret reaction). Next, two molecules of BCA chelate one cuprous ion producing a
purple-coloured compound which is proportional to the amount of protein in the
sample. The assay was carried out in 96-well plates. Protein samples were diluted 10
fold in each well of the plate and a standard curve with known amounts of Bovine
Serum Albumin (BSA) was prepared to calculate the protein concentration in the
samples. The BCA solution had been prepared mixing 50 parts of BCA Reagent A with 1
part of BCA Reagent B (50:1, Reagent A:B). 20 µL of this solution was added to each
well of both, samples and standard dilutions. The plate was then incubated at 37°C for
30 minutes and the absorbance was determined at 540 nm using a
spectrophotometer.
Material and methods
39
7.2.2. Bradford Protein Assay
Quantification of total protein in the samples of HAoEC cells and adipose tissues
extracted from mice was determined using the Bradford Protein Assay Kit® (Bio-Rad
Laboratories, Hercules, CA, USA). This method involves the binding of Coomassie
Brilliant Blue G-250 dye to proteins. Under acidic conditions, the dye is predominantly
in the doubly protonated red cationic form (Amax = 470 nm). However, when the dye
binds to protein, it is converted to a stable unprotonated blue form (Amax = 595 nm).
This blue protein-dye form is proportional to the amount of protein in the sample.
Samples were prepared pipetting 20 µL of each into disposable cuvettes. As in the
previous procedure a standard curve with known amounts of BSA was prepared. 1 mL
of 1X reagent dye was added to each cuvette and incubated at room temperature
them for 5 minutes. The absorbance was determined at 595 nm using a
spectrophotometer or microplate reader.
7.3. Western Blot
Protein lysates were mixed with loading buffer 4X and denatured by heating at 95°C
for 5 minutes. Denatured proteins were resolved in a SDS-PAGE minigels on a Mini-
PROTEAN Tetra Cell electrophoresis system (Bio-Rad Laboratories, Hercules, CA, USA)
at 130 mV for 90 minutes. Gels were then electroblotted using a Mini Trans Blot® Cell
(Bio-Rad Laboratories, Hercules, CA, USA) onto nitrocellulose membranes (Hybond-C
Extra, Amersham-Pharmacia, UK). The membranes were blocked with 5% milk or 5%
Bovine Serum Albumin in Tris-buffered saline with 0.1% Tween 20 (0.1% TBST) and
incubated with specific primary antibodies against HIF-1, Cav-1, Cav-1-Phospho-Tyr14,
PTRF/Cavin-1, SDPR/Cavin-2, beta subunit of insulin receptor (IRβ), IRβ-Phospho-
Tyr1146, GLUT4, GLUT1, and β-Actin. Detailed information about antibodies and
incubation condition is summarized on table M1. Next, the membranes were washed
three times with TBST to remove not bound antibodies before incubating them with
the correspondent horseradish peroxidase (HRP)-conjugated secondary antibody at
the appropriate dilution. Finally, after three washing steps, specific immunoreactive
bands were detected by a chemiluminescent ECL assay kit (Lumi-Light plus, Roche
Diagnostic, Mannheim, Germany). β-actin (Sigma-Aldrich, St Louis, MO, USA) was used
as an invariant internal control for normalization of protein expression.
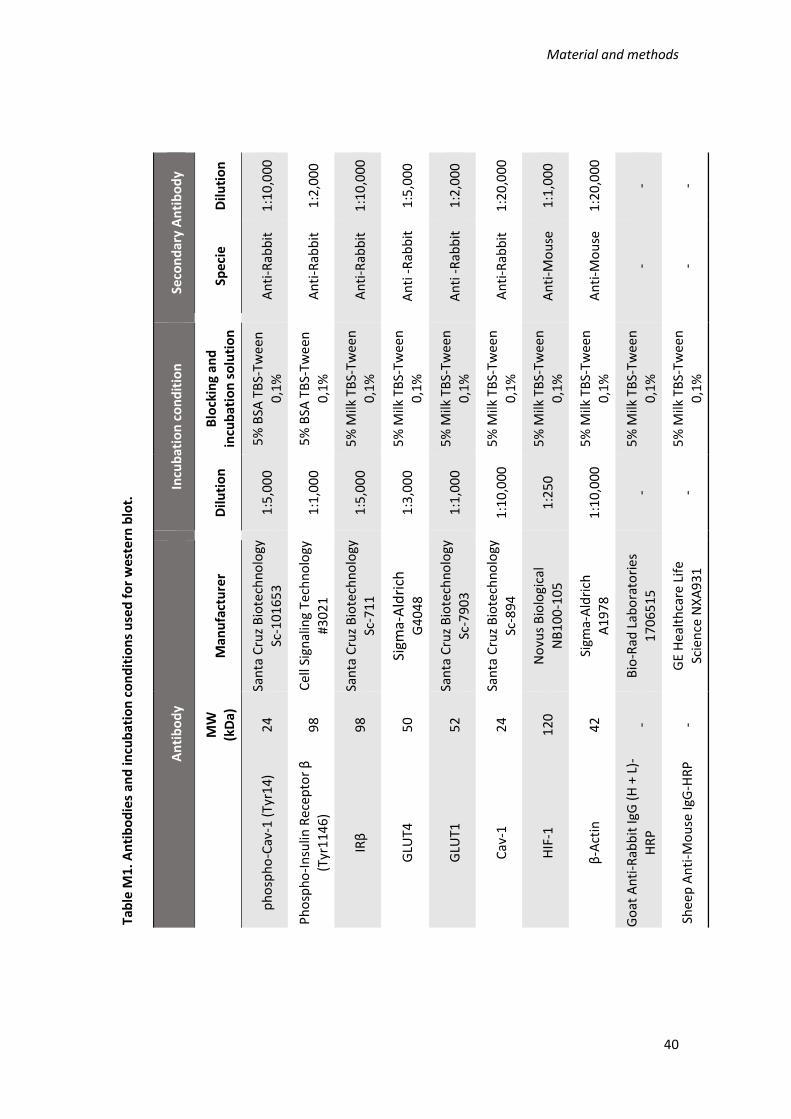
Material and methods
40
Seco
nd
ary
An
tib
od
y
Dilu
tio
n
1:1
0,0
00
1:2
,00
0
1:1
0,0
00
1:5
,00
0
1:2
,00
0
1:2
0,0
00
1:1
,00
0
1:2
0,0
00
- -
Spec
ie
An
ti-R
abb
it
An
ti-R
abb
it
An
ti-R
abb
it
An
ti -
Rab
bit
An
ti -
Rab
bit
An
ti-R
abb
it
An
ti-M
ou
se
An
ti-M
ou
se
- -
Incu
bat
ion
co
nd
itio
n
Blo
ckin
g an
d
incu
bat
ion
so
luti
on
5%
BSA
TB
S-Tw
een
0
,1%
5%
BSA
TB
S-Tw
een
0
,1%
5%
Milk
TB
S-Tw
een
0
,1%
5%
Milk
TB
S-Tw
een
0,1
%
5%
Milk
TB
S-Tw
een
0
,1%
5%
Milk
TB
S-Tw
een
0
,1%
5%
Milk
TB
S-Tw
een
0,1
%
5%
Milk
TB
S-Tw
een
0
,1%
5%
Milk
TB
S-Tw
een
0
,1%
5%
Milk
TB
S-Tw
een
0
,1%
Dilu
tio
n
1:5
,00
0
1:1
,00
0
1:5
,00
0
1:3
,00
0
1:1
,00
0
1:1
0,0
00
1:2
50
1:1
0,0
00
- -
An
tib
od
y
Man
ufa
ctu
rer
San
ta C
ruz
Bio
tech
no
logy
Sc-1
01
65
3
Cel
l Sig
nal
ing
Tech
no
logy
#3
02
1
San
ta C
ruz
Bio
tech
no
logy
Sc
-71
1
Sigm
a-A
ldri
ch
G4
04
8
San
ta C
ruz
Bio
tech
no
logy
Sc-7
90
3
San
ta C
ruz
Bio
tech
no
logy
Sc-8
94
No
vus
Bio
logi
cal
NB
10
0-1
05
Sigm
a-A
ldri
ch
A
19
78
Bio
-Rad
Lab
ora
tori
es
17
06
51
5
GE
Hea
lth
care
Lif
e Sc
ien
ce N
XA
93
1
MW
(kD
a)
24
98
98
50
52
24
120
42 - -
ph
osp
ho
-Cav
-1 (
Tyr1
4)
Ph
osp
ho
-In
sulin
Re
cep
tor
β
(Tyr
114
6)
IRβ
GLU
T4
GLU
T1
Cav
-1
HIF
-1
β-A
ctin
Go
at A
nti
-Rab
bit
IgG
(H
+ L
)-H
RP
Shee
p A
nti
-Mo
use
IgG
-HR
P
Tab
le M
1. A
nti
bo
die
s an
d in
cub
atio
n c
on
dit
ion
s u
sed
fo
r w
este
rn b
lot.

Material and methods
41
7.4. Immunofluorescence (IF)
7.4.1. HAoEC cells
Cellular location of Cav-1 and PTRF/Cavin-1 in HAoEC after incubation in hypoxia was
determined by immunofluorescence (IF). Cells were seeded in 6-well plates with
coverslips for IF. The day of the experiment, cells were washed 3 times with Dulbecco's
phosphate-buffered saline (DPBS) (Gibco™ Invitrogen Corporation, Grand Island, NY,
USA) and fixed with 4% paraformaldehyde (Thermo Fisher Scientific, Waltham, MA,
USA) for 15 minutes at room temperature. After 3 washes with DPBS to remove the
fixative solution, cells were permeabilized and blocked with 0.1% saponin and 0.2%
gelatin in PBS buffer during 10 minutes. Next, each coverslip was incubated with
specific primary antibody against Cav-1 (Santa Cruz Biotechnology, 1:200), PTRF
(Millipore, MA, USA; 1:200) diluted in a buffer containing 0.01% saponin, 0.2% gelatin
and 0.02% sodium azide in PBS (SG/PBS Buffer). The incubation was carried out in a
moist chamber overnight at 4°C. Coverslips were then washed 3 times with SG/PBS
buffer and incubated with suitable fluorescent secondary antibody, anti-Rabbit
(1:500), in a moist chamber for 1 hour at room temperature. Coverslips were washed 4
times with DPBS and placed in the microscope slide over a drop of mowiol® (Sigma-
Aldrich, St Louis, MO, USA) mounting medium and visualized in a confocal laser
fluorescence microscopy (Zeiss LSM 710, Oberkochen, Alemania).
7.4.2. 3T3-L1 adipocytes
For Cav-1 and GLUT4 location in 3T3-L1 adipocytes by IF, cells were seeded over
coverslips. The day of the experiments, cells were washed three times with DPBS and
then fixed with 4% paraformaldehyde (Thermo Fisher Scientific, Waltham, MA, USA)
for 15 minutes and permeabilized for 20 minutes with 0.1% Triton X-100. Cells were
then incubated with specific primary antibody against Cav-1 (Santa Cruz, 1:200) and
GLUT4 (Sigma-Aldrich, St. Louis, MO, USA; 1:200) in 1X DPBS with 1% gelatin.
Incubation was performed at room temperature for 1 hour. After three washes with a
solution of 1X DPBS and 1% gelatin, cells were incubated with Alexa Fluor 633 Goat
anti-Rabbit IgG (H+L) secondary antibody (Thermo Fisher Scientific, Waltham, MA,
USA) for 1 hour at room temperature. Coverslips were washed 4 times with DPBS and
Material and methods
42
placed in the microscope slide over a drop of mounting media with Dapi (Sigma-
Aldrich, St Louis, MO, USA) and visualized in a LSM 800 confocal laser-scanning
microscope (Zeiss, Jena, Germany).
8. Extraction and analysis of RNA
8.1. Total RNA extraction
8.1.1. 3T3-L1 adipocytes
RNA extraction was carried out with TRIzol® Reagent (Invitrogen, Carlsbad, CL, USA)
according to manufacturer’s instructions. Cells were lysed with 1 mL of TRIzol using a
cell scraper and then incubated for 5 minutes at room temperature. 200 µL of
chloroform was added to each sample and mixed vigorously by inversion. After 5
minutes of incubation at room temperature, the samples were centrifuged at 12,000 g,
4°C for 15 minutes. The resulting colourless upper aqueous phase containing the RNA
was removed carefully and placed in a new 1.5 mL tube previously filled with 1 mL of
isopropanol. The mixture was incubated overnight at -20°C to increase RNA
precipitation. Samples were next centrifuged at 12,000 g, 4°C for 15 minutes. The
resulting pellet was washed with 1 mL of cold 75% ethanol by vortexing and
subsequently centrifuged at 7,500 g for 5 minutes. Total RNA pellet was air-dried and
resuspended in 15 µL of RNase free water. RNA concentration of the samples was
measured using the NanoDrop spectrophotometer (Thermo Fisher Scientific, Waltham,
MA, USA) and stored at -80°C for further applications.
8.1.2. HAoEC and adipose tissue samples
RNA extraction of HAoEC cells and adipose tissue samples submitted to intermittent
hypoxia was carried out using the RNeasy mini kit (Qiagen N.V, Hilden, Germany).
Samples were harvested with 1 mL of QIAzol lysis reagent (Qiagen N.V, Hilden,
Germany) and placed in 1.5 ml tubes. 1 mL of 70% ethanol was added to the lysate and
transferred to an RNeasy mini spin column. Columns were centrifuged at 8,000 x g for
15 seconds and the flow-through was discarded. DNase treatment was carried out on-
column according to manufacturer’s instruction (Qiagen N.V, Hilden, Germany). To
wash the column, 350 µL Buffer RW1 was added followed by centrifugation for 15
seconds at 8,000 x g. 80 µL DNase I mix containing 10 µL DNase I and 70 µL Buffer RDD,

Material and methods
43
was added to each column and incubated at the benchtop for 15 minutes. After that
time, 350 µL Buffer RW1 was added to each column and then centrifuged at 8,000 x g
for 15 seconds. Two washes with 500 µL Buffer RPE were performed, the first one at
8,000 x g for 15 seconds and the second one at 8,000 x g for 2 minutes. The columns
were totally dried by placing them in a new 2 mL collection tube and centrifuged at
16,000 x g for 1 minute. Finally, RNA was eluted by adding 30 µL of RNase-free water
to each column. The columns were then placed in new 1.5 mL collection tubes and
centrifuged at 8,000 x g for 1 minute. The RNA concentration of the samples was
measured using the NanoDrop® spectrophotometer (Thermo Fisher Scientific,
Waltham, MA, USA) and stored at -80°C for further applications.
8.2. Treatment with DNase
RNA samples were treated with Ambion® DNase-free Kit (Thermo Fisher Scientific,
Waltham, MA, USA) before the reverse transcription to avoid genomic DNA
contamination. For this purpose, 2 µg of total RNA were diluted to 8 µL with RNase
free water. Next, 2 µL of a mixture containing 1 volume of 10X DNase I Buffer and 1
volume of rDNase I was added to each RNA sample. The samples were then incubated
at 37°C for 30 minutes in a thermocycler (GeneAmp®PCR System 9600, Roche
Diagnostic System). Then, 2 µL of resuspended DNase Inactivation Reagent were added
to each sample and centrifuged at 10,000 g for 1 minute. The supernatants were
transferred to a new 0.5 mL PCR tube to continue with the reverse transcription
reaction.
8.3. Reverse transcription
8.3.1. 3T3-L1 adipocytes
Synthesis of cDNA from RNA samples was carried out using M-MLV Reverse
Transcriptase kit (Invitrogen, Carlsbad, CA, USA) following manufacturer’s instruction.
Briefly, 3 µL of a mix composed by 20 µg/mL Random Primers (Invitrogen, Carlsbad,
CA, USA) and 10 Mm dNTP mix (dATP, dGTP, dCTP and dTTP) were added to each tube.
Samples were heated at 65°C for 5 minutes in a thermocycler (GeneAmp®PCR System
9600, Roche Diagnostic System) and then chilled on ice quickly. After a brief spin in a
picofuge, 7 µL of a mix composed by 4 µL First-Strand Buffer (5X), 2 µL DTT (0.1 M) and

Material and methods
44
1µL RNase OUT™ Recombinant Ribonuclease Inhibitor (40 units/µL) were added to
each tube, followed by incubation at 37°C for 2 minutes. Finally, 1 µL (200 units) of M-
MLV RT was added to each sample which were then incubated in turn at 25°C for 10
minutes; 37°C for 50 minutes and at the end at 70°C for 15 minutes to inactivate the
enzyme. The cDNA was stored at -20°C until further applications.
8.3.2. HAoEC and adipose tissue samples
Total RNA (500 ng) from HAoEC cells and adipose tissue samples, subjected to
intermittent hypoxia, was reverse transcribed using random hexamers and oligo(dT)
primers and PrimeScriptTM RT reagent Kit (Takara/Clontech, Mountain View, CA). The
following mix reaction was prepared on ice (Table M2).
Table M2. Master mix for reverse transcription of RNA samples using PrimeScriptTM RT
reagent Kit°°
Reagent Volume (µL)
Reaction Final
Concentration/Amount
5 × PrimeScriptTM Buffer 2 1X
PrimeScriptTM RT Enzyme Mix I 0.5
Oligo(dT) Primers (50 μM) 0.5 25 pmol
Random Hexamers (100 μM) 0.5 50 pmol
Total RNA x 500 ng
RNase-Free Water x x
Final Volume: 10 µL
Reaction mixtures were incubated at 37℃ for 15 minutes followed by an inactivation
step of the enzyme at 85℃ for 5 seconds. The reaction was performed in a
thermocycler. The samples were stored at -20°C until further application.

Material and methods
45
8.4. Real time Polymerase Chain Reaction (RT-PCR)
Gene expression was assessed by reverse transcription quantitative polymerase chain
reaction (RT-qPCR).
8.4.1. Real time PCR: Taqman probes reaction protocol
The expression analysis of 3T3-L1 genes was performed using predesigned TaqMan®
probes described in table M3. The genes and probes used in the assays are
summarized in table M2. cDNA was amplified in an ABI Prism 7300 HT Sequence
Detection System (Applied Biosystems, Foster city, CA, USA), using the TaqMan®
Universal PCR Master Mix (Applied Biosystems, Foster city, CA, USA) according to
standard conditions: 50°C for 2 minutes and 95°C for 10 minutes, followed by 40 cycles
of 15 seconds at 95°C and 1 minutes at 60°C. Cyclophilin (Ppia) was used as invariant
internal control for RT-PCR and subsequent normalization. Relative quantification of
gene expression was calculated by the 2-ΔΔCt method (Bustin, 2000).
Table M3. Gene probes used in Taqman® reaction protocol.
Gene Tqman® probe
Insr Mm_01211875_m1
Akt2 Mm02026778_g1
Slc2a4 Mm00436615_m1
Slc2a1 Mm 00441480_m1
Cav-1 Mm_00483057_m1
Cav-2 Mm 01129337_g1
Sdpr Mm 00507087_m1
Adipoq Mm 00456425_m1
Pparg Mm 00440940_m1
Cbpa Mm 00514283_s1
Pi3kr3 Mm 00725026_m1
Ppia Mm 02342430
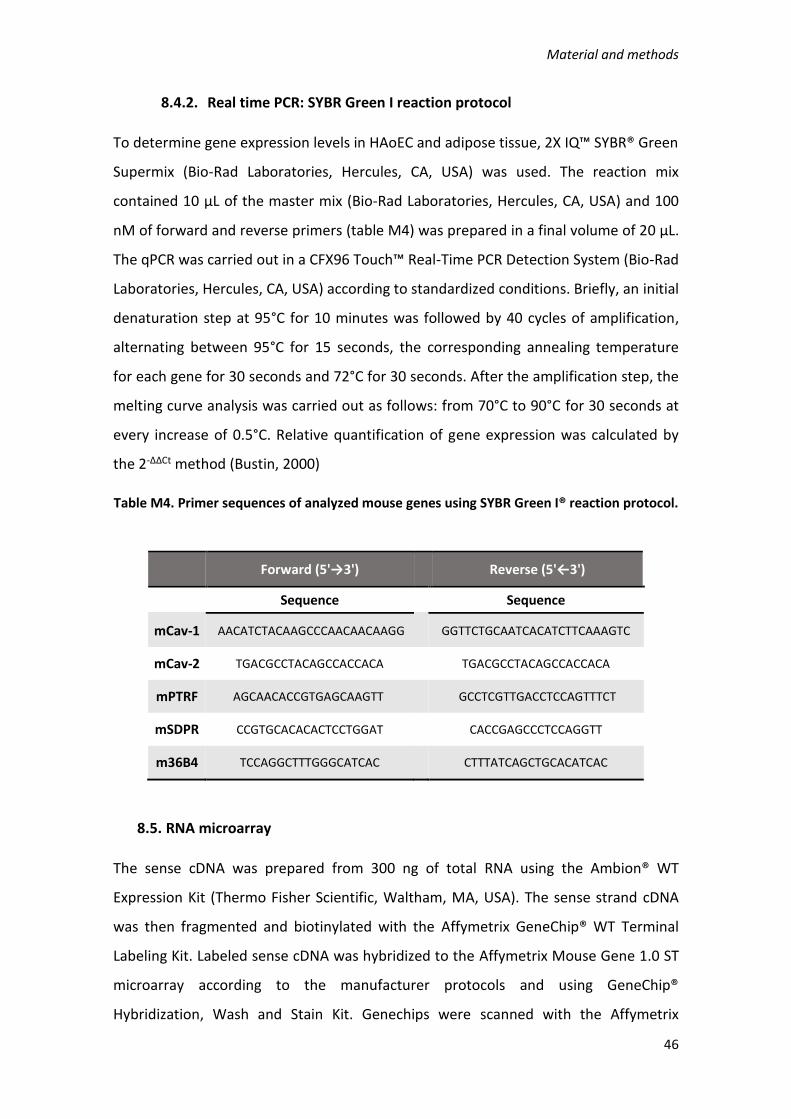
Material and methods
46
8.4.2. Real time PCR: SYBR Green I reaction protocol
To determine gene expression levels in HAoEC and adipose tissue, 2X IQ™ SYBR® Green
Supermix (Bio-Rad Laboratories, Hercules, CA, USA) was used. The reaction mix
contained 10 μL of the master mix (Bio-Rad Laboratories, Hercules, CA, USA) and 100
nM of forward and reverse primers (table M4) was prepared in a final volume of 20 μL.
The qPCR was carried out in a CFX96 Touch™ Real-Time PCR Detection System (Bio-Rad
Laboratories, Hercules, CA, USA) according to standardized conditions. Briefly, an initial
denaturation step at 95°C for 10 minutes was followed by 40 cycles of amplification,
alternating between 95°C for 15 seconds, the corresponding annealing temperature
for each gene for 30 seconds and 72°C for 30 seconds. After the amplification step, the
melting curve analysis was carried out as follows: from 70°C to 90°C for 30 seconds at
every increase of 0.5°C. Relative quantification of gene expression was calculated by
the 2-ΔΔCt method (Bustin, 2000)
Table M4. Primer sequences of analyzed mouse genes using SYBR Green I® reaction protocol.
Forward (5'→3') Reverse (5'←3')
Sequence
Sequence
mCav-1 AACATCTACAAGCCCAACAACAAGG GGTTCTGCAATCACATCTTCAAAGTC
mCav-2 TGACGCCTACAGCCACCACA
TGACGCCTACAGCCACCACA
mPTRF AGCAACACCGTGAGCAAGTT GCCTCGTTGACCTCCAGTTTCT
mSDPR CCGTGCACACACTCCTGGAT
CACCGAGCCCTCCAGGTT
m36B4 TCCAGGCTTTGGGCATCAC CTTTATCAGCTGCACATCAC
8.5. RNA microarray
The sense cDNA was prepared from 300 ng of total RNA using the Ambion® WT
Expression Kit (Thermo Fisher Scientific, Waltham, MA, USA). The sense strand cDNA
was then fragmented and biotinylated with the Affymetrix GeneChip® WT Terminal
Labeling Kit. Labeled sense cDNA was hybridized to the Affymetrix Mouse Gene 1.0 ST
microarray according to the manufacturer protocols and using GeneChip®
Hybridization, Wash and Stain Kit. Genechips were scanned with the Affymetrix

Material and methods
47
GeneChip® Scanner 3000. Both background correction and normalization were done
using RMA (Robust Multichip Average) algorithm (Irizarry et al., 2003). After quality
assessment, a filtering process was performed to eliminate low expression probe sets.
Applying the criterion of an expression value greater than 16 in 3 samples for each
experimental condition (normoxia and hypoxia), 24819 probe sets were selected for
statistical analysis. R and Bioconductor were used for preprocessing and statistical
analysis (Gentleman, 2005). LIMMA (Linear Models for Microarray Data) was used to
find out the probe sets that showed significant differential expression between
experimental conditions (Smyth, 2004). Adjusted p value was calculated with
Benjamini-Hochberg procedure. Genes were selected as significant using criteria of B>
5. The Log Odds or B value is the odds or probability that the gene is differentially
expressed, meaning that a gene with B=0 has a 50% chance to be differentially
expressed. Functional enrichment analysis of Gene Ontology (GO) categories was
carried out using standard hypergeometric test.
9. Extraction and analysis of DNA
9.1. Chromatin Immunoprecipitation (ChIP) assay
The ChIP-IT Express Enzymatic Kit (Active Motif, Carlsbad, California) was used to
determine the binding of HIF-1 to Hypoxia Response Elements (HRE) in 3T3-L1
adipocytes after hypoxia treatment. Fig M5 summarizes the process, which was carried
out according to the manufacturer’s instructions. Briefly, cells were fixed with 4%
formaldehyde to fix protein/DNA interactions and then sheared by enzymatic
digestion. Sheared chromatin was incubated with a specific antibody against HIF-1, and
antibody-bound protein/DNA complexes were precipitated using magnetic Protein G-
coupled beads. The precipitated chromatin was then eluted and the cross links
between proteins and DNA reversed. The recovered DNA was analyzed by qPCR and
specific primers to identify DNA HREs.

Material and methods
48
Figure M5. Flow chart of ChIP process using the ChIP-IT Express® Enzymatic Kit.
9.1.1. Preparation of sheared chromatin
9.1.1.1. Cell fixation
3T3-L1 cells were growth in 15 cm plates, differentiated for 8 days and incubated for
48 hours in hypoxia as previously described. Before harvesting the cells the following
solutions were freshly prepared:
Volumes for 1 plate of 15 cm.
Formaldehyde 1% (Fixation Solution):
19.46 mL DPBS 1X (Invitrogen, Carlsbad, CL, USA)
540 µL 36.5% formaldehyde (Sigma-Aldrich, St. Louis, MO, USA)
Glycine Stop-Fix Solution
8 mL sterile H2O
1 mL glycine (Sigma-Aldrich, St. Louis, MO, USA)
1 mL 10X PBS (Active Motif, Carlsbad, California)
Cell Scraping Solution
4.5 mL sterile H2O
0.5 mL 10X PBS (Active Motif, Carlsbad, California)
25 µL PMSF (was added just before use) (Sigma-Aldrich, St. Louis, MO, USA)

Material and methods
49
The medium was removed and cells were washed with cold DPBS 1X (Invitrogen,
Carlsbad, CL, USA). 20 mL of fixation solution was added to each plate and incubated
for 10 minutes at room temperature. The fixative solution was poured off and cells
were washed with ice-cold DPBS before the addition of 10 mL Glycine stop-fix solution
to each plate. After 5 minutes of incubation, the glycine stop-fix solution was removed
and cells were washed again with ice-cold DPBS 1X. Cells of each plate were harvested
with 5 mL ice-cold Cell Scraping Solution and collected in 15 mL conical tubes. Next,
the tubes were centrifuged at 720 x g for 10 minutes at 4°C to pellet the cells. The
supernatants were subsequently removed and discarded and the pellets were stored
at -80°C after the addition of 1 µL 100 mM PMSF and 1 µL PIC until the chromatin
shearing step was performed.
9.1.1.2. Chromatin shearing
For chromatin shearing, pellets were thawed on ice and resuspended in 1 mL ice-cold
lysis buffer supplied by the kit (Active Motif) and supplemented with 5 µL PIC and 5 µL
PMSF. The tubes were vortexed and incubated on ice for 30 minutes. During this
incubation, a working stock of Enzymatic Shearing Cocktail (200 U/mL) was prepared
by diluting the supplied Enzymatic Shearing Cocktail 1:100 with 50% glycerol in dH2O.
Cells of each tube were transferred to an ice-cold Dounce homogenizer and
homogenized on ice with 10 strokes to aid in nuclei release. Cells were then
transferred to a 1.5 mL microcentrifuge tube and centrifuged for 10 minutes at 2,400 x
g at 4°C to pellet the nuclei. Supernatant was removed from each tube and the pellet
was resuspended in 350 µL Digestion Buffer supplied by the kit and supplemented with
1.75 µL PIC and 1.75 µL PMSF. After 5 minutes of incubation at 37°C, 17 µL of the
working stock of Enzymatic Shearing Cocktail (200 U/mL) was added to each tube. The
incubation time for efficient chromatin shearing for this experiment was optimized to
15 minutes at 37°C. The reaction was then stopped by adding 7 µL ice-cold 0.5 M EDTA
to each tube and placing them on ice for 10 minutes. Next, the sheared chromatin
samples were centrifuged for 10 minutes at 18,000 x g at 4°C. Supernatant was
carefully transferred to a new 1.5-mL microcentrifuge tube and distributed as follows:
10 µL to carry out the INPUT. Stored at -20°C.

Material and methods
50
25 µL to carry out the CLEANUP step to validate shearing efficiency. Stored at -
20°C.
140 µL for the immunoprecipitation step. Stored -80°C.
9.1.2. DNA clean-up
The 25 µL aliquots of sheared chromatin were thawed and the volume was adjusted to
200 µL with dH2O. When all samples were ready, 10 µL 5M NaCl was added to each
tube and heated at 65°C overnight to reverse the protein/DNA cross links. The next
day, 1 µL RNase A was added to each sample, which were then incubated at 37°C for
15 minutes. After a brief spin in a picofuge, 10 µL Proteinase K (Active Motif, Carlsbad,
California) was added to each sample followed by incubation at 42 °C for 1.5 hours.
9.1.2.1. DNA extraction
After proteinase K incubation, DNA from each sample was phenol/chloroform
extracted and precipitated following manufacturer’s instruction. Briefly, 200 µL of
Ultrapure™ Phenol:Chloroform:Isoamyl Alcohol (25:24:1) pH 8.0 (Thermo Fisher
Scientific, Waltham, MA, USA) was added to each sample and centrifuged at 13,000 x g
for 10 minutes at 4°C. The supernatants (aqueous phase) were then transferred to a
fresh microcentrifuge tube and 20 µL 3M sodium acetate pH 5.2 and 500 µL absolute
ethanol were added and mixed by vortex. The mix was stored at -20°C overnight in
order to precipitate the DNA. The next day, samples were centrifuged at 16,000 x g for
10 minutes at 4°C. The supernatants were removed and discarded and the pellets were
washed with 500 µL 70% of ice-cold ethanol. The samples were again centrifuged at
16,000 x g speed for 5 minutes, the supernatants were removed and the pellets were
allowed to air dry before resuspending them in 30 µL dH2O. DNA concentration of each
sample was determined in a NanoDrop® Spectrophotometer ND-1000. In order to
verify fragmentation efficiency, 500 ng Clean Up-DNA was loaded and resolved in a 1%
agarose gel at 100 mV for 50 minutes. The band pattern was visualized using a Bio-Rad
ChemiDoc XRS System.

Material and methods
51
9.1.3. Chromatin immunoprecipitation
For immunoprecipitation, 5 µg of chromatin from each sample was used. The antibody
against HIF-1α (H1alpha67, Novus Biologicals) used for this experiment has been ChIP-
validated previously and 3 µg was used for each sample. The procedure followed was
according to manufacturer’s instruction.
Fixed and sheared chromatin samples stored at -80°C were thawed on ice and the
immunoprecipitation reactions were prepared as shown in table M4.
Table M5. Composition of immunoprecipitation reaction mix.
Reactive < 60 µl Chromatin >60 µl Chromatin
dH2O (q.s.)* 100 µL 200 µL
ChIP Buffer 10X 10 µL 20 µL
Proteinase Inhibitor Cocktail 1 µL 1 µL
Chromatin (5 µg) 20-60 µL 61-100 µL
Protein G-Magnetic Beads 25 µL 25 µL
6- Antibody (3 µg) 1-3 µg (2.5 µL) 1-3 µg (2.5 µL)
Final Volume 100 µl 200 µl
*q.s.: “quantum sufficit”/quantity required
The volume of each reagent was according to chromatin concentration determined in
the Clean-Up step. If the volume of chromatin necessary for 5 µg is less than 60 µL, the
final volume of the reaction is 100 µL. If the volume of chromatin is more than 60 µL,
the final volume of the reaction is 200 µL.
Once the immunoprecipitation reaction mixes were prepared, the tubes were placed
on a tube rotator and incubated overnight at 4 °C. After incubation, the tubes were
briefly centrifuged and placed on a magnetic stand to pellet the beads. The
supernatants were discarded and the beads were washed once with 800 µL ChIP Buffer
1 and then twice with 800 µL ChIP Buffer 2. Next, the beads were resuspended with 50
µL Elution Buffer AM2 and incubated 15 minutes at room temperature in a tube
rotator before 50 µL of the Reverse Cross-linking Buffer were added to the eluted
chromatin. The beads were then precipitated using the magnetic bar and the
supernatants which contained the chromatin, were transferred to a fresh tube. At this
Material and methods
52
time, the inputs of all samples were prepared as follows: 500 ng of input DNA aliquots
obtained in the chromatin shearing step were mixed with the required volume of ChIP
Buffer 2 to reach 98 µl and added together with 2 µl of NaCl.
The ChIP and Input DNA samples were incubated then at 95°C for 15 minutes in a
thermocycler (Bio-Rad Laboratories, Hercules, CA, USA) and 2 µL Proteinase K was
added to each tube. The samples were incubated then at 37°C for 1 hour and the
reaction was stopped by adding 2 µL Proteinase K Stop Solution. The DNA samples
obtained were stored at -20°C until the qPCR analysis.
9.1.4. PCR analysis
A potential HRE (5’-[AG]CGTG-3’) for the binding of HIF-1α to the Cav-1 promoter was
previously identified by a bioinformatic analysis with TRANSFAC® of the NCBI sequence
NC_000072.6. The HRE is located at -442 upstream transcription starting site (TSS) and
was amplified and quantified by RT-qPCR in the immunoprecipitated samples with the
following pair of primers: Fw-CCCAGCCATCTCGCTTCTAT and Rv-
CCCAGCCATCTCGCTTCTAT. A mix containing SYBR Green Master Mix 2X (Bio-Rad
Laboratories, Hercules, CA, USA), 10 µM Primers Mix (Sigma-Aldrich, St. Louis, MO,
USA) and the immunoprecipitated or the input DNA was prepared in a final volume of
20 µL. The RT-qPCR was carried out in a 7300 Fast Real-Time PCR System (Applied
Biosystems, Foster city, CA, USA) under optimal conditions. An initial denaturation step
at 95 °C for 10 minutes was followed by 45 cycles of amplification, alternating between
95 °C for 15 seconds and 65°C (annealing temperature) for 1 minute. After the
amplification step, the melting curve analysis was carried out as follows: from 70 °C to
90 °C, 15 seconds at every increase of 0.5 °C. Relative quantification of gene expression
was calculated by the 2-ΔΔCt method (Bustin, 2000).
10. Statistical analysis
All data are represented as the mean ± standard deviation. Once normality and
homogeneity of variance analysis were assessed, a parametric or nonparametric
analysis was selected. Statistically significant differences among three or more groups
were analysed by one-way analysis of variance (ANOVA) or two-way ANOVA, followed
by Tukey post-hoc analysis. Comparisons between two groups were carried out by t-

Material and methods
53
test (as parametric test) or by Mann-Witney U test (as nonparametric test). The
significance level was set to p <0.05 and classified by asterisks as follows: p < 0.05 (*); p
< 0.01 (**); p < 0.001 (***). The statistical analysis was calculated through GraphPad
Prism software for Windows (version 5.04).


RESULTS


Results
57
RESULTS
1. Effect of hypoxia on 3T3-L1 adipocytes.
1.1. Continuous hypoxia inhibits adipogenesis in 3T3-L1 adipocytes
In order to study how hypoxia could affect the differentiation process of 3T3-L1 pre-
adipocytes, we established a continuous hypoxia model. 3T3-L1 cells were
differentiated in hypoxia (1% O2) during 10 days, starting at the first day after the
hormonal cocktail was added (day 0). At the end of this period mRNA and protein
samples were extracted for analysis. Hypoxic response of the cells was confirmed by
measuring HIF-1 α expression by western blot. As expected, HIF-1α protein expression
was significantly induced in 3T3-L1 cells (P<0.05) after 10 days of incubation under
hypoxia (Fig R1).
Figure R1. HIF-1α protein expression is induced during 3T3-L1 differentiation after 10 days of incubation under hypoxia. 3T3-L1 preadipocytes were treated with the differentiation hormonal cocktail and incubated in hypoxia (1% O2) throughout the differentiation process. After 10 days, HIF-1α protein expression level was determined by western blot. Values were normalized to β-actin and mean of fold change vs normoxia condition ± SEM was represented (n=3). * P<0.05. N: Normoxia; CH: Continuous Hypoxia.
The main phenotypic feature of mature adipocytes is the accumulation of fat in the
cytoplasm. Therefore, in order to estimate the effect of hypoxia on the adipogenesis
process, we determined the triglyceride content of the cells using ORO staining.
Incubation of 3T3-L1 cells in hypoxia (1% O2) throughout the differentiation process

Results
58
strongly reduced triglyceride accumulation (P<0.001) when compared to cells
maintained in normoxia (Fig R2).
Figure R2. Anti-adipogenic effect of hypoxia during 3T3-L1 cells differentiation. ORO staining of 3T3-L1
cells differentiated in hypoxia (1% O2) for 10 days. Stained cells were photographed and ORO staining
was quantified measuring the absorbance at 540 nm. Means of fold change ± SEM are represented for
each group (n=6). ***P<0.001.
To investigate the status of insulin signaling in 3T3-L1 cells after the differentiation
process, expression of insulin signaling-related genes was determined by RT-PCR. Insr
(IR; P<0.05), Akt2 (Akt2/PKB; P<0.01) and Slc2a4 (GLUT4; P<0.001), mRNAs were
downregulated in 3T3-L1 cells differentiated in hypoxia for 10 days compared to cells
cultured under normoxia (Fig R3A). Moreover, protein expression of insulin receptor
determined by western blot was also significantly reduced (P<0.05) after continuous
incubation in hypoxia (Fig R3B).
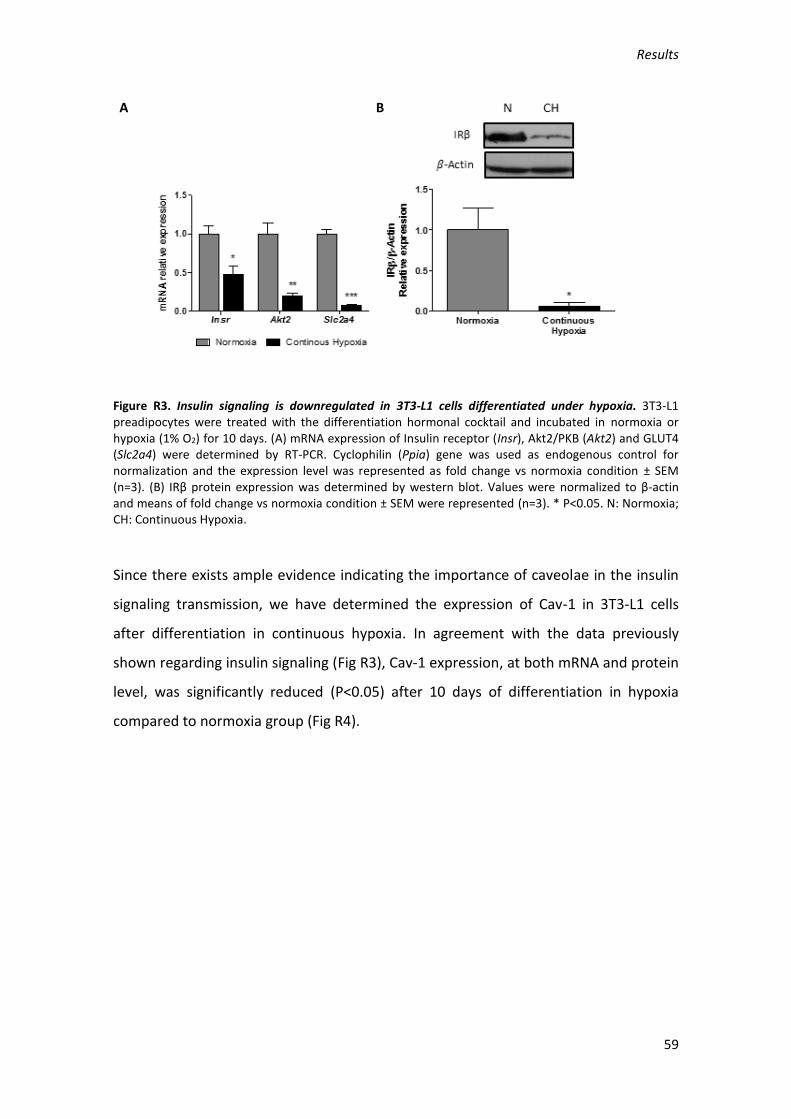
Results
59
Figure R3. Insulin signaling is downregulated in 3T3-L1 cells differentiated under hypoxia. 3T3-L1 preadipocytes were treated with the differentiation hormonal cocktail and incubated in normoxia or hypoxia (1% O2) for 10 days. (A) mRNA expression of Insulin receptor (Insr), Akt2/PKB (Akt2) and GLUT4 (Slc2a4) were determined by RT-PCR. Cyclophilin (Ppia) gene was used as endogenous control for normalization and the expression level was represented as fold change vs normoxia condition ± SEM (n=3). (B) IRβ protein expression was determined by western blot. Values were normalized to β-actin and means of fold change vs normoxia condition ± SEM were represented (n=3). * P<0.05. N: Normoxia; CH: Continuous Hypoxia.
Since there exists ample evidence indicating the importance of caveolae in the insulin
signaling transmission, we have determined the expression of Cav-1 in 3T3-L1 cells
after differentiation in continuous hypoxia. In agreement with the data previously
shown regarding insulin signaling (Fig R3), Cav-1 expression, at both mRNA and protein
level, was significantly reduced (P<0.05) after 10 days of differentiation in hypoxia
compared to normoxia group (Fig R4).
A B

Results
60
Figure R4. Caveolin-1 expression is reduced in 3T3-L1 cells differentiated under hypoxia. 3T3-L1 preadipocytes were treated with the differentiation hormonal cocktail and incubated in hypoxia (1% O2) for 10 days. (A) mRNA expression of Cav-1 was determined by RT-PCR. Cyclophilin (Ppia) gene was used as endogenous control for normalization and the expression level was represented as fold change vs normoxia condition ± SEM (n=3). (B) Cav-1 protein expression was determined by western blot. Values were normalized to β-actin and means of fold change vs normoxia condition ± SEM were represented (n=3). * P<0.05. N: Normoxia; CH: Continuous Hypoxia.
These results demonstrate that continuous hypoxia during differentiation in 3T3-L1
adipocytes strongly inhibit adipogenesis. Therefore, the cells after 10 days of
differentiation still retained mostly a fibroblast-like phenotype (Fig R2), with reduced
expression levels of adipocyte characteristic proteins (Fig R3,4).
Hence, since our aim was to investigate hypoxia-induced dysregulation in mature
adipocyte functions, in the following set of experiments, 3T3-L1 pre-adipocytes were
first differentiated for 8 days and then submitted to hypoxia.
1.2. Hypoxia during 48 hours induces insulin resistance in 3T3-L1 adipocytes
To determine the effect of hypoxia in already differentiated 3T3-L1 adipocytes, cells at
day 8 after starting the differentiation process were incubated in hypoxia (1% O2) for
48 hours until day 10. ORO staining to measure intracellular triglyceride accumulation
in normoxia group at days 0, 8 and 10 showed a time-dependent increase (Fig R5)
(P<0.05, P<0.01). However, incubation of adipocytes at day 8 of differentiation under
A B

Results
61
hypoxia for 48 hours, reduced triglyceride accumulation at day 10 (P<0.01) when
compared to cells maintained in normoxia (Fig R5).
Figure R5. Hypoxia for 48 hours significantly reduces triglyceride accumulation in 3T3-L1 adipocytes.
ORO staining of 3T3-L1 cells at day 0, 8 and 10 of differentiation in normoxia and at day 10 after 48
hours of hypoxia (1% O2). Stained cells were photographed and ORO staining was quantified measuring
the absorbance at 540 nm. Means of fold change ± SEM are represented for each group (n=6). *P<0.05,
**P<0.01, ***P<0.001.
Since hypoxia has been considered one of the factors responsible for the development
of insulin resistance in obese adipose tissue, we have also analyzed the insulin
signaling status in 3T3-L1 adipocytes after 48 hours of hypoxia. A significant reduction
in mRNA expression of Insr (IR; P<0.01), Akt2 (AKT2; P<0.01) and Slc2a4 (GLUT4;
P<0.001), as well as in the protein level of GLUT4 (P<0.01), were produced by hypoxia
(Fig R6A, R6C). Furthermore, IR phosphorylation induced by insulin stimulation was
reduced after 48 hours of hypoxia (Fig R6B). On the other hand, hypoxia induced the
expression of GLUT1 (P<0.001), which is a facilitated glucose transporter responsible
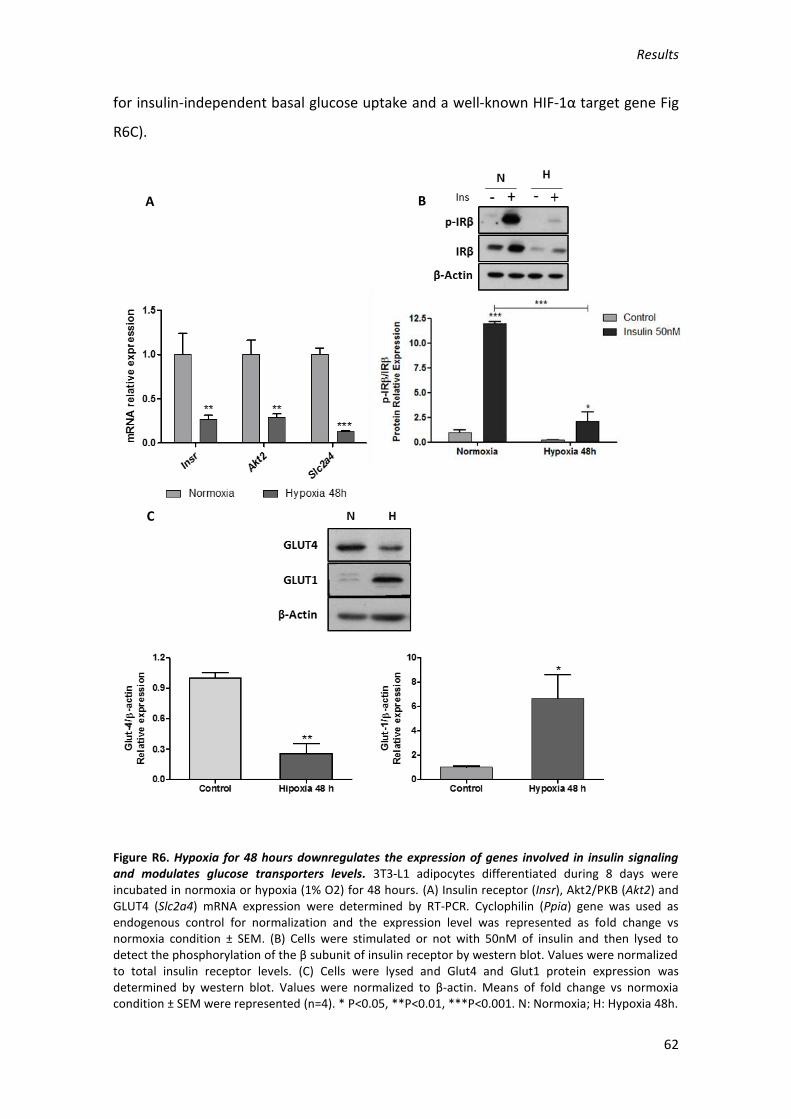
Results
62
for insulin-independent basal glucose uptake and a well-known HIF-1α target gene Fig
R6C).
Figure R6. Hypoxia for 48 hours downregulates the expression of genes involved in insulin signaling and modulates glucose transporters levels. 3T3-L1 adipocytes differentiated during 8 days were incubated in normoxia or hypoxia (1% O2) for 48 hours. (A) Insulin receptor (Insr), Akt2/PKB (Akt2) and GLUT4 (Slc2a4) mRNA expression were determined by RT-PCR. Cyclophilin (Ppia) gene was used as endogenous control for normalization and the expression level was represented as fold change vs normoxia condition ± SEM. (B) Cells were stimulated or not with 50nM of insulin and then lysed to detect the phosphorylation of the β subunit of insulin receptor by western blot. Values were normalized to total insulin receptor levels. (C) Cells were lysed and Glut4 and Glut1 protein expression was determined by western blot. Values were normalized to β-actin. Means of fold change vs normoxia condition ± SEM were represented (n=4). * P<0.05, **P<0.01, ***P<0.001. N: Normoxia; H: Hypoxia 48h.
A B
C
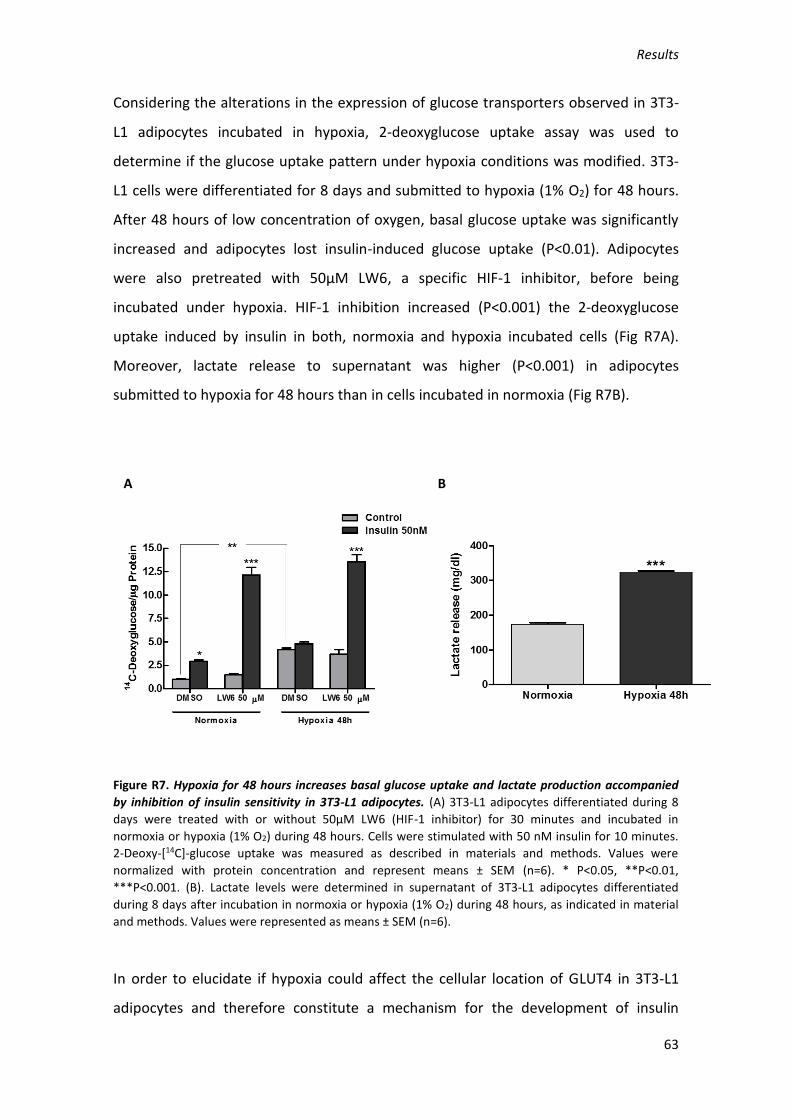
Results
63
Considering the alterations in the expression of glucose transporters observed in 3T3-
L1 adipocytes incubated in hypoxia, 2-deoxyglucose uptake assay was used to
determine if the glucose uptake pattern under hypoxia conditions was modified. 3T3-
L1 cells were differentiated for 8 days and submitted to hypoxia (1% O2) for 48 hours.
After 48 hours of low concentration of oxygen, basal glucose uptake was significantly
increased and adipocytes lost insulin-induced glucose uptake (P<0.01). Adipocytes
were also pretreated with 50µM LW6, a specific HIF-1 inhibitor, before being
incubated under hypoxia. HIF-1 inhibition increased (P<0.001) the 2-deoxyglucose
uptake induced by insulin in both, normoxia and hypoxia incubated cells (Fig R7A).
Moreover, lactate release to supernatant was higher (P<0.001) in adipocytes
submitted to hypoxia for 48 hours than in cells incubated in normoxia (Fig R7B).
Figure R7. Hypoxia for 48 hours increases basal glucose uptake and lactate production accompanied
by inhibition of insulin sensitivity in 3T3-L1 adipocytes. (A) 3T3-L1 adipocytes differentiated during 8
days were treated with or without 50µM LW6 (HIF-1 inhibitor) for 30 minutes and incubated in
normoxia or hypoxia (1% O2) during 48 hours. Cells were stimulated with 50 nM insulin for 10 minutes.
2-Deoxy-[14C]-glucose uptake was measured as described in materials and methods. Values were
normalized with protein concentration and represent means ± SEM (n=6). * P<0.05, **P<0.01,
***P<0.001. (B). Lactate levels were determined in supernatant of 3T3-L1 adipocytes differentiated
during 8 days after incubation in normoxia or hypoxia (1% O2) during 48 hours, as indicated in material
and methods. Values were represented as means ± SEM (n=6).
In order to elucidate if hypoxia could affect the cellular location of GLUT4 in 3T3-L1
adipocytes and therefore constitute a mechanism for the development of insulin
A B

Results
64
resistance, an immunofluorescence study with an antibody against GLUT4 was carried
out. As shown in Fig R8, insulin stimulation (50 nM) induced the traffic of GLUT4
vesicles from the cytoplasm to the plasma membrane, which will allow the increase in
the uptake of glucose by the cells. However, when adipocytes were incubated in a
hypoxic environment, the mobilization of GLUT4 to the plasma membrane after insulin
stimulation was not observed.
Figure R8. Glut4 translocation to the plasma membrane induced by insulin is abolished after 48 hours
of hypoxia. 3T3-L1 adipocytes differentiated during 8 days were cultured in hypoxia (1% O2) for 48
hours and stimulated or not with 50 nM insulin for 10 minutes before being fixed with 4%
paraformaldehyde. After permeabilization with 0.1% triton X100, the cells were incubated with primary
antibody against Glut4 and subsequently with a fluorescent secondary antibody and Dapi to stain the
nuclei. Images were captured using a confocal microscopy.
1.3. Hypoxia during 48 hours affects the expression and function of caveolins and
cavins in 3T3-L1 adipocytes
As indicated previously, caveolae play an important role in the transmission of many
cell signals including insulin. We therefore investigated the expression levels of Cav-1,

Results
65
Cav-2, and SDPR/Cavin-2 which are responsible of the biogenesis and function of
caveolae.
Incubation of 3T3-L1-differentiated cells under hypoxia for 48 hours was able to
reduce the mRNA expression of Cav-1, Cav-2 and SDPR/Cavin-2 (P<0.05, P<0.01,
P<0.01; Fig R9A). Cav-1 is phosphorylated and activated by insulin and incubation of
adipocytes in hypoxia for 48 hours completely abolished the insulin-induced
phosphorylation of Cav-1 (P<0.001; Fig R9B).
Figure R9. Hypoxia reduces Cav-1 and Cav-2 gene expression and Cav-1 phosphorylation induced by
insulin. 3T3-L1 preadipocytes were treated with the differentiation hormonal cocktail until day 8 and
incubated in normoxia or hypoxia (1% O2) for 48 hours. (A) Cav-1, Cav-2, Sdpr mRNA expression were
determined by RT-PCR. Cyclophilin (Ppia) gene was used as endogenous control for normalization and
the expression level was represented as fold change vs normoxia condition ± SEM (n=4-6). (B) Cells were
stimulated or not with 50 nM insulin for 10 minutes, lysed and phospho-Cav-1 protein expression was
determined by western blot. Values were normalized with total Cav-1 and means of fold change vs
normoxia condition ± SEM were represented (n=4). * P<0.05, **P<0.01, ***P<0.001.
Since caveolae are also structures related to cell trafficking processes and Cav-1 could
be mobilized into the cell, we hypothesized that hypoxia could induce a loss of
A B

Results
66
caveolae in the plasma membrane disrupting insulin signaling. Fig R10 shows by
immunofluorescence that Cav-1 in mature 3T3-L1 adipocytes cultured in normoxia
condition is mainly located in the plasma membrane. However, after 48 hours of
hypoxia, the presence of Cav-1 in plasma membrane became diffused and there was
an increase of the fluorescence signal in the cytoplasm. Stimulation with insulin did not
produce any apparent change in the Cav-1 cellular location either in normoxic or
hypoxic cells (Fig R10).
Figure R10. Membrane localization of Cav-1 is compromised in 3T3-L1 adipocytes incubated in hypoxia
for 48 hours. 3T3-L1 adipocytes differentiated during 8 days were cultured in hypoxia for 48 hours and
stimulated or not with 50 nM insulin for 10 minutes before being fixed with 4% paraformaldehyde. After
permeabilization with 0.1% triton X100, cells were incubated with a specific primary antibody against
Cav-1 and subsequently with a fluorescent secondary antibody and Dapi to stain the nuclei. Images were
captured using a confocal microscopy.
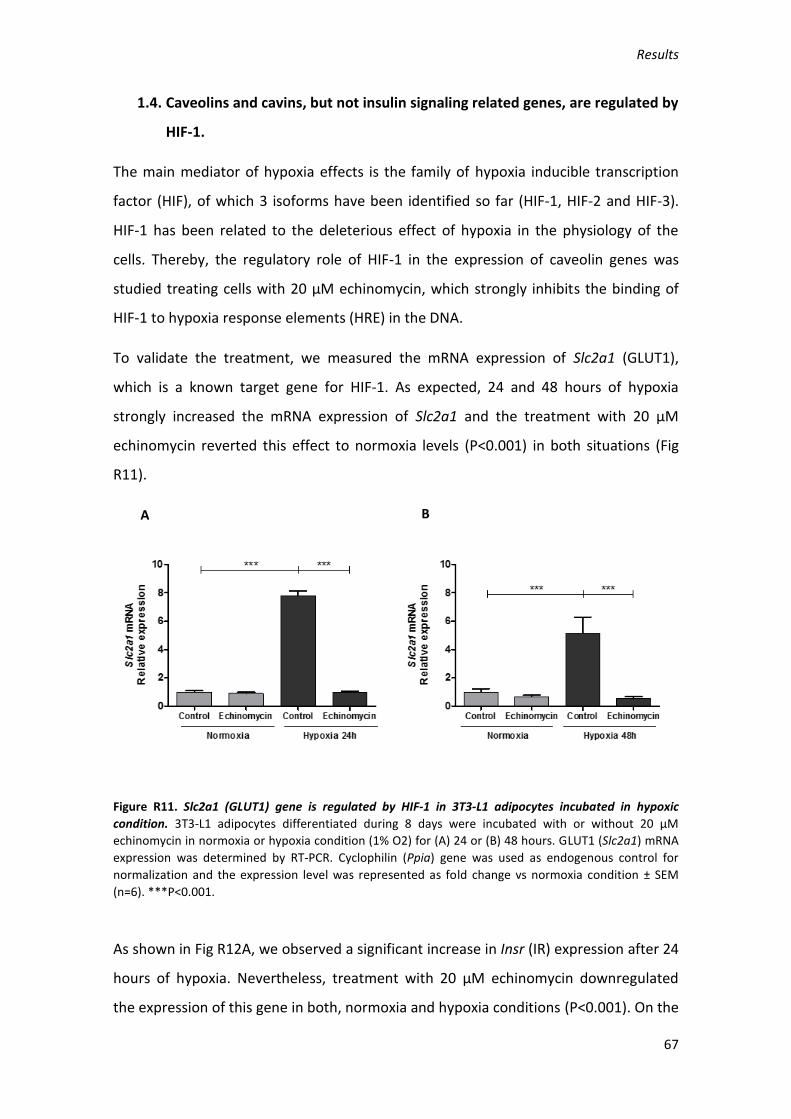
Results
67
1.4. Caveolins and cavins, but not insulin signaling related genes, are regulated by
HIF-1.
The main mediator of hypoxia effects is the family of hypoxia inducible transcription
factor (HIF), of which 3 isoforms have been identified so far (HIF-1, HIF-2 and HIF-3).
HIF-1 has been related to the deleterious effect of hypoxia in the physiology of the
cells. Thereby, the regulatory role of HIF-1 in the expression of caveolin genes was
studied treating cells with 20 µM echinomycin, which strongly inhibits the binding of
HIF-1 to hypoxia response elements (HRE) in the DNA.
To validate the treatment, we measured the mRNA expression of Slc2a1 (GLUT1),
which is a known target gene for HIF-1. As expected, 24 and 48 hours of hypoxia
strongly increased the mRNA expression of Slc2a1 and the treatment with 20 µM
echinomycin reverted this effect to normoxia levels (P<0.001) in both situations (Fig
R11).
Figure R11. Slc2a1 (GLUT1) gene is regulated by HIF-1 in 3T3-L1 adipocytes incubated in hypoxic
condition. 3T3-L1 adipocytes differentiated during 8 days were incubated with or without 20 µM
echinomycin in normoxia or hypoxia condition (1% O2) for (A) 24 or (B) 48 hours. GLUT1 (Slc2a1) mRNA
expression was determined by RT-PCR. Cyclophilin (Ppia) gene was used as endogenous control for
normalization and the expression level was represented as fold change vs normoxia condition ± SEM
(n=6). ***P<0.001.
As shown in Fig R12A, we observed a significant increase in Insr (IR) expression after 24
hours of hypoxia. Nevertheless, treatment with 20 µM echinomycin downregulated
the expression of this gene in both, normoxia and hypoxia conditions (P<0.001). On the
A B
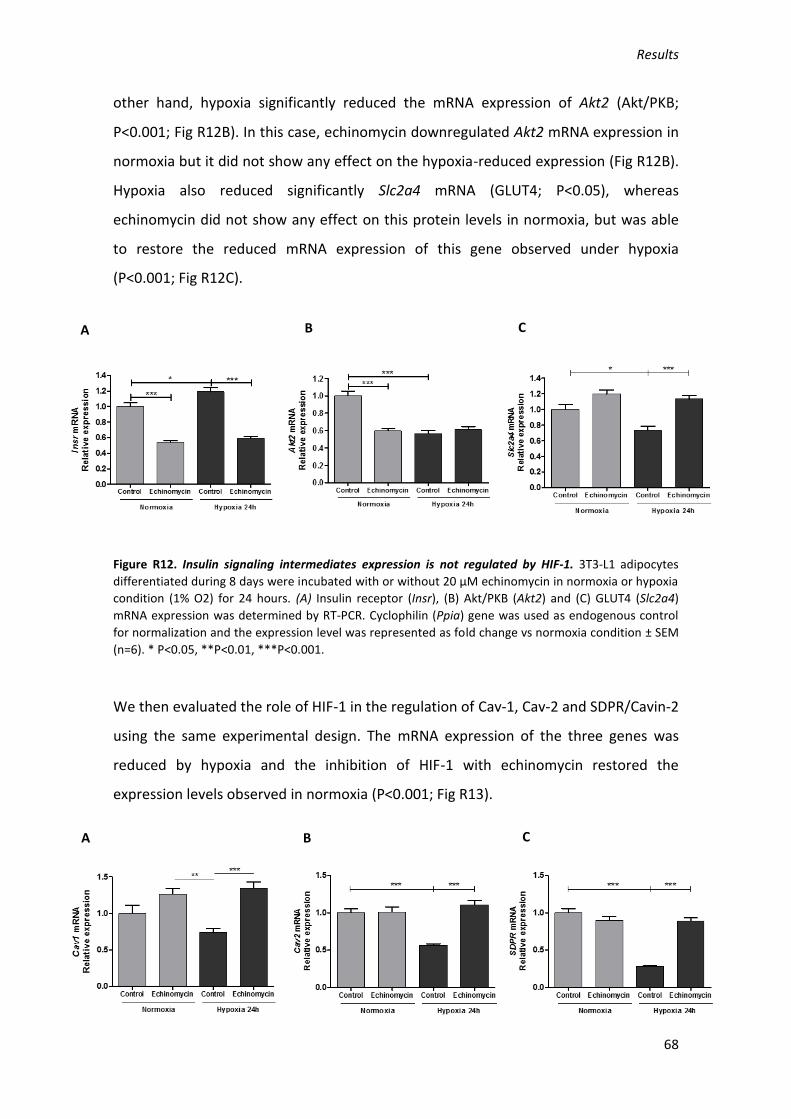
Results
68
other hand, hypoxia significantly reduced the mRNA expression of Akt2 (Akt/PKB;
P<0.001; Fig R12B). In this case, echinomycin downregulated Akt2 mRNA expression in
normoxia but it did not show any effect on the hypoxia-reduced expression (Fig R12B).
Hypoxia also reduced significantly Slc2a4 mRNA (GLUT4; P<0.05), whereas
echinomycin did not show any effect on this protein levels in normoxia, but was able
to restore the reduced mRNA expression of this gene observed under hypoxia
(P<0.001; Fig R12C).
Figure R12. Insulin signaling intermediates expression is not regulated by HIF-1. 3T3-L1 adipocytes
differentiated during 8 days were incubated with or without 20 µM echinomycin in normoxia or hypoxia
condition (1% O2) for 24 hours. (A) Insulin receptor (Insr), (B) Akt/PKB (Akt2) and (C) GLUT4 (Slc2a4)
mRNA expression was determined by RT-PCR. Cyclophilin (Ppia) gene was used as endogenous control
for normalization and the expression level was represented as fold change vs normoxia condition ± SEM
(n=6). * P<0.05, **P<0.01, ***P<0.001.
We then evaluated the role of HIF-1 in the regulation of Cav-1, Cav-2 and SDPR/Cavin-2
using the same experimental design. The mRNA expression of the three genes was
reduced by hypoxia and the inhibition of HIF-1 with echinomycin restored the
expression levels observed in normoxia (P<0.001; Fig R13).
A B C
A B C
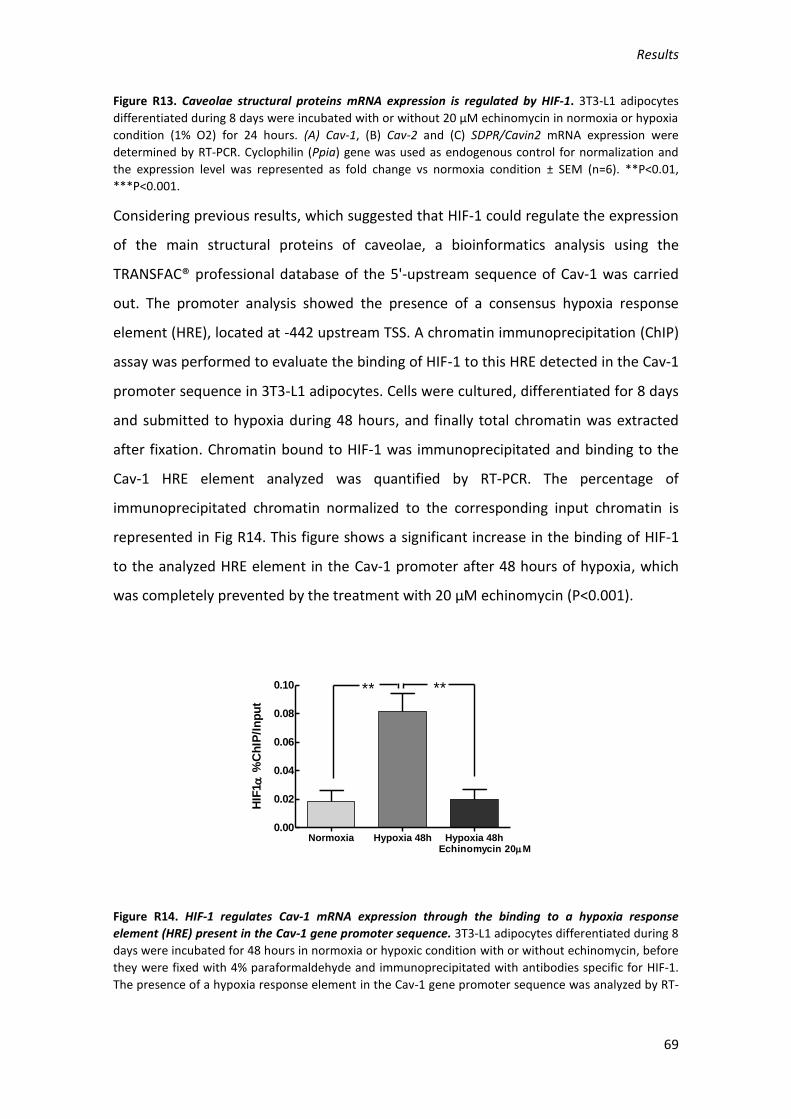
Results
69
Figure R13. Caveolae structural proteins mRNA expression is regulated by HIF-1. 3T3-L1 adipocytes
differentiated during 8 days were incubated with or without 20 µM echinomycin in normoxia or hypoxia
condition (1% O2) for 24 hours. (A) Cav-1, (B) Cav-2 and (C) SDPR/Cavin2 mRNA expression were
determined by RT-PCR. Cyclophilin (Ppia) gene was used as endogenous control for normalization and
the expression level was represented as fold change vs normoxia condition ± SEM (n=6). **P<0.01,
***P<0.001.
Considering previous results, which suggested that HIF-1 could regulate the expression
of the main structural proteins of caveolae, a bioinformatics analysis using the
TRANSFAC® professional database of the 5'-upstream sequence of Cav-1 was carried
out. The promoter analysis showed the presence of a consensus hypoxia response
element (HRE), located at -442 upstream TSS. A chromatin immunoprecipitation (ChIP)
assay was performed to evaluate the binding of HIF-1 to this HRE detected in the Cav-1
promoter sequence in 3T3-L1 adipocytes. Cells were cultured, differentiated for 8 days
and submitted to hypoxia during 48 hours, and finally total chromatin was extracted
after fixation. Chromatin bound to HIF-1 was immunoprecipitated and binding to the
Cav-1 HRE element analyzed was quantified by RT-PCR. The percentage of
immunoprecipitated chromatin normalized to the corresponding input chromatin is
represented in Fig R14. This figure shows a significant increase in the binding of HIF-1
to the analyzed HRE element in the Cav-1 promoter after 48 hours of hypoxia, which
was completely prevented by the treatment with 20 µM echinomycin (P<0.001).
Figure R14. HIF-1 regulates Cav-1 mRNA expression through the binding to a hypoxia response
element (HRE) present in the Cav-1 gene promoter sequence. 3T3-L1 adipocytes differentiated during 8
days were incubated for 48 hours in normoxia or hypoxic condition with or without echinomycin, before
they were fixed with 4% paraformaldehyde and immunoprecipitated with antibodies specific for HIF-1.
The presence of a hypoxia response element in the Cav-1 gene promoter sequence was analyzed by RT-
Normoxia Hypoxia 48h Hypoxia 48h0.00
0.02
0.04
0.06
0.08
0.10 ** **
Echinomycin 20M
HIF
1
%C
hIP
/In
pu
t

Results
70
PCR in the immunoprecipitated DNA. Values were represented as the percentage of HIF-1 binding vs
input ± SEM (n=4). **P<0.01.
1.5. Hypoxia induces a substantially different gene expression pattern compared
to normoxia
We performed a gene expression array in order to gain insight into possible
mechanisms by which hypoxia could contribute to induce insulin resistance in 3T3-L1
mature adipocytes. To discriminate those hypoxia-regulated genes that could be
relevant, B values greater than 5 and fold change (FC) values greater than 1 and less
than -1 were considered to select genes for further analysis. Gene Ontology (GO)
enrichment analysis was then carried out to classify genes differentially expressed
according to their function.
Table R1. Cellular processes affected in 3T3-L1 adipocytes after 48 hours of hypoxia determined by GO
enrichment analysis of the gene expression microarray results. Functional enrichment analysis of Gene
Ontology (GO) categories was carried out using standard hypergeometric test. P value indicates the
statistical significance of enrichment (n=4).
Selected genes and cellular processes are summarized in table R1. Differentially
expressed genes are involved in caveolae structure and function (13 genes), cellular
response to insulin stimulus (17 genes), carbohydrate transport (14 genes), response
to starvation (12 genes), 1-phosphatidylinositol-3-kinase regulator activity (2 genes)
and cellular carbohydrate metabolic processes (39 genes).
GO Term P Value
Caveola 0.00022
Cellular response to insulin stimulus 0.00027
Carbohydrate transport 0.00280
Response to starvation 0.00414
1-phosphatidylinositol-3-kinase
regulator activity0.00555
Cellular carbohydrate metabolic
process0.00659
Angptl4, Srebf1, Pfkfb1, Hspa5, Acads, Gabarapl1, Adm, Gnpat, Acat1, Jun, Acadm, Bmpr2
Pik3r3, Pik3r1
Eno2, Pgam1, Igf1, Ogdh, Pmm1, St3gal6, Adipoq, Gpd1, Man2a1, Pcx, Sorbs1, Pfkfb1,
Dhtkd1, Idh1, Atf3, Pfkfb3, Dolpp1, Pck1, Aimp1, Coq3, H6pd, Rbks, Pgm1, Dgat2, Phka2,
Pygb, Ppip5k1, B3galt2, Cog7, Hk1, Pomt1, Pik3r1, Atf4, Gm1840, Mgat2, Irs1, Itpk1, Acadm,
Ppp1r3c
Gene symbol
Cav2, Lipe, Hmox1, Igf1r, Atp1a2, Sorbs1, Slc2a1, Dlc1, Atp1b3, Scarb1, Sdpr, Irs1, Bmpr2
Ccnd2, Kat2b, Nr1h3, Rps6kb1, Srebf1, Prkdc, Sorbs1, Stat1, Pik3r3, Pde3b, Dlc1, Bcar1, Ucp2,
Apobec1, Pik3r1, Ghr, Irs1
Slc2a4, Slc35b4, Rps6kb1, Slc35a5, Adipoq, Sorbs1, Aqp7, Slc2a1, Klf15, Ednra, Scarb1, Irs1,
Sort1, G630090E17Rik

Results
71
From this group of 79 differentially expressed genes, 20 genes were upregulated by
hypoxia in 3T3-L1 mature adipocytes. Enolase 2 (Eno2), growth hormone releasing
hormone (Ghr), adrenomedullin (Adm) and GLUT1 (Slc2a1) were the most significantly
upregulated genes, as shown in table R2. Interestingly, expression of insulin growth
factor 1 (Igf1) and its receptor (Igf1r) were also increased by hypoxia with a significant
adjusted P value.
Table R2. Upregulated genes related to caveolae structure and function and carbohydrate metabolism
in 3T3-L1 adipocytes after 48 hours of hypoxia. Adjusted p value was calculated with Benjamini-
Hochberg procedure. The Log Odds or B value is the odds or probability that the gene is differentially
expressed. Genes were selected as significant using criteria of B> 5 (n=4).
Hypoxia also induced a strong downregulating effect on gene expression. In the
biological processes selected after the GO enrichment analysis, the expression of 59
out of the 79 selected differentially expressed genes was significantly decreased after
48 hours of hypoxia (table R3). Among the genes more negatively affected by hypoxia
stand out genes related with glucose metabolism (B3galt2, Pck1, Pfkfb1) and lipid
biosynthesis (Gpd1). Remarkably, genes directly related to insulin signaling (Irs1) and
caveolae structure (Sdpr) were also downregulated with a high value of fold change.
Genes logFC adj.P.Val B
Eno2 3.424 6.05E-13 29.084
Ghr 3.422 5.41E-10 18.757
Adm 3.215 6.06E-11 22.483
Slc2a1 2.277 3.35E-11 24.114
Pgam1 2.083 6.98E-11 22.133
Hk1 1.547 2.22E-07 10.190
Jun 1.514 8.10E-09 14.839
Igf1r 1.464 2.65E-09 16.397
Igf1 1.464 2.65E-09 16.397
Pmm1 1.448 2.85E-07 9.840
Itpk1 1.287 5.83E-09 15.293
Hspa5 1.230 3.23E-07 9.681
Atf4 1.176 1.39E-08 14.055
Atf3 1.172 1.24E-06 7.900
Hmox1 1.139 1.36E-07 10.867
Gm1840 1.124 4.36E-07 9.283
Aimp1 1.049 2.25E-08 13.365
Bcar1 1.043 6.57E-08 11.883
Pgm1 1.025 2.40E-07 10.085
Gabarapl1 1.014 4.42E-07 9.267

Results
72
Table R3. Downregulated genes related to caveolae structure and function and carbohydrate
metabolism in 3T3-L1 adipocytes after 48 hours of hypoxia. Adjusted p value was calculated with
Benjamini-Hochberg procedure. The Log Odds or B value is the odds or probability that the gene is
differentially expressed. Genes were selected as significant using criteria of B> 5 (n=4).
The results of the expression array were validated by RT-PCR in 3T3-L1 adipocytes after
24 and 48 hours of hypoxia incubation. The determination of gene expression after 24
hours serves as an indication of the time course of hypoxia-regulation of the analyzed
genes. Selected genes for validation considered not only the insulin related genes, but
also genes involved in other processes importantly affected such as adipocyte
differentiation.
As shown in Fig R18, mRNA expression of adiponectin (Adipoq), phosphoinositide-3-
kinase regulatory subunit 3 (Pik3r3) and CCAAT/enhancer binding protein (Cbpa) were
significantly downregulated at 24 (P<0.001) and 48 hours of hypoxia (P<0.01).
Nevertheless, peroxisome proliferator activated receptor gamma (Pparg) expression
level remained unaltered after 24 hours of hypoxia and its expression only decreased
after 48 hours of hypoxia (P<0.01).
Genes logFC adj.P.Val B Genes logFC adj.P.Val B Genes logFC adj.P.Val B
B3galt2 -4.362 1.22E-08 14.223 Ppp1r3c -1.772 5.73E-10 18.658 Ogdh -1.206 5.23E-09 15.482
Pck1 -4.174 1.37E-09 17.272 Kat2b -1.769 9.04E-10 17.972 Coq3 -1.190 4.72E-07 9.180
Pfkfb1 -3.566 1.28E-10 21.010 Ednra -1.639 9.75E-09 14.544 Srebf1 -1.166 6.53E-07 8.746
Gpd1 -3.506 3.35E-11 24.002 Pfkfb3 -1.638 1.30E-07 10.928 Ccnd2 -1.138 7.08E-09 15.047
Atp1a2 -2.974 4.98E-10 18.916 G630090E17Rik -1.626 2.39E-08 13.284 Rps6kb1 -1.128 1.92E-08 13.601
Sdpr -2.972 7.07E-11 22.091 Acads -1.593 4.20E-09 15.799 Phka2 -1.115 9.73E-08 11.331
Pik3r3 -2.631 8.17E-11 21.709 Pik3r1 -1.572 6.82E-09 15.092 H6pd -1.092 1.14E-06 8.014
Irs1 -2.522 6.40E-09 15.170 Pomt1 -1.534 1.07E-09 17.641 Dlc1 -1.092 5.71E-08 12.074
Stat1 -2.430 9.15E-10 17.953 Pygb -1.495 2.79E-10 19.662 Bmpr2 -1.076 7.90E-07 8.496
Sort1 -2.420 9.26E-10 17.929 Lipe -1.467 1.37E-09 17.276 Atp1b3 -1.074 7.82E-09 14.900
Aqp7 -2.286 1.18E-07 11.060 St3gal6 -1.458 1.19E-06 7.960 Mgat2 -1.049 9.30E-07 8.284
Adipoq -2.185 3.35E-11 23.675 Cav2 -1.398 2.21E-09 16.645 Ucp2 -1.038 2.40E-07 10.088
Klf15 -2.028 8.84E-10 18.006 Ppip5k1 -1.372 1.12E-07 11.146 Scarb1 -1.036 6.61E-09 15.131
Pcx -2.013 9.84E-11 21.397 Angptl4 -1.352 4.00E-08 12.570 Dhtkd1 -1.031 3.35E-07 9.631
Pde3b -1.986 8.17E-11 21.774 Sorbs1 -1.323 2.64E-07 9.955 Slc35b4 -1.027 1.74E-06 7.446
Dgat2 -1.939 6.06E-11 22.453 Prkdc -1.316 4.44E-09 15.728 Man2a1 -1.020 3.38E-08 12.807
Gnpat -1.863 7.92E-11 21.923 Nr1h3 -1.247 6.59E-06 5.744 Dolpp1 -1.018 1.15E-08 14.312
Idh1 -1.839 9.13E-11 21.555 Slc35a5 -1.230 4.30E-07 9.301 Rbks -1.014 7.23E-06 5.629
Slc2a4 -1.811 2.06E-10 20.190 Apobec1 -1.230 3.40E-08 12.798 Cog7 -1.008 8.78E-07 8.356
Acadm -1.780 1.28E-10 20.995 Acat1 -1.226 8.20E-09 14.812

Results
73
Figure R18. Hypoxia downregulates the mRNA expression of genes related to adipocyte differentiation
and insulin sensitivity. 3T3-L1 preadipocytes were treated with the differentiation hormonal cocktail for
8 days and incubated in normoxia or hypoxia condition (1% O2) for (A) 24 or (B) 48 hours. Adiponectin
(Adipoq), Phosphatidylinositol 3-kinase regulatory subunit gamma (Pik3r3), PPAR-γ (Pparg) and CEBPα
(Cbpa) mRNA expression were determined by RT-PCR. Cyclophilin (Ppia) gene was used as endogenous
control for normalization and the expression level was represented as fold change vs normoxia
condition ± SEM (n=6). * P<0.05, **P<0.01, ***P<0.001.
2. Effect of intermittent hypoxia in mouse white adipose tissue.
Obesity is often associated with the development of obstructive sleep apnea (OSA).
OSA is characterized by chronic intermittent hypoxia (IH) due to repetitive upper
airway collapses during sleep. IH is thought to be related to OSA-associated metabolic
alterations, such as insulin resistance and type 2 diabetes. For this reason, we
evaluated the effect of intermittent hypoxia in the caveolae structure using an animal
model. Epididymal fat tissue and carotids from C57BL/6 mice exposed to either IH
(FiO2 21-5%, 1 min cycle, 8 h/day) or normoxia conditions for 14 days were used for
the analysis. Pictures obtained by electronic microscopy showed that mice submitted
to IH for 14 days experienced reduced caveolae density in plasma membrane in the
carotids (P<0.05), adipose tissue (P<0.05) and in the periaortic adipose tissue (P<0.01;
Fig R19).
A B
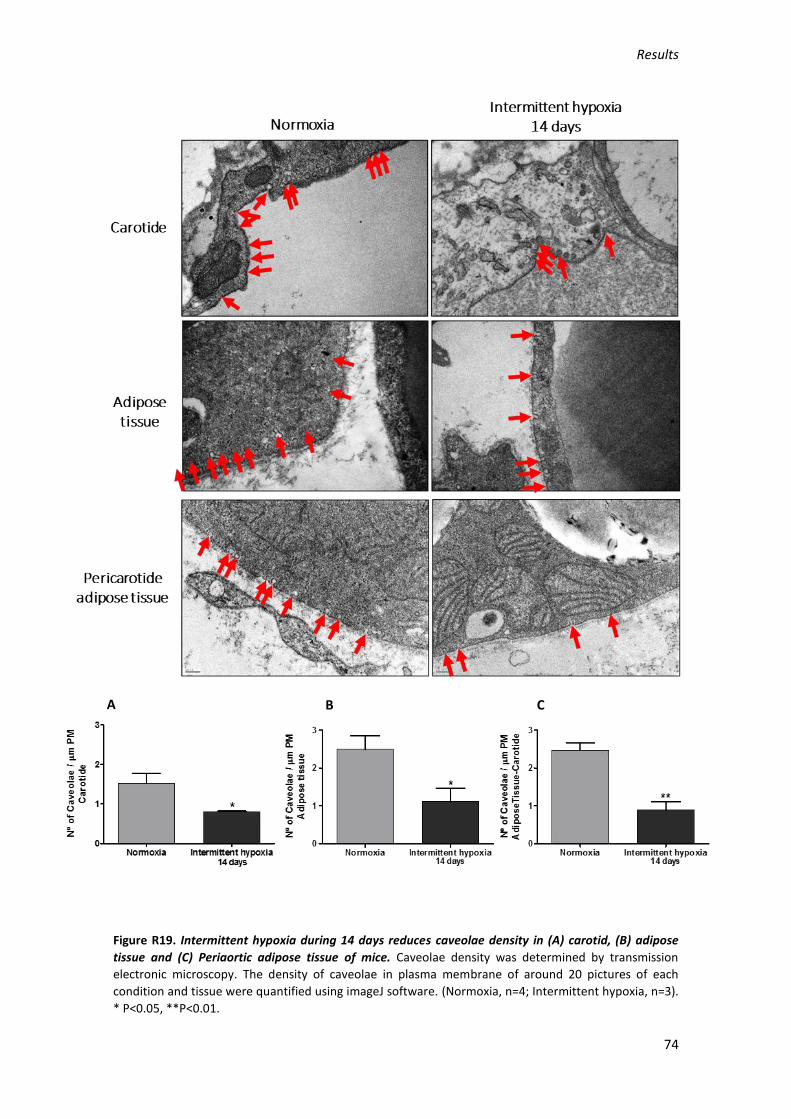
Results
74
Figure R19. Intermittent hypoxia during 14 days reduces caveolae density in (A) carotid, (B) adipose
tissue and (C) Periaortic adipose tissue of mice. Caveolae density was determined by transmission
electronic microscopy. The density of caveolae in plasma membrane of around 20 pictures of each
condition and tissue were quantified using imageJ software. (Normoxia, n=4; Intermittent hypoxia, n=3).
* P<0.05, **P<0.01.
A B C
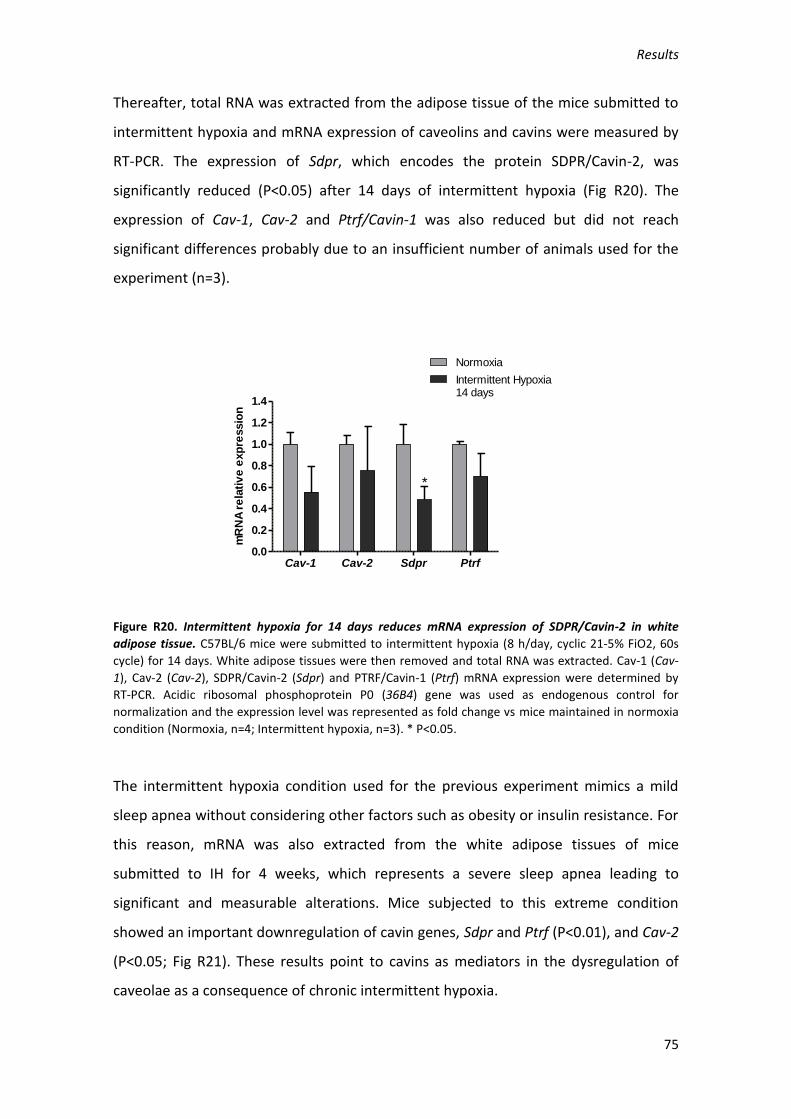
Results
75
Thereafter, total RNA was extracted from the adipose tissue of the mice submitted to
intermittent hypoxia and mRNA expression of caveolins and cavins were measured by
RT-PCR. The expression of Sdpr, which encodes the protein SDPR/Cavin-2, was
significantly reduced (P<0.05) after 14 days of intermittent hypoxia (Fig R20). The
expression of Cav-1, Cav-2 and Ptrf/Cavin-1 was also reduced but did not reach
significant differences probably due to an insufficient number of animals used for the
experiment (n=3).
Figure R20. Intermittent hypoxia for 14 days reduces mRNA expression of SDPR/Cavin-2 in white
adipose tissue. C57BL/6 mice were submitted to intermittent hypoxia (8 h/day, cyclic 21-5% FiO2, 60s
cycle) for 14 days. White adipose tissues were then removed and total RNA was extracted. Cav-1 (Cav-
1), Cav-2 (Cav-2), SDPR/Cavin-2 (Sdpr) and PTRF/Cavin-1 (Ptrf) mRNA expression were determined by
RT-PCR. Acidic ribosomal phosphoprotein P0 (36B4) gene was used as endogenous control for
normalization and the expression level was represented as fold change vs mice maintained in normoxia
condition (Normoxia, n=4; Intermittent hypoxia, n=3). * P<0.05.
The intermittent hypoxia condition used for the previous experiment mimics a mild
sleep apnea without considering other factors such as obesity or insulin resistance. For
this reason, mRNA was also extracted from the white adipose tissues of mice
submitted to IH for 4 weeks, which represents a severe sleep apnea leading to
significant and measurable alterations. Mice subjected to this extreme condition
showed an important downregulation of cavin genes, Sdpr and Ptrf (P<0.01), and Cav-2
(P<0.05; Fig R21). These results point to cavins as mediators in the dysregulation of
caveolae as a consequence of chronic intermittent hypoxia.
Cav-1 Cav-2 Sdpr Ptrf0.0
0.2
0.4
0.6
0.8
1.0
1.2
1.4
Normoxia
Intermittent Hypoxia14 days
*
mR
NA
re
lati
ve
exp
ressio
n

Results
76
Figure R21. Expression of cavins and Cav-2 genes are downregulated in adipose tissue of mice
submitted to intermittent hypoxia. C57BL/6 mice were submitted to intermittent hypoxia (8 h/day,
cyclic 21-5% FiO2, 60s cycle) for 4 weeks. White adipose tissues were then removed and total RNA was
extracted. Cav-1 (Cav-1), Cav-2 (Cav-2), SDPR/Cavin-2 (Sdpr) and PTRF/Cavin-1 (Ptrf) mRNA expression
were determined by RT-PCR. Acidic ribosomal phosphoprotein P0 (36B4) gene was used as endogenous
control for normalization and the expression level was represented as fold change vs mice maintained in
normoxia condition (Normoxia, n=4; Intermittent hypoxia, n=4). * P<0.05, ** P<0.01.
3. Effect of hypoxia in the caveolae structure of human aortic endothelial cells.
It is well known that insulin is able to induce vasodilatation by activating endothelial
nitric oxide synthase (eNOS) in endothelial cells (EC) mainly through the PI3K/PKB
pathway (Fisslthaler et al., 2003).
In order to evaluate the insulin response of primary HAoEC (Human Aortic Endothelial
Cells), these cells were stimulated with 100 nM insulin for 10 minutes. After this time,
cells were harvested and the phosphorylation of insulin receptor was determined by
western blot. As shown in Fig R22, IRβ phosphorylation was significantly increased due
to insulin stimulation (P<0.01).
Cav-1 Cav-2 Sdpr Ptrf0.0
0.2
0.4
0.6
0.8
1.0
1.2
1.4
Normoxia
Intermittent hypoxia4 weeks
*
** **m
RN
A r
ela
tiv
e e
xp
ressio
n

Results
77
Figure R22. Insulin induces insulin receptor phosphorylation in primary human aortic endothelial cells.
Human aortic endothelial cells (HAoEC) were grown until confluence and stimulated with 100 nM insulin
for 10 minutes. Cells were then lysed and phospho-IRβ protein expression was determined by western
blot. Values were normalized with total IRβ and means of fold change vs normoxia condition ± SEM
were represented (n=4). **P<0.01.
Previous results have shown that caveolae density in adipocyte plasma membrane is
reduced by hypoxia (Regazzetti et al., 2015). Taking into account that EC, like
adipocytes, are also enriched in caveolae and the lack of evidence showing the hypoxia
effects on caveolae in this cell type, we submitted primary HAoEC to hypoxia (1% O2)
for 16 hours to investigate its effect on caveolae. The density of caveolae in the plasma
membrane of HAoEC incubated in normoxia and hypoxia was determined by
transmission electronic microscopy (TEM). Fig R23 shows that hypoxia strongly
reduced the number of caveolae per micrometer of plasma membrane compared with
the same cells incubated in normoxia (P<0.001).
Control Ins 100 nM0.0
0.5
1.0
1.5
2.0
2.5
**
10 min
p-I
R
/IR
Pro
tein
Rela
tive E
xp
ressio
n

Results
78
Figure R23. Hypoxia induces the loss of caveolae in HAoEC plasma membrane. Cells were incubated in
normoxia or in hypoxia (1% O2) for 16 hours. Caveolae structures were identified by transmission
electronic microscopy. The density of caveolae in plasma membrane of around 20 pictures of each
condition and tissue were quantified using imageJ software. Quantification is expressed as number of
caveolae per micrometer of plasma membrane (PM) (n=4). ***P<0.001.
Due to this result, we performed an IF study to determine the location of Cav-1 and
PTRF/Cavin-1 in the HAoEC cells exposed to hypoxia. Interestingly, the incubation of
HAoEC in hypoxia seemed to produce an accumulation of Cav-1 in the nucleus which
was not observed in cells incubated in normoxia condition (Fig R24). However
PTRF/Cavin-1 is expressed in the nucleus in both, normoxia and hypoxia conditions.
This result was expected since this protein was first described as a factor in ribosomal
RNA transcription (Fig R24).
Figure R24. Cav-1 and PTRF/Cavin-1 are accumulated in the nucleus after 16 hours of hypoxia (1% O2). Immunofluorescence of endogenous caveolin-1 (upper panel) and PTRF/Cavin-1 (lower panel). Bar scale is 10 mm.

DISCUSION

Discusion
81
DISCUSION
1. Effect of hypoxia in the 3T3-L1 differentiation process
One of the features of obesity is the hypertrophy and hyperplasia of adipocytes which
leads to reduced levels of oxygen within adipose tissue. It is well known that hypoxia
induces a dysregulation of adipocyte physiology, including increased expression and
secretion of proinflammatory adipokines and altered glucose and lipid metabolism.
To investigate the contribution of hypoxia to the development of insulin resistance in
adipocytes, we used the 3T3-L1 cell line model. These cells are one of the most well
characterized and robust models to study the molecular events of adipocyte
differentiation. Confluent 3T3-L1 preadipocytes are normally differentiated into
adipocytes in a synchronized way. At confluence, the cell-cell contact induces the
expression of very early adipocyte differentiation markers, including lipoprotein lipase
(LPL) and type VI collagen (A2COL6) (Ntambi and Kim, 2000). The addition of a defined
adipogenic cocktail composed by the glucocorticoid dexamethasone (Dex), the growth
factor insulin, the phosphodiesterase inhibitor isobutilmethylxanthine (IBMX) and fetal
bovine serum (FBS), is needed to trigger a transcriptional cascade responsible for the
formation of mature adipocytes. Within 1 hour after the addition of the cocktail, there
is an increase in the expression of c-fos, c-jun, junB, c-myc and CCAAT/enhancer
binding proteins (C/EBP) β and δ, and cells undergo a postconfluent mitosis and
subsequent growth arrest (Bernlohr et al., 1985). After removal of IBMX and Dex from
the culture medium, expression of C/EBPδ dissipates over the subsequent 48 h,
whereas the decline of C/EBPβ is observed around day 8. The activity of C/EBPβ and δ
induces the expression of peroxisome proliferator-activated receptor γ (PPARγ) (Clarke
et al., 1997; Wu et al., 1995) and C/EBPα, which have been identified as responsible for
terminal differentiation through the transcription of many genes involved in the
development and maintenance of the adipocyte phenotype (Gregoire et al., 1998).
Finally, among the markers of adipocyte differentiation, and as a result of the action of
the transcription factors commented before, there is caveolin-1 (Cav-1), whose mRNA
is strongly induced between days 2 and 4 of 3T3-L1 adipocyte differentiation and
exhibits a similar pattern of induction during differentiation as the mRNAs encoding IR
and GLUT4 (Scherer et al., 1994). Our group has previously demonstrated that

Discusion
82
expression of Cav-1, one of the main proteins of caveolae, is enhanced during 3T3-L1
adipogenesis and can be regulated by epigenetic mechanisms (Palacios-Ortega et al.,
2014).
In this project we show that hypoxia strongly inhibits the differentiation process of
3T3-L1 adipocytes, demonstrated by the strong reduction of triglyceride accumulation
and the subsequent absence of lipid droplets in the cytoplasm (Fig R2). This result is
positively correlated with an increase of the HIF-1 expression (Fig R1), suggesting the
involvement of this transcription factor in the inhibitory mechanism of adipogenesis in
3T3-L1 cells. In this sense, it has been previously reported that HIF-1 represses PPARγ2
promoter activation through the induction of the DEC1/Stra13 target gene, a member
of the Drosophila hairy/Enhancer of split (HES) (Yun et al., 2002). Furthermore, in
differentiated human preadipocytes, acute exposure to hypoxia (3% O2) during 24
hours inhibits LPL activity (Mahat et al., 2016), one of the earliest markers of adipocyte
differentiation. Very recently, other group, using an experimental model similar to
ours, also observed that incubation of 3T3-L1 preadipocytes in 1% O2 during the
differentiation process reduced the expression of adipogenesis markers and inhibited
the formation of lipid droplets, as well as diminished lipogenesis, which dropped by
43% (Weiszenstein et al., 2016). Moreover, this work also supports the role of HIF-1 in
the inhibitory effect of hypoxia over adipogenesis.
In our study, incubation of mature 3T3-L1 adipocytes in hypoxia during 48 hours also
reduces the triglyceride content of the cells compared to the control group (Fig R5).
This result could be easily explained by the well-known lipolytic effect of hypoxia
(Trayhurn, 2014). One of the mechanisms proposed for the hypoxia-induced lower
levels of fatty acid in adipocytes in vivo is the inhibition of LPL activity, which promotes
the hydrolysis of dietary triglycerides and the subsequent uptake of fatty acids within
adipocytes (Dijk et al., 2016; Mahat et al., 2016). It has been demonstrated that the
hypoxia-induced gene angiopoietin-like protein 4 (ANGPTL4) promotes LPL
degradation and inactivation (Dijk et al., 2016; González-Muniesa et al., 2011;
Makoveichuk et al., 2013). However, in our in vitro cell culture model this mechanism
should not be very relevant, since the culture medium do not constitute an important
triglyceride source. Besides the impaired lipid uptake in adipocytes induced by

Discusion
83
hypoxia, recent evidence in human visceral adipose tissue suggests that a lower
pressure of oxygen downregulates the expression level of genes involved in de novo
lipogenesis (García-Fuentes et al., 2015). These data confirm that the reduced levels of
triglycerides observed in 3T3-L1 adipocytes after 48 hours of hypoxia are at least
partially due to both the increase of lipolysis and the inhibition of de novo lipogenesis.
2. Effect of hypoxia on the structure and function of caveolae in 3T3-L1 cells
Several studies have been performed in order to elucidate the role of Cav-1 in cell
function, but they are mostly focused on cancer. Studies in different types of cancer
expressing a hypoxic profile have shown that Cav-1 is upregulated and associated with
larger tumor size, higher tumor grade and stage, resistance to conventional therapies,
and poor prognosis (Bourseau-Guilmain et al., 2016; Campbell et al., 2003; Karam et
al., 2007; Shen et al., 2008; Wang et al., 2012). In contrast, there exists also evidence in
this field suggesting that Cav-1 could be downregulated during hypoxic condition in
gastric (Kannan et al., 2014), colon or ovarian carcinoma cells (Bender et al., 2000;
Wiechen et al., 2001), among others. On the other hand, it is well recognized that
adipocyte is the cell type where caveolae are more abundant. The regulation of this
specialized invagination in adipose tissue under hypoxia is not well understood, and
limited studies regarding this point have been published. In this context, Regazzetti
and colleagues observed in 3T3-L1 adipocytes that hypoxia, through a HIF-1 dependent
mechanism, downregulates the expression of cavins 1 and 2, which are necessary for
the biogenesis of caveolae. Therefore, these cells showed a reduced number of
caveolae in its plasma membrane compared with the control cells (Regazzetti et al.,
2015).
In this work, we have observed that Cav-1 mRNA and protein levels are downregulated
in both hypoxic models assayed: 3T3-L1 adipocytes differentiated in hypoxia (Fig R4),
and mature adipocytes incubated in hypoxia for 48 hours (Fig R9). We have also found
that Cav-2 and SDPR/Cavin-2 genes are downregulated in 3T3-L1 adipocytes cultured
under hypoxia for 48 hours (Fig R9). This inhibitory role of hypoxia over the caveolae
components suggests that its structure could be compromised. This idea is supported
by the disruption observed in the typical Cav-1 localization in adipocyte plasma
membrane after 48 hours of hypoxia, determined by immunofluorescence (Fig R8).

Discusion
84
Furthermore, the results obtained using echinomycin, a drug able to block HIF-1
binding to its HRE in the DNA, suggest that the expression of the main caveolae
components are directly regulated by HIF-1. 3T3-L1 adipocytes treated with
echinomycin during the incubation in hypoxia for 24 hours exhibit a rise in the
expression levels of Cav-1, Cav-2 and SDPR/Cavin-2, compared to the same cells
incubated in hypoxia without echinomycin (Fig R13). The idea of a HIF-1-dependent
mechanism had been postulated previously by Regazzetti et al for cavin-1 and cavin-2.
In this study, we show that expression of caveolins 1 and 2 might also be regulated by
this mechanism under hypoxia. In addition to the data obtained with echinomycin, we
also demonstrate by ChIP analysis the binding of HIF-1 to an HRE previously identified
in the mouse Cav-1 promoter sequence by a bioinformatic analysis. This was confirmed
in cells pretreated with echinomycin, which abolishes HIF-1 binding to DNA (Fig R14).
This result represents the first experimental evidence of Cav-1 as a target gene for HIF-
1 in adipocytes. Results obtained by Wang et al, support our observation but in human
renal carcinoma cells (Wang et al., 2012). They identified a possible HRE in the Cav-1
human promoter sequence and, using two approaches, electrophoretic mobility shift
assay (EMSA) and ChIP, demonstrated the binding of HIF-1 and HIF-2 to this element.
Also, a genome-wide identification of HIF binding sites by a probabilistic model
integrating transcription-profiling data and in silico binding site prediction, predicted
Cav-1 as one of the 216 HIF-target genes (Ortiz-Barahona et al., 2010).
The sustained hypoxia studied in this work mimics, in a certain way, the low oxygen
levels experimented by adipose tissue due to its expansion in obesity. However, this
tissue could also be affected by other pattern of hypoxia such as intermittent hypoxia
(IH). This cyclical pattern of reduced oxygen levels followed by reoxygenation is
characteristic in patients suffering of obstructive sleep apnea (OSA), a highly prevalent
comorbidity in obesity. To study the effect of this kind of hypoxia, the group of Arnaud
et al (Poulain et al., 2015) kindly provided us samples of adipose tissue obtained from
mice submitted to IH, which mimics the one experimented by OSA patients during the
night. The results obtained in this work suggest that a mild IH (for 14 days) in mice
produces a loss of caveolae in the plasma membrane of adipose tissue and in the
carotids (Fig R19). This was accompanied by a significant downregulation of
Discusion
85
SDPR/cavin-2, but not of the other cavins and caveolins genes (Fig R20). Other
investigations have shown that the deletion of SDPR/cavin-2 is able to induce loss of
endothelial caveolae in lung and adipose tissue (Hansen et al., 2013). Nevertheless, our
results are still preliminary, due to the limited sample size used in the experiment and
the lack of data about protein expression levels and cell localization of the caveolae
components. Conversely to most of the patients suffering OSA, who also experiment a
mild intermittent hypoxia, the mouse model that we have used, lacks other associated
deleterious factors, including obesity or genetic vulnerability. This could be the reason
for the absence of measurable alterations in the expression profile of caveolae protein
components observed in these mice (Fig R20). We therefore evaluated the expression
of caveolins and cavins using samples of adipose tissue from mice submitted to a
longer IH (4 weeks) resulting in a more severe condition. In these mice, the expression
of Cav-2, PTRF/cavin-1 and SDPR/cavin-2 is clearly downregulated. However, the
expression of Cav-1 remains stable (Fig R21). These results are also preliminary and it is
necessary to look in-depth into the implications of this expression pattern,
consequence of IH, for caveolae structure and function.
3. Effect of hypoxia on the structure and function of caveolae in endothelial cells
Hypoxia is not restricted to adipose tissue and affects other tissues in different ways.
In this sense, obesity could produce sleep disorders such as the obesity
hypoventilation syndrome, which limits O2 availability in the blood flow producing
general hypoxia. Other situations include chronic obstructive pulmonary disease
(COPD), interstitial lung diseases, chronic exposure to high altitude and some rare
neonatal diseases that are associated with the appearance of hypoxia (Ghofrani et al.,
2006). All these conditions induce, through different mechanisms, the development of
endothelial cell dysfunction, which may lead to vascular problems such as pulmonary
and systemic hypertension (Chan and Vanhoutte, 2013; Lévy et al., 2008). Taking all
this information into account, together with the fact that endothelial cells are one of
the cell types with a higher density of caveolae in their membranes, and the well-
established regulatory role of caveolins and caveolae in endothelial nitric oxide
synthase (eNOS) localization and NO production, we have analyzed the effect of
hypoxia on caveolae density in the plasma membrane of human aortic endothelial
Discusion
86
cells. We observed a significant decrease of caveolae density in the plasma membrane
after 16 hours of hypoxia (Fig R23). Interestingly, immunofluorescence staining shows
that hypoxia induces the migration of both Cav-1 and PTRF/Cavin-1 from the plasma
membrane to the nucleus (Fig R24). Despite that, these results are still preliminary and
further studies are necessary to analyze in-depth this effect. For example, mobilization
of crucial proteins involved in the structure of caveolae could result in the loss of
integrity of these invaginations and explain the results observed with electron
microscopy. Disruption of endothelial caveolae has been previously reported as a
mechanism for the aberrant endothelium-dependent relaxation and contractility, and,
therefore, for the proper maintenance of the myogenic tone (Je et al., 2004). These
impairments course with eNOS uncoupling and the consequent imbalance in NO
production and calcium signaling (Xu et al., 2007).
On the other hand, Cav-1 mobilization to the nucleus was rather surprising, since Cav-1
is a well-known plasma membrane protein. Chretien A et al reported the increased
expression of cytoplasmic and nuclear Cav-1 during establishment of H2O2-induced
premature senescence in fibroblasts (Chrétien et al., 2008). Nevertheless, PTRF/Cavin-
1 was initially discovered in the nucleus participating in the mechanism of transcription
termination by RNA polymerase I (Pol I) (Jansa et al., 1998). Recent results suggest that
PTRF could collaborate with Cav-1 in cellular senescence in fibroblasts through its
targeting to caveolae (Bai et al., 2011). Nonetheless, PTRF translocation to the nucleus
in response to metabolic challenges, including the compromise in nutrient availability
and insulin stimulation, has been recently described in adipocytes (Liu and Pilch, 2016).
In this case Cav-1 remains in the plasma membrane, since cells still respond to insulin
or nutrient changes; however, we have seen that in hypoxia insulin signaling is
compromised. Hypoxia seems to induce a senescent phenotype in human
mesenchymal stem cells, confirmed by the expression of the senescence-associated
beta-galactosidase (SA-β-gal) only expressed in senescent cells (Kim et al., 2016).
Moreover, hypoxia reduces cellular energy supply and represents a metabolic stress
(Mekhail et al., 2006) that, at least acutely, could be mediated by both PTRF/cavin-1
and Cav-1 in the nucleus. The possible effect of Cav-1 on the role of PTRF/cavin-1 in
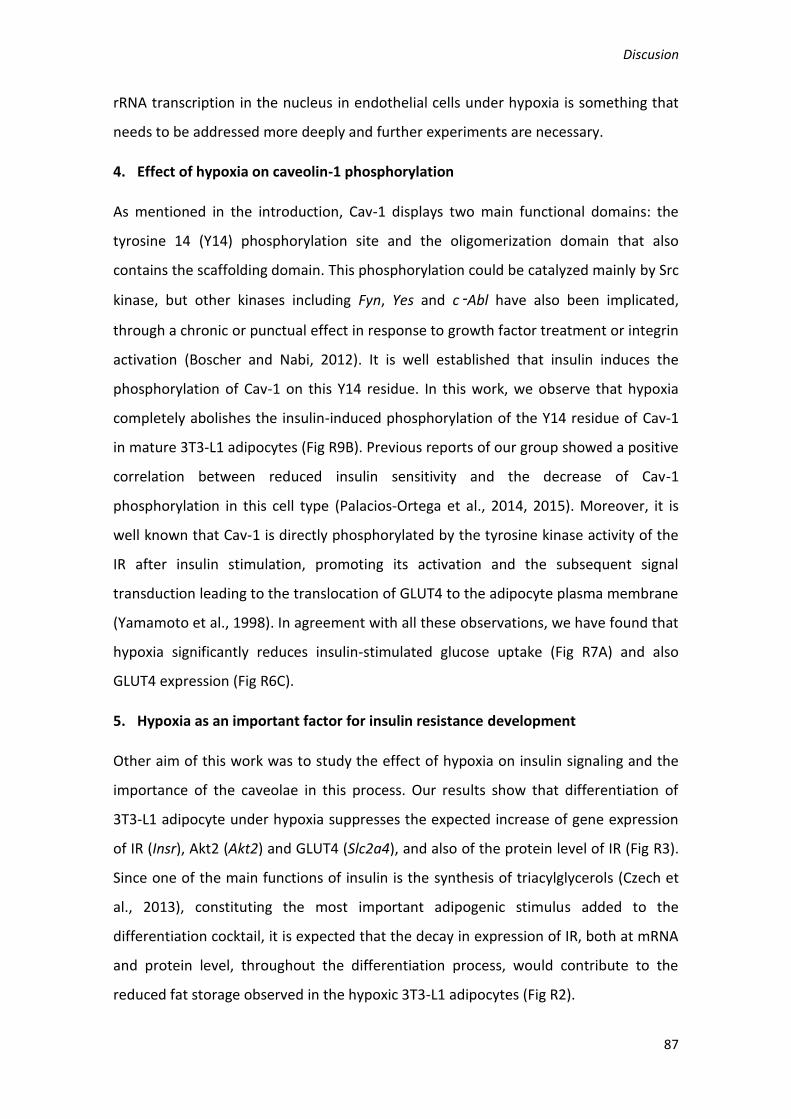
Discusion
87
rRNA transcription in the nucleus in endothelial cells under hypoxia is something that
needs to be addressed more deeply and further experiments are necessary.
4. Effect of hypoxia on caveolin-1 phosphorylation
As mentioned in the introduction, Cav-1 displays two main functional domains: the
tyrosine 14 (Y14) phosphorylation site and the oligomerization domain that also
contains the scaffolding domain. This phosphorylation could be catalyzed mainly by Src
kinase, but other kinases including Fyn, Yes and c‑Abl have also been implicated,
through a chronic or punctual effect in response to growth factor treatment or integrin
activation (Boscher and Nabi, 2012). It is well established that insulin induces the
phosphorylation of Cav-1 on this Y14 residue. In this work, we observe that hypoxia
completely abolishes the insulin-induced phosphorylation of the Y14 residue of Cav-1
in mature 3T3-L1 adipocytes (Fig R9B). Previous reports of our group showed a positive
correlation between reduced insulin sensitivity and the decrease of Cav-1
phosphorylation in this cell type (Palacios-Ortega et al., 2014, 2015). Moreover, it is
well known that Cav-1 is directly phosphorylated by the tyrosine kinase activity of the
IR after insulin stimulation, promoting its activation and the subsequent signal
transduction leading to the translocation of GLUT4 to the adipocyte plasma membrane
(Yamamoto et al., 1998). In agreement with all these observations, we have found that
hypoxia significantly reduces insulin-stimulated glucose uptake (Fig R7A) and also
GLUT4 expression (Fig R6C).
5. Hypoxia as an important factor for insulin resistance development
Other aim of this work was to study the effect of hypoxia on insulin signaling and the
importance of the caveolae in this process. Our results show that differentiation of
3T3-L1 adipocyte under hypoxia suppresses the expected increase of gene expression
of IR (Insr), Akt2 (Akt2) and GLUT4 (Slc2a4), and also of the protein level of IR (Fig R3).
Since one of the main functions of insulin is the synthesis of triacylglycerols (Czech et
al., 2013), constituting the most important adipogenic stimulus added to the
differentiation cocktail, it is expected that the decay in expression of IR, both at mRNA
and protein level, throughout the differentiation process, would contribute to the
reduced fat storage observed in the hypoxic 3T3-L1 adipocytes (Fig R2).
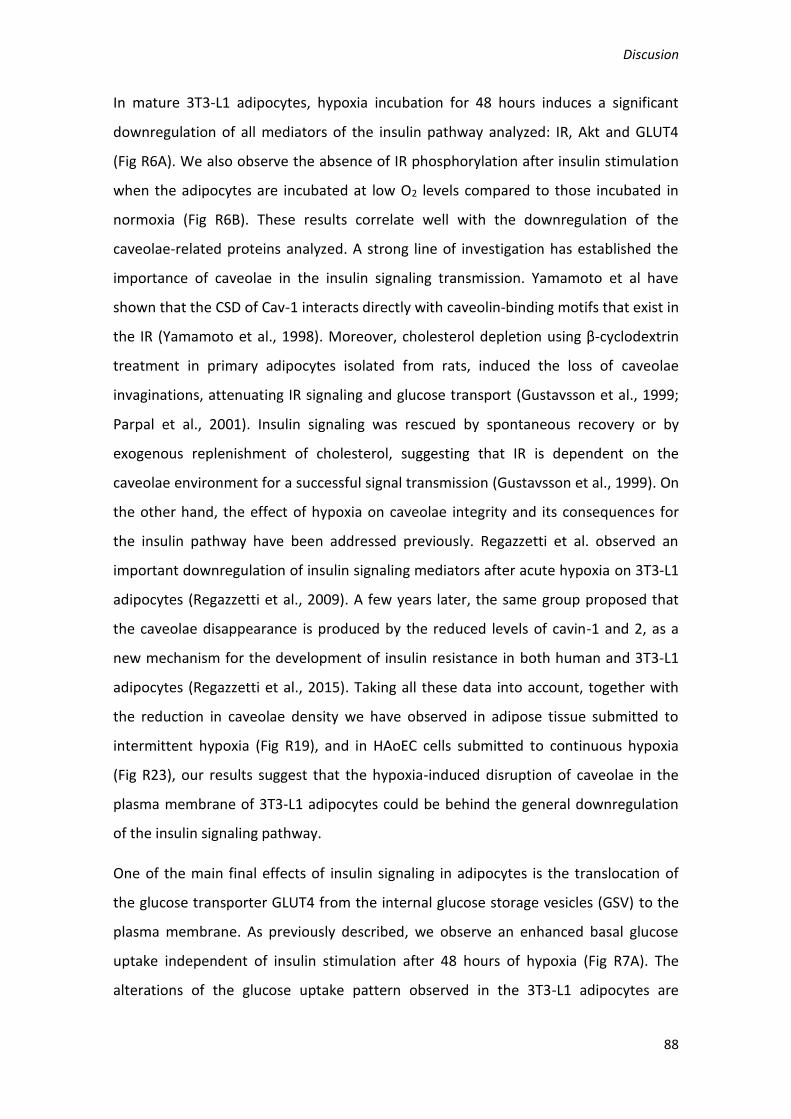
Discusion
88
In mature 3T3-L1 adipocytes, hypoxia incubation for 48 hours induces a significant
downregulation of all mediators of the insulin pathway analyzed: IR, Akt and GLUT4
(Fig R6A). We also observe the absence of IR phosphorylation after insulin stimulation
when the adipocytes are incubated at low O2 levels compared to those incubated in
normoxia (Fig R6B). These results correlate well with the downregulation of the
caveolae-related proteins analyzed. A strong line of investigation has established the
importance of caveolae in the insulin signaling transmission. Yamamoto et al have
shown that the CSD of Cav-1 interacts directly with caveolin-binding motifs that exist in
the IR (Yamamoto et al., 1998). Moreover, cholesterol depletion using β-cyclodextrin
treatment in primary adipocytes isolated from rats, induced the loss of caveolae
invaginations, attenuating IR signaling and glucose transport (Gustavsson et al., 1999;
Parpal et al., 2001). Insulin signaling was rescued by spontaneous recovery or by
exogenous replenishment of cholesterol, suggesting that IR is dependent on the
caveolae environment for a successful signal transmission (Gustavsson et al., 1999). On
the other hand, the effect of hypoxia on caveolae integrity and its consequences for
the insulin pathway have been addressed previously. Regazzetti et al. observed an
important downregulation of insulin signaling mediators after acute hypoxia on 3T3-L1
adipocytes (Regazzetti et al., 2009). A few years later, the same group proposed that
the caveolae disappearance is produced by the reduced levels of cavin-1 and 2, as a
new mechanism for the development of insulin resistance in both human and 3T3-L1
adipocytes (Regazzetti et al., 2015). Taking all these data into account, together with
the reduction in caveolae density we have observed in adipose tissue submitted to
intermittent hypoxia (Fig R19), and in HAoEC cells submitted to continuous hypoxia
(Fig R23), our results suggest that the hypoxia-induced disruption of caveolae in the
plasma membrane of 3T3-L1 adipocytes could be behind the general downregulation
of the insulin signaling pathway.
One of the main final effects of insulin signaling in adipocytes is the translocation of
the glucose transporter GLUT4 from the internal glucose storage vesicles (GSV) to the
plasma membrane. As previously described, we observe an enhanced basal glucose
uptake independent of insulin stimulation after 48 hours of hypoxia (Fig R7A). The
alterations of the glucose uptake pattern observed in the 3T3-L1 adipocytes are
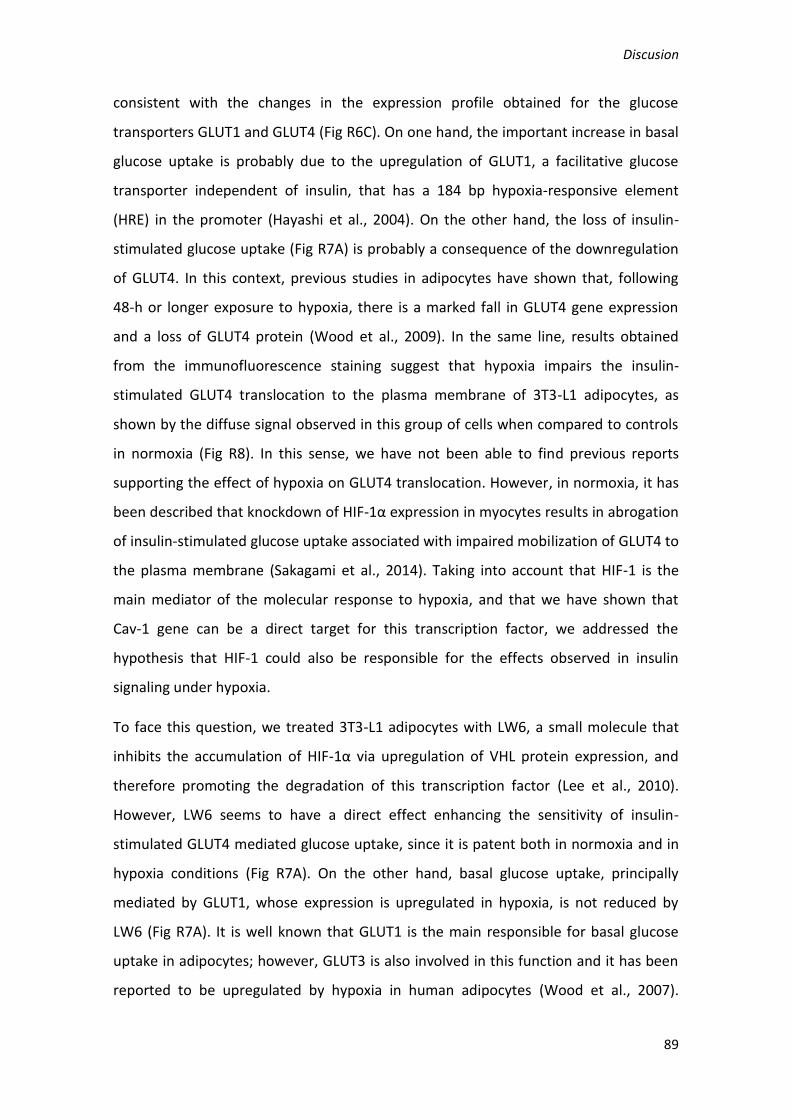
Discusion
89
consistent with the changes in the expression profile obtained for the glucose
transporters GLUT1 and GLUT4 (Fig R6C). On one hand, the important increase in basal
glucose uptake is probably due to the upregulation of GLUT1, a facilitative glucose
transporter independent of insulin, that has a 184 bp hypoxia-responsive element
(HRE) in the promoter (Hayashi et al., 2004). On the other hand, the loss of insulin-
stimulated glucose uptake (Fig R7A) is probably a consequence of the downregulation
of GLUT4. In this context, previous studies in adipocytes have shown that, following
48-h or longer exposure to hypoxia, there is a marked fall in GLUT4 gene expression
and a loss of GLUT4 protein (Wood et al., 2009). In the same line, results obtained
from the immunofluorescence staining suggest that hypoxia impairs the insulin-
stimulated GLUT4 translocation to the plasma membrane of 3T3-L1 adipocytes, as
shown by the diffuse signal observed in this group of cells when compared to controls
in normoxia (Fig R8). In this sense, we have not been able to find previous reports
supporting the effect of hypoxia on GLUT4 translocation. However, in normoxia, it has
been described that knockdown of HIF-1α expression in myocytes results in abrogation
of insulin-stimulated glucose uptake associated with impaired mobilization of GLUT4 to
the plasma membrane (Sakagami et al., 2014). Taking into account that HIF-1 is the
main mediator of the molecular response to hypoxia, and that we have shown that
Cav-1 gene can be a direct target for this transcription factor, we addressed the
hypothesis that HIF-1 could also be responsible for the effects observed in insulin
signaling under hypoxia.
To face this question, we treated 3T3-L1 adipocytes with LW6, a small molecule that
inhibits the accumulation of HIF-1α via upregulation of VHL protein expression, and
therefore promoting the degradation of this transcription factor (Lee et al., 2010).
However, LW6 seems to have a direct effect enhancing the sensitivity of insulin-
stimulated GLUT4 mediated glucose uptake, since it is patent both in normoxia and in
hypoxia conditions (Fig R7A). On the other hand, basal glucose uptake, principally
mediated by GLUT1, whose expression is upregulated in hypoxia, is not reduced by
LW6 (Fig R7A). It is well known that GLUT1 is the main responsible for basal glucose
uptake in adipocytes; however, GLUT3 is also involved in this function and it has been
reported to be upregulated by hypoxia in human adipocytes (Wood et al., 2007).

Discusion
90
Moreover, knockdown of GLUT3 with siRNA significantly reduced myocyte glucose
uptake (Copland et al., 2007). However, the mechanism for the hypoxia-induced
upregulation of GLUT3 is unknown and the role of HIF-1 in this mechanism is
uncertain, although a putative HRE, that could be critical in GLUT3 promoter activity,
has been described (Yu et al., 2012). In this sense, further studies are required in order
to elucidate the participation of this glucose transporter in basal uptake of glucose in
3T3-L1 adipocytes and whether GLUT3 might be involved in the upregulation of non-
insulin-mediated sugar transport by a HIF-1 independent mechanism.
Since LW6 is defined as an indirect HIF-1 inhibitor and in our case it did not show any
effect on hypoxia-induced GLUT1 activity, we designed experiments using
echinomycin, which reduces directly HIF-1 transcriptional activity by blocking its
binding to DNA, in order to assay the effect of this transcription factor on the
expression of several insulin signaling mediators. We first measured the expression of
Slc2a1 gene (GLUT1) in adipocytes incubated under hypoxia and treated with
echinomycin. As expected, Slc2a1 expression was increased in the hypoxic cells after
24 and 48 hours of treatment, and echinomycin abolishes this effect (Fig R11).
Furthermore, echinomycin treatment restores the expression of Slc2a4 (GLUT4)
diminished by 24 hours of hypoxia compared to their counterpart hypoxic
echinomycin-free adipocytes (Fig R12C). These results support the role of HIF-1 in the
altered glucose uptake pattern observed in hypoxia through the expression of both
Slc2a1 and Slc2a4.
We also determined the expression of other insulin signaling mediators under hypoxia,
with or without previous treatment of the cells with echinomycin. A previous work
from Regazzetti and colleagues did not observe changes in the expression levels of Insr
(IR) after 16 hours of hypoxia in adipocytes (Regazzetti et al., 2009). However, in our
experiment we submitted 3T3-L1 adipocytes to 24 hours of hypoxia slightly inducing
the expression of Insr (IR), but reducing the mRNA expression of Akt2 significantly (Fig
R12B). On the other hand, echinomycin decreases the expression of Insr and Akt2 in
normoxia and Insr in hypoxia. Therefore, in this case the hypoxia-dependent effect on
the insulin signaling intermediates does not seem to be mediated by HIF-1, since
echinomycin is not able to revert them. In this regard, although echinomycin is a

Discusion
91
potent inhibitor of HIF-1 binding to DNA, it also interferes with the activity of other
transcription factors, including Sp1 (Vlaminck et al., 2007), which has been involved in
the transcriptional regulation of, for example, IR (Costa et al., 2008; Foti et al., 2003).
The hypoxia-induced increase in Insr and decrease in Akt2 expression is difficult to
explain, since both effects seem contradictory in relation to insulin signaling
transmission. They may be part of a delayed response to low oxygen concentration,
considering also that Akt is involved in a variety of different signaling pathways, such
as inflammation or oxidative stress responses.
6. Gene expression profile induced by hypoxia
In order to elucidate new mechanisms involved in the response to hypoxia, we have
performed a gene expression array in search for genes with differential expression in
3T3-L1 adipocytes incubated under hypoxia for 48 hours. The Gene Ontology (GO)
enrichment analysis leads to 6 categories related to insulin response and
carbohydrates metabolism (Table R1). The most significant category of genes
corresponds to those related to caveolae. Some of these gene expression changes
have been validated by RT-PCR in this work, including the downregulation of Cav-2 and
Sdpr and the upregulation of Slc2a1.
In the microarray, the gene with the highest level of upregulation is enolase 2 (Eno2)
(Table R2). There are no reports about the role of Eno2 in adipocytes, except a recent
work in human Simpson-Golabi-Behmel syndrome (SGBS) adipocytes, which also
overexpressed this gene in response to hypoxia. The authors identified a HRE in the
Eno2 promoter suggesting that HIF-1 might be responsible for Eno2 mRNA
upregulation in human adipocytes (Leiherer et al., 2014). Since Eno1, the isoform of
enolase expressed mainly in cancer cells, participates in anaerobic glycolysis
contributing to the Warburg effect (Fu et al., 2015), perhaps Eno2 could contribute to
the adaptation of adipocytes to the hypoxic environment in obesity. Other interesting
genes strongly upregulated by hypoxia include growth hormone releasing hormone
(Ghrh) and insulin-like growth factor 1 (Igf1) and its receptor, Igf1r (Table R2). In
regard to this, it is well established that growth hormone (GH) hypersecretion is
positively correlated with the development of insulin resistance (Rose and Clemmons,
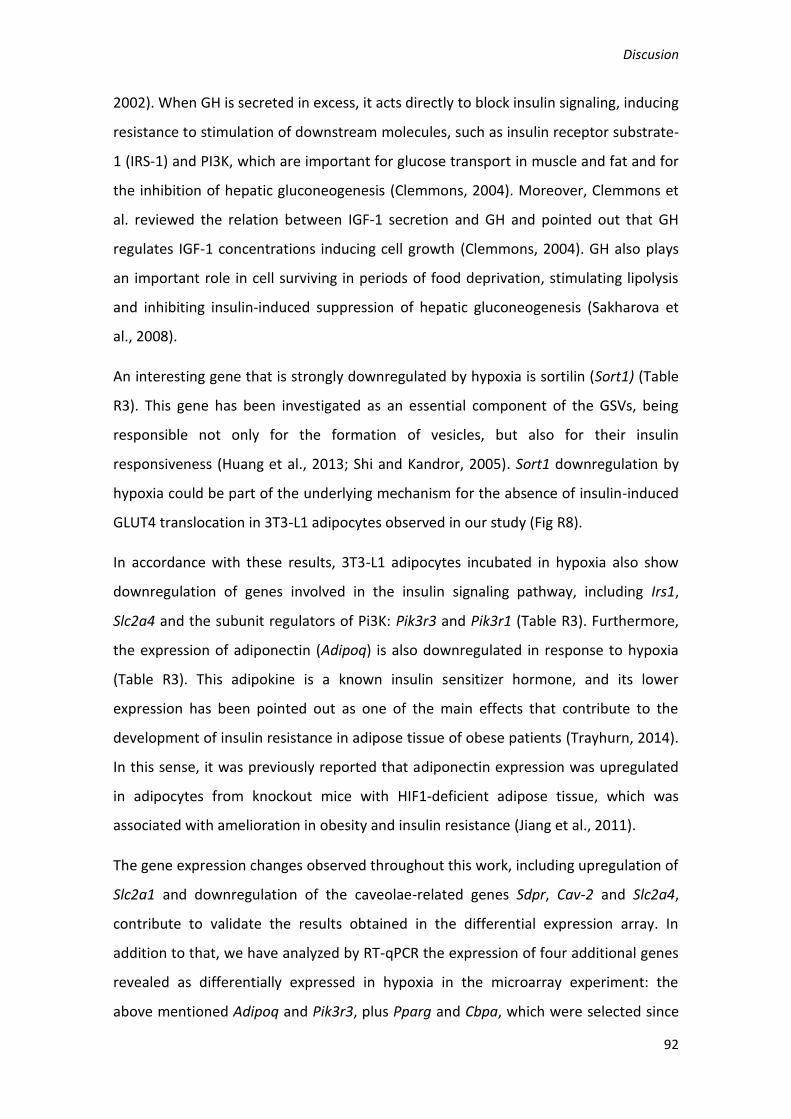
Discusion
92
2002). When GH is secreted in excess, it acts directly to block insulin signaling, inducing
resistance to stimulation of downstream molecules, such as insulin receptor substrate-
1 (IRS-1) and PI3K, which are important for glucose transport in muscle and fat and for
the inhibition of hepatic gluconeogenesis (Clemmons, 2004). Moreover, Clemmons et
al. reviewed the relation between IGF-1 secretion and GH and pointed out that GH
regulates IGF-1 concentrations inducing cell growth (Clemmons, 2004). GH also plays
an important role in cell surviving in periods of food deprivation, stimulating lipolysis
and inhibiting insulin-induced suppression of hepatic gluconeogenesis (Sakharova et
al., 2008).
An interesting gene that is strongly downregulated by hypoxia is sortilin (Sort1) (Table
R3). This gene has been investigated as an essential component of the GSVs, being
responsible not only for the formation of vesicles, but also for their insulin
responsiveness (Huang et al., 2013; Shi and Kandror, 2005). Sort1 downregulation by
hypoxia could be part of the underlying mechanism for the absence of insulin-induced
GLUT4 translocation in 3T3-L1 adipocytes observed in our study (Fig R8).
In accordance with these results, 3T3-L1 adipocytes incubated in hypoxia also show
downregulation of genes involved in the insulin signaling pathway, including Irs1,
Slc2a4 and the subunit regulators of Pi3K: Pik3r3 and Pik3r1 (Table R3). Furthermore,
the expression of adiponectin (Adipoq) is also downregulated in response to hypoxia
(Table R3). This adipokine is a known insulin sensitizer hormone, and its lower
expression has been pointed out as one of the main effects that contribute to the
development of insulin resistance in adipose tissue of obese patients (Trayhurn, 2014).
In this sense, it was previously reported that adiponectin expression was upregulated
in adipocytes from knockout mice with HIF1-deficient adipose tissue, which was
associated with amelioration in obesity and insulin resistance (Jiang et al., 2011).
The gene expression changes observed throughout this work, including upregulation of
Slc2a1 and downregulation of the caveolae-related genes Sdpr, Cav-2 and Slc2a4,
contribute to validate the results obtained in the differential expression array. In
addition to that, we have analyzed by RT-qPCR the expression of four additional genes
revealed as differentially expressed in hypoxia in the microarray experiment: the
above mentioned Adipoq and Pik3r3, plus Pparg and Cbpa, which were selected since
Discusion
93
they are directly involved in adipocyte differentiation, a process that, as discussed
earlier in this work, is strongly affected by hypoxia. The expression of all these genes,
which was reduced in the array experiment, was analyzed after 24 and 48 hours of
hypoxia. All these genes resulted significantly downregulated after 48 hours of
hypoxia, confirming the array results (Fig R18B). As a matter of fact, 24 hours of lower
oxygen levels were enough to downregulate the expression of all these genes except
Pparg, whose expression remained stable after this time (Fig R18A).
7. Strengths and limitations
This work provides new clues for the molecular mechanisms induced by hypoxia in
obesity and its comorbidities. Up to now, the experimental evidence of hypoxia effects
on the transcriptional regulation of genes involved in caveolae structure and function,
and the repercussion on insulin signaling in adipocytes, is limited. This question has
been only addressed by Regazzetti et al. using modern techniques (Regazzetti et al.,
2015). Our study complements their findings providing novel insights including the
identification of a HRE in Cav-1 promoter, using in silico analysis, and demonstrating
the ability of HIF-1 to bind to it, assayed by chromatin immunoprecipitation. The
methodology selected to study the transcriptional regulation of caveolae genes by HIF-
1, determines with high confidence the interaction between the transcription factor
and its binding elements in the target DNA. However, this study has some limitations.
For example, the use of functional techniques to measure the actual transcriptional-
regulatory activity of HIF-1 on Cav-1 promoter strength would allow to confirm this
finding.
One of the major concerns is the lack of assays studying gain or loss of function, which
would allow to establish a direct connection between the loss of caveolae integrity, the
disruption of insulin signaling and the other metabolic effects observed in adipocytes
after incubation in hypoxia. These experimental approaches are difficult to perform in
the cell line selected for this work, due to the limited transfection efficiency reported
(Kilroy et al., 2009).
In addition, most of the work was carried out in cultured cells since it is easier, less
expensive and provides a more homogenous response towards the different

Discusion
94
experimental conditions, including hypoxia. Nevertheless, it would be advisable to test
our hypothesis in animal models, or at least in primary adipocytes isolated from obese
animals or from rodents submitted to different models of hypoxia. The major
advantage of this approach is the ability to obtain adipocytes extracted from various
locations or depots, from animals of different ages or enduring different comorbidities,
as well as to take into account the important influence of other tissues, inflammation
or dietary factors.
Finally, the insufficient sample size used to obtain the results from the intermittent
hypoxia mouse model, and the lack of information about the protein expression
profile, make difficult to come to definitive conclusions regarding the effect of
intermittent hypoxia in the caveolae status and the subsequent dysregulation of
adipose tissue in these mice.
8. Corollary
In summary, this work corroborates the role of caveolae structure for the proper
functioning of insulin signaling and, therefore, for competent adipocyte physiology in
response to hypoxia, including adipogenesis and glucose metabolism. All models of
hypoxia assayed in this work induce the downregulation of genes essential for
caveolae formation and function that compromise also their integrity in the plasma
membrane. This effect is positively correlated with the loss of insulin responsiveness
and with the impairment of lipid metabolism in adipocytes. Moreover, this work shows
that HIF-1 is directly involved in the molecular regulation of this response mechanism,
since it regulates the expression of Cav-1 and seems to play also a role in the
regulation of Cav-2 and Sdpr expression. Furthermore, hypoxia importantly modifies
the overall gene expression pattern in adipocytes.
Broadening the knowledge of the response to hypoxia will contribute to the
elucidation of the underlying mechanisms related to the deleterious effects of low
oxygen in adipocytes, including the increase of GH and IGF-1 release, promotion of
insulin resistance through caveolae disruption, and downregulation of Sort1, which
could explain the absence of insulin-induced GLUT4 translocation to the plasma
membrane in 3T3-L1 adipocytes.

CONCLUSIONS


97
CONCLUSIONS
1. Chronic hypoxia strongly inhibits the 3T3-L1 adipocyte differentiation process.
2. Continuous hypoxia for 48 hours reduces the triglyceride content in 3T3-L1
mature adipocytes.
3. Continuous hypoxia for 48 hours downregulates insulin signaling and reduces
insulin-mediated GLUT4 translocation and glucose uptake, driving to
development of insulin resistance.
4. Continuous hypoxia for 48 hours increases GLUT1 expression, basal glucose
uptake and lactate production, clearly indicating a shift from aerobic to
anaerobic metabolism in adipocytes.
5. Hypoxia, whether chronic, continuous (48 hours) or intermittent, produces
alterations in caveolae structure, suggesting that caveolae disruption is
implicated in the development of obesity-related insulin resistance
6. The use of echinomycin, which inhibits HIF1 binding to Hypoxia Response
Elements (HRE), indicates that the expression of GLUT1 (Slc2a1) and GLUT4
(Slc2a4) genes is regulated by HIF-1 in hypoxic adipocytes, contributing to
explain the altered glucose uptake pattern observed in hypoxia.
7. The use of echinomycin also indicates that the expression of Cav-1, Cav-2 and
SDPR/Cavin-2 genes is regulated by HIF-1 in hypoxic adipocytes, contributing to
explain the changes in caveolae density observed in hypoxia.
8. Chromatin immunoprecipitation demonstrates that the hypoxia response
element present in mouse Cav-1 promoter (-442 TSS) is regulated directly by
HIF-1.
9. A microarray analysis of gene expression confirms that pathways related to
caveolae structure and function, insulin response, glucose transport and lipid
biosynthesis are affected by hypoxia. This analysis also highlights the
involvement of other genes such as Sort1, Ghrh and Igf in the effects of hypoxia
on adipocytes
10. In summary, hypoxia compromise caveolae integrity and function through the
downregulation of structural proteins by a Hif-1-dependent mechanism in

98
adipocytes, resulting in the impairment of insulin response and lipid
metabolism.

REFERENCES


References
101
REFERENCES
Ardissone, A., Bragato, C., Caffi, L., Blasevich, F., Maestrini, S., Bianchi, M.L., Morandi,
L., Moroni, I., and Mora, M. (2013). Novel PTRF mutation in a child with mild myopathy
and very mild congenital lipodystrophy. BMC Med. Genet. 14, 89.
Ariotti, N., Fern??ndez-Rojo, M.A., Zhou, Y., Hill, M.M., Rodkey, T.L., Inder, K.L., Tanner,
L.B., Wenk, M.R., Hancock, J.F., and Parton, R.G. (2014). Caveolae regulate the
nanoscale organization of the plasma membrane to remotely control Ras signaling. J.
Cell Biol. 204, 777–792.
Arsham, A.M., Howell, J.J., and Simon, M.C. (2003). A novel hypoxia-inducible factor-
independent hypoxic response regulating mammalian target of rapamycin and its
targets. J. Biol. Chem. 278, 29655–29660.
Bai, L., Deng, X., Li, J., Wang, M., Li, Q., An, W., a, D., and Cong, Y.-S. (2011). Regulation
of cellular senescence by the essential caveolar component PTRF/Cavin-1. Cell Res. 21,
1088–1101.
Bailey, C.J. (2005). Treating insulin resistance in type 2 diabetes with metformin and
thiazolidinediones. Diabetes. Obes. Metab. 7, 675–691.
Barja-Fernandez, S., Leis, R., Casanueva, F.F., and Seoane, L.M. (2014). Drug
development strategies for the treatment of obesity: How to ensure efficacy, safety,
and sustainable weight loss. Drug Des. Devel. Ther. 8, 2391–2400.
Bender, F.C., Reymond, M.A., Bron, C., and Quest, A.F.G. (2000). Caveolin-1 levels are
down-regulated in human colon tumors, and ectopic expression of caveolin-1 in colon
carcinoma cell lines reduces cell tumorigenicity. Cancer Res. 60, 5870–5878.
Bernlohr, D.A., Bolanowski, M.A., Kelly, T.J., and Lane, M.D. (1985). Evidence for an
increase in transcription of specific mRNAs during differentiation of 3T3-L1
preadipocytes. J. Biol. Chem. 260, 5563–5567.
Billaud, M., Lohman, A.W., Johnstone, S.R., Biwer, L.A., Mutchler, S., and Isakson, B.E.
(2014). Regulation of cellular communication by signaling microdomains in the blood
vessel wall. Pharmacol. Rev. 66, 513–569.

References
102
Boscher, C., and Nabi, I. (2012). Caveolin-1: role in cell signaling. Adv Exp Med Biol 29–
50.
Bourseau-Guilmain, E., Menard, J.A., Lindqvist, E., Indira Chandran, V., Christianson,
H.C., Cerezo Magaña, M., Lidfeldt, J., Marko-Varga, G., Welinder, C., and Belting, M.
(2016). Hypoxia regulates global membrane protein endocytosis through caveolin-1 in
cancer cells. Nat. Commun. 7, 11371.
Brahimi-Horn, M.C., and Pouysségur, J. (2007). Oxygen, a source of life and stress. FEBS
Lett. 581, 3582–3591.
Branza-Nichita, N., Macovei, A., and Lazar, C. (2012). Caveolae-Dependent Endocytosis
in Viral Infection. Mol. Regul. Endocytosis 1–32.
Briand, N., Prado, C., Mabilleau, G., Lasnier, F., Le Lièpvre, X., Covington, J.D., Ravussin,
E., Le Lay, S., and Dugail, I. (2014). Caveolin-1 expression and cavin stability regulate
caveolae dynamics in adipocyte lipid store fluctuation. Diabetes 63, 4032–4044.
Bruno, J., Brumfield, A., Chaudhary, N., Iaea, D., and McGraw, T.E. (2016). SEC16A is a
RAB10 effector required for insulin-stimulated GLUT4 trafficking in adipocytes. J. Cell
Biol. 214, jcb.201509052.
Bustin, S. (2000). Absolute quantification of mRNA using real-time reverse
transcription polymerase chain reaction assays. J. Mol. Endocrinol. 25, 169–193.
Campbell, L., Gumbleton, M., and Griffiths, D.F.R. (2003). Caveolin-1 overexpression
predicts poor disease-free survival of patients with clinically confined renal cell
carcinoma. Br. J. Cancer 89, 1909–1913.
Chan, C.K., and Vanhoutte, P.M. (2013). Hypoxia, vascular smooth muscles and
endothelium. Acta Pharm. Sin. B 3, 1–7.
Chen, B., Lam, K.S.L., Wang, Y., Wu, D., Lam, M.C., Shen, J., Wong, L., Hoo, R.L.C.,
Zhang, J., and Xu, A. (2006). Hypoxia dysregulates the production of adiponectin and
plasminogen activator inhibitor-1 independent of reactive oxygen species in
adipocytes. Biochem. Biophys. Res. Commun. 341, 549–556.
Cheng, J.P.X., and Nichols, B.J. (2016). Caveolae: One Function or Many? Trends Cell
References
103
Biol. 26, 177–189.
Choi, C.S., Kim, Y.-B., Lee, F.N., Zabolotny, J.M., Kahn, B.B., and Youn, J.H. (2002).
Lactate induces insulin resistance in skeletal muscle by suppressing glycolysis and
impairing insulin signaling. Am. J. Physiol. Endocrinol. Metab. 283, E233–E240.
Chrétien, A., Piront, N., Delaive, E., Demazy, C., Ninane, N., and Toussaint, O. (2008).
Increased abundance of cytoplasmic and nuclear caveolin 1 in human diploid
fibroblasts in H2O2-induced premature senescence and interplay with p38αMAPK.
FEBS Lett. 582, 1685–1692.
Christian K.Roberts, Andrea L.Hevener, and R.J.B. (2014). Metabolic Syndrome and
Insulin Resistance: Underlying Causes and Modification by Exercise Training. Compr
Physiol 3, 1–58.
Clarke, S.L., Robinson, C.E., and Gimble, J.M. (1997). CAAT / Enhancer Binding Proteins
Directly Modulate Transcription from the Peroxisome Proliferator- Activated Receptor
g 2 Promoter. Biochem. Biophys. Res. Commun. 240, 99–103.
Clemmons, D.R. (2004). The relative roles of growth hormone and IGF-1 in controlling
insulin sensitivity. J. Clin. Invest. 113, 25–27.
Cohen, A.W., Combs, T.P., Scherer, P.E., and Lisanti, M.P. (2003). Role of caveolin and
caveolae in insulin signaling and diabetes. Am. J. Physiol. Endocrinol. Metab. 285,
E1151–E1160.
Copland, J.A., Pardini, A.W., Wood, T.G., Yin, D., Green, A., Bodenburg, Y.H., Urban,
R.J., and Stuart, C.A. (2007). IGF-1 controls GLUT3 expression in muscle via the
transcriptional factor Sp1. Biochim. Biophys. Acta - Gene Struct. Expr. 1769, 631–640.
Costa, V., Foti, D., Paonessa, F., Chiefari, E., Palaia, L., Brunetti, G., Gulletta, E., Fusco,
a, and Brunetti, a (2008). The insulin receptor: a new anticancer target for peroxisome
proliferator-activated receptor-gamma (PPARgamma) and thiazolidinedione-
PPARgamma agonists. Endocr. Relat. Cancer 15, 325–335.
Czech, M.P., Tencerova, M., Pedersen, D.J., and Aouadi, M. (2013). Insulin signalling
mechanisms for triacylglycerol storage. Diabetologia 56, 949–964.

References
104
Deng, W., Feng, X., Li, X., Wang, D., and Sun, L. (2016). Hypoxia-inducible factor 1 in
autoimmune diseases. Cell. Immunol. 303, 7–15.
Després, J.P. (2012). Body fat distribution and risk of cardiovascular disease: An
update. Circulation 126, 1301–1313.
Dewan, N.A., Nieto, F.J., and Somers, V.K. (2015). Intermittent hypoxemia and OSA:
Implications for comorbidities. Chest 147, 266–274.
DiGirolamo, M., Newby, F.D., and Lovejoy, J. (1992). Lactate production in adipose
tissue: a regulated function with extra-adipose implications. FASEB J. 6, 2405–2412.
Dijk, W., Beigneux, A.P., Larsson, M., Bensadoun, A., Young, S.G., and Kersten, S.
(2016). Angiopoietin-like 4 (ANGPTL4) promotes intracellular degradation of
lipoprotein lipase in adipocytes. J. Lipid Res. 7, 956–963.
Drab, M., Verkade, P., Elger, M., Kasper, M., Lohn, M., Lauterbach, B., Menne, J.,
Lindschau, C., Mende, F., Luft, F.C., et al. (2001). Loss of caveolae, vascular dysfunction,
and pulmonary defects in caveolin-1 gene-disrupted mice. Science (80-. ). 293, 2449–
2452.
Echarri, A., and Del Pozo, M.A. (2015). Caveolae - mechanosensitive membrane
invaginations linked to actin filaments. J. Cell Sci. 128, 2747–2758.
Fagerholm, S., Örtegren, U., Karlsson, M., Ruishalme, I., and Strålfors, P. (2009). Rapid
insulin-dependent endocytosis of the insulin receptor by caveolae in primary
adipocytes. PLoS One 4.
Fisslthaler, B., Benzing, T., Busse, R., and Fleming, I. (2003). Insulin enhances the
expression of the endothelial nitric oxide synthase in native endothelial cells: A dual
role for Akt and AP-1. Nitric Oxide - Biol. Chem. 8, 253–261.
Foti, D., Iuliano, R., Chiefari, E., and Brunetti, A. (2003). A nucleoprotein complex
containing Sp1, C/EBP beta, and HMGI-Y controls human insulin receptor gene
transcription. Mol. Cell. Biol. 23, 2720–2732.
Fra, A.M., Williamson, E., Simons, K., and Parton, R.G. (1995). De novo formation of
caveolae in lymphocytes by expression of VIP21-caveolin. Proc. Natl. Acad. Sci. U. S. A.

References
105
92, 8655–8659.
Fridlyand, L.E., and Philipson, L.H. (2006). Reactive species and early manifestation of
insulin resistance in type 2 diabetes. Diabetes. Obes. Metab. 8, 136–145.
Fu, Q.F., Liu, Y., Fan, Y., Hua, S.N., Qu, H.Y., Dong, S.W., Li, R.L., Zhao, M.Y., Zhen, Y., Yu,
X.L., et al. (2015). Alpha-enolase promotes cell glycolysis, growth, migration, and
invasion in non-small cell lung cancer through FAK-mediated PI3K/AKT pathway. J
Hematol Oncol 8, 22.
García-Fuentes, E., Santiago-Fernández, C., Gutiérrez-Repiso, C., Mayas, M.D., Oliva-
Olivera, W., Coín-Aragüez, L., Alcaide, J., Ocaña-Wilhelmi, L., Vendrell, J., Tinahones,
F.J., et al. (2015). Hypoxia is associated with a lower expression of genes involved in
lipogenesis in visceral adipose tissue. J. Transl. Med. 13, 373.
Gentleman, R. (2005). Bioinformatics and computational biology solutions using R and
Bioconductor.
Ghofrani, H.A., Voswinckel, R., Reichenberger, F., Weissmann, N., Schermuly, R.T.,
Seeger, W., and Grimminger, F. (2006). Hypoxia- and non-hypoxia-related pulmonary
hypertension - Established and new therapies. Cardiovasc. Res. 72, 30–40.
Ginsberg, H.N. (2000). Insulin resistance and cardiovascular disease. J. Clin. Invest. 106,
453–458.
Gl??ck, A.A., Aebersold, D.M., Zimmer, Y., and Medov??, M. (2015). Interplay between
receptor tyrosine kinases and hypoxia signaling in cancer. Int. J. Biochem. Cell Biol. 62,
101–114.
González-Muniesa, P., De Oliveira, C., Pérez De Heredia, F., Thompson, M.P., and
Trayhurn, P. (2011). Fatty acids and hypoxia stimulate the expression and secretion of
the adipokine ANGPTL4 (angiopoietin-like protein 4/ fasting-induced adipose factor) by
human adipocytes. J. Nutrigenet. Nutrigenomics 4, 146–153.
González-Muñoz, E., López-Iglesias, C., Calvo, M., Palacín, M., Zorzano, A., and Camps,
M. (2009). Caveolin-1 loss of function accelerates glucose transporter 4 and insulin
receptor degradation in 3T3-L1 adipocytes. Endocrinology 150, 3493–3502.
References
106
Goossens, G.H., and Blaak, E.E. (2015). Adipose Tissue Dysfunction and Impaired
Metabolic Health in Human Obesity: A Matter of Oxygen? Front. Endocrinol.
(Lausanne). 6, 1–5.
Govers, E. (2015). Obesity and Insulin Resistance Are the Central Issues in Prevention
of and Care for Comorbidities. Healthcare 3, 408–416.
Gregoire, F.M., Smas, C.M., and Sul, H.S. (1998). Understanding adipocyte
differentiation. Physiol. Rev. 78, 783–809.
Gustavsson, J., Parpal, S., and Strålfors, P. (1996). Insulin-stimulated glucose uptake
involves the transition of glucose transporters to a caveolae-rich fraction within the
plasma membrane: implications for type II diabetes. Mol. Med. 2, 367–372.
Gustavsson, J., Parpal, S., Karlsson, M., Ramsing, C., Thorn, H., Borg, M., Lindroth, M.,
Peterson, K.H., Magnusson, K.E., and Strâlfors, P. (1999). Localization of the insulin
receptor in caveolae of adipocyte plasma membrane. FASEB J. 13, 1961–1971.
Hagen, T., Taylor, C.T., Lam, F., and Moncada, S. (2003). Redistribution of intracellular
oxygen in hypoxia by nitric oxide: effect on HIF1alpha. Science 302, 1975–1978.
Hansen, C.G., Bright, N.A., Howard, G., and Nichols, B.J. (2009). SDPR induces
membrane curvature and functions in the formation of caveolae. Nat Cell Biol 11, 807–
814.
Hansen, C.G., Shvets, E., Howard, G., Riento, K., and Nichols, B.J. (2013). Deletion of
cavin genes reveals tissue-specific mechanisms for morphogenesis of endothelial
caveolae. Nat. Commun. 4, 1831.
Harris, A.L. (2002). Hypoxia — a Key Regulatory Factor in Tumour Growth. Nat. Rev.
Cancer 2, 38–47.
Hashimoto, T., Yokokawa, T., Endo, Y., Iwanaka, N., Higashida, K., and Taguchi, S.
(2013). Modest hypoxia significantly reduces triglyceride content and lipid droplet size
in 3T3-L1 adipocytes. Biochem. Biophys. Res. Commun. 440, 43–49.
Hayashi, M., Sakata, M., Takeda, T., Yamamoto, T., Okamoto, Y., Sawada, K., Kimura,
A., Minekawa, R., Tahara, M., Tasaka, K., et al. (2004). Induction of glucose transporter

References
107
1 expression through hypoxia-inducible factor 1?? under hypoxic conditions in
trophoblast-derived cells. J. Endocrinol. 183, 145–154.
Henry, R.R. (2003). Insulin resistance: From predisposing factor to therapeutic target in
type 2 diabetes. Clin. Ther. 25.
Hill, M.M., Bastiani, M., Luetterforst, R., Kirkham, M., Kirkham, A., Nixon, S.J., Walser,
P., Abankwa, D., Oorschot, V.M.J., Martin, S., et al. (2008). PTRF-Cavin, a Conserved
Cytoplasmic Protein Required for Caveola Formation and Function. Cell 132, 113–124.
Holdsworth, M., El Ati, J., Bour, A., Kameli, Y., Derouiche, A., Millstone, E., and
Delpeuch, F. (2013). Developing national obesity policy in middle-income countries: A
case study from North Africa. Health Policy Plan. 28, 858–870.
Hosogai, N., Fukuhara, A., Oshima, K., Miyata, Y., Tanaka, S., Segawa, K., Furukawa, S.,
Tochino, Y., Komuro, R., Matsuda, M., et al. (2007). Adipose tissue hypoxia in obesity
and its impact on adipocytokine dysregulation. Diabetes 56, 901–911.
Huang, S., and Czech, M.P. (2007). The GLUT4 Glucose Transporter. Cell Metab. 5, 237–
252.
Huang, G., Buckler-Pena, D., Nauta, T., Singh, M., Asmar, A., Shi, J., Kim, J.Y., and
Kandror, K. V (2013). Insulin responsiveness of glucose transporter 4 in 3T3-L1 cells
depends on the presence of sortilin. Mol. Biol. Cell 24, 3115–3122.
Hubbard, S.R. (1997). Crystal structure of the activated insulin receptor tyrosine kinase
in complex with peptide substrate and ATP analog. EMBO J. 16, 5572–5581.
Hurt, R.T., Frazier, T.H., McClave, S.A., and Kaplan, L.M. (2011). Obesity epidemic:
overview, pathophysiology, and the intensive care unit conundrum. JPEN. J. Parenter.
Enteral Nutr. 35, 4S–13S.
Iiyori, N., Alonso, L.C., Li, J., Sanders, M.H., Garcia-Ocana, A., O’Doherty, R.M., Polotsky,
V.Y., and O’Donnell, C.P. (2007). Intermittent hypoxia causes insulin resistance in lean
mice independent of autonomic activity. Am. J. Respir. Crit. Care Med. 175, 851–857.
Ip, M.S.M., Lam, B., Ng, M.M.T., Lam, W.K., Tsang, K.W.T., and Lam, K.S.L. (2002).
Obstructive sleep apnea is independently associated with insulin resistance. Am. J.

References
108
Respir. Crit. Care Med. 165, 670–676.
Irizarry, R.A., Bolstad, B.M., Collin, F., Cope, L.M., Hobbs, B., and Speed, T.P. (2003).
Summaries of Affymetrix GeneChip probe level data. Nucleic Acids Res. 31, e15.
Isshiki, M., Ando, J., Yamamoto, K., Fujita, T., Ying, Y., and Anderson, R.G.W. (2002).
Sites of Ca(2+) wave initiation move with caveolae to the trailing edge of migrating
cells. J. Cell Sci. 115, 475–484.
Jansa, P., Mason, S.W., Hoffmann-Rohrer, U., and Grummt, I. (1998). Cloning and
functional characterization of PTRF, a novel protein which induces dissociation of
paused ternary transcription complexes. EMBO J. 17, 2855–2864.
Je, H.-D., Gallant, C., Leavis, P.C., and Morgan, K.G. (2004). Caveolin-1 regulates
contractility in differentiated vascular smooth muscle. Am. J. Physiol. Heart Circ.
Physiol. 286, H91–H98.
Jiang, C., Qu, A., Matsubara, T., Chanturiya, T., Jou, W., Gavrilova, O., Shah, Y.M., and
Gonzalez, F.J. (2011). Disruption of hypoxia-inducible factor 1 in adipocytes improves
insulin sensitivity and decreases adiposity in high-fat diet-fed mice. Diabetes 60, 2484–
2495.
Jiang, C., Kim, J.-H., Li, F., Qu, A., Gavrilova, O., Shah, Y.M., and Gonzalez, F.J. (2013).
Hypoxia-inducible factor 1α regulates a SOCS3-STAT3-adiponectin signal transduction
pathway in adipocytes. J. Biol. Chem. 288, 3844–3857.
Jiménez, C., Hernández, C., Pimentel, B., and Carrera, A.C. (2002). The p85 regulatory
subunit controls sequential activation of phosphoinositide 3-kinase by Tyr kinases and
Ras. J. Biol. Chem. 277, 41556–41562.
Kabayama, K., Sato, T., Saito, K., Loberto, N., Prinetti, A., Sonnino, S., Kinjo, M.,
Igarashi, Y., and Inokuchi, J. (2007). Dissociation of the insulin receptor and caveolin-1
complex by ganglioside GM3 in the state of insulin resistance. Proc. Natl. Acad. Sci. U.
S. A. 104, 13678–13683.
Kadowaki, T., Yamauchi, T., Kubota, N., Hara, K., Ueki, K., and Tobe, K. (2006).
Adiponectin and adiponectin receptors in insulin resistance , diabetes , and the

References
109
metabolic syndrome. Www . Jci . Org 116.
Kaelin, W.G., and Ratcliffe, P.J. (2008). Oxygen Sensing by Metazoans: The Central Role
of the HIF Hydroxylase Pathway. Mol. Cell 30, 393–402.
Kannan, A., Krishnan, A., Ali, M., Subramaniam, S., Halagowder, D., and
Sivasithamparam, N.D. (2014). Caveolin-1 promotes gastric cancer progression by up-
regulating epithelial to mesenchymal transition by crosstalk of signalling mechanisms
under hypoxic condition. Eur. J. Cancer 50, 204–215.
Karam, J.A., Lotan, Y., Roehrborn, C.G., Ashfaq, R., Karakiewicz, P.I., and Shariat, S.F.
(2007). Caveolin-1 overexpression is associated with aggressive prostate cancer
recurrence. Prostate 67, 614–622.
Karpe, F., Fielding, B. a, Ilic, V., Macdonald, I. a, Summers, L.K.M., and Frayn, K.N.
Response Is Related to Aspects of Insulin Sensitivity. 2, 2467–2473.
Kilroy, G., Burk, D.H., and Floyd, Z.E. (2009). High efficiency lipid-based siRNA
transfection of adipocytes in suspension. PLoS One 4, 1–8.
Kim, D.S., Ko, Y.J., Lee, M.W., Park, H.J., Park, Y.J., Kim, D.I., Sung, K.W., Koo, H.H., and
Yoo, K.H. (2016). Effect of low oxygen tension on the biological characteristics of
human bone marrow mesenchymal stem cells. Cell Stress Chaperones 1–11.
Klein, R. (1995). Hyperglycemia and microvascular and macrovascular disease in
diabetes. In Diabetes Care, pp. 258–268.
Koritzinsky, M., Rouschop, K.M.A., van den Beucken, T., Magagnin, M.G., Savelkouls,
K., Lambin, P., and Wouters, B.G. (2007). Phosphorylation of eIF2?? is required for
mRNA translation inhibition and survival during moderate hypoxia. Radiother. Oncol.
83, 353–361.
Koumenis, C., Naczki, C., Koritzinsky, M., Rastani, S., Diehl, A., Sonenberg, N.,
Koromilas, A., and Wouters, B.G. (2002). Regulation of protein synthesis by hypoxia via
activation of the endoplasmic reticulum kinase PERK and phosphorylation of the
translation initiation factor eIF2alpha. Mol. Cell. Biol. 22, 7405–7416.
Lee, K., Kang, J.E., Park, S.K., Jin, Y., Chung, K.S., Kim, H.M., Lee, K., Kang, M.R., Lee,

References
110
M.K., Song, K. Bin, et al. (2010). LW6, a novel HIF-1 inhibitor, promotes proteasomal
degradation of HIF-1α via upregulation of VHL in a colon cancer cell line. Biochem.
Pharmacol. 80, 982–989.
Lee, K.Y., Gesta, S., Boucher, J., Wang, X.L., and Kahn, C.R. (2011). The differential role
of Hif1β/Arnt and the hypoxic response in adipose function, fibrosis, and inflammation.
Cell Metab. 14, 491–503.
Leiherer, A., Geiger, K., Muendlein, A., and Drexel, H. (2014). Hypoxia induces a HIF-1??
dependent signaling cascade to make a complex metabolic switch in SGBS-adipocytes.
Mol. Cell. Endocrinol. 383, 21–31.
Lévy, P., Pépin, J.L., Arnaud, C., Tamisier, R., Borel, J.C., Dematteis, M., Godin-Ribuot,
D., and Ribuot, C. (2008). Intermittent hypoxia and sleep-disordered breathing: Current
concepts and perspectives. Eur. Respir. J. 32, 1082–1095.
Liu, L., and Pilch, P.F. (2008). A critical role of cavin (polymerase I and transcript release
factor) in caveolae formation and organization. J. Biol. Chem. 283, 4314–4322.
Liu, L., and Pilch, P.F. (2016). PTRF/Cavin-1 promotes efficient ribosomal RNA
transcription in response to metabolic challenges. Elife 5, 1–20.
Liu, L., Brown, D., McKee, M., LeBrasseur, N.K., Yang, D., Albrecht, K.H., Ravid, K., and
Pilch, P.F. (2008). Deletion of Cavin/PTRF Causes Global Loss of Caveolae, Dyslipidemia,
and Glucose Intolerance. Cell Metab. 8, 310–317.
Liu, L., Hansen, C.G., Honeyman, B.J., Nichols, B.J., and Pilch, P.F. (2014). Cavin-3
knockout mice show that cavin-3 is not essential for caveolae formation, for
maintenance of body composition, or for glucose tolerance. PLoS One 9, 1–8.
Liu, P., Cheng, H., Roberts, T.M., and Zhao, J.J. (2009). Targeting the phosphoinositide
3-kinase pathway in cancer. Nat. Rev. Drug Discov. 8, 627–644.
Lolmède, K., Durand de Saint Front, V., Galitzky, J., Lafontan, M., and Bouloumié, a
(2003). Effects of hypoxia on the expression of proangiogenic factors in differentiated
3T3-F442A adipocytes. Int. J. Obes. Relat. Metab. Disord. 27, 1187–1195.
Lopes, H.F., Corrêa-Giannella, M.L., Consolim-Colombo, F.M., and Egan, B.M. (2016).

References
111
Visceral adiposity syndrome. Diabetol. Metab. Syndr. 8, 40.
Losso, J.N., and Bawadi, H.A. (2005). Hypoxia inducible factor pathways as targets for
functional foods. J. Agric. Food Chem. 53, 3751–3768.
Louis, M., and Punjabi, N.M. (2009). Effects of acute intermittent hypoxia on glucose
metabolism in awake healthy volunteers. 1538–1544.
Low Wang, C.C., Goalstone, M.L., and Draznin, B. (2004). Impact Cardiovascular
Biology. Diabetes 53, 2735–2740.
Lu, H., Gao, Z., Zhao, Z., Weng, J., and Ye, J. (2016). Transient hypoxia reprograms
differentiating adipocytes for enhanced insulin sensitivity and triglyceride
accumulation. Int. J. Obes. (Lond). 40, 121–128.
Mahat, B., Chassé, É., Mauger, J.-F., and Imbeault, P. (2016). Effects of acute hypoxia
on human adipose tissue lipoprotein lipase activity and lipolysis. J. Transl. Med. 14,
212.
Makoveichuk, E., Vorrsjö, E., Olivecrona, T., and Olivecrona, G. (2013). Inactivation of
lipoprotein lipase in 3T3-L1 adipocytes by angiopoietin-like protein 4 requires that
both proteins have reached the cell surface. Biochem. Biophys. Res. Commun. 441,
941–946.
Martinez-Outschoorn, U.E., Sotgia, F., and Lisanti, M.P. (2015). Caveolae and signalling
in cancer. Nat. Rev. Cancer 15, 225–237.
Mazzatti, D., Lim, F.-L., O’Hara, A., Wood, I.S., and Trayhurn, P. (2012). A microarray
analysis of the hypoxia-induced modulation of gene expression in human adipocytes.
Arch. Physiol. Biochem. 118, 112–120.
McMahon, K.-A., Zajicek, H., Li, W.-P., Peyton, M.J., Minna, J.D., Hernandez, V.J., Luby-
Phelps, K., and Anderson, R.G.W. (2009). SRBC/cavin-3 is a caveolin adapter protein
that regulates caveolae function. EMBO J. 28, 1001–1015.
Mekhail, K., Rivero-Lopez, L., Khacho, M., and Lee, S. (2006). Restriction of rRNA
synthesis by VHL maintains energy equilibrium under hypoxia. Cell Cycle 5, 2401–2413.
Meshulam, T., Breen, M.R., Liu, L., Parton, R.G., and Pilch, P.F. (2011).

References
112
Caveolins/caveolae protect adipocytes from fatty acid-mediated lipotoxicity. J. Lipid
Res. 52, 1526–1532.
Mlinar, B., Marc, J., Jane??, A., and Pfeifer, M. (2007). Molecular mechanisms of insulin
resistance and associated diseases. Clin. Chim. Acta 375, 20–35.
Monier, S., Dietzen, D.J., Hastings, W.R., Lublin, D.M., and Kurzchalia, T. V. (1996).
Oligomerization of VIP21-caveolin in vitro is stabilized by long chain fatty acylation or
cholesterol. FEBS Lett. 388, 143–149.
Murata, M., Peranen, J., Schreiner, R., Wieland, F., Kurzchalia, T. V, and Simons, K.
(1995). VIP21/caveolin is a cholesterol-binding protein. Proc. Natl. Acad. Sci. U. S. A.
92, 10339–10343.
Ntambi, M.J., and Kim, Y.-C. (2000). Symposium: Adipocyte Function, Differentiation
and Metabolism Regulation of Leptin Production in Humans. J. Nutr 130, 3127–3131.
Nystrom, F.H., Chen, H., Cong, L.N., Li, Y., and Quon, M.J. (1999). Caveolin-1 interacts
with the insulin receptor and can differentially modulate insulin signaling in
transfected Cos-7 cells and rat adipose cells. Mol. Endocrinol. 13, 2013–2024.
O’Rourke, R.W., Meyer, K.A., Gaston, G., White, A.E., Lumeng, C.N., and Marks, D.L.
(2013). Hexosamine Biosynthesis Is a Possible Mechanism Underlying Hypoxia’s Effects
on Lipid Metabolism in Human Adipocytes. PLoS One 8.
Ohga, E., Tomita, T., Wada, H., Yamamoto, H., Nagase, T., and Ouchi, Y. (2003). Effects
of obstructive sleep apnea on circulating ICAM-1, IL-8, and MCP-1. J. Appl. Physiol. 94,
179–184.
De Oliveira, E.M., Sandri, S., Knebel, F.H., Contesini, C.G.I., Campa, A., and Filippin-
Monteiro, F.B. (2013). Hypoxia increases serum amyloid A3 (SAA3) in differentiated
3T3-L1 adipocytes. Inflammation 36, 1107–1110.
Ortiz-Barahona, A., Villar, D., Pescador, N., Amigo, J., and del Peso, L. (2010). Genome-
wide identification of hypoxia-inducible factor binding sites and target genes by a
probabilistic model integrating transcription-profiling data and in silico binding site
prediction. Nucleic Acids Res. 38, 2332–2345.

References
113
Oshikawa, J., Otsu, K., Toya, Y., Tsunematsu, T., Hankins, R., Kawabe, J., Minamisawa,
S., Umemura, S., Hagiwara, Y., and Ishikawa, Y. (2004). Insulin resistance in skeletal
muscles of caveolin-3-null mice. Proc. Natl. Acad. Sci. U. S. A. 101, 12670–12675.
Otsu, K., Toya, Y., Oshikawa, J., Kurotani, R., Yazawa, T., Sato, M., Yokoyama, U.,
Umemura, S., Minamisawa, S., Okumura, S., et al. (2010). Caveolin gene transfer
improves glucose metabolism in diabetic mice. 450–456.
Palacios-Ortega, S., Varela-Guruceaga, M., Milagro, F.I.F.I., Mart??nez, J.A., De Miguel,
C., Martínez, J.A., and De Miguel, C. (2014). Expression of caveolin 1 is enhanced by
DNA demethylation during adipocyte differentiation. Status of insulin signaling. PLoS
One 9.
Palacios-Ortega, S., Varela-Guruceaga, M., Algarabel, M., Milagro, F.I.F.I., Martínez,
J.A., De Miguel, C., Mart�nez, J.A., and De Miguel, C. (2015). Effect of TNF-Alpha on
Caveolin-1 Expression and Insulin Signaling during Adipocyte Differentiation and in
Mature Adipocytes. Cell. Physiol. Biochem. 36, 1499–1516.
Parpal, S., Karlsson, M., Thorn, H., and Strålfors, P. (2001). Cholesterol Depletion
Disrupts Caveolae and Insulin Receptor Signaling for Metabolic Control via Insulin
Receptor Substrate-1, but Not for Mitogen-activated Protein Kinase Control. J. Biol.
Chem. 276, 9670–9678.
Parton, R.G., and del Pozo, M. a (2013). Caveolae as plasma membrane sensors,
protectors and organizers. Nat. Rev. Mol. Cell Biol. 14, 98–112.
Parton, R.G., and Simons, K. (2007). The multiple faces of caveolae. Nat. Rev. Mol. Cell
Biol. 8, 185–194.
Perl, A. (2015). MTOR activation is a biomarker and a central pathway to autoimmune
disorders, cancer, obesity, and aging. Ann. N. Y. Acad. Sci. 1346, 33–44.
Polotsky, V.Y., Li, J., Punjabi, N.M., Rubin, A.E., Smith, P.L., Schwartz, A.R., and
O’Donnell, C.P. (2003). Intermittent hypoxia increases insulin resistance in genetically
obese mice. J. Physiol. 552, 253–264.
Poulain, L., Richard, V., Lévy, P., Dematteis, M., and Arnaud, C. (2015). Toll-like
References
114
receptor-4 mediated inflammation is involved in the cardiometabolic alterations
induced by intermittent hypoxia. Mediators Inflamm. 2015.
Qatanani, M., and Lazar, M.A. (2007). Mechanisms of obesity-associated insulin
resistance: Many choices on the menu. Genes Dev. 21, 1443–1455.
Rausch, M.E., Weisberg, S., Vardhana, P., and Tortoriello, D. V. (2008). Obesity in
C57BL/6J mice is characterized by adipose tissue hypoxia and cytotoxic T-cell
infiltration. Int. J. Obes. 32, 451–463.
Razani, B., Engelman, J.A., Wang, X.B., Schubert, W., Zhang, X.L., Marks, C.B.,
Macaluso, F., Russell, R.G., Li, M., Pestell, R.G., et al. (2001). Caveolin-1 null mice are
viable, but show evidence of hyper- proliferative and vascular abnormalities. J Biol
Chem 16, 16.
Razani, B., Combs, T.P., Wang, X.B., Frank, P.G., Park, D.S., Russell, R.G., Li, M., Tang, B.,
Jelicks, L.A., Scherer, P.E., et al. (2002). Caveolin-1-deficient mice are lean, resistant to
diet-induced obesity, and show hypertriglyceridemia with adipocyte abnormalities. J.
Biol. Chem. 277, 8635–8647.
Regazzetti, C., Peraldi, P., Gre, T., Najem-lendom, R., Ben-sahra, I., Cormont, M., and
Marchand-brustel, Y. Le (2009). Hypoxia Decreases Insulin Signaling Pathways in.
Diabetes 58, 95–103.
Regazzetti, C., Dumas, K., Lacas-Gervais, S., Pastor, F., Peraldi, P., Bonnafous, S.S.S.,
Dugail, I., Le Lay, S., Valet, P., Le Marchand-Brustel, Y., et al. (2015). Hypoxia inhibits
cavin-1 and cavin-2 expression and down-regulates caveolae in adipocytes.
Endocrinology 156, 789–801.
Rochford, J.J. (2014). Mouse models of lipodystrophy and their significance in
understanding fat regulation (Elsevier Inc.).
Romero-Ramirez, L., Cao, H., Nelson, D., Hammond, E., Lee, A.H., Yoshida, H., Mori, K.,
Glimcher, L.H., Denko, N.C., Giaccia, A.J., et al. (2004). XBP1 is essential for survival
under hypoxic conditions and is required for tumor growth. Cancer Res. 64, 5943–
5947.

References
115
Rose, D.R., and Clemmons, D.R. (2002). Growth hormone receptor antagonist improves
insulin resistance in acromegaly. Growth Horm. IGF Res. 12, 418–424.
Ruiz de Galarreta, M., Navarro, A., Ansorena, E., Garcia Garzón, A., Mòdol, T., López-
Zabalza, M.J., Martínez-Irujo, J.J., and Iraburu, M.J. (2016). Unfolded protein response
induced by Brefeldin A increases collagen type I levels in hepatic stellate cells through
an IRE1α, p38 MAPK and Smad-dependent pathway. Biochim. Biophys. Acta - Mol. Cell
Res. 1863, 2115–2123.
Sakagami, H., Makino, Y., Mizumoto, K., Isoe, T., Takeda, Y., Watanabe, J., Fujita, Y.,
Takiyama, Y., Abiko, A., and Haneda, M. (2014). Loss of HIF-1α impairs GLUT4
translocation and glucose uptake by the skeletal muscle cells. Am. J. Physiol.
Endocrinol. Metab. 306, E1065-76.
Sakharova, A.A., Horowitz, J.F., Surya, S., Goldenberg, N., Harber, M.P., Symons, K., and
Barkan, A. (2008). Role of growth hormone in regulating lipolysis, proteolysis, and
hepatic glucose production during fasting. J. Clin. Endocrinol. Metab. 93, 2755–2759.
Samuvel, D.J., Sundararaj, K.P., Nareika, A., Lopes-Virella, M.F., and Huang, Y. (2009).
Lactate boosts TLR4 signaling and NF-kappaB pathway-mediated gene transcription in
macrophages via monocarboxylate transporters and MD-2 up-regulation. J. Immunol.
(Baltimore, Md. 1950) 182, 2476–2484.
Sano, H. (2003). Insulin-stimulated Phosphorylation of a Rab GTPase-activating Protein
Regulates GLUT4 Translocation. J. Biol. Chem. 278, 14599–14602.
Scherer, P.E., Lisanti, M.P., Baldini, G., Sargiacomo, M., Mastick, C.C., and Lodish, H.F.
(1994). Induction of caveolin during adipogenesis and association of GLUT4 with
caveolin-rich vesicles. J. Cell Biol. 127, 1233–1243.
Schrauwen, I., Szelinger, S., Siniard, A.L., Kurdoglu, A., Corneveaux, J.J., Malenica, I.,
Richholt, R., Van Camp, G., De Both, M., Swaminathan, S., et al. (2015). A frame-shift
mutation in CAV1 is associated with a severe neonatal progeroid and lipodystrophy
syndrome. PLoS One 10, 1–13.
Schulz, R., Mahmoudi, S., Hattar, K., Sibelius, U.L.F., Olschewski, H., Mayer, K., Seeger,
W., and Grimminger, F. (2000). Enhanced release of superoxide from
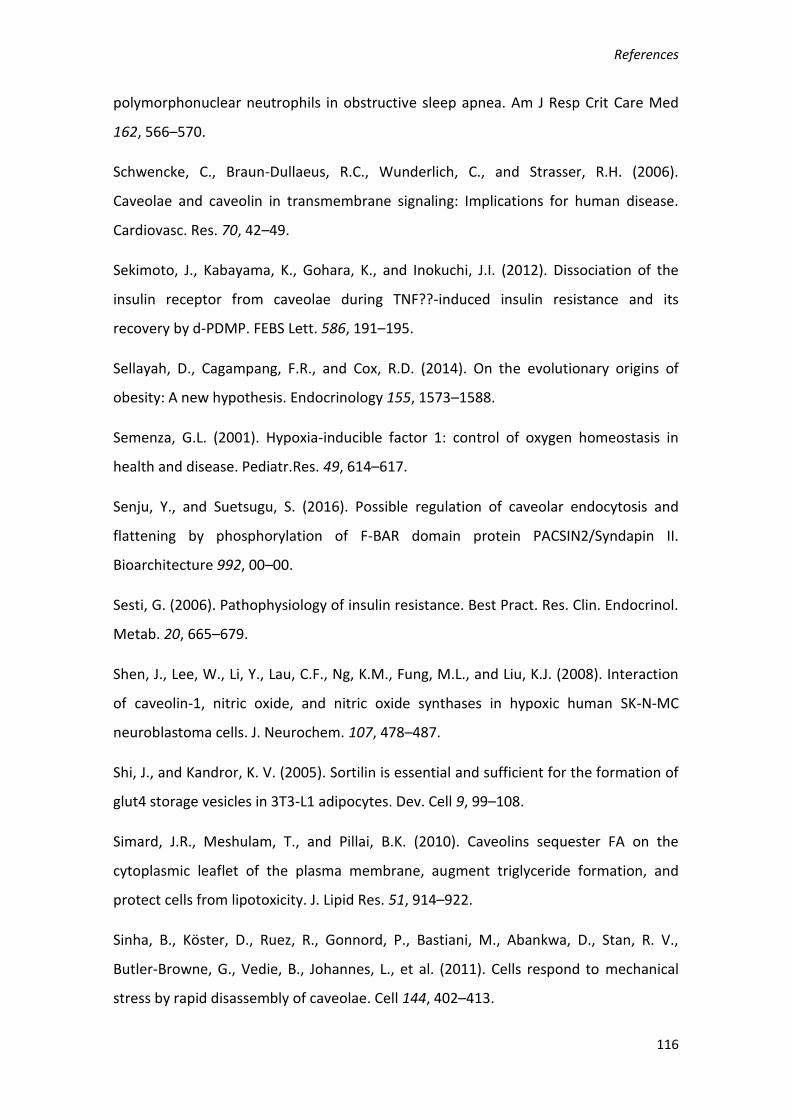
References
116
polymorphonuclear neutrophils in obstructive sleep apnea. Am J Resp Crit Care Med
162, 566–570.
Schwencke, C., Braun-Dullaeus, R.C., Wunderlich, C., and Strasser, R.H. (2006).
Caveolae and caveolin in transmembrane signaling: Implications for human disease.
Cardiovasc. Res. 70, 42–49.
Sekimoto, J., Kabayama, K., Gohara, K., and Inokuchi, J.I. (2012). Dissociation of the
insulin receptor from caveolae during TNF??-induced insulin resistance and its
recovery by d-PDMP. FEBS Lett. 586, 191–195.
Sellayah, D., Cagampang, F.R., and Cox, R.D. (2014). On the evolutionary origins of
obesity: A new hypothesis. Endocrinology 155, 1573–1588.
Semenza, G.L. (2001). Hypoxia-inducible factor 1: control of oxygen homeostasis in
health and disease. Pediatr.Res. 49, 614–617.
Senju, Y., and Suetsugu, S. (2016). Possible regulation of caveolar endocytosis and
flattening by phosphorylation of F-BAR domain protein PACSIN2/Syndapin II.
Bioarchitecture 992, 00–00.
Sesti, G. (2006). Pathophysiology of insulin resistance. Best Pract. Res. Clin. Endocrinol.
Metab. 20, 665–679.
Shen, J., Lee, W., Li, Y., Lau, C.F., Ng, K.M., Fung, M.L., and Liu, K.J. (2008). Interaction
of caveolin-1, nitric oxide, and nitric oxide synthases in hypoxic human SK-N-MC
neuroblastoma cells. J. Neurochem. 107, 478–487.
Shi, J., and Kandror, K. V. (2005). Sortilin is essential and sufficient for the formation of
glut4 storage vesicles in 3T3-L1 adipocytes. Dev. Cell 9, 99–108.
Simard, J.R., Meshulam, T., and Pillai, B.K. (2010). Caveolins sequester FA on the
cytoplasmic leaflet of the plasma membrane, augment triglyceride formation, and
protect cells from lipotoxicity. J. Lipid Res. 51, 914–922.
Sinha, B., Köster, D., Ruez, R., Gonnord, P., Bastiani, M., Abankwa, D., Stan, R. V.,
Butler-Browne, G., Vedie, B., Johannes, L., et al. (2011). Cells respond to mechanical
stress by rapid disassembly of caveolae. Cell 144, 402–413.

References
117
Smyth, G.K. (2004). Linear models and empirical bayes methods for assessing
differential expression in microarray experiments. Stat. Appl. Genet. Mol. Biol. 3,
Article3.
Speakman, J.R. (2013). Evolutionary perspectives on the obesity epidemic: adaptive,
maladaptive, and neutral viewpoints. Annu. Rev. Nutr. 33, 289–317.
Talukder, M.A.H., Preda, M., Ryzhova, L., Prudovsky, I., and Pinz, I.M. (2016).
Heterozygous caveolin-3 mice show increased susceptibility to palmitate-induced
insulin resistance. Physiol. Rep. 4, e12736.
Tan, S.-X., Ng, Y., Burchfield, J.G., Ramm, G., Lambright, D.G., Stöckli, J., and James, D.E.
(2012). The Rab GTPase-activating protein TBC1D4/AS160 contains an atypical
phosphotyrosine-binding domain that interacts with plasma membrane phospholipids
to facilitate GLUT4 trafficking in adipocytes. Mol. Cell. Biol. 32, 4946–4959.
Taylor, C.T. (2008). Mitochondria and cellular oxygen sensing in the HIF pathway.
Biochem. J. 409, 19–26.
Trayhurn, P. (2014). Hypoxia and Adipocyte Physiology : Implications for Adipose
Tissue Dysfunction in Obesity.
Trayhurn, P., and Wood, I.S. (2004). Adipokines: inflammation and the pleiotropic role
of white adipose tissue. Br. J. Nutr. 92, 347–355.
Vlaminck, B., Toffoli, S., Ghislain, B., Demazy, C., Raes, M., and Michiels, C. (2007). Dual
effect of echinomycin on hypoxia-inducible factor-1 activity under normoxic and
hypoxic conditions. FEBS J. 274, 5533–5542.
Walser, P.J., Ariotti, N., Howes, M., Ferguson, C., Webb, R., Schwudke, D., Leneva, N.,
Cho, K.J., Cooper, L., Rae, J., et al. (2012). Constitutive formation of caveolae in a
bacterium. Cell 150, 752–763.
Wang, B., Wood, I.S., and Trayhurn, P. (2007). Dysregulation of the expression and
secretion of inflammation-related adipokines by hypoxia in human adipocytes. Pflugers
Arch. Eur. J. Physiol. 455, 479–492.
Wang, Y., Roche, O., Xu, C., Moriyama, E.H., Heir, P., Chung, J., Roos, F.C., Chen, Y.,

References
118
Finak, G., Milosevic, M., et al. (2012). Hypoxia promotes ligand-independent EGF
receptor signaling via hypoxia-inducible factor-mediated upregulation of caveolin-1.
Proc. Natl. Acad. Sci. U. S. A. 109, 4892–4897.
Weiszenstein, M., Musutova, M., Plihalova, A., Westlake, K., Elkalaf, M., Koc, M.,
Prochazka, A., Pala, J., Gulati, S., Trnka, J., et al. (2016). Biochemical and Biophysical
Research Communications Adipogenesis , lipogenesis and lipolysis is stimulated by mild
but not severe hypoxia in 3T3-L1 cells. Biochem. Biophys. Res. Commun. 478, 727–732.
Wells, J.C.K. (2012). The evolution of human adiposity and obesity: where did it all go
wrong? Dis. Model. Mech. 5, 595–607.
Wiechen, K., Diatchenko, L., Agoulnik, A., Scharff, K.M., Schober, H., Arlt, K.,
Zhumabayeva, B., Siebert, P.D., Dietel, M., Schäfer, R., et al. (2001). Caveolin-1 is
down-regulated in human ovarian carcinoma and acts as a candidate tumor suppressor
gene. Am. J. Pathol. 159, 1635–1643.
Wilcox, G. (2005). Insulin and insulin resistance. Clin. Biochem. Rev. 26, 19–39.
Williams, E.P., Mesidor, M., Winters, K., Dubbert, P.M., and Wyatt, S.B. (2015).
Overweight and Obesity: Prevalence, Consequences, and Causes of a Growing Public
Health Problem. Curr. Obes. Rep. 4, 363–370.
Wood, I.S., Wang, B., Lorente-Cebrián, S., and Trayhurn, P. (2007). Hypoxia increases
expression of selective facilitative glucose transporters (GLUT) and 2-deoxy-d-glucose
uptake in human adipocytes. Biochem. Biophys. Res. Commun. 361, 468–473.
Wood, I.S., de Heredia, F.P., Wang, B., and Trayhurn, P. (2009). Cellular hypoxia and
adipose tissue dysfunction in obesity. Proc. Nutr. Soc. 68, 370–377.
Wouters, B.G., and Koritzinsky, M. (2008). Hypoxia signalling through mTOR and the
unfolded protein response in cancer. Nat. Rev. Cancer 8, 851–864.
Wu, Z., Xie, Y., Bucher, N.L., and Farmer, S.R. (1995). Conditional ectopic expression of
C/EBP beta in NIH-3T3 cells induces PPAR gamma and stimulates adipogenesis. Genes
Dev. 9, 2350–2363.
Wyatt, S.B., Winters, K.P., and Dubbert, P.M. (2006). Overweight and obesity:

References
119
prevalence, consequences, and causes of a growing public health problem. Am. J. Med.
Sci. 331, 166–174.
Xu, Y., Henning, R.H., van der Want, J.J.L., van Buiten, A., van Gilst, W.H., and Buikema,
H. (2007). Disruption of endothelial caveolae is associated with impairment of both
NO- as well as EDHF in acetylcholine-induced relaxation depending on their relative
contribution in different vascular beds. Life Sci. 80, 1678–1685.
Yamamoto, M., Toya, Y., Lisanti, M.P., Martin, G., Ishikawa, Y., Schwencke, C., and
Myers, M.G. (1998). CELL BIOLOGY AND METABOLISM : Caveolin Is an Activator of
Insulin Receptor Signaling Caveolin Is an Activator of Insulin Receptor Signaling *. J.
Biol. Chem. 273, 26962–26968.
Ye, J. (2009). Emerging role of adipose tissue hypoxia in obesity and insulin resistance.
Int. J. Obes. 33, 54–66.
Ye, J., Gao, Z., Yin, J., and He, Q. (2007). Hypoxia is a potential risk factor for chronic
inflammation and adiponectin reduction in adipose tissue of ob/ob and dietary obese
mice. Am. J. Physiol. Endocrinol. Metab. 293, E1118–E1128.
Yin, J., Gao, Z., He, Q., Zhou, D., Guo, Z., and Ye, J. (2009). Role of hypoxia in obesity-
induced disorders of glucose and lipid metabolism in adipose tissue. Am J Physiol
Endocrinol Metab 296, E333-342.
Yu, J., Bergaya, S., Murata, T., Alp, I.F., Bauer, M.P., Lin, M.I., Drab, M., Kurzchalia, T. V.,
Stan, R. V., and Sessa, W.C. (2006). Direct evidence for the role of caveolin-1 and
caveolae in mechanotransduction and remodeling of blood vessels. J. Clin. Invest. 116,
1284–1291.
Yu, J., Li, J., Zhang, S., Xu, X., Zheng, M., Jiang, G., and Li, F. (2012). IGF-1 induces
hypoxia-inducible factor 1??-mediated GLUT3 expression through PI3K/Akt/mTOR
dependent pathways in PC12 cells. Brain Res. 1430, 18–24.
Yun, Z., Maecker, H.L., Johnson, R.S., and Giaccia, A.J. (2002). Inhibition of PPAR ␥ 2
Gene Expression by the HIF-1-Regulated Gene DEC1 / Stra13 : A Mechanism for
Regulation of Adipogenesis by Hypoxia. 2, 331–341.
References
120
Di Zazzo, E., Feola, A., Zuchegna, C., Romano, A., Donini, C.F., Bartollino, S., Costagliola,
C., Frunzio, R., Laccetti, P., Di Domenico, M., et al. (2014). The p85 Regulatory Subunit
of PI3K Mediates cAMP-PKA and Insulin Biological Effects on MCF-7 Cell Growth and
Motility. Sci. World J. 2014, 1–11.
Zepeda, A.B., Pessoa, A., Castillo, R.L., Figueroa, C.A., Pulgar, V.M., and Far??as, J.G.
(2013). Cellular and molecular mechanisms in the hypoxic tissue: Role of HIF-1 and
ROS. Cell Biochem. Funct. 31, 451–459.
Zhang, H., Gao, P., Fukuda, R., Kumar, G., Krishnamachary, B., Zeller, K.I., Dang, C., and
Semenza, G.L. (2007). HIF-1 Inhibits Mitochondrial Biogenesis and Cellular Respiration
in VHL-Deficient Renal Cell Carcinoma by Repression of C-MYC Activity. Cancer Cell 11,
407–420.
Zou, M.H., Hou, X.Y., Shi, C.M., Nagata, D., Walsh, K., and Cohen, R.A. (2002).
Modulation by peroxynitrite of Akt- and AMP-activated kinase-dependent Ser1179
phosphorylation of endothelial nitric oxide synthase. J. Biol. Chem. 277, 32552–32557.