Identificación del material AICLE · Material AICLE 2º de ESO: ... Real MathematicsANCIENT GREECE...
36
-
Upload
trinhquynh -
Category
Documents
-
view
230 -
download
1
Transcript of Identificación del material AICLE · Material AICLE 2º de ESO: ... Real MathematicsANCIENT GREECE...
Material AICLE Secundaria 2º E.S.O. : ANCIENT GREECE 3Material AICLE 2º de ESO: Statistics: Real Mathematics
Identificación del material AICLE
CONSEJERÍA DE EDUCACIÓNDirección General de Participación e Innovación Educativa
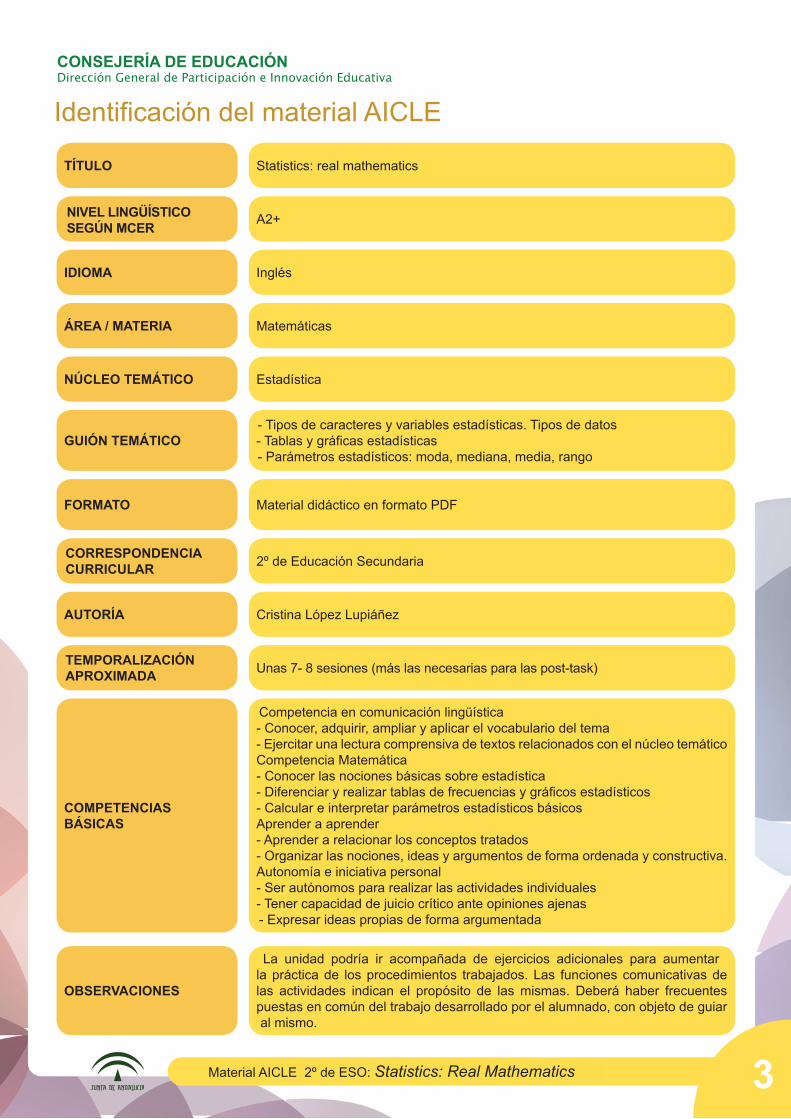
Statistics: real mathematicsTÍTULO
A2+NIVEL LINGÜÍSTICOSEGÚN MCER
InglésIDIOMA
MatemáticasÁREA / MATERIA
EstadísticaNÚCLEO TEMÁTICO
2º de Educación SecundariaCORRESPONDENCIA CURRICULAR
Unas 7- 8 sesiones (más las necesarias para las post-task)TEMPORALIZACIÓN APROXIMADA
- Tipos de caracteres y variables estadísticas. Tipos de datos- Tablas y gráficas estadísticas- Parámetros estadísticos: moda, mediana, media, rango
GUIÓN TEMÁTICO
Competencia en comunicación lingüística- Conocer, adquirir, ampliar y aplicar el vocabulario del tema- Ejercitar una lectura comprensiva de textos relacionados con el núcleo temáticoCompetencia Matemática- Conocer las nociones básicas sobre estadística- Diferenciar y realizar tablas de frecuencias y gráficos estadísticos- Calcular e interpretar parámetros estadísticos básicosAprender a aprender- Aprender a relacionar los conceptos tratados- Organizar las nociones, ideas y argumentos de forma ordenada y constructiva. Autonomía e iniciativa personal - Ser autónomos para realizar las actividades individuales- Tener capacidad de juicio crítico ante opiniones ajenas- Expresar ideas propias de forma argumentada
COMPETENCIASBÁSICAS
La unidad podría ir acompañada de ejercicios adicionales para aumentar la práctica de los procedimientos trabajados. Las funciones comunicativas de las actividades indican el propósito de las mismas. Deberá haber frecuentes puestas en común del trabajo desarrollado por el alumnado, con objeto de guiar al mismo.
OBSERVACIONES
Material didáctico en formato PDFFORMATO
Cristina López LupiáñezAUTORÍA
Material AICLE Secundaria 2º E.S.O. : ANCIENT GREECE4 Material AICLE 2º de ESO: Statistics: Real Mathematics
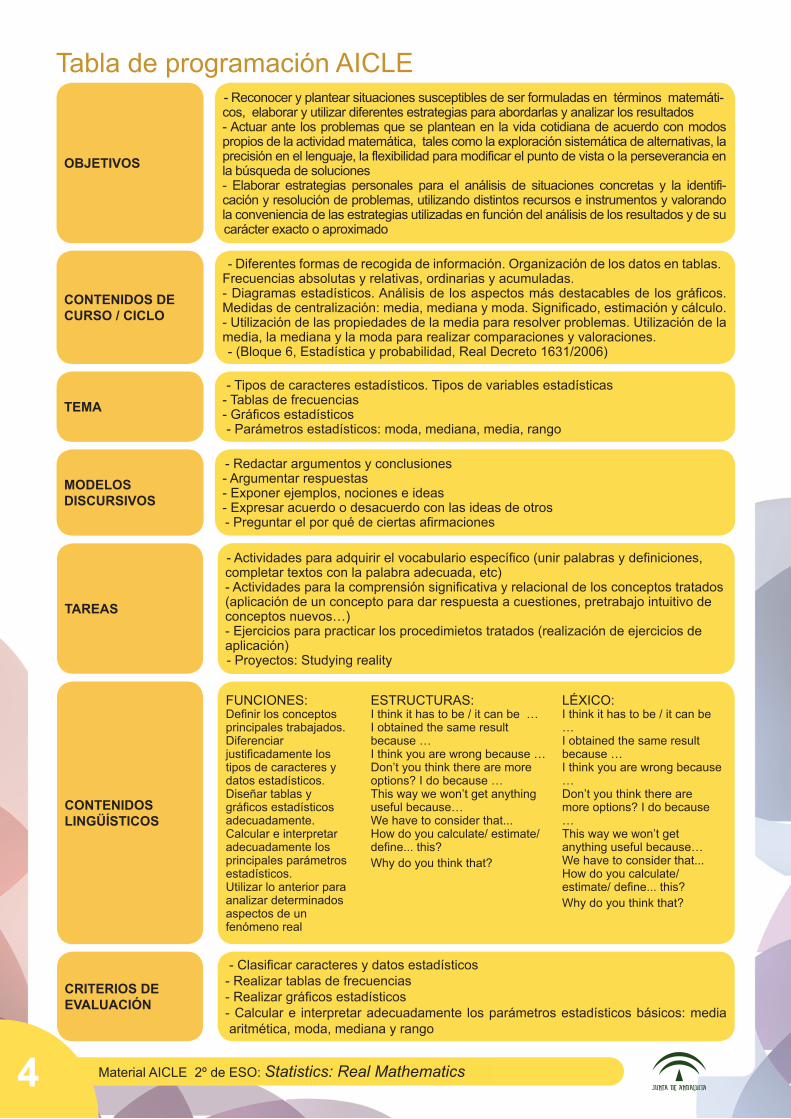
Tabla de programación AICLE- Reconocer y plantear situaciones susceptibles de ser formuladas en términos matemáti-cos, elaborar y utilizar diferentes estrategias para abordarlas y analizar los resultados- Actuar ante los problemas que se plantean en la vida cotidiana de acuerdo con modos propios de la actividad matemática, tales como la exploración sistemática de alternativas, la precisión en el lenguaje, la flexibilidad para modificar el punto de vista o la perseverancia en la búsqueda de soluciones- Elaborar estrategias personales para el análisis de situaciones concretas y la identifi-cación y resolución de problemas, utilizando distintos recursos e instrumentos y valorando la conveniencia de las estrategias utilizadas en función del análisis de los resultados y de su carácter exacto o aproximado
OBJETIVOS
- Tipos de caracteres estadísticos. Tipos de variables estadísticas- Tablas de frecuencias- Gráficos estadísticos- Parámetros estadísticos: moda, mediana, media, rango
TEMA
- Actividades para adquirir el vocabulario específico (unir palabras y definiciones, completar textos con la palabra adecuada, etc)- Actividades para la comprensión significativa y relacional de los conceptos tratados (aplicación de un concepto para dar respuesta a cuestiones, pretrabajo intuitivo de conceptos nuevos…)- Ejercicios para practicar los procedimietos tratados (realización de ejercicios de aplicación)- Proyectos: Studying reality
TAREAS
- Clasificar caracteres y datos estadísticos- Realizar tablas de frecuencias- Realizar gráficos estadísticos- Calcular e interpretar adecuadamente los parámetros estadísticos básicos: media aritmética, moda, mediana y rango
CRITERIOS DE EVALUACIÓN
- Redactar argumentos y conclusiones- Argumentar respuestas- Exponer ejemplos, nociones e ideas- Expresar acuerdo o desacuerdo con las ideas de otros- Preguntar el por qué de ciertas afirmaciones
MODELOSDISCURSIVOS
CONTENIDOS LINGÜÍSTICOS
FUNCIONES:Definir los conceptos principales trabajados.Diferenciar justificadamente los tipos de caracteres y datos estadísticos.Diseñar tablas y gráficos estadísticos adecuadamente.Calcular e interpretar adecuadamente los principales parámetros estadísticos.Utilizar lo anterior para analizar determinados aspectos de un fenómeno real
ESTRUCTURAS:I think it has to be / it can be …I obtained the same result because …I think you are wrong because …Don’t you think there are more options? I do because …This way we won’t get anything useful because…We have to consider that...How do you calculate/ estimate/ define... this?Why do you think that?
LÉXICO:I think it has to be / it can be …I obtained the same result because …I think you are wrong because …Don’t you think there are more options? I do because …This way we won’t get anything useful because…We have to consider that...How do you calculate/ estimate/ define... this?Why do you think that?
- Diferentes formas de recogida de información. Organización de los datos en tablas. Frecuencias absolutas y relativas, ordinarias y acumuladas.- Diagramas estadísticos. Análisis de los aspectos más destacables de los gráficos. Medidas de centralización: media, mediana y moda. Significado, estimación y cálculo. - Utilización de las propiedades de la media para resolver problemas. Utilización de la media, la mediana y la moda para realizar comparaciones y valoraciones.- (Bloque 6, Estadística y probabilidad, Real Decreto 1631/2006)
CONTENIDOS DECURSO / CICLO
Material AICLE Secundaria 2º E.S.O. : ANCIENT GREECE 5Material AICLE 2º de ESO: Statistics: Real Mathematics
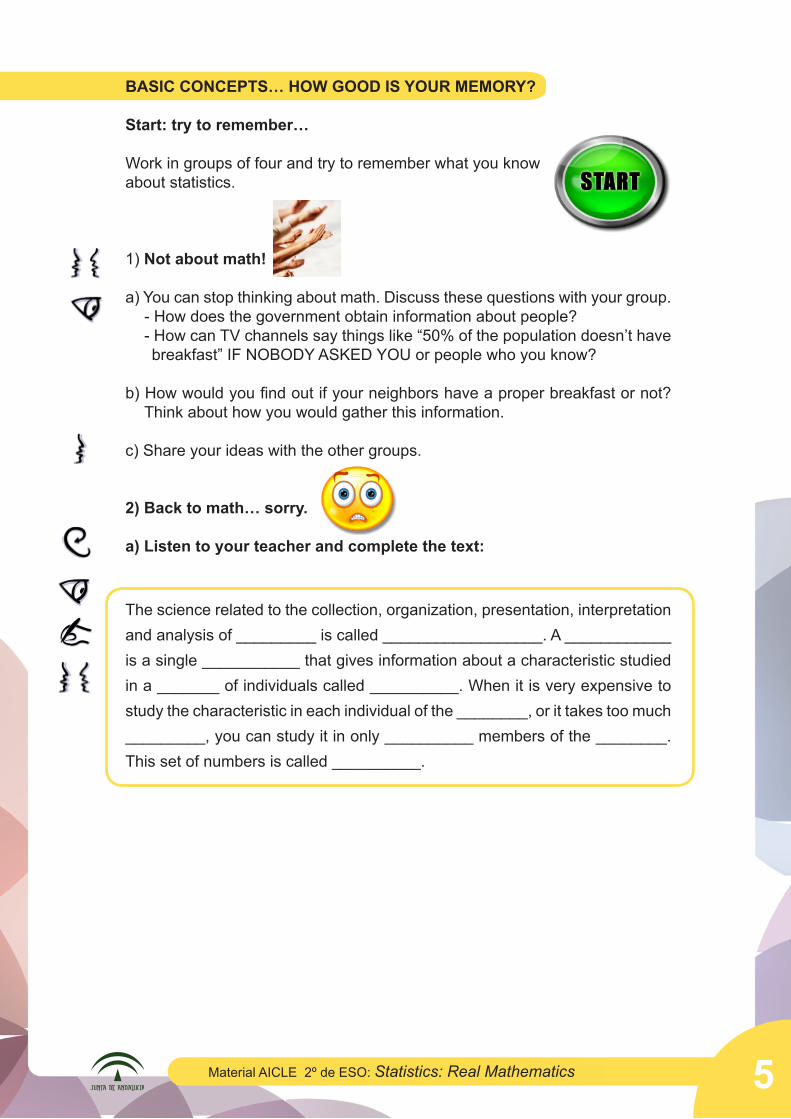
BASIC CONCEPTS… HOW GOOD IS YOUR MEMORY?
Start: try to remember…
Work in groups of four and try to remember what you know about statistics.
1) Not about math!
a) You can stop thinking about math. Discuss these questions with your group.- How does the government obtain information about people?- How can TV channels say things like “50% of the population doesn’t have breakfast” IF NOBODY ASKED YOU or people who you know?
b) How would you find out if your neighbors have a proper breakfast or not? Think about how you would gather this information.
c) Share your ideas with the other groups.
2) Back to math… sorry.
a) Listen to your teacher and complete the text:
The science related to the collection, organization, presentation, interpretation and analysis of _________ is called __________________. A ____________ is a single ___________ that gives information about a characteristic studied in a _______ of individuals called __________. When it is very expensive to study the characteristic in each individual of the ________, or it takes too much _________, you can study it in only __________ members of the ________. This set of numbers is called __________.
Material AICLE Secundaria 2º E.S.O. : ANCIENT GREECE6 Material AICLE 2º de ESO: Statistics: Real Mathematics
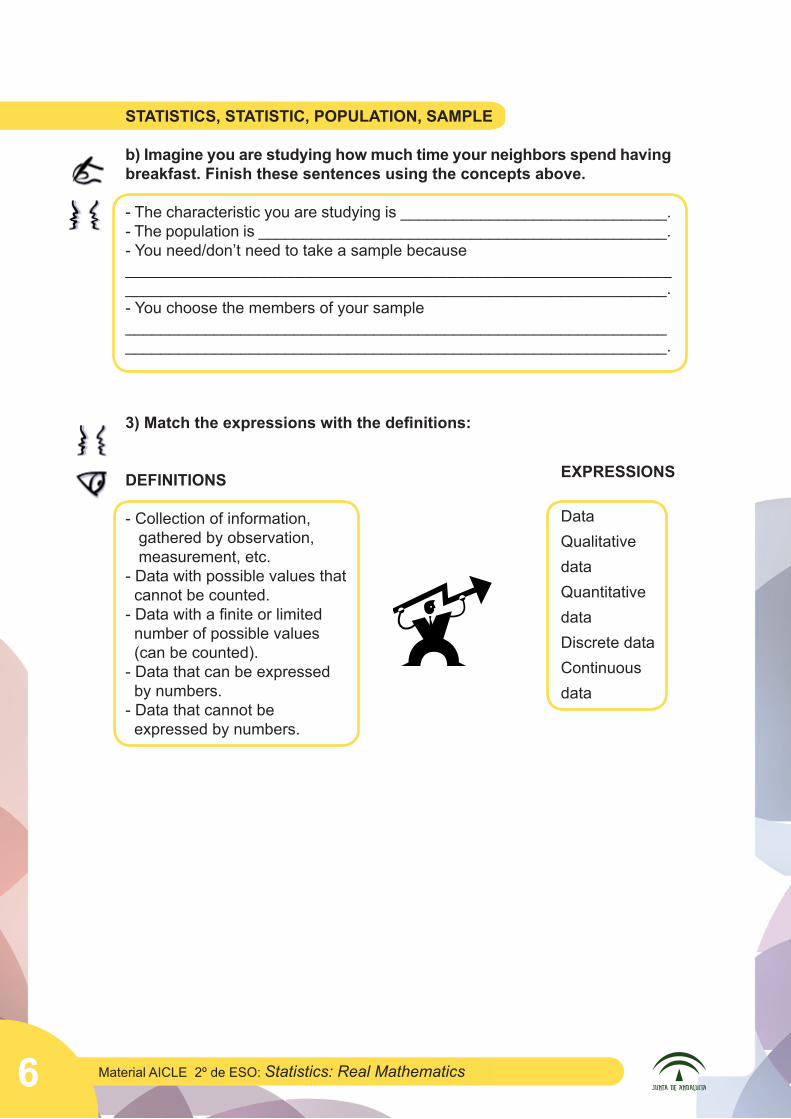
STATISTICS, STATISTIC, POPULATION, SAMPLE
b) Imagine you are studying how much time your neighbors spend having breakfast. Finish these sentences using the concepts above.
- The characteristic you are studying is ______________________________.- The population is ______________________________________________.- You need/don’t need to take a sample because__________________________________________________________________________________________________________________________.- You choose the members of your sample__________________________________________________________________________________________________________________________.
3) Match the expressions with the definitions:
DEFINITIONS
- Collection of information, gathered by observation, measurement, etc.- Data with possible values that cannot be counted.- Data with a finite or limited number of possible values (can be counted).- Data that can be expressed by numbers.- Data that cannot be expressed by numbers.
EXPRESSIONS
DataQualitativedataQuantitativedataDiscrete dataContinuousdata
Material AICLE Secundaria 2º E.S.O. : ANCIENT GREECE 7Material AICLE 2º de ESO: Statistics: Real Mathematics
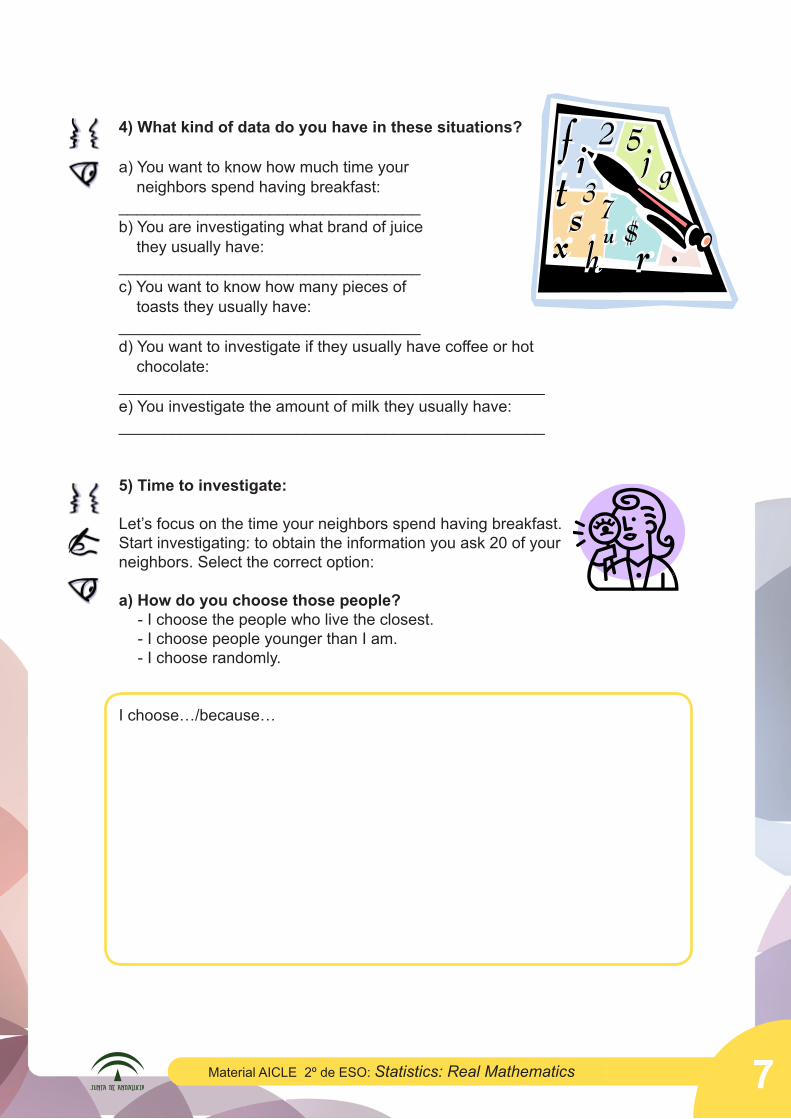
4) What kind of data do you have in these situations?
a) You want to know how much time your neighbors spend having breakfast:__________________________________b) You are investigating what brand of juice they usually have:__________________________________c) You want to know how many pieces of toasts they usually have:__________________________________d) You want to investigate if they usually have coffee or hot chocolate:________________________________________________e) You investigate the amount of milk they usually have:________________________________________________
5) Time to investigate:
Let’s focus on the time your neighbors spend having breakfast.Start investigating: to obtain the information you ask 20 of yourneighbors. Select the correct option:
a) How do you choose those people?- I choose the people who live the closest.- I choose people younger than I am.- I choose randomly.
I choose…/because…
Material AICLE Secundaria 2º E.S.O. : ANCIENT GREECE8 Material AICLE 2º de ESO: Statistics: Real Mathematics
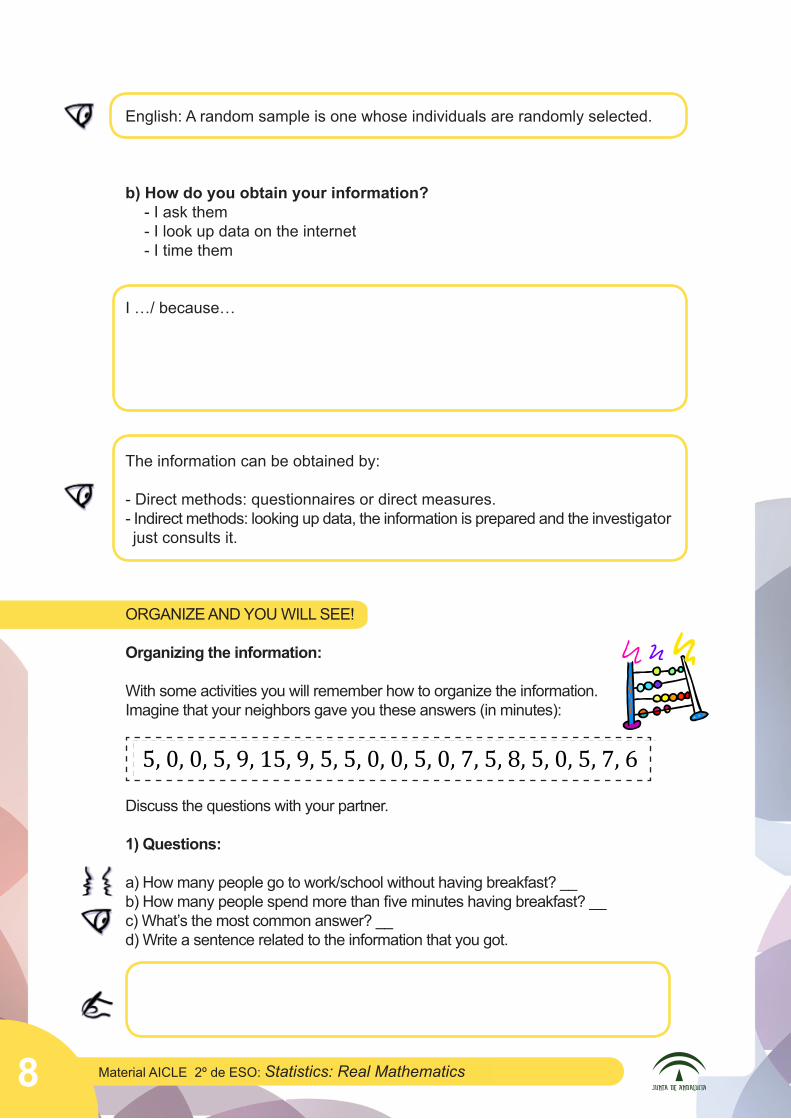
English: A random sample is one whose individuals are randomly selected.
b) How do you obtain your information?- I ask them- I look up data on the internet- I time them
I …/ because…
The information can be obtained by:
- Direct methods: questionnaires or direct measures.- Indirect methods: looking up data, the information is prepared and the investigator just consults it.
ORGANIZE AND YOU WILL SEE!
Organizing the information:
With some activities you will remember how to organize the information. Imagine that your neighbors gave you these answers (in minutes):
Discuss the questions with your partner.
1) Questions:
a) How many people go to work/school without having breakfast? __b) How many people spend more than five minutes having breakfast? __c) What’s the most common answer? __d) Write a sentence related to the information that you got.
5, 0, 0, 5, 9, 15, 9, 5, 5, 0, 0, 5, 0, 7, 5, 8, 5, 0, 5, 7, 6
Material AICLE Secundaria 2º E.S.O. : ANCIENT GREECE 9Material AICLE 2º de ESO: Statistics: Real Mathematics
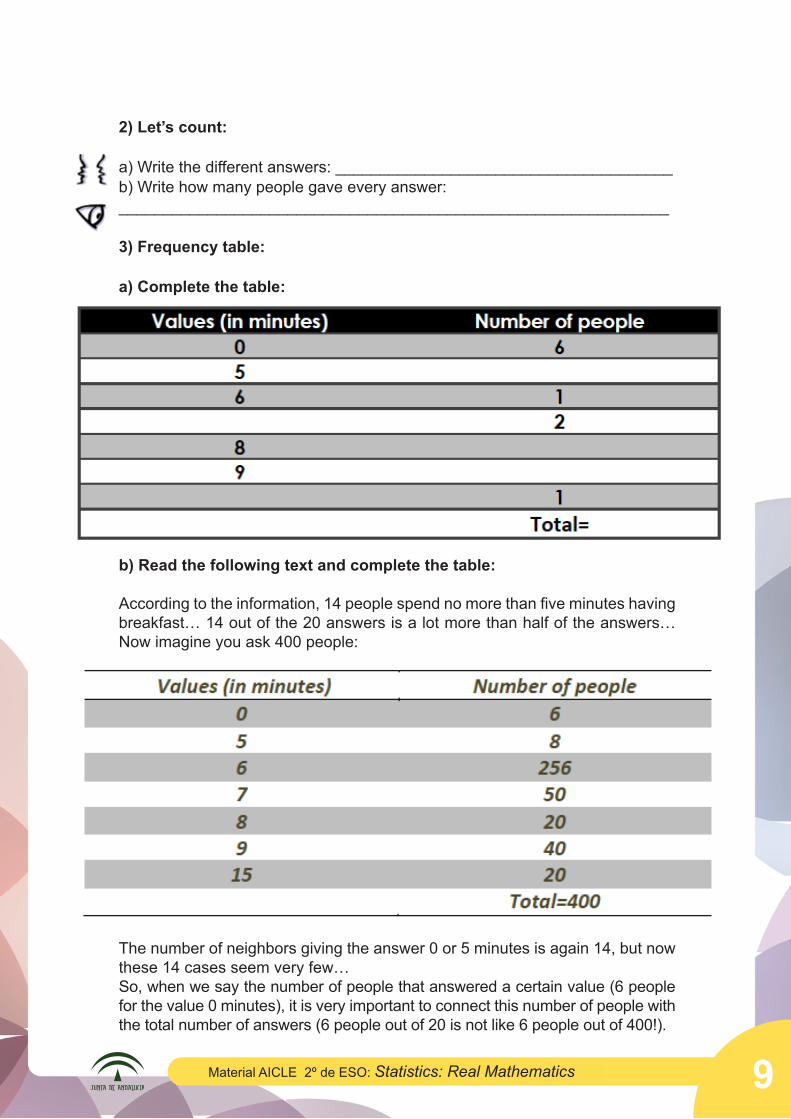
2) Let’s count:
a) Write the different answers: ______________________________________b) Write how many people gave every answer:______________________________________________________________
3) Frequency table:
a) Complete the table:
b) Read the following text and complete the table:
According to the information, 14 people spend no more than five minutes having breakfast… 14 out of the 20 answers is a lot more than half of the answers… Now imagine you ask 400 people:
The number of neighbors giving the answer 0 or 5 minutes is again 14, but now these 14 cases seem very few…So, when we say the number of people that answered a certain value (6 people for the value 0 minutes), it is very important to connect this number of people with the total number of answers (6 people out of 20 is not like 6 people out of 400!).
Material AICLE Secundaria 2º E.S.O. : ANCIENT GREECE10 Material AICLE 2º de ESO: Statistics: Real Mathematics
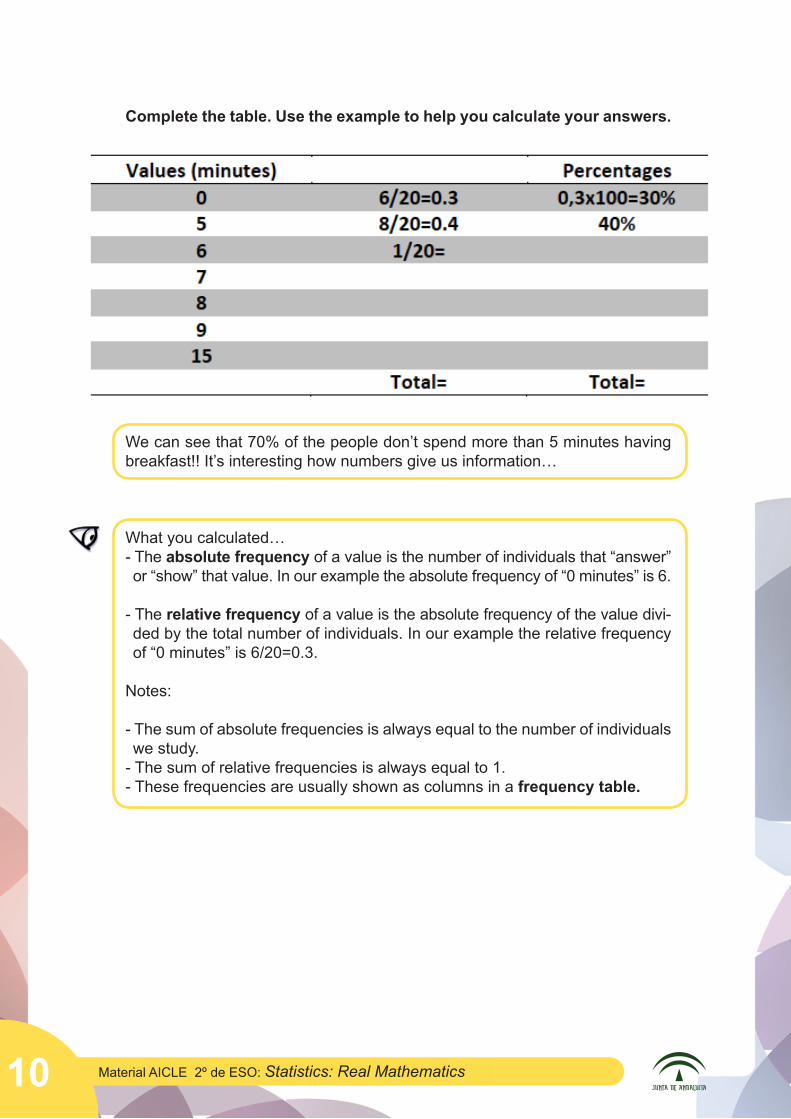
Complete the table. Use the example to help you calculate your answers.
We can see that 70% of the people don’t spend more than 5 minutes having breakfast!! It’s interesting how numbers give us information…
What you calculated…- The absolute frequency of a value is the number of individuals that “answer” or “show” that value. In our example the absolute frequency of “0 minutes” is 6.
- The relative frequency of a value is the absolute frequency of the value divi-ded by the total number of individuals. In our example the relative frequency of “0 minutes” is 6/20=0.3.
Notes:
- The sum of absolute frequencies is always equal to the number of individuals we study.
- The sum of relative frequencies is always equal to 1.- These frequencies are usually shown as columns in a frequency table.
Material AICLE Secundaria 2º E.S.O. : ANCIENT GREECE 11Material AICLE 2º de ESO: Statistics: Real Mathematics
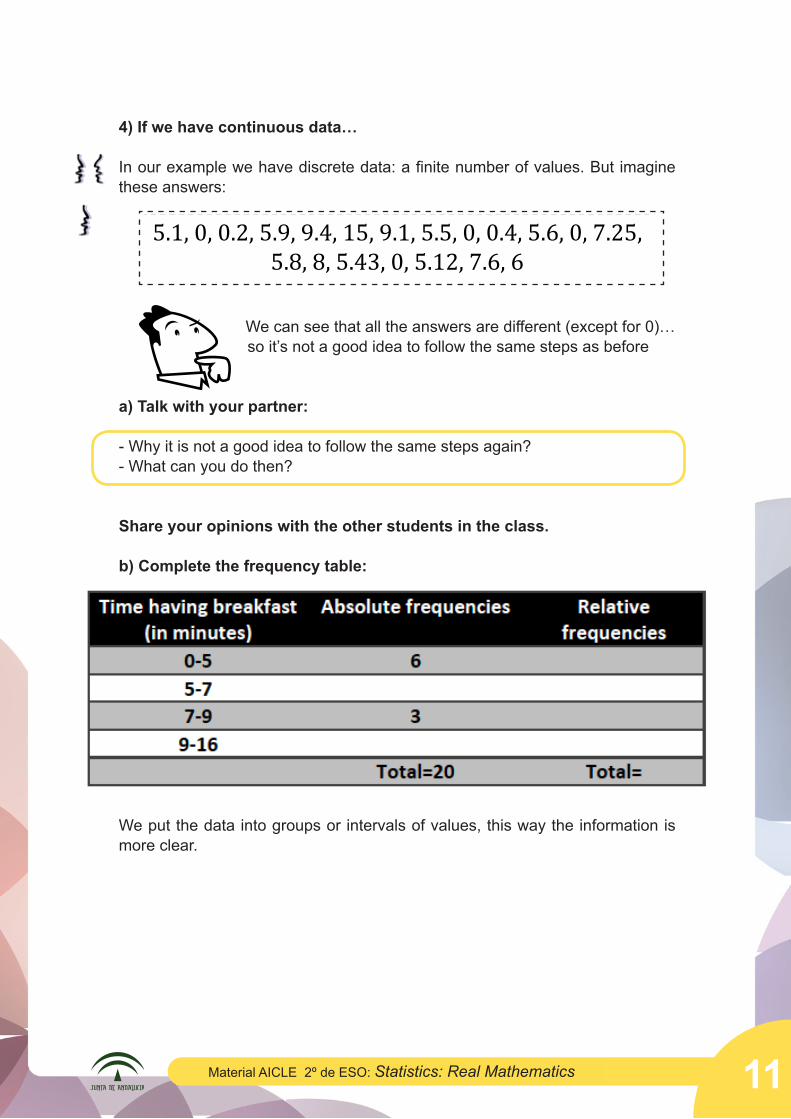
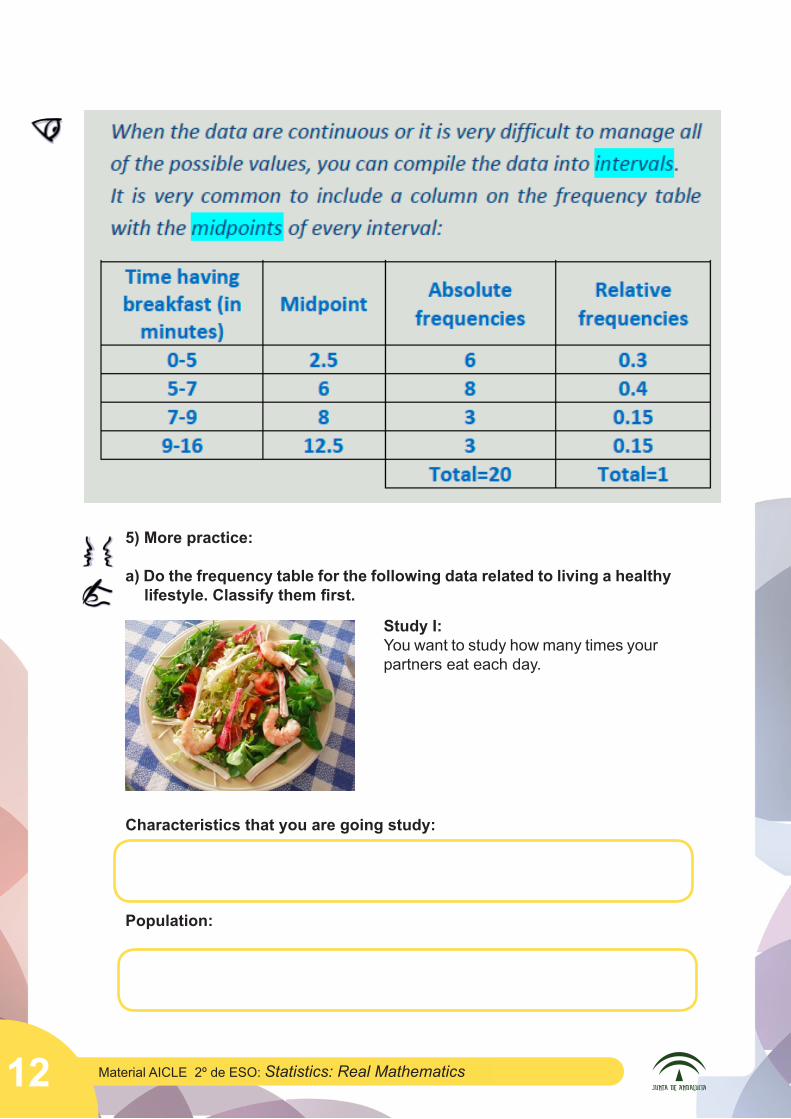
4) If we have continuous data…
In our example we have discrete data: a finite number of values. But imagine these answers:
We can see that all the answers are different (except for 0)… so it’s not a good idea to follow the same steps as before
a) Talk with your partner:
- Why it is not a good idea to follow the same steps again?- What can you do then?
Share your opinions with the other students in the class.
b) Complete the frequency table:
We put the data into groups or intervals of values, this way the information is more clear.
5.1, 0, 0.2, 5.9, 9.4, 15, 9.1, 5.5, 0, 0.4, 5.6, 0, 7.25, 5.8, 8, 5.43, 0, 5.12, 7.6, 6
Material AICLE Secundaria 2º E.S.O. : ANCIENT GREECE12 Material AICLE 2º de ESO: Statistics: Real Mathematics
5) More practice:
a) Do the frequency table for the following data related to living a healthy lifestyle. Classify them first.
Characteristics that you are going study:
Population:
Study I:You want to study how many times your partners eat each day.
Material AICLE Secundaria 2º E.S.O. : ANCIENT GREECE 13Material AICLE 2º de ESO: Statistics: Real Mathematics
Method used to obtain the information:
Data
3,4,2,3,3,4,5,3,4,4,3,3,4,5,5
Type of data:
Frequency table:
Material AICLE Secundaria 2º E.S.O. : ANCIENT GREECE14 Material AICLE 2º de ESO: Statistics: Real Mathematics
Study II:
You want to know if your aunts and uncles go tothe doctor regularly.
Characteristics that you are going study:
Population:
Method used to obtain the information:
Data
YES-NO-NO-SOMETIMES-NO-YES-NO-SOMETIMES-YESNO-NO-SOMETIMES
Type of data:
Frequency table:
Material AICLE Secundaria 2º E.S.O. : ANCIENT GREECE 15Material AICLE 2º de ESO: Statistics: Real Mathematics
Study III:
You want to know for how many hours a weekpeople in your town do sports.
Characteristics that you are going study:
Population-random sample:
Method used to obtain the information:
Data:
3.21h, 4.2h, 0.51h, 0h, 2.53h, 1.20h, 3.2h, 0.4h, 0h, 2.15h, 0h2.21h, 4.4h, 6.5h, 0h, 3.53h, 1.25h, 3.2h, 0.25h, 0h, 1.1h, 0h
Type of data:
Frequency table:
Material AICLE Secundaria 2º E.S.O. : ANCIENT GREECE16 Material AICLE 2º de ESO: Statistics: Real Mathematics
b) Work with you partner and comment on the possiblesolutions to these three problems.
c) Develop a problem, do a frequency table and prepare a presentation explaining your work.
Material AICLE Secundaria 2º E.S.O. : ANCIENT GREECE 17Material AICLE 2º de ESO: Statistics: Real Mathematics
AN IMAGE IS WORTH A THOUSAND WORDS!
Drawing math!
With these activities you will create pictures using statistical data. Withthese pictures we can “see” the information. You will work in groups of 3-4 students.
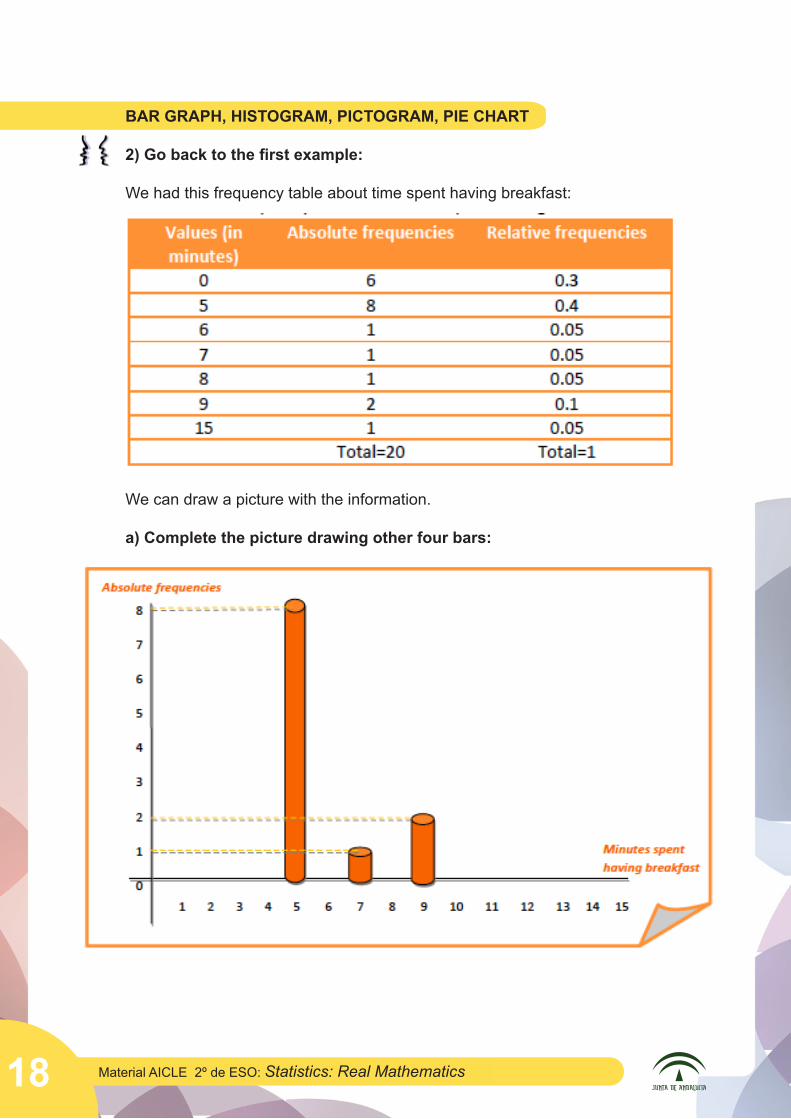
1) Refresh your memory:
Select the correct picture in each case:
1995 2000 2002 2005 2008
Material AICLE Secundaria 2º E.S.O. : ANCIENT GREECE18 Material AICLE 2º de ESO: Statistics: Real Mathematics
BAR GRAPH, HISTOGRAM, PICTOGRAM, PIE CHART
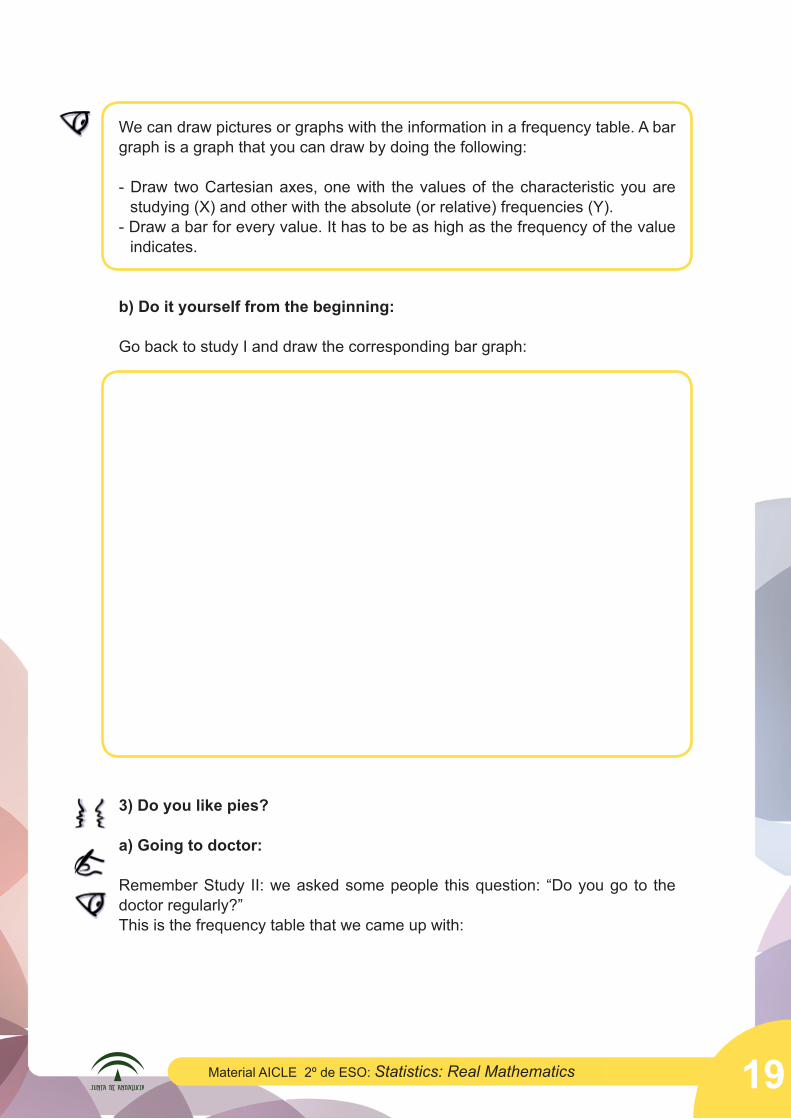
2) Go back to the first example:
We had this frequency table about time spent having breakfast:
We can draw a picture with the information.
a) Complete the picture drawing other four bars:
Material AICLE Secundaria 2º E.S.O. : ANCIENT GREECE 19Material AICLE 2º de ESO: Statistics: Real Mathematics
We can draw pictures or graphs with the information in a frequency table. A bar graph is a graph that you can draw by doing the following:
- Draw two Cartesian axes, one with the values of the characteristic you are studying (X) and other with the absolute (or relative) frequencies (Y).
- Draw a bar for every value. It has to be as high as the frequency of the value indicates.
b) Do it yourself from the beginning:
Go back to study I and draw the corresponding bar graph:
3) Do you like pies?
a) Going to doctor:
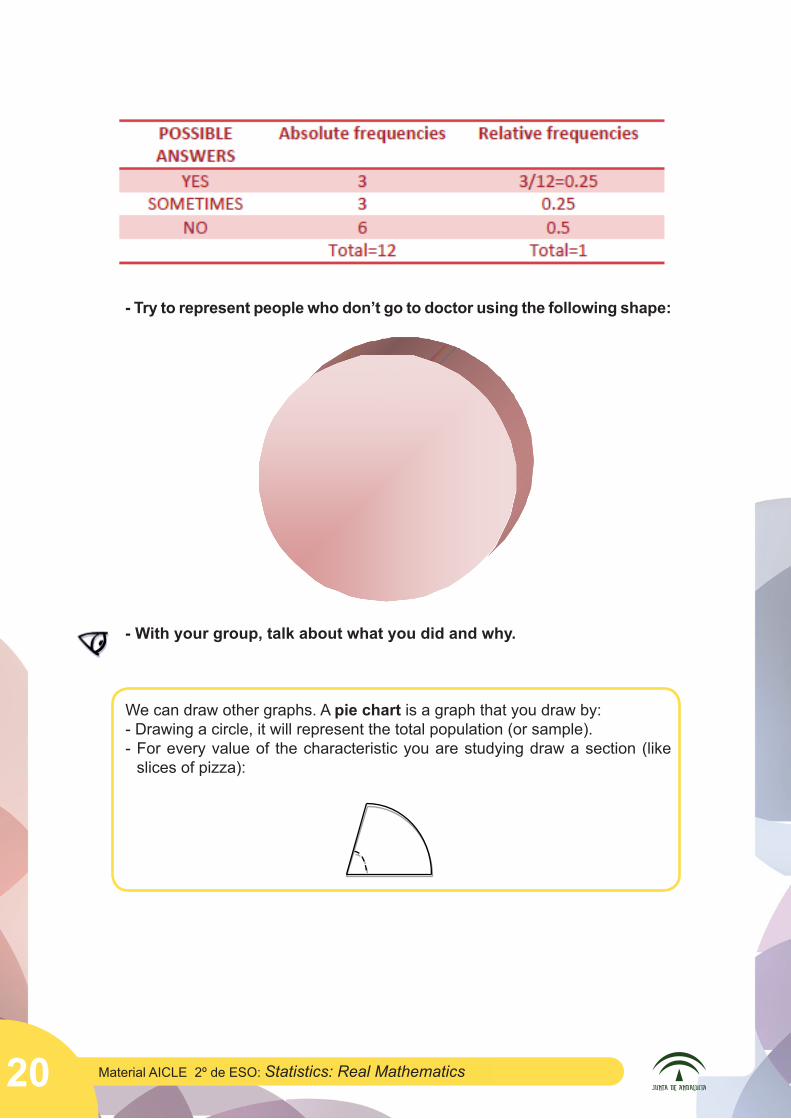
Remember Study II: we asked some people this question: “Do you go to the doctor regularly?”This is the frequency table that we came up with:
Material AICLE Secundaria 2º E.S.O. : ANCIENT GREECE20 Material AICLE 2º de ESO: Statistics: Real Mathematics
- Try to represent people who don’t go to doctor using the following shape:
- With your group, talk about what you did and why.
We can draw other graphs. A pie chart is a graph that you draw by:- Drawing a circle, it will represent the total population (or sample).- For every value of the characteristic you are studying draw a section (like
slices of pizza):
Material AICLE Secundaria 2º E.S.O. : ANCIENT GREECE 21Material AICLE 2º de ESO: Statistics: Real Mathematics
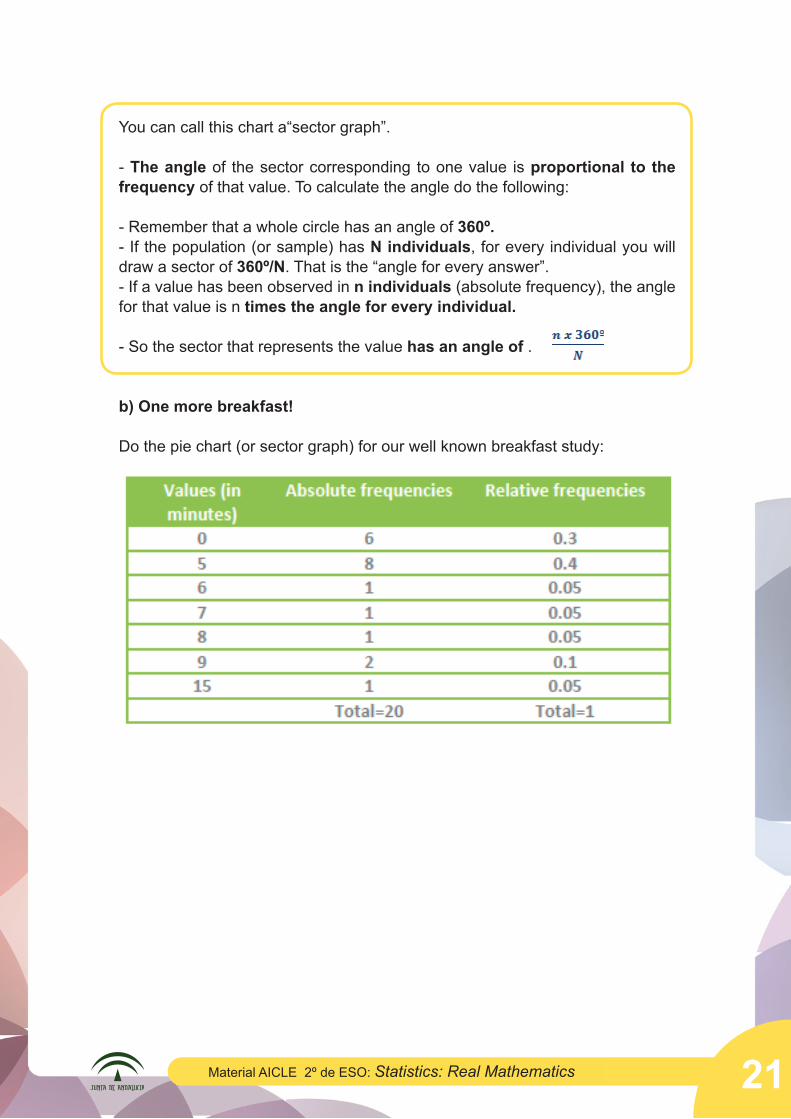
You can call this chart a“sector graph”.
- The angle of the sector corresponding to one value is proportional to the frequency of that value. To calculate the angle do the following:
- Remember that a whole circle has an angle of 360º.- If the population (or sample) has N individuals, for every individual you will draw a sector of 360º/N. That is the “angle for every answer”.- If a value has been observed in n individuals (absolute frequency), the angle for that value is n times the angle for every individual.
- So the sector that represents the value has an angle of .
b) One more breakfast!
Do the pie chart (or sector graph) for our well known breakfast study:
Material AICLE Secundaria 2º E.S.O. : ANCIENT GREECE22 Material AICLE 2º de ESO: Statistics: Real Mathematics
Listen, calculate and complete: your teacher will tell you the steps to follow: listen and complete the sentences. Then calculate and complete.
- How many __________ are there?- The _________ for the total population/sample is _____________.- The ________________ for the value “0” minutes is _______.-The __________ of the _________ for the value “0 minutes” is _________________.
- The angles for the others __________ are:
- The _____________ is:
c) Back to the doctor.
Imagine you draw a picture to represent the individuals in your population/sample.If the individuals are people, you can choose a picture like this:
Note: it will represent males as well as females
Material AICLE Secundaria 2º E.S.O. : ANCIENT GREECE 23Material AICLE 2º de ESO: Statistics: Real Mathematics
How can you use pictures to represent the information related to Study II? Work in groups to answer the question.
Remember the frequency table:
Representation using pictures:
A pictogram is a graph that has these characteristics:- Each value is represented by an image.- The image is usually the same for each value.- For each value the size of the image is proportional to the frequency of the value.
Attention: don’t use the surface of the image to calculate the proper size for each value. If you do, the images will be proportional to the square of the frequencies!!
Material AICLE Secundaria 2º E.S.O. : ANCIENT GREECE24 Material AICLE 2º de ESO: Statistics: Real Mathematics
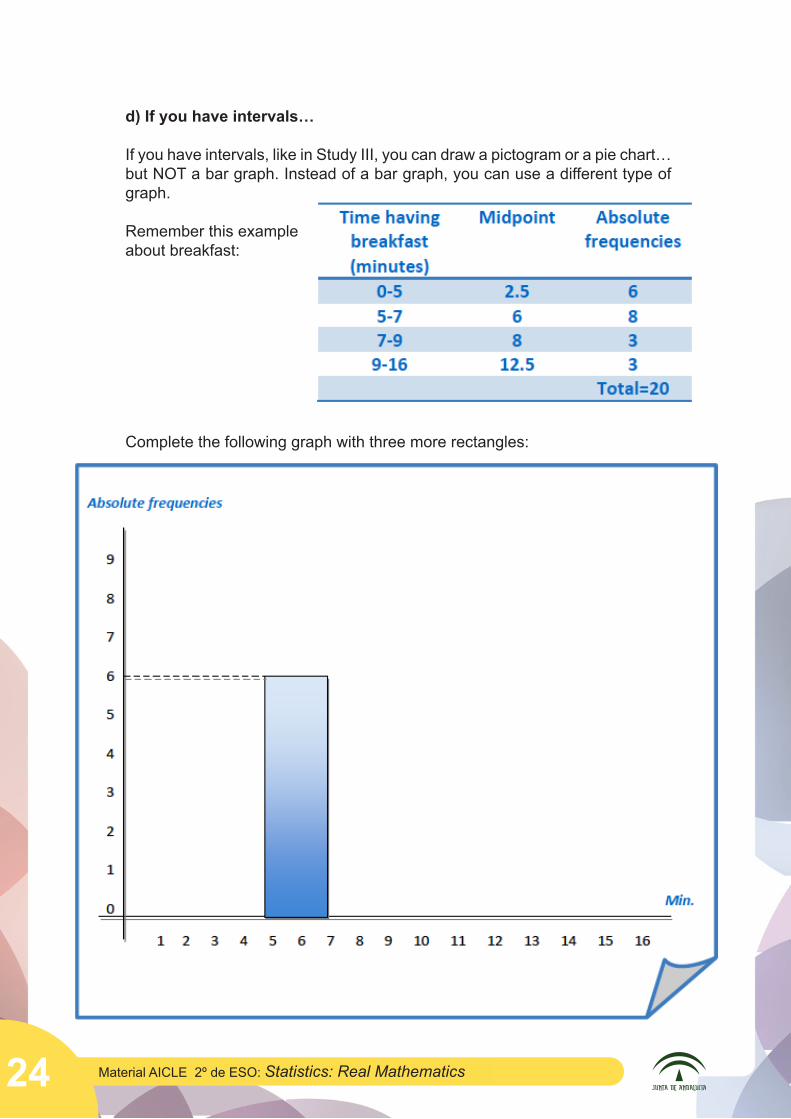
d) If you have intervals…
If you have intervals, like in Study III, you can draw a pictogram or a pie chart… but NOT a bar graph. Instead of a bar graph, you can use a different type of graph.
Remember this example about breakfast:
Complete the following graph with three more rectangles:
Material AICLE Secundaria 2º E.S.O. : ANCIENT GREECE 25Material AICLE 2º de ESO: Statistics: Real Mathematics
A histogram is a graph, similar to a bar graph, used when the data is distributed in intervals
- Every value is represented by a rectangle.- The rectangles have these dimensions: - The base is as long as the interval (as the amplitude of the interval). - The height is as tall as the frequency of the value indicates.
Note: as you can see, the intervals can have different amplitudes.
e) Draw the histogram that corresponds to Study III.
Material AICLE Secundaria 2º E.S.O. : ANCIENT GREECE26 Material AICLE 2º de ESO: Statistics: Real Mathematics
4) Work in groups and prepare a concept map about the different statistical graphs. When you finish, your group will present one graph, its corresponding C-map, and an example to the rest of the class.
Concept map:
Example:
Ideas for your presentation:
Material AICLE Secundaria 2º E.S.O. : ANCIENT GREECE 27Material AICLE 2º de ESO: Statistics: Real Mathematics
CALCULATE AND YOU WILL KNOW!
Special numbers I:
Now you need to remember that you can calculate special numbers that will give you information for your study. These numbers are called summary statistics. Do the activities in groups of 3-4!
1) At the end, everyone will share their conclusions
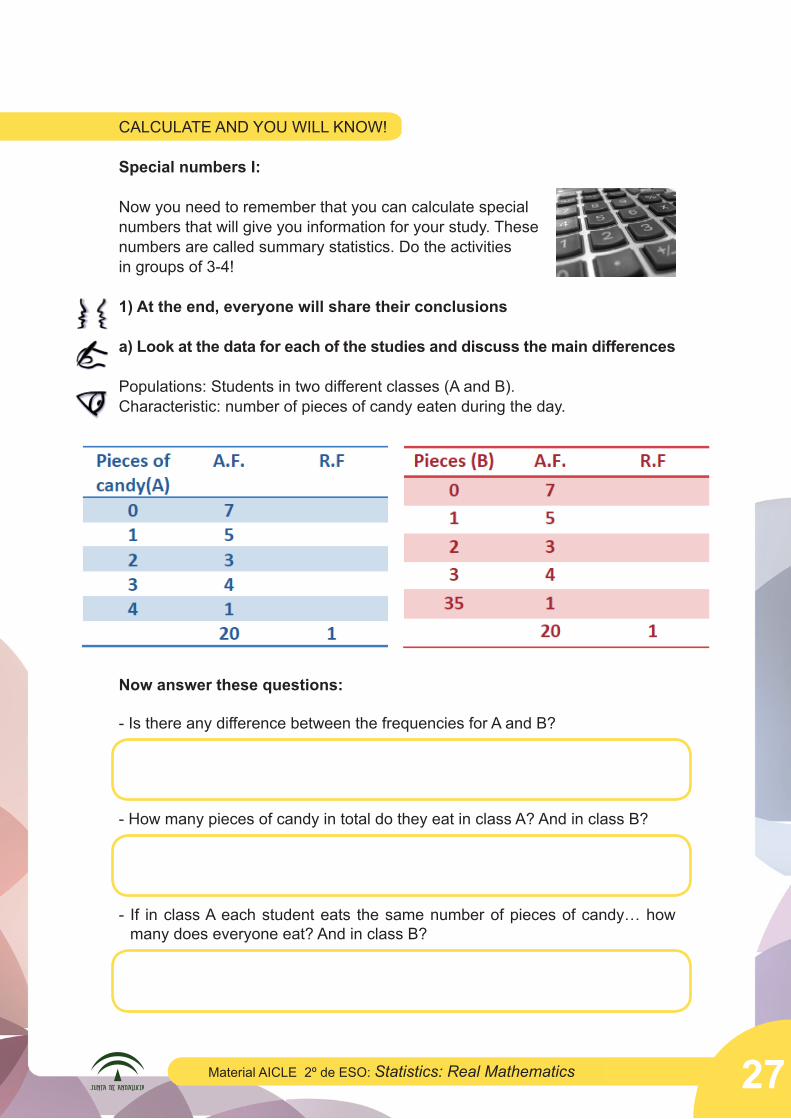
a) Look at the data for each of the studies and discuss the main differences
Populations: Students in two different classes (A and B).Characteristic: number of pieces of candy eaten during the day.
Now answer these questions:
- Is there any difference between the frequencies for A and B?
- How many pieces of candy in total do they eat in class A? And in class B?
- If in class A each student eats the same number of pieces of candy… how many does everyone eat? And in class B?
Material AICLE Secundaria 2º E.S.O. : ANCIENT GREECE28 Material AICLE 2º de ESO: Statistics: Real Mathematics
- Prepare a short explanation of your last answer and share it with the class.
If you divide the total of ALL the answers (or measures, etc) by the total popu-lation/sample you calculate the mean. In our example, the mean is the number of pieces of candy that everyone eats IF THEY ALL EAT THE SAME.
Note: The mean is a type of average, but sometimes it is called average itself.
If the data are distribute into intervals, to calculate the mean we use the midpoints of the intervals.
b) Discover with your group how to calculate the mean using absolute frequencies.
c) With your group, find out how to calculate the mean of data distributed into intervals.
d) With your group, find out how to calculate the mean of qualitative data.
Material AICLE Secundaria 2º E.S.O. : ANCIENT GREECE 29Material AICLE 2º de ESO: Statistics: Real Mathematics
2) Focus on the table for class A.
a) What is the most frequent answer?
b) Is it related to the frequencies?
The mode of the values of a statistical investigation is the most frequent value, “the most repeated answer”. It will be the value with the highest absolute frequency. It is another type of average.
If the data are distributed into intervals, the modal interval is the one with the highest absolute frequency, and the mode will be the midpoint of the modal interval.
3) Look at this data and answer:
We want to know if a group of students sleeps enough.We asked them the number of hours they sleep every day, and these were their answers:
5, 6, 6, 7, 8, 8, 9
Work in groups:
a) What value is in the middle? ___________________________________
b) What value separates the higher half of the answers from the lower half? ____________________________________________________________
Material AICLE Secundaria 2º E.S.O. : ANCIENT GREECE30 Material AICLE 2º de ESO: Statistics: Real Mathematics
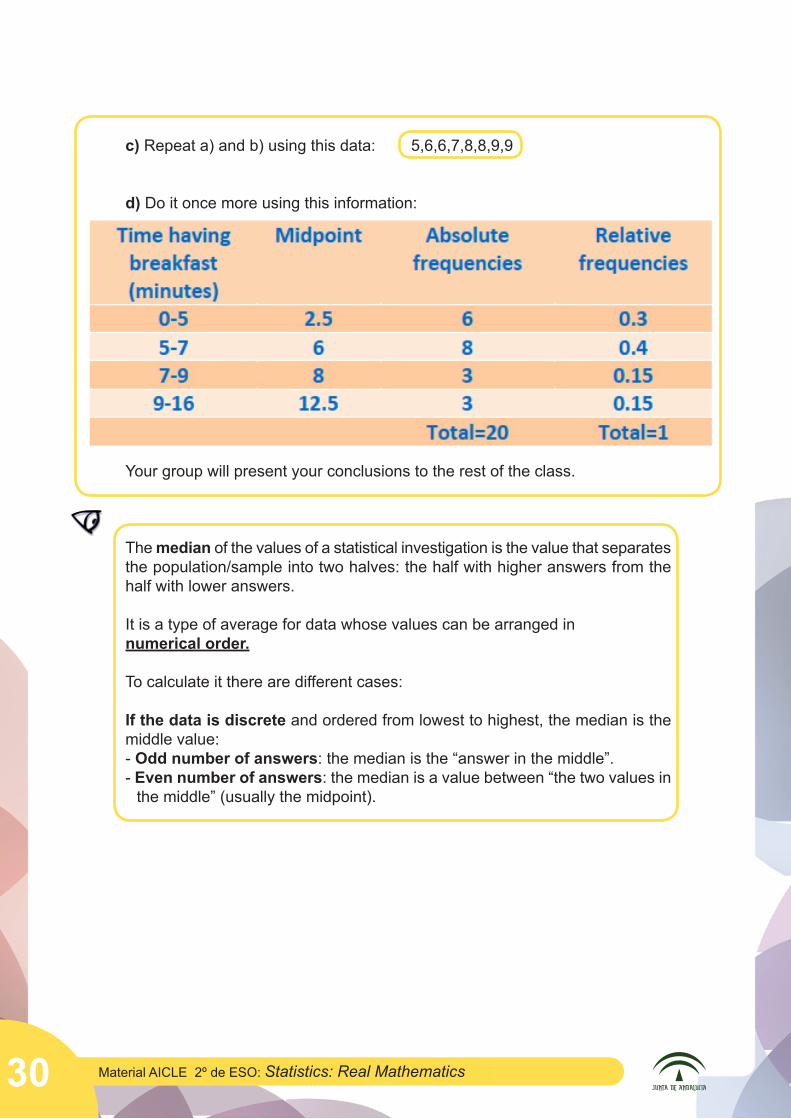
c) Repeat a) and b) using this data: 5,6,6,7,8,8,9,9
d) Do it once more using this information:
Your group will present your conclusions to the rest of the class.
The median of the values of a statistical investigation is the value that separates the population/sample into two halves: the half with higher answers from the half with lower answers.
It is a type of average for data whose values can be arranged in numerical order.
To calculate it there are different cases:
If the data is discrete and ordered from lowest to highest, the median is the middle value:- Odd number of answers: the median is the “answer in the middle”.- Even number of answers: the median is a value between “the two values in
the middle” (usually the midpoint).
Material AICLE Secundaria 2º E.S.O. : ANCIENT GREECE 31Material AICLE 2º de ESO: Statistics: Real Mathematics
4) Calculate the mean, mode and median for Studies I, II and III. Write out your conclusions.
Study I
Mean:
Mode:
Median:
Conclusions:
Study II
Mean:
Mode:
Material AICLE Secundaria 2º E.S.O. : ANCIENT GREECE32 Material AICLE 2º de ESO: Statistics: Real Mathematics
Median:
Conclusions:
Study III
Mean:
Mode:
Median:
Conclusions:
Material AICLE Secundaria 2º E.S.O. : ANCIENT GREECE 33Material AICLE 2º de ESO: Statistics: Real Mathematics
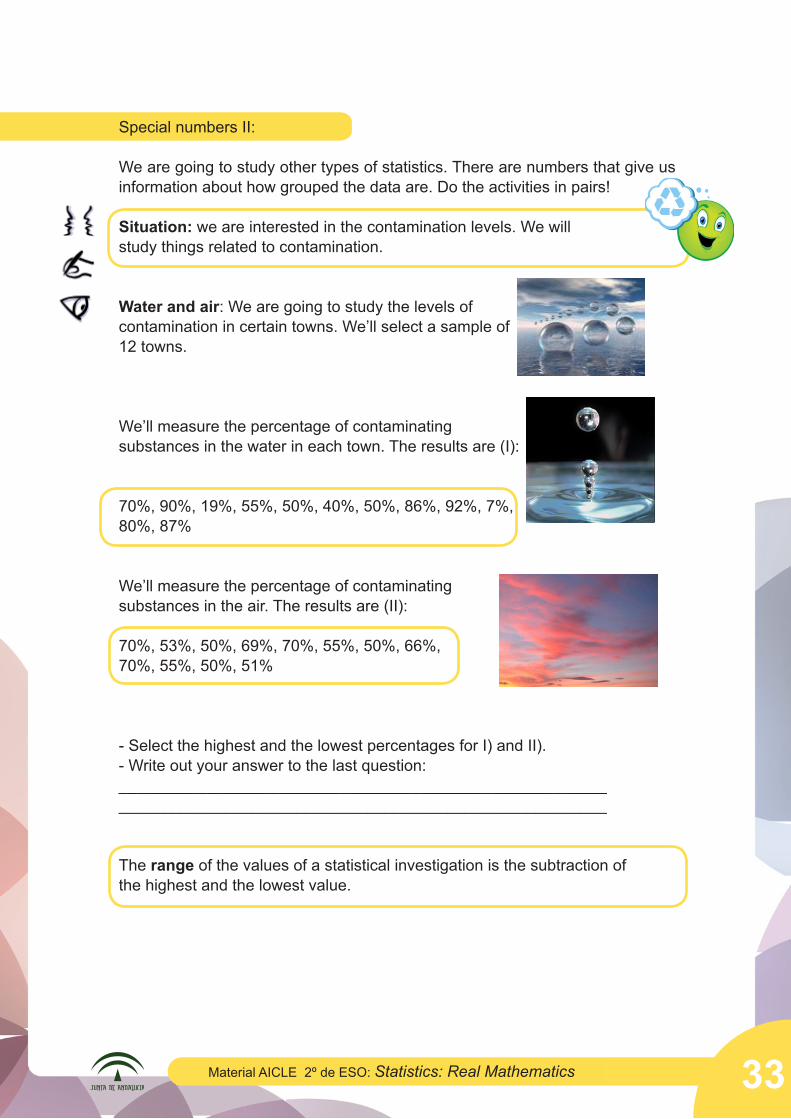
Special numbers II:
We are going to study other types of statistics. There are numbers that give us information about how grouped the data are. Do the activities in pairs!
Situation: we are interested in the contamination levels. We willstudy things related to contamination.
Water and air: We are going to study the levels ofcontamination in certain towns. We’ll select a sample of12 towns.
We’ll measure the percentage of contaminatingsubstances in the water in each town. The results are (I):
70%, 90%, 19%, 55%, 50%, 40%, 50%, 86%, 92%, 7%,80%, 87%
We’ll measure the percentage of contaminatingsubstances in the air. The results are (II):
70%, 53%, 50%, 69%, 70%, 55%, 50%, 66%,70%, 55%, 50%, 51%
- Select the highest and the lowest percentages for I) and II).- Write out your answer to the last question:______________________________________________________________________________________________________________
The range of the values of a statistical investigation is the subtraction ofthe highest and the lowest value.
Material AICLE Secundaria 2º E.S.O. : ANCIENT GREECE34 Material AICLE 2º de ESO: Statistics: Real Mathematics
6) Explain to your classmates:
Explain your study to the other students. Selectthe main things you want to tell them, preparegraphs, etc… and be the expert!
Material AICLE Secundaria 2º E.S.O. : ANCIENT GREECE 35Material AICLE 2º de ESO: Statistics: Real Mathematics
WHAT YOU HAVE LEARNT:
With these activities you have learned…
- That reality can be studied using statistics- That statistical information can be represented using frequency tables and different types of charts- That you can calculate spacial values that will give you information for your study.- How to calculate the median, mode, mean and range.
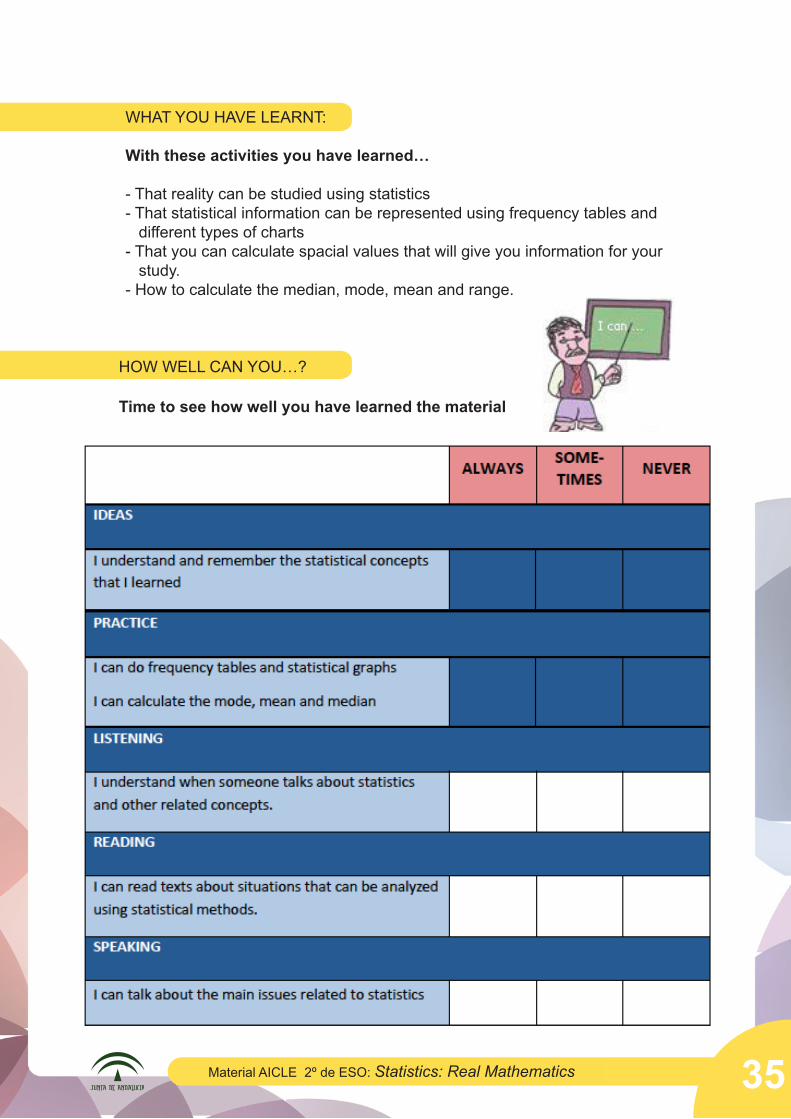
HOW WELL CAN YOU…?
Time to see how well you have learned the material
Material AICLE Secundaria 2º E.S.O. : ANCIENT GREECE36 Material AICLE 2º de ESO: Statistics: Real Mathematics