Integración de variables clínicas y de expresión génica en ...
89
Integración de variables clínicas y de expresión génica en un modelo estadístico para la valoración pronóstica en pacientes con cáncer de mama Javier Nieto Moragas Master Universitario en Bioinformática y Bioestadística Integración de datos ómicos. Ricardo Gonzalo Sanz José Antonio Morán Moreno Carles Ventura Royo 2 de enero de 2018.
Transcript of Integración de variables clínicas y de expresión génica en ...

Integración de variables clínicas y de expresión
génica en un modelo estadístico para la valoración
pronóstica en pacientes con cáncer de mama
Javier Nieto Moragas
Master Universitario en Bioinformática y Bioestadística
Integración de datos ómicos.
Ricardo Gonzalo Sanz
José Antonio Morán Moreno
Carles Ventura Royo
2 de enero de 2018.

Esta obra está sujeta a una licencia de
Reconocimiento-NoComercial-SinObraDerivada 3.0
España de Creative Commons

i
FICHA DEL TRABAJO FINAL
Título del trabajo:
Integración de variables clínicas y de expresión
génica en un modelo estadístico para una
valoración pronóstica en pacientes con cáncer de
mama
Nombre del autor: Javier Nieto Moragas
Nombre del consultor/a: Ricardo Gonzalo Sanz
Nombre del PRA: José Antonio Morán Moreno
Carles Ventura Royo
Fecha de entrega (mm/aaaa): 01/2018
Titulación: Master Universitario de Bioinformática y
Bioestadística
Área del Trabajo Final: Análisis de datos ómicos
Idioma del trabajo: Castellano
Palabras clave Microarray, pipeline, cáncer
Resumen del Trabajo (máximo 250 palabras): Con la finalidad, contexto de aplicación,
metodología, resultados i conclusiones del trabajo.
Pese a programas de detección precoz, el uso de técnicas de imagen de mayor
resolución o la mayor especificidad de los tratamientos quimioterápicos, el cáncer fue
la segunda causa de muerte en España con 238 casos/100.000 habitantes. En el cáncer
de mama, pese al diagnóstico precoz, la mejora en el tratamiento y el aumento en la
tasa de curación, la tasa de supervivencia a los 10 años de la remisión se encuentra en
un 80% de media en los países europeos. Diversos autores han demostrado el valor
añadido al incluir la medición de la expresión génica o la identificación de ciertos
patrones de expresión en la mejora del diagnóstico, pronostico o tratamiento del
cáncer de mama. Recientemente otros autores han descrito una mayor potencia para
pronosticar o predecir respuestas al tratamiento al integrar variables de expresión
génica y variables obtenidas en la práctica clínica en un modelo estadístico sin que esto
suponga un sobreajuste del modelo. Tras un análisis y una selección de variables clínicas
y de expresión génica provenientes de una base de datos pública, se obtuvo un
clasificador mediante LASSO con un rendimiento diagnóstico bueno. La aplicación del
modelo en una cohorte independiente muestra un rendimiento aceptable. Se observa
una ligera mejoría al incluir variables clínicas a los modelos con variables de expresión
génica que debe ser validado en una mayor cohorte.
ii
Abstract (in English, 250 words or less):
Despite early detection programs, the use of higher resolution imaging techniques or
the greater specificity of chemotherapy treatments, cancer remains one of the leading
causes of mortality in the population. For the breast cancer, despite the early diagnosis,
the improvement in the treatment and the increase in the cure rate, the survival rate
after 10 years of remission is around 80% in western coutries. Several authors have
demonstrated the added value by including the measurement of genetic expression or
the identification of patterns in the improvement of the diagnosis or the treatment.
Other authors have described the utility of integrating variables of gene expression and
variables obtained during clinical practice in a statistical model without an overfitting.
After the analysis and the selection of clinical and gene expression variables from a
public database, a LASSO classifier with good diagnostic performance was obtained. The
application of the model in an independent cohort shows an acceptable performance.
However, only a small improvement is observed when clinical variables are included in
the models with the gene expression variables.
iii
Índice
Lista de figuras ................................................................................................. iv Lista de Tablas ................................................................................................. 4 1. Introducción ............................................................................................. 5 1.1. Contexto y justificación del Trabajo .................................................. 5
1.2. Objetivos del Trabajo .......................................................................... 6 1.3. Enfoque y método seguido ................................................................. 7 1.4 Planificación del Trabajo ........................................................................ 8 1.5 Breve sumario de productos obtenidos .............................................. 10 1.6 Breve descripción de los otros capítulos de la memoria .................. 10
2. Fundamentos biológicos....................................................................... 11 2.1. Transcriptómica y la medición de la expresión génica. ................. 11
2.2. Concepto y tipos de microarrays. .................................................... 12 2.3. Conjunto de datos utilizados. ........................................................... 13
3. Pipeline del modelo para clasificación de pacientes .......................... 14 3.1. Preparación para el análisis. ............................................................ 14
3.1.1. Proyecto Bioconductor y paquetes ......................................... 14 3.1.2. Diseño del pipeline .................................................................... 15
3.2. Lectura de los datos .......................................................................... 15
3.3. Resumen y recodificación de las variables clínicas ....................... 17 3.4. Selección de variables clínicas relacionadas con el pronóstico ... 18
3.5. Análisis de los resultados de expresión génica. ............................ 19 3.5.1. Control de calidad de los datos originales ............................. 19 3.5.2. Normalización de los datos ...................................................... 20
3.5.3. Resumen de los datos .............................................................. 21
3.6. Filtrado de las sondas de expresión ................................................ 22 3.7. Selección de variables de expresión génica relacionadas con el pronóstico .................................................................................................... 23
4. Construcción y elaboración del clasificador. ...................................... 24 4.1. Método LASSO para la selección y clasificación de variables. ..... 24
4.2. Selección de variables por LASSO .................................................. 25 4.3. Elaboración del clasificador ............................................................. 26
4.3.1. Partición de los datos ............................................................... 26
4.3.2. Construcción del modelo y validación cruzada ..................... 26 4.4. Validación de los resultados en datos diferentes. .......................... 27
5. Conclusiones ......................................................................................... 29 6. Glosario .................................................................................................. 30 7. Bibliografía ............................................................................................... 1
8. Anexos ...................................................................................................... 1
8.1. Anexo: Informe de calidad de GSE20194 .......................................... 1 8.2. Informe con el código empleado ........................................................ 8 8.3. Anotación de genes, sus funciones biológicas y participación en rutas metabólicas seleccionados en el modelo con variables clínicas y de expresión génica. ........................................................................................ 28 8.4. Relación de genes, procesos biológicos y participación en rutas metabólicas seleccionados en el modelo con sólo variables de expresión génica. .......................................................................................................... 42
Lista de figuras
Ilustración 1Diagrama de Gantt sobre la planificación del trabajo .............................................. 9 Ilustración 2 Diferentes niveles en la biología molecular. Extraído de Wu RD et al. JDR 2011; 90:561-572. ................................................................................................................................. 11 Ilustración 3 Tipos de microarrays. Obtenido de la página European Bioinformatics Institute .. 13 Ilustración 4 Esquema del diseño del pipeline ............................................................................. 15 Ilustración 5 Estructura del objeto ExpressiónSet. Obtenido del curso con dirección web (https://biomedizin.unibas.ch/fileadmin/DKBW/redaktion/Group_Directories/Bioinformatics/IntroBioc2016/03_MicroarrayFromCEL_html.html) ...................................................................... 16 Ilustración 6 A y B, Nivel de expresión de las primmeras 50 sondas antes y despues de normalizar los datos mediante la función normalize.ExpressionSet.quantiles(). C y D, señal de los chips antes y después de normalizar los datos. ..................................................................... 21 Ilustración 7 Análisis de componentes principales. A. Distribución de muestras en función de los dos primeros componentes principales. B Mismos casos etiqueados con colores en función de la variable ER. C. Datos etiquetados con la variable PR. D, gráfico de barras de la varianza explicada a lo largo de los componenetes principales. ............................................................... 22 Ilustración 8 Coeficientes de las sondas seleccionadas durante el contraste entre los dos grupos. En rojo se representan las sondas sobreexpresadas en caso de recaída de la patología y en azul las sondas infraexpresadas en pacientes recaídos. ..................................................................... 22 Ilustración 9 Selección del factor de penalización en función del valor de AUC..........................25
Lista de Tablas Tabla 1 Resumen de las variables clínicas analizadas y sus valores. La columna de recodificación recoge los nuevos valores calculados en ciertos casos. .............................................................. 17 Tabla 2 Resumen de la distribución de las variables clínicas en la traning set y la testing set. .. 26
5
1. Introducción
1.1. Contexto y justificación del Trabajo
Pese a programas de detección precoz, el uso de técnicas de imagen de mayor resolución
o la mayor especificidad de los tratamientos quimioterápicos, el cáncer sigue siendo una
de las primeras causas de mortalidad en la población. Un ejemplo es el cáncer de mama
que, pese al diagnóstico precoz, la mejora en el tratamiento y el aumento en la tasa de
curación, la tasa de supervivencia a los 10 años de la remisión se encuentra en un 80% de
media en los países europeos. Por otro lado, la tasa de recaída total se encuentra entre
un 2 y 5% en los 20 años posteriores a la remisión1.
La guía de la Sociedad Europea de Oncología Médica (ESMO) para el diagnóstico,
tratamiento y seguimiento del cáncer de mama1, recomienda basarse en técnicas de
imagen para determinar el tamaño del tumor, detección de enfermedad en ganglios
linfáticos o detección de metástasis avanzadas, para el estadiaje en el diagnóstico del
carcinoma. Durante el diagnóstico, la determinación del subtipo molecular se basa en
pruebas de laboratorio como la determinación de la expresión de receptores de
estrógenos (ER), expresión de progestágenos (PR), presencia del receptor de crecimiento
epidérmico humano tipo 2 (HER2), tipo histológico del tumor o la del marcador de
proliferación Ki67 o la oncoproteina p53 en tejido. La medición de estos parámetros no
escapa a la subjetividad del observador y/o presentan limitaciones en cuanto a la
resolución y/o rendimiento.
En la revisión de la guía para el manejo del cáncer de mama del año 20151, se recomienda
la detección de mutaciones en la familia de genes BRCA en pacientes con antecedentes
familiares de cáncer de mama. La detección de estas mutaciones permite plantear un
programa de detección precoz diferente al de la población global y acompañarlo de la
opción de realizar mastectomías radicales de forma preventiva. Sin embargo, estas
cirugías no garantizan completamente la erradicación del riesgo de cáncer.
La comercialización de ensayos como Oncotype DX2,3, MammaPrint4 o Prosigna5 que
miden el perfil de expresión génica mediante microarrays de expresión u otras tecnologías
similares ha aportado una nueva visión en el manejo de la patología. Estos ensayos
pretenden complementar las pruebas actuales para establecer el pronóstico o realizar
predicciones sobre el uso de ciertos tratamientos. No obstante, estos recursos todavía se
encuentran en fase de ensayo y no se han incluido en la práctica clínica de manera
rutinaria. Algunos ensayos presentan limitaciones como los dos primeros mencionados2-
4, que solo son aplicables a un subtipo molecular de cáncer.

6
Diversos autores han demostrado el valor añadido al incluir la medición de la expresión
génica o la identificación de ciertos patrones de expresión en la mejora del diagnóstico,
pronostico o tratamiento del cáncer de mama7–9. Recientemente otros autores han
descrito la utilidad de integrar variables de expresión génica y variables obtenidas en la
práctica clínica en un modelo estadístico sin que esto suponga un sobreajuste del
modelo10.
Este proyecto pretende estudiar el rendimiento de un modelo clasificador que integre
variables de expresión génica y variables clínicas obtenidas de la práctica asistencial y que
las guías recomiendan determinar con objetivos diagnósticos, pronósticos y terapéuticos1.
La base de datos empleada que se utilice para la construcción del modelo debe contener
el mayor número de variables clínicas medidas para esta patología junto a la
determinación de la expresión génica mediante una tecnología reproducible que haya
superado los estandares de calidad.
El modelo obtenido tras el estudio debe ser reproducible y que demuestre un buen
rendimiento para clasificar los pacientes con diferentes subtipos de enfermedad para
poder optimizar el diagnóstico, pronostico y/o tratamiento del cáncer de mama.
1.2. Objetivos del Trabajo
Principales:
A. Análisis y selección de las variables clínicas y las de expresión génica estén
relacionadas con el pronóstico.
B. Integrar los dos tipos de variables en un modelo estadístico y comprobar
su validez como modelo predictor.
Secundarios:
A.1. Análisis y selección de variables clínicas en su forma original o una reinterpretación propuesta por las guías clínicas.
A.2. Análisis de variables de expresión génica y selección de los genes diferencialmente expresados. Se estudiará la posibilidad de seleccionarlos en base a sus perfiles funcionales o de forma individual.
B.1. Construir un modelo clasificador integrando las variables analizadas previamente. Se contemplará la opción de utilizar métodos como LASSO, SVM u otros similares y comparar su rendimiento en función del tiempo del que se disponga.
B.2. Validación del modelo. Se estudiará la posibilidad de utilizar una base de datos diferente a la utilizada para construir el modelo.

7
1.3. Enfoque y método seguido
Se han contemplado los siguientes criterios para escoger una base de datos adecuada para
este proyecto:
a) Las variables clínicas deben contemplar los diferentes subtipos de cáncer de
mama.
b) Medición de la expresión de genes con una tecnología actual y reproducible.
c) La simultaniedad en la determinación de los perfiles de expresión génica debe
ser valorada al escoger una tecnología.
Se realizó una búsqueda exhaustiva en diferentes liberarías de datos como Gene Expression
Omnibus (GEO), The Genoma Cancer Atlas (TGCA), y otros paquetes de R/Biocondcutor, con
la intención de escoger la base de datos que cumpla el máximo número de criterios.
Con la base de datos escogida, se hizo una descripción y análisis de las variables. Las variables
clínicas fueron descritas mediante métodos numéricos para caracterizar el tipo de pacientes
con los que se trabajaba. Las variables de expresión génica se sometieron a un control de
calidad para descartar posibles outliers.
Una selección previa de cada tipo de variable fue realizada con el objetivo de quedarse
únicamente con las variables con mayor relación a la variable respuesta y así eliminar posibles
interferencias a la hora de construir el modelo. Esta selección siguió cuatro pasos
importantes:
• Selección de variables clínicas mediante un test de ꭕ2 multiple.
• Filtrado de sondas con poca variación o sin información a cerca de la anotación.
• Selección diferencial de las sondas mediante métodos de comparación de medias
(estadístico t moderado).
• Sólo las variables filtradas en los pasos anteriores se volvieron a seleccionar con un
método de penalización (LASSO, least absolute shrinkage and selection operator).
En la segunda parte, se construyó el modelo clasificador con el método LASSO con una
validación cruzada. Para ello se dividió la muestra de pacientes en dos subgrupos; con el
primero conjunto, training set, se construyó el modelo y con el segundo, testing set, se validó
el clasificador.
Con la intención de ver el nivel de reproducibilidad, se probó el clasificador en otra base de
datos independiente. Para ello en un primer paso se describió los pacientes de esta segunda
base de datos para poder compararlos con los primeros. En un segundo término se aplicó el
clasificador para valorar el rendimiento.
8
1.4 Planificación del Trabajo
PEC 1
o Establecer y redactar el plan de trabajo
PEC 2
o Análisis de variables clínicas mediante métodos gráficos y numéricos. Relación de
los resultados con la variable respuesta. Cálculo de nuevas variables pronósticas
definidas en la bibliografía (4 días; 17/10/17-20/10/17).
o Análisis de variables de expresión génica. Control de calidad, normalización de los
datos (4 días; 21/10-25/10).
o Filtrado de sondas sin resultados de anotación y con poca variación respecto a la
variable respuesta.
o Determinación de genes diferencialmente expresados mediante comparación de
medias y selección de los genes con mayor expresión diferencial (6 días; 26/10-
3/11).
o Hitos: Obtención de las variables clínicas más significativas que se incluirán en el
modelo estadístico (20/10/17).
PEC 3
o Identificación de similitudes funcionales de los diferentes genes y estudio de la
posible inclusión de estos en forma individual o agrupados por función (9 dias;
04/11-15/11).
o Integración de variables. Comparación entre modelos obtenidos mediante
diferentes métodos estadísticos (9 días; 21/11-01/12).
o Validación del modelo mediante remuestreo o con una dataset diferente (6 días;
02/12-12/12).
o Hitos: Obtención de variables de expresión más significativas para incluirlas en el
modelo (15/11/17). Integración de los dos tipos de variables en un modelo
predictivo (01/12/17) y reproducible en otros datasets o validado mediante
remuestreo (12/12/17).
PEC 4
o Redacción de la memoria (11 días; 19/12/17-04/01/18).
PEC 5
o Elaborar una presentación con diapositivas que resuma el trabajo y defenderlo ante un
tribunal (6 días; 03/01/18-10/01/18).

9
Calendario:
Ilustración 1Diagrama de Gantt sobre la planificación del trabajo
En el calendario no se pueden observar los festivos de color más sombreado debido a la resolución. Se han contemplado los siguientes:
12/10/17: Dia de la Hispanidad 06/12/17: Dia de la Constitución 25/12/17: Navidad
01/11/17: Todos los Santos 08/12/17: Inmaculada Concepción 06/01/18: Reyes.
10
1.5 Breve sumario de productos obtenidos
• Plan de trabajo entregado en la PEC 1.
• Avances del proyecto entregados en la PEC 2 y la PEC 3.
• Memoria que se entrega en la PEC 4: sitúa el contexto en el que se desarrolla el trabajo,
explica el pipeline diseñado y comenta los resultados obtenidos.
• Pipeline e informe de resultados: código esplicado en un formato compatible con la forma
que se ubica en el anexo.
• Presentación virtual del proyecto para resumir los resultados obtenidos durante el trabajo.
1.6 Breve descripción de los otros capítulos de la memoria
• Capítulo 2: se explican los conceptos de microarray, las diferentes técnicas de medición de
expresión génica y el contexto actual en que se encuentra el manejo de los pacientes con
cáncer de mama para entender la información que nos aportan las variables clínicas en el
modelo construido.
• Capítulo 3: se desarrolla la primera parte del trabajo, correspondiente al primer objetivo
principal, en que se analiza y se seleccionan las variables clínicas y de expresión génica. A
medida que se avance en el texto se comentaran las estrategias seguidas a la vez que el
riesgo de error.
• Capítulo 4: contiene la segunda parte del trabajo, en que se construye el modelo estadístico
con las variables seleccionadas en el capítulo anterior.

11
2. Fundamentos biológicos 2.1. Transcriptómica y la medición de la expresión génica.
En biología molecular, el neologismo “ómicas” se refiere al estudio de elementos moleculares a
diferentes niveles en un organismo. La genómica, proteómica o metabolómica son subcampos que
se refieren al estudio del genoma, proteoma o metaboloma, respectivamente. El objetivo de cada
nivel es el de caracterizar y/o cuantificar elementos pertenecientes a dicho nivel y que presentan
características similares. Un ejemplo lo encontramos en la genómica; se cuantifica la variación de
número de copias de fragmentos de DNA (CNV) y a la vez caracteriza mutaciones en genes11,12. Las
dos mediciones pueden estar relacionadas, siendo interesante caracterizarlas de forma simultánea 13.
Las ómicas han evolucionado en diversos campos tales como la agronomía 14, industria energética
15, pero principalmente en el campo de la medicina11,12 y en sus diferentes vertientes 16,17.
Ilustración 2 Diferentes niveles en la biología molecular. Extraído de Wu RD et al. JDR 2011; 90:561-572.
Este proyecto se ha centrado en el campo de la transcriptómica que fue inicialmente definida por
Wang y colaboradores18. Este campo se ocupa de cuantificar y caracterizar la expresión diferencial

12
de los diferentes genes mediante el estudio del RNA mensajero (mRNA). La PCR cuantitativa o los
microarrays de expresión génica son los dos métodos más utilizados hasta hoy, pese a que la
denominada Next Generation Sequencing, como la secuenciación masiva de RNA (RNAseq), está
siendo la técnica que esté substituyendolas 18,19.
Los microarrays (coloquialmente denominados chips) han sido ampliamente estudiados; tras una
búsqueda exhaustiva, esta tecnología cumplía con los requisitos establecidos al inicio del proyecto.
Los microarrays presentan ventajas respecto a la PCR cuantitativa en cuanto al estudio simultaneo
de diferentes genes con una buena correlación entre resultados20. La idea de utilizar datos de
secuenciación de RNA (RNAseq) cumplía el criterio de tecnología de uso actual, pero sin embargo
no se encontraron bases de datos disponibles que cumplieran el resto de criterios.
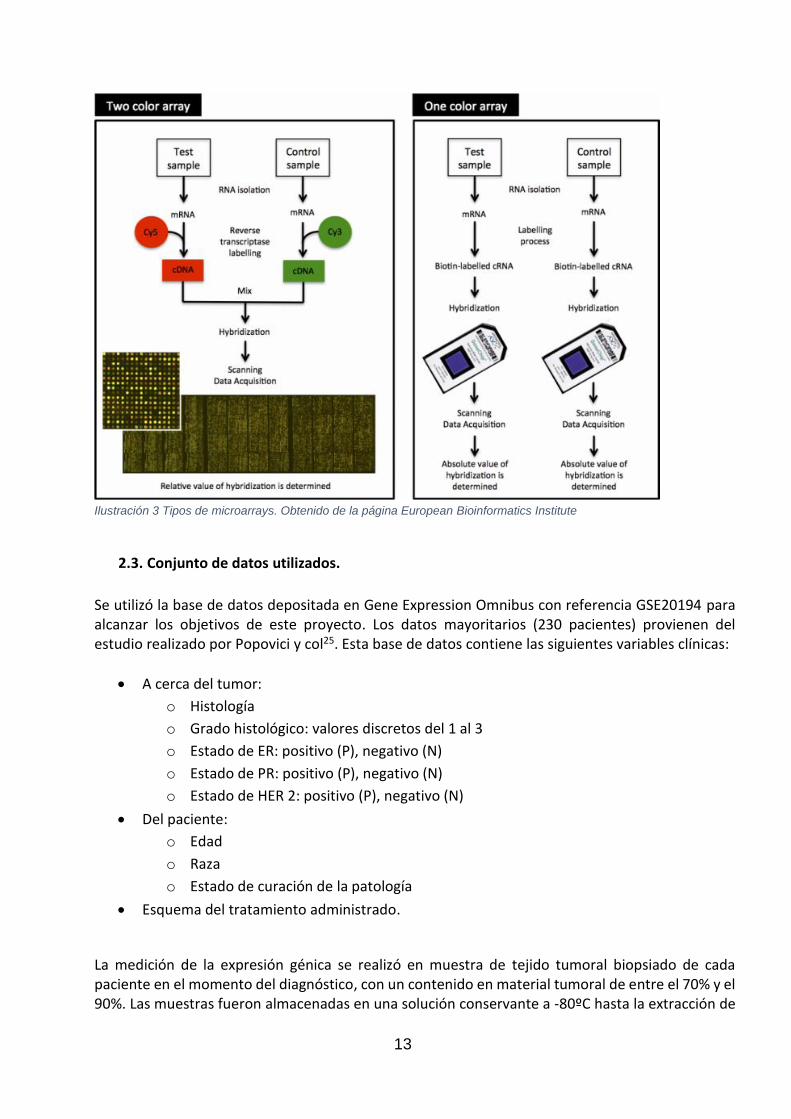
2.2. Concepto y tipos de microarrays.
A mediados de los años 90 empezaron a describirse los primero microarrays 21,22,23. Esta tecnología
ha servido para analizar proteínas, RNA o DNA. En función del número de muestras que se hibridan
al mismo tiempo se clasifican en dos grandes grupos:
• Microarrays de dos colores o spotted arrays 21
• Microarrays de un color o arrays de oligonucleótidos 24
Los microarrays de dos colores se basan en la hibridación competitiva de dos muestras marcadas
con un fluorocromo distinto. Tras un periodo de hibridación de las muestras marcadas con las
sondas fijadas en el soporte, se irradia el chip con una luz laser para excitar el fluorescente y así ver
qué muestra se ha hibridado con cada sonda, generando así un mapa de tres colores diferentes: el
rojo (Cy5), el verde (Cy3) y la mezcla de los dos (amarillo). La expresión de cada sonda se determina
con la medición de la fluorescencia, la cual es proporcional a la cantidad de RNA mensajero. El valor
calculado de cada sonda es una expresión relativa de una muestra detectada respecto a la otra 21.
Los microarrays de un canal son producidos de forma mayoritaria por Affymetrix 24. Esta tecnología
se caracteriza por utilizar un solo fluorocromo que sirve para marcar las muestras. A diferencia de
los microarrays anteriores, los resultados corresponden a una expresión absoluta. Este tipo de
microarrays presentan dos tipos de sondas: una complementaria a la secuencia que marca (perfect
match) y otra igual que la anterior a excepción del nucleótido central (mismatch).
13
Ilustración 3 Tipos de microarrays. Obtenido de la página European Bioinformatics Institute
2.3. Conjunto de datos utilizados.
Se utilizó la base de datos depositada en Gene Expression Omnibus con referencia GSE20194 para alcanzar los objetivos de este proyecto. Los datos mayoritarios (230 pacientes) provienen del estudio realizado por Popovici y col25. Esta base de datos contiene las siguientes variables clínicas:
• A cerca del tumor:
o Histología
o Grado histológico: valores discretos del 1 al 3
o Estado de ER: positivo (P), negativo (N)
o Estado de PR: positivo (P), negativo (N)
o Estado de HER 2: positivo (P), negativo (N)
• Del paciente:
o Edad
o Raza
o Estado de curación de la patología
• Esquema del tratamiento administrado.
La medición de la expresión génica se realizó en muestra de tejido tumoral biopsiado de cada paciente en el momento del diagnóstico, con un contenido en material tumoral de entre el 70% y el 90%. Las muestras fueron almacenadas en una solución conservante a -80ºC hasta la extracción de
14
RNA y la medición del perfil de expresión. La expresión génica fue medida mediante un chip Human Genome U133A (HGU133A) de Affymetrix y se realizó en diferentes centros en diferentes periodos de tiempo. Este chip contiene un total de 22283 sondas que reconocen 13516 genes. Actualmente este set se ha sustituido por una versión más nueva con referencia HGU U133 Plus 2.0, que mide un mayor número de genes que el set original 26. print(gset)
## ExpressionSet (storageMode: lockedEnvironment) ## assayData: 22283 features, 278 samples ## element names: exprs ## protocolData: none ## phenoData ## sampleNames: GSM505327 GSM505328 ... GSM505605 (278 total) ## varLabels: title geo_accession ... relation.1 (51 total) ## varMetadata: labelDescription ## featureData: none ## experimentData: use 'experimentData(object)' ## Annotation: GPL96
> length(unique(as.character(featureData(gset)$"Gene Symbol")))
[1] 13516
En el estudio de Popovici y col.25 se estudió el rendimiento de 40 modelos clasificadores que estaban formados por variables de expresión génica. Se construyeron para determinar el pronóstico del paciente o definir el estado de receptores de estrógenos. Cada modelo es el resultado de combinar 5 estrategias distintas en relación al filtrado de variables previo a construir el modelo y el uso de 8 clasificadores distintos.
3. Pipeline del modelo para clasificación de pacientes
3.1. Preparación para el análisis.
El proyecto Bioconductor ha sido la fuente mayoritaria de las librerías y paquetes utilizados durante
el análisis. Para ver la lista de paquetes y librerías instalados, referirse a los anexos.
a) Proyecto Bioconductor y paquetes Se instaló el proyecto Bioconductor con el siguiente comando: > source("https://bioconductor.org/biocLite.R")
Bioconductor version 3.5 (BiocInstaller 1.26.1), ?biocLite for help
A newer version of Bioconductor is available for this version of R, ?BiocUpgrade for help

15
> biocLite()
BioC_mirror: https://bioconductor.org
Using Bioconductor 3.5 (BiocInstaller 1.26.1), R 3.4.2 (2017-09-28).
b) Diseño del pipeline
3.2. Lectura de los datos
Ilustración 4 Esquema del diseño del pipeline
Lectura de GSE21094 .txt, getGEO()
QC datos de expresión arrayqualitytmetrics()
Descripción de variables clínicas.
Normalización normalization.ExpresionSet
Selección de variables clínicas
Filtrado de las sondas nsFilter()
Selección de sondes con expresión diferencial
limma
Selección de variables. LASSO
Elaboración del classificador. LASSO
GSE25055 Testing set Validación
Training set
Partición GSE2109
4
16
El deseo de trabajar con datos primarios (archivos con extensión CEL) para aplicar un control de
calidad no se cumplió debido al elevado número de muestras de la base de datos. El número de
muestras hizo que los requisitos informáticos para trabajar con los archivos primarios fueran
exigentes. Por este motivo, se optó por trabajar con datos ya tratados en el estudio original. Estos
datos se encuentran con formato .txt o .soft, el primero de mayor interés al poder leerse con algún
editor de datos.
El archivo GSE20194_series_matrix.txt.gz fue descargado manualmente de la web de GEO. La
función getGEO() del paquete GEOquery permite descargar y leer de forma automática el archivo
pero se optó por la forma manual ya que la matriz de datos originales presentó cierto desorden en
los datos. De nuevo, de forma manual con el uso de Microsoft Excel 2016, se editaron los datos para
facilitar su lectura.
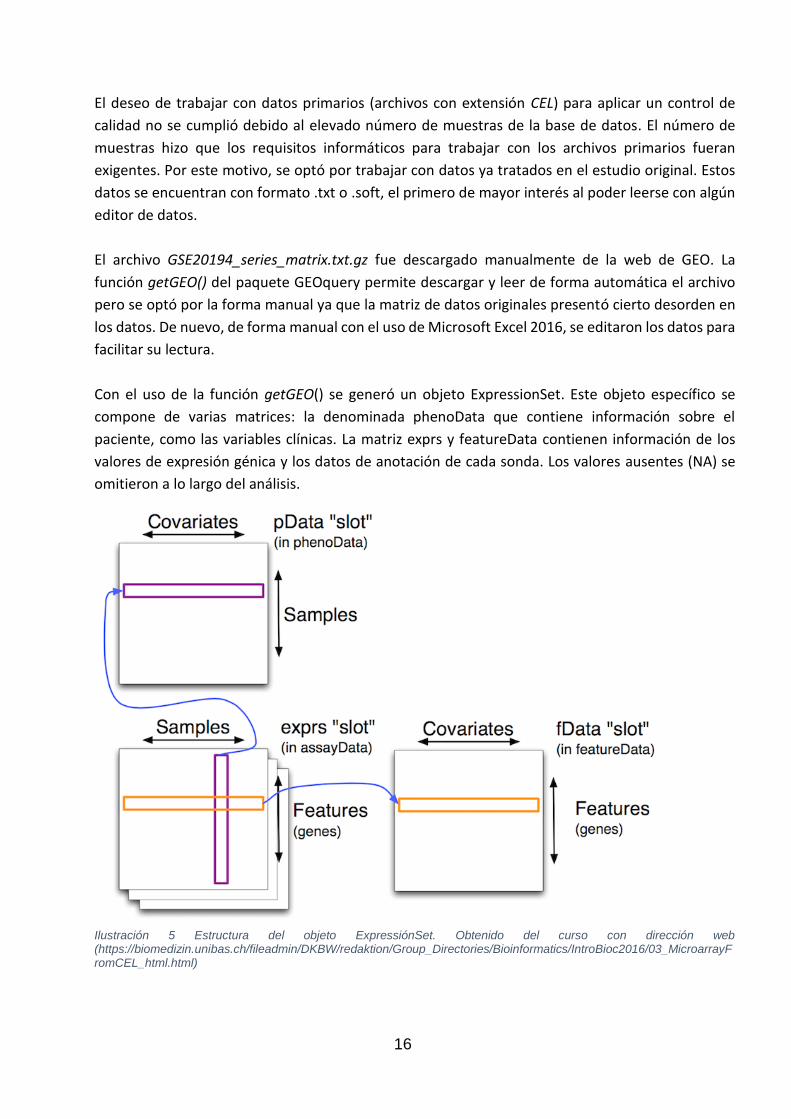
Con el uso de la función getGEO() se generó un objeto ExpressionSet. Este objeto específico se
compone de varias matrices: la denominada phenoData que contiene información sobre el
paciente, como las variables clínicas. La matriz exprs y featureData contienen información de los
valores de expresión génica y los datos de anotación de cada sonda. Los valores ausentes (NA) se
omitieron a lo largo del análisis.
Ilustración 5 Estructura del objeto ExpressiónSet. Obtenido del curso con dirección web (https://biomedizin.unibas.ch/fileadmin/DKBW/redaktion/Group_Directories/Bioinformatics/IntroBioc2016/03_MicroarrayFromCEL_html.html)
17
3.3. Resumen y recodificación de las variables clínicas
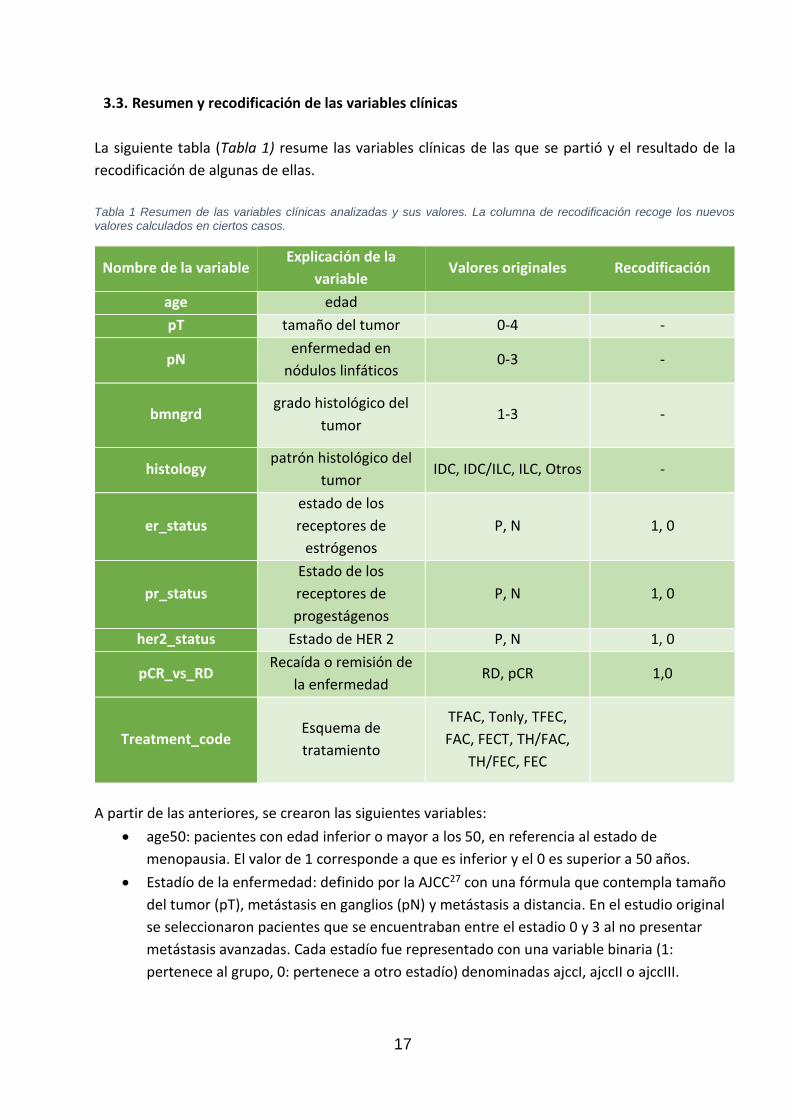
La siguiente tabla (Tabla 1) resume las variables clínicas de las que se partió y el resultado de la
recodificación de algunas de ellas.
Tabla 1 Resumen de las variables clínicas analizadas y sus valores. La columna de recodificación recoge los nuevos valores calculados en ciertos casos.
Nombre de la variable Explicación de la
variable Valores originales Recodificación
age edad
pT tamaño del tumor 0-4 -
pN enfermedad en
nódulos linfáticos 0-3 -
bmngrd grado histológico del
tumor 1-3 -
histology patrón histológico del
tumor IDC, IDC/ILC, ILC, Otros -
er_status
estado de los
receptores de
estrógenos
P, N 1, 0
pr_status
Estado de los
receptores de
progestágenos
P, N 1, 0
her2_status Estado de HER 2 P, N 1, 0
pCR_vs_RD Recaída o remisión de
la enfermedad RD, pCR 1,0
Treatment_code Esquema de
tratamiento
TFAC, Tonly, TFEC,
FAC, FECT, TH/FAC,
TH/FEC, FEC
A partir de las anteriores, se crearon las siguientes variables:
• age50: pacientes con edad inferior o mayor a los 50, en referencia al estado de
menopausia. El valor de 1 corresponde a que es inferior y el 0 es superior a 50 años.
• Estadío de la enfermedad: definido por la AJCC27 con una fórmula que contempla tamaño
del tumor (pT), metástasis en ganglios (pN) y metástasis a distancia. En el estudio original
se seleccionaron pacientes que se encuentraban entre el estadio 0 y 3 al no presentar
metástasis avanzadas. Cada estadío fue representado con una variable binaria (1:
pertenece al grupo, 0: pertenece a otro estadío) denominadas ajccI, ajccII o ajccIII.
18
• pTlocal o pTmet fueron dos variables resultantes de reagrupar los pacientes
pertenecientes a grupos de pT equivalentes a un tamaño de tumor inferior o superior a 20
mm.
• pN0 o pNmet son dos variables que se representan la reagrupación de los pacientes
pertenecientes a los grupos 0 y 1 o a 2 y 3 de la variable original pN. Dichos grupos se
correlacionan con los pacientes que presentan extensión de la enfermedad o no a ganglios
linfáticos.
• los diferentes niveles de la variable bmngrd se recodificaron en nuevas variables,
correspondientes a los grados del 1 al 3.
En total, se partió de 21 variables clínicas que son descritas de forma numérica a continuación.
clinvar<-pData(phenoData(gset))[,c(2,11:18,20,23,24,52:62)] summary(clinvar[,-1])
## age race er_status pcr_vs_rd1 pr_status pT ## Min. :26.00 asian : 18 0:114 0: 56 0:157 0 : 3 ## 1st Qu.:45.00 black : 29 1:164 1:222 1:121 1 : 23 ## Median :51.00 hispanic: 42 2 :147 ## Mean :51.99 mixed : 3 3 : 50 ## 3rd Qu.:59.00 white :176 4 : 53 ## Max. :79.00 NA's : 10 NA's: 2 ## NA's :1 ## pN bmngrd her2_status histology treatment_code ## 0 : 79 1 : 13 0:219 IDC :211 TFAC :213 ## 1 :125 2 :104 1: 59 IDC/DCIS: 20 TFEC : 35 ## 2 : 31 3 :150 ILC : 8 TH/FAC : 6 ## 3 : 42 NA's: 11 IDC/ILC : 7 TXFAC : 6 ## NA's: 1 : 5 : 3 ## (Other) : 24 (Other): 13 ## NA's : 3 NA's : 2 ## pTlocal pTmet pN0 pNmet grade1 grade2 ## 0 :103 0 :173 0 : 73 0 :204 0 :254 0 :163 ## 1 :173 1 :103 1 :204 1 : 73 1 : 13 1 :104 ## NA's: 2 NA's: 2 NA's: 1 NA's: 1 NA's: 11 NA's: 11 ## ## grade3 ajccI ajccII ajccIII age50 ## 0 :117 0 :271 0 :132 0 :151 0 :133 ## 1 :150 1 : 6 1 :145 1 :125 1 :144 ## NA's: 11 NA's: 1 NA's: 1 NA's: 2 NA's: 1
3.4. Selección de variables clínicas relacionadas con el pronóstico
Van Vliet y cols 28 estudiaron tres estrategias en la integración de variables usando diferentes clasificadores. Este estudio concluyó que la estrategia más interesante fue la integración de variables tras una preselección para evitar interferencias en la construcción del modelo con cualquier clasificador. En este proyecto se optó por esta opción, realizando un test ꭕ2 múltiple para ver la relación entre las variables clínicas y la variable de agrupación (estado de la patología del paciente). Se corrigieron los valores de p con el método de Benjamini y Hochberg29 con un nivel de significación de α=0,01.
19
## adj.p.value ## er_status 7.297519e-12 ## pr_status 7.248266e-06 ## her2_status 4.373811e-04 ## pT 4.158349e-01 ## pTlocal 1.000000e+00 ## pTmet 1.000000e+00 ## pN 1.650479e-01 ## pN0 9.301505e-01 ## pNmet 9.301505e-01 ## bmngrd 9.601512e-05 ## age50 8.546123e-01 ## grade1 4.075537e-01 ## grade2 2.156066e-04 ## grade3 3.351813e-05 ## ajccI 7.680278e-01 ## ajccII 7.224145e-01 ## ajccIII 5.754963e-01 ## histology 2.902538e-01 ## treatment_code 1.265552e-02
Seis variables clínicas presentaron relación con el estado de curación de los pacientes: el estado de receptores de estrógenos (ER) y de progestágenos (PR), la presencia de receptor de HER2 (HER2), grado histológico en forma de variable original y de las variables correspondientes al grupo 2 y 3. No se seleccionaron ninguna de las variables relacionadas con el tamaño del tumor, estado de enfermedad en ganglios o la clasificación de la AJCC pese a estar descrito su valor pronóstico1. Se observó que los datos no presentaban una distribución homogénea entre los grupos de pT, pN y AJCC, siendo mayoritarios los pacientes pertenecientes a estadios avanzados (AJCC 2 o 3), con tamaños del tumor intermedios y con poca extensión de la enfermedad en ganglios periféricos.
3.5. Análisis de los resultados de expresión génica.
a) Control de calidad de los datos originales Popovici y col.25 normalizaron los datos mediante MAS 5.0 (Affymetrix, Santa Clara, CA, USA) con la configuración predeterminada y utilizaron la función SimpleAffy para el control de calidad25. El paquete arrayQualityMetrics fue descrito recientemente como una forma de resumir el control de calidad de microarrays en un formato fácil de leer. Se utilizó la función principal para elaborar el informe que se incluye en el anexo. En este control de calidad se utilizaron diferentes métodos para detectar resultados irregulares tanto a nivel individual como colectivo: - Distancia entre muestras: el mapa de colores representa la diferencia media absoluta de la
distancia euclídea entre las muestras. Las variaciones de tipo biológico o de tipo experimental
pueden ser detectadas mediante este método. En el informe, observamos que 18 muestras han
sido clasificadas como outliers.
20
- Distribución de las intensidades: con el gráfico de cajas observamos qué nivel de intensidad
presentan las muestras. Utilizando el estadístico de Kolmogorov-Smirnov Ka, se detectaron 11
outliers, coincidentes con los anteriores.
- Análisis de Componente Principales: se representan las muestras tras una reducción de
dimensiones. Los puntos más grandes corresponden a muestras cuyas distribución se interpreta
como aberrante en relación a las demas. Observamos que el Componente Principal 1 separa 12
muestras con valores mayores a 1700, cuya observación coincide con los métodos anteriores.
En este gráfico se detecta que las muestras 69 y 70 son muy parecidas y tras ser examinadas,
se observó que correspondían a un replicado.
- Gráfico de densidades: método que sirve para estudiar la distribución de la señal entre las
muestras. Observamos que la muestra 166, señalada también por otros métodos, presenta una
distribución distinta a las demás.
- Varianza de la intensidad de señal en función del valor medio: en este gráfico se representa la
evolución de la media de la varianza a lo largo del rango de señal. Se observa un trazado lineal
si se parte de datos normalizados y en base logarítmica.
- MA plot: este método representa la diferencia de intensidades entre la muestra y la mediana
del conjunto respecto a la mediana de las dos. Se utilizó el estadístico de Hoeffding Da para
estudiar posibles outliers. Sólo han sido representadas las cuatro muestras con valor más alto
de Da, que no supera el umbral, y las cuatro con valor más bajo.
Tras realizar un primer control de calidad de los datos, se eliminaron las 14 muestras clasificadas como outliers por los diferentes métodos (con numero GSM505470, GSM505479, GSM505489, GSM505491 GSM505492, GSM505493, GSM505495, GSM505496, GSM505497, GSM505498, GSM505499, GSM505500, GSM505501, GSM505502). De forma adicional, se eliminó el replicado correspondiente al mismo paciente, con GSM505397.
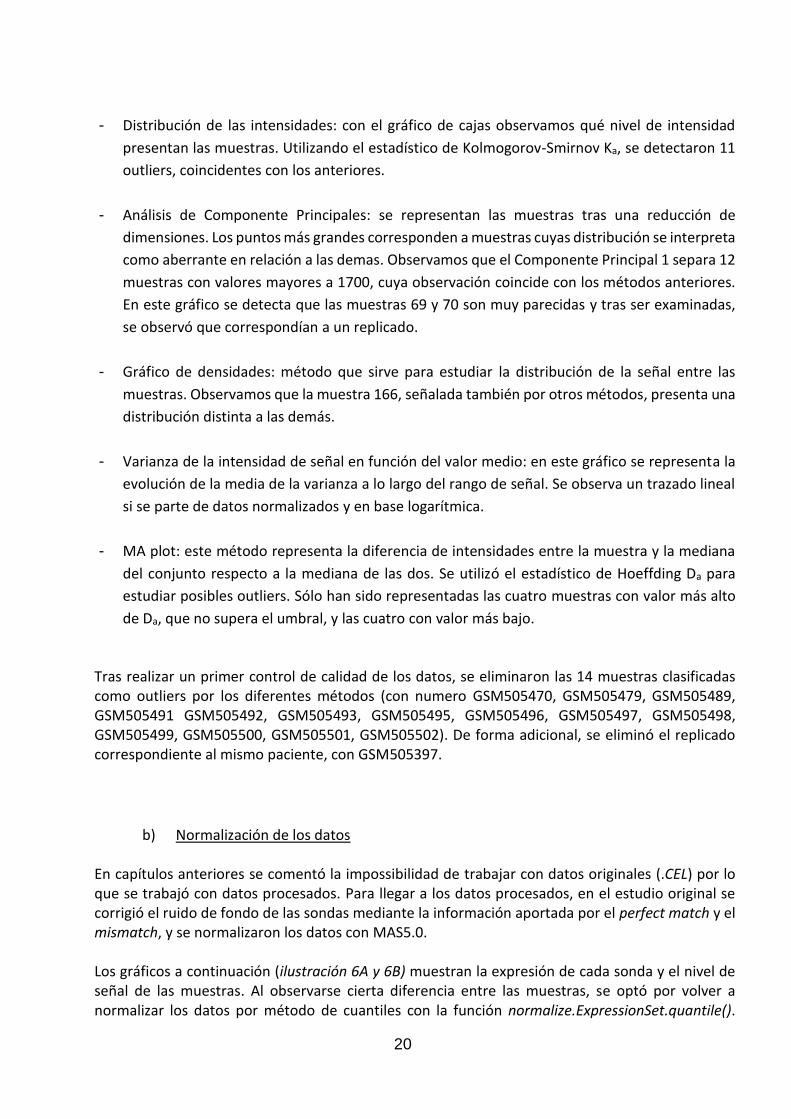
b) Normalización de los datos En capítulos anteriores se comentó la impossibilidad de trabajar con datos originales (.CEL) por lo que se trabajó con datos procesados. Para llegar a los datos procesados, en el estudio original se corrigió el ruido de fondo de las sondas mediante la información aportada por el perfect match y el mismatch, y se normalizaron los datos con MAS5.0. Los gráficos a continuación (ilustración 6A y 6B) muestran la expresión de cada sonda y el nivel de señal de las muestras. Al observarse cierta diferencia entre las muestras, se optó por volver a normalizar los datos por método de cuantiles con la función normalize.ExpressionSet.quantile().
21
Bolstad y col.30 describieron este método por ser tiempo-eficiente y reducir las diferencias entre las diferentes muestras.
Ilustración 6 A y B, Nivel de expresión de las primeras 50 sondas antes y después de normalizar los datos mediante la
función normalize.ExpressionSet.quantiles(). C y D, señal de los chips antes y después de normalizar los datos.
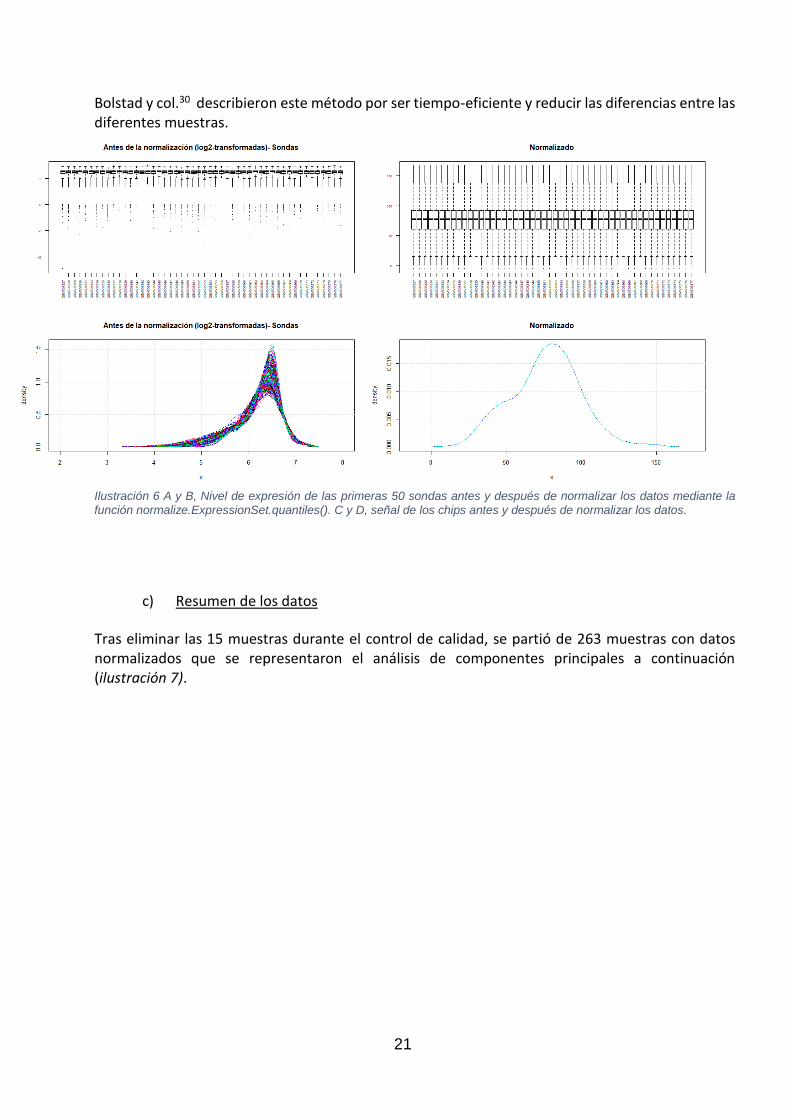
c) Resumen de los datos Tras eliminar las 15 muestras durante el control de calidad, se partió de 263 muestras con datos normalizados que se representaron el análisis de componentes principales a continuación (ilustración 7).
22
Ilustración 7 Representación del Componente Principal 2 en función del Componente Principal 1. A. Mismos Casos etiquetados en función de la variable PCR/RD. B Casos etiquetados en función de la variable ER. C. Casos etiquetados en función de la variable PR. D, gráfico de barras de la varianza explicada a lo largo de los componentes principales.
summary(pca)$importance["Proportion of Variance",1:15]
## PC1 PC2 PC3 PC4 PC5 PC6 PC7 PC8 PC9 ## 0.09576 0.05125 0.03634 0.03138 0.02582 0.01927 0.01794 0.01310 0.01235 ## PC10 PC11 PC12 PC13 PC14 PC15 ## 0.01205 0.00958 0.00897 0.00834 0.00810 0.00741
summary(pca)$importance["Cumulative Proportion",1:15]
## PC1 PC2 PC3 PC4 PC5 PC6 PC7 PC8 PC9 ## 0.09576 0.14700 0.18335 0.21472 0.24054 0.25981 0.27775 0.29085 0.30320 ## PC10 PC11 PC12 PC13 PC14 PC15 ## 0.31525 0.32483 0.33381 0.34215 0.35025 0.35766
Se observó que el Componente Principal 2 es capaz de separar los pacientes en función de la positividad de receptores de estrógenos (ER) (Ilustración 7B). El gráfico de barras y el resumen numérico mostró que la varianza se pudo explicar en un 31,3% con los primeros 10 componentes principales.
3.6. Filtrado de las sondas de expresión
El número de sondas medidas en cada array son 22283 que corresponden a 13516 genes. Mediante la función nsFilter() del paquete genefilter, se descartaron las sondas con poca variación basándose en el rango intercuartílico tomando como punto de corte 0,5. Otro criterio de filtrado fue la ausencia de anotación para las sondas que no dispuesieran de identificador de EntrezGene, tomando como referencia paquete hgu133a.db.

23
eset_filt<-nsFilter(eset,require.entrez = TRUE,var.func = IQR,var.filter=TRUE, filterByQuantile=TRUE,var.cutoff = 0.5) eset_filt<-eset_filt$eset
dim(eset_filt)
## Features Samples ## 6217 263
Se filtró un total de 16066 sondas, de las cuales 6218 sondas presentaron poca variación a lo largo de las muestras, 2431 sondas no disponían de identificador EntrezGene y 7407 sondas tenían EntrezGene ID duplicados.
3.7. Selección de variables de expresión génica relacionadas con el pronóstico
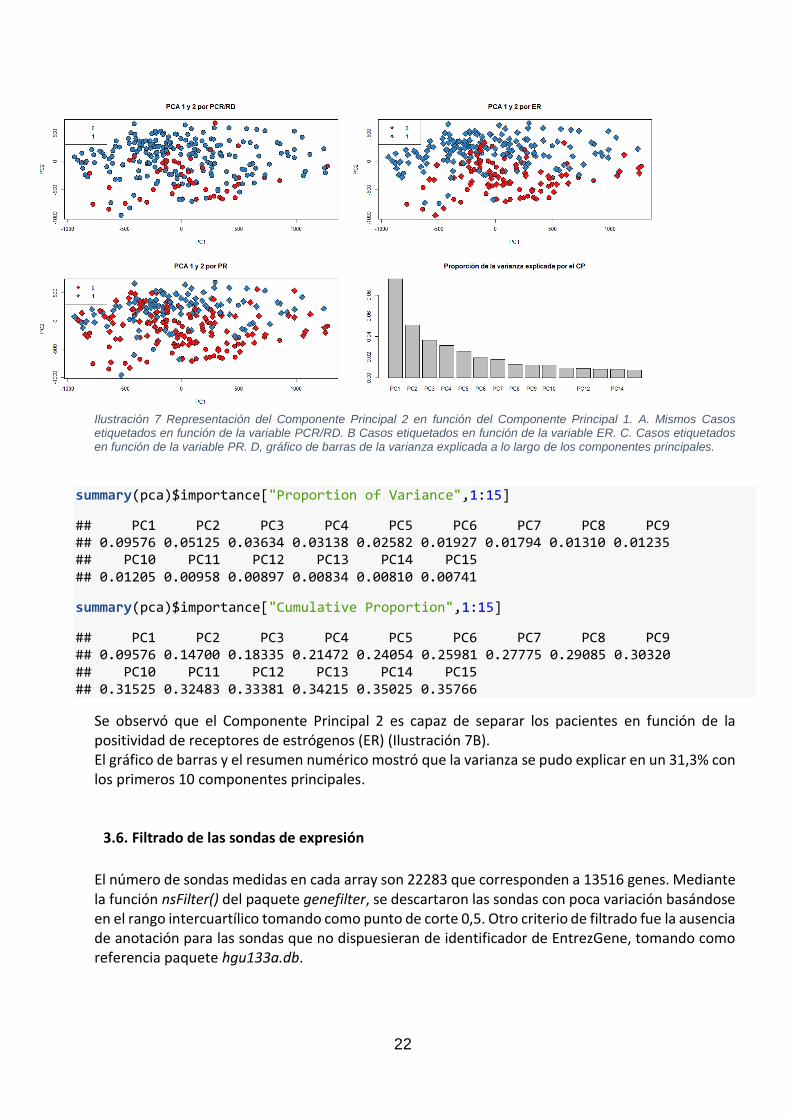
Con un total de 6217 sondas filtradas, se recurrió a determinar cuáles de estas presentaba una expresión diferencial en relación a la variable de recaída de la enfermedad (pcr_vs_rd1). Se diseñó una matriz de las muestras en función del grupo al que pertenecían, sin contemplar intercepción para mejorar la interpretación de los resultados. Se utilizó la función lmFit del paquete limma para ajustar cada sonda a un modelo lineal. La función contrasts.fit sirvió para calcular el coeficiente de las sondas al realizar un contraste basado en la variable respuesta. La función eBayes sirvió midió el estadístico t moderado con el objetivo de evidenciar qué sondas están diferencialmente expresadas entre los dos grupos. La función decideTests ajustó los p-valores según el método de Benjamini y Hochberg29, con un nivel de significación de 0.01, y ajustado a un cambio mínimo en el log2 de 1. summary(probeselected)
## PCRVSRD ## -1 187 ## 0 5867 ## 1 163
Se obtuvo un total de 350 sondas, 187 infraexpresadas y 163 sobreexpresadas en casos de recaída. A continuación, se representan los coeficientes de las sondas seleccionadas a lo largo de las 6217 sondas totales (ilustración 8). En el anexo se encuentra la lista de las sondas seleccionadas.
24
Ilustración 8 Coeficientes de las sondas seleccionadas durante el contraste entre los dos grupos. En rojo se representan las sondas sobreexpresadas en caso de recaída de la patología y en azul las sondas infraexpresadas en pacientes recaídos.
4. Construcción y elaboración del clasificador.
4.1. Método LASSO para la selección de variables y estimación de parámetros
El clasificador fue construido con el método de penalización LASSO, que se engloba en los métodos de regresión por truncado (en inglés denominados shrinkage methods). Lasso fue introducido por Tibshirani en 1996, y es un método que simplifica algunos parámetros hacia 0 y por este motivo define como método de selección de variables. Se basa en imponer una restricción o una penalización sobre los coeficientes, minimizando el siguiente problema:
estando sujeto a:
Cuando el parámetro de regularización t alcanza valores pequeños o valores grande de parámetro de penalización lambda, los coeficientes de las variables se aproximan a cero. Por este motivo lo convierte en un método de interés para gestionar casos con un número elevado de variables (p) mayor al número de observaciones (n)31.
25
La ventaja de utilizar este método respecto a los demás como Support Vector Machines o clasificadores basados en algoritmos de Machine Learning es la fácil interpretación de los resultados. El método de regresión lasso es de interés tanto para selección de variables como la regresión de estas en un modelo. Estas dos utilidades han sido utiizadas ampliamente sobretodo en modelos biológicos 32,33. En los siguientes subapartados se han seleccionado y construido dos modelos: uno con sólo variables de expresión génica y otro con variables de los dos tipos. Ambos han contemplado como variable de agrupación el estado de curación del paciente tras ser tratados. Este proceso se ha llevado a cabo con el objetivo de valorar la mejoría al incluir variables clínicas a clasificadores que solo contemplan variables de expresión génica como los comercializados bajo el nombre de Oncotype DX2,3, MammaPrint4 o Prosigna5.
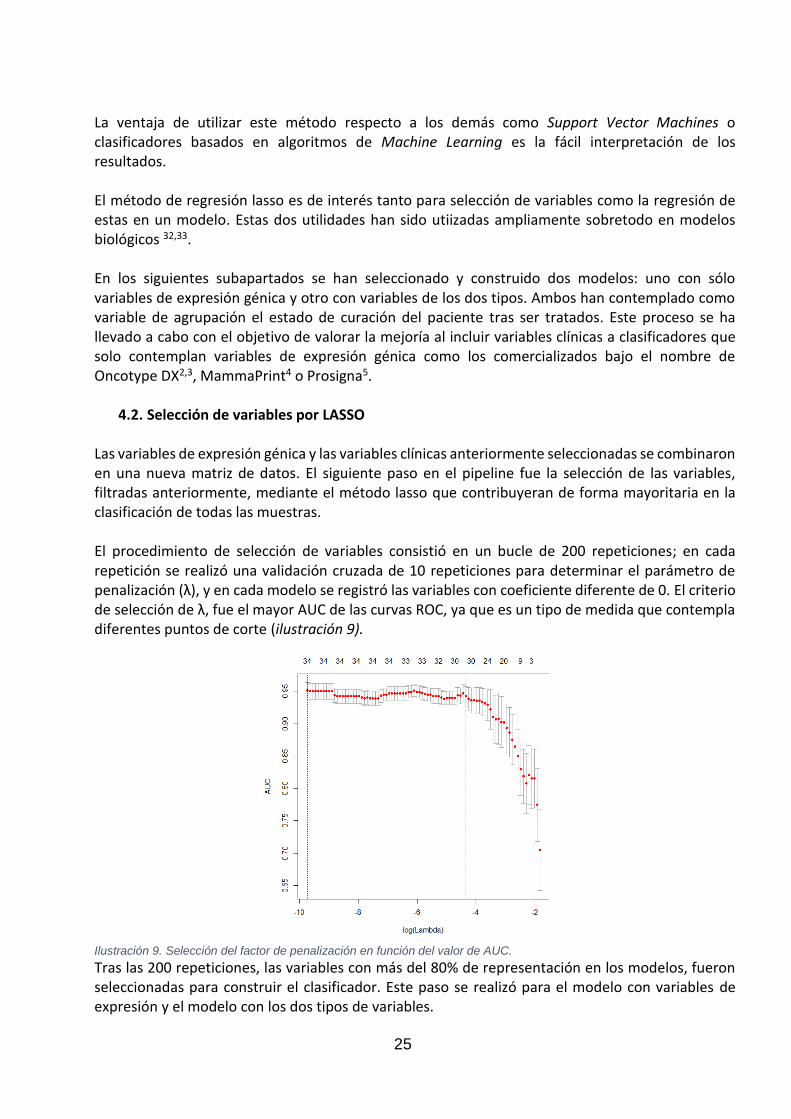
4.2. Selección de variables por LASSO Las variables de expresión génica y las variables clínicas anteriormente seleccionadas se combinaron en una nueva matriz de datos. El siguiente paso en el pipeline fue la selección de las variables, filtradas anteriormente, mediante el método lasso que contribuyeran de forma mayoritaria en la clasificación de todas las muestras. El procedimiento de selección de variables consistió en un bucle de 200 repeticiones; en cada repetición se realizó una validación cruzada de 10 repeticiones para determinar el parámetro de penalización (λ), y en cada modelo se registró las variables con coeficiente diferente de 0. El criterio de selección de λ, fue el mayor AUC de las curvas ROC, ya que es un tipo de medida que contempla diferentes puntos de corte (ilustración 9).
Ilustración 9. Selección del factor de penalización en función del valor de AUC. Tras las 200 repeticiones, las variables con más del 80% de representación en los modelos, fueron seleccionadas para construir el clasificador. Este paso se realizó para el modelo con variables de expresión y el modelo con los dos tipos de variables.
26
variables.exp
[1] "200670_at" "201579_at" "202862_at" "203917_at" "204401_at" "204470_at" [8] "204990_s_at" "205229_s_at" "205257_s_at" "205352_at" "205501_at" "205751_at" "205796_at" [15] "205801_s_at" "205862_at" "206410_at" "206565_x_at" "206618_at" "207134_x_at" "208358_s_at" [22] "209035_at" "209074_s_at" "209540_at" "209772_s_at" "210078_s_at" "210102_at" "211200_s_at" [29] "211303_x_at" "211864_s_at" "212583_at" "212841_s_at" "213100_at" "213134_x_at" "213582_at" [36] "215013_s_at" "215432_at" "216958_s_at" "217297_s_at" "217640_x_at" "217867_x_at" "218002_s_at" [43] "219051_x_at" "219795_at" "220095_at" "220183_s_at" "221728_x_at" "222031_at" "36499_at"
variables.int
## [1] "200670_at" "201579_at" "202862_at" "203917_at" ## [5] "204400_at" "204401_at" "204447_at" "204470_at" "204990_s_at" ## [10] "205229_s_at" "205352_at" "205501_at" "205751_at" "205796_at" ## [15] "205801_s_at" "206410_at" "206618_at" "207134_x_at" "208358_s_at" ## [20] "209035_at" "209074_s_at" "209540_at" "209686_at" "209772_s_at" ## [25] "209842_at" "210078_s_at" "210102_at" "211200_s_at" "211303_x_at" ## [30] "211864_s_at" "212583_at" "212841_s_at" "213100_at" "213582_at" ## [35] "215432_at" "216958_s_at" "217297_s_at" "217867_x_at" "218002_s_at" ## [40] "219051_x_at" "219654_at" "219795_at" "220095_at" "220183_s_at" ## [45] "222031_at" "er_status" "her2_status"
4.3. Elaboración del clasificador
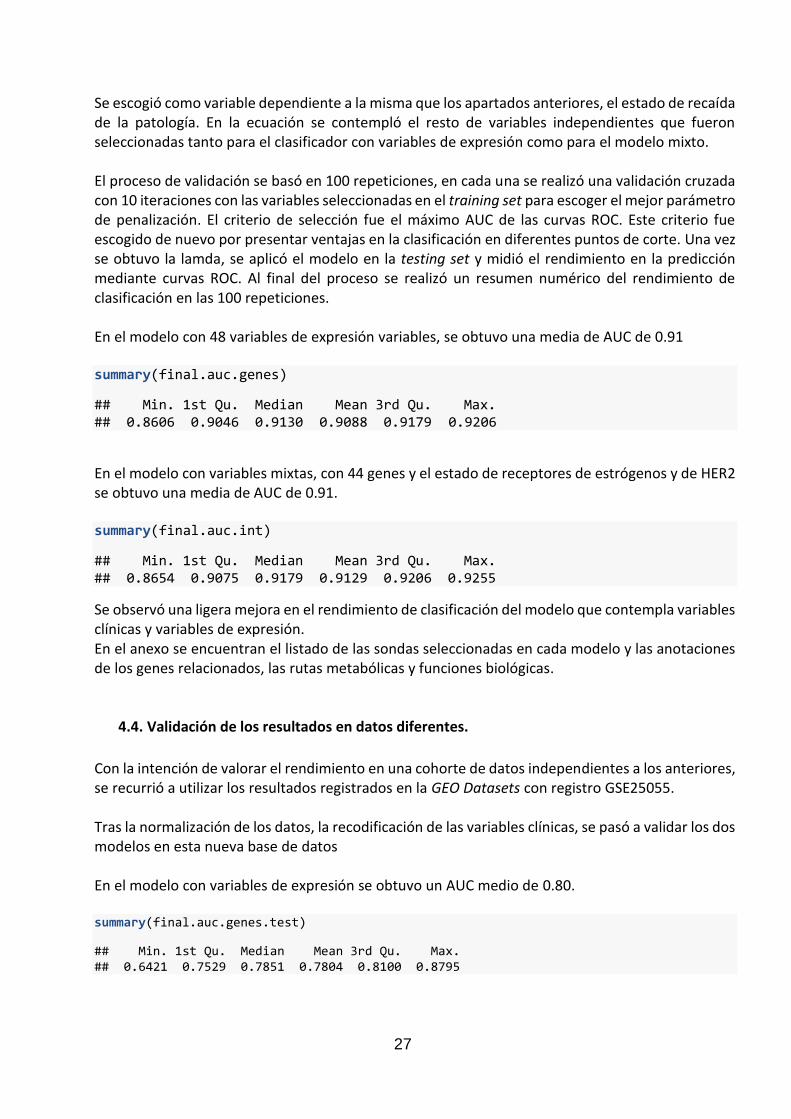
a) Partición de los datos Con el objetivo de obtener un modelo reproducible, se dividió la base de datos en dos partes: 80% de los datos originales, training set, utilizada para construir el modelo, y 20% de los datos originales, testing set, para validar el modelo. La siguiente tabla resume los datos de las variables clínicas de cada subpoblación: Tabla 2 Resumen de la distribución de las variables clínicas en la traning set y la testing set.
Training set Testing set
ER (% Positivo) P: 61% P: 60%
PR (% Positivo) P: 44% P: 45%
HER2 (% Positivo) P: 19% P: 26%
Bmngrd 1: 6%, 2:42%, 3:53% 1: 3%, 2:35%, 3: 62%
PCR_VS_RD (PCR/RD
RD: 77% RD: 73%
b) Construcción del modelo y validación cruzada
27
Se escogió como variable dependiente a la misma que los apartados anteriores, el estado de recaída de la patología. En la ecuación se contempló el resto de variables independientes que fueron seleccionadas tanto para el clasificador con variables de expresión como para el modelo mixto. El proceso de validación se basó en 100 repeticiones, en cada una se realizó una validación cruzada con 10 iteraciones con las variables seleccionadas en el training set para escoger el mejor parámetro de penalización. El criterio de selección fue el máximo AUC de las curvas ROC. Este criterio fue escogido de nuevo por presentar ventajas en la clasificación en diferentes puntos de corte. Una vez se obtuvo la lamda, se aplicó el modelo en la testing set y midió el rendimiento en la predicción mediante curvas ROC. Al final del proceso se realizó un resumen numérico del rendimiento de clasificación en las 100 repeticiones. En el modelo con 48 variables de expresión variables, se obtuvo una media de AUC de 0.91 summary(final.auc.genes)
## Min. 1st Qu. Median Mean 3rd Qu. Max. ## 0.8606 0.9046 0.9130 0.9088 0.9179 0.9206
En el modelo con variables mixtas, con 44 genes y el estado de receptores de estrógenos y de HER2 se obtuvo una media de AUC de 0.91. summary(final.auc.int)
## Min. 1st Qu. Median Mean 3rd Qu. Max. ## 0.8654 0.9075 0.9179 0.9129 0.9206 0.9255
Se observó una ligera mejora en el rendimiento de clasificación del modelo que contempla variables clínicas y variables de expresión. En el anexo se encuentran el listado de las sondas seleccionadas en cada modelo y las anotaciones de los genes relacionados, las rutas metabólicas y funciones biológicas.
4.4. Validación de los resultados en datos diferentes.
Con la intención de valorar el rendimiento en una cohorte de datos independientes a los anteriores, se recurrió a utilizar los resultados registrados en la GEO Datasets con registro GSE25055. Tras la normalización de los datos, la recodificación de las variables clínicas, se pasó a validar los dos modelos en esta nueva base de datos En el modelo con variables de expresión se obtuvo un AUC medio de 0.80. summary(final.auc.genes.test)
## Min. 1st Qu. Median Mean 3rd Qu. Max. ## 0.6421 0.7529 0.7851 0.7804 0.8100 0.8795

28
El modelo de variables clínicas y de expresión obtuvo un AUC medio parecido al anterior. summary(final.auc.int.test)
## Min. 1st Qu. Median Mean 3rd Qu. Max. ## 0.6756 0.7599 0.7944 0.7956 0.8281 0.8938
Se observó un rendimiento global inferior respecto a la base de datos anterior y el rendimiento del modelo con variables clínicas no mejoró al que contempla sólo variables de expresión.
29
5. Conclusiones
Este proyecto ha obtenido unos resultados que permite llegar a las siguientes deducciones:
• La metodología ha sido adecuada para el planteamiento de este proyecto, sin embargo, la
falta de base de datos con mayor cohorte ha limitado el avance hacia mejores resultados.
• El apartado de control de calidad de las muestras es un proceso crítico que puede afectar a
la parte analítica debido a señales aberrantes, a nivel colectivo o a nivel individual. Este
proceso facilita el análisis de resultados obtenidos a posteriori y descartar falsos positivos.
• Una selección previa de las variables, tanto las que tienen origen en la práctica clínica, como
las determinadas mediante microarrays, permite alcanzar un rendimiento diagnóstico
aceptable. Sería de interés en futuras investigaciones realizar estas mismas determinaciones
con variables clínicas originales, sin que hayan sido interpretadas por guías clínicas.
• El rendimiento de los modelos que incluyen variables clínicas ha demostrado ser ligeramente
mejores a los que sólo contemplan variables de expresión génica. Estos resultados deben ser
validados en una mayor cohorte de pacientes con diferentes subtipos de cáncer de mama.
Los próximos estudios deben valorar el interés de utilizar diferentes tipos de variables
clínicas recomendadas por las guías clínicas para valorar su rendimiento en un clasificador,
de la misma forma que se ha realizado en este proyecto.
• La estrategia de utilizar la expresión de genes de forma individual presenta buenos
rendimientos en cuanto a la predicción se refiere. Esta misma metodología se ha adoptado
en los diferentes ensayos comercializados citados anteriormente. Futuros estudios deben
ser orientados hacia el uso de agrupación de genes por fución biológica o por ruta metabólica
para estudiar si existe un mayor rendimiento, como ya han hecho ciertos autores34.
30
6. Glosario
ER: Estado de receptores de estrógenos en tejido, 5 ESMO: Sociedad Europea de Oncología Médica, 5 GEO: Gene Expression Omnibus, 7 HER2: Receptor de crecimiento epidérmico humano tipo 2, 5 Modelo clasificador: modelo estadístico que contiene variables que permiten
clasificar muestras en los respectivos grupos, 6 mRNA: RNA mensajero, 12 PR: Estado de receptores de progestágenos en tejido, 5 TGCA: The Genoma Cancer Atlas, 7
7. Bibliografía
1. Senkus E, Kyriakides S, Ohno S, et al. Primary breast cancer: ESMO Clinical Practice Guidelines for diagnosis, treatment and follow-up. Ann Oncol. 2015;26(October):v8-v30. doi:10.1093/annonc/mdv298.
2. Gluz O, Nitz UA, Christgen M, et al. West German Study Group Phase III PlanB Trial: First prospective outcome data for the 21-gene recurrence score assay and concordance of prognostic markers by central and local pathology assessment. J Clin Oncol. 2016;34(20):2341-2349. doi:10.1200/JCO.2015.63.5383.
3. J.A. Sparano, R.J. Gray, D.F. Makower, K.I. Pritchard, K.S. Albain, D.F. Hayes, C.E. Geyer Jr., E.C. Dees, E.A. Perez, J.A. Olson Jr., J.A. Zujewski, T. Lively, S.S. Badve, T.J. Saphner, L.I. Wagner, T.J. Whelan, M.J. Ellis, S. Paik, W.C. Wood, P. Ravdin, and GWS. Prospective Validation of a 21-Gene Expression Assay in Breast Cancer. N Engl J Med. 2015;373(21):2005–2014. doi:10.1159/000381474.A.
4. Cardoso F, van’t Veer LJ, Bogaerts J, et al. 70-Gene Signature as an Aid to Treatment Decisions in Early-Stage Breast Cancer. N Engl J Med. 2016;375(8):717-729. doi:10.1056/NEJMoa1602253.
5. Wallden B, Storhoff J, Nielsen T, et al. Development and verification of the PAM50-based Prosigna breast cancer gene signature assay. BMC Med Genomics. 2015;8(1):1-14. doi:10.1186/s12920-015-0129-6.
6. Mannelqvist M, Wik E, Stefansson IM, Akslen LA. An 18-Gene signature for vascular invasion is associated with aggressive features and reduced survival in breast cancer. PLoS One. 2014;9(6). doi:10.1371/journal.pone.0098787.
7. Reyal F, van Vliet MH, Armstrong NJ, et al. A comprehensive analysis of prognostic signatures reveals the high predictive capacity of the Proliferation, Immune response and RNA splicing modules in breast cancer. Breast Cancer Res. 2008;10(6):1-15. doi:10.1186/bcr2192.
8. Andres SA, Brock GN, Wittliff JL. Interrogating differences in expression of targeted gene sets to predict breast cancer outcome. BMC Cancer. 2013;13(1):1. doi:10.1186/1471-2407-13-326.
9. Baty F, Facompré M, Kaiser S, et al. Gene profiling of clinical routine biopsies and prediction of survival in non-small cell lung cancer. Am J Respir Crit Care Med. 2010;181(2):181-188. doi:10.1164/rccm.200812-1807OC.
10. L.B. H, B. N, P. Z, et al. Integrated Genetic, Epigenetic, and Transcriptional Profiling Identifies Molecular Pathways in the Development of Laterally Spreading Tumors. Mol Cancer Res. 2016;14(12):1217-1228. doi:http://dx.doi.org/10.1158/1541-7786.MCR-16-0175.
11. Yoo BC, Kim KH, Woo SM, Myung JK. Clinical multi-omics strategies for the effective cancer management. J Proteomics. 2017;(July):0-1. doi:10.1016/j.jprot.2017.08.010.
12. Tang B, Hsu PY, Huang THM, Jin VX. Cancer omics: From regulatory networks to clinical outcomes. Cancer Lett. 2013;340(2):277-283. doi:10.1016/j.canlet.2012.11.033.
13. Uzilov A V., Ding W, Fink MY, et al. Development and clinical application of an integrative genomic approach to personalized cancer therapy. Genome Med. 2016;8(1):1-20. doi:10.1186/s13073-016-0313-0.
14. Gong F, Yang L, Tai F, Hu X, Wang W. “Omics” of Maize Stress Response for Sustainable Food Production: Opportunities and Challenges. Omi A J Integr Biol. 2014;18(12):714-732. doi:10.1089/omi.2014.0125.
15. Misra N, Panda PK, Parida BK. Agrigenomics for microalgal biofuel production: an overview
of various bioinformatics resources and recent studies to link OMICS to bioenergy and bioeconomy. OMICS. 2013;17(11):537-549. doi:10.1089/omi.2013.0025.
16. Miller MB, Tang YW. Basic concepts of microarrays and potential applications in clinical microbiology. Clin Microbiol Rev. 2009;22(4):611-633. doi:10.1128/CMR.00019-09.
17. Zhou Y, Xu X, Tian Z, Wei H. “Multi-omics” analyses of the development and function of natural killer cells. Front Immunol. 2017;8(SEP). doi:10.3389/fimmu.2017.01095.
18. Zhong Wang, Mark Gerstein and MS. RNA-Seq: a revolutionary tool for transcriptomics. Nat Rev Genet 2009. 2009;10(1):57-63. doi:10.1038/nrg2484.RNA-Seq.
19. Stefano GB. Comparing Bioinformatic Gene Expression Profiling Methods: Microarray and RNA-Seq. Med Sci Monit Basic Res. 2014;20:138-142. doi:10.12659/MSMBR.892101.
20. Bradley WH, Eng K, Le M, Mackinnon AC, Kendziorski C, Rader JS. Comparing gene expression data from formalin-fixed, paraffin embedded tissues and qPCR with that from snap-frozen tissue and microarrays for modeling outcomes of patients with ovarian carcinoma. BMC Clin Pathol. 2015;15(1):1-7. doi:10.1186/s12907-015-0017-1.
21. Schena M, Shalon D, Heller R, Chai A, Brown PO, Davis RW. Parallel human genome analysis: microarray-based expression monitoring of 1000 genes. Proc Natl Acad Sci U S A. 1996;93(20):10614-10619. doi:10.1073/pnas.93.20.10614.
22. Ruíz de Villa MC, Sánchez-Pla A. Analisis de datos ómicos - Preliminares. 23. Trevino V, Falciani F, Hugo A Barrera-Saldaña. DNA Microarrays: a Powerful Genomic Tool
for Biomedical and Clinical Research. Mol Med. 2007;13(9):527-541. doi:10.2119/2006. 24. H A, DL N, K K. Expression Profiling Using Affymetrix GeneChip Microarrays. Methods Mol
Biol. 2009;509:35-46. 25. Popovici V, Chen W, Gallas BG, et al. Effect of training-sample size and classification difficulty
on the accuracy of genomic predictors. Breast Cancer Res. 2010;12(1):1-13. doi:10.1186/bcr2468.
26. Affymetrix. Affymetrix HGU 133 Datasheet. 27. Amin MB, Edge S, FL G. AJCC Cancer Staging Manual. 8th Ed. New York: Springer; 2016.;
2016. 28. van Vliet MH, Horlings HM, van de Vijver MJ, Reinders MJT, Wessels LFA. Integration of
clinical and gene expression data has a synergetic effect on predicting breast cancer outcome. PLoS One. 2012;7(7). doi:10.1371/journal.pone.0040358.
29. Benjamini Y, Hochberg Y. Controlling the False Discovery Rate: A Practical and Powerful Approach to Multiple Testing. J R Stat Soc Ser B. 1995;57(1):289-300.
30. Bolstad BM, Irizarry RAA, Astrand M, Speed TP. A comparison of normalization methods for high density oligonucleotide array data based on variance and bias. Bioinformatics. 2003;19(2):185-193. doi:10.1093/bioinformatics/19.2.185.
31. Faraway JJ. Linear Models with R. Second Edi.; 2015. 32. Ghosh D, Chinnaiyan AM. Classification and selection of biomarkers in genomic data using
LASSO. J Biomed Biotechnol. 2005;2005(2):147-154. doi:10.1155/JBB.2005.147. 33. Waldron L, Pintilie M, Tsao MS, Shepherd FA, Huttenhower C, Jurisica I. Optimized
application of penalized regression methods to diverse genomic data. Bioinformatics. 2011;27(24):3399-3406. doi:10.1093/bioinformatics/btr591.
34. Huang S, Yee C, Ching T, Yu H, Garmire LX. A Novel Model to Combine Clinical and Pathway-Based Transcriptomic Information for the Prognosis Prediction of Breast Cancer. PLoS Comput Biol. 2014;10(9). doi:10.1371/journal.pcbi.1003851.
8. Anexos
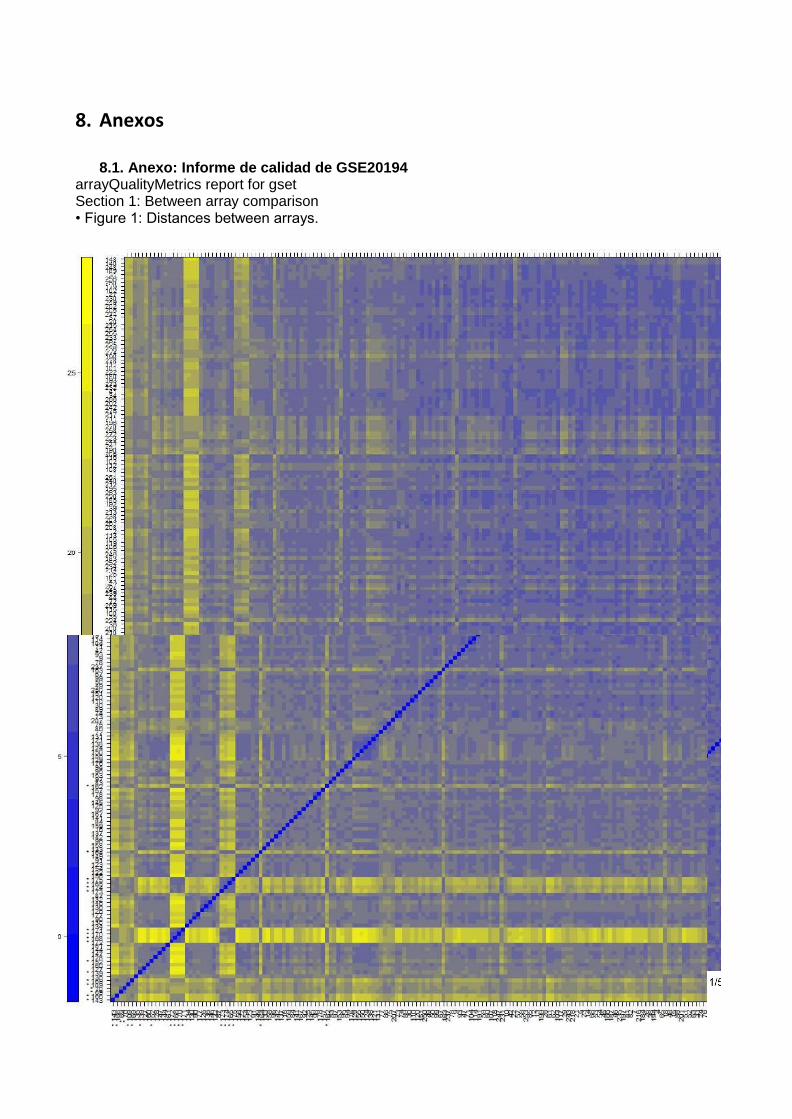
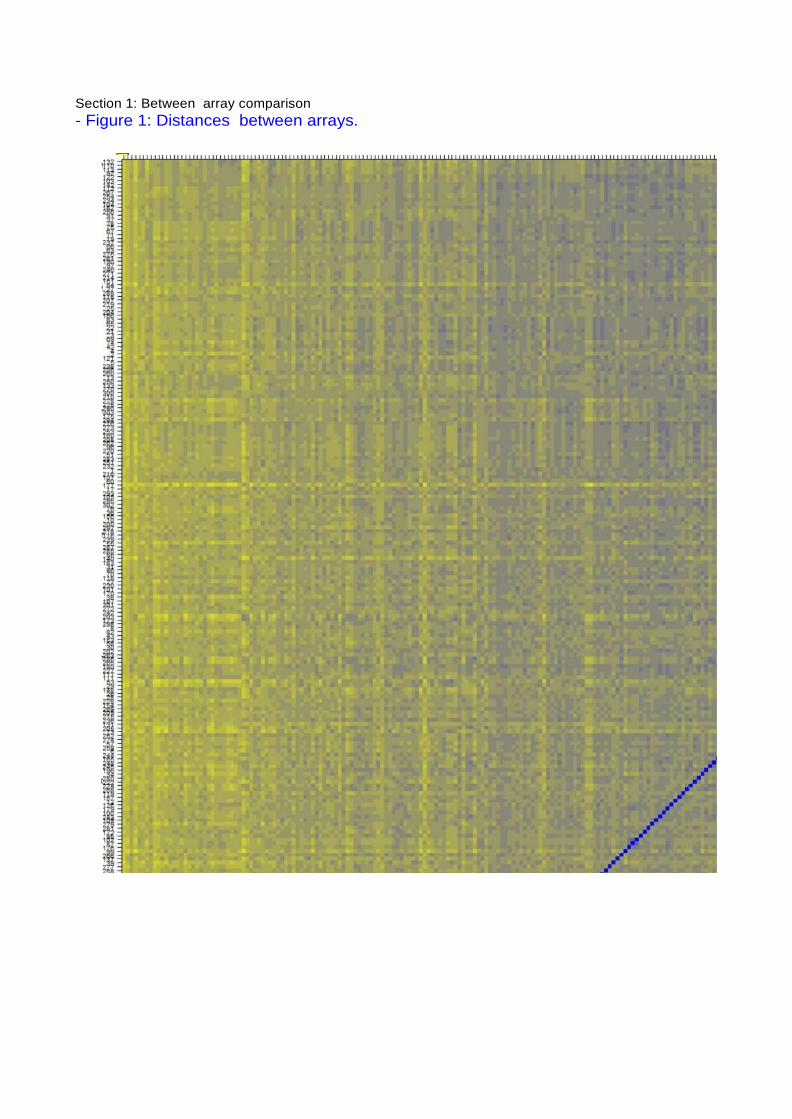
8.1. Anexo: Informe de calidad de GSE20194 arrayQualityMetrics report for gset Section 1: Between array comparison • Figure 1: Distances between arrays. Figure 1 (PDF file) shows a false color heatmap of the distances between arrays. The color scale is chosen to cover the range of distances encountered in the dataset. Patterns in this plot can indicate clustering of the arrays either because of intended biological or unintended experimental factors (batch effects). The distance dab between two arrays a and b is computed as the mean absolute difference (I-I-distance) between the data of the arrays (using the data from all probes without filtering). In formula, dab = mean I Mai - Mbi l, where Mai is the value of the i-th probe on the a-th array. Outlier detection was performed by looking for arrays for which the sum of the distances to all other arrays, Sa = Eb dab was exceptionally large. 18 such arrays were detected, and they are marked by an asterisk, *
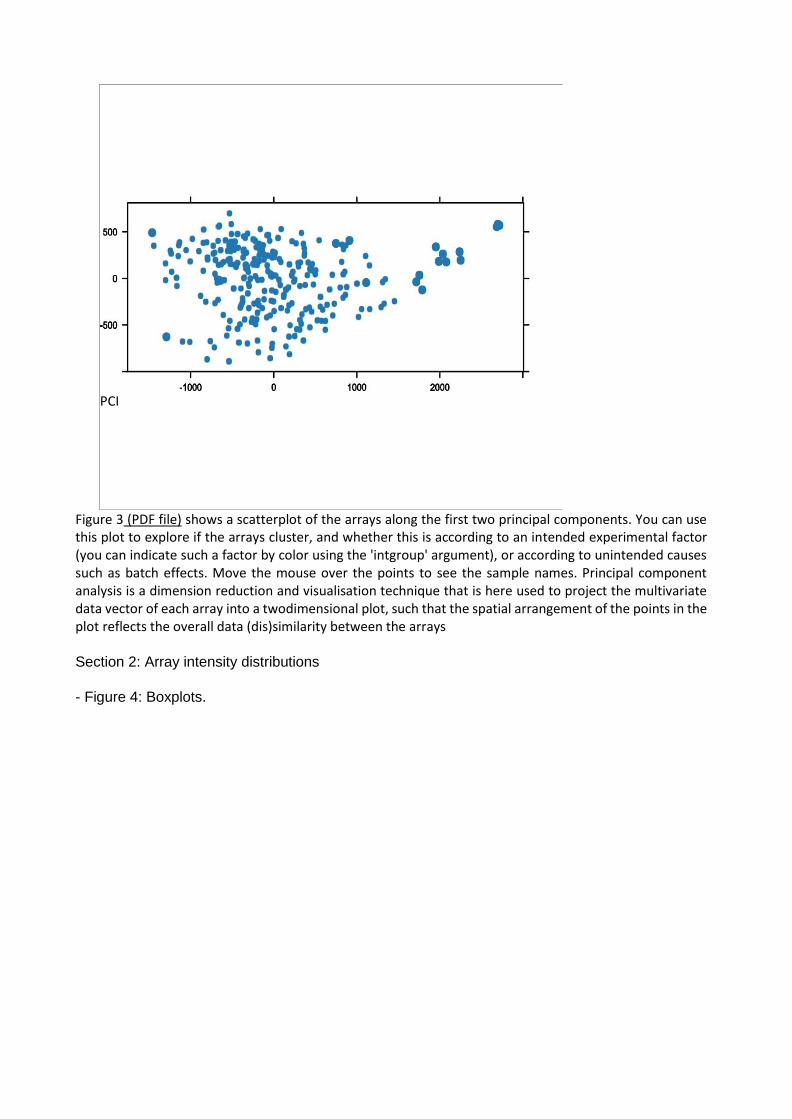
PCI
Figure 3 (PDF file) shows a scatterplot of the arrays along the first two principal components. You can use this plot to explore if the arrays cluster, and whether this is according to an intended experimental factor (you can indicate such a factor by color using the 'intgroup' argument), or according to unintended causes such as batch effects. Move the mouse over the points to see the sample names. Principal component analysis is a dimension reduction and visualisation technique that is here used to project the multivariate data vector of each array into a twodimensional plot, such that the spatial arrangement of the points in the plot reflects the overall data (dis)similarity between the arrays Section 2: Array intensity distributions
- Figure 4: Boxplots.
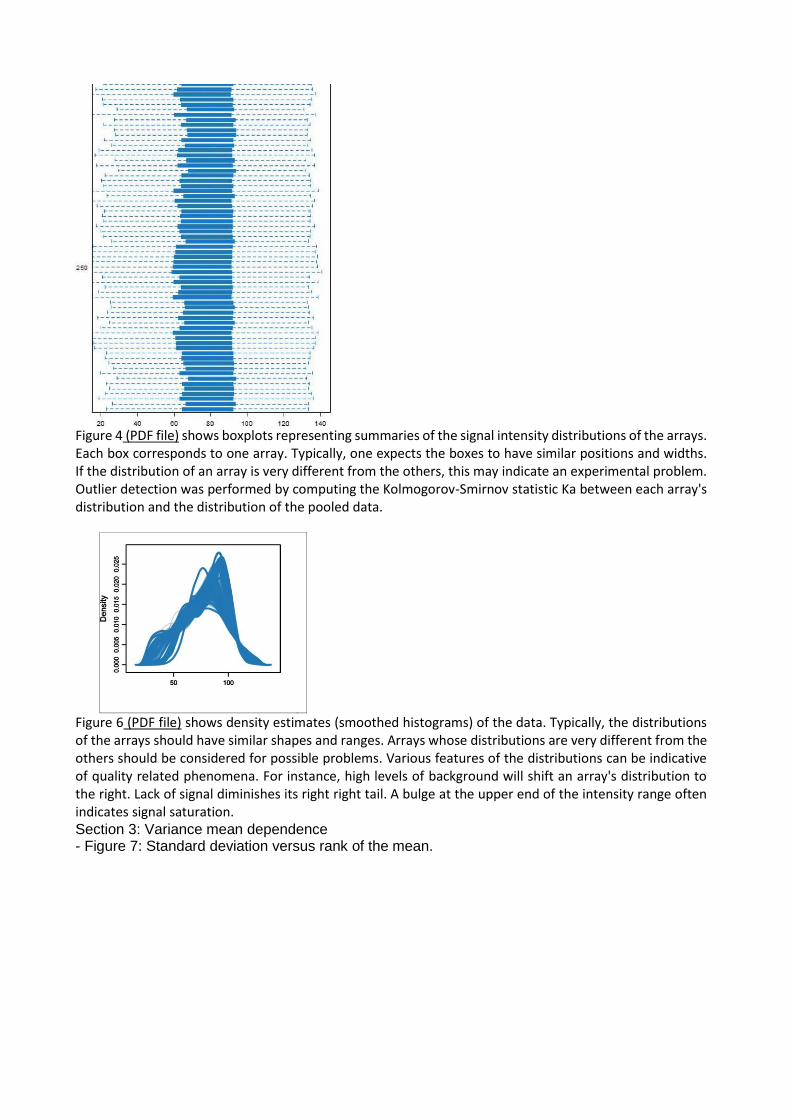
Figure 4 (PDF file) shows boxplots representing summaries of the signal intensity distributions of the arrays. Each box corresponds to one array. Typically, one expects the boxes to have similar positions and widths. If the distribution of an array is very different from the others, this may indicate an experimental problem. Outlier detection was performed by computing the Kolmogorov-Smirnov statistic Ka between each array's distribution and the distribution of the pooled data.
Figure 6 (PDF file) shows density estimates (smoothed histograms) of the data. Typically, the distributions of the arrays should have similar shapes and ranges. Arrays whose distributions are very different from the others should be considered for possible problems. Various features of the distributions can be indicative of quality related phenomena. For instance, high levels of background will shift an array's distribution to the right. Lack of signal diminishes its right right tail. A bulge at the upper end of the intensity range often indicates signal saturation. Section 3: Variance mean dependence - Figure 7: Standard deviation versus rank of the mean.
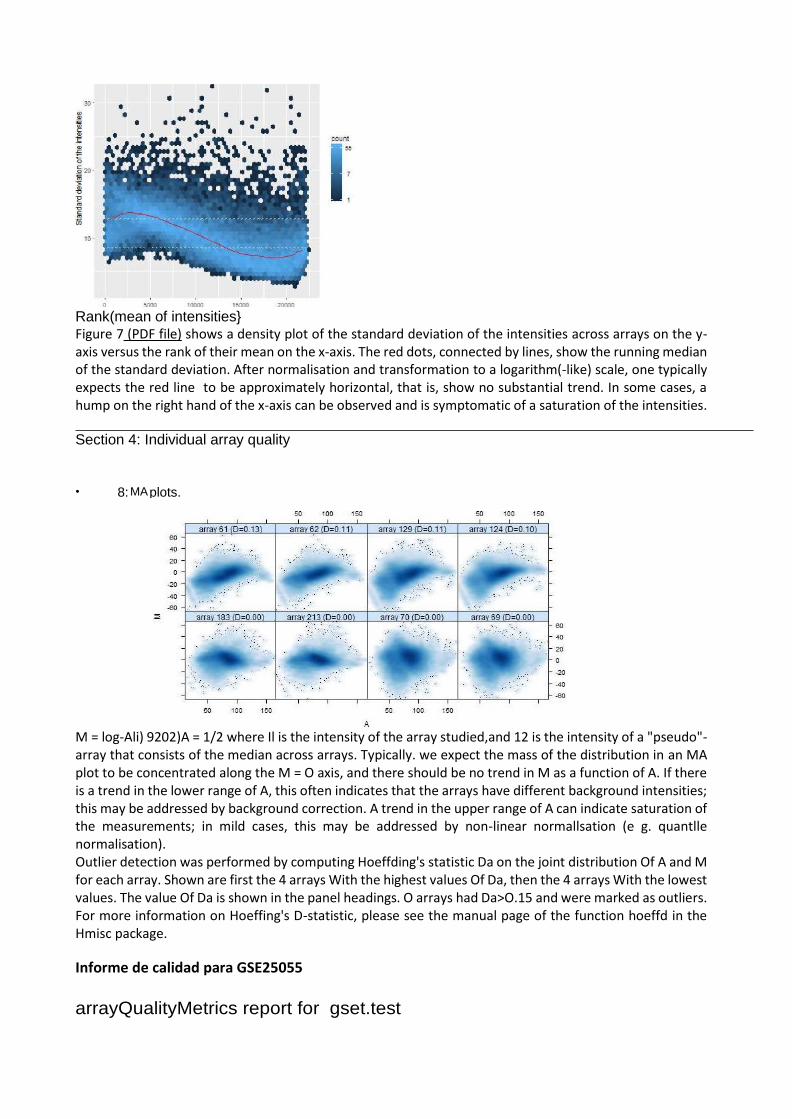
Rank(mean of intensities} Figure 7 (PDF file) shows a density plot of the standard deviation of the intensities across arrays on the y-axis versus the rank of their mean on the x-axis. The red dots, connected by lines, show the running median of the standard deviation. After normalisation and transformation to a logarithm(-like) scale, one typically expects the red line to be approximately horizontal, that is, show no substantial trend. In some cases, a hump on the right hand of the x-axis can be observed and is symptomatic of a saturation of the intensities.
Section 4: Individual array quality
M = log-Ali) 9202)A = 1/2 where Il is the intensity of the array studied,and 12 is the intensity of a "pseudo"-array that consists of the median across arrays. Typically. we expect the mass of the distribution in an MA plot to be concentrated along the M = O axis, and there should be no trend in M as a function of A. If there is a trend in the lower range of A, this often indicates that the arrays have different background intensities; this may be addressed by background correction. A trend in the upper range of A can indicate saturation of the measurements; in mild cases, this may be addressed by non-linear normallsation (e g. quantlle normalisation). Outlier detection was performed by computing Hoeffding's statistic Da on the joint distribution Of A and M for each array. Shown are first the 4 arrays With the highest values Of Da, then the 4 arrays With the lowest values. The value Of Da is shown in the panel headings. O arrays had Da>O.15 and were marked as outliers. For more information on Hoeffing's D-statistic, please see the manual page of the function hoeffd in the Hmisc package.
Informe de calidad para GSE25055
arrayQualityMetrics report for gset.test
• 8: MA plots.
Section 1: Between array comparison
- Figure 1: Distances between arrays.

6
Figure 1 fPDF file) shows a false color heatmap of the distances between arrays. The color scale is chosen to cover the range of distances encountered in the dataset. Patterns in this plot can indicate clustering of the arrays either because of intended biological or unintended experimental factors (batch effects). The distance d between two arrays a and b is computed as the mean absolute difference (Lj-distance) between the data of the arrays (using the data from all probes without filtering). In formula, d ¿ = mean | M , - M¿/ |, where / / is the value of the /-th probe on the a-th array. Outlier detection was performed by looking for arrays for which the sum of the distances to all other arrays, S = Z¿ d was exceptionally large. 6 such arrays were detected, and they are marked by an asterisk, ”.

Figure 3 fPDF file) shows a scatterplot of the arrays along the first two principal components. You can use this plot to explore if the arrays cluster, and whether this is according to an intended experimental factor (you can indicate such a factor by color using the 'intgroup' argument), or according to unintended causes such as batch effects. Move the mouse over the points to see the sample names. Principal component analysis is a dimension reduction and visualisation technique that is here used to project the multivariate data vector of each array into a two- dimensional plot, such that the spatial arrangement of the points in the plot reflects the overall data (dis)simiIarity between the arrays.
array
title characteristics_ch1.1 characteristics_ch1.2 characteristics_ch1.3
characteristics_ch1.6 characteristics_ch1.7 characteristics_ch1.8 characteristics ch1.9
PC1
8.2. Informe con el código empleado
TFM - PEC 4
Xavier Nieto Moragas
8 de diciembre de 2017
Lectura de los datos en Rstudio
Se ha escogido la base de datos ubicada en el repositorio GEO datasets de la NCBI, denominada GSE20194, para realizar este proyecto. Mediante el paquete GEOquery, podemos incorporar los datos al entorno de R llamando los datos colgados en la plataforma de GEO datasets. Debido a que existen ciertos datos que no estan ordenados propiamente, se ha descargado de forma manual y corregido para ser incorporados desde el sistema local.
• Incorporación de los datos del archivo .txt descargado y con correción de los datos.
library(Biobase)
## Loading required package: BiocGenerics
## Loading required package: parallel
## ## Attaching package: 'BiocGenerics'
## The following objects are masked from 'package:parallel': ## ## clusterApply, clusterApplyLB, clusterCall, clusterEvalQ, ## clusterExport, clusterMap, parApply, parCapply, parLapply, ## parLapplyLB, parRapply, parSapply, parSapplyLB
## The following objects are masked from 'package:stats': ## ## IQR, mad, sd, var, xtabs
## The following objects are masked from 'package:base': ## ## anyDuplicated, append, as.data.frame, cbind, colMeans, ## colnames, colSums, do.call, duplicated, eval, evalq, Filter, ## Find, get, grep, grepl, intersect, is.unsorted, lapply, ## lengths, Map, mapply, match, mget, order, paste, pmax, ## pmax.int, pmin, pmin.int, Position, rank, rbind, Reduce, ## rowMeans, rownames, rowSums, sapply, setdiff, sort, table, ## tapply, union, unique, unsplit, which, which.max, which.min
## Welcome to Bioconductor ## ## Vignettes contain introductory material; view with ## 'browseVignettes()'. To cite Bioconductor, see ## 'citation("Biobase")', and for packages 'citation("pkgname")'.
library(GEOquery)
## Setting options('download.file.method.GEOquery'='auto')
## Setting options('GEOquery.inmemory.gpl'=FALSE)
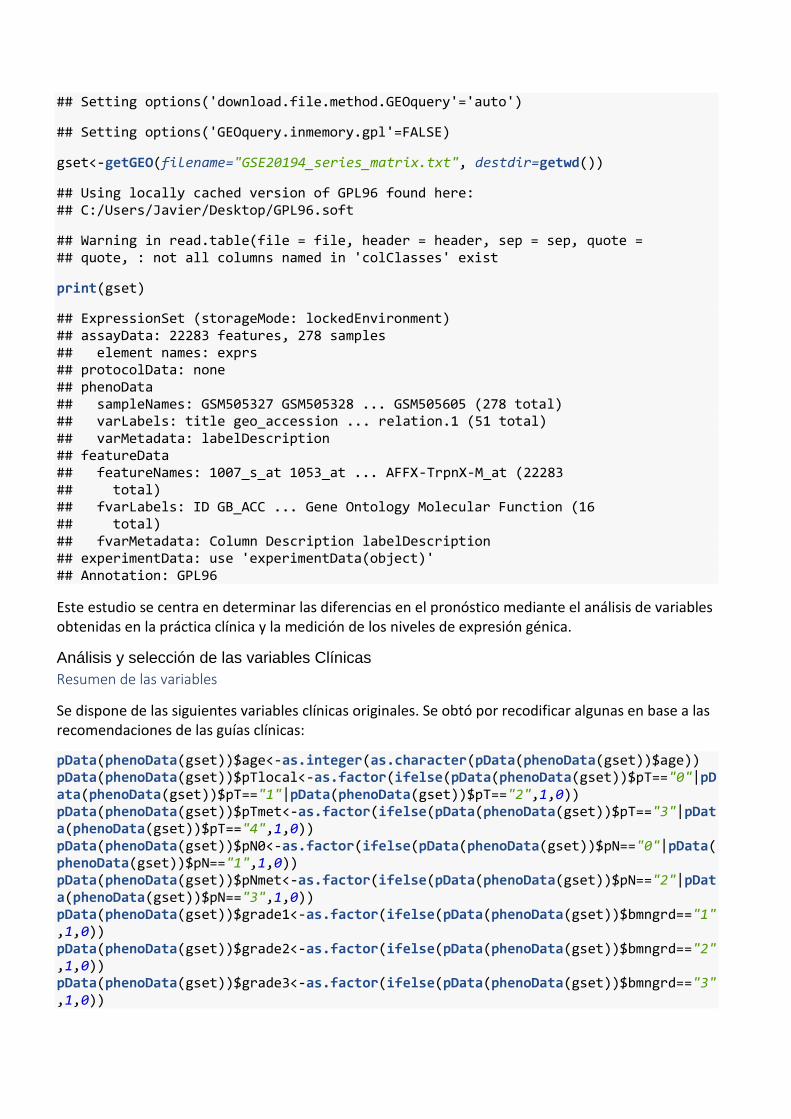
gset<-getGEO(filename="GSE20194_series_matrix.txt", destdir=getwd())
## Using locally cached version of GPL96 found here: ## C:/Users/Javier/Desktop/GPL96.soft
## Warning in read.table(file = file, header = header, sep = sep, quote = ## quote, : not all columns named in 'colClasses' exist
print(gset)
## ExpressionSet (storageMode: lockedEnvironment) ## assayData: 22283 features, 278 samples ## element names: exprs ## protocolData: none ## phenoData ## sampleNames: GSM505327 GSM505328 ... GSM505605 (278 total) ## varLabels: title geo_accession ... relation.1 (51 total) ## varMetadata: labelDescription ## featureData ## featureNames: 1007_s_at 1053_at ... AFFX-TrpnX-M_at (22283 ## total) ## fvarLabels: ID GB_ACC ... Gene Ontology Molecular Function (16 ## total) ## fvarMetadata: Column Description labelDescription ## experimentData: use 'experimentData(object)' ## Annotation: GPL96
Este estudio se centra en determinar las diferencias en el pronóstico mediante el análisis de variables obtenidas en la práctica clínica y la medición de los niveles de expresión génica.
Análisis y selección de las variables Clínicas
Resumen de las variables
Se dispone de las siguientes variables clínicas originales. Se obtó por recodificar algunas en base a las recomendaciones de las guías clínicas:
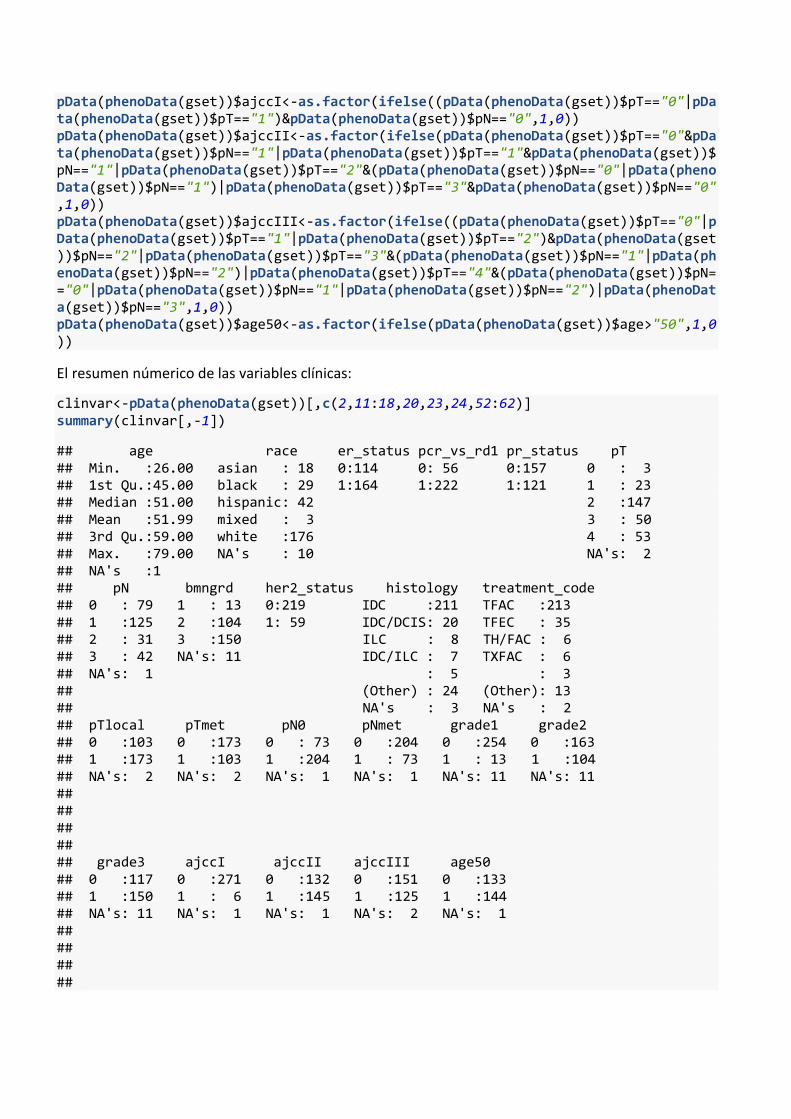
pData(phenoData(gset))$age<-as.integer(as.character(pData(phenoData(gset))$age)) pData(phenoData(gset))$pTlocal<-as.factor(ifelse(pData(phenoData(gset))$pT=="0"|pData(phenoData(gset))$pT=="1"|pData(phenoData(gset))$pT=="2",1,0)) pData(phenoData(gset))$pTmet<-as.factor(ifelse(pData(phenoData(gset))$pT=="3"|pData(phenoData(gset))$pT=="4",1,0)) pData(phenoData(gset))$pN0<-as.factor(ifelse(pData(phenoData(gset))$pN=="0"|pData(phenoData(gset))$pN=="1",1,0)) pData(phenoData(gset))$pNmet<-as.factor(ifelse(pData(phenoData(gset))$pN=="2"|pData(phenoData(gset))$pN=="3",1,0)) pData(phenoData(gset))$grade1<-as.factor(ifelse(pData(phenoData(gset))$bmngrd=="1",1,0)) pData(phenoData(gset))$grade2<-as.factor(ifelse(pData(phenoData(gset))$bmngrd=="2",1,0)) pData(phenoData(gset))$grade3<-as.factor(ifelse(pData(phenoData(gset))$bmngrd=="3",1,0))
pData(phenoData(gset))$ajccI<-as.factor(ifelse((pData(phenoData(gset))$pT=="0"|pData(phenoData(gset))$pT=="1")&pData(phenoData(gset))$pN=="0",1,0)) pData(phenoData(gset))$ajccII<-as.factor(ifelse(pData(phenoData(gset))$pT=="0"&pData(phenoData(gset))$pN=="1"|pData(phenoData(gset))$pT=="1"&pData(phenoData(gset))$pN=="1"|pData(phenoData(gset))$pT=="2"&(pData(phenoData(gset))$pN=="0"|pData(phenoData(gset))$pN=="1")|pData(phenoData(gset))$pT=="3"&pData(phenoData(gset))$pN=="0",1,0)) pData(phenoData(gset))$ajccIII<-as.factor(ifelse((pData(phenoData(gset))$pT=="0"|pData(phenoData(gset))$pT=="1"|pData(phenoData(gset))$pT=="2")&pData(phenoData(gset))$pN=="2"|pData(phenoData(gset))$pT=="3"&(pData(phenoData(gset))$pN=="1"|pData(phenoData(gset))$pN=="2")|pData(phenoData(gset))$pT=="4"&(pData(phenoData(gset))$pN=="0"|pData(phenoData(gset))$pN=="1"|pData(phenoData(gset))$pN=="2")|pData(phenoData(gset))$pN=="3",1,0)) pData(phenoData(gset))$age50<-as.factor(ifelse(pData(phenoData(gset))$age>"50",1,0))
El resumen númerico de las variables clínicas:
clinvar<-pData(phenoData(gset))[,c(2,11:18,20,23,24,52:62)] summary(clinvar[,-1])
## age race er_status pcr_vs_rd1 pr_status pT ## Min. :26.00 asian : 18 0:114 0: 56 0:157 0 : 3 ## 1st Qu.:45.00 black : 29 1:164 1:222 1:121 1 : 23 ## Median :51.00 hispanic: 42 2 :147 ## Mean :51.99 mixed : 3 3 : 50 ## 3rd Qu.:59.00 white :176 4 : 53 ## Max. :79.00 NA's : 10 NA's: 2 ## NA's :1 ## pN bmngrd her2_status histology treatment_code ## 0 : 79 1 : 13 0:219 IDC :211 TFAC :213 ## 1 :125 2 :104 1: 59 IDC/DCIS: 20 TFEC : 35 ## 2 : 31 3 :150 ILC : 8 TH/FAC : 6 ## 3 : 42 NA's: 11 IDC/ILC : 7 TXFAC : 6 ## NA's: 1 : 5 : 3 ## (Other) : 24 (Other): 13 ## NA's : 3 NA's : 2 ## pTlocal pTmet pN0 pNmet grade1 grade2 ## 0 :103 0 :173 0 : 73 0 :204 0 :254 0 :163 ## 1 :173 1 :103 1 :204 1 : 73 1 : 13 1 :104 ## NA's: 2 NA's: 2 NA's: 1 NA's: 1 NA's: 11 NA's: 11 ## ## ## ## ## grade3 ajccI ajccII ajccIII age50 ## 0 :117 0 :271 0 :132 0 :151 0 :133 ## 1 :150 1 : 6 1 :145 1 :125 1 :144 ## NA's: 11 NA's: 1 NA's: 1 NA's: 2 NA's: 1 ## ## ## ##
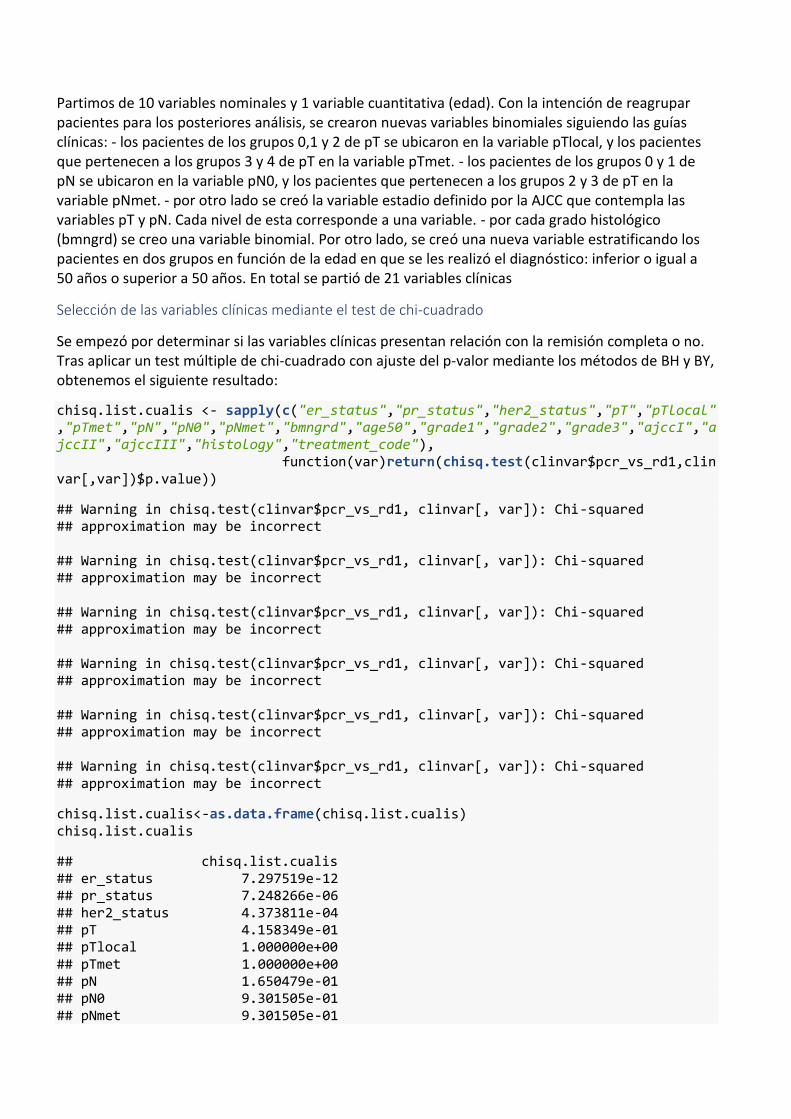
Partimos de 10 variables nominales y 1 variable cuantitativa (edad). Con la intención de reagrupar pacientes para los posteriores análisis, se crearon nuevas variables binomiales siguiendo las guías clínicas: - los pacientes de los grupos 0,1 y 2 de pT se ubicaron en la variable pTlocal, y los pacientes que pertenecen a los grupos 3 y 4 de pT en la variable pTmet. - los pacientes de los grupos 0 y 1 de pN se ubicaron en la variable pN0, y los pacientes que pertenecen a los grupos 2 y 3 de pT en la variable pNmet. - por otro lado se creó la variable estadio definido por la AJCC que contempla las variables pT y pN. Cada nivel de esta corresponde a una variable. - por cada grado histológico (bmngrd) se creo una variable binomial. Por otro lado, se creó una nueva variable estratificando los pacientes en dos grupos en función de la edad en que se les realizó el diagnóstico: inferior o igual a 50 años o superior a 50 años. En total se partió de 21 variables clínicas
Selección de las variables clínicas mediante el test de chi-cuadrado
Se empezó por determinar si las variables clínicas presentan relación con la remisión completa o no. Tras aplicar un test múltiple de chi-cuadrado con ajuste del p-valor mediante los métodos de BH y BY, obtenemos el siguiente resultado:
chisq.list.cualis <- sapply(c("er_status","pr_status","her2_status","pT","pTlocal","pTmet","pN","pN0","pNmet","bmngrd","age50","grade1","grade2","grade3","ajccI","ajccII","ajccIII","histology","treatment_code"), function(var)return(chisq.test(clinvar$pcr_vs_rd1,clinvar[,var])$p.value))
## Warning in chisq.test(clinvar$pcr_vs_rd1, clinvar[, var]): Chi-squared ## approximation may be incorrect ## Warning in chisq.test(clinvar$pcr_vs_rd1, clinvar[, var]): Chi-squared ## approximation may be incorrect ## Warning in chisq.test(clinvar$pcr_vs_rd1, clinvar[, var]): Chi-squared ## approximation may be incorrect ## Warning in chisq.test(clinvar$pcr_vs_rd1, clinvar[, var]): Chi-squared ## approximation may be incorrect ## Warning in chisq.test(clinvar$pcr_vs_rd1, clinvar[, var]): Chi-squared ## approximation may be incorrect ## Warning in chisq.test(clinvar$pcr_vs_rd1, clinvar[, var]): Chi-squared ## approximation may be incorrect
chisq.list.cualis<-as.data.frame(chisq.list.cualis) chisq.list.cualis
## chisq.list.cualis ## er_status 7.297519e-12 ## pr_status 7.248266e-06 ## her2_status 4.373811e-04 ## pT 4.158349e-01 ## pTlocal 1.000000e+00 ## pTmet 1.000000e+00 ## pN 1.650479e-01 ## pN0 9.301505e-01 ## pNmet 9.301505e-01

## bmngrd 9.601512e-05 ## age50 8.546123e-01 ## grade1 4.075537e-01 ## grade2 2.156066e-04 ## grade3 3.351813e-05 ## ajccI 7.680278e-01 ## ajccII 7.224145e-01 ## ajccIII 5.754963e-01 ## histology 2.902538e-01 ## treatment_code 1.265552e-02
El nivel de significación estadístico en este test es de alfa=0.05. El criterio para rechazar la hipótesis nula es que el p-valor ajustado por BH esté por debajo del nivel de significación:
chisq.list.cualis[,2] <- p.adjust(chisq.list.cualis[,1], method = "BH") chisq.list.cualis[,3] <- p.adjust(chisq.list.cualis[,1], method = "BY") colnames(chisq.list.cualis)<-c("pvalues","BH","BY") row.names(chisq.list.cualis[which(chisq.list.cualis[,2]<0.01),])
## [1] "er_status" "pr_status" "her2_status" "bmngrd" "grade2" ## [6] "grade3"
Datos de expresión génica
Chip utilizado en el estudio
En este apartado analizamos la expresión génica medida en nuestra cohorte mediante el chip de Affymetrix HG133A.Este chip contiene unas 22283 sondas.
require(affydata)
## Loading required package: affydata
## Loading required package: affy
## Package LibPath Item ## [1,] "affydata" "C:/Users/Javier/Documents/R/win-library/3.4" "Dilution" ## Title ## [1,] "AffyBatch instance Dilution"
require(affyPLM)
## Loading required package: affyPLM
## Loading required package: gcrma
## Loading required package: preprocessCore
require(hgu133a.db)
## Loading required package: hgu133a.db
## Loading required package: AnnotationDbi
## Loading required package: stats4
## Loading required package: IRanges

## Loading required package: S4Vectors
## ## Attaching package: 'S4Vectors'
## The following object is masked from 'package:base': ## ## expand.grid
## Loading required package: org.Hs.eg.db
##
##
annotation(gset)<-"hgu133a.db"
Control de calidad de los datos originales
A continuación se elabora el informe de los controles de calidad que se incluye en la memoria.
# library(arrayQualityMetrics)
gset<-gset[,-c(70,143,152,162,164,165,166,168,169,170,171,172,173,174,175)]
Normalización de las expresiones génicas:
Utilizamos la función normalize.ExpressionSet.quantiles del paquete affyPLM para normalizar los datos de expresión.
####Normalización de los datos de expresión con el método de quantiles stopifnot(require(affy)) stopifnot(require(affydata)) stopifnot(require(affyPLM)) eset<-normalize.ExpressionSet.quantiles(gset)
Los siguientes gráficos resumen este paso:
##Representeación gráfica de los datos antes y despues de normalizar. par(mfrow=c(2,2)) ##x11(width=8, height=10) boxplot(log2(exprs(gset))[,c(1:50)], pch=".", las=2, cex.axis=0.5, main="Antes de la normalización (log2-transformadas)- Sondas")
## Warning in boxplot(log2(exprs(gset))[, c(1:50)], pch = ".", las = 2, ## cex.axis = 0.5, : Se han producido NaNs
boxplot(exprs(eset)[,c(1:50)], pch=".", las=2, cex.axis=0.5, main="Normalizado") ## Plot the density distributions before and after normalization plotDensity(log2(exprs(gset)), main="Antes de la normalización (log2-transformadas)- Sondas",xlim=c(2,8)); grid()
## Warning in apply(mat, 2, density, na.rm = na.rm): Se han producido NaNs
plotDensity(exprs(eset), main="Normalizado"); grid()
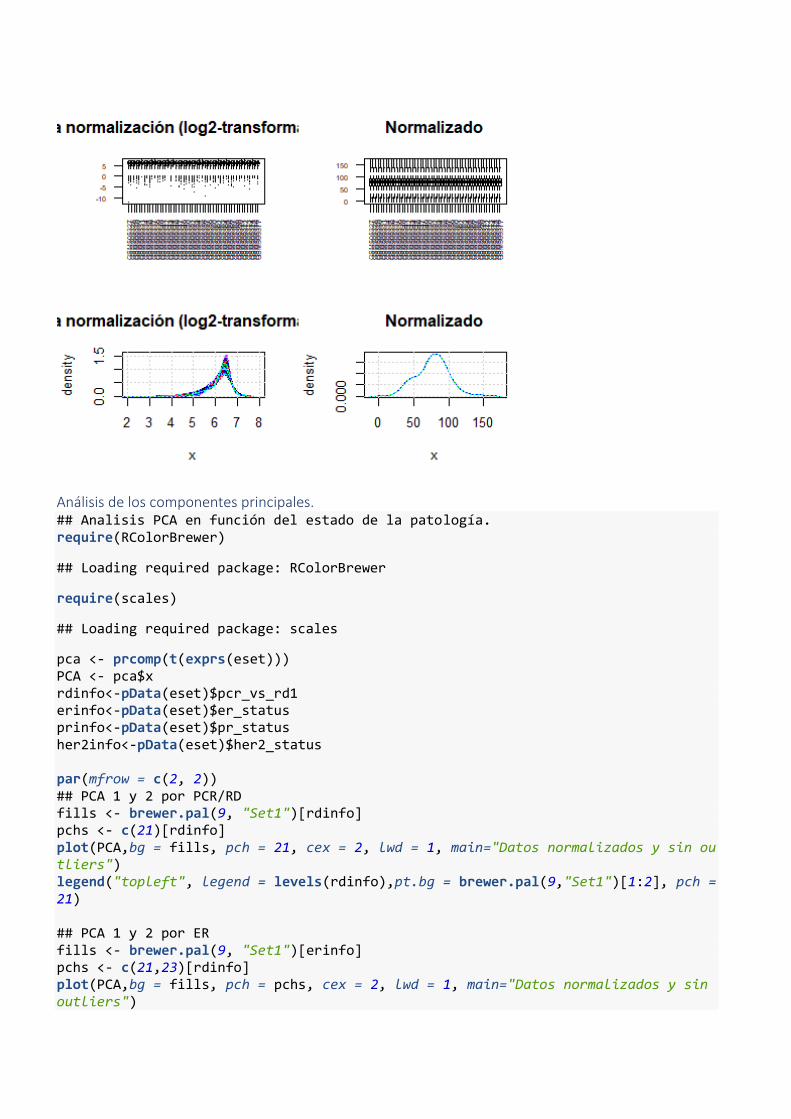
Análisis de los componentes principales. ## Analisis PCA en función del estado de la patología. require(RColorBrewer)
## Loading required package: RColorBrewer
require(scales)
## Loading required package: scales
pca <- prcomp(t(exprs(eset))) PCA <- pca$x rdinfo<-pData(eset)$pcr_vs_rd1 erinfo<-pData(eset)$er_status prinfo<-pData(eset)$pr_status her2info<-pData(eset)$her2_status par(mfrow = c(2, 2)) ## PCA 1 y 2 por PCR/RD fills <- brewer.pal(9, "Set1")[rdinfo] pchs <- c(21)[rdinfo] plot(PCA,bg = fills, pch = 21, cex = 2, lwd = 1, main="Datos normalizados y sin outliers") legend("topleft", legend = levels(rdinfo),pt.bg = brewer.pal(9,"Set1")[1:2], pch =21) ## PCA 1 y 2 por ER fills <- brewer.pal(9, "Set1")[erinfo] pchs <- c(21,23)[rdinfo] plot(PCA,bg = fills, pch = pchs, cex = 2, lwd = 1, main="Datos normalizados y sin outliers")

legend("topleft", legend = c(levels(erinfo),levels(rdinfo)),pt.bg = brewer.pal(9,"Set1")[1:2], pch =pchs) ## PCA 1 y 2 por PR fills <- brewer.pal(9, "Set1")[prinfo] pchs <- c(21,23)[rdinfo] plot(PCA,bg = fills, pch = pchs, cex = 2, lwd = 1, main="Datos normalizados y sin outliers") legend("topleft", legend = c(levels(prinfo),levels(rdinfo)),pt.bg = brewer.pal(9,"Set1")[1:2], pch =pchs) # Fraction of captured variance barplot(summary(pca)$importance["Proportion of Variance",1:15], main="Proporción de la varianza explicada por el CP")
summary(pca)$importance["Proportion of Variance",1:15]
## PC1 PC2 PC3 PC4 PC5 PC6 PC7 PC8 PC9 ## 0.09576 0.05125 0.03634 0.03138 0.02582 0.01927 0.01794 0.01310 0.01235 ## PC10 PC11 PC12 PC13 PC14 PC15 ## 0.01205 0.00958 0.00897 0.00834 0.00810 0.00741
summary(pca)$importance["Cumulative Proportion",1:15]
## PC1 PC2 PC3 PC4 PC5 PC6 PC7 PC8 PC9 ## 0.09576 0.14700 0.18335 0.21472 0.24054 0.25981 0.27775 0.29085 0.30320 ## PC10 PC11 PC12 PC13 PC14 PC15 ## 0.31525 0.32483 0.33381 0.34215 0.35025 0.35766
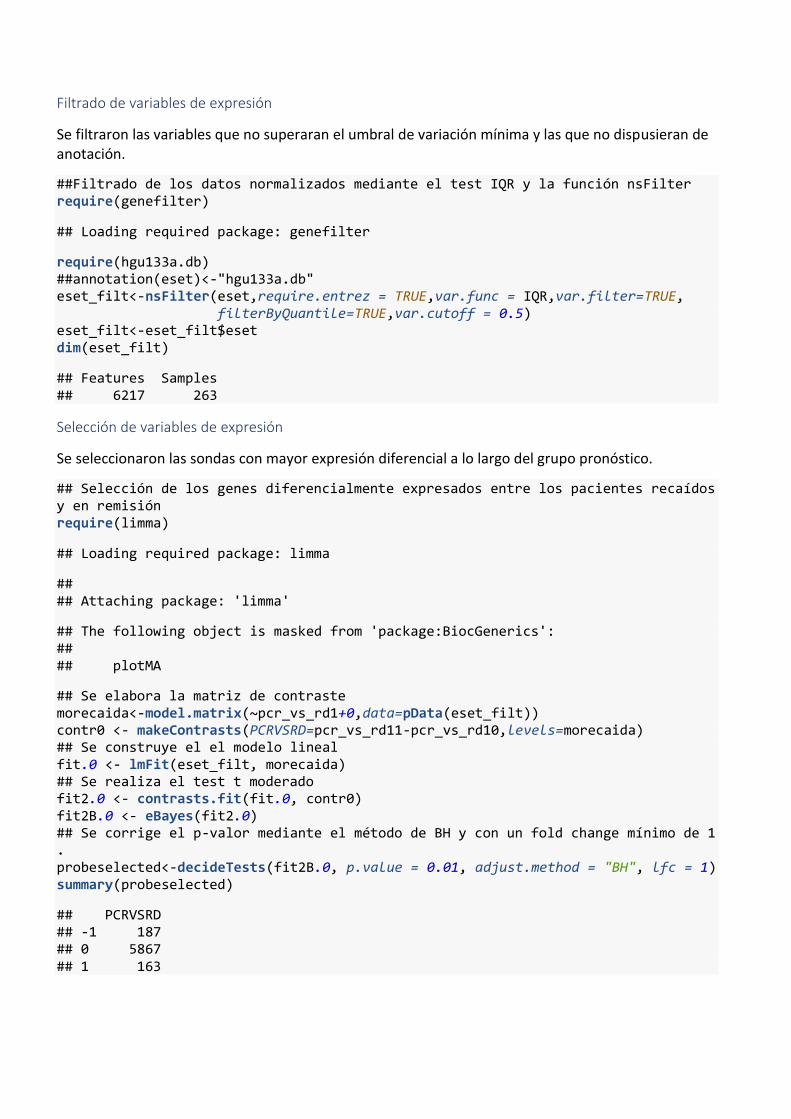
Filtrado de variables de expresión
Se filtraron las variables que no superaran el umbral de variación mínima y las que no dispusieran de anotación.
##Filtrado de los datos normalizados mediante el test IQR y la función nsFilter require(genefilter)
## Loading required package: genefilter
require(hgu133a.db) ##annotation(eset)<-"hgu133a.db" eset_filt<-nsFilter(eset,require.entrez = TRUE,var.func = IQR,var.filter=TRUE, filterByQuantile=TRUE,var.cutoff = 0.5) eset_filt<-eset_filt$eset dim(eset_filt)
## Features Samples ## 6217 263
Selección de variables de expresión
Se seleccionaron las sondas con mayor expresión diferencial a lo largo del grupo pronóstico.
## Selección de los genes diferencialmente expresados entre los pacientes recaídos y en remisión require(limma)
## Loading required package: limma
## ## Attaching package: 'limma'
## The following object is masked from 'package:BiocGenerics': ## ## plotMA
## Se elabora la matriz de contraste morecaida<-model.matrix(~pcr_vs_rd1+0,data=pData(eset_filt)) contr0 <- makeContrasts(PCRVSRD=pcr_vs_rd11-pcr_vs_rd10,levels=morecaida) ## Se construye el el modelo lineal fit.0 <- lmFit(eset_filt, morecaida) ## Se realiza el test t moderado fit2.0 <- contrasts.fit(fit.0, contr0) fit2B.0 <- eBayes(fit2.0) ## Se corrige el p-valor mediante el método de BH y con un fold change mínimo de 1. probeselected<-decideTests(fit2B.0, p.value = 0.01, adjust.method = "BH", lfc = 1) summary(probeselected)
## PCRVSRD ## -1 187 ## 0 5867 ## 1 163

Un total de 350 sondas fueron seleccionadas, de las cuales 187 fueron infrareguladas y 163 fueron sobreexpresadas en los casos de recaída. Se ajustaron los p-valores por el método de BH, de la misma forma que se procedió para las variables clínicas.
## Representación de los coeficientes de las sondas seleccionadas cols <- decideTests(fit2B.0, p.value = 0.01, adjust.method = "BH", lfc = 1)[, "PCRVSRD"] cols <- ifelse(cols == 1, "darkred", ifelse(cols == -1, "darkblue", "grey")) table(cols)
## cols ## darkblue darkred grey ## 187 163 5867
plot(coefficients(fit2B.0), col = cols, pch = 20)
Se reduce la base de datos con las sondas seleccionadas
eset_adjusted<-eset_filt[names(probeselected[which(probeselected!=0),]),]
Construcción del clasificador
Partición de la base de datos original.
Se construyó un nuevo objeto en forma de matriz para albergar todas las variables que se seleccionaron en pasos anteriores
require(glmnet)
## Loading required package: glmnet
## Loading required package: Matrix

## ## Attaching package: 'Matrix'
## The following object is masked from 'package:S4Vectors': ## ## expand
## Loading required package: foreach
## Warning: package 'foreach' was built under R version 3.4.3
## Loaded glmnet 2.0-13
gen_var<-scale(as.matrix(t(exprs(eset_adjusted)))) clin_var<-as.matrix(as.data.frame(lapply(pData(eset_adjusted)[,c(13:15,18,20,57,58)], as.numeric))) model<-cbind(clin_var,gen_var) model<-na.omit(model) colnames(model)
## [1] "er_status" "pcr_vs_rd1" "pr_status" "bmngrd" "her2_status" ## [6] "grade2" "grade3" "203256_at" "209772_s_at" "201664_at" ## [11] "209114_at" "218755_at" "204400_at" "200632_s_at" "204162_at" ## [16] "218806_s_at" "205830_at" "210024_s_at" "217834_s_at" "203789_s_at" ## [21] "203961_at" "209173_at" "209681_at" "204146_at" "209781_s_at" ## [26] "213245_at" "205501_at" "206023_at" "208682_s_at" "204244_s_at" ## [31] "213134_x_at" "203571_s_at" "205768_s_at" "217762_s_at" "206565_x_at" ## [36] "202458_at" "220183_s_at" "210758_at" "213060_s_at" "209074_s_at" ## [41] "209791_at" "219795_at" "204497_at" "200810_s_at" "215432_at" ## [46] "204170_s_at" "214769_at" "202376_at" "212925_at" "202404_s_at" ## [51] "202912_at" "201754_at" "209283_at" "207030_s_at" "222039_at" ## [56] "201360_at" "209869_at" "210074_at" "203917_at" "210272_at" ## [61] "210096_at" "205472_s_at" "213285_at" "205382_s_at" "205229_s_at" ## [66] "200862_at" "203566_s_at" "209459_s_at" "204750_s_at" "204794_at" ## [71] "209457_at" "203693_s_at" "204540_at" "36499_at" "201983_s_at" ## [76] "212418_at" "220624_s_at" "220559_at" "1438_at" "214053_at" ## [81] "205225_at" "204343_at" "203358_s_at" "202345_s_at" "202862_at" ## [86] "209955_s_at" "201579_at" "211303_x_at" "213100_at" "217640_x_at" ## [91] "209696_at" "212771_at" "206857_s_at" "205730_s_at" "213260_at" ## [96] "210052_s_at" "206469_x_at" "202580_x_at" "212964_at" "212956_at" ## [101] "212510_at" "213249_at" "212314_at" "213582_at" "202341_s_at" ## [106] "212949_at" "216603_at" "204541_at" "221641_s_at" "211002_s_at" ## [111] "222379_at" "212446_s_at" "205801_s_at" "202089_s_at" "217867_x_at" ## [116] "205354_at" "202134_s_at" "201397_at" "209603_at" "210002_at" ## [121] "218875_s_at" "211864_s_at" "205696_s_at" "201667_at" "205569_at" ## [126] "218856_at" "205257_s_at" "204875_s_at" "204470_at" "200824_at" ## [131] "220892_s_at" "201833_at" "205671_s_at" "204667_at" "206858_s_at" ## [136] "213419_at" "201841_s_at" "204786_s_at" "202147_s_at" "209540_at" ## [141] "222108_at" "203628_at" "201508_at" "212195_at" "211506_s_at" ## [146] "206999_at" "203126_at" "210029_at" "204686_at" "204698_at" ## [151] "211110_s_at" "204990_s_at" "216958_s_at" "204401_at" "203130_s_at" ## [156] "209680_s_at" "201088_at" "201596_x_at" "212099_at" "205734_s_at" ## [161] "222031_at" "201795_at" "212531_at" "201030_x_at" "210102_at" ## [166] "202641_at" "203362_s_at" "206401_s_at" "202107_s_at" "201755_at" ## [171] "210147_at" "209035_at" "210605_s_at" "203637_s_at" "212022_s_at"
## [176] "205047_s_at" "207076_s_at" "201710_at" "209757_s_at" "217297_s_at" ## [181] "216222_s_at" "201970_s_at" "213033_s_at" "204862_s_at" "205440_s_at" ## [186] "210683_at" "200790_at" "205646_s_at" "209524_at" "218450_at" ## [191] "209443_at" "214240_at" "201825_s_at" "217755_at" "219872_at" ## [196] "203066_at" "205714_s_at" "221139_s_at" "215729_s_at" "217838_s_at" ## [201] "215942_s_at" "205593_s_at" "206686_at" "205380_at" "218499_at" ## [206] "220414_at" "201037_at" "208305_at" "212190_at" "205352_at" ## [211] "209318_x_at" "201860_s_at" "203896_s_at" "219498_s_at" "202240_at" ## [216] "218035_s_at" "202887_s_at" "220095_at" "213712_at" "219919_s_at" ## [221] "218886_at" "221520_s_at" "218542_at" "220828_s_at" "205796_at" ## [226] "218726_at" "210794_s_at" "220651_s_at" "218309_at" "209916_at" ## [231] "218692_at" "219648_at" "220935_s_at" "204061_at" "201300_s_at" ## [236] "218976_at" "219806_s_at" "218447_at" "212096_s_at" "207011_s_at" ## [241] "219197_s_at" "221524_s_at" "209123_at" "206392_s_at" "203748_x_at" ## [246] "208711_s_at" "203685_at" "205681_at" "205158_at" "220540_at" ## [251] "201890_at" "203485_at" "209686_at" "203227_s_at" "203453_at" ## [256] "204103_at" "202071_at" "209687_at" "219414_at" "209624_s_at" ## [261] "202036_s_at" "207134_x_at" "205751_at" "209339_at" "206634_at" ## [266] "213664_at" "207626_s_at" "201563_at" "209842_at" "204914_s_at" ## [271] "210246_s_at" "205009_at" "204623_at" "209651_at" "201147_s_at" ## [276] "203476_at" "210084_x_at" "204822_at" "221765_at" "203343_at" ## [281] "208358_s_at" "203234_at" "211527_x_at" "200670_at" "221728_x_at" ## [286] "206373_at" "207781_s_at" "204508_s_at" "205186_at" "217028_at" ## [291] "210078_s_at" "219051_x_at" "208873_s_at" "218211_s_at" "219438_at" ## [296] "218885_s_at" "219741_x_at" "219455_at" "202371_at" "220581_at" ## [301] "219681_s_at" "221024_s_at" "200755_s_at" "209683_at" "208103_s_at" ## [306] "221004_s_at" "204775_at" "221436_s_at" "206197_at" "210085_s_at" ## [311] "214269_at" "211200_s_at" "206410_at" "219752_at" "219874_at" ## [316] "212841_s_at" "209204_at" "202671_s_at" "203438_at" "205379_at" ## [321] "212816_s_at" "206107_at" "206618_at" "203560_at" "204304_s_at" ## [326] "213226_at" "213523_at" "214440_at" "203108_at" "218009_s_at" ## [331] "202705_at" "219654_at" "209464_at" "201681_s_at" "206315_at" ## [336] "221759_at" "204033_at" "212265_at" "206513_at" "204647_at" ## [341] "218002_s_at" "203702_s_at" "203144_s_at" "205862_at" "204817_at" ## [346] "212583_at" "215013_s_at" "204447_at" "204681_s_at" "204040_at" ## [351] "203764_at" "203213_at" "204825_at" "204589_at" "202870_s_at" ## [356] "206364_at" "204695_at"
Con la intención de construir un modelo de la forma mas reproducible, se dividió la base de datos inicial en 2 partes, la primera albergaba 2/3 de las muestras iniciales con el objetivo de construir el modelo. La segunda parte recogió el 1/3 restante para validar el modelo construido.
require(caret)
## Loading required package: caret
## Warning: package 'caret' was built under R version 3.4.3
## Loading required package: lattice
## Loading required package: ggplot2
## Warning: package 'ggplot2' was built under R version 3.4.3
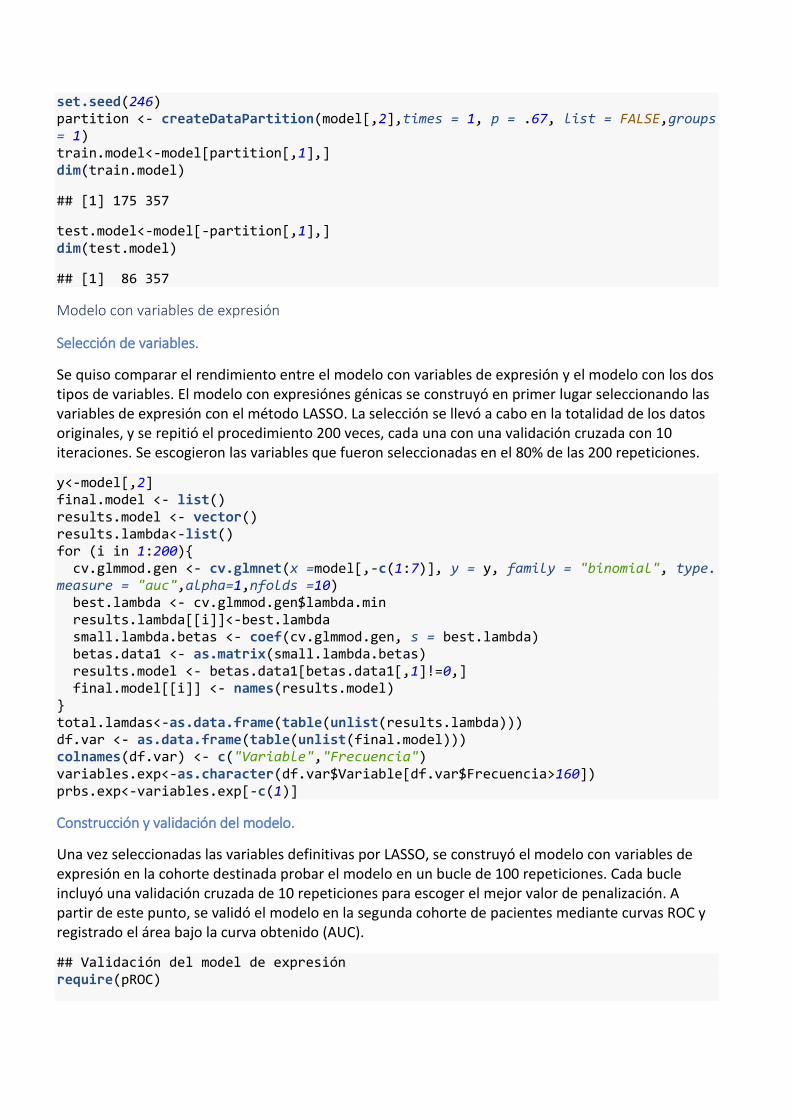
set.seed(246) partition <- createDataPartition(model[,2],times = 1, p = .67, list = FALSE,groups = 1) train.model<-model[partition[,1],] dim(train.model)
## [1] 175 357
test.model<-model[-partition[,1],] dim(test.model)
## [1] 86 357
Modelo con variables de expresión
Selección de variables.
Se quiso comparar el rendimiento entre el modelo con variables de expresión y el modelo con los dos tipos de variables. El modelo con expresiónes génicas se construyó en primer lugar seleccionando las variables de expresión con el método LASSO. La selección se llevó a cabo en la totalidad de los datos originales, y se repitió el procedimiento 200 veces, cada una con una validación cruzada con 10 iteraciones. Se escogieron las variables que fueron seleccionadas en el 80% de las 200 repeticiones.
y<-model[,2] final.model <- list() results.model <- vector() results.lambda<-list() for (i in 1:200){ cv.glmmod.gen <- cv.glmnet(x =model[,-c(1:7)], y = y, family = "binomial", type.measure = "auc",alpha=1,nfolds =10) best.lambda <- cv.glmmod.gen$lambda.min results.lambda[[i]]<-best.lambda small.lambda.betas <- coef(cv.glmmod.gen, s = best.lambda) betas.data1 <- as.matrix(small.lambda.betas) results.model <- betas.data1[betas.data1[,1]!=0,] final.model[[i]] <- names(results.model) } total.lamdas<-as.data.frame(table(unlist(results.lambda))) df.var <- as.data.frame(table(unlist(final.model))) colnames(df.var) <- c("Variable","Frecuencia") variables.exp<-as.character(df.var$Variable[df.var$Frecuencia>160]) prbs.exp<-variables.exp[-c(1)]
Construcción y validación del modelo.
Una vez seleccionadas las variables definitivas por LASSO, se construyó el modelo con variables de expresión en la cohorte destinada probar el modelo en un bucle de 100 repeticiones. Cada bucle incluyó una validación cruzada de 10 repeticiones para escoger el mejor valor de penalización. A partir de este punto, se validó el modelo en la segunda cohorte de pacientes mediante curvas ROC y registrado el área bajo la curva obtenido (AUC).
## Validación del model de expresión require(pROC)

train.model.genes<-as.data.frame(train.model[,c("pcr_vs_rd1",prbs.exp)]) test.model.genes<-as.data.frame(test.model[,c("pcr_vs_rd1",prbs.exp)]) final.auc.genes<-as.numeric() for (i in 1:100){ lasso.model <- cv.glmnet(x = as.matrix(train.model.genes[,prbs.exp]), y = train.model.genes[,1], family = 'binomial',type.measure = 'auc',nfolds = 10,grouped=FALSE) test.model.genes$lasso.prob <- predict(lasso.model,type="response", newx = as.matrix(test.model.genes[,prbs.exp]), s = 'lambda.min',exact=TRUE) pred<-roc(response=test.model.genes[,1],predictor=as.numeric(as.character(test.model.genes$lasso.prob))) final.auc.genes[i] <- pred$auc } summary(final.auc.genes)
## Min. 1st Qu. Median Mean 3rd Qu. Max. ## 0.8606 0.9046 0.9130 0.9088 0.9179 0.9206
prbs.exp<-variables.exp[-1] ## sondas seleccionadas write.csv2(as.data.frame(cbind(prbs.exp,as.character(featureData(eset_adjusted)[prbs.exp,]$"Gene Symbol"), as.character(featureData(eset_adjusted)[prbs.exp,]$"Gene Ontology Biological Process"), as.character(featureData(eset_adjusted)[prbs.exp,]$"Gene Ontology Molecular Function"))), "genes_model_expres.csv")
Modelo con variables mixtas
Selección de variables
A continuación se seleccionaron las variables clínicas y de expresión mediante LASSO con la misma estrategía que en el apartado anterior.
y<-model[,2] final.model <- list() results.model <- vector() results.lambda<-list() set.seed(246) for (i in 1:200){ cv.glmmod.int <- cv.glmnet(x =model[,-c(2,6,7)], y = y, family = "binomial", type.measure = "auc",alpha=1,nfolds =10) best.lambda <- cv.glmmod.int$lambda.min results.lambda[[i]]<-best.lambda small.lambda.betas <- coef(cv.glmmod.int, s = best.lambda) betas.data1 <- as.matrix(small.lambda.betas) results.model <- betas.data1[betas.data1[,1]!=0,] final.model[[i]] <- names(results.model) } total.lamdas<-as.data.frame(table(unlist(results.lambda))) df.var <- as.data.frame(table(unlist(final.model))) colnames(df.var) <- c("Variable","Frecuencia") variables.int<-as.character(df.var$Variable[df.var$Frecuencia>160]) genes<-as.character(featureData(eset_adjusted)[featureNames(eset_adjusted)%in%variables.int,]$"Gene Symbol") write.csv2(as.data.frame(cbind(as.character(featureData(eset_adjusted)[featureNames(eset_adjusted)%in%variables.int,]$"Gene Symbol"), as.character(featureData(eset_adjusted)[featureNames(eset_adjusted)%in%variables.int,]$"Gene Ontology Biological
Process"),as.character(featureData(eset_adjusted)[featureNames(eset_adjusted)%in%variables.int,]$"Gene Ontology Molecular Function"))),"genes_expres.csv") variables.int
## [1] "(Intercept)" "200670_at" "201579_at" "202862_at" "203917_at" ## [6] "204400_at" "204401_at" "204447_at" "204470_at" "204990_s_at" ## [11] "205229_s_at" "205352_at" "205501_at" "205751_at" "205796_at" ## [16] "205801_s_at" "206410_at" "206618_at" "207134_x_at" "208358_s_at" ## [21] "209035_at" "209074_s_at" "209540_at" "209686_at" "209772_s_at" ## [26] "209842_at" "210078_s_at" "210102_at" "211200_s_at" "211303_x_at" ## [31] "211864_s_at" "212583_at" "212841_s_at" "213100_at" "213582_at" ## [36] "215432_at" "216958_s_at" "217297_s_at" "217867_x_at" "218002_s_at" ## [41] "219051_x_at" "219654_at" "219795_at" "220095_at" "220183_s_at" ## [46] "222031_at" "er_status" "her2_status"
Construcción y validación del modelo.
De nuevo, se repitió el proceso de elaboración del modelo de variables mixstas con la cohorte pertinente en un bucle de 100 repeticiones, cada uno contempló una validación cruzada de 10 iteraciones para escoger el mejor valor de penalización y la validación en la segunda cohorte de pacientes mediante curvas ROC.
##Validación del modelo. variables.int<-variables.int[-c(1)] train.model.int<-as.data.frame(train.model[,c("pcr_vs_rd1",variables.int)]) test.model.int<-as.data.frame(test.model[,c("pcr_vs_rd1",variables.int)]) final.auc.int<-as.numeric() for (i in 1:100){ lasso.model <- cv.glmnet(x = as.matrix(train.model.int[,variables.int]), y = train.model.int[,1], family = 'binomial', type.measure = 'auc',nfolds = 10,grouped = FALSE) test.model.int$lasso.prob <- predict(lasso.model,type="response", newx = as.matrix(test.model.int[,variables.int]), s = 'lambda.min',exact=TRUE) pred<-roc(response=test.model.int$pcr_vs_rd1,predictor=as.numeric(as.character(test.model.int$lasso.prob))) final.auc.int[i] <- pred$auc } summary(final.auc.int)
## Min. 1st Qu. Median Mean 3rd Qu. Max. ## 0.8654 0.9075 0.9179 0.9129 0.9206 0.9255
Validación del clasificador en una base de datos
Hemos utilizado el estudio registrado en GEO con la referencia GSE25055 para validar el clasificador. Esta base de datos solo recoge pacientes HER2 negativos por lo que esta variable no pudo ser utilizada.
Tras normalizar los datos y escalarlos para ser comparables a los de origen, pasamos a construir el modelo con las variables que contemplamos al inicio:
Lectura de los dos datos gset.test<-getGEO(filename="GSE25055_series_matrix.txt.gz",destdir = getwd())
## Using locally cached version of GPL96 found here: ## C:/Users/Javier/Desktop/GPL96.soft
## Warning in read.table(file = file, header = header, sep = sep, quote = ## quote, : not all columns named in 'colClasses' exist
Informe del control de calidad de los datos ##library(arrayQualityMetrics) ##arrayQualityMetrics(gset.test)
Este se encuentra anexo a la memoria. Se comentaran los resultados en el apartado correspondiente.
Normalización de las determinaciones del chip. ####Normalización de los datos de expresión mediante la función normalize, que sigue ##el método de rangos intercuartiles stopifnot(require(affy)) stopifnot(require(affydata)) stopifnot(require(affyPLM)) eset.test<-normalize.ExpressionSet.quantiles(gset.test)
Recodificación y adaptación de las variables. ## Recodificación de las variables clínicas pData(phenoData(eset.test))$pT<-pData(phenoData(eset.test))$characteristics_ch1.7 pData(phenoData(eset.test))$pT<-ifelse(pData(phenoData(eset.test))$pT=="clinical_t_stage: T1",1, ifelse(pData(phenoData(eset.test))$pT=="clinical_t_stage: T2",2, ifelse(pData(phenoData(eset.test))$pT=="clinical_t_stage: T3",3, ifelse(pData(phenoData(eset.test))$pT=="clinical_t_stage: T4",4,0)))) pData(phenoData(eset.test))$pN<-pData(phenoData(eset.test))$characteristics_ch1.8 pData(phenoData(eset.test))$pN<-ifelse(pData(phenoData(eset.test))$pT=="clinical_nodal_status: N1",1, ifelse(pData(phenoData(eset.test))$pT=="clinical_nodal_status: N2",2, ifelse(pData(phenoData(eset.test))$pT=="clinical_nodal_status: N3",3,0))) pData(phenoData(eset.test))$ajcc<-pData(phenoData(eset.test))$characteristics_ch1.9 pData(phenoData(eset.test))$bmngrd<-pData(phenoData(eset.test))$characteristics_ch1.10 pData(phenoData(eset.test))$bmngrd<-ifelse(pData(phenoData(eset.test))$bmngrd=="grade: 1",1, ifelse(pData(phenoData(eset.test))$bmngrd=="grade: 2",2, ifelse(pData(phenoData(eset.test))$bmngrd=="grade: 3",3,NA))) pData(phenoData(eset.test))$er_status<-pData(phenoData(eset.test))$characteristics_ch1.3 pData(phenoData(eset.test))$er_status<-ifelse(pData(phenoData(eset.test))$er_status=="er_status_ihc: P",1,0) pData(phenoData(eset.test))$pr_status<-pData(phenoData(eset.test))$characteristics_ch1.4 pData(phenoData(eset.test))$pr_status<-ifelse(pData(phenoData(eset.test))$pr_status=="pr_status_ihc: P",1,0) pData(phenoData(eset.test))$her2_status<-pData(phenoData(eset.test))$characteristics_ch1.5 pData(phenoData(eset.test))$her2_status<-ifelse(pData(phenoData(eset.test))$her2_status=="her2_status: P",1,0) pData(phenoData(eset.test))$pcr_vs_rd1<-pData(phenoData(eset.test))$characteristics_ch1.11
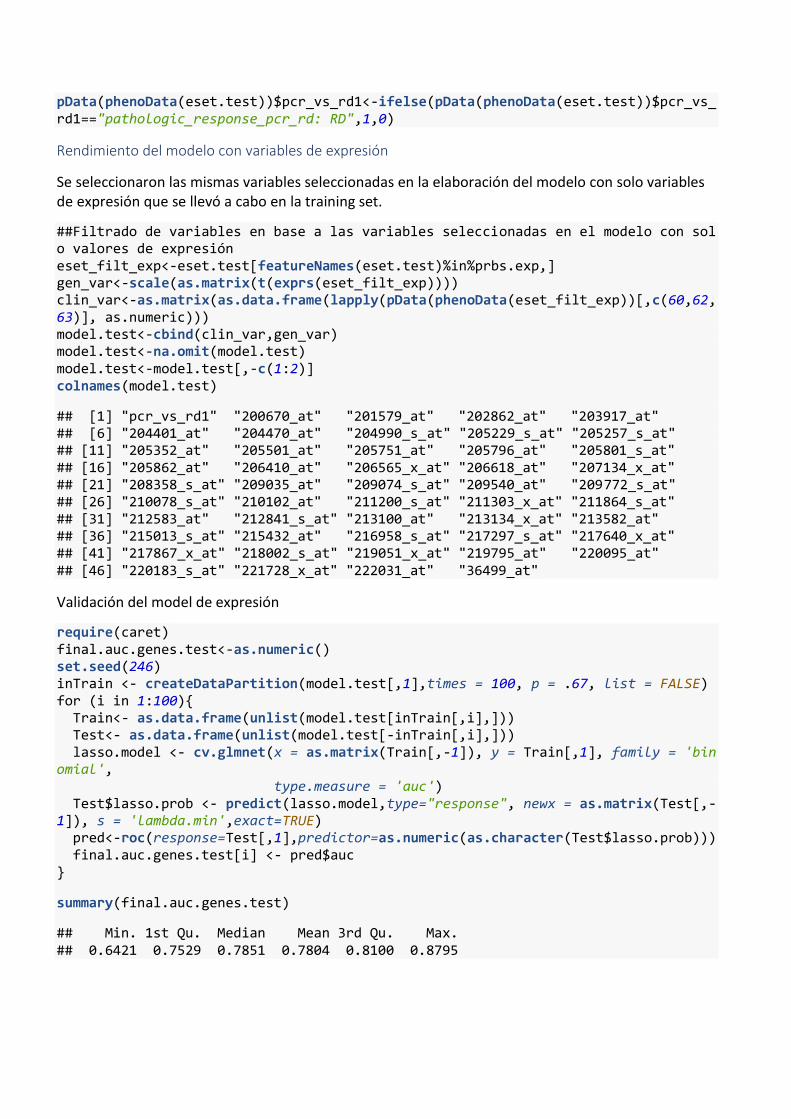
pData(phenoData(eset.test))$pcr_vs_rd1<-ifelse(pData(phenoData(eset.test))$pcr_vs_rd1=="pathologic_response_pcr_rd: RD",1,0)
Rendimiento del modelo con variables de expresión
Se seleccionaron las mismas variables seleccionadas en la elaboración del modelo con solo variables de expresión que se llevó a cabo en la training set.
##Filtrado de variables en base a las variables seleccionadas en el modelo con solo valores de expresión eset_filt_exp<-eset.test[featureNames(eset.test)%in%prbs.exp,] gen_var<-scale(as.matrix(t(exprs(eset_filt_exp)))) clin_var<-as.matrix(as.data.frame(lapply(pData(phenoData(eset_filt_exp))[,c(60,62,63)], as.numeric))) model.test<-cbind(clin_var,gen_var) model.test<-na.omit(model.test) model.test<-model.test[,-c(1:2)] colnames(model.test)
## [1] "pcr_vs_rd1" "200670_at" "201579_at" "202862_at" "203917_at" ## [6] "204401_at" "204470_at" "204990_s_at" "205229_s_at" "205257_s_at" ## [11] "205352_at" "205501_at" "205751_at" "205796_at" "205801_s_at" ## [16] "205862_at" "206410_at" "206565_x_at" "206618_at" "207134_x_at" ## [21] "208358_s_at" "209035_at" "209074_s_at" "209540_at" "209772_s_at" ## [26] "210078_s_at" "210102_at" "211200_s_at" "211303_x_at" "211864_s_at" ## [31] "212583_at" "212841_s_at" "213100_at" "213134_x_at" "213582_at" ## [36] "215013_s_at" "215432_at" "216958_s_at" "217297_s_at" "217640_x_at" ## [41] "217867_x_at" "218002_s_at" "219051_x_at" "219795_at" "220095_at" ## [46] "220183_s_at" "221728_x_at" "222031_at" "36499_at"
Validación del model de expresión
require(caret) final.auc.genes.test<-as.numeric() set.seed(246) inTrain <- createDataPartition(model.test[,1],times = 100, p = .67, list = FALSE) for (i in 1:100){ Train<- as.data.frame(unlist(model.test[inTrain[,i],])) Test<- as.data.frame(unlist(model.test[-inTrain[,i],])) lasso.model <- cv.glmnet(x = as.matrix(Train[,-1]), y = Train[,1], family = 'binomial', type.measure = 'auc') Test$lasso.prob <- predict(lasso.model,type="response", newx = as.matrix(Test[,-1]), s = 'lambda.min',exact=TRUE) pred<-roc(response=Test[,1],predictor=as.numeric(as.character(Test$lasso.prob))) final.auc.genes.test[i] <- pred$auc }
summary(final.auc.genes.test)
## Min. 1st Qu. Median Mean 3rd Qu. Max. ## 0.6421 0.7529 0.7851 0.7804 0.8100 0.8795
Rendimiento del modelo con variables mixtas
Se seleccionaron las mismas variables seleccionadas en la elaboración del modelo con solo variables de expresión que se llevó a cabo en la training set.
eset_filt_int<-eset.test[featureNames(eset.test)%in%variables.int,] gen_var<-scale(as.matrix(t(exprs(eset_filt_int)))) colnames(pData(phenoData(eset.test)))
## [1] "title" "geo_accession" ## [3] "status" "submission_date" ## [5] "last_update_date" "type" ## [7] "channel_count" "source_name_ch1" ## [9] "organism_ch1" "characteristics_ch1" ## [11] "characteristics_ch1.1" "characteristics_ch1.2" ## [13] "characteristics_ch1.3" "characteristics_ch1.4" ## [15] "characteristics_ch1.5" "characteristics_ch1.6" ## [17] "characteristics_ch1.7" "characteristics_ch1.8" ## [19] "characteristics_ch1.9" "characteristics_ch1.10" ## [21] "characteristics_ch1.11" "characteristics_ch1.12" ## [23] "characteristics_ch1.13" "characteristics_ch1.14" ## [25] "characteristics_ch1.15" "characteristics_ch1.16" ## [27] "characteristics_ch1.17" "characteristics_ch1.18" ## [29] "characteristics_ch1.19" "characteristics_ch1.20" ## [31] "characteristics_ch1.21" "characteristics_ch1.22" ## [33] "characteristics_ch1.23" "treatment_protocol_ch1" ## [35] "molecule_ch1" "extract_protocol_ch1" ## [37] "label_ch1" "label_protocol_ch1" ## [39] "taxid_ch1" "hyb_protocol" ## [41] "scan_protocol" "data_processing" ## [43] "platform_id" "contact_name" ## [45] "contact_email" "contact_phone" ## [47] "contact_institute" "contact_address" ## [49] "contact_city" "contact_state" ## [51] "contact_zip/postal_code" "contact_country" ## [53] "contact_web_link" "supplementary_file" ## [55] "data_row_count" "pT" ## [57] "pN" "ajcc" ## [59] "bmngrd" "er_status" ## [61] "pr_status" "her2_status" ## [63] "pcr_vs_rd1"
clin_var<-as.matrix(as.data.frame(lapply(pData(phenoData(eset_filt_int))[,c(60,62,63)], as.numeric))) model.test<-cbind(clin_var,gen_var) model.test<-na.omit(model.test) colnames(model.test)
## [1] "er_status" "her2_status" "pcr_vs_rd1" "200670_at" "201579_at" ## [6] "202862_at" "203917_at" "204400_at" "204401_at" "204447_at" ## [11] "204470_at" "204990_s_at" "205229_s_at" "205352_at" "205501_at" ## [16] "205751_at" "205796_at" "205801_s_at" "206410_at" "206618_at" ## [21] "207134_x_at" "208358_s_at" "209035_at" "209074_s_at" "209540_at" ## [26] "209686_at" "209772_s_at" "209842_at" "210078_s_at" "210102_at" ## [31] "211200_s_at" "211303_x_at" "211864_s_at" "212583_at" "212841_s_at"
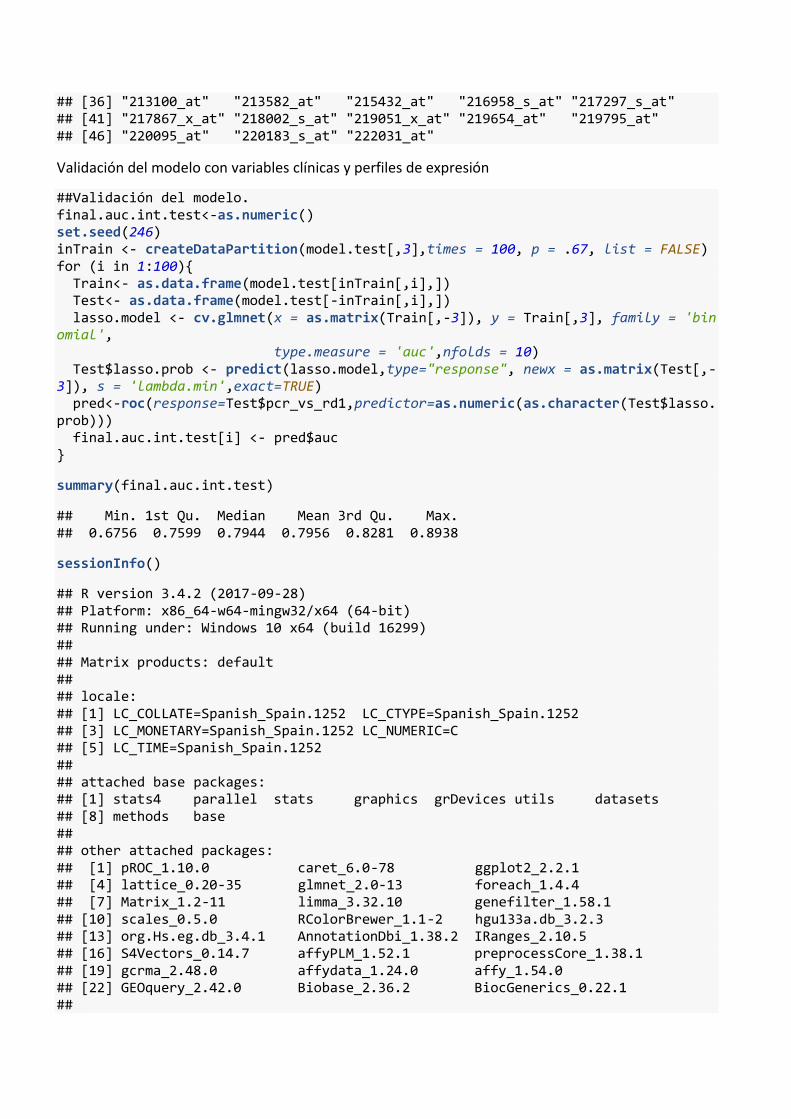
## [36] "213100_at" "213582_at" "215432_at" "216958_s_at" "217297_s_at" ## [41] "217867_x_at" "218002_s_at" "219051_x_at" "219654_at" "219795_at" ## [46] "220095_at" "220183_s_at" "222031_at"
Validación del modelo con variables clínicas y perfiles de expresión
##Validación del modelo. final.auc.int.test<-as.numeric() set.seed(246) inTrain <- createDataPartition(model.test[,3],times = 100, p = .67, list = FALSE) for (i in 1:100){ Train<- as.data.frame(model.test[inTrain[,i],]) Test<- as.data.frame(model.test[-inTrain[,i],]) lasso.model <- cv.glmnet(x = as.matrix(Train[,-3]), y = Train[,3], family = 'binomial', type.measure = 'auc',nfolds = 10) Test$lasso.prob <- predict(lasso.model,type="response", newx = as.matrix(Test[,-3]), s = 'lambda.min',exact=TRUE) pred<-roc(response=Test$pcr_vs_rd1,predictor=as.numeric(as.character(Test$lasso.prob))) final.auc.int.test[i] <- pred$auc }
summary(final.auc.int.test)
## Min. 1st Qu. Median Mean 3rd Qu. Max. ## 0.6756 0.7599 0.7944 0.7956 0.8281 0.8938
sessionInfo()
## R version 3.4.2 (2017-09-28) ## Platform: x86_64-w64-mingw32/x64 (64-bit) ## Running under: Windows 10 x64 (build 16299) ## ## Matrix products: default ## ## locale: ## [1] LC_COLLATE=Spanish_Spain.1252 LC_CTYPE=Spanish_Spain.1252 ## [3] LC_MONETARY=Spanish_Spain.1252 LC_NUMERIC=C ## [5] LC_TIME=Spanish_Spain.1252 ## ## attached base packages: ## [1] stats4 parallel stats graphics grDevices utils datasets ## [8] methods base ## ## other attached packages: ## [1] pROC_1.10.0 caret_6.0-78 ggplot2_2.2.1 ## [4] lattice_0.20-35 glmnet_2.0-13 foreach_1.4.4 ## [7] Matrix_1.2-11 limma_3.32.10 genefilter_1.58.1 ## [10] scales_0.5.0 RColorBrewer_1.1-2 hgu133a.db_3.2.3 ## [13] org.Hs.eg.db_3.4.1 AnnotationDbi_1.38.2 IRanges_2.10.5 ## [16] S4Vectors_0.14.7 affyPLM_1.52.1 preprocessCore_1.38.1 ## [19] gcrma_2.48.0 affydata_1.24.0 affy_1.54.0 ## [22] GEOquery_2.42.0 Biobase_2.36.2 BiocGenerics_0.22.1 ##

## loaded via a namespace (and not attached): ## [1] nlme_3.1-131 bitops_1.0-6 lubridate_1.7.1 ## [4] bit64_0.9-7 dimRed_0.1.0 httr_1.3.1 ## [7] rprojroot_1.3-1 tools_3.4.2 backports_1.1.2 ## [10] R6_2.2.2 affyio_1.46.0 rpart_4.1-11 ## [13] DBI_0.7 lazyeval_0.2.1 colorspace_1.3-2 ## [16] nnet_7.3-12 withr_2.1.1 tidyselect_0.2.3 ## [19] mnormt_1.5-5 bit_1.1-12 compiler_3.4.2 ## [22] sfsmisc_1.1-1 DEoptimR_1.0-8 psych_1.7.8 ## [25] robustbase_0.92-8 stringr_1.2.0 digest_0.6.13 ## [28] foreign_0.8-69 rmarkdown_1.8 XVector_0.16.0 ## [31] pkgconfig_2.0.1 htmltools_0.3.6 rlang_0.1.6 ## [34] ddalpha_1.3.1 RSQLite_2.0 BiocInstaller_1.26.1 ## [37] bindr_0.1 dplyr_0.7.4 ModelMetrics_1.1.0 ## [40] RCurl_1.95-4.9 magrittr_1.5 Rcpp_0.12.14 ## [43] munsell_0.4.3 stringi_1.1.6 yaml_2.1.16 ## [46] MASS_7.3-47 zlibbioc_1.22.0 plyr_1.8.4 ## [49] recipes_0.1.1 grid_3.4.2 blob_1.1.0 ## [52] Biostrings_2.44.2 splines_3.4.2 annotate_1.54.0 ## [55] knitr_1.18 pillar_1.0.1 reshape2_1.4.3 ## [58] codetools_0.2-15 CVST_0.2-1 XML_3.98-1.9 ## [61] glue_1.2.0 evaluate_0.10.1 gtable_0.2.0 ## [64] purrr_0.2.4 tidyr_0.7.2 kernlab_0.9-25 ## [67] assertthat_0.2.0 DRR_0.0.2 gower_0.1.2 ## [70] prodlim_1.6.1 xtable_1.8-2 broom_0.4.3 ## [73] class_7.3-14 survival_2.41-3 timeDate_3042.101 ## [76] RcppRoll_0.2.2 tibble_1.4.1 iterators_1.0.9 ## [79] memoise_1.1.0 lava_1.5.1 bindrcpp_0.2 ## [82] ipred_0.9-6
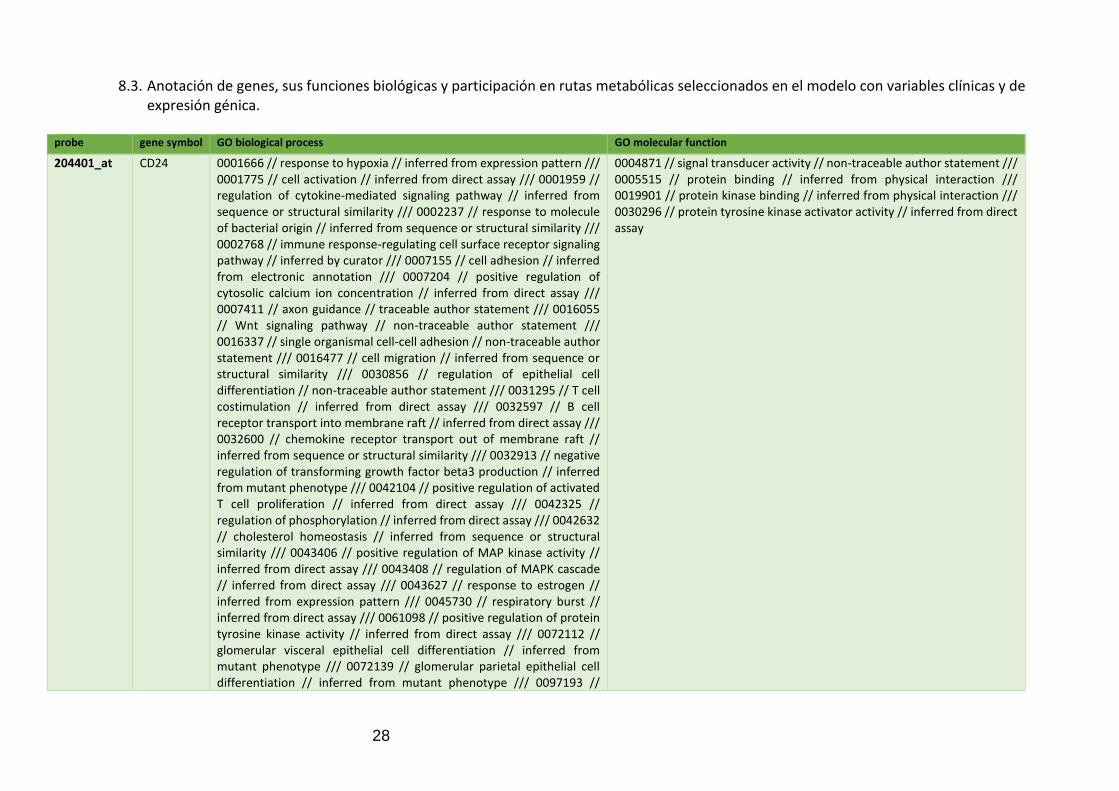
28
8.3. Anotación de genes, sus funciones biológicas y participación en rutas metabólicas seleccionados en el modelo con variables clínicas y de
expresión génica.
probe gene symbol GO biological process GO molecular function
204401_at CD24 0001666 // response to hypoxia // inferred from expression pattern /// 0001775 // cell activation // inferred from direct assay /// 0001959 // regulation of cytokine-mediated signaling pathway // inferred from sequence or structural similarity /// 0002237 // response to molecule of bacterial origin // inferred from sequence or structural similarity /// 0002768 // immune response-regulating cell surface receptor signaling pathway // inferred by curator /// 0007155 // cell adhesion // inferred from electronic annotation /// 0007204 // positive regulation of cytosolic calcium ion concentration // inferred from direct assay /// 0007411 // axon guidance // traceable author statement /// 0016055 // Wnt signaling pathway // non-traceable author statement /// 0016337 // single organismal cell-cell adhesion // non-traceable author statement /// 0016477 // cell migration // inferred from sequence or structural similarity /// 0030856 // regulation of epithelial cell differentiation // non-traceable author statement /// 0031295 // T cell costimulation // inferred from direct assay /// 0032597 // B cell receptor transport into membrane raft // inferred from direct assay /// 0032600 // chemokine receptor transport out of membrane raft // inferred from sequence or structural similarity /// 0032913 // negative regulation of transforming growth factor beta3 production // inferred from mutant phenotype /// 0042104 // positive regulation of activated T cell proliferation // inferred from direct assay /// 0042325 // regulation of phosphorylation // inferred from direct assay /// 0042632 // cholesterol homeostasis // inferred from sequence or structural similarity /// 0043406 // positive regulation of MAP kinase activity // inferred from direct assay /// 0043408 // regulation of MAPK cascade // inferred from direct assay /// 0043627 // response to estrogen // inferred from expression pattern /// 0045730 // respiratory burst // inferred from direct assay /// 0061098 // positive regulation of protein tyrosine kinase activity // inferred from direct assay /// 0072112 // glomerular visceral epithelial cell differentiation // inferred from mutant phenotype /// 0072139 // glomerular parietal epithelial cell differentiation // inferred from mutant phenotype /// 0097193 //
0004871 // signal transducer activity // non-traceable author statement /// 0005515 // protein binding // inferred from physical interaction /// 0019901 // protein kinase binding // inferred from physical interaction /// 0030296 // protein tyrosine kinase activator activity // inferred from direct assay
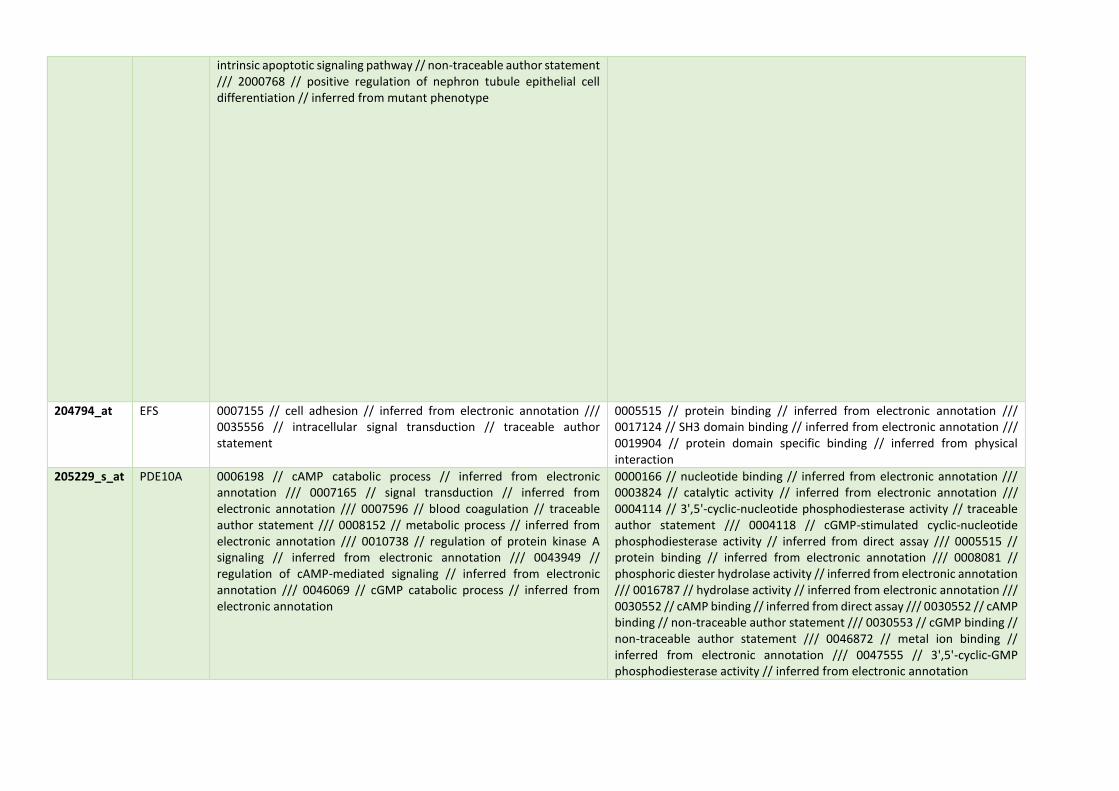
intrinsic apoptotic signaling pathway // non-traceable author statement /// 2000768 // positive regulation of nephron tubule epithelial cell differentiation // inferred from mutant phenotype
204794_at EFS 0007155 // cell adhesion // inferred from electronic annotation /// 0035556 // intracellular signal transduction // traceable author statement
0005515 // protein binding // inferred from electronic annotation /// 0017124 // SH3 domain binding // inferred from electronic annotation /// 0019904 // protein domain specific binding // inferred from physical interaction
205229_s_at PDE10A 0006198 // cAMP catabolic process // inferred from electronic annotation /// 0007165 // signal transduction // inferred from electronic annotation /// 0007596 // blood coagulation // traceable author statement /// 0008152 // metabolic process // inferred from electronic annotation /// 0010738 // regulation of protein kinase A signaling // inferred from electronic annotation /// 0043949 // regulation of cAMP-mediated signaling // inferred from electronic annotation /// 0046069 // cGMP catabolic process // inferred from electronic annotation
0000166 // nucleotide binding // inferred from electronic annotation /// 0003824 // catalytic activity // inferred from electronic annotation /// 0004114 // 3',5'-cyclic-nucleotide phosphodiesterase activity // traceable author statement /// 0004118 // cGMP-stimulated cyclic-nucleotide phosphodiesterase activity // inferred from direct assay /// 0005515 // protein binding // inferred from electronic annotation /// 0008081 // phosphoric diester hydrolase activity // inferred from electronic annotation /// 0016787 // hydrolase activity // inferred from electronic annotation /// 0030552 // cAMP binding // inferred from direct assay /// 0030552 // cAMP binding // non-traceable author statement /// 0030553 // cGMP binding // non-traceable author statement /// 0046872 // metal ion binding // inferred from electronic annotation /// 0047555 // 3',5'-cyclic-GMP phosphodiesterase activity // inferred from electronic annotation
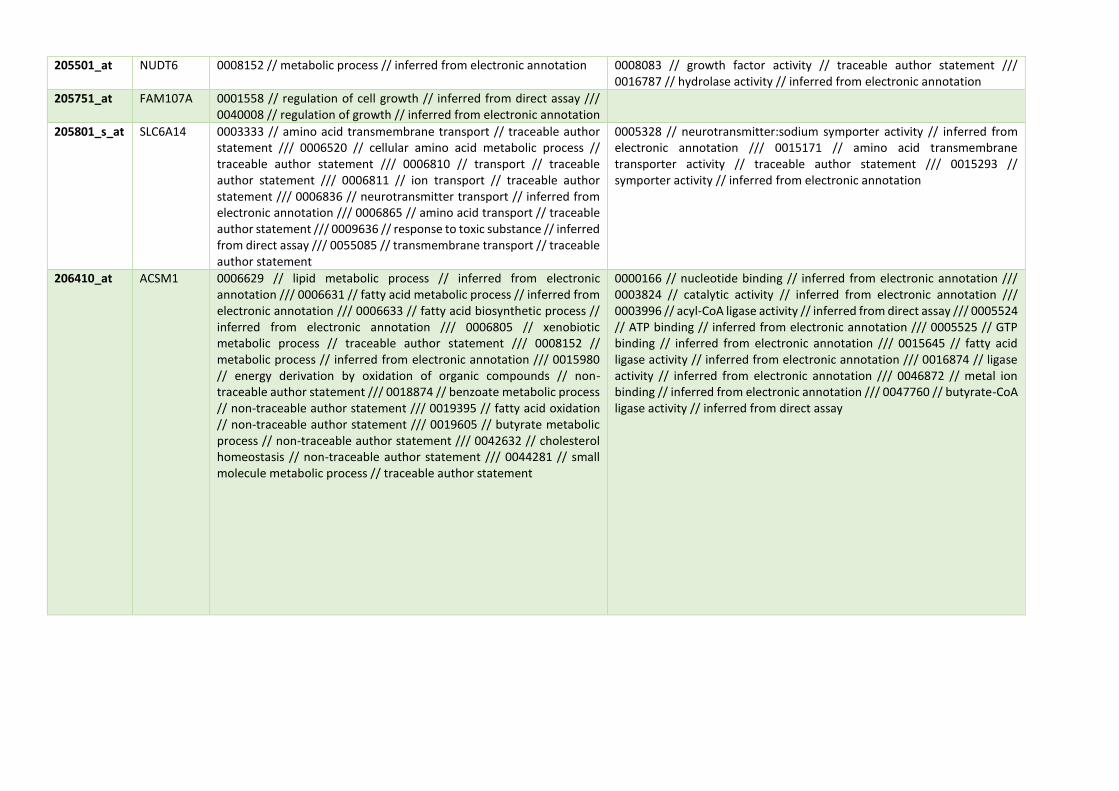
205501_at NUDT6 0008152 // metabolic process // inferred from electronic annotation 0008083 // growth factor activity // traceable author statement /// 0016787 // hydrolase activity // inferred from electronic annotation
205751_at FAM107A 0001558 // regulation of cell growth // inferred from direct assay /// 0040008 // regulation of growth // inferred from electronic annotation
205801_s_at SLC6A14 0003333 // amino acid transmembrane transport // traceable author statement /// 0006520 // cellular amino acid metabolic process // traceable author statement /// 0006810 // transport // traceable author statement /// 0006811 // ion transport // traceable author statement /// 0006836 // neurotransmitter transport // inferred from electronic annotation /// 0006865 // amino acid transport // traceable author statement /// 0009636 // response to toxic substance // inferred from direct assay /// 0055085 // transmembrane transport // traceable author statement
0005328 // neurotransmitter:sodium symporter activity // inferred from electronic annotation /// 0015171 // amino acid transmembrane transporter activity // traceable author statement /// 0015293 // symporter activity // inferred from electronic annotation
206410_at ACSM1 0006629 // lipid metabolic process // inferred from electronic annotation /// 0006631 // fatty acid metabolic process // inferred from electronic annotation /// 0006633 // fatty acid biosynthetic process // inferred from electronic annotation /// 0006805 // xenobiotic metabolic process // traceable author statement /// 0008152 // metabolic process // inferred from electronic annotation /// 0015980 // energy derivation by oxidation of organic compounds // non-traceable author statement /// 0018874 // benzoate metabolic process // non-traceable author statement /// 0019395 // fatty acid oxidation // non-traceable author statement /// 0019605 // butyrate metabolic process // non-traceable author statement /// 0042632 // cholesterol homeostasis // non-traceable author statement /// 0044281 // small molecule metabolic process // traceable author statement
0000166 // nucleotide binding // inferred from electronic annotation /// 0003824 // catalytic activity // inferred from electronic annotation /// 0003996 // acyl-CoA ligase activity // inferred from direct assay /// 0005524 // ATP binding // inferred from electronic annotation /// 0005525 // GTP binding // inferred from electronic annotation /// 0015645 // fatty acid ligase activity // inferred from electronic annotation /// 0016874 // ligase activity // inferred from electronic annotation /// 0046872 // metal ion binding // inferred from electronic annotation /// 0047760 // butyrate-CoA ligase activity // inferred from direct assay

207134_x_at CXADR 0007005 // mitochondrion organization // inferred from sequence or structural similarity /// 0007155 // cell adhesion // inferred from electronic annotation /// 0007157 // heterophilic cell-cell adhesion // inferred from direct assay /// 0007507 // heart development // inferred from sequence or structural similarity /// 0007596 // blood coagulation // traceable author statement /// 0008354 // germ cell migration // inferred from sequence or structural similarity /// 0009615 // response to virus // inferred from electronic annotation /// 0010669 // epithelial structure maintenance // inferred from mutant phenotype /// 0016032 // viral process // inferred from electronic annotation /// 0016337 // single organismal cell-cell adhesion // inferred from electronic annotation /// 0019048 // modulation by virus of host morphology or physiology // inferred from electronic annotation /// 0030593 // neutrophil chemotaxis // inferred from mutant phenotype /// 0031532 // actin cytoskeleton reorganization // inferred from direct assay /// 0034109 // homotypic cell-cell adhesion // inferred from direct assay /// 0045216 // cell-cell junction organization // inferred from sequence or structural similarity /// 0046629 // gamma-delta T cell activation // inferred from sequence or structural similarity /// 0048739 // cardiac muscle fiber development // inferred from sequence or structural similarity /// 0050776 // regulation of immune response // traceable author statement /// 0050900 // leukocyte migration // traceable author statement /// 0051607 // defense response to virus // inferred from direct assay /// 0060044 // negative regulation of cardiac muscle cell proliferation // inferred from electronic annotation /// 0070633 // transepithelial transport // inferred from mutant phenotype /// 0086067 // AV node cell to bundle of His cell communication // inferred from sequence or structural similarity
0001618 // virus receptor activity // inferred from electronic annotation /// 0005102 // receptor binding // inferred from physical interaction /// 0005178 // integrin binding // inferred from physical interaction /// 0005515 // protein binding // inferred from physical interaction /// 0008013 // beta-catenin binding // inferred from physical interaction /// 0030165 // PDZ domain binding // inferred from physical interaction /// 0042802 // identical protein binding // inferred from direct assay /// 0050839 // cell adhesion molecule binding // inferred from physical interaction /// 0071253 // connexin binding // inferred from sequence or structural similarity
209035_at COCH 0007605 // sensory perception of sound // inferred from electronic annotation /// 0008360 // regulation of cell shape // inferred from mutant phenotype
0005515 // protein binding // inferred from physical interaction
209074_s_at FAH 0006527 // arginine catabolic process // inferred from electronic annotation /// 0006559 // L-phenylalanine catabolic process // inferred from electronic annotation /// 0006559 // L-phenylalanine catabolic process // traceable author statement /// 0006572 // tyrosine catabolic process // inferred from electronic annotation /// 0008152 // metabolic process // inferred from electronic annotation /// 0009072 // aromatic amino acid family metabolic process // inferred from electronic annotation /// 0034641 // cellular nitrogen compound metabolic
0003824 // catalytic activity // inferred from electronic annotation /// 0004334 // fumarylacetoacetase activity // not recorded /// 0016787 // hydrolase activity // inferred from electronic annotation /// 0046872 // metal ion binding // inferred from electronic annotation

process // traceable author statement /// 0044281 // small molecule metabolic process // traceable author statement
209540_at FAT1 0007015 // actin filament organization // inferred from sequence or structural similarity /// 0007155 // cell adhesion // traceable author statement /// 0007156 // homophilic cell adhesion // inferred from electronic annotation /// 0007163 // establishment or maintenance of cell polarity // inferred from sequence or structural similarity /// 0007267 // cell-cell signaling // traceable author statement /// 0009653 // anatomical structure morphogenesis // traceable author statement /// 0016337 // single organismal cell-cell adhesion // inferred from sequence or structural similarity /// 0016477 // cell migration // inferred from sequence or structural similarity
0005509 // calcium ion binding // inferred from electronic annotation /// 0005515 // protein binding // inferred from physical interaction

209772_s_at FOLH1B 0006508 // proteolysis // inferred from electronic annotation /// 0008152 // metabolic process // inferred from electronic annotation
0003824 // catalytic activity // inferred from electronic annotation /// 0008233 // peptidase activity // inferred from electronic annotation /// 0008237 // metallopeptidase activity // inferred from electronic annotation /// 0016787 // hydrolase activity // inferred from electronic annotation /// 0016805 // dipeptidase activity // inferred from electronic annotation /// 0046872 // metal ion binding // inferred from electronic annotation
210102_at UNC5B 0006915 // apoptotic process // traceable author statement /// 0007165 // signal transduction // inferred from electronic annotation /// 0007275 // multicellular organismal development // inferred from electronic annotation /// 0007411 // axon guidance // traceable author statement /// 0014068 // positive regulation of phosphatidylinositol 3-kinase signaling // inferred from mutant phenotype /// 0033564 // anterior/posterior axon guidance // inferred from electronic annotation /// 0042981 // regulation of apoptotic process // traceable author statement /// 0043065 // positive regulation of apoptotic process // traceable author statement /// 0043524 // negative regulation of neuron apoptotic process // inferred from mutant phenotype /// 2001240 // negative regulation of extrinsic apoptotic signaling pathway in absence of ligand // inferred from mutant phenotype
0005515 // protein binding // inferred from physical interaction
212583_at ATP11A 0006812 // cation transport // inferred from electronic annotation /// 0008152 // metabolic process // inferred from electronic annotation /// 0045332 // phospholipid translocation // non-traceable author statement
0000287 // magnesium ion binding // inferred from electronic annotation /// 0004012 // phospholipid-translocating ATPase activity // inferred from electronic annotation /// 0005515 // protein binding // inferred from physical interaction /// 0005524 // ATP binding // inferred from electronic annotation /// 0019829 // cation-transporting ATPase activity // inferred from electronic annotation
212841_s_at RASGRP3 0000165 // MAPK cascade // non-traceable author statement /// 0007264 // small GTPase mediated signal transduction // traceable author statement /// 0007265 // Ras protein signal transduction // inferred from electronic annotation /// 0032320 // positive regulation of Ras GTPase activity // inferred from electronic annotation /// 0032854 // positive regulation of Rap GTPase activity // inferred from direct assay /// 0035556 // intracellular signal transduction // inferred from electronic annotation /// 0043087 // regulation of GTPase activity // inferred from electronic annotation /// 0043547 // positive regulation of GTPase activity // inferred from electronic annotation /// 0043547 // positive regulation of GTPase activity // traceable author statement /// 0051056 // regulation of small GTPase mediated signal transduction // inferred from electronic annotation
0004871 // signal transducer activity // traceable author statement /// 0005085 // guanyl-nucleotide exchange factor activity // traceable author statement /// 0005088 // Ras guanyl-nucleotide exchange factor activity // inferred from electronic annotation /// 0005509 // calcium ion binding // non-traceable author statement /// 0017016 // Ras GTPase binding // inferred from electronic annotation /// 0019900 // kinase binding // inferred from electronic annotation /// 0019992 // diacylglycerol binding // non-traceable author statement /// 0046582 // Rap GTPase activator activity // inferred from direct assay /// 0046872 // metal ion binding // inferred from electronic annotation
213134_x_at BACE2 0006508 // proteolysis // non-traceable author statement /// 0006509 // membrane protein ectodomain proteolysis // inferred from direct assay /// 0016486 // peptide hormone processing // non-traceable author statement /// 0042985 // negative regulation of amyloid precursor protein biosynthetic process // inferred from mutant phenotype
0004190 // aspartic-type endopeptidase activity // inferred from direct assay /// 0008233 // peptidase activity // inferred from electronic annotation /// 0016787 // hydrolase activity // inferred from electronic annotation
213582_at MYOF 0001778 // plasma membrane repair // inferred from sequence or structural similarity /// 0006936 // muscle contraction // traceable author statement /// 0008015 // blood circulation // traceable author statement /// 0030947 // regulation of vascular endothelial growth factor receptor signaling pathway // inferred from electronic annotation /// 0034605 // cellular response to heat // inferred from electronic annotation
0005515 // protein binding // inferred from physical interaction /// 0005543 // phospholipid binding // inferred from direct assay /// 0005543 // phospholipid binding // inferred from sequence or structural similarity
213611_at CXCL1 0006935 // chemotaxis // traceable author statement /// 0006954 // inflammatory response // inferred from electronic annotation /// 0006955 // immune response // inferred from electronic annotation /// 0007165 // signal transduction // traceable author statement /// 0007186 // G-protein coupled receptor signaling pathway // traceable author statement /// 0007399 // nervous system development // traceable author statement /// 0008283 // cell proliferation // traceable author statement /// 0008285 // negative regulation of cell proliferation // traceable author statement /// 0030036 // actin cytoskeleton organization // traceable author statement /// 0035556 // intracellular signal transduction // traceable author statement /// 0043085 // positive regulation of catalytic activity // traceable author statement /// 0060326 // cell chemotaxis // inferred from electronic annotation /// 0060326 // cell chemotaxis // traceable author statement
0005102 // receptor binding // traceable author statement /// 0005125 // cytokine activity // inferred from electronic annotation /// 0008009 // chemokine activity // inferred from electronic annotation /// 0008047 // enzyme activator activity // traceable author statement /// 0008083 // growth factor activity // inferred from electronic annotation

214524_at IGF1 0001501 // skeletal system development // traceable author statement /// 0001775 // cell activation // inferred from direct assay /// 0001932 // regulation of protein phosphorylation // inferred from electronic annotation /// 0001974 // blood vessel remodeling // inferred from electronic annotation /// 0002576 // platelet degranulation // traceable author statement /// 0006260 // DNA replication // traceable author statement /// 0006928 // cellular component movement // traceable author statement /// 0007165 // signal transduction // traceable author statement /// 0007265 // Ras protein signal transduction // traceable author statement /// 0007399 // nervous system development // inferred from electronic annotation /// 0007517 // muscle organ development // traceable author statement /// 0007596 // blood coagulation // traceable author statement /// 0008284 // positive regulation of cell proliferation // inferred from direct assay /// 0008285 // negative regulation of cell proliferation // inferred from electronic annotation /// 0009441 // glycolate metabolic process // traceable author statement /// 0010001 // glial cell differentiation // inferred from electronic annotation /// 0010613 // positive regulation of cardiac muscle hypertrophy // inferred from direct assay /// 0014068 // positive regulation of phosphatidylinositol 3-kinase signaling // inferred from direct assay /// 0014834 // satellite cell maintenance involved in skeletal muscle regeneration // inferred from direct assay /// 0014896 // muscle hypertrophy // inferred from mutant phenotype /// 0014904 // myotube cell development // inferred from direct assay /// 0014911 // positive regulation of smooth muscle cell migration // inferred from direct assay /// 0021940 // positive regulation of cerebellar granule cell precursor proliferation // inferred from electronic annotation /// 0030104 // water homeostasis // inferred from electronic annotation /// 0030166 // proteoglycan biosynthetic process // inferred from direct assay /// 0030168 // platelet activation // traceable author statement /// 0030324 // lung development // inferred from electronic annotation /// 0030879 // mammary gland development // inferred from electronic annotation /// 0031017 // exocrine pancreas development // inferred from electronic annotation /// 0032878 // regulation of establishment or maintenance of cell polarity // inferred from electronic annotation /// 0033160 // positive regulation of protein import into nucleus, translocation // inferred from direct assay /// 0034392 // negative regulation of smooth muscle cell apoptotic process // inferred from direct assay /// 0035264 // multicellular organism
0005158 // insulin receptor binding // inferred from physical interaction /// 0005159 // insulin-like growth factor receptor binding // inferred from physical interaction /// 0005178 // integrin binding // inferred from direct assay /// 0005179 // hormone activity // inferred from direct assay /// 0005515 // protein binding // inferred from physical interaction /// 0008083 // growth factor activity // inferred from electronic annotation
growth // inferred from electronic annotation /// 0035630 // bone mineralization involved in bone maturation // inferred from direct assay /// 0040014 // regulation of multicellular organism growth // inferred from expression pattern /// 0042104 // positive regulation of activated T cell proliferation // inferred from direct assay /// 0042523 // positive regulation of tyrosine phosphorylation of Stat5 protein // inferred from direct assay /// 0043066 // negative regulation of apoptotic process // inferred from electronic annotation /// 0043388 // positive regulation of DNA binding // inferred from direct assay /// 0043410 // positive regulation of MAPK cascade // inferred from direct assay /// 0043568 // positive regulation of insulin-like growth factor receptor signaling pathway // inferred from direct assay /// 0044267 // cellular protein metabolic process // traceable author statement /// 0045445 // myoblast differentiation // inferred from direct assay /// 0045669 // positive regulation of osteoblast differentiation // inferred from direct assay /// 0045725 // positive regulation of glycogen biosynthetic process // inferred from direct assay /// 0045740 // positive regulation of DNA replication // inferred from direct assay /// 0045740 // positive regulation of DNA replication // inferred from sequence or structural similarity /// 0045821 // positive regulation of glycolytic process // inferred from direct assay /// 0045840 // positive regulation of mitosis // inferred from direct assay /// 0045893 // positive regulation of transcription, DNA-templated // inferred from direct assay /// 0045944 // positive regulation of transcription from RNA polymerase II promoter // inferred from direct assay /// 0046326 // positive regulation of glucose import // inferred from direct assay /// 0046579 // positive regulation of Ras protein signal transduction // inferred from direct assay /// 0048009 // insulin-like growth factor receptor signaling pathway // inferred from electronic annotation /// 0048015 // phosphatidylinositol-mediated signaling // inferred from direct assay /// 0048146 // positive regulation of fibroblast proliferation // inferred from direct assay /// 0048286 // lung alveolus development // inferred from electronic annotation /// 0048468 // cell development // inferred from electronic annotation /// 0048661 // positive regulation of smooth muscle cell proliferation // inferred from direct assay /// 0048754 // branching morphogenesis of an epithelial tube // inferred from electronic annotation /// 0048839 // inner ear development // inferred from electronic annotation /// 0050650 // chondroitin sulfate proteoglycan biosynthetic process // inferred from electronic
annotation /// 0050679 // positive regulation of epithelial cell proliferation // inferred from direct assay /// 0050731 // positive regulation of peptidyl-tyrosine phosphorylation // inferred from direct assay /// 0051246 // regulation of protein metabolic process // inferred from electronic annotation /// 0051450 // myoblast proliferation // inferred from direct assay /// 0051897 // positive regulation of protein kinase B signaling // inferred from electronic annotation /// 0060426 // lung vasculature development // inferred from electronic annotation /// 0060463 // lung lobe morphogenesis // inferred from electronic annotation /// 0060509 // Type I pneumocyte differentiation // inferred from electronic annotation /// 0060510 // Type II pneumocyte differentiation // inferred from electronic annotation /// 0060527 // prostate epithelial cord arborization involved in prostate glandular acinus morphogenesis // inferred from electronic annotation /// 0060736 // prostate gland growth // inferred from electronic annotation /// 0060740 // prostate gland epithelium morphogenesis // inferred from electronic annotation /// 0060741 // prostate gland stromal morphogenesis // inferred from electronic annotation /// 0060766 // negative regulation of androgen receptor signaling pathway // inferred from electronic annotation /// 0070373 // negative regulation of ERK1 and ERK2 cascade // inferred from electronic annotation /// 0070886 // positive regulation of calcineurin-NFAT signaling cascade // inferred from direct assay /// 0090201 // negative regulation of release of cytochrome c from mitochondria // inferred from sequence or structural similarity /// 0097192 // extrinsic apoptotic signaling pathway in absence of ligand // inferred from electronic annotation /// 2000288 // positive regulation of myoblast proliferation // inferred from electronic annotation /// 2001237 // negative regulation of extrinsic apoptotic signaling pathway // inferred from direct assay
215432_at ITGB4 0006914 // autophagy // inferred from mutant phenotype /// 0007154 // cell communication // inferred from electronic annotation /// 0007155 // cell adhesion // non-traceable author statement /// 0007160 // cell-matrix adhesion // inferred from electronic annotation /// 0007229 // integrin-mediated signaling pathway // inferred from electronic annotation /// 0007275 // multicellular organismal development // inferred from electronic annotation /// 0009611 // response to wounding // inferred from direct assay /// 0030198 // extracellular matrix organization // traceable author statement /// 0031581 // hemidesmosome assembly // inferred from direct assay /// 0031581 // hemidesmosome assembly // traceable author statement /// 0034329 // cell junction assembly // traceable author statement /// 0046847 // filopodium assembly // inferred from electronic annotation /// 0048870 // cell motility // inferred from mutant phenotype
0001664 // G-protein coupled receptor binding // inferred from physical interaction /// 0004872 // receptor activity // inferred from electronic annotation /// 0005515 // protein binding // inferred from physical interaction
215704_at IVD 0006552 // leucine catabolic process // inferred from electronic annotation /// 0006552 // leucine catabolic process // inferred from sequence or structural similarity /// 0008152 // metabolic process // inferred from electronic annotation /// 0009083 // branched-chain amino acid catabolic process // traceable author statement /// 0034641 // cellular nitrogen compound metabolic process // traceable author statement /// 0044281 // small molecule metabolic process // traceable author statement /// 0055114 // oxidation-reduction process // inferred from electronic annotation
0003995 // acyl-CoA dehydrogenase activity // inferred from electronic annotation /// 0008470 // isovaleryl-CoA dehydrogenase activity // not recorded /// 0008470 // isovaleryl-CoA dehydrogenase activity // inferred from sequence or structural similarity /// 0016491 // oxidoreductase activity // inferred from electronic annotation /// 0016627 // oxidoreductase activity, acting on the CH-CH group of donors // inferred from electronic annotation /// 0050660 // flavin adenine dinucleotide binding // inferred from electronic annotation
216958_s_at KCNN4 0002376 // immune system process // inferred from electronic annotation /// 0006810 // transport // inferred from electronic annotation /// 0006811 // ion transport // inferred from electronic annotation /// 0006813 // potassium ion transport // traceable author statement /// 0006816 // calcium ion transport // inferred from direct assay /// 0006820 // anion transport // inferred from electronic annotation /// 0006884 // cell volume homeostasis // inferred from electronic annotation /// 0006952 // defense response // traceable author statement /// 0007268 // synaptic transmission // traceable author statement /// 0030322 // stabilization of membrane potential // inferred from direct assay /// 0045332 // phospholipid translocation // inferred from electronic annotation /// 0046541 // saliva secretion // inferred from electronic annotation /// 0050714 // positive regulation of protein secretion // inferred from electronic annotation /// 0050862 // positive regulation of T cell receptor signaling pathway // inferred
0005267 // potassium channel activity // inferred from electronic annotation /// 0005515 // protein binding // inferred from physical interaction /// 0005516 // calmodulin binding // not recorded /// 0015269 // calcium-activated potassium channel activity // inferred from direct assay /// 0016286 // small conductance calcium-activated potassium channel activity // not recorded /// 0019903 // protein phosphatase binding // inferred from physical interaction /// 0022894 // Intermediate conductance calcium-activated potassium channel activity // not recorded

from direct assay /// 0071435 // potassium ion export // inferred from electronic annotation /// 0071805 // potassium ion transmembrane transport // not recorded
217297_s_at VWA5A
217640_x_at MDK 0001662 // behavioral fear response // inferred from electronic annotation /// 0007165 // signal transduction // non-traceable author statement /// 0007219 // Notch signaling pathway // traceable author statement /// 0007275 // multicellular organismal development // inferred from electronic annotation /// 0007399 // nervous system development // non-traceable author statement /// 0007614 // short-term memory // inferred from electronic annotation /// 0009611 // response to wounding // inferred from sequence or structural similarity /// 0009725 // response to hormone // inferred from electronic annotation /// 0016477 // cell migration // inferred from electronic annotation /// 0021542 // dentate gyrus development // inferred from electronic annotation /// 0021681 // cerebellar granular layer development // inferred from electronic annotation /// 0021766 // hippocampus development // inferred from electronic annotation /// 0021987 // cerebral cortex development // inferred from electronic annotation /// 0030154 // cell differentiation // non-traceable author statement /// 0030325 // adrenal gland development // inferred from sequence or structural similarity /// 0030421 // defecation // inferred from electronic annotation /// 0042493 // response to drug // inferred from electronic annotation /// 0043524 // negative regulation of neuron apoptotic process // inferred from electronic annotation /// 0045893 // positive regulation of transcription, DNA-templated // inferred from electronic annotation /// 0050795 // regulation of behavior // inferred from electronic annotation /// 0051384 // response to glucocorticoid // inferred from electronic annotation /// 0051781 // positive regulation of cell division // inferred from electronic
0008083 // growth factor activity // non-traceable author statement /// 0008201 // heparin binding // inferred from direct assay
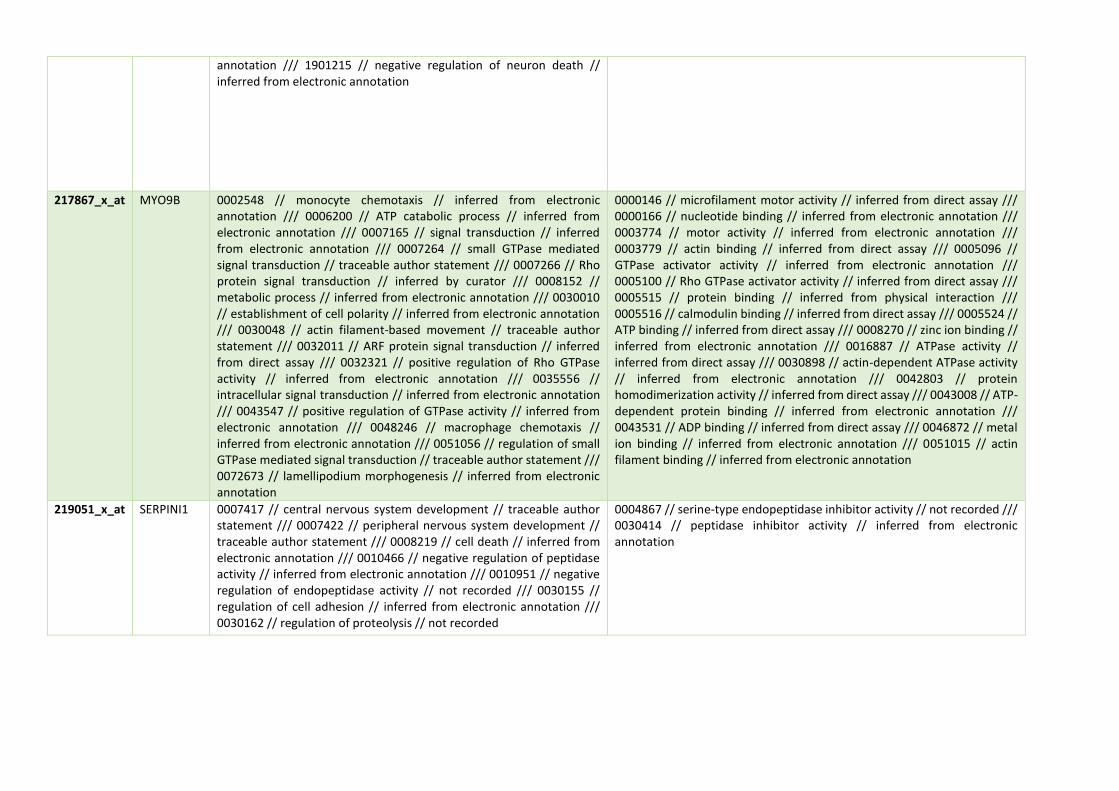
annotation /// 1901215 // negative regulation of neuron death // inferred from electronic annotation
217867_x_at MYO9B 0002548 // monocyte chemotaxis // inferred from electronic annotation /// 0006200 // ATP catabolic process // inferred from electronic annotation /// 0007165 // signal transduction // inferred from electronic annotation /// 0007264 // small GTPase mediated signal transduction // traceable author statement /// 0007266 // Rho protein signal transduction // inferred by curator /// 0008152 // metabolic process // inferred from electronic annotation /// 0030010 // establishment of cell polarity // inferred from electronic annotation /// 0030048 // actin filament-based movement // traceable author statement /// 0032011 // ARF protein signal transduction // inferred from direct assay /// 0032321 // positive regulation of Rho GTPase activity // inferred from electronic annotation /// 0035556 // intracellular signal transduction // inferred from electronic annotation /// 0043547 // positive regulation of GTPase activity // inferred from electronic annotation /// 0048246 // macrophage chemotaxis // inferred from electronic annotation /// 0051056 // regulation of small GTPase mediated signal transduction // traceable author statement /// 0072673 // lamellipodium morphogenesis // inferred from electronic annotation
0000146 // microfilament motor activity // inferred from direct assay /// 0000166 // nucleotide binding // inferred from electronic annotation /// 0003774 // motor activity // inferred from electronic annotation /// 0003779 // actin binding // inferred from direct assay /// 0005096 // GTPase activator activity // inferred from electronic annotation /// 0005100 // Rho GTPase activator activity // inferred from direct assay /// 0005515 // protein binding // inferred from physical interaction /// 0005516 // calmodulin binding // inferred from direct assay /// 0005524 // ATP binding // inferred from direct assay /// 0008270 // zinc ion binding // inferred from electronic annotation /// 0016887 // ATPase activity // inferred from direct assay /// 0030898 // actin-dependent ATPase activity // inferred from electronic annotation /// 0042803 // protein homodimerization activity // inferred from direct assay /// 0043008 // ATP-dependent protein binding // inferred from electronic annotation /// 0043531 // ADP binding // inferred from direct assay /// 0046872 // metal ion binding // inferred from electronic annotation /// 0051015 // actin filament binding // inferred from electronic annotation
219051_x_at SERPINI1 0007417 // central nervous system development // traceable author statement /// 0007422 // peripheral nervous system development // traceable author statement /// 0008219 // cell death // inferred from electronic annotation /// 0010466 // negative regulation of peptidase activity // inferred from electronic annotation /// 0010951 // negative regulation of endopeptidase activity // not recorded /// 0030155 // regulation of cell adhesion // inferred from electronic annotation /// 0030162 // regulation of proteolysis // not recorded
0004867 // serine-type endopeptidase inhibitor activity // not recorded /// 0030414 // peptidase inhibitor activity // inferred from electronic annotation
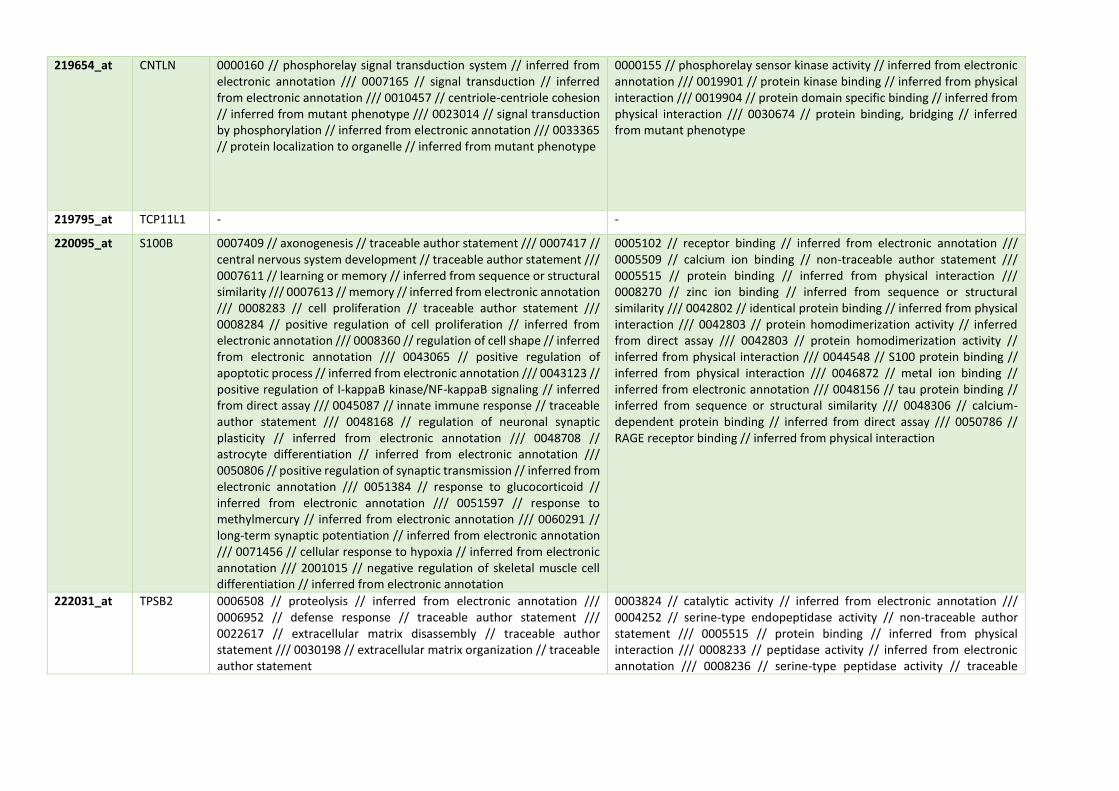
219654_at CNTLN 0000160 // phosphorelay signal transduction system // inferred from electronic annotation /// 0007165 // signal transduction // inferred from electronic annotation /// 0010457 // centriole-centriole cohesion // inferred from mutant phenotype /// 0023014 // signal transduction by phosphorylation // inferred from electronic annotation /// 0033365 // protein localization to organelle // inferred from mutant phenotype
0000155 // phosphorelay sensor kinase activity // inferred from electronic annotation /// 0019901 // protein kinase binding // inferred from physical interaction /// 0019904 // protein domain specific binding // inferred from physical interaction /// 0030674 // protein binding, bridging // inferred from mutant phenotype
219795_at TCP11L1 - -
220095_at S100B 0007409 // axonogenesis // traceable author statement /// 0007417 // central nervous system development // traceable author statement /// 0007611 // learning or memory // inferred from sequence or structural similarity /// 0007613 // memory // inferred from electronic annotation /// 0008283 // cell proliferation // traceable author statement /// 0008284 // positive regulation of cell proliferation // inferred from electronic annotation /// 0008360 // regulation of cell shape // inferred from electronic annotation /// 0043065 // positive regulation of apoptotic process // inferred from electronic annotation /// 0043123 // positive regulation of I-kappaB kinase/NF-kappaB signaling // inferred from direct assay /// 0045087 // innate immune response // traceable author statement /// 0048168 // regulation of neuronal synaptic plasticity // inferred from electronic annotation /// 0048708 // astrocyte differentiation // inferred from electronic annotation /// 0050806 // positive regulation of synaptic transmission // inferred from electronic annotation /// 0051384 // response to glucocorticoid // inferred from electronic annotation /// 0051597 // response to methylmercury // inferred from electronic annotation /// 0060291 // long-term synaptic potentiation // inferred from electronic annotation /// 0071456 // cellular response to hypoxia // inferred from electronic annotation /// 2001015 // negative regulation of skeletal muscle cell differentiation // inferred from electronic annotation
0005102 // receptor binding // inferred from electronic annotation /// 0005509 // calcium ion binding // non-traceable author statement /// 0005515 // protein binding // inferred from physical interaction /// 0008270 // zinc ion binding // inferred from sequence or structural similarity /// 0042802 // identical protein binding // inferred from physical interaction /// 0042803 // protein homodimerization activity // inferred from direct assay /// 0042803 // protein homodimerization activity // inferred from physical interaction /// 0044548 // S100 protein binding // inferred from physical interaction /// 0046872 // metal ion binding // inferred from electronic annotation /// 0048156 // tau protein binding // inferred from sequence or structural similarity /// 0048306 // calcium-dependent protein binding // inferred from direct assay /// 0050786 // RAGE receptor binding // inferred from physical interaction
222031_at TPSB2 0006508 // proteolysis // inferred from electronic annotation /// 0006952 // defense response // traceable author statement /// 0022617 // extracellular matrix disassembly // traceable author statement /// 0030198 // extracellular matrix organization // traceable author statement
0003824 // catalytic activity // inferred from electronic annotation /// 0004252 // serine-type endopeptidase activity // non-traceable author statement /// 0005515 // protein binding // inferred from physical interaction /// 0008233 // peptidase activity // inferred from electronic annotation /// 0008236 // serine-type peptidase activity // traceable
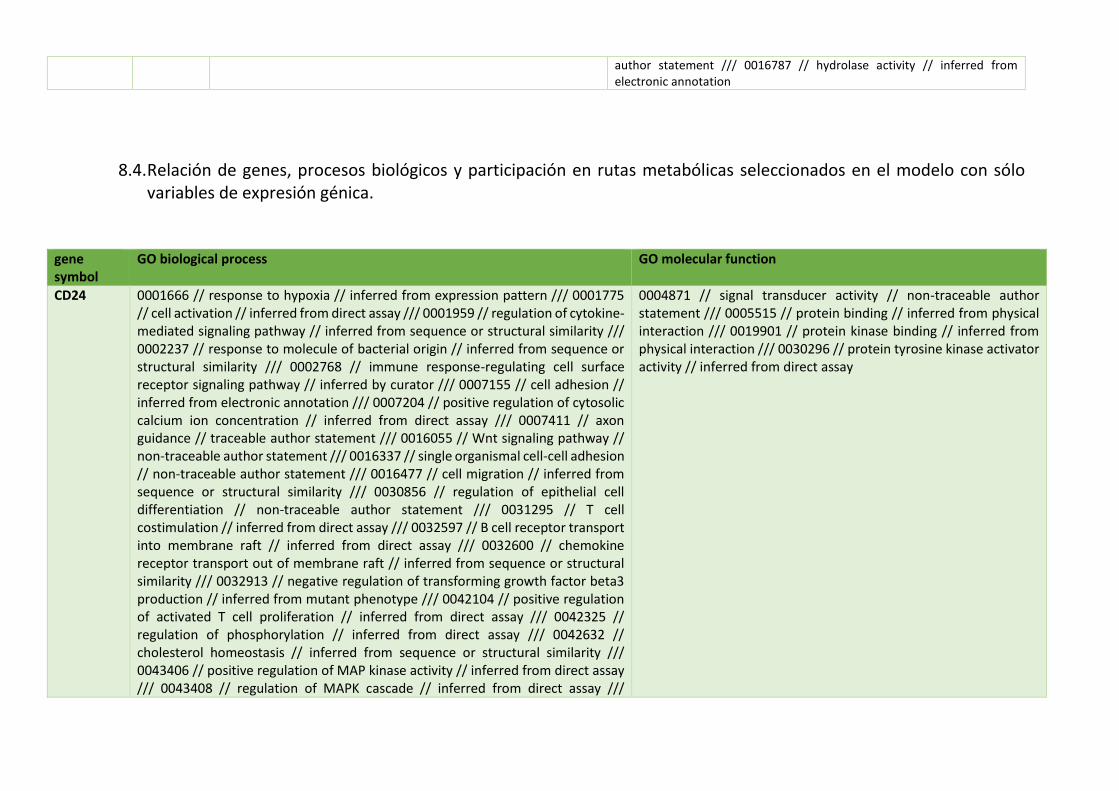
author statement /// 0016787 // hydrolase activity // inferred from electronic annotation
8.4. Relación de genes, procesos biológicos y participación en rutas metabólicas seleccionados en el modelo con sólo variables de expresión génica.
gene symbol
GO biological process GO molecular function
CD24 0001666 // response to hypoxia // inferred from expression pattern /// 0001775 // cell activation // inferred from direct assay /// 0001959 // regulation of cytokine-mediated signaling pathway // inferred from sequence or structural similarity /// 0002237 // response to molecule of bacterial origin // inferred from sequence or structural similarity /// 0002768 // immune response-regulating cell surface receptor signaling pathway // inferred by curator /// 0007155 // cell adhesion // inferred from electronic annotation /// 0007204 // positive regulation of cytosolic calcium ion concentration // inferred from direct assay /// 0007411 // axon guidance // traceable author statement /// 0016055 // Wnt signaling pathway // non-traceable author statement /// 0016337 // single organismal cell-cell adhesion // non-traceable author statement /// 0016477 // cell migration // inferred from sequence or structural similarity /// 0030856 // regulation of epithelial cell differentiation // non-traceable author statement /// 0031295 // T cell costimulation // inferred from direct assay /// 0032597 // B cell receptor transport into membrane raft // inferred from direct assay /// 0032600 // chemokine receptor transport out of membrane raft // inferred from sequence or structural similarity /// 0032913 // negative regulation of transforming growth factor beta3 production // inferred from mutant phenotype /// 0042104 // positive regulation of activated T cell proliferation // inferred from direct assay /// 0042325 // regulation of phosphorylation // inferred from direct assay /// 0042632 // cholesterol homeostasis // inferred from sequence or structural similarity /// 0043406 // positive regulation of MAP kinase activity // inferred from direct assay /// 0043408 // regulation of MAPK cascade // inferred from direct assay ///
0004871 // signal transducer activity // non-traceable author statement /// 0005515 // protein binding // inferred from physical interaction /// 0019901 // protein kinase binding // inferred from physical interaction /// 0030296 // protein tyrosine kinase activator activity // inferred from direct assay
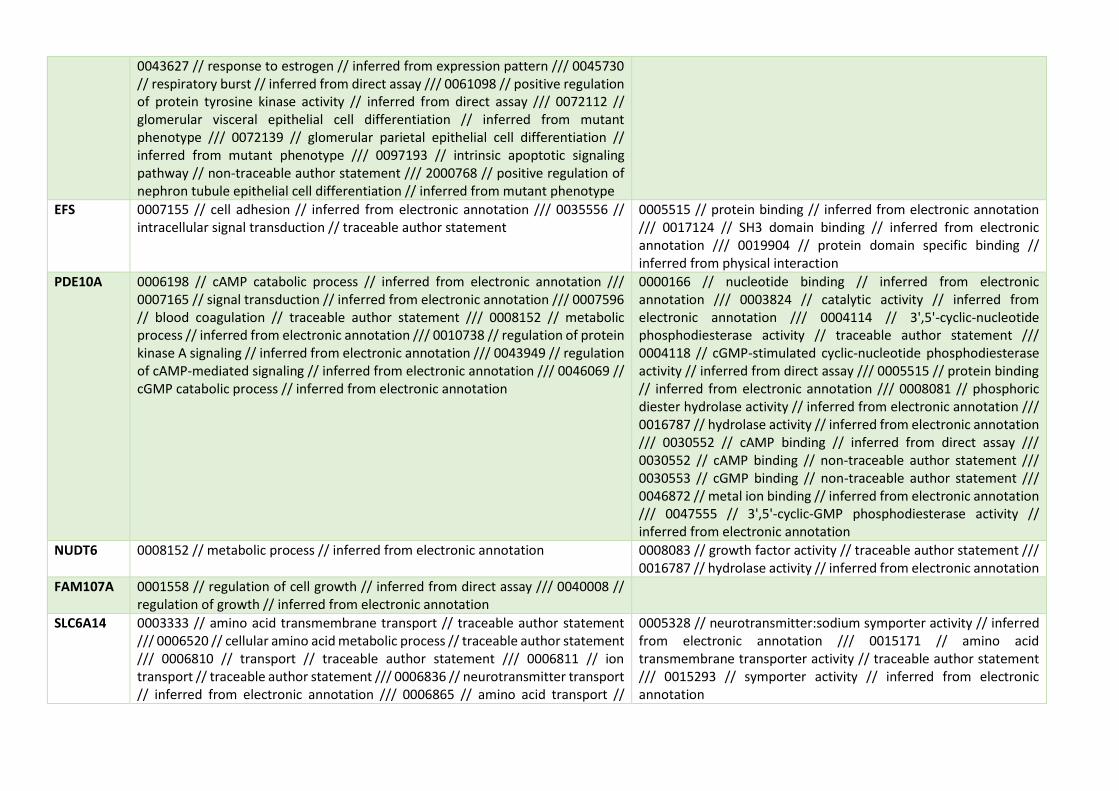
0043627 // response to estrogen // inferred from expression pattern /// 0045730 // respiratory burst // inferred from direct assay /// 0061098 // positive regulation of protein tyrosine kinase activity // inferred from direct assay /// 0072112 // glomerular visceral epithelial cell differentiation // inferred from mutant phenotype /// 0072139 // glomerular parietal epithelial cell differentiation // inferred from mutant phenotype /// 0097193 // intrinsic apoptotic signaling pathway // non-traceable author statement /// 2000768 // positive regulation of nephron tubule epithelial cell differentiation // inferred from mutant phenotype
EFS 0007155 // cell adhesion // inferred from electronic annotation /// 0035556 // intracellular signal transduction // traceable author statement
0005515 // protein binding // inferred from electronic annotation /// 0017124 // SH3 domain binding // inferred from electronic annotation /// 0019904 // protein domain specific binding // inferred from physical interaction
PDE10A 0006198 // cAMP catabolic process // inferred from electronic annotation /// 0007165 // signal transduction // inferred from electronic annotation /// 0007596 // blood coagulation // traceable author statement /// 0008152 // metabolic process // inferred from electronic annotation /// 0010738 // regulation of protein kinase A signaling // inferred from electronic annotation /// 0043949 // regulation of cAMP-mediated signaling // inferred from electronic annotation /// 0046069 // cGMP catabolic process // inferred from electronic annotation
0000166 // nucleotide binding // inferred from electronic annotation /// 0003824 // catalytic activity // inferred from electronic annotation /// 0004114 // 3',5'-cyclic-nucleotide phosphodiesterase activity // traceable author statement /// 0004118 // cGMP-stimulated cyclic-nucleotide phosphodiesterase activity // inferred from direct assay /// 0005515 // protein binding // inferred from electronic annotation /// 0008081 // phosphoric diester hydrolase activity // inferred from electronic annotation /// 0016787 // hydrolase activity // inferred from electronic annotation /// 0030552 // cAMP binding // inferred from direct assay /// 0030552 // cAMP binding // non-traceable author statement /// 0030553 // cGMP binding // non-traceable author statement /// 0046872 // metal ion binding // inferred from electronic annotation /// 0047555 // 3',5'-cyclic-GMP phosphodiesterase activity // inferred from electronic annotation
NUDT6 0008152 // metabolic process // inferred from electronic annotation 0008083 // growth factor activity // traceable author statement /// 0016787 // hydrolase activity // inferred from electronic annotation
FAM107A 0001558 // regulation of cell growth // inferred from direct assay /// 0040008 // regulation of growth // inferred from electronic annotation
SLC6A14 0003333 // amino acid transmembrane transport // traceable author statement /// 0006520 // cellular amino acid metabolic process // traceable author statement /// 0006810 // transport // traceable author statement /// 0006811 // ion transport // traceable author statement /// 0006836 // neurotransmitter transport // inferred from electronic annotation /// 0006865 // amino acid transport //
0005328 // neurotransmitter:sodium symporter activity // inferred from electronic annotation /// 0015171 // amino acid transmembrane transporter activity // traceable author statement /// 0015293 // symporter activity // inferred from electronic annotation
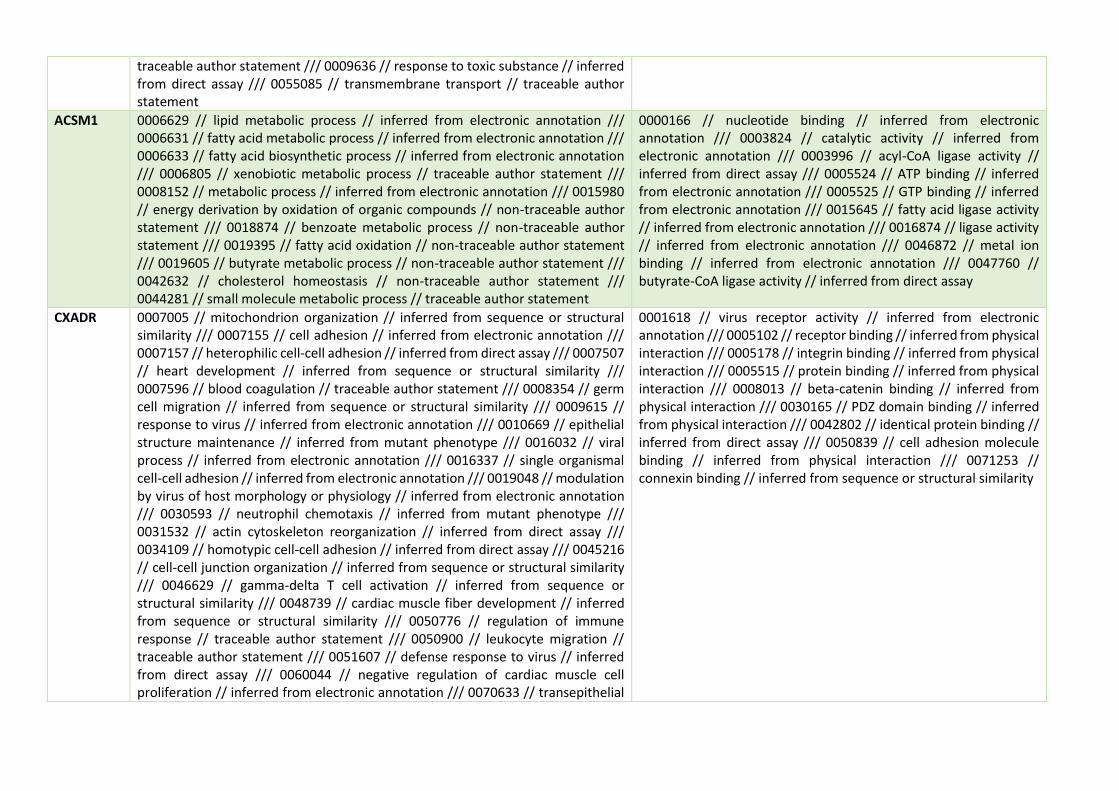
traceable author statement /// 0009636 // response to toxic substance // inferred from direct assay /// 0055085 // transmembrane transport // traceable author statement
ACSM1 0006629 // lipid metabolic process // inferred from electronic annotation /// 0006631 // fatty acid metabolic process // inferred from electronic annotation /// 0006633 // fatty acid biosynthetic process // inferred from electronic annotation /// 0006805 // xenobiotic metabolic process // traceable author statement /// 0008152 // metabolic process // inferred from electronic annotation /// 0015980 // energy derivation by oxidation of organic compounds // non-traceable author statement /// 0018874 // benzoate metabolic process // non-traceable author statement /// 0019395 // fatty acid oxidation // non-traceable author statement /// 0019605 // butyrate metabolic process // non-traceable author statement /// 0042632 // cholesterol homeostasis // non-traceable author statement /// 0044281 // small molecule metabolic process // traceable author statement
0000166 // nucleotide binding // inferred from electronic annotation /// 0003824 // catalytic activity // inferred from electronic annotation /// 0003996 // acyl-CoA ligase activity // inferred from direct assay /// 0005524 // ATP binding // inferred from electronic annotation /// 0005525 // GTP binding // inferred from electronic annotation /// 0015645 // fatty acid ligase activity // inferred from electronic annotation /// 0016874 // ligase activity // inferred from electronic annotation /// 0046872 // metal ion binding // inferred from electronic annotation /// 0047760 // butyrate-CoA ligase activity // inferred from direct assay
CXADR 0007005 // mitochondrion organization // inferred from sequence or structural similarity /// 0007155 // cell adhesion // inferred from electronic annotation /// 0007157 // heterophilic cell-cell adhesion // inferred from direct assay /// 0007507 // heart development // inferred from sequence or structural similarity /// 0007596 // blood coagulation // traceable author statement /// 0008354 // germ cell migration // inferred from sequence or structural similarity /// 0009615 // response to virus // inferred from electronic annotation /// 0010669 // epithelial structure maintenance // inferred from mutant phenotype /// 0016032 // viral process // inferred from electronic annotation /// 0016337 // single organismal cell-cell adhesion // inferred from electronic annotation /// 0019048 // modulation by virus of host morphology or physiology // inferred from electronic annotation /// 0030593 // neutrophil chemotaxis // inferred from mutant phenotype /// 0031532 // actin cytoskeleton reorganization // inferred from direct assay /// 0034109 // homotypic cell-cell adhesion // inferred from direct assay /// 0045216 // cell-cell junction organization // inferred from sequence or structural similarity /// 0046629 // gamma-delta T cell activation // inferred from sequence or structural similarity /// 0048739 // cardiac muscle fiber development // inferred from sequence or structural similarity /// 0050776 // regulation of immune response // traceable author statement /// 0050900 // leukocyte migration // traceable author statement /// 0051607 // defense response to virus // inferred from direct assay /// 0060044 // negative regulation of cardiac muscle cell proliferation // inferred from electronic annotation /// 0070633 // transepithelial
0001618 // virus receptor activity // inferred from electronic annotation /// 0005102 // receptor binding // inferred from physical interaction /// 0005178 // integrin binding // inferred from physical interaction /// 0005515 // protein binding // inferred from physical interaction /// 0008013 // beta-catenin binding // inferred from physical interaction /// 0030165 // PDZ domain binding // inferred from physical interaction /// 0042802 // identical protein binding // inferred from direct assay /// 0050839 // cell adhesion molecule binding // inferred from physical interaction /// 0071253 // connexin binding // inferred from sequence or structural similarity
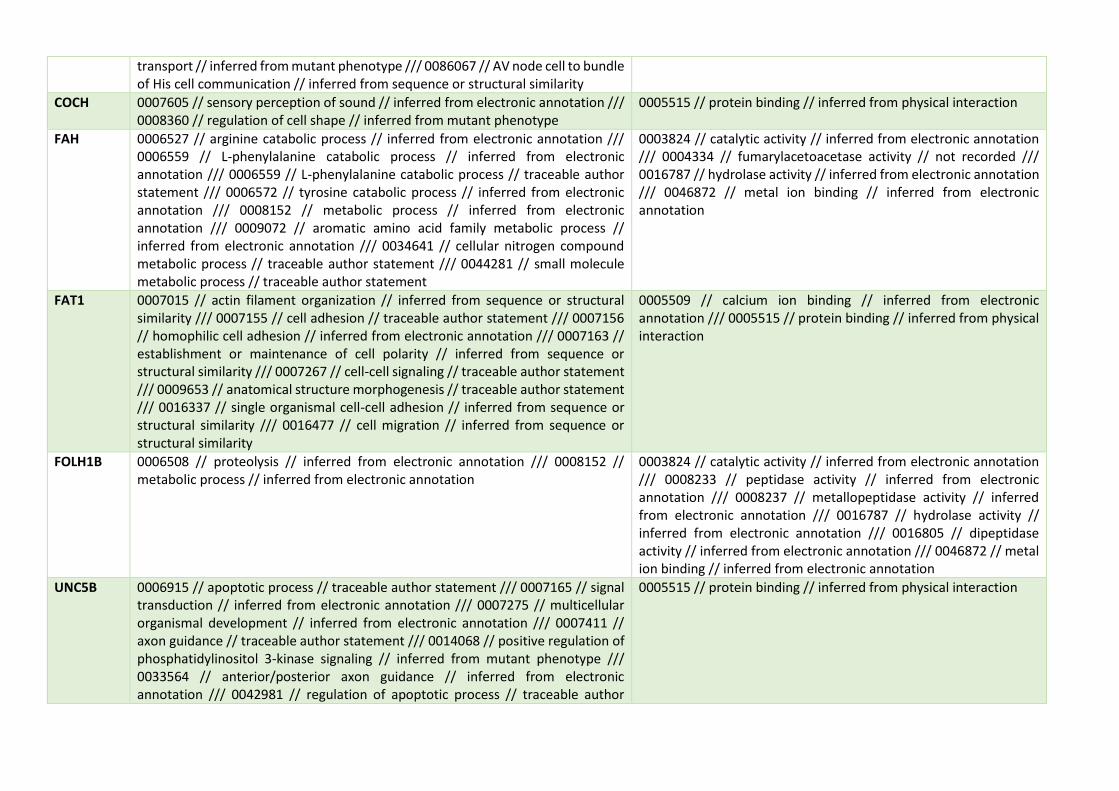
transport // inferred from mutant phenotype /// 0086067 // AV node cell to bundle of His cell communication // inferred from sequence or structural similarity
COCH 0007605 // sensory perception of sound // inferred from electronic annotation /// 0008360 // regulation of cell shape // inferred from mutant phenotype
0005515 // protein binding // inferred from physical interaction
FAH 0006527 // arginine catabolic process // inferred from electronic annotation /// 0006559 // L-phenylalanine catabolic process // inferred from electronic annotation /// 0006559 // L-phenylalanine catabolic process // traceable author statement /// 0006572 // tyrosine catabolic process // inferred from electronic annotation /// 0008152 // metabolic process // inferred from electronic annotation /// 0009072 // aromatic amino acid family metabolic process // inferred from electronic annotation /// 0034641 // cellular nitrogen compound metabolic process // traceable author statement /// 0044281 // small molecule metabolic process // traceable author statement
0003824 // catalytic activity // inferred from electronic annotation /// 0004334 // fumarylacetoacetase activity // not recorded /// 0016787 // hydrolase activity // inferred from electronic annotation /// 0046872 // metal ion binding // inferred from electronic annotation
FAT1 0007015 // actin filament organization // inferred from sequence or structural similarity /// 0007155 // cell adhesion // traceable author statement /// 0007156 // homophilic cell adhesion // inferred from electronic annotation /// 0007163 // establishment or maintenance of cell polarity // inferred from sequence or structural similarity /// 0007267 // cell-cell signaling // traceable author statement /// 0009653 // anatomical structure morphogenesis // traceable author statement /// 0016337 // single organismal cell-cell adhesion // inferred from sequence or structural similarity /// 0016477 // cell migration // inferred from sequence or structural similarity
0005509 // calcium ion binding // inferred from electronic annotation /// 0005515 // protein binding // inferred from physical interaction
FOLH1B 0006508 // proteolysis // inferred from electronic annotation /// 0008152 // metabolic process // inferred from electronic annotation
0003824 // catalytic activity // inferred from electronic annotation /// 0008233 // peptidase activity // inferred from electronic annotation /// 0008237 // metallopeptidase activity // inferred from electronic annotation /// 0016787 // hydrolase activity // inferred from electronic annotation /// 0016805 // dipeptidase activity // inferred from electronic annotation /// 0046872 // metal ion binding // inferred from electronic annotation
UNC5B 0006915 // apoptotic process // traceable author statement /// 0007165 // signal transduction // inferred from electronic annotation /// 0007275 // multicellular organismal development // inferred from electronic annotation /// 0007411 // axon guidance // traceable author statement /// 0014068 // positive regulation of phosphatidylinositol 3-kinase signaling // inferred from mutant phenotype /// 0033564 // anterior/posterior axon guidance // inferred from electronic annotation /// 0042981 // regulation of apoptotic process // traceable author
0005515 // protein binding // inferred from physical interaction

statement /// 0043065 // positive regulation of apoptotic process // traceable author statement /// 0043524 // negative regulation of neuron apoptotic process // inferred from mutant phenotype /// 2001240 // negative regulation of extrinsic apoptotic signaling pathway in absence of ligand // inferred from mutant phenotype
ATP11A 0006812 // cation transport // inferred from electronic annotation /// 0008152 // metabolic process // inferred from electronic annotation /// 0045332 // phospholipid translocation // non-traceable author statement
0000287 // magnesium ion binding // inferred from electronic annotation /// 0004012 // phospholipid-translocating ATPase activity // inferred from electronic annotation /// 0005515 // protein binding // inferred from physical interaction /// 0005524 // ATP binding // inferred from electronic annotation /// 0019829 // cation-transporting ATPase activity // inferred from electronic annotation
RASGRP3 0000165 // MAPK cascade // non-traceable author statement /// 0007264 // small GTPase mediated signal transduction // traceable author statement /// 0007265 // Ras protein signal transduction // inferred from electronic annotation /// 0032320 // positive regulation of Ras GTPase activity // inferred from electronic annotation /// 0032854 // positive regulation of Rap GTPase activity // inferred from direct assay /// 0035556 // intracellular signal transduction // inferred from electronic annotation /// 0043087 // regulation of GTPase activity // inferred from electronic annotation /// 0043547 // positive regulation of GTPase activity // inferred from electronic annotation /// 0043547 // positive regulation of GTPase activity // traceable author statement /// 0051056 // regulation of small GTPase mediated signal transduction // inferred from electronic annotation
0004871 // signal transducer activity // traceable author statement /// 0005085 // guanyl-nucleotide exchange factor activity // traceable author statement /// 0005088 // Ras guanyl-nucleotide exchange factor activity // inferred from electronic annotation /// 0005509 // calcium ion binding // non-traceable author statement /// 0017016 // Ras GTPase binding // inferred from electronic annotation /// 0019900 // kinase binding // inferred from electronic annotation /// 0019992 // diacylglycerol binding // non-traceable author statement /// 0046582 // Rap GTPase activator activity // inferred from direct assay /// 0046872 // metal ion binding // inferred from electronic annotation
BACE2 0006508 // proteolysis // non-traceable author statement /// 0006509 // membrane protein ectodomain proteolysis // inferred from direct assay /// 0016486 // peptide hormone processing // non-traceable author statement /// 0042985 // negative regulation of amyloid precursor protein biosynthetic process // inferred from mutant phenotype
0004190 // aspartic-type endopeptidase activity // inferred from direct assay /// 0008233 // peptidase activity // inferred from electronic annotation /// 0016787 // hydrolase activity // inferred from electronic annotation
MYOF 0001778 // plasma membrane repair // inferred from sequence or structural similarity /// 0006936 // muscle contraction // traceable author statement /// 0008015 // blood circulation // traceable author statement /// 0030947 // regulation of vascular endothelial growth factor receptor signaling pathway // inferred from electronic annotation /// 0034605 // cellular response to heat // inferred from electronic annotation
0005515 // protein binding // inferred from physical interaction /// 0005543 // phospholipid binding // inferred from direct assay /// 0005543 // phospholipid binding // inferred from sequence or structural similarity
CXCL1 0006935 // chemotaxis // traceable author statement /// 0006954 // inflammatory response // inferred from electronic annotation /// 0006955 // immune response
0005102 // receptor binding // traceable author statement /// 0005125 // cytokine activity // inferred from electronic annotation
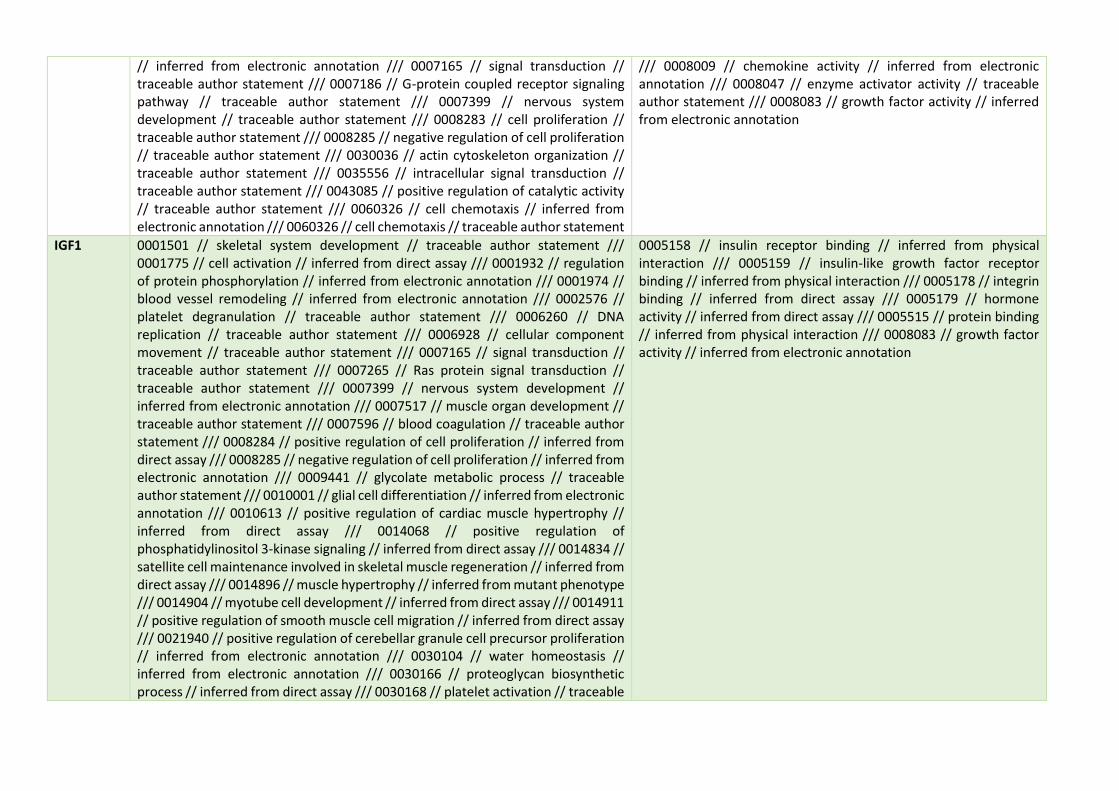
// inferred from electronic annotation /// 0007165 // signal transduction // traceable author statement /// 0007186 // G-protein coupled receptor signaling pathway // traceable author statement /// 0007399 // nervous system development // traceable author statement /// 0008283 // cell proliferation // traceable author statement /// 0008285 // negative regulation of cell proliferation // traceable author statement /// 0030036 // actin cytoskeleton organization // traceable author statement /// 0035556 // intracellular signal transduction // traceable author statement /// 0043085 // positive regulation of catalytic activity // traceable author statement /// 0060326 // cell chemotaxis // inferred from electronic annotation /// 0060326 // cell chemotaxis // traceable author statement
/// 0008009 // chemokine activity // inferred from electronic annotation /// 0008047 // enzyme activator activity // traceable author statement /// 0008083 // growth factor activity // inferred from electronic annotation
IGF1 0001501 // skeletal system development // traceable author statement /// 0001775 // cell activation // inferred from direct assay /// 0001932 // regulation of protein phosphorylation // inferred from electronic annotation /// 0001974 // blood vessel remodeling // inferred from electronic annotation /// 0002576 // platelet degranulation // traceable author statement /// 0006260 // DNA replication // traceable author statement /// 0006928 // cellular component movement // traceable author statement /// 0007165 // signal transduction // traceable author statement /// 0007265 // Ras protein signal transduction // traceable author statement /// 0007399 // nervous system development // inferred from electronic annotation /// 0007517 // muscle organ development // traceable author statement /// 0007596 // blood coagulation // traceable author statement /// 0008284 // positive regulation of cell proliferation // inferred from direct assay /// 0008285 // negative regulation of cell proliferation // inferred from electronic annotation /// 0009441 // glycolate metabolic process // traceable author statement /// 0010001 // glial cell differentiation // inferred from electronic annotation /// 0010613 // positive regulation of cardiac muscle hypertrophy // inferred from direct assay /// 0014068 // positive regulation of phosphatidylinositol 3-kinase signaling // inferred from direct assay /// 0014834 // satellite cell maintenance involved in skeletal muscle regeneration // inferred from direct assay /// 0014896 // muscle hypertrophy // inferred from mutant phenotype /// 0014904 // myotube cell development // inferred from direct assay /// 0014911 // positive regulation of smooth muscle cell migration // inferred from direct assay /// 0021940 // positive regulation of cerebellar granule cell precursor proliferation // inferred from electronic annotation /// 0030104 // water homeostasis // inferred from electronic annotation /// 0030166 // proteoglycan biosynthetic process // inferred from direct assay /// 0030168 // platelet activation // traceable
0005158 // insulin receptor binding // inferred from physical interaction /// 0005159 // insulin-like growth factor receptor binding // inferred from physical interaction /// 0005178 // integrin binding // inferred from direct assay /// 0005179 // hormone activity // inferred from direct assay /// 0005515 // protein binding // inferred from physical interaction /// 0008083 // growth factor activity // inferred from electronic annotation
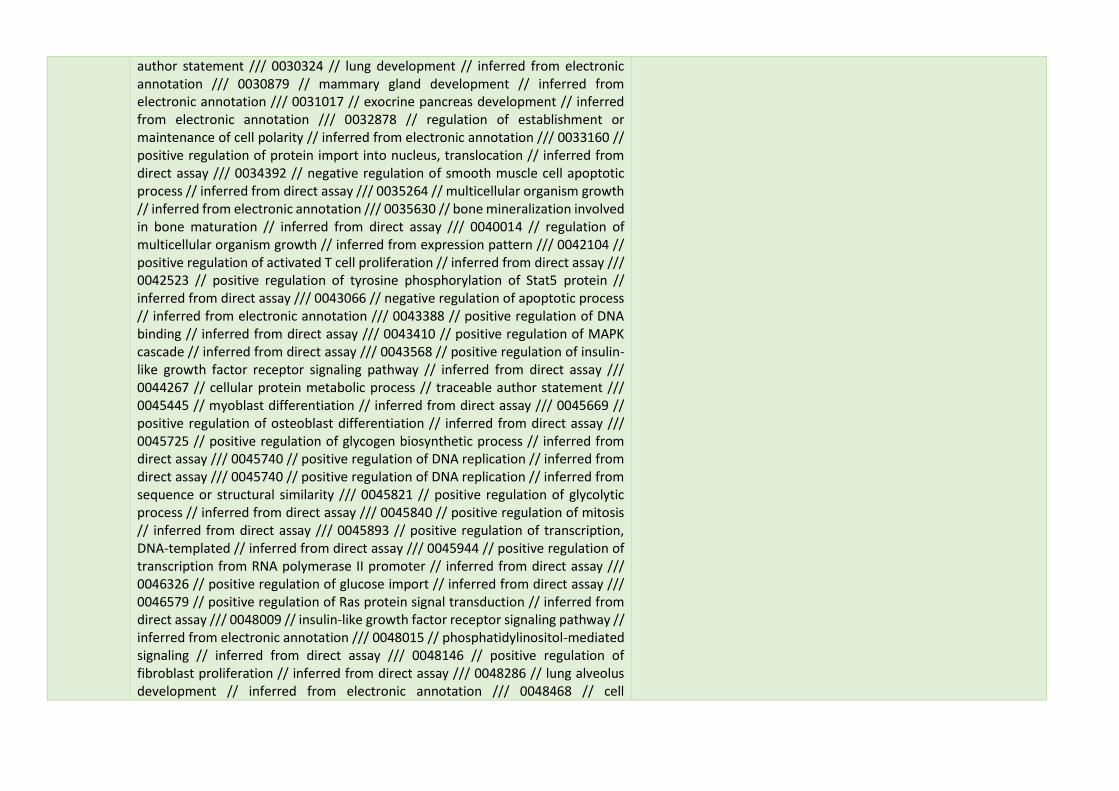
author statement /// 0030324 // lung development // inferred from electronic annotation /// 0030879 // mammary gland development // inferred from electronic annotation /// 0031017 // exocrine pancreas development // inferred from electronic annotation /// 0032878 // regulation of establishment or maintenance of cell polarity // inferred from electronic annotation /// 0033160 // positive regulation of protein import into nucleus, translocation // inferred from direct assay /// 0034392 // negative regulation of smooth muscle cell apoptotic process // inferred from direct assay /// 0035264 // multicellular organism growth // inferred from electronic annotation /// 0035630 // bone mineralization involved in bone maturation // inferred from direct assay /// 0040014 // regulation of multicellular organism growth // inferred from expression pattern /// 0042104 // positive regulation of activated T cell proliferation // inferred from direct assay /// 0042523 // positive regulation of tyrosine phosphorylation of Stat5 protein // inferred from direct assay /// 0043066 // negative regulation of apoptotic process // inferred from electronic annotation /// 0043388 // positive regulation of DNA binding // inferred from direct assay /// 0043410 // positive regulation of MAPK cascade // inferred from direct assay /// 0043568 // positive regulation of insulin-like growth factor receptor signaling pathway // inferred from direct assay /// 0044267 // cellular protein metabolic process // traceable author statement /// 0045445 // myoblast differentiation // inferred from direct assay /// 0045669 // positive regulation of osteoblast differentiation // inferred from direct assay /// 0045725 // positive regulation of glycogen biosynthetic process // inferred from direct assay /// 0045740 // positive regulation of DNA replication // inferred from direct assay /// 0045740 // positive regulation of DNA replication // inferred from sequence or structural similarity /// 0045821 // positive regulation of glycolytic process // inferred from direct assay /// 0045840 // positive regulation of mitosis // inferred from direct assay /// 0045893 // positive regulation of transcription, DNA-templated // inferred from direct assay /// 0045944 // positive regulation of transcription from RNA polymerase II promoter // inferred from direct assay /// 0046326 // positive regulation of glucose import // inferred from direct assay /// 0046579 // positive regulation of Ras protein signal transduction // inferred from direct assay /// 0048009 // insulin-like growth factor receptor signaling pathway // inferred from electronic annotation /// 0048015 // phosphatidylinositol-mediated signaling // inferred from direct assay /// 0048146 // positive regulation of fibroblast proliferation // inferred from direct assay /// 0048286 // lung alveolus development // inferred from electronic annotation /// 0048468 // cell
development // inferred from electronic annotation /// 0048661 // positive regulation of smooth muscle cell proliferation // inferred from direct assay /// 0048754 // branching morphogenesis of an epithelial tube // inferred from electronic annotation /// 0048839 // inner ear development // inferred from electronic annotation /// 0050650 // chondroitin sulfate proteoglycan biosynthetic process // inferred from electronic annotation /// 0050679 // positive regulation of epithelial cell proliferation // inferred from direct assay /// 0050731 // positive regulation of peptidyl-tyrosine phosphorylation // inferred from direct assay /// 0051246 // regulation of protein metabolic process // inferred from electronic annotation /// 0051450 // myoblast proliferation // inferred from direct assay /// 0051897 // positive regulation of protein kinase B signaling // inferred from electronic annotation /// 0060426 // lung vasculature development // inferred from electronic annotation /// 0060463 // lung lobe morphogenesis // inferred from electronic annotation /// 0060509 // Type I pneumocyte differentiation // inferred from electronic annotation /// 0060510 // Type II pneumocyte differentiation // inferred from electronic annotation /// 0060527 // prostate epithelial cord arborization involved in prostate glandular acinus morphogenesis // inferred from electronic annotation /// 0060736 // prostate gland growth // inferred from electronic annotation /// 0060740 // prostate gland epithelium morphogenesis // inferred from electronic annotation /// 0060741 // prostate gland stromal morphogenesis // inferred from electronic annotation /// 0060766 // negative regulation of androgen receptor signaling pathway // inferred from electronic annotation /// 0070373 // negative regulation of ERK1 and ERK2 cascade // inferred from electronic annotation /// 0070886 // positive regulation of calcineurin-NFAT signaling cascade // inferred from direct assay /// 0090201 // negative regulation of release of cytochrome c from mitochondria // inferred from sequence or structural similarity /// 0097192 // extrinsic apoptotic signaling pathway in absence of ligand // inferred from electronic annotation /// 2000288 // positive regulation of myoblast proliferation // inferred from electronic annotation /// 2001237 // negative regulation of extrinsic apoptotic signaling pathway // inferred from direct assay
ITGB4 0006914 // autophagy // inferred from mutant phenotype /// 0007154 // cell communication // inferred from electronic annotation /// 0007155 // cell adhesion // non-traceable author statement /// 0007160 // cell-matrix adhesion // inferred from electronic annotation /// 0007229 // integrin-mediated signaling pathway // inferred from electronic annotation /// 0007275 // multicellular organismal
0001664 // G-protein coupled receptor binding // inferred from physical interaction /// 0004872 // receptor activity // inferred from electronic annotation /// 0005515 // protein binding // inferred from physical interaction
development // inferred from electronic annotation /// 0009611 // response to wounding // inferred from direct assay /// 0030198 // extracellular matrix organization // traceable author statement /// 0031581 // hemidesmosome assembly // inferred from direct assay /// 0031581 // hemidesmosome assembly // traceable author statement /// 0034329 // cell junction assembly // traceable author statement /// 0046847 // filopodium assembly // inferred from electronic annotation /// 0048870 // cell motility // inferred from mutant phenotype
IVD 0006552 // leucine catabolic process // inferred from electronic annotation /// 0006552 // leucine catabolic process // inferred from sequence or structural similarity /// 0008152 // metabolic process // inferred from electronic annotation /// 0009083 // branched-chain amino acid catabolic process // traceable author statement /// 0034641 // cellular nitrogen compound metabolic process // traceable author statement /// 0044281 // small molecule metabolic process // traceable author statement /// 0055114 // oxidation-reduction process // inferred from electronic annotation
0003995 // acyl-CoA dehydrogenase activity // inferred from electronic annotation /// 0008470 // isovaleryl-CoA dehydrogenase activity // not recorded /// 0008470 // isovaleryl-CoA dehydrogenase activity // inferred from sequence or structural similarity /// 0016491 // oxidoreductase activity // inferred from electronic annotation /// 0016627 // oxidoreductase activity, acting on the CH-CH group of donors // inferred from electronic annotation /// 0050660 // flavin adenine dinucleotide binding // inferred from electronic annotation
KCNN4 0002376 // immune system process // inferred from electronic annotation /// 0006810 // transport // inferred from electronic annotation /// 0006811 // ion transport // inferred from electronic annotation /// 0006813 // potassium ion transport // traceable author statement /// 0006816 // calcium ion transport // inferred from direct assay /// 0006820 // anion transport // inferred from electronic annotation /// 0006884 // cell volume homeostasis // inferred from electronic annotation /// 0006952 // defense response // traceable author statement /// 0007268 // synaptic transmission // traceable author statement /// 0030322 // stabilization of membrane potential // inferred from direct assay /// 0045332 // phospholipid translocation // inferred from electronic annotation /// 0046541 // saliva secretion // inferred from electronic annotation /// 0050714 // positive regulation of protein secretion // inferred from electronic annotation /// 0050862 // positive regulation of T cell receptor signaling pathway // inferred from direct assay /// 0071435 // potassium ion export // inferred from electronic annotation /// 0071805 // potassium ion transmembrane transport // not recorded
0005267 // potassium channel activity // inferred from electronic annotation /// 0005515 // protein binding // inferred from physical interaction /// 0005516 // calmodulin binding // not recorded /// 0015269 // calcium-activated potassium channel activity // inferred from direct assay /// 0016286 // small conductance calcium-activated potassium channel activity // not recorded /// 0019903 // protein phosphatase binding // inferred from physical interaction /// 0022894 // Intermediate conductance calcium-activated potassium channel activity // not recorded
LOC389906
VWA5A
MDK 0001662 // behavioral fear response // inferred from electronic annotation /// 0007165 // signal transduction // non-traceable author statement /// 0007219 //
0008083 // growth factor activity // non-traceable author statement /// 0008201 // heparin binding // inferred from direct assay
Notch signaling pathway // traceable author statement /// 0007275 // multicellular organismal development // inferred from electronic annotation /// 0007399 // nervous system development // non-traceable author statement /// 0007614 // short-term memory // inferred from electronic annotation /// 0009611 // response to wounding // inferred from sequence or structural similarity /// 0009725 // response to hormone // inferred from electronic annotation /// 0016477 // cell migration // inferred from electronic annotation /// 0021542 // dentate gyrus development // inferred from electronic annotation /// 0021681 // cerebellar granular layer development // inferred from electronic annotation /// 0021766 // hippocampus development // inferred from electronic annotation /// 0021987 // cerebral cortex development // inferred from electronic annotation /// 0030154 // cell differentiation // non-traceable author statement /// 0030325 // adrenal gland development // inferred from sequence or structural similarity /// 0030421 // defecation // inferred from electronic annotation /// 0042493 // response to drug // inferred from electronic annotation /// 0043524 // negative regulation of neuron apoptotic process // inferred from electronic annotation /// 0045893 // positive regulation of transcription, DNA-templated // inferred from electronic annotation /// 0050795 // regulation of behavior // inferred from electronic annotation /// 0051384 // response to glucocorticoid // inferred from electronic annotation /// 0051781 // positive regulation of cell division // inferred from electronic annotation /// 1901215 // negative regulation of neuron death // inferred from electronic annotation
MYO9B 0002548 // monocyte chemotaxis // inferred from electronic annotation /// 0006200 // ATP catabolic process // inferred from electronic annotation /// 0007165 // signal transduction // inferred from electronic annotation /// 0007264 // small GTPase mediated signal transduction // traceable author statement /// 0007266 // Rho protein signal transduction // inferred by curator /// 0008152 // metabolic process // inferred from electronic annotation /// 0030010 // establishment of cell polarity // inferred from electronic annotation /// 0030048 // actin filament-based movement // traceable author statement /// 0032011 // ARF protein signal transduction // inferred from direct assay /// 0032321 // positive regulation of Rho GTPase activity // inferred from electronic annotation /// 0035556 // intracellular signal transduction // inferred from electronic annotation /// 0043547 // positive regulation of GTPase activity // inferred from electronic annotation /// 0048246 // macrophage chemotaxis // inferred from electronic annotation /// 0051056 // regulation of small GTPase mediated signal transduction
0000146 // microfilament motor activity // inferred from direct assay /// 0000166 // nucleotide binding // inferred from electronic annotation /// 0003774 // motor activity // inferred from electronic annotation /// 0003779 // actin binding // inferred from direct assay /// 0005096 // GTPase activator activity // inferred from electronic annotation /// 0005100 // Rho GTPase activator activity // inferred from direct assay /// 0005515 // protein binding // inferred from physical interaction /// 0005516 // calmodulin binding // inferred from direct assay /// 0005524 // ATP binding // inferred from direct assay /// 0008270 // zinc ion binding // inferred from electronic annotation /// 0016887 // ATPase activity // inferred from direct assay /// 0030898 // actin-dependent ATPase activity // inferred from electronic annotation /// 0042803 // protein homodimerization activity // inferred from direct assay /// 0043008
// traceable author statement /// 0072673 // lamellipodium morphogenesis // inferred from electronic annotation
// ATP-dependent protein binding // inferred from electronic annotation /// 0043531 // ADP binding // inferred from direct assay /// 0046872 // metal ion binding // inferred from electronic annotation /// 0051015 // actin filament binding // inferred from electronic annotation
SERPINI1 0007417 // central nervous system development // traceable author statement /// 0007422 // peripheral nervous system development // traceable author statement /// 0008219 // cell death // inferred from electronic annotation /// 0010466 // negative regulation of peptidase activity // inferred from electronic annotation /// 0010951 // negative regulation of endopeptidase activity // not recorded /// 0030155 // regulation of cell adhesion // inferred from electronic annotation /// 0030162 // regulation of proteolysis // not recorded
0004867 // serine-type endopeptidase inhibitor activity // not recorded /// 0030414 // peptidase inhibitor activity // inferred from electronic annotation
CNTLN 0000160 // phosphorelay signal transduction system // inferred from electronic annotation /// 0007165 // signal transduction // inferred from electronic annotation /// 0010457 // centriole-centriole cohesion // inferred from mutant phenotype /// 0023014 // signal transduction by phosphorylation // inferred from electronic annotation /// 0033365 // protein localization to organelle // inferred from mutant phenotype
0000155 // phosphorelay sensor kinase activity // inferred from electronic annotation /// 0019901 // protein kinase binding // inferred from physical interaction /// 0019904 // protein domain specific binding // inferred from physical interaction /// 0030674 // protein binding, bridging // inferred from mutant phenotype
TCP11L1
S100B 0007409 // axonogenesis // traceable author statement /// 0007417 // central nervous system development // traceable author statement /// 0007611 // learning or memory // inferred from sequence or structural similarity /// 0007613 // memory // inferred from electronic annotation /// 0008283 // cell proliferation // traceable author statement /// 0008284 // positive regulation of cell proliferation // inferred from electronic annotation /// 0008360 // regulation of cell shape // inferred from electronic annotation /// 0043065 // positive regulation of apoptotic process // inferred from electronic annotation /// 0043123 // positive regulation of I-kappaB kinase/NF-kappaB signaling // inferred from direct assay /// 0045087 // innate immune response // traceable author statement /// 0048168 // regulation of neuronal synaptic plasticity // inferred from electronic annotation /// 0048708 // astrocyte differentiation // inferred from electronic annotation /// 0050806 // positive regulation of synaptic transmission // inferred from electronic annotation /// 0051384 // response to glucocorticoid // inferred from electronic annotation /// 0051597 // response to methylmercury // inferred from electronic annotation /// 0060291 // long-term synaptic potentiation // inferred from electronic annotation /// 0071456 // cellular response to hypoxia // inferred from
0005102 // receptor binding // inferred from electronic annotation /// 0005509 // calcium ion binding // non-traceable author statement /// 0005515 // protein binding // inferred from physical interaction /// 0008270 // zinc ion binding // inferred from sequence or structural similarity /// 0042802 // identical protein binding // inferred from physical interaction /// 0042803 // protein homodimerization activity // inferred from direct assay /// 0042803 // protein homodimerization activity // inferred from physical interaction /// 0044548 // S100 protein binding // inferred from physical interaction /// 0046872 // metal ion binding // inferred from electronic annotation /// 0048156 // tau protein binding // inferred from sequence or structural similarity /// 0048306 // calcium-dependent protein binding // inferred from direct assay /// 0050786 // RAGE receptor binding // inferred from physical interaction
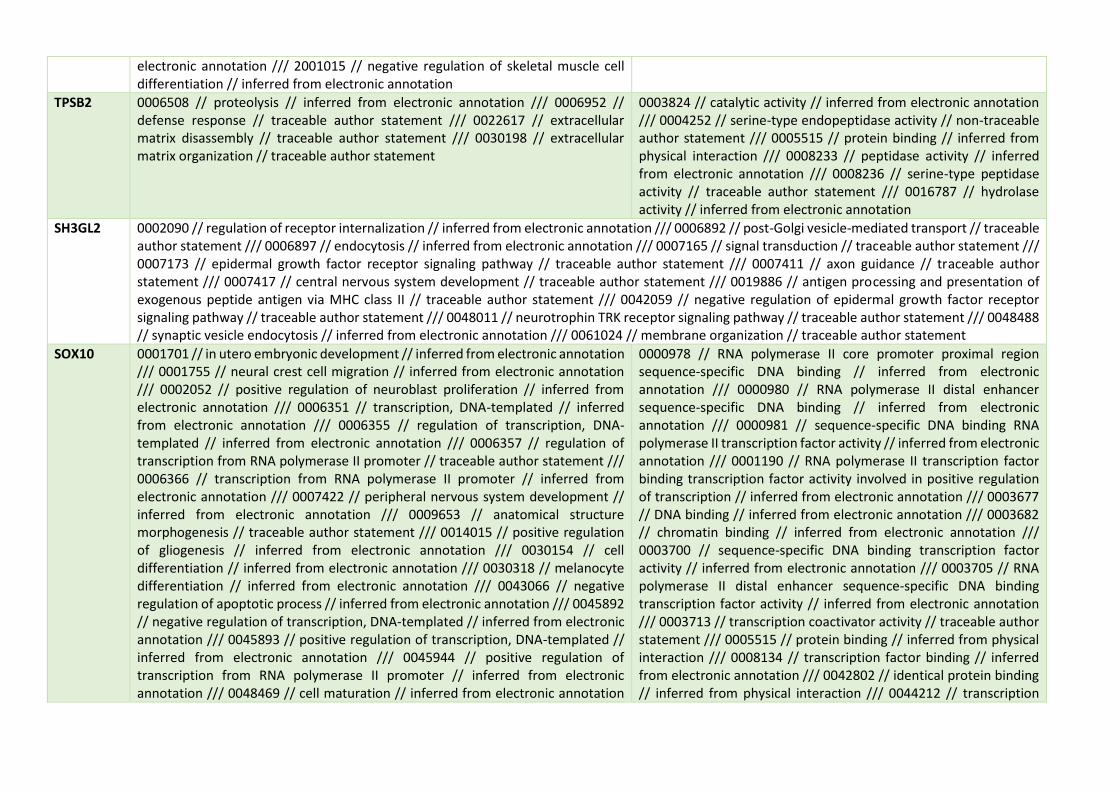
electronic annotation /// 2001015 // negative regulation of skeletal muscle cell differentiation // inferred from electronic annotation
TPSB2 0006508 // proteolysis // inferred from electronic annotation /// 0006952 // defense response // traceable author statement /// 0022617 // extracellular matrix disassembly // traceable author statement /// 0030198 // extracellular matrix organization // traceable author statement
0003824 // catalytic activity // inferred from electronic annotation /// 0004252 // serine-type endopeptidase activity // non-traceable author statement /// 0005515 // protein binding // inferred from physical interaction /// 0008233 // peptidase activity // inferred from electronic annotation /// 0008236 // serine-type peptidase activity // traceable author statement /// 0016787 // hydrolase activity // inferred from electronic annotation
SH3GL2 0002090 // regulation of receptor internalization // inferred from electronic annotation /// 0006892 // post-Golgi vesicle-mediated transport // traceable author statement /// 0006897 // endocytosis // inferred from electronic annotation /// 0007165 // signal transduction // traceable author statement /// 0007173 // epidermal growth factor receptor signaling pathway // traceable author statement /// 0007411 // axon guidance // traceable author statement /// 0007417 // central nervous system development // traceable author statement /// 0019886 // antigen processing and presentation of exogenous peptide antigen via MHC class II // traceable author statement /// 0042059 // negative regulation of epidermal growth factor receptor signaling pathway // traceable author statement /// 0048011 // neurotrophin TRK receptor signaling pathway // traceable author statement /// 0048488 // synaptic vesicle endocytosis // inferred from electronic annotation /// 0061024 // membrane organization // traceable author statement
SOX10 0001701 // in utero embryonic development // inferred from electronic annotation /// 0001755 // neural crest cell migration // inferred from electronic annotation /// 0002052 // positive regulation of neuroblast proliferation // inferred from electronic annotation /// 0006351 // transcription, DNA-templated // inferred from electronic annotation /// 0006355 // regulation of transcription, DNA-templated // inferred from electronic annotation /// 0006357 // regulation of transcription from RNA polymerase II promoter // traceable author statement /// 0006366 // transcription from RNA polymerase II promoter // inferred from electronic annotation /// 0007422 // peripheral nervous system development // inferred from electronic annotation /// 0009653 // anatomical structure morphogenesis // traceable author statement /// 0014015 // positive regulation of gliogenesis // inferred from electronic annotation /// 0030154 // cell differentiation // inferred from electronic annotation /// 0030318 // melanocyte differentiation // inferred from electronic annotation /// 0043066 // negative regulation of apoptotic process // inferred from electronic annotation /// 0045892 // negative regulation of transcription, DNA-templated // inferred from electronic annotation /// 0045893 // positive regulation of transcription, DNA-templated // inferred from electronic annotation /// 0045944 // positive regulation of transcription from RNA polymerase II promoter // inferred from electronic annotation /// 0048469 // cell maturation // inferred from electronic annotation
0000978 // RNA polymerase II core promoter proximal region sequence-specific DNA binding // inferred from electronic annotation /// 0000980 // RNA polymerase II distal enhancer sequence-specific DNA binding // inferred from electronic annotation /// 0000981 // sequence-specific DNA binding RNA polymerase II transcription factor activity // inferred from electronic annotation /// 0001190 // RNA polymerase II transcription factor binding transcription factor activity involved in positive regulation of transcription // inferred from electronic annotation /// 0003677 // DNA binding // inferred from electronic annotation /// 0003682 // chromatin binding // inferred from electronic annotation /// 0003700 // sequence-specific DNA binding transcription factor activity // inferred from electronic annotation /// 0003705 // RNA polymerase II distal enhancer sequence-specific DNA binding transcription factor activity // inferred from electronic annotation /// 0003713 // transcription coactivator activity // traceable author statement /// 0005515 // protein binding // inferred from physical interaction /// 0008134 // transcription factor binding // inferred from electronic annotation /// 0042802 // identical protein binding // inferred from physical interaction /// 0044212 // transcription
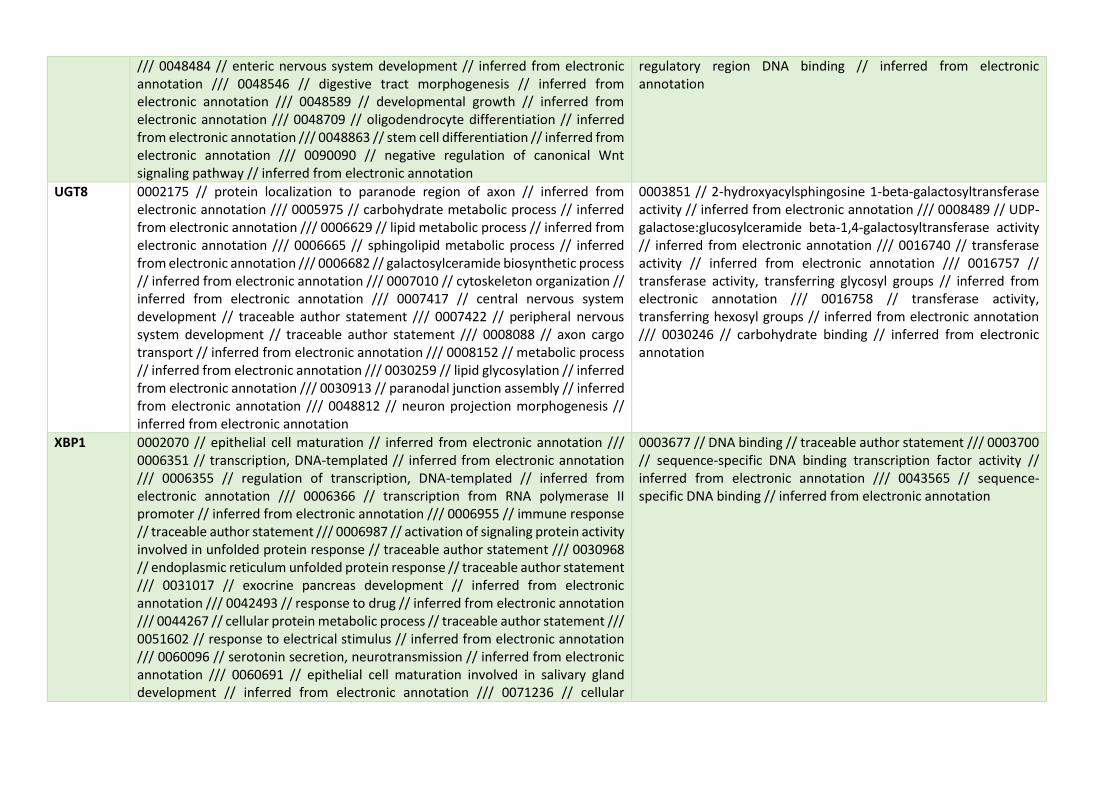
/// 0048484 // enteric nervous system development // inferred from electronic annotation /// 0048546 // digestive tract morphogenesis // inferred from electronic annotation /// 0048589 // developmental growth // inferred from electronic annotation /// 0048709 // oligodendrocyte differentiation // inferred from electronic annotation /// 0048863 // stem cell differentiation // inferred from electronic annotation /// 0090090 // negative regulation of canonical Wnt signaling pathway // inferred from electronic annotation
regulatory region DNA binding // inferred from electronic annotation
UGT8 0002175 // protein localization to paranode region of axon // inferred from electronic annotation /// 0005975 // carbohydrate metabolic process // inferred from electronic annotation /// 0006629 // lipid metabolic process // inferred from electronic annotation /// 0006665 // sphingolipid metabolic process // inferred from electronic annotation /// 0006682 // galactosylceramide biosynthetic process // inferred from electronic annotation /// 0007010 // cytoskeleton organization // inferred from electronic annotation /// 0007417 // central nervous system development // traceable author statement /// 0007422 // peripheral nervous system development // traceable author statement /// 0008088 // axon cargo transport // inferred from electronic annotation /// 0008152 // metabolic process // inferred from electronic annotation /// 0030259 // lipid glycosylation // inferred from electronic annotation /// 0030913 // paranodal junction assembly // inferred from electronic annotation /// 0048812 // neuron projection morphogenesis // inferred from electronic annotation
0003851 // 2-hydroxyacylsphingosine 1-beta-galactosyltransferase activity // inferred from electronic annotation /// 0008489 // UDP-galactose:glucosylceramide beta-1,4-galactosyltransferase activity // inferred from electronic annotation /// 0016740 // transferase activity // inferred from electronic annotation /// 0016757 // transferase activity, transferring glycosyl groups // inferred from electronic annotation /// 0016758 // transferase activity, transferring hexosyl groups // inferred from electronic annotation /// 0030246 // carbohydrate binding // inferred from electronic annotation
XBP1 0002070 // epithelial cell maturation // inferred from electronic annotation /// 0006351 // transcription, DNA-templated // inferred from electronic annotation /// 0006355 // regulation of transcription, DNA-templated // inferred from electronic annotation /// 0006366 // transcription from RNA polymerase II promoter // inferred from electronic annotation /// 0006955 // immune response // traceable author statement /// 0006987 // activation of signaling protein activity involved in unfolded protein response // traceable author statement /// 0030968 // endoplasmic reticulum unfolded protein response // traceable author statement /// 0031017 // exocrine pancreas development // inferred from electronic annotation /// 0042493 // response to drug // inferred from electronic annotation /// 0044267 // cellular protein metabolic process // traceable author statement /// 0051602 // response to electrical stimulus // inferred from electronic annotation /// 0060096 // serotonin secretion, neurotransmission // inferred from electronic annotation /// 0060691 // epithelial cell maturation involved in salivary gland development // inferred from electronic annotation /// 0071236 // cellular
0003677 // DNA binding // traceable author statement /// 0003700 // sequence-specific DNA binding transcription factor activity // inferred from electronic annotation /// 0043565 // sequence-specific DNA binding // inferred from electronic annotation
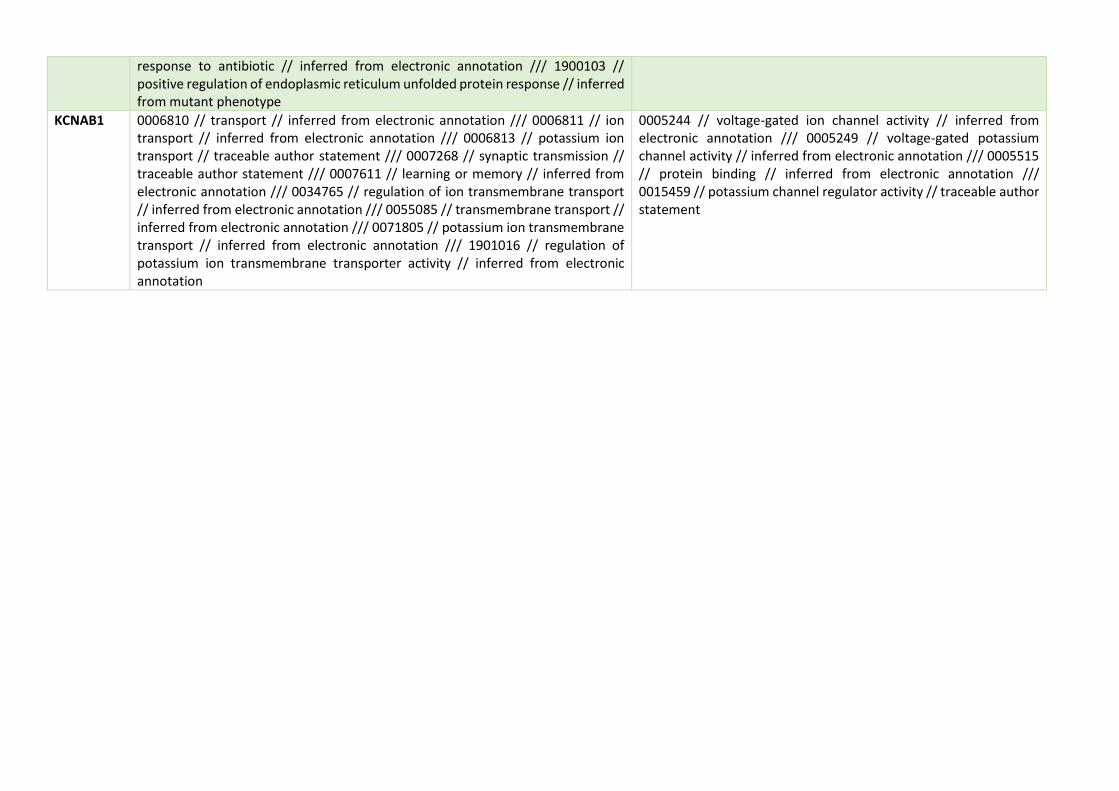
response to antibiotic // inferred from electronic annotation /// 1900103 // positive regulation of endoplasmic reticulum unfolded protein response // inferred from mutant phenotype
KCNAB1 0006810 // transport // inferred from electronic annotation /// 0006811 // ion transport // inferred from electronic annotation /// 0006813 // potassium ion transport // traceable author statement /// 0007268 // synaptic transmission // traceable author statement /// 0007611 // learning or memory // inferred from electronic annotation /// 0034765 // regulation of ion transmembrane transport // inferred from electronic annotation /// 0055085 // transmembrane transport // inferred from electronic annotation /// 0071805 // potassium ion transmembrane transport // inferred from electronic annotation /// 1901016 // regulation of potassium ion transmembrane transporter activity // inferred from electronic annotation
0005244 // voltage-gated ion channel activity // inferred from electronic annotation /// 0005249 // voltage-gated potassium channel activity // inferred from electronic annotation /// 0005515 // protein binding // inferred from electronic annotation /// 0015459 // potassium channel regulator activity // traceable author statement