Investor Presentation Q4 FY2016
25
Q4 & FY 2016 October 19, 2016 Earnings Results
-
Upload
wd40company -
Category
Investor Relations
-
view
1.264 -
download
1
Transcript of Investor Presentation Q4 FY2016

Q4 & FY 2016
October 19, 2016
Earnings Results
2
Historical financial and operating data in this presentation reflect the consolidated results of WD-40 Company, its subsidiaries and its legal
entities. WD-40 Company markets maintenance products (“MP”) under the WD-40®, 3-IN-ONE® and GT85® brand names. Currently
included in the WD-40 brand are the WD-40 Multi-Use Product and the WD-40 Specialist® and WD-40 BIKETM product lines. WD-40
Company markets the following homecare and cleaning (”HCCP”) brands: X-14® mildew stain remover and automatic toilet bowl cleaners,
2000 Flushes® automatic toilet bowl cleaners, Carpet Fresh® and no vac® rug and room deodorizers, Spot Shot® aerosol and liquid carpet
stain removers, 1001® household cleaners and rug and room deodorizers and Lava® and Solvol® heavy-duty hand cleaners.
Except for the historical information contained herein, this presentation contains “forward-looking statements” within the meaning of the Private
Securities Litigation Reform Act of 1995. Such statements reflect the Company’s current expectations with respect to currently available
operating, financial and economic information. These forward-looking statements are subject to certain risks, uncertainties and assumptions
that could cause actual results to differ materially from those anticipated in or implied by the forward-looking statements.
Our forward-looking statements include, but are not limited to, discussions about future financial and operating results, including: growth
expectations for maintenance products; expected levels of promotional and advertising spending; plans for and success of product innovation,
the impact of new product introductions on the growth of sales; anticipated results from product line extension sales; and forecasted foreign
currency exchange rates and commodity prices. Our forward-looking statements are generally identified with words such as “believe,”
“expect,” “intend,” “plan,” “could,” “may,” “aim,” “anticipate,” “estimate” and similar expressions.
The Company's expectations, beliefs and forecasts are expressed in good faith and are believed by the Company to have a reasonable basis,
but there can be no assurance that the Company's expectations, beliefs or forecasts will be achieved or accomplished.
Actual events or results may differ materially from those projected in forward-looking statements due to various factors, including, but not
limited to, those identified in Part I―Item 1A, “Risk Factors,” in the Company’s Annual Report on Form 10-K for the fiscal year ended August
31, 2016 which the Company expects to file with the SEC on October 24, 2016.
All forward-looking statements included in this presentation should be considered in the context of these risks. All forward-looking statements
speak only as of October 19, 2016 and we undertake no obligation to update or revise any forward-looking statements, whether as a result of
new information, future events or otherwise. Investors and prospective investors are cautioned not to place undue reliance on our forward-
looking statements.
Forward-Looking Statements
3
Q4 FY16 RESULTS
4
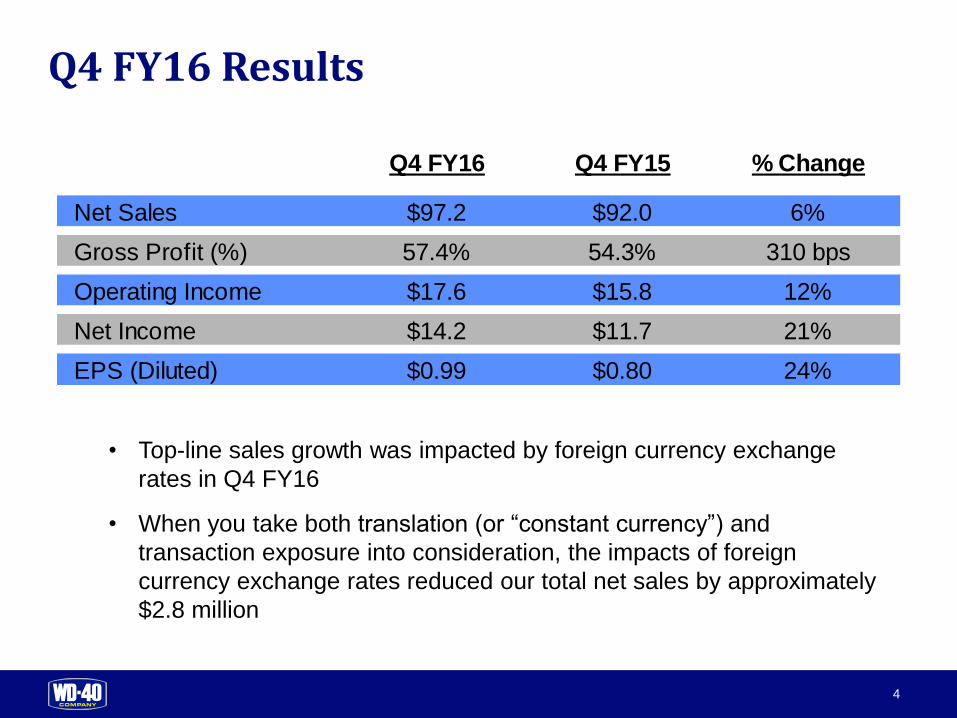
Q4 FY16 Results
• Top-line sales growth was impacted by foreign currency exchange
rates in Q4 FY16
• When you take both translation (or “constant currency”) and
transaction exposure into consideration, the impacts of foreign
currency exchange rates reduced our total net sales by approximately
$2.8 million
Q4 FY16 Q4 FY15 % Change
Net Sales $97.2 $92.0 6%
Gross Profit (%) 57.4% 54.3% 310 bps
Operating Income $17.6 $15.8 12%
Net Income $14.2 $11.7 21%
EPS (Diluted) $0.99 $0.80 24%
5
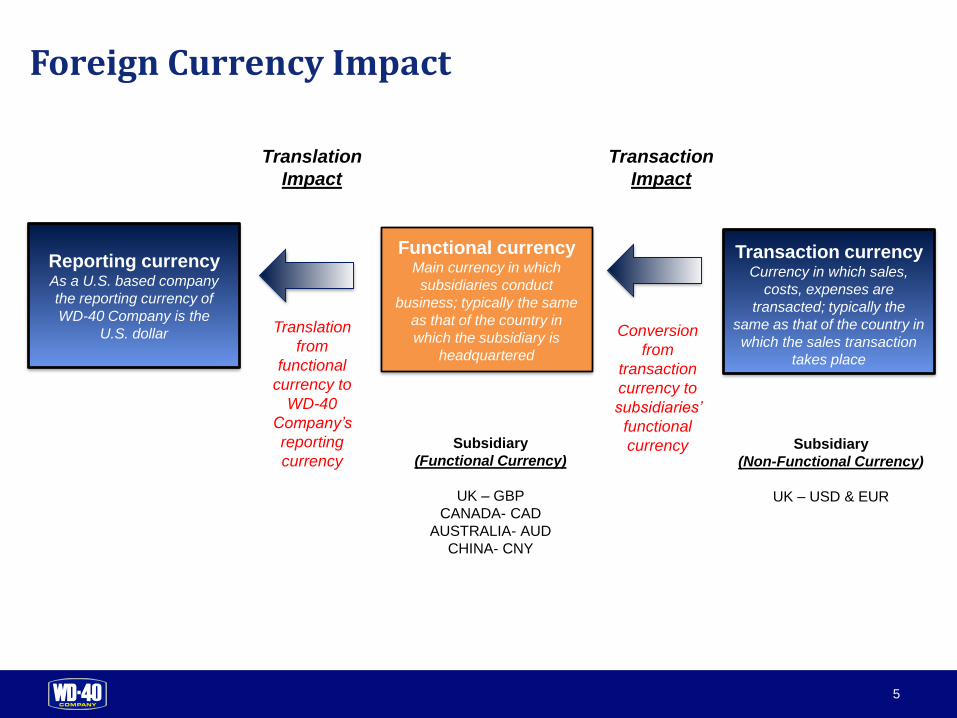
Functional currencyMain currency in which
subsidiaries conduct
business; typically the same
as that of the country in
which the subsidiary is
headquartered
Transaction currencyCurrency in which sales,
costs, expenses are
transacted; typically the
same as that of the country in
which the sales transaction
takes place
Reporting currencyAs a U.S. based company
the reporting currency of
WD-40 Company is the
U.S. dollar Conversion
from
transaction
currency to
subsidiaries’
functional
currency
Translation
from
functional
currency to
WD-40
Company’s
reporting
currency
Foreign Currency Impact
Translation
Impact
Transaction
Impact
Subsidiary
(Functional Currency)
UK – GBP
CANADA- CAD
AUSTRALIA- AUD
CHINA- CNY
Subsidiary
(Non-Functional Currency)
UK – USD & EUR
6
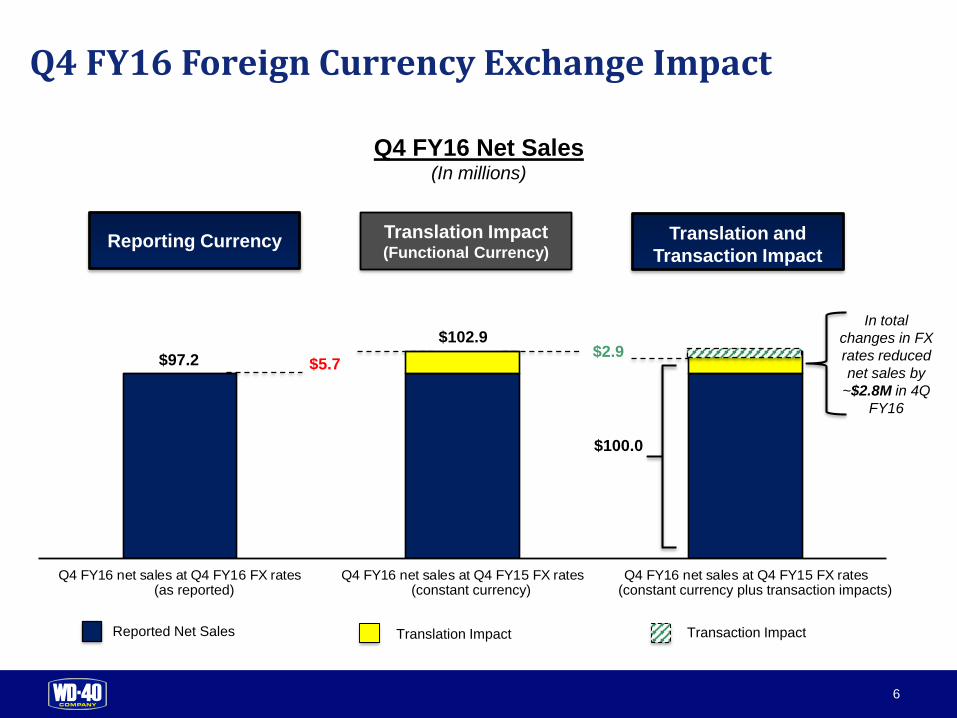
Q4 FY16 net sales at Q4 FY16 FX rates Q4 FY16 net sales at Q4 FY15 FX rates Q4 FY16 net sales at Q4 FY15 FX rates
Q4 FY16 Foreign Currency Exchange Impact
In total
changes in FX
rates reduced
net sales by
~$2.8M in 4Q
FY16
$97.2
$102.9
$100.0
Reported Net Sales Translation Impact Transaction Impact
Translation Impact(Functional Currency)
Translation and
Transaction ImpactReporting Currency
Q4 FY16 Net Sales(In millions)
(constant currency) (constant currency plus transaction impacts)(as reported)
$5.7$2.9
7
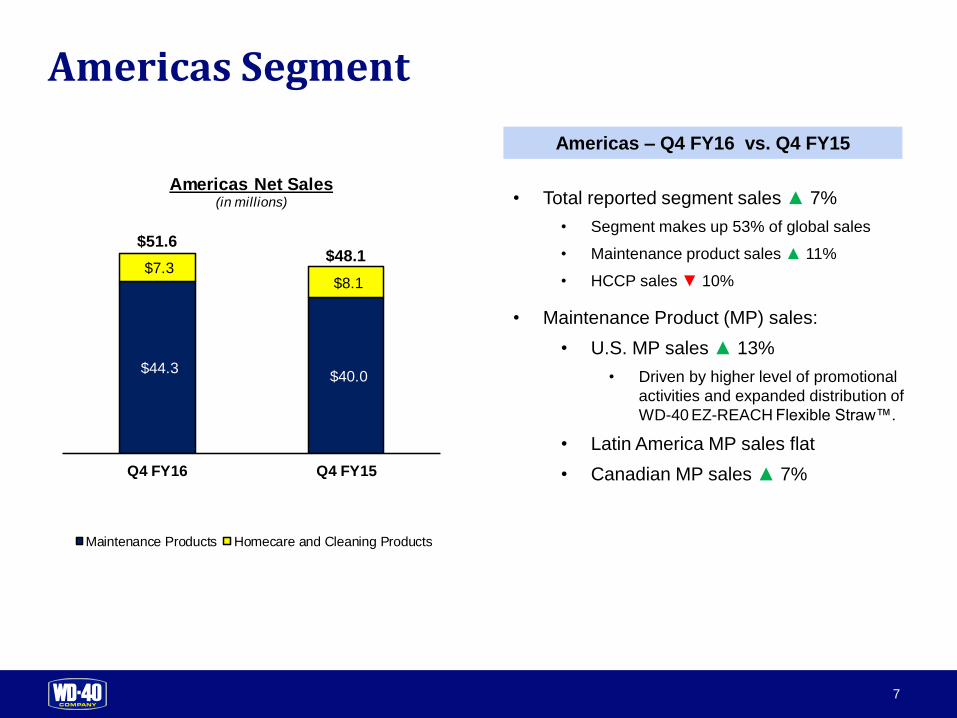
$7.3 $8.1
$44.3 $40.0
Q4 FY16 Q4 FY15
Americas Net Sales(in millions)
Maintenance Products Homecare and Cleaning Products
Americas Segment
Americas – Q4 FY16 vs. Q4 FY15
$51.6$48.1
• Total reported segment sales ▲ 7%
• Segment makes up 53% of global sales
• Maintenance product sales ▲ 11%
• HCCP sales ▼ 10%
• Maintenance Product (MP) sales:
• U.S. MP sales ▲ 13%
• Driven by higher level of promotional
activities and expanded distribution of
WD-40 EZ-REACH Flexible Straw™.
• Latin America MP sales flat
• Canadian MP sales ▲ 7%
8
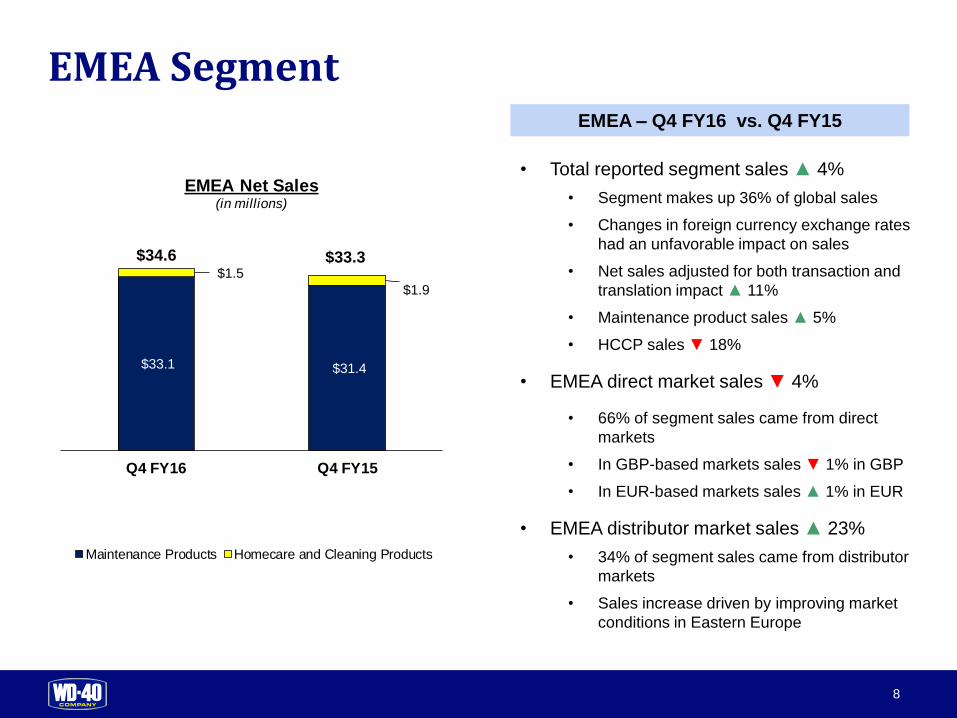
$33.1 $31.4
$1.5
$1.9
Q4 FY16 Q4 FY15
EMEA Net Sales(in millions)
Maintenance Products Homecare and Cleaning Products
EMEA SegmentEMEA – Q4 FY16 vs. Q4 FY15
$33.3$34.6
• Total reported segment sales ▲ 4%
• Segment makes up 36% of global sales
• Changes in foreign currency exchange rates
had an unfavorable impact on sales
• Net sales adjusted for both transaction and
translation impact ▲ 11%
• Maintenance product sales ▲ 5%
• HCCP sales ▼ 18%
• EMEA direct market sales ▼ 4%
• 66% of segment sales came from direct
markets
• In GBP-based markets sales ▼ 1% in GBP
• In EUR-based markets sales ▲ 1% in EUR
• EMEA distributor market sales ▲ 23%
• 34% of segment sales came from distributor
markets
• Sales increase driven by improving market
conditions in Eastern Europe
9
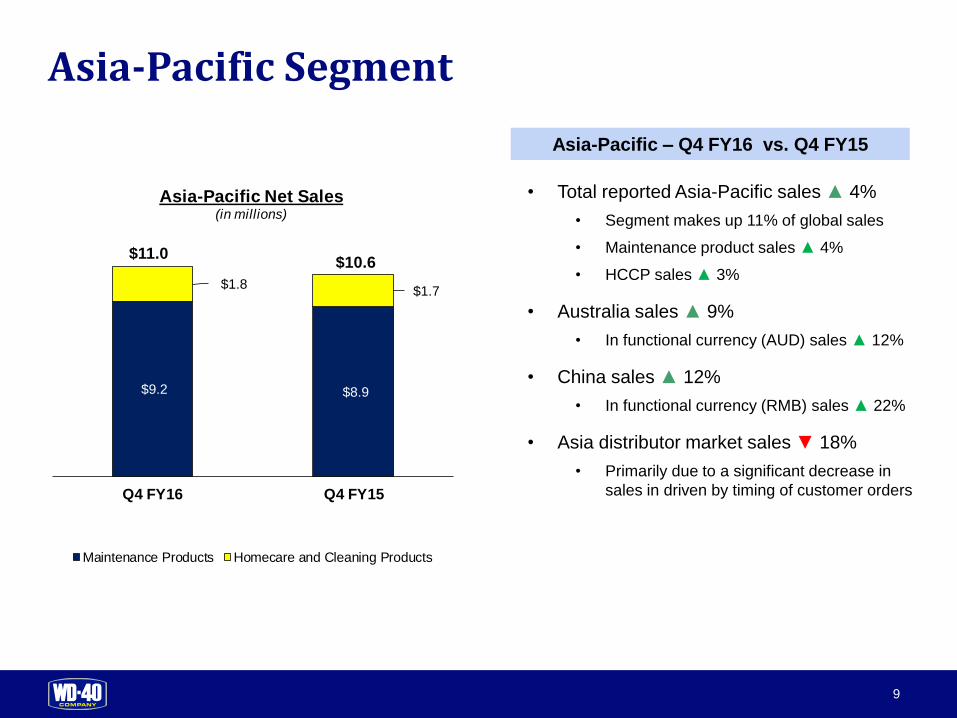
$9.2 $8.9
$1.8 $1.7
Q4 FY16 Q4 FY15
Asia-Pacific Net Sales(in millions)
Maintenance Products Homecare and Cleaning Products
Asia-Pacific Segment
Asia-Pacific – Q4 FY16 vs. Q4 FY15
$10.6$11.0
• Total reported Asia-Pacific sales ▲ 4%
• Segment makes up 11% of global sales
• Maintenance product sales ▲ 4%
• HCCP sales ▲ 3%
• Australia sales ▲ 9%
• In functional currency (AUD) sales ▲ 12%
• China sales ▲ 12%
• In functional currency (RMB) sales ▲ 22%
• Asia distributor market sales ▼ 18%
• Primarily due to a significant decrease in
sales in driven by timing of customer orders
10
FY16 RESULTS
11
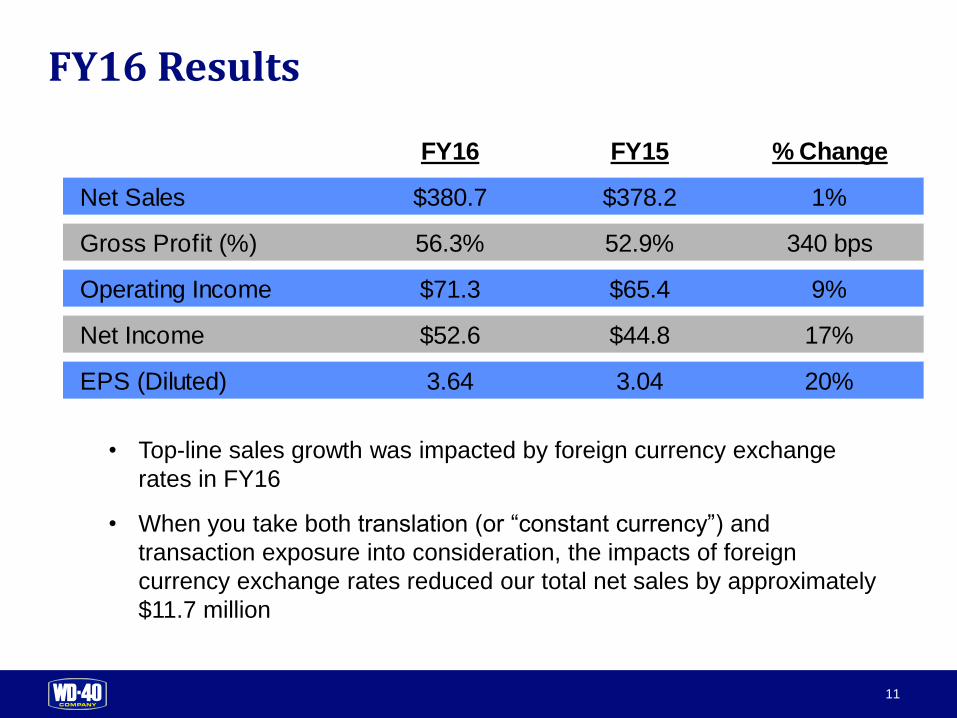
FY16 FY15 % Change
Net Sales $380.7 $378.2 1%
Gross Profit (%) 56.3% 52.9% 340 bps
Operating Income $71.3 $65.4 9%
Net Income $52.6 $44.8 17%
EPS (Diluted) 3.64 3.04 20%
FY16 Results
• Top-line sales growth was impacted by foreign currency exchange
rates in FY16
• When you take both translation (or “constant currency”) and
transaction exposure into consideration, the impacts of foreign
currency exchange rates reduced our total net sales by approximately
$11.7 million
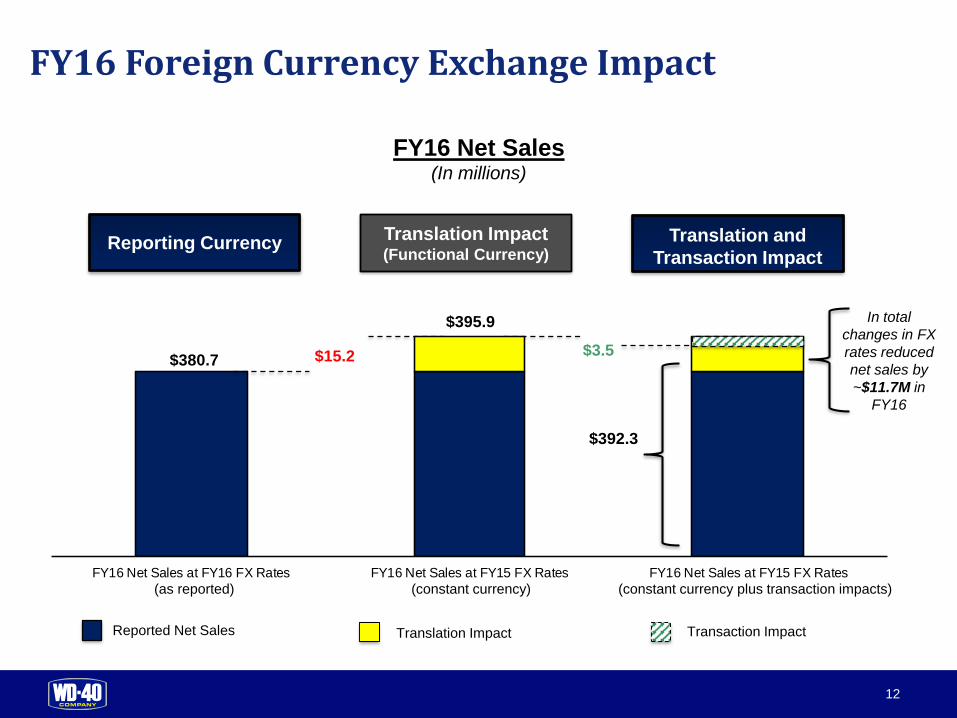
12
FY16 Net Sales at FY16 FX Rates FY16 Net Sales at FY15 FX Rates FY16 Net Sales at FY15 FX Rates
FY16 Foreign Currency Exchange Impact
In total
changes in FX
rates reduced
net sales by
~$11.7M in
FY16
$380.7
$395.9
$392.3
Reported Net Sales Translation Impact Transaction Impact
Translation Impact(Functional Currency)
Translation and
Transaction ImpactReporting Currency
FY16 Net Sales(In millions)
(constant currency) (constant currency plus transaction impacts)(as reported)
$15.2 $3.5
13
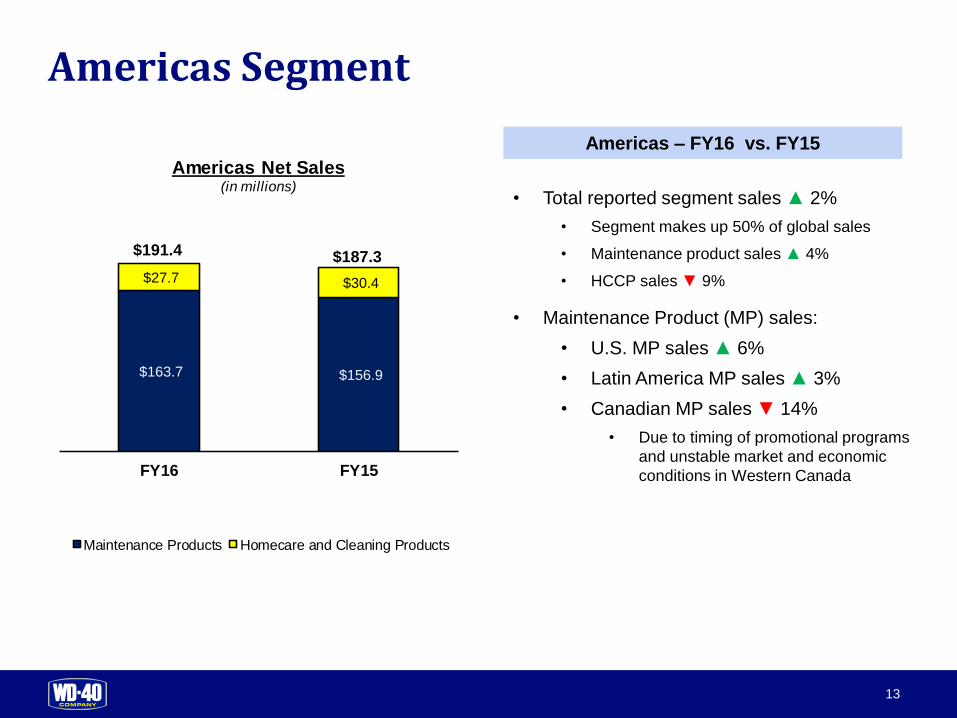
$163.7 $156.9
$27.7 $30.4
FY16 FY15
Americas Net Sales(in millions)
Maintenance Products Homecare and Cleaning Products
Americas Segment
Americas – FY16 vs. FY15
$191.4 $187.3
• Total reported segment sales ▲ 2%
• Segment makes up 50% of global sales
• Maintenance product sales ▲ 4%
• HCCP sales ▼ 9%
• Maintenance Product (MP) sales:
• U.S. MP sales ▲ 6%
• Latin America MP sales ▲ 3%
• Canadian MP sales ▼ 14%
• Due to timing of promotional programs
and unstable market and economic
conditions in Western Canada
14
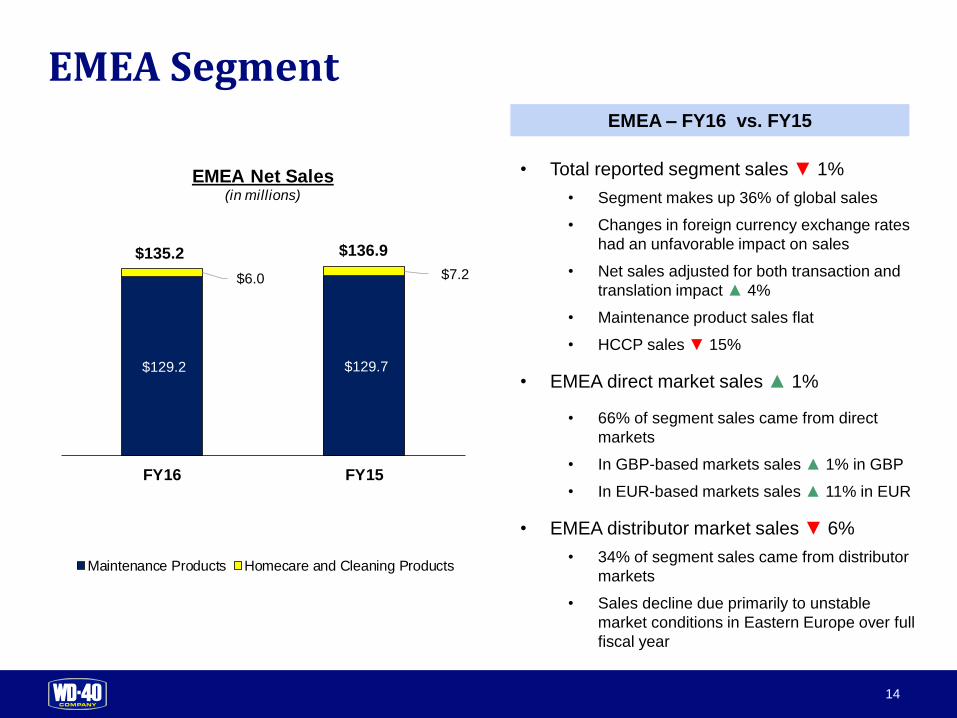
$129.2 $129.7
$6.0 $7.2
FY16 FY15
EMEA Net Sales(in millions)
Maintenance Products Homecare and Cleaning Products
EMEA SegmentEMEA – FY16 vs. FY15
$136.9$135.2
• Total reported segment sales ▼ 1%
• Segment makes up 36% of global sales
• Changes in foreign currency exchange rates
had an unfavorable impact on sales
• Net sales adjusted for both transaction and
translation impact ▲ 4%
• Maintenance product sales flat
• HCCP sales ▼ 15%
• EMEA direct market sales ▲ 1%
• 66% of segment sales came from direct
markets
• In GBP-based markets sales ▲ 1% in GBP
• In EUR-based markets sales ▲ 11% in EUR
• EMEA distributor market sales ▼ 6%
• 34% of segment sales came from distributor
markets
• Sales decline due primarily to unstable
market conditions in Eastern Europe over full
fiscal year
15
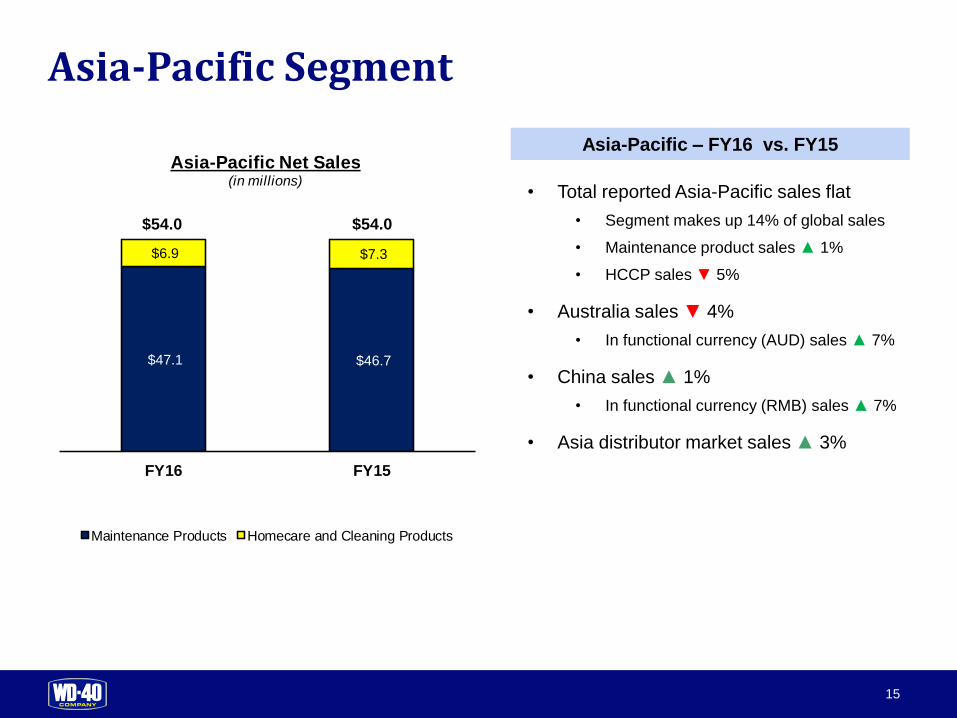
$47.1 $46.7
$6.9 $7.3
FY16 FY15
Asia-Pacific Net Sales(in millions)
Maintenance Products Homecare and Cleaning Products
Asia-Pacific Segment
Asia-Pacific – FY16 vs. FY15
$54.0$54.0
• Total reported Asia-Pacific sales flat
• Segment makes up 14% of global sales
• Maintenance product sales ▲ 1%
• HCCP sales ▼ 5%
• Australia sales ▼ 4%
• In functional currency (AUD) sales ▲ 7%
• China sales ▲ 1%
• In functional currency (RMB) sales ▲ 7%
• Asia distributor market sales ▲ 3%
16
THE 55/30/25 RULE
17
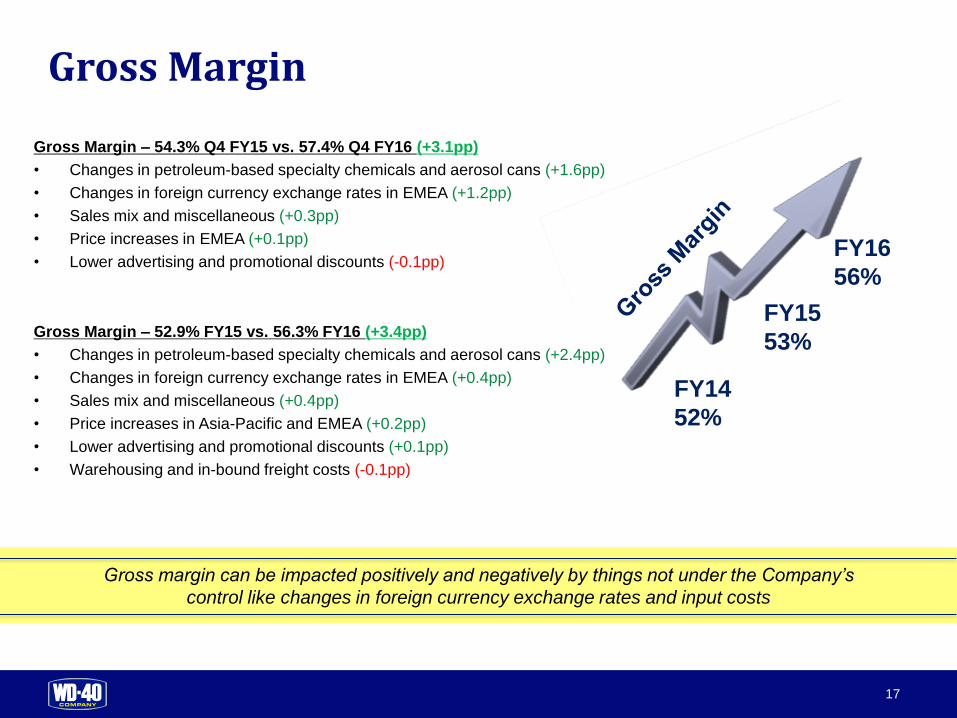
Gross Margin
Gross margin can be impacted positively and negatively by things not under the Company’s
control like changes in foreign currency exchange rates and input costs
FY16
56%
FY15
53%
FY14
52%
Gross Margin – 54.3% Q4 FY15 vs. 57.4% Q4 FY16 (+3.1pp)
• Changes in petroleum-based specialty chemicals and aerosol cans (+1.6pp)
• Changes in foreign currency exchange rates in EMEA (+1.2pp)
• Sales mix and miscellaneous (+0.3pp)
• Price increases in EMEA (+0.1pp)
• Lower advertising and promotional discounts (-0.1pp)
Gross Margin – 52.9% FY15 vs. 56.3% FY16 (+3.4pp)
• Changes in petroleum-based specialty chemicals and aerosol cans (+2.4pp)
• Changes in foreign currency exchange rates in EMEA (+0.4pp)
• Sales mix and miscellaneous (+0.4pp)
• Price increases in Asia-Pacific and EMEA (+0.2pp)
• Lower advertising and promotional discounts (+0.1pp)
• Warehousing and in-bound freight costs (-0.1pp)
18
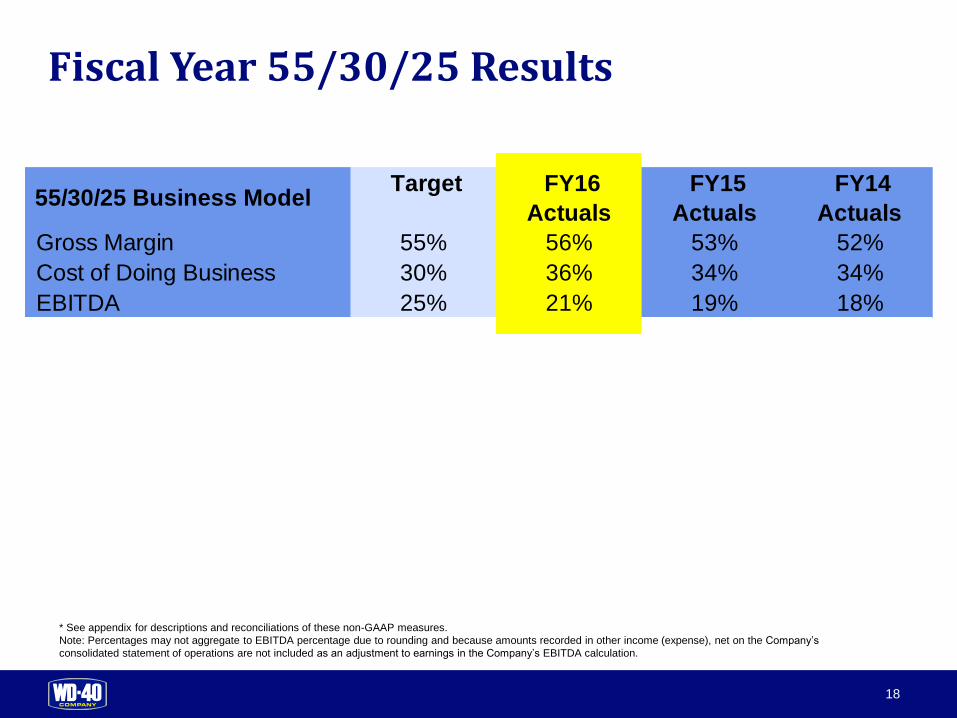
Fiscal Year 55/30/25 Results
* See appendix for descriptions and reconciliations of these non-GAAP measures.
Note: Percentages may not aggregate to EBITDA percentage due to rounding and because amounts recorded in other income (expense), net on the Company’s
consolidated statement of operations are not included as an adjustment to earnings in the Company’s EBITDA calculation.
55/30/25 Business Model Target FY16
Actuals
FY15
Actuals
FY14
Actuals
Gross Margin 55% 56% 53% 52%
Cost of Doing Business 30% 36% 34% 34%
EBITDA 25% 21% 19% 18%
19
GUIDANCE
20
Diluted EPS
Net Income
A&P Investment
Gross Margin
Net Sales
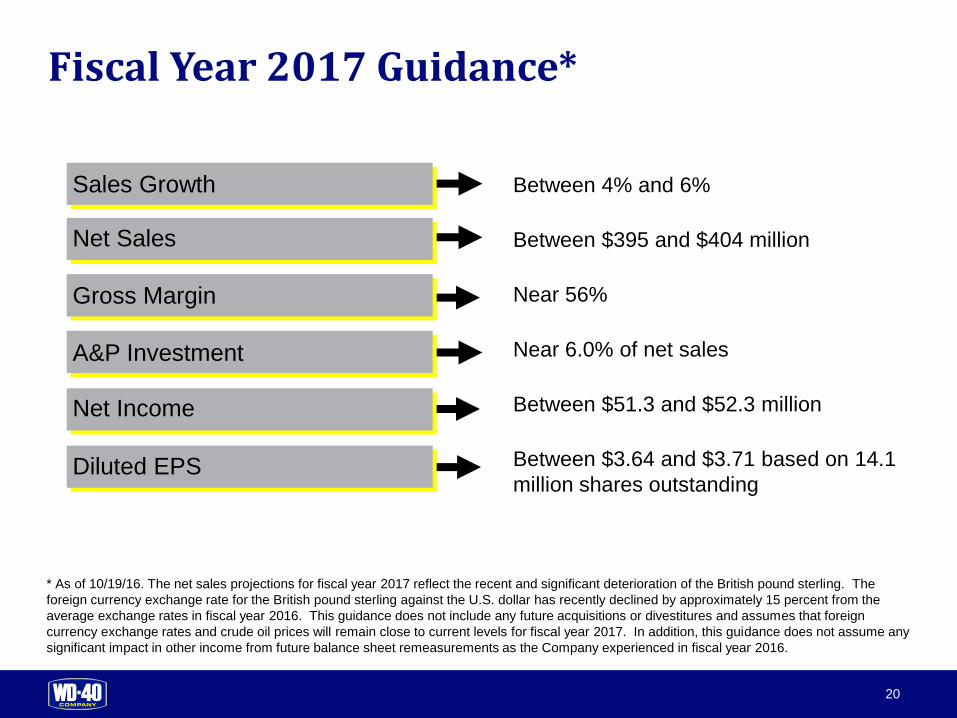
Sales Growth Between 4% and 6%
Between $395 and $404 million
Near 56%
Near 6.0% of net sales
Between $51.3 and $52.3 million
Between $3.64 and $3.71 based on 14.1
million shares outstanding
* As of 10/19/16. The net sales projections for fiscal year 2017 reflect the recent and significant deterioration of the British pound sterling. The
foreign currency exchange rate for the British pound sterling against the U.S. dollar has recently declined by approximately 15 percent from the
average exchange rates in fiscal year 2016. This guidance does not include any future acquisitions or divestitures and assumes that foreign
currency exchange rates and crude oil prices will remain close to current levels for fiscal year 2017. In addition, this guidance does not assume any
significant impact in other income from future balance sheet remeasurements as the Company experienced in fiscal year 2016.
Fiscal Year 2017 Guidance*
21
APPENDIX
22
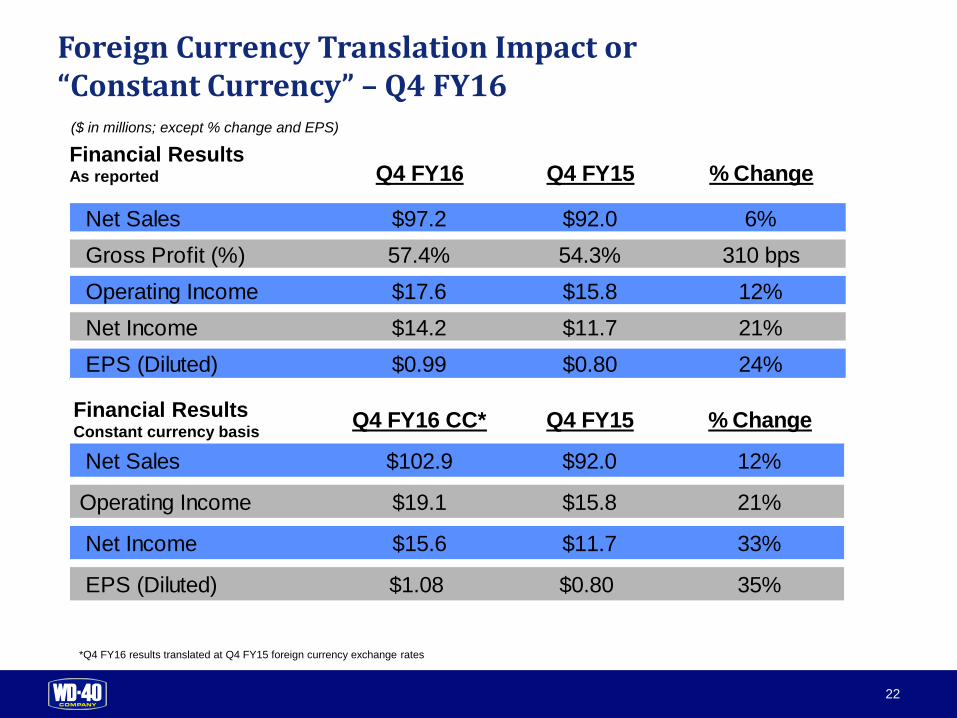
Q4 FY16 CC* Q4 FY15 % Change
Net Sales $102.9 $92.0 12%
Operating Income $19.1 $15.8 21%
Net Income $15.6 $11.7 33%
EPS (Diluted) $1.08 $0.80 35%
Q4 FY16 Q4 FY15 % Change
Net Sales $97.2 $92.0 6%
Gross Profit (%) 57.4% 54.3% 310 bps
Operating Income $17.6 $15.8 12%
Net Income $14.2 $11.7 21%
EPS (Diluted) $0.99 $0.80 24%
Foreign Currency Translation Impact or“Constant Currency” – Q4 FY16
Financial ResultsAs reported
Financial ResultsConstant currency basis
*Q4 FY16 results translated at Q4 FY15 foreign currency exchange rates
($ in millions; except % change and EPS)
23
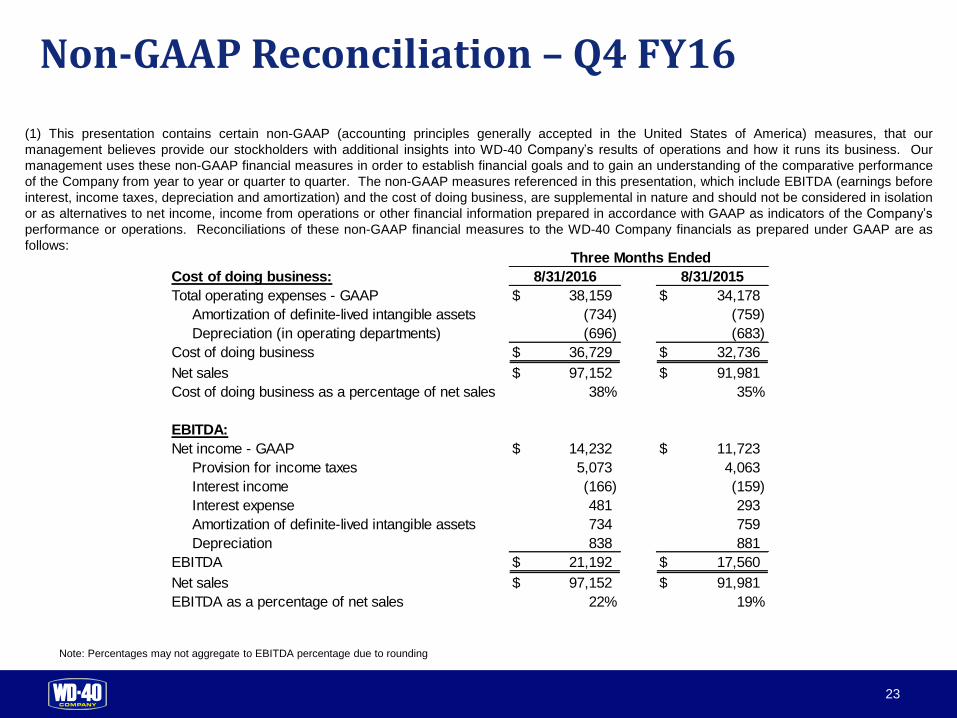
(1) This presentation contains certain non-GAAP (accounting principles generally accepted in the United States of America) measures, that our
management believes provide our stockholders with additional insights into WD-40 Company’s results of operations and how it runs its business. Our
management uses these non-GAAP financial measures in order to establish financial goals and to gain an understanding of the comparative performance
of the Company from year to year or quarter to quarter. The non-GAAP measures referenced in this presentation, which include EBITDA (earnings before
interest, income taxes, depreciation and amortization) and the cost of doing business, are supplemental in nature and should not be considered in isolation
or as alternatives to net income, income from operations or other financial information prepared in accordance with GAAP as indicators of the Company’s
performance or operations. Reconciliations of these non-GAAP financial measures to the WD-40 Company financials as prepared under GAAP are as
follows:
Non-GAAP Reconciliation – Q4 FY16
Note: Percentages may not aggregate to EBITDA percentage due to rounding
Cost of doing business:
Total operating expenses - GAAP $ 38,159 $ 34,178
Amortization of definite-lived intangible assets (734) (759)
Depreciation (in operating departments) (696) (683)
Cost of doing business $ 36,729 $ 32,736
Net sales $ 97,152 $ 91,981
Cost of doing business as a percentage of net sales 38% 35%
EBITDA:
Net income - GAAP $ 14,232 $ 11,723
Provision for income taxes 5,073 4,063
Interest income (166) (159)
Interest expense 481 293
Amortization of definite-lived intangible assets 734 759
Depreciation 838 881
EBITDA $ 21,192 $ 17,560
Net sales $ 97,152 $ 91,981
EBITDA as a percentage of net sales 22% 19%
Three Months Ended
8/31/2016 8/31/2015
24
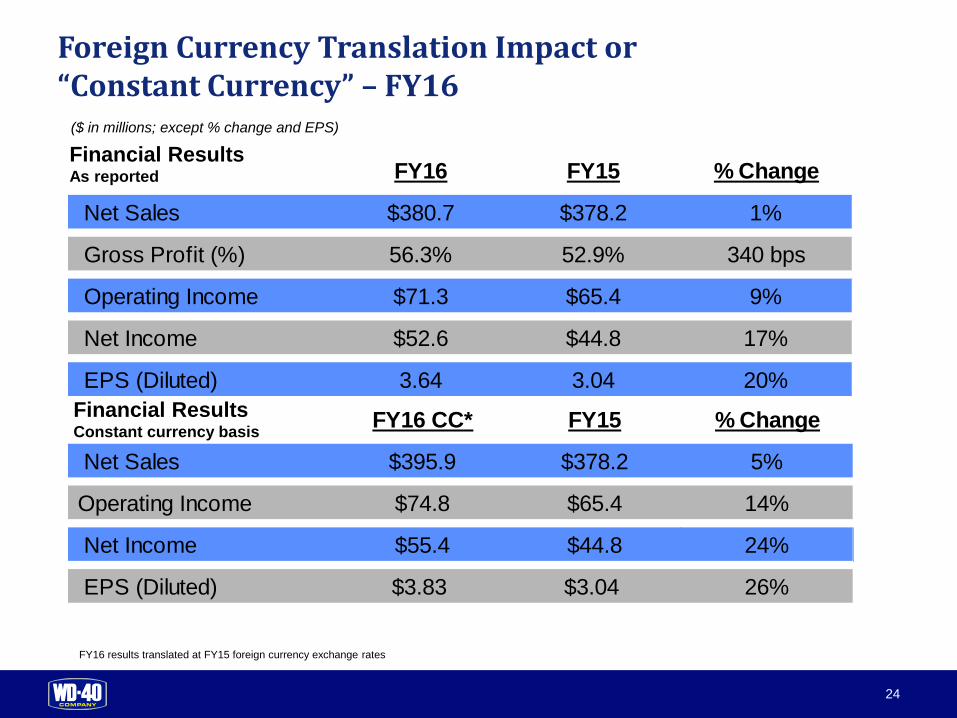
FY16 CC* FY15 % Change
Net Sales $395.9 $378.2 5%
Operating Income $74.8 $65.4 14%
Net Income $55.4 $44.8 24%
EPS (Diluted) $3.83 $3.04 26%
FY16 FY15 % Change
Net Sales $380.7 $378.2 1%
Gross Profit (%) 56.3% 52.9% 340 bps
Operating Income $71.3 $65.4 9%
Net Income $52.6 $44.8 17%
EPS (Diluted) 3.64 3.04 20%
Foreign Currency Translation Impact or“Constant Currency” – FY16
Financial ResultsAs reported
Financial ResultsConstant currency basis
FY16 results translated at FY15 foreign currency exchange rates
($ in millions; except % change and EPS)
25
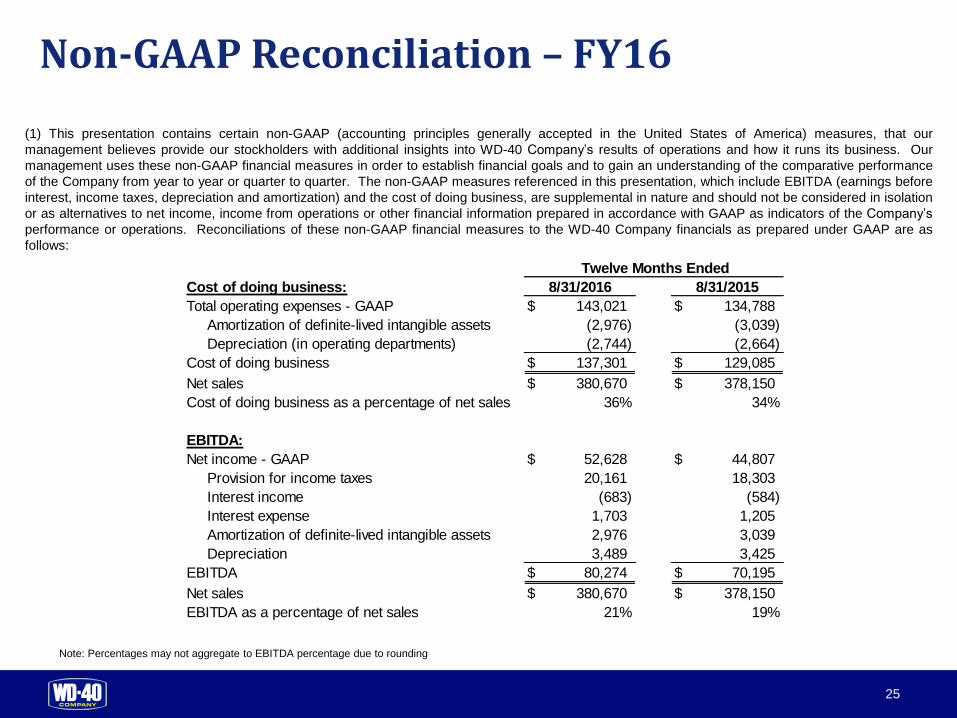
(1) This presentation contains certain non-GAAP (accounting principles generally accepted in the United States of America) measures, that our
management believes provide our stockholders with additional insights into WD-40 Company’s results of operations and how it runs its business. Our
management uses these non-GAAP financial measures in order to establish financial goals and to gain an understanding of the comparative performance
of the Company from year to year or quarter to quarter. The non-GAAP measures referenced in this presentation, which include EBITDA (earnings before
interest, income taxes, depreciation and amortization) and the cost of doing business, are supplemental in nature and should not be considered in isolation
or as alternatives to net income, income from operations or other financial information prepared in accordance with GAAP as indicators of the Company’s
performance or operations. Reconciliations of these non-GAAP financial measures to the WD-40 Company financials as prepared under GAAP are as
follows:
Non-GAAP Reconciliation – FY16
Note: Percentages may not aggregate to EBITDA percentage due to rounding
Cost of doing business:
Total operating expenses - GAAP $ 143,021 $ 134,788
Amortization of definite-lived intangible assets (2,976) (3,039)
Depreciation (in operating departments) (2,744) (2,664)
Cost of doing business $ 137,301 $ 129,085
Net sales $ 380,670 $ 378,150
Cost of doing business as a percentage of net sales 36% 34%
EBITDA:
Net income - GAAP $ 52,628 $ 44,807
Provision for income taxes 20,161 18,303
Interest income (683) (584)
Interest expense 1,703 1,205
Amortization of definite-lived intangible assets 2,976 3,039
Depreciation 3,489 3,425
EBITDA $ 80,274 $ 70,195
Net sales $ 380,670 $ 378,150
EBITDA as a percentage of net sales 21% 19%
Twelve Months Ended
8/31/2016 8/31/2015


![Investor Presentation Q4 FY 2016 [Company Update]](https://static.fdocuments.es/doc/165x107/577c7fb51a28abe054a5bb0b/investor-presentation-q4-fy-2016-company-update.jpg)


![Investor Presentation - Q4 & FY16 [Company Update]](https://static.fdocuments.es/doc/165x107/577c7bb11a28abe0549832d4/investor-presentation-q4-fy16-company-update.jpg)