JERARQUIZACIÓN DE CADENAS FORESTALES ANTE LA ... · artÍculo / article jerarquizaciÓn de cadenas...
16
ARTÍCULO / ARTICLE JERARQUIZACIÓN DE CADENAS FORESTALES ANTE LA VULNERABILIDAD AL CAMBIO CLIMÁTICO EN EL ESTADO DE MÉXICO HIERARCHIZATION OF FOREST CHAINS IN THE FACE OF THE VULNERABILITY TO CLIMATE CHANGE IN THE STATE OF MEXICO Georgel Moctezuma López 1 , José Luis Jolalpa Barrera 2 , Magaly Montserrat Pérez Díaz 3 , Antonio González Hernández 1 Francisco Moreno Sánchez 1 y Ramiro Pérez Miranda 1 RESUMEN El cambio climático es una realidad a nivel mundial y las masas forestales del Estado de México, al igual que en otras localidades, tienen un rol determinante en la mitigación de este fenómeno. Asimismo, la priorización de las cadenas productivas del subsector forestal pueden orientar y ayudar a los tomadores de decisión hacia dónde dirigir recursos monetarios para incrementar su actividad. La jerarquización de esas cadenas se apoya, fundamentalmente, en dos dimensiones: importancia socioeconómica y competitividad; mismas a las que se les asigna, de acuerdo al método del International Service for National Agricultural Research, un valor de 100 puntos a cada una de ellas, con el fin de hacer más fácil su comprensión. Los criterios utilizados para el caso de la primera dimensión son el tamaño, dinamismo y especialización de las cadenas productivas forestales, y para la segunda se toman en cuenta la productividad y sustentabilidad, además se consideran diversas variables para su calificación en los sectores primario y secundario en que inciden. Una vez valoradas, se procede a graficarlas y ubicarlas dentro de una matriz de posicionamiento dividida en cuatro cuadrantes, y bajo esta óptica se definen diversas estrategias. Las cadenas forestales productivas analizadas con mayor calificación fueron la de oyamel, pino y encino con valoraciones de 109, 96 y 90 puntos, respectivamente, que se obtuvieron de las sumas de las dos dimensiones. Palabras clave: Competitividad, importancia socioeconómica, matriz de posicionamiento, productos forestales, sector primario, sector secundario. ABSTRACT Climate change is a worldwide reality, and the forest masses of the State of Mexico, like those of other localities, play a decisive role in the mitigation of this phenomenon. Likewise, the prioritization of the productive chains of the forest subsector can orient decision makers and help them determine in what direction to channel the monetary resources in order to increase their activity. Basically, the hierarchization of those chains is supported on two dimensions: socioeconomic importance and competitiveness; according to the method of the International Service for National Farming Research, these are assigned a value of 100 points each, so as to make them easier to understand. The criteria utilized for the first dimension are the size, dynamism and specialization of the forest productive chains, and for the second, productivity and sustainability; besides, several different variables are considered for grading in the secondary and primary sectors on which they exert an impact. Once they have been valued, they are charted and located within a positioning matrix divided into four quadrants, and diverse strategies are defined based on this perspective. The analyzed productive forest chains with the highest score were those of the sacred fir, pine and red oak, with appraisals of 109, 96 and 90 points, respectively, obtained from the sums of the two dimensions. Key words: Competitiveness, socioeconomic importance, positioning matrix, forest products, primary sector, secondary sector. Fecha de recepción/ date of receipt: 5 de abril de 2011; Fecha de aceptación/ date of acceptance: 23 de abril de 2013. 1 Centro Nacional de Investigación Disciplinaria en Conservación y Mejoramiento de Ecosistemas Forestales. INIFAP. Correo-e: [email protected] 2 Campo Experimental Valle de México. CIR-Centro. INIFAP 3 Facultad de Estudios Superiores Aragón. UNAM.
Transcript of JERARQUIZACIÓN DE CADENAS FORESTALES ANTE LA ... · artÍculo / article jerarquizaciÓn de cadenas...

ARTÍCULO / ARTICLE
JERARQUIZACIÓN DE CADENAS FORESTALES ANTE LA VULNERABILIDAD AL CAMBIO CLIMÁTICO EN EL ESTADO DE MÉXICO
HIERARCHIZATION OF FOREST CHAINS IN THE FACE OF THE VULNERABILITY TO CLIMATE CHANGE IN THE STATE OF MEXICOGeorgel Moctezuma López1, José Luis Jolalpa Barrera2, Magaly Montserrat Pérez Díaz3, Antonio González Hernández1 Francisco Moreno Sánchez1 y Ramiro Pérez Miranda1
RESUMEN
El cambio climático es una realidad a nivel mundial y las masas forestales del Estado de México, al igual que en otras localidades, tienen un rol determinante en la mitigación de este fenómeno. Asimismo, la priorización de las cadenas productivas del subsector forestal pueden orientar y ayudar a los tomadores de decisión hacia dónde dirigir recursos monetarios para incrementar su actividad. La jerarquización de esas cadenas se apoya, fundamentalmente, en dos dimensiones: importancia socioeconómica y competitividad; mismas a las que se les asigna, de acuerdo al método del International Service for National Agricultural Research, un valor de 100 puntos a cada una de ellas, con el fin de hacer más fácil su comprensión. Los criterios utilizados para el caso de la primera dimensión son el tamaño, dinamismo y especialización de las cadenas productivas forestales, y para la segunda se toman en cuenta la productividad y sustentabilidad, además se consideran diversas variables para su calificación en los sectores primario y secundario en que inciden. Una vez valoradas, se procede a graficarlas y ubicarlas dentro de una matriz de posicionamiento dividida en cuatro cuadrantes, y bajo esta óptica se definen diversas estrategias. Las cadenas forestales productivas analizadas con mayor calificación fueron la de oyamel, pino y encino con valoraciones de 109, 96 y 90 puntos, respectivamente, que se obtuvieron de las sumas de las dos dimensiones.
Palabras clave: Competitividad, importancia socioeconómica, matriz de posicionamiento, productos forestales, sector primario, sector secundario.
ABSTRACT
Climate change is a worldwide reality, and the forest masses of the State of Mexico, like those of other localities, play a decisive role in the mitigation of this phenomenon. Likewise, the prioritization of the productive chains of the forest subsector can orient decision makers and help them determine in what direction to channel the monetary resources in order to increase their activity. Basically, the hierarchization of those chains is supported on two dimensions: socioeconomic importance and competitiveness; according to the method of the International Service for National Farming Research, these are assigned a value of 100 points each, so as to make them easier to understand. The criteria utilized for the first dimension are the size, dynamism and specialization of the forest productive chains, and for the second, productivity and sustainability; besides, several different variables are considered for grading in the secondary and primary sectors on which they exert an impact. Once they have been valued, they are charted and located within a positioning matrix divided into four quadrants, and diverse strategies are defined based on this perspective. The analyzed productive forest chains with the highest score were those of the sacred fir, pine and red oak, with appraisals of 109, 96 and 90 points, respectively, obtained from the sums of the two dimensions.
Key words: Competitiveness, socioeconomic importance, positioning matrix, forest products, primary sector, secondary sector.
Fecha de recepción/ date of receipt: 5 de abril de 2011; Fecha de aceptación/ date of acceptance: 23 de abril de 2013.1 Centro Nacional de Investigación Disciplinaria en Conservación y Mejoramiento de Ecosistemas Forestales. INIFAP. Correo-e: [email protected] Campo Experimental Valle de México. CIR-Centro. INIFAP3 Facultad de Estudios Superiores Aragón. UNAM.

Moctezuma et al., Jeraquización de cadenas forestales ante...
9
INTRODUCTION
The forest production in Mexico requires a modification process in order to meet the needs of a dynamic national and international context, represented by the various performers that are immersed in the different links of the timber-yielding and non-timber-yielding forest chains. Also, climate change is a reality worldwide, manifested as a 0.5 °C increase in the temperature in the last 100 years (Sagarpa, 2010); however, different projections foretell long-term increases of 2 °C to 5 °C. Under this circumstance, the forest masses play a decisive role in the mitigation of the effects of climate change.
In the State of Mexico there is today a high accident rate due to torrential rains, as well as detachments of large volumes of earth from the slopes and abrupt alterations of the temperature through the year that were absent before and which constitute a valuable opportunity, but which are also threats for the system of research and transfer of forest technologies (Espinosa, et al., 2009; Jolalpa et al., 2010; Pérez et al., 2010). Hence the need for the research carried out in this sector to change its focus from the supply to the demand, since usually its purpose is to face the challenges of the primary sector, while it tends to leave the secondary and tertiary sectors (agroindustrial processes, distribution, commercialization and preferences of the consumers) in the background. From the point of view of forestry, few projects integrate the chains under the perspective of multidimensionality and multidisciplinarity of the links and segments that conform them.
With the purpose of contributing knowledge to the analysis of the timber-yielding and non-timber-yielding production chains, the present study identifies the most prominent productive chains in the forest subsector of the State of Mexico in terms of their socioeconomic importance and competitiveness within the primary and secondary sectors, thus contributing prominent information in order to enable decision makers to use the resources destined to the research, generation, validation and transfer of technology more efficiently, as science, innovation and development are essential activities and generators of changes in the productivity (González and Wood, 2006).
MATERIAL AND METHODS
Revision of the bibliography. This was based on the statistical information of the federal delegation of the Department of the Environment and Natural Resources (Semarnat) in the State of Mexico; of the Agri-food and Fishing Information Service (SIAP), of the Department of Agriculture, Livestock, Rural Development, Fishing and Nutrition (Sagarpa), and of the National Institute of Statistics, Geography and Data Processing (INEGI).
INTRODUCCIÓN
La producción forestal en México requiere de un proceso de modificaciones para dar respuesta a las necesidades de un contexto dinámico nacional e internacional, representado por los distintos actores que están inmersos en los diferentes eslabones de las cadenas forestales maderables y no maderables. Asimismo, el cambio climático es una realidad en todo el mundo, que se manifiesta por medio de la elevación de la temperatura en alrededor de 0.5 °C en los últimos 100 años (Sagarpa, 2010); aunque distintas proyecciones pronostican en el largo plazo aumentos entre 2 °C y 5 °C. Bajo esta circunstancia, las masas forestales tienen un rol determinante en la mitigación de los efectos del cambio climático.
En el Estado de México, actualmente, se presenta una gran siniestralidad por lluvias torrenciales, el desprendimiento de grandes volúmenes de tierra en laderas y alteraciones bruscas de temperatura a lo largo del año, que antes no se presentaban y que constituyen una oportunidad valiosa, pero también son amenazas para el sistema de investigación y transferencia de tecnologías forestales (Espinosa et al., 2009; Jolalpa et al., 2010; Pérez et al., 2010). De aquí surge la necesidad de que la investigación en el sector pase de un enfoque de oferta a uno de demanda, ya que comúnmente se avoca a enfrentar los retos del sector primario y deja en segundo plano lo relativo a los secundarios y terciarios (procesos agroindustriales, distribución, comercialización y preferencias de los consumidores). En el aspecto forestal se tienen pocos proyectos que integren las cadenas bajo la visión de multidimensionalidad y multidisciplinariedad en los eslabones y segmentos que las conforman.
Con la finalidad de aportar conocimiento al análisis de las cadenas productivas maderables y no maderables, en el presente estudio se identifican las más relevantes en el subsector forestal del Estado de México, en función de la importancia socioeconómica y competitividad que tienen en el ámbito primario y secundario, y así aportar información para que los tomadores de decisión hagan uso más eficiente de los recursos destinados a la investigación, generación, validación y transferencia de tecnología, ya que la ciencia, innovación y desarrollo son actividades esenciales y generadoras de cambios en la productividad (González y Wood, 2006).
MATERIALES Y MÉTODOS
Revisión de bibliografía. Se basó en la información de tipo estadístico de la delegación federal de la Secretaría del Medio Ambiente y Recursos Naturales (Semarnat) en el Estado de México, del Servicio de Información Agroalimentaria y Pesquera (SIAP), de la Secretaría de Agricultura, Ganadería, Desarrollo Rural, Pesca y Alimentación (Sagarpa) y del Instituto Nacional de Estadística, Geografía e Informática (INEGI).

Rev. Mex. Cien. For. Vol. 5 Núm. 21
10
Productive chains. Their prioritization was based on the proposal of the International Service for National Farming Reseach (ISNAR) (Velásquez et al., 1999), which considers two support dimensions: socioeconomic importance and competitiveness. The first one includes three basic criteria: size, dynamism and specialization; in its appraisal, the maximum score was 100 points: 30 for size, 40 for dynamism, and 30 for specialization. The information was obtained through consultations to the main actors of the productive chains and compared with the information processed and analyzed through the trends generated by the products of the chains (Jansenn et al., 1999; Ghezán et al., 1999; ISNAR, 1999; Valenzuela et al., 1999; Taddei et al., 2004). The variables in each criterion and their respective maximum value are summarized in Table 1.
Cadenas productivas. Su priorización se hizo con base en la propuesta del International Service for National Agricultural Reseach (ISNAR) (Velásquez et al., 1999) que considera dos dimensiones de soporte: la importancia socioeconómica y la competitividad. La primera incluye tres criterios básicos: tamaño, dinamismo y especialización; en su valoración, el puntaje máximo correspondió a 100 puntos: 30 para tamaño, 40 para dinamismo y 30 para especialización. La información se obtuvo por medio de consultas a los principales actores de las cadenas productivas, y se confrontó con la procesada y analizada por medio de tendencias que generan los productos de las cadenas (Jansenn et al., 1999; Ghezán et al., 1999; ISNAR, 1999; Valenzuela et al., 1999; Taddei et al., 2004). Las variables en cada criterio y su respectivo valor máximo se resumen en el Cuadro 1.
Cuadro 1. Puntaje máximo para jerarquizar las cadenas forestales del Estado de México, con base en su importancia socioeconómica.
DimensiónPuntaje máximo
Criterios Puntaje máximo
Variables
Sector primarioPuntaje máximo
Sector secundario
Puntaje máximo
Importancia Socioeconómica
100
Tamaño 30
Valor de la producción
5Valor de la producción
5
Superficie o inventario
5Unidades de producción
5
Empleos generados 5Empleos
generados5
Dinamismo
Tendencia del valor (constantes)
6Tendencia del
valor (constantes) 7
40Evaluación de precios reales(constantes)
7Evolución de unidades de producción
6
Evolución de empleo
7Evolución de
empleo7
Especialización 30
Coeficiente de especialización
(nacional)8
Coeficiente de especialización
(nacional)7
Concentración
(estatal)7
Concentración
(estatal)8
Las variables utilizadas en la valoración de los sectores primario y secundario fueron para el criterio de tamaño, el valor de la producción a precios constantes con base en el año 2002, número de unidades de producción o de productores para el sector primario; y solo unidades de producción para el secundario. Para el dinamismo, en ambos sectores se usaron la tendencia del valor real de la producción a precios constantes; la evolución de los precios reales, deflactados con el índice nacional de precios al consumidor al año base de 2002; y la evolución en el empleo.
The variables utilized in the appraisal of the secondary and primary sectors were for the criterion of size, the value of the production at constant prices based on the year 2002, the number of production units or of producers for the primary sector, and for the production units alone for the secondary sector. For dynamism, the tendency of the real value of the production at constant prices, the evolution of the real prices deflated with the national index of consumer prices to the baseline year 2002, and the evolution in the employment were used in both sectors.

Moctezuma et al., Jeraquización de cadenas forestales ante...
11
The estimation of the specialization criterion in the primary sector was based on the national specialization coefficient —considered as the quotient of the value of the production of the chain divided by the value of the total production of the national forest sector— and on the state concentration, calculated upon the basis of the value of the production of the chain at state level.
For the secondary sector, the national specialization coefficient was considered; this was determined based on the value of the agro-industrial production of the chain and of the total of the sectors of the forest industry; and the state concentration was calculated based on the quotient of the total value of production of the chain in the state and the total value of the production of the national chain in the years 1998 and 2004.
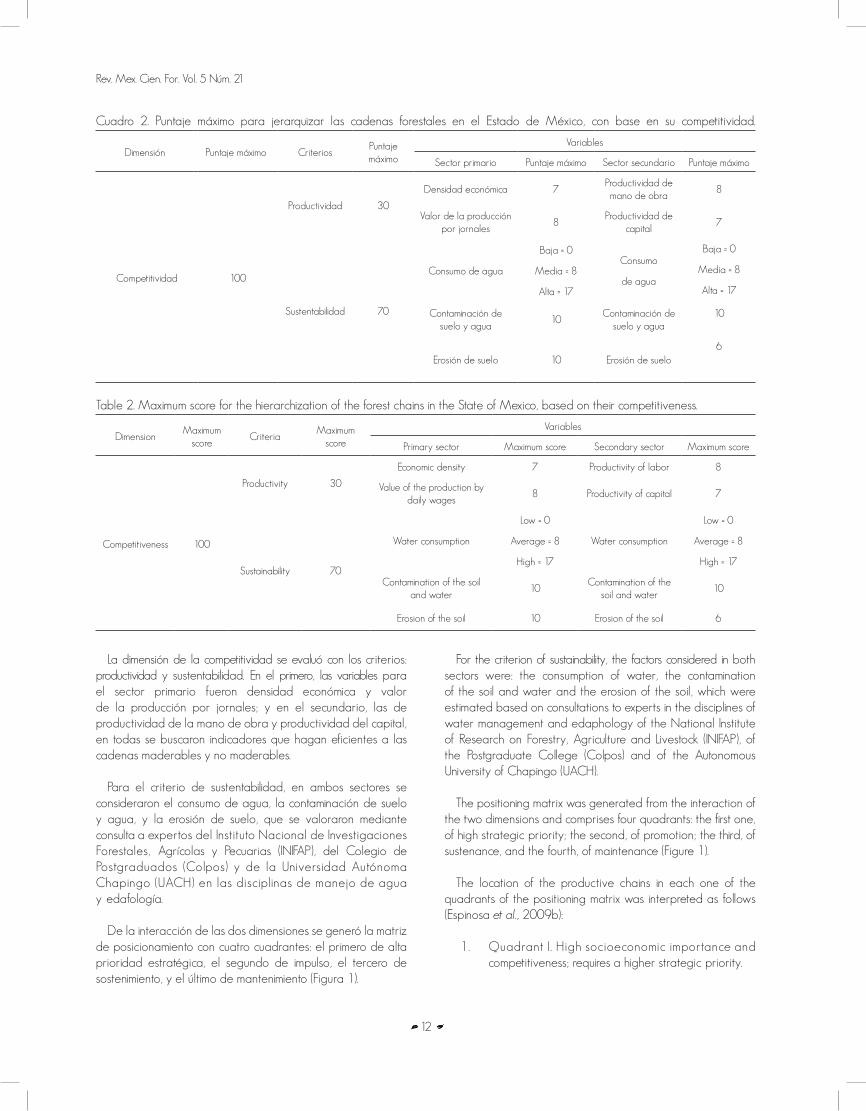
For the competitiveness dimension, the criteria of productivity and sustainability were utilized. Its maximum value, like that of the previous dimension, was 100 points (Table 2).
The dimension of competitiveness was evaluated according to the criteria of productivity and sustainability. In relation to the first, the variables for the primary sector were the economic density and the value of the production by daily wages; and for the secondary sector, the productivity of the labor and the productivity of the capital; in all cases, indicators were sought to render both the timber-yielding and the non-timber-yielding chains efficient.
El criterio de especialización en el sector primario se estimó a partir del coeficiente de especialización nacional, que se consideró como el cociente del valor de la producción de la cadena entre el valor de la producción total del sector forestal nacional; y la concentración estatal, cuyo cálculo se hizo con base en el valor de la producción de la cadena en el ámbito estatal.
En el sector secundario se tomó en cuenta el coeficiente de especialización nacional, que se determinó con el valor de la producción agroindustrial de la cadena y el total de los sectores de la industria forestal; y la concentración estatal, se calculó mediante el cociente del valor total de producción de la cadena en el estado, y el valor total de producción de la cadena nacional, en los años 1998 y 2004.
En el caso de la dimensión competitividad se emplearon los criterios de productividad y sustentabilidad. Su valor máximo, al igual que la dimensión anterior, fue de 100 puntos (Cuadro 2).
Table 1. Maximum score for the hierarchization of the forest chains of the State of Mexico, based on their socioeconomic importance.
DimensionMaximum
scoreCriteria
Maximum score
Variable
Primary sectorMaximum
scoreSecondary sector
Maximum score
Socio-economic importance
100
Size 30
Value of the production
5Value of the production
5
Surface or inventory 5 Production units 5
Jobs generated 5 Jobs generated 5
Dynamism 40
Tendency of the value (constants)
6Tendency of the value (constants)
7
Evolution of real prices (constants)
7Evolution of
production units6
Evolution of employment
7Evolution of employment
7
Specialization 30
Specialization coefficient
8Specialization
coefficient (national)
7
Concentration
(at state level)7
Concentration
(at state level)8
Rev. Mex. Cien. For. Vol. 5 Núm. 21
12
For the criterion of sustainability, the factors considered in both sectors were: the consumption of water, the contamination of the soil and water and the erosion of the soil, which were estimated based on consultations to experts in the disciplines of water management and edaphology of the National Institute of Research on Forestry, Agriculture and Livestock (INIFAP), of the Postgraduate College (Colpos) and of the Autonomous University of Chapingo (UACH).
The positioning matrix was generated from the interaction of the two dimensions and comprises four quadrants: the first one, of high strategic priority; the second, of promotion; the third, of sustenance, and the fourth, of maintenance (Figure 1).
The location of the productive chains in each one of the quadrants of the positioning matrix was interpreted as follows (Espinosa et al., 2009b):
1. Quadrant I. High socioeconomic importance and competitiveness; requires a higher strategic priority.
Cuadro 2. Puntaje máximo para jerarquizar las cadenas forestales en el Estado de México, con base en su competitividad.
Dimensión Puntaje máximo CriteriosPuntaje máximo
Variables
Sector primario Puntaje máximo Sector secundario Puntaje máximo
Competitividad 100
Productividad 30
Densidad económica 7Productividad de mano de obra
8
Valor de la producción por jornales
8Productividad de
capital7
Sustentabilidad 70
Consumo de agua
Baja = 0
Media = 8
Alta = 17
Consumo
de agua
Baja = 0
Media = 8
Alta = 17
Contaminación de suelo y agua
10Contaminación de
suelo y agua10
Erosión de suelo 10 Erosión de suelo6
Table 2. Maximum score for the hierarchization of the forest chains in the State of Mexico, based on their competitiveness.
DimensionMaximum
scoreCriteria
Maximum score
Variables
Primary sector Maximum score Secondary sector Maximum score
Competitiveness 100
Productivity 30
Economic density 7 Productivity of labor 8
Value of the production by daily wages
8 Productivity of capital 7
Sustainability 70
Water consumption
Low = 0
Average = 8
High = 17
Water consumption
Low = 0
Average = 8
High = 17
Contamination of the soil and water
10Contamination of the
soil and water10
Erosion of the soil 10 Erosion of the soil 6
La dimensión de la competitividad se evaluó con los criterios: productividad y sustentabilidad. En el primero, las variables para el sector primario fueron densidad económica y valor de la producción por jornales; y en el secundario, las de productividad de la mano de obra y productividad del capital, en todas se buscaron indicadores que hagan eficientes a las cadenas maderables y no maderables.
Para el criterio de sustentabilidad, en ambos sectores se consideraron el consumo de agua, la contaminación de suelo y agua, y la erosión de suelo, que se valoraron mediante consulta a expertos del Instituto Nacional de Investigaciones Forestales, Agrícolas y Pecuarias (INIFAP), del Colegio de Postgraduados (Colpos) y de la Universidad Autónoma Chapingo (UACH) en las disciplinas de manejo de agua y edafología.
De la interacción de las dos dimensiones se generó la matriz de posicionamiento con cuatro cuadrantes: el primero de alta prioridad estratégica, el segundo de impulso, el tercero de sostenimiento, y el último de mantenimiento (Figura 1).

Moctezuma et al., Jeraquización de cadenas forestales ante...
13
2. Quadrant II. Low socioeconomic importance and high competitiveness; its growth should be promoted.
3. Quadrant III. High socioeconomic importance and low competitiveness; actions should be carried out to sustain it.
4. Quadrant IV. Low socioeconomic importance and competitiveness; requires a minimum intervention.
The information was obtained from statistics drawn from the Economic Census (INEGI, 2004), the database of Siacon-Sagarpa (2007), the Statistical Yearbook of the Forest Industry Production in Mexico (Semarnat 1994–2004), and consultations to experts.
For the effects of the climate change, historical data of the period 1980 to 2007 were utilized to determine the situation of the forest masses in the year 2010, and for its projection for the years 2030 and 2050 three models of general circulation (MGC) were used:
1. Hadley Center Global Enviromental Model (HADGEM) of the United Kingdom.
Impo
rtanc
ia
soci
oeco
nóm
ica Alto
III
Sostenimiento
I
Alta Prioridad Estratégica
BajoIV
Mínima intervención
II
De Impulso
Bajo Alto
CompetitividadFigura 1. Matriz de posicionamiento de las cadenas forestales en el Estado de México.
Soci
o-ec
onom
ic
impo
rtanc
e HighIII
Sustenance
I
High Strategic Priority
LowIV
Minimum intervention
II
Promotion
Low High
CompetitivenessFigure 1. Positioning matrix of the forest chains in the State of Mexico.
La ubicación de las cadenas productivas en cada uno de los cuadrantes de la matriz de posicionamiento se interpretó (Espinosa et al., 2009b) de la siguiente manera:
1. Cuadrante I. Importancia socioeconómica y competitividad altas, se requiere otorgar una prioridad estratégica superior.
2. Cuadrante II. Importancia socioeconómica baja y competitividad alta, hay que promover su crecimiento.
3. Cuadrante III. Importancia socioeconómica alta y competitividad baja, se deben realizar acciones para su sostenimiento.
4. Cuadrante IV. Importancia socioeconómica y competitividad bajas; se necesita una intervención mínima.
La información se obtuvo de estadísticas provenientes del Censo Económico (INEGI, 2004), de la base de datos Siacon-Sagarpa (2007), del Anuario Estadístico de la Producción Forestal en México (Semarnat 1994 – 2004) y de la consulta a expertos.
Para los efectos del cambio climático se utilizaron datos históricos del periodo 1980 a 2007, con los que se determinó la situación de

Rev. Mex. Cien. For. Vol. 5 Núm. 21
14
las masas forestales en el año 2010 y su proyección a los años 2030 y 2050, por medio de tres modelos de circulación general (CGM):
1. Hadley Centre Global Enviromental Model (HADGEM) del Reino Unido.
2. Geophysical Fluid Dynamics Laboratory (GFDL _ 2.0) de Alemania.
3. Componead Atmospheric Ocean, Sea Ice Models (MPIECHAM) de los Estados Unidos de América.
Los escenarios económicos usados en el proyecto para conocer los distintos comportamientos de los bosques en el Estado de México fueron:
A = Un mundo futuro con alto crecimiento económico.
B = Un mundo futuro con crecimiento moderado.
A1 y B1 = Un mundo en el que se supone habrá una globalización tal que las economías convergerán en su desarrollo.
B1 y B2 = Un mundo en el cual se considera que el desarrollo se dará más a nivel regional.
2. Geophysical Fluid Dynamics Laboratory (GFDL _ 2.0) of Germany.
3. Coupled Atmospheric-Ocean Sea Ice Model (MPIECHAM) of the United States of America.
The economic settings used in the project in order to learn the different behaviors of the forests in the State of Mexico were:
A = A future world with a high economic growth.
B = A future world with a moderate growth.
A1 and B1 = A world in which supposedly there will be a globalization such that the economies will converge in their development.
B1 and B2 = A world in which the development is expected to occur at a more regional level.
Cuadro 3. Valor de la producción, unidades de producción y empleos generados para las principales cadenas forestales del Estado de México.
Cadena/ SistemaValor de la producción
(1)
Superficie e Inventario
(2)
Empleos generados
(3)
Pino 104 784 080.59 270 392 13 520
Oyamel 44 860 530.05 270 392 13 520
Resinas 11 561 760.56 9 911 496
Tierra de monte 7 299 569.04 9 911 496
Encino 4 101 801.28 270 392 13 520
Otras coníferas 2 442 595.54 151 114 7 556
Otras latifoliadas 842 667.27 126 652 6 333
Otros 560 167.26 9 911 496
Rizomas 3 078.14 9 911 496
Subtotal forestal 176 456 249.72 558 069 27 905Fuente: Anuarios Estadísticos de la Producción Forestal. (Semarnat, 1994 – 2004). (1) El valor de la producción está dado en miles de pesos, es el promedio de 5 años (2000-2005) para silvicultura. (2) El promedio es 2002-2006 para forestal.

Moctezuma et al., Jeraquización de cadenas forestales ante...
15
Table 3. Value of the production, production units and jobs generated for the main forest chains of the State of Mexico.
Chain/ SystemValue of the production
(1)
Surface and Inventory
(2)
Jobs generated
(3)
Pine 104 784 080.59 270 392 13 520
Sacred fir 44 860 530.05 270 392 13 520
Resins 11 561 760.56 9 911 496
Woodland earth 7 299 569.04 9 911 496
Red oak 4 101 801.28 270 392 13 520
Other conifers 2 442 595.54 151 114 7 556
Other broadleaves 842 667.27 126 652 6 333
Others 560 167.26 9 911 496
Rhizomes 3 078.14 9 911 496
Forest subtotal 176 456 249.72 558 069 27 905Source: Anuarios Estadísticos de la Producción Forestal. (Semarnat, 1994 – 2004). (1) The value of the production is given in thousands pesos and is the average of 5 years (2000-2005) for silviculture; (2) The average is 2002-2006 for the forest industry.
RESULTS AND DISCUSSION
Socioeconomic importance
The results of the value of the production, surface and inventories, as well as the jobs generated are shown in Table 3.
Outstanding for their importance in terms of the value of the production are the pine —the most prominent chain—, followed by the sacred fir and, in third place, the resins, which are obtained chiefly from the genus Pinus. These add up to 91.4 % of the total in the state; however, they represent only 2.1 % of the entire primary sector (agriculture, livestock and silviculture). When considering only the pine chain, its value adds up to 59.3 % of the subsector and to a mere 1.4 % of the three primary subsectors.
As for the jobs generated and the surface of the forest mass covered by pine, red oak and sacred fir, each of these amounted to 48.5 % within the subsector. It is worth noting that the three groups of species were assigned the same amount for surface and jobs, due to the lack of data and to the fact that the figures of the wooded masses are not itemized by taxon but are integrated in large assemblies that include other conifers and broadleaves.
The specialization analysis reveals those chains that had the greatest importance due to the high level of their contribution of economic resources through the value of the production (Table 4).
The chains pertaining to woodland earth and sacred fir registered the highest levels of specialization behavior.
RESULTADOS Y DISCUSIÓN
Importancia socioeconómica
Los resultados del valor de la producción, superficie e inventarios, así como los empleos generados se consignan en el Cuadro 3.
Destacan por su importancia, en cuanto a valor de la producción, el pino como la cadena más relevante, seguida por la de oyamel y en tercer lugar la de resinas, que se obtienen principalmente del género Pinus. Estas suman 91.4 % del total en la entidad; sin embargo, al compararlas con todo el sector primario (agricultura, ganadería y silvicultura) solo representan 2.1 %. Al considerar únicamente la cadena pino, su valor alcanza 59.3 % del subsector y 1.4 % de los tres subsectores primarios.
Respecto a los empleos generados, así como a la superficie de la masa forestal cubierta por pino, encino y oyamel significaron, en ambos casos, 48.5 % en el subsector. Cabe señalar que a los tres grupos de especies se les asignó la misma cantidad en superficie y empleos, debido a la falta de datos y a que las cifras de las masas arboladas no están desglosadas por taxón, sino que se integran en grandes conjuntos que incluyen a otras coníferas y latifoliadas.
En el análisis de especialización, se aprecian aquellas cadenas que tuvieron mayor importancia por el alto nivel de aportación de recursos económicos mediante el valor de la producción (Cuadro 4).

Rev. Mex. Cien. For. Vol. 5 Núm. 21
16
Cuadro 4. Coeficiente de especialización e índice de concentración de las cadenas forestales más importantes del Estado de México.
Cadena/Sistema Coeficiente de especialización (1) Índice de concentración (2)
Pino 0.001 0.000044
Oyamel 0.020 0.000590
Resinas 0.006 0.000192
Tierra de monte 0.029 0.000868
Encino 0.001 0.000026
Otras coníferas 0.007 0.000215
Otras latifoliadas 0.001 0.000025
Otros n/d 0.000006
Rizomas 0.003 0.0001031 Se usó la fórmula: (VP
ce/VP
te) / (VP
cn/VP); VP
ce= valor de la producción de la cadena respectiva en el estado; VP
te= valor de la producción total del sector agropecuario
en el estado; VPcn= valor de la producción de la cadena respectiva en el país; VP
tn= valor de la producción total del sector agropecuario en el país.
2 Datos del 2001, con la fórmula: (VPce/VP); VP
ce= valor de la producción de la cadena respectiva en el estado; VP
cn= valor de la producción de la cadena en el país.
Table 4. Specialization coefficient and concentration index of the most important forest chains of the State of Mexico.
Chain/system Specialization coefficient (1) Concentration index (2)
Pine 0.001 0.000044
Sacred fir 0.020 0.000590
Resins 0.006 0.000192
Woodland earth 0.029 0.000868
Red oak 0.001 0.000026
Other conifers 0.007 0.000215
Other broadleaves 0.001 0.000025
Others n/d 0.000006
Rhizomes 0.003 0.0001031 The following formula was used: (VP
cs/VP
ts) / (VP
cn/VP); VP
cs= value of the production of the respective chain in the state; VP
ts= value of the total production of the agriculture
and livestock sector in the state; VPnc
= value of the production of the respective chain in the country; VPtn= value of the total production of the agriculture and livestock
sector in the country.2 Data of 2001, with the formula: (VP
cs/VP); VP
cs= value of the production of the respective chain in the state; VP
cn= value of the production of the chain in the country.
Las cadenas correspondientes a tierra de monte y oyamel registraron el mayor comportamiento de especialización.
El índice de concentración relaciona el valor de la producción del Estado de México, con respecto al de toda la cadena en el ámbito nacional. En este sentido, la cadena tierra de monte tuvo el índice de concentración más grande.
En el Cuadro 5 se presentan los valores de las unidades económicas, personal ocupado y valor de la producción para la industria maderera en el Estado de México.
Con base en el número de establecimientos, de acuerdo a la clasificación de la Secretaría de Economía, la industria de la madera ocupó el tercer lugar, después de la panadera y tortillera; en segundo lugar se ubicó la de productos lácteos.
The concentration index relates the value of the production of the State of Mexico, with respect to that of the chain at the national level. In this sense, the woodland earth forest chain had the highest concentration index.
Table 5 shows the values of the economic units, the personnel employed and the value of the production for the lumber industry in the State of Mexico.

Moctezuma et al., Jeraquización de cadenas forestales ante...
17
Con relación al total de establecimientos dedicados a la industria maderera, el Estado de México contribuyó con 8.14 % del total de unidades económicas, y al confrotarla con la de otros estados de la república, Durango contribuyó con 1.87 % de los establecimientos madereros del país, mientras que Chihuahua, Michoacán y Oaxaca con 2.42 %, 15.36 % y 4.96 %, respectivamente. Referente al personal, le correspondió el sexto lugar, y los dos primeros sitios fueron para las ramas industriales antes mencionadas. Cuando se comparó la importancia de la participación en la generación de empleos, el Estado de México contribuyó solo con 1.24 % de las fuentes de trabajo que se dieron en la industria manufacturera y fue superado por Michoacán que aporta 10.44 % (8.4 veces más), siguieron en orden de importancia Durango, Oaxaca y Chihuahua con 9.54 %, 7.54 % y 2.54 %, respectivamente. Para el caso del valor de la producción, ocupó el octavo lugar, en tanto que los más importantes resultaron las ramas de elaboración de productos lácteos y la industria de bebidas. El valor de la producción de la industria de la madera en el Estado de México representó 9.25 % del valor nacional (11 719 995 pesos) y superó al estado de Oaxaca que aportó 4.29 %, pero Durango, Chihuahua y Michoacán tuvieron participaciones más significativas con proporciones de 15.58 %, 15,07 % y 11.47 %, respectivamente. Los cinco estados, en forma conjunta alcanzaron más de la mitad del valor nacional (55.56 %).
El análisis del sector secundario se complementó con el criterio de especialización, evaluado con base en el valor de la producción industrial maderera de la cadena que se ubicó en el segundo lugar, por el alto nivel de especialización y aportación de recursos económicos, y solo fue superada por las agroindustrias de la conservación de frutas, verduras y guisos. En un estudio similar sobre el sector agropecuario en Hidalgo, se determinó que los coeficientes de especialización de las principales cadenas agroproductivas presentaron 24.00 para el maguey pulquero y siguieron las cadenas de cebada grano con coeficiente de 10.47 y la pecuaria de ovinos con 10.21 (Espinosa et al., 2009a).
Competitividad
La competitividad es un factor sobresaliente en la sustentabilidad de las empresas y de los recursos, de acuerdo a Porter (1996), para los empresarios significa la capacidad de competir en los mercados con una estrategia mundial; para el gobierno, que la nación tenga una balanza comercial positiva, y para los economistas, un bajo costo unitario de mano de obra ajustada a los tipos de cambio; además se considera una medida multidimensional de naturaleza cualitativa y cuantitativa, imposible de reflejarse en una medida unidimensional. En el Cuadro 6 se muestran
Cuadro 5. Valores de la producción industrial maderera en el Estado de México.
Variable Industria de la madera
Unidades económicas (Núm.) 1 443
Personal ocupado (Núm.) 5 649
Valor de la producción (miles $) 2 349 348.13
Coeficiente de especialización 7.424
Índice de concentración 0.189Fuente: Censos Económicos (INEGI, 2006).
Table 5. Values of the production of the lumber industry in the State of Mexico.
Variable Lumber industry
Economic units (No.) 1 443
Personnel employed (No.) 5 649
Value of the production (thousands of $)
2 349 348.13
Specialization coefficient 7.424
Concentration index 0.189Source: Censos Económicos (INEGI, 2006).
Based on the number of establishments, according to the classification by the Department of Economy, the lumber industry occupied the third place, after the industries of baked goods and tortillas; the industry of dairy products occupied the second place. Of the total number of establishments dedicated to the lumber industry in the country, the State of Mexico contributed 8.14 %; as for other states of the Republic, Durango contributed 1.87 %, while Chihuahua, Michoacan and Oaxaca contributed 2.42 %, 15.36 % and 4.96 %, respectively. In relation to the personnel, it occupied the sixth place, and the first two places were for the industrial branches mentioned above. When comparisons were made for the importance of the participation in the generation of jobs, the State of Mexico contributed alone contributed 1.24 % of the sources of work in the manufacturing industry and was surpassed by Michoacan, which contributes 10.44 % (8.4 times more); the next states in order of importance were Durango, Oaxaca and Chihuahua, with 9.54 %, 7.54 % and 2.54 %, respectively. In terms of the value of the production, it occupied the 8th place, while the highest places were for the elaboration of dairy products and the industry of beverages. The value of the production of the lumber industry in the State of Mexico represented 9.25 % of the national value (11 719 995 pesos) and surpassed the state of Oaxaca, which contributed 4.29 %, while Durango, Chihuahua and Michoacan had more significant participations, with proportions of 15.58 %, 15.07 % and 11.47 %, respectively. The five states together added up to more than one half of the national value (55.56 %).

Rev. Mex. Cien. For. Vol. 5 Núm. 21
18
los datos de la productividad para la variable densidad económica, misma que se calculó al dividir el valor relativo de la producción entre la superficie boscosa relativa, cuyo 100 % correspondió al total de la superficie de las masas arboladas incluidas en el análisis.
En el subsector forestal, la mayor densidad económica fue para la cadena de las resinas, seguida por la de tierra de monte y en tercer lugar la cadena pino. En el estudio de cadenas agropecuarias de Espinosa et al. (2009), las mayores densidades económicas de las cadenas agrícolas se obtuvieron para la de maguey pulquero, con 4.20; chile verde, con 2.68; y ejote, con 2.48; en tanto que, para las cadenas pecuarias, la de más densidad fue la de porcinos, con 1.91, y aves para carne y bovinos leche, con 0.98 y 0.72.
Cuadro 6. Densidad económica de las cadenas forestales más importantes del Estado de México.
Cadena/Sistema Densidad económica (participación %)
Pino 1.96
Oyamel 0.84
Resinas 5.90
Tierra de monte 3.72
Encino 0.08
Otras coníferas 0.08
Otras latifoliadas 0.03
Otros 0.29
Rizomas 0.00
Table 6. Economic density of the main forest chains of the State of Mexico.
Chain/system Economic density (participation %)
Pine 1.96
Sacred fir 0.84
Resins 5.90
Woodland earth 3.72
Red oak 0.08
Other conifers 0.08
Other broadleaves 0.03
Others 0.29
Rhizomes 0.00
El criterio de productividad de mano de obra se estimó como el cociente del valor de la producción bruta (en miles de pesos) entre el personal ocupado (número de empleos), y
The analysis of the secondary sector was complemented with the specialization criterion, evaluated based on the value of the production of the lumber industry of the chain, which attained the second place due to its high level of specialization and contribution of economic resources and was surpassed only by the agroindustries of fruit, vegetable and stew preserves. A similar study of the agriculture and livestock sector in Hidalgo determined that the coefficients of specialization of the main agroproductive chains were 24.00 for the pulque aloe, followed by 10.47 for the barley chain and 10.21 for the ovine livestock chain (Espinosa et al., 2009a).
Competitiveness
Competitiveness is a prominent factor in the sustainability of the businesses and of the resources, according to Porter (1996); for the businessmen, it signifies the ability to compete in the markets with a world strategy; for the government, it means a positive trade balance for the nation, and for the economists, a low cost per unit of labor adjusted to the exchange rates; furthermore, it is considered a multidimensional measure of quantitative and qualitative nature, which cannot be reflected in a one-dimensional measure. Table 6 shows the data of the productivity for the variable economic density, estimated by dividing the relative value of the production by the relative wooded surface, whose 100 % corresponded to the total surface of the wooded masses included in the analysis.
Cuadro 7. Productividad de mano de obra y capital, de la industria maderera en el Estado de México.
DescripciónProductividad mano
de obra*Productividad del
capital**
Industria de la madera
200.51 1.6
Fuente: INEGI (2004).Valores a precios constantes, 2006=100; * miles de pesos por empleo. ** pesos producidos por cada activo fijo.
Table 7. Productivity of labor and capital of the lumber industry in the State of Mexico.
DescriptionProductivity of the
labor*Productivity of the
capital**
Lumber industry 200.51 1.6Source: INEGI (2004).Values at constant prices, 2006=100; * Thousands of pesos per job. ** Pesos produced by each fixed asset.
In the forest subsector, the highest economic density was for the chain of the resins, followed by the woodland earth chain and, in third place, the pine chain. In the study of agricultural and livestock chains by Espinosa et al. (2009), the highest economic densities of the agricultural chains were obtained for the pulque aloe, with 4.20; green chili peppers, with 2.68, and

Moctezuma et al., Jeraquización de cadenas forestales ante...
19
Socioeconómica = Socio-Economic Importance; Sostenimiento = Sustenance; Alta prioridad = High priority; Pino = Pine; Oyamel = Sacred fir; Encino = Red oak; Otras coníferas = Other conifers; Otras latifoliadas = Other broadleaves; Resinas = Resins; De impulso = Promotion; Tierra de monte = Woodland Earth; Mínima intervención = Minimum intervention; Rizomas = Rhizomes; Competitividad = Competitiveness
Figura 2. Matriz de posicionamiento de las principales cadenas forestales en el Estado de México.Figure 2. Positioning matrix of the main forest chains in the State of Mexico.
la productividad del capital se determinó como el valor de la producción bruta total (en miles de pesos) entre los activos fijos netos (en miles de pesos) (Cuadro 7).
El ramo de la industria maderera es uno de los que tienen menor productividad, tanto de la mano de obra como del capital; al compararse con otras industrias como la agroindustria de elaboración de alimentos balanceados para ganado, la supera por más de 10 veces en productividad de la mano de obra; y la agroindustria láctea es casi siete veces superior en productividad de capital; aunque hay similitud con las cadenas agroproductivas del estado de Hidalgo en cuanto a la productividad de la mano de obra con la de frijol grano (203.3), alfalfa verde (216.3), porcinos (230.1) y carne de aves (159.4) (Espinoza et al., 2009).
Ponderación de la importancia socioeconómica
Los resultados para la dimensión de importancia socioeconómica de las cadenas forestales, así como de sus variables tamaño, dinamismo y especialización, tanto del sector primario como secundario se resumen en el Cuadro 8.
green beans, with 2.48. As for the livestock chains, the highest densities were for pork, with 1.91, and poultry raised for meat, and bovine milk, with 0.98 and 0.72.
The labor productivity criterion was estimated as the quotient of the value of the rough production (in thousands of pesos) divided by the employed personnel (number of jobs), and the productivity of the capital was determined as the value of the total rough production (in thousands of pesos) divided by the net fixed assets (in thousands of pesos) (Table 7).
The lumber industry is one of the industries with the lowest labor and capital productivity; compared to other industries, the labor productivity of the agro-industry of balanced cattle feed surpasses it by more than 10 times; and the capital productivity of the milk agro-industry is almost 7 times higher. However, there is a similarity between the agroproductive chains of the state of Hidalgo and the productivity of the labor for beans (203.3), green alfalfa (216.3), pork (230.1) and poultry meats (159.4) (Espinosa et al., 2009).
Weighting of the socioeconomic importance
The results for the socioeconomic importance dimension of the forest chains, as well as for its variables of size, dynamism and specialization in both the primary and the secondary sectors are summarized in Table 8.

Rev. Mex. Cien. For. Vol. 5 Núm. 21
20
Las tres cadenas forestales mejor ponderadas, desde el punto de vista de la importancia socioeconómica fueron oyamel, pino y encino con calificaciones de 58, 51 y 46, respectivamente. Como se observa en los cuadros 1 y 2 se partió de la calificación máxima y se establecieron intervalos para definir el valor de las variables, posteriormente, se sumaron para cada una de las cadenas forestales maderables y no maderables.
Ponderación de la competitividad
Bajo la misma consideración que se hizo para la importancia socioeconómica, los resultados para la dimensión de la competitividad de las cadenas forestales se consignan en el Cuadro 9.
The three best weighted forest chains, from the perspective of their socioeconomic importance, were: the sacred fir, pine and red oak, with the scores 58, 51 and 46, respectively. As may be observed in tables 1 and 2, the baseline was the maximum score, and intervals were established to define the value of the variables; subsequently, they were added for each of the timber-yielding and non-timber-yielding forest chains.
Weighting of competitiveness
Under the same consideration made for the socioeconomic importance, the results for the competitiveness dimension of the forest chains are shown in Table 9.
The most prominent chains resulted turned out to be the sacred fir and the resins, both of which obtained a score of 51. Next in order of importance was pine, with 45 points. For the sustainability criterion, the experts were consulted by means of a structured interview, and they all agreed in assigning the highest scores to this criterion, since, in their opinion, it is the one that
Cuadro 8. Ponderación de la importancia socioeconómica de las cadenas forestales del Estado de México.
Cadena productiva Tamaño Dinamismo Especialización
TotalSector primario
Sector secundario
Sector primario
Sector secundario
Sector primario
Sector secundario
Maderable
Oyamel 12 3 12 13 9 9 58
Pino 15 3 9 13 2 9 51
Encino 11 3 8 13 2 9 46
Otras coníferas 5 3 6 13 3 9 39
Otras latifoliadas 5 3 2 13 2 9 34
No Maderables
Resinas 3 3 4 13 2 9 34
Tierra de monte 3 0 8 0 15 0 26
Rizomas 3 0 1 0 2 0 6
Table 8. Weighting of the socioeconomic importance of the forest chains of the State of Mexico.
Productive chain Size Dynamism SpecializationTotalPrimary
sectorSecondary
sectorPrimary sector
Secondary sector
Primary sector
Secondary sector
Timber-yielding
Sacred fir 12 3 12 13 9 9 58
Pine 15 3 9 13 2 9 51
Red oak 11 3 8 13 2 9 46
Other conifers 5 3 6 13 3 9 39
Other broadleaves 5 3 2 13 2 9 34
Non-timber-yielding
Resins 3 3 4 13 2 9 34
Woodland earth 3 0 8 0 15 0 26
Rhizomes 3 0 1 0 2 0 6

Moctezuma et al., Jeraquización de cadenas forestales ante...
21
Cuadro 9. Ponderación de la competitividad de las cadenas forestales del Estado de México.
Cadena productivaProductividad Sustentabilidad Dinamismo
TotalSector primario
Sector secundario
Sector primario
Sector secundario
Sector primario
Sector secundario
Maderable
Oyamel 9 2 17 0 20 3 51
Pino 3 2 17 0 20 3 45
Otras coníferas 2 2 17 0 20 3 44
Encino 2 2 17 0 20 3 44
Otras latifoliadas 2 2 17 0 20 3 44
No Maderables
Resinas 9 2 17 0 20 3 51
Rizomas 2 0 17 0 20 3 42
Tierra de monte 5 0 17 0 15 0 37
Table 9. Weighting of the competitiveness of the forest chains of the State of Mexico.
Productive chain Productivity Sustainability DynamismTotalPrimary
sectorSecondary
sectorPrimary sector
Secondary sector
Primary sector
Secondary sector
Timber-yielding
Sacred fir 9 2 17 0 20 3 51
Pine 3 2 17 0 20 3 45
Other conifers 2 2 17 0 20 3 44
Red oak 2 2 17 0 20 3 44
Other broadleaves
2 2 17 0 20 3 44
Non-timber-yielding
Resins 9 2 17 0 20 3 51
Rhizomes 2 0 17 0 20 3 42
Woodland earth 5 0 17 0 15 0 37
Las cadenas más relevantes resultaron la de oyamel y la de resinas, ambas obtuvieron un puntaje de 51; siguió en orden de importancia la de pino con 45 puntos. Para el criterio de sustentabilidad, se consultó a los expertos por medio de una entrevista estructurada y su opinión coincidió en el sentido de asignar las calificaciones más altas a este criterio, ya que, de acuerdo a su visualización, es el que tiene una mayor contribución a la conservación de los recursos naturales, en virtud de que el bosque y sus componentes captan y retienen agua, disminuyen la erosión, retienen los suelos y evitan desastres naturales al atenuar el deslizamiento de tierra en laderas montañosas; asimismo, las masas forestales capturan carbono, además de que tienen un rol importante en el establecimiento del paisaje natural.
most contributes to the preservation of the natural resources, as the forest and its components capture and retain water, reduce the erosion, contain the soils and avoid natural disasters by reducing the landslide in mountainous slopes; furthermore, the forest masses capture carbon, and besides, they play an important role in the establishment of the natural landscape.
Positioning matrix
The main results of the forest subsector are illustrated by a positioning matrix (Figure 2). Outstanding for their socioeconomic importance and by their competitiveness is the chain of sacred fir, followed by those of pine and red oak.
The total scores of the forest productive chains of sacred fir, pine and red oak of the State of Mexico were 109, 96 and 90, respectively (Table 10). The position of the sacred fir, pine and red oak in the positioning matrix is different and, consequently, the recommended strategy is different. The sacred fir chain is

Rev. Mex. Cien. For. Vol. 5 Núm. 21
22
Cuadro 10. Puntaje obtenido en la priorización de las principales cadenas forestales en el Estado de México.
Cadena Competitividad Importancia Socioeconómica Puntaje Total
Pino 45 51 96
Oyamel 51 58 109
Otras coníferas 44 39 83
Encino 44 46 90
Otras latifoliadas 44 34 78
Resinas 51 34 85
Rizomas 42 6 48
Tierra de monte 37 26 63
Table 10. Score obtained in the prioritization of the main forest chains in the State of Mexico.
Chain Competitiveness Socioeconomic importance Total score
Pine 45 51 96
Sacred fir 51 58 109
Other conifers 44 39 83
Red oak 44 46 90
Other broadleaves 44 34 78
Resins 51 34 85
Rhizomes 42 6 48
Woodland earth 37 26 63
Matriz de posicionamiento
Los principales resultados del subsector forestal se ilustran en una matriz de posicionamiento (Figura 2). Resaltan por su importancia socioeconómica y por su competitividad la cadena de oyamel, seguida por las de pino y encino.
El puntaje total de las cadenas productivas forestales oyamel, pino y encino del Estado de México fue 109, 96 y 90, respectivamente (Cuadro 10). La ubicación del oyamel, pino y encino en la matriz de posicionamiento es diferente y, en consecuencia, la estrategia recomendable es diferente. Con respecto a la cadena de oyamel, se le considera como de alta prioridad, la de pino de sostenimiento, el encino es de mínima intervención y para la cadena resinera, la estrategia es de impulso.
CONCLUSIONES
En función de su importancia socioeconómica y competitividad en el Estado de México, las cadenas de oyamel, pino y encino son las más importantes para el subsector.
considered as high priority; that of pine, as sustenance; that of the red oak, as of minimum intervention, and the strategy for the resin is promotion.
CONCLUSIONS
In terms of their socioeconomic importance and competitiveness in the State of Mexico, the chains of sacred fir, pine and red oak are the most important for the subsector.
In the positioning matrix, the sacred fir productive chain is the only one located in Quadrant I, i.e. the only one considered as of high strategic priority.
The pine chain is located in Quadrant III, classified as sustenance, and the red oak chain, in Quadrant IV, i.e. minimum intervention; this same quadrant includes other conifers, other broadleaves, woodland earth and rhizomes; all with a similar level of competitiveness, although listed in order of decreasing socioeconomic importance. On the other hand, the resins chain is part of Quadrant II, known as promotion, because it has been attributed a slightly higher level of competitiveness than the chains cited above.

Moctezuma et al., Jeraquización de cadenas forestales ante...
23
En la matriz de posicionamiento, la cadena productiva de oyamel es la única que se ubicó en el Cuadrante I, considerado como de alta prioridad estratégica.
En el Cuadrante III, catalogado como de sostenimiento se ubica el pino y en el Cuadrante IV de mínima intervención se localiza la cadena encino; en este mismo se sitúan otras coníferas, otras latifoliadas, tierra de monte y rizomas, todas ellas con similar nivel de competitividad; aunque con importancia socioeconómica decreciente en el orden en que se anotan. En cambio, la cadena de resinas forma parte del Cuadrante II, llamado de impulso por habérsele atribuido un nivel de competitividad ligeramente mayor al de las otras cadenas.
AGRADECIMIENTO
Al Consejo Nacional de Ciencia y Tecnología (Conacyt) por haber aportado los recursos monetarios para la realización del presente trabajo de investigación a través del proyecto “Definición de Acciones sobre el Riesgo en Materia de Adaptación y Vulnerabilidad para el Sector Primario ante el Cambio Climático en el Estado de México”.
REFERENCIAS
Espinosa G., J. A., D. E. Bustos C., V. Cuevas R. y G. Moctezuma L. 2009a. Demandas de Investigación y Transferencia de Tecnología Agropecuaria en el Estado de Querétaro. INIFAP. Querétaro, Qro. México. 98 p.
Espinosa G., J. A., V. Cuevas R., G. Moctezuma L., F. Romero S., J. L. Jolalpa B., D. E. Bustos C. y A. Vélez I. 2009b. Visión Estratégica para el Análisis de Cadenas Agroalimentarias en el Estado de Hidalgo. INIFAP. Pachuca, Hgo. México. Libro Técnico Núm. 1. 159 p.
Ghezán, G., S. Brieva y L. Iriarte 1999. Análisis Prospectivo de la Demanda Tecnológica en el Sistema Agroindustrial. Servicio Nacional para la Investigación Agrícola Nacional. Respuestas de la Investigación Agrícola a las Nuevas Demandas Tecnológicas: Agroindustria y Recursos Naturales. La Haya, Países Bajos. 99 p.
González, E. A. y S. Wood. 2006. Impactos económicos de tecnologías para el campo mexicano. INIFAP. Chapingo, Edo. de Mex. México. Libro Científico Núm.1. 411 p.
Instituto Nacional de Estadística y Geografía (INEGI). 2004. Censo Económico. México, D.F. México. 479 p.
Instituto Nacional de Estadística y Geografía (INEGI), 2006. Censo Económico. México. México, D.F. México. 498 p.
Jansenn, W. y J. Tola (eds.) 1999. Integración de Demandas Agroindustriales y Ambientales en la Investigación Agrícola para el Siglo 21. In:Memorias de un Seminario Internacional. Servicio Internacional para la Investigación Agrícola Nacional (ISNAR). La Haya. Países Bajos.107 p.
Jolalpa B., J. L., G. Moctezuma L., A. González H. y M. M. Pérez D. 2010. Determinación de las Principales Cadenas Productivas en el Sector Agrícola, Pecuario y Forestal en el Estado de México. In: Memoria del XXXIII Congreso Internacional de Administración de Empresas Agropecuarias. San Luis Potosí, SLP. México. 455 p.
Pérez D., M. M., G. Moctezuma L., J. L. Jolalpa B. y A. González H. 2010. Fase de Priorización en las Cadenas Pecuarias, para Evaluar las Principales Tecnologías Ganaderas, ante la Adaptación y Vulnerabilidad del Cambio Climático en el Estado de México. In: Cavalloti, A., B., C. Vázquez F., M. Álvarez y B. Ramírez V. (comps.). Cambios Tecnológicos y Sustentabilidad de la Producción del Libro Los Grandes Retos para la Ganadería: Hambre, Pobreza y Crisis Ambiental. Universidad Autónoma Chapingo. Texcoco, Edo de Méx. México. pp. 379–388.
ACKNOWLEDGMENT
The authors wish to express their gratitude to the National Council of Science and Technology (Conacyt) for having contributed the monetary resources for the execution of the present research through the project “Definition of Actions on Adaptation and Vulnerability Related Risk for the Primary Sector in the Face of the Climate Change in the State of Mexico”.
End of the English version
Secretaría del Medio Ambiente y Recursos Naturales y Pesca (Semarnat).1994 – 2004. Anuario Estadístico de la Producción Forestal. México, D.F., México. 213 p.
Secretaría de Agricultura, Ganadería, Desarrollo Rural, Pesca y Alimentación (Sagarpa), 2010. Cadenas del Sector Hortofrutícola de Córdoba www.sagarpa.gob.mx/desarrolloRural/Documents/cambioclimatico/QUE%20ES%20%CAMBIO%20CLIMATICO.pdf. (30 de octubre de 2010.).
Servicio Internacional para La Investigación Agrícola Nacional (ISNAR). 1999. Integración de Demandas Agroindustriales en la Investigación Agropecuaria. Módulo de Capacitación. La Haya. Países Bajos. 373 p.
Sistema de Información Agroalimentaria de Consulta- Secretaría de Agricultura, Ganadería, Desarrollo Rural, Pesca y Alimentación (Siacon-Sagarpa).Servicio de Información Agroalimentaria de Consulta -Secretaría de Agricultura, Ganadería y Desarrollo Rural. 1980-2007. México, D. F. México. 41 p.
Taddei B., C., E. Valenzuela C., J. Robles P., M. Martín R., A. Zapien S., H. González R. y R. Armenta C. 2004. Cadena Productiva Bovinos
Carne: Detección de Necesidades de Investigación y Transferencia de Tecnología. Sagarpa. INIFAP. México, D.F. México. Libro Técnico Núm. 3. 136 p.
Valenzuela C., E., J. A. Espinosa G., G. Barrera C., H. Vaquera H., O. H. Moreno R., M. A. Velázquez H. y E. Casas Díaz. 1999. Evaluación del Impacto Ambiental y Productivo de Proyectos de Desarrollo Tecnológico en el Cultivo del Trigo en México. Servicio Internacional para la Investigación Agrícola Nacional (ISNAR). La Haya, Países Bajos. 31 p.
Velásquez, F., J. Plaza, B. Gutiérrez, J. Pulido, G. Rodríguez, M. Romero y J. Carranza. 1999. Método de Planificación del Desarrollo Tecnológico en Cadenas Agroindustriales que Integra Principios de Sostenibilidad y Competitividad. ISNAR. La Haya, Países Bajos. 93 p..