Jordi Sunyer
73
Retos para la mejora de la calidad del aire Los efectos en la salud de la contaminación atmosférica Jordi Sunyer CREAL 20/9/2012 ENCUENTRO
-
Upload
uimp-pirineos -
Category
Documents
-
view
227 -
download
0
description
Jordi Sunyer
Transcript of Jordi Sunyer

Retos para la mejora de la calidad del aire
Los efectos en la salud de la contaminación atmosférica
Jordi Sunyer
CREAL 20/9/2012
ENCUENTRO

Beijing Olympic games (2008)
By Aymeric Ung, InVS
0
100
200
300
400
500
15-May
22-May
29-May
5-Jun
12-Jun
19-Jun
26-Jun
3-Jul
10-Jul
17-Jul
24-Jul
31-Jul
7-Aug
14-Aug
21-Aug
28-Aug
4-Sep
Date
Air
Pollu
tion
Inde
x (A
PI)
Beijing 2008's Olympics
Odd-even licence plate restriction
300,000 high-polluting vehicles banned
Shutdown of 300 steel factories in the city of Tangshan (90 miles from Beijing)
Shutdown of 40 factories in the city of Tianjin (70 miles from Beijing)

Lin W, Acute respiratory inflammation in children and black carbon in ambient air before and during the 2008 Beijing Olympics. Environ Health Perspect. 2011;119:1507-12

Beijing Olympic games (2008): the health impact
• Rich DQ, Association between changes in air pollution levels during the Beijing Olympics and biomarkers of inflammation and thrombosis in healthy young adults. JAMA. 2012;307:2068-78.
• Huang W, Inflammatory and Oxidative Stress
Responses of Healthy Young Adults to Changes in Air Quality during the Beijing Olympics. Am J Respir Crit Care Med. 2012 Aug 30

NIH library Pubmed air pollution AND health
papers/year
1
10
100
1000
10000
1976-1980
2006-2010
Health Effects of Fine Particles: Lines that Connect (Pope et Dockery 2006)
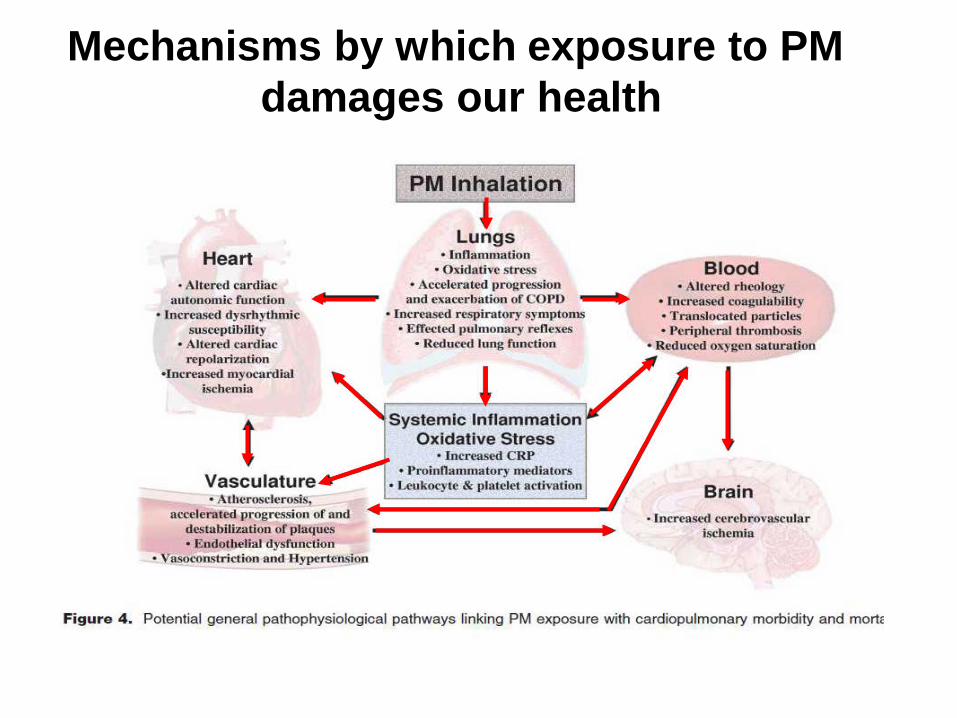
Mechanisms by which exposure to PM damages our health

Particulate matter (PM)
e.g.: PM2.5 i.e. Ø ≤ 2.5 μm

Impact by PM size

Ultrafine particles (UFP) promote early atherosclerosis and systemic oxidative stress (Araujo, 2008, Brook 2010)

Placas en las arterias después exposición a New York PM en ratolins
Sun et al, JAMA Dec 2005

Porque mejorar la calidad del aire?
• Efectos agudos o a corto plazo • Efectos crónicos • Lecciones de las Intervenciones
Porque no mejoramos la calidad del aire? • Fuentes • El papel de los médicos y otros profesionales
Nuevos estudios

Total mortality and PM10 concentration vs timeBarcelona 2003-2004
0
20
40
60
80
100
120
01/01
/2003
01/02
/2003
01/03
/2003
01/04
/2003
01/05
/2003
01/06
/2003
01/07
/2003
01/08
/2003
01/09
/2003
01/10
/2003
01/11
/2003
01/12
/2003
01/01
/2004
01/02
/2004
01/03
/2004
01/04
/2004
01/05
/2004
01/06
/2004
01/07
/2004
01/08
/2004
01/09
/2004
01/10
/2004
01/11
/2004
01/12
/2004
Time
Dea
th p
er d
ay
0
20
40
60
80
100
120
140
160
180
200
PM10
(ug/
m3 )
Death per day PM10 (ug/m3)
Mortalidad diaria y contaminación atmosfèrica: anàlisis de series temporales

Example: Time-series analysis APHEA: daily mortality and air pollution Katsouyanni et al, Epidemiology 2001
• 29 European cities • >43 mill. Inhabitants • > 5 years of data • Total death (excluding external causes) • Daily: PM10, black smoke, SO2, O3,
NO2 • Investigate city-specific causes of
heterogeneity of effects across Europe (two-stage model)

Percent increase in daily mortality (95% CI) per
10μg/m3 PM10 The European APHEA
Study
Katsouyanni et al, Epidemiology 2001; 12 (5): 521-
31
Cambridge1.ppt
0 1 2-1
Percent increase in mortality-1% 0% 1% 2%
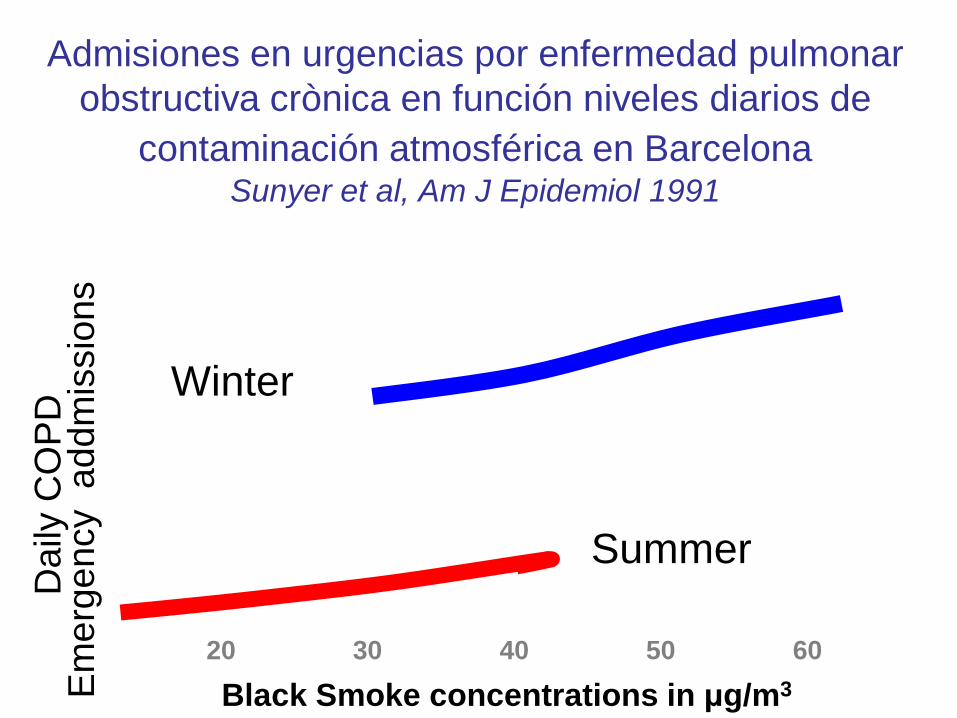
Admisiones en urgencias por enfermedad pulmonar obstructiva crònica en función niveles diarios de
contaminación atmosférica en Barcelona Sunyer et al, Am J Epidemiol 1991
Winter
Summer
Dai
ly C
OP
D
Em
erge
ncy
add
mis
sion
s
Black Smoke concentrations in μg/m3 20 30 40 50 60
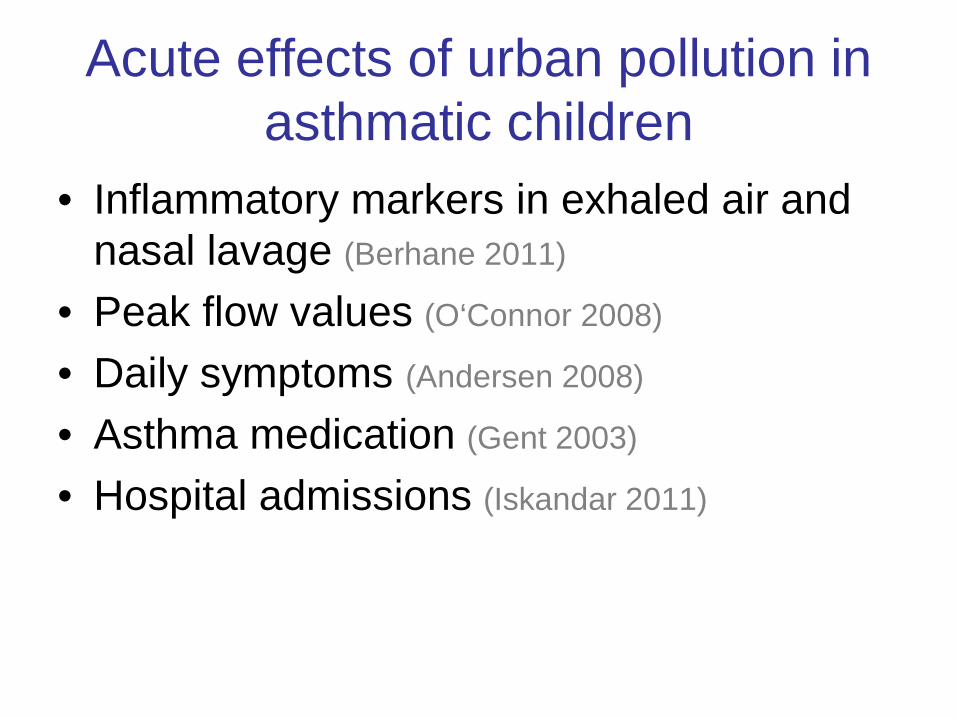
Acute effects of urban pollution in asthmatic children
• Inflammatory markers in exhaled air and nasal lavage (Berhane 2011)
• Peak flow values (O‘Connor 2008)
• Daily symptoms (Andersen 2008)
• Asthma medication (Gent 2003)
• Hospital admissions (Iskandar 2011)

Parallel contributions of past days’ 1hr-maxima of NO2 (in units of 50 µg/m3 ) to current day’s mortality
(cubic polynomial lag models) (Schindler, Künzli, Ackermann-Liebrich; 2001)
0,97
0,98
0,99
1
1,01
1,02
1,03
0 -1 -2 -3 -4 -5 -6
day
rela
tive
risk
ZurichBaselGeneva

Urban PM fractions and health effects Perez et al.2009
Odds ratio per 10 ug/m3*
Fraction Respiratory mortality
Cardiovascular mortality
Cerebrovascular mortality
PM10-2.5 Not significant 1.059
(1.026-1.094) Lag1
1.098 (1.030-1.171)
Lag1
PM2.5-1
1.206 (1.028-1.416)
Lag2
Not significant
Not significant
PM1 Not significant 1.028
(1.000-1.058) Lag1
1.063 (1.004-1.124)
Lag1
*Only maximum lag effect for tri-pollutant model presented
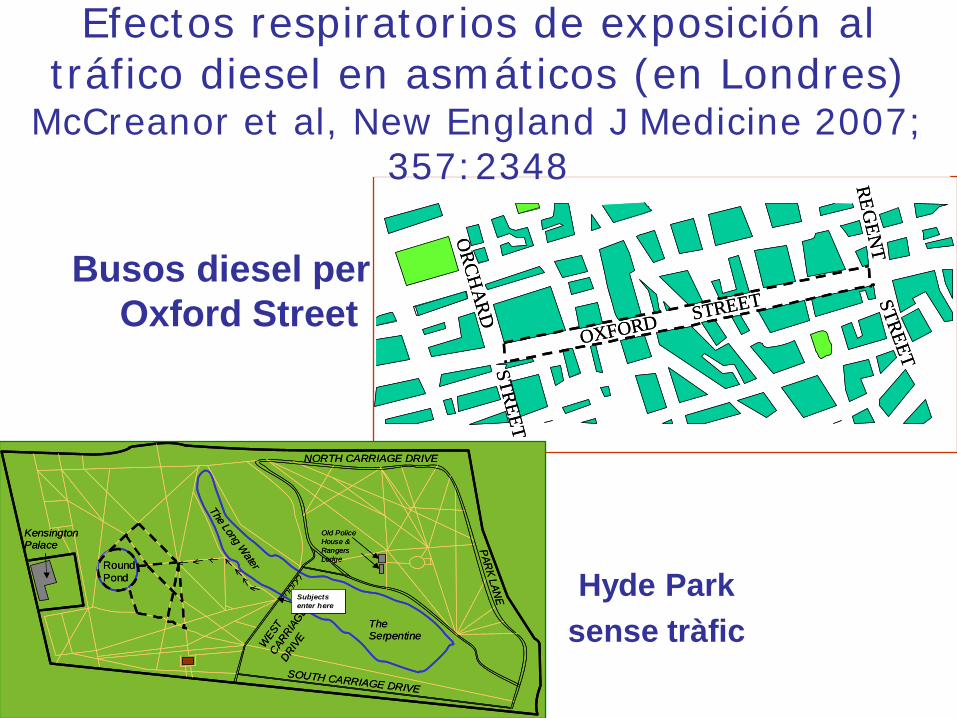
Oxford Street
Hyde Park sense tràfic
OXFORD STREET
REGEN
TSTREET
ORCH
ARDSTREET
OXFORD STREET
REGEN
TSTREET
ORCH
ARDSTREET
Efectos respiratorios de exposición al tráfico diesel en asmáticos (en Londres)
McCreanor et al, New England J Medicine 2007; 357:2348
Busos diesel per Oxford Street
Kensington Palace
Round Pond
The Serpentine
The Long Water
Old Police House & Rangers Lodge
WES
T CAR
RIAGE
DRIVE
SOUTH CARRIAGE DRIVE
NORTH CARRIAGE DRIVEPAR
K LANESubjects
enter here
Kensington Palace
Round Pond
The Serpentine
The Long Water
Old Police House & Rangers Lodge
WES
T CAR
RIAGE
DRIVE
SOUTH CARRIAGE DRIVE
NORTH CARRIAGE DRIVEPAR
K LANESubjects
enter here
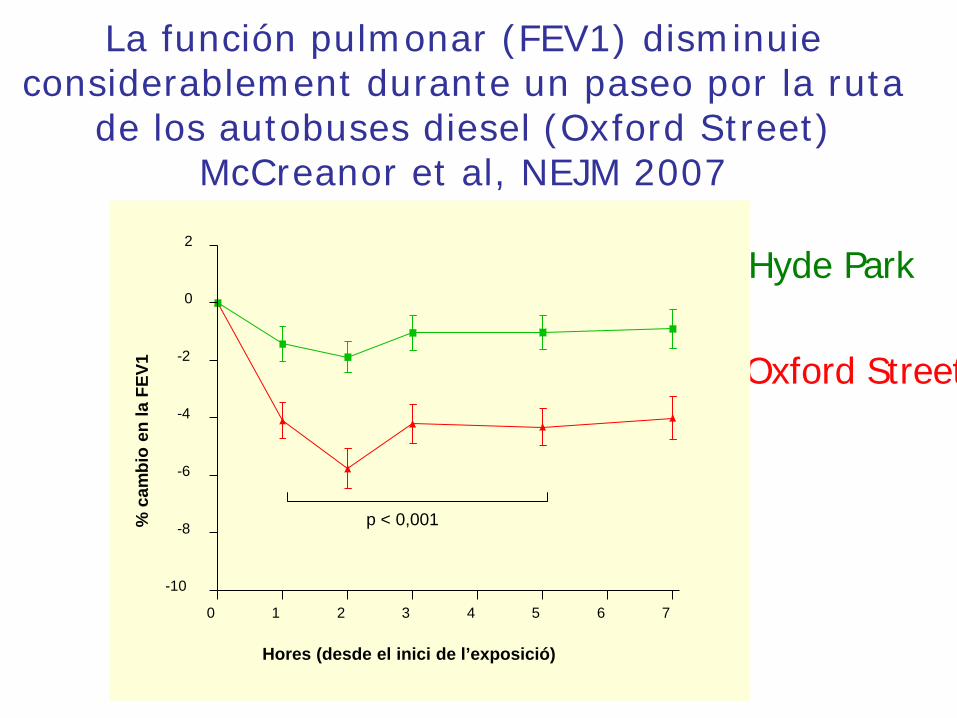
La función pulmonar (FEV1) disminuie considerablement durante un paseo por la ruta
de los autobuses diesel (Oxford Street) McCreanor et al, NEJM 2007
Hyde Park
Oxford Street
0 1 2 3 4 5 6 7
-10
-8
-6
-4
-2
0
2
Hores (desde el inici de l’exposició)
% c
ambi
o en
la F
EV1
p < 0,001

Presence of carbon in airway macrophages in healthy children exposed to traffic
Kulkarni et al. (NEJM 2006)
Figure 1. Representative Images of Carbon in Airway Macrophages from Healthy Children. Panel A shows a macrophage with no carbon. Increasing levels of carbon are shown in Panels B through E.

Carbon in airway macrophages impairs lung function in healthy children
Kulkarni et al. (NEJM 2006)

WHO review 2005 ‘Substantial evidence suggested that the
inflammatory processes associated with exposure to traffic pollutants contributed to an increase respiratory symptoms’

Are there chronic effects (average exposure for one year or more) beyond the short-term effects
• Onset asthma • Lung function growth decline • Atherosclerosis • Mortality • Life expectancy

The USC Children’s Health Study in 12 communities

Grade # Kids 1993 94 95 96 97 98 99 00 01 02 03 04
4th 1,759 10 18
7th 900 13 18
10th 900 16 18
4th 2,000 10 18
Lung development during 8 years NEJM 2004; 351:1057

big3dist
s(bi
g3di
st, 3
)
0 100 200 300 400 500
-10
1
Distance to busy road 0 100 200 300 400 500 meters
Asth
ma
risk
RR=1.0
Southern California Association between residential distance to busy roads
and childhood asthma
McConnell et al, EHP2010
RR=1.4

Traffic proximity and exposure
Beckerman et al. 2008

Birth cohorts on asthma: Long follow-up after exposure at early life • Germany (GINI & LISA), n=3066 at six years,
doctor diagnosed asthma OR=1.56 (1.03-2.37) (Morgenstern V, AJRCCM 2008)
• Holland (PIAMA), n=3583 at 4 years, doctor diagnosed asthma OR=1.32 (1.04-1.69) (Brauer M, ERJ 2008; Gehring 2010)
• Sweeden (BAMSE), n=3515 at 4 years, persistent wheeze OR=1.60 (1.09-2.36) (Nordling E, Epidemiology 2009)
• East Boston, n=413 at 18 years doctor diagnosed asthma OR=1.63 (1.14-2.33) (Clougherty JE, EHP 2007)

Life-time course of lung function (e.g. forced expiratory capacities such as FEV1 and
FVC)
0 20 80 Age
Disability
Death
100% normal at age 20

Repeated FEV1 during 8 years in the CHS (Gauderman NEJM 2004; 351:1057)

PM2,5
% of persons at age 18 with FEV1 < 80% by PM2,5 (Gauderman, NEJM 2004)

Changes in ambient PM2.5 correlated with change in lung function development (FEV1)
Avol et al., Am J Respir Crit Care Med 2001
FEV1
gro
wth
rate
(m
l pe
r yea
r)
-40 -20 0 +20 +40 change in PM10 (μg/m3)
cleaner dirtier

Lung function growth in Mexico (Rojas-Martinez R, AJRCCM 2007)
• Cohort at age 8 (n=3170) • Followed during three years • Spirometry every 6 months • Attended 39 schools near 10 stations • An IQR on PM10 -> annual deficit in FEV1
of 11 ml in girls and 15 in boys.

Life-time course of lung function (e.g. forced expiratory capacities such as FEV1 and FVC)
0 20 80 A
Disability
Death
100% normal at age 20
smoking

Annual mean PM10 and expiratory capacity (FVC) in the 8 SAPALDIA areas
Ackermann-Liebrich et al, AJRCCM 1997; 155 (1):122-129
-6
-4
-2
0
2
4
6
0 10 20 30 40
PM10 annual mean (µg / m3)
FVC
% d
evia
tion
from
pre
dict
ed
© Nino li

Lung function studies in adults – SAPALDIA (Downs, NEJM 2007) – SALIA (Shikowski T, Respir Med 2005) – Health Survey for England( Forbes, Thorax
2009)
• An increase in 10 μg/m3 was associated with a decrease of 3.4% in FEV1. This may imply an increase of 50% of the population with a FEV1<80%

© Nino li

EXPOSURE SURFACE, PM2.5

Home outdoor PM2.5 is associated with CIMT Künzli et al, Env Health Perspect 2005

35 30 25 20 15 10 0.9
1.0
1.1
1.2
1.3
• Portage, W • Topeka, KS
• Waterown, MA (Boston)
• Harriman, TN (Knoxville) • St. Louis, MO
• Stebenville, OH
Long-term mortality. 6 cities, Dockery 1993
EL ESTUDIO DE LAS 6 CIUDADES: PM2.5 –MORTALITAT (Dockery , NEJM 1993)

Bold: PM2.5 1974-89 Cursive: 1990-98
Mortalitat Cardiovascular en el seguiment de l’estudi 6-Cities Study
Laden et al, AJRCCM 2006
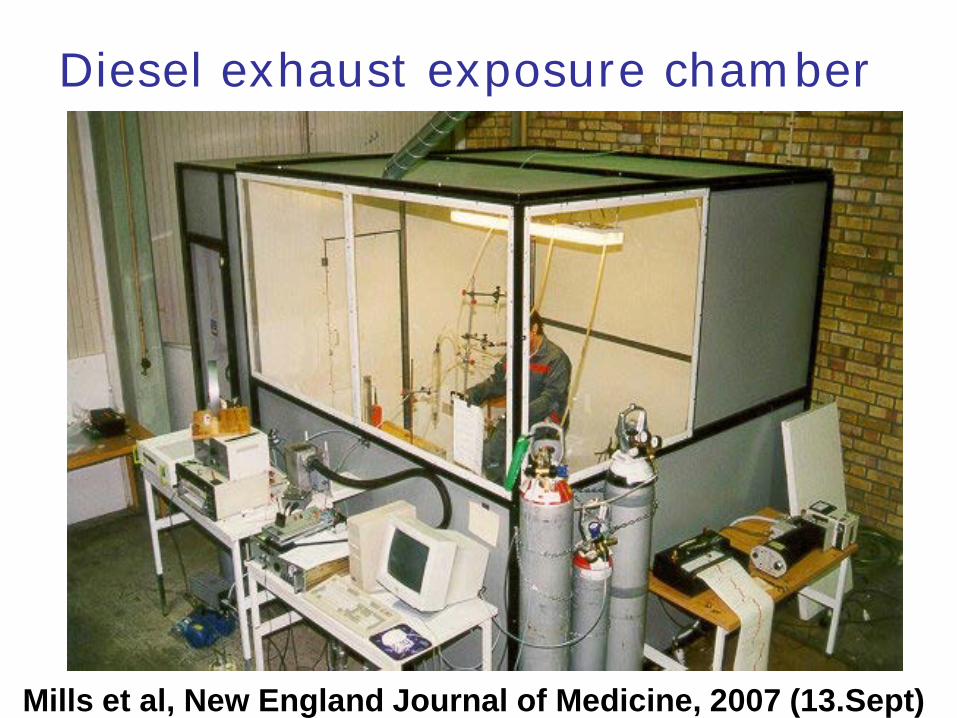
Diesel exhaust exposure chamber
Mills et al, New England Journal of Medicine, 2007 (13.Sept)

1 hora exposición en una cámara con diesel en 20 supervivents infarto de miocardo
(Mills et al, N Engl J Med 2007)

Long-term exposure to air pollution increases the incidence of cardiovascular events and mortality in
women Miller et al. (NEJM 2007)

Pope CA. Fine-paticulate air pollution and life expectancy in US. N Engl J Med. 2009

5 10 15 20 25 30 35 5 7 9
11 13 15 17 19 21 23 25
Montana
Payerne Langnau
Rheintal
Biel
Lugano
Genf
Zürich Bern
Anières
PM10 µg/m3 Braun-Fahrländer; Am JRespir Crit Care Med 1997
Chronic cough and annual pollution in Swiss children 1993

Lugano
Geneve
Montana
Lugano Basel
Davos
1991 2002
PM10
ann
ual m
ean
PM decline in Swiss cities after traffic intervention 1993-2001

Anieres
BernBiel
Genf
Langnau
Lugano
Montana
Pay erneZuerich
-8-6
-4-2
0
-20 -15 -10 -5 0Decline of PM10 between 1993 and 2001 in μg/m3
Across nine Regions of SwissSchool Children Study Change in prevalence vs change in PM10
Bayer-Oglesby et al., Env Health Perspect, 2005

Schindler et al. 2009
Reduction among adults Reduction of chronic cough-SAPALDIA

Decreasing PM10 over 11 years reduced decline in adults' lung function
SAPALDIA Swiss Study, Downs et al. (NEJM, 2007) Estimated Effect of Interval Exposure between 1991 and 2002 on Mean Annual Decline in FEV1
-50
-45
-40
-35
-30
-25
-20
-15
-10
-5
0
51015202530354045
Decrease in Mean Annual PM10 (µg/m3)
Mea
n A
nnua
l Dec
line
in F
EV
1 (m
l/yr)

Prohibición del carbón en Dublín, 1990
Reduccció Fums negres: - 35.6 %
SO2: - 11.3%
Reducció Mort cardiovascular: - 10.3%
Mort respiratòria: -15.5%
valor mig
valor mig
4,4 /dia
3,8 /dia
Clancy et al., Lancet 2002 1991
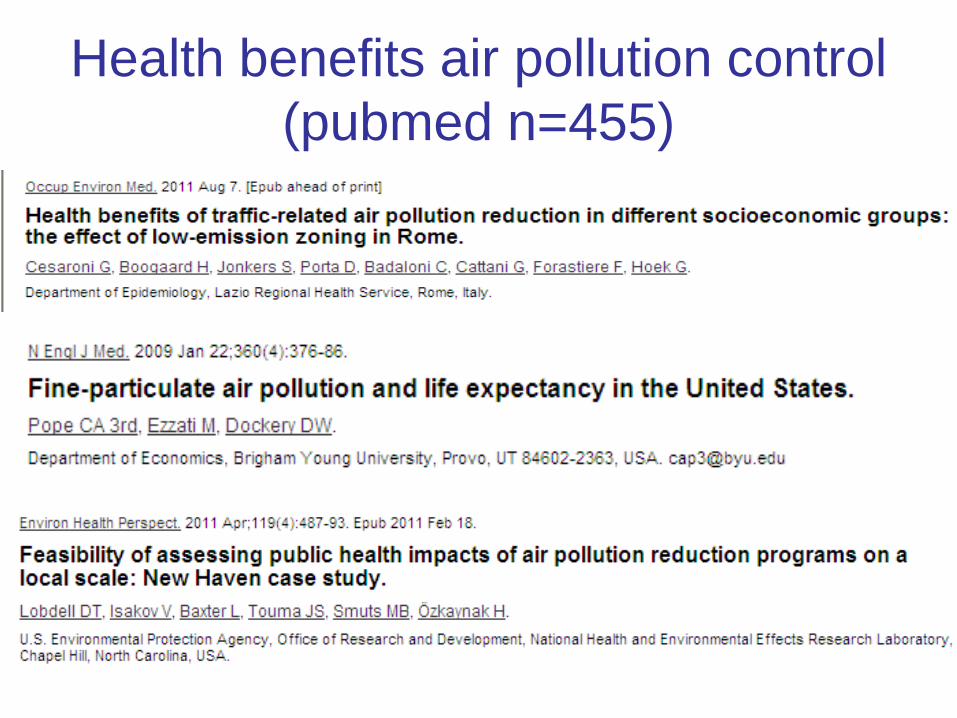
Health benefits air pollution control (pubmed n=455)
• .
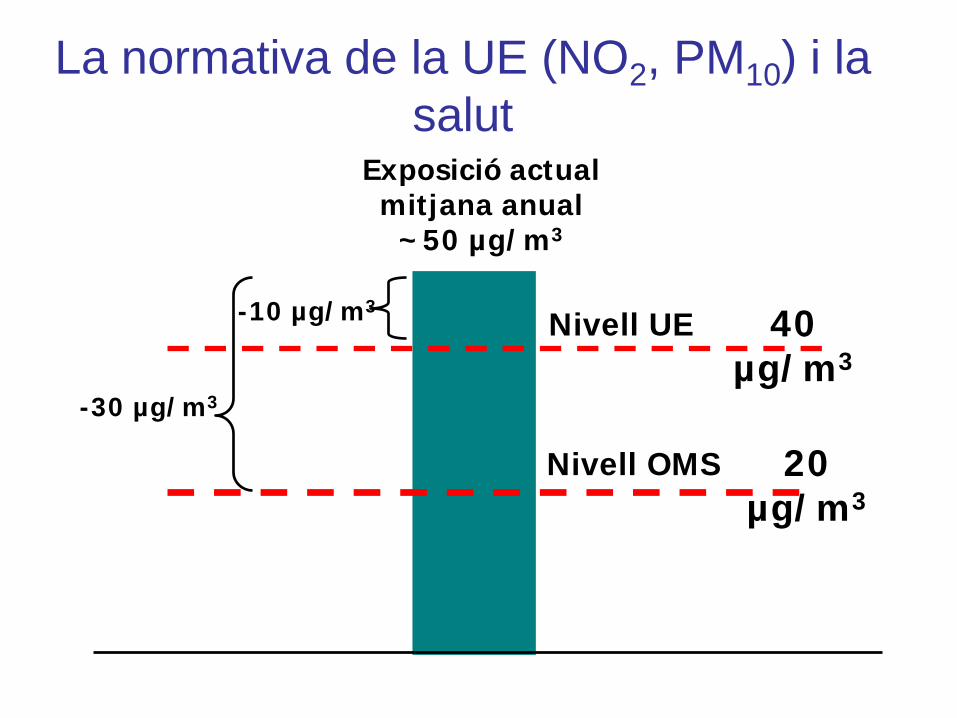
La normativa de la UE (NO2, PM10) i la salut
Nivell UE
Nivell OMS
Exposició actual mitjana anual
~50 µg/m3
40 µg/m3
20 µg/m3
-10 µg/m3
-30 µg/m3
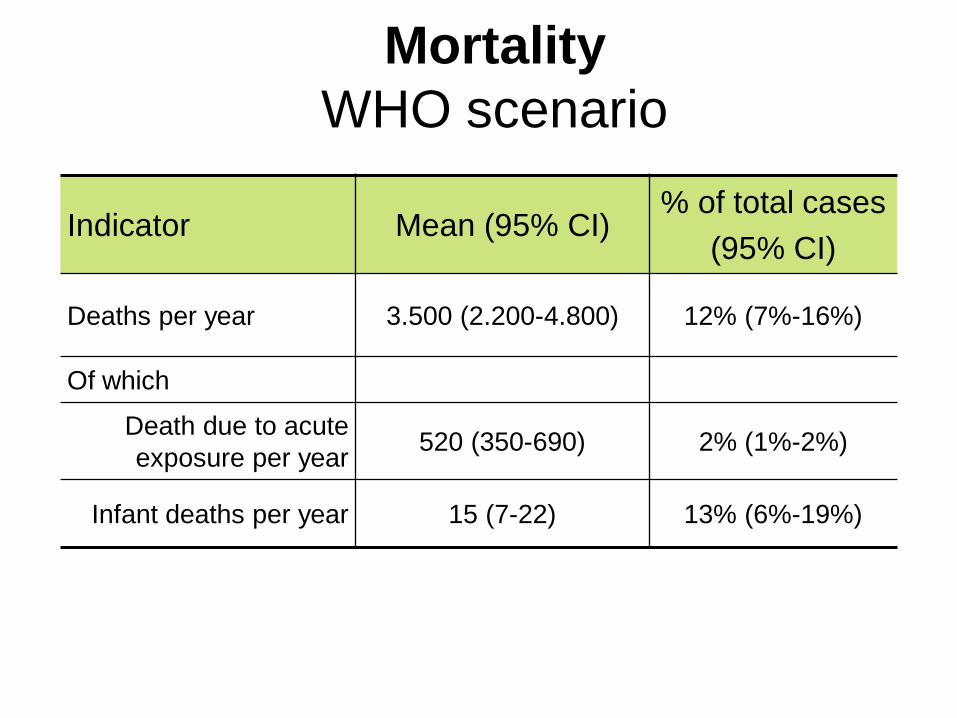
Mortality WHO scenario
Indicator Mean (95% CI) % of total cases
(95% CI)
Deaths per year 3.500 (2.200-4.800) 12% (7%-16%)
Of which
Death due to acute exposure per year 520 (350-690) 2% (1%-2%)
Infant deaths per year 15 (7-22) 13% (6%-19%)

Morbidity per year WHO scenario
Indicator Mean (95% CI) % of total cases
(95% CI)
Respiratory
Chronic bronchitis adults 5.100 (550-8.500) 25% (3%-41%)
Acute bronchitis children 31.100 (17.500-40.500) 49% (28%-64%)
Asthma attacks adults 41.500 (21.000-60.500) 11% (6%-16%)
Asthma attacks children 12.400 (6.400-15.200) 11% (6%-14%)
Hospitalizations
Respiratory causes 1.150 (630-1.670)) 3% (2%-5%)
Cardiovascular causes 620 (310-930) 2% (1%-3%)

Beneficis econòmics de reduir la contaminació atmosfèrica
(Euros/any)

PM1 composition in Barcelona (Pérez N, 2010)

Estimating impact of traffic exposure Population distribution from roads >10,000 vehicle/day

% de días que exceden los estándards de calidad del aire en Los Ángeles - 1976 a
2002
1976 1990 2002
75%
50%
25%

http://www.ersnet.org/publications/air-quality-and-health.html
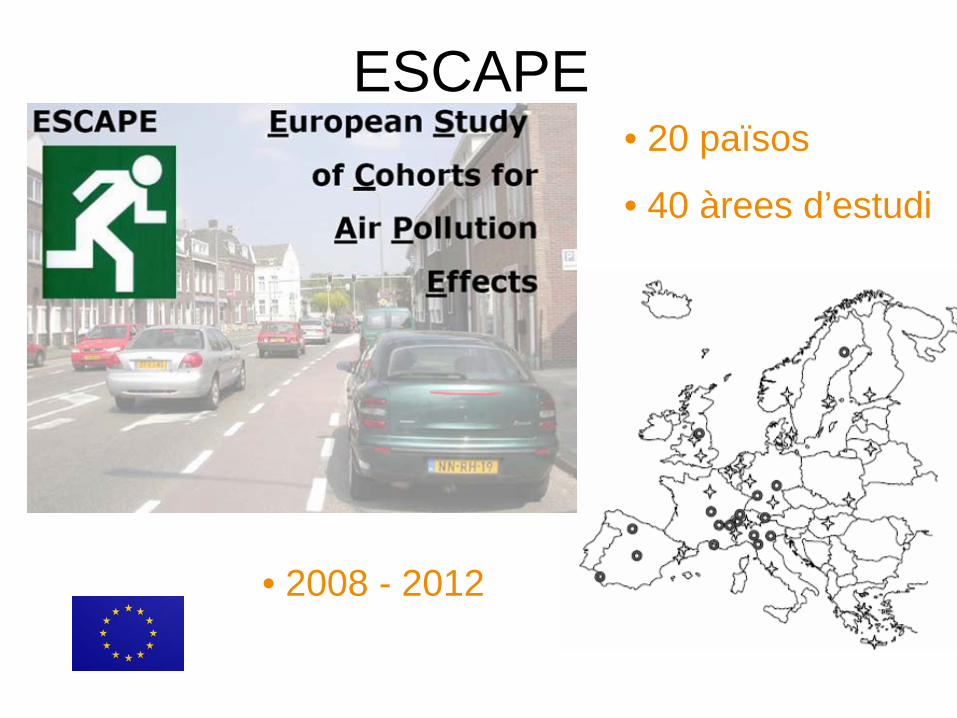
• 20 països
• 40 àrees d’estudi
• 2008 - 2012
ESCAPE

PM2.5 (Absorbance)

Jordi Sunyer April 2012

Objective
To discover the neurodevelopmental (cognitive, behavioral, and neurostructural) effects of urban air pollution (UFP traffic).

Pollutants: (1) school at t in, (2) school at t out and (3) continuous
at fixed site • Continuous:
– EC – UFP counts – Mass: PM1, 2.5, 10
• Daily average: – PM2.5, mass and Patterns of metals
• Weekly average: – Mass OC and Patterns of metals
• PM0.2 • PM0.2-2.5 • PM2.5-10
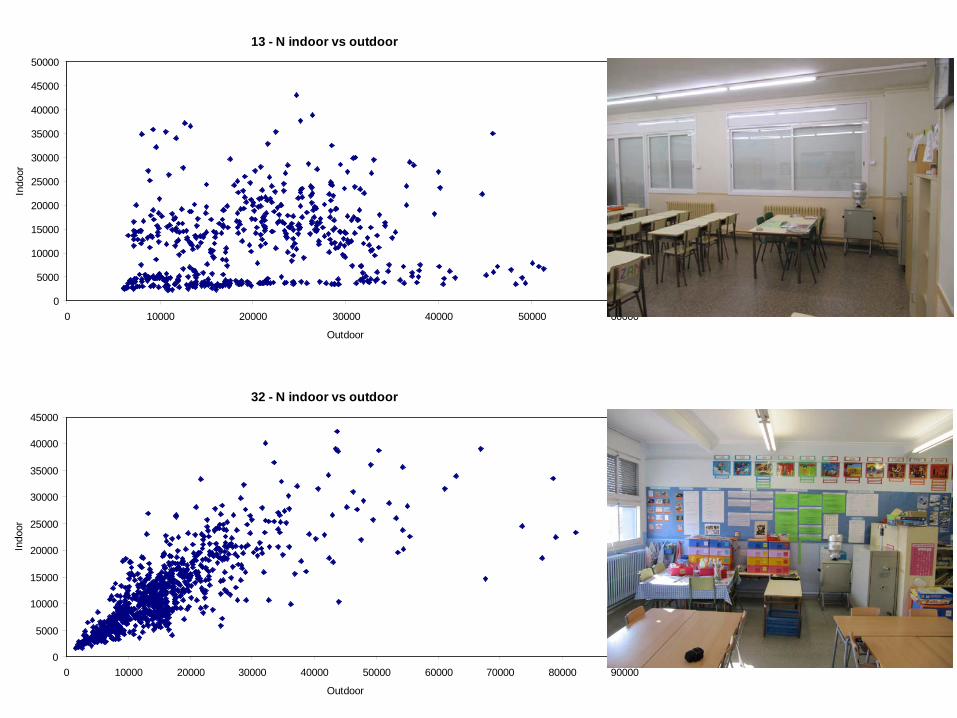
13 - N indoor vs outdoor
0
5000
10000
15000
20000
25000
30000
35000
40000
45000
50000
0 10000 20000 30000 40000 50000 60000
Outdoor
Indo
or
32 - N indoor vs outdoor
0
5000
10000
15000
20000
25000
30000
35000
40000
45000
0 10000 20000 30000 40000 50000 60000 70000 80000 90000
Outdoor
Indo
or


Que sabemos? Efectos agudos: • Exacerbación: MPOC, asma, insuficiència
coronària, diabetis • Incremento urgèncias (respiratorias, cardiacas,
vasculares), absentismo escolar y laboral • Incremento mortalidad • Efectos sobre ritmo cardiaco, función vascular,
inflamación bronquial y sistémica, coagulación, función pulmonar
• Relación linial sin umbral

Que sabemos? Efectos a largo pplazo:
– Aterosclerosis – Inflamación bronquial y disminución función
pulmonar – Mortalidad cardio-respiratoria y cáncer de pulmón – Relación distancia a ‘busy roads’ – Intervención: reducción sintomas respiratorios,
mejora función pulmonar, mejora de la esperanza de vida

Que no sabemos?
• Que elementos en el PM y en que fracción son los más tóxicos?
• Cuales son las mezclas más tóxicas? • Afecta el crecimiento intra-uterino? • Existen factores protectores o
promotores? • Causa alzheimer? • Produce un retardo en el desarrollo neuro-
cognitivo?

Conclusiones
• La contaminación urbana y principalmente las partículas finas y ultrafinas de origen mayoritario en el tráfico, afecta la salud de todos los ciudadanos.
. • Los profesionales tenemos de actuar como
lobby para reducir la contaminación del aire.