La Evaluación de Impacto - caf.com³n Ana Balsa... · •Cualquier diferencia entre los grupos al...
63
La Evaluación de Impacto Ana Balsa Universidad de Montevideo Argentina SEMIDE Noviembre 2017
Transcript of La Evaluación de Impacto - caf.com³n Ana Balsa... · •Cualquier diferencia entre los grupos al...

LaEvaluacióndeImpacto
AnaBalsaUniversidaddeMontevideo
ArgentinaSEMIDENoviembre2017

Kahoot.itIngresarPIN Ingresarapodo

¿Quéesunaevaluacióndeimpacto?
• Enfoquetradicional:basadoeninsumos,procesos y monitoreofinanciero
• Políticabasadaenlaevidencia:focoenresultados• Asignacióneficientedelosrecursos(eficacia,costo-efectividad,costo-beneficio)
• Rendicióndecuentas• Innovación• Aprendizaje• Discusióninformada
DISCULPE,¿noseolvidadenada?
Ejemplo• Programasdetransferenciacondicionada
• BolsaFamilia(Brasil)• ProgresaOportunidades(México)• AsignaciónUniversalporHijo(Argentina)• AsignaciónUniversalporEmbarazo(Argentina)
• Impactosen:• Pobreza• Capitalhumano• Salud
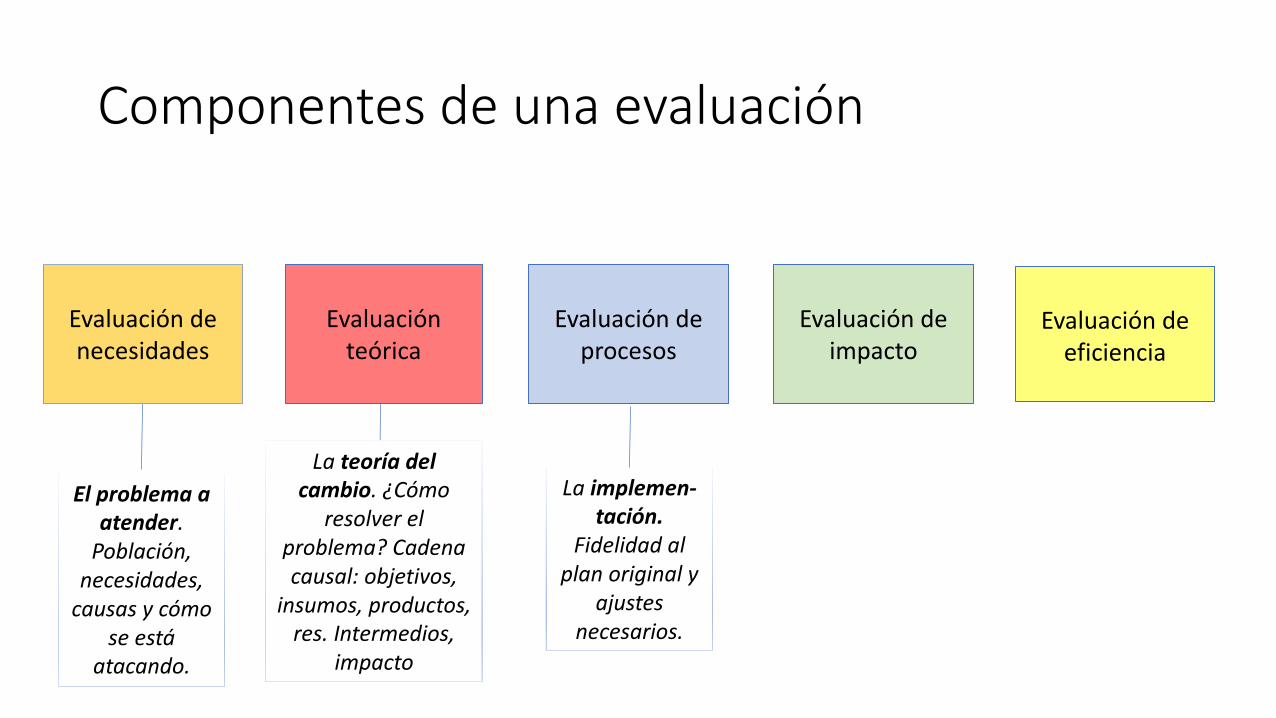
Componentesdeunaevaluación

Componentesdeunaevaluación
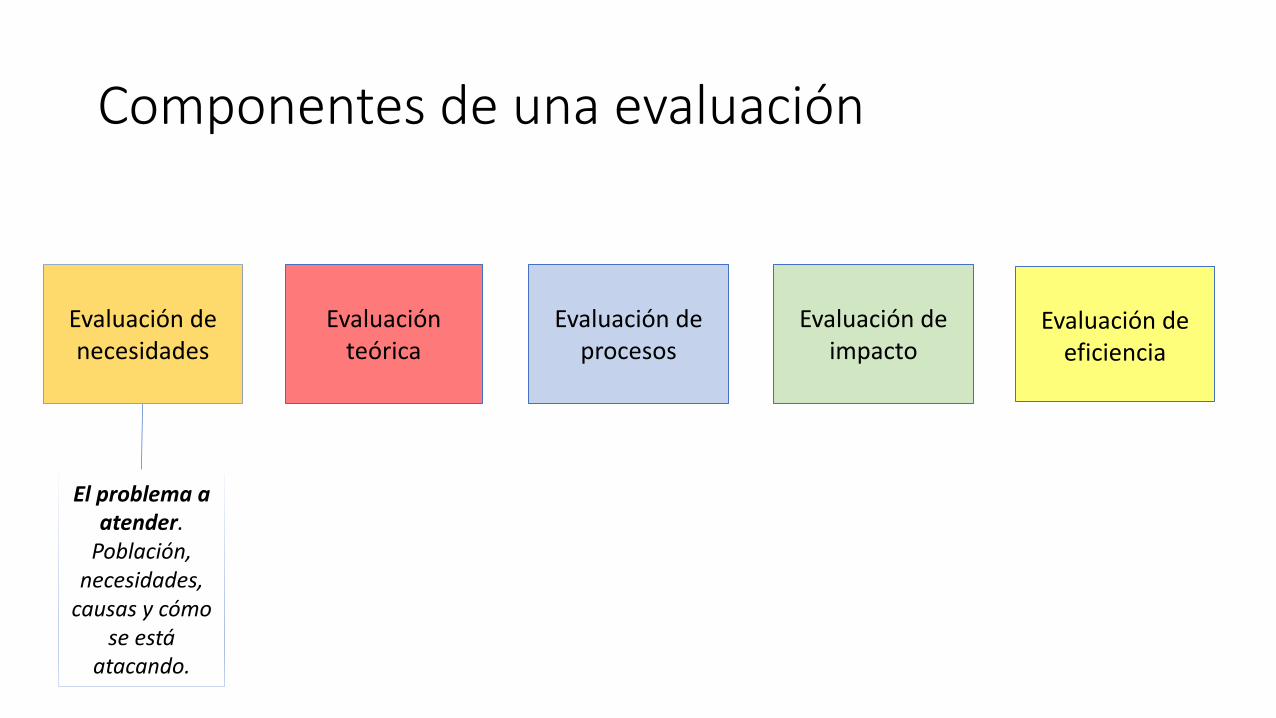
Evaluacióndenecesidades
Evaluaciónteórica
Evaluacióndeprocesos
Evaluacióndeimpacto
Evaluacióndeeficiencia
Componentesdeunaevaluación
Evaluacióndenecesidades
Evaluaciónteórica
Evaluacióndeprocesos
Evaluacióndeimpacto
Evaluacióndeeficiencia
Elproblemaaatender.Población,necesidades,causasycómo
seestáatacando.
Componentesdeunaevaluación
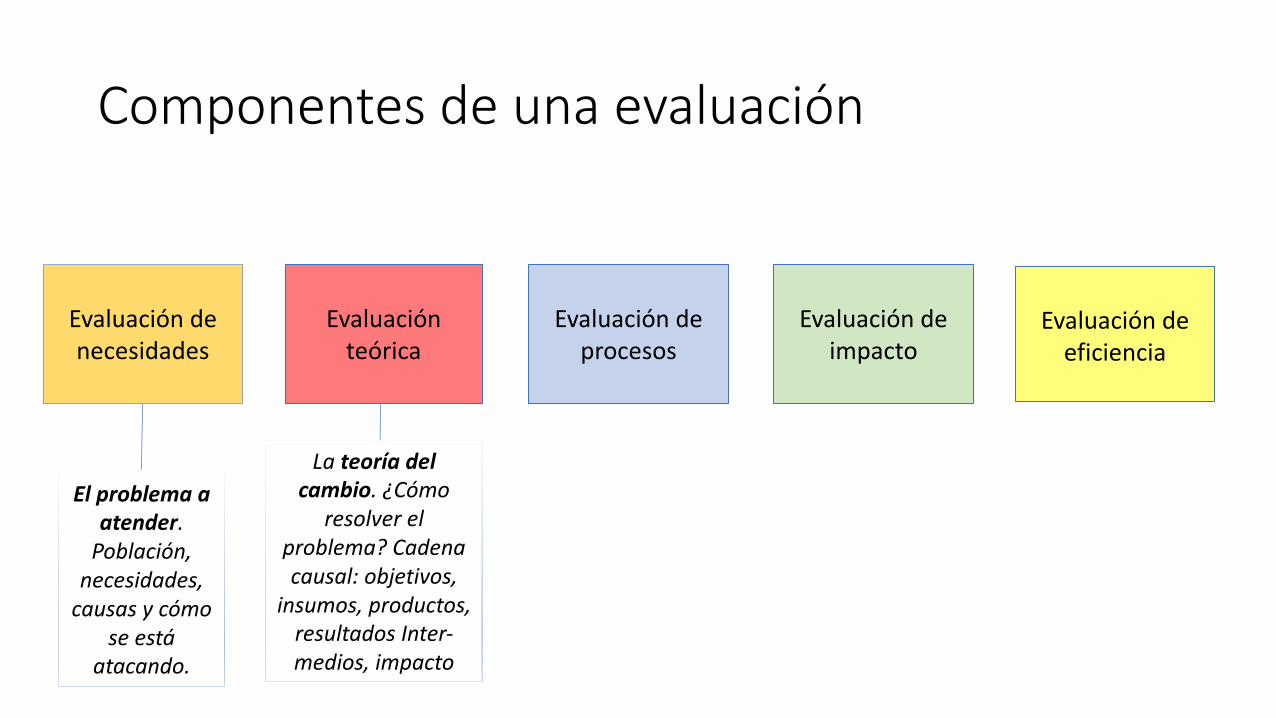
Evaluacióndenecesidades
Evaluaciónteórica
Evaluacióndeprocesos
Evaluacióndeimpacto
Evaluacióndeeficiencia
Elproblemaaatender.Población,necesidades,causasycómo
seestáatacando.
Lateoríadelcambio.¿Cómo
resolverelproblema?Cadenacausal:objetivos,
insumos,productos,resultadosInter-medios,impacto
Componentesdeunaevaluación
Evaluacióndenecesidades
Evaluaciónteórica
Evaluacióndeprocesos
Evaluacióndeimpacto
Evaluacióndeeficiencia
Laimplemen-tación.
Fidelidadalplanoriginaly
ajustesnecesarios.
Elproblemaaatender.Población,necesidades,causasycómo
seestáatacando.
Lateoríadelcambio.¿Cómo
resolverelproblema?Cadenacausal:objetivos,
insumos,productos,res.Intermedios,
impacto
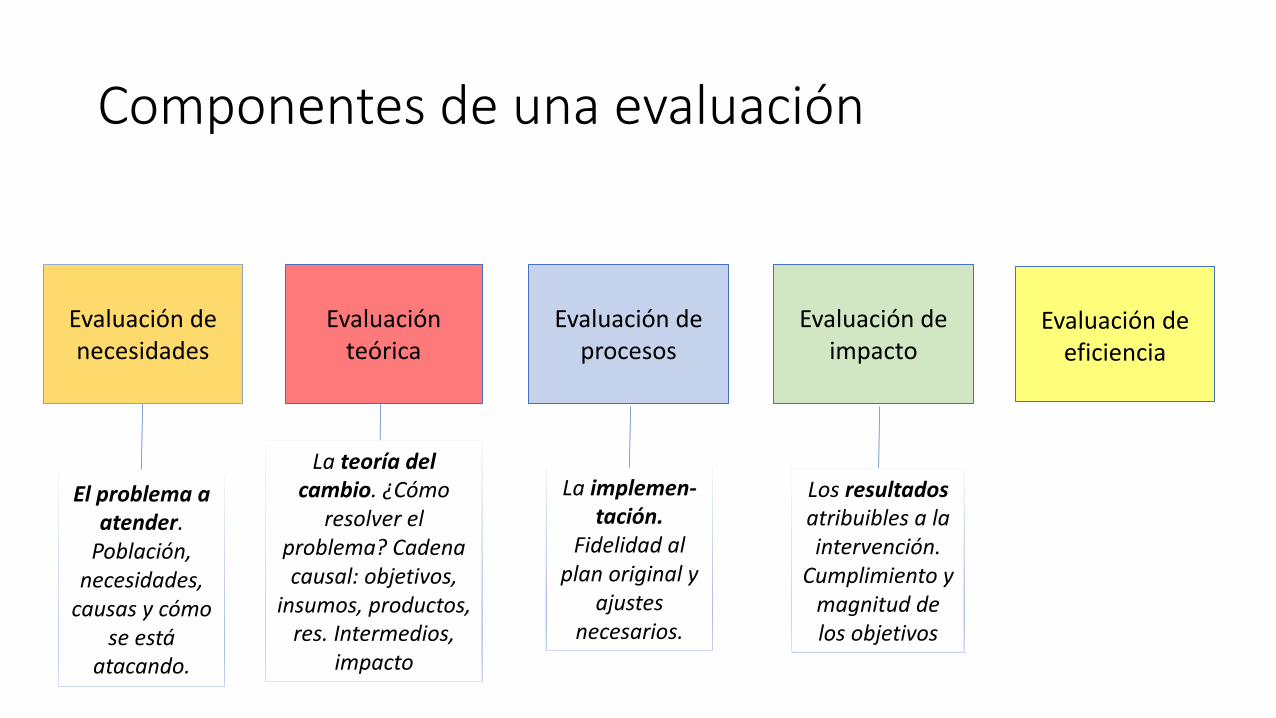
Componentesdeunaevaluación
Evaluacióndenecesidades
Evaluaciónteórica
Evaluacióndeprocesos
Evaluacióndeimpacto
Evaluacióndeeficiencia
Laimplemen-tación.
Fidelidadalplanoriginaly
ajustesnecesarios.
Losresultadosatribuiblesalaintervención.
Cumplimientoymagnituddelosobjetivos
Elproblemaaatender.Población,necesidades,causasycómo
seestáatacando.
Lateoríadelcambio.¿Cómo
resolverelproblema?Cadenacausal:objetivos,
insumos,productos,res.Intermedios,
impacto
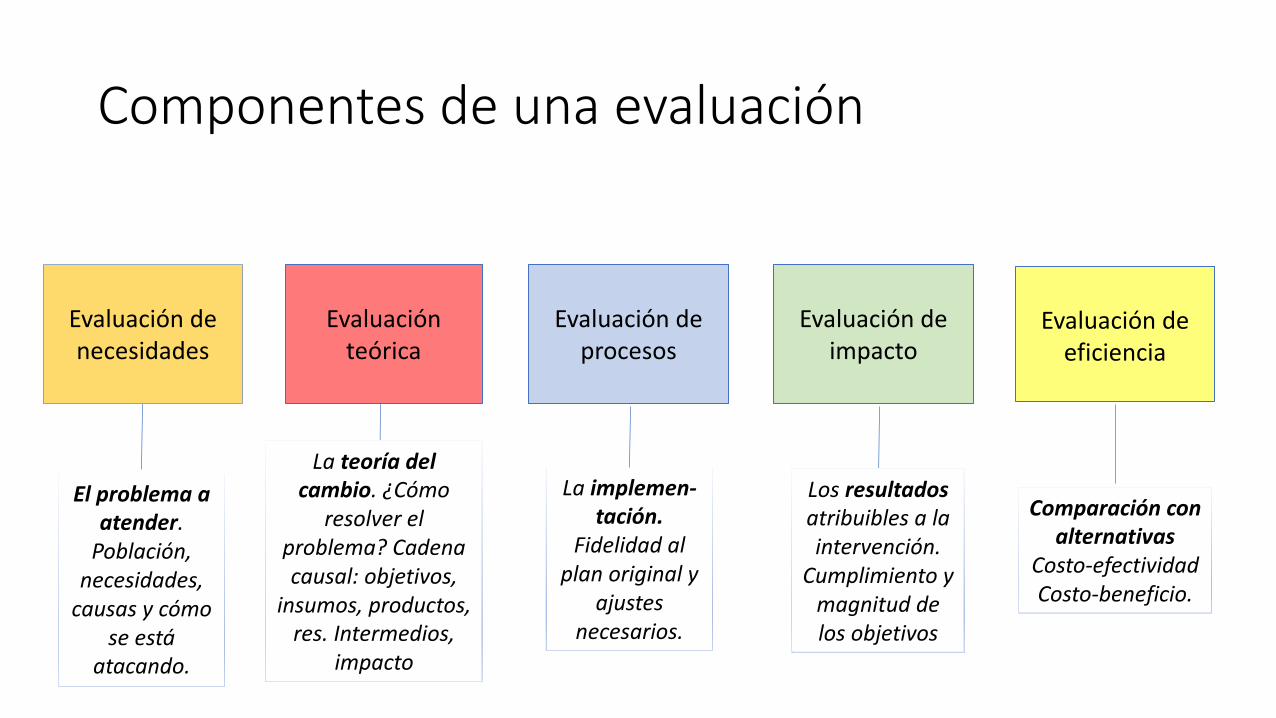
Componentesdeunaevaluación
Evaluacióndenecesidades
Evaluaciónteórica
Evaluacióndeprocesos
Evaluacióndeimpacto
Evaluacióndeeficiencia
Laimplemen-tación.
Fidelidadalplanoriginaly
ajustesnecesarios.
Losresultadosatribuiblesalaintervención.
Cumplimientoymagnituddelosobjetivos
Comparaciónconalternativas
Costo-efectividadCosto-beneficio.
Lateoríadelcambio.¿Cómo
resolverelproblema?Cadenacausal:objetivos,
insumos,productos,res.Intermedios,
impacto
Elproblemaaatender.Población,necesidades,causasycómo
seestáatacando.

EvaluacióndeimpactoyCausalidad
“Laafirmaciónparadigmáticaenelestudiodelasrelacionescausalesesquelamanipulacióndeunacausavaaresultarenlamanipulacióndeunefecto...Lacausalidadimplicaque,alvariarunfactor,puedohacerqueotrovaríe.”
Cook&Campbell,1979
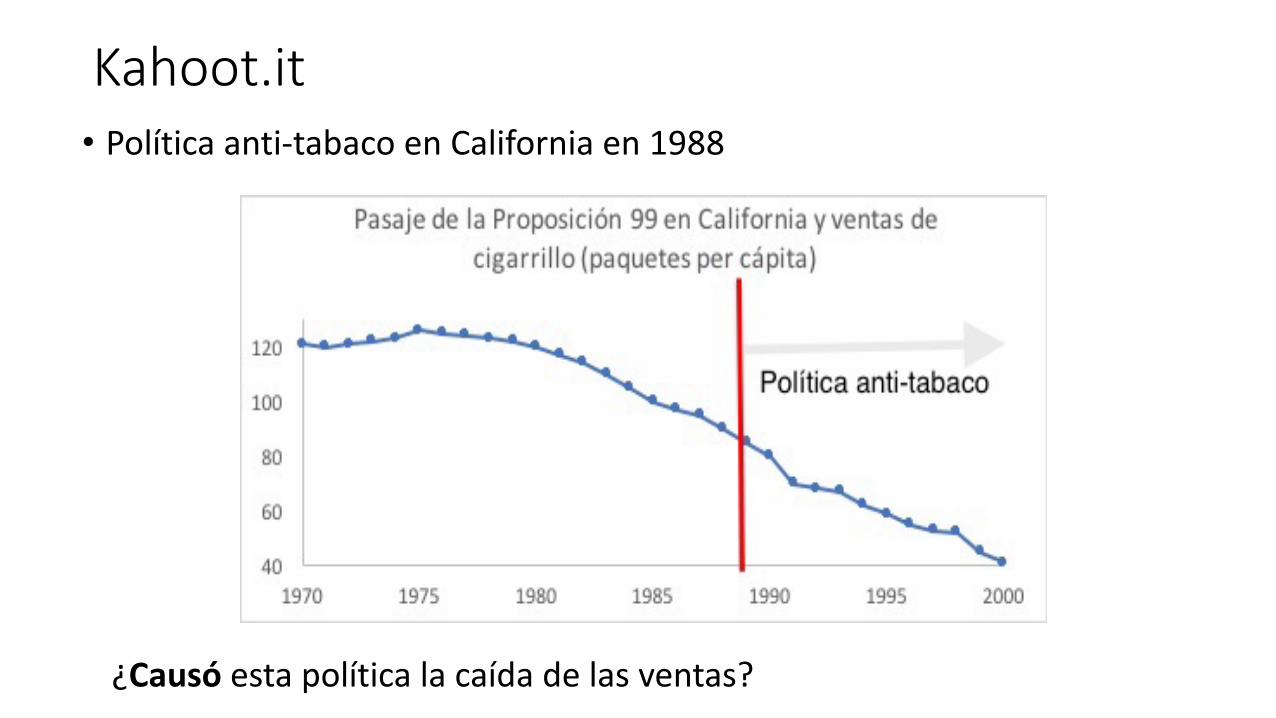
Kahoot.it• Políticaanti-tabacoenCaliforniaen1988
¿Causóestapolíticalacaídadelasventas?

Kahoot.it• Políticaanti-tabacoenCaliforniaen1988
¿Causóestapolíticalacaídadelasventas?
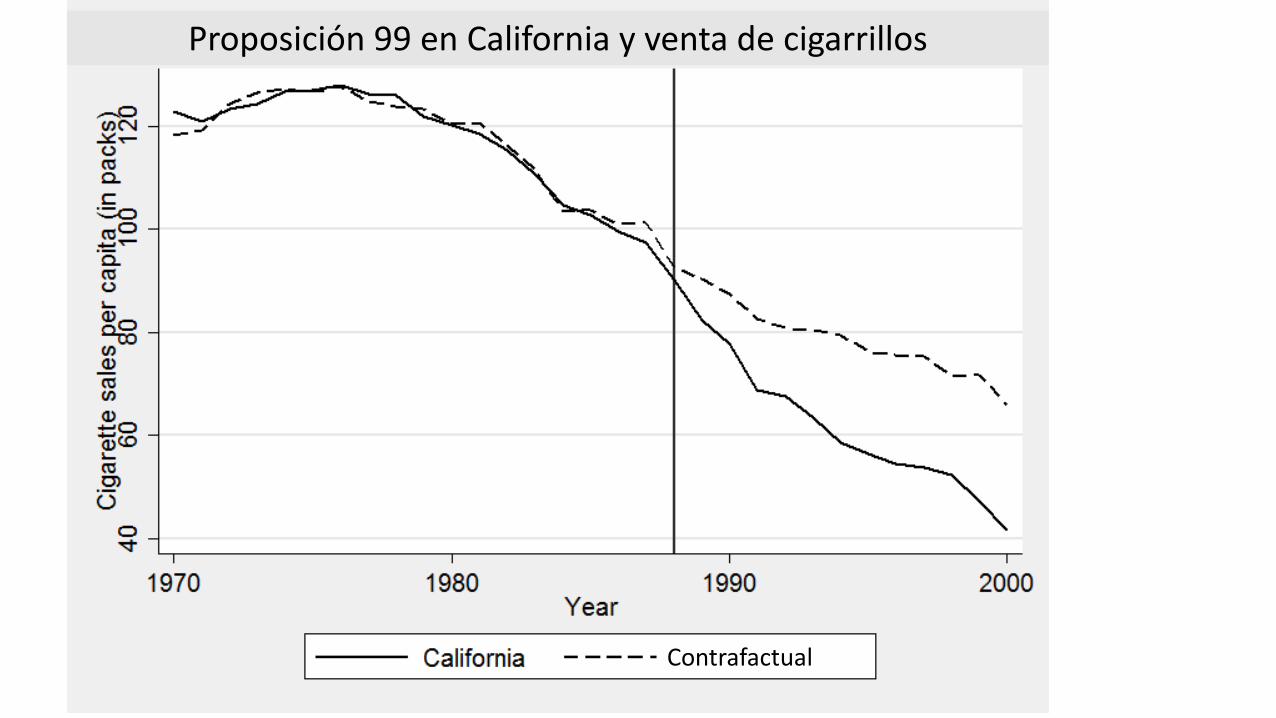
Contrafactual
Proposición99enCaliforniayventadecigarrillos
Contrafactual
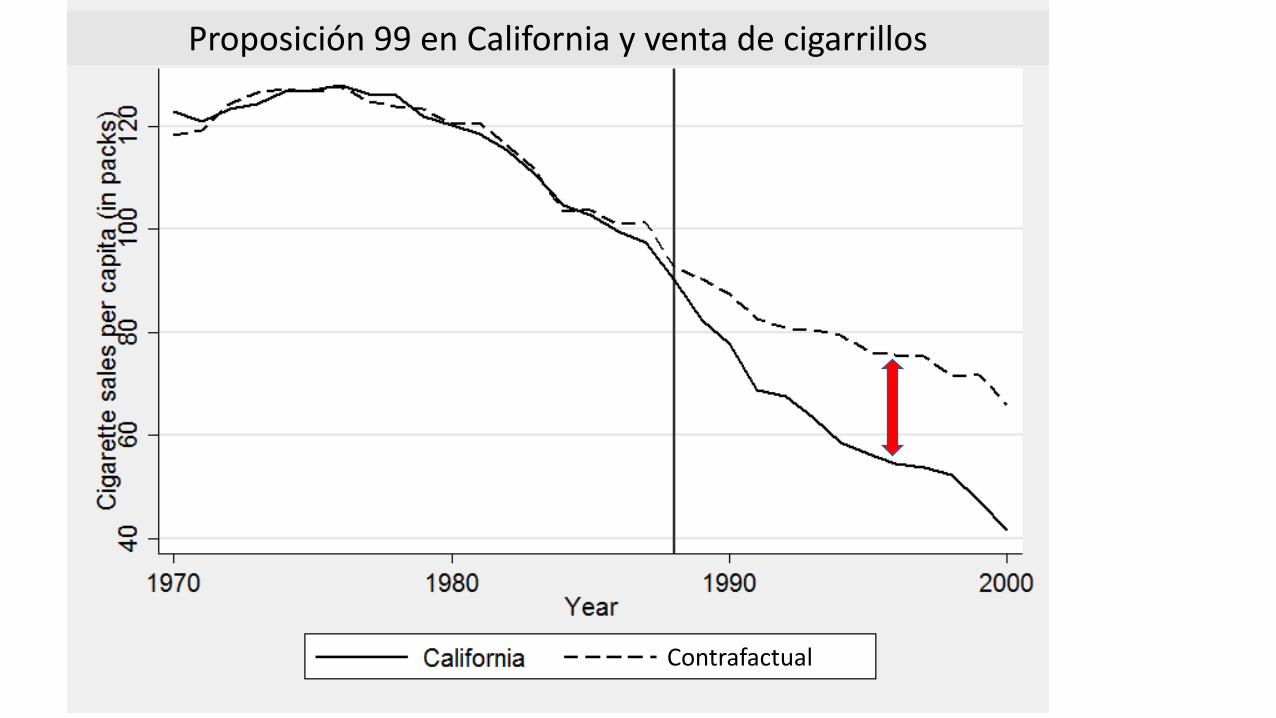
Proposición99enCaliforniayventadecigarrillos
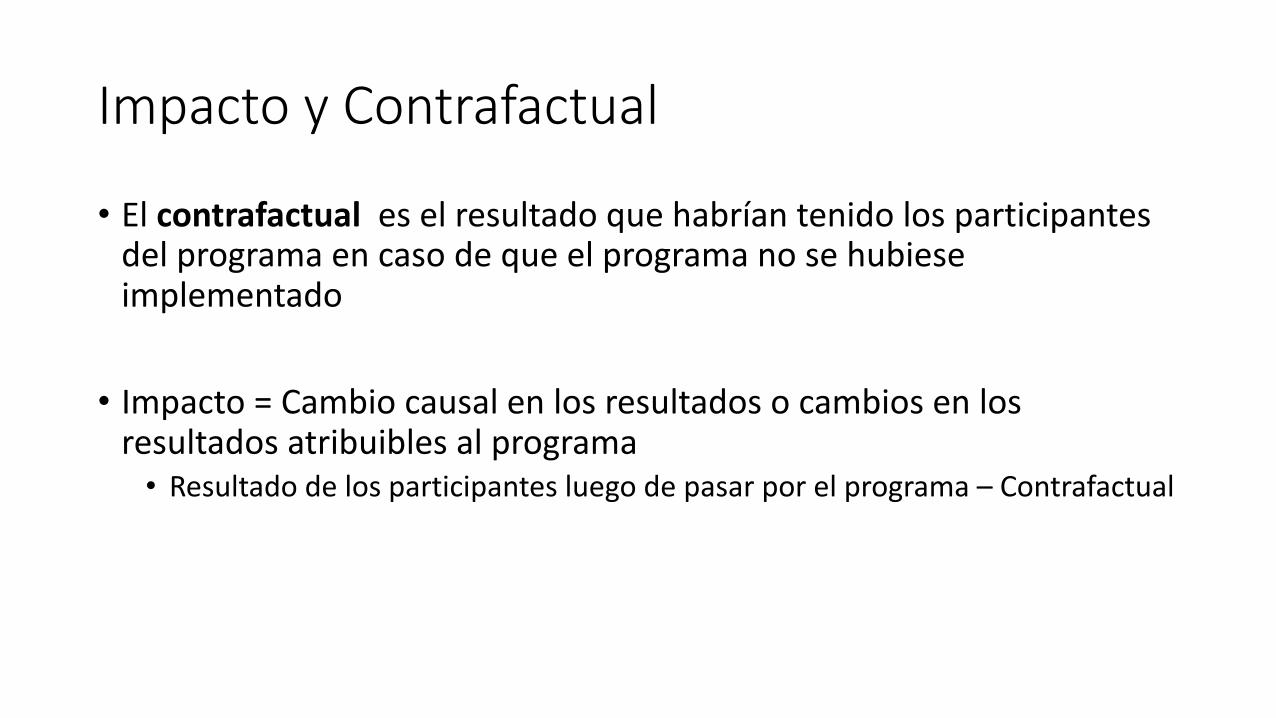
ImpactoyContrafactual
• Elcontrafactual eselresultadoquehabríantenidolosparticipantesdelprogramaencasodequeelprogramanosehubieseimplementado
• Impacto=Cambiocausalenlosresultadosocambiosenlosresultadosatribuiblesalprograma
• Resultadodelosparticipantesluegodepasarporelprograma– Contrafactual
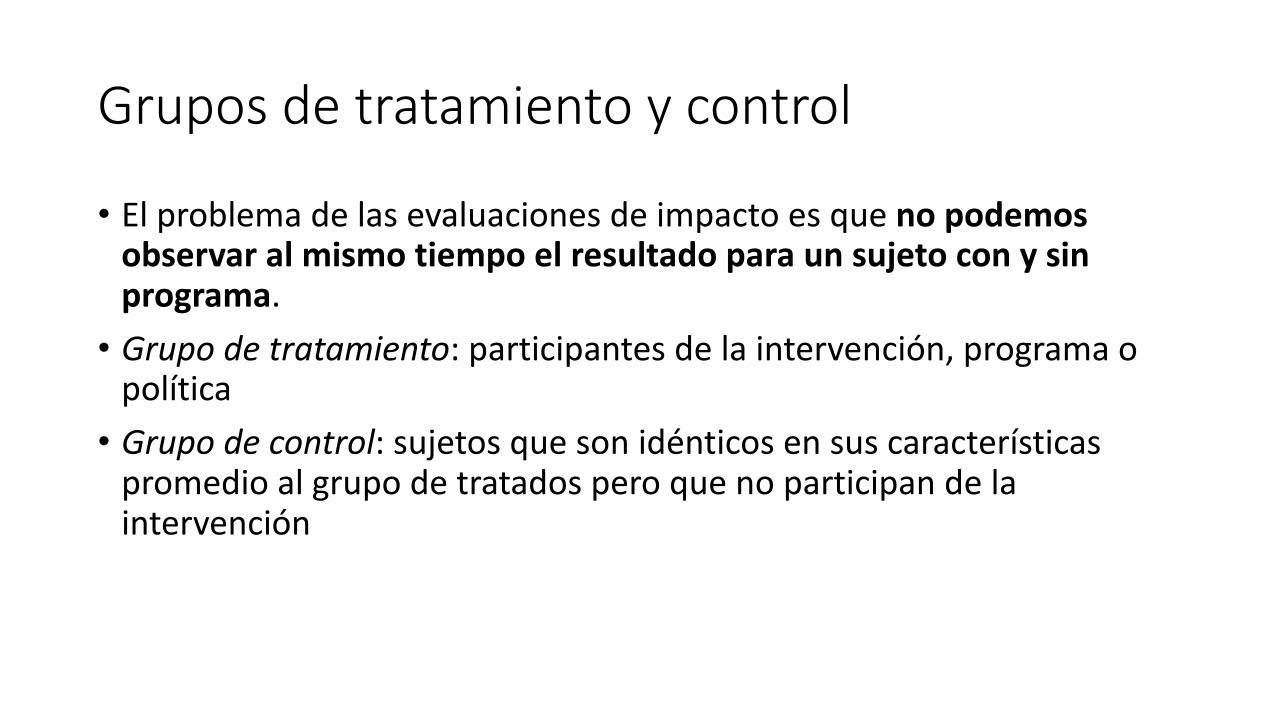
Gruposdetratamientoycontrol
• Elproblemadelasevaluacionesdeimpactoesquenopodemosobservaralmismotiempoelresultadoparaunsujetoconysinprograma.
• Grupodetratamiento:participantesdelaintervención,programaopolítica
• Grupodecontrol:sujetosquesonidénticosensuscaracterísticaspromedioalgrupodetratadosperoquenoparticipandelaintervención

Diseñosincorrectosdeevaluación1) Comparaciónantesydespuésdelgrupodeparticipantes
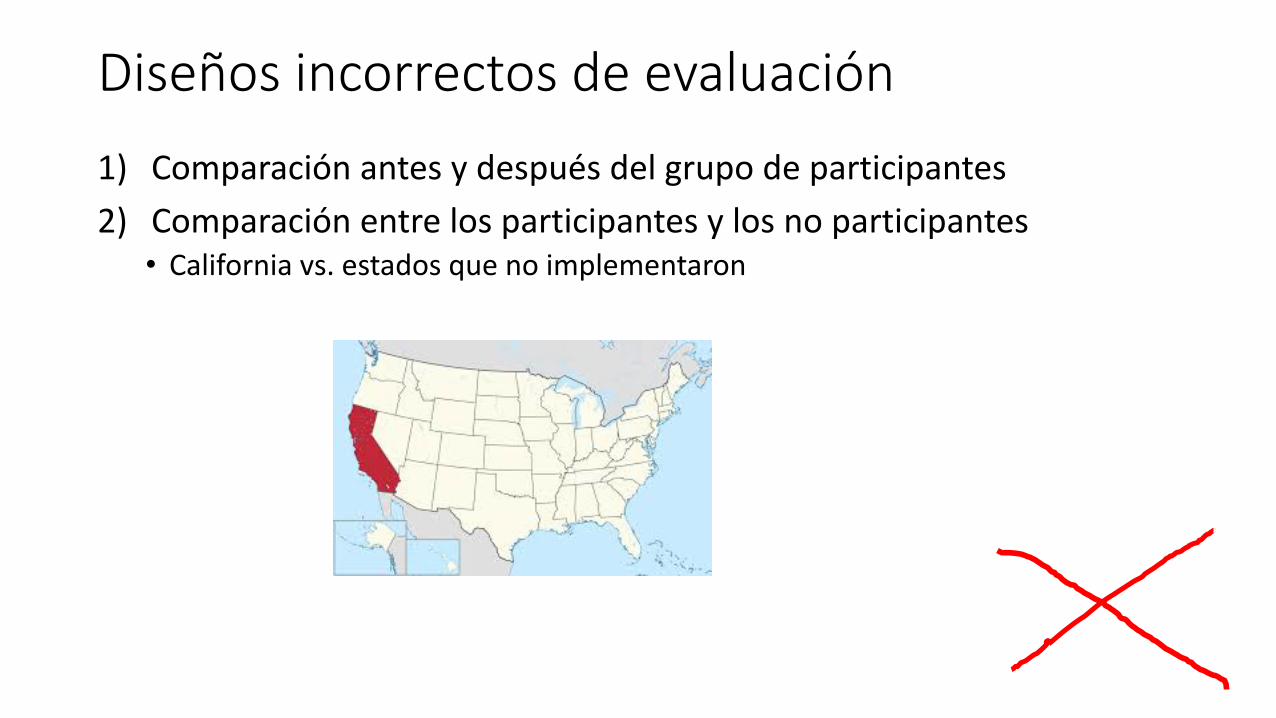
Diseñosincorrectosdeevaluación1) Comparaciónantesydespuésdelgrupodeparticipantes2) Comparaciónentrelosparticipantesylosnoparticipantes
• Californiavs.estadosquenoimplementaron
Kahoot.it

ElSesgodeSelección
• Elsesgodeselecciónocurrecuandolasrazonesporlascualesunindividuoparticipaeneltratamientoestáncorrelacionadasconlosresultados.
• Hospitalizaciónysaludautoreportada (estadodesaludgeneral)• Participaciónenolimpíadasmatemáticasyaprendizajeenmatemática(habilidad)• Participaciónenprogramasdecapacitaciónlaboral(potencialdegeneraringresos)• Tamañodeclaseyaprendizajes(niñosconmásdificultadseasignanaclasesmáschicas)
• Asegurarsequeelimpactoestimadoestélibredesesgodeselecciónesunodelosobjetivosydesafíosmásimportantesdecualquierevaluacióndeimpacto
Metodologíasdeevaluacióndeimpacto
CLAVE
Encontrarungrupodecontrolqueseaunbuencontrafactual
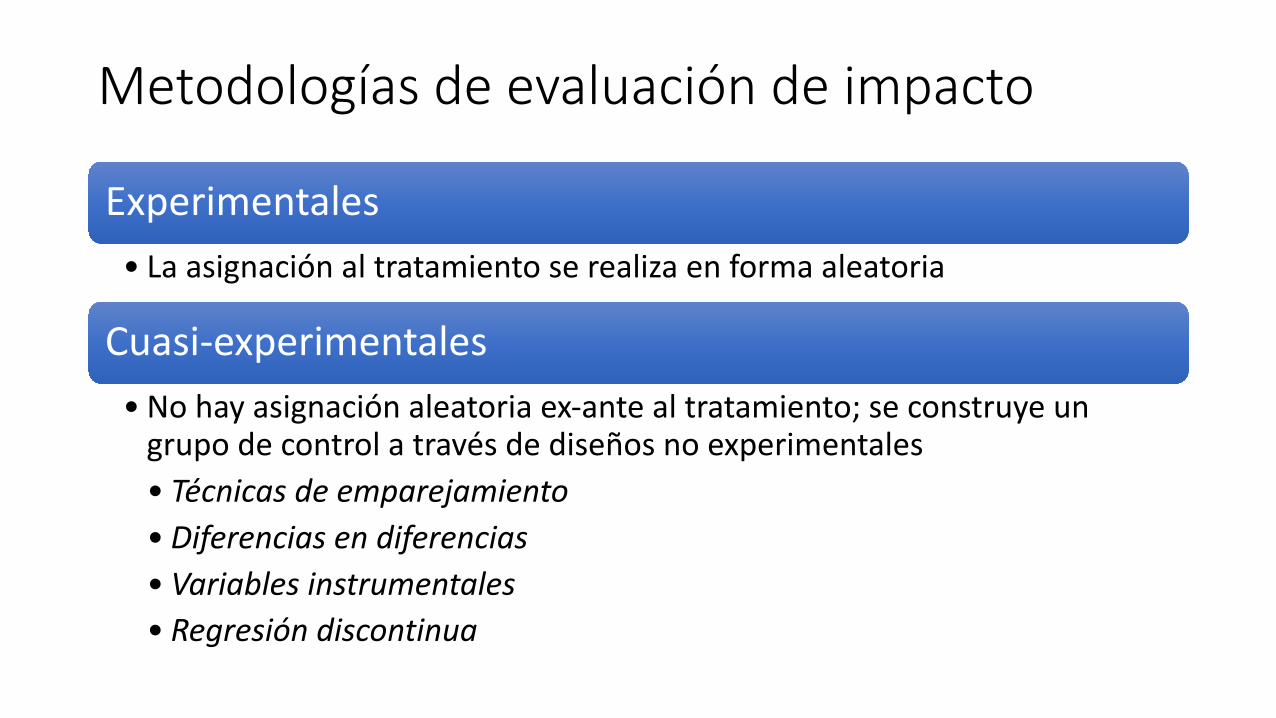
Metodologíasdeevaluacióndeimpacto
Experimentales• Laasignaciónaltratamientoserealizaenformaaleatoria
Cuasi-experimentales• Nohayasignaciónaleatoriaex-antealtratamiento;seconstruyeungrupodecontrolatravésdediseñosnoexperimentales• Técnicasdeemparejamiento• Diferenciasendiferencias• Variablesinstrumentales• Regresióndiscontinua
Diseñosexperimentales
Kahoot.it
• ¿Porquéconstituyelaevaluaciónexperimentalunbuendiseñodeevaluacióndeimpacto?
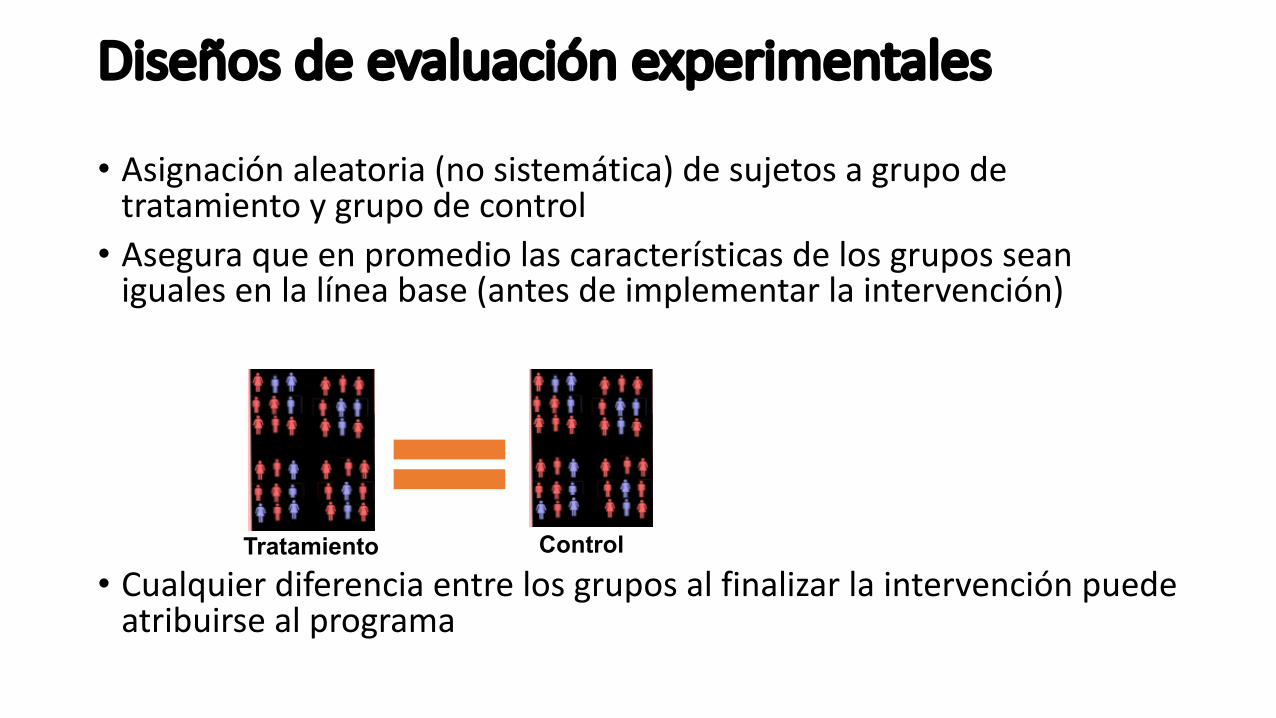
Diseñosdeevaluaciónexperimentales
• Asignaciónaleatoria(nosistemática)desujetosagrupodetratamientoygrupodecontrol
• Aseguraqueenpromediolascaracterísticasdelosgruposseanigualesenlalíneabase(antesdeimplementarlaintervención)
• Cualquierdiferenciaentrelosgruposalfinalizarlaintervenciónpuedeatribuirsealprograma
Tratamiento Control

Diseñodelexperimento(definirsub-población,necesidades,pertinencia,insumosyprocesos)
Aleatorización
Recogerdatosdelíneadebaseychequearbalance
Recogerdatosdeseguimiento
Análisisdedesgastedemuestraydeintegridaddetratamientoycontrol
Recogerdatosdelproceso
Evaluarimpacto
Pasosdeunexperimentoaleatorio
Métodosdealeatorización• Segúnunidaddealeatorización
• Anivelindividual• Aniveldegrupoocluster (escuelas,hospitales,barrios)
Kahoot.it
• Aleatorizacióngrupalvs.individual

Métodosdealeatorización• Segúnrestriccionesdelprograma
• Sobre-suscripción• Loteríasimple• Problemadedesgastediferencial
• Ingresoalprogramaenfases• Ventajas
• Másjusto• Incentivoaparticiparenelfuturoevitadesvinculación(attrition)delcontrol
• Desventajas• Puedeimpedirestimacióndeefectosdemedianoylargoplazo• Grupodecomparaciónpuedeverseafectadoporexpectativadetratamientofuturo
• Aleatorizaciónenlaburbuja• Aleatorizacióndelosincentivosparaparticipar
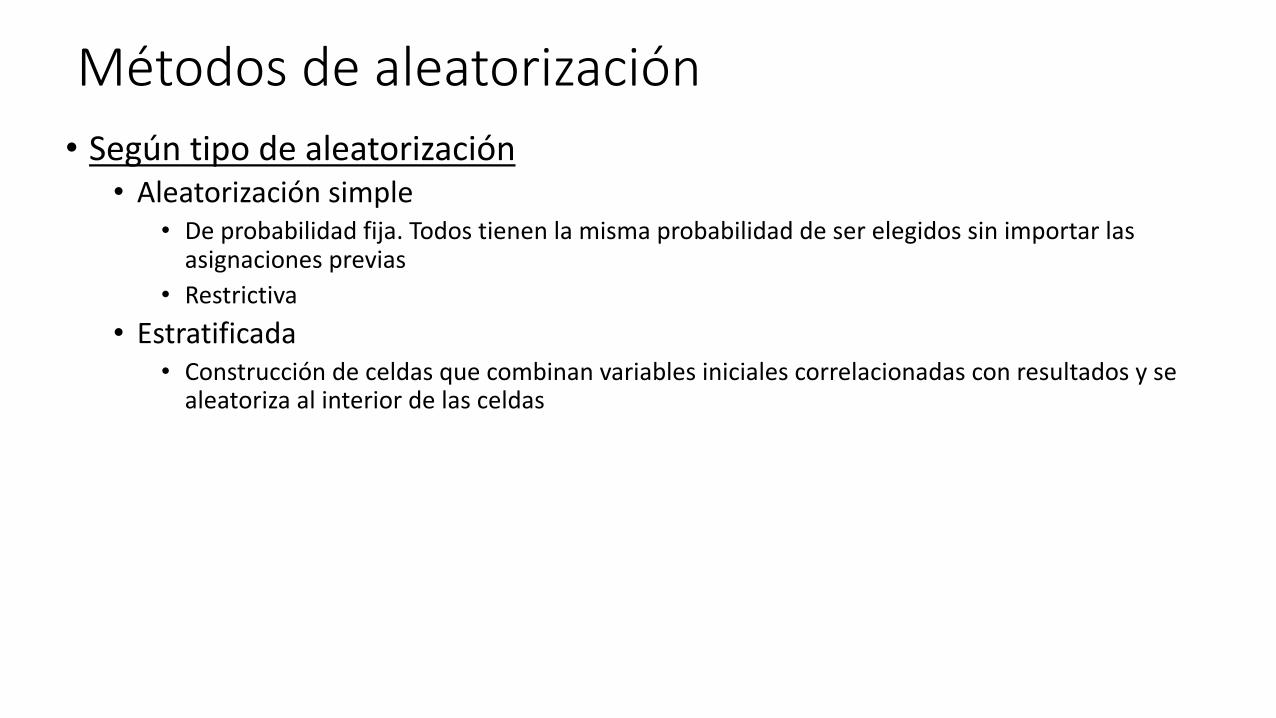
Métodosdealeatorización• Segúntipodealeatorización
• Aleatorizaciónsimple• Deprobabilidadfija.Todostienenlamismaprobabilidaddeserelegidossinimportarlasasignacionesprevias
• Restrictiva• Estratificada
• Construccióndeceldasquecombinanvariablesinicialescorrelacionadasconresultadosysealeatoriza alinteriordelasceldas
Consideracioneséticasdelaevaluaciónexperimental• ¿Eséticodejargentefueradelprograma?• Sonmuycaras• Privacidaddedatos• Quenadiequedepeor
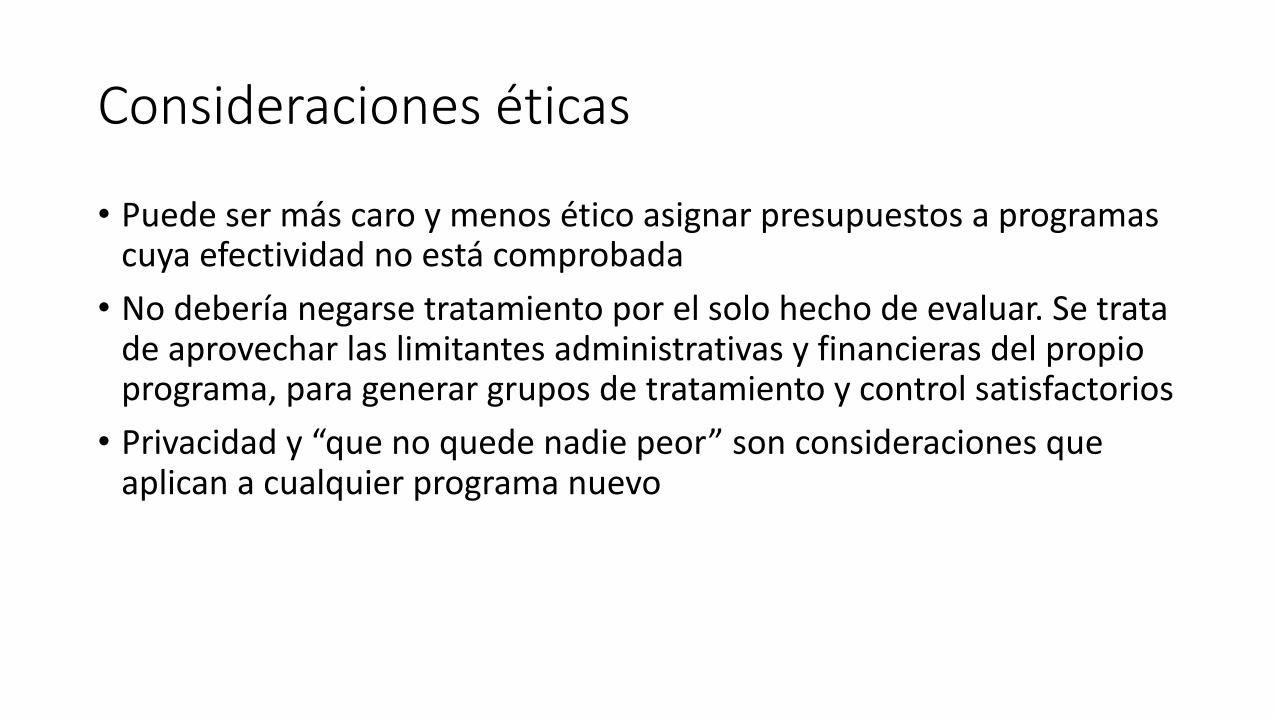
Consideracioneséticas
• Puedesermáscaroymenoséticoasignarpresupuestosaprogramascuyaefectividadnoestácomprobada
• Nodeberíanegarsetratamientoporelsolohechodeevaluar.Setratadeaprovecharlaslimitantesadministrativasyfinancierasdelpropioprograma,paragenerargruposdetratamientoycontrolsatisfactorios
• Privacidady“quenoquedenadiepeor”sonconsideracionesqueaplicanacualquierprogramanuevo

Kahoot.it
• Validezinternayexterna
Validezinternayexterna
• Unaevaluaciónesinternamenteválidasigeneraunestimativoprecisodelcontrafactual atravésdeungrupodecomparaciónválido
• Unaevaluaciónesexternamenteválidasilamuestraevaluadarepresentaenformaprecisaalapoblacióndelossujetoselegibles.Enestecasolosresultadosdelaevaluaciónpuedensergeneralizadosalapoblacióndesujetoselegibles
Cálculodepoder
• Esmuycostosoevaluaratodalapoblación–>muestreo• Errorestándar(errordeestimación):aumentaconlavarianzadelresultadoydisminuyeconeltamañodelamuestra
• Intervalodeconfianzaal95%:Media+/- 1,96*errorestándar• Confianza:en100muestras,95deellasreflejanelverdaderovalorpoblacional

Kahoot.it
• Significanciaestadística
Kahoot.it
• Significanciaestadística:ErrortipoI=ProbabilidaddeencontrarefectodadoqueNOlohay.
• 5%eslohabitual
• Poderestadístico:1-errortipoII=ProbabilidaddeencontrarimpactodadoqueSIloHAY
• 80%a90%eslohabitual• Elpoderdependede
• Lamagnituddelefecto(+)• eltamañodelamuestra(+)• Lavarianzadelresultado(-)• El%asignadoatratamientovs.control)
Kahoot.it
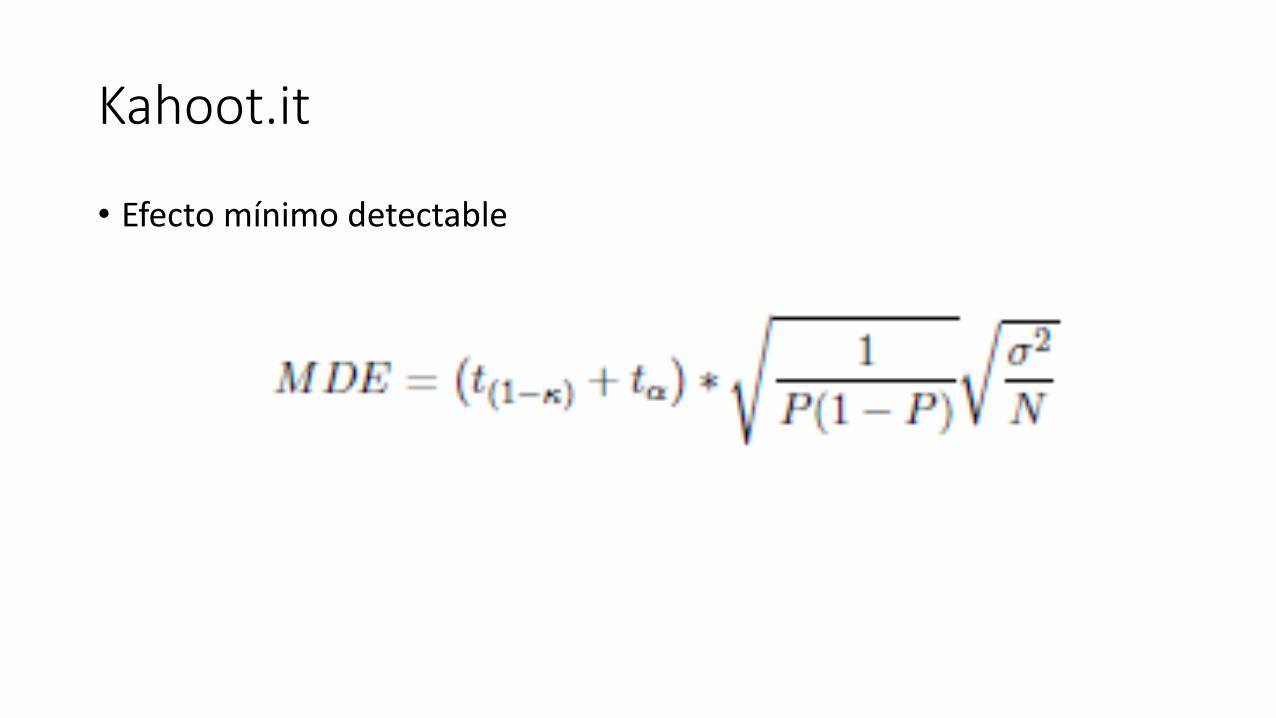
• Efectomínimodetectable

Kahoot.it
• Efectomínimodetectable
• Elcálculodepoderesclaveparasabersivalelapenaembarcarseenlaevaluaciónyparacalculareltamañomuestral mínimoparamantenerciertopoder

ProblemasdeseguimientoenunRCT
• Contaminación• Desgaste• Cumplimientoimperfecto

Diseñoscuasi-experimentales
Diseñoscuasi-experimentales
• Selecciónbasadaencaracterísticasobservables• Técnicasdeemparejamiento
• Selecciónbasadaencaracterísticasinobservables• Diferenciasendiferencias• Variablesinstrumentales• Regresióndiscontinua
Técnicasdeemparejamientoo“matching”
• Consistenenelusedebasesdedatosgrandesytécnicasestadísticasparaconstruirelmejorgrupodecomparaciónbasadoencaracterísticasobservables
• Emparejamientoexacto• Emparejamientoenbasealpropensity score• Emparejamientoendiferenciasendiferencias• Controlsintético
Emparejamientoexacto
144 Impact Evaluation in Practice
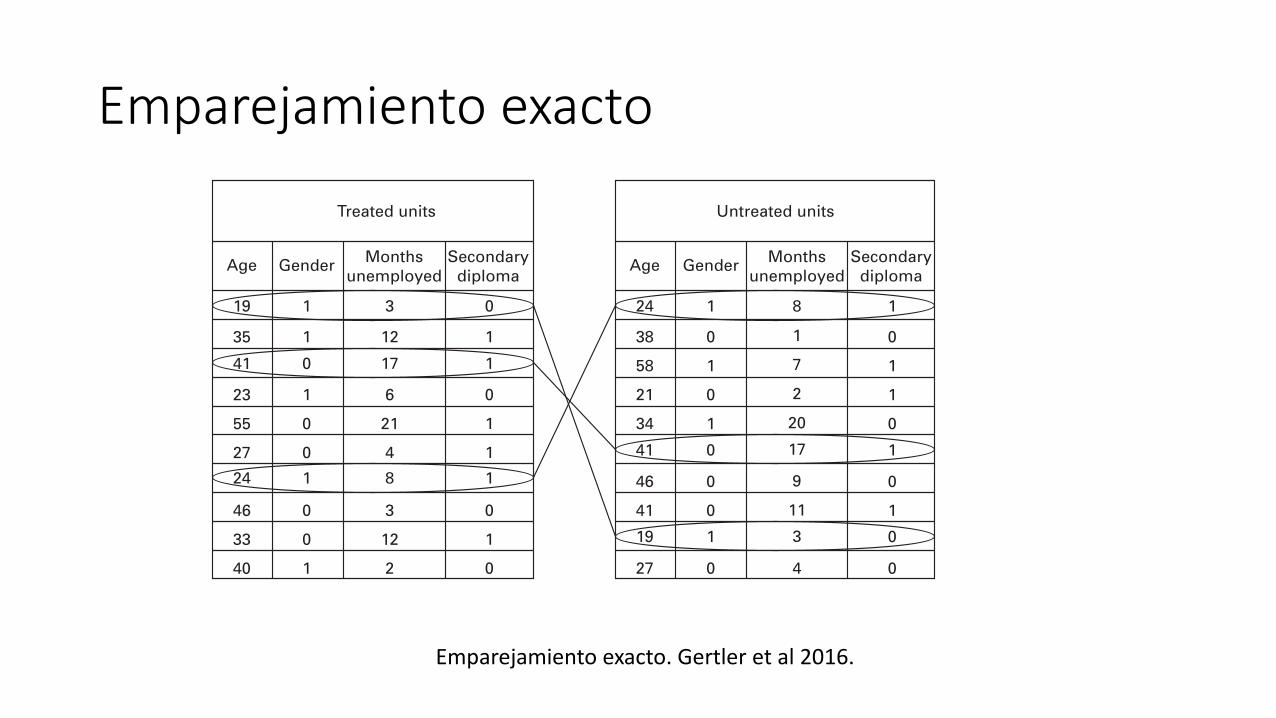
decision to enroll in the program. Unfortunately, this is easier said than done. If the list of relevant observed characteristics is very large, or if each characteristic takes on many values, it may be hard to identify a match for each of the units in the treatment group. As you increase the number of characteristics or dimensions against which you want to match units that enrolled in the program, you may run into what is called the curse of dimensionality. For example, if you use only three important characteristics to identify the matched comparison group, such as age, gender, and whether the individual has a secondary school diploma, you will probably find matches for all participants enrolled in the program in the pool of those who are not enrolled (the nonenrolled), but you run the risk of leaving out other potentially important characteristics. However, if you increase the list of characteristics—say, to include number of children, number of years of edu-cation, number of months unemployed, number of years of experience, and so forth—your database may not contain a good match for most of the pro-gram participants who are enrolled, unless it contains a very large number of observations. Figure 8.1 illustrates matching based on four characteris-tics: age, gender, months unemployed, and secondary school diploma.
Propensity Score Matching
Fortunately, the curse of dimensionality can be quite easily solved using a method called propensity score matching (Rosenbaum and Rubin 1983). In this approach, we no longer need to try to match each enrolled unit to a
Figure 8.1 Exact Matching on Four Characteristics
Treated units
Age
19 1 3 0
1
1
0
1
1
1
0
1
0
12
17
6
21
4
8
3
12
2
1
0
1
0
0
1
0
0
1
35
41
23
55
27
24
46
33
40
Gender Monthsunemployed
Secondarydiploma
Untreated units
Age
24
38
58
21
34
41
46
41
19
27
1
0
1
0
1
0
0
0
1
0
8
1
7
2
20
17
9
11
3
4
1
0
1
1
0
1
0
1
0
0
Gender Monthsunemployed
Secondarydiploma
Emparejamientoexacto.Gertler etal2016.
Emparejamientoenbaseapropensity score
• Construimosuníndicedeparticipaciónbasadoencaracterísticasobservablesdelindividuo,elpropensity score
• Nosquedamosconobservacionestratadasynotratadasconunsoportecomúndelpropensity score
• Seasignanalgrupodetratamientoaindividuostratadosyalgrupodecontrolaindividuossimilaresenobservablesperoquenohansidotratados
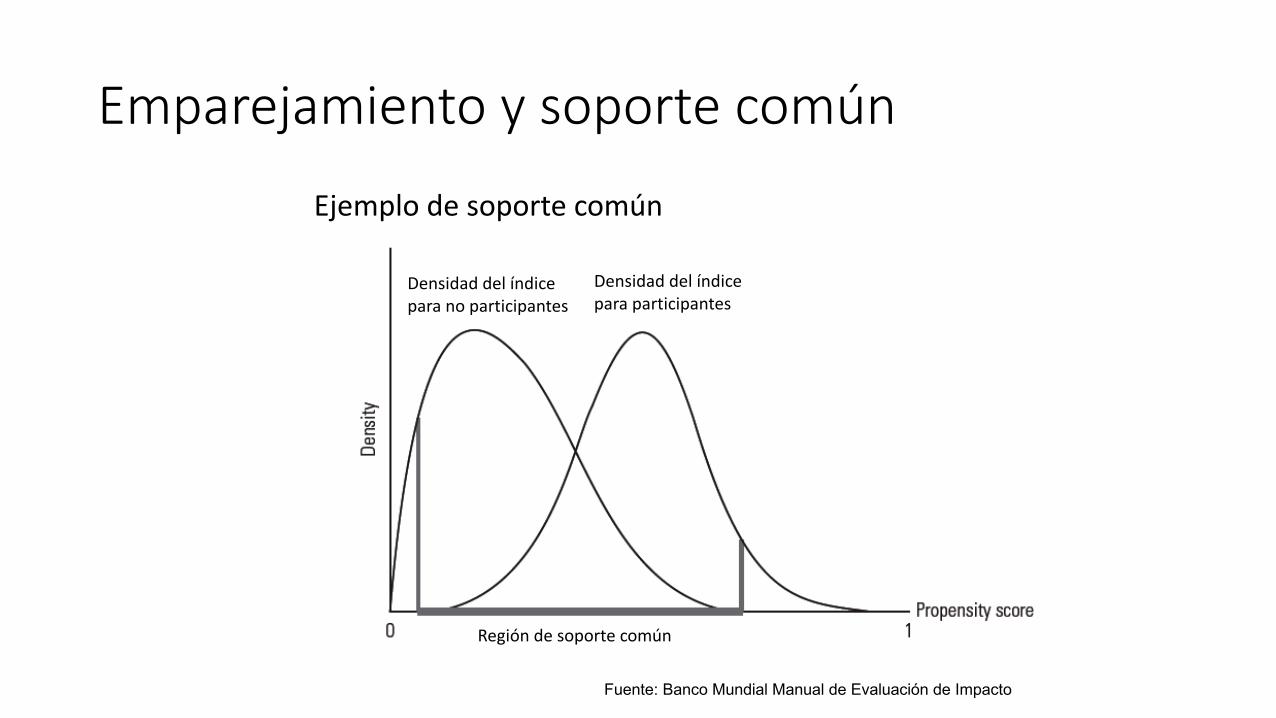
Emparejamientoysoportecomún
Fuente: Banco Mundial Manual de Evaluación de Impacto
Densidaddelíndiceparanoparticipantes
Densidaddelíndiceparaparticipantes
Regióndesoportecomún
Ejemplodesoportecomún
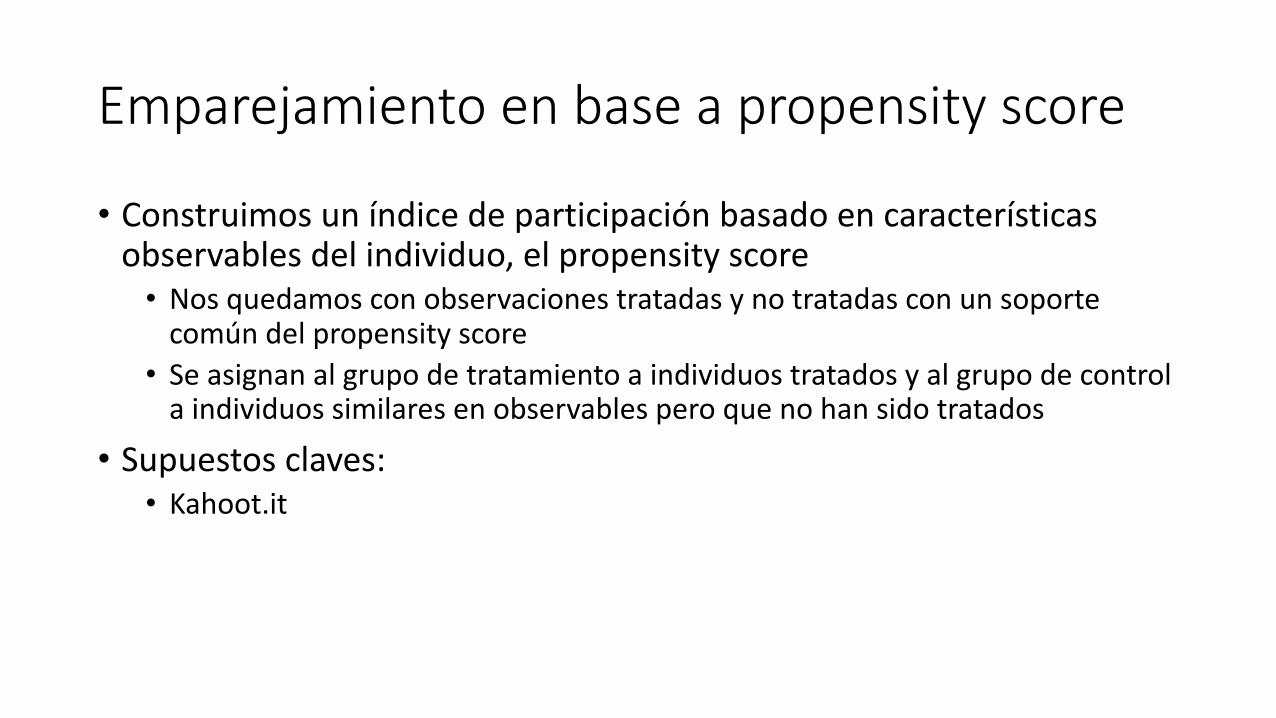
Emparejamientoenbaseapropensity score
• Construimosuníndicedeparticipaciónbasadoencaracterísticasobservablesdelindividuo,elpropensity score
• Nosquedamosconobservacionestratadasynotratadasconunsoportecomúndelpropensity score
• Seasignanalgrupodetratamientoaindividuostratadosyalgrupodecontrolaindividuossimilaresenobservablesperoquenohansidotratados
• Supuestosclaves:• Kahoot.it
Emparejamientoenbaseapropensity score
• Supuestosclaves:• Independenciacondicionada:unavezquecontroloportodaslascaracterísticasqueobservo,eliminoelsesgodeselección(nohaycorrelaciónentrelaparticipaciónycaracterísticasdelindividuoquelollevenaobtenerunresultado)
• Soportecomún
Diferenciasendiferencias
• ComparalosCAMBIOSenresultadoseneltiempoentreunidadesqueparticiparondelprograma(tratamiento)yunidadesqueno(control).Estopermitecorregirpordiferenciasentretratamientoycontrolquesonconstanteseneltiempo
• Pischke (2007):efectosdelalongituddelañoescolarenelaprendizaje
• Hasta1960todoslosEstadosalemanesempezabanelañoescolarenlaprimavera,menosBavaria
• 1966-67:sedecidióquetodosempezaríanenotoño• transición:2añoscortosparacohortesafectados(24enlugarde37semanas)
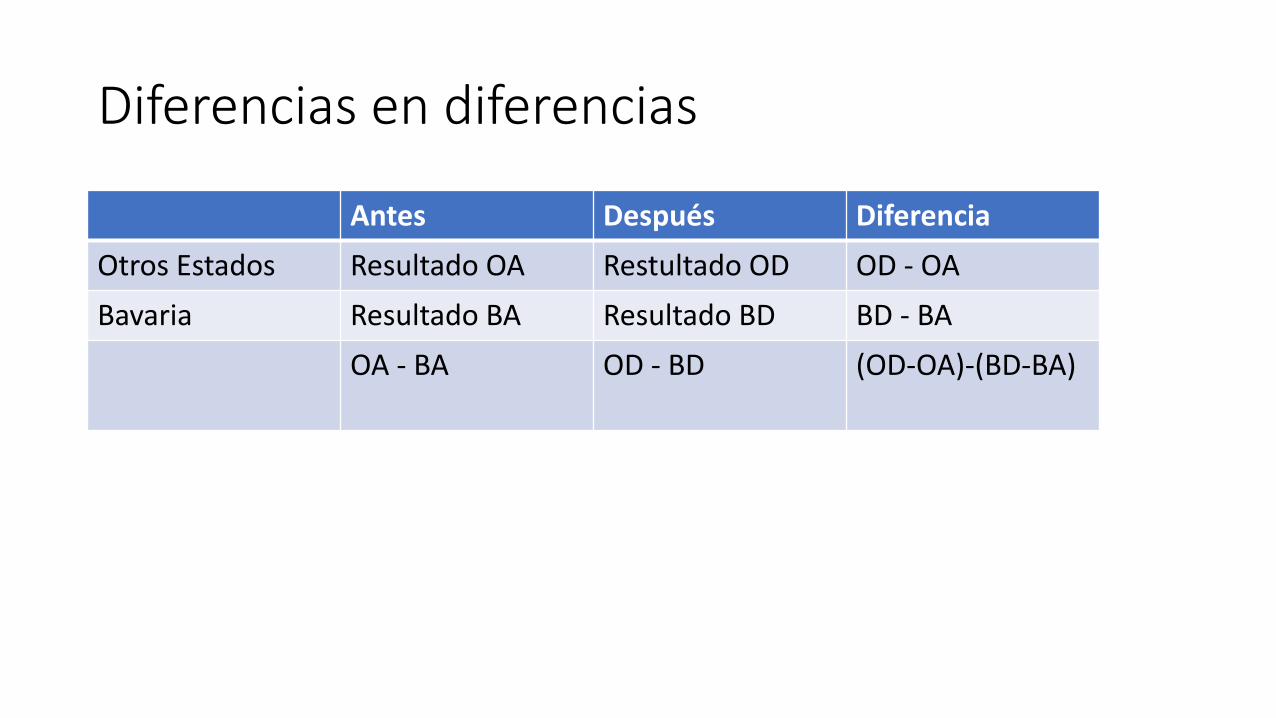
Diferenciasendiferencias
Antes Después DiferenciaOtrosEstados Resultado OA Restultado OD OD - OABavaria ResultadoBA Resultado BD BD- BA
OA - BA OD- BD (OD-OA)-(BD-BA)
Diferenciasendiferencias
• Kahoot.it• Supuestoclave
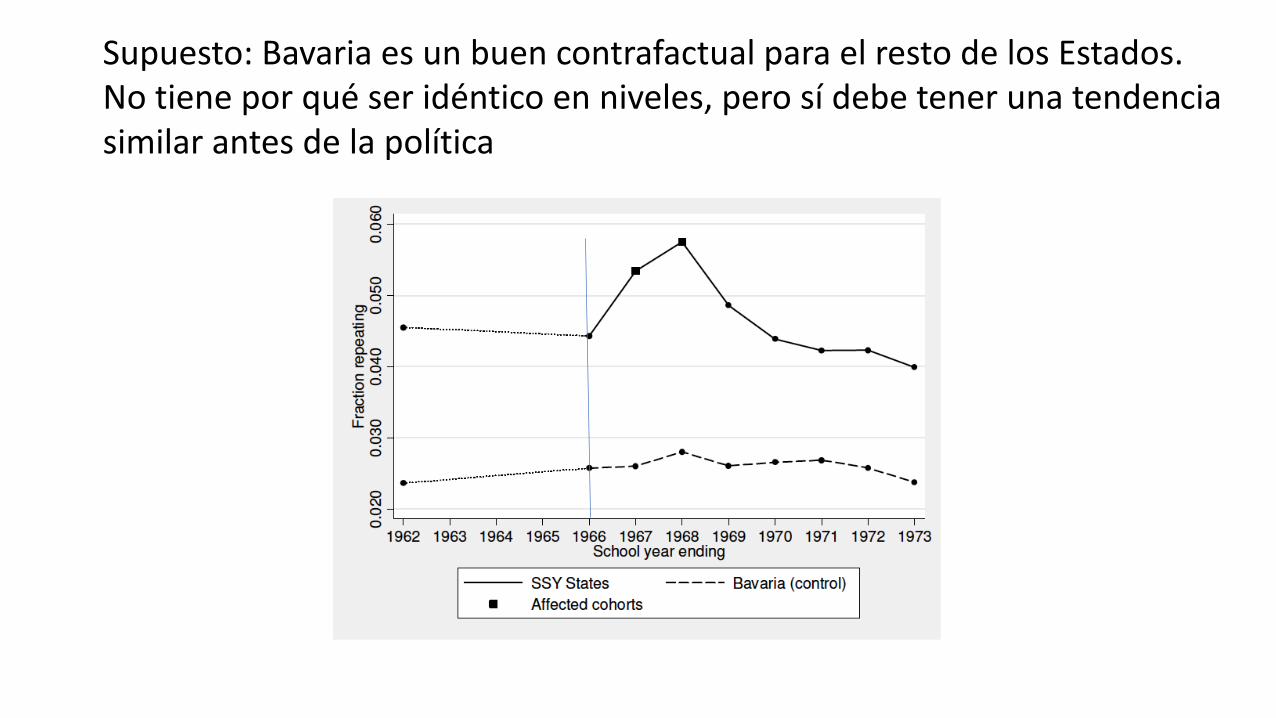
Supuesto:Bavariaesunbuencontrafactual paraelrestodelosEstados.Notieneporquéseridénticoenniveles,perosídebetenerunatendenciasimilarantesdelapolítica
Variablesinstrumentales
• Asignaciónaltratamientodependeexógenamentedeciertasvariablesnocorrelacionadasconlosresultados
• Ejemplos:• distanciaalaclínica• Parosdetransporte• Incentivosaleatoriosaparticipardeunprograma• Mesdenacimiento• Presenciadeunauniversidadenlazonadondeviveelindividuo
Variablesinstrumentales
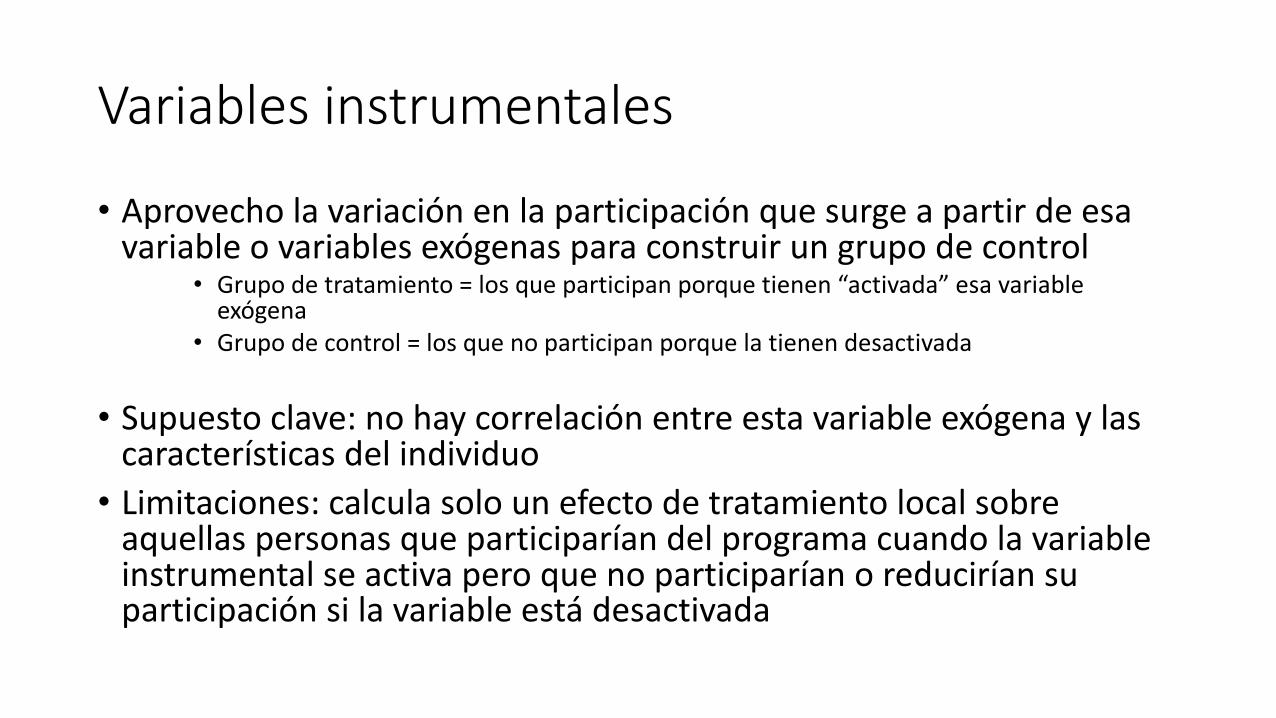
• Aprovecholavariaciónenlaparticipaciónquesurgeapartirdeesavariableovariablesexógenasparaconstruirungrupodecontrol
• Grupodetratamiento=losqueparticipanporquetienen“activada”esavariableexógena
• Grupodecontrol=losquenoparticipanporquelatienendesactivada
• Supuestoclave:nohaycorrelaciónentreestavariableexógenaylascaracterísticasdelindividuo
• Limitaciones:calculasolounefectodetratamientolocalsobreaquellaspersonasqueparticiparíandelprogramacuandolavariableinstrumentalseactivaperoquenoparticiparíanoreduciríansuparticipaciónsilavariableestádesactivada
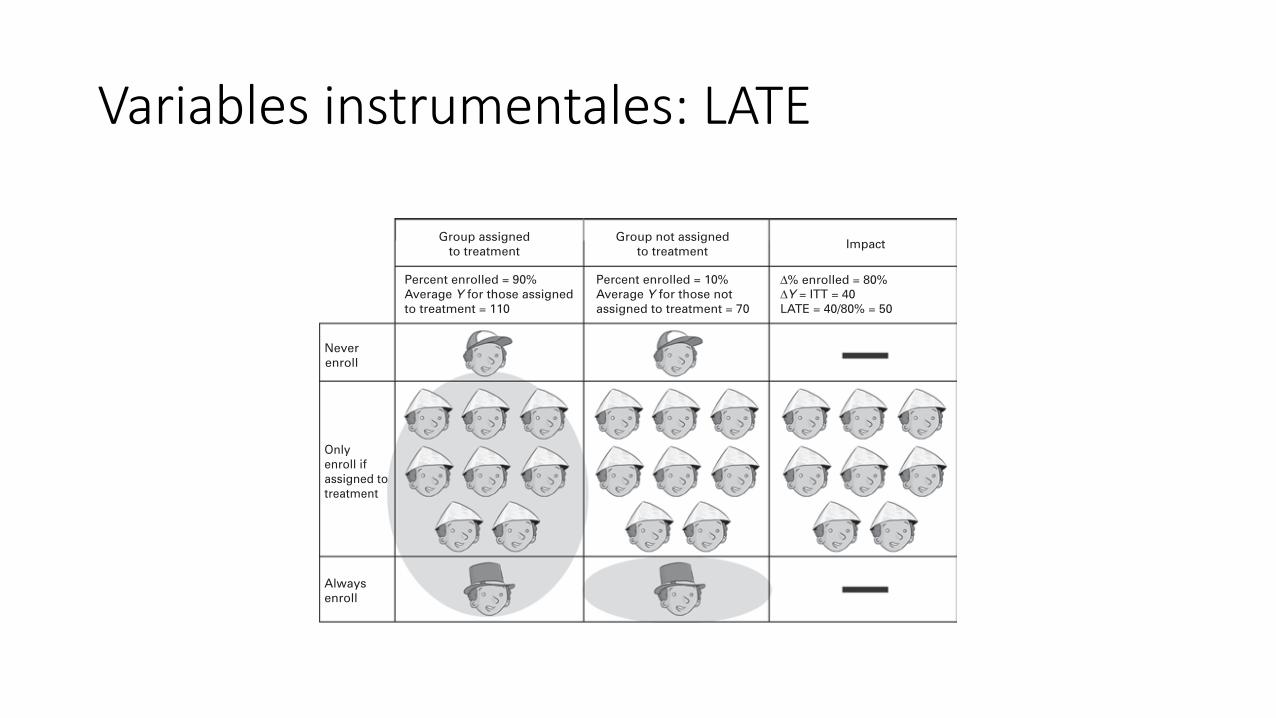
Variablesinstrumentales:LATE
Instrumental Variables 97
are in the treatment group or the comparison group. Thus the diff erence in outcomes between the two groups must necessarily come from the eff ect of the program on the only group aff ected by their assignment to treatment or comparison: that is, the Enroll-if-assigned group. So if we can identify the Enroll-if-assigned in both groups, it will be easy to esti-mate the impact of the program on them.
In reality, although we know that these three types of individuals exist in the population, we cannot separate out unique individuals by whether they are Enroll-if-assigned, Never, or Always. In the group that was assigned treatment, we can identify the Nevers (because they have not enrolled), but we cannot diff erentiate between the Always and the Enroll-if-assigned (because both are enrolled). In the group that was not assigned treatment, we can identify the Always group (because they enroll in the program), but we cannot diff erentiate between the Nevers and the Enroll-if-assigned.
Figure 5.2 Estimating the Local Average Treatment Effect under Randomized Assignment with Imperfect Compliance
Note: ∆ = causal impact; Y = outcome. The intention-to-treat (ITT) estimate is obtained by comparing
outcomes for those assigned to the treatment group with those assigned to the comparison group,
irrespective of actual enrollment. The local average treatment effect (LATE) estimate provides the im-
pact of the program on those who enroll only if assigned to the program (Enroll-if-assigned). The LATE
estimate does not provide the impact of the program on those who never enroll (the Nevers) or on
those who always enroll (the Always).
Group not assignedto treatment
Group assignedto treatment
Neverenroll
Onlyenroll ifassigned totreatment
Alwaysenroll
Percent enrolled = 90%Average Y for those assignedto treatment = 110
Percent enrolled = 10%Average Y for those notassigned to treatment = 70
Impact
∆% enrolled = 80%∆Y = ITT = 40LATE = 40/80% = 50

Regresióndiscontinua
• Programasqueusanuníndiceparaasignartratamientoyquetienenunpuntodecortequedeterminasilosindividuossonelegiblesalprograma
• Asignacionesfamiliares• Ingresosalauniversidad
• Sepuedeusartécnicasderegresióndiscontinuacuandoelíndice• Ordenaindividuosenformacontinua• Tieneuncorteclaramentedefinidoparaasignartratamiento• Soloseusaparaasignartratamiento• Nosepuedemanipularel“puntaje”decadaindividuo
Regresióndiscontinua
• Silaregulaciónimplicaquevaloresdelíndicealaderechadelpuntodecorterecibentratamiento:laregresióndiscontinuadefinecomo
• Grupodetratamientoalosindividuosconunvalordelíndicecercanoperoporencimadelpuntodecorte
• Grupodecontrolalosindividuosconunvalordelíndicecercanoperopordebajodelpuntodecorte

Ejemplo:subsidiosafertilizantesparaagricultoresconmenosde50hectáreas
Regression Discontinuity Design 117
program on the smallest farms—say, those with 10 or 20 acres of land—where the eff ects of a fertilizer subsidy may diff er in important ways from the medium-size farms with 48 or 49 hectares. One advantage of the RDD method is that once the program eligibility rules are applied, no eligible units need to be left untreated for the purposes of the impact evaluation. The trade-off is that impacts for observations far away from the cutoff will not be known. Box 6.2 presents an example of the use of RDD for evaluating a social safety net program in Jamaica.
Fuzzy Regression Discontinuity Design
Once we have verifi ed that there is no evidence of manipulation in the eligibility index, we may still face a challenge if units do not respect their assignment to the treatment or comparison groups. In other words, some units that qualify for the program on the basis of their eligibility index may opt not to participate, while other units that did not qualify for the program on the basis of their eligibility index may fi nd a way to partici-pate anyway. When all units comply with the assignment that corresponds to them on the basis of their eligibility index, we say that the RDD is “sharp,” while if there is noncompliance on either side of the cutoff , then
Figure 6.2 Rice Yield, Smaller Farms versus Larger Farms (Follow-Up)
19
20
18
17
16
1520 30 40 50
= yield for farms > 50 hectares= yield for farms < 50 hectares
Hectares of land
Ric
e yi
eld
(bus
hels
per
hec
tare
s)
60 70 80
= ImpactA
A
B
B
Fuente:Gertler etal2016

Regresióndiscontinua• 2tipos:
• Sharpodeterminística:eltratamientoseactivaconprobabilidad1cuandosepasaelpuntodecorte
• Fuzzy oprobabilística:pasarelpuntodecorteaumentalaprobabilidaddetratamientoperonoes1(discontinuidadenlaasignaciónoperacomovariableinstrumental)
Regression Discontinuity Design 119
Checking the Validity of the Regression Discontinuity Design
For a RDD to yield an unbiased LATE estimate at the cutoff , it is impor-tant that the eligibility index not be manipulated around the cutoff so that an individual can change treatment or control status.2 Manipulation of the eligibility criteria can take many forms. For example, the enumera-tors who collect data that are used to compute the eligibility score could change one or two responses of respondents; or respondents may pur-posefully lie to enumerators if they think that doing so would qualify them for the program. In addition, manipulation of the scores might get worse over time as enumerators, respondents, and politicians all start learning the “rules of the game.” In the fertilizer subsidy example, manipulation around the cutoff would occur if farm owners could alter land titles or misreport the size of their farms. Or a farmer with 50.3 hectares of land might fi nd a way to sell off a half hectare to qualify for the program, if the expected benefi ts from the fertilizer subsidy were worth doing so.
One telltale sign of manipulation is illustrated in fi gure 6.4. Panel a shows the distribution of households according to their baseline index when there is no manipulation. The density of households around the cut-off (50) is continuous (or smooth). Panel b shows a diff erent situation: a larger number of households seem to be “bunched” right below the cutoff , while relatively few households can be found right above the cutoff . Since there is no a priori reason to believe that there should be a large shift in the number of households right around the cutoff , the occurrence of that shift in the distribution around the cutoff is evidence that somehow households
Figure 6.3 Compliance with Assignment
a. Sharp RDD(full compliance)
Perc
ent o
f hou
seho
lds
that
par
ticip
ate
Perc
ent o
f hou
seho
lds
that
par
ticip
ate
b. Fuzzy RDD(incomplete compliance)
10
50
100
10
50
100
30 40 50 60 70 80 30 40 50 60 70 80
Baseline poverty index Baseline poverty index
Fuente:Gertler etal2016
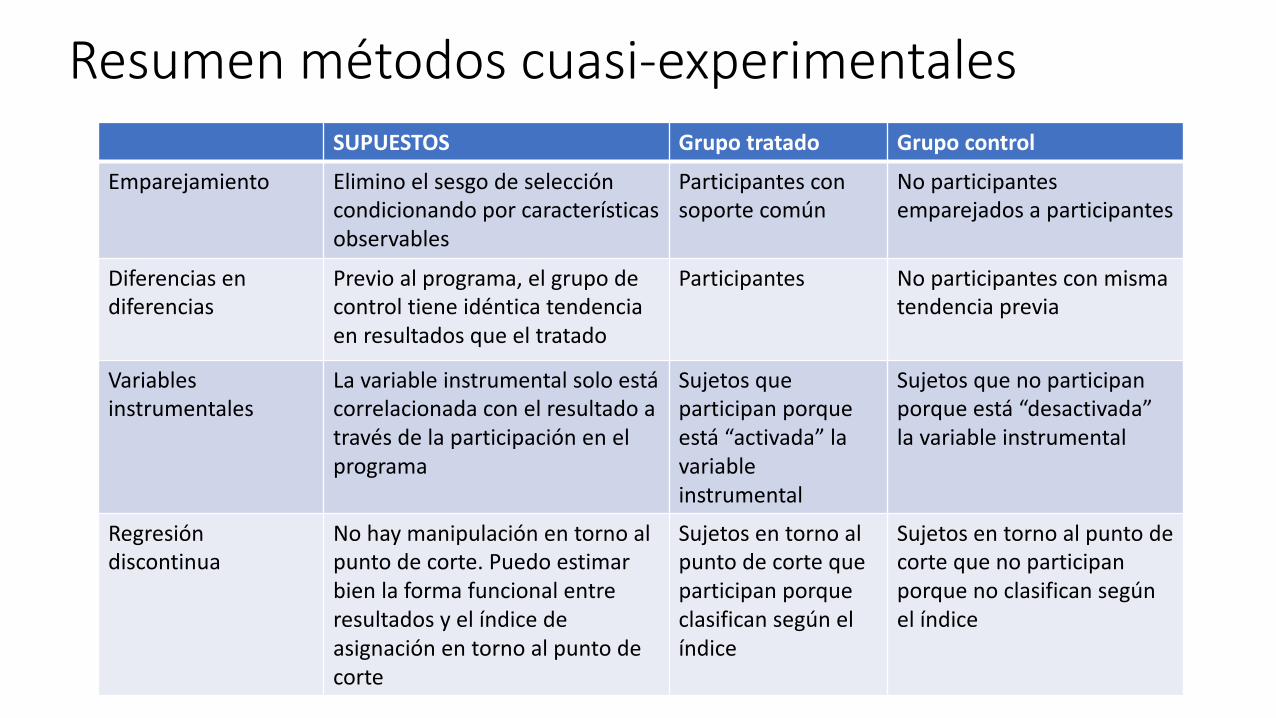
Resumenmétodoscuasi-experimentalesSUPUESTOS Grupotratado Grupocontrol
Emparejamiento Eliminoelsesgodeseleccióncondicionandoporcaracterísticasobservables
Participantesconsoporte común
Noparticipantesemparejadosaparticipantes
Diferenciasendiferencias
Previoalprograma,elgrupodecontroltieneidénticatendenciaenresultados queeltratado
Participantes Noparticipantesconmismatendenciaprevia
Variablesinstrumentales
Lavariableinstrumentalsolo estácorrelacionadaconelresultadoatravésdelaparticipaciónenelprograma
Sujetosqueparticipan porqueestá“activada”lavariableinstrumental
Sujetosquenoparticipanporqueestá“desactivada”lavariableinstrumental
Regresióndiscontinua
Nohaymanipulaciónentornoalpuntodecorte. Puedoestimarbienlaformafuncionalentreresultadosyelíndicedeasignaciónentornoalpuntodecorte
Sujetosentornoalpuntodecortequeparticipanporqueclasificansegúnelíndice
Sujetos entornoalpuntodecortequenoparticipanporquenoclasificansegúnelíndice