LA REVALORIZACIÓN DEL USO DE ALMIDÓN DE TAPIOCA ...
228
― Instituto de Agroquímica y Tecnología de Alimentos ― LA REVALORIZACIÓN DEL USO DE ALMIDÓN DE TAPIOCA. ESTRATEGIA MULTIENFOQUE EN SU APLICACIÓN EN RELLENOS DE FRUTA TESIS DOCTORAL Maria Alejandra Agudelo Motato Dirigida por: Dra. Susana Fiszman Dal Santo Dra. Paula Varela Tomasco Valencia, Noviembre de 2014
Transcript of LA REVALORIZACIÓN DEL USO DE ALMIDÓN DE TAPIOCA ...
― Instituto de Agroquímica y Tecnología de Alimentos ―
LA REVALORIZACIÓN DEL USO DE
ALMIDÓN DE TAPIOCA. ESTRATEGIA
MULTIENFOQUE EN SU APLICACIÓN EN
RELLENOS DE FRUTA
TESIS DOCTORAL
Maria Alejandra Agudelo Motato
Dirigida por:
Dra. Susana Fiszman Dal Santo
Dra. Paula Varela Tomasco
Valencia, Noviembre de 2014


Dña. Susana Fiszman Dal Santo, Profesora de Investigación, Investigadora
Científica, del Instituto de Agroquímica y Tecnología de Alimentos del
Consejo Superior de Investigaciones Científicas y Dña. Paula Varela
Tomasco, Senior Researcher del Sensory, Consumer Science y Innovation
Group, Nofima AS, Norway.
HACEN CONSTAR QUE:
El trabajo de investigación titulado “La revalorización del uso de almidón
de tapioca. Estrategia multienfoque en su aplicación en rellenos de
fruta” que presenta Dña. Maria Alejandra Agudelo Motato por la
Universidad Politécnica de Valencia, ha sido realizado en el Instituto de
Agroquímica y Tecnología de alimentos (IATA-CSIC) bajo nuestra dirección
y que reúne las condiciones para optar al grado de Doctor.
Valencia, Noviembre de 2014
Fdo: Dra. Susana Fiszman Dal Santo Fdo: Dra. Paula Varela Tomasco


A mi familia especialmente a mi madre a mi esposo y a mi hijo,

Agradecimientos
Gracias a Dios por guiar mis pasos en cada momento, para estar en el lugar
indicado y en el tiempo adecuado para vivir cada etapa de mi vida, como
esta que hoy termina con la elaboración de esta tesis.
A Sucromiles S.A, hoy Sucroal S.A: A Orlando Castaño, desde el principio
de mi vida profesional y laboral, siempre pendiente de mí, ayudándome en
todo, has sido más que un padre para mí, como te digo de cariño “mi
angelito”. Este viaje ha sido en gran parte tu obra, Gracias
Al Doctor Colmenares
Gracias por ser más que un Gerente, el padre de una gran familia, por
confiar en mí y en mis capacidades, por todo su apoyo y cariño y por poner
siempre los medios necesarios para que mi entrenamiento y capacitación
fuera el mejor y en todos las áreas, no solo a nivel profesional sino también
a nivel personal. Sucromiles fue mi sueño como ingeniera química y ha sido
la plataforma para lanzarme por muchos sueños más, que hoy son una
realidad en mi vida.
A mis compañeros en Sucroal: Andrés, Nhora, Iber y Luis Fernando, gracias
por su amistad y gran ayuda enviando materias primas, información y por
los análisis de muestras realizados cuando fue requerido.
A mis directoras de tesis en el IATA,
Susana, eres la mejor, no tengo palabras para expresar todo mi
agradecimiento por toda tu contribución a mi tesis, a mi crecimiento
profesional y personal, eres más que mi directora una gran amiga y una
persona muy especial a la que admiro no solo por su gran labor y logros
científicos y profesionales, sino también por sus grandes virtudes como
mujer y madre.
Paula V, gracias por dirigir mi tesis al lado de Susana, son un gran equipo y
sobre todo gracias por tu alegría, tus consejos tanto en mi vida profesional
como en mi vida personal. Eres un ejemplo a seguir, por tu arduo trabajo el
cual te ha llevado donde estas ahora con todos tus logros profesionales y lo
más importante sin dejar de lado tu vida personal como esposa y como
madre.
A Isabel Hernando, porque gracias a ti tuve la oportunidad de conocer a
Susana y hacer mi tesis en el IATA. Gracias por tu alegría, tu apoyo y por
ser mi tutora en la universidad.
A mis compañeras
Johanna, gracias por tu sincera amistad desde la universidad y ahora en el
laboratorio, que buenos momentos hemos compartido.
Eli, Laura y Pau T, gracias porque fueron la mayor compañía y alegría
mientras estuvieron en el laboratorio, cuanto las echo de menos, son
personas muy especiales, gracias por catar mi comida colombiana
especialmente mi Lau y por enseñarme gran parte de la cultura valenciana
(española), bueno y también de la ecuatoriana mi Eli y de la árabe y las
expresiones y dichos que tanto compartimos con Pau.
Teresa, Ana y Amparo, gracias por su colaboración y ayuda, por la
información aportada para mi tesis, por sus enseñanzas sobre el manejo de
equipos, por todos sus consejos y por brindarme su amistad.
Antonio, Iñaqui y Andrea Fantini, gracias por su valiosa colaboración en el
trabajo experimental de mi tesis, por hacer mil y un rellenos de fruta y/o las
largas horas en el reómetro o en las salas de análisis sensorial.
A todas las personas que pasaron por el laboratorio durante mi estadía allí,
por las risas y los buenos ratos, a Vicenta, Aurora, Myrna, Ángela, Julián,
Carolina, Dimitar, Natalia, a la alegre Gabriela y a la dulce Mary jane
Al IATA, por poner los medios para la realización de mi tesis, y en especial
al personal y compañeros de otros laboratorios que he conocido en estos
años. Al panel de catadores entrenados, y al resto de catadores que
participaron en la tesis, por su tiempo y colaboración desinteresada.
A mis amigos y amigas, porque forman parte de mi vida porque
compartimos penas y alegrías, y porque siempre me apoyan y están ahí
cuando los necesito. Muy especialmente A mi July y a mi Annita, estuvieron
allí justo cuando más necesitada una mano amiga en medio de la distancia,
la soledad y el no encontrar a nadie que me orientara en medio de la selva
de cemento donde el lenguaje español parecía ser un idioma diferente.
Estaban aquí desde Colombia para estar junto a mí, orientarme, ayudarme
en todo, pero sobre todo para darme su valiosa amistad y compañía.
A Maria Estella Matos por mostrarme el camino para hacer mis sueños
realidad con la fuerza y la luz que hay en mi interior, por enseñarme a
comunicarme mejor y a vivir el aquí y el ahora, gracias amiga.
A mis padres, porque sin duda no estaría aquí sin ellos, Al resto de mi
familia porque todos han tratado de ayudarme y los he tenido cuando los he
necesitado. Y también a la familia de mi esposo que ahora es mi familia.
A mis dos príncipes porque son el amor de mi vida,
A mi José (hermoso), por estar a mi lado, queriéndome y cuidándome, por
entender y respetar mi trabajo, por hacer realidad mis sueños y por hacerme
sentir la mujer más feliz del mundo.

A mi Samuel, un milagro hecho realidad, por ser un aliciente más en mi vida
para cumplir todos mis sueños y proyectos.
Alejandra
Resumen
La identificación de nuevos nichos de mercado para productos procesados
que contenga almidón de tapioca (yuca) se hace indispensable para
favorecer el desarrollo de esta agroindustria en Colombia y en otros países
productores. Los consumidores perciben los almidones nativos como
“naturales” o “de menor riesgo” que otros ingredientes/ aditivos, como los
almidones modificados; esta percepción y la tendencia del mercado hacia
los alimentos naturales y de etiqueta limpia hace prometedor el uso de los
almidones nativos. No obstante, los almidones nativos tienen limitaciones en
algunas aplicaciones en la industria alimentaria, debido a su inestabilidad a
altas temperaturas, a altas fuerzas de cizallamiento, a bajos pH y a su
tendencia a retrogradar a bajas temperaturas, causando un descenso en la
calidad de los productos finales.
El objetivo principal de esta Tesis es la evaluación del desempeño del
almidón de tapioca nativo en rellenos de fruta y propuesta de un sistema
mixto con pectina que admita las condiciones de pH, temperatura y proceso.
Se han desarrollado sistemas basados en almidón nativo de tapioca para
esta aplicación con el fin de revalorizarlo en la industria de alimentos.
Primero se evaluó la adición de un hidrocoloide como modelo principal
(sistema mixto) basado en almidón nativo de tapioca con adición de pectina
de bajo metoxilo; se comparó con un control, elaborado con un almidón
modificado que se utiliza normalmente en rellenos de fruta industriales. Se
estudiaron las propiedades de formación de pasta de los almidones y las
propiedades viscoelásticas, los parámetros de textura instrumental
(extrusión) y sinéresis de los diferentes sistemas modelo. En el diseño y
formulación también se consideraron diversos factores inherentes a las
condiciones experimentales de proceso de los rellenos de fruta donde se
usa el sistema espesante; como la adición de fruta y la estabilidad frente a
los tratamientos térmicos como el horneado y a la congelación. Se evaluó el
efecto de la cocción sobre la textura en dos aplicaciones de panadería
(sistemas abiertos y cerrados). La adición de pectina aumentó
significativamente la firmeza y la consistencia de los geles analizados y los
rellenos con y sin fruta preparados con el sistema propuesto, fueron más
resistentes a los tratamientos térmicos que los preparados con almidón de
tapioca solo, mostrando propiedades reológicas y texturales estables
durante los diferentes procesos y similares a las del almidón de maíz
modificado, usado como control.
Teniendo en cuenta que en la actualidad, el mercado de los alimentos se
encuentra cada vez más segmentado y los consumidores buscan productos
no solo de buena calidad sino que sean más saludables, satisfagan
necesidades y gustos personales, se evaluaron rellenos de fruta reducidos
en azúcar, se aplicaron técnicas instrumentales (reológicas y de textura) y
técnicas sensoriales (estudios de análisis sensorial descriptivo (QDA)
clásico con panel entrenado y estudios con consumidores no entrenados
para evaluar su aceptabilidad); y mediante escalas JAR se evaluó el gusto y
la adecuación de algunos atributos sensoriales. Los resultados
instrumentales y sensoriales estuvieron altamente correlacionados entre sí y
se encontró segmentación en la percepción y gusto de los consumidores
por los rellenos de fruta en tres grupos. Un grupo al que no le gustan los
edulcorantes intensos en absoluto, otro grupo, que notablemente, prefiere
las características de las muestras que contienen almidón de tapioca y un
tercero intermedio en sus tendencias. Estos resultados sugieren que las
formulaciones pueden ser adaptadas a cada escenario. Por último,
sabiendo que una serie de características texturales se evalúan durante el
consumo y la masticación del producto, que a su vez modulan la percepción
del sabor, se aplicaron dos técnicas sensoriales relativamente nuevas:
Dominio temporal de las sensaciones (TDS) evaluando textura y sabor por

separado y análisis CATA (Check-all-that-apply) incluyendo la evaluación de
un "relleno de fruta ideal".
Por último, los resultados se relacionaron con la aceptabilidad. Estas
técnicas sensoriales permiten que sea el consumidor quien dirija y sugiera
qué aspectos de la formulación pueden ser rediseñados.

Resum
La identificació de nous nínxols de mercat per a productes processats que
continguen midó de tapioca (yuca) es fa indispensable per afavorir el
desenvolupament d'aquesta agroindústria a Colòmbia i en altres països
productors. Els consumidors perceben els midons nadius com "naturals" o
"de menor risc" que altres ingredients / additius, com els midons modificats;
aquesta percepció i la tendència del mercat cap als aliments naturals i
d'etiqueta neta fa prometedor l'ús dels midons nadius. No obstant això, els
midons nadius tenen limitacions en algunes aplicacions en la indústria
alimentària, per la seua inestabilitat a altes temperatures, a altes forces de
cisallament, a baixos pH i a la seua tendència a retrogradar a baixes
temperatures, causant un descens en la qualitat dels productes finals.
L'objectiu principal d'aquesta Tesi és l'avaluació de l'acompliment del midó
de tapioca natiu en farcits de fruita i proposta d'un sistema mixt amb pectina
que admiteixca les condicions de pH, temperatura i procés. S'han
desenvolupat sistemes basats en midó natiu de tapioca per a aquesta
aplicació per tal de revaloritzar en la indústria d'aliments.
Primer es va avaluar l'addició d'un hidrocol·loide com a model principal
(sistema mixt) basat en midó natiu de tapioca amb addició de pectina de
baix metoxil; es va comparar amb un control, elaborat amb un midó
modificat que s'utilitza normalment en farcits de fruita industrials. Es van
estudiar les propietats de formació de pasta dels midons i les propietats
viscoelàstiques, els paràmetres de textura instrumental (extrusió) i sinèresi
dels diferents sistemes model. En el disseny i formulació també es van
considerar diversos factors inherents a les condicions experimentals de
procés dels farcits de fruita on s'usa el sistema espessidor; com l'addició de
fruita i l'estabilitat enfront dels tractaments tèrmics com l'enfornat i a la
congelació. Es va avaluar l'efecte de la cocció sobre la textura en dues
aplicacions de forn (sistemes oberts i tancats). L'addició de pectina va
augmentar significativament la fermesa i la consistència dels gels analitzats i
els farcits amb i sense fruita preparats amb el sistema proposat, van ser
més resistents als tractaments tèrmics que els preparats amb midó de
tapioca sol, mostrant propietats reològiques i texturals estables durant els
diferents processos i similars a les del midó de blat de moro modificat, usat
com a control.
Tenint en compte que en l'actualitat, el mercat dels aliments es troba cada
vegada més segmentat i els consumidors busquen productes no només de
bona qualitat sinó que siguen més saludables, satisfacin necessitats i gustos
personals, es van avaluar farcits de fruita reduïts en sucre, es van aplicar
tècniques instrumentals (reològiques i de textura) i tècniques sensorials
(estudis d'anàlisi sensorial descriptiu (QDA) clàssic amb panell entrenat i
estudis amb consumidors no entrenats per avaluar la seua acceptabilitat); i
mitjançant escales JAR es va avaluar el gust i l'adequació d'alguns atributs
sensorials.
Els resultats instrumentals i sensorials van estar altament correlacionats
entre si i es va trobar segmentació en la percepció i gust dels consumidors
pels farcits de fruita en tres grups. Un grup al qual no li agraden els
edulcorants intensos en absolut, un altre grup, que notablement, prefereix
les característiques de les mostres que contenen midó de tapioca i un tercer
intermedi en les seves tendències. Aquests resultats suggereixen que les
formulacions poden ser adaptades a cada escenari. Finalment, sabent que
una sèrie de característiques texturals s'avaluen durant el consum i la
masticació del producte, que al seu torn modulen la percepció del gust, es
van aplicar dues tècniques sensorials relativament noves: Domini temporal
de les sensacions (TDS) avaluant textura i gust per separat i anàlisi CATA
(Check-all-that-apply) incloent l'avaluació d'un "farcit de fruita ideal".

Finalment, els resultats es van relacionar amb l'acceptabilitat. Aquestes
tècniques sensorials permeten que siga el consumidor qui dirigeixi i
suggereixi quins aspectes de la formulació poden ser redissenyats.

Summary
Identifying niche markets for products that use native tapioca starch is
essential to promote the development of this agro-industry in Colombia and
in other producing countries. Native starches are perceived by consumers as
“natural” or “less risky” than other ingredients/ additives; this perception and
the market trend towards natural foods and clean labels make the use of
native starches look promising. However, native starches have limitations in
some applications in the food industry because of their instability at high
temperatures, high shear forces, low pH values and its tendency to
retrogradation at low temperatures, leading to lower end-product quality.
The main objective of this thesis is to evaluate the performance of native
tapioca starch in fruit fillings and to develop a starch plus low-methoxyl
pectin mixed system able to support pH, nigh temperature and process
conditions, adding value to the starch alone because of its improved
properties.
First, the addition of pectin to the starch, as the main mixed system, was
developed. It was compared to a control of modified starch commonly used
in industrially prepared fruit fillings. Starch pasting and viscoelastic
properties, instrumental texture parameters (extrusion) and syneresis of the
different systems were studied. A number of factors inherent to the
conditions of the preparation processes of fruit fillings, such as addition of
fruit and stability at different temperature conditions (baking and freezing),
were also studied. The effect of cooking in two bakery applications (open
and closed systems) was evaluated. The addition of pectin caused a
significant increase in the firmness and consistency of the gels analyzed and
the fillings without fruit prepared with the proposed system were more
resistant to heat treatment than those prepared with tapioca starch alone,
showing stable rheological and textural properties during the different
processes and similar to those of the modified corn starch, used as control.
Given that at present, the food market is increasingly segmented and
consumers seek products not only of good quality but also healthier,
satisfying needs, and personal tastes, reduced-sugar fruit fillings were also
formulated. Instrumental (rheological and texture) and sensory techniques
(quantitative descriptive analysis, QDA) and untrained consumer hedonic
studies were performed. Liking and adequacy of some sensory attributes
were also evaluated using just-about-right (JAR) scales.
The instrumental and sensory results were highly correlated, and a
segmentation into three consumer groups was found in fruit fillings’
perception and consumer liking. One group did not like intense sweeteners
at all. Another, remarkably, preferred the characteristics of the tapioca starch
samples. The third group (the most numerous) did not show these marked
tendencies, suggesting that formulations should be adapted to each
scenario.
Finally, knowing that a number of textural features are assessed during the
consumption of the fillings, which in turn can modulate their flavour
perception, two relatively new sensory techniques were applied: Temporal
Dominance of Sensations (TDS) with trained assessors (with texture and
flavour modalities separately performed) and a check-all-that-apply (CATA)
questionnaire with consumers, including the evaluation of an “ideal fruit
filling”. The results were then correlated with consumers’ liking. These
sensory techniques allowed the consumer to drive and suggest what
aspects of the formulation should be redesigned.

ÍNDICE

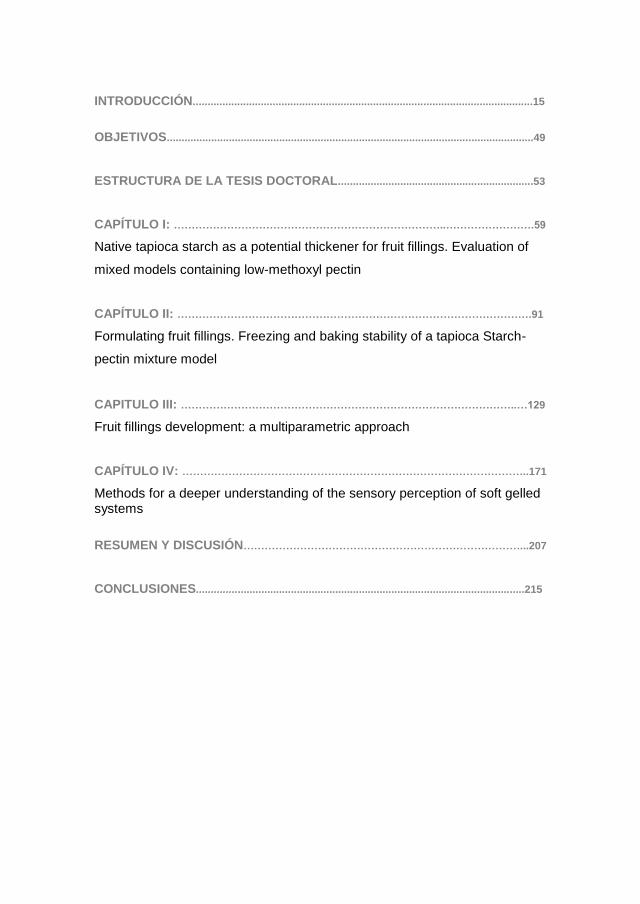
INTRODUCCIÓN...................................................................................................................15
OBJETIVOS............................................................................................................................49
ESTRUCTURA DE LA TESIS DOCTORAL..................................................................53
CAPÍTULO I: …………………………………………………………………..…………………….59
Native tapioca starch as a potential thickener for fruit fillings. Evaluation of
mixed models containing low-methoxyl pectin
CAPÍTULO II: ……………………………………………………………………………………….91
Formulating fruit fillings. Freezing and baking stability of a tapioca Starch-
pectin mixture model
CAPITULO III: …………………………………………………………………………………..…129
Fruit fillings development: a multiparametric approach
CAPÍTULO IV: ……………………………………………………………………………………..171
Methods for a deeper understanding of the sensory perception of soft gelled systems
RESUMEN Y DISCUSIÓN……………………………………………………………………...207
CONCLUSIONES...............................................................................................................215


INTRODUCCIÓN

17
INTRODUCCIÓN
1. Almidón nativo de tapioca
Se obtiene de las raíces de la planta cassava (Manihot esculenta) que se
encuentra en las regiones ecuatoriales. Recibe diferentes nombres
dependiendo de la región, en Centro América y norte de Sur América se la
denomina yuca, en Brasil mandioca o manioca, en India y Malasia tapioca,
en África y suroeste de Asia, cassava. En Norte América y Europa el
nombre cassava se aplica a las raíces de la planta y tapioca al almidón y
otros productos procesados (Aristizabal 2007; Breuninger et al 2009). El alto
contenido de almidón del tubérculo y su proporción de amilosa, en
comparación con otras fuentes de almidón, hace de éste un importante
cultivo industrial, además de ser una fuente de alimentación rica en calorías.
El almidón de tapioca es la segunda fuente de almidón más importante en el
mundo después del maíz.
El almidón se encuentra en las plantas en forma de gránulos y presenta
diferentes características, dependiendo de la especie vegetal de la que
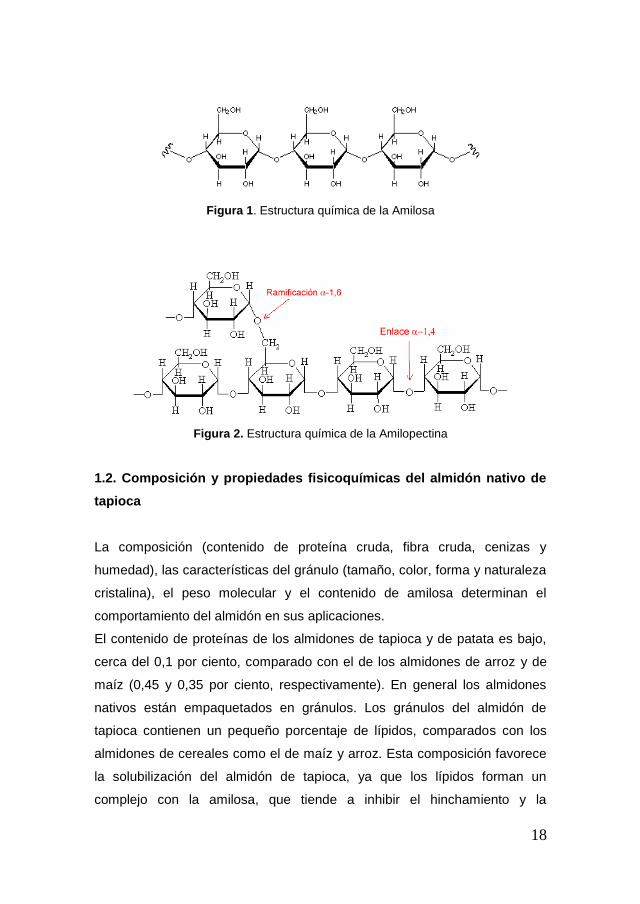
proceda. Químicamente es un polisacárido de glucosa anhidra constituido
por dos componentes: amilosa y amilopectina; en las figuras 1 y 2 se
pueden observar las estructuras químicas de estos dos componentes. La
proporción amilosa - amilopectina, también depende de la fuente vegetal.
Los almidones contienen entre un 17-28 por ciento de amilosa; el maíz y el
trigo están en el extremo alto del intervalo, mientras la patata y la tapioca
están en el extremo más bajo. El almidón de tapioca tiene entre 17-22 por
ciento de amilosa. La estructura y la cantidad relativa de ambos
componentes del almidón desempeñan un papel importante en la
determinación de sus propiedades fisicoquímicas.
18
Figura 1. Estructura química de la Amilosa
Figura 2. Estructura química de la Amilopectina
1.2. Composición y propiedades fisicoquímicas del almidón nativo de
tapioca
La composición (contenido de proteína cruda, fibra cruda, cenizas y
humedad), las características del gránulo (tamaño, color, forma y naturaleza
cristalina), el peso molecular y el contenido de amilosa determinan el
comportamiento del almidón en sus aplicaciones.
El contenido de proteínas de los almidones de tapioca y de patata es bajo,
cerca del 0,1 por ciento, comparado con el de los almidones de arroz y de
maíz (0,45 y 0,35 por ciento, respectivamente). En general los almidones
nativos están empaquetados en gránulos. Los gránulos del almidón de
tapioca contienen un pequeño porcentaje de lípidos, comparados con los
almidones de cereales como el de maíz y arroz. Esta composición favorece
la solubilización del almidón de tapioca, ya que los lípidos forman un
complejo con la amilosa, que tiende a inhibir el hinchamiento y la

19
solubilización de los gránulos del almidón. Los gránulos del almidón de
tapioca no son uniformes en tamaño y forma: son redondos con
terminaciones truncadas, y con un núcleo bien definido; su tamaño varía
entre 4-35 mm, con un promedio de 20 mm. Las características de
hinchamiento del granulo, gelatinización y formación de pasta, son
funciones importantes del almidón cuando se utilizan como ingrediente en
sistemas alimenticios para controlar o modificar sus propiedades reológicas
(Pongsawatmanit et al 2007). La gelatinización es el mejor proceso para
definir las características de un almidón; este proceso induce cambios en
los gránulos como el hinchamiento, lixiviación de amilosa y amilopectina,
rompimiento de los gránulos, pérdida de birrefringencia; e incremento en la
viscosidad (Babic et al. 2006). Diferentes almidones muestran diferentes
características de hinchamiento, en términos de volumen final del gel
obtenido y en términos de temperatura de respuesta. Los almidones de
tubérculos (patata y tapioca) presentan grandes volúmenes de gel,
comparados con los que presentan los almidones de cereales. También
muestran un fuerte aumento en la viscosidad durante la cocción y tienen
picos de viscosidad más altos que los almidones de cereales (Biliaderis,
2009). Por su bajo contenido en amilosa, el almidón de tapioca presenta
poca tendencia a la retrogradación, lo cual le confiere potencial para mejorar
los ciclos de estabilidad al congelamiento y descongelamiento y la textura
en algunos alimentos (Hoover, 2001). El almidón de tapioca gelatiniza a
temperaturas relativamente bajas (62-73 ºC); el pico máximo se alcanza
rápidamente, lo que implica que es un almidón fácil de cocinar y requiere
menor consumo de energía. Sin embargo, aunque la viscosidad de la pasta
es inicialmente alta, ésta decae bruscamente cuando continúa la agitación
por encima de 90ºC y después de un enfriamiento posterior no hay
formación de gel. Las propiedades de claridad y baja retrogradación del
almidón de tapioca son útiles en muchos productos alimenticios. Las pastas
de almidón de tapioca no son estables en medios muy ácidos, a pH por
20
debajo de 2,4, hay destrucción del gránulo e hidrólisis parcial o total del
almidón.
El almidón nativo se utiliza en numerosas aplicaciones industriales; en
alimentos se usa para espesar, gelificar, estabilizar, proveer control de
humedad y movilidad de agua, mejorar textura y reducir costos (Shi y
BeMiller, 2002).
1.3. Aplicaciones del almidón de tapioca en la industria de alimentos
En la industria de alimentos el almidón, tanto nativo como modificado, tiene
un papel importante en la textura de varios preparados al aportar
palatabilidad y aceptabilidad como:
Protege contra la humedad; en diversos productos en polvo –como
azúcares– pues los almidones absorben humedad sin apelmazarse.
Imparte textura y estabilidad a caramelos como agente para
espolvorear, combinado con azúcar pulverizada en gominolas,
caramelos y gomas de mascar.
Espesa y da cuerpo y textura al alimento preparado; para sopas,
alimentos infantiles, salsas, “gelatinas” no animales.
Confiere textura, sabor y apariencia. La cocción del almidón produce
una solución coloidal estable, compatible con muchos ingredientes
en productos alimenticios.
Aglutina y liga componentes. En la preparación de salchichas y
embutidos cocidos.
Emulsifica y produce emulsiones estables en la preparación de
mayonesas y salsas similares.
Estabiliza debido su elevada capacidad de retención de agua se usa
en productos mantecados y helados. En la mezcla con harinas para
bajar el contenido de proteínas y la fuerza del gluten en panadería.
21
En la fabricación de galletas aumenta su capacidad de extenderse y
carácter crujiente, además de ablandar, mejorar el sabor y evitar
que adherencia.
Como ingrediente en la preparación de snacks extruidos y
expandidos.
En los últimos años hay una tendencia hacia la utilización de almidón de
tapioca modificado e hidrolizado en preferencia a la utilización de almidón
nativo, para obtener productos de mayor valor agregado; por ejemplo por
hidrólisis, se obtienen almidones de baja solubilidad en agua fría y alta
solubilidad en agua caliente, logrando geles de baja viscosidad utilizados en
la industria alimentaria como espesantes, o para dotar a los alimentos de
una película protectora o como estabilizantes en la preparación de jaleas,
también para obtener dextrosa y jarabes de glucosa muy empleados en la
industria de bebidas. Las tecnologías de modificación surgen como una
alternativa rentable para el desarrollo del cultivo de cassava (Aristizabal,
2007). La identificación de nuevos nichos de mercado para productos
procesados se hace indispensable para favorecer el desarrollo de la
agroindustria de la yuca en Colombia (FAO, 2006). Por otro lado, el
incremento del precio del maíz por su uso como sustrato en biocombustible,
también hace que se favorezca la oportunidad de reemplazar el maíz y sus
derivados por productos de “tapioca” (Jaramillo et al., 2011).
Los consumidores perciben los almidones nativos como “naturales” o “de
menor riesgo” que otros ingredientes/ aditivos, como son los almidones
modificados (Varela y Fiszman, 2013). Esta percepción y la tendencia del
mercado hacia los alimentos naturales y de etiqueta limpia hace prometedor
el uso de los almidones nativos (Arocas et al., 2010). No obstante, los
almidones nativos tienen limitaciones en las algunas aplicaciones en la
industria alimentaria, debido a su inestabilidad a altas temperaturas, a altas
fuerzas de cizallamiento, a bajos valores de pH y a su tendencia a
retrogradar a bajas temperaturas, causando un descenso en la calidad de
22
los productos finales (Miyazaki et al., 2006). En muchas de estas
aplicaciones el almidón interactúa con otros componentes de las
formulaciones como azúcares, sales, otros hidrocoloides, etc. que afectan el
proceso su gelatinización y el comportamiento durante la formación de
pasta, entre otras propiedades (Pongsawatmanit et al 2007).
Por esta razón en el presente trabajo se seleccionó una aplicación
alimentaria (relleno de fruta) que supone un reto para el almidón nativo de
tapioca por las condiciones adversas de uso, buscando reformulaciones que
permitan mejorar su comportamiento, y su tecnofuncionalidad, revalorizando
el uso del almidón nativo de tapioca en la industria de alimentos.
2. Rellenos de fruta
Los rellenos de fruta son alimentos semisólidos similares a una mermelada;
pueden contener menor cantidad de fruta, menor cantidad de sólidos y en
su formulación pueden llevar almidones y otros hidrocoloides para mejorar
su estabilidad a las temperaturas de horneado a las que se someten en sus
aplicaciones finales. En su formulación contienen fruta, agua, azúcar o
edulcorantes, acidulantes y espesantes. Los espesantes más usados son
pectinas, almidones modificados y mezclas de hidrocoloides. La principal
aplicación de los rellenos es en muy diversos productos de panadería y sus
factores de calidad son la estabilidad, buen aspecto, y sabor agradable
(Ulinsky, 1989). Por eso es importante conocer el comportamiento de los
sistemas que forman y sus interacciones con el resto de los componentes
para obtener una formulación adaptada a las aplicaciones finales.
2.1. Agentes de textura o espesante en rellenos de fruta
Un requisito importante a la hora de valorar la idoneidad de un espesante
para su aplicación en rellenos de fruta es su estabilidad a pH ácido. La
23
estabilidad de los almidones a diferentes valores bajos de pH es a menudo
un punto crítico porque pueden sufrir hidrólisis con cierta facilidad. Los
rellenos de fruta presentan valores de pH entre 3 y 4; (Wei et al 2001)
estudiaron las propiedades de varios rellenos de fruta comerciales y
encontraron intervalos de valores de pH entre 2,6 y 3,5. Los almidones que
tradicionalmente se utilizan en aplicaciones a pH ácido son los modificados
por entrecruzamiento. En general, a mayor grado de modificación por
entrecruzamiento mayor resistencia al pH ácido.
Otro reto importante para el espesante es la estabilidad a altas
temperaturas. Cuando se formulan rellenos de frutas deben considerarse
dos etapas de calentamiento: el calentamiento durante la preparación del
propio relleno (un paso intermedio en la industria) y el calentamiento en el
horno durante la cocción de los pasteles. La temperatura afecta la calidad
de los rellenos de fruta basados en almidón nativo, debido a su degradación
a altas temperaturas que se ve favorecido por los valores bajos de pH. La
viscosidad de la pasta de almidón de tapioca nativo también puede
disminuir después de varios ciclos de calentamiento; este hecho afectará a
su aplicación en rellenos de frutas, ya que conduce a la inestabilidad de la
textura durante el almacenamiento (Temsiripong, Pongsawatmanit, Ikedab y
Nishinari, 2005; Biliaderis, 2009).
Debido a esta inestabilidad los almidones modificados son los más
indicados para esta aplicación. Por esta razón, en el presente trabajo, se
seleccionó como control un relleno de fruta elaborado con almidón
modificado altamente entrecruzado, hidroxipropilado y fosfatado de maíz
waxy (MWCS) que se utiliza normalmente en rellenos de fruta elaborados
industrialmente por su estabilidad mejorada. Las modificaciones químicas
se realizan sometiendo los almidones nativos a una serie de reacciones
asociadas con los grupos hidroxilos de sus polímeros; las más empleadas
son el entrecruzamiento, la sustitución y la conversión (Mitolo, 2006). El
almidón waxy, seleccionado como control, presenta doble modificación: la
primera, por entrecruzamiento en la cual se introducen enlaces covalentes
24
inter e intramoleculares en el polímero de almidón reforzando la estructura
granular del mismo; esto permite un mejor control del hinchamiento granular
y provee estabilidad ante el medio ácido y ante la degradación térmica y
mecánica. La segunda modificación es por sustitución (eterificación), que
consiste en la sustitución de los grupos hidroxilos del almidón por grupos
monofuncionales como el acetilo o grupos hidroxipropilos. Esta modificación
minimiza o previene la retrogradación por impedimento del acercamiento de
las moléculas del polímero (Singh et al., 2007).
2.2. La fruta y sus interacciones con los demás componentes
La fruta, es el principal componente de los rellenos. Algunos resultados
previos indican que la adición de pulpa de fruta en sistemas que contienen
almidones o hidrocoloides, modifica las propiedades reológicas y provoca
cambios de textura de los productos finales; los efectos son dependientes
de numerosos factores: pH, cantidad de fruta adicionada, tipo de fruta,
tamaño de partícula del puré, cantidad de sólidos (azúcares), tipo y
concentración de hidrocoloides, y las interacciones entre todos estos
factores. En general, existe poca información sobre el efecto de la adición
de fruta a sistemas basados en almidón / hidrocoloides (Carbonell, Costell y
Duran, 1991a; Carbonell, Costell y Duran, 1991b; Fiszman y Duran, 1992;
Wei et al., 2001; Basu y Shivhare, 2010, Baiano, Mastromatteo y Del Nobile,
2012). En particular, en los sistemas que contienen pectina el calcio
disponible en la fruta también es un factor importante (Young, Kappel y
Bladt, 2003).
2.3. Efecto de la cocción en los rellenos de fruta
Los rellenos de fruta sufren diversos procesos de calentamiento durante su
preparación y también en su aplicación final durante el horneado, en su
25
aplicación final como pasteles rellenos, tartaletas, empanadillas, tartas, etc.
Los rellenos deben demostrar principalmente estabilidad frente a estos
procesos de calentamiento; no deben adquirir una consistencia muy fluida.
Cuando existe gran fluidificación el relleno puede derramarse o salirse del
pastel y se requemarán en el horno, creando una apariencia que no será
aceptable, además de crear humos y suciedad.
El calentamiento afecta la calidad de los rellenos de fruta basados en
almidón nativo, debido a la degradación del almidón por calentamiento a
valores bajos de pH. La viscosidad de la pasta de almidón de tapioca nativo
disminuye después de un ciclo de calentamiento; conduciendo a la
inestabilidad de la textura hacia el final de la cocción o durante el
almacenamiento (Biliaderis, 2009; Temsiripong, Pongsawatmanit, Ikeda, y
Nishinari, 2005). Por esta razón es importante evaluar el comportamiento
durante el calentamiento de los diferentes sistemas espesantes usados en
los rellenos de fruta.
Por medio de estudios termoreológicos, se pueden determinar los efectos
de aumento de temperatura. En el presente estudio, se valoró el efecto de la
cocción sobre los rellenos (geles) aplicando barridos de temperatura en
ensayos de reología dinámica (descrita en la sesión 4.1.1) y también se
desarrolló un método para valorar el comportamiento en aplicaciones reales
de los rellenos de fruta. Se estudiaron las características de textura de
diferentes alimentos horneados que incluyen el relleno de fruta con el fin de
evaluar el comportamiento y la estabilidad durante el horneado.
2.4. Rellenos de fruta reducidos en azúcar
El azúcar en rellenos de fruta contribuye a los sólidos solubles totales, un
efecto que es esencial para su estabilidad física, química y microbiológica,
así como para sus características sensoriales. Proporciona: dulzor, cuerpo y
sensación en boca (mouthfeel); mejora el aspecto (color y brillo); y hace
26
posible la gelificación de la pectina (Hyvonen y Torma, 1983; Basu,
Shivhare y Singh, 2013). Los azúcares y los polialcoholes en general
impiden el hinchamiento del granulo y en consecuencia aumentan la
temperatura de gelatinización de los almidones (Sharma 2009; Biliaderis
2009). Pongsawatmanit et al (2007) encontraron que la adición de azúcar
retarda el proceso de gelatinización de mezclas de almidón de tapioca y
goma xantana resultando en altas temperaturas y entalpias de
gelatinización; el pico de viscosidad final del almidón de tapioca se
incrementa al incrementar la cantidad de goma xantana y azúcar. La adición
de azúcar resulta en un incremento de la retrogradación y mejora el
comportamiento viscoelástico de los geles preparados con estas mezclas.
Hoy en día, debido al crecimiento del sector de “alimentos saludables”, la
reducción del contenido de azúcar en los productos alimenticios mediante
su sustitución total o parcial por edulcorantes alternativos se ha convertido
en una opción viable para la producción de alimentos bajos en calorías. La
sustitución del azúcar por otros edulcorantes es un desafío para los
investigadores y para la industria, ya que por su adición suelen modificarse
otros atributos sensoriales además del sabor dulce (Cadena, Cruz, Neto,
Castro, Faria, y Bolini, 2013).
Cada vez con más frecuencia se utilizan edulcorantes de alta intensidad ya
sea por su menor contenido en energía o debido a la relación entre el
consumo de azúcar y la diabetes u otras enfermedades (Cadena y Bolini,
2011). La industria utiliza frecuentemente mezclas de edulcorantes para
superar las limitaciones sensoriales de los edulcorantes individuales (Zhao y
Tepper, 2007). Con las mezclas se aprovecha las sinergias que puedan
presentarse; éstas se observan típicamente en edulcorantes que muestran
diferentes perfiles de sabor, especialmente si uno de los edulcorantes es
amargo. La mezcla tiende a crear un perfil de sabor mejorado.
El esteviósido (stevia) y la sucralosa son dos edulcorantes de alta
intensidad no nutritivos, estables al calor y a los ácidos, y se pueden utilizar
en combinación para la elaboración de productos como las mermeladas sin
27
comprometer el sabor (Basu et al., 2013). En varios estudios se ha
encontrado que la stevia aporta sabor amargo residual, común a muchas
especies de stevia (Melo, Bolini, y Efraim, 2009; Prakash, DuBois, Clos,
Wilkens, y Fosdick, 2008). Se sugirió que para reducirlo, es importante
obtener la stevia con más rebaudiósido (Cadena, Cruz, Neto, Castro, Faria,
y Bolini, 2013)). También se ha sugerido que la sucralosa tiene un sabor
dulce relativamente limpio y persistente con poca persistencia de amargo
(Nabors, 2002; Zhao, y Tepper, 2007).
Sin embargo, los edulcorantes de alta potencia no contribuyen a la textura
del producto (se adicionan en muy pequeña cantidad); para mantener las
características estructurales que aporta el azúcar se deben usar otras
sustancias como sustitutos de la sacarosa en términos de agente de carga,
tales como polidextrosa, que presenta propiedades tecnológicas similares a
la sacarosa, excepto en el dulzor. La polidextrosa carece de sabor dulce, y
ofrece 1 kcal / g en comparación con la sacarosa que tiene 4 kcal / g
(Schirmer, Jekle, Arendt y Becker, 2012). La polidextrosa se ha incorporado
con éxito en una amplia gama de alimentos, incluidos los productos de
panadería, bebidas, confitería y postres congelados y se sabe que
proporcionan las cualidades de cuerpo, textura y sensación en boca
apropiados (Aidoo, Afoakwa, y Dewettinck, 2014); no aporta retrogusto, ni
color y la interacción con el almidón y la proteína se dan de forma similar a
la de la sacarosa (Pereira, Ríos de Souza, Teixeira, Queiroz, Borges y
Souza, 2013).
3. Uso de hidrocoloides en mezcla con almidones
Los almidones se utilizan en mezclas con diferentes aditivos o ingredientes
para mejoren su tecnofuncionalidad (Ortega et al 2001; Babic et al., 2006).
Una alternativa para mejorar sus propiedades tecnofuncionales,
28
especialmente la mejora en la textura, es la adición de hidrocoloides, que
pueden interactuar con los almidones a través de interacciones moleculares
(Ojijo y Shimoni, 2007; Babic et al., 2006).
Los hidrocoloides se pueden definir como polímeros solubles en agua que
poseen la habilidad de conferir viscosidad o gelificar sistemas acuosos.
Según esta definición los propios almidones son hidrocoloides, sin embargo,
suele reservarse esta denominación a los que producen viscosidad a muy
bajas concentraciones.
El uso de hidrocoloides como espesantes ha sido estudiado ampliamente,
por su diversidad y su funcionalidad. Existe una gran cantidad de
información acerca de cómo afectan ciertos hidrocoloides a las propiedades
del almidón; sin embargo aún hay aspectos desconocidos en los sistemas
almidón – hidrocoloides por la complejidad de sus efectos. Respecto a las
propiedades reológicas del almidón de tapioca, es bien conocido que
determinados hidrocoloides las afectan en diferentes formas (Breuninger, et
al., 2009); principalmente debido a la interacción de las estructuras
moleculares de los hidrocoloides y/o a las cargas iónicas del almidón y de
ciertos hidrocoloides (Shi y Bemiller, 2002; Bemiller, 2011).
Diversos estudios han mostrado que algunas mezclas de hidrocoloides con
almidones conducen a la mejora de ciertas propiedades tecnofuncionales
deseables debido al desarrollo de interacciones macromoleculares (Ojijo y
Shimoni 2007). (Lim et al 2002) sugirieron que ciertas gomas iónicas
pueden actuar como agentes de entrecruzamiento, como también formar
copolímeros a través de la formación de ésteres por inducción con calor.
Arocha (2011) observó que una pectina de bajo metoxilo inducía un
decrecimiento significativo en el pico de viscosidad, estabilidad
(breakdown), viscosidad final y retrogradación del almidón de patata.
Chaisawang et al (2006) investigaron el efecto de goma guar (no iónica) y
goma xantana (cargada negativamente) sobre el comportamiento reológico
y propiedades de almidón nativo de tapioca (no iónico) y sobre almidón
29
aniónico de tapioca (cargado negativamente); encontraron que hubo tres
factores que influenciaron las características de gelatinización; el primero, la
estructura morfológica de la goma extendida en la matriz (fase continua) en
la cual se encuentran embebidos los gránulos de almidón. La segunda, por
el propio poder de hinchamiento de los gránulos de almidón. Y tercera, la
interacción electrostática entre los gránulos de almidón y las moléculas de
goma.
Khondkar et al (2007) estudiaron el efecto de la pectina sobre las
propiedades del almidón de maíz waxy entrecruzado y no entrecruzado;
encontraron un aumento en módulo de almacenamiento (G’) y el módulo de
perdida (G”) con la adición de pectina. Además G” fue mayor que G”
indicando que estos geles tenían un comportamiento predominantemente
elástico con buena estructuración. Con estos datos sugirieron que podía
tener lugar un cierto nivel de entrecruzamiento almidón- pectina en los
sistemas mixtos.
3.1. Pectinas
Son hidrocoloides que en solución acuosa presentan propiedades
espesantes, estabilizantes y sobre todo gelificantes en determinadas
condiciones. Están presentes en mayor o menor grado en todas las frutas y
plantas superiores, son solubles en agua caliente, insolubles en alcoholes y
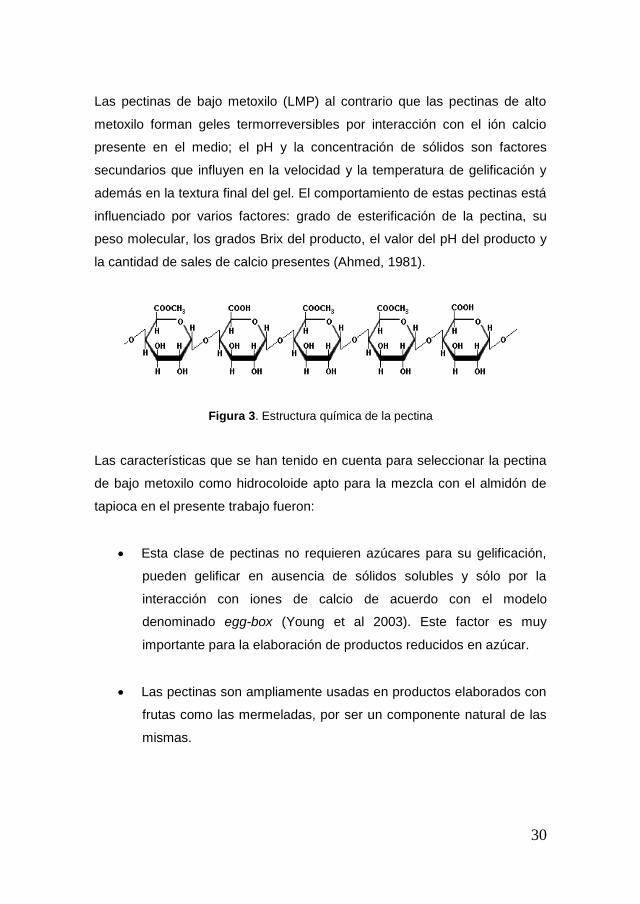
parcialmente solubles en jarabes ricos en azúcares. Son polímeros del
ácido galacturónico, con un contenido medio de éster metílico (figura 3). La
principal característica es su capacidad de formar geles en presencia de
sólidos solubles suficientes y ácidos o iones polivalentes. Se clasifican de
acuerdo con su grado de esterificación en pectinas de alto metoxilo (grado
de esterificación superior al 50%) y pectinas de bajo metoxilo (grado de
esterificación inferior al 50%). En el presente trabajo se utilizó una pectina
de bajo metoxilo, por lo que sus propiedades se discuten en más detalle.
30
Las pectinas de bajo metoxilo (LMP) al contrario que las pectinas de alto
metoxilo forman geles termorreversibles por interacción con el ión calcio
presente en el medio; el pH y la concentración de sólidos son factores
secundarios que influyen en la velocidad y la temperatura de gelificación y
además en la textura final del gel. El comportamiento de estas pectinas está
influenciado por varios factores: grado de esterificación de la pectina, su
peso molecular, los grados Brix del producto, el valor del pH del producto y
la cantidad de sales de calcio presentes (Ahmed, 1981).
Figura 3. Estructura química de la pectina
Las características que se han tenido en cuenta para seleccionar la pectina
de bajo metoxilo como hidrocoloide apto para la mezcla con el almidón de
tapioca en el presente trabajo fueron:
Esta clase de pectinas no requieren azúcares para su gelificación,
pueden gelificar en ausencia de sólidos solubles y sólo por la
interacción con iones de calcio de acuerdo con el modelo
denominado egg-box (Young et al 2003). Este factor es muy
importante para la elaboración de productos reducidos en azúcar.
Las pectinas son ampliamente usadas en productos elaborados con
frutas como las mermeladas, por ser un componente natural de las
mismas.
31
Al igual que los almidones nativos, los consumidores perciben las
pectinas como un componente de bajo riesgo para la salud por
provenir de una fuente natural y familiar para ellos, como lo son las
frutas (Varela y Fiszman, 2013). Este factor es importante para el
uso en productos de etiqueta limpia.
Son estables a valores de pH entre 3 y 4, intervalo en el cual se
encuentran los rellenos de frutas.
32
4. Control y desarrollo de los rellenos de fruta
El desarrollo y formulación de productos, al igual que en otras industrias, es
una actividad sumamente importante para la industria de mermeladas y
rellenos de frutas. La calidad del producto final es el principal determinante
de la elección del consumidor. Evidentemente, son los ingredientes los que
determinan dicha calidad tanto en términos subjetivos (calidad sensorial)
como objetivos (composición, valor nutricional, etc.) (Basu y Shivhare,
2010).
La comprensión de las interacciones de los componentes del sistema o
matriz que contiene el almidón será de máxima importancia para el control
del proceso y para mejorar la textura y otros atributos de calidad de los
productos finales (Biliaderis 2009). En los rellenos de fruta como se ha visto
se añaden ingredientes (almidones, hidrocoloides, azúcares, ácidos y fruta
entre otros) que pueden desarrollar interacciones, y que sumados a ciertos
factores de proceso pueden alterar la calidad final del producto. Es
necesario, por tanto, un conocimiento claro de las propiedades reológicas,
texturales y sensoriales, con el objetivo de desarrollar nuevos productos y
equipos y mejorar los procesos así como ayudar en el control de calidad
(Steffe, 1996).
4.1. Textura de los rellenos de fruta
La textura de los alimentos es una percepción sensorial derivada de su
estructura (a niveles moleculares, microestructurales y macroscópicos). La
apreciación de la textura, atributo multiparamétrico, puede incluir uno o
varios estímulos, como el visual, auditivo, táctil y cinestésico, trabajando en
combinación (Chen, 2009). La percepción y la apreciación de la textura es
un proceso dinámico, basado en las sensaciones generadas durante la
deformación y ruptura oral del material alimenticio. Relacionar la textura
sensorial de un alimento con sus propiedades microestructurales, reológicas
33
y a grandes deformaciones no es una tarea fácil (Foegeding, 2007). La
reología clásica y los ensayos mecánicos (a bajas y a altas deformaciones
respectivamente) siguen siendo útiles y esenciales en la evaluación de las
propiedades del material de los alimentos (Chen, 2009); pero el instrumento
último es el ser humano, cuya percepción debe correlacionarse con los
parámetros medidos por medios instrumentales.
4.1.1. Textura instrumental a bajas deformaciones
La mayoría de los alimentos no pueden clasificarse dentro del
comportamiento típico de un líquido (viscosidad) ni el de un sólido
(elasticidad) ya que presentan componentes de ambos comportamientos,
llamado comportamiento viscoelástico. La medida de estas propiedades se
realiza mediante ensayos reológicos dentro del intervalo o zona de
viscoelasticidad lineal (ZVL). En ésta, la relación entre el esfuerzo y la
deformación es lineal, de forma que la respuesta del material en este
régimen está fuertemente condicionada por su estructura molecular; por
ello se convierte en una buena herramienta de caracterización.
Debido a que los geles (rellenos de fruta) son materiales viscoelásticos, los
ensayos reológicos dinámicos a bajas deformaciones resultan adecuados
para evaluar sus características. De las pruebas de reología dinámica en la
ZVL, se pueden obtener los valores del módulo de almacenamiento, G’, del
módulo de pérdida G”, y del factor de pérdida tan = (G”/G’). El valor G’ es
una medida de la energía de deformación almacenada en la muestra
durante el proceso de cizallamiento, que representa la componente elástica
de una muestra. El valor que G” es una medida de la energía disipada por la
muestra, que representa la componente viscosa (Mezger, 2002). Si G’ es
mucho mayor que G”, el material se comporta con mayor característica de
sólido; es decir, las deformaciones serán esencialmente elásticas o
recuperables. Por el contrario, si G” es mucho mayor que G’, la energía
utilizada para deformar el material se disipa fluyendo y el comportamiento
34
del material tiene mayores características de líquido (Rao, 1999). La
relación entre los valores de G’ y G’’ define la tangente de pérdidas tan, en
la que δ representa el desfase existente entre el esfuerzo y la deformación;
es un parámetro indicativo de la relación entre la energía disipada y la
almacenada por el sistema y de su viscoelasticidad. Si el material fuera
totalmente elástico el esfuerzo y la deformación estarían en fase y en
ángulo sería de 0º, mientras que si fuera totalmente viscoso habría un
desfase de 90º. Los materiales viscoelásticos presentan valores entre 0 y
90º por lo que se tangente varía entre 1 y 0 y da indicación del grado de
viscoelasticidad.
4.1.2. Textura instrumental a altas deformaciones
Las grandes deformaciones se aplican para revelar las propiedades
mecánicas de los sistemas; con ellas se intenta simular las condiciones de
deformación a las que pueden someterse cuando se manipulan en la boca
durante la ingestión, o durante la preparación y procesado (Angioloni, y
Collar, 2009). En alimentos tipo gel, los resultados de la aplicación de este
tipo de ensayos se utiliza para relacionarlos con los atributos sensoriales, ya
que las deformaciones aplicadas son del mismo orden (Roopa y
Bhattacharya, 2008). Por ejemplo, datos de penetración del gel o de
extrusión inversa proporcionan información que puede relacionarse con
parámetros de textura como dureza, firmeza, o cohesividad en boca. Estos
ensayos mecánicos a alta deformación proporcionan información que
también puede estar relacionada con las mediciones dinámicas a bajas
deformaciones, pero dicha relación normalmente no es directa.
4.2. Análisis sensorial
El análisis sensorial permite evaluar las sensaciones que se producen
cuando se prueba un producto y ofrece una dimensión muy importante en el
35
estudio de la calidad de productos alimenticios. La evaluación sensorial se
puede definir como “la disciplina científica utilizada para evocar, medir,
analizar e interpretar las reacciones a aquellas características de los
alimentos y otras sustancias, percibidas por los sentidos de la vista, olfato,
gusto, tacto y oído” (IFT, 2009).
Existen diversas herramientas de análisis sensorial que ayudan en el
desarrollo y creación de productos, así como a su reformulación con el
objetivo de satisfacer a los consumidores. La investigación cuantitativa del
consumidor suele implicar la obtención de sus respuestas a través de
métodos de recolección de datos apropiados. Los métodos sensoriales son
relevantes en el desarrollo y diseño de productos, y las fases de
optimización previas al lanzamiento (Van Kleef van Trijp, y Luning, 2005;
Costa, y Jongen, 2006) pero también durante los controles de calidad.
4.2.1. Análisis descriptivo (QDA)
El análisis descriptivo o QDA (Quantitative Descriptive Analysis) (Stone y
Sidel, 2004), es una herramienta de gran utilidad en el estudio de productos
alimenticios. Este ensayo utiliza una metodología que conduce a una
descripción completa de los productos y provee la base para determinar
cuáles son las características sensoriales clave de los productos, y, en
consecuencia, muy probablemente los que estarán relacionados con su
aceptabilidad. Las características más importantes de este método son las
siguientes:
Mide todas las características sensoriales
Puede analizar varios productos a la vez
Emplea un número limitado de evaluadores altamente
entrenados
Los evaluadores se seleccionan y se monitoriza su actuación
Emplea descriptores obtenidos por consenso
36
Es un método cuantitativo en el que los resultados se analizan
estadísticamente
La calidad sensorial de los rellenos de fruta incluye un gran número de
características sensoriales. Son particularmente importantes el equilibrio de
dulzor y acidez, color, sabor de fruta y una textura de gel homogéneo. Estas
características están definidas por muchos atributos, que a su vez estarán
relacionadas con las preferencias del consumidor.
Para un producto como los rellenos de fruta es importante entender las
relaciones entre la percepción de la textura de gel y estructura (Renard et
al., 2006). La textura del producto suele relacionarse con la excelencia de la
preparación y debe ser idealmente constante una vez que el producto esté
en el mercado. La variación en los tipos de ingredientes o sus niveles de
concentración por lo general conduce a cambios en la estructura de gel que
los consumidores percibirán como cambios en la textura o en las
sensaciones en la boca. Esta “sensación en la boca” es la experiencia
sensorial que se deriva durante y después de la ingestión. Los
consumidores suelen apreciar términos de calidad (fresco, rancio, tierno,
maduro) a partir de sensaciones físicas en la boca (duro, suave, húmedo,
seco, etc.) (Basu y Shivhare, 2010). En general, los consumidores prefieren
tener control total del alimento cuando se encuentra en su boca; en general,
se rechaza un alimento grumoso, o demasiado viscoso, o que contienen
trozos inesperados o partículas duras (Grujić et al., 2010).
4.2.2 Predominio temporal de las sensaciones (TDS, Temporal
Dominance of Sensations)
Es una metodología sensorial desarrollada recientemente para evaluar la
evolución temporal de las percepciones sensoriales en la boca durante la
ingestión del producto que se está probando (Pineau et al. 2009). Mientras
el análisis descriptivo clásico realiza medidas “estáticas” de la percepción,
37
esta metodología ha ganado gran interés en el campo sensorial debido a su
enfoque único que permite la descripción de la secuencia de las
percepciones sensoriales predominantes a lo largo de la degustación de un
producto. Se ha utilizado para describir diversos productos. El
procedimiento de TDS es muy diferente de las metodologías sensoriales
estándar. A lo largo de la evaluación, los panelistas tienen que hacer
secuencialmente una elección entre varios atributos para determinar cuál de
ellos es el que predomina sobre los demás. Por ello, la definición de la lista
de atributos a evaluar es el elemento clave (Pineau 2012). Este método se
ha utilizado para productos con diferentes propiedades de textura, tales
como aguas y bebidas (Reverend et al. 2008; Teillet et al. 2010), cereales
(Lenfant et al. 2009), vinos parcialmente desalcoholizados (Meillon et al.
2009), geles sólidos (Labbe et al. 2009), productos lácteos (Pineau et al.
2009), productos rebozados (Albert et al., 2010) o helados (Varela et al.,
2014). Hasta ahora no se ha usado en geles suaves como rellenos de fruta
o mermeladas
4.2.3 Pruebas con consumidores.
Escalas de adecuación (Just-about-right o JAR)
Las escalas de adecuación, son unas de las más usadas durante el
desarrollo de productos (optimización), en conjunto con medidas de
aceptabilidad, para ajustar las formulaciones de acuerdo con la preferencia
del consumidor. Estas pruebas ayudan a entender qué atributos del
producto es necesario modificar para mejorar la aceptabilidad o preferencia
(Rhotman, 2007). Las escalas JAR se utilizan en la ciencia de los
consumidores para identificar si un atributo es demasiado alto o demasiado
bajo en un producto, o si es "justo el adecuado". Las calificaciones de los
consumidores proporcionan una indicación de las posibilidades de mejorar
el prototipo y la dirección del cambio en la formulación. Se utilizan con
frecuencia en los estudios de optimización de producto (Popper, 2014).
38
En el diseño del producto, un paso clave es la selección de una formulación
de producto que se ajusta en la medida de lo posible a las preferencias
sensoriales de los consumidores (van Kleef, van Trijp, y Luning, 2006). En
este contexto, uno de los principales desafíos para la ciencia sensorial y del
consumidor es proporcionar información útil para la decisión de cambios
específicos en la formulación del producto (Moskowitz y Hartmann, 2008).
Uno de los pasos más importantes del proceso es la identificación del
producto ideal para los consumidores y el camino a seguir para la
reformulación. En el presente trabajo se utilizó la técnica cuestionario CATA
con el fin de profundizar en este conocimiento sobre las percepciones del
consumidor. Así, se obtuvo información para una adecuada orientación
hacia la diversificación y reformulación de los rellenos de fruta usando
almidón de tapioca.
Cuestionario CATA (Check-all-that-apply)
CATA es un método accesible y de uso fácil para el consumidor; se utiliza
cada vez con mayor frecuencia para obtener la percepción de los
consumidores sobre las características sensoriales y no sensoriales de los
productos alimenticios. Ha ido ganando popularidad debido a su simplicidad
y facilidad de uso (Adams, Williams, Lancaster, y Foley, 2007; Ares,
Barreiro, Deliza, Giménez y Gámbaro, 2010; Ares, Varela, Rado y Giménez,
2011a; Dooley, Lee y Meullenet, 2010; Plaehn, 2012). En este método se
presenta a los consumidores una lista de términos y se les pide que
seleccionen todos los que consideren apropiados para describir el producto
que están evaluando. La relevancia de cada término para cada producto se
determina calculando la frecuencia de selección que hace el conjunto de
consumidores encuestados. Este método de análisis puede usarse para
identificar qué características del producto son importantes para el
consumidor y su relación con los determinantes de la aceptación o la
preferencia, en combinación con datos de aceptabilidad.
39
Bibliografía
Adams, J., Williams, A., Lancaster, B. y Foley, M. (2007). Advantages and uses of
check-all-that-apply response compared to traditional scaling of attributes for salty
snacks. In 7th Pangborn Sensory Science Symposium, 12-16 August 2007,
Minneapolis, EE.UU.
Ahmed, G.E. (1981). "High methoxyl Pectins an their uses un jam manufacture" A
literature survey. Scientific and Technical Survey. Nº 127.
Aidoo, R., Afoakwa, E. y Dewettinck, K. (2014) Optimization of inulin and
polydextrose mixtures as sucrose replacers during sugar-free chocolate
manufacture-Rheological, microstructure and physical quality characteristics.
Journal of Food Engineering, 126, 35-42.
Angioloni, A. y Collar, C. (2009). Small and large deformation viscoelastic behaviour
of selected fibre blends with gelling properties. Food Hydrocolloids, 23, 742-748.
Ares, G., Deliza, R., Barreiro, C., Gimenez, A. y Gambaro A. (2010). Comparison of
two sensory profiling techniques based on consumer perception. Food Quality
and Preference, 21 (4), 417-426.
Ares, G., Varela, P., Rado, G. y Giménez, A. (2011a). Are consumer profiling
techniques equivalent for some product categories? The case of orange flavoured
powdered drinks. International Journal of Food Science and Technology, 46,
1600–1608.
Ares, G., Varela, P., Rado, G. y Giménez, A. (2011b). Identifying ideal products
using three different consumer profiling methodologies. Comparison with external
preference mapping. Food Quality and Preference, 22, 581-591.
Ares, G., Dauber, C., Fernández, E. Giménez, A. y Varela, P. (2014). Penalty
analysis based on CATA questions to identify drivers of liking and directions for
product reformulation. Food Quality and Preference, 32, 65-76.
40
Albert, A., Salvador, A. Schlich, P. y Fiszman S. (2012). Comparison between
temporal dominance of sensations (TDS) and key-attribute sensory profiling for
evaluating solid food with contrasting textural layers: Fish sticks. Food Quality
and Preference, 24, 111–118.
Aristizábal, J. y Sánchez T (2007) Guía técnica para producción y análisis de
almidón de yuca. Boletín de servicios agrícolas de la FAO-163, Roma, Italia.
Arocas, A., Sanz, T. y Fiszman, S.M. (2010). Clean label starches as thickeners in
white sauces. Shearing, heating and freeze/thaw stability. Food Hydrocolloids,
23, 2031-2037.
Arocha, M. y Rosella C.M. (2011) Physicochemical properties and enzymatic
hydrolysis of different starches in the presence of hydrocolloids. Carbohydrate
Polymers, 85, 237–244.
Babic, J., Subaric, D., Ackar, D., Pilizota, V., Kopjar, M. y Nedic, N. (2006). Effects
of pectin and carrageenan on thermophysical and rheological properties of
tapioca starch. Czech Journal of Food Sciences, 24, 275-282.
Baiano, A., Mastromatteo, M. y Del Nobile, M.A. (2012). Effects of Cultivar and
Process Variables on Dynamic-Mechanical and Sensorial Behavior of Value-
Added Grape-Based Smoothies. Molecules, 17, 11421-11434;
doi:10.3390/molecules 171011421
Basu, S. y Shivhare, U.S. (2010). Rheological, textural, micro-structural and sensory
properties of mango jam. Journal of Food Engineering, 100, 357-365.
Basu, S., Shivhare, U.S. y Singh, T.V. (2013).Effect of substitution of stevioside and
sucralose on rheological, spectral, color and microstructural characteristics of
mango jam. Journal of Food Engineering, 114, 465-476.
41
BeMiller, J. N. (2011). Pasting, paste, and gel properties of starch–hydrocolloid
combinations: a review. Carbohydrate Polymers, 86, 386-423.
Biliaderis, C.G. (2009). Structural Transitions and Related Physical Properties of
Starch. In J. BeMiller y R. Whistler (Eds.). In J. BeMiller y R. Whistler (Eds.),
Starch (3th ed.). Chemistry and Technology (pp. 301-331). Orlando, FL:
Academic Press.
Breuninger, W.F., Piyachomkwan, K. y Sriroth, K. (2009). Tapioca/Cassava Starch:
Production and Use. In J. BeMiller y R. Whistler (Eds.), Starch (3th ed.).
Chemistry and Technology (pp 541-568). Orlando, FL: Academic Press.
Cadena, R.S. y Bolini, H.M.A. (2011). Time-intensity analysis and acceptance test
for traditional and light vanilla ice cream. Food Research International, 44, 677–
683.
Cadena, R.S., Cruz, A.G., Netto, R.R., Castro, W.F., Faria, J.D.A.F. y Bolini, H.M.A.
(2013). Sensory profile and physicochemical characteristics of mango nectar
sweetened with high intensity sweeteners throughout storage time. Food
Research International, 54, 167-1679.
Carbonell, E., Costell, E. y Duran L. (1990) a. Research note. Rheological behaviour
of sheared jams. Relation with fruit content. Journal of texture studies, 22, 33-43.
Carbonell, E., Costell, E. y Duran L. (1990) b. Rheological indices of fruit content in
jams: influence of formulation on time-dependent flow of sheared strawberry and
peach jams. Journal of texture studies, 22, 457-470.
Chaisawang, M. y Suphantharika, M. (2006). Pasting and rheological properties of
native and anionic tapioca starches as modified by guar gum and xanthan gum.
Food Hydrocolloids, 20, 641-649.
Chen, J. (2009). Food oral processing. A review. Food Hydrocolloids, 23, 1-25.
42
Costa, A.I.A. y Jongen, W.M.F. (2006). New insights into consumer-led food product
development. Trends in Food Science y Technology, 17, 457-465.
Duran, E., Costell E., lzquierdo L. y Duran, L. (1994). Low sugar bakery jams with
gellan gum-guar gum mixtures. Influence of composition on texture. Food
Hydrocolloids, .8 (3-4), 373-381.
FAO (Food and Agricultura Organization). (2006). Starch market adds value to
cassava. http://www.fao.org/ag/magazine/0610sp1.htm
FAO. Organización de las naciones unidas para la agricultura y la alimentación
(2006) El mercado de almidón añade valor a la yuca. Enfoques octubre 2006.
Fiszman, S.M. y Duran, L. (1992). Effects of pulp and sucrose on the compression
response of different polysaccharide gel systems. Carbohydrate polymers, 17,
11-17.
Foegeding, E.A. (2007). Rheology and sensory texture of biopolymer gels. Current
Opinion in Colloid and Interface Science, 12, 242-250.
Grujić, S., Grujić, R. y Poljašević, J. (2010). Effect of food additives on sensory
characteristics of thermo-stable marmalade, Electronic Journal of Polish
Agricultural Universities, 13(2), 11. Website:
http://www.ejpau.media.pl/volume13/issue2/art-11.html.
Hoover, R. (2001). Composition, molecular structure and physicochemical
properties of tuber and root starches: a review. Carbohydrate polymers, 45, 253-
267.
Hyvonen, L. y Torma, R., 1983. Examination of sucrose, sucrose alcohols, and
artificial sweeteners as substitutes for sucrose in strawberry jam: product
development. Journal of Food Science. 192, (48), 183-185.

43
IFT Sensory and Consumer Sciences Division. (2009). http://www.ift.org/knowledge-
center/core-sciences/sensory-science.aspx. Acceso: 09/11/2013.
Jaramillo M., Castrillón A. y Gallego, J.B. (2011). Diseño de estrategias para
impulsar el cultivo masivo y tecnificado de la yuca en Colombia como producto
sustituto del. Especialización en gerencia agropecuaria universidad la Salle,
Antioquia, Colombia.
Khondkar, D., Tester, R.F., Hudson, N., Karkalas, J. y Morrow, J. (2007).
Rheological behaviour of uncross-linked and cross-linked gelatinized waxy maize
starch with pectin gels. Food Hydrocolloids, 21, 1296-1301.
Labbe, D., Schlich, P., Pineau, N., Gilbert, F. y Martin, N. (2009). Temporal
dominance of sensations and sensory profiling: A comparative study. Food
Quality and Preference, 20, 216-221.
Lenfant, F., Loret, C., Pineau, N., Hartmann, C. y Martin, N. (2009). Perception of
oral food breakdown. The concept of sensory trajectory. Appetite, 52, 659-667.
Melo, L.L.M.M., Bolini, H.M.A. y Efraim, P. (2009). Sensory profile, acceptability, and
their relationship for diabetic/reduced calorie chocolates. Food Quality and
Preference, 20, 138–143.
Mezger, T.G. (2002). In Ulrich Zorll (Ed.), The rheology handbook: for users of
rotational and oscillatory rheometers. Germany: Hannover.
Mitolo, J.J. (2006). Starch sellecccio and interation in foods. In Gaonkar, A.G., y
McPherson, A (Eds), Ingredient Interations. Effects on food quality. New York:
Taylor y Francis. pp 140-164.
Miyazaki, M., Van Hung, P., Maeda, T. y Morita, N. (2006). Recent advances in
application of modified starches for breadmaking. Trends in Food Science y
Technology, 17(11), 591-599.
44
Moskowitz, H. y Hartmann, J. (2008). Consumer research: creating a solid base for
innovative strategies. Trends in Food Science y Technology, 19 (11), 581-589.
Nabors L.O., 2001. Alternative sweeteners: an overview. In: Alternative Sweeteners
(edited by L.O. Nabors), New York, U.S.A., Marcel Dekker.
Ojijo, N. y Shimoni, E. (2007). Influence of xanthan gum and tapioca starch on the
retrogradation and gelation of finger millet (Eleusine coracana l. Gaertner) starch
pastes. Journal of Texture Studies, 38, 100-115.
Ortega, F.E. y Eliason, A.C. (2001) Gelatinisation and retrogradation behaviour of
some starch mixtures. Starch, 53, 520-529.
Pereira, P.A.P., de Souza, V.R., Teixeira, T.R., Queiroz, F., Borges, S.V. y Carneiro,
J.D.D.S. (2013). Rheological behavior of functional sucrose-free guava
preserves: Effect of the addition of salts. Food Hydrocolloids, 31, 404-412.
Pineau, N., Schlich, P., Cordelle, S., Mathonniere, C., Issanchou, S., Imbert, A.,
Rogeaux, M., Etievant, P. y Koster, E. (2009). Temporal Dominance of
Sensations: Construction of the TDS curves and comparison with time–intensity.
Food Quality and Preference, 20 (6), 450-455.
Pongsawatmanit R., Temsiripong T., Ikeda S. y Nishinari K. (2006) Influence of
tamarind seed xyloglucan on rheological properties and thermal stability of
tapioca starch. Journal of Food Engineering, 77, 41-50.
Pongsawatmanit, R., Temsiripong, T. y Suwonsichon, T. (2007). Thermal and
rheological properties of tapioca starch and xyloglucan mixtures in the presence
of sucrose. Food Research International, 40, 239-248.
Pongsawatmanit, R. y Srijunthongsiri, S. (2008). Influence of xanthan gum on
rheological properties and freeze–thaw stability of tapioca starch. Journal of Food
Engineering, 88, 137-143.
45
Popper, R. (2014). Use of Just-About-Right Scales in Consumer Research. In:
Novel Techniques in Sensory Characterization and Consumer Profiling. Eds:
Varela, P. y Ares, G. Boca Raton, FL Ed. CRC Press - Taylor y Francis. Pp. 137-
155.
Prakash, I., DuBois, G.E., Clos, J.F., Wilkens, K.L. y Fosdick, L.E. (2008).
Development of rebiana, a natural, non-caloric sweetener. Food and Chemical
Toxicology, 46, S75–S82.
Renard, D., van de Velde, F. y Visschers, R.W. (2006). The gap between food gel
structure, texture and perception. Food Hydrocolloids, 20 (4), 423-431.
Rao, M.A. (1999). Rheological behavior of processed fluid and semisolid foods. In
M.A. Rao (Ed.), Rheology of fluid and semisolid foods: principles and
applications. (Chapter 3 and 5, pp. 105–108, 244–254).
Roopa, B. S. y Bhattacharya, S. (2008). Alginate gels: I. Characterization of textural
attributes. Journal of Food Engineering, 85, 123-131.
Schirmer, M., Jekle, E., Arendt, T. y Becker, T. (2012). Physicochemical interactions
of polydextrose for sucrose replacement in pound. (Food Research International,
48, 291-298.
Stone, H. y Sidel, J.L. (2004). Quantitative Descriptive Analysis (The QDA Method),
Sensory Evaluation Practices, Elsevier Academic Press, San Diego, CA.
Shi, X. y BeMiller, J. N. (2002). Effects of food gums on viscosities of starch
suspensions during pasting. Carbohydrates Polymers, 50, 7-18.
Singh, J., Kaur, L. y McCarthy, O.J. (2007). Factors influencing the physico-
chemical, morphological, thermal and rheological properties of some chemically
modified starches for food applications. A review. Food Hydrocolloids, 21, 1-22.

46
Steffe, T.F. (1996). Rheological methods in food process engineering (2th ed.). East
Lansing, MI: Freeman Press.
Temsiripong, T., Pongsawatmanit, R., Ikedab, S. y Nishinari, K. (2005). Influence of
xyloglucan on gelatinization and retrogradation of tapioca starch. Food
Hydrocolloids, 19, 1054-1063.
Ulinsky, T.J. (1989) flavoring low water activity fruit fillings for bakery goods. Cereals
foods world, 323.
Van Kleef, E., Van Trijp, H.C.M. y Luning, P. (2005). Consumer research in the early
stages of new product development: a critical review of methods and techniques.
Food Quality and Preference, 16, 181-201.
Varela, P. y Fiszman, S.M. (2013). Exploring consumers’ knowledge and
perceptions of hydrocolloids used as food additives and ingredients. Food
Hydrocolloids, 30, 477-484.
Varela, P. (2013). Chapter 11: Application of multivariate statistical methods during
new product development. Case study: application of principal component
analysis and hierarchical cluster analysis on consumer liking data of orange
juices. In: Mathematical and Statistical Methods in Food Science and Technology.
Eds: D. Granato y G. Ares. Hoboken, NJ 07030. Ed. John Wiley y Sons, Inc.
ISBN: 978-1-118-43368-3.
Varela, P., Pintor, A. y Fiszman, S.M. (2014). How hydrocolloids affect the temporal
oral perception of ice cream. Food Hydrocolloids, 36, 220-228.
Wei, Y.P., Wang, C.S. y Wu, J.S.B. (2001). Flow properties of fruit fillings. Food
Research International, 34, 377-381.
47
Young, N. W. G., Kappel, G. y Bladt, T. (2003). A polyuronan blend giving novel
synergistic effects and bake-stable functionality to high soluble solids fruit fillings.
Food Hydrocolloids, 17, 407-418.
Zhao, L. y Tepper, B. J. (2007). Perception and acceptance of selected high-
intensity sweeteners and blends in model soft drinks by propylthiouracil (PROP)
non-tasters and super-tasters. Food Quality and Preference, 18, 531–540.


OBJETIVOS

OBJETIVO PRINCIPAL
El objetivo principal de esta Tesis Doctoral es la evaluación del desempeño
del almidón de tapioca nativo en rellenos de fruta y propuesta de un sistema
mixto con pectina que admita las correspondientes condiciones de pH, de
temperatura y de proceso.
Objetivos específicos
Evaluar el efecto de la adición de pectina de bajo metoxilo sobre las
propiedades reológicas y de textura del almidón de tapioca nativo y
comparar su tecnofuncionalidad con almidón de maíz waxy
modificado, usado como control.
Investigar el efecto de los tratamientos de calentamiento y
congelación/ descongelación sobre las propiedades reológicas de los
sistemas propuestos para la elaboración de rellenos de fruta.
Estudiar los efectos de la cantidad de fruta y del horneado en
aplicaciones de pastelería.
Evaluar el efecto de la cantidad de fruta y del reemplazo de azúcar
con polidextrosa y edulcorantes de alta intensidad sobre las
propiedades reológicas, la textura instrumental y las características
sensoriales de los rellenos de fruta y sobre la percepción oral
dinámica de los rellenos de fruta
Evaluar las características de los rellenos de fruta propuestos con
técnicas que estudian la percepción del consumidor, estudiando
posibles nichos de preferencia.


ESTRUCTURA DE LA
TESIS DOCTORAL

ESTRUCTURA DE LA TESIS
55
El trabajo de investigación realizado ha dado origen a diversas
publicaciones científicas, cuyo contenido se presenta en los distintos
capítulos de la presente Tesis Doctoral. Las referencias de las
publicaciones y el capítulo en que aparecen son:
Capítulo I.
Agudelo, A., Varela, P., Sanz, T., y Fiszman, S. (2014). Native
tapioca starch as a potential thickener for fruit fillings. Evaluation of
mixed models containing low-methoxyl pectin. Food Hydrocolloids,
35, 297-304
Capítulo II.
Agudelo, A., Varela, P., Sanz, T., y Fiszman, S. (2014).
Formulating fruit fillings. Freezing and baking stability of a tapioca
Starch-pectin mixture model. Food Hydrocolloids, 40, 203-213
Capítulo III.
Agudelo, A., Varela, P., y Fiszman, S. (2014).Fruit fillings
development: a multiparametric approach. Aceptado con cambios
menores en LWT
Capítulo IV.
Agudelo, A., Varela, P., y Fiszman, S. (2014). Methods for a
deeper understanding of the sensory perception of soft gelled
systems. Enviado a Food Hydrocolloids
ESTRUCTURA DE LA TESIS
56
En el capítulo 1 se evaluó la adición de pectina en combinación con el
almidón de tapioca como sistema modelo de agente espesante en un
relleno de fruta y se compararon las propiedades de formación de pasta, las
propiedades viscoelásticas, los parámetros de textura instrumental
(extrusión) y sinéresis del sistema propuesto con el almidón nativo de
tapioca solo y con un control (almidón modificado de maíz waxy) usado en
rellenos de fruta industrialmente
En el capítulo 2 se investigó la influencia de los tratamientos de
calentamiento y congelamiento/ descongelamiento sobre las propiedades de
formación de pasta, propiedades viscoelásticas, propiedades de textura
(extrusión) y la sinéresis de los sistemas con y sin fruta (mezcla del almidón
de tapioca y pectina, almidón control y almidón de tapioca). Además se
evaluó el efecto de la cocción sobre la textura en dos aplicaciones de
panadería (sistemas abiertos y cerrados).
En el capítulo 3 se evaluaron rellenos de fruta reducidos en azúcar,
elaborados con diferente cantidad de fruta y remplazando el azúcar por
polidextrosa como agente de carga y una mezcla de edulcorantes de alta
intensidad. Para ello se aplicaron técnicas instrumentales (reológicas y de
textura) y técnicas sensoriales (estudios de análisis sensorial descriptivo
(QDA) clásico con panel entrenado y estudios con consumidores no
entrenados para evaluar su aceptabilidad y adecuación (uso de escalas
JAR).
En el último capítulo se aplicaron técnicas sensoriales relativamente nuevas
para poder profundizar en la comprensión de la percepción de sistemas
gelificados suaves como los rellenos de fruta. Las técnicas usadas fueron:
Dominio temporal de las Sensaciones (TDS: Temporal Dominance of
Sensations) evaluando textura y sabor por separado y análisis CATA
(Check-all-that-apply) incluyendo la evaluación de un "relleno de fruta

ESTRUCTURA DE LA TESIS
57
ideal". Los resultados se relacionaron con la aceptabilidad por los
consumidores.

CAPÍTULO 1
Native tapioca starch as a potential thickener for fruit fillings.
Evaluation of mixed models containing low-methoxyl pectin
Alejandra Agudelo, Paula Varela, Teresa Sanz y
Susana Fiszman
Instituto de Agroquímica y Tecnología de Alimentos (CSIC). Valencia – Spain
Food Hydrocolloids, 35, 297-304

CAPÍTULO 1
61
ABSTRACT
Fruit fillings for pastries are low-pH systems that have to withstand baking
temperatures without loss of quality. The present study evaluated a mixed
system based on native tapioca starch (NTS) with the addition of low-
methoxyl pectin (LMP) as a model for use in an acid environment (pH 3.0-
3.2). This system was compared with a modified (highly cross-linked,
hydroxypropylated and phosphated) waxy corn starch (MWCS) commonly
used in industrial fruit fillings. The starch pasting and viscoelastic
properties, instrumental texture and syneresis were measured. The
addition of LMP to replace 10% of the NTS significantly increased the peak
viscosity (PV), hot paste viscosity (HPV), cold paste viscosity (CPV) and
total relative setback of the NTS and reduced relative breakdown. The
mixed system also made the gel stronger and more elastic, achieving
similar levels of viscoelastic properties to those of the control starch. At a
frequency of 1 Hz, in acid conditions and with 35% sugar, no significant
differences in G’, G” and tan G’/G” were found between the mixed system
and the control (MWCS). The addition of pectin caused a significant
increase in the firmness and consistency of the gels analyzed by extrusion
tests.
Keywords: Tapioca starch, Pectin, Fruit fillings, Rheology, Pasting
properties, Texture, Syneresis.
CAPÍTULO 1
62
1. INTRODUCTION
Identifying niche markets for products that use native tapioca starch e
which is extracted from cassava roots e and acquiring a deeper knowledge
of its applications in food systems and matrices would boost the
development of this agro-industry in Colombia and other South American
countries (FAO, 2006). Native starches (NS) are perceived by consumers
as “natural” or “less worrying” than other ingredients/additives (Varela y
Fiszman, 2013); this perception and the market trend towards natural foods
and clean labels make the use of native starches look promising (Arocas,
Sanz, y Fiszman, 2010). However, in industrial applications such as in fruit
fillings for pastries, which have low pH values because of the fruit and must
withstand the baking temperatures, NS present limitations as they are
unstable in these conditions and tend to retrograde at low temperatures,
leading to lower end-product quality (Miyazaki, Van Hung, Maeda, y Morita,
2006). In these kinds of application modified starches are indicated.
For example, modification by etherification provides stability against
retrogradation and modification by cross-linking provides stability against
acid, thermal and mechanical degradation (Singh, Kaur, y McCarthy,
2007). Another alternative to improve the functional properties of NS is to
use hydrocolloids, which could act with starches through macromolecular
interactions (Babic et al., 2006; Ojijo y Shimoni, 2007). It has been shown
that particular hydrocolloids affect the rheological properties of tapioca
starch in different ways (Babic et al., 2006; Breuninger, Pyyachomkwan, y
Siroth, 2009), largely owing to the molecular structure of the hydrocolloids
and/or the ionic charges of the starch and the hydrocolloids (BeMiller,
2011; Shi y BeMiller, 2002). Pectin is the hydrocolloid most frequently used
in systems containing fruit; for fruit fillings _ which normally contain less
than 55% sugar _ low methoxyl pectin (LMP) with the addition of calcium
CAPÍTULO 1
63
ions would be indicated. Information on mixed starch/LMP systems is
scarce. Khondkar, Tester, Hudson, Karkalas, and Morrow (2007) studied
the effect of LMP on the dynamic rheological properties of crosslinked and
uncross-linked waxy corn starch and found that G’ and G” increased when
pectin was added. They suggested that there could be cross-linking
between the starch and the pectin in this type of system. Lim, Han, Lim,
and BeMiller (2002) also suggested that ion-charged gums could act as
cross-linking agents in starch-gum systems.
The effects of other gums such as guar gum (non-ionic) and xanthan gum
(negatively charged) on the properties and rheological behaviour of native
tapioca starch (non-ionic) and of anionic (negatively charged) modified
tapioca starch were researched by Chaisawang and Suphantharika (2006),
who found that the system gelling characteristics were influenced by three
factors: (a) the continuous phase of the gum extending through the matrix
where the starch granules had collected, (b) the swelling ability of the
starch granules themselves and (c) the electrostatic interaction between
the starch granules and the gum molecules. The dominance of each factor
was dependent on the combination of each specific starch and gum:
xanthan gum totally wrapped around the NS granules and made it more
difficult for them to swell and, in turn, to gelatinize. On the other hand, in
the modified starche xanthan system gelatinization was retarded compared
with the native starch due to repulsion between the starch granules and the
gum. The guar gum, on the other hand, did not wrap round either the
native or the anionic starch granules but allowed them to gelatinize freely.
Sugar, whether alone or in the presence of hydrocolloids, has well-know
effects on starch gelatinization that have been studied by a number of
authors (Babic et al., 2009; Baek, Yoo, y Lim, 2004; Chantaro y
Pongsawatmanit, 2010; Eliasson, 1992; Perry y Donald, 2002; Rumpold,
Bauer, y Knorr, 2005; Sharma, Oberoi, Sogi, y Gill, 2009). The presence of
CAPÍTULO 1
64
sugars and of polyols prevents the starch granules from swelling and
increases their pasting temperature and gelatinization temperature,
measured by a Rapid Visco Analyser (RVA) and by differential scanning
calorimetry (DSC) respectively. In tapioca starch (TS) specifically,
Pongsawatmanit, Temsiripong, and Suwonsichon (2007) studied mixtures
of NTS and xyloglucan and found a higher pasting temperature in the
presence of sugar, measured with an RVA. They also observed that the
final viscosity peak rose when the quantities of sugar were increased.
Chantaro and Pongsawatmanit (2010) observed the same effects in
mixtures with xanthan gum.
The purpose of this study was to assess the effect that adding low-
methoxyl pectin plus calcium would have on the rheology and consistency
of native tapioca starch and to compare its performance with that of
modified waxy corn starch, used as a control, in order to reappraise the
use of native tapioca starch under the typical sugar concentration, pH, and
temperature conditions of fruit fillings.
2. MATERIALS AND METHODS
2.1 Ingredients
The ingredients employed were native tapioca starch (NTS) (moisture
content 13.7%, Sucroal S.A., Colombia), citric acid and sodium citrate
(Sucroal S.A., Colombia), highly cross-linked waxy corn starch,
hydroxypropylated and phosphated (MWCS) (moisture content 12.3%,
Polartex 6716, Cargill, Spain), low-methoxyl pectin (LMP) (33-37%
esterified, moisture content 12%, Unipectine OB700, Cargill, España),
anhydrous calcium chloride (Panreac, Spain) and white sugar (Hacendado,
Spain).
CAPÍTULO 1
65
2.1.1. Native tapioca starch characterization
The moisture and ash content of the tapioca starch were measured using
standard USP procedures (USP, 2009). The phosphate content was
measured by an NTC (Norma Tecnica Colombiana) procedure (ICONTEC,
2001), the pH and acidity by procedure ISI 26-5e (ISI, 1999) and the
amylose content by a colorimetric method employing visible UV
spectrophotometry (Jarvis y Walter, 1993; Wuttisela, Shobsngob, Triampo,
y Triampo, 2008). All the measurements of physical and chemical
properties were carried out at the Sucroal S.A. Food Research and
Development Laboratory in Colombia.
2.2 Sample preparation
The samples were prepared in a food processor-cooker (Thermomix TM
31, Wuppertal, Germany) equipped with temperature and stirring speed
controls. All the samples were prepared at pH 3 and contained 35% sugar
and 6% of the thickener system. The thickener model systems employed
were the control starch (MWCS), native tapioca starch (NTS) and NTS with
two levels of pectin e 0.3% and 0.6% of the total sample weight e and two
levels of calcium ions in each, namely 40 mg and 60 mg of calcium ions
per gram of pectin (Table 1). The sample preparation for the determination
of the pasting properties is described in Section 2.3.
The first step in preparing the samples was to add the sugar to part of the
water, heat to 60ºC and stir at 600 rpm for 5 min. In the formulations with
pectin, this was first dispersed in water with the magnetic stirrer at 80ºC
until it was totally dissolved, then allowed to cool to 60ºC before adding it to
the sugar-water mixture. The starch was dispersed in another part of cold
water and added to the sugar-water mixture, which continued to be stirred
while heating for another 2 min. Once the mixtures had been prepared with
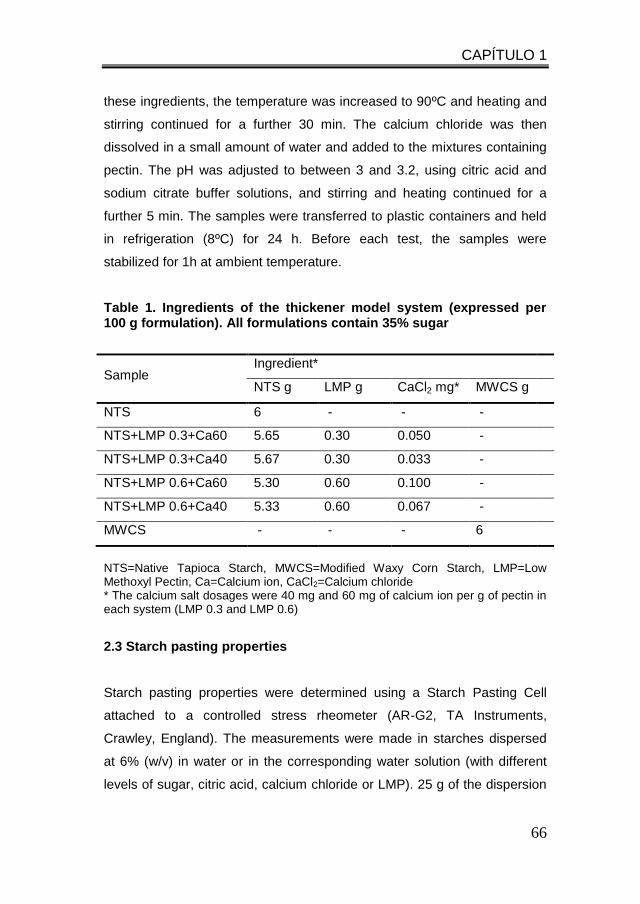
CAPÍTULO 1
66
these ingredients, the temperature was increased to 90ºC and heating and
stirring continued for a further 30 min. The calcium chloride was then
dissolved in a small amount of water and added to the mixtures containing
pectin. The pH was adjusted to between 3 and 3.2, using citric acid and
sodium citrate buffer solutions, and stirring and heating continued for a
further 5 min. The samples were transferred to plastic containers and held
in refrigeration (8ºC) for 24 h. Before each test, the samples were
stabilized for 1h at ambient temperature.
Table 1. Ingredients of the thickener model system (expressed per 100 g formulation). All formulations contain 35% sugar
Sample Ingredient*
NTS g LMP g CaCl2 mg* MWCS g
NTS 6 - - -
NTS+LMP 0.3+Ca60 5.65 0.30 0.050 -
NTS+LMP 0.3+Ca40 5.67 0.30 0.033 -
NTS+LMP 0.6+Ca60 5.30 0.60 0.100 -
NTS+LMP 0.6+Ca40 5.33 0.60 0.067 -
MWCS - - - 6
NTS=Native Tapioca Starch, MWCS=Modified Waxy Corn Starch, LMP=Low Methoxyl Pectin, Ca=Calcium ion, CaCl2=Calcium chloride * The calcium salt dosages were 40 mg and 60 mg of calcium ion per g of pectin in each system (LMP 0.3 and LMP 0.6)
2.3 Starch pasting properties
Starch pasting properties were determined using a Starch Pasting Cell
attached to a controlled stress rheometer (AR-G2, TA Instruments,
Crawley, England). The measurements were made in starches dispersed
at 6% (w/v) in water or in the corresponding water solution (with different
levels of sugar, citric acid, calcium chloride or LMP). 25 g of the dispersion
CAPÍTULO 1
67
were placed in the cylindrical container and inserted into the base of the
pasting cell. The sample was stirred vigorously at 100 s-1 for 10 s and the
stirring speed was set to 30 s-1 until the end of the test. The samples were
heated from 30ºC to 90ºC at a speed of 15 ºC/min, held at 90 ºC for 5 min,
cooled to 30ºC at a speed of 15ºC/min and finally held at a constant
temperature of 30ºC for 5 min. The data were collected with the software
supplied with the equipment (TA Data Analysis, TA Instruments, Crawley,
England).
The parameters extracted were pasting temperature (PT), taken as the
temperature at which the viscosity begins to rise; peak viscosity (PV),
taken as the highest viscosity achieved during heating; hot paste viscosity
(HPV), taken as the viscosity value at the end of the isothermal period at
90ºC; cold paste viscosity (CPV), taken as the viscosity value at the end of
the isothermal period at 30ºC; breakdown (PV-HPV); relative breakdown
(PV-HPV)/PV; total setback (CPV-HPV); and relative total setback, (CPV-
HPV)/CPV.
2.4 Viscoelastic properties
The linear viscoelastic properties were measured using a controlled stress
rheometer (AR-G2, TA Instruments, Crawley, England) with Peltier
temperature control, using a 60 mm diameter plate-plate geometry with a 1
mm gap. Before measurement began, the sample was left to stabilize
between the plates for 10 min. The measurements were carried out at
20ºC. Stress sweeps were carried out to determine the linear viscoelastic
region, followed by frequency sweeps from 10 to 0.01 Hz at stress
amplitude inside the linear region. The storage modulus (G’), loss modulus
(G”) and loss tangent (tan or tan G”/G’) were recorded with the software
(TA Data analysis, TA Instruments, Crawley, England).
CAPÍTULO 1
68
2.5 Extrusion test
The extrusion properties were measured with a texture analyzer (TA-XT
Plus, Godalming, England) equipped with a 50 mm diameter back
extrusion cell (A/BE Back Extrusion Rig) with a 10mmgap between the
extrusion cylinder and the compression disk. The compression speed was
10 mm/s and the trigger point was 10 g. The duration of the test was set at
15 s (Arocas, Sanz, y Fiszman, 2009). The samples were placed in an
extrusion cylinder and stabilized in a water bath at 25ºC for 10 min before
making the measurements. The force-displacement profiles were recorded
and the area under the curve (AUC, in N s) and maximum extrusion force
(Fmax, in N) as a measure of consistency were obtained.
2.5 Syneresis
Two methods were used to measure syneresis: Centrifugation. The
method used was adapted from Sanguansri, Orawan and Janya (2008).
The sample was weighed and centrifuged (Sorvall RC-5B, DuPont
Instruments, Wilmington, DE, USA) at 8000 g for 15 min. The liquid
released was removed and weighed. After extrusion. The method used
was adapted from Arocas et al. (2009). Syneresis was quantified 2 min
after the extrusion test. The sample was weighed and transferred to a
funnel lined with filter paper (Whatman 42) and the liquid released was
collected for 15 min. This method is intended to reduce the degree of gel
structure destruction that occurs during centrifuging. In both methods,
syneresis was expressed as the amount of liquid released per 100 g of
sample.
% Syneresis = (Weight of liquid released / Total initial weight of
sample)*100
CAPÍTULO 1
69
2.7 Statistical processing of the data
All the tests were carried out in duplicate with samples prepared on
different days. Analyses of variance (ANOVA) were performed to compare
the effect of adding the different ingredients on the pasting properties of the
tapioca starch in comparison to the control starch (MWCS). Tukey’s
multiple comparison test was used to analyse inter-group differences with
a 95% confidence interval. These analyses were performed with the
XLSTAT statistics software package (Addinsoft-Barcelona-Spain, version
2009, 4.03).
3. RESULTS AND DISCUSSION
3.1 Physico-chemical properties of tapioca starch
The NTS assay results are shown in Table 2. The values were similar to
those reported in other studies (Sriroth, Santisopasri, Petchalanuwat,
Kurotjanawong, y Piyachomkwan, 1999). The 13.7% moisture content was
high but acceptable. Nuwamanya, Baguma, Emmambux, and Rubaihayo
(2010) reported starch moisture levels ranging from 14% to 16% and
stated that the level depends on the process employed and the storage
conditions. The 0.011% phosphate content was similar to the levels in
tapioca starch reported by other authors: 0.016-0.018% (Moorthy y
Ramanujam, 1986), 0.008% organic and 0.001% inorganic phosphate
(Hoover, 2001) and 0.01% total phosphate content in tapioca starch
(Breuninger et al., 2009). The 23.55% amylose content was in the high
regions of the ranges reported by several authors (Freitas, Paula, Feitosa,
Rocha, y Sierakowski, 2004; Nuwamanya et al., 2010; Sajeev, Sreekumar,
Unnikrishnan, Moorthy, y Shanavas, 2010). A high amylose content has
usually been linked to a greater tendency to retrogradation in starches,
showing higher peak viscosities with consequently greater breakdown
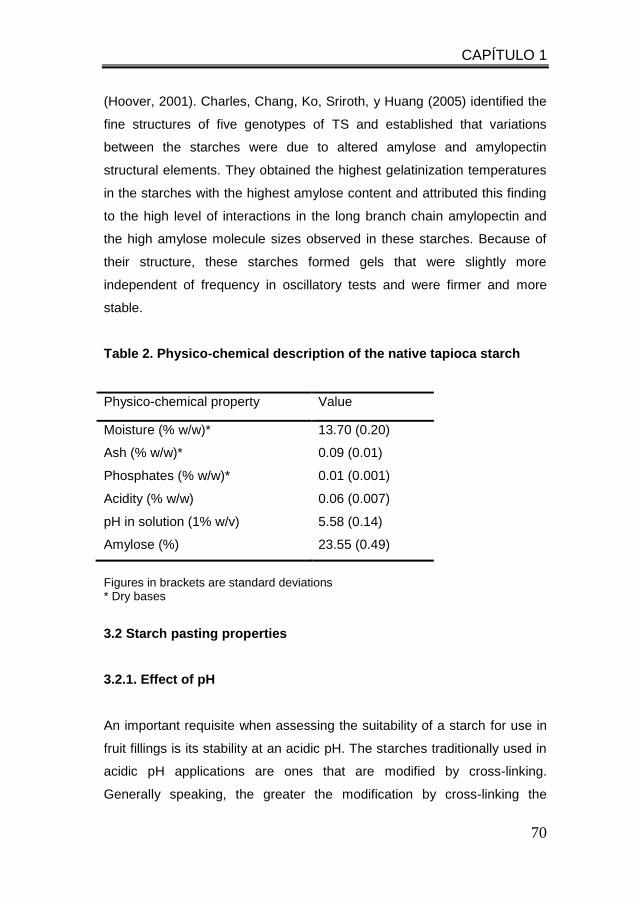
CAPÍTULO 1
70
(Hoover, 2001). Charles, Chang, Ko, Sriroth, y Huang (2005) identified the
fine structures of five genotypes of TS and established that variations
between the starches were due to altered amylose and amylopectin
structural elements. They obtained the highest gelatinization temperatures
in the starches with the highest amylose content and attributed this finding
to the high level of interactions in the long branch chain amylopectin and
the high amylose molecule sizes observed in these starches. Because of
their structure, these starches formed gels that were slightly more
independent of frequency in oscillatory tests and were firmer and more
stable.
Table 2. Physico-chemical description of the native tapioca starch
Physico-chemical property Value
Moisture (% w/w)* 13.70 (0.20)
Ash (% w/w)* 0.09 (0.01)
Phosphates (% w/w)* 0.01 (0.001)
Acidity (% w/w) 0.06 (0.007)
pH in solution (1% w/v) 5.58 (0.14)
Amylose (%) 23.55 (0.49)
Figures in brackets are standard deviations * Dry bases
3.2 Starch pasting properties
3.2.1. Effect of pH
An important requisite when assessing the suitability of a starch for use in
fruit fillings is its stability at an acidic pH. The starches traditionally used in
acidic pH applications are ones that are modified by cross-linking.
Generally speaking, the greater the modification by cross-linking the
CAPÍTULO 1
71
greater their resistance to acidic pH values. Table 3 shows the pasting
parameters, PV, PT, HPV, CPV, relative total setback and relative
breakdown values at different pH levels, comparing their effect in NTS and
in a highly cross-linked modified starch that is appropriate for this
application (MWCS, control). As expected, the pH values had completely
different effects on the pasting parameters in the two types of starches. In
the NTS, PT and PV decreased significantly as the pH fell. However, the
most noticeable change at the lowest pH was a significant decrease in
HPV and an associated increase in relative structure breakdown, showing
the high level of starch structure breakdown which takes place during the
heating step at a low pH. The CPV values were also significantly lower at
pH 3, which again points to the inability of NTS to produce a gel at pH 3.
The effect of pH on MWCS was completely different, as the high level of
cross-linking makes it resistant to low-pH levels. In this starch, the
maximum viscosity developed at pH 3 and the PV, HPV and CPV levels all
rose as the Ph decreased. One noticeable feature of the behaviour of the
MWCS was that the viscosity values rose slightly during the isothermal
stage at 90ºC, showing that because of its high degree of crosslinking, this
starch needs high acidity and a high temperature in order to swell and
develop maximum viscosity. The rise in viscosity during the isothermal
period at 90ºC explains the negative relative breakdown values, which
indicate that the granular structure of this starch most probably did not
breakdown. The pasting temperature was altered very slightly by the pH in
the range studied (Table 3). The instability of native starches to acidic
conditions has been reported by many authors. Mali et al. (2003) compared
the rheological behaviour of yam tuber starch and tapioca starch in
solutions at pH 3 and 6, using a Brabender Viscograph, and obtained very
similar results, although they did not find that the pH affected the pasting
temperature. Sae-kang and Suphantharika (2006) studied the influence of
pH on tapioca starch at pH 3, 6 and 9, using DSC, and found very low
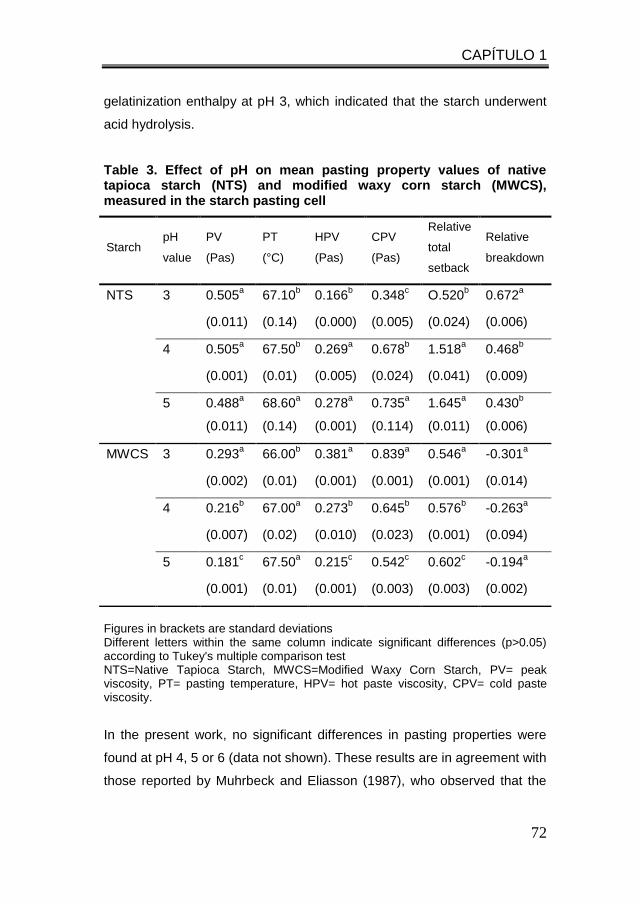
CAPÍTULO 1
72
gelatinization enthalpy at pH 3, which indicated that the starch underwent
acid hydrolysis.
Table 3. Effect of pH on mean pasting property values of native tapioca starch (NTS) and modified waxy corn starch (MWCS), measured in the starch pasting cell
Figures in brackets are standard deviations Different letters within the same column indicate significant differences (p>0.05) according to Tukey's multiple comparison test NTS=Native Tapioca Starch, MWCS=Modified Waxy Corn Starch, PV= peak viscosity, PT= pasting temperature, HPV= hot paste viscosity, CPV= cold paste viscosity.
In the present work, no significant differences in pasting properties were
found at pH 4, 5 or 6 (data not shown). These results are in agreement with
those reported by Muhrbeck and Eliasson (1987), who observed that the
Starch pH
value
PV
(Pas)
PT
(°C)
HPV
(Pas)
CPV
(Pas)
Relative
total
setback
Relative
breakdown
NTS 3 0.505a 67.10
b 0.166
b 0.348
c O.520
b 0.672
a
(0.011) (0.14) (0.000) (0.005) (0.024) (0.006)
4 0.505a 67.50
b 0.269
a 0.678
b 1.518
a 0.468
b
(0.001) (0.01) (0.005) (0.024) (0.041) (0.009)
5 0.488a
(0.011)
68.60a
(0.14)
0.278a
(0.001)
0.735a
(0.114)
1.645a
(0.011)
0.430b
(0.006)
MWCS 3 0.293a 66.00
b 0.381
a 0.839
a 0.546
a -0.301
a
(0.002) (0.01) (0.001) (0.001) (0.001) (0.014)
4 0.216b 67.00
a 0.273
b 0.645
b 0.576
b -0.263
a
(0.007) (0.02) (0.010) (0.023) (0.001) (0.094)
5 0.181c 67.50
a 0.215
c 0.542
c 0.602
c -0.194
a
(0.001) (0.01) (0.001) (0.003) (0.003) (0.002)
CAPÍTULO 1
73
rheological data for tapioca starch were not sensitive to pH levels of
between 4.2 and 9.2. The starch hydrolysis mechanism presented two
phases: the first corresponded to a faster degradation of the amorphous
areas of granules and the second to a slower degradation of the crystalline
regions. The acid hydrolysis rate of starch granules depends on the source
of the starch and the amount of acid added (Campanha and Franco, 2011).
In the present case, pH values from 4 to 6 did not have a significant effect
on the pasting profile of NTS.
3.2.2. Effect of sucrose
Fruit fillings not only have low pH but also high sugar levels, so it is useful
to know the effect of sugar concentrations on the gelatinization of starch at
an acidic pH level (pH 3). The effect of sugar on the pasting parameter
values of NTS and MWCS are shown in Table 4. The viscosity values and
PT rose with the sugar concentration. Significant differences were found in
PV, PT, HPV and CPV. Similar results have been reported in a number of
papers dealing with tapioca starch. Pongsawatmanit et al. (2007), using an
RVA, found that with higher sugar and xyloglucan contents, dispersions of
NTS and xyloglucan in different proportions showed increases in the
viscosity peak and final viscosity. According to Chantaro and
Pongsawatmanit (2010), a higher sugar concentration increased the PT,
PV, CPV, breakdown and setback values in mixtures of NTS and xanthan
gum. Baek et al. (2004) and Babic et al. (2006) found that the gelatinization
temperature and enthalpy of corn starch and tapioca starch with different
types of sugar rose with increased sugar concentration. Rumpold et al.
(2005) and Sharma et al. (2009) established that tapioca starch
gelatinization is delayed by the addition of sugar. Eliasson (1992) and Baek
et al. (2004) explained the effect of sugar on the gelatinization of starch in
terms of two mechanisms. One is based on a reduction in the available
water and water activity in the presence of sugar.
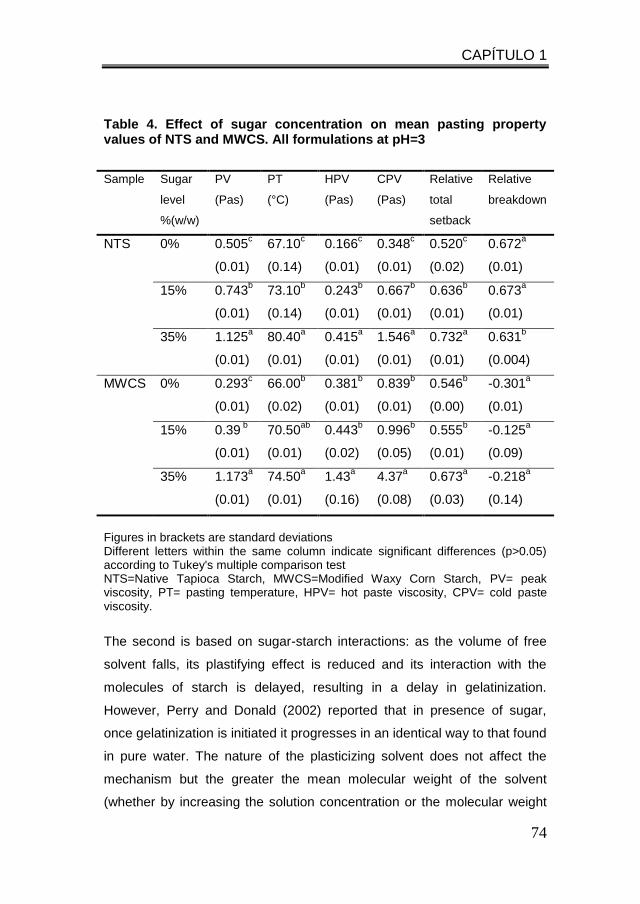
CAPÍTULO 1
74
Table 4. Effect of sugar concentration on mean pasting property values of NTS and MWCS. All formulations at pH=3
Sample Sugar
level
%(w/w)
PV
(Pas)
PT
(°C)
HPV
(Pas)
CPV
(Pas)
Relative
total
setback
Relative
breakdown
NTS
0% 0.505c
(0.01)
67.10c
(0.14)
0.166c
(0.01)
0.348c
(0.01)
0.520c
(0.02)
0.672a
(0.01)
15% 0.743b
(0.01)
73.10b
(0.14)
0.243b
(0.01)
0.667b
(0.01)
0.636b
(0.01)
0.673a
(0.01)
35% 1.125a
(0.01)
80.40a
(0.01)
0.415a
(0.01)
1.546a
(0.01)
0.732a
(0.01)
0.631b
(0.004)
MWCS
0%
0.293c
(0.01)
66.00b
(0.02)
0.381b
(0.01)
0.839b
(0.01)
0.546b
(0.00)
-0.301a
(0.01)
15% 0.39 b
(0.01)
70.50ab
(0.01)
0.443b
(0.02)
0.996b
(0.05)
0.555b
(0.01)
-0.125a
(0.09)
35% 1.173a
(0.01)
74.50a
(0.01)
1.43a
(0.16)
4.37a
(0.08)
0.673a
(0.03)
-0.218a
(0.14)
Figures in brackets are standard deviations Different letters within the same column indicate significant differences (p>0.05) according to Tukey's multiple comparison test NTS=Native Tapioca Starch, MWCS=Modified Waxy Corn Starch, PV= peak viscosity, PT= pasting temperature, HPV= hot paste viscosity, CPV= cold paste viscosity.
The second is based on sugar-starch interactions: as the volume of free
solvent falls, its plastifying effect is reduced and its interaction with the
molecules of starch is delayed, resulting in a delay in gelatinization.
However, Perry and Donald (2002) reported that in presence of sugar,
once gelatinization is initiated it progresses in an identical way to that found
in pure water. The nature of the plasticizing solvent does not affect the
mechanism but the greater the mean molecular weight of the solvent
(whether by increasing the solution concentration or the molecular weight
CAPÍTULO 1
75
of the individual solute), the greater the extent to which gelatinization is
shifted to higher temperatures. According to these authors, these variations
in gelatinization appear to be caused not by specific starch-solute or
solute-water interactions but by non-specific variation in thermodynamic
and kinetic properties which affect the ability of granules to swell.
For both NTS and MWCS, the relative total setback rose when the sugar
concentration increased but the relative breakdown was practically
unaffected. A slight although significant reduction in relative breakdown
was observed in the NTS when the sugar concentration rose, whereas the
MWCS showed negative breakdown values because this modified starch
did not present breakdown (Table 4): as cross-linking strengthens the
bonds between the starch chains, causing resistance of the granules to
swelling, they retained their integrity at 90ºC.
3.2.3. Effect of calcium and pectin
Table 5 presents the effects of adding LMP and calcium ions on the
pasting parameters of NTS, with and without sugar. Adding calcium ions
alone (in the form of CaCl2) at concentrations of 0.033% and 0.100% did
not have a significant effect on the parameters that represent NTS
gelatinization. These results agreed with the findings of Muhrbeck and
Eliasson (1987) that adding electrolytes at low concentrations did not alter
the gelatinization temperature or enthalpy of tapioca starch but did affect
those of potato starch. The difference between these two starches is that
the NTS has a lower proportion of phosphate groups than potato starch
and they do not act in the same way during gel formation. The high degree
of phosphate group substitution in the potato starch increases its negative
charge, giving it different characteristics to those of other tuber starches
(Karim et al., 2007; Noda et al., 2007). In rice starch, both native and
hydroxypropylated, a fall in viscosity has been reported when calcium salts
were added (Islam y Mohd, 1997). These authors suggested that the
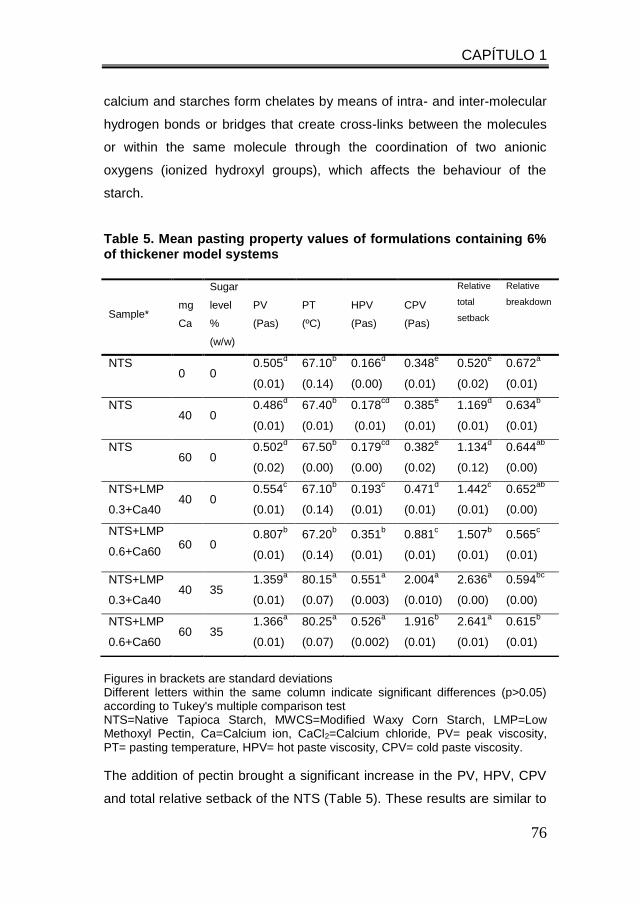
CAPÍTULO 1
76
calcium and starches form chelates by means of intra- and inter-molecular
hydrogen bonds or bridges that create cross-links between the molecules
or within the same molecule through the coordination of two anionic
oxygens (ionized hydroxyl groups), which affects the behaviour of the
starch.
Table 5. Mean pasting property values of formulations containing 6% of thickener model systems
Figures in brackets are standard deviations Different letters within the same column indicate significant differences (p>0.05) according to Tukey's multiple comparison test NTS=Native Tapioca Starch, MWCS=Modified Waxy Corn Starch, LMP=Low Methoxyl Pectin, Ca=Calcium ion, CaCl2=Calcium chloride, PV= peak viscosity, PT= pasting temperature, HPV= hot paste viscosity, CPV= cold paste viscosity.
The addition of pectin brought a significant increase in the PV, HPV, CPV
and total relative setback of the NTS (Table 5). These results are similar to
Sample* mg
Ca
Sugar
level
%
(w/w)
PV
(Pas)
PT
(ºC)
HPV
(Pas)
CPV
(Pas)
Relative
total
setback
Relative
breakdown
NTS 0 0
0.505d
(0.01)
67.10b
(0.14)
0.166d
(0.00)
0.348e
(0.01)
0.520e
(0.02)
0.672a
(0.01)
NTS 40 0
0.486d
(0.01)
67.40b
(0.01)
0.178cd
(0.01)
0.385e
(0.01)
1.169d
(0.01)
0.634b
(0.01)
NTS 60 0
0.502d
(0.02)
67.50b
(0.00)
0.179cd
(0.00)
0.382e
(0.02)
1.134d
(0.12)
0.644ab
(0.00)
NTS+LMP
0.3+Ca40 40 0
0.554c
(0.01)
67.10b
(0.14)
0.193c
(0.01)
0.471d
(0.01)
1.442c
(0.01)
0.652ab
(0.00)
NTS+LMP
0.6+Ca60 60 0
0.807b
(0.01)
67.20b
(0.14)
0.351b
(0.01)
0.881c
(0.01)
1.507b
(0.01)
0.565c
(0.01)
NTS+LMP
0.3+Ca40 40 35
1.359a
(0.01)
80.15a
(0.07)
0.551a
(0.003)
2.004a
(0.010)
2.636a
(0.00)
0.594bc
(0.00)
NTS+LMP
0.6+Ca60 60 35
1.366a
(0.01)
80.25a
(0.07)
0.526a
(0.002)
1.916b
(0.01)
2.641a
(0.01)
0.615b
(0.01)
CAPÍTULO 1
77
those reported by Babic et al. (2006) for tapioca starch to which
carrageenan and high methoxyl pectin had been added, where the effect of
the carrageenan on viscosity was greater than that of the pectin.
The effects of hydrocolloids on the viscosity of mixed systems with starch
have been interpreted by Alloncle, Lefebvre, Llamas, and Doublier (1989),
who assumed two phases in the system, with the gum located in the
continuous phase and the starch in the dispersed phase, and considered
that the increased viscosity of the suspension is due to the contribution of
both phases, which results in a sharp rise in the viscosity of the starche
hydrocolloid combination. Sikora, Kowalsky, and Tomasik (2008) studied
binary starche xanthan gum systems with potato, tapioca, oat and corn
starches in a proportion of 9:1. These authors suggested that initially the
starch and gum gel solution forms two separate phases which slowly
combine into one phase, causing a rise in viscosity, after which the phases
separate again, causing breakdown, and the viscosity falls.
They also observed that the separated phase of the starch and the gum
combined to form a homogeneous phase more rapidly in the NTS solution
than in the other starch mixtures. The pasting temperature did not change
when pectin was added. This agrees with the results obtained by
Hongsprabhas, Israkarn, and Rattanawattanaparkit (2007), who found that
adding alginate and carrageenan to NTS did not significantly affect the
pasting temperature obtained with an RVA. However, Chaisawang and
Suphantharika (2006) found that the pasting temperature of potato and
tapioca starches increased significantly when xanthan gum and guar gum
were added. Rojas, Rosell, and de Barber (1999) concluded that adding
different hydrocolloids to wheat flour promotes a great effect on the pasting
properties of the resulting hydrocolloid-flour mixture and the extent of this
variation is highly dependent on the chemical structure of the hydrocolloid
added: the PT of the wheat flour rose slightly in the presence of pectin and
HPMC at different concentrations, the addition of K-carrageenan, alginate
CAPÍTULO 1
78
and xanthan gum at different concentrations led to a fall in PT, and the
effect of adding guar gum depended on the concentration.
3.3 Linear viscoelastic properties
As may be seen in Fig. 1a and b, a considerable difference in structure
was observed between NTS and MWCS, which is recommended for use in
fruit fillings. The mechanical spectra were recorded at a constant 35%
sugar concentration for both starches on their own and for the mixtures of
NTS with two concentrations of pectin and two levels of calcium ions at
each of the pectin concentrations. The mechanical spectrum of NTS, with
G’ values only slightly higher than those of G” and quite frequency-
dependent, reflected a weak gel structure with low viscoelasticity. The
modified starch was more viscoelastic, as it had significantly higher
modulus values than the native starch and the two moduli were further
apart. Also, these values were much less frequency-dependent than those
of the native starch, which again reflected the stronger gel structure of the
modified starch.
The mixture of NTS with pectin and Ca ions considerably increased the
values of G‘ and G” and the distance between the two, showing a sizeable
increase in viscoelastic behaviour (Biliaderis, 2009; Steffe, 1996) and
taking the NTS closer to the viscoelastic properties of the MWCS gel.
Increasing the LMP concentration raised the modulus values and the gap
between them and reduced the frequency-dependence. At 0.6% LMP (Fig.
1a), the shape of the mechanical spectra was very similar to that of the
MWCS. Table 6 presents the mean values of G’, G” and tan at a
frequency of 1 Hz. It will be seen that increasing the concentration of LMP
brought a significant rise in G’ and G” and a significant drop in tan (closer
to 0), reflecting increased viscoelasticity. The effect of the quantity of
calcium depended on the concentration of LMP. At 0.3% LMP (Fig. 1b),
increasing the calcium ions from 40 mg to 60 mg per g of pectin did not
CAPÍTULO 1
79
alter the G’, G” or tan. In other words, the structure of the gel was not
affected. At the 0.6% LMP concentration, however, significant rises in the
values of the viscoelastic moduli and in viscoelasticity were observed when
the concentration of calcium ions was increased, showing that the lower
concentration had not fully activated the gelling function of the LMP. It
should be noted that with 0.6% LMP, no differences were found between
the viscoelasticity (tan) of the modified starch and that of the native
starch. Consequently, in both cases, in the presence of sugar and at pH 3
the NTS-LMP mixture appears to possess the same rheological properties
as the control starch.
Khondkar et al. (2007) obtained an improvement in the rheological
behaviour of cross-linked waxy corn starch by adding low methoxyl pectin
and concluded that cross-linking can take place in mixed polymer systems.
Chaisawang and Suphantharika (2006) found that adding xanthan gum
and guar gum improved native cassava starch and anionic cassava starch
and Choi and Yoo (2009) found that potato starch was improved by adding
xanthan gum. Chaisawang and Suphantharika (2006) reported that native
tapioca starch contains a small quantity of phosphate groups but the
mechanism of association is different to that of anionic modified starches or
native potato starch, as owing to their high phosphate content, the latter
repel hydrocolloids with a negative charge. A smaller quantity of
phosphates is present in tapioca starch and they do not play the same role
in gelation (Moorthy y Ramanujam,1986).
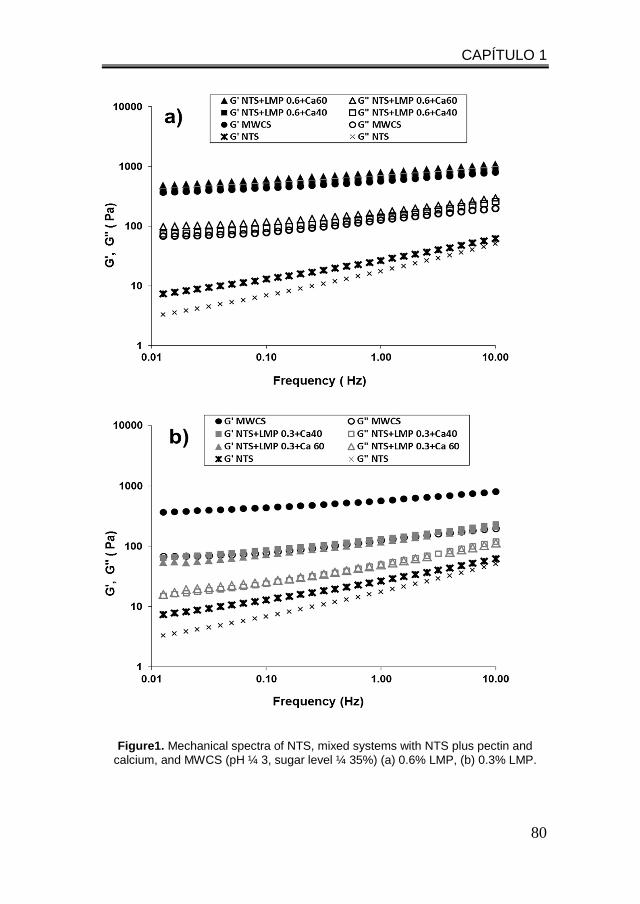
CAPÍTULO 1
80
Figure1. Mechanical spectra of NTS, mixed systems with NTS plus pectin and
calcium, and MWCS (pH ¼ 3, sugar level ¼ 35%) (a) 0.6% LMP, (b) 0.3% LMP.
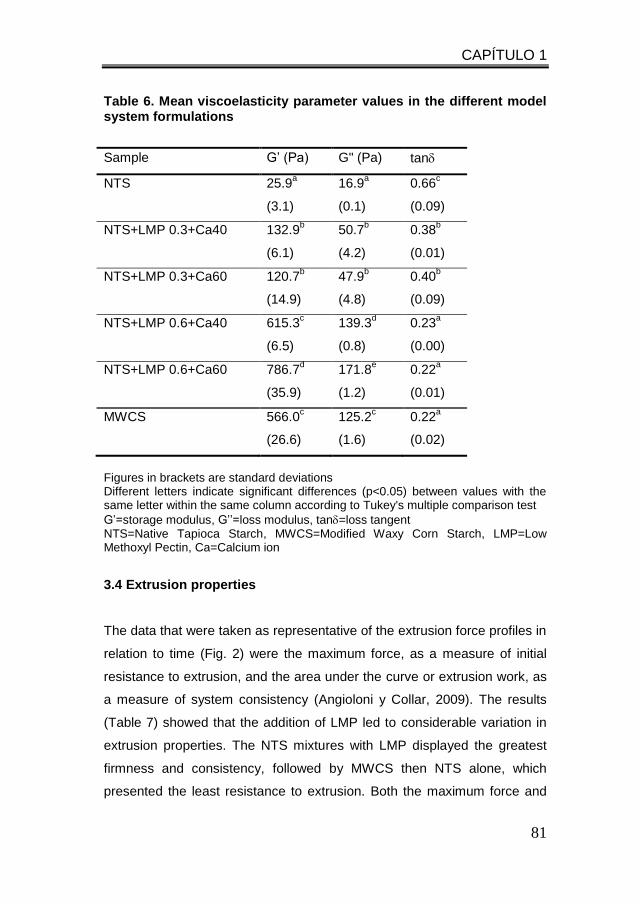
CAPÍTULO 1
81
Table 6. Mean viscoelasticity parameter values in the different model system formulations
Sample G’ (Pa) G" (Pa) tan
NTS 25.9a
(3.1)
16.9a
(0.1)
0.66c
(0.09)
NTS+LMP 0.3+Ca40 132.9b
(6.1)
50.7b
(4.2)
0.38b
(0.01)
NTS+LMP 0.3+Ca60 120.7b
(14.9)
47.9b
(4.8)
0.40b
(0.09)
NTS+LMP 0.6+Ca40 615.3c
(6.5)
139.3d
(0.8)
0.23a
(0.00)
NTS+LMP 0.6+Ca60 786.7d
(35.9)
171.8e
(1.2)
0.22a
(0.01)
MWCS 566.0c
(26.6)
125.2c
(1.6)
0.22a
(0.02)
Figures in brackets are standard deviations Different letters indicate significant differences (p<0.05) between values with the same letter within the same column according to Tukey's multiple comparison test
G’=storage modulus, G’’=loss modulus, tan=loss tangent NTS=Native Tapioca Starch, MWCS=Modified Waxy Corn Starch, LMP=Low Methoxyl Pectin, Ca=Calcium ion
3.4 Extrusion properties
The data that were taken as representative of the extrusion force profiles in
relation to time (Fig. 2) were the maximum force, as a measure of initial
resistance to extrusion, and the area under the curve or extrusion work, as
a measure of system consistency (Angioloni y Collar, 2009). The results
(Table 7) showed that the addition of LMP led to considerable variation in
extrusion properties. The NTS mixtures with LMP displayed the greatest
firmness and consistency, followed by MWCS then NTS alone, which
presented the least resistance to extrusion. Both the maximum force and
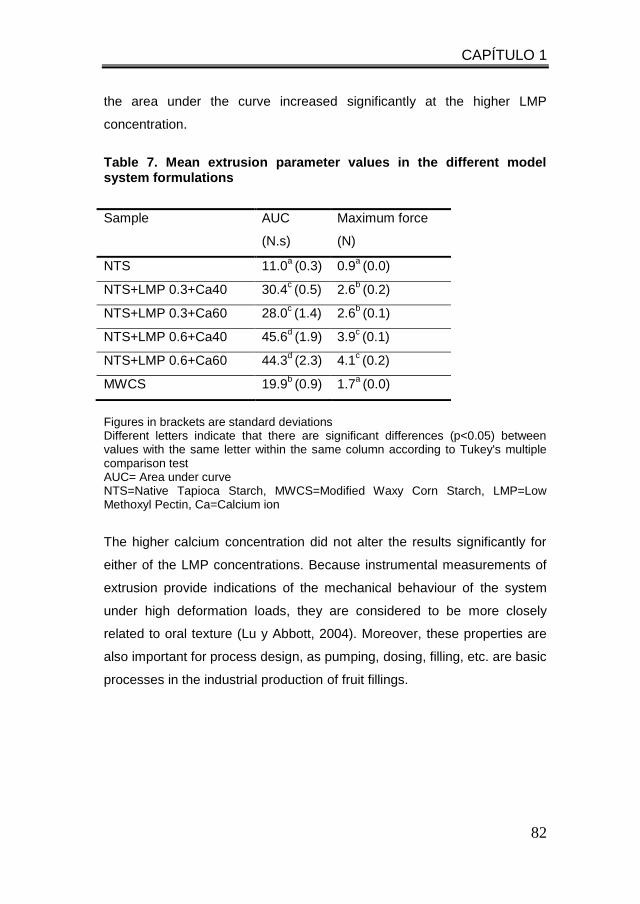
CAPÍTULO 1
82
the area under the curve increased significantly at the higher LMP
concentration.
Table 7. Mean extrusion parameter values in the different model system formulations
Sample AUC
(N.s)
Maximum force
(N)
NTS 11.0a (0.3) 0.9
a (0.0)
NTS+LMP 0.3+Ca40 30.4c (0.5) 2.6
b (0.2)
NTS+LMP 0.3+Ca60 28.0c (1.4) 2.6
b (0.1)
NTS+LMP 0.6+Ca40 45.6d (1.9) 3.9
c (0.1)
NTS+LMP 0.6+Ca60 44.3d (2.3) 4.1
c (0.2)
MWCS 19.9b (0.9) 1.7
a (0.0)
Figures in brackets are standard deviations Different letters indicate that there are significant differences (p<0.05) between values with the same letter within the same column according to Tukey's multiple comparison test AUC= Area under curve NTS=Native Tapioca Starch, MWCS=Modified Waxy Corn Starch, LMP=Low Methoxyl Pectin, Ca=Calcium ion
The higher calcium concentration did not alter the results significantly for
either of the LMP concentrations. Because instrumental measurements of
extrusion provide indications of the mechanical behaviour of the system
under high deformation loads, they are considered to be more closely
related to oral texture (Lu y Abbott, 2004). Moreover, these properties are
also important for process design, as pumping, dosing, filling, etc. are basic
processes in the industrial production of fruit fillings.
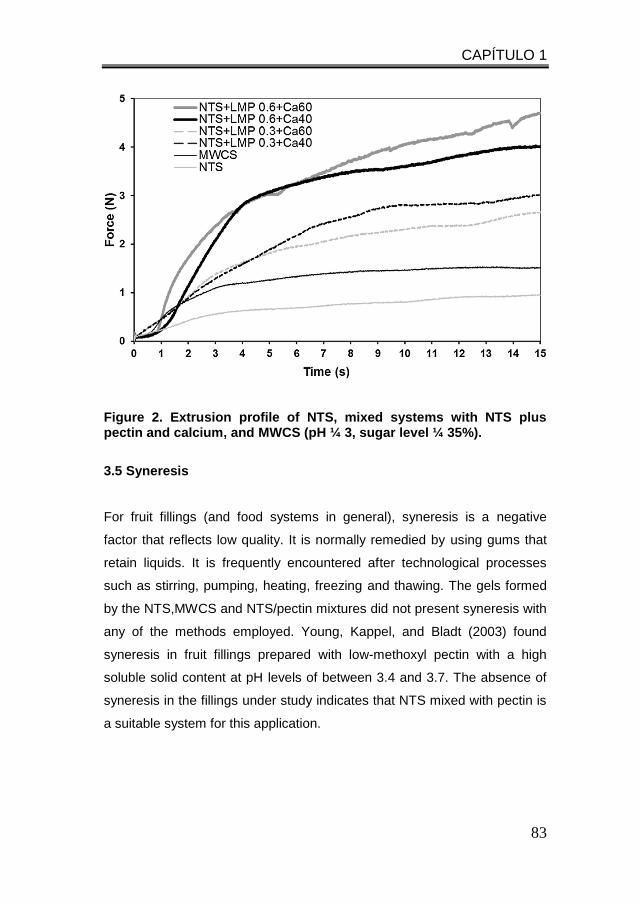
CAPÍTULO 1
83
Figure 2. Extrusion profile of NTS, mixed systems with NTS plus pectin and calcium, and MWCS (pH ¼ 3, sugar level ¼ 35%).
3.5 Syneresis
For fruit fillings (and food systems in general), syneresis is a negative
factor that reflects low quality. It is normally remedied by using gums that
retain liquids. It is frequently encountered after technological processes
such as stirring, pumping, heating, freezing and thawing. The gels formed
by the NTS,MWCS and NTS/pectin mixtures did not present syneresis with
any of the methods employed. Young, Kappel, and Bladt (2003) found
syneresis in fruit fillings prepared with low-methoxyl pectin with a high
soluble solid content at pH levels of between 3.4 and 3.7. The absence of
syneresis in the fillings under study indicates that NTS mixed with pectin is
a suitable system for this application.
CAPÍTULO 1
84
4. CONCLUSIONS
The design of hydrocolloid system formulations that add value to the end
product is a priority goal in the constantly changing world of processed
foods. The present study proposed model formulations which were
designed to act as thickeners in fruit fillings for pastries or in other systems
that require low pH values: a system composed of native tapioca starch
with the addition of small quantities of low-methoxyl pectin and calcium has
proved an interesting alternative with similar properties to modified
starches.
Fruit applications present additional important challenges, as they demand
stability against thermal processes and against freeze/thaw cycles. The
proposed system will need to be studied further to assess its stability
during baking, whether the filling holds its shape during cooking and its
behaviour during frozen storage and subsequent thawing.
REFERENCES
Alloncle, M., Lefebvre, J., Llamas, G. y Doublier, J. L. (1989). A Rheological
Characterization of Cereal Starch-Galactomannan Mixtures. Cereal Chemestry
journal, 66(2), 90-93.
Angioloni, A., y Collar, C. (2009). Small and large deformation viscoelastic
behaviour of selected fibre blends with gelling properties. Food Hydrocolloids,
23, 742-748.
Arocas, A., Sanz, T., y Fiszman, S. M. (2009). Influence of corn starch type on the
rheological properties of a white sauce after heating and freezing. Food
Hydrocolloids, 23, 901-907.
CAPÍTULO 1
85
Arocas, A., Sanz, T., y Fiszman, S. M. (2010). Clean label starches as
thickeners in white sauces. Shearing, heating and freeze/thaw stability. Food
Hydrocolloids, 23, 2031-2037
Babic, J., Subaric, D., Ackar, D., Pilizota, V., Kopjar, M., y Nedic, N. (2006).
Effects of pectin and carrageenan on thermophysical and rheological
properties of tapioca starch. Czech Journal of Food Sciences, 24, 275-282.
Baek, M. H., Yoo, B., y Lim, S. T. (2004). Effects of sugars and sugar alcohols
on thermal transition and cold stability of corn starch gel. Food
Hydrocolloids, 18, 133-142
BeMiller, J. N. (2011). Pasting, paste, and gel properties of starch–hydrocolloid
combinations: a review. Carbohydrate Polymers, 86, 386-423.
Biliaderis, C. G. (2009). Structural Transitions and Related Physical Properties
of Starch. In J. BeMiller y R. Whistler (Eds.). In J. BeMiller y R. Whistler
(Eds.), Starch (3th ed.). Chemistry and Technology (pp. 301-331). Orlando,
FL: Academic Press.
Breuninger, W. F., Piyachomkwan, K., y Sriroth, K. (2009). Tapioca/Cassava
Starch: Production and Use. In J. BeMiller y R. Whistler (Eds.), Starch (3th
ed.). Chemistry and Technology (pp 541-568). Orlando, FL: Academic
Press.
Campanha, R.,y Franco, C. (2011). Gelatinization properties of native starches
and their Naegeli dextrins. Journal of Thermal Analysis y Calorimetry, 106
(3), 799-804.
Chaisawang, M., y Suphantharika, M. (2006). Pasting and rheological
properties of native and anionic tapioca starches as modified by guar gum
and xanthan gum. Food Hydrocolloids, 20, 641-649.
Chantaro, P., y Pongsawatmanit, R. (2010). Influence of sucrose on thermal
and pasting properties of tapioca starch and xanthan gum mixtures. Journal
of Food Engineering, 98, 44-50.
CAPÍTULO 1
86
Charles, A.L. Chang, Y.H., Ko W-C., Sriroth, K., y Huang, T.C. (2005).
Influence of Amylopectin Structure and Amylose Content on the Gelling
Properties of Five Cultivars of Cassava starches. Journal of Agricultural and
Food Chemistry, 53 (7), 2717-2725.
Choi, H. M., y Yoo, B. (2009). Steady and dynamic shear rheology of sweet
potato starch–xanthan gum mixtures. Food Chemistry, 116, 638-643.
Eliasson, A. C. (1992). A calorimetric investigation of the influence of sucrose
on the gelatinization of starch. Carbohydrate Polymers, 18, 131-138.
FAO (Food and Agricultura Organization). (2006). Starch market adds value to
cassava. http://www.fao.org/ag/magazine/0610sp1.htm
Freitas, R. A., Paula, R. C., Feitosa, J. P. A., Rocha, S., y Sierakowski, M. R.
(2004). Amylose contents, rheological properties and gelatinization kinetics
of yam (Dioscorea alata) and cassava (Manihot utilissima) starches.
Carbohydrate Polymers, 55, 3-8.
Hongsprabhas, P., Israkarn, K., y Rattanawattanaprakit, C. (2007) Architectural
changes of heated mungbean, rice and cassava starch granules: Effects of
hydrocolloids and protein-containing envelope. Carbohydrate Polymers, 67,
614-622.
Hoover, R. (2001). Composition, molecular structure and physicochemical
properties of tuber and root starches: a review. Carbohydrate polymers, 45,
253-267.
ICONTEC (Instituto Colombiano de Normas Técnicas y Certificación). (2001).
Determinación del contenido de fósforo. Método espectrofotométrico. NTC
(Norma Técnica Colombiana) 4981. Bogotá Colombia.
ISI (International Starch Institute). (1999). Determination of pH in starch and
syrup. ISI 26-5e. Aarhus, Denmark.
Islam, M. N., y Mohd B. M. N. (1997). Rheological Properties of Calcium
Treated Hydroxypropyl Rice Starches. Starch/Starke, 49(4), 136-141.
CAPÍTULO 1
87
Jarvis, C., y Walter, J. (1993). Simultaneous, rapid, spectrophotometric
determination of total starch, amylose and amylopectin, Journal of the
Science of Food and Agriculture, 63, 53-57.
Karim, A. A., Tool, N. L. C., Lee, V. P. L., Ong, W. Y., Fazilah, A., y Noda, T.
(2007). Effects of Phosphorus Contents on the Gelatinization and
Retrogradation of Potato Starch. Journal of Food Science, 72(2), 133-138.
Khondkar, D., Tester, R. F., Hudson, N., Karkalas, J., y Morrow, J. (2007).
Rheological behaviour of uncross-linked and cross-linked gelatinized waxy
maize starch with pectin gels. Food Hydrocolloids, 21, 1296-1301.
Lu, R., y Abbott, J. A. (2004). Force/deformation techniques for measuring
texture. In Kilcast, D. (Ed.), Texture in food, volume 2, Solids Food (pp. 109-
145). Cambridge England: CRC Press. Woodhead Publishing Ltd.
Lim, S. T., Han, J. A., Lim, H. S., y BeMiller, J. N. (2002). Modification of Starch
by Dry Heating with Ionic Gums. Cereal Chemistry, 79(5), 601-606.
Mali, S., Ferrero, C., Redigonda, V., Beleia, A. P., Grossmann, M. V. E., y
Zaritzky, N. E. (2003). Influence of pH and hydrocolloids addition on yam
(Dioscorea alata) starch pastes stability. Lebensm.-Wiss. u.-Technology, 36,
475-481.
Miyazaki, M., Van Hung, P., Maeda, T., y Morita, N. (2006). Recent advances
in application of modified starches for breadmaking. Trends in Food Science
y Technology, 17(11), 591-599.
Moorthy, S. N., y Ramanujam, T. (1986). Variation in properties of starch in
cassava varieties in relation to age of the crop. Starch/Starke, 38(2), 58-61.
Muhrbeck, P., y Eliasson, A. C. (1987). Influence of pH and Ionic Strength on
the Viscoelastic Properties of Starch Gels - A Comparison of Potato and
Cassava Starches. Carbohydrate Polymers, 7, 291-300.
Noda, T., Kottearachchi, N. S., Tsuda, S., Mori, M., Takigawa, S., Matsuura-
Endo, C., Hashimoto, N., y Yamauchi, H. (2007). Starch phosphorus content
CAPÍTULO 1
88
in potato (Solanum tuberosum L.) cultivars and its effect on other starch
properties. Carbohydrate Polymers, 68, 793-796.
Nuwamanya, E., Baguma, Y., Emmambux, N., y Rubaihayo, P. (2010).
Crystalline and pasting properties of cassava starch are influenced by its
molecular properties. African Journal of Food Science, 4(1), 8-15.
Ojijo, N., y Shimoni, E. (2007). Influence of xanthan gum and tapioca starch on
the retrogradation and gelation of finger millet (Eleusine coracana l.
Gaertner) starch pastes. Journal of Texture Studies, 38, 100-115.
Perry, P. A., y Donald, A. M. (2002). The effect of sugars on the gelatinization
of starch. Carbohydrate polymers, 49, 155-165.
Pongsawatmanit, R., Temsiripong, T., y Suwonsichon, T. (2007). Thermal and
rheological properties of tapioca starch and xyloglucan mixtures in the
presence of sucrose. Food Research International, 40, 239-248.
Rojas, J. A., Rosell, C. M, y de Barber, B. (1999). Pasting properties of different
wheat flour-hydrocolloid systems. Food Hydrocolloids, 13, 27-33.
Rumpold, B. A., Bauer, F., y Knorr, D. (2005). Effect of Salts and Sugars on
Pressure-induced Gelatinisation of Wheat, Tapioca, and Potato Starches.
Starch/Stärke, 57, 370-377.
Sae-kang, V., y Suphantharika, M. (2006). Influence of pH and xanthan gum
addition on freeze-thaw stability of tapioca starch pastes. Carbohydrate
Polymers, 65, 371-380.
Sajeev, M. S., Sreekumar, S., Unnikrishnan, M., Moorthy, S. N., y Shanavas,
S. (2010). Kinetics of thermal softening of cassava tubers and rheological
modeling of the starch. Journal of Food Science Technology, 47(5), 507-
518.
Sanguansri, C., Orawan, T., y Janya, M. (2008). Use of centrifugation–filtration
for determination of syneresis in freeze–thaw starch gels. Carbohydrate
polymers, 73, 143-147.
CAPÍTULO 1
89
Sharma, R., Oberoi, D. P. S., Sogi, D. S., y Gill, B. S. (2009). Effect of sugar
and gums on the pasting properties of cassava starch. Journal of Food
Processing and Preservation, 33, 401-414.
Shi, X., y BeMiller, J. N. (2002). Effects of food gums on viscosities of starch
suspensions during pasting. Carbohydrates Polymers, 50, 7-18.
Sikora, M., Kowalski, S., y Tomasik, P. (2008). Binary hydrocolloids from
starches and xanthan gum. Food Hydrocolloids, 22, 943-952.
Singh, J., Kaur, L., y McCarthy, O. J. (2007). Factors influencing the physico-
chemical, morphological, thermal and rheological properties of some
chemically modified starches for food applications. A review. Food
Hydrocolloids, 21, 1-22.
Sriroth, K., Santisopasri, V., Petchalanuwat, C., Kurotjanawong, K., y
Piyachomkwan, K. (1999). Cassava starch granule structure-function
properties: influence of time and conditions at harvest on four cultivars of
cassava starch. Carbohydrate Polymers, 38, 161-170.
Steffe, T. F. (1996). Rheological methods in food process engineering (2th ed.).
East Lansing, MI: Freeman Press.
USP (United States Pharmacopeia 32 and National Formulary 27. (2009). (27th
ed.). Rockville, MD: The United States Pharmacopeia Convention Inc.
Varela, P., y Fiszman, S. M. (2013). Exploring consumers’ knowledge and
perceptions of hydrocolloids used as food additives and ingredients. Food
Hydrocolloids, 30, 477-484.
Wuttisela, K., Shobsngob, S., Triampo, W., y Triampo, D. (2008). Amylose
/Amylopectin Simple Determination In Acid Hydrolyzed Tapioca Starch.
Journal of Chilean Chemical. Society., 53(3), 1564-1567.
Young, N. W. G., Kappel, G., y Bladt, T. (2003). A polyuronan blend giving
novel synergistic effects and bake-stable functionality to high soluble solids
fruit fillings. Food Hydrocolloids, 17, 407-418.

CAPÍTULO 2
Formulating fruit fillings. Freezing and baking stability of a tapioca
Starch-pectin mixture model
Alejandra Agudelo, Paula Varela, Teresa Sanz y Susana Fiszman
Instituto de Agroquímica y Tecnología de Alimentos (CSIC). Valencia – Spain
Food Hydrocolloids, 40, 203-213


CAPÍTULO 2
93
ABSTRACT
Fruit fillings are a little-studied product. Their design and formulation must
take a number of factors which are inherent to their applications into
account, including stability during heat treatments such as baking and
freezing, during which their quality must remain intact. The present study
investigated systems containing native tapioca starch (TS), low methoxyl
pectin (P, at two concentrations: 0.3% and 0.6%) and calcium, compared
with TS alone and with a modified waxy corn starch (C), normally used in
the industry, as control. All the systems were prepared with and without the
addition of fruit. A method to measure the instrumental texture of filled
pastries was developed and applied to study the effect of the baking
process on two types of bakery products. The rheological results indicated
that in the mixed TS-P systems pectin had the dominant role. The
presence of fruit caused a significant rise in the G’ and G” module values
for all the thickener system formulations, but the effect was greater with the
mixtures that contained pectin. This would indicate that the addition of
solids and/or the extra pectin contributed by the fruit led to greater
structuring. During freezing, the pectin gave rise to a different gel structure
to that of TS alone and acted as a retrogradation and syneresis inhibitor.
The extent of this effect depended on the added pectin concentration.
Pectin also imparts the stability at high temperatures and conferred similar
viscoelastic behaviour to that of the modified starch control (C). The TS-
pectin system also proved bake stable.
Keywords: Tapioca starch, Pectin, Fruit fillings, Freezing/thawing, Bake
stable.
CAPÍTULO 2
94
1. INTRODUCTION
Fruit fillings are a little-studied product and very few papers deal with this
subject. Native starches are widely used in industry in order to impart
viscosity, texture, and stability to food products. Their use gives a ‘clean’
label and it has been shown that consumers perceive them as being
familiar ingredients and as healthier than their modified equivalents or
other thickeners (Varela y Fiszman, 2013). However, native starches are of
limited use in a number of food applications because the pastes and gels
prepared with them tend to break down with prolonged heating or under
high shear or acidic conditions. Moreover, they have a strong tendency to
retrograde and undergo syneresis on cooling (Galkowska, Dlugosz, y
Juszczak, 2013). Therefore, native starches are physically or chemically
modified in order to improve their performance. Another strategy for
improving their techno-functional properties is to add a gum or
hydrocolloid, as reported by numerous authors (Alloncle, Lefebvre, Llamas,
y Doublier, 1989; Biliaderis, 2009; Breuninger, Piyachomkwan, y Sriroth,
2009; Chaisawang y Suphantharika, 2006; Chantaro, Pongsawatmanit, y
Nishinari, 2013; Pongsawatmanit, Temsiripong, y Suwonsichon, 2007;
Sikora, Kowalski, y Tomasik, 2008). In particular, to maintain or improve
desirable textural properties and the stability of native tapioca starch-based
products during long storage periods, hydrocolloids have been added to
control the viscosity of the continuous phase and the textural properties of
the final products (Pongsawatmanit y Srijunthongsiri, 2008). In a previous
paper, the authors proposed a new model system for fruit fillings (pH 3,
35% sugar) which contained native tapioca starch, low-methoxyl pectin and
calcium ions and improved their viscoelastic and texture properties
(Agudelo, Varela, Sanz, y Fiszman, 2014). Since fruit fillings need to be
stable during all kind of technological process conditions, in that paper a
comparison with a control starch (highly cross-linked waxy corn starch,
hydroxypropylated and phosphated) was performed; modification by
CAPÍTULO 2
95
etherification provides stability against retrogradation during
refrigeration/freezing and modification by cross-linking provides stability
against acid, thermal and mechanical degradation (Singh, Kaur, y
McCarthy, 2007). Hydrocolloid addition may decrease or increase the gel-
like character of starch pastes, depending on the starch type as well as on
the gum type and concentration. The most common observation is the
increase in both viscosity and elasticity, with more pronounced effects on
viscosity. The addition of a hydrocolloid can also accelerate gelation and
reduce retrogradation (Rosell, Yokoyama, y Shoemaker, 2011).
According to Mandala (2012), retrogradation takes place in two stages.
The first phase (short-term retrogradation) begins as the paste cools and a
structure of entanglements and/or junction zons is created between
amylose molecules, resulting in an elastic gel. This phase may last up to
48 h. The second phase (long-term retrogradation) involves amylopectin
changes. It is a much slower process that may take place over several
weeks, depending on the storage temperature. Both G’ and G” increase
upon cooling and during short-term storage, indicating that the gels are
becoming firmer. Funami et al. (2005b) studied the effect of adding guar
gum on corn starch retrogradation and found that the interactions between
guar and amylose (or an ‘amylose-like’ component) should be considered a
factor inhibiting short-term retrogradation of starch, because the
interactions may reduce the amount of the starch components that
participate in gelation. They hypothesized that interactions between guar
and leached amylopectin may be a main cause of increased viscosity in a
starch/guar system, and are probably also responsible for the decrease in
the amount of leached amylose. Galkowska et al. (2013) studied how high-
methoxyl pectin and sucrose affected the rheological and textural
properties of chemically-modified potato starch-pectin-sucrose systems
and found that starch-pectin-sucrose gels exhibited better structuring ability
and higher textural parameter values than the gels developed with modified
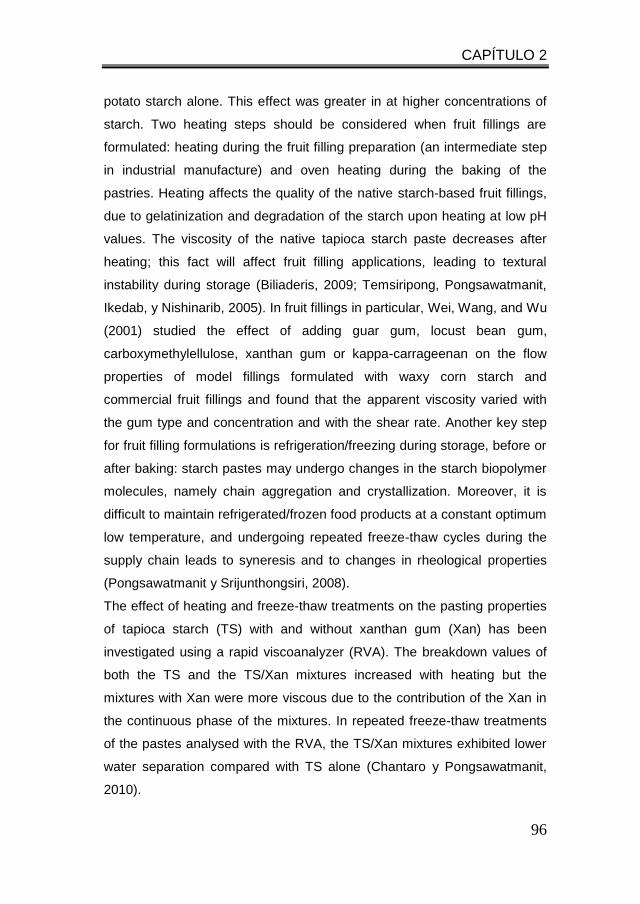
CAPÍTULO 2
96
potato starch alone. This effect was greater in at higher concentrations of
starch. Two heating steps should be considered when fruit fillings are
formulated: heating during the fruit filling preparation (an intermediate step
in industrial manufacture) and oven heating during the baking of the
pastries. Heating affects the quality of the native starch-based fruit fillings,
due to gelatinization and degradation of the starch upon heating at low pH
values. The viscosity of the native tapioca starch paste decreases after
heating; this fact will affect fruit filling applications, leading to textural
instability during storage (Biliaderis, 2009; Temsiripong, Pongsawatmanit,
Ikedab, y Nishinarib, 2005). In fruit fillings in particular, Wei, Wang, and Wu
(2001) studied the effect of adding guar gum, locust bean gum,
carboxymethylellulose, xanthan gum or kappa-carrageenan on the flow
properties of model fillings formulated with waxy corn starch and
commercial fruit fillings and found that the apparent viscosity varied with
the gum type and concentration and with the shear rate. Another key step
for fruit filling formulations is refrigeration/freezing during storage, before or
after baking: starch pastes may undergo changes in the starch biopolymer
molecules, namely chain aggregation and crystallization. Moreover, it is
difficult to maintain refrigerated/frozen food products at a constant optimum
low temperature, and undergoing repeated freeze-thaw cycles during the
supply chain leads to syneresis and to changes in rheological properties
(Pongsawatmanit y Srijunthongsiri, 2008).
The effect of heating and freeze-thaw treatments on the pasting properties
of tapioca starch (TS) with and without xanthan gum (Xan) has been
investigated using a rapid viscoanalyzer (RVA). The breakdown values of
both the TS and the TS/Xan mixtures increased with heating but the
mixtures with Xan were more viscous due to the contribution of the Xan in
the continuous phase of the mixtures. In repeated freeze-thaw treatments
of the pastes analysed with the RVA, the TS/Xan mixtures exhibited lower
water separation compared with TS alone (Chantaro y Pongsawatmanit,
2010).
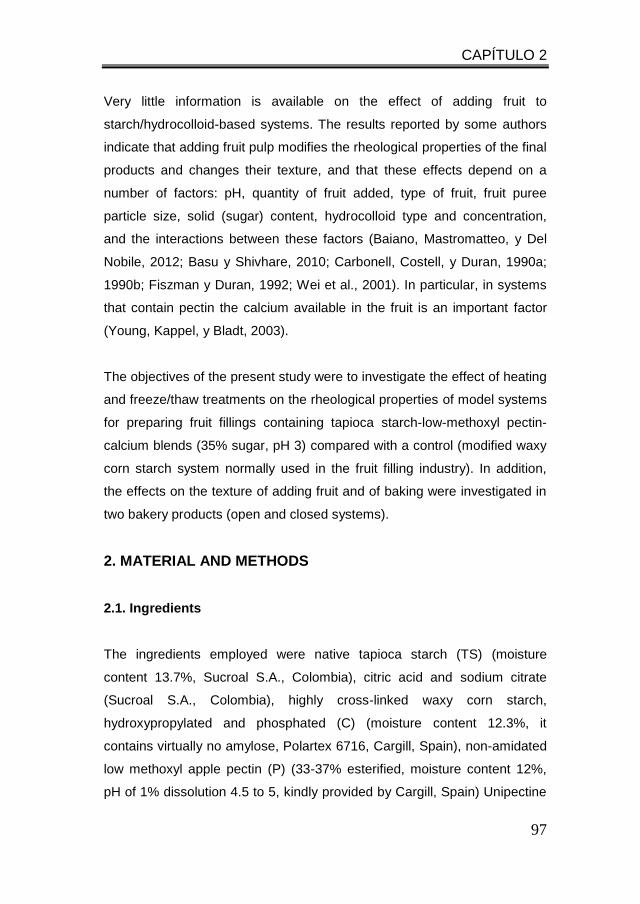
CAPÍTULO 2
97
Very little information is available on the effect of adding fruit to
starch/hydrocolloid-based systems. The results reported by some authors
indicate that adding fruit pulp modifies the rheological properties of the final
products and changes their texture, and that these effects depend on a
number of factors: pH, quantity of fruit added, type of fruit, fruit puree
particle size, solid (sugar) content, hydrocolloid type and concentration,
and the interactions between these factors (Baiano, Mastromatteo, y Del
Nobile, 2012; Basu y Shivhare, 2010; Carbonell, Costell, y Duran, 1990a;
1990b; Fiszman y Duran, 1992; Wei et al., 2001). In particular, in systems
that contain pectin the calcium available in the fruit is an important factor
(Young, Kappel, y Bladt, 2003).
The objectives of the present study were to investigate the effect of heating
and freeze/thaw treatments on the rheological properties of model systems
for preparing fruit fillings containing tapioca starch-low-methoxyl pectin-
calcium blends (35% sugar, pH 3) compared with a control (modified waxy
corn starch system normally used in the fruit filling industry). In addition,
the effects on the texture of adding fruit and of baking were investigated in
two bakery products (open and closed systems).
2. MATERIAL AND METHODS
2.1. Ingredients
The ingredients employed were native tapioca starch (TS) (moisture
content 13.7%, Sucroal S.A., Colombia), citric acid and sodium citrate
(Sucroal S.A., Colombia), highly cross-linked waxy corn starch,
hydroxypropylated and phosphated (C) (moisture content 12.3%, it
contains virtually no amylose, Polartex 6716, Cargill, Spain), non-amidated
low methoxyl apple pectin (P) (33-37% esterified, moisture content 12%,
pH of 1% dissolution 4.5 to 5, kindly provided by Cargill, Spain) Unipectine
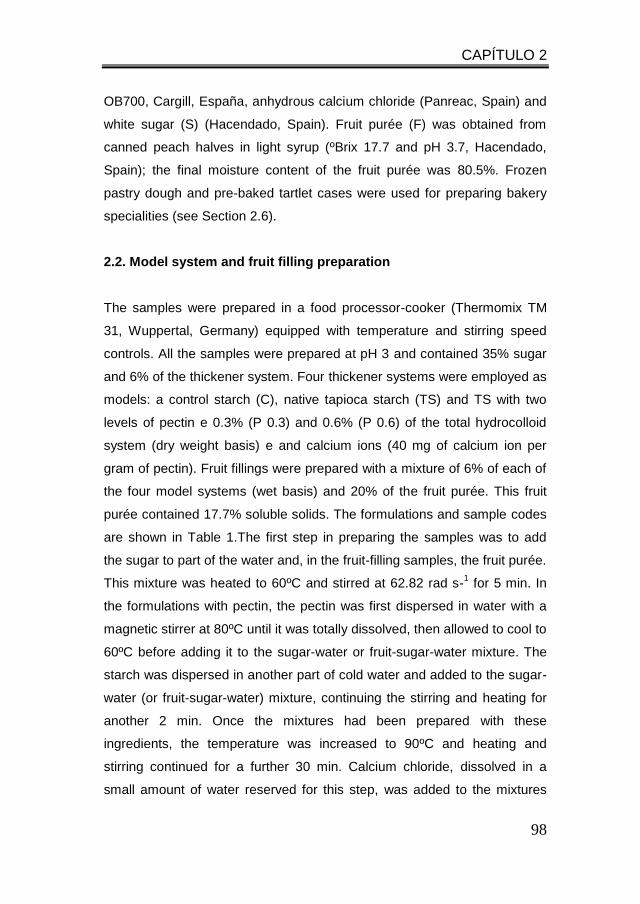
CAPÍTULO 2
98
OB700, Cargill, España, anhydrous calcium chloride (Panreac, Spain) and
white sugar (S) (Hacendado, Spain). Fruit purée (F) was obtained from
canned peach halves in light syrup (ºBrix 17.7 and pH 3.7, Hacendado,
Spain); the final moisture content of the fruit purée was 80.5%. Frozen
pastry dough and pre-baked tartlet cases were used for preparing bakery
specialities (see Section 2.6).
2.2. Model system and fruit filling preparation
The samples were prepared in a food processor-cooker (Thermomix TM
31, Wuppertal, Germany) equipped with temperature and stirring speed
controls. All the samples were prepared at pH 3 and contained 35% sugar
and 6% of the thickener system. Four thickener systems were employed as
models: a control starch (C), native tapioca starch (TS) and TS with two
levels of pectin e 0.3% (P 0.3) and 0.6% (P 0.6) of the total hydrocolloid
system (dry weight basis) e and calcium ions (40 mg of calcium ion per
gram of pectin). Fruit fillings were prepared with a mixture of 6% of each of
the four model systems (wet basis) and 20% of the fruit purée. This fruit
purée contained 17.7% soluble solids. The formulations and sample codes
are shown in Table 1.The first step in preparing the samples was to add
the sugar to part of the water and, in the fruit-filling samples, the fruit purée.
This mixture was heated to 60ºC and stirred at 62.82 rad s-1 for 5 min. In
the formulations with pectin, the pectin was first dispersed in water with a
magnetic stirrer at 80ºC until it was totally dissolved, then allowed to cool to
60ºC before adding it to the sugar-water or fruit-sugar-water mixture. The
starch was dispersed in another part of cold water and added to the sugar-
water (or fruit-sugar-water) mixture, continuing the stirring and heating for
another 2 min. Once the mixtures had been prepared with these
ingredients, the temperature was increased to 90ºC and heating and
stirring continued for a further 30 min. Calcium chloride, dissolved in a
small amount of water reserved for this step, was added to the mixtures
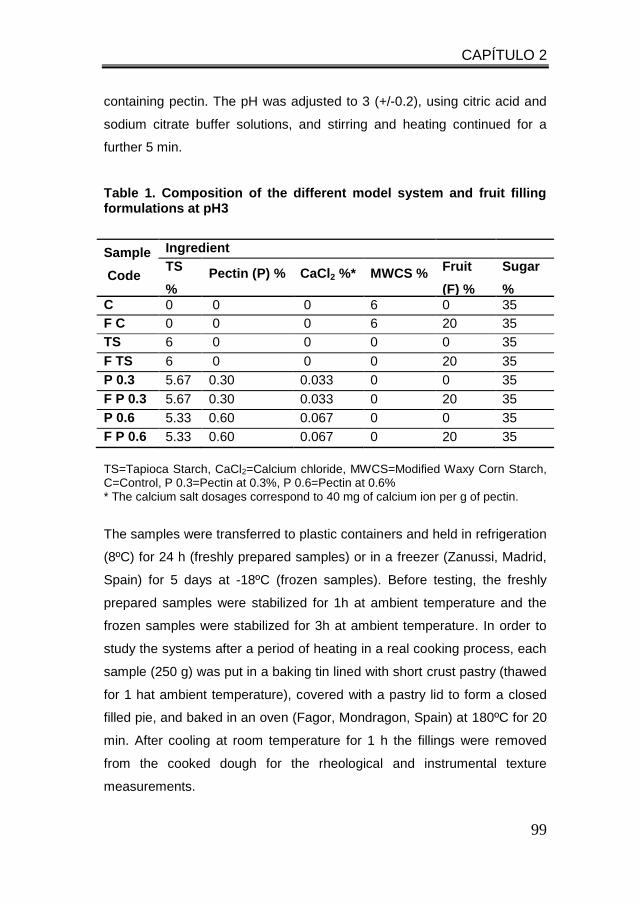
CAPÍTULO 2
99
containing pectin. The pH was adjusted to 3 (+/-0.2), using citric acid and
sodium citrate buffer solutions, and stirring and heating continued for a
further 5 min.
Table 1. Composition of the different model system and fruit filling formulations at pH3
Sample
Code
Ingredient
TS
%
Pectin (P) % CaCl2 %* MWCS % Fruit
(F) %
Sugar
% C 0 0 0 6 0 35
F C 0 0 0 6 20 35
TS 6 0 0 0 0 35
F TS 6 0 0 0 20 35
P 0.3 5.67 0.30 0.033 0 0 35
F P 0.3 5.67 0.30 0.033 0 20 35
P 0.6 5.33 0.60 0.067 0 0 35
F P 0.6 5.33 0.60 0.067 0 20 35
TS=Tapioca Starch, CaCl2=Calcium chloride, MWCS=Modified Waxy Corn Starch, C=Control, P 0.3=Pectin at 0.3%, P 0.6=Pectin at 0.6% * The calcium salt dosages correspond to 40 mg of calcium ion per g of pectin.
The samples were transferred to plastic containers and held in refrigeration
(8ºC) for 24 h (freshly prepared samples) or in a freezer (Zanussi, Madrid,
Spain) for 5 days at -18ºC (frozen samples). Before testing, the freshly
prepared samples were stabilized for 1h at ambient temperature and the
frozen samples were stabilized for 3h at ambient temperature. In order to
study the systems after a period of heating in a real cooking process, each
sample (250 g) was put in a baking tin lined with short crust pastry (thawed
for 1 hat ambient temperature), covered with a pastry lid to form a closed
filled pie, and baked in an oven (Fagor, Mondragon, Spain) at 180ºC for 20
min. After cooling at room temperature for 1 h the fillings were removed
from the cooked dough for the rheological and instrumental texture
measurements.
CAPÍTULO 2
100
2.3. Linear viscoelastic properties
The linear viscoelastic properties of the different filling samples were
studied with a controlled stress rheometer (AR-G2, TA Instruments,
Crawley, England) using serrated plate-plate geometry (60 mm diameter).
A gap of 1 mm was employed. Before measurements were taken, the
samples remained between the plates for a 10 min equilibration time. The
exposed edges of the samples were covered with silicon oil to avoid
sample drying during measurements. The measurements were carried out
at 20ºC. Strain sweeps were carried out to determine the linear viscoelastic
region, followed by frequency sweeps from 10 to 0.01 Hz at a strain
amplitude value inside the linear region. The storage modulus (G’), loss
modulus (G”) and loss tangent (tan= tan G”/G’) were recorded with TA
data analysis software (TA Instruments, Crawley, England). To simulate
the effect of heating during baking on the gel structure temperature,
sweeps were performed from 20 to 80ºC at a heating rate of 1.5ºC/min and
a strain amplitude of 0.005. The strain applied was selected to guarantee
the existence of linear viscoelastic response according to the previous
strain sweeps. The temperature sweep was stopped at 80ºC and after a 10
min temperature equilibration time the storage modulus (G’), loss modulus
(G”), and loss tangent (tan= tan G”/G’) values were recorded.
2.4. Extrusion test
The extrusion properties were measured with a texture analyser (TA-XT
Plus, Godalming, England) equipped with a 50-mm diameter back
extrusion cell (A/BE Back Extrusion Rig) with a 10mm gap between the
sample container and the disc plunger. The compression speed was 10
mm/s and the trigger point was 10 g. The duration of the test was set at 15
s (Arocas, Sanz, y Fiszman, 2009). The samples were placed in the
CAPÍTULO 2
101
extrusion cylinder and stabilized in a water bath at 25ºC for 10 min before
making the measurements. The force-displacement profiles were recorded
and the maximum extrusion force (Fmax, in N) as an index of firmness,
and the area under the curve (AUC, in N/s) as an index of consistency
were obtained (Cevoli, Balestra, Ragni, y Fabbri. 2013).
2.5. Syneresis
The method used was adapted from Arocas et al. (2009). Syneresis was
quantified 2 min after the extrusion test. The samplewas weighed and
transferred to a funnel lined with filter paper (Whatman 42) and the liquid
released was collected for 15 min. This method is intended to reduce the
degree of gel structure destruction that occurs with methods that use
centrifugation. Syneresis was expressed as the amount of liquid released
per 100 g of sample:
% Syneresis = (Weight of liquid released / Total initial weight of
sample)*100
2.6. Pie and tartlet preparation
To study the effect of real baking on the final texture of the fruit fillings (FC,
FTS, FP 0.3 and FP 0.6), two different products were prepared: filled pies
(closed system, Fig.1A) and filled tartlets (open system, Fig. 1B) in order to
know the fruit filling behaviour when submitted to different baking
conditions.
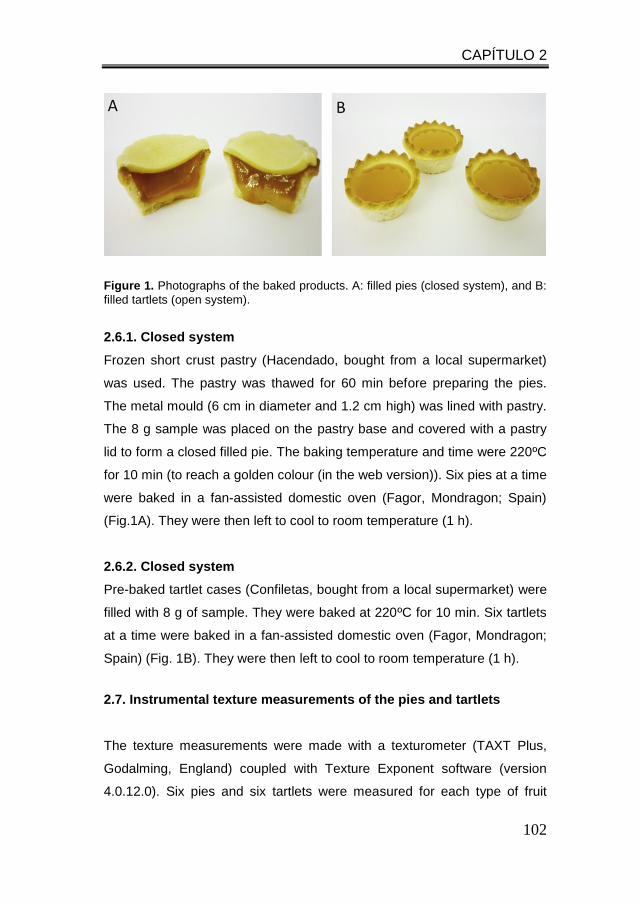
CAPÍTULO 2
102
Figure 1. Photographs of the baked products. A: filled pies (closed system), and B:
filled tartlets (open system).
2.6.1. Closed system
Frozen short crust pastry (Hacendado, bought from a local supermarket)
was used. The pastry was thawed for 60 min before preparing the pies.
The metal mould (6 cm in diameter and 1.2 cm high) was lined with pastry.
The 8 g sample was placed on the pastry base and covered with a pastry
lid to form a closed filled pie. The baking temperature and time were 220ºC
for 10 min (to reach a golden colour (in the web version)). Six pies at a time
were baked in a fan-assisted domestic oven (Fagor, Mondragon; Spain)
(Fig.1A). They were then left to cool to room temperature (1 h).
2.6.2. Closed system
Pre-baked tartlet cases (Confiletas, bought from a local supermarket) were
filled with 8 g of sample. They were baked at 220ºC for 10 min. Six tartlets
at a time were baked in a fan-assisted domestic oven (Fagor, Mondragon;
Spain) (Fig. 1B). They were then left to cool to room temperature (1 h).
2.7. Instrumental texture measurements of the pies and tartlets
The texture measurements were made with a texturometer (TAXT Plus,
Godalming, England) coupled with Texture Exponent software (version
4.0.12.0). Six pies and six tartlets were measured for each type of fruit
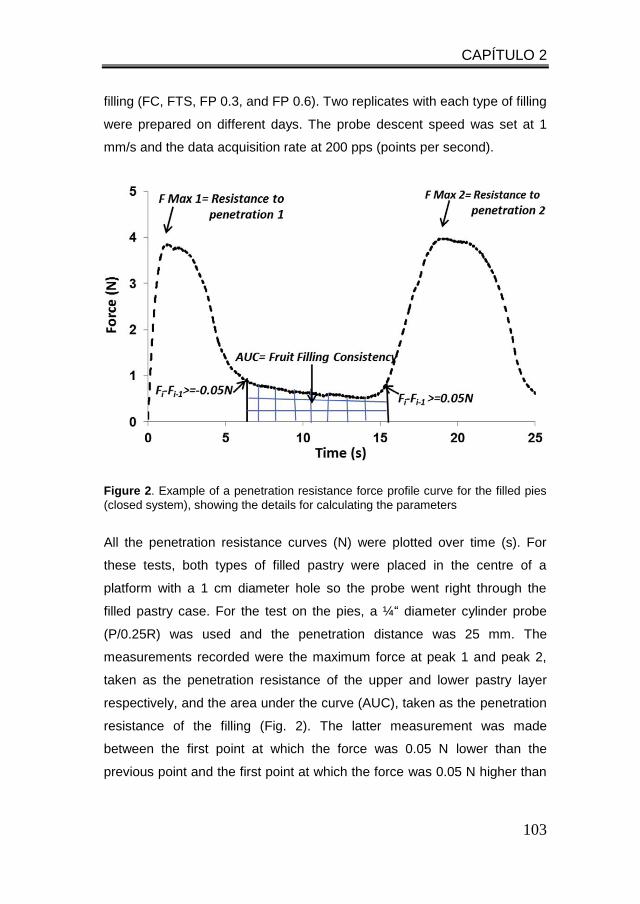
CAPÍTULO 2
103
filling (FC, FTS, FP 0.3, and FP 0.6). Two replicates with each type of filling
were prepared on different days. The probe descent speed was set at 1
mm/s and the data acquisition rate at 200 pps (points per second).
Figure 2. Example of a penetration resistance force profile curve for the filled pies
(closed system), showing the details for calculating the parameters
All the penetration resistance curves (N) were plotted over time (s). For
these tests, both types of filled pastry were placed in the centre of a
platform with a 1 cm diameter hole so the probe went right through the
filled pastry case. For the test on the pies, a ¼“ diameter cylinder probe
(P/0.25R) was used and the penetration distance was 25 mm. The
measurements recorded were the maximum force at peak 1 and peak 2,
taken as the penetration resistance of the upper and lower pastry layer
respectively, and the area under the curve (AUC), taken as the penetration
resistance of the filling (Fig. 2). The latter measurement was made
between the first point at which the force was 0.05 N lower than the
previous point and the first point at which the force was 0.05 N higher than
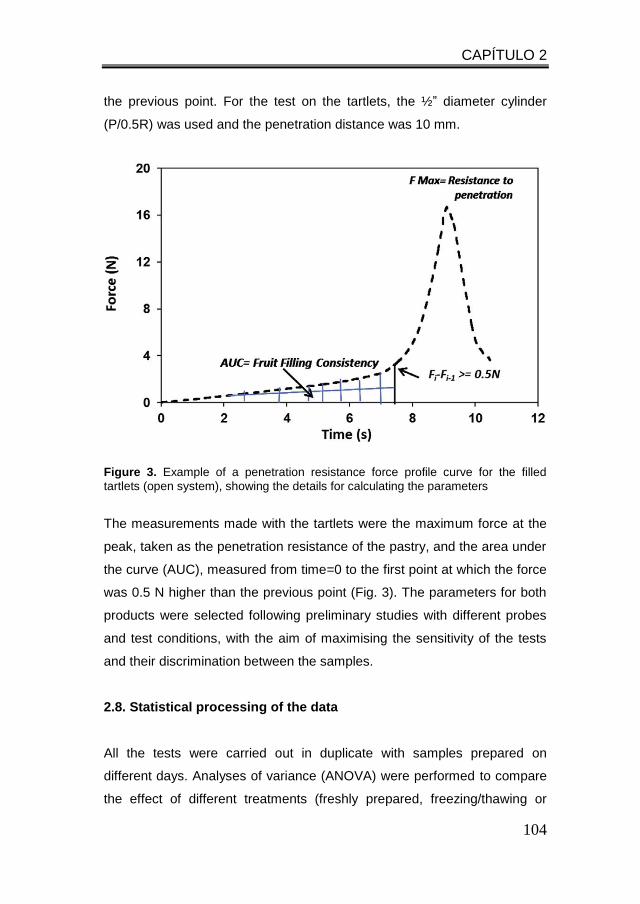
CAPÍTULO 2
104
the previous point. For the test on the tartlets, the ½” diameter cylinder
(P/0.5R) was used and the penetration distance was 10 mm.
Figure 3. Example of a penetration resistance force profile curve for the filled
tartlets (open system), showing the details for calculating the parameters
The measurements made with the tartlets were the maximum force at the
peak, taken as the penetration resistance of the pastry, and the area under
the curve (AUC), measured from time=0 to the first point at which the force
was 0.5 N higher than the previous point (Fig. 3). The parameters for both
products were selected following preliminary studies with different probes
and test conditions, with the aim of maximising the sensitivity of the tests
and their discrimination between the samples.
2.8. Statistical processing of the data
All the tests were carried out in duplicate with samples prepared on
different days. Analyses of variance (ANOVA) were performed to compare
the effect of different treatments (freshly prepared, freezing/thawing or
CAPÍTULO 2
105
baking) on the viscoelastic properties of samples C, TS, P 0.3 and P 0.6,
with and without fruit (Table 1). Tukey’s multiple comparison test was used
to analyse inter-group differences with a 95% confidence interval. These
analyses were performed with the XLSTAT statistics software package
(Addinsoft-Barcelona, Spain, version 2009, 4.03).
3. RESULTS AND DISCUSSION
3.1. Viscoelastic properties
Fig. 4 shows the mechanical spectra of the samples prepared with different
thickeners and no fruit (model system) for each of the treatments e freshly
prepared (Fig. 4A1), after a freeze/thaw cycle (Fig. 4A2) and after baking
(Fig. 4A3) e and of the samples prepared with these thickener systems and
fruit (fruit fillings) for each of the same treatments (Fig. 4B1, B2 and B3
respectively). Table 2 shows the viscoelastic parameter values for the
different thickening systems and treatments.
3.1.1. Freshly prepared model systems and freshly prepared fruit
Filling
As may be seen in Fig. 4A1 and Table 2, in the model systems without fruit
all the samples with the different thickeners showed gel behaviour, with G’
greater than G”. As expected, a considerable difference in structure was
observed between TS and C. The mechanical spectrum of TS, with G’
values only slightly higher than those of G” and quite frequency dependent,
reflected a weak gel structure with low viscoelasticity; C starch was more
viscoelastic, as it had significantly higher modulus values than the native
starch and the two moduli were further apart; these results coincide with
the results previously obtained by the authors (Agudelo et al., 2014). When
a non waxy native starch (as tapioca) is heated above the gelatinization
CAPÍTULO 2
106
temperature in the presence of excess water, the starch granules lose their
internal order and absorb the water. This causes a swelling of the granules
and a rise of the viscosity (Heyman, De Vos, Van der Meeren, y
Dewettinck, 2014) prior to their physical breakdown. On the other hand,
chemically cross-linked starches, as C, are commercially very popular,
because their strengthened granules can much better withstand the
elevated temperatures and high shear forces encountered in production
processes (Singh et al., 2007); the cross-linking treatment is intended to
add intra- and inter-molecular bonds at random locations in the starch
granule that stabilize and strengthen the granule.
A big improvement of the viscoelastic properties was obtained with the
system formed by TS and pectin (samples P 0.3 and P 0.6). Moreover,
when the concentration of pectin was increased the G’ and G” module
values rose and G” values less dependent of the frequency; G’ values drew
further away from G”, showing a firmer gel structure with greater elasticity.
This behaviour could be attributed to the pectin, which happened to have
the dominant role of the system, whereas the effect of the starch molecules
appeared to be additive; in addition, some ionic interaction between the
starch molecules and charged positions in the pectin molecules could not
be discarded. In other study (Galkowska et al., 2013), high-methoxyl pectin
and sucrose was added to modified starches in a concentration of 0.5
(wt%); these authors assumed that the rheology of the mixed systems was
mainly dominated by the behaviour of starch, since the results of the
dynamic rheological measurements indicated that pectin did not affect the
proportion of the elastic and viscous properties of the gels. However, in the
present case tan values were significantly lower in the systems containing
pectin, suggesting a potential change in the type and/or strength/number of
the interactions in gel network.
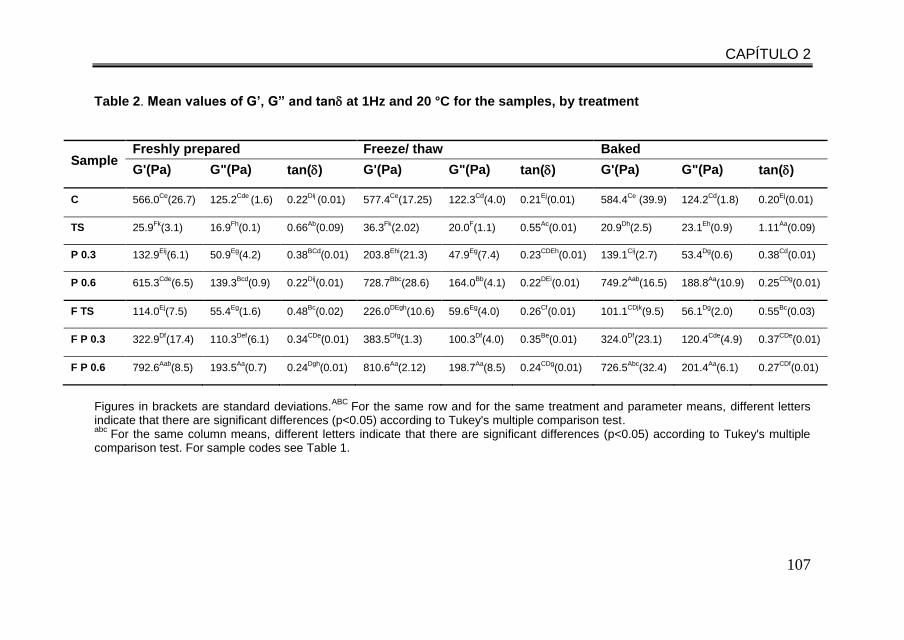
CAPÍTULO 2
107
Table 2. Mean values of G’, G” and tan at 1Hz and 20 °C for the samples, by treatment
Sample Freshly prepared Freeze/ thaw Baked
G'(Pa) G"(Pa) tan() G'(Pa) G"(Pa) tan() G'(Pa) G"(Pa) tan()
C 566.0Ce
(26.7)
125.2Cde
(1.6) 0.22Dij
(0.01) 577.4Ce
(17.25) 122.3Cd
(4.0) 0.21Ej
(0.01) 584.4Ce
(39.9) 124.2Cd
(1.8) 0.20Ej
(0.01)
TS 25.9Fk
(3.1) 16.9Fh
(0.1) 0.66Ab
(0.09) 36.3Fk
(2.02) 20.0F(1.1) 0.55
Ac(0.01) 20.9
Dh(2.5) 23.1
Eh(0.9) 1.11
Aa(0.09)
P 0.3 132.9Eij
(6.1) 50.9Eg
(4.2) 0.38BCd
(0.01) 203.8Ehi
(21.3) 47.9Eg
(7.4) 0.23CDEh
(0.01) 139.1Cij
(2.7) 53.4Dg
(0.6) 0.38Cd
(0.01)
P 0.6 615.3Cde
(6.5) 139.3Bcd
(0.9) 0.22Dij
(0.01) 728.7Bbc
(28.6) 164.0Bb
(4.1) 0.22DEi
(0.01) 749.2Aab
(16.5) 188.8Aa
(10.9) 0.25CDg
(0.01)
F TS 114.0Ej
(7.5) 55.4Eg
(1.6) 0.48Bc
(0.02) 226.0DEgh
(10.6) 59.6Eg
(4.0) 0.26Cf
(0.01) 101.1CDjk
(9.5) 56.1Dg
(2.0) 0.55Bc
(0.03)
F P 0.3 322.9Df
(17.4) 110.3Def
(6.1) 0.34CDe
(0.01) 383.5Dfg
(1.3) 100.3Df
(4.0) 0.35Be
(0.01) 324.0Df
(23.1) 120.4Cde
(4.9) 0.37CDe
(0.01)
F P 0.6 792.6Aab
(8.5) 193.5Aa
(0.7) 0.24Dgh
(0.01) 810.6Aa
(2.12) 198.7Aa
(8.5) 0.24CDg
(0.01) 726.5Abc
(32.4) 201.4Aa
(6.1) 0.27CDf
(0.01)
Figures in brackets are standard deviations.
ABC For the same row and for the same treatment and parameter means, different letters
indicate that there are significant differences (p<0.05) according to Tukey's multiple comparison test. abc
For the same column means, different letters indicate that there are significant differences (p<0.05) according to Tukey's multiple comparison test. For sample codes see Table 1.
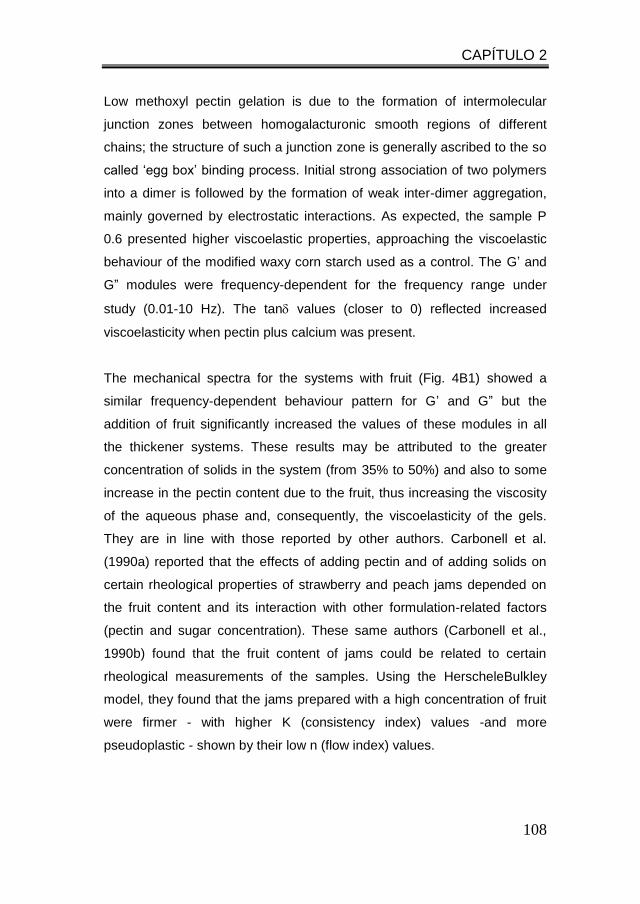
CAPÍTULO 2
108
Low methoxyl pectin gelation is due to the formation of intermolecular
junction zones between homogalacturonic smooth regions of different
chains; the structure of such a junction zone is generally ascribed to the so
called ‘egg box’ binding process. Initial strong association of two polymers
into a dimer is followed by the formation of weak inter-dimer aggregation,
mainly governed by electrostatic interactions. As expected, the sample P
0.6 presented higher viscoelastic properties, approaching the viscoelastic
behaviour of the modified waxy corn starch used as a control. The G’ and
G” modules were frequency-dependent for the frequency range under
study (0.01-10 Hz). The tan values (closer to 0) reflected increased
viscoelasticity when pectin plus calcium was present.
The mechanical spectra for the systems with fruit (Fig. 4B1) showed a
similar frequency-dependent behaviour pattern for G’ and G” but the
addition of fruit significantly increased the values of these modules in all
the thickener systems. These results may be attributed to the greater
concentration of solids in the system (from 35% to 50%) and also to some
increase in the pectin content due to the fruit, thus increasing the viscosity
of the aqueous phase and, consequently, the viscoelasticity of the gels.
They are in line with those reported by other authors. Carbonell et al.
(1990a) reported that the effects of adding pectin and of adding solids on
certain rheological properties of strawberry and peach jams depended on
the fruit content and its interaction with other formulation-related factors
(pectin and sugar concentration). These same authors (Carbonell et al.,
1990b) found that the fruit content of jams could be related to certain
rheological measurements of the samples. Using the HerscheleBulkley
model, they found that the jams prepared with a high concentration of fruit
were firmer - with higher K (consistency index) values -and more
pseudoplastic - shown by their low n (flow index) values.
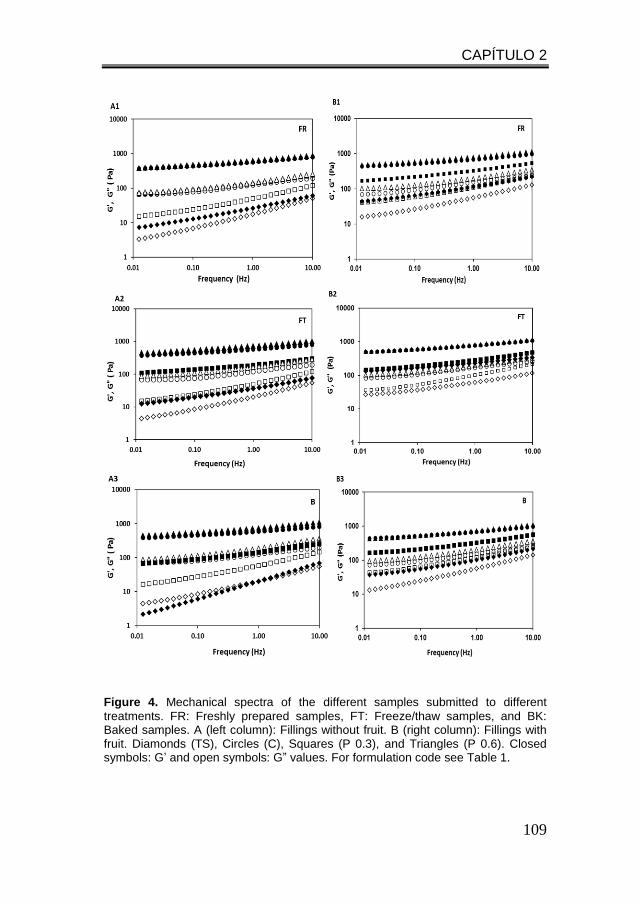
CAPÍTULO 2
109
Figure 4. Mechanical spectra of the different samples submitted to different
treatments. FR: Freshly prepared samples, FT: Freeze/thaw samples, and BK: Baked samples. A (left column): Fillings without fruit. B (right column): Fillings with fruit. Diamonds (TS), Circles (C), Squares (P 0.3), and Triangles (P 0.6). Closed symbols: G’ and open symbols: G” values. For formulation code see Table 1.
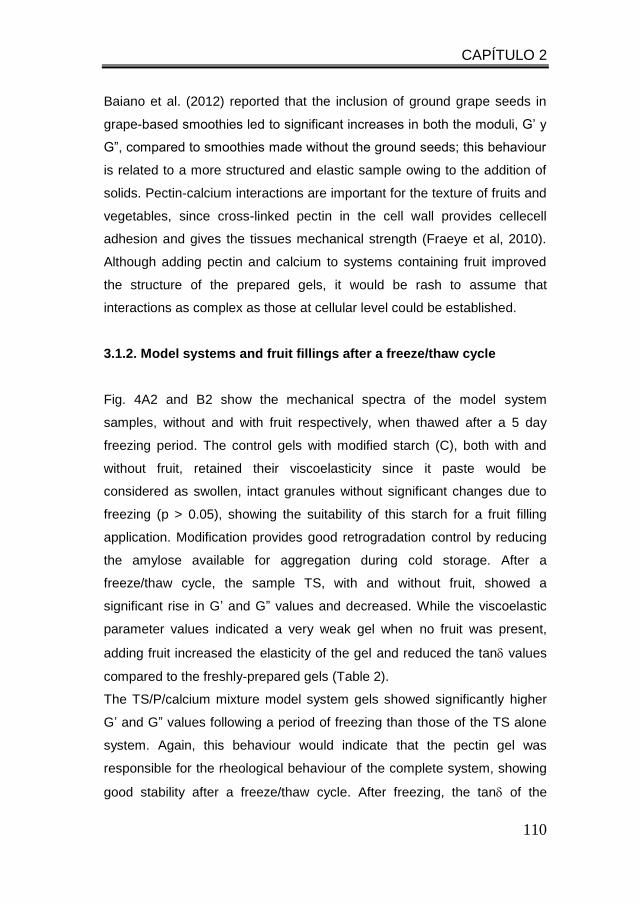
CAPÍTULO 2
110
Baiano et al. (2012) reported that the inclusion of ground grape seeds in
grape-based smoothies led to significant increases in both the moduli, G’ y
G”, compared to smoothies made without the ground seeds; this behaviour
is related to a more structured and elastic sample owing to the addition of
solids. Pectin-calcium interactions are important for the texture of fruits and
vegetables, since cross-linked pectin in the cell wall provides cellecell
adhesion and gives the tissues mechanical strength (Fraeye et al, 2010).
Although adding pectin and calcium to systems containing fruit improved
the structure of the prepared gels, it would be rash to assume that
interactions as complex as those at cellular level could be established.
3.1.2. Model systems and fruit fillings after a freeze/thaw cycle
Fig. 4A2 and B2 show the mechanical spectra of the model system
samples, without and with fruit respectively, when thawed after a 5 day
freezing period. The control gels with modified starch (C), both with and
without fruit, retained their viscoelasticity since it paste would be
considered as swollen, intact granules without significant changes due to
freezing (p > 0.05), showing the suitability of this starch for a fruit filling
application. Modification provides good retrogradation control by reducing
the amylose available for aggregation during cold storage. After a
freeze/thaw cycle, the sample TS, with and without fruit, showed a
significant rise in G’ and G” values and decreased. While the viscoelastic
parameter values indicated a very weak gel when no fruit was present,
adding fruit increased the elasticity of the gel and reduced the tan values
compared to the freshly-prepared gels (Table 2).
The TS/P/calcium mixture model system gels showed significantly higher
G’ and G” values following a period of freezing than those of the TS alone
system. Again, this behaviour would indicate that the pectin gel was
responsible for the rheological behaviour of the complete system, showing
good stability after a freeze/thaw cycle. After freezing, the tan of the
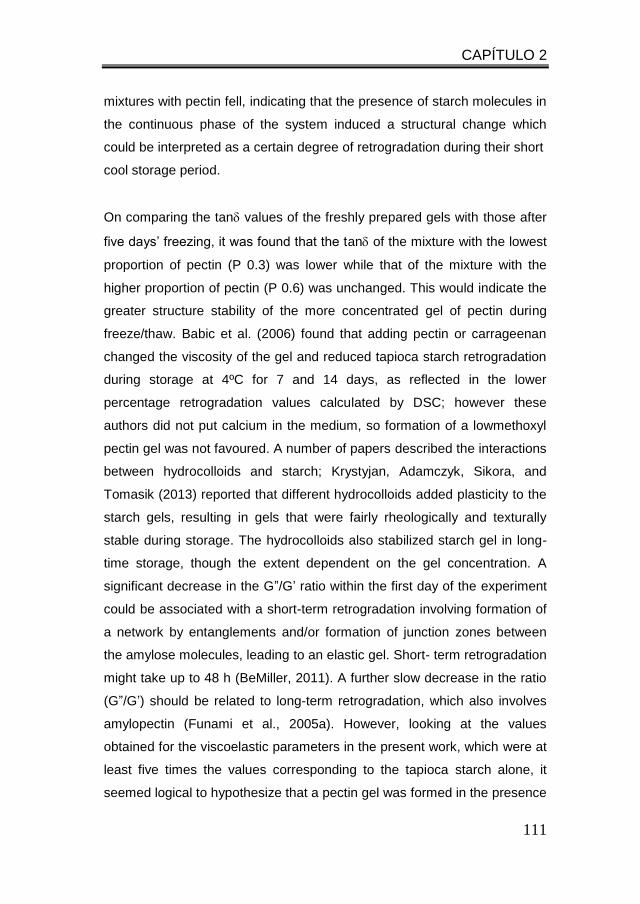
CAPÍTULO 2
111
mixtures with pectin fell, indicating that the presence of starch molecules in
the continuous phase of the system induced a structural change which
could be interpreted as a certain degree of retrogradation during their short
cool storage period.
On comparing the tan values of the freshly prepared gels with those after
five days’ freezing, it was found that the tan of the mixture with the lowest
proportion of pectin (P 0.3) was lower while that of the mixture with the
higher proportion of pectin (P 0.6) was unchanged. This would indicate the
greater structure stability of the more concentrated gel of pectin during
freeze/thaw. Babic et al. (2006) found that adding pectin or carrageenan
changed the viscosity of the gel and reduced tapioca starch retrogradation
during storage at 4ºC for 7 and 14 days, as reflected in the lower
percentage retrogradation values calculated by DSC; however these
authors did not put calcium in the medium, so formation of a lowmethoxyl
pectin gel was not favoured. A number of papers described the interactions
between hydrocolloids and starch; Krystyjan, Adamczyk, Sikora, and
Tomasik (2013) reported that different hydrocolloids added plasticity to the
starch gels, resulting in gels that were fairly rheologically and texturally
stable during storage. The hydrocolloids also stabilized starch gel in long-
time storage, though the extent dependent on the gel concentration. A
significant decrease in the G”/G’ ratio within the first day of the experiment
could be associated with a short-term retrogradation involving formation of
a network by entanglements and/or formation of junction zones between
the amylose molecules, leading to an elastic gel. Short- term retrogradation
might take up to 48 h (BeMiller, 2011). A further slow decrease in the ratio
(G”/G’) should be related to long-term retrogradation, which also involves
amylopectin (Funami et al., 2005a). However, looking at the values
obtained for the viscoelastic parameters in the present work, which were at
least five times the values corresponding to the tapioca starch alone, it
seemed logical to hypothesize that a pectin gel was formed in the presence
CAPÍTULO 2
112
of calcium ions and the tapioca starch molecules reinforced the pectin
network acting as a filler or establishing junction points via ionic
interactions. Scarce references to starch/pectin systems could be found.
The effect of oxidized starch on the networks formed by low-methoxy
pectin (2.0 wt %), on cooling has been explored by rheological
measurements. At low concentrations of Ca2+, incorporation of increasing
concentrations of starch (across the range 0-30 wt%) causes a progressive
increase in modulus G’, attributed to segregative interactions between the
two polymers promoting conversion of pectin from the expanded coil
conformation to a more compact associated form (Picout, Richardson,
Rolin, Abeysekera, y Morris, 2000). Some other papers studied the effect
of pectin addition to the properties of starch pastes (Babic et al., 2006;
Witczak, Witczak, y Ziobro, 2013); however, in these papers the pectin did
not meet the requirements to form a gel per se. It is also important to note
that the gels used in the present study contained sugar, as several authors
have shown that sugars have an anti-ageing effect, inhibit retrogradation
and are also cryoprotective of systems containing starch. Aee, Hiea, and
Nishinari (1998) found that the retrogradation ratio (retrogradation enthalpy
after 14 days’ storage compared to the initial gelatinization enthalpy) of
corn starch systems to which different concentrations of sugar had been
added increased with time, and was smaller for gels with a higher sucrose
content. In a short storage time, the effect of sucrose on the retrogradation
ratio is not so dependent on sucrose concentration. It has been reported
that retrogradation consists of two separable processes. The first stage is
governed by the gelation of amylose solubilized during gelatinization and
the second stage is induced by the recrystallization of amylopectin within
the gelatinized granules. Since the retrogradation enthalpy is not so
dependent on the concentration of sucrose in samples stored for one day,
and is strongly dependent on the concentration of sucrose in samples
stored for 14 days, the antistaling effect of sucrose should be more
important for the interaction of sucrose with amylopectin than for its
CAPÍTULO 2
113
interaction with amylose. When the fruit was added, the viscoelasticity of all
the systems increased. Specifically in the systems containing pectin,
greater structural stability was observed after the freezing period (tan
values unchanged). This may be attributed to the solids added to the
system, as discussed above. The structure development rate (poise/min) of
pectin gels increased at a lower temperature and higher pectin
concentration, as also reported by Thakur, Singh, Handa, and Rao (1997).
3.1.3. Model system and fruit fillings after baking
Of the 250 g gel samples baked in pastry cases (see Section 2.2), those
prepared with TS alone, with or without fruit, could immediately be seen to
have quite a liquid consistency, making the pastries difficult to handle
before and after baking, as some opened and their filling ran out. The
behaviour of the fillings made with modified starch (C) and the
TS/P/calcium mixtures was better, as after baking they were found to have
gelled well. The gels prepared with TS, the worst-affected by baking,
presented fluid behaviour with G” values higher than G’ and a tan of 1.11
(Fig. 4A3, without fruit, and B3, with fruit), indicating a structure with
predominantly viscous behaviour. Adding fruit improved the structure,
achieving gels with similar characteristics to those of the TS gels when
freshly prepared or after one freezing cycle, so TS might work in fruit filling
applications at certain fruit concentrations. The gels made with modified
starch (C), with and without fruit, showed no significant changes in the G’
and G” module values after baking: as expected, this starch displayed the
greatest resistance (fewest changes) during baking. The TS and pectin
mixtures without fruit showed a slight but significant rise in tan after
baking, sowing some higher contribution of the viscous component. When
fruit was added, the structure of the system remained stable. There were
no significant changes in the viscoelasticity parameters of these mixtures,
which could indicate that combinations of native tapioca starch and pectin

CAPÍTULO 2
114
are a good option for formulating fruit fillings which are stable at baking
temperatures.
3.2. Effect of heating ramps on the rheological properties of freshly
prepared or frozen/thawed samples
Fig. 5 shows the changes in G’ and G” as the temperature rose from 20ºC
to 80ºC at a frequency of 1 Hz (Fig. 5A, without fruit, and B, with fruit). The
modified starch (C) behaved differently from the other gels made with
native tapioca starch alone or the mixed system with pectin, as the G’ and
G” values of C were not affected by temperatures in the 20ºC-80ºC
temperature range, either when freshly prepared (Fig. 5A1 and B1) or after
freezing/thawing (Fig. 5A2 and B2), and it presented very constant values
in all the treatments. In the case of native TS, the G’ and G” modules
decreased as the temperature rose and their values drew closer from 50ºC
onwards, indicating that the gel became increasingly liquid as the
temperature rose. In the mixed system with pectin, only a slight fall in the
viscoelasticity modules, G’ and G”, was observed as the temperature rose.
The effect was smaller in the system containing 0.6% pectin and tapioca
starch. These results show the good thickening and heat-resistance
properties of the C starch and the P 0.6 which is a mixture of pectin and
tapioca starch. They are in accordance with those reported by Arocas et al.
(2009), who found different behaviour between modified and native starch-
based sauces: in the modified starch sauces, whether freshly prepared or
frozen/thawed, increasing the temperature from 20 to 80ºC did not affect
the values of either G’ or G” . However, in the freshly prepared native
starch sauces a slight decrease in the values of the viscoelastic moduli
was observed. In the native starch a predominance of G” versus G’
occurred from 40ºC onwards. The behaviour of the gels examined in the
present study also showed a tendency to Arrhenius behaviour for TS and
TS/pectin mixtures and it was found that their temperature dependence fell
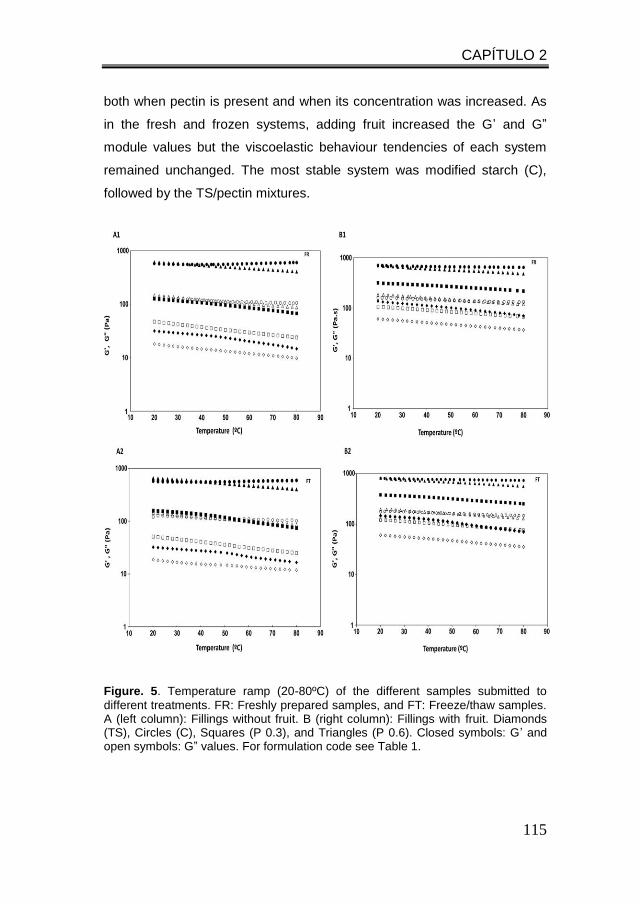
CAPÍTULO 2
115
both when pectin is present and when its concentration was increased. As
in the fresh and frozen systems, adding fruit increased the G’ and G”
module values but the viscoelastic behaviour tendencies of each system
remained unchanged. The most stable system was modified starch (C),
followed by the TS/pectin mixtures.
Figure. 5. Temperature ramp (20-80ºC) of the different samples submitted to
different treatments. FR: Freshly prepared samples, and FT: Freeze/thaw samples. A (left column): Fillings without fruit. B (right column): Fillings with fruit. Diamonds (TS), Circles (C), Squares (P 0.3), and Triangles (P 0.6). Closed symbols: G’ and open symbols: G” values. For formulation code see Table 1.
CAPÍTULO 2
116
3.3. Extrusion properties of the model systems and fruit fillings
subjected to the different treatments
Extrusion tests have demonstrated to be a good tool to evaluate the
consistency of semisolid systems. The values that were taken as
representative from the extrusion force profiles with time, were the
maximum force (Fmax), as an index of initial resistance to extrusion, and
the area under the curve (AUC) or extrusion work as an index of system
consistency (Angioloni y Collar, 2009; Cevoli, Balestra, Ragni, y Fabbri.
2013). They were measured for all the filling formulations, without fruit (Fig.
6A) and with fruit (Fig. 6B), with all the treatments: freshly prepared,
frozen/thawed and baked (Table 3). The pectin/tapioca starch blend
displayed the greatest firmness and consistency in all the treatments e
freshly-prepared, frozen and baked, followed by C then TS alone, which
presented the least resistance to extrusion. Both Fmax and AUC increased
significantly with the higher P concentration (Fig. 6A).
The same trend was found on comparing the systems with fruit (Fig. 6B),
which all had significantly higher parameter values than the same systems
without fruit. Adding fruit increased the consistency and resistance to
extrusion of the samples because of the solids added by the fruit and
possible interactions with the pectin, as commented earlier.
Duran, Costell, lzquierdo, and Duran (1994) studied the influence of
formulation on the texture of low-sugar bakery jams gelled with gellan
gume guar gum mixtures and found significant effects depending on the
gum type and concentration, the fruit, and their interaction. Adding gellan
gum and peach pulp increased the hardness (measured as the load
required for gel rupture) and rigidity (measured as the ratio of load required
for gel rupture to distance penetrated at rupture) in a single cycle puncture
test.
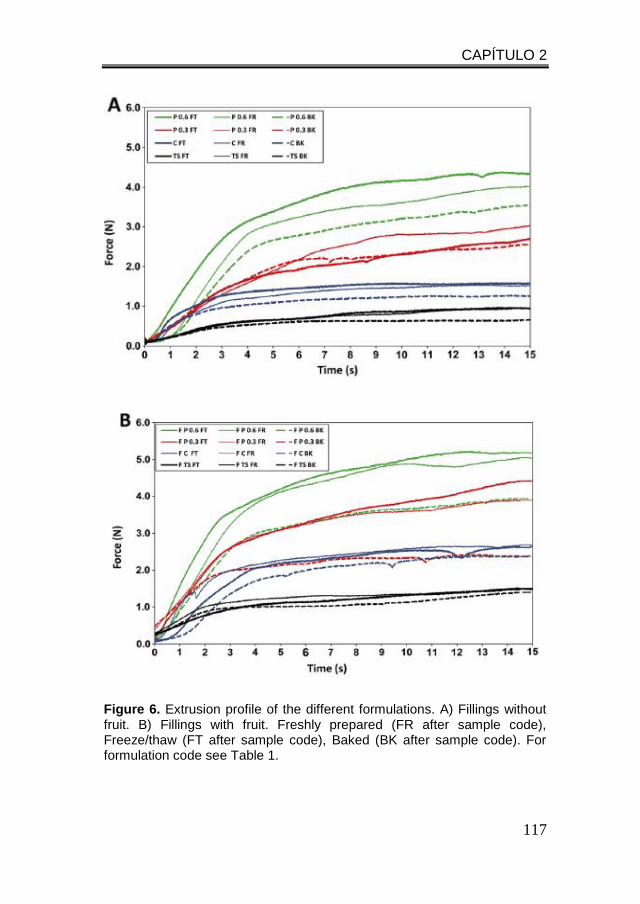
CAPÍTULO 2
117
Figure 6. Extrusion profile of the different formulations. A) Fillings without fruit. B) Fillings with fruit. Freshly prepared (FR after sample code), Freeze/thaw (FT after sample code), Baked (BK after sample code). For formulation code see Table 1.
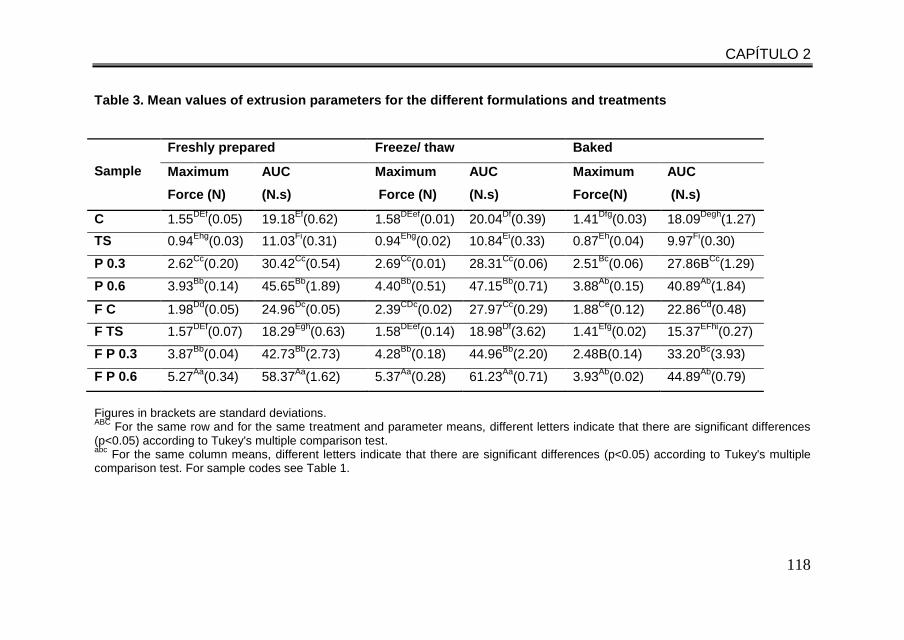
CAPÍTULO 2
118
Table 3. Mean values of extrusion parameters for the different formulations and treatments
Sample
Freshly prepared Freeze/ thaw Baked
Maximum
Force (N)
AUC
(N.s)
Maximum
Force (N)
AUC
(N.s)
Maximum
Force(N)
AUC
(N.s)
C 1.55DEf
(0.05) 19.18Ef
(0.62) 1.58DEef
(0.01) 20.04Df
(0.39) 1.41Dfg
(0.03) 18.09Degh
(1.27)
TS 0.94Ehg
(0.03) 11.03Fi(0.31) 0.94
Ehg(0.02) 10.84
Ei(0.33) 0.87
Eh(0.04) 9.97
Fi(0.30)
P 0.3 2.62Cc
(0.20) 30.42Cc
(0.54) 2.69Cc
(0.01) 28.31Cc
(0.06) 2.51Bc
(0.06) 27.86BCc
(1.29)
P 0.6 3.93Bb
(0.14) 45.65Bb
(1.89) 4.40Bb
(0.51) 47.15Bb
(0.71) 3.88Ab
(0.15) 40.89Ab
(1.84)
F C 1.98Dd
(0.05) 24.96Dc
(0.05) 2.39CDc
(0.02) 27.97Cc
(0.29) 1.88Ce
(0.12) 22.86Cd
(0.48)
F TS 1.57DEf
(0.07) 18.29Egh
(0.63) 1.58DEef
(0.14) 18.98Df
(3.62) 1.41Efg
(0.02) 15.37EFhi
(0.27)
F P 0.3 3.87Bb
(0.04) 42.73Bb
(2.73) 4.28Bb
(0.18) 44.96Bb
(2.20) 2.48B(0.14) 33.20Bc
(3.93)
F P 0.6 5.27Aa
(0.34) 58.37Aa
(1.62) 5.37Aa
(0.28) 61.23Aa
(0.71) 3.93Ab
(0.02) 44.89Ab
(0.79)
Figures in brackets are standard deviations. ABC
For the same row and for the same treatment and parameter means, different letters indicate that there are significant differences (p<0.05) according to Tukey's multiple comparison test. abc
For the same column means, different letters indicate that there are significant differences (p<0.05) according to Tukey's multiple comparison test. For sample codes see Table 1.
CAPÍTULO 2
119
There were no significant differences in the hardness and stiffness of the
fillings at low gellan gum concentrations with different fruit pulp contents
(40%, 50% and 60%), an effect they also observed in the control system
(traditional jams with high methoxyl pectin). Fiszman and Durán (1992)
encountered a different effect: that adding fruit to different polysaccharide
gel systems (kappa-carrageenan and kappa-carrageenan plus alginate,
with or without sugar) led to a weakening of the system’s structure as
measured by a lower peak rupture force and deformability. They attributed
the weakening to possible mechanical interference of the fruit tissue
particles with hydrocolloid molecules in the formation of the basic
carrageenan network. Measurements of extrusion leading to gel rupture
contribute information on behaviour under high deformation forces. They
confirmed the results obtained at low deformation forces (see Section 3.1),
showing that the consistency and strength of the gel rose slightly with the
freezing/thawing process and fell with the baking process. They also
confirmed that adding fruit strengthened the structure of the gels.
3.4. Syneresis
Freeze/thaw stability is also important in the frozen pastry industry, as it
represents the ability of a product to maintain its composition and integrity
during storage and distribution. The liquid released within the product
causes larger ice crystals to form after freezing, leading to the breakdown
of the structure (Chantaro y Pongsawatmanit, 2010). The samples
prepared and analysed in the present study (35% sugar) showed no
syneresis either when fresh or after the freezing/thawing or baking
treatments. In preliminary tests the gels prepared with 6% tapioca starch
and no sugar or pectin did display syneresis (results not shown). Chantaro
and Pongsawatmanit (2010), also working with tapioca starch, found that
water separation (syneresis) of TS and TS/xanthan pastes increased with
the number of freeze-thaw cycles and the heating time before freezing,
CAPÍTULO 2
120
confirming the higher breakdown of starch molecules. However, the TS
pastes containing xanthan gum exhibited lower water separation (p < 0.05)
compared with those made with TS alone.
The absence of syneresis in the present study confirms that sugars act as
cryoprotectants. In Kim, Yoo, Cornillon, and Lim (2004), low molecular
weight sugars or sugar alcohols acted as cryoprotectants by depressing
the ice melting temperature and by increasing the solid glass content. The
unfrozen liquid level depended on the sugar structure. The availability of
the hydroxyl groups and structural flexibility in the sugar molecules
appeared to be among the attributes determining the unfrozen liquid level.
The absence of syneresis in the TS/pectin mixtures is an improvement on
the behaviour of the gels with pectin alone, for which syneresis problems
have been reported. Young et al. (2003) found syneresis in fruit fillings
prepared with low methoxyl pectin with a high solids content (65%) at pH
levels of between 3.4 and 3.7. Grujic, Grujic, and Poljasevic (2010) studied
the effects of different gelling agents in heat-stable jams for doughnut
fillings and encountered syneresis in some of the formulae that contained
low methoxyl pectin and CaCl2. They associated this phenomenon with the
type of fruit, calcium concentration and final pH, which are important
factors for appropriate gel stability.
3.5. Application to fruit fillings in closed systems (pies) and open
systems (tartlets)
In view of the scanty information on methods for analysing this type of
filled product, preliminary instrumental texture measurement tests were
carried out, the methodology was developed and the experimental
conditions that best discriminated between the samples of the two types of
filled pastry case (open system and close system) were chosen. The
preliminary tests included penetration with an incisor-shaped probe (upper
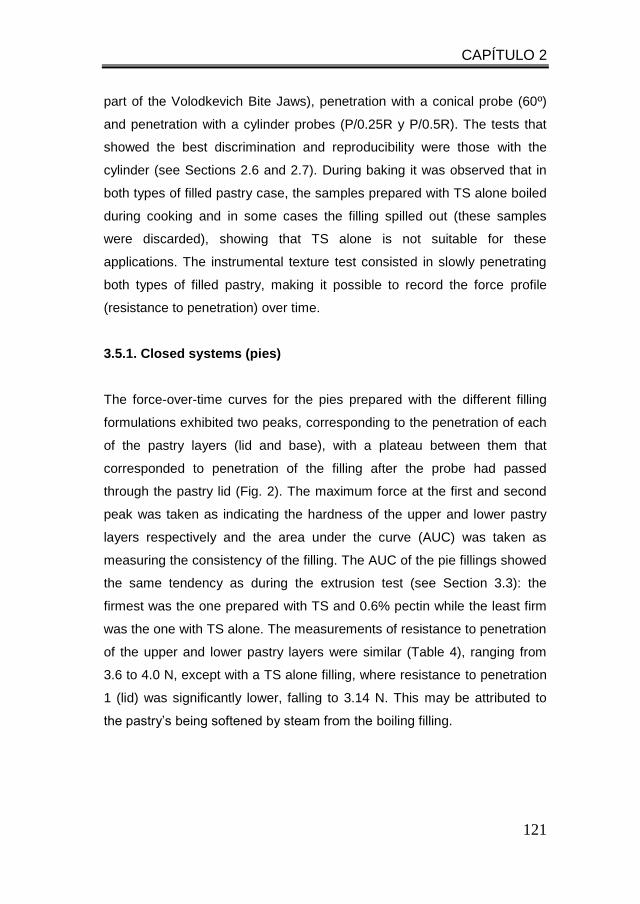
CAPÍTULO 2
121
part of the Volodkevich Bite Jaws), penetration with a conical probe (60º)
and penetration with a cylinder probes (P/0.25R y P/0.5R). The tests that
showed the best discrimination and reproducibility were those with the
cylinder (see Sections 2.6 and 2.7). During baking it was observed that in
both types of filled pastry case, the samples prepared with TS alone boiled
during cooking and in some cases the filling spilled out (these samples
were discarded), showing that TS alone is not suitable for these
applications. The instrumental texture test consisted in slowly penetrating
both types of filled pastry, making it possible to record the force profile
(resistance to penetration) over time.
3.5.1. Closed systems (pies)
The force-over-time curves for the pies prepared with the different filling
formulations exhibited two peaks, corresponding to the penetration of each
of the pastry layers (lid and base), with a plateau between them that
corresponded to penetration of the filling after the probe had passed
through the pastry lid (Fig. 2). The maximum force at the first and second
peak was taken as indicating the hardness of the upper and lower pastry
layers respectively and the area under the curve (AUC) was taken as
measuring the consistency of the filling. The AUC of the pie fillings showed
the same tendency as during the extrusion test (see Section 3.3): the
firmest was the one prepared with TS and 0.6% pectin while the least firm
was the one with TS alone. The measurements of resistance to penetration
of the upper and lower pastry layers were similar (Table 4), ranging from
3.6 to 4.0 N, except with a TS alone filling, where resistance to penetration
1 (lid) was significantly lower, falling to 3.14 N. This may be attributed to
the pastry’s being softened by steam from the boiling filling.
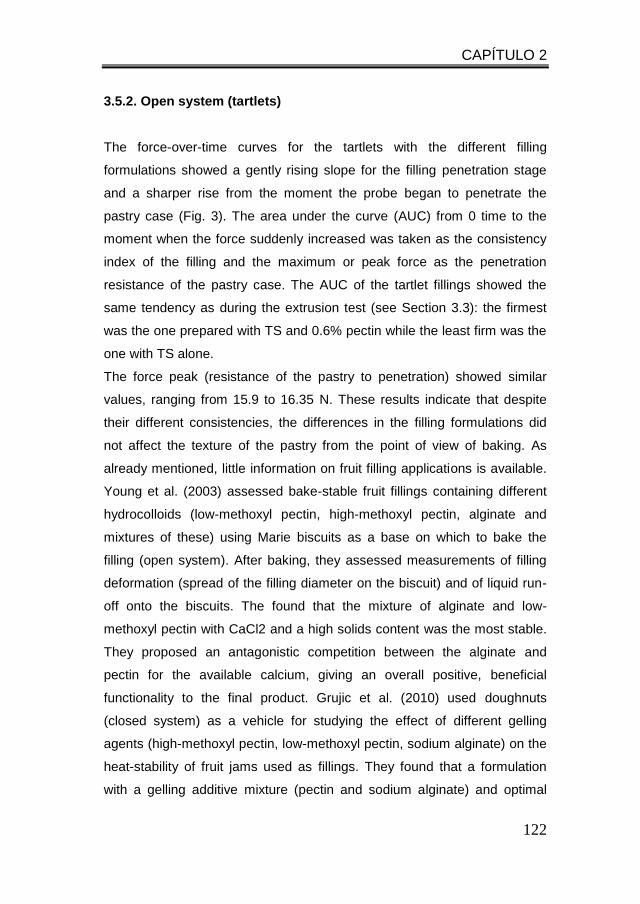
CAPÍTULO 2
122
3.5.2. Open system (tartlets)
The force-over-time curves for the tartlets with the different filling
formulations showed a gently rising slope for the filling penetration stage
and a sharper rise from the moment the probe began to penetrate the
pastry case (Fig. 3). The area under the curve (AUC) from 0 time to the
moment when the force suddenly increased was taken as the consistency
index of the filling and the maximum or peak force as the penetration
resistance of the pastry case. The AUC of the tartlet fillings showed the
same tendency as during the extrusion test (see Section 3.3): the firmest
was the one prepared with TS and 0.6% pectin while the least firm was the
one with TS alone.
The force peak (resistance of the pastry to penetration) showed similar
values, ranging from 15.9 to 16.35 N. These results indicate that despite
their different consistencies, the differences in the filling formulations did
not affect the texture of the pastry from the point of view of baking. As
already mentioned, little information on fruit filling applications is available.
Young et al. (2003) assessed bake-stable fruit fillings containing different
hydrocolloids (low-methoxyl pectin, high-methoxyl pectin, alginate and
mixtures of these) using Marie biscuits as a base on which to bake the
filling (open system). After baking, they assessed measurements of filling
deformation (spread of the filling diameter on the biscuit) and of liquid run-
off onto the biscuits. The found that the mixture of alginate and low-
methoxyl pectin with CaCl2 and a high solids content was the most stable.
They proposed an antagonistic competition between the alginate and
pectin for the available calcium, giving an overall positive, beneficial
functionality to the final product. Grujic et al. (2010) used doughnuts
(closed system) as a vehicle for studying the effect of different gelling
agents (high-methoxyl pectin, low-methoxyl pectin, sodium alginate) on the
heat-stability of fruit jams used as fillings. They found that a formulation
with a gelling additive mixture (pectin and sodium alginate) and optimal
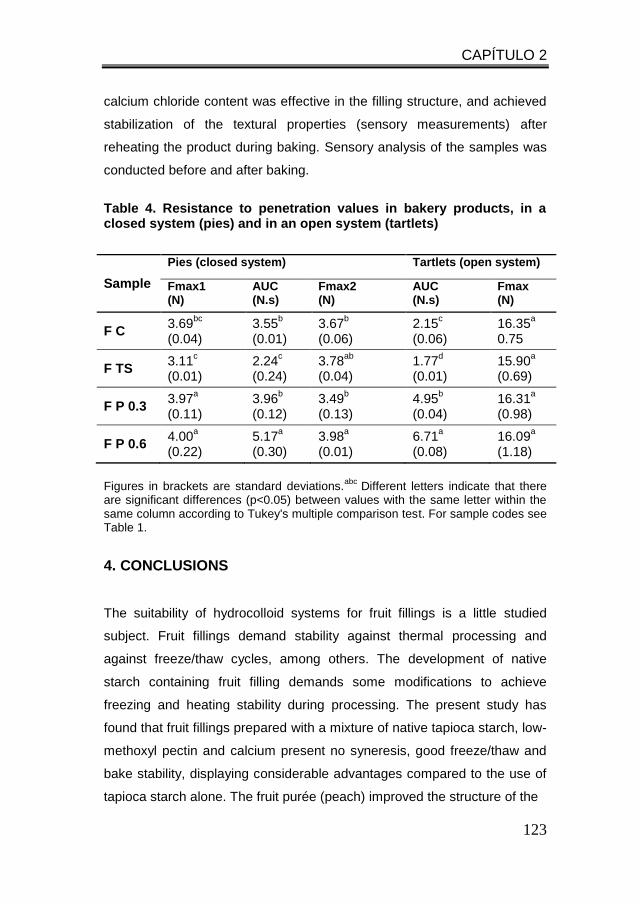
CAPÍTULO 2
123
calcium chloride content was effective in the filling structure, and achieved
stabilization of the textural properties (sensory measurements) after
reheating the product during baking. Sensory analysis of the samples was
conducted before and after baking.
Table 4. Resistance to penetration values in bakery products, in a closed system (pies) and in an open system (tartlets)
Sample
Pies (closed system) Tartlets (open system)
Fmax1 (N)
AUC (N.s)
Fmax2 (N)
AUC (N.s)
Fmax (N)
F C 3.69
bc
(0.04) 3.55
b
(0.01) 3.67
b
(0.06) 2.15
c
(0.06) 16.35
a
0.75
F TS 3.11
c
(0.01) 2.24
c
(0.24) 3.78
ab
(0.04) 1.77
d
(0.01) 15.90
a
(0.69)
F P 0.3 3.97
a
(0.11) 3.96
b
(0.12) 3.49
b
(0.13) 4.95
b
(0.04) 16.31
a
(0.98)
F P 0.6 4.00
a
(0.22) 5.17
a
(0.30) 3.98
a
(0.01) 6.71
a
(0.08) 16.09
a
(1.18)
Figures in brackets are standard deviations.
abc Different letters indicate that there
are significant differences (p<0.05) between values with the same letter within the same column according to Tukey's multiple comparison test. For sample codes see Table 1.
4. CONCLUSIONS
The suitability of hydrocolloid systems for fruit fillings is a little studied
subject. Fruit fillings demand stability against thermal processing and
against freeze/thaw cycles, among others. The development of native
starch containing fruit filling demands some modifications to achieve
freezing and heating stability during processing. The present study has
found that fruit fillings prepared with a mixture of native tapioca starch, low-
methoxyl pectin and calcium present no syneresis, good freeze/thaw and
bake stability, displaying considerable advantages compared to the use of
tapioca starch alone. The fruit purée (peach) improved the structure of the
CAPÍTULO 2
124
fillings and the baking tests with two real applications (open and closed
filled pastry cases) confirmed the viability of the proposed system, which
even presented advantages compared to the control.
REFERENCES
Aee, L.H., Hiea, K.M., y Nishinari, K. (1998). DSC and rheological studies of the
effects of sucrose on the gelatinization and retrogradation of acorn starch.
Thermochimica Acta, 322, 39-46.
Agudelo, A., Varela, P., Sanz, T., y Fiszman S.M. (2014). Native tapioca starch as
a potential thickener for fruit fillings.Evaluation of mixed models containing low-
methoxyl pectin. Food hydrocolloids, 35, 297-304.
Alloncle, M., Lefebvre, J., Llamas, G., y Doublier, J. L. (1989). A Rheological
Characterization of Cereal Starch-Galactomannan Mixtures. Cereal Chemistry
journal, 66(2), 90-93.
Angioloni, A., y Collar, C. (2009). Small and large deformation viscoelastic
behaviour of selected fibre blends with gelling properties. Food Hydrocolloids,
23, 742-748.
Arocas, A., Sanz, T., y Fiszman, S. M. (2009). Influence of corn starch type on the
rheological properties of a white sauce after heating and freezing. Food
Hydrocolloids, 23, 901-907.
Babic, J., Subaric, D., Ackar, D., Pilizota, V., Kopjar, M., y Nedic, N. (2006). Effects
of pectin and carrageenan on thermophysical and rheological properties of
tapioca starch. Czech Journal of Food Sciences, 24, 275-282.
Baiano, A., Mastromatteo, M., y Del Nobile, M.A. (2012). Effects of Cultivar and
Process Variables on Dynamic-Mechanical and Sensorial Behavior of Value-
Added Grape-Based Smoothies. Molecules, 17, 11421-11434;
doi:10.3390/molecules 171011421
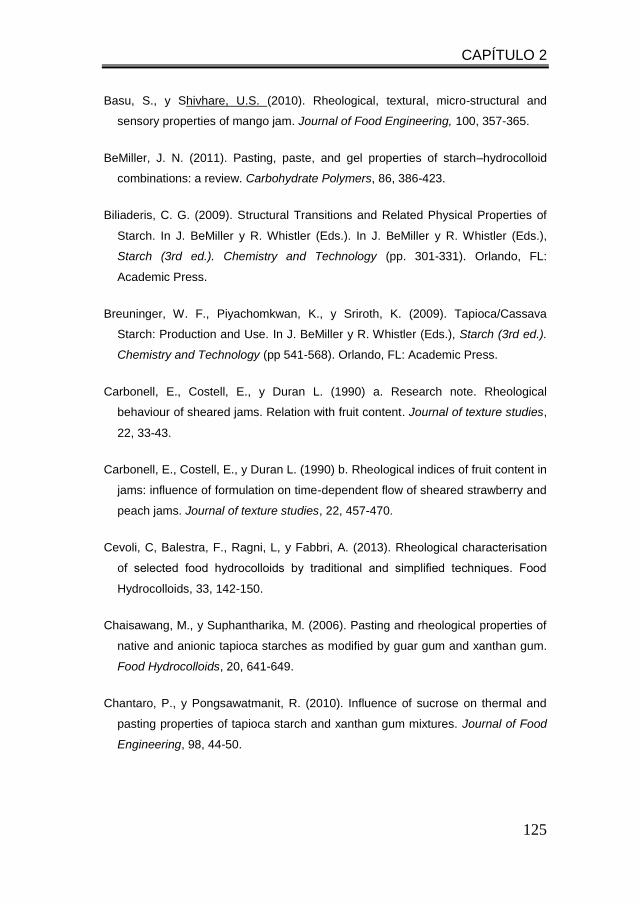
CAPÍTULO 2
125
Basu, S., y Shivhare, U.S. (2010). Rheological, textural, micro-structural and
sensory properties of mango jam. Journal of Food Engineering, 100, 357-365.
BeMiller, J. N. (2011). Pasting, paste, and gel properties of starch–hydrocolloid
combinations: a review. Carbohydrate Polymers, 86, 386-423.
Biliaderis, C. G. (2009). Structural Transitions and Related Physical Properties of
Starch. In J. BeMiller y R. Whistler (Eds.). In J. BeMiller y R. Whistler (Eds.),
Starch (3rd ed.). Chemistry and Technology (pp. 301-331). Orlando, FL:
Academic Press.
Breuninger, W. F., Piyachomkwan, K., y Sriroth, K. (2009). Tapioca/Cassava
Starch: Production and Use. In J. BeMiller y R. Whistler (Eds.), Starch (3rd ed.).
Chemistry and Technology (pp 541-568). Orlando, FL: Academic Press.
Carbonell, E., Costell, E., y Duran L. (1990) a. Research note. Rheological
behaviour of sheared jams. Relation with fruit content. Journal of texture studies,
22, 33-43.
Carbonell, E., Costell, E., y Duran L. (1990) b. Rheological indices of fruit content in
jams: influence of formulation on time-dependent flow of sheared strawberry and
peach jams. Journal of texture studies, 22, 457-470.
Cevoli, C, Balestra, F., Ragni, L, y Fabbri, A. (2013). Rheological characterisation
of selected food hydrocolloids by traditional and simplified techniques. Food
Hydrocolloids, 33, 142-150.
Chaisawang, M., y Suphantharika, M. (2006). Pasting and rheological properties of
native and anionic tapioca starches as modified by guar gum and xanthan gum.
Food Hydrocolloids, 20, 641-649.
Chantaro, P., y Pongsawatmanit, R. (2010). Influence of sucrose on thermal and
pasting properties of tapioca starch and xanthan gum mixtures. Journal of Food
Engineering, 98, 44-50.
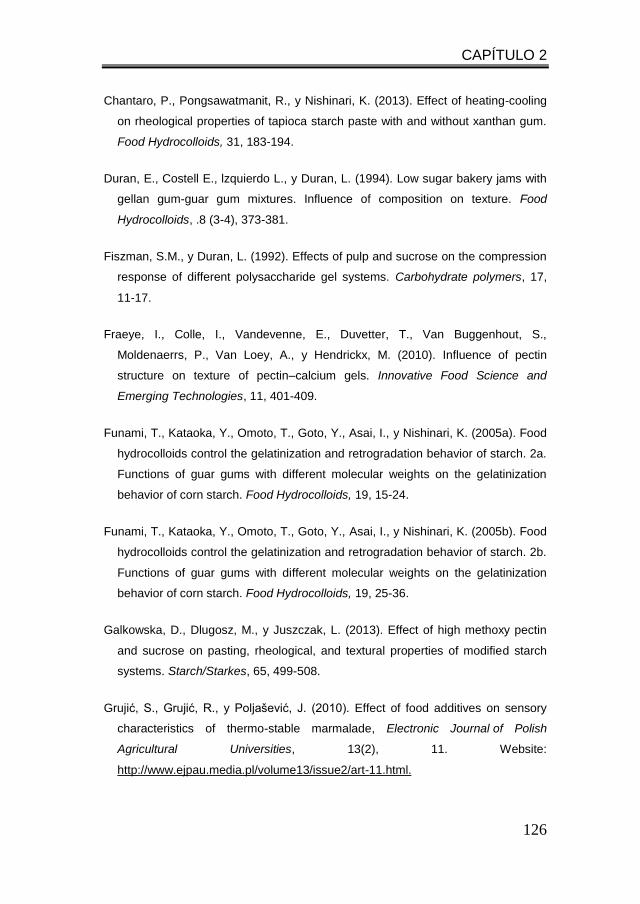
CAPÍTULO 2
126
Chantaro, P., Pongsawatmanit, R., y Nishinari, K. (2013). Effect of heating-cooling
on rheological properties of tapioca starch paste with and without xanthan gum.
Food Hydrocolloids, 31, 183-194.
Duran, E., Costell E., lzquierdo L., y Duran, L. (1994). Low sugar bakery jams with
gellan gum-guar gum mixtures. Influence of composition on texture. Food
Hydrocolloids, .8 (3-4), 373-381.
Fiszman, S.M., y Duran, L. (1992). Effects of pulp and sucrose on the compression
response of different polysaccharide gel systems. Carbohydrate polymers, 17,
11-17.
Fraeye, I., Colle, I., Vandevenne, E., Duvetter, T., Van Buggenhout, S.,
Moldenaerrs, P., Van Loey, A., y Hendrickx, M. (2010). Influence of pectin
structure on texture of pectin–calcium gels. Innovative Food Science and
Emerging Technologies, 11, 401-409.
Funami, T., Kataoka, Y., Omoto, T., Goto, Y., Asai, I., y Nishinari, K. (2005a). Food
hydrocolloids control the gelatinization and retrogradation behavior of starch. 2a.
Functions of guar gums with different molecular weights on the gelatinization
behavior of corn starch. Food Hydrocolloids, 19, 15-24.
Funami, T., Kataoka, Y., Omoto, T., Goto, Y., Asai, I., y Nishinari, K. (2005b). Food
hydrocolloids control the gelatinization and retrogradation behavior of starch. 2b.
Functions of guar gums with different molecular weights on the gelatinization
behavior of corn starch. Food Hydrocolloids, 19, 25-36.
Galkowska, D., Dlugosz, M., y Juszczak, L. (2013). Effect of high methoxy pectin
and sucrose on pasting, rheological, and textural properties of modified starch
systems. Starch/Starkes, 65, 499-508.
Grujić, S., Grujić, R., y Poljašević, J. (2010). Effect of food additives on sensory
characteristics of thermo-stable marmalade, Electronic Journal of Polish
Agricultural Universities, 13(2), 11. Website:
http://www.ejpau.media.pl/volume13/issue2/art-11.html.
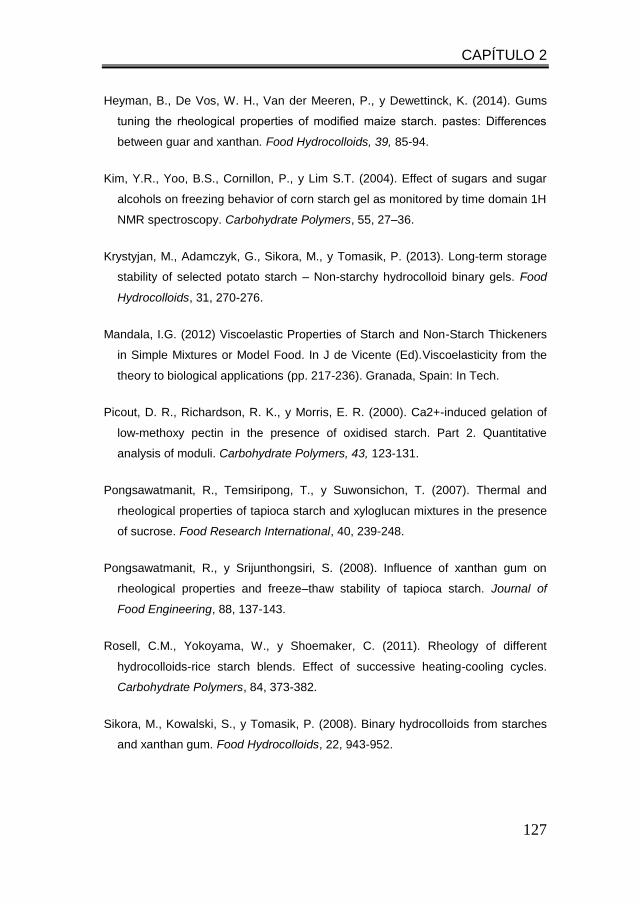
CAPÍTULO 2
127
Heyman, B., De Vos, W. H., Van der Meeren, P., y Dewettinck, K. (2014). Gums
tuning the rheological properties of modified maize starch. pastes: Differences
between guar and xanthan. Food Hydrocolloids, 39, 85-94.
Kim, Y.R., Yoo, B.S., Cornillon, P., y Lim S.T. (2004). Effect of sugars and sugar
alcohols on freezing behavior of corn starch gel as monitored by time domain 1H
NMR spectroscopy. Carbohydrate Polymers, 55, 27–36.
Krystyjan, M., Adamczyk, G., Sikora, M., y Tomasik, P. (2013). Long-term storage
stability of selected potato starch – Non-starchy hydrocolloid binary gels. Food
Hydrocolloids, 31, 270-276.
Mandala, I.G. (2012) Viscoelastic Properties of Starch and Non-Starch Thickeners
in Simple Mixtures or Model Food. In J de Vicente (Ed).Viscoelasticity from the
theory to biological applications (pp. 217-236). Granada, Spain: In Tech.
Picout, D. R., Richardson, R. K., y Morris, E. R. (2000). Ca2+-induced gelation of
low-methoxy pectin in the presence of oxidised starch. Part 2. Quantitative
analysis of moduli. Carbohydrate Polymers, 43, 123-131.
Pongsawatmanit, R., Temsiripong, T., y Suwonsichon, T. (2007). Thermal and
rheological properties of tapioca starch and xyloglucan mixtures in the presence
of sucrose. Food Research International, 40, 239-248.
Pongsawatmanit, R., y Srijunthongsiri, S. (2008). Influence of xanthan gum on
rheological properties and freeze–thaw stability of tapioca starch. Journal of
Food Engineering, 88, 137-143.
Rosell, C.M., Yokoyama, W., y Shoemaker, C. (2011). Rheology of different
hydrocolloids-rice starch blends. Effect of successive heating-cooling cycles.
Carbohydrate Polymers, 84, 373-382.
Sikora, M., Kowalski, S., y Tomasik, P. (2008). Binary hydrocolloids from starches
and xanthan gum. Food Hydrocolloids, 22, 943-952.
CAPÍTULO 2
128
Singh, J., Kaur, L, y McCarthy, O. J. (2007). Factors influencing the physico-
chemical, morphological, thermal and rheological properties of some chemically
modified starches for food applications—A review. Food Hydrocolloids, 21, 1–22
Temsiripong, T., Pongsawatmanit, R., Ikedab, S., y Nishinarib, K. (2005). Influence
of xyloglucan on gelatinization and retrogradation of tapioca starch. Food
Hydrocolloids, 19, 1054-1063.
Thakur, B. R., Singh, R.K., Handa A. K., y Rao, M. A. (1997). Chemistry and uses
of pectin – A review, Critical Reviews in Food Science and Nutrition, 37, (19), 47-
73.
Varela, P., y Fiszman, S. M. (2013). Exploring consumers’ knowledge and
perceptions of hydrocolloids used as food additives and ingredients. Food
Hydrocolloids, 30, 477-484.
Wei, Y.P., Wang, C.S., y Wu, J.S.B. (2001). Flow properties of fruit fillings. Food
Research International, 34, 377-381.
Witczak, T., Witczak, M., y Ziobro, R. (2013). Effect of inulin and pectin on
rheological and thermal properties of potato starch paste and gel. Journal of
Food Engineering, 124, 72-79.
Young, N. W. G., Kappel, G., y Bladt, T. (2003). A polyuronan blend giving novel
synergistic effects and bake-stable functionality to high soluble solids fruit fillings.
Food Hydrocolloids, 17, 407-418.
CAPÍTULO 3
Fruit fillings development: a multiparametric approach
Alejandra Agudelo, Paula Varela y Susana
Fiszman
Instituto de Agroquímica y Tecnología de Alimentos (CSIC). Valencia – Spain
Enviado a LWT

CAPÍTULO 3
131
ABSTRACT
Fruit fillings were formulated with three composition variables: thickeners
(native tapioca starch, modified waxy corn starch and a mixed system of
native tapioca starch plus low-methoxyl pectin), quantity of fruit (25
g/100g and 50 g/100g) and replacement of sucrose with polydextrose
and intense sweeteners (stevia:sucralose 50:50).
The 12 formulations were evaluated to discover their rheological
behaviour and instrumental texture. Sensory evaluation by quantitative
descriptive analysis was performed by a trained panel. Liking and, more
importantly, the adequacy of some sensory attributes were evaluated
with a panel of 100 consumers using just-about-right (JAR) scales.
Hierarchical cluster analysis was applied to the results to detect
consumer groups with different preference profiles. Three groups were
found, suggesting that formulations should be adapted to each scenario.
One group did not like intense sweeteners at all. Another, remarkably,
preferred the characteristics of the tapioca starch samples. The third
group (the most numerous) did not show these marked tendencies. The
results demonstrate that this kind of analysis with consumers is
necessary to interpret the liking values of a population sample correctly
and give the industry the necessary tools for adequate target-driven
diversification of the fruit filling market.
Key words: Fruit fillings; sugar-free; adequacy of sensory attributes;
consumer perception.
CAPÍTULO 3
132
1. INTRODUCTION
New product development is a suitable strategy for building competitive
advantage and long-term financial success in today’s global food
markets. Nowadays, the food market is increasingly segmented.
Consumers look for products that are not only of good quality but also
meet personal needs and tastes. In the phase in which the new product
starts to take shape, a careful analysis needs to be made of the
relationships between consumer perceptions, preferences and choices,
on one hand, and the product’s technical features, on the other, (Costa y
Jongen, 2006). Incorporating the ‘voice of the consumer’ at early stages
of the process has been identified as a critical success factor. However,
it is often ignored or poorly executed (Van Kleef, Van Trijp, y Luning,
2005).
This approach would make it possible to design a new product that could
potentially fulfil consumer needs. Among other things, this requires
studies to discover whether the population’s perception of the target
product is segmented and which versions of a product need to be
developed. Consumer preferences differ and there are indications that
they have become more diverse over time. In addition, consumers differ
in the kind of qualities they expect from food products. Nevertheless,
much product innovation in the food sector is still not geared towards
specific consumer segments (Grunert y Valli, 2001).
In the present study, two factors were varied in the selected fruit filling: 1)
the gelling agent, and consequently the final texture (one of the main
factors for quality and acceptance in this type of product), and 2) sucrose
or its replacement by alternative sweeteners, with the resulting benefit of
a lower calorie content.
Sucrose in fruit fillings contributes to total soluble solids, an effect that is
essential for their physical, chemical, and microbiological stability;

CAPÍTULO 3
133
provides sweetness, body and mouthfeel; improves appearance (colour
and shine); and makes gelation of pectin possible (Hyvonen y Torma,
1983; Basu, Shivhare y Singh, 2013). Sucrose also acts as a dehydrating
agent for the pectin molecules (the naturally-occurring gelling agent in
fruit fillings), permitting closer contact between the pectin chain
molecules during filling manufacture (Suutarinen, 2002). One gram of
sucrose contributes 4 calories. Nowadays, due to the growth of the
health food industry, reducing the sucrose content of food products
through full or partial replacement by alternative sweeteners has become
a viable option for producing low or zero calorie foods. Substituting other
sweeteners for sucrose is a challenge for researchers and industry alike,
since in addition to the sweet taste, other sensory attributes may be
modified (Cadena, Cruz, Netto, Castro, Faria, y Bolini, 2013). High
intensity sweeteners are increasingly being used by consumers, either
for their reduced energy content or due to the demands of diabetes
mellitus sufferers (Cadena y Bolini, 2011).
The food industry frequently uses sweetener blends to overcome the
sensory limitations of individual sweeteners (Zhao y Tepper, 2007).
Blending takes advantage of the phenomenon of synergy among
sweeteners which is typically observed for sweeteners that exhibit
different flavour profiles, particularly if one of them is bitter. Blending
tends to create an improved flavour profile. Stevioside and sucralose are
non- nutritive high intensity sweeteners, acid- and heat-stable, that can
be used in combination to prepare jam-like products without
compromising taste (Basu, Shivhare, y Singh, 2013). Residual bitterness
from the stevia has been reported in a number of studies (Melo, Bolini, y
Efraim, 2009; Prakash, DuBois, Clos, Wilkens, y Fosdick, 2008). It has
been suggested that to reduce the bitter taste, common to many Stevia
species, it is important to obtain Stevia with more rebaudioside (Cadena,
Cruz, Netto, Castro, Faria, y Bolini, 2013)). Sucralose is reported to have
CAPÍTULO 3
134
a relatively clean and lingering sweet taste with little persistence of
bitterness (Nabors, 2002; Zhao, y Tepper, 2007).
However, high-potency sweeteners do not contribute texture. To
maintain the structural characteristics supplied by sucrose, other
substances such as polydextrose are used as bulking agent
replacements for sucrose. Polydextrose has similar technical properties
to sucrose, except for sweetness. It lacks a sweet taste, but provides 1
kcal/g in comparison to the 4 cal/g of sucrose (Schirmer, Jekle, Arendt y
Becker, 2012). Polydextrose has been successfully incorporated into a
wide range of foods, including baked goods, beverages, confectionery
and frozen desserts, and is known to provide the bulk, appropriate
texture and mouthfeel qualities (Aidoo, Afoakwa, y Dewettinck, 2014), no
aftertaste, contribution to colour and interaction with starch and protein,
in a similar manner to that of sucrose (Pereira, Rios de Souza, Teixeira,
Queiroz, Borges y Souza, 2013).
The sensory quality of fruit fillings includes a number of attributes like
balance of sweetness and sourness, colour, fruit flavour, medium
firmness and a homogeneous gel-like texture, among others. Gel texture
depends, of course, on the gelling agent selected. Different pectin
preparations or some other substance such as a gelling agent can be
used. For the present study, three different gelling systems (tapioca
starch alone, a combination of tapioca starch and pectin and a modified
waxy corn starch (MWCS)) were selected based on two previous studies
that assessed certain rheological and technical characteristics (Agudelo,
Varela, Sanz, y Fiszman, 2014a; Agudelo, Varela, Sanz y Fiszman,
2014b). Pectin is primarily used in the jam and bakery filling industry,
since it is a gelling agent that occurs naturally in fruit (Young, Kappel, y
Bladt, 2003; Grujic, Grujić, y Poljašević, 2010), and MWCS is also used
to obtain syneresis-free and freeze-stable products (Gisslen, 2012).
CAPÍTULO 3
135
A number of tools are available to help product developers to create or
revise products to please consumers. Quantitative consumer research
typically involves obtaining consumer responses through appropriate
data collection methods for the products of interest. Hedonic responses
are generally obtained through product liking scales or behaviour choices
(preference). These methods are relevant at the development (product
design) and optimization stages (testing), previous to the launch (Van
Kleef van Trijp, y Luning, 2005; Costa, y Jongen, 2006). However,
merely ascertaining acceptability (in the form of overall liking or
preference ratings) does not open the door to further product
development. Liking scales and preference ratings alone do not assist
developers to understand how product attributes need be altered to
improve product acceptability or relative preference. Just-about-right
(JAR) scales are a technique that has been incorporated into quantitative
consumer testing for this purpose (Rhotman, 2007). JAR scales are used
in consumer science to identify whether an attribute is too high or too low
in a product, or whether it is “just about right.” The consumer ratings
provide an indication of the potential for improving the prototype and the
direction of formulation change. JAR scales are frequently used in non-
experimental product optimization studies, which include prototypes
and/or commercial products (Popper, 2014).
The aims of the present study were to approach fruit filling development
from a multiparametric perspective, studying how consumer and sensory
techniques can guide the final characteristics of products that have good
acceptability, and to evaluate how this is reflected in the intrinsic
characteristics of the products (sensory and instrumental parameters) as
defined by compositional changes (amount of fruit and sucrose
replacement).
CAPÍTULO 3
136
2. MATERIALS AND METHODS
2.1. Ingredients
The ingredients employed were native tapioca starch (TS) (moisture
content 13.7 g/100g, Sucroal S.A., Cali, Colombia), citric acid and
sodium citrate (Sucroal S.A., Cali, Colombia), highly cross-linked waxy
corn starch, hydroxypropylated and phosphated (C) (moisture content
12.3 g/100g, Polartex 6716, Cargill, Martorell, Spain), low methoxyl
pectin (P) (33-37% esterified), moisture content 12 g/100g, Unipectine
OB700, Cargill, Martorell, Spain), anhydrous calcium chloride (Panreac,
Barcelona, Spain), polydextrose (PD) (moisture content 3.2 g/100g,
Stalite III, Tate y Lyle, Decatur IL, US), rebaudioside B (stevioside, purity
greater than 95%, Sucroal S.A., Cali, Colombia ), sucralose (Tate y Lyle,
Jurong Island, Singapore) and sucrose (S) (all-purpose table sugar,
Hacendado, Valencia, Spain). Fruit purée (F) was obtained from canned
peach halves in light syrup (6.5 degrees Brix, pH 3.8, Hacendado,
Valencia, Spain). The final moisture content of the fruit purée was 92
g/100g.
2.2. Model system and fruit filling preparation
The samples were prepared in a food processor-cooker (Thermomix TM
31, Wuppertal, Germany) equipped with temperature and stirring speed
controls. All the samples were prepared at pH 3 and contained 35 g/100g
total soluble solids (sucrose or polydextrose) and 6 g/100g of the
thickener system. Three thickener systems were employed: a modified
waxy corn starch as control (C), native tapioca starch (TS), and TS with
pectin (0.6 g/100g of the total hydrocolloid system on a dry weight basis)
and calcium ions (60 mg of calcium ion per gram of pectin) (P).
CAPÍTULO 3
137
The first step in preparing the samples was to add the sucrose or
polydextrose to part of the water. In the samples that contained fruit, the
fruit purée was also added (25 g/100g or 50 g/100g). The mixture was
heated to 60°C and stirred at 600 rpm for 5 minutes. In the formulations
containing pectin, the pectin was first dispersed in water with a magnetic
stirrer at 80°C until it was totally dissolved, then allowed to cool to 60°C
before adding it to the sucrose-fruit-water or polydextrose-fruit-water
mixture. The starch was dispersed in another part of cold water and
added to the sucrose-water, polydextrose-water, sucrose-water-fruit
mixture or polydextrose-water-fruit mixture, continuing to stir while
heating for another 2 minutes. The sweetener mixture was then added to
the samples that contained polydextrose. Once the mixtures had been
prepared with these ingredients, the temperature was increased to 90°C
and heating and stirring continued for a further 30 minutes. Calcium
chloride, dissolved in a small amount of water reserved for this step, was
added to the mixtures containing pectin. The pH was adjusted to 3.0
(±0.2), using citric acid and sodium citrate buffer solutions, and stirring
and heating continued for a further 5 minutes. The samples were
transferred to plastic containers and held in refrigeration (8°C) for 24
hours (Table 1).
2.3. Linear viscoelastic properties
The linear viscoelastic properties of the different samples were studied
with a controlled stress rheometer (AR-G2, TA Instruments, Crawley,
England), using serrated plate-plate geometry (40mm diameter). A gap
of 1 mm was employed. Before the measurements were taken, the
samples remained between the plates for 10 min equilibration time. The
exposed edges of the samples were covered with silicone oil to prevent
the sample from drying out during the measurements.
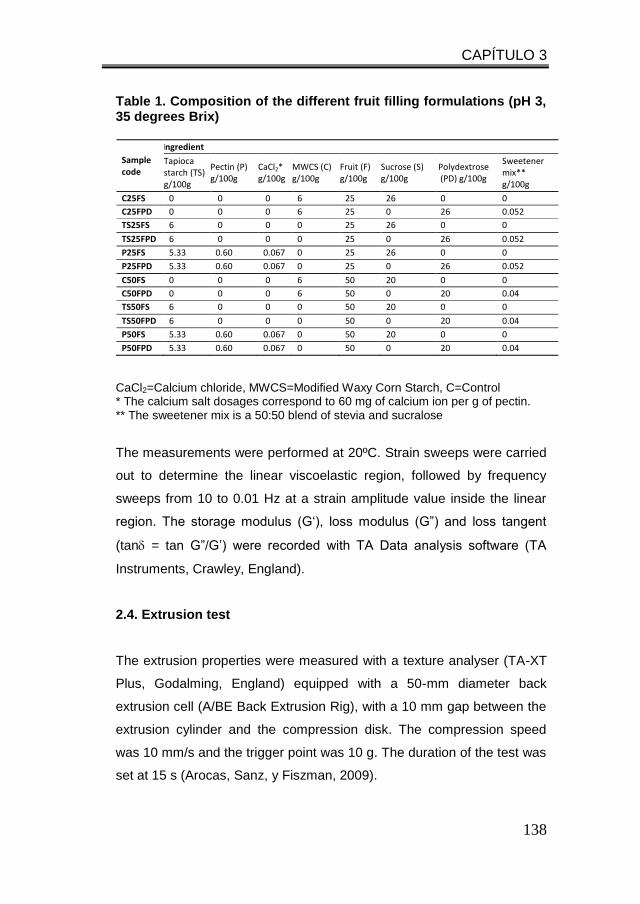
CAPÍTULO 3
138
Table 1. Composition of the different fruit filling formulations (pH 3, 35 degrees Brix)
Sample code
Ingredient
Tapioca starch (TS) g/100g
Pectin (P) g/100g
CaCl2* g/100g
MWCS (C) g/100g
Fruit (F) g/100g
Sucrose (S) g/100g
Polydextrose (PD) g/100g
Sweetener mix** g/100g
C25FS 0 0 0 6 25 26 0 0
C25FPD 0 0 0 6 25 0 26 0.052
TS25FS 6 0 0 0 25 26 0 0
TS25FPD 6 0 0 0 25 0 26 0.052
P25FS 5.33 0.60 0.067 0 25 26 0 0
P25FPD 5.33 0.60 0.067 0 25 0 26 0.052
C50FS 0 0 0 6 50 20 0 0
C50FPD 0 0 0 6 50 0 20 0.04
TS50FS 6 0 0 0 50 20 0 0
TS50FPD 6 0 0 0 50 0 20 0.04
P50FS 5.33 0.60 0.067 0 50 20 0 0
P50FPD 5.33 0.60 0.067 0 50 0 20 0.04
CaCl2=Calcium chloride, MWCS=Modified Waxy Corn Starch, C=Control * The calcium salt dosages correspond to 60 mg of calcium ion per g of pectin. ** The sweetener mix is a 50:50 blend of stevia and sucralose
The measurements were performed at 20ºC. Strain sweeps were carried
out to determine the linear viscoelastic region, followed by frequency
sweeps from 10 to 0.01 Hz at a strain amplitude value inside the linear
region. The storage modulus (G‘), loss modulus (G”) and loss tangent
(tan = tan G”/G’) were recorded with TA Data analysis software (TA
Instruments, Crawley, England).
2.4. Extrusion test
The extrusion properties were measured with a texture analyser (TA-XT
Plus, Godalming, England) equipped with a 50-mm diameter back
extrusion cell (A/BE Back Extrusion Rig), with a 10 mm gap between the
extrusion cylinder and the compression disk. The compression speed
was 10 mm/s and the trigger point was 10 g. The duration of the test was
set at 15 s (Arocas, Sanz, y Fiszman, 2009).
CAPÍTULO 3
139
The samples were placed in the extrusion cylinder and stabilized in a
water bath at 25°C for 10 minutes before making the measurements. The
force-displacement profiles were recorded and the maximum extrusion
force (Fmax, in N) and the area under the curve (AUC, in N/s) were
obtained, as indices of firmness and consistency, respectively (Cevoli,
Balestra, Ragni, y Fabbri. 2013).
2.5 Sensory and Consumer tests
All the sensory tests were carried out in a sensory laboratory equipped
with individual booths (ISO, 2007). Data acquisition was performed using
Compusense five release 5.0 software (Compusense Inc., Guelph,
Ontario, Canada).
2.5.1 Quantitative descriptive analysis (QDA)
The twelve samples (Table 1) employed in the instrumental tests (see
sections 2.2, 2.3 and 2.4) were assessed through QDA.
Selection of Terms. A panel of eight assessors (seven woman and one
man, aged between 20 and 45 years), with previous experience in
descriptive analysis, selected the descriptors using the Checklist Method
(Lawless y Heymann, 1998). The terms were selected and discussed in
four 1-hour open sessions with the panel leader. The assessors were
first given a brief outline of the procedures and a list of attributes and
representative samples. They were then asked to choose and write down
the most appropriate attributes to describe all the sensory properties of
the fruit filling or to suggest new ones. The panel leader collected and
wrote down all the attributes on a new list. The panel discussed the
appropriateness and definitions of the selected attributes and held
preliminary discussions on how to assess the products. At the end of
these sessions, a consensus on the list of attributes was reached (table
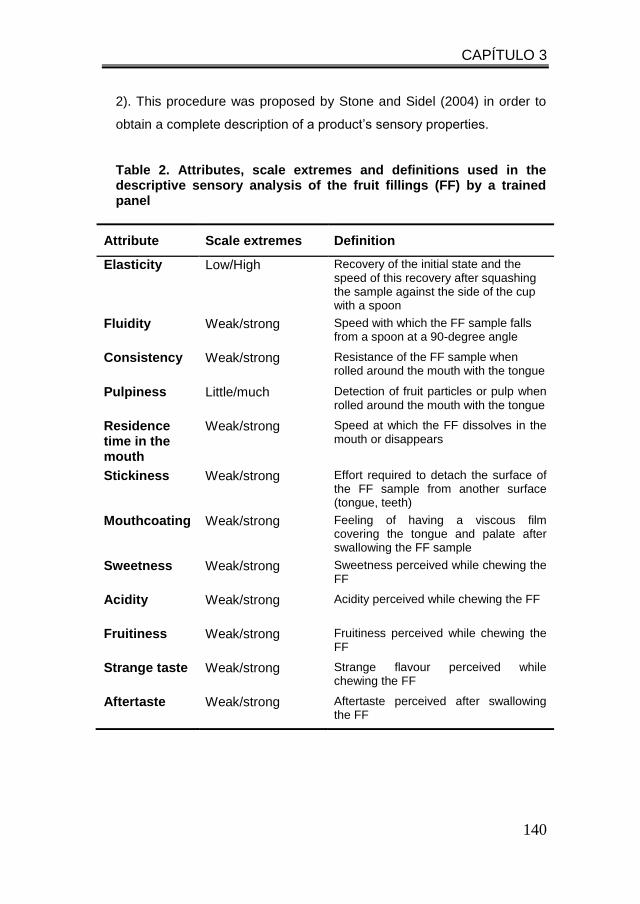
CAPÍTULO 3
140
2). This procedure was proposed by Stone and Sidel (2004) in order to
obtain a complete description of a product’s sensory properties.
Table 2. Attributes, scale extremes and definitions used in the descriptive sensory analysis of the fruit fillings (FF) by a trained panel
Attribute Scale extremes Definition
Elasticity Low/High Recovery of the initial state and the speed of this recovery after squashing the sample against the side of the cup with a spoon
Fluidity Weak/strong Speed with which the FF sample falls from a spoon at a 90-degree angle
Consistency
Weak/strong Resistance of the FF sample when rolled around the mouth with the tongue
Pulpiness Little/much Detection of fruit particles or pulp when rolled around the mouth with the tongue
Residence time in the mouth
Weak/strong Speed at which the FF dissolves in the mouth or disappears
Stickiness Weak/strong Effort required to detach the surface of the FF sample from another surface (tongue, teeth)
Mouthcoating Weak/strong Feeling of having a viscous film covering the tongue and palate after swallowing the FF sample
Sweetness Weak/strong Sweetness perceived while chewing the FF
Acidity Weak/strong Acidity perceived while chewing the FF
Fruitiness Weak/strong Fruitiness perceived while chewing the FF
Strange taste Weak/strong Strange flavour perceived while chewing the FF
Aftertaste Weak/strong Aftertaste perceived after swallowing the FF
CAPÍTULO 3
141
Panel Training. The panellists attended eight 1-hour training sessions.
Training involved two stages. During the first stage, different samples
were tasted by the panellists to attain a better understanding and final
agreement on how to measure all the descriptors. Different tasting
sessions were conducted until the panel was homogeneous in its
assessments and its comprehension of the extremes of the scales.
During the second stage, the panellists used a 10-cm unstructured scale
to score the selected attributes of the fruit filling samples (Table 2).
Sample assessment. A complete block experimental design was carried
out in duplicate (12 samples, 6 sessions, 4 samples per session). The
intensities of the sensory attributes were scored on a 10-cm unstructured
line scale. In each session, the samples were served in random order,
each in a separate plastic cup identified with a random three-digit code.
The panellists were instructed to rinse their mouths with water and eat a
neutral-tasting biscuit between each sample evaluation.
2.5.2 Consumer test
This test assessed six samples prepared with the three thickeners
(tapioca starch alone, TS; modified waxy corn starch, C; and the mixed
system with tapioca starch and pectin, P), each with either sucrose (S
samples) or a combination of polydextrose and sweeteners (PD
samples). All these samples contained the highest level of fruit
(50g/100g) and their final total soluble solids level was 35 g/100g.
Consequently, the sample codes for the samples evaluated were C50FS,
C50FPD, TS50FS, TS50FPD, P50FS, and P50FPD.
The test was conducted with 100 consumers (35 men and 65 women,
with ages ranging from 18 to 62 years). All the consumers stated that
they knew what fruit filling products were and that they consumed them.
They assessed six fruit filling samples in a single session. The samples
CAPÍTULO 3
142
were coded with randomized 3-digit numbers in a balanced complete
blocks experimental design.
Liking Scales
The consumers rated their liking for the fruit fillings on a 9-point hedonic
scale 9 (1 = I don’t like it at all, 9 = I like it very much). The consumers
rated their overall liking, consistency liking and flavour liking for each
sample by choosing the point on the scale that best expressed their
tastes.
Adequacy of consistency, sweetness, acidity, and fruit flavour attributes
(JAR scales)
The adequacy of the consistency, sweetness, acidity, and fruit flavour of
each sample was evaluated with “just-about right” (JAR) five-point bipolar
scales. In this kind of test, the end-points are anchored with labels that
represent the levels of the attribute that deviate from a respondent’s
theoretical ideal point in opposite directions, while the central point is the
ideal (Rothman, 2007). In the JAR test the consumers were asked “in
your opinion this product should be ...”, rated on the following scale: 1 =
much more …, 2 = more …, 3 = about right, 4 = less …, 5 = much less …
(Lawless y Heymann, 1998).
2.6. Statistical processing of the data
Instrumental analysis
All the tests were carried out in duplicate with samples prepared on
different days. Analyses of variance (ANOVA) were performed to
compare the effect of different concentrations of polydextrose and
sucrose and of two concentrations of fruit (25 g/100g and 50 g/100g),
with and without added sucrose, on the viscoelastic and extrusion
properties of the samples (Table 1). Tukey's multiple comparison test
CAPÍTULO 3
143
was used to analyse inter-group differences with a 95% confidence
interval.
Quantitative descriptive analysis
Two-way analysis of variance (ANOVA) was applied to each descriptor to
check panel performance and differences between products, considering
the assessors, the samples and their interaction as factors. Least
significant differences were calculated by Tukey’s test and the
significance at P < 0.05 was determined. One-way ANOVA was applied
to the consumer liking scores to study the differences between the
samples. The least significant differences were calculated by Tukey's
test (p<0.05). Hierarchical cluster analysis (Euclidean distance, Ward’s
method) was applied to the overall liking scores in order to identify
segments of consumers with similar preference patterns. The JAR
results were analysed by penalty analysis (PA) to identify potential
directions for reformulation on the basis of consumer liking by
highlighting the most penalizing attributes. This technique is used to
relate JAR scales to liking data, particularly in order to understand which
side of the JAR scale is linked to lower hedonic ratings. The respondent
percentages (x-axis) were plotted against the penalties (drop in liking, y-
axis). Penalty analysis was used in order to gain an understanding of the
attributes that most affected liking ratings (Plaehn y Horne, 2008). The
usefulness of the method is that it provides guidance for product
reformulation or a better understanding of attribute adequacy in relation
to liking in terms of direction, with the assumption that the maximum
hedonic score will occur at the “just about right” point (Rothman, 2007).
All the statistical analyses were performed with the XLSTAT statistics
software package (Addinsoft, Barcelona, Spain, version 2009, 4.03).
CAPÍTULO 3
144
3. RESULTS AND DISCUSSION
3.1.1 Effect of sucrose replacement on the different thickener
systems without fruit
Table 3 shows the viscoelasticity parameters of the systems with the
three thickeners –native tapioca starch (TS), modified waxy corn starch
(MWCS) as the control (C), or the pectin-tapioca starch mixture (P) – and
increasing replacement of sucrose (S) by polydextrose (PD). Adding
polydextrose as a bulking agent for partial or total replacement of the
sucrose led to a significant fall in the storage modulus (G’) of the three
systems under study and to significantly lower G’’ values in most cases.
In the tapioca starch alone system (TS) the G’ values were slightly higher
than those of G” and both were quite frequency-dependent, reflecting a
weak gel structure with low viscoelasticity which fell lower as the sucrose
was increasingly replaced by polydextrose.
The MWCS system had significantly higher modulus values than the TS
system and the two moduli were further apart. In addition, these values
were much less frequency-dependent than those of TS, reflecting the
stronger gel structure of MWCS. The MWCS samples showed the same
behaviour pattern as TS with increasing replacement of sucrose by
polydextrose, as the G’ and G’’ values fell significantly and tanδ rose in
comparison with the sucrose-only sample, indicating a weakening of the
gel as the sucrose level fell.
The TS with pectin and calcium ions system (P) was also more
viscoelastic than the TS alone, presenting higher G’ and G’’ and lower
tanδ values, showing a sizeable increase in viscoelastic behaviour and
behaving more like the modified starch system. In general, the G’ and G’’
values fell significantly as the proportion of polydextrose rose but the
tanδ values remained unchanged, indicating that replacement by
CAPÍTULO 3
145
polydextrose did not cause major changes in the gel structure. The lower
viscoelastic moduli values in the presence of polydextrose indicated a
slight but significant loss in elasticity as the sucrose was replaced.
Despite this, the structural alteration was not very great because the
physico-chemical properties of polydextrose are very similar to those of
sucrose (Schirmer et al., 2012). According to Pereira et al. (2013), the
bulking agent must have similar characteristics to those of sucrose,
including replacement of solid stability at different pH and temperature
conditions. The low methoxyl pectin does not require the addition of
solids in order to gel, it only needs divalent calcium ions. However, the
addition of soluble solids such as sucrose to the pectin-calcium gels can
enhance gel strength. The extent to which gel strength is increased
depends not only on the sugar concentration, but also on the type of
sugar and the pH value (Fraeye et al., 2010).
3.1.2 Effect of the amount of fruit on the viscoelastic properties of
fruit fillings
The effect of adding fruit at two content levels (25 g/100g and 50 g/100g)
to the three thickener systems was analysed (Table 4). Two series of
samples were studied, one with sucrose and the other with complete
replacement of sucrose by polydextrose. All these systems were
adjusted to 35 g/100g of total soluble solids. Increasing the percentage
of fruit from 25 g/100g to 50 g/100g significantly increased the G’ and G’’
values of all the samples, showing some reinforcement of the systems.
The mean viscoelasticity parameter values (Table 4) show that
increasing the fruit content of the TS filling from 25 g/100g to 50 g/100 g
led to slight but not significant differences, and no differences were found
on increasing the percentage of fruit in the samples prepared with
polydextrose.
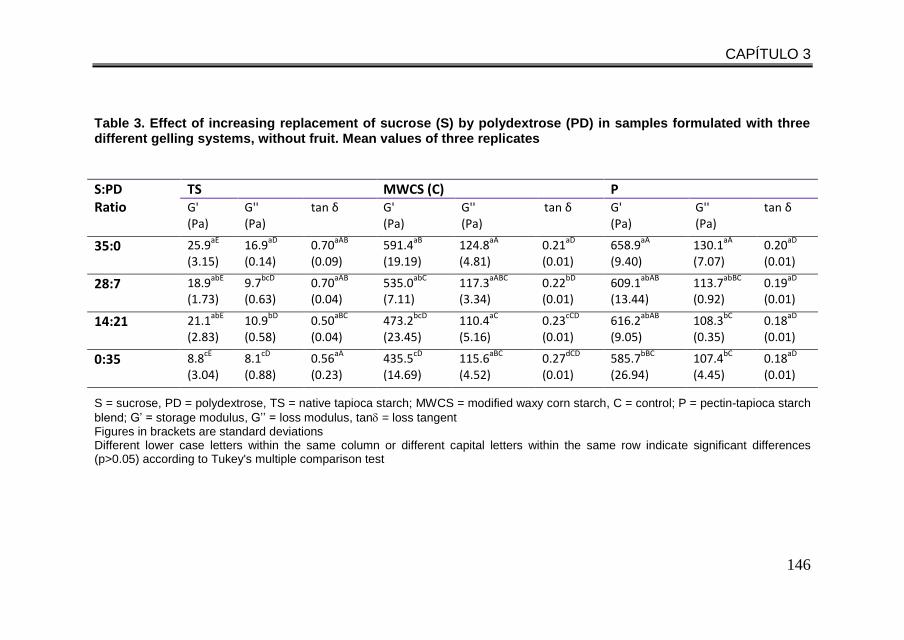
CAPÍTULO 3
146
Table 3. Effect of increasing replacement of sucrose (S) by polydextrose (PD) in samples formulated with three different gelling systems, without fruit. Mean values of three replicates
S:PD Ratio
TS MWCS (C) P G' (Pa)
G'' (Pa)
tan δ G' (Pa)
G'' (Pa)
tan δ G' (Pa)
G'' (Pa)
tan δ
35:0 25.9aE
(3.15)
16.9aD
(0.14)
0.70aAB
(0.09)
591.4aB
(19.19)
124.8aA
(4.81)
0.21aD
(0.01)
658.9aA
(9.40)
130.1aA
(7.07)
0.20aD
(0.01)
28:7 18.9abE
(1.73)
9.7bcD
(0.63)
0.70aAB
(0.04)
535.0abC
(7.11)
117.3aABC
(3.34)
0.22bD
(0.01)
609.1abAB
(13.44)
113.7abBC
(0.92)
0.19aD
(0.01)
14:21 21.1abE
(2.83)
10.9bD
(0.58)
0.50aBC
(0.04)
473.2bcD
(23.45)
110.4aC
(5.16)
0.23cCD
(0.01)
616.2abAB
(9.05)
108.3bC
(0.35)
0.18aD
(0.01)
0:35 8.8cE
(3.04)
8.1cD
(0.88)
0.56aA
(0.23)
435.5cD
(14.69)
115.6aBC
(4.52)
0.27dCD
(0.01)
585.7bBC
(26.94)
107.4bC
(4.45)
0.18aD
(0.01)
S = sucrose, PD = polydextrose, TS = native tapioca starch; MWCS = modified waxy corn starch, C = control; P = pectin-tapioca starch
blend; G’ = storage modulus, G’’ = loss modulus, tan = loss tangent Figures in brackets are standard deviations Different lower case letters within the same column or different capital letters within the same row indicate significant differences (p>0.05) according to Tukey's multiple comparison test
CAPÍTULO 3
147
Sample C showed a large, significant rise in modules G’ and G’’ when
the fruit content was increased from 25 g to 50 g / 100 g, indicating a
strengthening of the system’s structure, and higher values than those of
the system prepared without fruit, where the solids were provided only by
the sucrose or by the polydextrose (Table 3).
As in the systems without fruit, adding polydextrose lowered the G’ and
G’’ values compared with the systems containing fruit and sucrose. This
effect can be attributed to the difference in molecular weight and to the
greater viscosity of polydextrose at the same temperature and
concentration as sucrose. These characteristics enable polydextrose to
provide the desirable mouth-feel and texture qualities that are so
important when replacing sucrose (Amerbach y Craig, 2008). It is also
known that full replacement of sucrose with polydextrose leads to a
higher starch gelatinization temperature in comparison with sucrose
(Hicsasmaz, Yazgan, Bozoglua, y Katnas, 2003).
The pectin-tapioca starch (P) systems exhibited different behaviour.
Although increasing the quantity of fruit again improved the gel structure
(higher G’ and G’’ values), as in the other thickener systems, the
differences compared to samples prepared without fruit were not
significant in this system (Table 3). In addition, the G’ and G’’ values
were much lower than in the control. In the pectin-tapioca starch system,
the polydextrose appeared not to affect gel formation when fruit was
present.
In a previous study, pectin was found to be responsible for the
viscoelastic properties of the mixed system, giving the gel greater
strength than the system with starch alone (higher G’ and G” values),
whereas the starch molecules appeared to have an additive effect. In
addition, some ion interaction between the starch molecules and charged
positions in the pectin molecules could not be discarded (Agudelo et al.,
2014b).
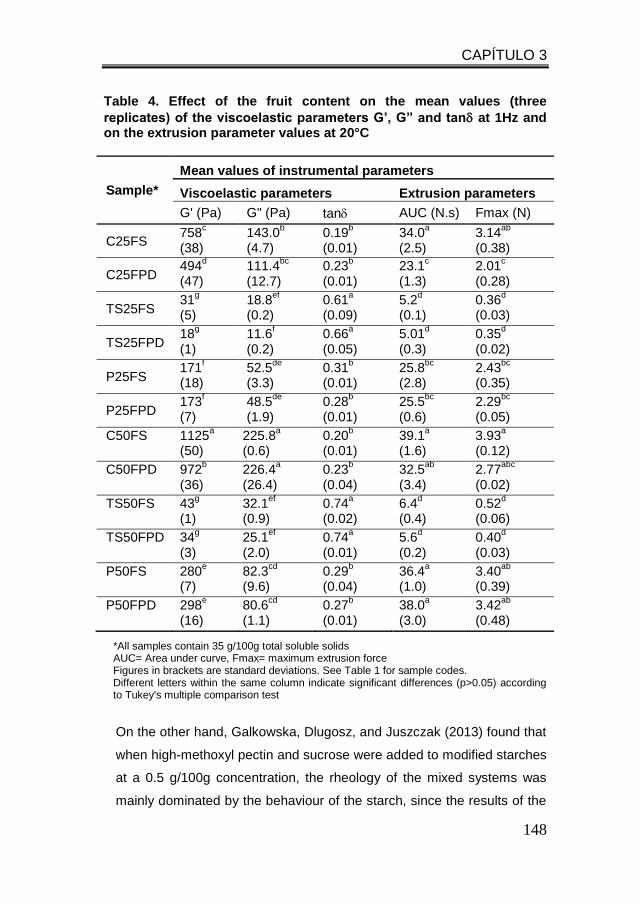
CAPÍTULO 3
148
Table 4. Effect of the fruit content on the mean values (three
replicates) of the viscoelastic parameters G’, G” and tan at 1Hz and on the extrusion parameter values at 20°C
Sample*
Mean values of instrumental parameters
Viscoelastic parameters Extrusion parameters
G' (Pa) G" (Pa) tan AUC (N.s) Fmax (N)
C25FS 758
c
(38) 143.0
b
(4.7) 0.19
b
(0.01) 34.0
a
(2.5) 3.14
ab
(0.38)
C25FPD 494
d
(47) 111.4
bc
(12.7) 0.23
b
(0.01) 23.1
c
(1.3) 2.01
c
(0.28)
TS25FS 31
g
(5) 18.8
ef
(0.2) 0.61
a
(0.09) 5.2
d
(0.1) 0.36
d
(0.03)
TS25FPD 18
g
(1) 11.6
f
(0.2) 0.66
a
(0.05) 5.01
d
(0.3) 0.35
d
(0.02)
P25FS 171
f
(18) 52.5
de
(3.3) 0.31
b
(0.01) 25.8
bc
(2.8) 2.43
bc
(0.35)
P25FPD 173
f
(7) 48.5
de
(1.9) 0.28
b
(0.01) 25.5
bc
(0.6) 2.29
bc
(0.05)
C50FS 1125a
(50) 225.8
a
(0.6) 0.20
b
(0.01) 39.1
a
(1.6) 3.93
a
(0.12)
C50FPD 972b
(36) 226.4
a
(26.4) 0.23
b
(0.04) 32.5
ab
(3.4) 2.77
abc
(0.02)
TS50FS 43g
(1) 32.1
ef
(0.9) 0.74
a
(0.02) 6.4
d
(0.4) 0.52
d
(0.06)
TS50FPD 34g
(3) 25.1
ef
(2.0) 0.74
a
(0.01) 5.6
d
(0.2) 0.40
d
(0.03)
P50FS 280e
(7) 82.3
cd
(9.6) 0.29
b
(0.04) 36.4
a
(1.0) 3.40
ab
(0.39)
P50FPD 298e
(16) 80.6
cd
(1.1) 0.27
b
(0.01) 38.0
a
(3.0) 3.42
ab
(0.48)
*All samples contain 35 g/100g total soluble solids AUC= Area under curve, Fmax= maximum extrusion force Figures in brackets are standard deviations. See Table 1 for sample codes. Different letters within the same column indicate significant differences (p>0.05) according to Tukey's multiple comparison test
On the other hand, Galkowska, Dlugosz, and Juszczak (2013) found that
when high-methoxyl pectin and sucrose were added to modified starches
at a 0.5 g/100g concentration, the rheology of the mixed systems was
mainly dominated by the behaviour of the starch, since the results of the
CAPÍTULO 3
149
dynamic rheological measurements indicated that pectin did not affect
the proportion of the elastic and viscous properties of the gels. However,
this was not the case in the present study.
The gel strength of pectin-calcium gels depends not only on the sugar
content, but also on the type of sugar: adding sucrose increases the gel
strength more than adding glucose, which in turn has a greater effect
than fructose (Grosso y Rao, 1998). The mechanism by which sucrose
increases the gel strength is not entirely clear. Sugars reduce the water
activity, promoting pectin-pectin interactions rather than pectin-water
interactions. In contrast, depending on the stereochemistry of the
hydroxyl groups, some polyols may compete with pectin to bind calcium
ions, which may reduce the gel promoting effect (Fraeye et al., 2010). In
the present study, it was found that the solids provided by the fruit did not
increase the gel strength to the same extent as those contributed by the
sucrose.
3.2. Extrusion properties of fruit fillings
The extrusion properties were measured in samples of fruit fillings with
25 g or 50 g / 100 g of fruit, prepared with the highest level of sucrose or
with total replacement of the sucrose by polydextrose, for each of the
three thickeners (see Table 1 for sample codes). The extrusion profile
values that were taken as representative were the maximum force
(Fmax), as an index of initial resistance to extrusion, and the area under
the curve (AUC), or extrusion work, as an index of the system
consistency (Angioloni y Collar, 2009; Cevoli et al., 2013).
Measurements of extrusion leading to gel rupture contributed information
on behaviour under high deformation forces; in general, the results
confirmed those obtained at low deformation forces (see section 3.1.2).
System C had the highest firmness and consistency values for each fruit
content level (Table 4), followed by the pectin-tapioca starch mixture
CAPÍTULO 3
150
samples and, lastly, by those with tapioca starch alone. These values
followed the same behaviour patterns as for the viscoelastic properties of
the different systems (see section 3.1), confirming that adding more fruit
strengthened the gel structure in the systems studied and that the gel
structure formed by the pectin-native TS system was stronger than with
the TS-alone system and nearer to that of the system prepared with the
control starch. Substituting polydextrose for sucrose had very little effect
on the structure of the systems studied, though the C starch system was
the one that showed the greatest differences.
3.3 Sensory Analysis- Quantitative Descriptive Analysis (QDA)
The QDA approach (Stone y Sidel, 1998) was chosen to identify and
quantify the sensory properties of the samples. The composition of the
twelve samples analysed is shown in Table 1 and the attributes
assessed by the trained panel are described in Table 2.
ANOVA of the trained panel sensory scores indicated that the effect of
the sample was significant for all the attributes (P < 0.05). The mean
intensity values for each sensory attribute of the fruit filling samples were
mapped on a spider web plot. Since the general pattern of the set of
samples containing 25 g of fruit/100g (data not shown) was similar to that
of the sample set with 50g of fruit/100g results, only the latter is shown
(Figure 1). The only significant differences between the two sets (25g
and 50g fruit) were that the samples with the higher fruit content were
rated as more acid and fruitier.
Considering the texture-related attributes, as expected, the thickener
systems had the greatest effect on the scores. The pectin-TS (P) and C
samples showed quite similar profiles whereas the TS samples behaved
differently, exhibiting greater consistency, stickiness, residence time in
the mouth and mouthcoating and less fluidity and elasticity.
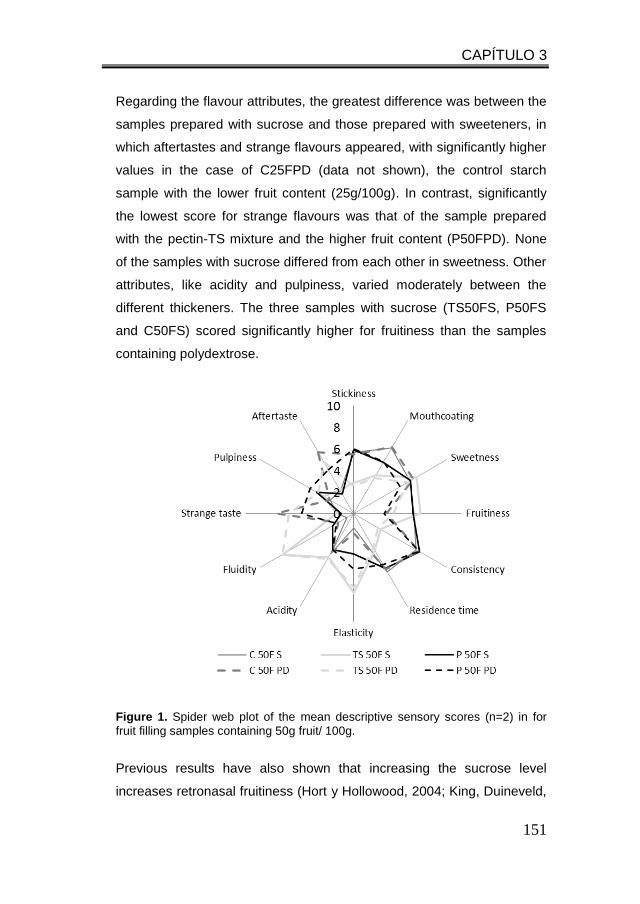
CAPÍTULO 3
151
Regarding the flavour attributes, the greatest difference was between the
samples prepared with sucrose and those prepared with sweeteners, in
which aftertastes and strange flavours appeared, with significantly higher
values in the case of C25FPD (data not shown), the control starch
sample with the lower fruit content (25g/100g). In contrast, significantly
the lowest score for strange flavours was that of the sample prepared
with the pectin-TS mixture and the higher fruit content (P50FPD). None
of the samples with sucrose differed from each other in sweetness. Other
attributes, like acidity and pulpiness, varied moderately between the
different thickeners. The three samples with sucrose (TS50FS, P50FS
and C50FS) scored significantly higher for fruitiness than the samples
containing polydextrose.
Figure 1. Spider web plot of the mean descriptive sensory scores (n=2) in for
fruit filling samples containing 50g fruit/ 100g.
Previous results have also shown that increasing the sucrose level
increases retronasal fruitiness (Hort y Hollowood, 2004; King, Duineveld,
CAPÍTULO 3
152
Arents, Meyners, Schroff y Soekhai , 2007). According to Boland, Buhr,
Giannouli, and van Ruth, 2004), the effects of hydrocolloids on flavour
release may be due to two mechanisms: one is the physical entrapment
of flavour molecules within the food matrix and the second involves
interactions between the flavour molecules and the gel components. On
comparing several types of gels, these authors found that ten flavour
compounds had higher partition coefficients in pectin gel than in starch
gel.
The samples with the lower fruit content (25g/100g), particularly the one
prepared with the control starch (C25FS), scored slightly but significantly
higher for sweetness.
3.4 Sensory-instrumental correlations. Principal Component
Analysis (PCA)
A PCA was calculated from the instrumental analysis and descriptive
analysis data (Figure 2). The three first components accounted for
87.62% of the variability in the results. The first component (PC1)
explained 53.41% of the variance. It was mainly defined by texture-
related parameters, measured both sensorially and instrumentally (G’,
G”, mouthcoating, consistency, residence time in the mouth, AUC, FMax,
stickiness, fluency, elasticity).
The second component (PC2) explained 18.70% of the variance and was
mainly defined by taste attributes (strange taste, aftertaste, fruitiness).
The third component (PC3) contributed a further 15.51% of the variance,
mainly explained by the attributes of pulpiness, acidity and sweetness,
which were not very well represented in the space defined by the two first
components. Figure 2 shows two-dimensional maps of the attributes and
samples in the space defined by the first three PCA components. (1 vs 2
in figures 2a and 2b and 1 vs 3 in figures 2c and 2d). The PCA results
confirmed several of the results obtained by other methods and
CAPÍTULO 3
153
discussed in previous sections. The trained panel considered the
samples made with the control starch (C) – and, to a lesser extent, those
with the pectin-TS mixture (P) – to be consistent, sticky, with longer
residence times in the mouth and more mouthcoating. These parameters
were closely related to the instrumental measurements of G’, G”, AUC
and F Max. A high positive correlation was found between various
sensory parameters. Consistency and residence time were related to
stickiness, which in turn was positively correlated with the extrusion
parameters of area under the curve (AUC), taken as an index of
consistency, and maximum force (FMax), indicative of the product
firmness index. Another high positive correlation was found between
mouthcoating and the instrumental measurements of the viscoelasticity
parameters G’ and G’’, indicating that as the gel structure became
stronger (higher G’ and G’’ values), the trained panel perceived greater
mouthcoating (correlation coefficient values not shown). Conversely, the
TS samples, which had a weaker gel structure, were perceived as fluid
and elastic and were placed in the opposite quadrant to samples C and
P. The samples with the higher fruit content (50 g/100 g) were placed
further left along the component 1 axis than those which contained 25
g/100 g, confirming that the fruit strengthened the gel structure. In the
same way, logically, a negative correlation was found between fluidity
and consistency, stickiness, residence time in the mouth and the
instrumental extrusion parameters of AUC and F Max: as expected, the
greater the fluidity the lower the consistency indicator values, and
because the filling was more fluid (so dissolved and disappeared more
rapidly from the mouth) the residence time was perceived as being lower.
A negative correlation was found between elasticity, mouthcoating and
the viscoelastic loss modulus G’, indicating that consumers perceived
more elasticity and less mouthcoating for the samples with a smaller loss
modulus (a less structured gel).
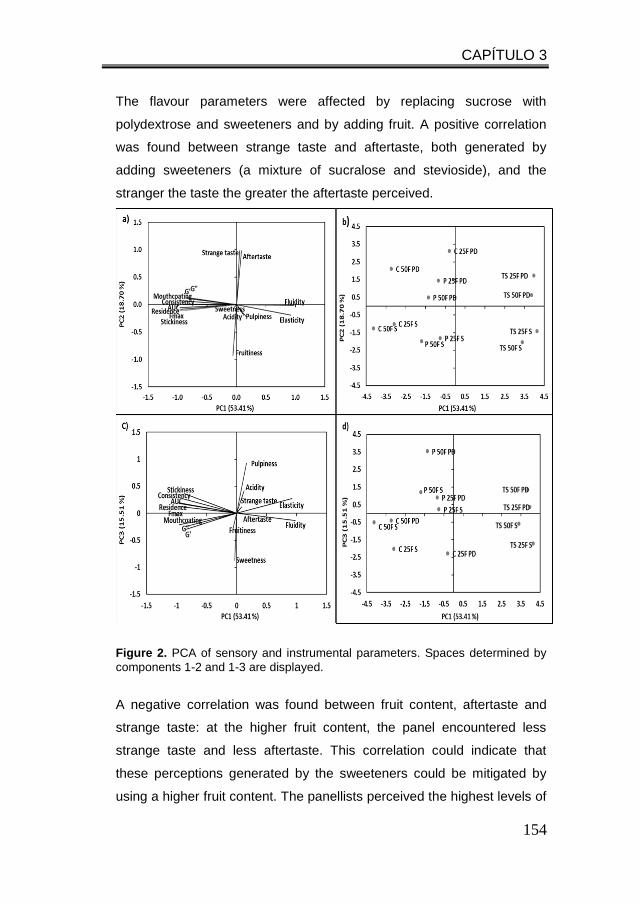
CAPÍTULO 3
154
The flavour parameters were affected by replacing sucrose with
polydextrose and sweeteners and by adding fruit. A positive correlation
was found between strange taste and aftertaste, both generated by
adding sweeteners (a mixture of sucralose and stevioside), and the
stranger the taste the greater the aftertaste perceived.
Figure 2. PCA of sensory and instrumental parameters. Spaces determined by
components 1-2 and 1-3 are displayed.
A negative correlation was found between fruit content, aftertaste and
strange taste: at the higher fruit content, the panel encountered less
strange taste and less aftertaste. This correlation could indicate that
these perceptions generated by the sweeteners could be mitigated by
using a higher fruit content. The panellists perceived the highest levels of
CAPÍTULO 3
155
strange taste and aftertaste in the polydextrose and sweetener samples,
especially those prepared with the control starch and the lower fruit
content (C25FPD). The samples prepared with the higher fruit content
(50g/100g) were perceived as pulpier. This perception was greatest for
the sample prepared with pectin/TS and polydextrose (P50FPD). The
samples with more fruit were also perceived as being more sour, with the
highest acidity scores being given to those prepared with the pectin/TS
mixture and polydextrose (P50FPD) and with TS alone and polydextrose
(TS50FPD). The samples perceived as having the sweetest taste were
those prepared with sucrose and the lower fruit content (25 g/100g). The
sweetest was C25FS. A study by Broomes and Badrie (2010) of
reduced-sucrose jams with a low solid content, using low methoxyl pectin
as a thickener and Splenda (sucralose and maltodextrin) as a sweetener,
found very high acceptability and no significant differences in sweetness
compared with jams made with sucrose. They found a clean sweet taste
similar to that of sucrose but low acceptability for the texture, as the solid
content was very low and (unlike in the present study) no bulking agent
was used to provide the solids removed through replacing the sucrose
with the sweetener.
3.5 Consumer tests
3.5.1 Overall liking, consistency liking and flavour liking.
Due to the mostly similar behaviour of the high/low fruit systems, the
samples with the highest fruit content (50g/100g) were selected for
consumer testing as they had a fruitier flavour. The samples assessed
were C50FS, C50FPD, TS50FS, TS50FPD, P50FS and P50FPD. The
consumers assessed overall liking, consistency liking, and flavour liking.
The overall liking values for the samples ranged between 4.2 and 6.8 (on
a 9-point scale) (Table 5).
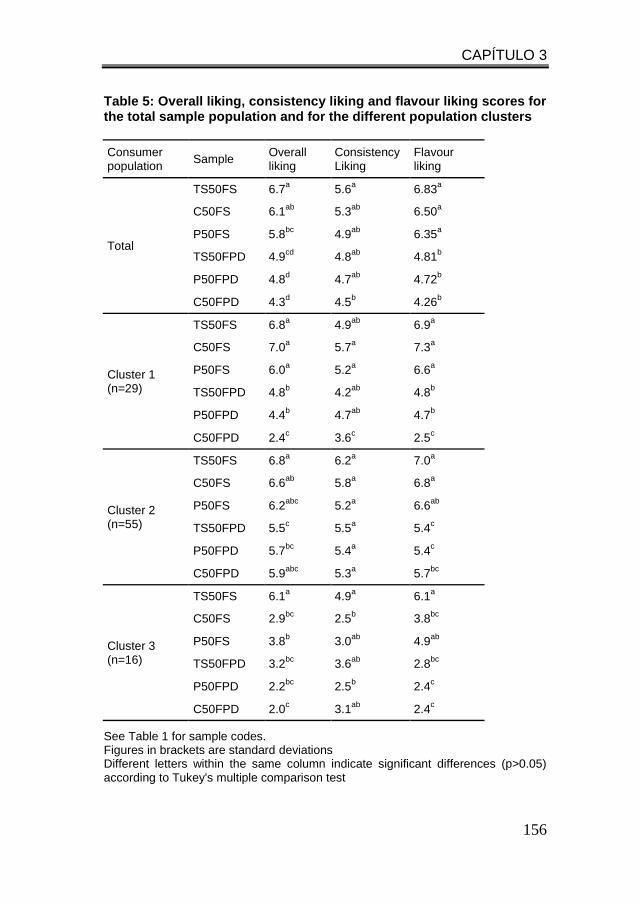
CAPÍTULO 3
156
Table 5: Overall liking, consistency liking and flavour liking scores for the total sample population and for the different population clusters
Consumer population
Sample Overall liking
Consistency Liking
Flavour liking
Total
TS50FS 6.7a 5.6
a 6.83
a
C50FS 6.1ab
5.3ab
6.50a
P50FS 5.8bc
4.9ab
6.35a
TS50FPD 4.9cd
4.8ab
4.81b
P50FPD 4.8d 4.7
ab 4.72
b
C50FPD 4.3d 4.5
b 4.26
b
Cluster 1 (n=29)
TS50FS 6.8a 4.9
ab 6.9
a
C50FS 7.0a 5.7
a 7.3
a
P50FS 6.0a 5.2
a 6.6
a
TS50FPD 4.8b 4.2
ab 4.8
b
P50FPD 4.4b 4.7
ab 4.7
b
C50FPD 2.4c 3.6
c 2.5
c
Cluster 2 (n=55)
TS50FS 6.8a 6.2
a 7.0
a
C50FS 6.6ab
5.8a 6.8
a
P50FS 6.2abc
5.2a 6.6
ab
TS50FPD 5.5c 5.5
a 5.4
c
P50FPD 5.7bc
5.4a 5.4
c
C50FPD 5.9abc
5.3a 5.7
bc
Cluster 3 (n=16)
TS50FS 6.1a 4.9
a 6.1
a
C50FS 2.9bc
2.5b 3.8
bc
P50FS 3.8b 3.0
ab 4.9
ab
TS50FPD 3.2bc
3.6ab
2.8bc
P50FPD 2.2bc
2.5b 2.4
c
C50FPD 2.0c 3.1
ab 2.4
c
See Table 1 for sample codes. Figures in brackets are standard deviations Different letters within the same column indicate significant differences (p>0.05) according to Tukey's multiple comparison test
CAPÍTULO 3
157
Significantly the highest overall liking score was obtained by the TS-
alone fruit filling with sucrose. Flavour liking values did not presented
differences due to the thickener system but they did due to the presence
of the intense sweeteners. Liking for the flavour fell into two groups: the
samples containing sucrose and those containing sweeteners and
polydextrose. In both groups, the TS-alone fruit filling samples were the
most liked.
In all three liking modalities, the least-liked sample was the one made
with the control starch and no sucrose. The QDA (section 3.3) showed
that this sample had a more intense strange flavour and aftertaste and
greater mouthcoating, which were deduced to be the reasons for its
being the least liked, whereas its pulpiness, acidity, sweetness and
fruitiness attributes were intermediate compared to the samples with
other thickeners. Conversely, the flavour profile of the TS-alone samples
presented greater acidity and fruitiness. Additionally, they were described
as being less consistent and more fluid even though their consistency
liking values were not significantly different to those of other samples.
Tapioca starch is said to be very clean in flavour and does not mask the
flavours (International Starch Institute, 2014).
3.5.2 Attribute adequacy and its relation to liking – Penalty Analysis
(PA)
The samples assessed on the JAR scales were the six with the higher
fruit content, with each of the three thickener systems being prepared
with and without sucrose (C50FS, C50FPD, TS50FS, TS50FPD, P50FS
and P50FPD).
Penalty analysis (PA) helps to identify potential product improvements
that may bring a product closer to the “ideal” and so increase its overall
liking. Being an attribute-by-attribute analysis, various potential product
improvements can be prioritized by focusing the greatest attention on the
CAPÍTULO 3
158
attributes in the upper right-hand corner of the PA plots (Popper, 2014).
The JAR scales were used to identify to what degree the products fails to
deliver its optimum and to gain a better understanding of the attributes
that most affected liking ratings (Plaehn y Horne, 2008).
An attribute was considered susceptible of modification when the
respondent percentage was higher than 20% (Xiong y Meullenet, 2006)
and the penalty score (drop in overall liking) was higher than 1 (Figure 3).
An attribute in the upper right-hand corner of the PA plot (a high number
of consumers saying the attribute level was not right, with a big impact on
overall liking) is more penalising than an attribute placed in the lower left-
hand corner (a few consumers saying the attribute level was not right
with a small impact on overall liking).
In general, the PA of the JAR data found that the most balanced sample
was TS50S (tapioca starch and sucrose), which had the least drop in
liking compared to the rest of the products assessed: less than 1.8 and
among fewer than 45% of the subjects (Figure 3). In principle there
would be no need to make major adjustments to this sample, particularly
since the attribute that seems to be most penalizing is consistency, on
which the consumers’ opinions were divided (more than 20% stating “too
much” and more than 30% “not enough”), suggesting some
segmentation in their opinion regarding the optimal consistency.
Furthermore, some consumers considered it had little fruit flavour,
although that did not lead to a big drop in liking (less than 1). The good
adequacy of the attributes in general was in line with the fact that TS50S
was the sample that scored highest for overall liking (section 3.5.1, Table
5).
The samples with sweeteners were the most unbalanced, obtaining the
highest drops in liking in a number of attributes; the consumers were
generally of the opinion that all of them had little fruit flavour, with 55% of
consumers finding this fault with the control starch sample with
polydextrose and sweetener (C50FPD, with a 2-point drop in liking) and
CAPÍTULO 3
159
70% penalising this lack of fruit flavour in a further two samples
(TS50FPD and P50FPD, with a 1.5-point drop in liking in both cases).
Sweetness and acidity also attracted penalties although the consumers
were divided on these: some considered the samples with sweeteners
insufficiently sweet or lacking in acidity, while others considered them
much too sweet or much too sour. In the case of C50FPD, over 50% of
the consumers considered it not sweet enough, with a drop in liking of
more than 2 points, but nearly 25% found it too sweet and over 40% too
sour, with a drop in liking of 1.5 points. Nearly 50% of the consumers
believed that sample P50FPD was not sweet enough, with a 1-point drop
in acceptability.
The consumers were also divided regarding acidity (Figure 3). The
samples with sweeteners scored the lowest on overall liking, particularly
C50FPD, which was rated highest for strange taste, aftertaste and
sweetness in the QDA (Table 5 and section 3.3).
In general, a lack of fruit flavour was a penalising attribute for almost all
the samples, not just for those made with polydextrose and sweeteners.
The least penalised was T50FS: though 60% consumers considered it
had insufficient fruit flavour, this did not cause a major drop in liking. The
fact that the fruit flavour was considered “not enough” in most cases
could in a way be an example of how consumer perceptions of the
intrinsic desirability of certain attributes may influence a JAR response,
as attributes that have a positive halo have a tendency to be rated
always as “not enough” (Popper, 2014).
The consistency of the fruit filling attracted penalties in almost all the
control starch and pectin-TS mixture samples. The control starch
samples (C50FS and C50FPD) were considered too consistent by
almost 65% and 55% of the consumers respectively with a 2-point drop
in liking for both.

CAPÍTULO 3
160
Figure 3. Penalty analysis of the samples containing 50% fruit. Representation of
significant penalties (mean drops in liking) vs. the percentage of consumers. The cut-off point was 20% of consumers stating that an attribute was “not enough” (-) or “too much” (+).
CAPÍTULO 3
161
“Too consistent” was the main penalising attribute for the pectin-TS
mixture, where it was noted by 70% of the consumers and caused a 1.5-
point drop in overall liking in the case of P50FS, and by 60% of
consumers with a 1-point drop in acceptability for the P50FPD sample.
For an untrained consumer, consistency can be a somewhat complex
attribute to measure. The trained panel was able to assess a number of
texture parameters separately (consistency, fluidity, elasticity, stickiness,
mouthcoating and residence time in the mouth). These attributes are
easily rated by a trained person but there is usually less consensus
among untrained consumers, who may not all be paying attention to the
same characteristics or in-mouth sensations. The trained panel rated the
samples with tapioca starch alone as having little consistency and
considerable fluidity but the consumers’ tastes were divided between
those that preferred the harder samples (more viscous and consistent)
and those who preferred the softer ones (less viscous, less consistent or
more fluid). According to Popper (2014), polarization may also be the
result of a problem with the quality of an attribute, rather than its quantity.
From the instrumental measurements (Table 4) and QDA (section 3.3) it
is clear that the samples prepared with the control starch and the pectin-
TS mixture presented greater indications of high consistency, as
reflected in the higher G’, G’’, AUC and F max values, while the TS-alone
samples had the lowest values for these parameters. It would appear
that the consumers liked a less consistent product (Table 5).
As expected, the sweetness liking scores were not the same in the
sucrose samples as in those prepared with the sweetener mixture, which
generally did not manage to reproduce the sweetness profile of sucrose.
Some consumers found the samples insufficiently sweet and others
found them too sweet. The present study used a 1:1 ratio of stevioside
and sucralose, with different sweetness profiles which could be affected
in turn by the fruit filling matrix formed with the different thickeners. Some
CAPÍTULO 3
162
studies have described bitter characteristics of stevioside. Cardoso and
Bolini (2007) found that the sweetness ratio of a peach nectar was lower
with stevia than with other sweeteners. A possible explanation for this
fact is that stevia has a characteristic bitter taste, especially at high
concentrations. In a study with yogurt, it had a high-quality time-intensity
profile, quite similar to that of sucrose, and its perceived sweetness was
fast, persisted for slightly longer than that of sucrose and did not present
any metallic aftertaste (Pinheiro, Oliveira, Penna, y Tamine, 2005).
Cadena et al. (2013) found that mango nectar samples with stevia
presented the greatest intensity of residual bitterness and a decrease in
mango flavor. Cadena and Bolini (2011) encountered a different time of
maximum intensity and longer duration of the sweetness in ice cream
with sucralose, suggesting that the residual sweetness of this ice cream
was lower. Sucralose is reported to have a relatively clean, sweet taste
with little persistence of bitterness (Zhao y Tepper, 2007).
The above results show that sucrose replacement is not an easy task.
From the results of the present study it may be concluded that the
stevioside was the main cause of strange tastes and aftertastes in the
fruit filling samples prepared with the sweetener mixture. Texture is an
important factor for the perception of flavour. Boland, Delahunty, and Van
Ruth (2006), analysing pectin and gelatine gels, found that increased gel
rigidity resulted in lower air/gel partition coefficients, higher maximum
concentrations of volatiles and lower release rates during in-nose
analysis, decreased perception of odour, strawberry flavour and
sweetness, and higher intensity ratings for thickness in sensory analysis.
Consequently, both the type of hydrocolloid and the rigidity of the sample
greatly affected flavour release and perception.
The possibility of finding populations with different preferences was
studied in greater detail through cluster analysis (see section 3.5.3).
CAPÍTULO 3
163
3.5.3 Liking segmentation - Cluster Analysis
The above mentioned high proportion of responses on both sides of “just
right” for the same attribute may suggest the presence of various
segments within the consumer population being tested. Consumers
might have different ideal attribute levels. For example, one group of
consumers (segment) could prefer a lower level of sweetness while
another could prefer a sweeter sample. In this case it could be difficult to
achieve a level that is ideal for everyone and the solution could
sometimes be to develop two products that target the different groups
(Rothman, 2007). Based on these observations, a hierarchical cluster
analysis was run on the overall liking data. Agglomerative Hierarchical
Clustering (AHC) is an iterative classification method that supplies
(among other results) a dendrogram that shows the progressive grouping
of the data graphically, which is then used to decide how many clusters
or groups of consumers with different liking patterns to consider. In order
to be actionable for guidance in the product development process, the
clusters obtained in this way have to be both consistent, in terms of
having really distinct liking patterns, and understandable when looking at
the other available information on the products (sensory data for
example) (Varela, 2013).
AHC clearly showed a division into three groups (Table 5): one that
rejected the samples without sucrose (cluster 1, n=29), another that
rather liked all the samples (cluster 2, n=55) and a third that only liked
the TS-alone sample with sucrose and strongly rejected all the others
(cluster 3, n=16). Those liked by cluster 1 presented a taste profile that
the QDA identified as the samples with sucrose (TS50FS, C50FS and
P50FS), which had slightly more acidity, sweetness and fruit flavour than
the samples prepared without sugar and also presented less strange
taste and aftertaste than those prepared with sweeteners. Texture was a
less important factor. When looking at the flavour liking and consistency
CAPÍTULO 3
164
liking, cluster 1 consumers distinguished the samples more on their taste
than their texture. It is clear that this subpopulation did not like the flavour
of the sweeteners in the PD samples at all.
For cluster 2 consumers, consistency again seems not to have been a
very important factor (there were no significant differences in liking) and
the flavour liking scores were significantly higher for the samples
prepared with sucrose, but all the samples rated highly on overall liking.
Cluster 3 consumers attached most importance to flavour. In particular,
they liked the samples with tapioca starch alone the most, both on
flavour and on texture, and gave the other samples significantly lower
scores. The QDA found that the TS samples had the most balanced
flavour. Even the TS sample without sugar (TS50FPD) exhibited a good
acidity, sweetness and fruit flavour profile and had little strange taste or
aftertaste compared to the other samples with sweeteners. The different
responses to flavour and consistency among the clusters would explain
the PA results.
4. CONCLUSIONS
From the results obtained it is evident that the consumers’ preferences
were segmented. There was a consumer niche for fruit fillings with a
bland, soft texture and a sweet, acid, and highly fruity taste,
corresponding to the sensory profile of the sample prepared with native
tapioca starch and sucrose. This group could be described as preferring
a “home-made style” and a natural, clean label product. Another group
clearly rejected the flavour with the intense sweeteners, so if the goal is
to launch a fruit filling without sugar (sucrose), in-depth studies should be
made to formulate a new sweetness profile for this population or to make
a greater effort to discover how to inform the consumers of the benefits
of calorie saving and diabetes/weight control, in fitting with a healthier
diet and lifestyle pattern. Finally, a big consumer group liked both the
CAPÍTULO 3
165
sucrose and non-sucrose samples, so all the formulations proposed
would fit its preferences. This study has demonstrated the relevance of
taking consumer preference segmentation into account and the
adequacy of the sensory methods and techniques used in food product
design.
ACKNOWLEDGEMENTS
The authors are grateful to Sucroal S.A. (Colombia) and SENA (Servicio
Nacional de Aprendizaje de Colombia) for funding the PhD studies of
Maria Alejandra Agudelo (Sucroal S.A.) at the Polytechnic University of
Valencia and to the Spanish Ministry of Science and Innovation for
financial support (AGL2012-36753-C02-01). They would also like to
thank Mary Georgina Hardinge for translating this paper into English.
REFERENCES
Agudelo, A., Varela, P., Sanz, T., y Fiszman S.M. (2014a). Native tapioca starch as
a potential thickener for fruit fillings. Evaluation of mixed models containing low-
methoxyl pectin. Food hydrocolloids, 35, 297-304.
Agudelo, A., Varela, P., Sanz, T., y Fiszman S.M. (2014b). Formulating fruit fillings.
Freezing and baking stability of a tapioca starch-pectin mixture model. Food
Hydrocolloids, 40, 203-213.
Aidoo, R., Afoakwa, E., y Dewettinck, K. (2014) Optimization of inulin and
polydextrose mixtures as sucrose replacers during sugar-free chocolate
manufacture-Rheological, microstructure and physical quality characteristics.
Journal of Food Engineering, Volume 126, 35-42.
Amerbach, M., y Craig, S. (2008). Bulking agents: multifunctional ingredients. In H.
Mitchell (Ed), Sweeteners and sucrose alternatives in food Technology (PP 372-
375). Chichester U.S.A.: Blackwell Publishing.
CAPÍTULO 3
166
Angioloni, A., y Collar, C. (2009). Small and large deformation viscoelastic
behaviour of selected fibre blends with gelling properties. Food Hydrocolloids, 23,
742-748.
Arocas, A., Sanz, T., y Fiszman, S. M. (2009). Influence of corn starch type on the
rheological properties of a white sauce after heating and freezing. Food
Hydrocolloids, 23, 901-907.
Basu, S., Shivhare, U.S. y Singh, T.V. (2013).Effect of substitution of stevioside
and sucralose on rheological, spectral, color and microstructural characteristics
of mango jam. Journal of Food Engineering, 114, 465-476.
Broomes , J. y Badrie, N. (2010)Effects of Low-Methoxyl Pectin on
Physicochemical and Sensory Properties of Reduced- Calorie Sorrel/Roselle
(Hibiscus sabdariffa L.) Jams. The Open Food Science Journal, 4, 48-55.
Boland, A., Buhr, B., Giannouli, P., y Van Ruth, S.M. (2004). Influence of gelatin,
starch, pectin and artificial saliva on release of 11 flavour compounds from model
gel systems. Food chemistry, 86, 401-411.
Boland, A.B., Delahunty, C.M., yVan Ruth, S.M. (2006), Influence of the texture of
gelatin gels and pectin gels on strawberry flavour release and perception. Food
chemistry, 96, 452-460.
Cadena, R. S., y Bolini, H. M. A. (2011). Time-intensity analysis and acceptance
test for traditional and light vanilla ice cream. Food Research International, 44,
677–683.
Cadena, R. S., Cruz, A. G., Netto, R. R., Castro, W. F., Faria, J. D. A. F., Bolini, H.
M. A. (2013). Sensory profile and physicochemical characteristics of mango
nectar sweetened with high intensity sweeteners throughout storage time. Food
Research International, 54, 167-1679.
Cardoso, J.M., y Bolini, H.M. (2007). Different sweeteners in peach nectar: Ideal
and equivalent sweetness. Food Research International, 40, 1249-1253.
CAPÍTULO 3
167
Cevoli, C, Balestra, F., Ragni, L, y Fabbri, A. (2013). Rheological characterisation
of selected food hydrocolloids by traditional and simplified techniques. Food
Hydrocolloids, 33, 142-50.
Costa, A. I. A., y Jongen, W.M.F. (2006). New insights into consumer-led food
product development. Trends in Food Science y Technology, 17, 457-465.
Fraeye, I., Colle, I., Vandevenne, E., Duvetter, T., Van Buggenhout, S.,
Moldenaerrs, P., Van Loey, A., y Hendrickx, M. (2010). Influence of pectin
structure on texture of pectin–calcium gels. Innovative Food Science and
Emerging Technologies, 11, 401-409.
Galkowska, D., Dlugosz, M., y Juszczak, L. (2013). Effect of high methoxy pectin
and sucrose on pasting, rheological, and textural properties of modified starch
systems. Starch/Starkes, 65, 499-508.
Gisslen, W. (2012). Fillings. In: Professional baking 6th edition (p. 293). New
Jersey: John Wiley y Sons.
Grosso, C. R. F., y Rao, M. A. (1998). Dynamic rheology of structure development
in low-methoxyl pectin plus Ca+2 sucrose gels. Food Hydrocolloids, 12, 357-363.
Grujić, S., Grujić, R., y Poljašević, J. (2010). Effect of food additives on sensory
characteristics of thermo-stable marmalade, Electronic Journal of Polish
Agricultural Universities, 13(2), 11. Website:
http://www.ejpau.media.pl/volume13/issue2/art-11.html.
Grunert, K.G., y Valli, C. (2001). Designer-made meat and dairy products:
consumer-led product Development. Livestock Production Science, 72, 83-98.
Hicsasmaz, Z., Yazgan, Y., Bozoglua, F., y Katnas, Z. (2003). Effect of
polydextrose-substitution on the cell structure of the high-ratio cake system.
Lebensm.-Wiss. U.-Technol, 36, 441-450.
Hort, J., y Hollowood, T. A. (2004). Controlled continuous flow delivery system for
investigating taste–aroma interactions. Journal of Agricultural and Food
Chemistry, 52, 4834-4843. http://www.starch.dk/isi/applic/ tapiocafood.htm
CAPÍTULO 3
168
Hyvonen, L., y Torma, R., 1983. Examination of sucrose, sucrose alcohols, and
artificial sweeteners as substitutes for sucrose in strawberry jam: product
development. Journal of Food Science. 192, (48), 183-185.
ISO. (2007). Sensory analysis General guidance for the design of test room.
Standard No 8589. Geneva, Switzerland: International Organization for
Standardization.
International Starch Institute, 2014. International Starch Trading, Tapioca Food
Starch. Retrieved from http:www.Starch.dk/ISI/applic/tapiocafood. htm
King, B. M., Duineveld, C. A. A., Arents, P., Meyners, M., Schroff, S. I., y Soekhai
S.T. (2007. Retronasal odor dependence on tastants in profiling studies of
beverages. Food Quality and Preference, 18, 286–295.
Lawless, H.T., y Heymann, H. (1998). Sensory Evaluation of Food: Principles and
Practices. New York: Chapman y Hall.
Melo, L. L. M. M., Bolini, H. M.A., y Efraim, P. (2009). Sensory profile, acceptability,
and their relationship for diabetic/reduced calorie chocolates. Food Quality and
Preference, 20, 138–143.
Nabors L.O., 2001. Alternative sweeteners: an overview. In: Alternative Sweeteners
(edited by L.O. Nabors), New York, U.S.A., Marcel Dekker.
Pereira, P. A. P., de Souza, V. R. , Teixeira, T. R. , Queiroz, F. , Borges, S. V. , y
Carneiro, J. D. D. S. (2013). Rheological behavior of functional sucrose-free
guava preserves: Effect of the addition of salts. Food Hydrocolloids, 31, 404-412.
Pinheiro, M.V.S., Oliveira, M.N. Penna, A.L.B., y Tamine A.Y. (2005).The effect of
different sweeteners in low-calorie yogurts a review, International Journal of
Dairy Technology, 58(4), 193-199.
Plaehn, D., y Horne, J. (2008). A regression-based approach for testing
significance of “just-about-right” variable penalties. Food Quality and Preference,
19, 21-32.
CAPÍTULO 3
169
Popper, R. (2014). Use of Just-About-Right Scales in Consumer Research. In:
Novel Techniques in Sensory Characterization and Consumer Profiling. Eds:
Varela, P. y Ares, G. Boca Raton, FL Ed. CRC Press - Taylor y Francis. Pp. 137-
155.
Prakash, I., DuBois, G. E., Clos, J. F., Wilkens, K. L., y Fosdick, L. E. (2008).
Development of rebiana, a natural, non-caloric sweetener. Food and Chemical
Toxicology, 46, S75–S82.
Rothman, L. (2007). The use of just-about-right (JAR) scales in food product
development and reformulation. In H. Macfie (Ed.), Consumer-led food product
development, pp. 407-433, Woodhead Publishing in Food Science, Technology
and Nutrition. USA.
Schirmer, M., Jekle, E., Arendt, T., Becker, T. (2012). Physicochemical interactions
of polydextrose for sucrose replacement in pound. (Food Research International,
48, 291-298.
Stone, H., y Sidel, J.L. (2004). Quantitative Descriptive Analysis (The QDA
Method), Sensory Evaluation Practices, Elsevier Academic Press, San Diego,
CA.
Suutarinen, M. (2002). Effects of prefreezing treatments on the structure of
strawberries and jams, Ph.D. thesis, VTT, Helsinki University of Technology,
Finland.
Van Kleef, E., Van Trijp, H. C. M., y Luning, P. (2005). Consumer research in the
early stages of new product development: a critical review of methods and
techniques. Food Quality and Preference, 16, 181-201.
Varela, P. (2013). Chapter 11: Application of multivariate statistical methods during
new product development. Case study: application of principal component
analysis and hierarchical cluster analysis on consumer liking data of orange
juices. In: Mathematical and Statistical Methods in Food Science and
Technology. Eds: D. Granato y G. Ares. Hoboken, NJ 07030. Ed. John Wiley y
Sons, Inc. ISBN: 978-1-118-43368-3.
CAPÍTULO 3
170
Xiong, R., y Meullenet, J-F. (2006). A PLS dummy variable approach to assess the
impact of jar attributes on liking. Food Quality and Preference, 17, 188–198.
Young, N. W. G., Kappel, G., y Bladt, T. (2003). A polyuronan blend giving novel
synergistic effects and bake-stable functionality to high soluble solids fruit fillings.
Food Hydrocolloids, 17, 407-418.
Zhao, L., y Tepper, B. J. (2007). Perception and acceptance of selected high-
intensity sweeteners and blends in model soft drinks by propylthiouracil (PROP)
non-tasters and super-tasters. Food Quality and Preference, 18, 531–540.
CAPÍTULO 4
Methods for a deeper understanding of the sensory perception of fruit fillings
Alejandra Agudelo, Paula Varela and Susana Fiszman
Instituto de Agroquímica y Tecnología de Alimentos (CSIC).
Valencia – Spain
Enviado a Food Hydrocolloids

CAPÍTULO 4
173
ABSTRACT
Variations in ingredients essentially affect the quality of soft gelled systems
in terms of texture. In two previous papers the authors studied instrumental
(rheometer, texture analyser) parameters in gelled fruit systems with three
different thickeners. The sensory perception of soft gelled systems is a
rather subtle issue. Their oral processing is quite limited in terms of
chewing, as almost no mastication or bolus formation is required. However,
a number of textural features assessed during their consumption can
modulate their perceived flavour and several relatively new sensory
evaluation techniques can provide a deeper understanding of the
perception of soft gelled systems.
In the present work, six fruit gels were prepared with three different gelling
systems: tapioca starch alone (TS), modified waxy corn starch (C), and a
mixed system with tapioca starch plus pectin (P). Each of these was
prepared with sucrose or with polydextrose and intense sweeteners. The
samples were subjected to two sensory techniques: Temporal Dominance
of Sensations (TDS) with trained assessors (evaluating the texture and
flavour modalities separately) and a check-all-that-apply questionnaire with
consumers, including the evaluation of an “ideal fruit filling”. Finally, the
results were correlated with the consumers’ liking for the samples. The
results indicated that flavour TDS curves mainly depended on the type of
sweetener (sugar or intense sweetener) while, as expected, the texture
TDS curve patterns were dependent on the type of thickener system. The
best-liked set of samples was that with sugar (demonstrating that flavour
dominated over texture) and, among these, TS was the preferred
hydrocolloid system, for its creamy, fondant texture.
CAPÍTULO 4
174
1. INTRODUCTION
Product reformulation to fit consumer demands and segmentation is an
immensely important activity when designing food. It is said that product
quality is a major determinant of consumer choice. However, “quality” is a
somewhat vague concept. In the case of soft gelled products (fruit fillings,
jams, etc.), it is evident that the ingredients, particularly hydrocolloids,
affect their quality in terms of both physical properties (instrumental texture
and rheological) (Basu, Shivhare, y Singh, 2013) and sensory properties,
which are not always taken into account sufficiently in the product design
phase. In particular, it is important to understand the relationships between
the perception of the gel texture and its structure (Renard, van de Velde y
Visschers, 2006) and how it, in turn, can modulate the perception of the
flavour attributes. People like to be in full control of the food placed in their
mouth. In the case of gels, gummy or slimy products or those containing
unexpected lumps or hard particles are rejected (Grujić, Grujić, y
Poljasević, 2010). In the world of food hydrocolloid applications, rheological
properties are very widely studied to assess all the components’ technical
functionality in product development and quality control and to correlate
them with sensory attributes (Dervisi, Lamb y Zabetakis, 2001). However,
perceived texture is a very complex sensory issue that comprises
numerous different channels. Texture perception can involve one or many
stimuli, including visual, auditory, tactile and kinaesthetic factors, working in
combination. While seeing and touching can provide useful information,
oral processing is the most important stage of textural perception and
appreciation. Oral processing of food involves a series of complex
operations, including grip and first bite, first stage transportation, chewing,
second stage transportation, bolus formation, and swallowing. Texture
perception and appreciation is a dynamic process, based on the perception
obtained from continuous oral destruction (and breakdown) of food material
CAPÍTULO 4
175
(Chen, 2009). In the case of soft gels these steps are simplified slightly
since almost no particle reduction is necessary and insalivation and bolus
formation are much milder operations, but other sensations such as
creaminess or fondant become important. A study with consumers that
explored the vocabulary of texture highlighted the importance of
creaminess, since it was the most frequently cited texture term, mentioned
by more than 50% of the participants (Antmann, Ares, Varela, Salvador,
Coste, y Fiszman, 2011). Variations in ingredients or their concentration
usually lead to changes in gel structures being perceived by the consumers
through what is called mouth-feel. Mouth-feel has been defined as the
sensory experience derived from the sensation in the mouth or on the
tongue during and after ingestion of a food material (Basu y Shivhare,
2010). It is especially important in semi-solid foods. In gelled materials,
different thickener systems give the final product different consistencies
and are responsible for its main texture features. In fruit fillings (FF), the
fruit pulp interacts with the hydrocolloid matrix in many different ways,
depending on the nature of the matrix (and a number of factors such as
pH, quantity of fruit, type of fruit, fruit puree particle size and solid content).
It provides an acidic and fruity flavour, which in turn is perceived with
differing intensity depending on the solid matrix, and also gives graininess,
depending on the size and distribution of its particles and their integration
into the matrix (Baiano, Mastromatteo, y Del Nobile, 2012; Basu y
Shivhare, 2010; Wei, Wang, y Wu, 2001). Sugar also plays an important
function in giving the FF mass body and a sweet flavour. When sugar is
removed to produce a sugar-free FF, alternative components come to have
a role: bulking agents such as polydextrose contribute body while intense
sweeteners contribute a sweet flavour. However, reformulation is not easy
since the acid/sweetness balance alters the global flavour perception.
In two previous papers (Agudelo, Varela, Sanz y Fiszman 2014 a, b), the
rheological performance and stability of a mixture of native tapioca starch
plus low-methoxyl pectin were studied and compared with a modified
CAPÍTULO 4
176
starch control sample. In an acid medium, an improvement in native starch
performance during processing (freezing or baking) and during long
storage periods was demonstrated. However, one of the most important
steps in the new product development process is identifying the
consumers’ ideal products and directions for product reformulation (Ares,
Dauber, Fernández, Giménez, y Varela, 2014). In product design, one key
step is the selection of a product formulation that is aligned as much as
possible with their sensory preferences (van Kleef, van Trijp, y Luning,
2006). In this regard, one of the main challenges for Sensory and
Consumer Science is to provide actionable information for making specific
changes in product formulation, not just product descriptions (Moskowitz y
Hartmann, 2008; Ares et al., 2014).
CATA (check-all-that-apply) questionnaires are a consumer-friendly
method that is increasingly being used due to their simplicity and ease of
use (Varela y Ares, 2012). In this approach, consumers are presented with
a list of terms and are asked to select those that in their opinion fit the
product. The relevance of each term is determined by calculating its
frequency of selection. The attributes are not limited to sensory aspects but
can also be related to hedonic and emotional aspects, product use and
concept fit (Dooley, Lee, y Meullenet, 2010). The method has been applied
to salty snacks (Adams, Williams, Lancaster, y Foley, 2007), strawberries
(Lado, Vicente, Manzzioni, y Ares, 2010), ice cream (Dooley et al., 2010;
Varela, Pintor, y Fiszman, 2014), chocolate milk desserts (Ares´Deliza,
Barreiro, Giménez, y Gámbaro, 2010), orange-flavoured powdered drinks
(Ares, Varela, Rado, y Giménez 2011a,b) and the texture of milk desserts
(Bruzzone, Ares, y Giménez, 2011). Some of these authors have used it in
addition to hedonic ratings to provide an alternative to classical external
preference maps generated from sensory profiles. Valentin, Chollet,
Lelievre, and Abdi (2012) have recently reviewed the new descriptive
methods in food science and concluded that CATA is powerful enough to
discriminate between samples. Compared with descriptive analysis, the
CAPÍTULO 4
177
main advantage of CATA from both the assessors’ and the experimenter’s
points of view is its great simplicity.
Another aspect which is often overlooked is examining flavour and textural
changes during a masticatory/ consumption sequence. When a food
product is put in the mouth a first impact suddenly appears, producing a
sensation that dominates over others and probably leading to like or dislike
at a certain point. This first sensation is followed by a cascade or sequence
of sensations. To record the emergence of each salient sensation – both
texture- and flavour-related – during the consumption of a food product,
sensory techniques involving the additional dimension of time are required.
The Temporal Dominance of Sensations (TDS) method developed in
recent years makes it possible to record the evolution of sensory
perceptions in the mouth during product tasting (Pineau et al., 2009). This
method has already been used for a number of products with different
texture properties: cereals (Lenfant, Loret, Pineau, Hartmann, y Martin,
2009), dairy products (Pineau et al., 2009), yoghurt (Bruzzone et al., 2009)
and ice cream (Varela, Pintor, y Fiszman, 2014).
The objectives of the present work were 1) to assess three thickener
systems in fruit preparations, using two novel sensory techniques with
consumers (temporal dominance of sensations and check-all-that-apply)
and 2) to link these consumer results with product liking. The three
thickener systems were tapioca starch, modified waxy corn starch and a
tapioca starch-pectin blend, each with sugar or without sugar but with an
intense sweetener plus polydextrose as a bulking agent.
2. MATERIALS AND METHODS
2.1. Ingredients
The ingredients employed were native tapioca starch (TS) (moisture
content 13.7 g/100g, Sucroal S.A., Colombia), citric acid and sodium citrate
CAPÍTULO 4
178
(Sucroal S.A., Colombia), highly cross-linked waxy corn starch,
hydroxypropylated and phosphated (C) (moisture content 12.3 g/100g,
Polartex 6716, Cargill, Martorell, Spain), low methoxyl pectin (P) (33-37%
esterified, moisture content 12 g/100g, Unipectine OB700, Cargill,
Martorell, Spain), anhydrous calcium chloride (Panreac, Spain),
polydextrose (PD), (moisture content 3.2 g/100g, Stalite III, Tate y Lyle,
Decatur IL, US), Rebaudioside B (stevioside, 95% purity, Sucroal S.A.
Colombia), Sucralose (Tate y Lyle, Jurong Island, Singapore) and sugar
(S) (Hacendado, Spain). Fruit purée (F) was obtained from canned peach
halves in light syrup (6.5 degrees Brix, pH 3.8, Hacendado, Spain). The
final moisture content of the fruit purée was 92 g/100g.
2.2. Sample preparation
The samples (Table 1) were prepared in a food processor-cooker
(Thermomix TM 31, Wuppertal, Germany) equipped with temperature and
stirring speed controls. All the samples were prepared at pH 3 and
contained 35g/100g total soluble solids (sucrose or polydextrose and fruit)
and 6 g/100g of the thickener system. Three thickener systems were
employed: a control starch (C), native tapioca starch (TS) and TS with
pectin – 0.6g/100g (P) of the total hydrocolloid system (dry weight basis) –
and calcium ions – 60 mg of calcium ion per gram of pectin.
The first step in preparing the samples was to add the sugar or
polydextrose to part of the water, then the fruit purée (50 g/100g), heat the
mixture to 60°C and stir it at 600 rpm for 5 minutes. In the formulations with
pectin, this was first dispersed in water with a magnetic stirrer at 80°C until
totally dissolved, then allowed to cool to 60°C before adding it to the sugar-
fruit-water or polydextrose-water-fruit mixture. The starch was dispersed in
another part of cold water and added to the sugar- or polydextrose-water-
fruit mixture, continuing to stir and heat the mixture for another 2 minutes.
The intense sweeteners were then added to the samples containing
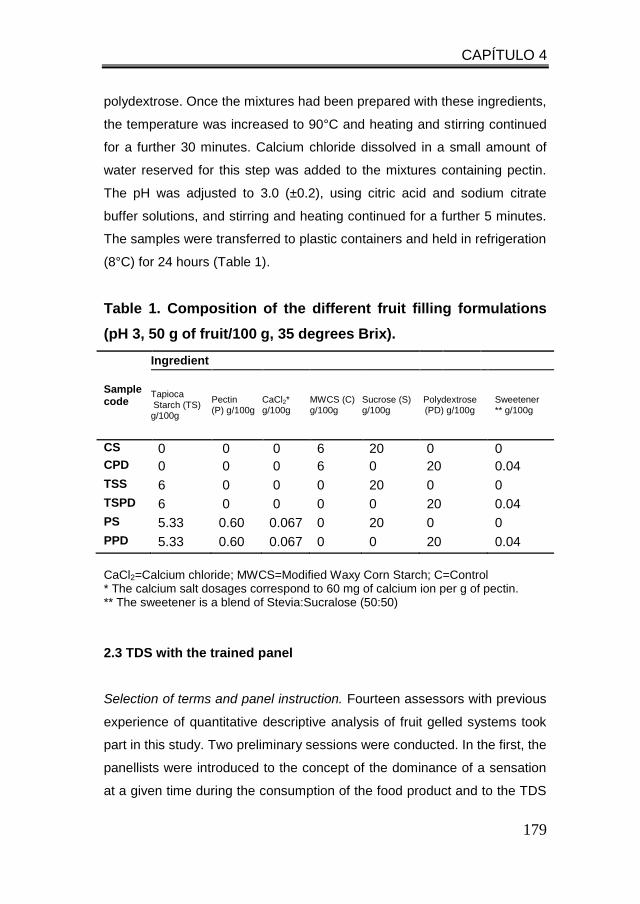
CAPÍTULO 4
179
polydextrose. Once the mixtures had been prepared with these ingredients,
the temperature was increased to 90°C and heating and stirring continued
for a further 30 minutes. Calcium chloride dissolved in a small amount of
water reserved for this step was added to the mixtures containing pectin.
The pH was adjusted to 3.0 (±0.2), using citric acid and sodium citrate
buffer solutions, and stirring and heating continued for a further 5 minutes.
The samples were transferred to plastic containers and held in refrigeration
(8°C) for 24 hours (Table 1).
Table 1. Composition of the different fruit filling formulations
(pH 3, 50 g of fruit/100 g, 35 degrees Brix).
Sample code
Ingredient
Tapioca Starch (TS) g/100g
Pectin (P) g/100g
CaCl2* g/100g
MWCS (C) g/100g
Sucrose (S) g/100g
Polydextrose (PD) g/100g
Sweetener ** g/100g
CS 0 0 0 6 20 0 0
CPD 0 0 0 6 0 20 0.04
TSS 6 0 0 0 20 0 0
TSPD 6 0 0 0 0 20 0.04
PS 5.33 0.60 0.067 0 20 0 0
PPD 5.33 0.60 0.067 0 0 20 0.04
CaCl2=Calcium chloride; MWCS=Modified Waxy Corn Starch; C=Control * The calcium salt dosages correspond to 60 mg of calcium ion per g of pectin. ** The sweetener is a blend of Stevia:Sucralose (50:50)
2.3 TDS with the trained panel
Selection of terms and panel instruction. Fourteen assessors with previous
experience of quantitative descriptive analysis of fruit gelled systems took
part in this study. Two preliminary sessions were conducted. In the first, the
panellists were introduced to the concept of the dominance of a sensation
at a given time during the consumption of the food product and to the TDS
CAPÍTULO 4
180
technique, and had to list all the in-mouth sensations they felt while tasting
all 6 samples, focusing on the changes in dominance over the other
sensations during the consumption period; the descriptors were both
texture- and flavour-related. In the second session, the most frequently
cited attributes were selected and their definitions and the protocol for
measuring them were developed (Table 2) until consensus was reached.
These attributes numbered six for texture – creamy, cohesive, fondant,
adhesive, pulpy and mouth-coating – and four for flavour – sweet, acid,
fruity and bitter. During the third and fourth sessions, the panellists were
able to understand the sequential attribute appearance concept and
participated in a simulated TDS session with several fruit filling samples in
order to answer questions and get used to the computer program and
methodology.
Formal assessment. The TDS evaluation took place over six sessions, held
on different days, in order to conduct three replicated evaluations of the six
samples (Table 1). Three samples were evaluated per session. The
panellists were given half a spoonful of one of the samples (always the
same amount) and had to check its texture attributes (creamy, cohesive,
fondant, adhesive, pulpy, and mouth coating) on the first screen. After this
they rinsed their mouths (still mineral water and unsalted crackers were
available) and rested for some seconds, then they were given another half
spoonful of the same sample and checked its flavour attributes on a
second screen (sweet, acid, fruity and bitter). After mouth rinsing, a new
sample was assessed, then the procedure was repeated for the third
sample. The samples were presented according to a complete balanced
experimental design. The panellists were presented with the list of texture
(or flavour) attributes on the computer screen. At the same time they put
the sample spoon in their mouth they clicked the Start button (starting the
chronometer software) to begin the test. The panellists were free to choose
CAPÍTULO 4
181
the same attribute for the same sample as often as they considered
necessary or never to select any particular attribute as dominant.
Table 2. Attribute definitions generated by the trained panel for the
TDS task
Attribute Description
Cohesive Tendency of the product mass to remain in one piece. Degree
to which the sample deforms or compresses before spreading
Fondant
Speed and degree of sample spreading down due to
mechanical action by the tongue. Speed at which sample
disappears during consumption
Pulpy Presence of particles or lumps (heterogeneous texture)
Creamy Soft, homogeneous texture
Adhesive Force required for tongue to remove sample adhered to the
mouth during consumption
Mouth
coating
Viscous film covering the tongue and palate during
consumption or after swallowing
Acid Acid flavour perceived during consumption
Sweet Sweet flavour perceived during consumption
Bitter Bitter flavour perceived during consumption
Fruity Fruity flavour perceived during consumption
The evaluation ended when the panellists no longer perceived sensations
after swallowing the sample and clicked the Stop button (stopping the
CAPÍTULO 4
182
chronometer). The order of the descriptors was different for each panellist
in order to guard against list order bias. The data were collected with Fizz
Software version 2.45 (Biosystems, Counternon, France).
2.4 Consumer tests
The tests were conducted in the standard sensory rooms of IATA and the
Universitat Politècnica de València, using 100 untrained consumers (35
men, 65 women) aged between 18- 62. All the consumers declared that
they knew about or consumed fruit fillings. The six samples were evaluated
at a single session, in sensory booths with artificial daylight-type
illumination, temperature control and air circulation. The six samples (Table
1) were presented at room temperature in small plastic cups labelled with
random three-digit numbers. Twenty grams of each sample were served to
the assessors. The samples were presented in a sequential monadic
series, following a complete block design balanced for carry-over position
effects.
2.4.1. Overall liking rating
The consumers’ overall liking rating for the fruit fillings was obtained on a
9-point hedonic scale (1=do not like it at all; 9= like it a lot).
2.4.2. Check-all-that-apply (CATA) task
After rating their overall liking, the consumers answered a check-all-that-
apply (CATA) question. The consumers selected all the words or
expressions from a given list that (in their opinion) fitted a description of the
sample they were tasting. In this study, the consumers described the six
samples (Table 1) by selecting the attributes/ expressions they considered
applicable from a 38-attribute list that included texture, flavour and use and
CAPÍTULO 4
183
attitude attributes. These attributes were selected based on the literature
and on previous sensory studies. The 38 terms were: Very consistent,
Consistent, Low consistency, Mouth-coating, Mucous-like, Very fluid, Fluid,
Pulpy, Fibrous, Sticky, Elastic, Homogeneous, Grainy, Melts quickly in the
mouth, Soft, Cohesive (texture attributes); Bitter, Very sweet, Sweet, Low
sweetness, Slightly fruity, Fruity, Very fruity, Very acid, Acid, Slightly acid,
Off-flavour, Metallic taste, Aftertaste (flavour attributes), and Very calorific,
It is a light product, I would use it as a pastry filling, I would use it as a jam,
Delicious, I would buy it if available, Unpleasant, I would use it as a pie
filling, and I would use it as tartlet filling (use and attitude attributes). The
attributes were randomized between products and across consumers
within each of the groups (texture, flavour, use and attitude). The
instruction given to the participants was: “Please check all the answers that
apply to the sample you have tasted”. After finishing their descriptions of all
the samples, the consumers were asked to select the words/expressions
that applied to their ideal fruit filling.
2.5 Data analysis
For the TDS data analysis, the attribute chosen as dominant and the times
when the dominance begun and finished were collected for each panellist
run. As the duration of the period up to complete swallowing and no more
sensations perceived differed from one panellist to another, the data were
normalized, adjusting them according to the individual duration of each
panellist’s test (Albert, Salvador, Schlich y Fiszman, 2012). Finally, to build
the TDS curves, the period when a sensation was dominant for a product
at panel level (dominance rate) was computed at each point of time
(Lenfant et al., 2009). The data were collected with Fizz Software version
2.45 (Biosystems, Counternon, France).
One-way ANOVA was applied to the consumer liking scores to study the
differences between the samples. The least significant differences were
CAPÍTULO 4
184
calculated by Tukey's test (p<0.05). XLStat 2009 software (Addinsoft,
Paris, France).
Cochran’s Q test (Manoukian, 1986) was carried out on the CATA data in
order to identify significant differences between samples for each of the
attributes. The CATA results were analysed by Multiple Factor Analysis
(MFA) of the frequency counts of the attributes selected for each sample in
order to obtain a two-dimensional representation of the attributes and
samples. The Ideal sample data was used as supplementary observation
in the MFA. The overall liking data were used as supplementary variables
in the MFA analysis. All the statistical analyses were performed with XLStat
2009 software (Addinsoft, Paris, France).
3. RESULTS
3.1. TDS test
3.1.1 TDS Curves
In TDS studies, it is recommended that panellists use a reduced list of
attributes (normally no more than 8 per screen). The attributes, which were
generated by the panellists, were related to the main sensory
characteristics of the product. A number of TDS studies have already
investigated the temporality of texture attributes alone (Lenfant et al, 2009;
Bruzzone et al., 2012; Varela, et al., 2014). However, those studies were
only designed to focus on texture attributes, not with the purpose of also
performing a separate flavour TDS. In other studies, a very few texture and
flavour attributes were evaluated in the same TDS session, as in Pineaut et
al. (2009), working with dairy products.
In the present case of gelled fruit products, both texture and flavour were
considered important features for product acceptance (Saint-Eve et al.,
2011; Foster et al., 2011), so each were focused on separately. In a
CAPÍTULO 4
185
previous work, gelatin- and pectin-based gummy confections were
evaluated by free choice profiling (another type of sensory test): the
panellists were asked to generate their own list of both texture and flavour
attributes and the results were analysed separately (De Mars y Ziegler,
2001). Following this idea, and also in view of the trained panel feedback, it
was hypothesised that by concentrating on just in one modality at a time
(flavour or texture), the test would give better results and the panellists’
task would be easier. As a result, the TDS evaluation was split in two to
assess the dominance of texture and flavour sensations separately and
consecutively (on consecutive screens).
The TDS curves were obtained by plotting the dominance rate of each of
the sensations at different points of the eating period, for each sample,
across the panel (Pineau et al., 2009). Since the duration of consumption
of the food item up to swallowing differed from one subject to another, the
sensory perception time scales differed as well (Lenfant et al., 2009). In
order to take this point into account in the computation of the TDS curves,
the data from each subject were normalized according to individual
mastication durations, so the x-axis shows values from x = 0 (first scoring)
to x = 100 (swallowing); in the present study, the x-axis of the TDS curves
corresponds to the normalized time (% of consumption time) and the y-axis
to the dominance rate (%).
The TDS responses are then linked to the liking scores and to the other
consumers’ sensory evaluations in order to capture the consumer
perceptions, gaining a better understanding of consumer response and
how to apply it to product reformulation. Better identification and control of
the sensory contrasts that potentially drive liking is key to developing
innovations for food (Lenfant et al., 2009).
On the TDS plots (Figures 1 and 2), two lines were drawn for the chance
(CL) and significance levels (LS). The CL refers to the dominance rate that
an attribute could obtain by chance. Its value is inversely proportional to
the number of attributes (P0 = 1/p, where p is the number of attributes).
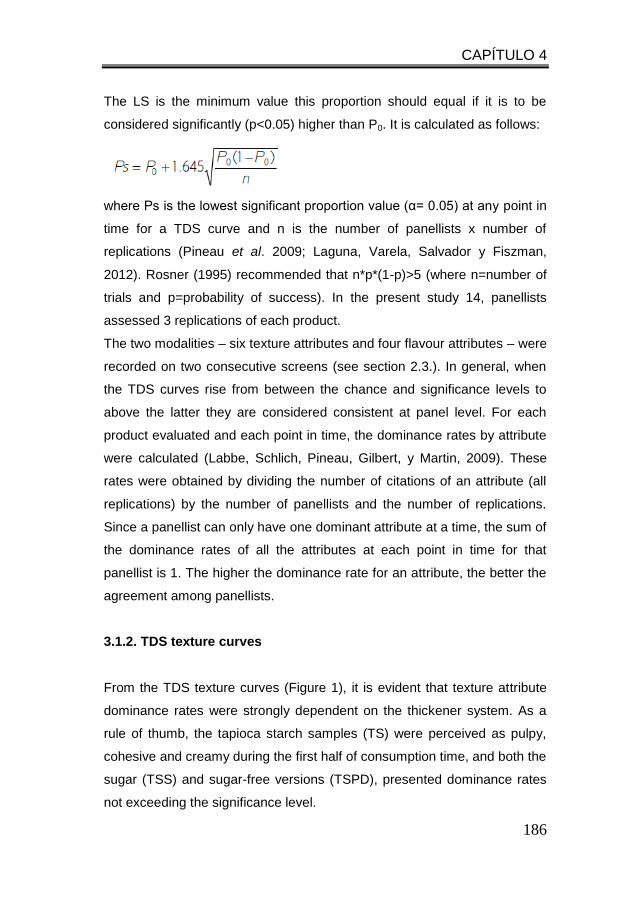
CAPÍTULO 4
186
The LS is the minimum value this proportion should equal if it is to be
considered significantly (p<0.05) higher than P0. It is calculated as follows:
where Ps is the lowest significant proportion value (α= 0.05) at any point in
time for a TDS curve and n is the number of panellists x number of
replications (Pineau et al. 2009; Laguna, Varela, Salvador y Fiszman,
2012). Rosner (1995) recommended that n*p*(1-p)>5 (where n=number of
trials and p=probability of success). In the present study 14, panellists
assessed 3 replications of each product.
The two modalities – six texture attributes and four flavour attributes – were
recorded on two consecutive screens (see section 2.3.). In general, when
the TDS curves rise from between the chance and significance levels to
above the latter they are considered consistent at panel level. For each
product evaluated and each point in time, the dominance rates by attribute
were calculated (Labbe, Schlich, Pineau, Gilbert, y Martin, 2009). These
rates were obtained by dividing the number of citations of an attribute (all
replications) by the number of panellists and the number of replications.
Since a panellist can only have one dominant attribute at a time, the sum of
the dominance rates of all the attributes at each point in time for that
panellist is 1. The higher the dominance rate for an attribute, the better the
agreement among panellists.
3.1.2. TDS texture curves
From the TDS texture curves (Figure 1), it is evident that texture attribute
dominance rates were strongly dependent on the thickener system. As a
rule of thumb, the tapioca starch samples (TS) were perceived as pulpy,
cohesive and creamy during the first half of consumption time, and both the
sugar (TSS) and sugar-free versions (TSPD), presented dominance rates
not exceeding the significance level.
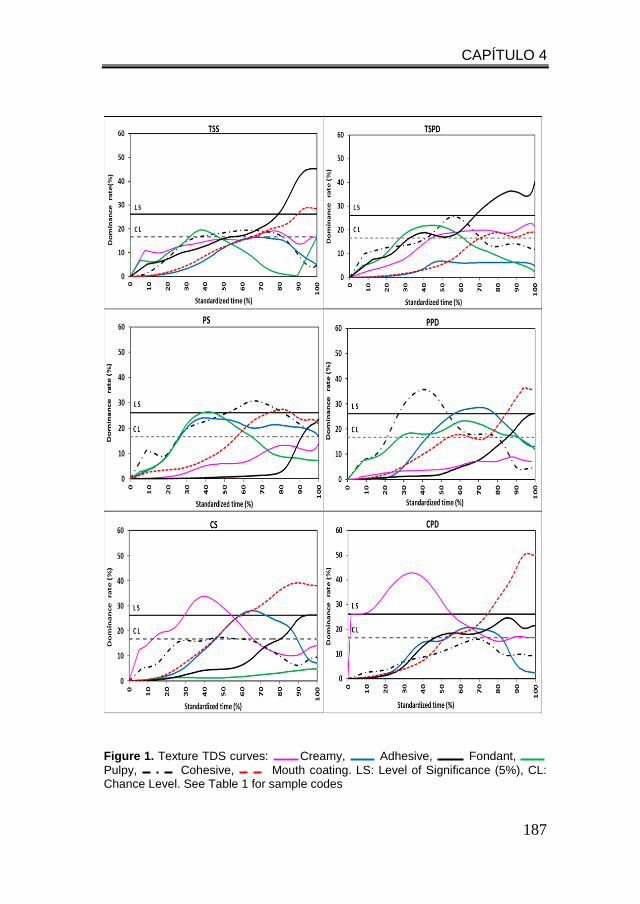
CAPÍTULO 4
187
Figure 1. Texture TDS curves: Creamy, Adhesive, Fondant,
Pulpy, Cohesive, Mouth coating. LS: Level of Significance (5%), CL: Chance Level. See Table 1 for sample codes
CAPÍTULO 4
188
A high, significant dominance rate of fondant perception was found in the
last stage of consumption, meaning that the sample melted quickly and did
not remain for long in the mouth. The samples containing pectin (P)
(prepared with pectin and tapioca starch) presented a high dominance rate
for cohesiveness, both for the samples with and without sugar (PS and
PPD, respectively), and adhesive and pulpy also appeared as dominant
sensations for these systems, generally without exceeding the significance
level. Comparison of these two samples (TS alone and TS with pectin)
showed that the main difference between them was the highly fondant
sensation of the tapioca starch sample and the cohesiveness when tapioca
starch was combined with pectin. This is in agreement with previous
studies on the instrumental mechanical properties of these systems, where
the TS gelling system presented a mechanical spectrum with G’ values
only slightly higher than those of G” and quite strong frequency
dependency, reflecting a weak gel structure with low viscoelasticity (a fluid,
viscous gel), whereas the P gelling system (mixture of TS with pectin and
calcium ions) showed considerably higher G‘ and G” values, a greater
distance between the two, and lower tan values (closer to 0), reflecting
increased viscoelasticity. In addition, an extrusion test showed that the P
mixture displayed greater firmness than TS alone, which presented low
resistance to extrusion. P samples have a firmer and more compact and
solid structure (Agudelo et al., 2014a).
It is worth noting that the P samples were not perceived as predominantly
creamy at any moment of consumption. The reason can be attributed to
the absence of perception of mouth-coating at the moment of putting the
sample on the tongue, as it remained in one piece and was described as
cohesive. Mouth-coating only began to be perceived at 25% of the
consumption time for both the sugar and sugar-free samples, and then
lasted up to the final stage. A possible explanation is that a pulpy
(heterogeneous) sensation was probably found somewhat opposite to
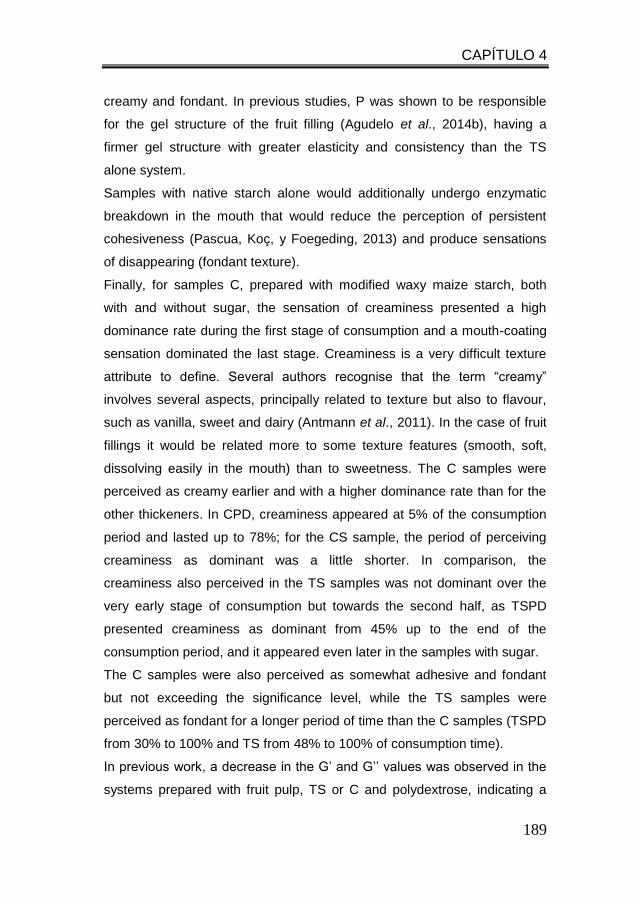
CAPÍTULO 4
189
creamy and fondant. In previous studies, P was shown to be responsible
for the gel structure of the fruit filling (Agudelo et al., 2014b), having a
firmer gel structure with greater elasticity and consistency than the TS
alone system.
Samples with native starch alone would additionally undergo enzymatic
breakdown in the mouth that would reduce the perception of persistent
cohesiveness (Pascua, Koç, y Foegeding, 2013) and produce sensations
of disappearing (fondant texture).
Finally, for samples C, prepared with modified waxy maize starch, both
with and without sugar, the sensation of creaminess presented a high
dominance rate during the first stage of consumption and a mouth-coating
sensation dominated the last stage. Creaminess is a very difficult texture
attribute to define. Several authors recognise that the term “creamy”
involves several aspects, principally related to texture but also to flavour,
such as vanilla, sweet and dairy (Antmann et al., 2011). In the case of fruit
fillings it would be related more to some texture features (smooth, soft,
dissolving easily in the mouth) than to sweetness. The C samples were
perceived as creamy earlier and with a higher dominance rate than for the
other thickeners. In CPD, creaminess appeared at 5% of the consumption
period and lasted up to 78%; for the CS sample, the period of perceiving
creaminess as dominant was a little shorter. In comparison, the
creaminess also perceived in the TS samples was not dominant over the
very early stage of consumption but towards the second half, as TSPD
presented creaminess as dominant from 45% up to the end of the
consumption period, and it appeared even later in the samples with sugar.
The C samples were also perceived as somewhat adhesive and fondant
but not exceeding the significance level, while the TS samples were
perceived as fondant for a longer period of time than the C samples (TSPD
from 30% to 100% and TS from 48% to 100% of consumption time).
In previous work, a decrease in the G’ and G’’ values was observed in the
systems prepared with fruit pulp, TS or C and polydextrose, indicating a
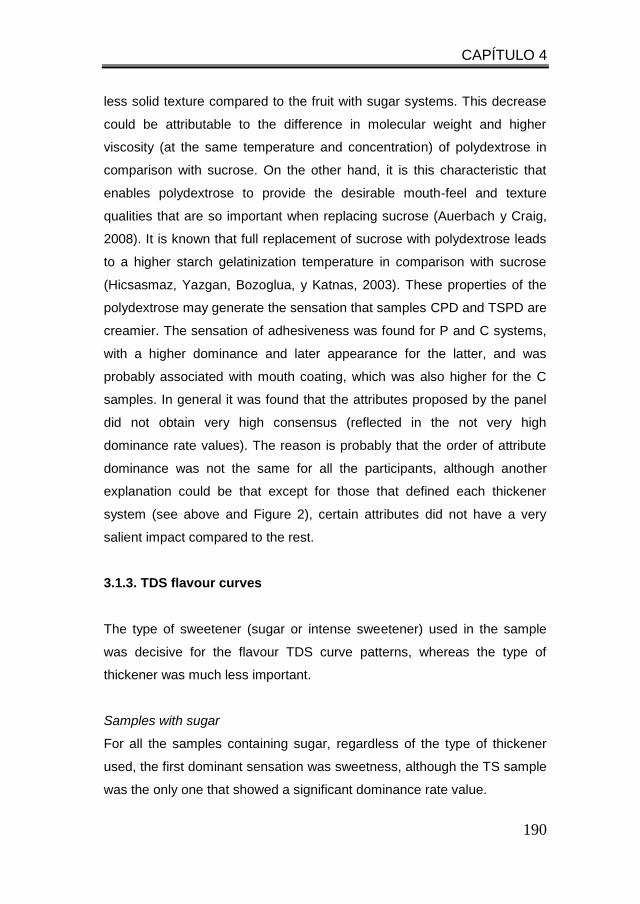
CAPÍTULO 4
190
less solid texture compared to the fruit with sugar systems. This decrease
could be attributable to the difference in molecular weight and higher
viscosity (at the same temperature and concentration) of polydextrose in
comparison with sucrose. On the other hand, it is this characteristic that
enables polydextrose to provide the desirable mouth-feel and texture
qualities that are so important when replacing sucrose (Auerbach y Craig,
2008). It is known that full replacement of sucrose with polydextrose leads
to a higher starch gelatinization temperature in comparison with sucrose
(Hicsasmaz, Yazgan, Bozoglua, y Katnas, 2003). These properties of the
polydextrose may generate the sensation that samples CPD and TSPD are
creamier. The sensation of adhesiveness was found for P and C systems,
with a higher dominance and later appearance for the latter, and was
probably associated with mouth coating, which was also higher for the C
samples. In general it was found that the attributes proposed by the panel
did not obtain very high consensus (reflected in the not very high
dominance rate values). The reason is probably that the order of attribute
dominance was not the same for all the participants, although another
explanation could be that except for those that defined each thickener
system (see above and Figure 2), certain attributes did not have a very
salient impact compared to the rest.
3.1.3. TDS flavour curves
The type of sweetener (sugar or intense sweetener) used in the sample
was decisive for the flavour TDS curve patterns, whereas the type of
thickener was much less important.
Samples with sugar
For all the samples containing sugar, regardless of the type of thickener
used, the first dominant sensation was sweetness, although the TS sample
was the only one that showed a significant dominance rate value.
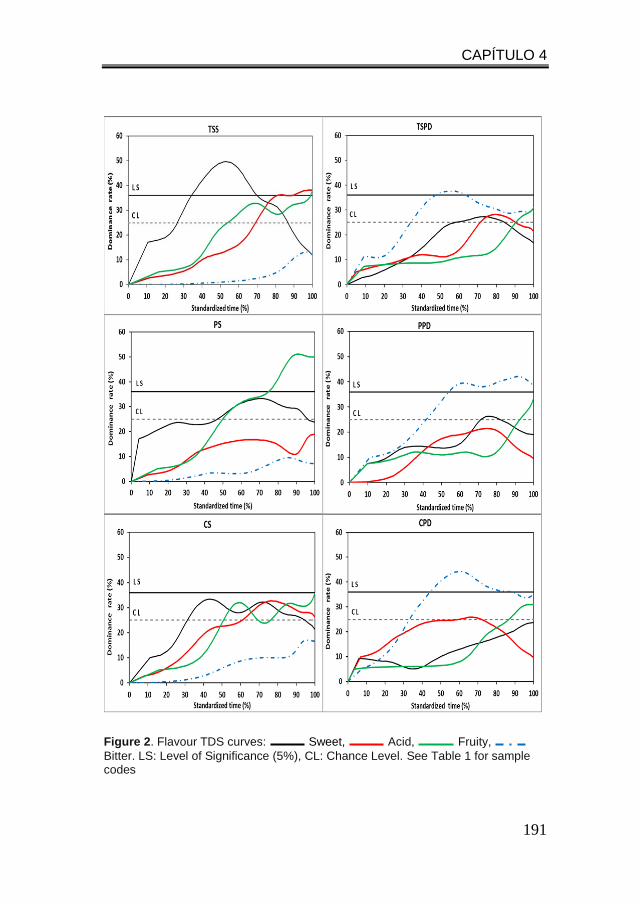
CAPÍTULO 4
191
Figure 2. Flavour TDS curves: Sweet, Acid, Fruity,
Bitter. LS: Level of Significance (5%), CL: Chance Level. See Table 1 for sample codes
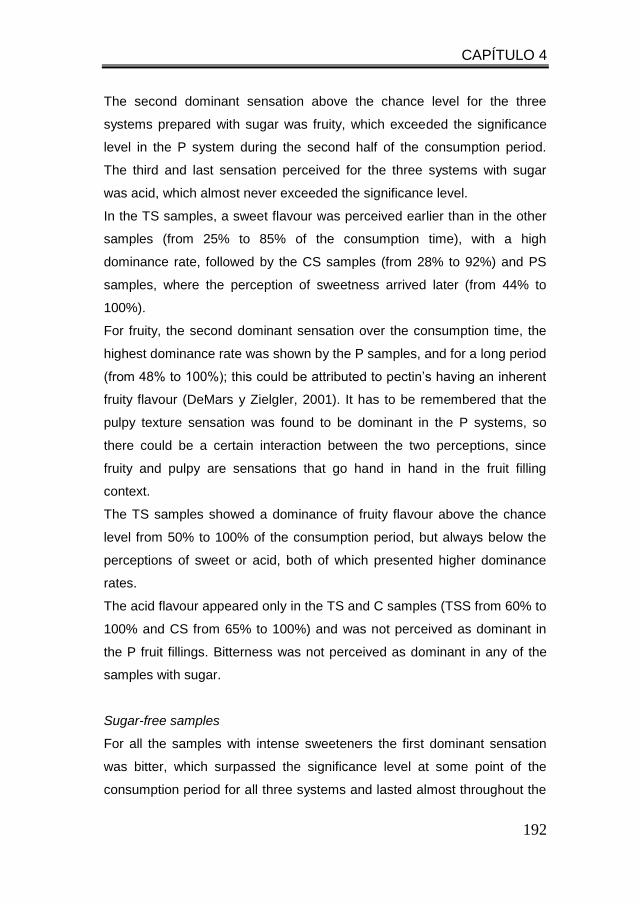
CAPÍTULO 4
192
The second dominant sensation above the chance level for the three
systems prepared with sugar was fruity, which exceeded the significance
level in the P system during the second half of the consumption period.
The third and last sensation perceived for the three systems with sugar
was acid, which almost never exceeded the significance level.
In the TS samples, a sweet flavour was perceived earlier than in the other
samples (from 25% to 85% of the consumption time), with a high
dominance rate, followed by the CS samples (from 28% to 92%) and PS
samples, where the perception of sweetness arrived later (from 44% to
100%).
For fruity, the second dominant sensation over the consumption time, the
highest dominance rate was shown by the P samples, and for a long period
(from 48% to 100%); this could be attributed to pectin’s having an inherent
fruity flavour (DeMars y Zielgler, 2001). It has to be remembered that the
pulpy texture sensation was found to be dominant in the P systems, so
there could be a certain interaction between the two perceptions, since
fruity and pulpy are sensations that go hand in hand in the fruit filling
context.
The TS samples showed a dominance of fruity flavour above the chance
level from 50% to 100% of the consumption period, but always below the
perceptions of sweet or acid, both of which presented higher dominance
rates.
The acid flavour appeared only in the TS and C samples (TSS from 60% to
100% and CS from 65% to 100%) and was not perceived as dominant in
the P fruit fillings. Bitterness was not perceived as dominant in any of the
samples with sugar.
Sugar-free samples
For all the samples with intense sweeteners the first dominant sensation
was bitter, which surpassed the significance level at some point of the
consumption period for all three systems and lasted almost throughout the
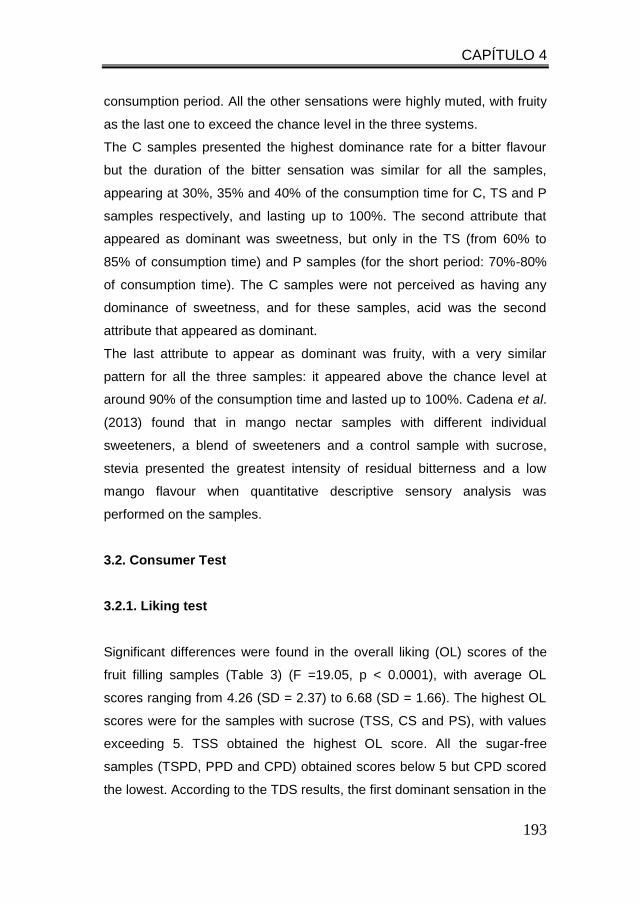
CAPÍTULO 4
193
consumption period. All the other sensations were highly muted, with fruity
as the last one to exceed the chance level in the three systems.
The C samples presented the highest dominance rate for a bitter flavour
but the duration of the bitter sensation was similar for all the samples,
appearing at 30%, 35% and 40% of the consumption time for C, TS and P
samples respectively, and lasting up to 100%. The second attribute that
appeared as dominant was sweetness, but only in the TS (from 60% to
85% of consumption time) and P samples (for the short period: 70%-80%
of consumption time). The C samples were not perceived as having any
dominance of sweetness, and for these samples, acid was the second
attribute that appeared as dominant.
The last attribute to appear as dominant was fruity, with a very similar
pattern for all the three samples: it appeared above the chance level at
around 90% of the consumption time and lasted up to 100%. Cadena et al.
(2013) found that in mango nectar samples with different individual
sweeteners, a blend of sweeteners and a control sample with sucrose,
stevia presented the greatest intensity of residual bitterness and a low
mango flavour when quantitative descriptive sensory analysis was
performed on the samples.
3.2. Consumer Test
3.2.1. Liking test
Significant differences were found in the overall liking (OL) scores of the
fruit filling samples (Table 3) (F =19.05, p < 0.0001), with average OL
scores ranging from 4.26 (SD = 2.37) to 6.68 (SD = 1.66). The highest OL
scores were for the samples with sucrose (TSS, CS and PS), with values
exceeding 5. TSS obtained the highest OL score. All the sugar-free
samples (TSPD, PPD and CPD) obtained scores below 5 but CPD scored
the lowest. According to the TDS results, the first dominant sensation in the
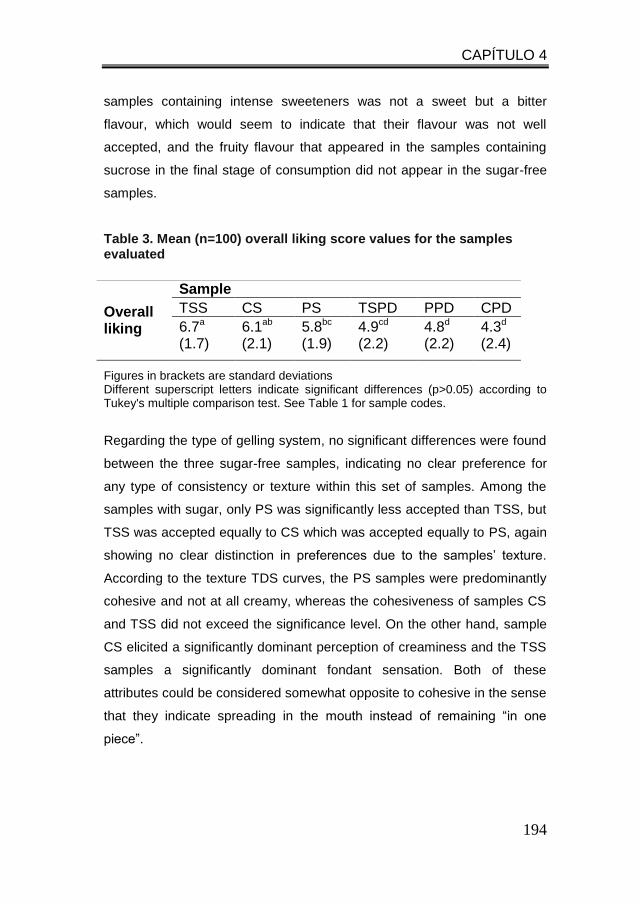
CAPÍTULO 4
194
samples containing intense sweeteners was not a sweet but a bitter
flavour, which would seem to indicate that their flavour was not well
accepted, and the fruity flavour that appeared in the samples containing
sucrose in the final stage of consumption did not appear in the sugar-free
samples.
Table 3. Mean (n=100) overall liking score values for the samples evaluated
Overall liking
Sample
TSS CS PS TSPD PPD CPD
6.7a (1.7)
6.1ab (2.1)
5.8bc (1.9)
4.9cd (2.2)
4.8d (2.2)
4.3d (2.4)
Figures in brackets are standard deviations Different superscript letters indicate significant differences (p>0.05) according to Tukey's multiple comparison test. See Table 1 for sample codes.
Regarding the type of gelling system, no significant differences were found
between the three sugar-free samples, indicating no clear preference for
any type of consistency or texture within this set of samples. Among the
samples with sugar, only PS was significantly less accepted than TSS, but
TSS was accepted equally to CS which was accepted equally to PS, again
showing no clear distinction in preferences due to the samples’ texture.
According to the texture TDS curves, the PS samples were predominantly
cohesive and not at all creamy, whereas the cohesiveness of samples CS
and TSS did not exceed the significance level. On the other hand, sample
CS elicited a significantly dominant perception of creaminess and the TSS
samples a significantly dominant fondant sensation. Both of these
attributes could be considered somewhat opposite to cohesive in the sense
that they indicate spreading in the mouth instead of remaining “in one
piece”.
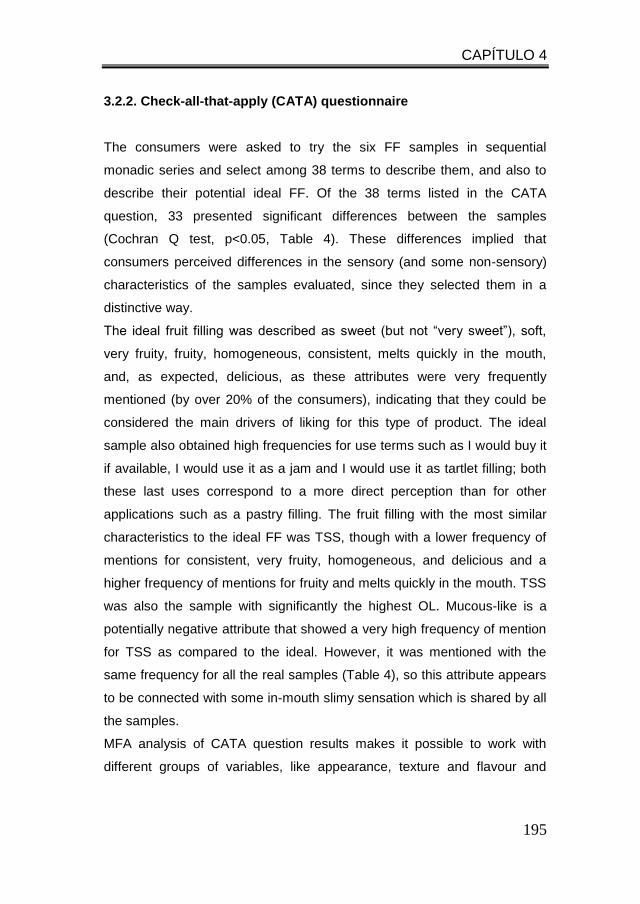
CAPÍTULO 4
195
3.2.2. Check-all-that-apply (CATA) questionnaire
The consumers were asked to try the six FF samples in sequential
monadic series and select among 38 terms to describe them, and also to
describe their potential ideal FF. Of the 38 terms listed in the CATA
question, 33 presented significant differences between the samples
(Cochran Q test, p<0.05, Table 4). These differences implied that
consumers perceived differences in the sensory (and some non-sensory)
characteristics of the samples evaluated, since they selected them in a
distinctive way.
The ideal fruit filling was described as sweet (but not “very sweet”), soft,
very fruity, fruity, homogeneous, consistent, melts quickly in the mouth,
and, as expected, delicious, as these attributes were very frequently
mentioned (by over 20% of the consumers), indicating that they could be
considered the main drivers of liking for this type of product. The ideal
sample also obtained high frequencies for use terms such as I would buy it
if available, I would use it as a jam and I would use it as tartlet filling; both
these last uses correspond to a more direct perception than for other
applications such as a pastry filling. The fruit filling with the most similar
characteristics to the ideal FF was TSS, though with a lower frequency of
mentions for consistent, very fruity, homogeneous, and delicious and a
higher frequency of mentions for fruity and melts quickly in the mouth. TSS
was also the sample with significantly the highest OL. Mucous-like is a
potentially negative attribute that showed a very high frequency of mention
for TSS as compared to the ideal. However, it was mentioned with the
same frequency for all the real samples (Table 4), so this attribute appears
to be connected with some in-mouth slimy sensation which is shared by all
the samples.
MFA analysis of CATA question results makes it possible to work with
different groups of variables, like appearance, texture and flavour and
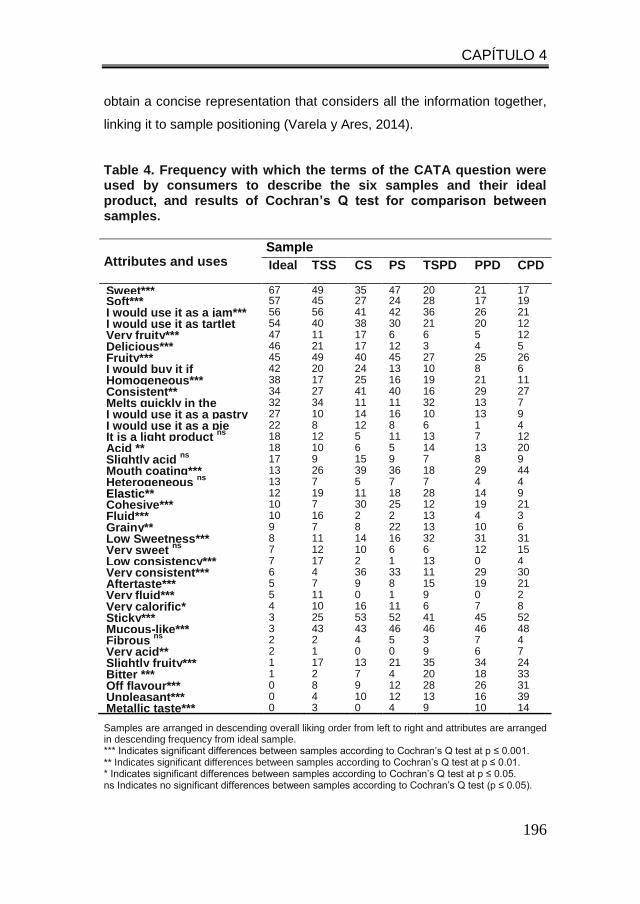
CAPÍTULO 4
196
obtain a concise representation that considers all the information together,
linking it to sample positioning (Varela y Ares, 2014).
Table 4. Frequency with which the terms of the CATA question were used by consumers to describe the six samples and their ideal product, and results of Cochran’s Q test for comparison between samples.
Attributes and uses Sample
Ideal TSS CS PS TSPD PPD CPD
Sweet*** 67 49 35 47 20 21 17 Soft*** 57 45 27 24 28 17 19 I would use it as a jam*** 56 56 41 42 36 26 21 I would use it as tartlet filling***
54 40 38 30 21 20 12 Very fruity*** 47 11 17 6 6 5 12 Delicious*** 46 21 17 12 3 4 5 Fruity*** 45 49 40 45 27 25 26 I would buy it if available***
42 20 24 13 10 8 6 Homogeneous*** 38 17 25 16 19 21 11 Consistent** 34 27 41 40 16 29 27 Melts quickly in the mouth***
32 34 11 11 32 13 7 I would use it as a pastry filling**
27 10 14 16 10 13 9 I would use it as a pie filling ***
22 8 12 8 6 1 4 It is a light product
ns 18 12 5 11 13 7 12
Acid ** 18 10 6 5 14 13 20 Slightly acid
ns 17 9 15 9 7 8 9
Mouth coating*** 13 26 39 36 18 29 44 Heterogeneous
ns 13 7 5 7 7 4 4
Elastic** 12 19 11 18 28 14 9 Cohesive*** 10 7 30 25 12 19 21 Fluid*** 10 16 2 2 13 4 3 Grainy** 9 7 8 22 13 10 6 Low Sweetness*** 8 11 14 16 32 31 31 Very sweet
ns 7 12 10 6 6 12 15
Low consistency*** 7 17 2 1 13 0 4 Very consistent*** 6 4 36 33 11 29 30 Aftertaste*** 5 7 9 8 15 19 21 Very fluid*** 5 11 0 1 9 0 2 Very calorific* 4 10 16 11 6 7 8 Sticky*** 3 25 53 52 41 45 52 Mucous-like*** 3 43 43 46 46 46 48 Fibrous
ns 2 2 4 5 3 7 4
Very acid** 2 1 0 0 9 6 7 Slightly fruity*** 1 17 13 21 35 34 24 Bitter *** 1 2 7 4 20 18 33 Off flavour*** 0 8 9 12 28 26 31 Unpleasant*** 0 4 10 12 13 16 39 Metallic taste*** 0 3 0 4 9 10 14
Samples are arranged in descending overall liking order from left to right and attributes are arranged in descending frequency from ideal sample. *** Indicates significant differences between samples according to Cochran’s Q test at p ≤ 0.001. ** Indicates significant differences between samples according to Cochran’s Q test at p ≤ 0.01. * Indicates significant differences between samples according to Cochran’s Q test at p ≤ 0.05. ns Indicates no significant differences between samples according to Cochran’s Q test (p ≤ 0.05).
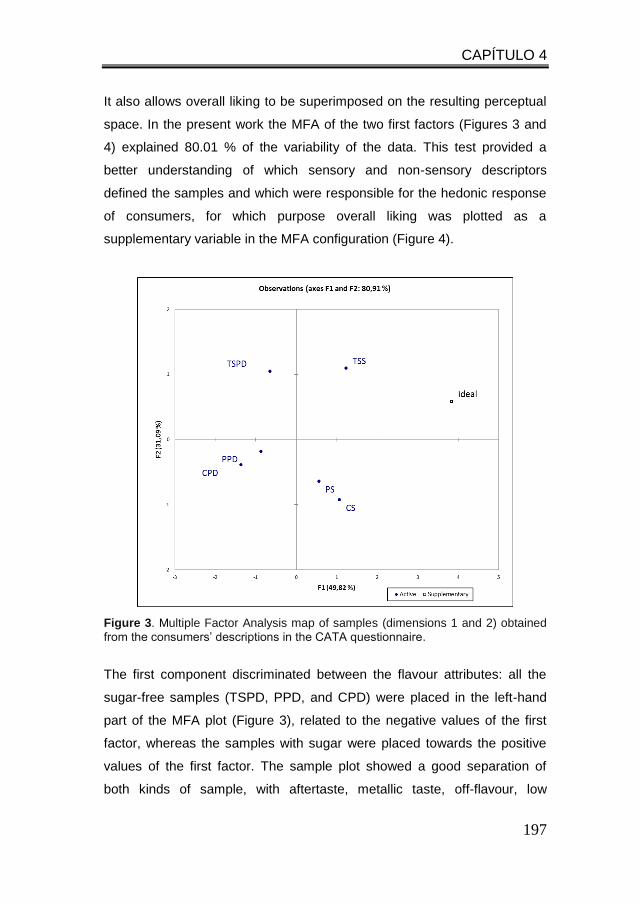
CAPÍTULO 4
197
It also allows overall liking to be superimposed on the resulting perceptual
space. In the present work the MFA of the two first factors (Figures 3 and
4) explained 80.01 % of the variability of the data. This test provided a
better understanding of which sensory and non-sensory descriptors
defined the samples and which were responsible for the hedonic response
of consumers, for which purpose overall liking was plotted as a
supplementary variable in the MFA configuration (Figure 4).
Figure 3. Multiple Factor Analysis map of samples (dimensions 1 and 2) obtained
from the consumers’ descriptions in the CATA questionnaire.
The first component discriminated between the flavour attributes: all the
sugar-free samples (TSPD, PPD, and CPD) were placed in the left-hand
part of the MFA plot (Figure 3), related to the negative values of the first
factor, whereas the samples with sugar were placed towards the positive
values of the first factor. The sample plot showed a good separation of
both kinds of sample, with aftertaste, metallic taste, off-flavour, low
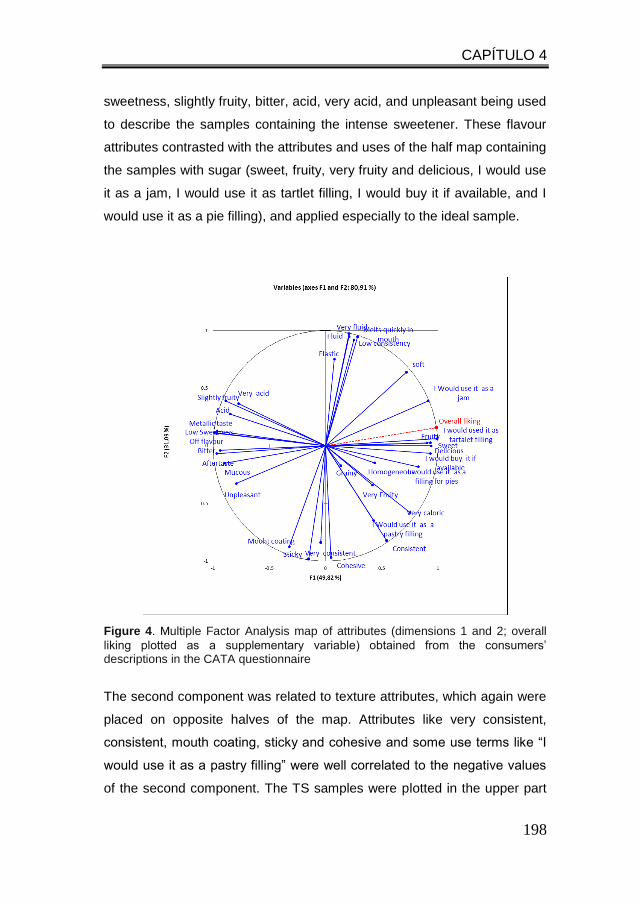
CAPÍTULO 4
198
sweetness, slightly fruity, bitter, acid, very acid, and unpleasant being used
to describe the samples containing the intense sweetener. These flavour
attributes contrasted with the attributes and uses of the half map containing
the samples with sugar (sweet, fruity, very fruity and delicious, I would use
it as a jam, I would use it as tartlet filling, I would buy it if available, and I
would use it as a pie filling), and applied especially to the ideal sample.
Figure 4. Multiple Factor Analysis map of attributes (dimensions 1 and 2; overall
liking plotted as a supplementary variable) obtained from the consumers’ descriptions in the CATA questionnaire
The second component was related to texture attributes, which again were
placed on opposite halves of the map. Attributes like very consistent,
consistent, mouth coating, sticky and cohesive and some use terms like “I
would use it as a pastry filling” were well correlated to the negative values
of the second component. The TS samples were plotted in the upper part
CAPÍTULO 4
199
of the map, identifying them as very fluid, fluid, with little consistency, melts
quickly in mouth and soft. The P samples were placed near very
consistent, cohesive, mouth coating and sticky. Finally, the CS sample,
prepared with the control starch, was a little to the right of PS, related to
the attributes of mouth coating, sticky, very consistent and cohesive. Mouth
coating was dominant in the TDS curves from 40 % of the consumption
time. The overall liking was plotted very near to the ideal fruit filling, as
expected. A number of use and hedonic terms were well correlated to it:
delicious, I would use it as a jam, I would use it as tartlet filling, I would buy
it if available, I would use it as a pie filling. The flavour attributes of this
zone of the map were sweet and fruity. They were found to be dominant in
the TDS curves for the sucrose-containing samples, confirming that these
attributes are drivers of liking (and of a perception of quality).
In this sample set, the main variation in consumer perception was driven by
flavour more than by texture. According to Szczesniak (2002) for the most
part, texture is taken for granted and consumers do not comment on it
unless asked specific questions, or unless texture is definitely off or
inappropriate, expectations are violated or non-food associations are
triggered; this is important to remember when conducting consumer tests.
Flavour attributes were correlated to the first factor of the MFA, which
explained their higher contribution to discrimination amongst the samples.
Flavour also appeared as the main driver of liking, particularly through
rejection of the (negative) characteristics generated by the artificial
sweeteners. The sweeteners had time-intensity sweetness and time-
intensity bitterness profiles that differ from those of sucrose, showing that a
number of factors should be taken into account (deSouza et al., 2013).
From these results it was evident that substitution of sucrose by other
sweeteners is a challenge for researchers and the industry alike, and in
addition to the sweet taste, attributes other than flavour may be modified
(Cadena et al., 2013). The residual bitterness of stevia has been reported
in a number of studies (Meloet al., 2009; Prakash et al., 2008). Sucralose
CAPÍTULO 4
200
is reported to have a relatively clean and lingering sweet taste with little
persistence of bitterness (Nabors, 2002; Zhao, y Tepper, 2007).
Formulating food products for targeted niches such as low-calorie
consumers is a key point in new developments. Changing the sweetness
profile would probably be a good option, or implementing marketing
strategies to inform the consumer about the advantages of a low calorie
intake or low glycaemic index in relation with health issues such as
diabetes, obesity, and weight control, and also to fit the pattern of a
healthier diet and lifestyle.
Regarding texture, the ideal fruit filling and OL were in an intermediate
position between opposite texture attributes. This could indicate
segmentation regarding texture preferences.
4. CONCLUSIONS
Conventional rheological and instrumental measurements are widely used
for measuring the characteristics of soft gelled systems but are insufficient
when formulating new real products. New sensory techniques with
consumers are available to gather information that allows a deeper insight
into consumer perceptions. These techniques contribute a very rich
panorama, making it possible to position the product in the market. In the
present work, the analysis of detailed information on the predominant
perceptions of consumers while consuming fruit fillings showed the
differences in perception elicited by the three systems studied. In addition,
a quick and spontaneous description of newly formulated products clearly
showed the way forward: the samples with sugar were by far the most liked
and were closer to the “ideal” sample, while replacement of sugar with
intense sweeteners has to be rethought to fit into the low-calorie consumer
niche, as these results pointed to the intense sweetener’s flavour as being
pivotal for sample rejection. In the set of samples containing sugar, the
CAPÍTULO 4
201
choice of hydrocolloid system pointed to a preference for the creamy,
fondant textures identified in the tapioca starch sample.
ACKNOWLEDGEMENTS
The authors are grateful to Sucroal S.A. (Colombia) and SENA (Servicio
Nacional de Aprendizaje de Colombia) for funding the PhD studies of Maria
Alejandra Agudelo (Sucroal S.A.) at the Polytechnic University of Valencia
and to the Spanish Ministry of Science and Innovation for financial support
(AGL2012-36753-C02-01). They would also like to thank Mary Georgina
Hardinge for language correction of this paper.
REFERENCES
Adams, J., Williams, A., Lancaster, B., y Foley, M. (2007). Advantages and uses of
check-all-that-apply response compared to traditional scaling of attributes for
salty snacks. In 7th Pangborn Sensory Science Symposium, 12-16 August 2007,
Minneapolis, USA.
Agudelo, A., Varela, P., Sanz, T., y Fiszman S. M. (2014a). Native tapioca starch
as a potential thickener for fruit fillings. Evaluation of mixed models containing
low-methoxyl pectin. Food hydrocolloids, 35, 297-304.
Agudelo, A., Varela, P., Sanz, T., y Fiszman S. (2014b). Formulating fruit fillings.
freezing and baking stability of a tapioca starch-pectin mixture model. Food
Hydrocolloids, 40, 203-213.
Albert, A., Salvador, A. Schlich, P., y Fiszman S. (2012). Comparison between
temporal dominance of sensations (TDS) and key-attribute sensory profiling for
evaluating solid food with contrasting textural layers: Fish sticks. Food Quality
and Preference, 24, 111–118.
CAPÍTULO 4
202
Auerbach, M., Craig, S. y Mitchell, H. (2008). Bulking agents: multifunctional
ingredients. In H. Mitchell (Ed.), Sweeteners and sucrose alternatives in food
Technology (pp. 372-375). Oxford, UK: Blackwell Publishing Ltd.
Antmann, G., Ares, G., Varela, P., Salvador, A., Coste, B., y Fiszman, S. (2011).
Consumers’ creaminess concept perception: a cross-cultural study in three
Spanish-speaking countries. Journal of Texture Studies, 42, 50-60.
Ares, G., Dauber, C., Fernández, E., Giménez, A., y Varela, P. (2014). Penalty
analysis based on CATA questions to identify drivers of liking and directions for
product reformulation. Food Quality and Preference, 32, 65-76.
Ares, G., Deliza, R., Barreiro, C., Gimenez, A., y Gambaro A. (2010). Comparison
of two sensory profiling techniques based on consumer perception. Food Quality
and Preference, 21 (4), 417-426.
Ares, G., Varela, P., Rado, G., y Giménez, A. (2011a). Are consumer profiling
techniques equivalent for some product categories? The case of orange
flavoured powdered drinks. International Journal of Food Science and
Technology, 46, 1600–1608.
Ares, G., Varela, P., Rado, G., y Giménez, A. (2011b). Identifying ideal products
using three different consumer profiling methodologies. Comparison with
external preference mapping. Food Quality and Preference, 22, 581-591.
Baiano, A., Mastromatteo, M., y Del Nobile, M. A. (2012). Effects of cultivar and
process variables on dynamic-mechanical and sensorial behavior of value added
grape-based smoothies. Molecules, 17, 11421-11434.
Basu, S., y Shivhare, U. S. (2010). Rheological, textural, micro-structural and
sensory properties of mango jam. Journal of Food Engineering, 100, 357–365.
Basu, S., Shivhare, U. S., y Singh, T. V. (2013).Effect of substitution of stevioside
and sucralose on rheological, spectral, color and microstructural characteristics
of mango jam. Journal of Food Engineering, 114, 465-476.
CAPÍTULO 4
203
Bruzzone, F., Ares, G., y Giménez, A. (2013). Temporal aspects of yoghurt texture
perception. International Dairy Journal, 29, 124-134.
Cadena, R. S., Cruz, A. G., Netto, R. R., Castro, W. F., Faria, J. D. A. F., y Bolini,
H. M. A. (2013). Sensory profile and physicochemical characteristics of mango
nectar sweetened with high intensity sweeteners throughout storage time. Food
Research International, 54, 167-1679.
Chen, J. (2009). Food oral processing. A review. Food Hydrocolloids, 23, 1-25.
DeMars, L., y Ziegle, G.R. (2001). Texture and structure of gelatin/pectin-based
gummy confections. Food Hydrocolloids, 15, 643-653.
Dervisi, P., Lamb, J., y Zabetakis, I. (2001). High pressure processing in jam
manufacture: effects in textural and colour properties. Food chemistry, 73, 85-91.
deSouza, V. R., Pereira, P. A. P., Pinheiro, A. C. M., Bolini, H. M. A., Borges, S. V.
y Queiroz, F. (2013). Analysis of various sweeteners in low-sugar mixed fruit
jam: equivalent sweetness, time-intensity analysis and acceptance test.
International Journal of Food Science y Technology, 48, 1541–1548.
Dooley, L., Lee, Y. S., y Meullenet, J. F. (2010). The application of check-all-
thatapply (CATA) consumer profiling to preference mapping of vanilla ice cream
and its comparison to classical external preference mapping. Food Quality and
Preference, 21, 394-401.
Foster, K. D., Grigor, J., Cheong, J. N., Yoo, M. J. Y., Bronlund, J. E., y
Morgenstern, M. P.(2011). The Role of Oral Processing in Dynamic Sensory
perception. Journal of Food Science, 76(2), 49-61.
Grujić, S., Grujić, R., y Poljašević, J. (2010). Effect of food additives on sensory
characteristics of thermo-stable marmalade. Electronic Journal of Polish
Agricultural Universities, 13(2), 11. Website:
http://www.ejpau.media.pl/volume13/issue2/art-11.html.
CAPÍTULO 4
204
Hicsasmaz, Z., Yazgan, Y., Bozoglua, F., y Katnas, Z. (2003). Effect of
polydextrose-substitution on the cell structure of the high-ratio cake system.
LWT-Food Science and Technology, 36, 441-450.
Labbe, D., Schlich, P., Pineau, N., Gilbert, F., y Martin, N. (2009). Temporal
dominance of sensations and sensory profiling: A comparative study. Food
Quality and Preference, 20, 216-221.
Lado, J., Vicente, E., Manzzioni, A., y Ares, G. (2010). Application of a check-all-
thatapply question for the evaluation of strawberry cultivars from a breeding
program. Journal of the Science of Food and Agriculture, 90, 2268-2275.
Laguna, L., Varela, P. Salvador, A., y Fiszman, S. (2012). A new sensory tool to
analyse the oral trajectory of biscuits with different fat and fibre content. Food
Research International, 51, 544-553.
Lenfant, F., Loret, C., Pineau, N., Hartmann, C., y Martin, N. (2009). Perception of
oral food breakdown. The concept of sensory trajectory. Appetite, 52, 659-667.
Manoukian, E. B. (1986). Mathematical nonparametric statistics. New York: Gordon
y Breach.
Melo, L. L. M. M., Bolini, H. M.A., y Efraim, P. (2009). Sensory profile, acceptability,
and their relationship for diabetic/reduced calorie chocolates. Food Quality and
Preference, 20, 138-143.
Moskowitz, H., y Hartmann, J. (2008). Consumer research: creating a solid base for
innovative strategies. Trends in Food Science y Technology, 19 (11), 581-589.
Nabors L.O., 2001. Alternative sweeteners: an overview. In: L. O. Nabors (Ed.)
Alternative Sweeteners, New York: Marcel Dekker.
Pascua, I., Koç, H., y Foegeding, A. (2013). Food structure: Roles of mechanical
properties and oral processing in determining sensory texture of soft materials.
Current Opinion in Colloid y Interface Science, 18, 324-333.
CAPÍTULO 4
205
Pineau, N., Schlich, P., Cordelle, S., Mathonniere, C., Issanchou, S., Imbert, A.,
Rogeaux, M., Etievant, P., y Koster, E. (2009). Temporal Dominance of
Sensations: Construction of the TDS curves and comparison with time–intensity.
Food Quality and Preference, 20, 450-455.
Prakash, I., DuBois, G. E., Clos, J. F., Wilkens, K. L., y Fosdick, L. E. (2008).
Development of rebiana, a natural, non-caloric sweetener. Food and Chemical
Toxicology, 46, S75–S82.
Renard, D., van de Velde, F., y Visschers, R.W. (2006). The gap between food gel
structure, texture and perception. Food Hydrocolloids, 20, 423-431.
Rosner, B. (1995). Fundamentals of biostatistics (4th ed.). Belmont: Duxbury Press.
Saint-Eve, A., Deleris, I., Panouillé, M., Dakowski, F., Cordelle, S., Schlich, P., y
Souchon, I. 2011. How Texture Influences Aroma and Taste Perception Over
Time in Candies. Chemosensory Perception, 4 (1-2), 32-41.
Szczesniak, A. S. (2002). Texture is a sensory property. Food Quality and
Preference, 13, 215–225.
Valentin, D., Chollet, S., Lelievre, M., y Abdi, H. (2012). Quick and dirty but still
pretty good: a review of new descriptive methods in food science. International
Journal of Food Science and Technology, 47, 1563-1578.
Van Kleef, E., Van Trijp, H. C. M., y Luning, P. (2005). Consumer research in the
early stages of new product development: a critical review of methods and
techniques. Food Quality and Preference, 16, 181-201.
Varela, P., y Ares, G. (2012). Sensory profiling, the blurred line between sensory
and consumer science. A review of novel methods for product characterization.
Food Research International, 48, 893-908.
Varela, P., Pintor, A., y Fiszman, S. (2014). How hydrocolloids affect the temporal
oral perception of ice cream. Food Hydrocolloids, 36, 220-228.
CAPÍTULO 4
206
Wei, Y. P., Wang, C. S., y Wu, J. S. B. (2001). Flow properties of fruit fillings. Food
Research International, 34, 377-381.
Zhao, L., y Tepper, B. J. (2007). Perception and acceptance of selected high-
intensity sweeteners and blends in model soft drinks by propylthiouracil (PROP)
non-tasters and super-tasters. Food Quality and Preference, 18, 531-540.

RESUMEN Y DISCUSIÓN

RESUMEN Y DISCUSIÓN
209
En La presente tesis doctoral “La revalorización del uso de almidón de
tapioca. Estrategia multienfoque en su aplicación en rellenos de fruta”, Se
han desarrollado sistemas basados en almidón nativo de tapioca para
aplicación en rellenos de fruta con el fin de revalorizar el uso de este
almidón en la industria de alimentos. Se desarrollaron modelos y
productos y se aplicaron herramientas para su desarrollo desde el punto
de vista instrumental y sensorial. Todos ellos están enmarcado en los
proyectos que se pueden desarrollar y aplicar en Sucroal S.A empresa en
la que trabajo y con la participación del estado colombiano, programa del
SENA “Apoyo a la creación y fortalecimiento de unidades de investigación
aplicada y desarrollo tecnológico”. El estudio y la aplicación de algunas
herramientas nuevas para el desarrollo de productos tanto desde el punto
de vista instrumental como sensorial constituyen un importante aporte en
la presente memoria.
Para el cumplimento de los objetivos propuestos, se evaluó la adición de
un hidrocoloide como modelo principal: sistema mixto, basado en almidón
nativo de tapioca (NTS) con adición de pectina de bajo metoxilo (LMP).
Los rellenos de fruta para pastelería suelen tener un bajo valor de pH y
normalmente deben soportar altas temperaturas de proceso y horneado
sin alterar su calidad, por esta razón, el sistema propuesto se comparó con
un control, elaborado con un almidón modificado altamente entrecruzado,
hidroxipropilado y fosfatado – de maíz waxy (MWCS) que se utiliza
normalmente en rellenos de fruta elaborados industrialmente. Se
estudiaron las propiedades de formación de pasta de los almidones y las
propiedades viscoelásticas, los parámetros de textura instrumental
(extrusión) y sinéresis de los diferentes sistemas modelo. Los resultados
indicaron que la adición de LMP reemplazando un 10 % del NTS aumentó
significativamente el PV, HPV, CPV y total relative setback del NTS y
disminuyó el breakdowm. Así mismo el sistema mixto proporcionó
RESUMEN Y DISCUSIÓN
210
características viscoelásticas de gel más fuerte y elástico alcanzando
valores similares a los del almidón control. Los valores de los parámetros
viscoelásticos G’, G” y tan G’/G”, a frecuencia de 1Hz, no presentaron
diferencias significativas entre el sistema mixto y el MWCS en condiciones
ácidas (pH 3,0-3,2) y con un 35% de azúcar. La adición de pectina
aumentó significativamente la firmeza y la consistencia de los geles
analizados mediante pruebas de extrusión. El diseño de formulaciones de
sistemas de hidrocoloides que añadan valor al producto final, es un
objetivo prioritario en el cambiante mundo de constante aparición de
nuevos alimentos procesados. En el presente estudio se proponen
formulaciones modelo pensadas para actuar como espesantes en rellenos
de frutas de pastelería, o sistemas que requieran baja acidez.
En el diseño y formulación del sistema espesante propuesto se
consideraron también diversos factores inherentes a las condiciones
experimentales de proceso de los rellenos de fruta como la cantidad de
fruta y la estabilidad frente a los tratamientos térmicos (horneado y
congelación), durante los cuales deberán conservar su calidad intacta.
Para ello se investigó la influencia de los tratamientos de calentamiento y
congelamiento/ descongelamiento sobre las propiedades de formación de
pasta, propiedades viscoelásticas, propiedades de textura (extrusión) y la
sinéresis de los rellenos con y sin fruta, elaborados con los tres sistemas
espesantes (mezcla de TS y pectina, almidón control y almidón nativo de
tapioca). Además se evaluó el efecto de la cocción sobre la textura en dos
aplicaciones de pastelería (sistemas abiertos y cerrados). La adición de
fruta causo un aumento significativo de los módulos G’ y G” en todos los
sistemas siendo este efecto mayor en los sistemas que tenían pectina;
esto indicó mayor estructura del sistema por la adición de sólidos y pectina
de la fruta. La adición de pectina modifico la estructura del gel de TS,
actuando como inhibidor de la retrogradación (tan permaneció más
estable para las mezclas con pectina durante el congelamiento) y este
RESUMEN Y DISCUSIÓN
211
efecto fue dependiente de la concentración de pectina adicionada; además
aumentó la estabilidad a las temperaturas de horneado presentando
valores estables de tan, similar comportamiento viscoelástico y
resistencia. Los rellenos con y sin fruta preparados con una mezcla de
almidón nativo de tapioca, pectina de bajo metoxilo y calcio, fueron más
resistentes a tratamientos térmicos tanto congelamiento/
descongelamiento como procesos de horneado que los rellenos
preparados con almidón de tapioca solo, mostrando propiedades
reológicas y texturales estables durante los diferentes procesos y similares
a las del almidón de maíz modificado, usado como control. La adición de
fruta (melocotón) confirió mayor estructura a los rellenos.
Teniendo en cuenta que en la actualidad, el mercado de los alimentos se
encuentra cada vez más segmentado y los consumidores buscan
productos no solo de buena calidad sino que sean más saludables,
satisfagan necesidades y gustos personales. Por ello también se
evaluaron rellenos de fruta reducidos en azúcar, elaborados con diferente
cantidad de fruta y remplazando el azúcar por polidextrosa como agente
de carga y una mezcla de edulcorantes de alta intensidad. La reducción de
azúcares no es fácil debido a que proporcionan buenas texturas y además
los productos son más apetecibles. Para cumplir este objetivo se aplicaron
técnicas instrumentales (reológicas y de textura) y técnicas sensoriales
(estudios de análisis sensorial descriptivo (QDA) clásico con panel
entrenado y estudios con consumidores no entrenados para evaluar su
aceptabilidad). La adecuación de algunos atributos sensoriales se evaluó
con un panel de 100 consumidores mediante escalas JAR. Los resultados
instrumentales de reología y textura y los descriptores de textura del QDA
se encontraron altamente correlacionados, describiendo a los rellenos
elaborados con el almidón control y la mezcla de tapioca-pectina como;
consistentes, adherentes, de mayor tiempo de residencia en boca, y
recubrimiento que los elaborados con almidón de tapioca. Estos últimos

RESUMEN Y DISCUSIÓN
212
fueron descritos como fluidos. Las muestras con alto contenido de fruta
(50 g/100 g) fueron descritas como de mayor consistencia que las
elaboradas con 25 g/100 g. Estos resultados confirman los datos
obtenidos instrumentalmente en los cuales los sistemas elaborados con
almidón control y con la mezcla de tapioca y pectina tienen una estructura
de gel más fuerte que la del almidón de tapioca solo y la adición de fruta
fortalece la estructura del gel. Los parámetros de sabor se afectaron por el
remplazo de azúcar por polidextrosa y edulcorante y por la adición de alto
contenido de fruta; el panel entrenado encontró mayor sabor extraño y
retrogusto en las muestras que contenían edulcorante siendo estos
valores mayores en los rellenos elaborados con almidón control y menores
en los elaborados con almidón de tapioca. También se percibió menor
sabor extraño y retrogusto en los rellenos elaborados con mayor contenido
de fruta; este resultado puede indicar que la percepción generada por el
edulcorante puede ser mitigada usando un alto contenido de fruta.
Se aplicó un análisis de conglomerados jerárquico a los resultados
obtenidos de la prueba con consumidores para detectar los grupos con
diferentes perfiles de preferencias. A partir de los resultados obtenidos fue
evidente que las preferencias de los consumidores estaban segmentadas.
Hubo un nicho de consumidores que prefería los rellenos de frutas con
una textura suave y un sabor dulce, ácido, y muy afrutado,
correspondiente al perfil sensorial de la muestra preparada con almidón de
tapioca nativo y azúcar. Este grupo podría ser descrito como de un "estilo
casero" por preferir un producto natural o estilo casero. Otro grupo
rechazó claramente el sabor de los edulcorantes intensos, por lo que para
el objetivo de elaborar un relleno de frutas sin azúcar se deberán hacer
estudios en profundidad para formular un nuevo perfil de dulzor para esta
población o hacer un mayor esfuerzo para descubrir la manera de informar
a los consumidores de los beneficios de la disminución de calorías y el
control de la diabetes o del peso, en el contexto de dieta y estilo de vida
más saludable. Por último, a un grupo numeroso de consumidores le gusta
RESUMEN Y DISCUSIÓN
213
tanto las muestras con azúcar como las sin azúcar, por lo que todas las
formulaciones propuestas encajarían en sus preferencias
Para el cumplimiento del último objetivo, dada la segmentación de los
consumidores con respecto a los productos evaluados y sabiendo que una
serie de características texturales se evalúan durante el consumo y la
masticación del producto, que a su vez modulan la percepción del sabor,
se utilizaron técnicas sensoriales relativamente nuevas para poder
profundizar en la comprensión de la percepción de los rellenos de fruta.
Adicionalmente estas técnicas sensoriales nos permiten que sea el
consumidor quien dirija y sugiera qué aspectos de la formulación pueden
ser rediseñados.
Las muestras elaboradas con los tres sistemas espesantes con y sin
azúcar y con contenido de fruta 50g/100g, se sometieron a dos técnicas
sensoriales: Dominio temporal de las sensaciones (TDS: Temporal
Dominance of Sensations) evaluando textura y sabor por separado y
análisis CATA (Check-all-that-apply) incluyendo la evaluación de un
"relleno de fruta ideal". Los resultados se relacionaron con la aceptabilidad
por los consumidores e indicaron, como era de esperar de acuerdo a los
parámetros evaluados anteriormente, que los atributos de textura fueron
muy dependientes del sistema espesante tanto en TDS como en análisis
CATA, Sin embargo el producto ideal y la aceptabilidad se ubicaron
alejados de estos atributos de textura, indicando que existe una
segmentación en las preferencias por los consumidores dirigida por el
sabor; de hecho hubo varios atributos de textura en TDS que no fueron
significativos.
De acuerdo con las curvas de TDS de textura las muestras con pectina
fueron predominantemente cohesivas y no cremosas, mientras que para
las muestras con almidones, la cohesividad no excedió el nivel
significativo. Por otra lado las muestras de almidón control se percibieron
significativamente dominantes como cremosas y las muestras de almidón
RESUMEN Y DISCUSIÓN
214
nativo solo significativamente dominantes como “fondant” (de fácil fusión
en la boca). Estos dos atributos se consideran algo opuesto a "cohesivo"
en el sentido de que indican la difusión en la boca en vez de permanecer
“en una sola pieza".
Como resultado del análisis CATA, el relleno de fruta ideal fue descrito
como dulce (pero no "muy dulce"), suave, con sabor a fruta, homogéneo,
consistente y que se funde rápidamente en la boca, y, como se esperaba,
delicioso. Estos atributos tienen una alta frecuencia de mención (más del
20% de los consumidores) lo cual indica que pueden considerarse como
los principales motores de aceptabilidad para este tipo de producto. En
cuanto a sabor, las muestras elaboradas con azúcar fueron las más
aceptadas por los consumidores ubicándose cerca del producto ideal y los
atributos de dulce y afrutado; estos dos atributos también se encontraron
como dominantes en las curvas de TDS para sabor, confirmando que el
azúcar tiene gran poder en la dirección de determinar la calidad.
A partir de estos resultados es evidente que la sustitución de azúcar por
otros edulcorantes es un reto para los investigadores y la industria por
igual, ya que pueden modificarse además del sabor dulce, otros atributos
de sabor. La formulación de los productos alimenticios para nichos
específicos como los consumidores de productos bajos en calorías es un
punto clave en los nuevos desarrollos.

CONCLUSIONES

CONCLUSIONES
217
Las principales conclusiones de la presente tesis doctoral ”La
revalorización del uso de almidón de tapioca. Estrategia multienfoque en
su aplicación en rellenos de fruta”, son:
Un sistema compuesto por almidón de tapioca nativo con adición
de pectina de bajo metoxilo y calcio, ha demostrado ser una
alternativa interesante que presenta propiedades reológicas y de
textura similares que los almidones modificados para aplicación en
rellenos de fruta.
Los resultados reológicos indican que en el sistema elaborado con
la mezcla de almidón de tapioca, pectina de bajo metoxilo y calcio,
la pectina tiene un papel dominante en la estructura del sistema.
Los rellenos de fruta preparados con la mezcla propuesta de
almidón de tapioca, pectina de bajo metoxilo y calcio fueron
estables a las temperaturas de horneado, mostrando ventajas
considerables en comparación con la utilización de almidón de
tapioca solo.
La adición de puré de fruta (melocotón) mejoró la estructura de los
rellenos; las pruebas de cocción en dos aplicaciones reales:
pasteles (cerrado) y tartaletas (abierto) confirmaron la viabilidad
del sistema propuesto, que incluso presentó ventajas en
comparación con el control.
El diseño de formulaciones de sistemas de hidrocoloides que
añadan valor al producto final, utilizando el almidón nativo de
tapioca en su formulación revaloriza el uso de este ingrediente en
la industria en alimentos.
CONCLUSIONES
218
Las nuevas técnicas sensoriales y de estudios con consumidores
disponibles aportan la posibilidad de recoger información que
permite profundizar en el conocimiento de las preferencias del
consumidor.
La elección de las formulaciones por parte de los consumidores
depende en gran manera de sus preferencias: éstas estuvieron
segmentadas por la presencia de edulcorante o azúcar, y entre
texturas más consistentes o más fluidas.
La sustitución de azúcar por otros edulcorantes es un reto. La
formulación de los productos alimenticios para nichos específicos
como los consumidores de productos bajos en calorías ha
resultado ser un punto clave en los nuevos desarrollos.
El estudio dinámico de la percepción sensorial durante el consumo
y degustación de un alimento, además de una descripción más
realista permite una mayor comprensión de la complejidad de la
percepción y su relación con las preferencias del consumidor.
Este estudio ha demostrado la importancia de tomar en cuenta la
segmentación de las preferencias del consumidor y la adecuación
de los métodos y técnicas sensoriales utilizadas en el diseño de
nuevos productos alimenticios como rellenos de fruta bajos en
calorías.