MASTER EN AUTOMOCIÓN - UVaDOC: Iniciouvadoc.uva.es/bitstream/10324/15022/1/TFM-I-68.pdf · La...
70
Escuela Ingenierías Industriales Depto. Ingª Energética y Fluidomecánica Paseo del Cauce s/n Fundación Cidaut Parque Tecnológico de Boecillo, 209 47151 Boecillo (Valladolid) 47011 Valladolid (España) España MASTER EN AUTOMOCIÓN ESCUELA DE INGENIERÍAS INDUSTRIALES TRABAJO FIN DE MÁSTER Aerodynamics in race cars Design and characterization of a diffuser for a Formula Student race car Aerodinámica en vehículos de competición Diseño y caracterización de un difusor para un vehículo de Formula Student Autor: D. Manuel Víctor Parrilla Gallego Tutor: D. Alejandro Izquierdo Tutor Colaborador: D. Daniel Bell Valladolid, Julio de 2013
-
Upload
truongthuan -
Category
Documents
-
view
217 -
download
0
Transcript of MASTER EN AUTOMOCIÓN - UVaDOC: Iniciouvadoc.uva.es/bitstream/10324/15022/1/TFM-I-68.pdf · La...
Escuela Ingenierías Industriales Depto. Ingª Energética y Fluidomecánica Paseo del Cauce s/n
Fundación Cidaut Parque Tecnológico de Boecillo, 209
47151 Boecillo (Valladolid) 47011 Valladolid (España)
España
MASTER EN AUTOMOCIÓN ESCUELA DE INGENIERÍAS INDUSTRIALES
TRABAJO FIN DE MÁSTER
Aerodynamics in race cars
Design and characterization of a diffuser for a Formula Student race car
Aerodinámica en vehículos de competición
Diseño y caracterización de un difusor para un vehículo de Formula Student
Autor: D. Manuel Víctor Parrilla Gallego
Tutor: D. Alejandro Izquierdo
Tutor Colaborador: D. Daniel Bell
Valladolid, Julio de 2013
Aerodynamics in race cars ii
ABSTRACT
In the present document a study about the characterization and optimization of a diffuser for a formula student race car has been carried out. This study pretends to provide a general overview about how the diffuser of a race car works. To that effect, an analysis about some variables that have effect in the diffuser performance has been developed.
Different configurations of diffuser has been designed and studied in order to choose the design with the best adaptation to the car. Also different configurations of the geometry chosen have been studied to know how the different parameters affect to the performance of the diffuser.
The aerodynamic study of this car starts with a model without any aerodynamic appendix. Therefore is also objet of this project the design of the front and the rear wings in order to study the interaction wings-diffuser.
The methodology chosen to carry out this study is based in CFD technology, carried out through the Star CCM+ software for the calculation, and CATIA for the develop of the models. The computational fluid dynamics provide an accurate solution of this kind of problems and can be easily implemented with standard facilities.
In order to have a better idea about the operation of the different proposed solutions a lap time simulation has been used.
To conclude the study a summary of the results achieved in each stage is done in order to can compare the gains of the each model and have a global overview of the design process.
Regarding with the results obtained, it has been calculated a Cd=0,88 and Cl=-0,011 for the baseline design which results in a drag force of 191N and a downforce of -12,5N. As can be seen, these results do not seem too good.
In order to improve the performance of the starting design, different models has been proposed and studied, introducing an optimized diffuser as well as front and rear wings.
After the different studies carried out, the best configuration has been found for the first design of diffuser proposed (view chapter four) with a length of 550mm and 20 degrees of exit angle. The diffuser works in combination with a three planes front wing which provides about 700N of downforce and a rear wing, which provides about 650N. The diffuser in these conditions is generating about 500N. The total downforce generated under these conditions is around 1900N. This improvement of the aerodynamics forces has allowed reducing the time per lap of a typical circuit for this category up to 6 seconds, which could provide an idea about the importance of the aerodynamics in the race cars.

Aerodynamics in race cars iii
RESUMEN
La aerodinámica se ha convertido en una pieza clave en el rompecabezas de la ingeniería de competición. Se dice que la aerodinámica representa más del 50% total sobre el rendimiento del monoplazas de Fórmula 1 o GP2 que son las competiciones donde tal vez estén más desarrollados este tipo de tecnologías, dejando a los neumáticos y los elementos mecánicos un papel un tanto secundario a la hora de bajar los tiempos por vuelta.
Con la presencia cada vez más instaurada del cálculo fluido dinámico asistido por computador, está teniendo lugar un incremento en los estudios aerodinámicos de vehículos, ya sean orientados a la competición o no, que antes no podían tener lugar si no fuera en túnel de viento o con test en pista., lo cual conlleva unos costes muy elevados en el desarrollo de un vehículo.
A pesar de todo se puede decir que es sumamente complicado encontrar bibliografía relacionada con el tema que ocupa el presente estudio. La aerodinámica en vehículos de competición. Posiblemente este área de conocimiento sea una de las más codiciadas en el sector de la ingeniería de competición y los estudios llevados a cabo por los equipos son normalmente guardados con recelo para evitar copias de soluciones técnicas entre equipos. Los estudios publicados, por otra parte, a menudo están faltos de información y además dan esta de una manera simplista y poco útil. Este hecho hace que aprender y formarse en este campo sea una tarea bastante complicada que requiere muchas horas de experiencia y estudio.
En el presente estudio se ha llevado a cabo un análisis de las variables que gobiernan el rendimiento aerodinámico del suelo-difusor en un vehículo de competición desde un punto de vista cualitativo. Para esto se ha como base el coche que el equipo de Formula Student de Oxford Brookes University está desarrollando para las competiciones del 2013. Además se ha desarrollado el conjunto aerodinámico completo del vehículo con el fin de poder determinar la influencia entre alerones y el propio difusor. Para llevar a cabo el estudio se ha hecho uso de técnicas de mecánica de fluidos computacional mediante el software Star CCM+ que será alimentado por los modelos numéricos obtenidos previamente en CATIA v5.
El análisis comienza con un estudio pormenorizado de las características aerodinámicas que posé el vehículo sin la adición de ningún tipo de aditamento aerodinámico. El coche está construido con un chasis monocasco fabricado en aluminio “honeycomb” que actúa como superficie de interacción con el aire, es decir, no hay ningún carenado independiente al propio chasis para mejorar las características aerodinámicas de este. Es precisamente el chasis, junto con otros elementos, como los soportes de la transmisión y el motor, los que van a limitar la forma que puedan adoptar cualquier tipo de elemento aerodinámico que se quiera añadir, pero especialmente influirá en la geometría del difusor con lo que el rendimiento del mismo está supeditado a las limitaciones del propio chasis.
Una vez conocidos los valores de diversas variables del modelo de partida, como pueden ser el drag y el downforce, así como la distribución de presiones sobre el coche y el recorrido de las líneas de flujo que inciden sobre él, es posible comenzar con el diseño del difusor. Es esencial, conocer previamente el comportamiento aerodinámico del coche para saber de qué modo se puede abordar el problema del diseño del fondo, ya que la dirección de las corrientes del flujo y la distribución de presiones influirán en el comportamiento del mismo. Por tanto es preciso conocerlas de antemano para empezar el diseño objetivamente. Es también importante conocer los valores de las fuerzas generadas para comparar con los nuevos diseños y tener una idea en cada momento de las mejoras que se han hecho y si ciertos diseños han funcionado o no lo han hecho y en qué medida.

Aerodynamics in race cars iv
Con el fin de encontrar una geometría que se adapte lo mejor posible a las especificaciones del coche y que genere el rendimiento más alto posible se han propuesto varias soluciones para su estudio. Se han estudiado las fuerzas que genera el propio difusor y la influencia sobre el total del coche, analizando también la distribución de presiones sobre el suelo y las estelas generadas por el flujo, que tendrán especial importancia en la generación de resistencia.
Una vez elegida la geometría de suelo-difusor más adecuada se ha estudiado la influencia que tienen tanto el alerón delantero como el trasero en el rendimiento aerodinámico del suelo y en el global del coche. Para esto han sido previamente desarrollados ambos alerones siguiendo varios criterios de diseño hasta encontrar una geometría más o menos óptima para el cometido que las alas tienen. Hay que hacer notar en este punto que el trabajo se basa en el estudio del suelo del vehículo principalmente, por lo que los alerones adquieren un papel secundario y no han sido optimizados al máximo, lo cual podría constituir un proyecto por si solo. No obstante la eficiencia que se ha alcanzado en ambos alerones es bastante alto (en torno a 5 para el alerón delantero y 3 el trasero) y pueden constituir un modelo significativo de lo que cualquier coche de esta categoría podría incorporar.
Con el fin de poder cuantificar numéricamente la mejora (o empeoramiento en su caso) de los distintos modelos propuestos se ha empleado un simulador de tiempos por vuelta en el que se ha implementado un circuito típico para la Formula Student y han sido tenidas en cuenta diversas características del coche con especial importancia sobre ello. El peso del vehículo, las fuerzas aerodinámicas, el par y potencia del motor así como las relaciones de transmisión se tendrán en cuenta para el análisis.
Por último se ha hecho una revisión de los resultados conseguidos comentando aspectos de especial interés en el diseño de este tipo de sistemas y se dan una serie de pautas o posibilidades de desarrollo futuro para mejorar el diseño conseguido y ampliar los resultados conseguidos en este estudio.
En relación con los resultados obtenidos, hay que hacer notar la gran influencia que ha tenido la incorporación de los elementos aerodinámicos en las fuerzas generadas por el coche y la implicación que eso ha tenido en el descenso de los tiempos por vuelta.
El diseño del que se partía tenía unas características aerodinámicas poco enfocadas a obtener el máximo rendimiento en pista, ya que aunque el drag generado era muy bajo, el coche no estaba generando nada de downforce, es más, generaba fuerzas hacia arriba. Concretamente los estudios llevados a cabo han mostrado una fuerza de 191N de drag y -12,5 de downforce.
Después del estudio de las diversas opciones propuestas para el difusor, y los alerones delantero y trasero, se ha encontrado la mejor configuración del coche con el primer modelo de difusor propuesto (ver capitulo cuatro) con una longitud de 550 mm y un ángulo de salida de 20 grados (limitado por la propia geometría del coche). Este difusor trabaja en combinación con un alerón frontal de 3 planos que proporciona un downforce de alrededor de 700N y un alerón trasero, también de tres planos, que ofrece unos 650N. El difusor bajo estas condiciones de operación es capaz de entregar casi 500N de fuerza, lo cual hace que la fuerza total sobre el coche este entorno a los 1900N, permitiendo reducir el tiempo por vuelta en casi 6 segundos en un circuito típico de Formula Student, como puede ser el de Hockemhein del año 2012 que ha sido elegido para el estudio.

Aerodynamics in race cars v
ACKNOWLEDGEMENTS
First of all, I would like to thank Oxford Brookes University for give me the chance to enrol with them as a research student to develop this study. From the first day they have been very friendly helping me in all I needed.
I would also like acknowledge the work of my tutors Daniel Bell from Oxford Brookes University and Alejandro Izquierdo, researcher in CIDAUT foundation to advice and help me in the theoretical aspects guiding me during whole project. Also to Francisco Tinaut, coordinator of the Automotive Engineering Master of UVA-CIDAUT, who has been following my work since the first day.
To my friends and also office mates, Nikos and Mohamed, for their support and teachings during the time we have spent together.
Finally I would like to thank my friends and my family, especially my parents, for the effort they have done for I could develop this project abroad and for the support I have received.
AGRADECIMIENTOS
En primer lugar me gustaría dar las gracias a Oxford Brooks University por darme la oportunidad de trabajar con ellos como estudiante investigador. Desde el primer día se han mostrado muy cordiales ayudándome en todo cuanto he necesitado.
Me gustaría también reconocer el trabajo de mis dos tutores, Daniel Bell de Oxford Brookes University y Alejandro Izquierdo, investigador de la fundación CIDAUT, por los consejos y la ayuda aportada en los aspectos teóricos del trabajo. También me gustaría nombrar a Francisco Tinaut, que se ha mostrado muy interesado por la progresión de este trabajo ayudándome en la gestión de los aspectos académicos.
A mis amigos y compañeros de oficina Nikos y Mohamed, por su apoyo incondicional y por sus impagables enseñanzas extraídas de las largas divagaciones en nuestro tiempo libre.
Finalmente me gustaría agradecer todo esto a mi familia, y en especial a mis padres, que han hecho posible, con su esfuerzo y apoyo, que pudiera adentrarme en el apasionante mundo de la ingeniería de competición desarrollando este proyecto en el extranjero.
Aerodynamics in race cars vi
INDEX ABSTRACT ..................................................................................................................................... ii
RESUMEN ..................................................................................................................................... iii
ACKNOWLEDGEMENTS .............................................................................................................. v
AGRADECIMIENTOS .................................................................................................................... v
INDEX ............................................................................................................................................ vi
1. INTRODUCTION ................................................................................................................... 1
1.1. A bit of history ................................................................................................................ 1
1.2. Diffuser theory and aerodynamic concepts. ................................................................... 3
1.2.1. Underbody channels. Tunnels and diffusers. ......................................................... 3
1.3. Computational fluid dynamics ........................................................................................ 8
1.4. Aim of the project ......................................................................................................... 10
2. STATE OF THE ART .......................................................................................................... 11
3. METHODOLOGY AND PROCEDURES ............................................................................. 15
3.1. Geometry generation ................................................................................................... 15
3.2. Computational fluid dynamics ...................................................................................... 16
3.2.1. Mesh Generation ................................................................................................. 17
3.2.2. Wind tunnel .......................................................................................................... 19
3.2.3. CFD Model ........................................................................................................... 20
3.3. Lap Time Simulator ...................................................................................................... 21
3.4. Improvement of the model. .......................................................................................... 25
4. RESULTS AND COMMENTS ............................................................................................. 27
4.1. Study of the initial concept ........................................................................................... 27
4.2. Diffuser implementation ............................................................................................... 31
4.2.1. Proposal 1 ............................................................................................................ 32
4.2.2. Proposal 2 ............................................................................................................ 35
4.2.3. Proposal 3 ............................................................................................................ 38
4.3. Study and characterization of the chosen proposal ..................................................... 40
4.3.1. Interaction with the wings ..................................................................................... 40
4.3.2. Influence of the moving floor and the rotating wheels in the simulation ............... 47
4.3.3. Influence of the rear wing height on the diffuser performance ............................. 49
4.3.4. Effect of the diffuser angle in the generation of downforce .................................. 51
4.3.5. Influence of the diffuser length in the generation of downforce ............................ 53
4.4. Lap time simulations .................................................................................................... 56
5. CONCLUSIONS .................................................................................................................. 60
5.1. Solution adopted .......................................................................................................... 61

Aerodynamics in race cars vii
5.2. Future work .................................................................................................................. 61
6. BIBLIOGRAPHY ................................................................................................................. 62
ANNEX ........................................................................................................................................ 64
A.1. Aerodynamic concepts ..................................................................................................... 64
A.2. Detailed views of the car .................................................................................................. 68
A.3. Detailed views of the rear wings and the final design. ...................................................... 71

Aerodynamics in race cars 1
1. INTRODUCTION
1.1. A bit of history
There isn’t another aspect race cars technology which has had more impact in the vehicle performance than the development of aerodynamics. In all of the different competitions, including F1, GP2, and Formula 3, aerodynamics is an important element in the performance of the vehicles.
The aerodynamics in motorsport vehicles has undergone a gradual change during the last 60 years. The first time an aerodynamic appendage was introduced on a race car was in 1956 by the Swiss engineer Michael May who mounted a wing on top of the cockpit of a Porsche Spyder. The wing was mounted at the centre of gravity of the car and it could change between -3 and 17 degrees in order to set the appropriate downforce. The main problem was that it failed to pass the verification test and could not participate in the race.
Image 1. Porsche Spyder 1956 [26]
Ten years later, in 1966, after a lot of experiments and bit improvements on the cars related with aerodynamics, the engineer and pilot Jim Hall appeared with inverted plane wing in his Chaparral 2E during the Bridgehampton race in New York. This is regarded the first car which mount wings. This improvement produced an inflexion point in the performance of the competition cars.

Aerodynamics in race cars 2
Image 2. Chaparral E2. The first car that competed with an aerodynamic attachment. [27]
We can’t talk about aerodynamics without make reference to F1, this is where aerodynamics has developed most progress in the motorsport industry. Along the history it has been different significant upgrades which have resulted in a high improvement of the performance. The addition of the wings, the ground effect, the rise of the turbocharged engine, the dynamic suspension, the rear diffuser, and lately the blown diffuser, are some of the advances that have marked an era.
The goal of this project consists on the study of a diffuser for a Formula Student race car. Thereby in this part is where we are going to find a deeper analysis. Focusing on how this part of the car works.
The backgrounds of the actual diffuser were known like a ground effect “undertray”. The first time that was mounted a floor with the intention of generating downforce was in ‘70s were Peter Wright and Colin Chapman introduced in the Lotus 78 a floor with the profile of inverted wing in order to generate downforce. “We have achieved something for nothing” (Champman,Collin. 1976) where he makes reference to the force generated and the little drag that this system had.
The downforce that the system generated was really incredible, but it had a problem. This system was very sensitive to changes of height of the car. In some circumstances it was possible for the car to lose all the downforce doing it undriveable (Liftoff). It is said that different accidents were caused by this fact. The aerodynamics had become very sensitive and dangerous, so the FIA didn’t take a lot of time to restrict the aerodynamic of the cars.
The different restriction of a primary floor, with inverted wing form, has led to the actual form of the rear diffusers. Firstly, the plane floor was introduced, and afterwards, the step floor. In the following lines it could be appreciated a revision of the different technical solutions, whereas it could be found how each of them works and the principles that are based.

Aerodynamics in race cars 3
1.2. Diffuser theory and aerodynamic concepts.
1.2.1. Underbody channels. Tunnels and diffusers.
The idea of creating downforce using the underbody airflow was developed a long time ago. The idea is best demonstrated by the basic concept of an airfoil in ground effect, which has the potential to generate very large values of downforce with relatively low Drag penalties. That shows that an appropriate driving of the flows under the car could generate high levels of downforce.
The clearance between the parts of the car and the track will become a critical factor due to the sensitivity of the tunnels to the height of the track. Different components such as the gearbox need to be placed as low as possible to allow an optimum shape of the car’s floor. The lower surface of some race cars will have longitudinal, slanted underbody channels, in order to generate downforce owning to venture effect. The size of these channels is usually limited by the racing regulations, in many a totally flat floor between wheels is forbidden. In this case it is only allowing the use of a diffuser.
In the different bibliography that discusses that topic, the tunnels (also called venturis) and the diffusers are considered together and both are explained as the same thing. It is true that the physical principle that affects both is the same, but I like to do a distinction between those two. The shape of each of them is mainly because of the different regulations that have led to two different morphologies depending of the rules of each competition. In which the shape of the floor is not restricted, is usually used the tunnel configuration due to the power of generating more downforce. In the majority of competitions, however, is required to have a flat floor or a step floor between the wheels, is in this case when the diffuser is used.
Image 3. Comparative between tunnels (left) and diffuser (right) in Formula One cars. [28]
General aim of the diffuser
The principal aim of the diffuser is to accommodate the flow under the bodywork to the conditions of the back of the car. The optimized surface and the proximity of it to the track, forces the air stream to flow under the car at low pressure and high velocity. The direct consequence of this is the generation of downforce, and perhaps the drag reduction because of an increased pressure in the rear of the car. The flow along the diffuser is losing velocity gradually due to the increasing of the section until it acquires the pressure and velocity conditions of the free stream behind the car. The shape of the diffuser takes special importance in this particular point, because it is necessary to prevent the boundary layer detachment and allow the lateral flows a successful entry into the diffuser in order to obtain the highest performance possible. To achieve this goal

Aerodynamics in race cars 4
several “skirts” with different forms are attached to the diffuser, which must have a correct exit angle to prevent the boundary layer detachment.
Image 4. Detail of the RB8 rear diffuser. Notice the inlet on the step in order to create a “double diffuser” [29]
Similarity to the venturi
The diffuser operation is frequently compared with a venturi tube, both examples work similarly but they have their particularities. The entrance of the floor acts as a nozzle that increases the velocity of the air below the vehicle, a throat that could be regarded as the entrance to the diffuser where the maximum velocity is reached (and minimum pressure), and a diffuser where the air is incorporated to free stream behind the car.
Image 5. Comparison between the distribution of pressure coefficient in a venturi and diffuser [14]
Bernoulli’s principle shows how the velocity of the flow increases when it passes through the throat and as a consequence the local pressure is decreased in order to preserve the fluid energy. In the figure above it can be seen how in both cases the pressure distribution is similar. The lowest pressure is obtained at the narrowest flow passage, which in a vehicle can be utilized to generate downforce. So, as usual the diffuser is also called venturi, channel or tunnel. [Katz, Joseph]

Aerodynamics in race cars 5
Influence of the boundary conditions
Owing to the low pressure generated behind the floor and the high pressure on the bodywork, a downforce is created. Therefore we can conclude that the goal of the diffuser is generate downforce increasing the velocity of the flow under the car to decrease the pressure.
It seems logical to think that closer distances of the under tray to the floor are going to generate more downforce because the flow under the car will be more rapid. This is true to some extent. A ground clearance below a certain level could generate a positive lift due to blockage of the flow which would result as an increase of the pressure under the car. In contrast, greater distances to the track will not allow adequate flow acceleration and as a consequence low levels of downforce will be created. In terms of drag the clearance to the track is less injurious but is also affected in some way.
Graph 1. Lift coefficient variation with the diffuser angle and track height [5]
The previous graph exposes the variation of negative lift coefficient (downforce) in function of non-dimensional track height, where H is the height of the model and h is the distance to the track. For slight values of height the lift increases with respect to the lift at the optimum height which could be due to the airflow blockage.
Image 6. Relation between the dimensions used. [5]
Aerodynamics in race cars 6
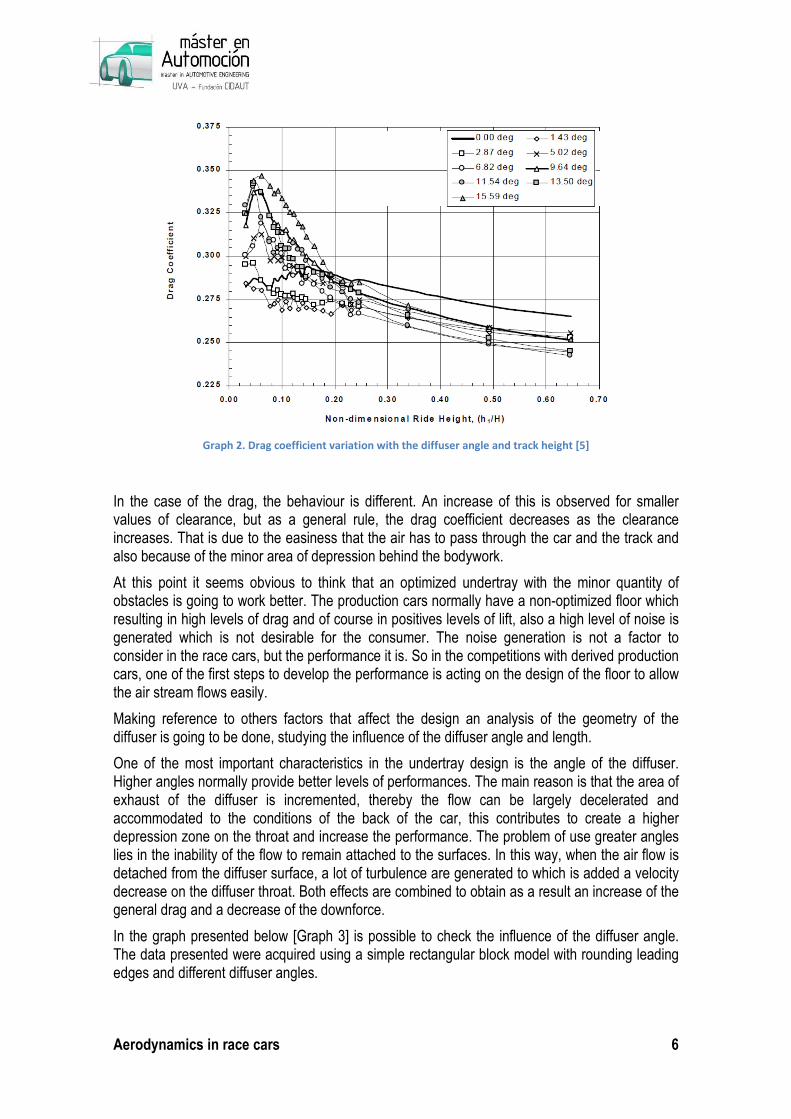
Graph 2. Drag coefficient variation with the diffuser angle and track height [5]
In the case of the drag, the behaviour is different. An increase of this is observed for smaller values of clearance, but as a general rule, the drag coefficient decreases as the clearance increases. That is due to the easiness that the air has to pass through the car and the track and also because of the minor area of depression behind the bodywork.
At this point it seems obvious to think that an optimized undertray with the minor quantity of obstacles is going to work better. The production cars normally have a non-optimized floor which resulting in high levels of drag and of course in positives levels of lift, also a high level of noise is generated which is not desirable for the consumer. The noise generation is not a factor to consider in the race cars, but the performance it is. So in the competitions with derived production cars, one of the first steps to develop the performance is acting on the design of the floor to allow the air stream flows easily.
Making reference to others factors that affect the design an analysis of the geometry of the diffuser is going to be done, studying the influence of the diffuser angle and length.
One of the most important characteristics in the undertray design is the angle of the diffuser. Higher angles normally provide better levels of performances. The main reason is that the area of exhaust of the diffuser is incremented, thereby the flow can be largely decelerated and accommodated to the conditions of the back of the car, this contributes to create a higher depression zone on the throat and increase the performance. The problem of use greater angles lies in the inability of the flow to remain attached to the surfaces. In this way, when the air flow is detached from the diffuser surface, a lot of turbulence are generated to which is added a velocity decrease on the diffuser throat. Both effects are combined to obtain as a result an increase of the general drag and a decrease of the downforce.
In the graph presented below [Graph 3] is possible to check the influence of the diffuser angle. The data presented were acquired using a simple rectangular block model with rounding leading edges and different diffuser angles.
Aerodynamics in race cars 7
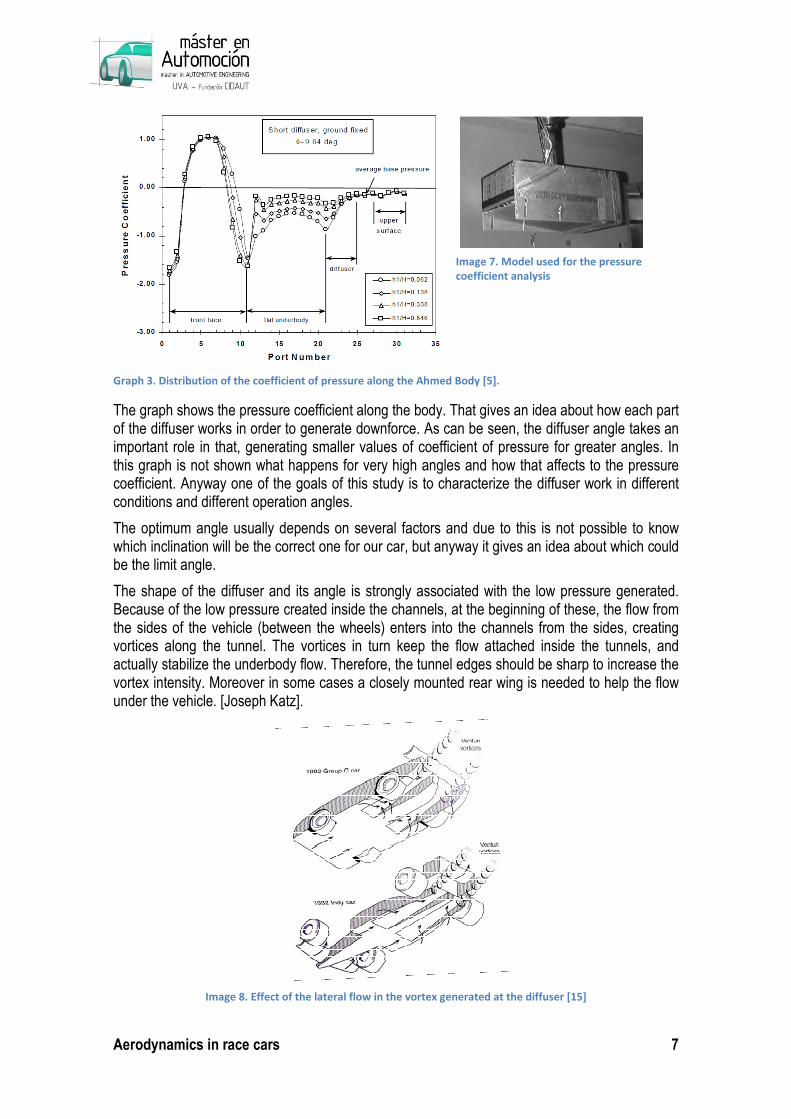
Graph 3. Distribution of the coefficient of pressure along the Ahmed Body [5].
The graph shows the pressure coefficient along the body. That gives an idea about how each part of the diffuser works in order to generate downforce. As can be seen, the diffuser angle takes an important role in that, generating smaller values of coefficient of pressure for greater angles. In this graph is not shown what happens for very high angles and how that affects to the pressure coefficient. Anyway one of the goals of this study is to characterize the diffuser work in different conditions and different operation angles.
The optimum angle usually depends on several factors and due to this is not possible to know which inclination will be the correct one for our car, but anyway it gives an idea about which could be the limit angle.
The shape of the diffuser and its angle is strongly associated with the low pressure generated. Because of the low pressure created inside the channels, at the beginning of these, the flow from the sides of the vehicle (between the wheels) enters into the channels from the sides, creating vortices along the tunnel. The vortices in turn keep the flow attached inside the tunnels, and actually stabilize the underbody flow. Therefore, the tunnel edges should be sharp to increase the vortex intensity. Moreover in some cases a closely mounted rear wing is needed to help the flow under the vehicle. [Joseph Katz].
Image 8. Effect of the lateral flow in the vortex generated at the diffuser [15]
Image 7. Model used for the pressure
coefficient analysis

Aerodynamics in race cars 8
Lastly, it is necessary to mention the importance of the tunnel inlet. The location of the entrance of the diffuser greatly affects where the low pressure occurs on the vehicle undertray. Data presented in Katz et al. [15] shows that there is a low pressure peak at the entrance location. To move the centre of pressure of the undertray or the balance, the low pressure concentration can be moved by changing the location of the diffuser entrance more forward or rearward. For a race car, balance is critical to vehicle performance due to its effects on understeer and oversteer characteristics [Mc Beat, S.; Katz, J.].
1.3. Computational fluid dynamics
Computational fluid dynamics, also known as CFD, is a discipline of fluids mechanics that uses numerical methods to solve problems in which fluids are involved. Fluid flows prediction, heat transfer, mass transfer, chemical reactions, between other problems can be solved using this technology.
This kind of calculus is based in the resolution of the Navier-Stokes equations in its differential form. Conservation of mass, momentum, and energy are involved in the equations that govern the CFD analysis.
The instantaneous continuity equation (1), momentum equation (2) and energy equation (3) for a compressible fluid can be written as:
In order to apply these equations to the fluid region, it must be discretized in finite volumes in which these equations will be solved according to the boundary conditions imposed.
Image 9. Two dimensional mesh example in a plane shape
Once the different variables have been solved for each finite volume it is possible to obtain the data required for the control volume.
According with that, the way to proceed in a CFD simulation is the following:

Aerodynamics in race cars 9
Diverse information can be obtained for the post processing of the simulation flow field.
• Calculation of derived quantities (streamfunction, vorticity).
• Calculation of integral parameters (lift, drag, total mass).
• Visualization (representation of numbers as images).
– 1D data: function values connected by straight lines.
– 2D data: streamlines, contour levels, color diagrams.
– 3D data: cutlines, cutplanes, isosurfaces, isovolumes.
– Arrow plots particle tracing, animations, etc.
According with the data that can be obtained is obvious to think that the CFD analysis present a certain advantages over experimentation, because of the amount of data that can be obtained but also the economic aspect is an advantage in the CFD. But not all is good; the CFD has some limitations that can be solved with the experimentation.
As a rule, CFD does not replace the measurements completely but the amount of experimentation and the overall cost can be significantly reduced.
Experiments Simulations
• Expensive
• Slow
• Sequential
• Single-purpose
• Cheap (er)
• Fast (er)
• Parallel
• Multi-purpose
Table 1. Comparative between CFD analysis and experimentation
The results of a CFD simulation are never 100% reliable because:
• The input data may involve too much guessing or imprecision.
• The mathematical model of the problem at hand may be inadequate.
• The accuracy of the results is limited by the available computing power.
Geometry generation (CAD)
Control volume discretization (Meshing)
Setting of the boundary conditions and phisical models
Calculus Post processing

Aerodynamics in race cars 10
1.4. Aim of the project
The principal goal of this project is the study, characterization and the optimization of the diffuser of a formula student race car.
Is intended with this study to provide a general overview about how the diffuser works. To that effect is going to do an analysis about some variables that have effect in the diffuser performance. Also, how some parts of the car affect to the operation of the diffuser, and how affect the external variables like the movement of the track and wheels to the different parameters like pressure centre or downforce.
Different configurations of diffuser will be studied in order to choose the design with the best adaptation to the car. Also different configuration of the geometry chosen will be studied to know how the different parameters affect to the performance of this part of the car. The interaction with the wing, with the wheels, the diffuser angle, the track height and other variables that affect to the diffuser performance will be analysed in order to characterize the diffuser works under different work conditions.
The aerodynamic study of this car starts with a model without any aerodynamic appendix. Therefore will be also objet of this project the design of the front and the rear wings in order to study the interaction wings-diffuser. Different configuration of rear wing will be analysed to find a good solution for this part of the car and to obtain a solution as a representative as possible of the cars that normally use these kind of solutions. Regarding to the optimization of the wings, this will not too much optimized, which could consists of a project in itself. But it will have enough performance to obtain representative results with the interaction of the car.
The methodology chosen to carry out this study will be based in CFD technology. The computational fluid dynamics provide an accurate solution of this kind of problem and can be easily implemented with standard facilities; this is with only a computer and the appropriate software. The advantages that CFD present over other technologies are obvious, in terms of price, availability and time.
Different parametric models will be develop in CAD format (CATIA V5) to be inserted later in Star CCM+ in order to discretize the control volume, preprocessing the calculus and carry out the appropriate simulation. The post-processing of the simulation will be also developed in Star CCM+ and diverse data will be acquired.
In order to have a better idea about the operation of the different proposed solutions a lap time simulation will be used. The software chosen for this purpose has been “Optimum lap” which is open source software that can provide sufficiently accurate results and has demonstrated to run properly without a big dispersion in the solutions. Regarding to the simulation conditions different parameter of the car such as weight and weight distribution, aerodynamics, torque and power, gear ratios, tires coefficients, etc, will be implemented to have a model as close as the real possible.
To conclude the study a summary of the results achieved in each stage will be done in order to can compare the gains of the each model and have a global overview of the design process.

Aerodynamics in race cars 11
2. STATE OF THE ART
The Formula Student (Formula SAE in America) has become one of the most popular competitions in the motorsport world. The level of performance of the prototypes of the different teams present in the competitions around the world is coming to a level of development which could be in higher categories.
The aerodynamics has become one of the most important areas to develop within the car. Different technologies have been developed for this competition, as aerodynamics wings, diffuser and optimized bodywork. These improvements allow the cars to have more performance due to increasing of downforce and reduction of the drag which is a factor to consider due to the power of the engines and the necessity of have a content consumption.
Image 10. Two different concepts for the same competition. High downforce (Left) and low drag design (Right).
One of the ways that almost all teams chose to develop the aerodynamics of theirs cars is the CFD technology. The results that provide the CFD analysis are sufficiently precise to develop conveniently any part of the car. The usage of this technology is constantly growing due to the versatility, low cost, and reduction of development times which is essential for the requirements in the automotive industry and its short times of development.
The usage of CFD in competition is day by day more extended because the possibility of carried out a lot of experiment in a fast way using coupled design tools with parametric design. Looking to get small improvements in a sector where the margins of improvement are reduced.
The advantages over other procedures like wind tunnel experiments are clear. Lower cost, greater flexibility and ease access to resources for everyone. But it is also true that the rapid prototyping is growing quickly and the cost that were involved in a wind tunnel test are now descending, and both, CFD analysis and wind tunnel testing, can complement for better results.
Regarding to race car development, the design of the undertray is usually one of the areas with more study of the cars. But curiously it is one of the most unknown parts of the vehicle, probably because the teams keep their studies in secret. Frequently the design of this piece is focused in get more downforce or reduce the drag.
The idea behind the floor of the car is to use the close proximity of the vehicle to the ground in order to generate a force, known as ground effect, due to the venturi effect generated under the car. Like in a venturi, there is a nozzle that increases the velocity of the air underneath the vehicle, a throat where the maximum velocity is reached and a diffuser where the air is slowed back down to free stream velocity. Bernoulli's Equation shows us that as the local velocity

Aerodynamics in race cars 12
increases relative to the free stream velocity the local pressure is decreased. Using this lower pressure under the vehicle and the higher pressure on top, downforce can be created.
Below is going to be an introduction to the different ways of researching of various work teams which have been investigating in different cases within the aerodynamics of formula student cars and particularly in the design of the undertray. Any other articles will be presented because of the relationship with this topic and the influence that it may have, even though they are not directly related with the competition.
The research lines are diverse; depending of the goals, the way to proceed is a bit different. Thereby a lot of procedures exist to achieve the aims that have been proposed in first time.
Recently in the SAE congress of Brazil was presented a comparative study of different designs of floors in open wheel race car [19]. The results of that study shows that there is an improvement of 7.1% in the drag reduction with the use of the optimized diffuser.
Image 11. Velocity distribution in the symmetry plane for different designs of diffuser. [19]
This improvement was achieved only with the geometry of the floor. They did not incorporated technical solutions like vortex generators, double diffusers, or other kinds of attachments with the finality of improve the performance, which are commonly used in higher competitions. The main objective was the improvement of the drag without any consideration of the downforce.
A similar study was carried out by Angel Huminic in the Transylvania University where the importance of the dimensions of the diffuser and its angles respect the horizontal are shown. Also the influence of the vortices generated by the wheels is studied in order to determinate how it affect to the general drag of the car. It was determinate that the addition of the wheels and wheelhouses (in the case of the production cars) results in increasing of the drag about the 25%, which gives a reference about how the important the wheels are into the aerodynamic behaviour.[9]
In other part, the results show that the lift and the drag decrease with increasing diffuser length and diffuser angle. But there comes a time that the drag rises again due to detachment of the boundary layer and the vortex generated. That occurs with angles above of 6 degrees. Other studies and the reference bibliography [7, 13, 16, 23] show higher angles for this fact. So we don’t have to take these results as a reference but it gives an idea about the general behaviour of the diffuser. In this way, a study carried out by Obinna Ehirim [7] shows that the maximum performance of the diffuser is reached with an angle of 20 degrees in a formula student race car, which can be considered a more significant number.

Aerodynamics in race cars 13
In order to improve the efficiency in different situations active diffusers are implemented, but only in production cars, because of the limitations of the rules in the aerodynamics field in almost all categories of motorsport. In this way Hyundai conducted a study about how an active rear diffuser affect to the drag reduction in a three volumes production car. The study was carried out using a diffuser with the capacity of extended to different lengths in function of velocity and other variables, in order to achieve the maximum performance possible. Various kinds of geometries were also checked in different circumstances to achieve finally a decrease of 5% in the aerodynamic drag. [19]
Other way of research, largely used in competition, is based on the generation of downforce on the diffuser. In this case the goal is trying to use the diffuser like a venturi tube and use the ground effect to generate downforce. In these cases are usually used different attachments in order to seal as best as possible the space between the floor of the car and the track. Other way of procedure to achieve a better performance consists in the generation of vortices along the diffuser skirts. That vortices increase the flow energy allowing higher diffuser angles [24].
Image 12. Effect of the skirts in the diffuser. [24]
The improvement of this system is around 15% at 90km/h which is substantially increased with the use of a rear wing.
For the purpose of obtain the max performance possible, different attachments are implemented. According to the studies there is about a 5% of improvement with the use of skirts. The vortex generators are used to seal the floor and sometimes to increase the flow energy. Moreover, by suction effect produced by the longitudinal vortex heightens the fluid velocity of the diffuser, which increases the negative pressure. But in this study is not characterized the influence of these attachments. [24]
Other ways of researching, that that also will be studied in the present document is the interaction between diffuser and rear wing. Lotus Engineering carried out an analysis to determinate how affects the height of the rear wing in the diffuser performance. The studied was executed using a Lotus Evora model and was determined that in this kind of cars the height of the rear wing do not have great importance in the interaction with the diffuser [4].

Aerodynamics in race cars 14
Image 13. Interaction between diffuser and rear wing in a Lotus Evora. Pressure distribution in the symmetry
plane. [4]
The results show that there is not a decisive influence between the wing and the diffuser in this kind of cars, but there is a change in the own wing because of the changes in the flow incidence on the rear wing, with performance increasing with the height.

Aerodynamics in race cars 15
3. METHODOLOGY AND PROCEDURES
The present study aims develop and study a diffuser for a formula student race car in order to achieve the maximum performance possible. Also behaviour in different situation will be studied. For that, the methodology chosen consists of numerical models simulated by CFD due the flexibility provided by this method and the low cost involved.
The study starts with an implementation of the car in a CAD model. That model will be studied to understand the initial aerodynamic characteristics and how the air streams flow around the car.
Once the baseline model is known, different designs of undertrays will be generated by CAD and tested with CFD. The best one of these will be chosen for performance optimisation and changes to different parameters will be like diffuser angle, pitch angle, track height, etc. In this way, different models will be also checked to compare how each of one works.
In addition to this, the aerodynamic performance will be studied in lap time simulator, thereby is possible to know how the aerodynamics affect the time per lap in different kind of circuits and get a better idea about what aerodynamic set up is adequate for each circuit.
3.1. Geometry generation
To carry out the design of the geometry the software CATIA v5 has been chosen. This software provides a very versatile package of options to generate the geometry fast and efficiently. Also provides a parametric design that could be used to modify the geometry with few operations.
The geometry implemented will be representative of the car but not reaching levels of details that make the simulation intractable. In this way different parts of the car will be eliminated, like suspension supports, bolts, callipers, etc… and other ones will be simplified, like the driver, cockpit, or the hubs. In spite of this, the models implemented give reasonable results about how the aerodynamics works in the real car, with a minimum error. That error can be quantified testing the aerodynamics on track. Therefore, which is pretended with this study is to give a qualitative idea about the interaction the diffuser operation and the exact data is not as important and can be considered as a secondary question.
In the following pictures is represented the baseline of the car with its dimension. (See the annex for detailed views)
Image 14. Baseline of the model studied. Oxford Brookes Racing ISIS XIII. Perspective view.
Aerodynamics in race cars 16
Image 15. Different views of the model and coordinate system.
3.2. Computational fluid dynamics
In order to determine the interaction between the air stream and the vehicle surface, will be used the CFD technology. The result of the simulation can give different interesting parameters like pressure distribution, velocity, drag, downforce, and other fluid properties that will allow determining the aerodynamic performance of the car.
The software used to carry out the study is StarCCM+ V7.04.011 a well-known CFD software with capable of make both pre-processing and post-processing apart from the CFD calculation. That means that only one program is required to make the simulations. Using other ones like OpenFoam is necessary to have additional software to make the meshing and view the solutions.
The CFD is a powerful tool that allows having a sufficiently precise result in most problems. Nevertheless the resolution of the Navier-Stokes equation using finite volume methods involves certain difficulties which must take into consideration. The primary problems are follows: [2]
• Existing popular turbulence models do not work well in all areas of the flow.
• Modelling the effects of the turbulence in the oncoming wind is difficult or expensive in
terms of computation.
• Fine details on car have a significant effect on the flow, but to model them sufficiently
accurately require a very fine grid and a large computational time.
• Good simulation requires long run times on very powerful computers.
• It is difficult to correctly model the rotation wheels.
• The wake behind the vehicles and this feeds back to unsteadiness on the flow around the
vehicle. Unsteady simulations will require long time of computing.
The meshing is one of the points into the process that can be that the solution turns very high in computation terms. In order to minimize the number of cells of the model different solutions are used. In areas where is necessary to have a good knowledge about the flow, or areas where the flow properties changes rapidly is necessary to have a finer mesh for a correct solution. The boundary layer could be the more representative example about that. In contrast farthest points of

Aerodynamics in race cars 17
the car don’t need this resolution in the grid, so coarse cells are implemented far of the body. In this way, boundary layer can be meshed or control volumes can be generated.
3.2.1. Mesh Generation
The starting point for the meshing process is the import of some type of surface data in the form of either a mesh or geometric description of some kind. There are three different types of surface data that can be imported into STAR-CCM+:
• Surface meshes
• Neutral from data
• CAD data
In the present study we have chosen the third method. The geometry has been imported as a step file, which is tolerated without problem for the software. This geometry has been developed using surfaces. This has advantages and disadvantages, but generally working with these types of geometries in the CFD is difficult. Sometimes different errors of geometry can occur, so the use of the surface repair module that StarCCM+ incorporates is very useful and at times indispensable.
The meshing process starts with the generation of the surface mesh. A surface mesh is a discrete representation of the geometry of the individual regions that will be used for the volume mesh generation. It is made up of faces (triangles) and vertices. Ideally, the surface mesh should have the following properties:
• Closed - Contains no free edges or mismatches.
• Manifold - Edges are shared between no more than two triangles.
• Non-intersecting - The surface does not self-intersect. The quality of triangle faces is also important. The surface should ideally contain:
• Equilateral triangles.
• Gradual variation in triangle size from one to the next.
• No sharp angles/surface folds etc. within the triangle proximity sphere. Once the surface meshing has concluded, is possible to start with the volume meshing. The volume meshing is based in the previous surfaces cells, so the first step must be correct. The StarCCM+ Pre-Processor allows create different kinds of volume cells depending of the requirements of the model.
• Tetrahedral
• Polyhedral
• Trimmed
• Thin mesh Each of ones have their own properties and are used for different proposes.
Aerodynamics in race cars 18
In this study have been used for the mesh the following models:
Polyhedral Mesher
The polyhedral meshing model utilizes an arbitrary polyhedral cell shape based on the previously generated surface mesh in order to build the core mesh. The polyhedral cells created typically have an average of 14 cell faces.
Prism Layer Mesher
This kind of meshing allows create a prismatic type volume mesh near the contour of the body. Improve the overall cell quality and reduce the cell count when compared to an equivalent tetrahedral or polyhedral type core mesh. Thereby the boundary layer can be studied in more detail.
Surface Remesher
The surface remesher is used to re-triangulate an existing surface in order to improve the overall quality of the surface and optimize it for the volume mesh models.
Table 2. Characteristics of the different types of meshing.
In order to adapt as best as possible the mesh to the geometry and not to have a very high simulation that would takes days to calculate have been used different mesh sizes in the different parts of the car. The following table shows the various cells sizes that have been chosen to carry out the surface meshing.
Tunnel Minimum 0,003m
Target 0,06m
Body Minimum 0,002m
Target 0,02m
Diffuser Minimum 0,002m
Target 0,02m
Wheels Minimum 0,005m
Target 0,01m
Boundary Layer
Prism Layer Thickness 0,01m
Number of Prism Layers 4
Prism Layer Stretching 1,5
Total number of cells 5.500.000 (approx. value depending of the model)
Table 3. Meshing parameters.
With these dimensions has been found an acceptable compromise about the computation time, the convergence of the model and the time to generate the mesh. That gives a grid with around five million and half of cells, which can be considered enough to make an analysis with good results. These data are approximate because the different geometries used in the developing of the car will give, as a consequence, a different size of the mesh. Nevertheless it can be considered as a reference.

Aerodynamics in race cars 19
Image 16. ISIS XIII meshed model.
3.2.2. Wind tunnel
To carry out the simulations will be implemented a virtual wind tunnel sufficiently large to provide a result in which the existence of walls don’t have influence with the flow.
Different authors do not agree with each other about the dimension of the virtual wind tunnel. It is possible to find diverse bibliography or articles with different criteria to select the appropriate dimension of the tunnel. However, everyone agrees that the tunnel should be sufficiently big.
In the CFD analysis the dimensions of the wind tunnel are crucial for the simulation, the memory consumption and the processor usage will depend of it, due to a larger mesh size. As a consequence of that, the calculation times will be increased.
Thereby for this study has been chosen a wind tunnel as big as possible according with the computing limitations and the time available. The idea of perform the simulation using a symmetry plane has been dismissed because the car is not symmetrical respect the longitudinal axis and could provide wrong results. The wind tunnel has the following dimensions:

Aerodynamics in race cars 20
Image 17. Wind tunnel dimensions
3.2.3. CFD Model
In order to carry out a simulation as faithful to the real conditions as possible has been implemented a model taking into account the averaged speeds that normally encountered in the formula student competitions. As a consequence has been chosen a calculation turbulence model according with the conditions on the track and the geometry of the car.
In this way the following model has been used:
• Velocity (m/s): 17 / 25
• Temperature (K): 300
• Ground velocity (m/s): 0 / 17 / 25
• Top and side walls: Stationary (Symmetry plane)
• Rotation wheels (rps): 0 / 11,04 / 16,23
• Car body: Stationary wall
• Three dimension model
• Flow type: Incompressible gas (constant density)
• Turbulent flow
• Turbulence model: K-Epsilon (Realizable K-Epsilon two layer)
• Air density: 1,18415 kg/m3
• Dynamic viscosity: 1,855x10-5 Pa·s
• Turbulence intensity: 0,01
• Turbulence viscosity ratio: 10
Aerodynamics in race cars 21
3.3. Lap Time Simulator
The goal of the lap time simulator is to know how the aerodynamics (and other factors) affects to the time per lap in a given circuit. It aims to create a model that allows having sufficient accuracy in the calculation of the time. In this case the time simulator has been used as a tool to get the data required to know the performance of the car on track, nevertheless will be make a short summary about the working mode of the simulator and the equation used for it.
The different factors taken into consideration for the simulation are as follows:
• Mass of the vehicle
• Tires coefficients (lateral and longitudinal friction coefficients and rolling resistance)
• Track
• Drag, lift coefficient and centre of pressure
• Gears ratios and drive train efficiency
• Power and torque and thermal efficiency
A number of assumptions have been made that can affect to the final result, to a greater or lesser result:
• Constant friction coefficient of the tyres.
• The driver is capable to obtain de maximum performance of the car (brakes, tyres…)
during whole lap.
• The circuit is completely flat.
• Circuit finite discretization.
• The straights are treated like corners with “infinite” radius.
• The weight transfer is not taken into account
The following is a brief overview of some of the equations used in lap time simulator. In this simple example, downforce is neglected.
Aerodynamics in race cars 22
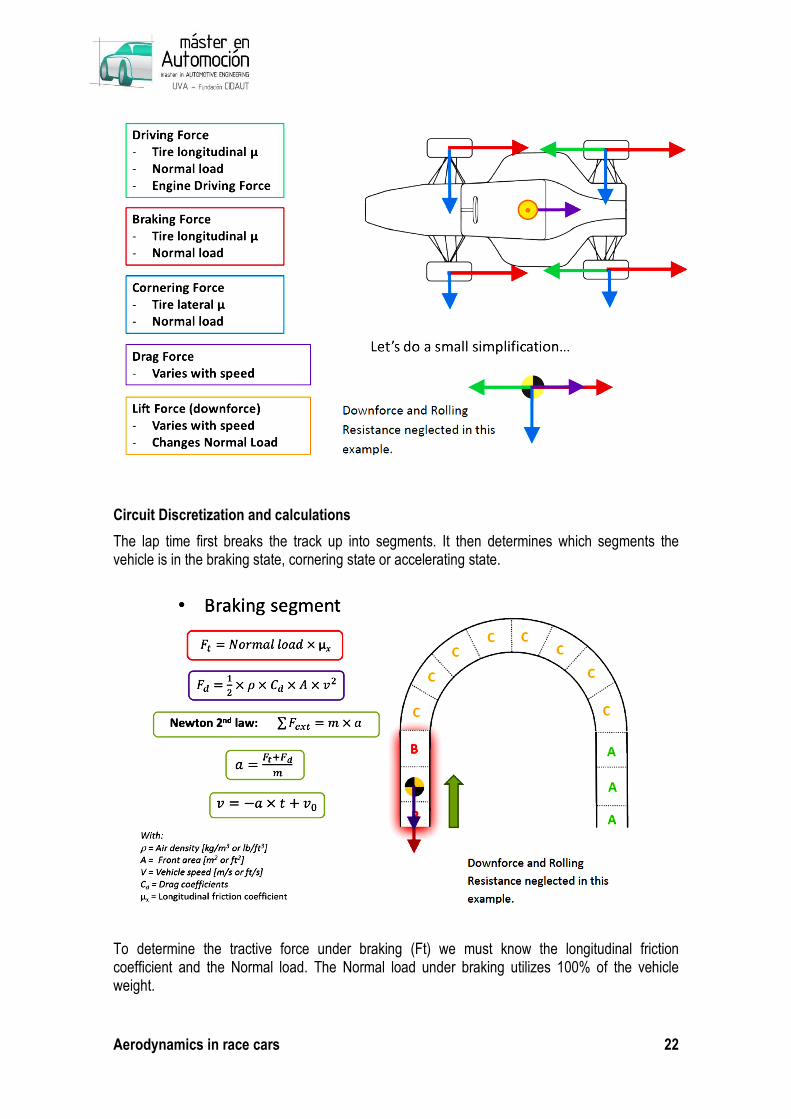
Circuit Discretization and calculations
The lap time first breaks the track up into segments. It then determines which segments the vehicle is in the braking state, cornering state or accelerating state.
To determine the tractive force under braking (Ft) we must know the longitudinal friction coefficient and the Normal load. The Normal load under braking utilizes 100% of the vehicle weight.

Aerodynamics in race cars 23
The drag force will also be helping to slow the vehicle down. To know this value we need to know the density of the air, the drag coefficient of the vehicle, its frontal area and the speed at which the vehicle is traveling.
Then from Newton’s 2nd Law we can determine the available deceleration the vehicle can attain. The equation for the velocity at the end of the first segment becomes the following when everything is substituted together:
� � ���� � �� � � ��
To know the lateral force that the vehicle can apply to the ground we need to know the lateral coefficient of friction (µy) and the normal load, which similarly to the tractive force under braking, the Normal load will take into account the entire weight of the vehicle.
When calculating the acceleration in a corner we have to remember the equation for centrifugal force:
� ���
Then when we apply Newton’s 2nd Law and combines it with the equation for the centrifugal force we obtain:
� ��� � �� → � � ��� ∙ �

Aerodynamics in race cars 24
To determine the tractive force under acceleration (Fs) we must know the longitudinal friction coefficient and the Normal load. The Normal load will depend on the driven type of the vehicle, if it is 2WD then it is assumed to be 50% of the weight of the vehicle and for AWD it is assumed to be 100% of the weight of the vehicle.
The drag force will also be working against the forward acceleration of the vehicle. To know this value we need to know the density of the air, the drag coefficient of the vehicle, its frontal area and the speed at which the vehicle is traveling.
Then from Newton’s 2nd Law we can determine the available acceleration the vehicle can attain. The equation for the velocity at the end of the first segment becomes the following when everything is substituted together:
� � ��� � �� � � ��
To make this a quasi-steady state solver, the vehicle is allowed to accelerate in a corner until it reaches its maximum allowed corner speed. Similarly the vehicle is allowed to decelerate in a corner as well.
The accurate that the software provides (OptimumLap) according to data provided by the software developer can be estimated around 10% of the real time, which is an acceptable precision for this purpose. In the following graph the data acquired with a data logger directly from the car, and de data estimated with the lap time simulator can be compared.

Aerodynamics in race cars 25
Graph 4. Comparison between data acquired on track and simulated with the lap time simulator
3.4. Improvement of the model.
The study begins with the generation of a suitable CAD geometry for a CFD analysis. In this case has been used a geometry using surfaces. This model comes from the existing model of Oxford Brookes Racing car called ISIS13. The goal is to achieve the aerodynamic performance as well as the final performance of the car.
In the first place a study about how the baseline of the car works is carried out. Various parameters are studied in order to know how the airflow affects to the car. The drag and downforce are quantified and also, and very important, is the study of the stream lines around the car.
Considering the initial behaviour of the car, and how the air streams flow around the bodywork, different geometries of the diffuser are developed, to carry out the appropriate survey. These geometries are taken as a first approximation of the solution of the problem. According with the results obtained one of these geometries will be chosen to develop it with more level of detail and improve his behaviour.
Once reached this point is going to carry out a study about how affect to the diffuser performance some boundary conditions. In this way the influence of the diffuser angle, the track height, the diffuser length and also the interaction between the diffuser and the rear wing will be studied

Aerodynamics in race cars 26
First modification
Second modification
… Modification n
Chosen design
Wings interaction Diffuser length Difuser angle Track heigh
Final solution
Improvements
Starting design

Aerodynamics in race cars 27
4. RESULTS AND COMMENTS
In this chapter the results obtained in each simulation are going to be presented. The results will be analysed and commented in order to give to the reader a general overview about how each design is working and why is working in that way.
4.1. Study of the initial concept
The project starts with the study of a formula student race car that the students of Oxford Brookes University have been developing for some time. This initial concept lacks any type of aerodynamic attachment, and it will be the baseline for the following study.
In first time to know the aerodynamic behavior of the initial concept is necessary. In this way an analysis to determine the initial parameters that are needed in order to know how the car works and the influence between the car and airflow is carried out. The different data obtained will be valid to compare the results achieved in the different simulations that are going to be studied, and check the influence that each modification have on the overall behavior.
A CFD simulation has been carried out to identify different parameters that are normally used in the automotive industry when an aerodynamic analysis is required such as pressure distribution, drag and lift forces, coefficient of pressure under the car, etc.
In first instance to know the typical velocities that these kinds of cars have when they are competing is necessary. A preliminary study has been carried out to determine these velocities. Considering the experience of the previous competitions and test on circuit, it has been established a velocity range for the simulations between 17m/s and 25m/s, that can be considered as the average speed and the maximum speed in a standard Formula Student circuit.
Once obtained the data about the work conditions of the car respect the speed to run a first simulation to get the first data of the initial model is possible.
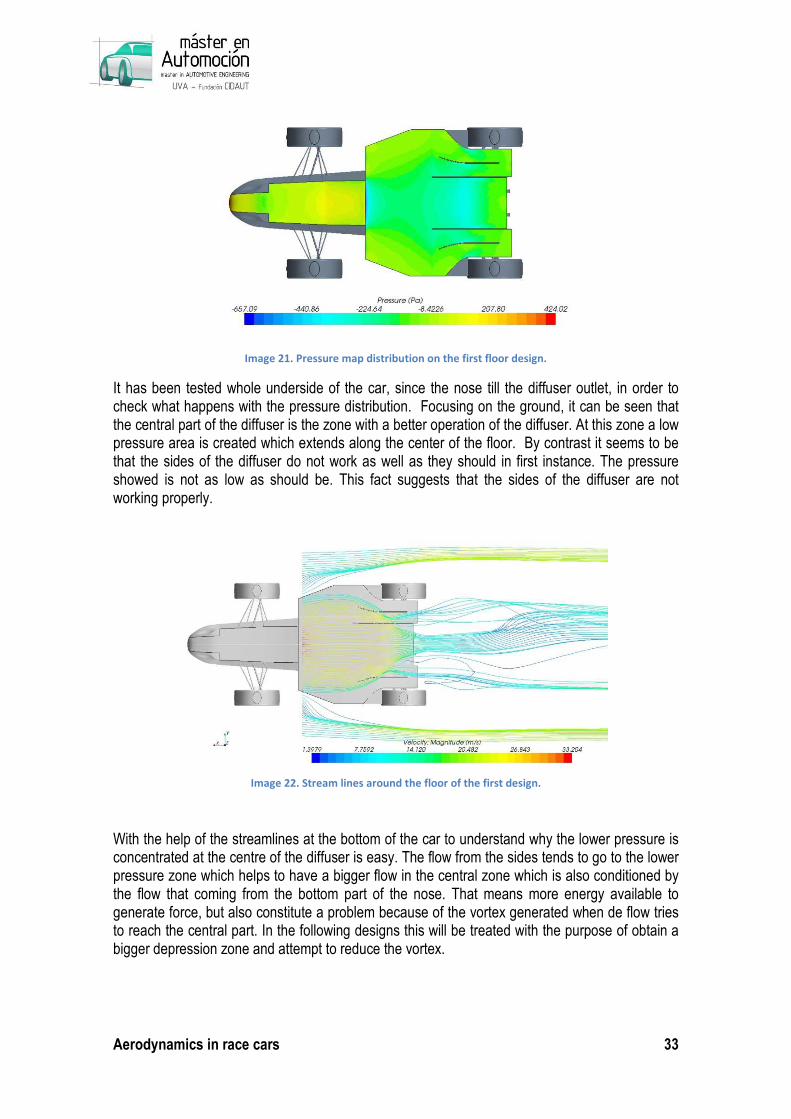
Pressure Maps distribution
The aerodynamic forces are direct consequence of the pressure distribution on the car surface. A good knowledge about this could help us to modify certain parts of the bodywork that the pressure distribution shows that are not working properly. In this way different parts of the car will have more importance than others. The tyres, wings and diffuser are normally the main elements to take into account at the time of improve the overall performance.
In the following representation the pressure distribution on the surface of the initial concept can be seen, and it is possible to have an idea about how each part is working.

Aerodynamics in race cars 28
Image 18. Pressure distribution on the initial concept.
In the previous image [image 20], taken at 17m/s, the influence that the different parts of the car have in the total aerodynamic forces, can be checked. It can be seen that the tyres are one of the principal parts of the car that have a high contribution in the drag force because have a big frontal area influenced by a high pressure at the front and a low pressure at the back. That is a well-known problem of the open wheeled race cars that is always attempt to reduce.
In other part, the driver is other of the greatest problem in this kind of cars because he is so exposed to the flow, which results in a high pressure at his front. This, combined with a relatively high frontal area is going to produce a big amount of drag force
The contribution to the total drag of the tyres has been calculated to give an idea with a solid base about how much the tyres affect to the aerodynamics. It has been determined a contribution of 32N that represent about 36% of the total drag force at 17m/s which is increased up to 73N at 25 m/s. This is a representative figure of the most cars of this type, in which the drag force created by the wheels is around 1/3 of the total drag.
Making a compilation about the different forces onto the car, the drag and lift forces are obtained. In the following table these values are represented for the different velocities studied.
Speed (m/s) Drag (N) Downforce (N)
17 88,8 -1,14
25 191 -12,5 Table 4. Aerodynamic forces obtained for the initial concept.
These forces are actuating at the center of pressure of the car, which is located for this model on the following point. (The origin is located between the nose of the car and the body. See the previous chapter.
CoPx (m) -1,28
CoPy (m) -0,032
CoPz (m) 0,304 Table 5. Position of the center of pressure for the initial concept

Aerodynamics in race cars 29
For the purpose of determine the Cd and Cl parameters it is necessary to know the frontal area of the car. Using the CAD tools available has been estimated a frontal area of 0,59m2 (without wings).
In this moment is possible to determine the Cl and Cd coefficients:
� � 12��� · � · ��
�� � 2����� · � � 2 · 88,81,18 · 17� · 0,59 � 0.88
�# � 2�#��� · � � 2 · (�1,14)1,18 · 17� · 0,59 � �0.011
In order to know how the floor of the car works, a pressure coefficient distribution is going to be used. This methodology provides no dimensional values that can be easily compared with others and also is easier to interpret that the pressure distribution maps. In the following graph the coefficient of pressure on the initial concept floor is presented.
Graph 5. Pressure distribution under the initial concept without any aerodynamic attachment.
There are two critical zones which could create a high decrease of the pressure under the car. The first one is situated about 0.9 meters of the origin, at the junction of the nose with the floor. In this place, the air stream that flows under the nose is accelerated when it reaches the lower part and passes through the car and the ground. The other point is the zone where the diffuser starts, at this zone the flow is accelerated as has been explained in the previous chapter. A high amount of downforce could be created if would be possible to obtain a pressure profile as lower as possible between these two points.
-1.2
-1
-0.8
-0.6
-0.4
-0.2
0
0.2
0.4
0.6
0 0.5 1 1.5 2
Co
eff
icie
nt
of
Pre
ssu
re
Floor length (m)
Pressure Coefficient distribution

Aerodynamics in race cars 30
Image 19. Pressure map distribution under the initial concept.
In the image 20, the pressure distribution can be checked in a more visual way. As can be seen, there are two areas represented in a more intense green which correspond to the two negative peaks of the graphic above. In this zone downforce is generating, but in a low level. The aim will consist in create a big area with the lower pressure possible. An optimized diffuser will be essential to achieve this objective.
It is important at the time to create downforce the position of the car and by extension, the position of the undertray. All constructors normally give to their cars a pitch angle to optimize the aerodynamic work. This study has been performed to get an idea about how the position with the pavement could affect to the aerodynamics.
Graph 6. Variation of the drag and downforce for different pitch angles.
-2
-1
0
1
2
3
4
5
6
7
86
87
88
89
90
91
92
93
0 0.5 1 1.5 2
Dra
g (
N)
Pitch angle (Degrees)
Drag and Downforce VS Pitch angle
Drag
Downforce
Do
wn
forc
e(N
)

Aerodynamics in race cars 31
Graph 7. Influence of the pitch angle in the aerodynamic efficiency for the initial concept.
According with the literature reviewed is established that a pitch angle between 1 and 2 degrees would be the optimum pitch to achieve the maximum performance [7, 13, 16]. This affirmation has been tested, and according to the data obtained in the previous graph, it can be determined that the optimum performance is obtained for pitch angles close to 2 degrees when the car lacks of aerodynamics attachments.
A high increase of the global performance is observed in the graph 7. The amount of efficiency obtained in this manner is actually not as high as is showed, because the performance is close to 0 and so is very easy to multiply it. Anyway, an increase of efficiency can be reached but it is not enough for a good behaviour on track, and it should be improved by aerodynamics appendixes.
4.2. Diffuser implementation
There are not written rules about the shape of the diffuser. The literature reviewed doesn’t provide a clear methodology to be followed in order to develop the floor of the car. This problem must be normally solved applying different solutions that should works in first instance and comparing the different designs with each other.
For this study it has proceeded in this way, and different proposals have been analyzed to compare the different behavior of each of them. In the following, these models and their related studies about the aerodynamics will be presented and explained carefully.
For the different proposals has been taken into account the inital geometry of the car, which could not be modified. This limitation in the design takes some importance at the time of create an optimiced shape. The angle of the diffuser, the position of the skirts and the general dimension of the floor have been higly conditioned by the imposibility of modified the chasis.
-0.02
0
0.02
0.04
0.06
0.08
0 0.5 1 1.5 2
Ae
rod
yn
am
ic
eff
icie
ncy
Pitch angle
Aerodynamic efficiency

Aerodynamics in race cars 32
4.2.1. Proposal 1
Image 20. First proposal of diffuser to study.
For the first proposal, the width of the car has been exploited at the maximum. The objective of this design is to obtain the largest possible area at the diffuser with a low pressure, for that, the dimensions of the floor has extended to the wheels’ width that is the maximum allowed by the rules.
At the outlet of the diffuser, three zones are clearly distinguished, two at the sides, in which the diffuser has a bigger outlet angle and other one at the center of the car. The dimensions of the central part of the diffuser are limited by the position of the engine and the gearbox affecting to the angle, and the width of the chassis affecting to the width of this part of the diffuser. Whilst in the side parts is the geometry of the suspension and the transmission which condition the exit angle.
The position of the throat, or the zone where the diffuser starts, has been chosen according with the diffuser angle and the limitation that the suspension arms and the chassis impose. According with that, the diffuser has the following dimensions:
• Width: 960 mm
• Length: 705 mm
• Height: 178 mm
• Area of the floor: 1.48 m2 (approx.)
Once the basic geometric characteristics have been analysed, the aerodynamic properties that this model offers are going to be studied.
In first time the pressure distribution map of the floor is presented.
Aerodynamics in race cars 33
Image 21. Pressure map distribution on the first floor design.
It has been tested whole underside of the car, since the nose till the diffuser outlet, in order to check what happens with the pressure distribution. Focusing on the ground, it can be seen that the central part of the diffuser is the zone with a better operation of the diffuser. At this zone a low pressure area is created which extends along the center of the floor. By contrast it seems to be that the sides of the diffuser do not work as well as they should in first instance. The pressure showed is not as low as should be. This fact suggests that the sides of the diffuser are not working properly.
Image 22. Stream lines around the floor of the first design.
With the help of the streamlines at the bottom of the car to understand why the lower pressure is concentrated at the centre of the diffuser is easy. The flow from the sides tends to go to the lower pressure zone which helps to have a bigger flow in the central zone which is also conditioned by the flow that coming from the bottom part of the nose. That means more energy available to generate force, but also constitute a problem because of the vortex generated when de flow tries to reach the central part. In the following designs this will be treated with the purpose of obtain a bigger depression zone and attempt to reduce the vortex.
Aerodynamics in race cars 34
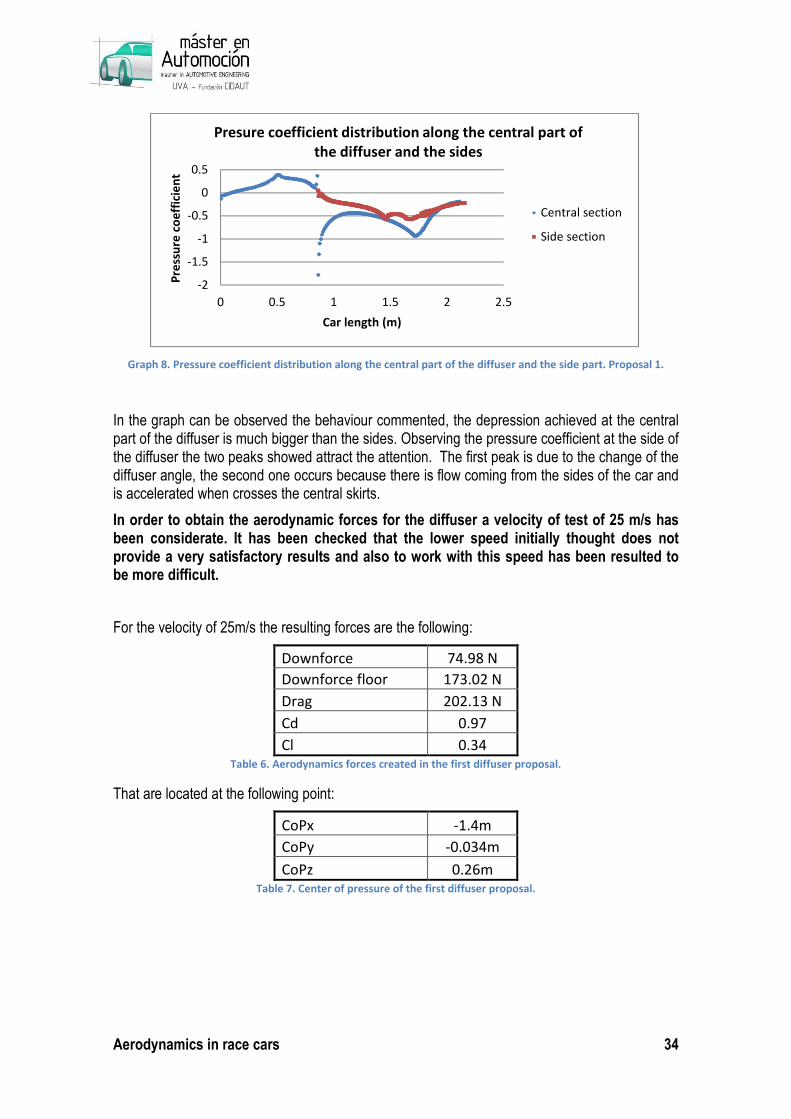
Graph 8. Pressure coefficient distribution along the central part of the diffuser and the side part. Proposal 1.
In the graph can be observed the behaviour commented, the depression achieved at the central part of the diffuser is much bigger than the sides. Observing the pressure coefficient at the side of the diffuser the two peaks showed attract the attention. The first peak is due to the change of the diffuser angle, the second one occurs because there is flow coming from the sides of the car and is accelerated when crosses the central skirts.
In order to obtain the aerodynamic forces for the diffuser a velocity of test of 25 m/s has been considerate. It has been checked that the lower speed initially thought does not provide a very satisfactory results and also to work with this speed has been resulted to be more difficult.
For the velocity of 25m/s the resulting forces are the following:
Downforce 74.98 N
Downforce floor 173.02 N
Drag 202.13 N
Cd 0.97
Cl 0.34 Table 6. Aerodynamics forces created in the first diffuser proposal.
That are located at the following point:
CoPx -1.4m
CoPy -0.034m
CoPz 0.26m Table 7. Center of pressure of the first diffuser proposal.
-2
-1.5
-1
-0.5
0
0.5
0 0.5 1 1.5 2 2.5
Pre
ssu
re c
oe
ffic
ien
t
Car length (m)
Presure coefficient distribution along the central part of
the diffuser and the sides
Central section
Side section

Aerodynamics in race cars 35
4.2.2. Proposal 2
Image 23. Second design proposed for study. Notice the lip at the deflector on the car's floor.
In the first proposal it was observed that the air stream tended to flow toward the central part of the diffuser. It seemed that the performance could be optimized if a bigger area of the floor was used to generate depression. What has been attempted with this model is to canalize the flow under the car to the sides of the diffuser, this solution, in first instance, should provide a bigger aspect ratio between the inlet of the diffuser and the outlet, approximately 13:1, this means that there is more capacity to generate a depression at the throat, and therefore, more downforce.
The general dimensions for this design are the following:
• Width: 614 mm
• Length: 592 mm
• Height: 186 mm
• Area of the floor: 1.23 m2 (approx.)
Image 24. Pressure map distribution on the floor of the second proposal.
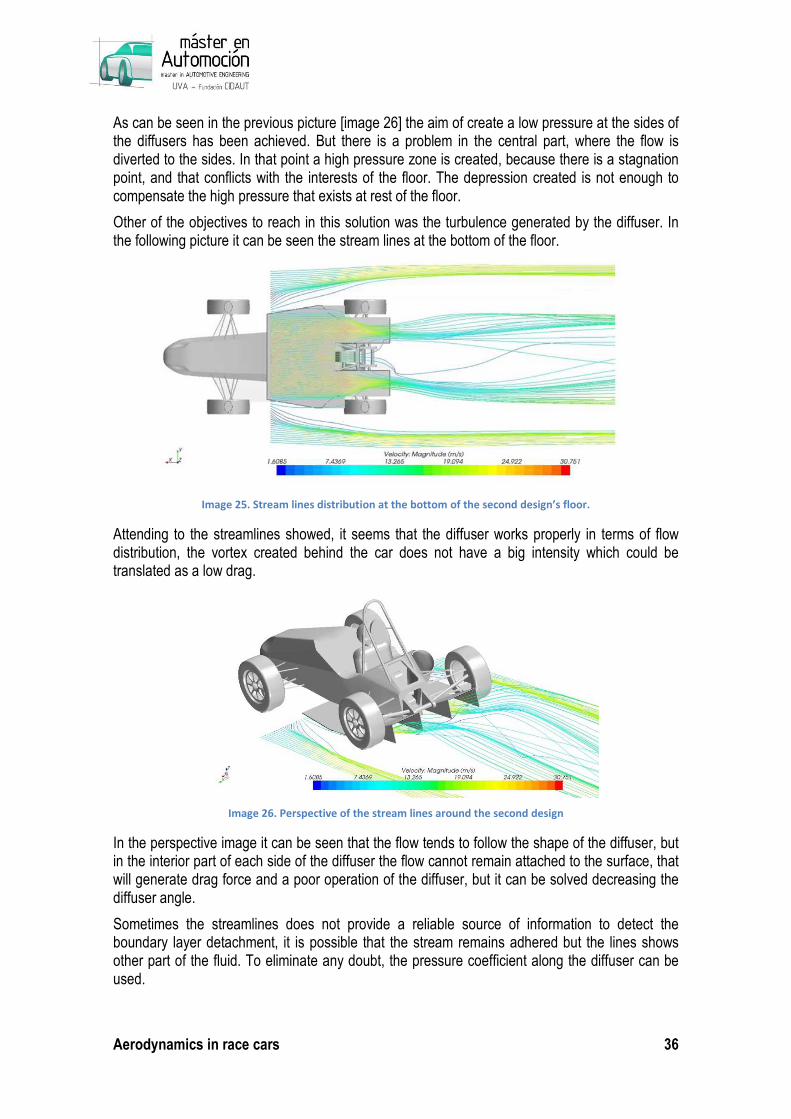
Aerodynamics in race cars 36
As can be seen in the previous picture [image 26] the aim of create a low pressure at the sides of the diffusers has been achieved. But there is a problem in the central part, where the flow is diverted to the sides. In that point a high pressure zone is created, because there is a stagnation point, and that conflicts with the interests of the floor. The depression created is not enough to compensate the high pressure that exists at rest of the floor.
Other of the objectives to reach in this solution was the turbulence generated by the diffuser. In the following picture it can be seen the stream lines at the bottom of the floor.
Image 25. Stream lines distribution at the bottom of the second design’s floor.
Attending to the streamlines showed, it seems that the diffuser works properly in terms of flow distribution, the vortex created behind the car does not have a big intensity which could be translated as a low drag.
Image 26. Perspective of the stream lines around the second design
In the perspective image it can be seen that the flow tends to follow the shape of the diffuser, but in the interior part of each side of the diffuser the flow cannot remain attached to the surface, that will generate drag force and a poor operation of the diffuser, but it can be solved decreasing the diffuser angle.
Sometimes the streamlines does not provide a reliable source of information to detect the boundary layer detachment, it is possible that the stream remains adhered but the lines shows other part of the fluid. To eliminate any doubt, the pressure coefficient along the diffuser can be used.

Aerodynamics in race cars 37
Graph 9. Pressure coefficient distribution on the second design of diffuser
The pressure distribution along the diffuser follows typical distribution, but the sudden change in the slope of the curve is indicative of a boundary layer detachment. Combining it with the previous result provided by the streamlines is determined that there is boundary layer detachment.
In terms of pressure distribution, the data shows a coefficient upcoming to -0.55 which is not a good coefficient that should be under -1.5. In addition to this, a pressure coefficient above 0 is reached before the diffuser throat, and this is totally contrary with the aim of the floor.
In view of these results it does not seem that the downforce and the drag will have good values, and effectively, don’t have.
The forces generated by the second design at 25m/s are the following:
Downforce -20N
Downforce floor 55.76N
Drag 211.56N
Cd 0.97N
Cl -0.091N Table 8. Aerodynamic forces created in the second diffuser proposal.
With the centre of pressure located at:
CoPx (m) -1.43
CoPy (m) -0.056
CoPz (m) 0.29 Table 9. Centre of pressure for the second diffuser proposal.
As can be seen this solution does not provide a good behaviour in terms of downforce and drag force. Perhaps could be improved redesigning the zone where the flow is deflected in order to reduce the high pressure in that zone, but in any case the results will not improve too much.
-0.6
-0.4
-0.2
0
0.2
0 0.5 1 1.5 2 2.5
Co
eff
icie
nt
of
pre
ssu
re
Car length (m)
Pressure coefficient distribution on the second
design of diffuser

Aerodynamics in race cars 38
4.2.3. Proposal 3
Image 27. Third model proposed
It has been observed that the zone with more influence to generate downforce is the central zone of the floor. In order to exploit the central flow this design has been created. The main idea is attempt to diffuse the flow in that zone to a maximum possible and generate the maximum depression at the centre of the car. In this way the sides of the floor have a secondary role at the time of generate downforce but are essential to avoid or minimize the flow entry from the sides.
The aspect ratio between the inlet and the outlet of the diffuser is limited by the engine and the gearbox, as in the other designs. These limitations impede the correct flow expansion because the height of the diffuser cannot be as high as it should. To solve this problem a curved geometry has been chosen. This kind of geometry allows expanding the flow to the sides instead to upward like in the previous ones.
The general dimensions for this design are the following:
• Width: 614 mm
• Length: 655 mm
• Height: 119 mm
• Area of the floor: 1.20 m2 (approx.)
Image 28. Pressure distribution map of the third design

Aerodynamics in race cars 39
The pressure distribution map shows in this case a zone with low pressure at the center of the diffuser which could be higher than the previous designs. This fact will be studied below trough the pressure coefficient distribution that will provide more accurate results. It is also observed that there are two zones, at the sides of the diffuser with a lower pressure that means that it is possible to have some turbulence or unorganized flow in this part created by the lateral skirts. Besides there are two zones at the sides of the central skirts which have a higher pressure than should have and this is other indication that the diffuser could works deficiently.
Image 29. Stream lines distribution at the floor of the third model
Observing the streamlines the first thing that attract the attention is the two swirls created behind the car, which will increase the depression in that zone and will contribute negatively to the drag force. It can be seen that there is a cross flow on the diffuser. In principle the diffuser works properly “filling” the low pressure zone behind the wheels. The flow keeps attached to the lateral skirts and it is introduced correctly behind the wheels. However the air stream that flows at the sides of the floor tend to go to the lower pressure zone located at the center of the diffuser, one there, the flow find other zone with lower energy, and tends to go to there, this is behind the wheels, thereby the swirls behind the car are created.
Image 30. Pressure coefficient distribution along the diffuser of the third design
-1.4
-1.2
-1
-0.8
-0.6
-0.4
-0.2
0
0 0.5 1 1.5 2 2.5
Pre
ssu
re c
oe
ffic
ien
t
Car length (m)
Pressure coefficient distribution along the
diffuser of the third design

Aerodynamics in race cars 40
The coefficient of pressure shows an important decline of the pressure at the throat, the distribution is continuous and stable, and follows the typical shape of a pressure distribution on a diffuser. The boundary layer detachment and others adverse effects are not detected in the main section. Therefore this design should be taken into account for a possible optimization.
The pressure drop is more pronounced that were in the previous designs which could be good, but a high overall pressure distribution before the diffuser throat is detected, and that could contribute to have a less downforce than is expected.
The simulation at 25m/s throws the following data:
Downforce 21.97 N
Downforce floor 102.88 N
Drag 207 N
Cd 0.95
Cl 0.1 Table 10 Aerodynamic forces created in the third diffuser proposal.
As might be expected the downforce generated in this design is not as good as it should. The low pressure drop on the floor impedes the generation of downforce in that zone and secondly the turbulence created behind the car contributes to increase the drag. Perhaps it is possible to improve the performance of this design, but it would be difficult to reach the performance of the first model studied.
4.3. Study and characterization of the chosen proposal
Once the different proposal have been studied, the best of all, which has proved to be the first one, is going to be studied under different conditions to establish the correct operation of the diffuser, and also, to have an idea about how the different parameters affect to the downforce generation in the floor.
The interaction with the front and rear wing, the effect of the rotating wheels and moving floor and geometric characteristics as the diffuser angle and length are going to be studied in this chapter..
The final aim will be to find the best configuration of the diffuser for this car and also give a general overview about the physics that govern the diffuser operation.
4.3.1. Interaction with the wings
Taking into account the results provided by the different simulations, it seems to be that the performance of the diffuser is not as high as it should. The downforce generated by this system is not enough for the requirements of the competition. For this reason it is considered necessary the additions of wings to the car.
The wings constitute an essential part of the aerodynamics of a car, and they are the responsible for generating around the 75% of the total downforce. For this model various designs of rear and front wings has been developed and are going to be presented here.

Aerodynamics in race cars 41
It is considerate that the rear wings, specially the beam wing, are indispensable elements for the performances of the diffuser. Below is going to do a study about how the wings affect to the diffuser performance and its own interaction with the global aerodynamics.
The different models studied are presented below. In the annex it is possible to find a more extensive and detailed presentation about the different designs.
Influence of the rear wings
Image 31. Images sequence that show the changes that the rear wing and beam wing has suffered in each stage
of the design
The different designs have been implemented in order to find the best configuration of the rear wing possible. In a first time was considered a rear wing with two planes mounted on the endplates which are supported by the beam wing. This configuration is typical of most of the competitions of single seat cars. The results thrown by the simulations were not too good, for that, this solution was discarded. A design with the rear wing separated from the beam wing provided better results in terms of downforce and drag.
In the table below is shown the different configuration of the wings for each model:
Design Profile chord Attack
angle
Profile
Flap
Chord
flap
Attack
Angle flap
Gap X Gap Z
1 Selig 1223 200mm 20 Gm15sm 70mm 48 2% Chord 1.5% chord
2 Selig 1223 200mm 22-29 Gm15sm 70mm 50 2% Chord 1.5% chord
3 Selig 1223 200mm 22-32 Gm15sm 70mm 50 2% Chord 1.5% chord
4 Selig 1223 200mm 22 Selig 1223 70mm 50 2% Chord 1.5% chord
5 Selig 1223 400mm 5 Fx74mod 150mm 33 1.5% chord 1.5% chord
Table 11. Summary of the different airfoils used for the rear wings
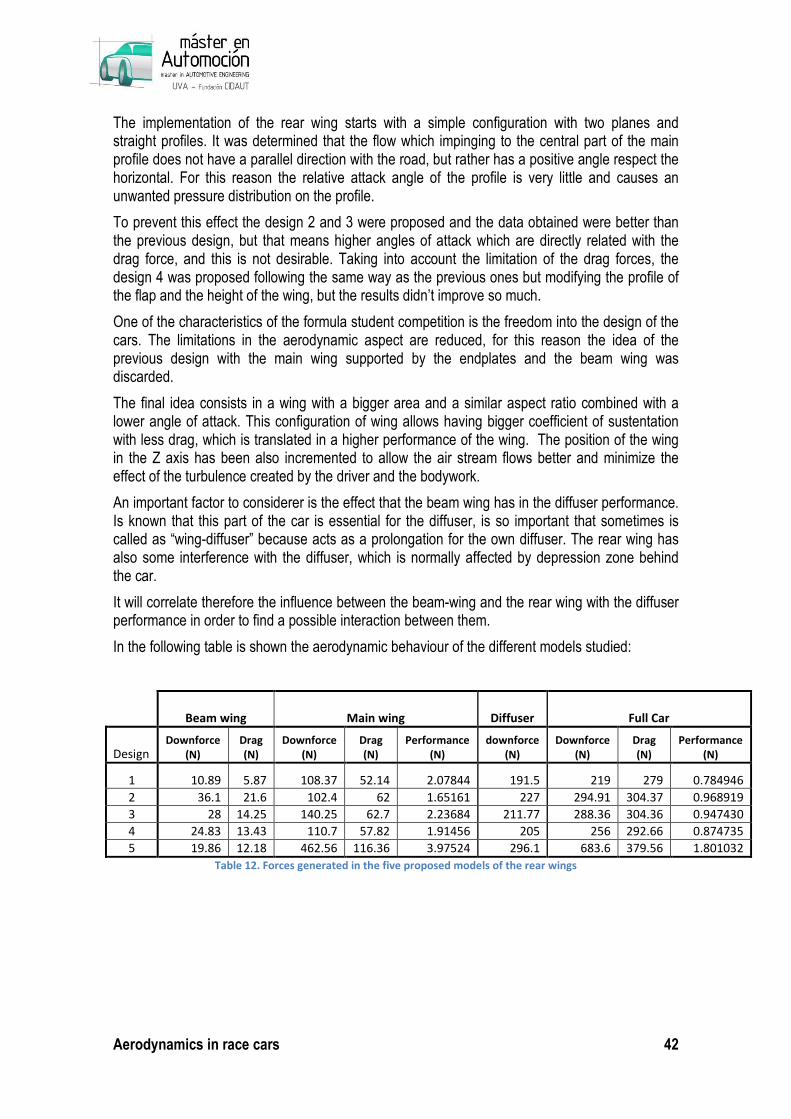
Aerodynamics in race cars 42
The implementation of the rear wing starts with a simple configuration with two planes and straight profiles. It was determined that the flow which impinging to the central part of the main profile does not have a parallel direction with the road, but rather has a positive angle respect the horizontal. For this reason the relative attack angle of the profile is very little and causes an unwanted pressure distribution on the profile.
To prevent this effect the design 2 and 3 were proposed and the data obtained were better than the previous design, but that means higher angles of attack which are directly related with the drag force, and this is not desirable. Taking into account the limitation of the drag forces, the design 4 was proposed following the same way as the previous ones but modifying the profile of the flap and the height of the wing, but the results didn’t improve so much.
One of the characteristics of the formula student competition is the freedom into the design of the cars. The limitations in the aerodynamic aspect are reduced, for this reason the idea of the previous design with the main wing supported by the endplates and the beam wing was discarded.
The final idea consists in a wing with a bigger area and a similar aspect ratio combined with a lower angle of attack. This configuration of wing allows having bigger coefficient of sustentation with less drag, which is translated in a higher performance of the wing. The position of the wing in the Z axis has been also incremented to allow the air stream flows better and minimize the effect of the turbulence created by the driver and the bodywork.
An important factor to considerer is the effect that the beam wing has in the diffuser performance. Is known that this part of the car is essential for the diffuser, is so important that sometimes is called as “wing-diffuser” because acts as a prolongation for the own diffuser. The rear wing has also some interference with the diffuser, which is normally affected by depression zone behind the car.
It will correlate therefore the influence between the beam-wing and the rear wing with the diffuser performance in order to find a possible interaction between them.
In the following table is shown the aerodynamic behaviour of the different models studied:
Beam wing Main wing Diffuser Full Car
Design Downforce
(N)
Drag
(N)
Downforce
(N)
Drag
(N)
Performance
(N)
downforce
(N)
Downforce
(N)
Drag
(N)
Performance
(N)
1 10.89 5.87 108.37 52.14 2.07844 191.5 219 279 0.784946
2 36.1 21.6 102.4 62 1.65161 227 294.91 304.37 0.968919
3 28 14.25 140.25 62.7 2.23684 211.77 288.36 304.36 0.947430
4 24.83 13.43 110.7 57.82 1.91456 205 256 292.66 0.874735
5 19.86 12.18 462.56 116.36 3.97524 296.1 683.6 379.56 1.801032
Table 12. Forces generated in the five proposed models of the rear wings
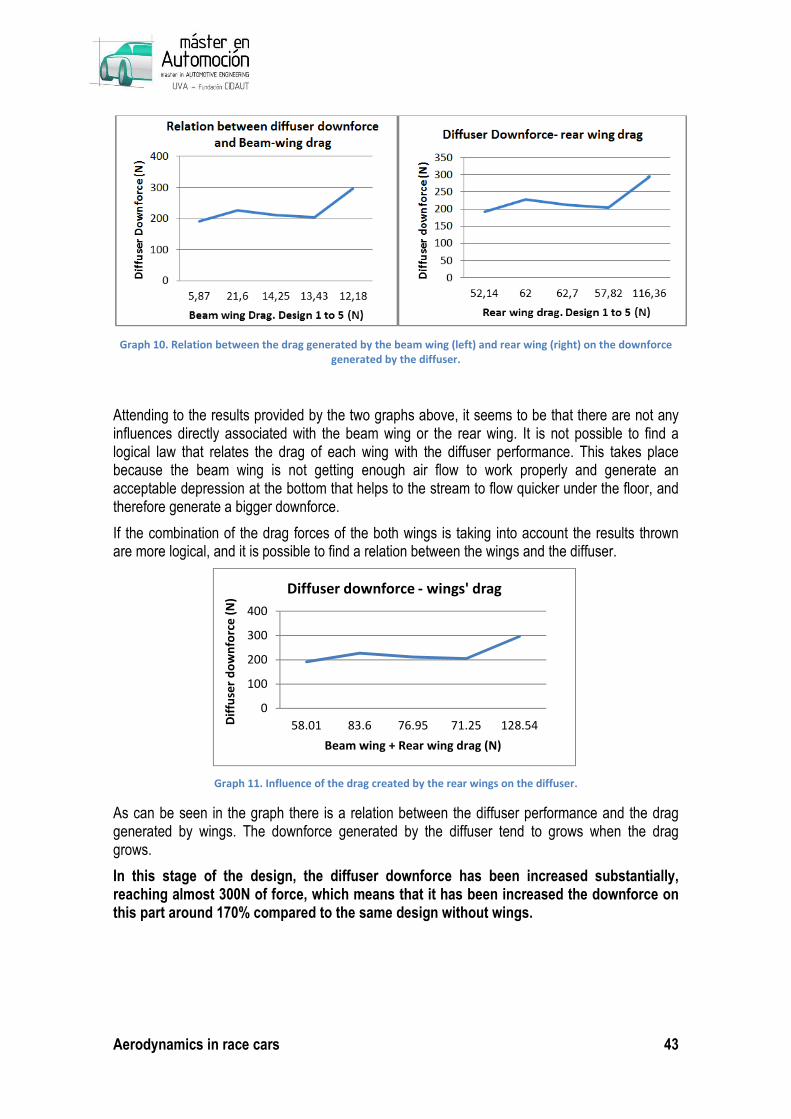
Aerodynamics in race cars 43
Graph 10. Relation between the drag generated by the beam wing (left) and rear wing (right) on the downforce
generated by the diffuser.
Attending to the results provided by the two graphs above, it seems to be that there are not any influences directly associated with the beam wing or the rear wing. It is not possible to find a logical law that relates the drag of each wing with the diffuser performance. This takes place because the beam wing is not getting enough air flow to work properly and generate an acceptable depression at the bottom that helps to the stream to flow quicker under the floor, and therefore generate a bigger downforce.
If the combination of the drag forces of the both wings is taking into account the results thrown are more logical, and it is possible to find a relation between the wings and the diffuser.
Graph 11. Influence of the drag created by the rear wings on the diffuser.
As can be seen in the graph there is a relation between the diffuser performance and the drag generated by wings. The downforce generated by the diffuser tend to grows when the drag grows.
In this stage of the design, the diffuser downforce has been increased substantially, reaching almost 300N of force, which means that it has been increased the downforce on this part around 170% compared to the same design without wings.
0
100
200
300
400
58.01 83.6 76.95 71.25 128.54Dif
fuse
r d
ow
nfo
rce
(N
)
Beam wing + Rear wing drag (N)
Diffuser downforce - wings' drag

Aerodynamics in race cars 44
Graph 12. Influence of the rear wings on the diffuser pressure distribution.
Influence of the front wing
Once the rear wing has been incorporated, including a front wing is an essential question in order to achieve the aerodynamic balance of the car. For this design a front wing with high aerodynamic load and specific airfoils for low speed applications has been chosen.
Image 32. Car with the final wings design implemented. Notice that a third profile on the rear wing has been
incorporated in order to have a good aerodynamic balance.
For the main plane a Selig 1223 airfoil has been chosen, the same that the rear wing. According with the bibliography consulted [15, 21, 22] this profile have a good behaviour in the conditions that is going to be used.
-1.6
-1.4
-1.2
-1
-0.8
-0.6
-0.4
-0.2
0
0 0.5 1 1.5 2 2.5
Pre
ssu
re c
oe
ffic
ien
t
Car length (m)
influence of the rear wing in the pressure distribution
Wing design
Design without wing

Aerodynamics in race cars 45
Image 33. Detail of the Selig 1223 airfoil.
A variable attack angle has been chosen for the lower profile to allow the flow at the centre of the car to reach the floor with the maximum energy possible. For this propose the attack angle at the centre of the wing is -3 degrees whilst the sides have 5 degrees. The chord of the main plain remains constant respect the rear wing having 400mm of chord.
For the secondary planes a MH78 profile has been chosen (MH 78 14.47%). It has been modified thinning the thickness up to 70% and given a 300mm of radius to the chord in order to allow a better accommodation behind the main plane.
Image 34. Detail of the MH78 airfoil used for the flaps.
This profile has been chosen because it has the maximum thickness in an ideal situation for use as a secondary plane, because has his lower pressure area just where the previous profile directs the flow, and it is possible to achieve more performance in the wing.
Image 35. Airfoils layout in the front wing.
The gap used between main profile and the following is among 7% in X and 5% in Z of chord of the main profile, and the gap between the other two is 10% in X and 8.5% in Z of the chord of the

Aerodynamics in race cars 46
secondary profile, which has 150 mm of length. The attack angle of the flaps is 32 and 45 degrees respectively.
Other profile has been incorporated to the rear wind in order to increase his downforce to similar values of the front wing. It has been used the FX74 mod profile, which was used for the previous flap.
The results provided by this configuration are the following:
As can be seen in the results obtained, the addition of a front wing contributes greatly to the downforce generation with a low penalization in the drag. Evidence of this is the aerodynamic efficiency of the front wing which is above 5.
In addition to this, the drag force caused by the wheels is also decreased, in this case up to 55.57 N. This value, compared with the drag generated without front wing is about 25% lower, which was 73N.
In other part the third added plane to the rear wing also increase his downforce substantially, since 425.8N to 696.27N which means a 63% of the downforce increase, but in this case the wing efficiency is decreased.
The effect that the wings have in the diffuser performance is worthy of mention as well. If the results between the different model are compared it is possible to see how the front wing affect to diffuser work. In this way the diffuser had a downforce production around 296N which is decreased up to 287.7N with the addition of the front wing. This is a decrease of the downforce generation around 3% that can be considered as a small interaction, and gives an idea about the design optimization.
Downforce
beam wing
(N)
Drag
beam
wing (N)
Downforce
Rear wing
(N)
Drag
rear wing
(N)
Downforce
front wing
(N)
Drag
front
wing (N)
Downforce
Diffuser
(N)
Downforce
Car
(N)
Drag
Car
(N)
2 Planes wing 11.49 9.85 425.88 112.84 695.23 129.69 287.64 1344.64 304.37
3 Planes wing 14.78 11.093 696.27 246.67 710.62 136.5 346.57 1687.54 470.27
Table 13. Forces generated by the two planes rear wing and 3 planes.
A. Efficiency Beam wing Rear wing Front wing Car
2 Planes wing 1.16 3.77 5.36 4.42
3 Planes wing 1.33 2.82 5.21 3.59
Table 14. Aerodynamic efficiency of the car and each wing for the two rear wing proposals.

Aerodynamics in race cars 47
Image 36. Channel under the nose to allow the flow to reach the floor with high energy.
In order to maximize the performance of the floor it has been attached skirts along the front part of the body, from the nose to the floor entry. These skirts, together with the wing opening, allow the flow to reach the bottom of the diffuser with a higher energy possible to create a good work.
According with the interaction of the three planes rear wing, once more, the drag generated by this wing has an important contribution to the diffuser, reaching in this case 346.57N which is the greater value achieved between the different models, and this represents an increase of 20% respect of the 2 planes rear wing.
In the pressure distribution it is observed a similar profile in both case, but a lower general pressure in the case of 3 planes wing.
Graph 13. Comparative of the pressure coefficient distribution at the central part of the diffuser with different
rear wings configuration and no wings design.
4.3.2. Influence of the moving floor and the rotating wheels in the simulation
It is known that the rotation wheels and the moving floor have a significant influence in the aerodynamic forces when a simulation of this type is carried out. The aim of this point is to quantify how much influence the kinematics conditions have in the aerodynamics forces. For that, the last design has been chosen and simulated under different conditions, this is, simulating under static and kinematics conditions.
-1.5
-1
-0.5
0
0.5 1 1.5 2 2.5
Pre
ssu
re c
oe
fici
en
t
Car length (m)
Pressure coefficient with diferent configurtation of the
rear wing
2 Planes wing
3 Planes wing
Initial design
No wing desing
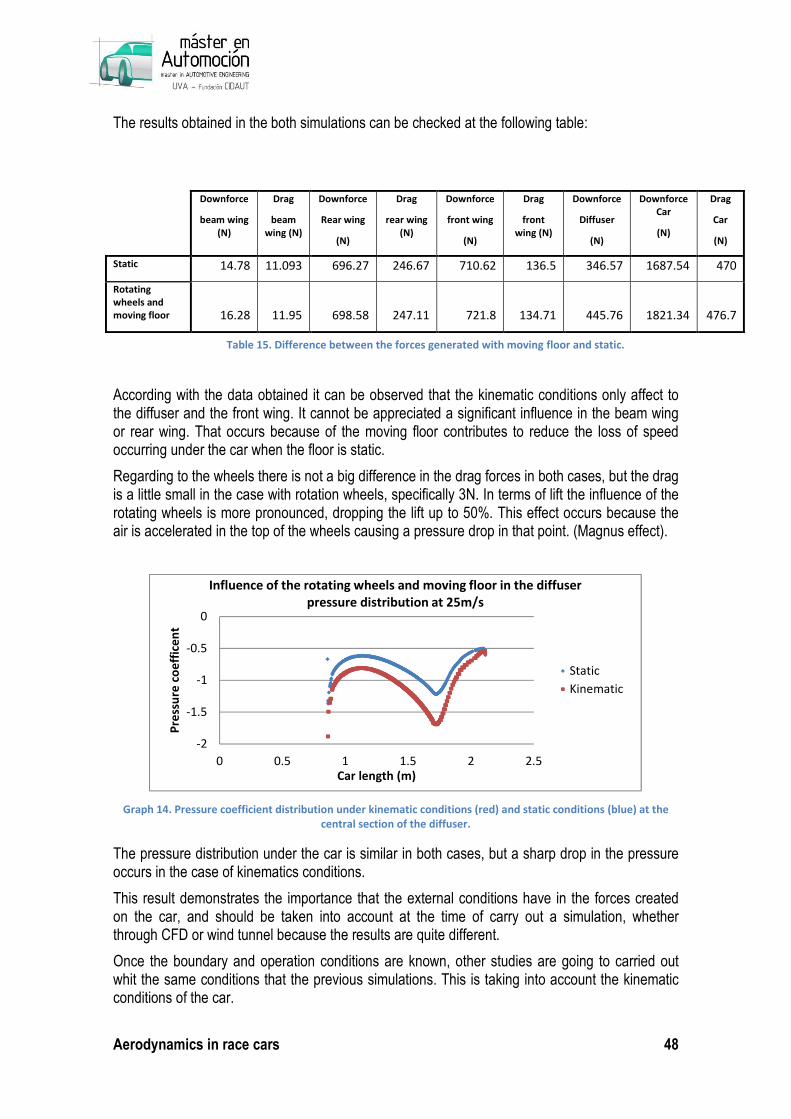
Aerodynamics in race cars 48
The results obtained in the both simulations can be checked at the following table:
According with the data obtained it can be observed that the kinematic conditions only affect to the diffuser and the front wing. It cannot be appreciated a significant influence in the beam wing or rear wing. That occurs because of the moving floor contributes to reduce the loss of speed occurring under the car when the floor is static.
Regarding to the wheels there is not a big difference in the drag forces in both cases, but the drag is a little small in the case with rotation wheels, specifically 3N. In terms of lift the influence of the rotating wheels is more pronounced, dropping the lift up to 50%. This effect occurs because the air is accelerated in the top of the wheels causing a pressure drop in that point. (Magnus effect).
Graph 14. Pressure coefficient distribution under kinematic conditions (red) and static conditions (blue) at the
central section of the diffuser.
The pressure distribution under the car is similar in both cases, but a sharp drop in the pressure occurs in the case of kinematics conditions.
This result demonstrates the importance that the external conditions have in the forces created on the car, and should be taken into account at the time of carry out a simulation, whether through CFD or wind tunnel because the results are quite different.
Once the boundary and operation conditions are known, other studies are going to carried out whit the same conditions that the previous simulations. This is taking into account the kinematic conditions of the car.
-2
-1.5
-1
-0.5
0
0 0.5 1 1.5 2 2.5
Pre
ssu
re c
oe
ffic
en
t
Car length (m)
Influence of the rotating wheels and moving floor in the diffuser
pressure distribution at 25m/s
Static
Kinematic
Downforce
beam wing
(N)
Drag
beam
wing (N)
Downforce
Rear wing
(N)
Drag
rear wing
(N)
Downforce
front wing
(N)
Drag
front
wing (N)
Downforce
Diffuser
(N)
Downforce
Car
(N)
Drag
Car
(N)
Static 14.78 11.093 696.27 246.67 710.62 136.5 346.57 1687.54 470
Rotating
wheels and
moving floor
16.28
11.95
698.58
247.11
721.8
134.71
445.76
1821.34
476.7
Table 15. Difference between the forces generated with moving floor and static.

Aerodynamics in race cars 49
4.3.3. Influence of the rear wing height on the diffuser performance
It has been demonstrated previously that exists an influence between the diffuser downforce and the drag generated by the rear wing for a determined position. The aim now is to verify the influence of the rear wing height respect the diffuser in order to see if there is an appreciable influence between two.
The analysis has been carried out for 5 different positions, from 300mm to 700mm (Z Axis) measured between the exit of the diffuser and the attack border of the rear wing, using same configuration of the rear wing. The data provided by the simulations are following:
According to the data obtained, it is observed that there is indeed an influence on the operation of the rear wing when the height changes.
Graph 15. Influence of the rear wing vertical position in his downforce.
In the graph above [graph 15] it is observed that the downforce and the drag force increases with the wing height. This is because of the air flow impinging against the wing have a greater speed and is not as influenced by the car as the airstream that flows below, that it has been modified by the car shape. It is common to say in these cases that the air stream is cleaner, in the way that it is not influenced by anything. For that, it is possible to generate a bigger amount of downforce, but the drag is also increased.
In regard to the diffuser, the effect is so marked as in the case of the wing, but with the opposite effect.
0
200
400
600
800
1000
300 400 500 600 700
Re
ar
win
g d
ow
nfo
rce
(N
)
Rear wing height (mm)
Influence of the rear wing position in his downforce
Downforce Rear
wing
Drag rear wing
RW
Position
Downforce
beam wing (N)
Drag beam
wing (N)
Downforce
Rear wing (N)
Drag rear
wing (N)
Downforce
front wing (N)
Drag front
wing (N)
downforce
diffuser (N)
Downforce
(N)
Drag
(N)
300 24.14 15.11 394.19 178.73 670.58 111.43 446.92 1545 527.88
400 20.76 14.23 608.48 227.63 680.02 112.93 461.95 1770 599.47
500 16.28 11.95 698.58 247.11 721.8 134.71 445.76 1821.34 576.7
600 12.32 10.23 723.63 259.72 708.17 110.86 440.13 1860.56 586.64
700 10.1 8.91 802.35 270.91 687.22 113.94 392.1 1875.71 625.81
Table 16. Influence of the variation of the rear wing height in the forces generated
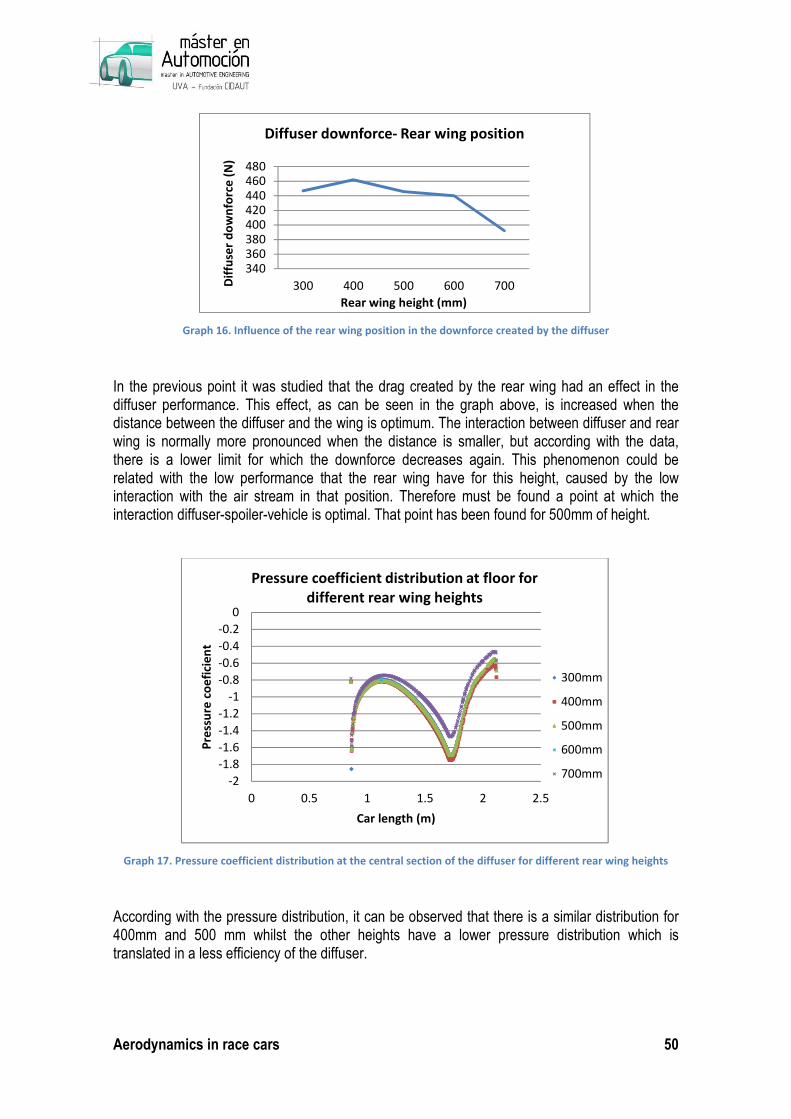
Aerodynamics in race cars 50
Graph 16. Influence of the rear wing position in the downforce created by the diffuser
In the previous point it was studied that the drag created by the rear wing had an effect in the diffuser performance. This effect, as can be seen in the graph above, is increased when the distance between the diffuser and the wing is optimum. The interaction between diffuser and rear wing is normally more pronounced when the distance is smaller, but according with the data, there is a lower limit for which the downforce decreases again. This phenomenon could be related with the low performance that the rear wing have for this height, caused by the low interaction with the air stream in that position. Therefore must be found a point at which the interaction diffuser-spoiler-vehicle is optimal. That point has been found for 500mm of height.
Graph 17. Pressure coefficient distribution at the central section of the diffuser for different rear wing heights
According with the pressure distribution, it can be observed that there is a similar distribution for 400mm and 500 mm whilst the other heights have a lower pressure distribution which is translated in a less efficiency of the diffuser.
340360380400420440460480
300 400 500 600 700Dif
fuse
r d
ow
nfo
rce
(N
)
Rear wing height (mm)
Diffuser downforce- Rear wing position
-2
-1.8
-1.6
-1.4
-1.2
-1
-0.8
-0.6
-0.4
-0.2
0
0 0.5 1 1.5 2 2.5
Pre
ssu
re c
oe
fici
en
t
Car length (m)
Pressure coefficient distribution at floor for
different rear wing heights
300mm
400mm
500mm
600mm
700mm
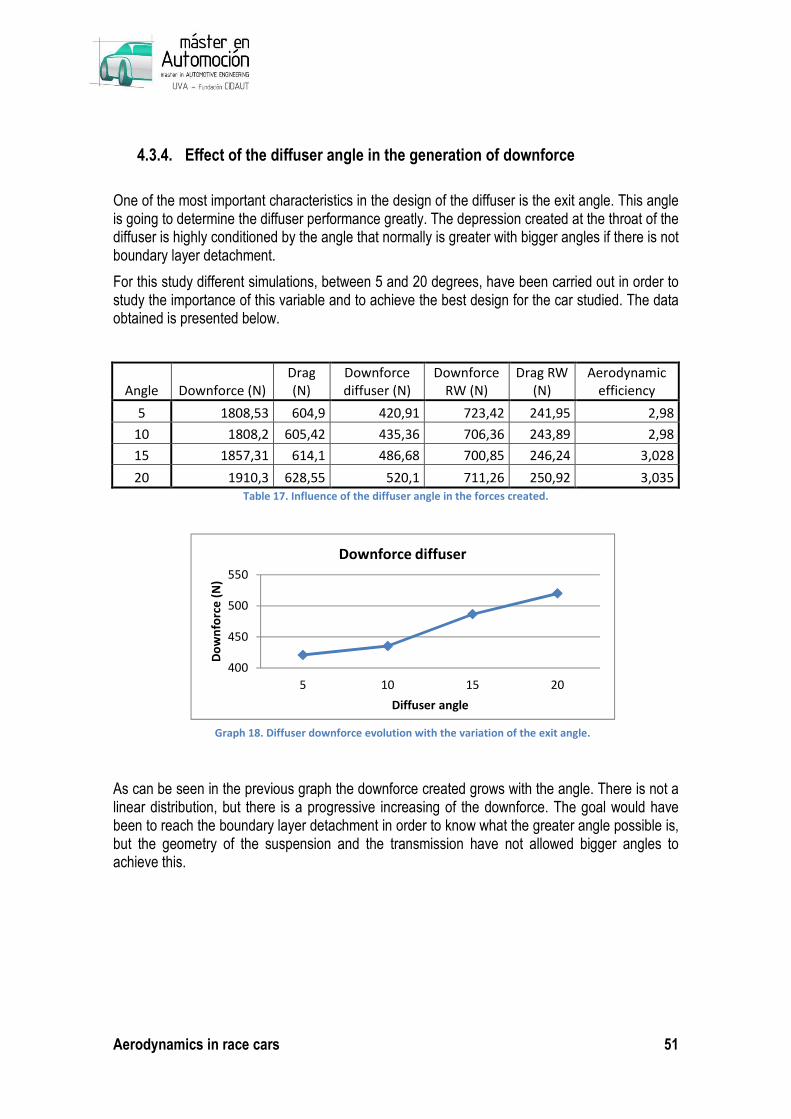
Aerodynamics in race cars 51
4.3.4. Effect of the diffuser angle in the generation of downforce
One of the most important characteristics in the design of the diffuser is the exit angle. This angle is going to determine the diffuser performance greatly. The depression created at the throat of the diffuser is highly conditioned by the angle that normally is greater with bigger angles if there is not boundary layer detachment.
For this study different simulations, between 5 and 20 degrees, have been carried out in order to study the importance of this variable and to achieve the best design for the car studied. The data obtained is presented below.
Angle Downforce (N)
Drag
(N)
Downforce
diffuser (N)
Downforce
RW (N)
Drag RW
(N)
Aerodynamic
efficiency
5 1808,53 604,9 420,91 723,42 241,95 2,98
10 1808,2 605,42 435,36 706,36 243,89 2,98
15 1857,31 614,1 486,68 700,85 246,24 3,028
20 1910,3 628,55 520,1 711,26 250,92 3,035
Table 17. Influence of the diffuser angle in the forces created.
As can be seen in the previous graph the downforce created grows with the angle. There is not a linear distribution, but there is a progressive increasing of the downforce. The goal would have been to reach the boundary layer detachment in order to know what the greater angle possible is, but the geometry of the suspension and the transmission have not allowed bigger angles to achieve this.
400
450
500
550
5 10 15 20
Do
wn
forc
e (
N)
Diffuser angle
Downforce diffuser
Graph 18. Diffuser downforce evolution with the variation of the exit angle.
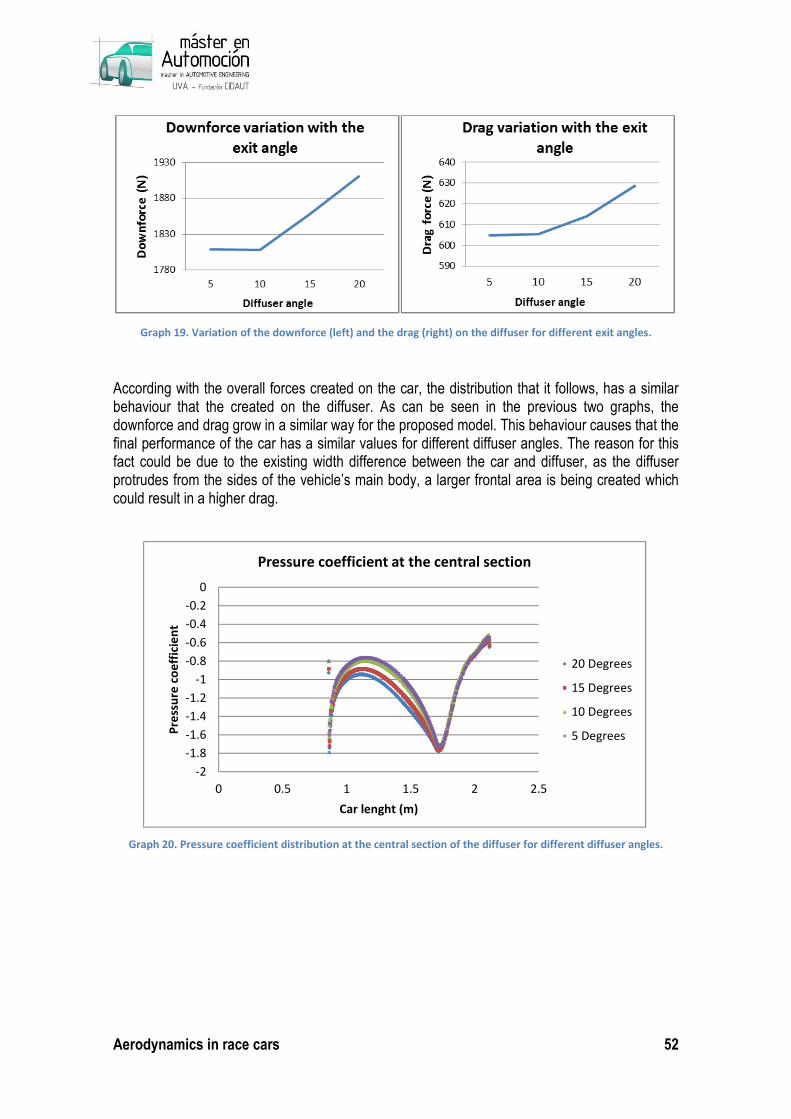
Aerodynamics in race cars 52
Graph 19. Variation of the downforce (left) and the drag (right) on the diffuser for different exit angles.
According with the overall forces created on the car, the distribution that it follows, has a similar behaviour that the created on the diffuser. As can be seen in the previous two graphs, the downforce and drag grow in a similar way for the proposed model. This behaviour causes that the final performance of the car has a similar values for different diffuser angles. The reason for this fact could be due to the existing width difference between the car and diffuser, as the diffuser protrudes from the sides of the vehicle’s main body, a larger frontal area is being created which could result in a higher drag.
Graph 20. Pressure coefficient distribution at the central section of the diffuser for different diffuser angles.
-2
-1.8
-1.6
-1.4
-1.2
-1
-0.8
-0.6
-0.4
-0.2
0
0 0.5 1 1.5 2 2.5
Pre
ssu
re c
oe
ffic
ien
t
Car lenght (m)
Pressure coefficient at the central section
20 Degrees
15 Degrees
10 Degrees
5 Degrees

Aerodynamics in race cars 53
Graph 21. Pressure coefficient distribution at the side section of the diffuser for different diffuser angles
The pressure distribution shows a decrease of the overall pressure under the floor. At the central section the drop is less pronounced and it is generated before the diffuser throat. In other hand it is observed that the main difference is located at the sides of the diffuser. This is an obvious behavior if we take into account that the diffuser angle only changes at sides.
For future designs could be good to develop the chassis taking into account the diffuser shape, in order to allow a big exit angle at the center of the car, which has been demonstrated that is the zone where the diffuser has more efficiency.
4.3.5. Influence of the diffuser length in the generation of downforce
As well as the diffuser angle, the length is another of the characteristics that defines the shape of the diffuser, and therefore its performance. In this section, the influence that the length of the diffuser has in the forces generated on the car is going to be studied.
To carry out the study an angle of 20 degrees has been selected. It was seen that this angle provided the maximum performance on the diffuser. The boundary conditions keep similar to the previous simulations to compare with a minimum dispersion possible with each other.
It is obvious that if the length of the diffuser grows, the beam wing will be out of position when the end of the diffuser is more backwards that the beam wing. For this reason the beam wing has been moved in each model to keep similar distances between the diffuser and the beam wing. Furthermore, the influence that the beam wing has in the diffuser performance is going to be studied in this part, to determine in what degree the beam wing is useful to generate a better performance on the diffuser.
Study with the beam wing attached.
In the following table the values of the different forces are represented for each simulation carried out with the beam wing implemented.
-2
-1.5
-1
-0.5
0
0 0.5 1 1.5 2 2.5
Pre
ssu
re c
oe
ffic
ien
t
Car length
Pressure coefficient at the side section
20 Degrees
15 Degrees
10 Degrees
5 Degrees
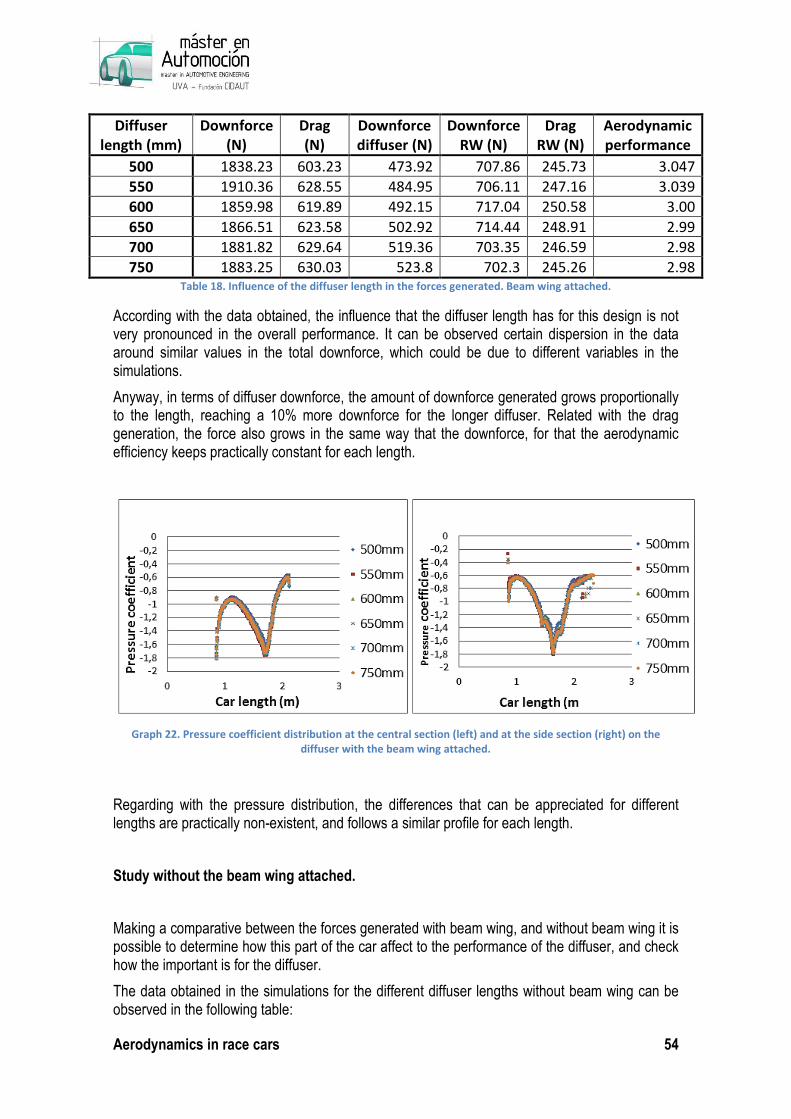
Aerodynamics in race cars 54
Diffuser
length (mm)
Downforce
(N)
Drag
(N)
Downforce
diffuser (N)
Downforce
RW (N)
Drag
RW (N)
Aerodynamic
performance
500 1838.23 603.23 473.92 707.86 245.73 3.047
550 1910.36 628.55 484.95 706.11 247.16 3.039
600 1859.98 619.89 492.15 717.04 250.58 3.00
650 1866.51 623.58 502.92 714.44 248.91 2.99
700 1881.82 629.64 519.36 703.35 246.59 2.98
750 1883.25 630.03 523.8 702.3 245.26 2.98 Table 18. Influence of the diffuser length in the forces generated. Beam wing attached.
According with the data obtained, the influence that the diffuser length has for this design is not very pronounced in the overall performance. It can be observed certain dispersion in the data around similar values in the total downforce, which could be due to different variables in the simulations.
Anyway, in terms of diffuser downforce, the amount of downforce generated grows proportionally to the length, reaching a 10% more downforce for the longer diffuser. Related with the drag generation, the force also grows in the same way that the downforce, for that the aerodynamic efficiency keeps practically constant for each length.
Graph 22. Pressure coefficient distribution at the central section (left) and at the side section (right) on the
diffuser with the beam wing attached.
Regarding with the pressure distribution, the differences that can be appreciated for different lengths are practically non-existent, and follows a similar profile for each length.
Study without the beam wing attached.
Making a comparative between the forces generated with beam wing, and without beam wing it is possible to determine how this part of the car affect to the performance of the diffuser, and check how the important is for the diffuser.
The data obtained in the simulations for the different diffuser lengths without beam wing can be observed in the following table:
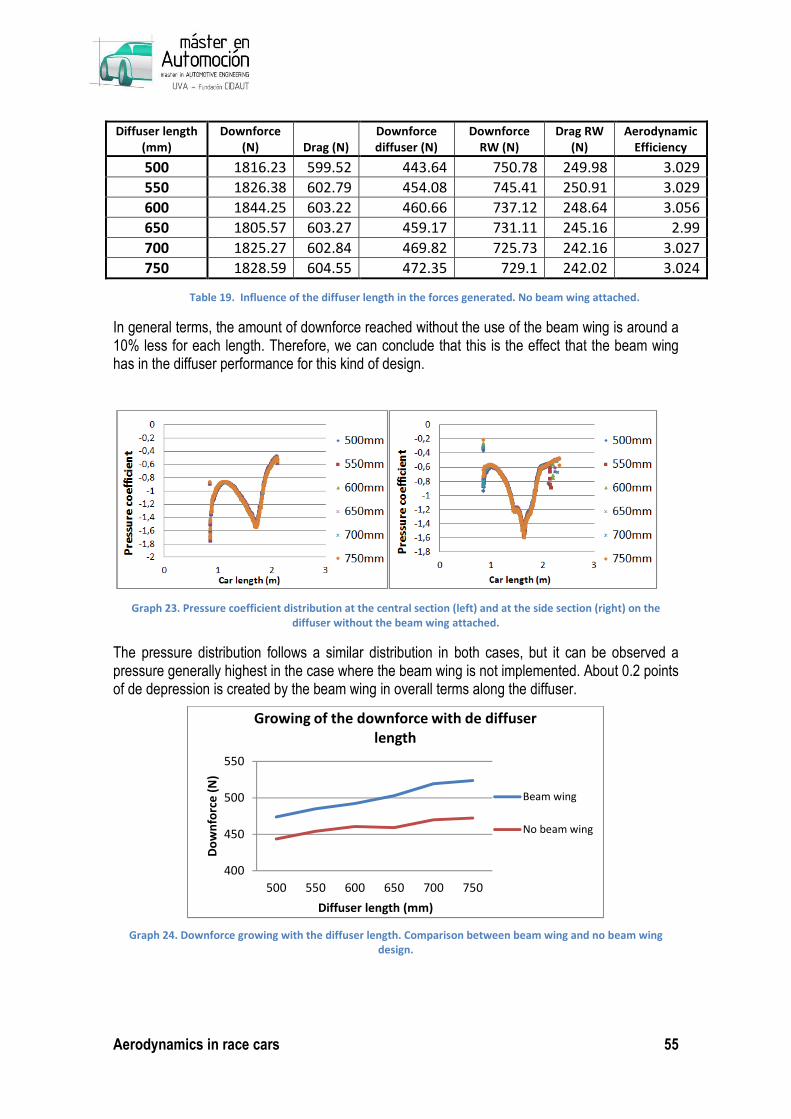
Aerodynamics in race cars 55
In general terms, the amount of downforce reached without the use of the beam wing is around a 10% less for each length. Therefore, we can conclude that this is the effect that the beam wing has in the diffuser performance for this kind of design.
Graph 23. Pressure coefficient distribution at the central section (left) and at the side section (right) on the
diffuser without the beam wing attached.
The pressure distribution follows a similar distribution in both cases, but it can be observed a pressure generally highest in the case where the beam wing is not implemented. About 0.2 points of de depression is created by the beam wing in overall terms along the diffuser.
Graph 24. Downforce growing with the diffuser length. Comparison between beam wing and no beam wing
design.
400
450
500
550
500 550 600 650 700 750
Do
wn
forc
e (
N)
Diffuser length (mm)
Growing of the downforce with de diffuser
length
Beam wing
No beam wing
Table 19. Influence of the diffuser length in the forces generated. No beam wing attached.
Diffuser length
(mm)
Downforce
(N) Drag (N)
Downforce
diffuser (N)
Downforce
RW (N)
Drag RW
(N)
Aerodynamic
Efficiency
500 1816.23 599.52 443.64 750.78 249.98 3.029
550 1826.38 602.79 454.08 745.41 250.91 3.029
600 1844.25 603.22 460.66 737.12 248.64 3.056
650 1805.57 603.27 459.17 731.11 245.16 2.99
700 1825.27 602.84 469.82 725.73 242.16 3.027
750 1828.59 604.55 472.35 729.1 242.02 3.024
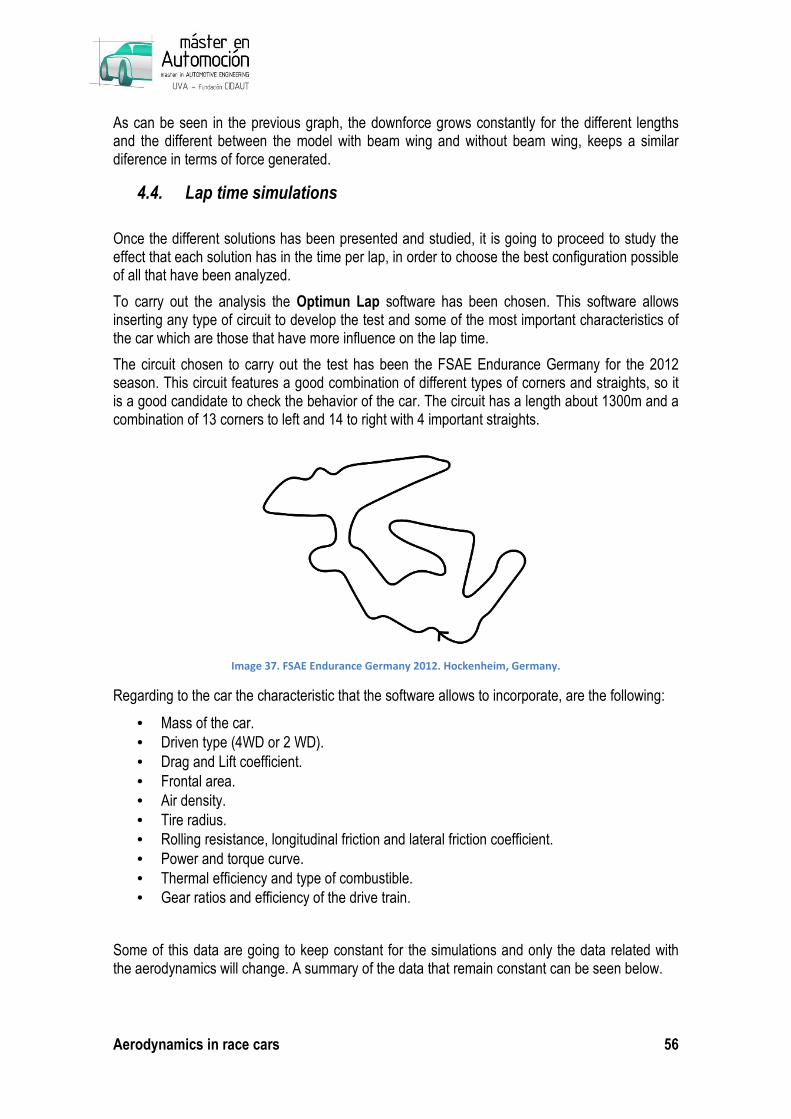
Aerodynamics in race cars 56
As can be seen in the previous graph, the downforce grows constantly for the different lengths and the different between the model with beam wing and without beam wing, keeps a similar diference in terms of force generated.
4.4. Lap time simulations
Once the different solutions has been presented and studied, it is going to proceed to study the effect that each solution has in the time per lap, in order to choose the best configuration possible of all that have been analyzed.
To carry out the analysis the Optimun Lap software has been chosen. This software allows inserting any type of circuit to develop the test and some of the most important characteristics of the car which are those that have more influence on the lap time.
The circuit chosen to carry out the test has been the FSAE Endurance Germany for the 2012 season. This circuit features a good combination of different types of corners and straights, so it is a good candidate to check the behavior of the car. The circuit has a length about 1300m and a combination of 13 corners to left and 14 to right with 4 important straights.
Image 37. FSAE Endurance Germany 2012. Hockenheim, Germany.
Regarding to the car the characteristic that the software allows to incorporate, are the following:
• Mass of the car.
• Driven type (4WD or 2 WD).
• Drag and Lift coefficient.
• Frontal area.
• Air density.
• Tire radius.
• Rolling resistance, longitudinal friction and lateral friction coefficient.
• Power and torque curve.
• Thermal efficiency and type of combustible.
• Gear ratios and efficiency of the drive train.
Some of this data are going to keep constant for the simulations and only the data related with the aerodynamics will change. A summary of the data that remain constant can be seen below.

Aerodynamics in race cars 57
Mass of the car 232kg (with 68kg driver seated)
Driven type 2WD
Air density 1.18 kg/m3
Tire radius 0,22m
Rolling resistance 0,03
Longitudinal friction coeff. 1,4
Lateral friction coeff. 1,5
Thermal efficiency 0,33
Table 20. Different data for the lap time analysis
Regarding to the characteristics of the engine, in the following graph the curves of power and torque are showed. These data have been extracted directly from the dynamometer.
Graph 25. Power and torque curves.
And the gear ratios:
1st 5,4
2nd 4,5
3rd 3,6
4th 2,8
Final drive ratio 3,5
Drive efficiency 95%
Table 21. Gear ratios.
0
10
20
30
40
50
60
0.00
5.00
10.00
15.00
20.00
25.00
30.00
35.00
40.00
40
00
45
00
50
00
52
50
55
00
57
50
60
00
62
50
65
00
67
50
70
00
72
50
75
00
77
50
80
00
82
50
85
00
87
50
Po
we
r (k
w)
Regime (rps)
Power and torque curves
Power
Torque
To
rqu
e (
Nm
)

Aerodynamics in race cars 58
After the time lap simulation, the results obtained are the following:
Speed
(m/s)
Downforce
(N)
Drag
(N)
Frontal
área (m2) Cd Cl Time (s)
Initial concept 25 -12,5 191 0,59 0,877 -0,0574 85,77
First diffuser design 25 74,98 202,13 0,59 0,929 0,344 85,47
Second diffuser
design 25 -20 211,56 0,59 0,9724 -0,091 85,8
Third diffuser desing 25 21,97 207 0,59 0,951 0,101 85,67
Rear wing 1 25 219 279 0,79 0,957 0,751 85,06
Rear wing 2 25 294,91 304,37 0,79 1,044 1,012 80,82
Rear wing 3 25 288,36 304,36 0,79 1,044 0,989 80,85
Rear wing 4 25 256 292,66 0,79 1,004 0,878 84,95
Rear wing 5 25 683,6 379,56 0,79 1,307 2,346 83,58
Front wing + 2
planes RW 25 1344,64 304,37 0,79 1,044 4,615 81,39
Front wing + 3
planes RW 25 1687,64 470,27 1,09 1,170 4,1987 80,53
Kinematic conditions 25 1821,34 476,7 1,09 1,186 4,531 80,43
Rear wing height 300 25 1545 527,88 1,09 1,313 3,843 81,03
Rear wing height 400 25 1771 599,47 1,09 1,491 4,406 80,42
Rear wing height 500 25 1821,34 576,7 1,09 1,434 4,531 80,24
Rear wing height 600 25 1860,56 586,64 1,09 1,459 4,628 80,15
Rear wing height 700 25 1875,51 625,81 1,09 1,556 4,666 80,15
Angle diffuser 5 25 1808,53 604,9 1,09 1,504 4,499 80,31
Angle diffuser 10 25 1808,2 605,42 1,09 1,506 4,498 80,31
Angle diffuser 15 25 1857,31 614,1 1,09 1,527 4,620 80,18
Angle diffuser 20 25 1910,3 628,55 1,09 1,563 4,752 80,06
Diffuser length 500 25 1838,23 603,23 1,09 1,508 4,573 80,23
Diffuser length 550 25 1910,36 628,55 1,09 1,565 4,758 80,06
Diffuser length 600 25 1859,98 619,89 1,09 1,542 4,627 80,19
Diffuser length 650 25 1866,81 623,58 1,09 1,551 4,644 80,17
Diffuser length 700 25 1881,83 629,64 1,09 1,566 4,681 80,13
Diffuser length 750 25 1823,35 630,03 1,09 1,567 4,536 80,19
Table 22. Lap time simulation results.

Aerodynamics in race cars 59
In view of the results obtained, we can conclude that the incorporation of an aerodynamic package affect highly the time per lap. In this case, the time has been reduced in 5,71 seconds in a track with 1300m.
It is determined that the best configuration studied correspond with a three planes rear wing in combination with a diffuser with 20º of angle and 550mm length. The rear wing must be located 500mm above the exit of the diffuser in order to achieve the maximum performance.

Aerodynamics in race cars 60
5. CONCLUSIONS
In this study the importance that the aerodynamics forces have in the behavior of the car and its effect in the overall performance of the car has been determined.
With the inclusion of aerodynamics appendices the reduction of the time per lap has been demonstrated. The results have shown an improvement of about 5.7 second in the time per lap in a very representative circuit of this kind of competition.
Regarding to the diffuser, which was the aim of this study, a large amount of simulations have been carried out to determine in the best way possible the operation of this part of the car. It has been determined that the diffuser has great significance in the generation of the downforce, representing about a 25% of the total downforce created by the car. Furthermore the importance that the shape has in the diffuser performance has been checked, observing that this is very sensitive to the changes of the form. It has been difficult to find a properly geometry with a high performance because the shape of the chassis couldn’t be modified, this fact hindered the generation of drag behind the car and as a consequence a big amount of downforce couldn’t be generated. Therefore, the low pressure behind the car is a requirement to reach high levels of performance on the diffuser.
In order to increase the downforce of the diffuser the rear wing and the beam wing were incorporated. The study about the effect of the wing in the diffuser shows that there is an increase of the downforce generated by the diffuser around 200% which can reach up to 300% when the exit angle, length and other parameters are optimized. It has been observed that a nearly lineal dependence exists between the drag generated by the rear wings and the downforce generated by the diffuser.
It has been also studied that the angle of the diffuser and its length has a great importance in the performance. The downforce generated by the diffuser grows in the same way that the angle is bigger, the same happens when the length grows. But because of the diffuser is wider than the principal body of the car, the drag created by the diffuser also grows, which leads to choose a solution with the best compromise between the drag and downforce.
The effect that the wings have in the car has been also studied and it has been determined in what extend these attachments affect to the overall behavior of the car. Making a comprehensive analysis of the results related with the wings, it is determined that the drag induced by the wings has a big influence in the time per lap. Because this fact, it is necessary a design of the wings with a high level of efficiency, which leads to the choice of wings with a high aspect ratio in order to achieve the maximum downforce possible with the minimum drag. Relative to this, that is, the efficiency of the wing, we can conclude that the efficiency of the rear wing could be improved to achieve better results. The efficiency of this wing is about 2.8 whilst the front wing has an efficiency coefficient close to 5. It should be noted at this point that the optimization of the wings is not a direct aim of this study and this should be solved in a complementary research.
In the previous chapter there is a summary table with the principal results of the different models studied, it is highly recommended to take a look of the table in order to have a general overview about how the results have changed along the study.
Aerodynamics in race cars 61
5.1. Solution adopted
In view of the data obtained, the solution chosen as a final design corresponds to the first proposal of diffuser with 20 degrees of exit angle and 550mm of length measured since the point in which the inclination starts.
The diffuser works in combination with a rear and a front wing. Both wings are composed of three profiles. For the rear wing a configuration of a Seilig 1223 airfoil for the main plane and two FX74 MOD for the flaps has been chosen. The same configuration has been adopted for the front wing.
This configuration of wings allows generating about 720 N of downforce at the front wing, almost 700N at the rear wing and 490N on the diffuser. Therefore, taking into account the other forces created by the car, the resulting forces are 1910N for the downforce and 628,5N of drag.
This solution has resulted to be the solution with the best compromise between the drag and downforce and it has demonstrated to be the best in the lap times. Therefore it has been adopted as a final solution.
5.2. Future work
In order to finish with the aerodynamic study of this car the following analysis are proposed:
• Optimization of the rear wing. Study of the gap between profiles and the attack angle. Study of the endplates as a drag reduction system.
• Optimization of the front wing. Study of the gap between profiles and an optimum attack angle. It is also important the study of the flow toward the back of the car in order to improve the efficiency of the floor and the rear wings.
• Detailed study of the end plates of the front wing in order to reduce the drag of the wheels and also to create a system to seal aerodynamically the floor of the car to achieve more performance on the floor.
• Try to find a more precise relation between the drag created by the wings and the diffuser downforce, using for example, pressure maps distribution at the back of the car.
• Study of the influence of the track height and the pitch angle in the diffuser performance. The effect of the yaw is also interesting in order to know how affect to the overall aerodynamic.

Aerodynamics in race cars 62
6. BIBLIOGRAPHY
[1] Aiguabella Macau, R. 2011, Formula One Rear Wing Optimization, Universitat Politecnica de Catalunya.
[2] Barnard, R.H. 2009, Road vehicle aerodynamic design, 3rd ed, Mechaero.
[3] Breslouer, O.J.; George, A.R. 2008, Exploratory Experimental Studies of Forces and Flow Structure on a Bluff Body with Variable Diffuser and Wheel Configurations, SAE International.
[4] Christoffersen, L.; Söderblom, D.; Lofdahl, L.; Hill, R. & Kerr, L. 2011, Wing-Diffuser Interaction on a Sports Car, SAE International.
[5] Cooper, K.R.; Bertenyi, T.; Dutil, G.; Syms, J.; Sovran, G. 1998, The Aerodynamic Performance of Automotive Underbody Diffusers, SAE International.
[6] Dyverfors, N.; Borre, K.; Arnell, C.; Rice J. 2012, Interaction of Downforce Generating Devices and Cooling Air Flow - A Numerical and Experimental Study on Open Wheeled Race Cars, SAE International.
[7] Ehirim, O. 2012, Optimal Diffuser Design for Formula SAE Race Car Using an Innovative Geometry Buildup and CFD Simulation Setup with On-Track Testing Correlation, SAE International.
[8] Huminic, A.; Huminic, G. 2012, Numerical Flow Simulation for a Generic Vehicle Body on Wheels with Variable Underbody Diffuser, SAE International.
[9] Huminic, A.; Huminic, G. 2010, Computational Study of Flow in the Underbody Diffuser for a Simplified Car Model, SAE International.
[10] Jensen, K. 2010, Aerodynamic Undertray Design for Formula SAE.
[11] Joseph, K.; Garcia, D.; Sluder, R. 2004, Aerodynamics of Race Car Liftoff, SAE International.
[12] Kang, S.; Cho, J.; Jun, S.; Park, H.; Song, K.; Kee, J.; Kim, K.; Lee, D. 2012, A Study of an Active Rear Diffuser Device for Aerodynamic Drag Reduction of Automobiles, SAE International.
[13] katz, J. 2006, Aerodynamics of Race Cars, Annu. Rev. Fluid Mech., vol. 38:27–63.
[14] Katz, J. 2006, Race Car Aerodynamics - Designing for Speed, 2nd ed, Bentley Publisher.
[15] Lyon, C.A.; Broeren, A.P.; Giguère, P.; Gopalarathnam, A.; Selig, M.S. 1998, Summary of Low-Speed Airfoil Data, Vol. 3, SoarTech Publications, Virginia Beach, VA.
[16] McBeat, S. 2006, Competition car aerodynamics, 2nd ed, Haynes.
[17] Meseguer, J. 2010, Algunas consideraciones sobre la aerodinámica de los automóviles de carreras, Instituto Universitario de Microgravedad “Ignacio Da Riva” (IDR/UPM), E.T.S.I. Aeronáuticos, Universidad Politécnica de Madrid.
[18] Morata Royes, S. 2009, Estudio comparativo teórico de la evolución 2008/2009 de los alerones delanteros de Formula 1.
[19] Oliveira, D.A.; Buscariolo, F.F.; Sales, F.B. 2012, Comparative CFD Study of Different Undertrays Design over an Open Wheel Prototype Race Car, SAE International.
[20] Ruhrmann, A.; Zhang, X. 2003, Influence of Diffuser Angle on a Bluff Body in Ground Effect, Journal of Fluids Engineering. Vol 125/1.
Aerodynamics in race cars 63
[21] Selig, M.S., Guglielmo, J.J., Broeren, A.P. & Giguère, P. (eds) 1995, "Summary of Low-Speed Airfoil Data”, Vol. 1, SoarTech Publications, Virginia Beach, VA.
[22] Selig, M.S.; Lyon, C.A.; Giguère, P.; Ninham, C.N.; Guglielmo, J.J. 1996, Summary of Low-Speed Airfoil Data, Vol. 2, SoarTech Publications, Virginia Beach, VA.
[23] Sumantran, V.; Sovran, G. 1996, Vehicle Aerodynamics, SAE International.
[24] Wakabayashi, M.; Komuro, K.; Pedoussaut, O.; Oguri, Y.; Suzuki, T. 2009, Improving Vehicle Performance by Aerodynamic Devices in Formula SAE, Society of Automotive Engineers of Japan.
[25] Zhang, X.; Toet, W.; Zeriham, J. 2006, Ground Effect Aerodynamics of Race Cars.
[26] Star CCM+ User manual.
Web Pages
[27] http://forums.rennlist.com/rennforums/993-forum/405821-anybody-have-pics-of-narrow-body-cars-with-gt-2-wing-2.html
[28] http://scarbsf1.com/blog1/2011/03/22/floors-and-diffusers-the-basics-explained/
[29] http://www.f1technical.net/development/248
[30] http://www.cortana.com/Drag_Description.htm
[31] http://airfoiltools.com/
[32] http://www.ae.illinois.edu/m-selig/uiuc_lsat.html
[33] www.formulastudent.de
[34] http://www.optimumg.com/


![Aerodinámica y Mecánica Del Vuelo [AM] Vers1](https://static.fdocuments.es/doc/165x107/563dba7f550346aa9aa62236/aerodinamica-y-mecanica-del-vuelo-am-vers1.jpg)


![Madrid, a 30 de octubre de 2009€¦ · AERODINÁMICA BÁSICA [2a Edición] 978-84-9281-271-4 AERODINÁMICA DE ALTAS VELOCIDADES [2a Edición] 978-84-9281-294-3 AERODINÁMICA de las](https://static.fdocuments.es/doc/165x107/5fcc5205c877b52a8b6718c2/madrid-a-30-de-octubre-de-2009-aerodinmica-bsica-2a-edicin-978-84-9281-271-4.jpg)