MERCADO MUNDIAL DEL ESPARRAGO. SITUACION Y …¡nchez-Vigo.pdf · 31/08/2017 1 MERCADO MUNDIAL DEL...
20
31/08/2017 1 MERCADO MUNDIAL DEL ESPARRAGO. SITUACION Y PERSPECTIVAS DEL CULTIVO. Oportunidades y Amenazas para el Cultivo en Chile. Ing. Javier Sánchez Vigo [email protected] Chillán (Chile), 31 de agosto 2017
Transcript of MERCADO MUNDIAL DEL ESPARRAGO. SITUACION Y …¡nchez-Vigo.pdf · 31/08/2017 1 MERCADO MUNDIAL DEL...

31/08/2017
1
MERCADO MUNDIAL DEL ESPARRAGO. SITUACION Y PERSPECTIVAS DEL CULTIVO.
Oportunidades y Amenazas para el Cultivo en Chile.
Ing. Javier Sánchez [email protected]
Chillán (Chile), 31 de agosto 2017
31/08/2017
2
PERU: En cifras al 2010
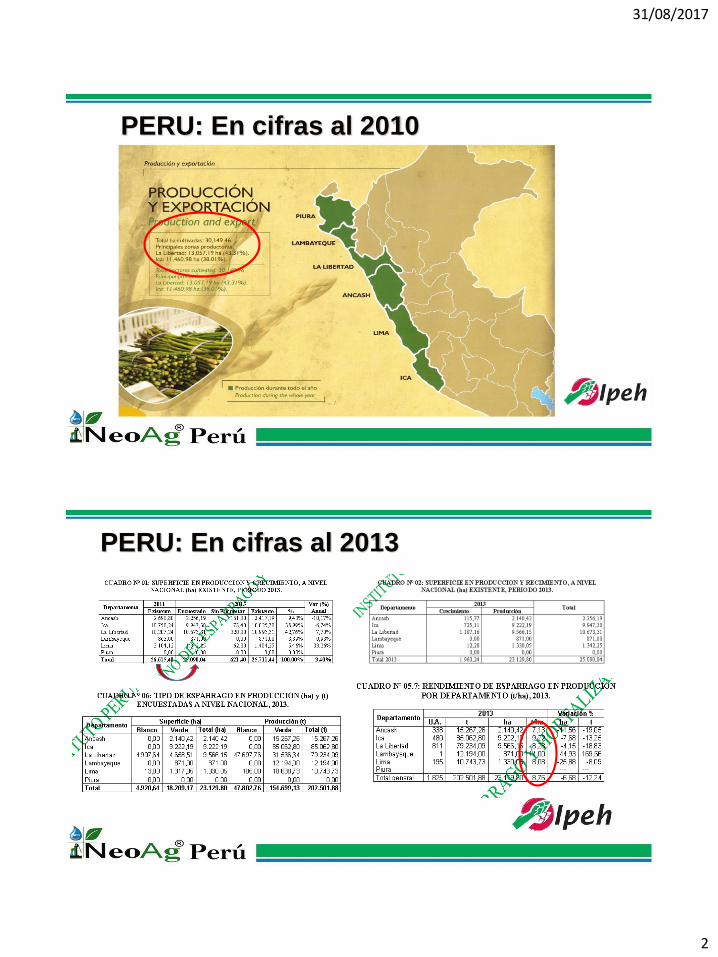
PERU: En cifras al 2013
31/08/2017
3
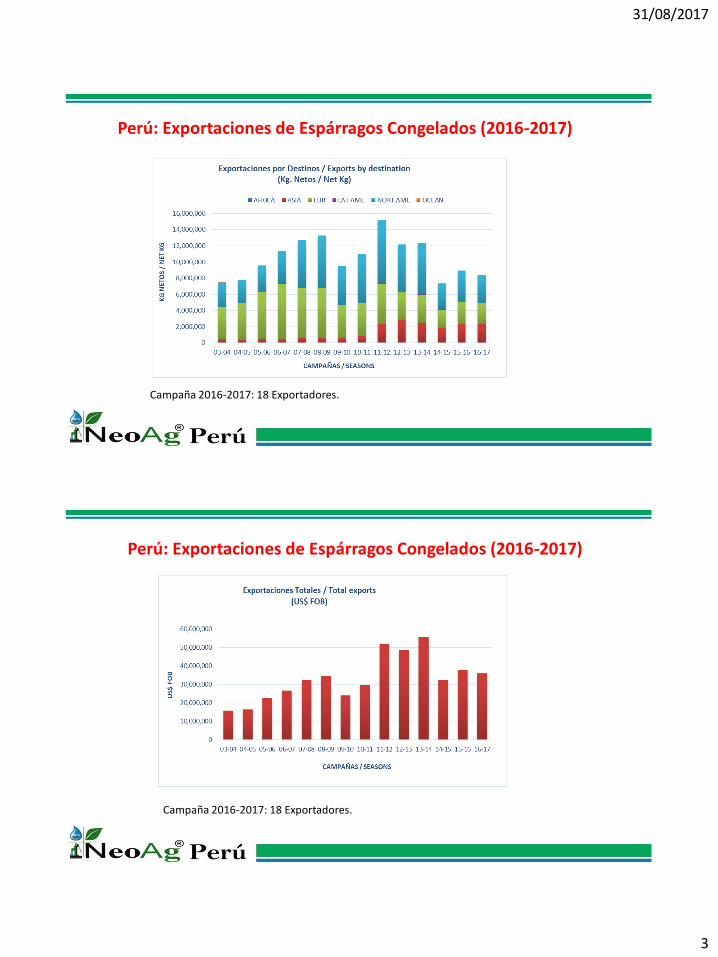
Perú: Exportaciones de Espárragos Congelados (2016-2017)
Campaña 2016-2017: 18 Exportadores.
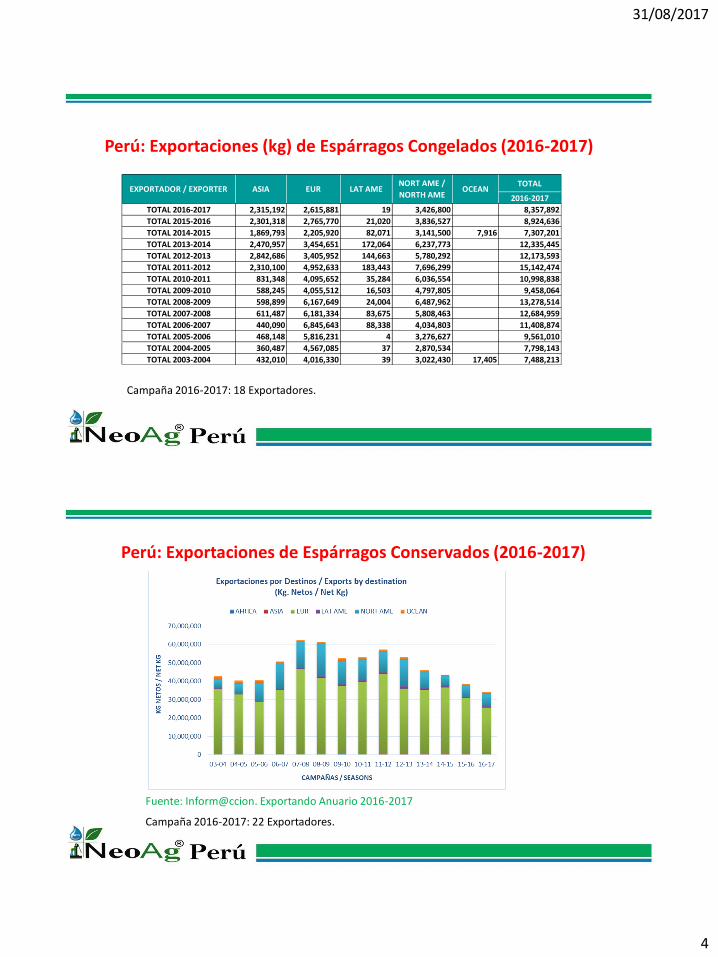
Perú: Exportaciones de Espárragos Congelados (2016-2017)
Campaña 2016-2017: 18 Exportadores.
31/08/2017
4
TOTAL
2016-2017
TOTAL 2016-2017 2,315,192 2,615,881 19 3,426,800 8,357,892
TOTAL 2015-2016 2,301,318 2,765,770 21,020 3,836,527 8,924,636
TOTAL 2014-2015 1,869,793 2,205,920 82,071 3,141,500 7,916 7,307,201
TOTAL 2013-2014 2,470,957 3,454,651 172,064 6,237,773 12,335,445
TOTAL 2012-2013 2,842,686 3,405,952 144,663 5,780,292 12,173,593
TOTAL 2011-2012 2,310,100 4,952,633 183,443 7,696,299 15,142,474
TOTAL 2010-2011 831,348 4,095,652 35,284 6,036,554 10,998,838
TOTAL 2009-2010 588,245 4,055,512 16,503 4,797,805 9,458,064
TOTAL 2008-2009 598,899 6,167,649 24,004 6,487,962 13,278,514
TOTAL 2007-2008 611,487 6,181,334 83,675 5,808,463 12,684,959
TOTAL 2006-2007 440,090 6,845,643 88,338 4,034,803 11,408,874
TOTAL 2005-2006 468,148 5,816,231 4 3,276,627 9,561,010
TOTAL 2004-2005 360,487 4,567,085 37 2,870,534 7,798,143
TOTAL 2003-2004 432,010 4,016,330 39 3,022,430 17,405 7,488,213
EXPORTADOR / EXPORTER OCEANLAT AMEEURASIANORT AME /
NORTH AME
Perú: Exportaciones (kg) de Espárragos Congelados (2016-2017)
Campaña 2016-2017: 18 Exportadores.
Perú: Exportaciones de Espárragos Conservados (2016-2017)
Campaña 2016-2017: 22 Exportadores.
Fuente: Inform@ccion. Exportando Anuario 2016-2017

31/08/2017
5
Perú: Exportaciones de Espárragos Conservados (2016-2017)
Campaña 2016-2017: 22 Exportadores.Fuente: Inform@ccion. Exportando Anuario 2016-2017
TOTAL
2016-2017
TOTAL 2016-2017 15,665 213,299 25,487,648 721,193 6,701,229 911,250 34,050,284
TOTAL 2015-2016 49,311 296,108 30,258,525 894,716 6,321,013 748,289 38,567,961
TOTAL 2014-2015 66,313 345,182 36,145,767 1,225,329 5,074,309 750,162 43,607,061
TOTAL 2013-2014 111,400 293,137 34,832,210 1,157,392 8,507,662 1,249,722 46,151,523
TOTAL 2012-2013 43,746 444,597 35,496,157 1,418,945 14,450,637 1,190,801 53,044,883
TOTAL 2011-2012 87,353 347,041 43,349,459 1,210,490 10,847,431 1,445,809 57,287,583
TOTAL 2010-2011 50,016 170,761 39,427,055 1,040,576 11,062,824 1,299,481 53,050,712
TOTAL 2009-2010 308,352 135,571 37,043,530 978,309 12,630,090 1,519,502 52,615,353
TOTAL 2008-2009 79,609 41,732,573 897,307 17,507,128 1,207,051 61,423,668
TOTAL 2007-2008 21,470 48,415 46,331,112 920,946 13,903,821 1,120,412 62,346,176
TOTAL 2006-2007 107,221 35,001,551 921,806 13,765,526 982,047 50,778,151
TOTAL 2005-2006 72,673 28,604,288 414,138 10,090,009 1,426,783 40,607,891
TOTAL 2004-2005 79,087 32,670,182 454,821 5,346,556 1,746,930 40,297,576
TOTAL 2003-2004 134,652 35,570,771 428,772 4,986,564 1,766,606 42,887,365
EXPORTADOR /
EXPORTEROCEANLAT AMEEURASIAAFRICA
NORT AME /
NORTH AME
Perú: Exportaciones (kg) de Espárragos Conservados (2016-2017)
Campaña 2016-2017: 22 Exportadores.
Fuente: Inform@ccion. Exportando Anuario 2016-2017

31/08/2017
6
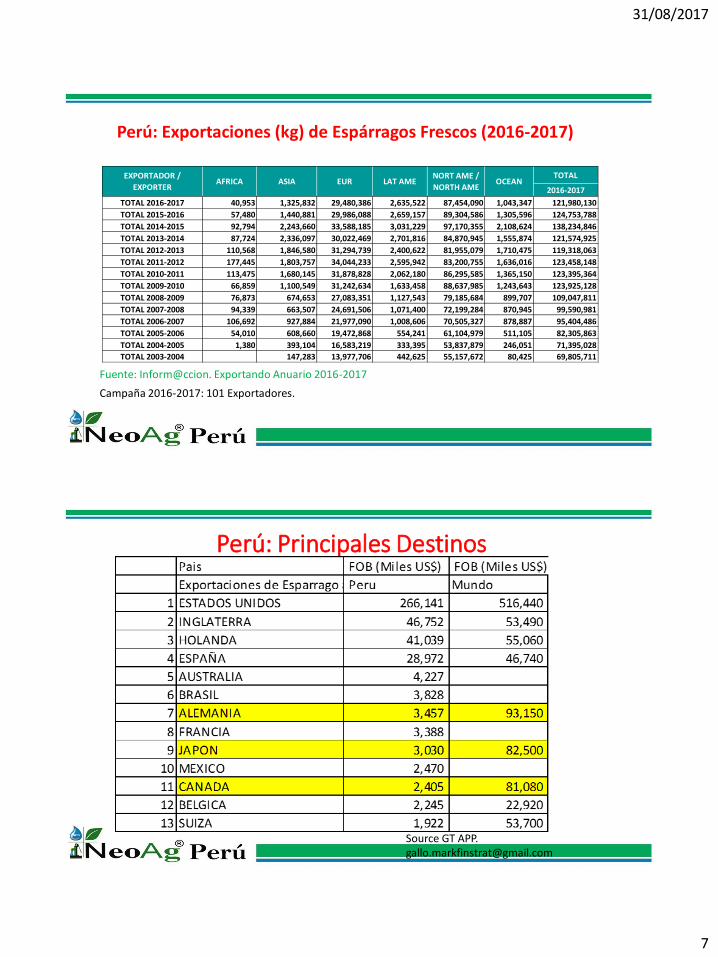
Perú: Exportaciones de Espárragos Frescos (2016-2017)
Campaña 2016-2017: 101 Exportadores.
Fuente: Inform@ccion. Exportando Anuario 2016-2017
Perú: Exportaciones de Espárragos Frescos (2016-2017)
Campaña 2016-2017: 101 Exportadores.
Fuente: Inform@ccion. Exportando Anuario 2016-2017
31/08/2017
7
TOTAL
2016-2017
TOTAL 2016-2017 40,953 1,325,832 29,480,386 2,635,522 87,454,090 1,043,347 121,980,130
TOTAL 2015-2016 57,480 1,440,881 29,986,088 2,659,157 89,304,586 1,305,596 124,753,788
TOTAL 2014-2015 92,794 2,243,660 33,588,185 3,031,229 97,170,355 2,108,624 138,234,846
TOTAL 2013-2014 87,724 2,336,097 30,022,469 2,701,816 84,870,945 1,555,874 121,574,925
TOTAL 2012-2013 110,568 1,846,580 31,294,739 2,400,622 81,955,079 1,710,475 119,318,063
TOTAL 2011-2012 177,445 1,803,757 34,044,233 2,595,942 83,200,755 1,636,016 123,458,148
TOTAL 2010-2011 113,475 1,680,145 31,878,828 2,062,180 86,295,585 1,365,150 123,395,364
TOTAL 2009-2010 66,859 1,100,549 31,242,634 1,633,458 88,637,985 1,243,643 123,925,128
TOTAL 2008-2009 76,873 674,653 27,083,351 1,127,543 79,185,684 899,707 109,047,811
TOTAL 2007-2008 94,339 663,507 24,691,506 1,071,400 72,199,284 870,945 99,590,981
TOTAL 2006-2007 106,692 927,884 21,977,090 1,008,606 70,505,327 878,887 95,404,486
TOTAL 2005-2006 54,010 608,660 19,472,868 554,241 61,104,979 511,105 82,305,863
TOTAL 2004-2005 1,380 393,104 16,583,219 333,395 53,837,879 246,051 71,395,028
TOTAL 2003-2004 147,283 13,977,706 442,625 55,157,672 80,425 69,805,711
EXPORTADOR /
EXPORTEROCEANLAT AMEEURASIAAFRICA
NORT AME /
NORTH AME
Perú: Exportaciones (kg) de Espárragos Frescos (2016-2017)
Campaña 2016-2017: 101 Exportadores.
Fuente: Inform@ccion. Exportando Anuario 2016-2017
Perú: Principales Destinos
Source GT APP. [email protected]

31/08/2017
8
Perú: Creciente Transporte Maritimo a USA
Camion Mexico TX – N York 4,500 $Camion California – N York 7,500 $Container C.A. Lima– Miami – Phil 5,000 $0.25 vs 1.5$/Kg
Source GT APP [email protected]
Perú: Calendario Agrícola de Agroexportación (2016-2017)

31/08/2017
9
Perú: Ventajas Comparativas y Competitivas del Esparrago
• Producción todos los días del año • Producción de Formatos: Fresco, Conservados y Congelados• Espárragos Verdes, Blancos, Morados.• Bandejas mix: espárragos + choclo bebe + arvejas, etc. (4G)• Altas tecnologías y producciones por hectárea
• El 80% está controlado por grandes empresas.• Empresas Agroindustriales que producen y ofertan una canasta
productos: Espárragos, paltas, cítricos, uvas de mesa, arándanos,pimientos, mangos, etc, etc.
• Espárragos peruano se vende en 72 países del mundo.• Ya manejan su propio canal de distribución en países de destino.
“El Espárrago” vs Los Espárragos

31/08/2017
10
Fuente: ADEX - ADUANAS
Elaboración:
inform @cción - SFConsulting
*Datos preliminares a la fecha:
#########
EXPORTACION DE ESPARRAGOS DE LOS AÑOS 2014, 2015, 2016*EN KG NETOS Y PRECIOS REFERENCIALES FOB US$/KG
inform @ cción
0.00
0.50
1.00
1.50
2.00
2.50
3.00
3.50
4.00
4.50
0
5,000,000
10,000,000
15,000,000
20,000,000
25,000,000
Ene Feb Mar Abr May Jun Jul Ago Sep Oct Nov Dic
US$
/kg
Kg
2014 (KG) 2015 (KG) 2016 (KG)
2014 ( US$/kg ) 2015 ( US$/kg ) 2016 ( US$/kg )
Cómo anda México ?: Superficie Cultivada (ha) y Rendimiento Promedio (kg/ha) del último Quinquenio (2013-2017)

31/08/2017
11
Situación al 31 de diciembre de 2013 ESPARRAGO
EstadoSuperficie (ha) Produccion (ton) Rdto. (ton/ha)
sembrada cosechada siniestrada obtenida obtenido
BAJA CALIFORNIA 2,494 2,080 206 13,493 6,488
BAJA CALIFORNIA SUR 1,588 1,208 6,094 5,045
GUANAJUATO 2,784 2,642 7 18,809 7,119
QUERETARO 801 789 2,772 3,513
SONORA 11,599 10,880 83,997 7,720
TOTAL 19,266 17,599 213 125,165 7.112
Datos Preliminares.
Fuente: Servicio de Información Agroalimentaria y Pesquera (SIAP).
México: Superficie Cultivada (ha) y Rendimiento Promedio (kg/ha)de Espárragos al 31 de diciembre del 2013
Situación al 31 de diciembre de 2014 ESPARRAGO
EstadoSuperficie (ha) Produccion (ton) Rdto (ton/ha)
sembrada cosechada siniestrada obtenida obtenido
BAJA CALIFORNIA 2,461 2,320 13,884 5,985
BAJA CALIFORNIA SUR 2,396 2,379 16,590 6,973
GUANAJUATO 3,064 3,031 21,970 7,249
MICHOACAN 121 37 130 3,500
NUEVO LEON 4
QUERETARO 832 772 2,594 3,360
SONORA 12,445 11,899 105,878 8,898
TOTAL 21,323 20,438 0 161,046 7.880
Datos Preliminares. v
Fuente: Servicio de Información Agroalimentaria y Pesquera (SIAP).
México: Superficie Cultivada (ha) y Rendimiento Promedio (kg/ha)de Espárragos al 31 de diciembre del 2014

31/08/2017
12
Situación al 31 de diciembre de 2015 ESPARRAGO
EstadoSuperficie (ha) Produccion (ton) Rdto. (ton/ha)
sembrada cosechada siniestrada obtenida obtenido
BAJA CALIFORNIA 3,262 2,934 21,423 7,302
BAJA CALIFORNIA SUR 3,009 2,719 11,584 4,260
COAHUILA 14 14 130 9,300
GUANAJUATO 3,216 3,198 23,803 7,442
MICHOACAN 121 58 386 6,655
NUEVO LEON 4 4 20 5,000
QUERETARO 795 772 3,219 4,170
SAN LUIS POTOSI 80 0
SINALOA 59 0
SONORA 13,081 12,483 112,160 8,985
TLAXCALA 44 0
TOTAL 23,685 22,182 0 172,725 7.787
Datos Preliminares.
Fuente: Servicio de Información Agroalimentaria y Pesquera (SIAP).
México: Superficie Cultivada (ha) y Rendimiento Promedio (kg/ha)de Espárragos al 31 de diciembre del 2015
Situación al 31 de diciembre de 2016 ESPARRAGO
EstadoSuperficie (ha) Produccion (ton) Rdto. (ton/ha)
sembrada cosechada siniestrada obtenida obtenido
AGUASCALIENTES 19 19 76 4,000
BAJA CALIFORNIA 3,322 3,154 27,027 8,583
BAJA CALIFORNIA SUR 3,264 2,719 16,917 6,222
COAHUILA 14 14 119 8,500
DURANGO 7
GUANAJUATO 3,288 3,266.0 27,146 8,312
MEXICO 20 20.0 120 6,000
MICHOACAN 170 126.0 1,075 8,498
NUEVO LEON 4
QUERETARO 883 883.0 5,284 5,984
SAN LUIS POTOSI 80 80.0 80 1,000
SINALOA 59 59.0 354 6,000
SONORA 14,925 14,388 129,808 9,022
TLAXCALA 44 42 126 3,000
ZACATECAS 20 20 260 1,300
TOTAL 26,119 24,790 0 208,392 8.406
Datos Preliminares.
Fuente: Servicio de Información Agroalimentaria y Pesquera (SIAP).
México: Superficie Cultivada (ha) y Rendimiento Promedio (kg/ha)de Espárragos al 31 de diciembre del 2016

31/08/2017
13
Situación al 31 de MAYO de 2017 ESPARRAGO
EstadoSuperficie (ha) Produccion (ton) Rdto. (ton/ha)
sembrada cosechada siniestrada obtenida obtenido
AGUASCALIENTES 26
BAJA CALIFORNIA 3,352 2,240 76 19,301 8.617
BAJA CALIFORNIA SUR 3,407 1,117 2,743 2.456
COAHUILA 14
DURANGO 102
GUANAJUATO 3,358 60 216 3.000
JALISCO 38
MEXICO 20
MICHOACAN 286 79 243 3.076
QUERETARO 1,091
SAN LUIS POTOSI 80
SINALOA 169
SONORA 15,402 13,948 133,002 9.536
TLAXCALA 44
ZACATECAS 20
TOTAL 27,409 17,444 76 155,505 8.915
Datos Preliminares.
Fuente: Servicio de Información Agroalimentaria y Pesquera (SIAP).
México: Superficie Cultivada (ha) y Rendimiento Promedio (kg/ha)de Espárragos al 31 de julio del 2017
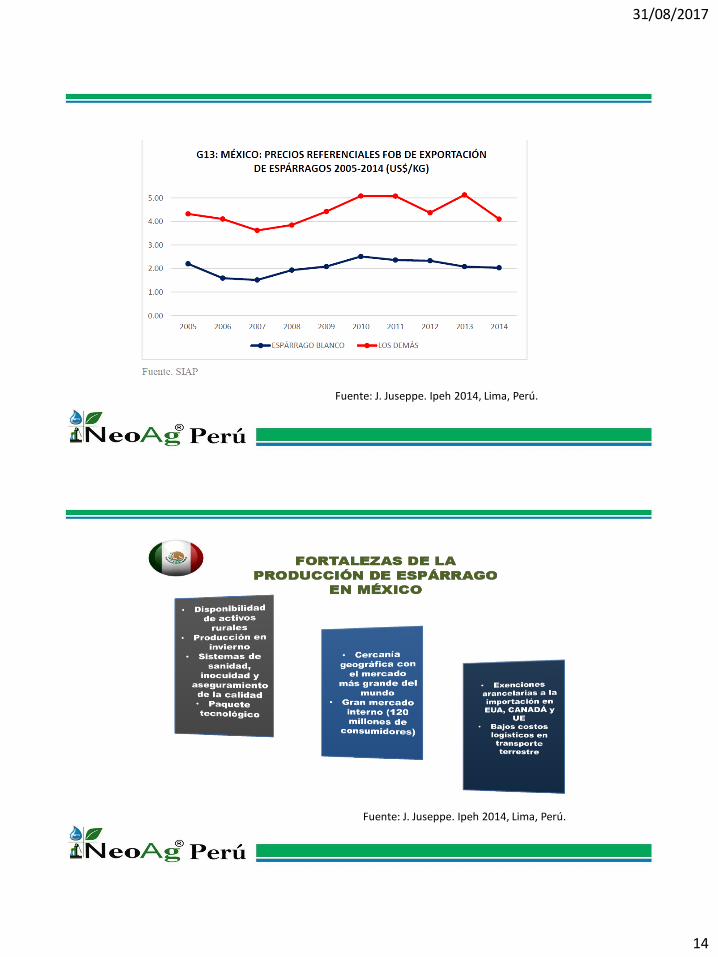
Fuente: J. Juseppe. Ipeh 2014, Lima, Perú.
Con el ingreso de nuevos estadosen la producción de espárragos, laoferta se ampliará en el calendario.
31/08/2017
14
Fuente: J. Juseppe. Ipeh 2014, Lima, Perú.
Fuente: J. Juseppe. Ipeh 2014, Lima, Perú.

31/08/2017
17
Source GT APP [email protected]
Perú y México: Evolución de los últimos 5 años
Perú: Fuente; Ipeh (2010 y 2013), estimación del autor (2014 al 2017)
México: Fuente; SIAP (Servicio de Información Agropecuaria y Pesquera)

31/08/2017
18
Y, Chile? Cómo va Chile?
• Desde el año 2104, el suscrito ya reportaba bajas de áreas en Perú.• Varias giras técnicas de agricultores chilenos a Perú, pudieron verificar “in situ”
• Hay la intención de recuperar el campo y mercado perdido.• La superficie cultivada actual no pasa de 5,000 has con 5 ton/ha promedio.
Del 2013 al 2017:• Perú, decrece un 6% anual en sus áreas y plantaciones cada vez mas viejas,
pero con rendimientos promedio de 8-9 ton/ha.• México, crece, un 7% anual en sus áreas y cada vez más estados entran a la
producción con rendimientos promedio de 8-9 ton/ha.• Chile; sigue evaluando, la posibilidad de recuperar el protagonismo de los 80 y 90.
Jorge Ocampo. Chile (2016) Con amor...¡
Asociatividad...¡
Y, Chile? Cómo va Chile?

31/08/2017
19
Perú: Conclusiones del Autor
1. En este momento, deben haber aproximadamente unas 22,000 has cultivadas con espárragos.2. La tasa de reposición es mucho menor que la tasa de cierre (“matada”).3. La región Lambayeque es la que tienen mayor tasa de siembra de áreas nuevas, pero no significativa a nivel nacional. Son las mismas empresas del sur (Ica) y del norte (Trujillo).4. La única variedad nueva a nivel comercial es la UC115, en tres años lleva un comportamiento
ligeramente mejor que la UC157.5. Las grandes empresas en el sur están migrando de espárragos a: uva de mesa sin semilla, paltas,
cítricos, arándanos y hortalizas menores. Problema es el agua.6. La oferta en volumen es cada año menor, pero los precios son ligeramente mayor en el retorno,
esto, por falta de competencia. Ventajas Comparativas y Competitivas de Perú.8. Los costos de producción directos e indirectos se han elevado mucho, especialmente la mano de obra.
---------- Forwarded message ----------
From: IAS 2017 Potsdam <[email protected]>
Date: 2017-08-23 8:25 GMT-05:00
Subject: Thinking about next IAS host
Dear Attendee's; 14th International Asparagus Symposium:
The organizing committee is pleased to see so many people attending and I personally want to thank the German organizing committee for the hard work in preparing the 14th
Asparagus Symposium!
One task at the closing business meeting (6 Sept) is to identify the location (host country or area) for the 15th Asparagus Symposium. We have been to many exciting places around
the world looking at asparagus (China: 2013; Peru: 2009) just to name the last couple.
Hosting the meetings offer the chance to highlight what you do in your country (area). For those attending the meetings, it is a chance to enjoy visiting your country, learning about
local asparagus issues, and socializing with each other and talking about asparagus research. On a personal level, I have made many great friends though my association with the
ISHS Asparagus working group and look forward to the next meetings.
1) So, before you come to Potsdam, think about where the next asparagus symposium should be held. Is there someplace we haven't been for a while? Just remember, we need an
organizing committee to put the program together.
2) Or better yet, Is your country or asparagus research team willing to host the next symposium? If so, come with a Symposium Hosting proposal.
We really would like to identify the next host country at the meetings and we do this at the business meeting on 6 September. So talk to your colleagues and
see if your country is willing to host the 15th International Asparagus Symposium!
If you have any questions about hosting, please contact me ([email protected])
or get in touch with one of the organizers of 14th IAS. They can tell you a
lot about what it takes to host the meetings.
We all looking forward to meet you soon in Potsdam!
Best regards
Dan Drost - Asparagus Working Group Chairperson and Members of the 14th IAS Organizing committee

31/08/2017
20