Mineral requirements for beef cattle - BR-Corte 3
38
9 Mineral requirements for beef cattle Luiz Fernando Costa e Silva, Sebastião de Campos Valadares Filho, Polyana Pizzi Rotta, Marcos Inácio Marcondes, Diego Zanetti, Mateus Pies Gionbelli, Terry Eugene Engle, Mário Fonseca Paulino INTRODUCTION Minerals are present in variable amounts and proportions in all feeds and animal tissues (Underwood, 1981). The prominence of each mineral is closely related to its functional role. There are 22 essential minerals that are known to provide specific functions in the body and are necessary for animal (McDonald et al., 2002): calcium (Ca), phosphorus (P), potassium (K), sodium (Na), chlorine (Cl), magnesium (Mg), and sulfur (S), which are considered macrominerals; and iron (Fe), iodine (I), zinc (Zn), copper (Cu), manganese (Mn), cobalt (Co), molybdenum (Mo), selenium (Se), chromium (Cr), tin (Sn), vanadium (V), fluorine (F), silicon (Si), nickel (Ni), and argon (Ar), which are considered microminerals (Spears and Kegley, 2002). Due to their concentration, macrominerals are expressed as g/kg of animal tissue and microminerals as mg/kg of animal tissue. Although minerals are present in animals in lower proportions than other nutrients, such as protein and fat, they perform vital functions in the body. Mineral deficiencies and excesses can cause severe nutritional changes that impair animal performance. Erickson (1999) studied two levels of calcium in the diet (0.35 and 0.70%) and showed animals fed at 0.70% had lower performance. Thus, ensuring adequate mineral nutrition is fundamental to optimize animal performance and avoid contamination of soil and water, resulting from mineral excretion into the environment via feces and urine. Fundamentally, minerals have five functions in animals (Suttle, 2010; Wilson et al., 2016): 1. Structural: composition of organs and body tissues, such as Ca, P, Mg, F, and Si in bones and teeth; and P and S in muscle proteins. Approximately 99% Ca, 80% P, and 70% Mg are present in the skeleton (AFRC, 1991; Coelho da Silva, 1995; NRC, 2000); 2. Physiological: constituents of body tissues and fluids responsible for maintaining osmotic pressure, acid-base balance, membrane permeability, and tissue irritability, such as Na, K, Cl, Ca, and Mg in the blood, brain-spinal fluid, and gastric juice (Suttle, 2010); 3. Catalytic: catalysts of enzymatic and hormonal systems, performed primarily by microminerals. The regulation of lipid metabolism and synthesis by Cu and spermatogenesis by Zn are examples (Suttle, 2010); 4. Regulatory: replication, regulation and cell differentiation, such as the influences of Ca on signal transduction, and selenocysteine on gene transcription (Suttle, 2010); and 5. Immune response: in calves, Cu supplementation increases its hepatic concentration during respiratory challenges, positively impacting the immune response when under stress (Wilson et al., 2016). These functions can only be performed if adequate amounts of dietary minerals are absorbed and retained to maintain growth, development, and reproduction, as well as replace minerals lost to milk yield, for example (Suttle, 2010). The feedstuffs, commonly fed to beef cattle, can provide these nutrients (Genther and Hansen, 2014); however, the mineral concentrations are variable and/or inadequate (Smart et al., 1981), contributing to low animal performance and meat quality (Spears and Kegley, 2002). According to Arthington et al. (2014), mineral supplementation can be achieved in several ways: salt blocks fortified with minerals, injectable microminerals, and protein- energy supplements fortified with microminerals. Factorial models are the most common methods used to predict the mineral dietary requirements of cattle (ARC, 1980). The dietary requirement for each mineral is predicted as the sum of the net mineral required for maintenance and production divided by the absorption coefficient of each mineral, in the gastrointestinal tract of the animal, to allow for the inefficient use of dietary mineral supply. However, not all
Transcript of Mineral requirements for beef cattle - BR-Corte 3

9
Mineral requirements for beef cattle
Luiz Fernando Costa e Silva, Sebastião de Campos Valadares Filho, Polyana Pizzi Rotta, Marcos Inácio
Marcondes, Diego Zanetti, Mateus Pies Gionbelli, Terry Eugene Engle, Mário Fonseca Paulino
INTRODUCTION
Minerals are present in variable amounts
and proportions in all feeds and animal tissues
(Underwood, 1981). The prominence of each
mineral is closely related to its functional role.
There are 22 essential minerals that are known to
provide specific functions in the body and are
necessary for animal (McDonald et al., 2002):
calcium (Ca), phosphorus (P), potassium (K),
sodium (Na), chlorine (Cl), magnesium (Mg),
and sulfur (S), which are considered
macrominerals; and iron (Fe), iodine (I), zinc
(Zn), copper (Cu), manganese (Mn), cobalt (Co),
molybdenum (Mo), selenium (Se), chromium
(Cr), tin (Sn), vanadium (V), fluorine (F), silicon
(Si), nickel (Ni), and argon (Ar), which are
considered microminerals (Spears and Kegley,
2002). Due to their concentration, macrominerals
are expressed as g/kg of animal tissue and
microminerals as mg/kg of animal tissue.
Although minerals are present in animals
in lower proportions than other nutrients, such as
protein and fat, they perform vital functions in
the body. Mineral deficiencies and excesses can
cause severe nutritional changes that impair
animal performance. Erickson (1999) studied
two levels of calcium in the diet (0.35 and
0.70%) and showed animals fed at 0.70% had
lower performance. Thus, ensuring adequate
mineral nutrition is fundamental to optimize
animal performance and avoid contamination of
soil and water, resulting from mineral excretion
into the environment via feces and urine.
Fundamentally, minerals have five functions in
animals (Suttle, 2010; Wilson et al., 2016):
1. Structural: composition of organs and
body tissues, such as Ca, P, Mg, F, and Si in
bones and teeth; and P and S in muscle proteins.
Approximately 99% Ca, 80% P, and 70% Mg
are present in the skeleton (AFRC, 1991; Coelho
da Silva, 1995; NRC, 2000);
2. Physiological: constituents of body
tissues and fluids responsible for maintaining
osmotic pressure, acid-base balance, membrane
permeability, and tissue irritability, such as Na,
K, Cl, Ca, and Mg in the blood, brain-spinal
fluid, and gastric juice (Suttle, 2010);
3. Catalytic: catalysts of enzymatic and
hormonal systems, performed primarily by
microminerals. The regulation of lipid
metabolism and synthesis by Cu and
spermatogenesis by Zn are examples (Suttle,
2010);
4. Regulatory: replication, regulation and
cell differentiation, such as the influences of Ca
on signal transduction, and selenocysteine on
gene transcription (Suttle, 2010); and
5. Immune response: in calves, Cu
supplementation increases its hepatic
concentration during respiratory challenges,
positively impacting the immune response when
under stress (Wilson et al., 2016).
These functions can only be performed if
adequate amounts of dietary minerals are
absorbed and retained to maintain growth,
development, and reproduction, as well as
replace minerals lost to milk yield, for example
(Suttle, 2010). The feedstuffs, commonly fed to
beef cattle, can provide these nutrients (Genther
and Hansen, 2014); however, the mineral
concentrations are variable and/or inadequate
(Smart et al., 1981), contributing to low animal
performance and meat quality (Spears and
Kegley, 2002). According to Arthington et al.
(2014), mineral supplementation can be achieved
in several ways: salt blocks fortified with
minerals, injectable microminerals, and protein-
energy supplements fortified with microminerals.
Factorial models are the most common
methods used to predict the mineral dietary
requirements of cattle (ARC, 1980). The dietary
requirement for each mineral is predicted as the
sum of the net mineral required for maintenance
and production divided by the absorption
coefficient of each mineral, in the gastrointestinal
tract of the animal, to allow for the inefficient use
of dietary mineral supply. However, not all
Nutrient Requirements of Zebu and Crossbred Cattle – BR-CORTE
214
mineral absorbed by the animal has function in
the body, being excreted via urine. Thus, using
the absorption coefficient does not seem to be
the most suitable, but the true retention
coefficient, which considers mineral losses in the
urine.
Mineral requirements for cattle are
expressed as amounts per day, per unit of
product, or as a proportion of the dry matter
intake (DMI). Mineral requirements can be
affected by breed or genetic group, sex, age,
health status, feeding, production level, and
environment (Suttle, 2010). Factors inherent to
feeds or diets, such as organic or inorganic
fractions of the mineral, bioavailability, and
chemical form of the element, along with aspects
related to inter-associations (antagonism and
agonism) among minerals can also influence
dietary requirements.
To calculate dietary mineral
requirements, the knowledge about the
bioavailability, or proportion of the mineral
released during digestion of the feed, enabling its
absorption and use, is required. Additionally,
differences exist between feeds produced in
tropical and temperate regions, regarding mineral
release in animals. Hence, dietary requirements
are needed to validate factorial-derived
requirements.
This chapter discusses the dietary
requirements of macrominerals (Ca, P, Mg, Na,
K, and S) and microminerals (Co, Cr, Cu, Fe,
Mn, Mo, Se, and Zn) for maintenance as well as
the true retention coefficient of each mineral,
using a database developed by researches
conducted in Brazil. Also, equations to estimate
the net requirements for weight gain (NRG) will
be presented from a database of animals raised
under tropical conditions. Finally, tables of
dietary macromineral and micromineral
requirements will be presented for beef cattle.
DIETARY MINERAL REQUIREMENTS
Mineral requirements for maintenance
include those needed to support normal
functions when an animal is not growing,
performing work, reproducing, or generating
any product (Underwood, 1981). The body
requires nutrients to maintain normal body
temperature, internal metabolism for
circulation, respiration, and other vital
processes, and to compensate for external losses
and normal animal movements. These
requirements are related to the needs of the
animal whilst meeting the unavoidable losses,
also called endogenous losses or secretions,
from the body (Fontes, 1995).
In Brazil, mineral studies evaluating
endogenous losses and absorption coefficients
in cattle are scarce. Moreover, the few available
studies present variable results, hence, it has not
been possible to establish their precise
recommendations for cattle raised under
Brazilian conditions. The BR-CORTE is an
online software (www.brcorte.com.br/en) that
optimizes the diets for beef cattle under tropical
conditions. In the BR-CORTE (2010), mineral
requirements suggested for maintenance and
their respective absorption coefficients, for both
macrominerals and microminerals, were mainly
based on ARC (1980) and NRC (2000)
recommendations.
The main global councils for nutrient
requirements (ARC, 1980; NRC, 2000; NRC,
2001; CSIRO, 2007) consider that mineral
losses via urine are negligible due to mineral
recycling in the kidneys. However, Costa e
Silva et al. (2015a) verified that some mineral
losses via urine can reach 35% of the mineral
intake and therefore should not be disregarded.
These values enable the true retention
coefficients for all minerals to be considered
rather than their true absorption coefficients.
Thus, in this chapter, dietary mineral
requirements will be calculated from the sum of
their net mineral requirements for maintenance
and NRG divided by their retention coefficient.
DATABASE
Net mineral requirements for maintenance
and true retention coefficient of each mineral
The net mineral requirements for
maintenance (intercept) and the retention
coefficient (slope) of each mineral can be
calculated by linear regression of the association
between mineral retention and intake:
RM = MI – MIf – MIu,
where RM is retained mineral, MI is mineral
intake, MIf is mineral excreted via feces, and
MIu is mineral excreted via urine.
Mineral requirements for beef cattle
215
Then, to estimate the net requirement for
maintenance and retention coefficient of each
mineral, a database was developed from 10
experiments conducted under tropical conditions:
Souza (2010), Gionbelli (2010), Marcondes
(2010), Prados (2012), Zanetti (2014), Sathler
(2015), Costa e Silva et al. (2015a – 2), Prados
(2016), and Zanetti (work in progress). The
minerals intake, and the mineral excretion in the
feces and urine are presented in Tables 9.1
(macrominerals) and 9.2 (microminerals). This
database included 325 observations; 181 bulls,
73 steers, and 71 heifers. The animals were from
the following genetic groups: Nellore (n = 243),
Holstein × Zebu (n = 46), Angus × Nellore (n =
18), and Simmental × Nellore (n = 18). A meta-
analysis was used whereby sex (fixed effect),
genetic group (fixed group), and study (random
effect) were considered classificatory effects to
evaluate differences for each mineral.
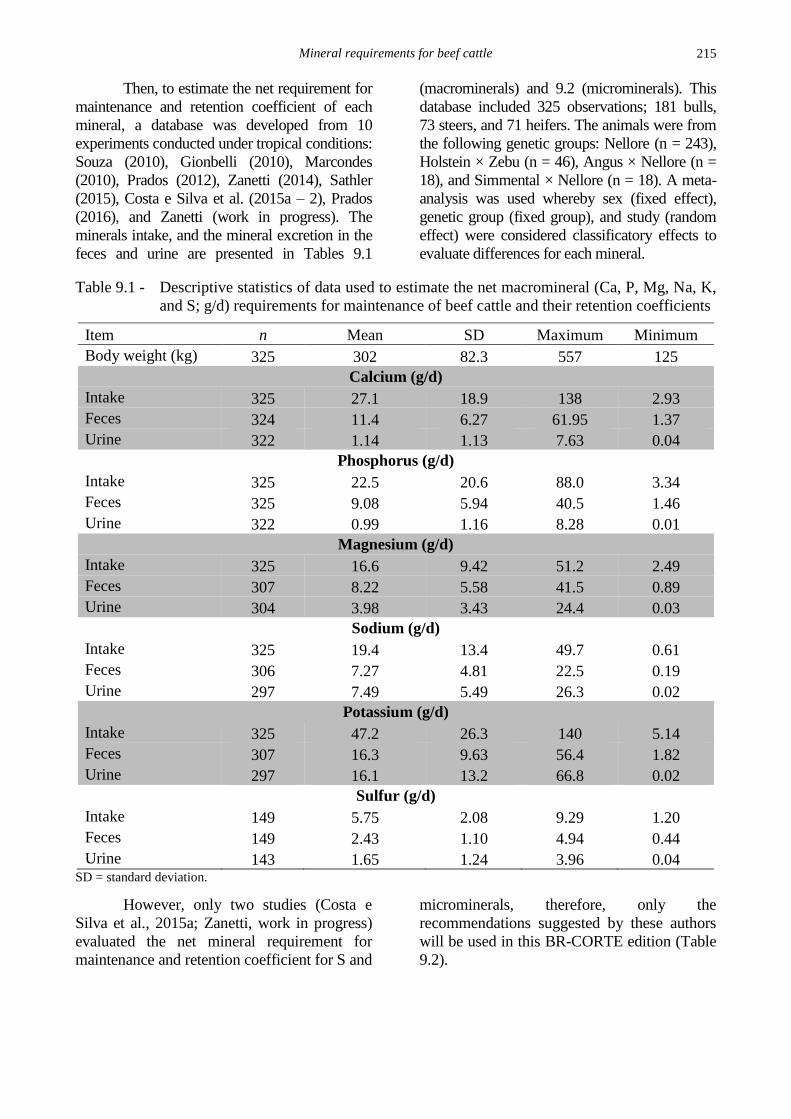
Table 9.1 - Descriptive statistics of data used to estimate the net macromineral (Ca, P, Mg, Na, K,
and S; g/d) requirements for maintenance of beef cattle and their retention coefficients
Item n Mean SD Maximum Minimum
Body weight (kg) 325 302 82.3 557 125
Calcium (g/d)
Intake 325 27.1 18.9 138 2.93
Feces 324 11.4 6.27 61.95 1.37
Urine 322 1.14 1.13 7.63 0.04
Phosphorus (g/d)
Intake 325 22.5 20.6 88.0 3.34
Feces 325 9.08 5.94 40.5 1.46
Urine 322 0.99 1.16 8.28 0.01
Magnesium (g/d)
Intake 325 16.6 9.42 51.2 2.49
Feces 307 8.22 5.58 41.5 0.89
Urine 304 3.98 3.43 24.4 0.03
Sodium (g/d)
Intake 325 19.4 13.4 49.7 0.61
Feces 306 7.27 4.81 22.5 0.19
Urine 297 7.49 5.49 26.3 0.02
Potassium (g/d)
Intake 325 47.2 26.3 140 5.14
Feces 307 16.3 9.63 56.4 1.82
Urine 297 16.1 13.2 66.8 0.02
Sulfur (g/d)
Intake 149 5.75 2.08 9.29 1.20
Feces 149 2.43 1.10 4.94 0.44
Urine 143 1.65 1.24 3.96 0.04 SD = standard deviation.
However, only two studies (Costa e
Silva et al., 2015a; Zanetti, work in progress)
evaluated the net mineral requirement for
maintenance and retention coefficient for S and
microminerals, therefore, only the
recommendations suggested by these authors
will be used in this BR-CORTE edition (Table
9.2).
Nutrient Requirements of Zebu and Crossbred Cattle – BR-CORTE
216
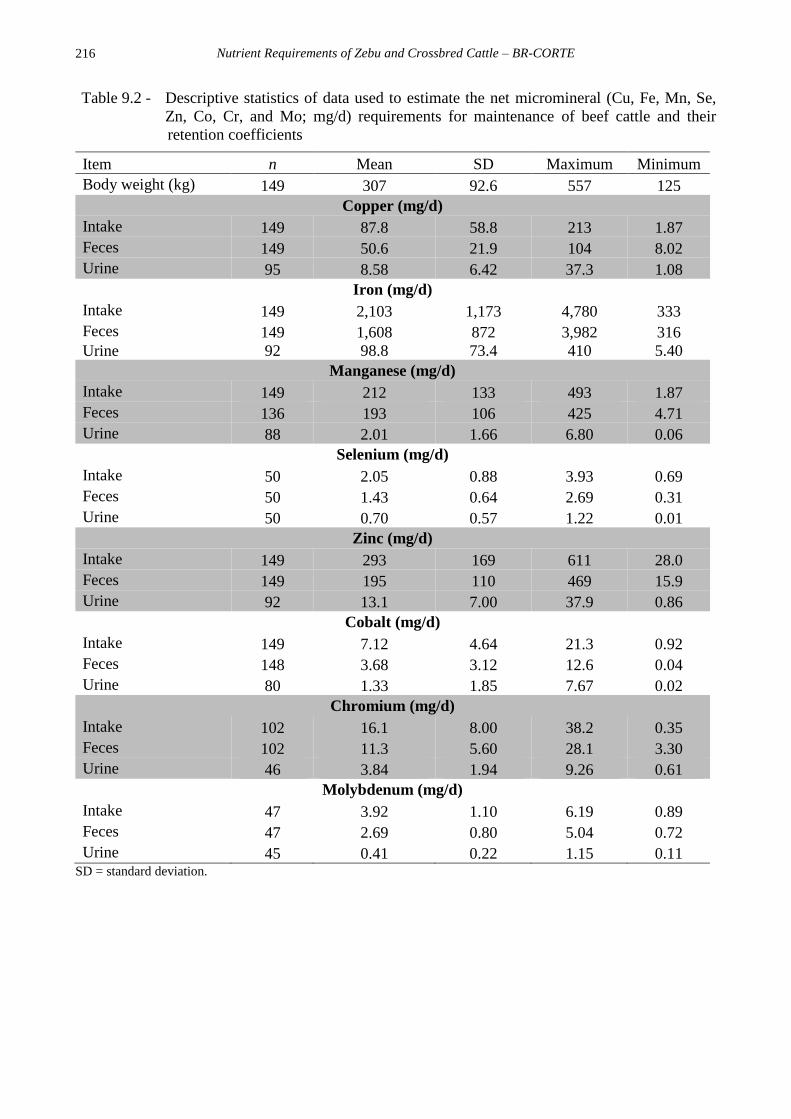
Table 9.2 - Descriptive statistics of data used to estimate the net micromineral (Cu, Fe, Mn, Se,
Zn, Co, Cr, and Mo; mg/d) requirements for maintenance of beef cattle and their
retention coefficients
Item n Mean SD Maximum Minimum
Body weight (kg) 149 307 92.6 557 125
Copper (mg/d)
Intake 149 87.8 58.8 213 1.87
Feces 149 50.6 21.9 104 8.02
Urine 95 8.58 6.42 37.3 1.08
Iron (mg/d)
Intake 149 2,103 1,173 4,780 333
Feces 149 1,608 872 3,982 316
Urine 92 98.8 73.4 410 5.40
Manganese (mg/d)
Intake 149 212 133 493 1.87
Feces 136 193 106 425 4.71
Urine 88 2.01 1.66 6.80 0.06
Selenium (mg/d)
Intake 50 2.05 0.88 3.93 0.69
Feces 50 1.43 0.64 2.69 0.31
Urine 50 0.70 0.57 1.22 0.01
Zinc (mg/d)
Intake 149 293 169 611 28.0
Feces 149 195 110 469 15.9
Urine 92 13.1 7.00 37.9 0.86
Cobalt (mg/d)
Intake 149 7.12 4.64 21.3 0.92
Feces 148 3.68 3.12 12.6 0.04
Urine 80 1.33 1.85 7.67 0.02
Chromium (mg/d)
Intake 102 16.1 8.00 38.2 0.35
Feces 102 11.3 5.60 28.1 3.30
Urine 46 3.84 1.94 9.26 0.61
Molybdenum (mg/d)
Intake 47 3.92 1.10 6.19 0.89
Feces 47 2.69 0.80 5.04 0.72
Urine 45 0.41 0.22 1.15 0.11 SD = standard deviation.
Mineral requirements for beef cattle
217
Net requirement for growth (NRG)
The power model is commonly used to
estimate the NRG (ARC, 1980), according to:
Mi = β0× EBWβ1,
where Mi is the mineral (i) content in the
body (Ca and P (kg); Mg, Na, and K (g)), β0
and β1 are regression parameters and EBW is
the empty body weight (kg). Using the first
derivation of this equation and based on the
empty body gain (EBG), the NRG is
estimated as follows:
NRGi = EBG × (β0 × β1× EBWβ1-1)
where NRGi is the net requirements for
mineral i, EBG is the empty body gain (kg/d)
and β0 and β1 are regression parameters.
Cattle reach a body weight (BW) at
which there is no more mineral deposition in
the body, hence, the dietary requirements
refer only to animal maintenance. Thus, the
point, at which there is no more significant
mineral addition in the EBW, is determined
by the plateau power method, as suggested
by Chizzotti et al. (2009), for Ca and P. For
each mineral, their NRG is considered
equal to zero in the EBW when the plateau
is achieved.
Thus, a database was developed
from 21 studies conducted under tropical
conditions: Paulino (1996), Silva (2001),
Veloso (2001), Paulino (2002), Backes
(2003), Leonel (2003), Martins (2003),
Chizzotti (2007), Véras (2005), Moraes
(2006), Marcondes (2007), Paixão (2008),
Sales (2008), Gionbelli (2010), Souza
(2010), Marcondes (2010), Valente (2012),
Rodrigues (2014), Amaral (2012), Costa e
Silva et al. (2015a), and Zanetti (work in
progress). The data used to estimate
macromineral requirements for gain are
shown in Table 9.3.
In the BR-CORTE (2010), two
methods were suggested to estimate the
NRGCa and NRGP: plateau quadratic and
plateau power methods. In this BR-CORTE
edition, these methods were tested and the
plateau power method presented the best
estimates (lower values of mean square of
error of prediction, MSEP), and consequently
it was chosen as the standard method to
estimate NRGCa and NRGP. For NRGMg,
NRGNa, and NRGK, the power method was
used, but the plateau of deposition of these
minerals was not estimated due to these
minerals are more related to body fluid than
deposition in bones and body tissues.
Due to the lack of literature data on
the NRGS and NRG for microminerals (Co,
Cr, Cu, Fe, Mn, Mo, Se, and Zn), the
recommendations have been based on the
studies of Costa e Silva et al. (2015a) and
Zanetti (work in progress; Table 9.4).
Nutrient Requirements of Zebu and Crossbred Cattle – BR-CORTE
218
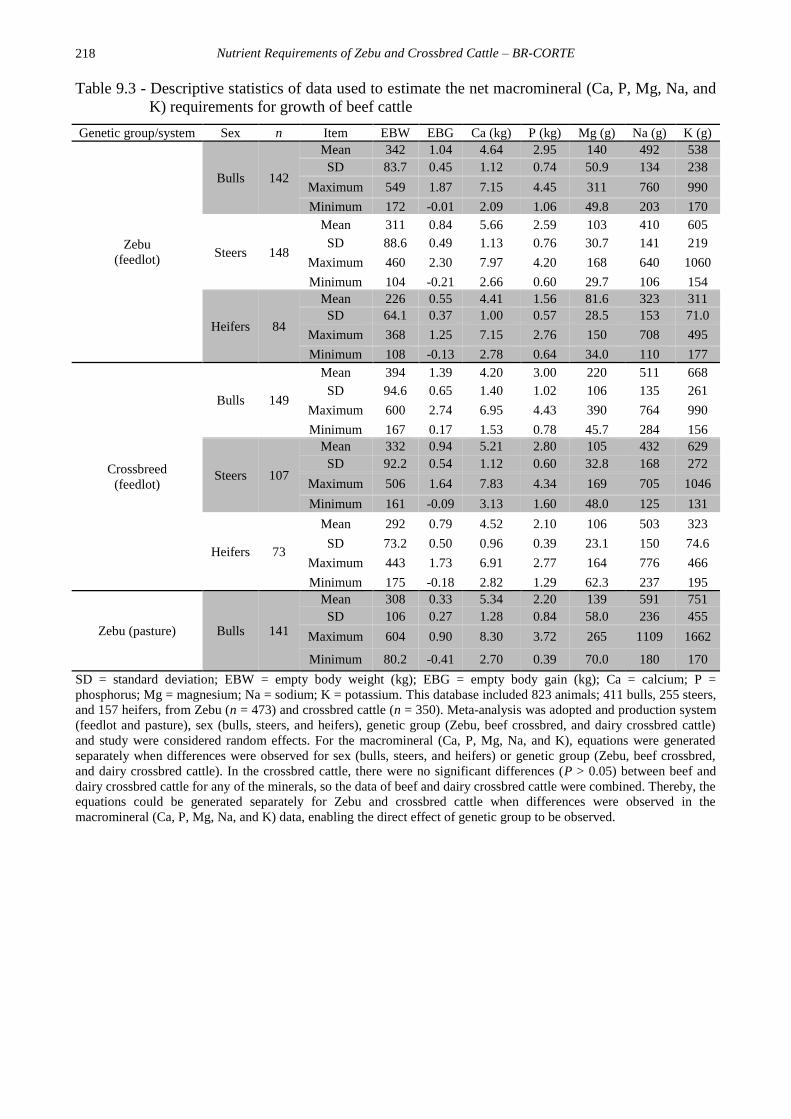
Table 9.3 - Descriptive statistics of data used to estimate the net macromineral (Ca, P, Mg, Na, and
K) requirements for growth of beef cattle
Genetic group/system Sex n Item EBW EBG Ca (kg) P (kg) Mg (g) Na (g) K (g)
Zebu
(feedlot)
Bulls 142
Mean 342 1.04 4.64 2.95 140 492 538
SD 83.7 0.45 1.12 0.74 50.9 134 238
Maximum 549 1.87 7.15 4.45 311 760 990
Minimum 172 -0.01 2.09 1.06 49.8 203 170
Steers 148
Mean 311 0.84 5.66 2.59 103 410 605
SD 88.6 0.49 1.13 0.76 30.7 141 219
Maximum 460 2.30 7.97 4.20 168 640 1060
Minimum 104 -0.21 2.66 0.60 29.7 106 154
Heifers 84
Mean 226 0.55 4.41 1.56 81.6 323 311
SD 64.1 0.37 1.00 0.57 28.5 153 71.0
Maximum 368 1.25 7.15 2.76 150 708 495
Minimum 108 -0.13 2.78 0.64 34.0 110 177
Crossbreed
(feedlot)
Bulls 149
Mean 394 1.39 4.20 3.00 220 511 668
SD 94.6 0.65 1.40 1.02 106 135 261
Maximum 600 2.74 6.95 4.43 390 764 990
Minimum 167 0.17 1.53 0.78 45.7 284 156
Steers 107
Mean 332 0.94 5.21 2.80 105 432 629
SD 92.2 0.54 1.12 0.60 32.8 168 272
Maximum 506 1.64 7.83 4.34 169 705 1046
Minimum 161 -0.09 3.13 1.60 48.0 125 131
Heifers 73
Mean 292 0.79 4.52 2.10 106 503 323
SD 73.2 0.50 0.96 0.39 23.1 150 74.6
Maximum 443 1.73 6.91 2.77 164 776 466
Minimum 175 -0.18 2.82 1.29 62.3 237 195
Zebu (pasture) Bulls 141
Mean 308 0.33 5.34 2.20 139 591 751
SD 106 0.27 1.28 0.84 58.0 236 455
Maximum 604 0.90 8.30 3.72 265 1109 1662
Minimum 80.2 -0.41 2.70 0.39 70.0 180 170
SD = standard deviation; EBW = empty body weight (kg); EBG = empty body gain (kg); Ca = calcium; P =
phosphorus; Mg = magnesium; Na = sodium; K = potassium. This database included 823 animals; 411 bulls, 255 steers,
and 157 heifers, from Zebu (n = 473) and crossbred cattle (n = 350). Meta-analysis was adopted and production system
(feedlot and pasture), sex (bulls, steers, and heifers), genetic group (Zebu, beef crossbred, and dairy crossbred cattle)
and study were considered random effects. For the macromineral (Ca, P, Mg, Na, and K), equations were generated
separately when differences were observed for sex (bulls, steers, and heifers) or genetic group (Zebu, beef crossbred,
and dairy crossbred cattle). In the crossbred cattle, there were no significant differences (P > 0.05) between beef and
dairy crossbred cattle for any of the minerals, so the data of beef and dairy crossbred cattle were combined. Thereby, the
equations could be generated separately for Zebu and crossbred cattle when differences were observed in the
macromineral (Ca, P, Mg, Na, and K) data, enabling the direct effect of genetic group to be observed.

Mineral requirements for beef cattle
219
Table 9.4 - Descriptive statistics of total contents of each mineral used to estimate the net S and
micromineral (Co, Cr, Cu, Fe, Mn, Mo, Se, and Zn) requirements for growth of beef cattle
Item n Mean SD Maximum Minimum
EBW (kg) 133 288 110 549 104
EBG (kg/d) 133 0.74 0.55 1.87 -0.02
Co (mg) 87 1,480 1,683 5,193 12
Cr (mg) 87 1,113 938 3,736 154
Cu (mg) 87 1,519 1,161 4,678 153
Fe (g) 87 31.2 22.2 78.5 7.02
Mn (mg) 87 913 874 2,801 112
Mo (mg) 46 9.05 3.96 19.3 2.81
Se (mg) 50 136 92 328 21
S (g) 87 610 506 2,197 86
Zn (g) 87 20.4 20.2 65.0 2.17 EBW = empty body weight (kg); EBG = empty body gain (kg); SD = standard deviation; Co = cobalt; Cr = chromium;
Cu = copper; Fe = iron; Mn = manganese; Mo = molybdenum; Se = selenium; Zn = zinc.
MACROMINERALS
In the BR-CORTE (2010), a collection of
macromineral (Ca, P, Mg, Na, and K) absorption
coefficient data was based on literature studies
(Table 9.5). However, due to the variability of
data found, mainly in Brazil, the
recommendations remained unchanged or
followed the suggestions proposed by the NRC
(2000) for Ca and P and ARC (1980) for Mg,
Na, and K.
Table 9.5 - True absorption and retention coefficients of macrominerals (Ca, P, Mg, Na, and K)
found in the literature
Source Absorption coefficient (%)1
Ca P Mg Na K
ARC (1980) 68 60 17 91 100
Blaney et al. (1982) 50 - - - -
Field (1983b) - 58 - - -
Ezequiel (1987)2 62 72 52 66 100
AFRC (1991) - 58 a 70 - - -
Coelho da Silva et al. (1991)2 - - 16 76 -
Rosado (1991)2 - - 44 57 44
Valadares Filho et al. (1991)2 - - 57 - -
Boin (1993) – calves2 - 78 - - -
Boin (1993) – steers2 - 58 - - -
Coelho da Silva et al. (1995)2 72 63 38 54 -
NRC (2000) 50 68 - - -
NRC (2001) – forages 30 80 - 81 -
NRC (2001) – concentrate 60 - - 100 -
Araújo et al. (2001)2 59 56 45 94 78
Gionbelli (2010)2,3 55 56 16 19 4
Costa e Silva et al. (2015a)2,3 72 82 98 58 70
BR-CORTE (2016)2,3 57 68 36 37 43 1Values adopted from BR-CORTE (2010) are in bold; 2Experiments conducted in Brazil; 3 True retention coefficient. Ca
= calcium; P = phosphorus; Mg = magnesium; Na = sodium; K = potassium.
However, from the database generated
in this edition, some of the urinary mineral
excretions were low relative to their intake,
such as Ca (4.29%), P (4.33%), Cu (3.82%),
Fe (3.59%), Mn (1.72%), Se (6.47%), and Zn
(4.03%; Table 9.2). Nevertheless, the urinary
Nutrient Requirements of Zebu and Crossbred Cattle – BR-CORTE
220
excretion of other minerals was considered
high, such as Na (39.3%), S (34.8%), Mg
(24.9%), K (30.3%), Co (14.6%), and Cr
(14.6%). Hence, it is impractical to use the
absorption coefficient to convert from the net
to dietary requirements, for all minerals.
Therefore, in this BR-CORTE edition, all
coefficients reported are the true retention
coefficients, directly representing the
association between mineral retention and
intake.
Calcium
Ca is the most abundant mineral found
in animals; in the animal body, approximately
99% is present in bones and teeth and 1% in
soft tissues and body fluids. Ca is involved in
blood coagulation, muscle contraction, nerve
impulse transmission, heart beats regulation,
hormonal secretion, and enzyme activation
and stabilization (Lalman, 2005). Ruminants
have low capacity to excrete Ca absorbed in
excess to their needs, represented by low
urinary Ca excretions, while fecal endogenous
losses are constant, which indicates that
absorption is regulated at an intestinal level
(Field, 1983a). Indeed, Costa e Silva et al.
(2015a) verified that only 3.85% Ca intake
was excreted via urine while 47.9% was
excreted via feces.
Based on Hansard et al. (1954; 1957),
in which Ca radioisotopes were used to
estimate its true bioavailability and
requirements for maintenance, and use for
cattle, the NRC (1984) recommended 15.4
mg/kg BW as the net Ca requirement for
maintenance and, in the absence of further
studies to verify this estimate, the same
recommendation was reported in further
editions (NRC, 2000; NRC, 2001; BCNRM,
2016). Moreover, the ARC (1965) considered
the net Ca requirement for maintenance as 16
mg/kg BW; 0.8 mg/kg BW was related to
urinary losses. The AFRC (1991) suggests an
equation whereby fecal metabolic losses
(FML) are estimated as a function of DMI
(kg/d) and BW of the animals, which has been
adopted by the CSIRO (2007):
FMLCa (g/d) = 0.66 × DMI + 0.74 × BW – 0.74.
In Brazil, few studies have estimated
the net Ca requirements for maintenance.
Ezequiel (1987) suggested 33.2, 43.5, and
26.1 mg/kg BW, using Nellore, Holstein (H),
and ½ H × ½ Zebu cattle, respectively. These
values are above those recommended by the
main global councils (ARC, 1980; NRC,
2000). In the BR-CORTE (2010), only data
from a single study (Gionbelli, 2010) were
used and 26.5 mg/kg BW was the estimated
net Ca requirement for maintenance. Costa e
Silva et al. (2015a), estimated the net Ca
requirement for maintenance as 20 mg/kg
BW, for Nellore cattle. However, from the
meta-analysis of seven studies in the BR-
CORTE database, the net Ca requirement for
maintenance and its retention coefficient were
estimated as 11.7 mg/kg BW and 56.8%,
respectively (Figure 9.1).
Mineral requirements for beef cattle
221
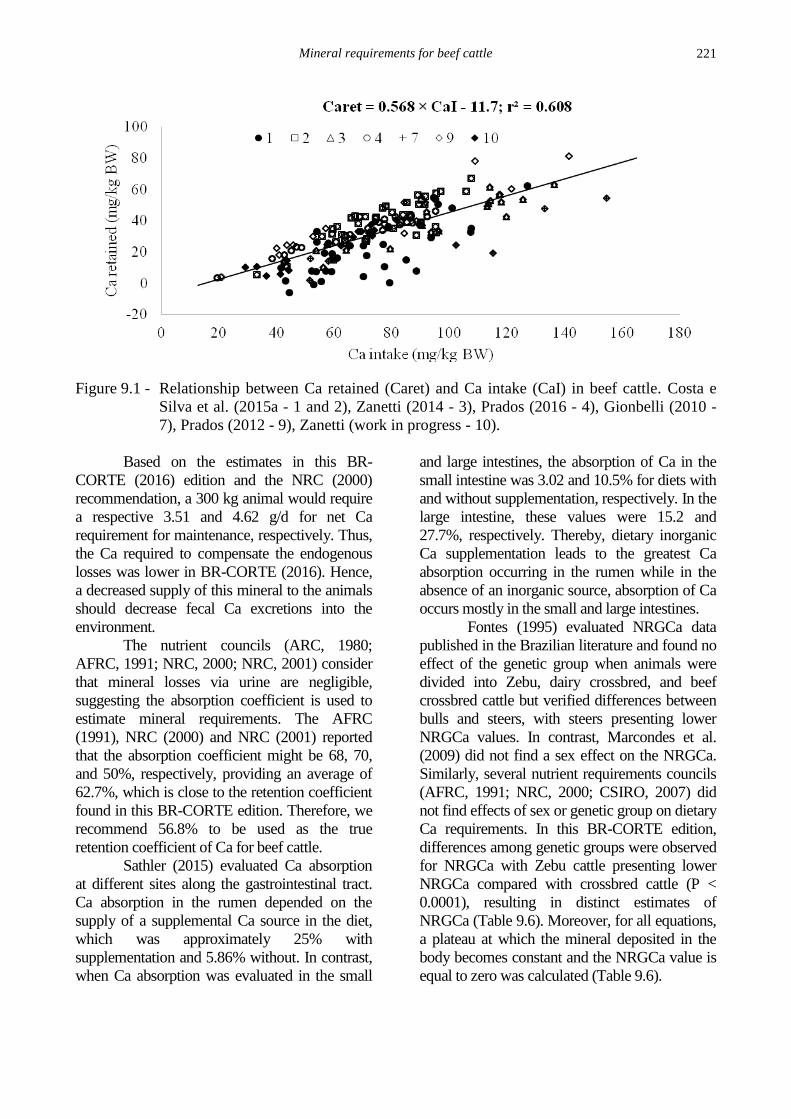
Figure 9.1 - Relationship between Ca retained (Caret) and Ca intake (CaI) in beef cattle. Costa e
Silva et al. (2015a - 1 and 2), Zanetti (2014 - 3), Prados (2016 - 4), Gionbelli (2010 -
7), Prados (2012 - 9), Zanetti (work in progress - 10).
Based on the estimates in this BR-
CORTE (2016) edition and the NRC (2000)
recommendation, a 300 kg animal would require
a respective 3.51 and 4.62 g/d for net Ca
requirement for maintenance, respectively. Thus,
the Ca required to compensate the endogenous
losses was lower in BR-CORTE (2016). Hence,
a decreased supply of this mineral to the animals
should decrease fecal Ca excretions into the
environment.
The nutrient councils (ARC, 1980;
AFRC, 1991; NRC, 2000; NRC, 2001) consider
that mineral losses via urine are negligible,
suggesting the absorption coefficient is used to
estimate mineral requirements. The AFRC
(1991), NRC (2000) and NRC (2001) reported
that the absorption coefficient might be 68, 70,
and 50%, respectively, providing an average of
62.7%, which is close to the retention coefficient
found in this BR-CORTE edition. Therefore, we
recommend 56.8% to be used as the true
retention coefficient of Ca for beef cattle.
Sathler (2015) evaluated Ca absorption
at different sites along the gastrointestinal tract.
Ca absorption in the rumen depended on the
supply of a supplemental Ca source in the diet,
which was approximately 25% with
supplementation and 5.86% without. In contrast,
when Ca absorption was evaluated in the small
and large intestines, the absorption of Ca in the
small intestine was 3.02 and 10.5% for diets with
and without supplementation, respectively. In the
large intestine, these values were 15.2 and
27.7%, respectively. Thereby, dietary inorganic
Ca supplementation leads to the greatest Ca
absorption occurring in the rumen while in the
absence of an inorganic source, absorption of Ca
occurs mostly in the small and large intestines.
Fontes (1995) evaluated NRGCa data
published in the Brazilian literature and found no
effect of the genetic group when animals were
divided into Zebu, dairy crossbred, and beef
crossbred cattle but verified differences between
bulls and steers, with steers presenting lower
NRGCa values. In contrast, Marcondes et al.
(2009) did not find a sex effect on the NRGCa.
Similarly, several nutrient requirements councils
(AFRC, 1991; NRC, 2000; CSIRO, 2007) did
not find effects of sex or genetic group on dietary
Ca requirements. In this BR-CORTE edition,
differences among genetic groups were observed
for NRGCa with Zebu cattle presenting lower
NRGCa compared with crossbred cattle (P <
0.0001), resulting in distinct estimates of
NRGCa (Table 9.6). Moreover, for all equations,
a plateau at which the mineral deposited in the
body becomes constant and the NRGCa value is
equal to zero was calculated (Table 9.6).
Nutrient Requirements of Zebu and Crossbred Cattle – BR-CORTE
222
Table 9.6 - Net Ca requirements for growth and plateau of Ca deposition as a function of genetic
group (Zebu and crossbred cattle)
GG1 Plateau Body content (kg) NRGCa2 (g/d)
Zebu cattle EBW < 462 kg 0.294 × EBW 0.50 EBG × (147 × EBW -0.50)
EBW ≥ 462 kg 6.32 0
Crossbred cattle EBW < 453 kg 0.096 × EBW 0.68 EBG × (66.0 × EBW -0.32)
EBW ≥ 453 kg 6.17 0 1GG = genetic group; 2NRGCa = net Ca requirement for growth; EBW = empty body weight (kg); EBG = empty body gain (kg).
The NRC (2000) estimated the Ca
growth requirements as 7.1 g per 100 g/d of
protein gain in animals. However, Chizzotti et al.
(2009) reported that Ca deposition was poorly
associated with protein deposition. Moreover,
these authors estimated the plateau for protein,
Ca and P deposition occurred at 450, 416 and
416 kg EBW for Nellore × Angus cattle. When
the mineral requirements have been calculated as
a function of protein deposition, they would have
been overestimated for EBW between 416 and
450 kg. In BR-CORTE (2010), a common
plateau was suggested for Ca and P of 412 kg
equivalent EBW (469 kg BW for Nellore, and
496 kg BW for beef crossbred cattle). In this BR-
CORTE edition, the inclusion of data for heavier
animals resulted in better fit, differences among
genetic groups were verified and a plateau for Ca
deposition could be estimated for each genetic
group (Table 9.6). Therefore, we suggest that the
EBW at which there is no more Ca deposition
would be 462 and 453 kg EBW for Zebu and
crossbred cattle, respectively.
In the last few years, dietary mineral
requirements have received considerable
attention, mainly due to the association between
mineral excretion and environment pollution.
Costa e Silva et al. (2015b) decreased the dietary
Ca requirement recommended in the BR-
CORTE (2010) by 43% in Nellore steers and
heifers and verified that this decrease did not
influence animal performance, intake, or nutrient
digestibility. Similarly, Prados et al. (2015)
found that decreasing the recommended dietary
Ca requirements in the BR-CORTE (2010) by
38% in Holstein × Zebu bulls did not affect
animal performance or mineral bone
concentrations. These authors concluded that
lowering the Ca supply could decrease costs in
feedlot operations and Ca excretion into the
environment. Therefore, more studies that
evaluate decrease Ca in cattle diets, to lessen the
excretion of this mineral, should be conducted.
Phosphorus
Phosphorus (P) is the second most
abundant mineral in animals, with 80% found in
bones and teeth. The remaining 20% is
distributed in fluids and tissues (Suttle, 2010).
Phosphorus is required for bone formation and
mineralization and it is important for growth and
differentiation of ribonucleic acids. Additionally,
P is fundamental for osmotic regulation and acid-
base balance, energy use, electron transfer,
phospholipid production, fatty acid transport, and
amino acid and protein production (Suttle, 2010).
Phosphorus is also required by rumen
microorganisms for growth and cell metabolism
(NRC, 2000).
Dietary P that exceeds animal
requirements is not absorbed or, if so, is excreted
in the urine. Urinary P excretion is low in normal
conditions as large amounts of P are recycled by
saliva (ARC, 1965). Thereby, the net P
requirements for maintenance have been
calculated by the sum of fecal and urinary
metabolic P excretions. The ARC (1980) suggest
this value is 12 mg/kg BW. The AFRC (1991)
calculated the net P requirement for maintenance
from an equation based on studies in sheep,
whereby metabolic P losses were calculated as a
function of DMI. Furthermore, the NRC (2000)
considers the net P requirement for maintenance
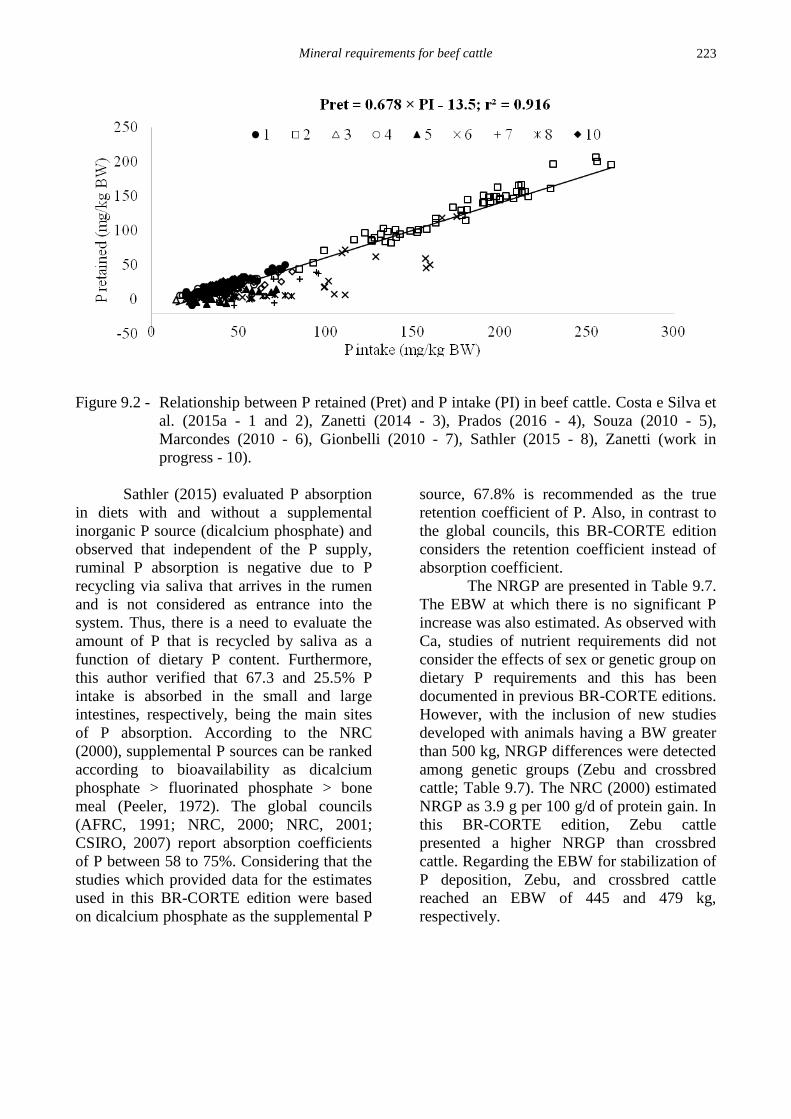
to be 16 mg/kg BW. From the BR-CORTE
database, the net mineral requirement for
maintenance and the true retention coefficient of
P were 13.5 mg/kg BW and 67.8%, respectively
(Figure 9.2).
Mineral requirements for beef cattle
223
Figure 9.2 - Relationship between P retained (Pret) and P intake (PI) in beef cattle. Costa e Silva et
al. (2015a - 1 and 2), Zanetti (2014 - 3), Prados (2016 - 4), Souza (2010 - 5),
Marcondes (2010 - 6), Gionbelli (2010 - 7), Sathler (2015 - 8), Zanetti (work in
progress - 10).
Sathler (2015) evaluated P absorption
in diets with and without a supplemental
inorganic P source (dicalcium phosphate) and
observed that independent of the P supply,
ruminal P absorption is negative due to P
recycling via saliva that arrives in the rumen
and is not considered as entrance into the
system. Thus, there is a need to evaluate the
amount of P that is recycled by saliva as a
function of dietary P content. Furthermore,
this author verified that 67.3 and 25.5% P
intake is absorbed in the small and large
intestines, respectively, being the main sites
of P absorption. According to the NRC
(2000), supplemental P sources can be ranked
according to bioavailability as dicalcium
phosphate > fluorinated phosphate > bone
meal (Peeler, 1972). The global councils
(AFRC, 1991; NRC, 2000; NRC, 2001;
CSIRO, 2007) report absorption coefficients
of P between 58 to 75%. Considering that the
studies which provided data for the estimates
used in this BR-CORTE edition were based
on dicalcium phosphate as the supplemental P
source, 67.8% is recommended as the true
retention coefficient of P. Also, in contrast to
the global councils, this BR-CORTE edition
considers the retention coefficient instead of
absorption coefficient.
The NRGP are presented in Table 9.7.
The EBW at which there is no significant P
increase was also estimated. As observed with
Ca, studies of nutrient requirements did not
consider the effects of sex or genetic group on
dietary P requirements and this has been
documented in previous BR-CORTE editions.
However, with the inclusion of new studies
developed with animals having a BW greater
than 500 kg, NRGP differences were detected
among genetic groups (Zebu and crossbred
cattle; Table 9.7). The NRC (2000) estimated
NRGP as 3.9 g per 100 g/d of protein gain. In
this BR-CORTE edition, Zebu cattle
presented a higher NRGP than crossbred
cattle. Regarding the EBW for stabilization of
P deposition, Zebu, and crossbred cattle
reached an EBW of 445 and 479 kg,
respectively.
Nutrient Requirements of Zebu and Crossbred Cattle – BR-CORTE
224
Table 9.7 - Net P requirements for growth and plateau of P deposition as a function of genetic
group (Zebu and crossbred cattle)
GG Plateau Body content (kg) NRGP2 (g/d)
Zebu cattle EBW < 445 kg 0.05995 × EBW 0.6446 EBG × (38.6 × EBW -0.36)
EBW ≥ 445 kg 3.05 0
Crossbred cattle EBW < 479 kg 0.0339 × EBW 0.7496 EBG × (25.4 × EBW -0.25)
EBW ≥ 479 kg 3.46 0 1GG = genetic group; 2NRGP = net P requirement for growth; EBW = empty body weight (kg); EBG = empty body gain (kg).
Current publications have addressed
the need to decrease environment impacts
caused by cattle P excretions (Vasconcelos et
al., 2007; Costa e Silva et al., 2015b; Prados
et al., 2015). Costa e Silva et al. (2015b)
verified a 20% P decrease in the diet of
Nellore steers and heifers did not impact on
intake, nutrient digestibility or animal
performance. Similarly, Prados et al. (2015)
found that decreasing the BR-CORTE (2010)
recommended dietary P requirements of
crossbred cattle by 14% did not affect animal
performance or P bone concentrations. Also,
Erickson et al. (1999; 2002) did not observe
differences in either steers or calves
performance when fed diets with 71 or 162%
(steer) and 76 or 190% (calves), of the P
requirements recommended by the NRC
(2000). Call et al. (1978) fed beef heifers
during a two-year period with 66 and 174% of
the P requirements recommended by the NRC
(2000) and did not observe differences in
weight gain. This shows that dietary P
requirements can be decreased without
affecting animal performance and that excess
dietary P is excreted in the feces.
Furthermore, mineral nutrition of cattle is not
fully understood and we recommend further
studies in this area to obtain a better
understanding of the mineral metabolism in
cattle.
The ARC (1980) reports that the
association between dietary Ca and P in
ruminants is important because both minerals
participate in bone production and
recommend a Ca:P ratio between 1:1 and 2:1.
An inadequate Ca:P ratio can alter these
maintenance requirements if either mineral is
deficient in the diet. Hansard and Plumlee
(1954) observed an increased metabolic
excretion of P when Ca intake was low and
suggested a portion of the excess P that would
typically be used for bone deposition is
excreted when there is insufficient Ca in the
blood for bone calcification. Costa e Silva et
al. (2015a) found an average Ca:P ratio of
2.15:1 for Nellore cattle from three sexes
raised in a feedlot. Zanetti (work in progress)
found the feeding behavior, nutrient intake
and performance of Nellore bulls during
growing and finishing phases was not affected
by a Ca:P ratio between 0.63 to 1.82.
Furthermore, this author observed that this
low Ca:P ratio decreased their respective fecal
excretion, resulting in less environment
impact.
In this BR-CORTE (2016), the
average ratio between Ca and P was 1.46:1,
which is close to the inferior limit
recommended by the NRC (2000). However,
the NRC (2000) emphasized that a Ca:P ratio
between 1:1 to 7:1 resulted in similar
ruminant performance (Dowe et al., 1957;
Wise et al., 1963).
Magnesium
Approximately 70% of the Mg in the
body is located in bones while the remaining
30% is found in muscle and other soft tissues.
Only 1% Mg is found in extracellular fluids.
In the soft tissues, Mg is involved in energy
metabolism, mainly through the Mg-ATP
complex, maintenance of electric potential
that affects intra and extracellular ionic
gradients, and enzyme activation. The
maintenance of ideal Mg concentrations is
essential for its functions. According to the
ARC (1980), endogenous Mg losses via urine
are disregarded. However, from dataset used
in this BR-CORTE edition, on average,
49.5% of the Mg intake (Table 9.1) was
excreted in feces, while 24% was excreted via
urine. Therefore, urinary excretion of Mg

Mineral requirements for beef cattle
225
should be considered to accurately estimate
its true retention coefficient, which is 35.5 %
(Figure 9.3). In comparison, the ARC (1980)
and NRC (2000, 2001) considered absorption
coefficients with lower mean values of 29.4%
and 17%, respectively. The ARC (1980) and
NRC (2001) suggested 3 mg/kg BW as the
net Mg requirement for maintenance.
However, this BR-CORTE edition shows the
estimated net Mg requirement for
maintenance is 5.9 mg/kg BW (Figure 9.3).
Figure 9.3 - Relationship between Mg retained (Mgret) and Mg intake (MgI) in beef cattle. Costa e
Silva et al. (2015a - 2), Zanetti (2014 - 3), Prados (2016 - 4), Souza (2010 - 5), Marcondes
(2010 - 6), Gionbelli (2010 - 7), Sathler (2015 - 8), Zanetti (work in progress - 10).
In the BR-CORTE (2010), the
NRGMg values were estimated from the
EBG. This BR-CORTE edition adopted the
power model with the aim to standardize
mineral requirements. Thus, the NRGMg
were estimated and the effect of genetic group
was observed (Table 9.8).
Table 9.8 - Net Mg requirements for growth as a function of genetic group (Zebu and crossbred cattle)
GG Body content (g) NRGMg2 (g/d)
Zebu cattle 0.3427 × EBW 1.0113 EBG × (0.3466 × EBW 0.0113)
Crossbred cattle 1.3918 × EBW 0.7614 EBG × (1.0597 × EBW -0.2386) 1GG = genetic group; 2NRGMg = net Mg requirement for growth; EBW = empty body weight (kg); EBG = empty body
gain (kg).
Sodium
Among the ions that contribute to the
osmotic balance, Na presents the greatest
concentration. Moreover, Na contributes to
muscle contraction, nerve impulse transmission,
and nutrient (e.g. glucose) transport. The ARC
(1980) suggests that dietary Na is uncomplexed
and, therefore, is completely absorbed. This
infers that fecal endogenous losses do not apply
to Na. However, the amount of Na in feces and
urine is, on average, 37.5 and 38.6% of the Na
intake, respectively (Table 9.1). Based on this
data, the net Na requirement for maintenance and
the true retention coefficient of Na were
estimated as 6.3 mg/kg BW and 37.1%,
respectively (Figure 9.4). This net Na
requirement for maintenance is lower than that
suggested by the ARC (1980) and the NRC
(2001) of 6.8 and 15 mg/kg BW, respectively.
According to Aitken (1976), the Na losses
Nutrient Requirements of Zebu and Crossbred Cattle – BR-CORTE
226
through saliva are negligible, except for non-
acclimated cattle in tropical conditions, where
the Na loss through saliva is 1.4 g/d for each 100
kg BW. However, there is no data from animals
raised in tropical conditions that evaluate
endogenous losses through the skin and saliva.
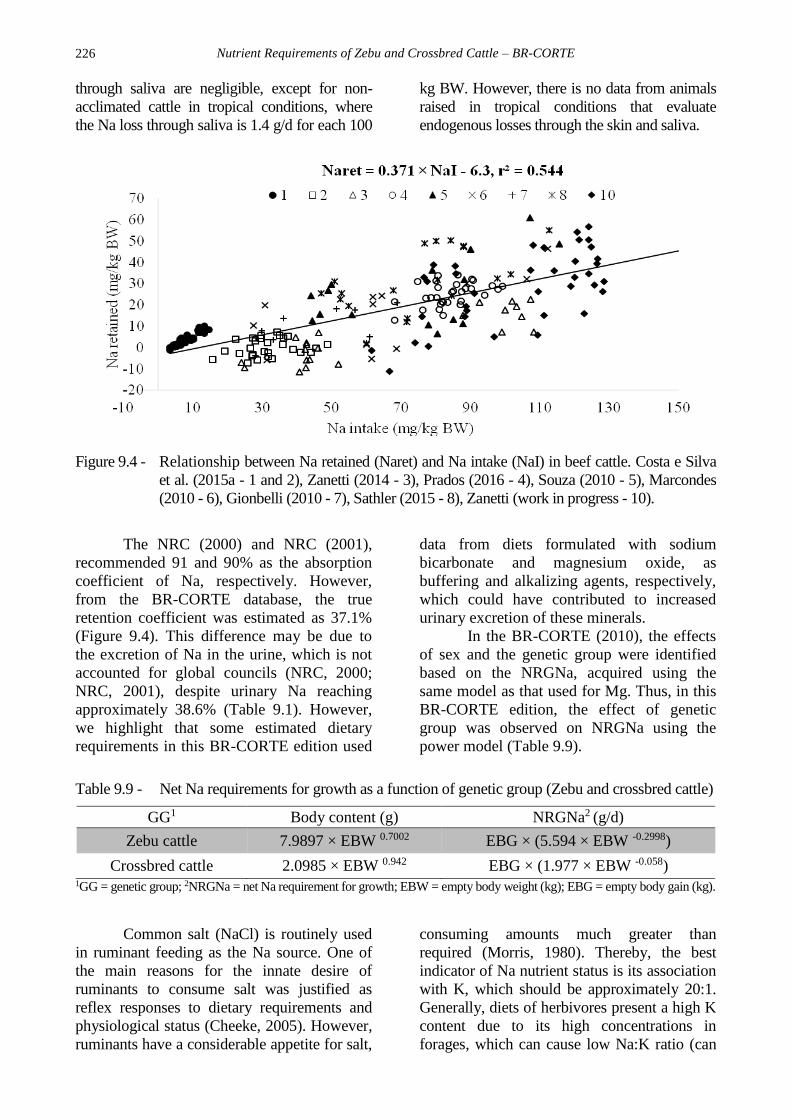
Figure 9.4 - Relationship between Na retained (Naret) and Na intake (NaI) in beef cattle. Costa e Silva
et al. (2015a - 1 and 2), Zanetti (2014 - 3), Prados (2016 - 4), Souza (2010 - 5), Marcondes
(2010 - 6), Gionbelli (2010 - 7), Sathler (2015 - 8), Zanetti (work in progress - 10).
The NRC (2000) and NRC (2001),
recommended 91 and 90% as the absorption
coefficient of Na, respectively. However,
from the BR-CORTE database, the true
retention coefficient was estimated as 37.1%
(Figure 9.4). This difference may be due to
the excretion of Na in the urine, which is not
accounted for global councils (NRC, 2000;
NRC, 2001), despite urinary Na reaching
approximately 38.6% (Table 9.1). However,
we highlight that some estimated dietary
requirements in this BR-CORTE edition used
data from diets formulated with sodium
bicarbonate and magnesium oxide, as
buffering and alkalizing agents, respectively,
which could have contributed to increased
urinary excretion of these minerals.
In the BR-CORTE (2010), the effects
of sex and the genetic group were identified
based on the NRGNa, acquired using the
same model as that used for Mg. Thus, in this
BR-CORTE edition, the effect of genetic
group was observed on NRGNa using the
power model (Table 9.9).
Table 9.9 - Net Na requirements for growth as a function of genetic group (Zebu and crossbred cattle)
GG1 Body content (g) NRGNa2 (g/d)
Zebu cattle 7.9897 × EBW 0.7002 EBG × (5.594 × EBW -0.2998)
Crossbred cattle 2.0985 × EBW 0.942 EBG × (1.977 × EBW -0.058) 1GG = genetic group; 2NRGNa = net Na requirement for growth; EBW = empty body weight (kg); EBG = empty body gain (kg).
Common salt (NaCl) is routinely used
in ruminant feeding as the Na source. One of
the main reasons for the innate desire of
ruminants to consume salt was justified as
reflex responses to dietary requirements and
physiological status (Cheeke, 2005). However,
ruminants have a considerable appetite for salt,
consuming amounts much greater than
required (Morris, 1980). Thereby, the best
indicator of Na nutrient status is its association
with K, which should be approximately 20:1.
Generally, diets of herbivores present a high K
content due to its high concentrations in
forages, which can cause low Na:K ratio (can

Mineral requirements for beef cattle
227
reach a minimum limit of 10:1), contributing
to an enhanced Na appetite in herbivores.
Ruminants show a high capacity to
retain Na in the rumen because Na can be
absorbed into the blood in instances of Na
deficiency, and under these conditions, K
replaces Na in the saliva (Cheeke, 2005). A Na
deficiency can decrease osmotic pressure,
causing body dehydration. Among the
symptoms of Na deficiency are decreased
growth and protein efficiency and energy use
(McDonald et al., 2002). More severe
deficiency causes depraved appetite
(Underwood and Suttle, 1999).
Potassium
Potassium (K) is the third most
abundant ion in the body and the major cation
in intracellular fluid. Along with Na, K has
important functions in osmotic balance,
muscle contraction, nerve impulse
transmission, and several enzymatic systems.
According to the ARC (1980), endogenous K
losses can be divided into estimated fecal (2.6
g/kg DM), urinary (37.5 mg/kg BW), salivary
(0.7g/100 kg BW) and skin (1.1 g/d) losses,
with the net K requirement for maintenance
calculated as the sum of these losses. These
estimates were adopted by the BR-CORTE
(2010). Nevertheless, the data used by the
ARC (1980) were only based on one study
(St. Omer and Roberts, 1967), in which nine
heifers were studied using a 3 × 3 Latin
square experimental design to evaluate
mineral balance. With the aim to standardize
the net mineral requirements for maintenance,
the BR-CORTE dataset estimates the net K
requirement for maintenance as 23.5 mg/kg
BW (Figure 9.5). This value is lower than the
38 mg/kg BW, recommended by the NRC
(2001).
Figure 9.5 - Relationship between K retained (Kret) and K intake (KI) in beef cattle. Costa e Silva
et al. (2015a - 1), Zanetti (2014 - 3), Prados (2016 - 4), Marcondes (2010 - 6),
Gionbelli (2010 - 7), Sathler (2015 - 8).
Ward (1966) reported that K is
absorbed in the rumen, abomasum, and small
and large intestines. Sathler (2015) evaluated
the absorption of K from several sites within
the gastrointestinal tract and observed a
negative absorption of K in the rumen and
large intestine, suggesting the secretion of K
in these sites is greater than its absorption.
The substantial amount of ruminal K was due
to salivary K secretions that were not
quantified as part of the K intake. The
substantial large intestine K secretion that
occurs when Na absorption is high may be
due to the contribution of K, Na and Cl ion
channels to transepithelial flow by coupling
electrochemical gradients (Sathler, 2015).
The ARC (1980) and NRC (2001)
considered the absorption coefficient of K as 100
Nutrient Requirements of Zebu and Crossbred Cattle – BR-CORTE
228
and 90%, respectively. These high values can be
justified by Ward (1966), who indicated that
urine is the main route of K excretion, which
minimizes K reserves. Based on the dataset
developed for this BR-CORTE edition, the fecal
K excretion cannot be neglected and the urinary
K excretion does not represent total daily K
excretion. Indeed, fecal and urinary excretions of
K were, on average, 35.3 and 30.3% of the K
intake (Table 9.1), respectively, which provided
a true retention coefficient of 48.4% (Figure 9.5),
considerably lower than those recommended by
several nutrient requirement councils. This
shows that there is no main route for K excretion.
Therefore, the true retention coefficient was
48.4% (Figure 9.5) and it is the value
recommended for this edition of the BR-
CORTE.
The NRGK, with respect to the effect of
genetic group, resulted in distinct equations for
Zebu and crossbred cattle (Table 9.10). This
NRGK is approximately 17% lower than that
previously reported in the BR-CORTE (2010).
Table 9.10 - Net K requirements for growth as a function of genetic group (Zebu and crossbred cattle)
GG1 Body content (g) NRGK2 (g/d)
Zebu cattle 0.8437 × EBW 1.1216 EBG × (0.9463 × EBW 0.1216)
Crossbred cattle 0.2589 × EBW 1.3200 EBG × (0.3418 × EBW 0.3200) 1GG = genetic group; 2NRGK = net K requirement for growth; EBW = empty body weight (kg); EBG = empty body gain (kg).
Sulfur
Several biomolecules are composed of
S, such as amino acids (methionine, cystine,
and cysteine), hormones (insulin and
oxytocin) and metalloproteins, which are
important in safety animals against Cu, Cd,
and Zn excesses (Suttle, 2010).
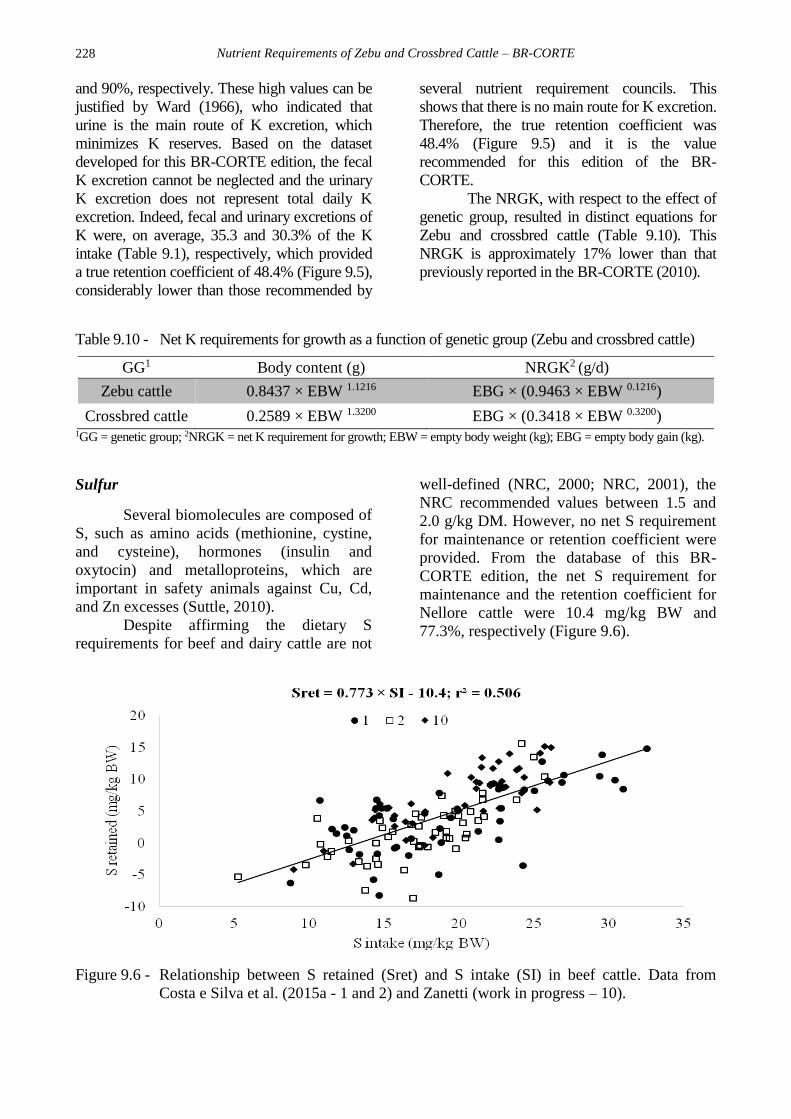
Despite affirming the dietary S
requirements for beef and dairy cattle are not
well-defined (NRC, 2000; NRC, 2001), the
NRC recommended values between 1.5 and
2.0 g/kg DM. However, no net S requirement
for maintenance or retention coefficient were
provided. From the database of this BR-
CORTE edition, the net S requirement for
maintenance and the retention coefficient for
Nellore cattle were 10.4 mg/kg BW and
77.3%, respectively (Figure 9.6).
Figure 9.6 - Relationship between S retained (Sret) and S intake (SI) in beef cattle. Data from
Costa e Silva et al. (2015a - 1 and 2) and Zanetti (work in progress – 10).
Mineral requirements for beef cattle
229
The NRGS is based on the data
available, which is a single study developed by
Costa e Silva et al. (2015a) and estimated based
on the following recommended equation:
NRGS (g/d) = EBG × (0.03 × EBW 0.89),
where EBG is the empty body gain (kg/d) and
EBW is the empty body weight (kg).
In contrast to the other macrominerals,
the exponent of the equation was positive, which
infers that as the animal grows (increases its
EBW), the NRGS increases. When expressed as
DMI (g/kg), the estimated average dietary S
requirement is 1.36 g/kg DM, which
approximates that recommended by the NRC
(2000) but is lower than that recommended by
the NRC (2001) for dairy cows. Costa e Silva et
al. (2015a) reported that these differences could
be due to the NRC (2001) data that was based on
a single study (Bouchard and Conrad, 1973) of
mid-term lactation Holstein cows producing 30
to 37 kg milk/d. However, we highlight the need
for more studies to evaluate dietary S
requirements to improve the accuracy of these
estimates.
Chlorine
In nature and the body, Cl exists
primarily as the chloride anion, Cl-, which is
the main anion present in the extracellular
fluid. This mineral is needed for HCl
production in the gastric juice and amylase
activation. Both Na and Cl- are involved in
the osmotic pressure maintenance, hydric
balance control, and acid-base balance
regulation (Underwood, 1981). To date,
studies on dietary Cl- are primarily concerned
with microorganism control, such as
Escherichia coli in the gastrointestinal tract
(Callaway et al., 2002; Anderson et al., 2005),
rather than evaluating the dietary
requirements of this mineral.
Thus, the net Cl- requirement for
maintenance and its retention coefficient in
beef cattle are not well defined (Underwood
and Suttle, 1999). Chloride deficiency does
not seem probable in practical conditions
(NRC, 2000). Information about endogenous
Cl- losses is not found in the literature;
nevertheless, the ARC (1980) considers that
there is an inevitable urinary loss, as occurs
for Na. According to Aitken (1976), cattle
raised in tropical conditions have a high Cl-
maintenance requirement due to losses via
skin and saliva, suggesting 1.6 g/d for a 500
kg animal raised under tropical conditions i.e.
exposed to approximately 40ºC for 7 h/d and
air humidity of 90%. Such conditions are
particularly probable in grazing animals
raised under these conditions. For salivary
losses, the Cl- recommendation is 0.9 g/d for
each 100 kg BW. Smith et al. (2012) reported
an average Cl- (as NaClO3) absorption in
cattle of 12.6% based on a compilation of
studies that evaluated several chlorides using 36Cl- as an isotopic marker.
The ARC (1980) estimated dietary
requirements of 0.7 g/kg DM in beef cattle
gaining 1.0 kg/d and due to the absence of
studies on this subject in Brazil, we suggest
that this value is adopted.
MICROMINERALS
Due to the lack of studies on dietary
requirements of microminerals in the
literature, the recommendations in this BR-
CORTE edition are only based on two studies
(Costa e Silva et al, 2015a; Zanetti, work in
progress) and their descriptive statistics are
shown in Table 9.4.
Copper
The functions of Cu in the body are
related to lipid metabolism and the activation
of several enzymes, such as cytochrome
oxidase, ceruloplasmin, and superoxide
dismutase. The main reserve organ of Cu is
the liver, where Cu concentrations are
influenced by dietary concentrations. Costa e
Silva et al (2015a) reported an average Cu
intake of 83.5 mg/d, and Cu retention of 25.4
mg/d, which suggests that only 30.4% of the
Cu intake is retained in animals. Nevertheless,
65.7 and 3.8% of the Cu intake was excreted
via feces and urine, respectively. Sathler
(2015), reported that fecal excretion of Cu in
Nellore bulls, varied from 38.2 to 61.2% of
Cu intake, depending on whether
macrominerals and/or microminerals were
included in the diet. However, the urinary Cu
excretion was not measured.

Nutrient Requirements of Zebu and Crossbred Cattle – BR-CORTE
230
In this BR-CORTE edition, the net Cu
requirement for maintenance was 95.6 µg/kg
BW (Figure 9.7). This is higher than the 7.1
µg/kg BW recommended by the ARC (1980);
however, to reach this value, the ARC (1980)
assumed an equation that uses Cu intake,
hepatic Cu loss, and BW changes.
Meanwhile, the Australian system (CSIRO,
2007) adopted 4.0 µg/kg BW as the Cu
requirements for maintenance, based on the
results of a single study (Suttle, 1974) that
evaluated Cu bioavailability in sheep.
The Cu absorption in ruminants is
considered low (<1 to 10%) compared to that
reported for non-ruminants (Underwood and
Suttle, 1999). Calves absorb approximately
70% of their dietary Cu, while adult cattle
absorb 1 to 5% (NRC, 2001). This is
primarily due to the complex interactions that
occur in the rumen (Sathler, 2015). However,
Sathler (2015) found the absorption
coefficient of Cu changing from 38.2 to
61.2%, depending on whether macrominerals
and/or microminerals were included in the
diet; the lowest absorption occurred when
macrominerals but no microminerals were
supplied.
Figure 9.7 - Relationship between Cu retained (Curet) and Cu intake (CuI) in beef cattle. Data from
Costa e Silva et al. (2015a - 1 and 2) and Zanetti (work in progress – 10).
Several factors affect Cu absorption in
ruminants, such as high dietary concentrations
of Mo and S. These minerals interact with Cu,
producing thiomolybdates, an insoluble
complex, rendering Cu unavailable for
absorption (Suttle, 1991). According to the
NRC (2001), dietary Cu requirements varied
from 4 to 15 mg/kg DM depending on dietary
Mo and S concentration. Thus, further studies
that evaluate the interference of Mo and S in Cu
absorption should be conducted to investigate
the Cu amount required to prevent Cu
deficiency in animals. Furthermore, some
studies have shown a decrease in ruminal Cu
absorption when Ca is added to the diet (Dick,
1954; Kirchgessner and Weser, 1965). Sathler
(2015) reported that Cu absorption in the
rumen, small intestine, and large intestine
varied, depending on macromineral and/or
micromineral supplementation.
Costa e Silva et al. (2015a) suggested
that the retention coefficient provides the most
accurate estimate of dietary requirements and
urinary mineral excretion cannot be discarded.
A total 3.8% of Cu intake is excreted via urine
(Costa e Silva et al., 2015a). Thus, the retention
Mineral requirements for beef cattle
231
coefficient is 73.5% (Figure 9.7). This value is
higher than the 6% reported by the ARC (1980),
which was recommended based on studies with
sheep.
The NRGCu was estimated as follows:
NRGCu (mg/d) = EBG × (1.25 × EBW 0.33),
where EBG is the empty body gain (kg/d) and
EBW is the empty body weight (kg, Costa e
Silva et al., 2015a).
The exponent of the equation is
positive, hence as per S, we concluded that as
the animal grows (increases EBW), the NRGCu
increases.
Mullis et al. (2003) estimated dietary Cu
requirements for Angus and Simmental heifers
as 7 mg/kg DM. The NRC (2000) recommends
10 mg/kg DM dietary Cu in beef cattle.
However, these recommendations did not
consider the amount of Cu supplied in the basal
diet but only that used for supplementation.
Costa e Silva et al. (2015a) evaluated the
composition of the basal diet and found that the
average dietary Cu requirements for Nellore
cattle were 9.53 mg/kg DM and this BR-
CORTE edition supports this recommendation
for Zebu cattle. Nevertheless, Prados (2016)
compared diets with (5.85 mg/kg DM) and
without Cu supplementation and found no
difference in animal performance.
Iron
Iron (Fe) is an important component of
various proteins that participate in oxygen use
and transport, such as hemoglobin, which
contains 50% of all the Fe present in animals,
myoglobin, cytochromes, and iron-sulfur
proteins involved in the electron transport chain
(NRC, 2000). In addition, an insufficient Fe
supply can decrease body reserves and Fe
concentrations in the serum and blood
hemoglobin (Thomas, 1970).
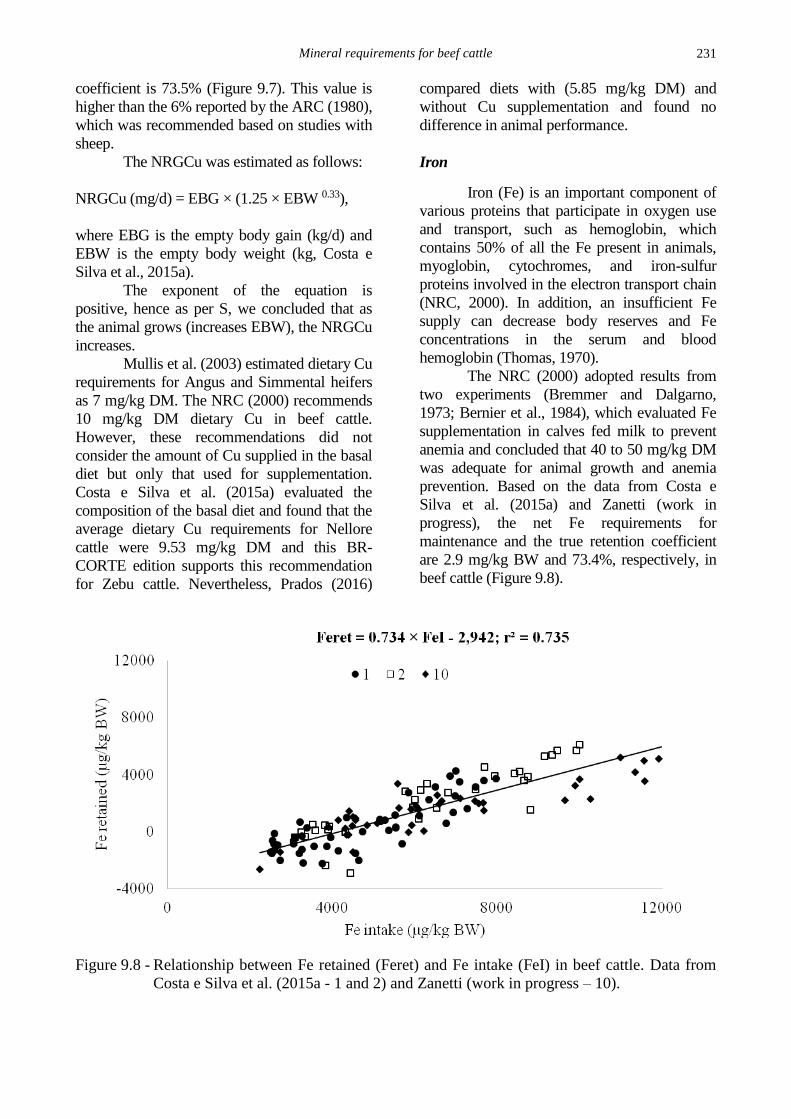
The NRC (2000) adopted results from
two experiments (Bremmer and Dalgarno,
1973; Bernier et al., 1984), which evaluated Fe
supplementation in calves fed milk to prevent
anemia and concluded that 40 to 50 mg/kg DM
was adequate for animal growth and anemia
prevention. Based on the data from Costa e
Silva et al. (2015a) and Zanetti (work in
progress), the net Fe requirements for
maintenance and the true retention coefficient
are 2.9 mg/kg BW and 73.4%, respectively, in
beef cattle (Figure 9.8).
Figure 9.8 - Relationship between Fe retained (Feret) and Fe intake (FeI) in beef cattle. Data from
Costa e Silva et al. (2015a - 1 and 2) and Zanetti (work in progress – 10).
Nutrient Requirements of Zebu and Crossbred Cattle – BR-CORTE
232
For the NRGFe, the equation suggested by
Zanetti (work in progress) was used:
NRGFe (mg/d) = EBG × (10.4 × EBW 0.24),
where EBG is the empty body gain (kg/d) and
EBW is the empty body weight (kg).
Thereby, the NRGFe increases as the
animal grows, although at a slower rate than the
rate of animal growth. However, the NRC (2000)
suggests that as the animal grows, the relative
requirements would decrease, because blood
volume does not increase proportionally to BW.
The NRC (2000) recommended 50
mg/kg DM as the Fe dietary requirement. We
suggest a comparatively higher average of 166
mg/kg DM. However, we highlight that the Fe
concentration in the basal diet was considered in
this BR-CORTE edition, while the NRC (2000)
only evaluated Fe supplementation, discarding
the amount of Fe provided by milk to the
animals.
Manganese
Manganese (Mn) is widely distributed in
the body tissues and fluids and its amount can
vary according to species, age, organ, and in
relation to the presence of other microminerals in
the diet. Some studies (Bentley and Phillips,
1951; Rojas et al, 1965; DiCostanzo et al, 1986)
reported Mn levels were associated with
reproductive aspects but did not affect animal
performance. Schroeder et al. (1966)
recommended 20 to 25 mg/kg DM of Mn for
good skeletal development.
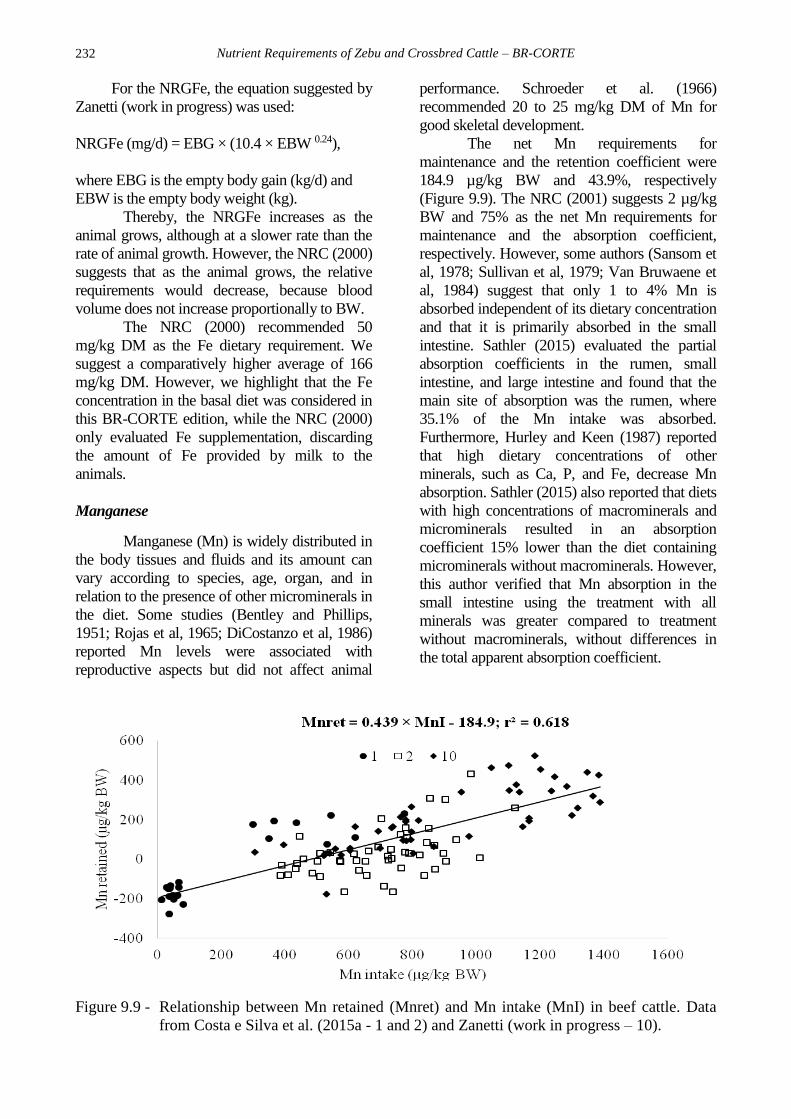
The net Mn requirements for
maintenance and the retention coefficient were
184.9 µg/kg BW and 43.9%, respectively
(Figure 9.9). The NRC (2001) suggests 2 µg/kg
BW and 75% as the net Mn requirements for
maintenance and the absorption coefficient,
respectively. However, some authors (Sansom et
al, 1978; Sullivan et al, 1979; Van Bruwaene et
al, 1984) suggest that only 1 to 4% Mn is
absorbed independent of its dietary concentration
and that it is primarily absorbed in the small
intestine. Sathler (2015) evaluated the partial
absorption coefficients in the rumen, small
intestine, and large intestine and found that the
main site of absorption was the rumen, where
35.1% of the Mn intake was absorbed.
Furthermore, Hurley and Keen (1987) reported
that high dietary concentrations of other
minerals, such as Ca, P, and Fe, decrease Mn
absorption. Sathler (2015) also reported that diets
with high concentrations of macrominerals and
microminerals resulted in an absorption
coefficient 15% lower than the diet containing
microminerals without macrominerals. However,
this author verified that Mn absorption in the
small intestine using the treatment with all
minerals was greater compared to treatment
without macrominerals, without differences in
the total apparent absorption coefficient.
Figure 9.9 - Relationship between Mn retained (Mnret) and Mn intake (MnI) in beef cattle. Data
from Costa e Silva et al. (2015a - 1 and 2) and Zanetti (work in progress – 10).
Mineral requirements for beef cattle
233
For the NRGMn, Costa e Silva et al.
(2015a) suggested the following equation:
NRGMn (mg/d) = EBG × (0.07 × EBW 0.80),
where EBG is the empty body gain (kg/d) and
EBW is empty body weight (kg).
The NRC (2000) recommended 20 mg/kg
DM dietary Mn requirement and this was adopted
by the BR-CORTE (2010). Hartmans (1974) fed
cows 2.5 to 3.5 years of age with diets containing
16 to 21 mg/kg DM and did not observe Mn
deficiency symptoms or improved animal
performance. Possibly, the supply of Mn was
above the requirements for optimal performance.
Costa e Silva et al. (2015a) estimated dietary Mn
requirements as 9.59 mg/kg DM and showed that
similar animal performance was achieved when
10 mg/kg DM was supplied.
Selenium
The Se concentration in animals
depends on the dietary Se amount, its
chemical form and the tissue where the Se
concentration is measured. According to
Behne and Wolters (1983), high Se
concentrations can occur in the liver and
kidneys whereas the highest Se contents are
captured by muscles. In these tissues, Se
activates enzymes involved in the production
of thyroid hormones (T3 and T4), and as an
antioxidant, decreasing hydrogen peroxide
concentrations.
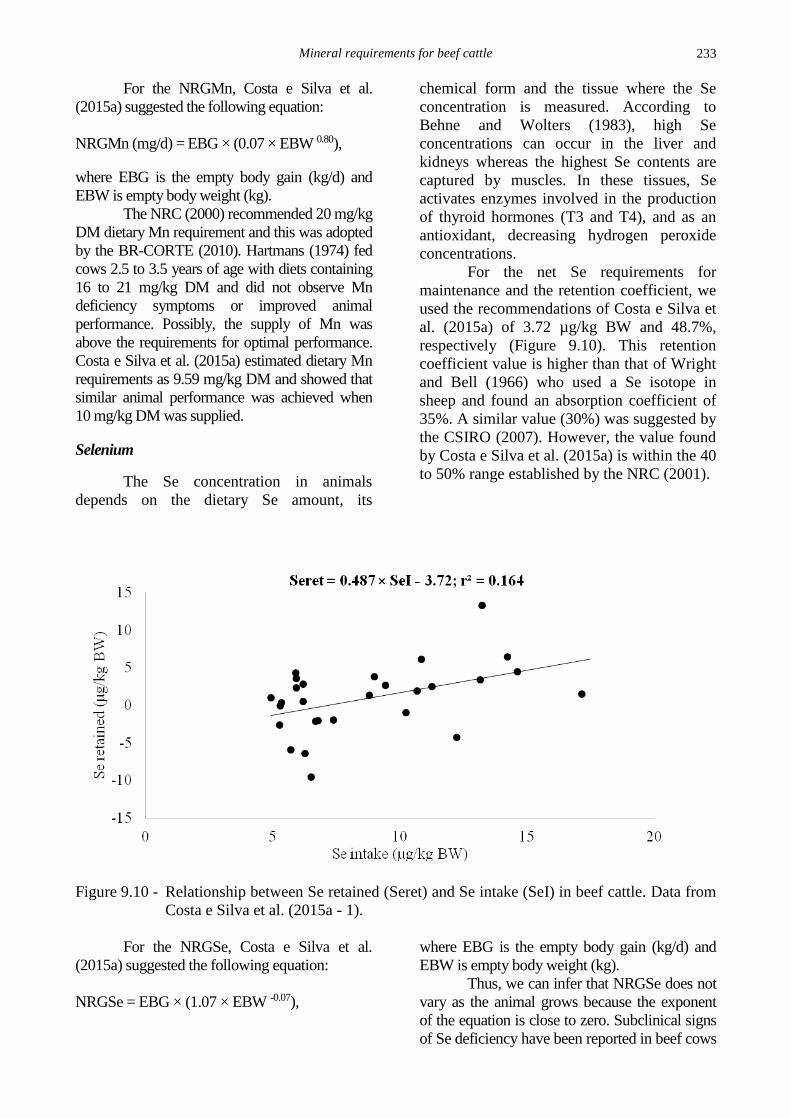
For the net Se requirements for
maintenance and the retention coefficient, we
used the recommendations of Costa e Silva et
al. (2015a) of 3.72 µg/kg BW and 48.7%,
respectively (Figure 9.10). This retention
coefficient value is higher than that of Wright
and Bell (1966) who used a Se isotope in
sheep and found an absorption coefficient of
35%. A similar value (30%) was suggested by
the CSIRO (2007). However, the value found
by Costa e Silva et al. (2015a) is within the 40
to 50% range established by the NRC (2001).
Figure 9.10 - Relationship between Se retained (Seret) and Se intake (SeI) in beef cattle. Data from
Costa e Silva et al. (2015a - 1).
For the NRGSe, Costa e Silva et al.
(2015a) suggested the following equation:
NRGSe = EBG × (1.07 × EBW -0.07),
where EBG is the empty body gain (kg/d) and
EBW is empty body weight (kg).
Thus, we can infer that NRGSe does not
vary as the animal grows because the exponent
of the equation is close to zero. Subclinical signs
of Se deficiency have been reported in beef cows
Nutrient Requirements of Zebu and Crossbred Cattle – BR-CORTE
234
and calves fed forage containing 0.02 to 0.05 mg
Se/kg DM (Morris et al, 1984; Hidiroglou et al,
1985; Spears et al., 1986). In reference to these
studies, the NRC (2000) recommended 0.1
mg/kg DM as the dietary Se requirements.
However, Costa e Silva et al. (2015a) estimated
0.57 mg/kg DM as the dietary Se requirements.
Moreover, this value is higher than that
recommended by the CSIRO (2007) and NRC
(2001) of 0.05 and 0.30 mg/kg DM, respectively.
However, we emphasize that the values
suggested by Costa e Silva et al. (2015a) were
derived from only one experiment, containing 50
Nellore cattle, with BW varying between 121
and 300 kg, and, therefore, we recommend that
further studies are required before the dietary
requirements can be conclusively defined.
Zinc
The functions of Zn in the body are
mainly related to enzymatic action, either as a
cofactor or by enzyme activation.
Additionally, the development and
functionality of the immune system are Zn-
dependent. Some researchers (Delezenne,
1919; Bodansky, 1920; Weitzel et al, 1954)
reported that the Zn concentrations in plants
and animals are often comparable to Fe
contents and are generally greater than other
microminerals (Hambidge et al., 1986). The
NRC (2000) used the average of three studies
(Miller et al 1966; Hansard et al, 1968;
Schwarz and Kirchgessner, 1975) to estimate
the Zn endogenous losses and estimated 12
µg/kg BW as the net Zn requirements for
maintenance. Weigand and Kirchgessner
(1982) estimated the net Zn requirements for
maintenance in lactating cows as 53 µg/kg
BW. Furthermore, the ARC (1980) and the
NRC (2001) estimated the net Zn
requirements for maintenance as 55 µg/kg
BW, while the CSIRO (2007) recommended
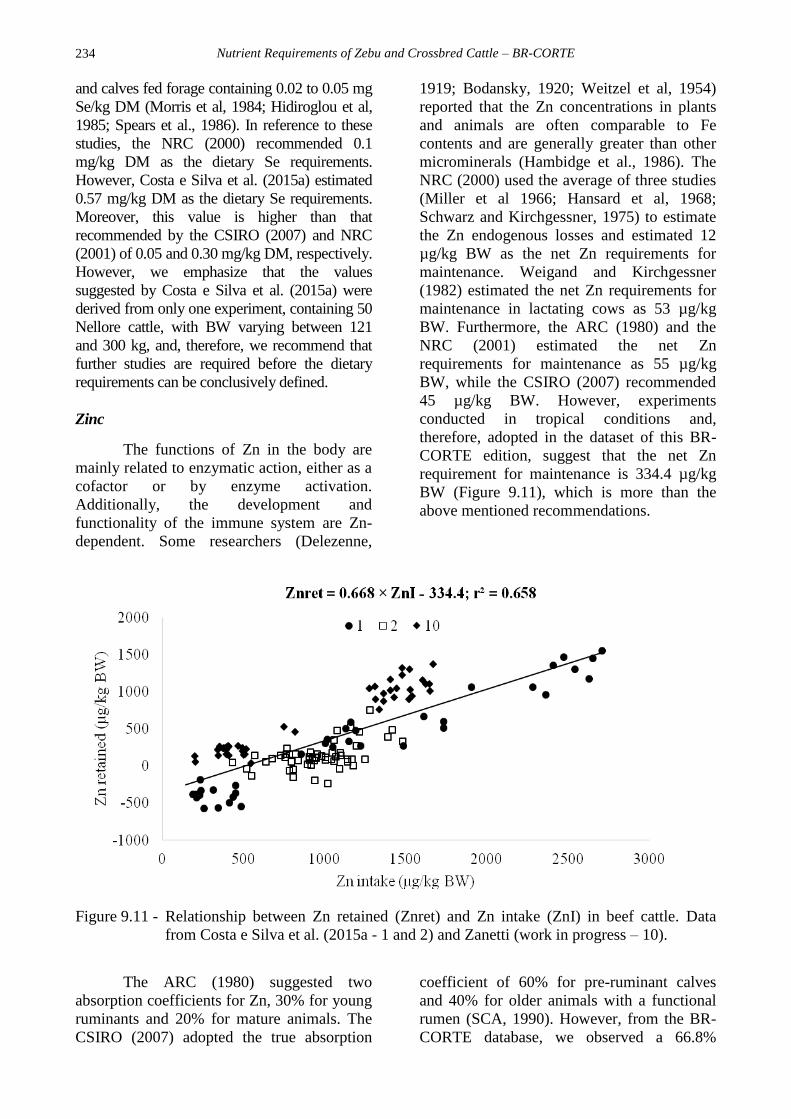
45 µg/kg BW. However, experiments
conducted in tropical conditions and,
therefore, adopted in the dataset of this BR-
CORTE edition, suggest that the net Zn
requirement for maintenance is 334.4 µg/kg
BW (Figure 9.11), which is more than the
above mentioned recommendations.
Figure 9.11 - Relationship between Zn retained (Znret) and Zn intake (ZnI) in beef cattle. Data
from Costa e Silva et al. (2015a - 1 and 2) and Zanetti (work in progress – 10).
The ARC (1980) suggested two
absorption coefficients for Zn, 30% for young
ruminants and 20% for mature animals. The
CSIRO (2007) adopted the true absorption
coefficient of 60% for pre-ruminant calves
and 40% for older animals with a functional
rumen (SCA, 1990). However, from the BR-
CORTE database, we observed a 66.8%
Mineral requirements for beef cattle
235
retention coefficient (Figure 9.11). Miller and
Cragle (1965) suggested that Zn absorption
occurs mainly in the abomasum and small
intestine. However, Sathler (2015) verified
that in diets with and without supplementation
of microminerals, Zn was primarily absorbed
in the rumen (approximately 43.7% of the Zn
intake) and large intestine (an average 27% of
the Zn intake), respectively. Moreover, some
studies (Mills et al, 1967; Perry et al, 1968)
showed that Zn absorption is decreased when
Ca is included in the diet. However, Sathler
(2015) reported no differences in Zn
absorption independent of dietary Ca.
Nevertheless, Prados (2016) verified lower Zn
concentration in the liver when there was Ca
supplementation in the diet that could be due
to the interaction between Ca and Zn,
decreasing Zn absorption.
For the NRGZn, Costa e Silva et al.
(2015a) recommended the following
equation:
NRGZn (mg/d) = EBG × (1.16 × EBW 0.86),
where EBG is the empty body gain (kg/d) and
EBW is empty body weight (kg).
The ARC (1980) suggested that 16 to
31 mg Zn/kg BW can be incorporated into
body tissue for each kilogram of BW gain.
The NRC (2000) considered the dietary Zn
requirements as 30 mg/kg DM, while the
CSIRO (2007) recommended 11.6 mg/kg
DM. However, the NRC (2000)
recommendations were based on two studies
(Perry et al, 1968; Pond and Otjen, 1988) that
evaluated growth response to Zn
supplementation when Zn concentration in the
basal diet was unknown. However, Costa e
Silva et al. (2015a), considered the Zn
composition in the basal diet and reported 61
mg/kg DM as the dietary Zn requirements in
Nellore cattle.
Cobalt
Co is the precursor of vitamin B12,
which is associated with energy metabolism;
although, the amount of dietary Co that is
converted to vitamin B12 varies from 3 to
13% of the Co intake (Smith, 1987).
Furthermore, some studies (Monroe et al,
1952; Looney et al, 1976) found that 84 to
98% of the Co supplied in the diet is found in
the feces approximately 5 to 14 days after
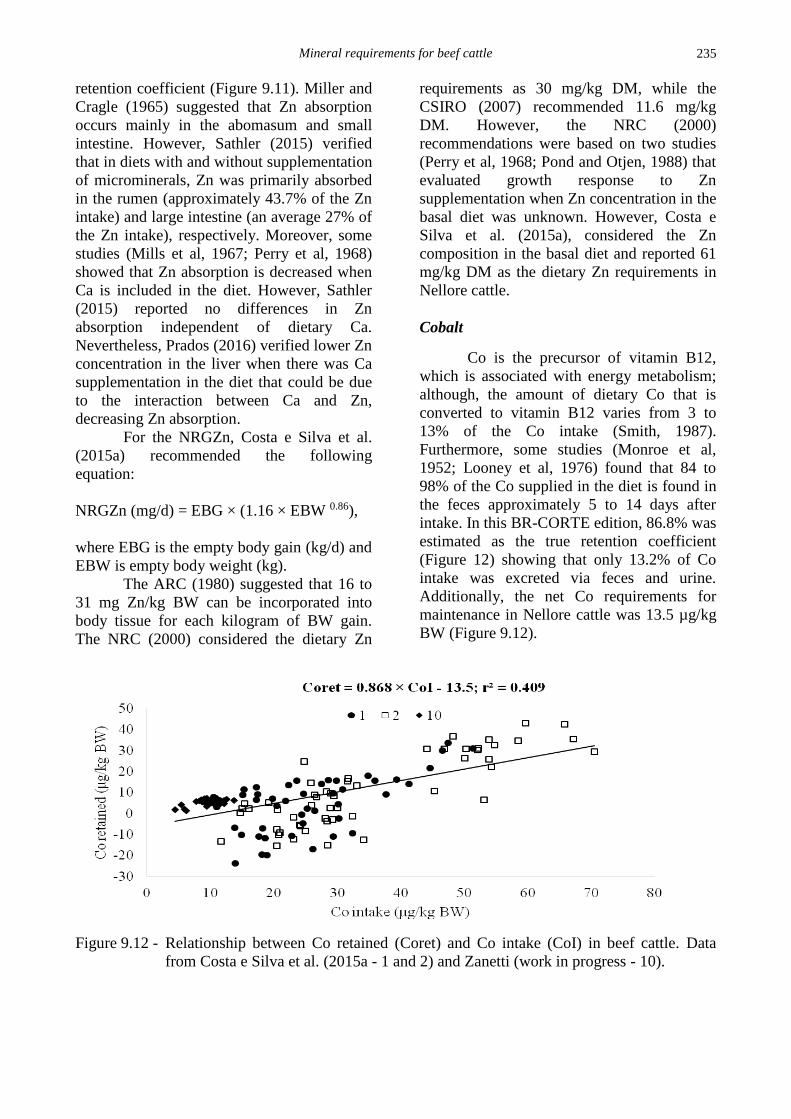
intake. In this BR-CORTE edition, 86.8% was
estimated as the true retention coefficient
(Figure 12) showing that only 13.2% of Co
intake was excreted via feces and urine.
Additionally, the net Co requirements for
maintenance in Nellore cattle was 13.5 µg/kg
BW (Figure 9.12).
Figure 9.12 - Relationship between Co retained (Coret) and Co intake (CoI) in beef cattle. Data
from Costa e Silva et al. (2015a - 1 and 2) and Zanetti (work in progress - 10).
Nutrient Requirements of Zebu and Crossbred Cattle – BR-CORTE
236
NRGCo was based on the equation
suggested by Zanetti (work in progress):
NRGCo (mg/d)= EBG × (0.045 × EBW -0.023),
where EBG is the empty body gain (kg/d) and
EBW is empty body weight (kg).
Thus, the NRGCo decreases as the
EBW increases, although at an almost
constant rate. Smith (1987) suggested 0.11
mg/kg DM as the dietary Co requirements,
and this was adopted by the NRC (2000 and
2001). The BCNRM (2016) recommends 0.15
mg/kg DM. However, Smith (1987) did not
consider the absorption coefficient or the Co
content of the feeds. Thus, in this BR-CORTE
edition, the dietary Co requirements was 0.63
mg/kg DM, considering the retention
coefficient and the Co contents of the feeds.
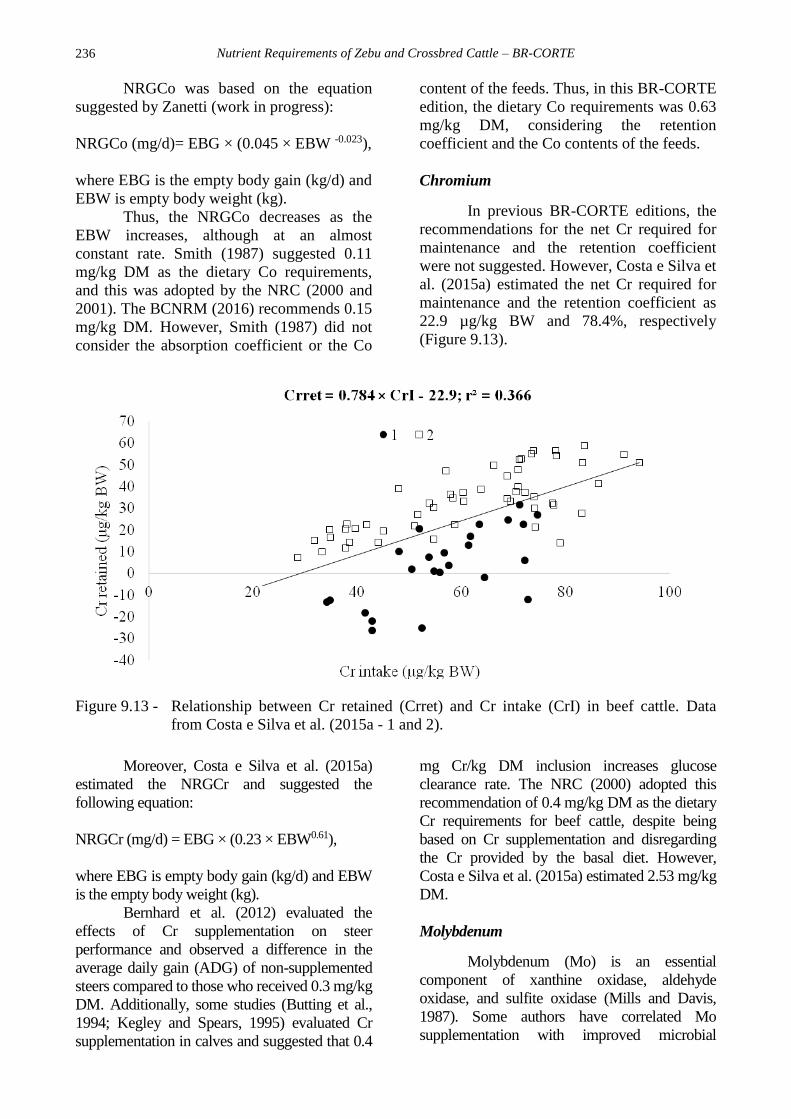
Chromium
In previous BR-CORTE editions, the
recommendations for the net Cr required for
maintenance and the retention coefficient
were not suggested. However, Costa e Silva et
al. (2015a) estimated the net Cr required for
maintenance and the retention coefficient as
22.9 µg/kg BW and 78.4%, respectively
(Figure 9.13).
Figure 9.13 - Relationship between Cr retained (Crret) and Cr intake (CrI) in beef cattle. Data
from Costa e Silva et al. (2015a - 1 and 2).
Moreover, Costa e Silva et al. (2015a)
estimated the NRGCr and suggested the
following equation:
NRGCr (mg/d) = EBG × (0.23 × EBW0.61),
where EBG is empty body gain (kg/d) and EBW
is the empty body weight (kg).
Bernhard et al. (2012) evaluated the
effects of Cr supplementation on steer
performance and observed a difference in the
average daily gain (ADG) of non-supplemented
steers compared to those who received 0.3 mg/kg
DM. Additionally, some studies (Butting et al.,
1994; Kegley and Spears, 1995) evaluated Cr
supplementation in calves and suggested that 0.4
mg Cr/kg DM inclusion increases glucose
clearance rate. The NRC (2000) adopted this
recommendation of 0.4 mg/kg DM as the dietary
Cr requirements for beef cattle, despite being
based on Cr supplementation and disregarding
the Cr provided by the basal diet. However,
Costa e Silva et al. (2015a) estimated 2.53 mg/kg
DM.
Molybdenum
Molybdenum (Mo) is an essential
component of xanthine oxidase, aldehyde
oxidase, and sulfite oxidase (Mills and Davis,
1987). Some authors have correlated Mo
supplementation with improved microbial
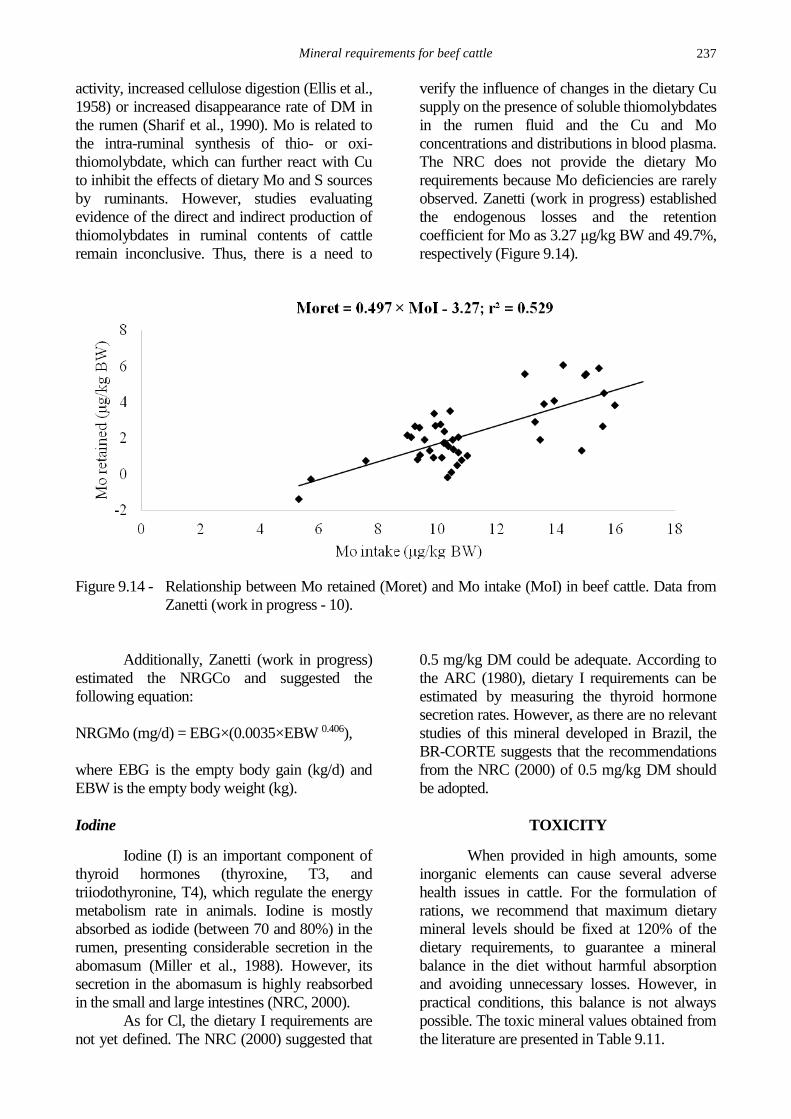
Mineral requirements for beef cattle
237
activity, increased cellulose digestion (Ellis et al.,
1958) or increased disappearance rate of DM in
the rumen (Sharif et al., 1990). Mo is related to
the intra-ruminal synthesis of thio- or oxi-
thiomolybdate, which can further react with Cu
to inhibit the effects of dietary Mo and S sources
by ruminants. However, studies evaluating
evidence of the direct and indirect production of
thiomolybdates in ruminal contents of cattle
remain inconclusive. Thus, there is a need to
verify the influence of changes in the dietary Cu
supply on the presence of soluble thiomolybdates
in the rumen fluid and the Cu and Mo
concentrations and distributions in blood plasma.
The NRC does not provide the dietary Mo
requirements because Mo deficiencies are rarely
observed. Zanetti (work in progress) established
the endogenous losses and the retention
coefficient for Mo as 3.27 μg/kg BW and 49.7%,
respectively (Figure 9.14).
Figure 9.14 - Relationship between Mo retained (Moret) and Mo intake (MoI) in beef cattle. Data from
Zanetti (work in progress - 10).
Additionally, Zanetti (work in progress)
estimated the NRGCo and suggested the
following equation:
NRGMo (mg/d) = EBG×(0.0035×EBW 0.406),
where EBG is the empty body gain (kg/d) and
EBW is the empty body weight (kg).
Iodine
Iodine (I) is an important component of
thyroid hormones (thyroxine, T3, and
triiodothyronine, T4), which regulate the energy
metabolism rate in animals. Iodine is mostly
absorbed as iodide (between 70 and 80%) in the
rumen, presenting considerable secretion in the
abomasum (Miller et al., 1988). However, its
secretion in the abomasum is highly reabsorbed
in the small and large intestines (NRC, 2000).
As for Cl, the dietary I requirements are
not yet defined. The NRC (2000) suggested that
0.5 mg/kg DM could be adequate. According to
the ARC (1980), dietary I requirements can be
estimated by measuring the thyroid hormone
secretion rates. However, as there are no relevant
studies of this mineral developed in Brazil, the
BR-CORTE suggests that the recommendations
from the NRC (2000) of 0.5 mg/kg DM should
be adopted.
TOXICITY
When provided in high amounts, some
inorganic elements can cause several adverse
health issues in cattle. For the formulation of
rations, we recommend that maximum dietary
mineral levels should be fixed at 120% of the
dietary requirements, to guarantee a mineral
balance in the diet without harmful absorption
and avoiding unnecessary losses. However, in
practical conditions, this balance is not always
possible. The toxic mineral values obtained from
the literature are presented in Table 9.11.

Nutrient Requirements of Zebu and Crossbred Cattle – BR-CORTE
238
Table 9.11 - Maximum tolerable concentrations of minerals for beef cattle
Macromineral Toxic level Micromineral Toxic level
Calcium1 44 g/kg DM Copper4 40 mg/kg DM
Potassium4 20 g/kg DM Manganese2 1,000 mg/kg DM
Magnesium1 4 g/kg DM Selenium3 5.0 mg/kg DM
Sodium1 65 g/kg DM Zinc3 500 mg/kg DM
Sulfur1 4 g/kg DM Cobalt4 25 mg/kg BW
Chromium2 50 mg/kg DM
Fluoride3 30 mg/kg DM
Iodine2 50 mg/kg DM
Molybdenium3 6.0 mg/kg DM
Vanadium2 30 mg/kg DM 1NRC (2000); 2McDonald et al. (2002); 3McDowell (1992); 4 BCNRM (2016).
TABLES OF MINERAL REQUIREMENTS
FOR BEEF CATTLE
Based on the estimated net requirements
for maintenance and NRG as well as the true
retention coefficient, dietary mineral
requirements were calculated (Table 9.12). The
recommended dietary mineral requirements are
shown in Tables 9.13 and 9.14.
Table 9.12 - Summary of the recommendations for calculation of dietary macromineral and
micromineral requirements for beef cattle
Mineral Net requirements for
maintenance
True retention
coefficient Net requirements for growth (NRG)1
EBW in
the plateau
mg/kg body weight % g/d kg
Ca 11.7 56.8
Zebu cattle: NRGCa = EBG × (147 × EBW-0.50) 462
Crossbred cattle: NRGCa = EBG × (66.0 × EBW-0.32) 453
P 13.5 67.8
Zebu cattle: NRGP = EBG × (38.6 × EBW-0.36) 445
Crossbred cattle: NRGP = EBG × (25.4 × EBW-0.25) 479
Mg 5.9 35.5
Zebu cattle: NRGMg = EBG × (0.3466 × EBW0.0113) -
Crossbred cattle: NRGMg = EBG × (1.0597 × EBW-0.2386) -
Na 6.3 37.1
Zebu cattle: NRGNa = EBG × (5.594 × EBW -0.2998) -
Crossbred cattle: NRGNa = EBG × (1.977 × EBW -0.058) -
K 23.5 48.4
Zebu cattle: NRGK = EBG × (0.9463 × EBW 0.1216) -
Crossbred cattle: NRGK = EBG × (0.3418 × EBW 0.3200) -
S 10.4 77.3 NRGS = EBG × (0.03 × EBW 0.8900) -
Mineral µg/kg body weight % mg/d
Cu 95.6 73.5 NRGCu = EBG × (1.25 × EBW 0.33) -
Co 13.5 86.8 NRGCo = EBG × (0.045 × EBW -0.023) -
Cr 22.9 78.4 NRGCr = EBG × (0.23 × EBW 0.61) -
Fe 2,942 73.4 NRGFe = EBG × (14.0 × EBW 0.24) -
Mn 184.9 43.9 NRGMn = EBG × (0.07 × EBW 0.80) -
Mo 3.27 49.7 NRGMo = EBG × (0.0035 × EBW 0.41) -
Se 3.72 48.7 NRGSe = EBG × (1.07 × EBW-0.07) -
Zn 334.4 66.8 NRGZn = EBG × (1.16 × EBW 0.86) - 1EBG = empty body gain (kg/d); EBW = empty body weight (kg); NRG = net mineral requirement for growth.
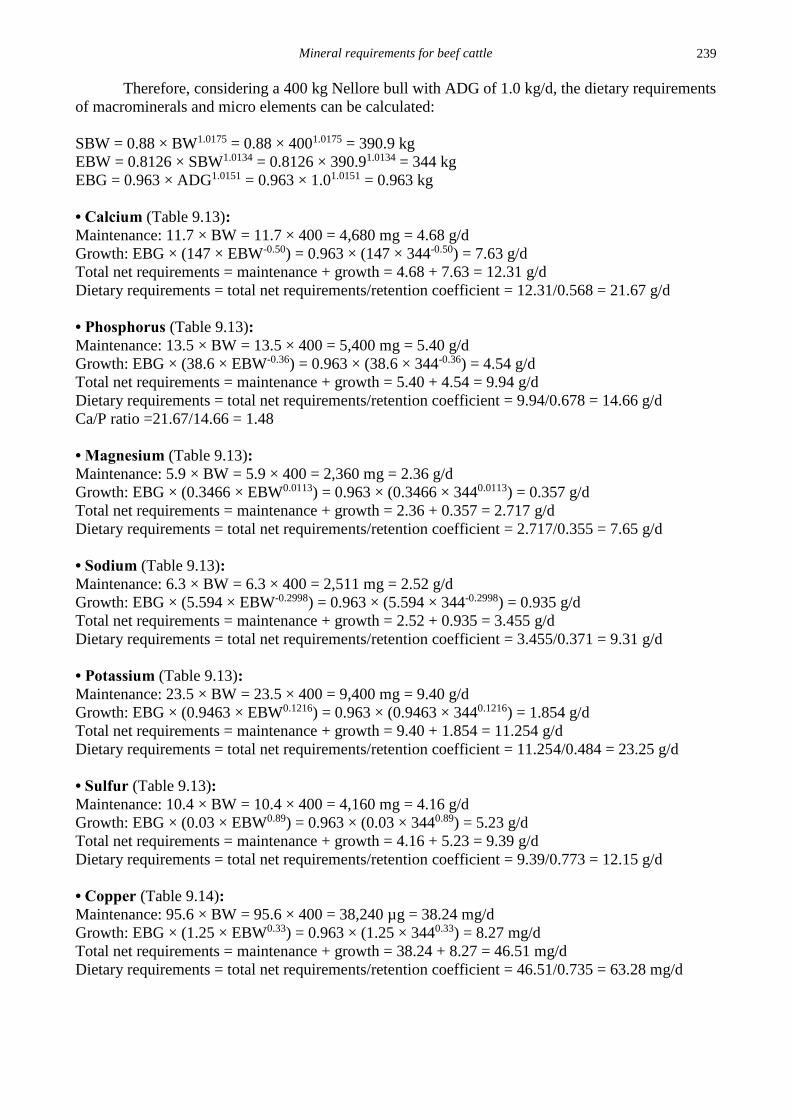
Mineral requirements for beef cattle
239
Therefore, considering a 400 kg Nellore bull with ADG of 1.0 kg/d, the dietary requirements
of macrominerals and micro elements can be calculated:
SBW = 0.88 × BW1.0175 = 0.88 × 4001.0175 = 390.9 kg
EBW = 0.8126 × SBW1.0134 = 0.8126 × 390.91.0134 = 344 kg
EBG = 0.963 × ADG1.0151 = 0.963 × 1.01.0151 = 0.963 kg
• Calcium (Table 9.13):
Maintenance: 11.7 × BW = 11.7 × 400 = 4,680 mg = 4.68 g/d
Growth: EBG × (147 × EBW-0.50) = 0.963 × (147 × 344-0.50) = 7.63 g/d
Total net requirements = maintenance + growth = 4.68 + 7.63 = 12.31 g/d
Dietary requirements = total net requirements/retention coefficient = 12.31/0.568 = 21.67 g/d
• Phosphorus (Table 9.13):
Maintenance: 13.5 × BW = 13.5 × 400 = 5,400 mg = 5.40 g/d
Growth: EBG × (38.6 × EBW-0.36) = 0.963 × (38.6 × 344-0.36) = 4.54 g/d
Total net requirements = maintenance + growth = 5.40 + 4.54 = 9.94 g/d
Dietary requirements = total net requirements/retention coefficient = 9.94/0.678 = 14.66 g/d
Ca/P ratio =21.67/14.66 = 1.48
• Magnesium (Table 9.13):
Maintenance: 5.9 × BW = 5.9 × 400 = 2,360 mg = 2.36 g/d
Growth: EBG × (0.3466 × EBW0.0113) = 0.963 × (0.3466 × 3440.0113) = 0.357 g/d
Total net requirements = maintenance + growth = 2.36 + 0.357 = 2.717 g/d
Dietary requirements = total net requirements/retention coefficient = 2.717/0.355 = 7.65 g/d
• Sodium (Table 9.13):
Maintenance: 6.3 × BW = 6.3 × 400 = 2,511 mg = 2.52 g/d
Growth: EBG × (5.594 × EBW-0.2998) = 0.963 × (5.594 × 344-0.2998) = 0.935 g/d
Total net requirements = maintenance + growth = 2.52 + 0.935 = 3.455 g/d
Dietary requirements = total net requirements/retention coefficient = 3.455/0.371 = 9.31 g/d
• Potassium (Table 9.13):
Maintenance: 23.5 × BW = 23.5 × 400 = 9,400 mg = 9.40 g/d
Growth: EBG × (0.9463 × EBW0.1216) = 0.963 × (0.9463 × 3440.1216) = 1.854 g/d
Total net requirements = maintenance + growth = 9.40 + 1.854 = 11.254 g/d
Dietary requirements = total net requirements/retention coefficient = 11.254/0.484 = 23.25 g/d
• Sulfur (Table 9.13):
Maintenance: 10.4 × BW = 10.4 × 400 = 4,160 mg = 4.16 g/d
Growth: EBG × (0.03 × EBW0.89) = 0.963 × (0.03 × 3440.89) = 5.23 g/d
Total net requirements = maintenance + growth = 4.16 + 5.23 = 9.39 g/d
Dietary requirements = total net requirements/retention coefficient = 9.39/0.773 = 12.15 g/d
• Copper (Table 9.14):
Maintenance: 95.6 × BW = 95.6 × 400 = 38,240 µg = 38.24 mg/d
Growth: EBG × (1.25 × EBW0.33) = 0.963 × (1.25 × 3440.33) = 8.27 mg/d
Total net requirements = maintenance + growth = 38.24 + 8.27 = 46.51 mg/d
Dietary requirements = total net requirements/retention coefficient = 46.51/0.735 = 63.28 mg/d
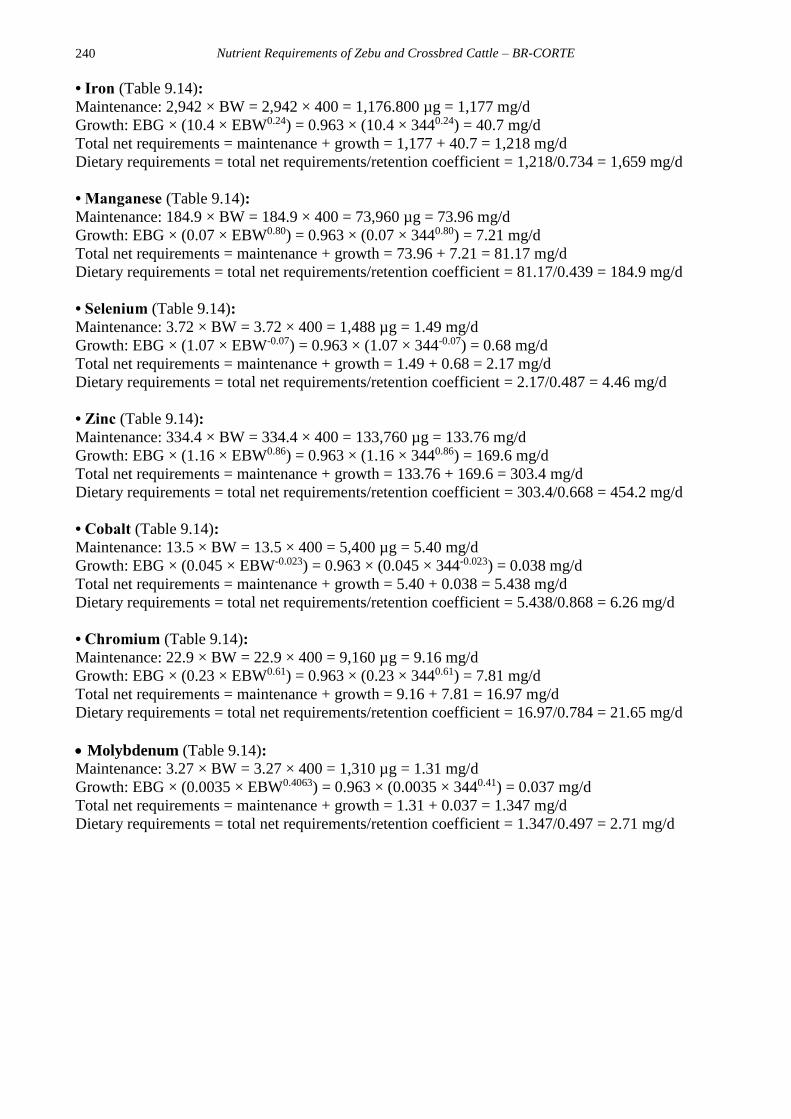
Nutrient Requirements of Zebu and Crossbred Cattle – BR-CORTE
240
• Iron (Table 9.14):
Maintenance: 2,942 × BW = 2,942 × 400 = 1,176.800 µg = 1,177 mg/d
Growth: EBG × (10.4 × EBW0.24) = 0.963 × (10.4 × 3440.24) = 40.7 mg/d
Total net requirements = maintenance + growth = 1,177 + 40.7 = 1,218 mg/d
Dietary requirements = total net requirements/retention coefficient = 1,218/0.734 = 1,659 mg/d
• Manganese (Table 9.14):
Maintenance: 184.9 × BW = 184.9 × 400 = 73,960 µg = 73.96 mg/d
Growth: EBG × (0.07 × EBW0.80) = 0.963 × (0.07 × 3440.80) = 7.21 mg/d
Total net requirements = maintenance + growth = 73.96 + 7.21 = 81.17 mg/d
Dietary requirements = total net requirements/retention coefficient = 81.17/0.439 = 184.9 mg/d
• Selenium (Table 9.14):
Maintenance: 3.72 × BW = 3.72 × 400 = 1,488 µg = 1.49 mg/d
Growth: EBG × (1.07 × EBW-0.07) = 0.963 × (1.07 × 344-0.07) = 0.68 mg/d
Total net requirements = maintenance + growth = 1.49 + 0.68 = 2.17 mg/d
Dietary requirements = total net requirements/retention coefficient = 2.17/0.487 = 4.46 mg/d
• Zinc (Table 9.14):
Maintenance: 334.4 × BW = 334.4 × 400 = 133,760 µg = 133.76 mg/d
Growth: EBG × (1.16 × EBW0.86) = 0.963 × (1.16 × 3440.86) = 169.6 mg/d
Total net requirements = maintenance + growth = 133.76 + 169.6 = 303.4 mg/d
Dietary requirements = total net requirements/retention coefficient = 303.4/0.668 = 454.2 mg/d
• Cobalt (Table 9.14):
Maintenance: 13.5 × BW = 13.5 × 400 = 5,400 µg = 5.40 mg/d
Growth: EBG × (0.045 × EBW-0.023) = 0.963 × (0.045 × 344-0.023) = 0.038 mg/d
Total net requirements = maintenance + growth = 5.40 + 0.038 = 5.438 mg/d
Dietary requirements = total net requirements/retention coefficient = 5.438/0.868 = 6.26 mg/d
• Chromium (Table 9.14):
Maintenance: 22.9 × BW = 22.9 × 400 = 9,160 µg = 9.16 mg/d
Growth: EBG × (0.23 × EBW0.61) = 0.963 × (0.23 × 3440.61) = 7.81 mg/d
Total net requirements = maintenance + growth = 9.16 + 7.81 = 16.97 mg/d
Dietary requirements = total net requirements/retention coefficient = 16.97/0.784 = 21.65 mg/d
Molybdenum (Table 9.14):
Maintenance: 3.27 × BW = 3.27 × 400 = 1,310 µg = 1.31 mg/d
Growth: EBG × (0.0035 × EBW0.4063) = 0.963 × (0.0035 × 3440.41) = 0.037 mg/d
Total net requirements = maintenance + growth = 1.31 + 0.037 = 1.347 mg/d
Dietary requirements = total net requirements/retention coefficient = 1.347/0.497 = 2.71 mg/d
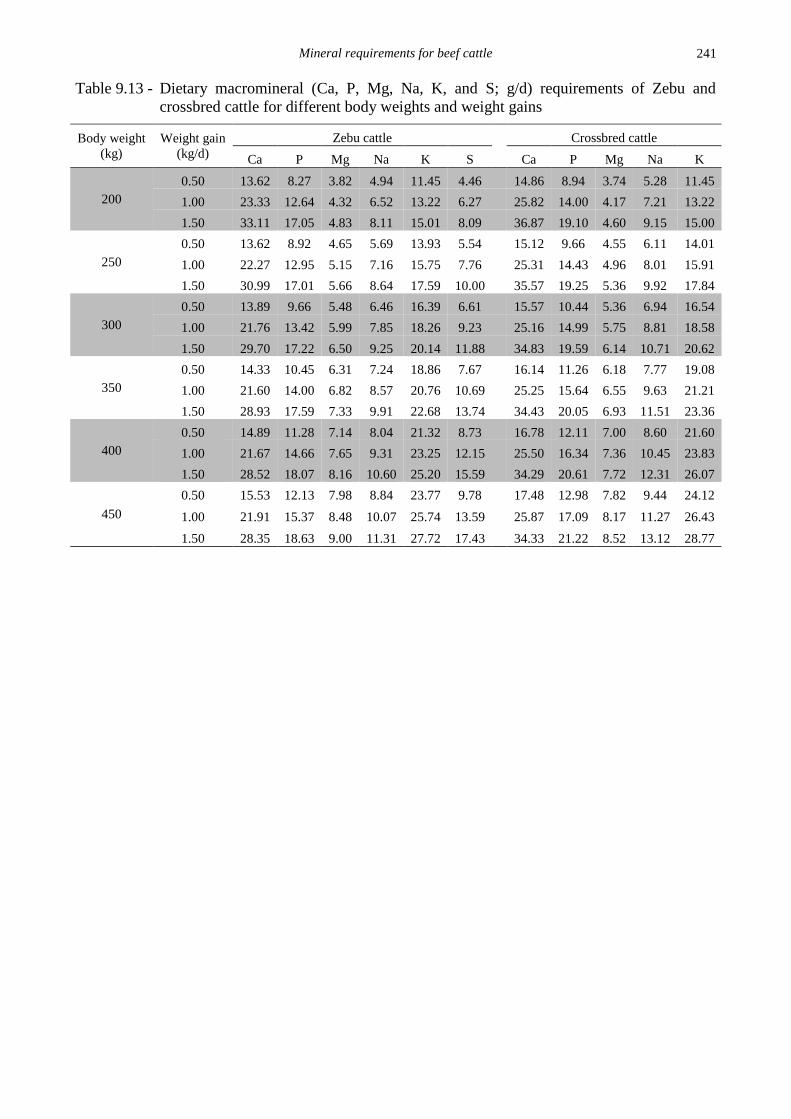
Mineral requirements for beef cattle
241
Table 9.13 - Dietary macromineral (Ca, P, Mg, Na, K, and S; g/d) requirements of Zebu and
crossbred cattle for different body weights and weight gains
Body weight
(kg)
Weight gain
(kg/d)
Zebu cattle Crossbred cattle
Ca P Mg Na K S Ca P Mg Na K
200
0.50 13.62 8.27 3.82 4.94 11.45 4.46 14.86 8.94 3.74 5.28 11.45
1.00 23.33 12.64 4.32 6.52 13.22 6.27 25.82 14.00 4.17 7.21 13.22
1.50 33.11 17.05 4.83 8.11 15.01 8.09 36.87 19.10 4.60 9.15 15.00
250
0.50 13.62 8.92 4.65 5.69 13.93 5.54 15.12 9.66 4.55 6.11 14.01
1.00 22.27 12.95 5.15 7.16 15.75 7.76 25.31 14.43 4.96 8.01 15.91
1.50 30.99 17.01 5.66 8.64 17.59 10.00 35.57 19.25 5.36 9.92 17.84
300
0.50 13.89 9.66 5.48 6.46 16.39 6.61 15.57 10.44 5.36 6.94 16.54
1.00 21.76 13.42 5.99 7.85 18.26 9.23 25.16 14.99 5.75 8.81 18.58
1.50 29.70 17.22 6.50 9.25 20.14 11.88 34.83 19.59 6.14 10.71 20.62
350
0.50 14.33 10.45 6.31 7.24 18.86 7.67 16.14 11.26 6.18 7.77 19.08
1.00 21.60 14.00 6.82 8.57 20.76 10.69 25.25 15.64 6.55 9.63 21.21
1.50 28.93 17.59 7.33 9.91 22.68 13.74 34.43 20.05 6.93 11.51 23.36
400
0.50 14.89 11.28 7.14 8.04 21.32 8.73 16.78 12.11 7.00 8.60 21.60
1.00 21.67 14.66 7.65 9.31 23.25 12.15 25.50 16.34 7.36 10.45 23.83
1.50 28.52 18.07 8.16 10.60 25.20 15.59 34.29 20.61 7.72 12.31 26.07
450
0.50 15.53 12.13 7.98 8.84 23.77 9.78 17.48 12.98 7.82 9.44 24.12
1.00 21.91 15.37 8.48 10.07 25.74 13.59 25.87 17.09 8.17 11.27 26.43
1.50 28.35 18.63 9.00 11.31 27.72 17.43 34.33 21.22 8.52 13.12 28.77
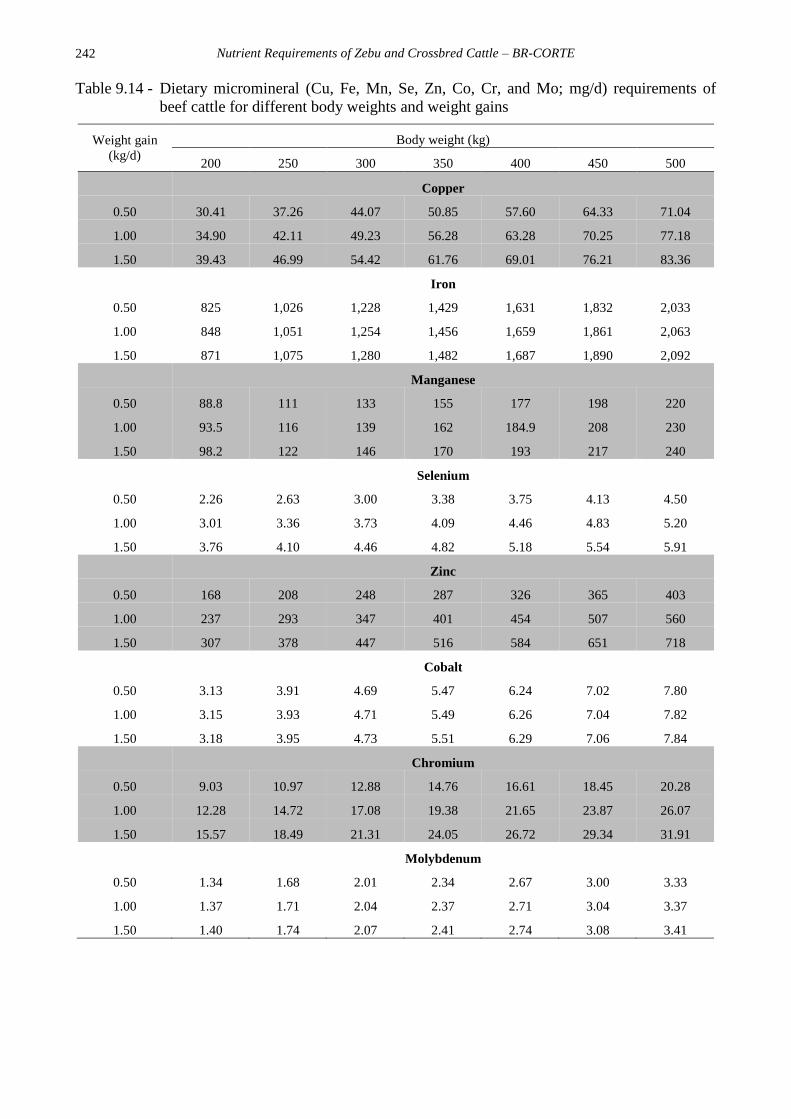
Nutrient Requirements of Zebu and Crossbred Cattle – BR-CORTE
242
Table 9.14 - Dietary micromineral (Cu, Fe, Mn, Se, Zn, Co, Cr, and Mo; mg/d) requirements of
beef cattle for different body weights and weight gains
Weight gain
(kg/d)
Body weight (kg)
200 250 300 350 400 450 500
Copper
0.50 30.41 37.26 44.07 50.85 57.60 64.33 71.04
1.00 34.90 42.11 49.23 56.28 63.28 70.25 77.18
1.50 39.43 46.99 54.42 61.76 69.01 76.21 83.36
Iron
0.50 825 1,026 1,228 1,429 1,631 1,832 2,033
1.00 848 1,051 1,254 1,456 1,659 1,861 2,063
1.50 871 1,075 1,280 1,482 1,687 1,890 2,092
Manganese
0.50 88.8 111 133 155 177 198 220
1.00 93.5 116 139 162 184.9 208 230
1.50 98.2 122 146 170 193 217 240
Selenium
0.50 2.26 2.63 3.00 3.38 3.75 4.13 4.50
1.00 3.01 3.36 3.73 4.09 4.46 4.83 5.20
1.50 3.76 4.10 4.46 4.82 5.18 5.54 5.91
Zinc
0.50 168 208 248 287 326 365 403
1.00 237 293 347 401 454 507 560
1.50 307 378 447 516 584 651 718
Cobalt
0.50 3.13 3.91 4.69 5.47 6.24 7.02 7.80
1.00 3.15 3.93 4.71 5.49 6.26 7.04 7.82
1.50 3.18 3.95 4.73 5.51 6.29 7.06 7.84
Chromium
0.50 9.03 10.97 12.88 14.76 16.61 18.45 20.28
1.00 12.28 14.72 17.08 19.38 21.65 23.87 26.07
1.50 15.57 18.49 21.31 24.05 26.72 29.34 31.91
Molybdenum
0.50 1.34 1.68 2.01 2.34 2.67 3.00 3.33
1.00 1.37 1.71 2.04 2.37 2.71 3.04 3.37
1.50 1.40 1.74 2.07 2.41 2.74 3.08 3.41

Mineral requirements for beef cattle
243
REFERENCES
Aitken, F. C. Tech. Comm. Commonw. Bur.
Nutr. No 26. 1976.
AFRC – Agricultural and Food Research
Council. A reappraisal of the calcium and
phosphorus requirements of sheep and
cattle (Report 6). Nutrition Abstracts and
Reviews, 61:573-612. 1991.
Amaral, P. M. 2012. Desempenho e exigências
nutricionais de bovinos mestiços Holandês
x zebu alimentados com dietas contendo
diferentes níveis de proteína. Dissertação
(Mestrado em Zootecnia) – Universidade
Federal de Viçosa, Viçosa, MG. 84p. 2012.
Anderson, R. C.; Carr, M. A.; Miller, R. K.;
King, D. A.; Carstens, G. E.; Genovese, K.
J.; Callaway, T. R.; Edrington, T. S.; Jung,
Y. S.; Mcreynolds, J. L.; Hume, M. E.;
Beier, R. C.; Elder, R. O.; Nisbet, D. J.
Effects of experimental chlorate
preparations as feed and water supplements
on Escherichia coli colonization and
contamination of beef cattle carcasses.
Food Microbiology 22:439–447. 2005.
Araújo, G. G. L.; Coelho Da Silva, J. F.;
Valadares Filho, S. C.; Campos O. F.;
Signoretti, R. D.; Turco, S. H. N. Consumo
e absorção aparente de macroelementos
minerais, em bezerros alimentados com
dietas contendo diferentes níveis de
volumoso. Revista Brasileira de Zootecnia,
30:1824-1828. 2001.
ARC – Agricultural Research Council. 1965.
The Nutrient Requirements of Farm
Livestock. London, UK: Agricultural
Research Council, 264p.
ARC – Agricultural Research Council. 3rd ed.
Commonwealth Agricultural Bureaux,
Farnham Royal, UK, 351p. 1980.
Arthington, J. D.; Moriel, P.; Martins, P. G.
M. A.; Lamb, G. C.; Havenga, L. J. Effects
of trace mineral injections on measures of
performance and trace mineral status of
pre- and postweaned beef calves. Journal
of Animal Science. 92:2630-2640. 2014.
Backes, A. A. Composição corporal e
exigências de energia, proteína e
macroelementos minerais para bovinos
mestiços leiteiros e zebu, castrados, em
fase de recria e engorda, em confinamento .
Tese (Doutorado em Zootecnia) –
Universidade Federal de Vicosa, Vicosa,
MG. 2003.
Beef Cattle Nutrient Requirement Model –
BCNRM. Nutrient requirements of beef
cattle. 8th edition. Washington, DC: The
National Academies Press, 475p, 2016.
Bentley, O. G.; Phillips, P. H. The effects of
low Mn rations upon dairy cattle. Journal
of Dairy Science, 34:396–403. 1951.
Bernhard, B. C.; Burdick, N. C.; Roundsw,
Rathmann, R. J.; Carroll, J. A.; Finck, D.
N.; Jennings, M. A.; Young, T. R.;
Johnson, B. J. Chromium supplementation
alters the performance and health of feedlot
cattle during the receiving period and
enhances their metabolic response to a
lipopolysaccharide challenge. Journal of
Animal Science, 90:3879–3888. 2012.
Blaney, J.; Gartner, J. W.; Head, T. A. The
effects of oxalate in tropical grasses on
calcium, phosphorus and magnesium
availability to cattle. Journal of
Agricultural Science, 99:533-539. 1982.
Bodansky M. Biochemical studies on marine
organisms. II. The occurrence of zinc. The
Journal of Biological Chemistry, 44:399–
407. 1920.
Boin, C. Exigências de minerais pelas
categorias do rebanho bovino e funções
desses nutrientes. In: Peixoto, A. M. (Ed).
Nutrição de bovinos: conceitos básicos e
aplicados. Piracicaba: FEALQ, p.407-450.
1993.
Bouchard, R.; Conrad, H. R. Sulfur
requirement of lactating dairy cows. I.
Sulfur balance and dietary
supplementation. Journal of Dairy Science,
56:1276–1282. 1973.
Butting, L. D.; Fernandes, J. M.; Thompson,
D. L.; Southern, L. L. Influence of
chromium picolinate on glucose usage and
metabolic criteria in growing Holstein
calves. Journal of Animal Science,
72:1591–1599. 1994.
Call, J. W.; Butcher, J. E.; Blake, J. T.; Smart, R.
A.; Shupe, J. L. Phosphorus influence on
growth and reproduction of beef cattle.
Journal of Animal Science, 47:216-225. 1978.
Callaway, T. R.; Anderson, R. C.; Genovese, K.
J.; Poole, T. L.; Anderson, T. J.; J. Byrd, A.;
Kubena, L. F.; Nisbet. D. J. Sodium chlorate
supplementation reduces E. coli O157:H7
populations in cattle. Journal of Animal
Science, 80:1683–1689. 2002.
Nutrient Requirements of Zebu and Crossbred Cattle – BR-CORTE
244
Cheeke, P. R. Applied animal nutrition: feeds
and feeding. 3.ed. Upper Saddle River, NJ:
Pearson Education Inc., 604p. 2005.
Chizzotti, M. L. Exigências nutriticionais de
animais Nelore, puros e cruzados, de
diferentes classes. 2007. Tese (Doutorado
em Zootecnia) Universidade Federal de
Viçosa, Viçosa-MG. 101p. 2007.
Chizzotti, M. L.; Valadares Filho, S. C.;
Tedeschi, L. O.; Paulino, P. V. R.; Paulino,
M. F.; Valadares, R. F. D.; Amaral, P.;
Benedeti, P. D. B.; Rodrigues, T. I.;
Fonseca, M. L. Net requirements of
calcium, magnesium, sodium, phosphorus,
and potassium for growth of Nellore×Red
Angus bulls, steers, and heifers. Livestock
Sience, 124:242-247. 2009.
Coelho da Silva, J. F.; Valadares Filho, S. C.;
Leao, M. I.; Castro, A. C. G.; Costa, W. P.
Efeito da monensina sódica e da uréia
sobre o consumo, parâmetros ruminais,
digestibilidade aparente e balanço
nutricional em bovinos. Revista da
Sociedade Brasileira de Zootecnia, 20:454-
470. 1991.
Coelho da Silva, J. F. Inorganic macronutrient
requirements in cattle: The ARC/AFRC
system and the Brazilian experience. In:
Proceedings of International Symposium
on the Nutritional Requirements of
Ruminants, 1995, Vicosa, Brazil. Anais.
Viçosa, Brazil: JARD. p. 311-345. 1995.
Costa e Silva, L. F.; Valadares Filho, S. C.;
Engle, T. E.; Rotta, P. P.; Marcondes, M.
I.; Silva, F. A. S.; Martins, E. C.;
Tokunaga, A. T. Macromineral and trace
element requirements for beef cattle. PLoS
ONE 10(12): e0144464. 2015a.
Costa e Silva, L. F.; Engle, T. E.; Valadares
Filho, S. C.; Rotta, P. P.; Valadares, R. F.
D.; Silva, B. C.; Pacheco, M. V. C. Intake,
apparent digestibility, and nutrient
requirements for growing Nellore heifers
and steers fed two levels of calcium and
phosphorus. Livestock Science, 181:17–24.
2015b.
CSIRO – Commonwealth Scientific and
Industrial Research Organization. Nutrient
requirements of domesticated ruminants.
CSIRO Publications: Collingwood, AU,
270p. 2007.
Delezenne C. Le zinc constituant cellulaire de
l’organisme animal = sa présence et son
rôle dans le venin des serpents. Ann Inst
Pasteur 33:68. 1919.
Dick, A. T. Studies on the assimilation and
storage of copper in crossbred sheep.
Australian Journal of Agricultural
Research, 5:511. 1954.
Dicostanzo, A.; Meiske, J. C.; Plegge, S. D.;
Haggard, D. L.; Chaloner, K. M. Influence
of manganese, copper, and zinc on
reproductive performance of beef cows.
Nutrition Reports International, 34:287-
293. 1986.
Dowe, T. W.; Matsushima, J.; Arthaud, V. H.
The effects of adequate and excessive
calcium when fed with adequate
phosphorus in growing rations for beef
calves. Journal of Animal Science,16:811–
820. 1957.
Ellis, W. C.; Pfander, W. H.; Muhrer, M. E.;
Pickett, E. E. Molybdenum as a dietary
essential for lambs. Journal of Animal
Science, 17:180-188. 1958.
Erickson, G. E.; Klopfenstein, T. J.; Milton,
C. T.; Hanson, D.; Calkins, C. Effect of
dietary phosphorus on finishing steer
performance, bone status, and carcass
maturity. Journal of Animal Science,
77:2832-2836. 1999.
Erickson, G. E.; Klopfenstein, T. J.; Milton,
C. T.; Brink, D.; Orth, M. W.; Whittet, K.
M. Phosphorus requirement of finishing
feedlot calves. Journal of Animal Science,
80:1690-1695. 2002.
Ezequiel, J. M. B. Exigências de proteína e
minerais de bovídeos: frações endógenas.
Tese (Doutorado em Zootecnia) –
Universidade Federal de Viçosa, Viçosa,
MG. 131p. 1987.
Field, A. C. A review of requirements of dairy
and beef cattle for major elements.
Livestock Production Science, 10:327-338.
1983a.
Field, A. C. Maintenance requirements of
phosphorus and absorbability of dietary
phosphorus in sheep. Journal of
Agricultural Science, 100:231-233. 1983b.
Fontes, C. A. A. Body composition, net
requirements of protein, energy and
minerals for weight gain and productive
performance of Zebu and crossbred
European-Zebu cattle. Experimental
results. In: Proceedings of International
Symposium on the Nutritional

Mineral requirements for beef cattle
245
Requirements of Ruminants, 1995, Vicosa,
MG, Brazil. Anais. Vicosa, MG, Brazil:
JARD, p.265-299. 1995.
Genther, O. N.; Hansen, S. L. Effect of dietary
trace mineral supplementation and a multi-
element trace mineral injection on shipping
response and growth performance of beef
cattle. Journal of Animal Science, 92:2522-
2530. 2014.
Gionbelli, M. P. Desempenho produtivo e
exigências nutricionais de fêmeas Nelore
em crescimento. 2010. Dissertação
(Mestrado em Zootecnia) – Universidade
Federal de Vicosa, Vicosa, MG. 101p.
2010.
Hambidge, K. M.; Casey, C. E.; Krebs, N. F.
Zinc. Trace elements in human and animal
nutrition. Academic Press: San Diego, CA,
USA. pp. 1–137. 1986.
Hansard, S. L.; Comar, C. L.; Plumlee, M. P.
The effects of age upon calcium utilization
and maintenance requirements in the
bovine. Journal of Animal Science, 13:25-
26. 1954.
Hansard, S. L.; Crowder, H. M.; Lyke, W. A.
The Biological Availability of Calcium in
Feeds for Cattle. Journal of Animal
Science, 16:437-443. 1957.
Hansard, S. L.; Plumlee, M. P. Effects of
Dietary Calcium and Phosphorus Levels
upon the Physiological Behavior of
Calcium and Phosphorus in the Rat.
Journal of Nutrition, 54:17-31. 1954.
Hansard, S. L.; Mohammed, A. S.; Turner, J.
W. Gestation age effects upon maternal-
fetal zinc utilization in the bovine. Journal
of Animal Science, 27:1097–1102. 1968.
Hartmans, J. Tracing and treating mineral
disorders in cattle under field conditions.
Trace Element Metabolism in Animals.
University Park Press: Baltimore, MD,
USA, pp. 261–273. 1974.
Harvey, A. L.; Thomas, B. H.; Culbertson, C.
C.; Collins, E. V. Effect of work on the
calcium and phosphorus retention of
percheron geldings. Journal of Animal
Science, 2:103-111. 1943.
Hidiroglou, M.; Proulx, J.; Jolette, J.
Intraruminal selenium pellet for control of
nutritional muxcular dystrophy in cattle.
Journal of Dairy Science, 68, 57-66. 1985.
Hurley, L. S.; Keen, C. L. Manganese. Trace
elements in human and animal nutrition.
Academic Press: New York, NY, USA.
pp.185–223. 1987.
Kegley, E. B.; Spears, J. W. Immune
response, glucose metabolism, and
performance of stressed feeder calves fed
inorganic or organic chromium. Journal of
Animal Science, 73:2721–2726. 1995.
Kirchgessner, M.; Weser, U. Complex-
stability and copper absorption. 4. On the
dynamics of copper absorption. Z.
Tierphysiol Tiererenahr Futtermittelkd .
20:44-49. 1965.
Lalman, D. L. Vitamin and mineral nutrition
of grazing cattle. In: Doye, D.; Lalman, D.
L. (Ed). Beef cattle manual. 5.ed.
Stillwater, OK: Oklahoma State University,
p.109-121. 2005.
Leonel, F. P. Exigências nutricionais em
macronutrientes minerais (Ca, P, Mg, Na e
K) para novilhos de diferentes grupos
zootécnicos. Dissertação (Mestrado em
Zootecnia) – Universidade Federal de
Vicosa, Vicosa, MG. 2003.
Looney, J. W.; Gille, G.; Preston, R. L.;
Graham, E. R.; Pfander, W. H. Effects of
plant species and cobalt intake upon cobalt
utilization and ration digestibility by sheep.
Journal of Animal Science, 42:693–698.
1976.
Marcondes, M. I. Desempenho de bovinos
Nelore alimentados individualmente ou em
grupo, exigências nutricionais e avaliação
protéica de alimentos para ruminantes.
Dissertação (Mestrado em Zootecnia) -
Universidade Federal de Viçosa, Viçosa-
MG. 136p. 2007.
Marcondes, M. I. Exigências nutricionais e
predição da composição corporal de
bovinos Nelore puros e cruzados. Tese
(Doutorado em Zootecnia) – Universidade
Federal de Vicosa, Vicosa, MG. 2010.
Marcondes, M. I.; Valadares Filho, S. C.;
Paulino, P. V. R.; Valadares, R. F. D.;
Paulino, M. F.; Nascimento, F. B.;
Fonseca, M. A. Exigências nutricionais de
proteína, energia e macrominerais de
bovinos Nelore de três classes sexuais.
Revista Brasileira de Zootecnia, 38:1587-
1596. 2009.
Nutrient Requirements of Zebu and Crossbred Cattle – BR-CORTE
246
Marshall, B.; Long, M. I. E. Calcium intake
and excretion of zebu cattle used for
digestibility trials. East African
Agricultural and Foresty Journal, 37:46-
48. 1971.
Martins, R. G. R. Exigências de energia,
proteína e macroelementos minerais (Ca,
P, Mg, Na e K) de bovinos Nelore e
mestiços, não castrados, em confinamento.
Tese (Doutorado em Zootecnia) –
Universidade Federal de Vicosa, Vicosa,
MG. 2003.
Mcdonald, P. M.; Edwards, R. A.;
Greenhalgh, J. F. D. Animal Nutrition. 6th
edition. Longman, London and New York,
543p. 2002.
McDowell, L. R. Minerals in Animal and
Human Nutrition. Academic Press Inc.
Harcourt Brace Jovanovich Publishers, San
Diego, CA. 1992.
Miller, J. K.; Cragle, R. G. Gastrointestinal
sites of absorption and endogenous
secretion of zinc in dairy cattle. Journal of
Dairy Science, 48:370–373. 1965.
Miller, W. J.; Powell, G. W.; Hiers, J. M.
Influence of zinc deficiency on dry matter
digestibility in ruminants. Journal of Dairy
Science, 49:1012–1013. 1966.
Miller, J. K.; Ramsey, N.; Madsen, F. C. The
trace elements. Pp. 343-401 in The
Ruminant Animal-Digestive Physiology
and Nutrition, Church, D.C., ed.
Englewood Cliffs, N.J.: Prentice-Hall.
1988.
Mills, C. F.; Dalgarno, A. C.; Williams, R. B.;
Quarterman, J. Zinc deficiency and zinc
requirements of calves and lambs. British
Journal of Nutrition, 21:751-768. 1967.
Mills, C. F.; Davis, G. K. Molybdenum. Pp.
429-463 in Trace Elements in Human and
Animal Nutrition. Vol.1. W. Mertz, ed.
New York: Academic. 1987.
Monroe, R. A.; Sauberlick, H. E.; Comar, C.
L.; Hood, S. L. Vitamin B12 biosynthesis
after oral and intravenous administration of
inorganic Co6o to sheep. Proceedings of
the society for experimental biology and
medicine. New York, NY, USA, pp. 250.
1952.
Moraes, E. H. B. K. Desempenho e exigência
de energia, proteína e minerais de bovinos
de corte em pastejo, submetidos a
diferentes estratégias de suplementação.
Tese (Doutor em Zootecnia) - Universidade
Federal de Viçosa, Viçosa-MG. 136p.
2006.
Morris, J. G. Assessment of sodium
requirements of grazing beef cattle: a
review. Journal of Animal Science, 50,
145-152. 1980.
Morris, J. G.; Cripe, W. S.; Chapman Jr., H.
L.; Walker, D. F.; Armstrong, J. B.;
Alexander Jr., J. D.; Miranda, R.; Sanchez
Jr., A.; Sanchez, B.; Blair-West, J. R.;
Denton, D. A. Selenium deficiency in
cattle associated with heinz bodies and
anemia. Science, 223, 491-493. 1984.
Mullis, L. A.; Spears, J. W.; Mccraw, R. L.
Estimated copper requirements of Angus
and Simmental heifers. Journal of Animal
Science, 81:865–873. 2003.
NRC – National Research Council. Nutrient
Requirements of Beef Cattle. 6th.ed.
Washington, DC: National Academy Press.
90p. 1984.
NRC – National Research Council. Nutrient
Requirements of Beef Cattle. 7th.ed.
Washington, DC: National Academy Press,
242p. 2000.
NRC – National Research Council. Nutrient
requirements of dairy cattle. Washington,
DC, USA: National Academy Press, 362 p.
2001.
Paixão, M. L. Desempenho produtivo e
exigências nutricionais de bovinos de corte
em pastagens de brachiaria decumbens,
com suplementação protéica. Tese
(Doutorado em Zootecnia) – Universidade
Federal de Vicosa, Vicosa, MG. 2008.
Paulino, M. F. Composição corporal e
exigências de energia, proteína e
macroelementos minerais (Ca, P, Mg, Na e
K) de bovinos não-castrados de quatro
raças zebuínas em confinamento. 1996.
Tese (Doutorado em Zootecnia) –
Universidade Federal de Vicosa, Vicosa,
MG. 80p. 1996.
Paulino, P. V. R. Exigências nutricionais e
validação da seção hh para predição da
composição corporal de zebuínos.
Dissertação (Mestrado em Zootecnia) –
Universidade Federal de Vicosa, Vicosa,
MG. 2002.
Peeler, H. T. Biological availability of
nutrients in feeds: availability of majos
Mineral requirements for beef cattle
247
mineral ions. Journal of Animal Science,
35, 695-712. 1972.
Perry, T. W.; Beeson, W. M.; Smith, W. H.;
Mohler, M. T. Value of zinc
supplementation of natural rations for
fattening beef cattle. Journal of Animal
Science, 27:1674–1677. 1968.
Pond, W. G.; Otjen, R. R. Response of large
and medium frame beef steers to protein
and zinc supplementation of a corn silage-
corn finishing diet. Nutrition Reports
International, 38:737–743. 1988.
Prados, L. F. Desempenho e exigências
nutricionais de bovinos alimentados com
dietas contendo diferentes níveis de cálcio
e fósforo. 2012. 96p. Dissertação
(Mestrado em Zootecnia) – Universidade
Federal de Vicosa, Vicosa, MG. 2012.
Prados, L. F.; Valadares Filho, S. C.; Santos,
S. A.; Zanetti, D.; Nunes, A. N.; Costa, D.
R.; Mariz, L. D. S.; Detmann, E.; Amaral,
P. M.; Rodrigues, F. C.; Valadares, R. F.
D. Reducing calcium and phosphorus in
crossbred beef cattle diets: impacts on
productive performance during the growing
and finishing phase. Animal Production
Science.
http://dx.doi.org/10.1071/AN14781. 2015.
Prados, L. F. Reduction of minerals in feedlot
diets of Nellore cattle: impacts on intake,
performance, and liver and bone status and
nutrient requirements; and prediction of
chemical rib section composition by dual
energy x-ray absorptiometry in Zebu cattle.
95 p. Tese (Doutorado em Zootecnia) –
Universidade Federal de Viçosa, Viçosa,
MG. 2016.
Rodrigues, F. C. Turnover protéico, avaliação
e predição da composição química da
carcaça e do corpo vazio de bovinos ¾
Zebu x ¼ Holandês. 2014. 44p. Dissertação
(Mestrado em Zootecnia) – Universidade
Federal de Vicosa, Vicosa, MG. 2014.
Rojas, M. A.; Dryer, I. A.; Cassatt, W. A.
Manganese deficiency in the bovine.
Journal of Animal Science, 24:664-667.
1965.
Rosado, M. Efeito do complexo ácido graxo-
cálcio sobre a digestibilidade aparente,
alguns parâmetros ruminais e taxa de
passagem em vacas lactantes. 1991. 96p.
Dissertação (Mestrado em Zootecnia) -
Universidade Federal de Vicosa, Vicosa.
1991.
Sales, M. F. L. Desempenho e exigências
nutricionais de novilhos zebuínos sob
pastejo. 2008. 128p. Tese (Doutorado em
Zootecnia) – Universidade Federal de
Vicosa, Vicosa, MG. 2008.
Sansom, B. F.; Symonds, H. W.; Vagg, M. J.
The absorption of dietary manganese by
dairy cows. Research of Veterinary
Science, 24:366–369. 1978.
Sathler, D. F. T. Efeito da suplementação
mineral sobre as digestibilidades total,
ruminal e intestinal em zebuínos. 55p.
Dissertação (Mestrado em zootecnia) –
Universidade Federal de Viçosa, Viçosa,
MG. 2015.
SCA. Feeding standards for Australian
livestock. 1990. Ruminants. Report for the
Standing Committee on Agriculture.
CSIRO Publications: Melbourne, AU.
Schroeder, H. A.; Balassa, J. J.; Tipton, I. H.
Essential trace metals in man: manganese.
A study in homeostasis. Journal Chronical
Disease, 19:545–571. 1966.
Schwarz, W. A.; Kirchgessner, M. Excretion
of zinc in lactating cows receiving various
supplies of zinc. Arch Tierernähr, 25:597–
608. 1975.
Scott, D. Control of phosphorus balance in
ruminantes. In: DOBSON, A.; DOBSON,
M.J. (Ed). Aspects of Digestive Physiology
in Ruminantes. 1.ed. Ithaca, New York:
Comstock Publishing Associates, 1988.
p.156-174. 1988.
Shariff, M. A.; Boila, R. J.; Wittenberg, K. M.
Effect of dietary molybdenum on rumen
disappearance in cattle. Canadian Journal
of Animal Science, 70:319-323. 1990.
Silva, F. F. Desempenho, características de
carcaça, composição corporal e exigências
nutricionais (de energia, proteína,
aminoácidos e macrominerais) de novilhos
Nelore, nas fases de recria e engorda,
recebendo diferentes níveis de concentrado
e proteína. Tese (Doutorado em Zootecnia)
– Universidade Federal de Viçosa, 211 p,
2001.
Smart, M. E.; Gudmundson, J.; Christensen,
D.A. Trace mineral deficiencies in cattle:
A review. Canadian Veterinary Journal,
22:372–376, 1981.
Smith R. M. Cobalt. Trace elements in human
and animal nutrition. Academic Press:
New York, NY, USA, 185–223, 1987.
Nutrient Requirements of Zebu and Crossbred Cattle – BR-CORTE
248
Smith, D. J.; Oliver, C. E.; Taylor, J. B.;
Anderson, R. C. Efficacy, metabolism, and
toxic responses to chlorate salts in food
and laboratory animals. Journal of Animal
Science, 90:4098–4117, 2012.
Spears, J. M.; Kegley, E. B. Effect of zinc
source (zinc oxide vs. zinc proteinate) and
level on performance, carcass
characteristics, and immune response of
growing and finishing steers. Journal of
Animal Science, 80:2747-2752, 2002.
Spears, J. W.; Harvey, R. W.; Segerson, E. C.
Effect of marginal selenium deficiency on
growht, reproduction and selenium status
of beef cattle. Journal of Animal Science,
63, 586-594, 1986.
Souza, E. J. 2010. Desempenho e exigências
nutricionais de fêmeas Nelore, F1 Nagus x
Nelore e F1 Simental × Nelore em dietas
contendo alto e baixo nível de
concentrado. Tese (Doutorado em
Zootecnia) – Universidade Federal Rural
de Pernambuco, Pernambuco, 2010.
St. Omer, V. V. E.; Roberts, W. K. Some
effects of dietary potassium upon
digestibility, serum electrolytes and
utilization of potassium, sodium, nitrogen
and water in heifers. Canadian Journal of
Animal Science, 47:39–46, 1967.
Sullivan, J. F.; Blotcky, A. J.; Jetton, M. M.;
Hahn, H. K.; Burch, R. E. Serum levels of
selenium, calcium, copper, magnesium,
manganese and zinc in various human
diseases. Journal of Nutrition, 109:1432–
1437, 1979.
Suttle, N. F. A technique for measuring the
biological availability of copper to sheep,
using hypocupraemic ewes. British Journal
of Nutrition, 32:395–405, 1974.
Suttle, N. F. The interactions between copper,
molybdenum and sulfur in ruminant
nutrition. Annual Review of Nutrition,
11:121-140, 1991.
Suttle N. F. Mineral nutrition of livestock. 4th
ed. CABI Publishing, Oxfordshire, UK.
579 p, 2010.
Thomas, J. W. Metabolism of iron and
manganese. Journal of Dairy Science,
53:107–1123, 1970.
Valadares Filho, S. C.; Coelho Da Silva, J. F.;
Leao, M. I. Absorções aparentes totais de
parciais de sódio, potássio, magnésio,
cobre e manganês em bovinos alimentados
com ração purificada e semipurificada. In:
Reunião Anual da Sociedade Brasileira de
Zootecnia, João Pessoa. Anais... João
Pessoa: SBZ, 1991.
Valadares Filho, S. C.; Marcondes, M. I.;
Chizzotti, M. L.; Paulino, P. V. R. Nutrient
requirements of zebu beef cattle — BR-
CORTE. Suprema Grafica Ltda, Viçosa,
Minas Gerais, Brazil. 193p, 2010.
Valente, E. E. L. Suplementação de bovinos
de corte em pastejo com diferentes
relações proteína:carboidrato da fase de
amamentação ao abate. Tese (Doutorado
em Zootecnia) – Universidade Federal de
Vicosa, Vicosa, MG, 2012.
Vasconcelos, J. T.; Tedeschi, L. O.; Fox, D.
G.; Galyean, M. L.; Greene, L. W. Review:
Feeding nitrogen and phosphorus in beef
cattle feedlot production to mitigate
environmental impacts. Professional
Animal Scientist, 23:8-17, 2007.
Van Bruwaene, R.; Gerber, G. B.; Kirchmann, R.;
Colard, J.; Van Kerkom, J. Metabolism of 51Cr,
54Mn, 59Fe, and 60Co in lactating dairy cows.
Health Physiology, 46:1069–1082, 1984.
Veloso, C. M. Composição corporal e exigências
nutricionais de bovinos F1 Limousin x Nelore
alimentados com rações contendo diferentes
níveis de concentrado. Tese (Doutorado em
Zootecnia) – Universidade Federal de Vicosa,
Vicosa, MG, 2001.
Véras, R. M. L. Consumo, digestibilidades total e
parcial, produção microbiana e exigências de
proteína para mantença de bovinos Nelore. Tese
(Doutorado em Zootecnia) – Universidade
Federal de Viçosa, 2006.
Underwood, E. J. The mineral nutrition of livestock.
London: Academic Press, 111p, 1981.
Underwood, E. J.; Suttle, N. F. The mineral nutrition
of livestock. 3.ed. London. UK: CABI
Publishing, 614 p, 1999.
Ward, G. M. Potassium metabolism of domestic
ruminants: A review. Journal of Dairy Science,
49:268–276, 1966.
Weigand, E.; Kirchgessner, M. Factorial estimation
of the zinc requirement of lactating dairy cows. Z
Tierphysiol Tierernahr Futtermittelkd, 47:1–9,
1982.
Weitzel, G.; Strecker, F.; Roester, U.; Buddecke,
E.; Fretzdorff, A. Zink im Tapetum lucidum.
Hoppe–Seyler’s Z Physiologische Chemie,
296:19–30, 1954.

Mineral requirements for beef cattle
249
Wise, M. B.; Ordoreza, A.L.; Barrick, E. R.
Influence of variations in dietary
calcium:phosphorus ratio on performance and
blood constituents of calves. Journal of
Nutrition, 79:79–84, 1963.
Wilson, B. K.; Vazquez-Anon, M.; Step, D. L.;
Moyer, K. D.; Haviland, C. L.; Maxwell, C.
L.; O´Neill, C. F.; Gifford, C. A., Krehbiel, C.
R.; Richards, C. J. Effect of copper,
manganese, and zinc supplementation on the
performance, clinical signs, and mineral status
of calves following exposure to bovine viral
diarrhea virus type 1b and subsequent
Mannheimia haemolytica infection. Journal of
Animal Science, 94, 1123-1140, 2016.
Wright, P. L. and Bell, M. C. Comparative
metabolism of selenium and tellurium in
sheep and swine. American Journal of
Physiology--Legacy Content, 211:6-10.
1966.
Zanetti, D. Exigências nutricionais,
frequência de alimentação e níveis de
cálcio e fósforo para bovinos Holandês x
Zebu em confinamento. Dissertação
(Mestrado em Zootecnia) – Universidade
Federal de Viçosa, 78 p, 2014.

Nutrient Requirements of Zebu and Crossbred Cattle – BR-CORTE
250