Molecular-cytogenetic analysis of repetitive sequences in ...
190
Molecular-cytogenetic analysis of repetitive sequences in genomes of Beta species and hybrids DISSERTATION zur Erlangung des akademischen Grades Doctor rerum naturalium (Dr. rer. nat.) vorgelegt der Fakultät Mathematik und Naturwissenschaften der Technischen Universität Dresden von Dipl.-Biol. Dechyeva Daryna geboren am 10. Juli 1972 in Sofia, Bulgarien Gutachter: Prof. Dr. Thomas Schmidt Prof. Dr. John Seymour Heslop-Harrison Prof. Dr. Jutta Ludwig-Müller Eingereicht am: 23.02.2006 Tag der Verteidigung: 07.07.2006
Transcript of Molecular-cytogenetic analysis of repetitive sequences in ...
Molecular-cytogenetic analysis of repetitive sequences in genomes of Beta species and hybrids
DISSERTATION
zur Erlangung des akademischen Grades
Doctor rerum naturalium (Dr. rer. nat.)
vorgelegt
der Fakultät Mathematik und Naturwissenschaften der Technischen Universität Dresden
von
Dipl.-Biol. Dechyeva Daryna
geboren am 10. Juli 1972 in Sofia, Bulgarien
Gutachter: Prof. Dr. Thomas Schmidt Prof. Dr. John Seymour Heslop-Harrison Prof. Dr. Jutta Ludwig-Müller Eingereicht am: 23.02.2006 Tag der Verteidigung: 07.07.2006


Моей семье и учителям
To my family and teachers

Contents
Index of figures and tables
Index of abbreviations
1. Introduction 1
2. Material and Methods 12
2.1. Material 12
2.2. Methods 14
2.2.1. Molecular methods 14
2.2.1.1. Isolation of DNA 14
2.2.1.2. Restriction of DNA and agarose gel electrophoresis 17
2.2.1.3. Polymerase chain reaction 18
2.2.1.4. Ligation of DNA 19
2.2.1.5. DNA transformation 20
2.2.1.6. Southern hybridization 21
2.2.1.7. Sequence analysis 22
2.2.2. Molecular cytogenetic methods 25
2.2.2.1. Preparation of plant chromosomes 25
2.2.2.2. Preparation of extended DNA fibers 27
2.2.2.3. Labelling of DNA probes for FISH 28
2.2.2.4. Fluorescent in situ hybridization 30
2.2.2.5. Preparation of chromosome spreads for immunocytochemistry 34
2.2.2.6. Immunocytochemical localization of proteins 35
2.2.2.7. UV microscopy 36
2.2.2.8. Digital image processing 36
3. Results 37
3.1. Repetitive sequences in the genome of the wild beet Beta procumbens 37
3.1.1. Satellite repeats of the AluI restriction family 38
3.1.2. The dispersed sequence family pAp4 44
3.1.3. The dispersed repetitive sequence pAp22 53
3.1.4. Organization of dispersed repeats in the B. procumbens genome 56
3.2. Organization of subterminal DNA sequences in sugar beet 62
3.2.1. Sequence variation and genomic organization of subtelomeric satellite
family 63
3.2.2. Chromosomal organization of subtelomeric satellite repeats and 69
telomeric DNA
3.2.3. Fluorescent in situ hybridization to extended chromatin fibers of
B. vulgaris 71
3.2.4. Sequence divergence and phylogeny of subtelomeric satellite family 74
3.3. Analysis of the B. vulgaris fragment addition lines PRO1 and PAT2
with a set of repetitive DNA probes 83
3.3.1. Physical mapping of repetitive DNA sequences on the chromosomes of
the fragment addition line PRO1and the parental species B. procumbens 86
3.3.2. Detection of repetitive DNA sequences on the chromosomes of
the fragment addition line PAT2 and the parental species B. patellaris 91
3.3.3. Physical localization of BACs on the chromosomes the B. vulgaris
fragment addition lines PRO1 and PAT2 and the wild beet species
B. procumbens and B. patellaris 95
3.4. Identification of the centromere-associated proteins on the B. vulgaris
fragment addition line PRO1 99
4. Discussion 103
4.1. Satellites as repetitive DNA sequences of plant genomes 103
4.1.1. Genome organization and evolution of the satellite subfamily pAp11 104
4.1.2. Chromosomal organization of the satellite pAp11 in B. procumbens
and B. vulgaris 106
4.1.3. Organization and evolution of the subtelomeric satellite family in
genomes of Beta species and S. oleracea 107
4.1.4. Physical organization of the DNA sequences in the terminal chromatin
of Beta species and S. oleracea 111
4.2. Dispersed repetitive sequences in the genome of B. procumbens 117
4.3. Structure of the minichromosomes in the B. vulgaris fragment
addition lines 121
4.3.1. Generation of a physical model of the PRO1 and PAT2
minichromosomes 121
4.3.2. Application of BAC-FISH for the analysis of B. vulgaris fragment
addition lines 128
4.4. Kinetochore proteins in the B. vulgaris hybrid PRO1 130
5. Relevance of the results for biotechnology 132
6. Summary (English, German, Russian) 136
7. References 145

Index of figures and tables Fig. 1 Beta procumbens 37 Fig. 2 Selection of B. procumbens clones containing repetitive sequences 39 Fig. 3 Structural relationship between satellites from B. procumbens and
B. vulgaris 40 Fig. 4 Methylation pattern of pAp11 in the B. procumbens genome 41 Fig. 5 Genomic organization of pAp11-1 and pEV4 in Chenopodiaceae 42 Fig. 6 Fluorescent in situ hybridization of satellite repeats on Beta chromosomes 43 Fig. 7 Sequence alignment of two representatives of pAp4 repetitive family 44 Fig. 8 Organization of pAp4-1 in the B. procumbens genome 45 Fig. 9 Species distribution and genomic organization of pAp4 in Chenopodiaceae 46 Fig. 10 Localization of pAp4 on B. procumbens chromosomes 46 Fig. 11 Sequence alignment of three pAp4 clones representing a complete
repeating unit 47 Fig. 12 Schematic representation of pAp4 dispersed repeat clones and flanking
sequences according to a restriction map of pAp4 49 Fig. 13 Alignment of sequences adjacent to pAp4 in the B. procumbens genome 50 Fig. 14 Estimation of the size of pAp4 full repeating unit 51 Fig. 15 Large-scale organization of pAp4 in the B. procumbens genome 52 Fig. 16 Internal structure of the dispersed AluI repeat pAp22 53 Fig. 17 Genomic organization of the dispersed AluI repeat pAp22 in
B. procumbens 53 Fig. 18 Genomic organization and species distribution of pAp22 in
Chenopodiaceae 54 Fig. 19 Fluorescent in situ hybridization of pAp22 on B. procumbens
chromosomes 55 Fig. 20 Fluorescent in situ hybridization of dispersed repetitive sequences on
B. procumbens chromosomes 56
Fig. 21 Schematic map of the primers tested to span the interspersion between pAp22 and pAp4 by PCR 57
Fig. 22 Amplification of sequences interspersed between pAp22 and pAp4
by PCR 58 Fig. 23 Alignment of the sequences flanking the 3´ end of pAp22 58 Fig. 24 Interspersion of pAp22 and pAp4 dispersed repeats in the B. procumbens
genome 60 Fig. 25 Structural organization of an Athila-like retrotransposon 61 Fig. 26 Sequence organization of the pAv34 satellite from B. vulgaris 64 Fig. 27 PCR amplification of subtelomeric satellite repeats 65 Fig. 28 Sequence alignment of the satellite repeats from Beta species and
S. oleracea 66 Fig. 29 Genomic organization and species distribution of the satellite pAv34 in
Chenopodiaceae 67 Fig. 30 Genomic organization and species distribution of the satellite pRn34 in
Chenopodiaceae 68 Fig. 31 Chromosomal localization of subterminal DNA sequences in
Chenopodiaceae species 70 Fig. 32 Physical organization of distal regions of the B. vulgaris chromosomes 72 Fig. 33 Dendrogram representing phylogenetic relationships between subtelomeric
satellite repeats 76 Fig. 34 Phylogenetic analysis of the subunits SU1 and SU2 from subtelomeric
satellite repeats 82 Fig. 35 Localization of repetitive sequences on the B. procumbens and PRO1
chromosomes 87 Fig. 36 Simultaneous localization of the centromeric probes pTS5 and pTS4.1
on B. procumbens meiotic chromosomes 89 Fig. 37 Repetitive sequences hybridized in situ to B. patellaris and PAT2
chromosomes 92 Fig. 38 Detection of BACs on PRO1, B. procumbens and on PAT2, B. patellaris by FISH 96 Fig. 39 Localization of kinetochore proteins on PRO1 mitotic preparation by
immunostaining 101
Fig. 40 Schema of possible phylogeny of pAp11 and pEV4 satellites in Beta genomes 106
Fig. 41 Schema of possible dimerization and evolution of subtelomeric satellites in Chenopodiaceae genomes 110
Fig. 42 Structural model of the PRO1 and PAT2 minichromosomes 126 Fig. 43 Schematic representation of a plant artificial chromosome 133 Fig. 44 Generation of the callus culture from B. vulgaris for biolistic
transformation 135 Tab. 1 Taxonomy, geographical distribution and ploidy levels of the genus
Beta species 9 Tab. 2 Repetitive DNA sequences in the genus Beta 10 Tab. 3 Organization patterns and sizes of telomeric and subtelomeric satellite
arrays in B. vulgaris 73 Tab. 4 Sequence distances between Beta subtelomeric satellite subfamilies 75 Tab. 5 Sequence distances between the subunits SU1 from Beta subtelomeric
satellite subfamilies 78 Tab. 6 Sequence distances between the subunits SU1 and SU2 from
Beta subtelomeric satellite subfamilies 80 Tab. 7 Repetitive probes and BACs used for the characterization of the fragment
addition lines PRO1 and PAT2 85 Tab. 8 Satellite repetitive sequences isolated from species of the genus Beta 104

Index of abbreviations
Ac - acetate
AP - alkaline phosphatase
BAC - bacterial artificial chromosome
bp – base pair
BSA – bovine serum albumin
CTAB - cetyltrimethyl ammoniumbromid
DAPI - 4’,6-Diamidin-2-phenylindol
DMSO - dimethyl sulfoxide
DNA – desoxyribonucleic acid
ddNTP - di-desoxynucleosidtriphosphate
dNTP - desoxynucleosidtriphosphate
EDTA - ethylendiamintetraacetic acid
EGTA - ethylene glycol-bis(2-aminoethyl ether)-N,N,N’,N’-tetraacetic acid
FISH - fluorescent in situ hybridization
FITC - fluorescein isothiocyanate
IPTG - isopropyl-ß-D-thiogalactopyranosid
h - hour
HMW - high molecular weight
HRP - horseradish peroxidase
kbp - kilobase pair
LB - Luria-Bertani medium
LTR - long terminal repeat
Mbp - megabase pair
min - minute
MTSB - microtubule stabilising buffer
NIB - nuclei isolation buffer
NOR - nucleolus organizer region
PBS - phosphate buffered saline
PCR - polymerase chain reaction
PFGE - pulsed field gel electrophoresis
PIPES - piperazine-N,N’-bis(2-ethanesulfonic acid)
PMSF - phenalmethanesulfonyl flouride
PVP - polyvinylpyrollidone
RFLP - restriction fragment length polymorphysm
RNase I - ribonuclease I
Rpm - rounds per minute
RT - room temperature
SDS - sodium dodecylsulphase
SSC - standard saline cytrate
STE - SDS-Tris-EDTA lysis buffer
TEMED - N,N,N’,N’-tetramethylethylenediamine
Tris - Tris(hydroxymethyl)aminomethan
TSA - tyramide signal amplification
UV - ultraviolet
v/v - volume part
w/v - weight part
X-Gal - 5-Bromo-4-chloro-3-indolyl-ß-D-Galactopyranosid
1. Introduction
The characterization of the genomes of higher plants is an important scientific task. The progress
in technology in the recent years and the international cooperation allowed to sequence the
genomes of the model plant Arabidopsis thaliana (Arabidopsis Genome Initiative 2000) and of
rice (Goff et al. 2002, Yu et al. 2002), and the genome of the next important crop maize is about
to be sequenced (Chandler & Brendel 2002, Messing et al. 2004). The data on the composition
and organization of these genomes proved that the number of genes is similar for different plant
species and lies in the range of 20,000-30,000 (Kikuchi et al. 2003). Comparative analysis of
cereal genomes indicated that they are composed of similar blocks of genes (Moore et al. 1995).
Linkage analysis of DNA markers in barley revealed complete correspondence with their genetic
order in rice (Dunford et al. 1995). The conservation of gene order in genomes of higher plants
known as genome collinearity, or gene synteny, is an important adaptive trait maintaining
genome stability (Benntzen & Freeling 1997, Devos & Gale 2000, Salse et al. 2002).
Plant genomes can be as small as 157 Mbp for Arabidopsis (Bennett et al. 2003) or as large as
36 000 Mbp for pine (Grotkopp et al. 2004) and over 80 000 Mbp for some Liliaceae (Bennett
1972). Although polyploidy also accounts for genome size variation, the increase of the genome
size is mostly due to the amount of repetitive DNA (Bennetzen et al. 2005). More than half of
many plant genomes is actually repetitive (Flavell et al. 1974, Kumar & Bennetzen 2000).
Repeats are represented from sequence duplications up to hundreds of thousands copies (Heslop-
Harrison 2000). Retrotransposons alone can comprise up to 50% of the plant genome (SanMiguel
et al. 1996). In spite of the fact that the representatives of many classes of repeats were described
in detail for various plant species, the function of this prominent part of plant genomes is still
poorly understood. Repeats of different classes evolve rapidly in copy number and result in
species-specific variants and/or novel sequence families (Schmidt & Heslop-Harrison 1998).
Thus, repetitive DNA is largely responsible for genome expansion. However, especially in
polyploids and interspecific hybrids, the repetitive DNA can be eliminated, as shown for rDNA
in tobacco (Volkov et al. 1999). It has been reported, that sequence elimination is one of the
major and immediate responses of the genome to wide hybridization or allopolyploidy in wheat
(Shaked et al. 2001). This leads to a significant reduction of the genome size in allopolyploids in
comparison to the expected value (Ozkan et al. 2003). Thus, repetitive DNA is important and
critical for genome evolution (Zhang & Wessler 2004). Therefore, understanding of the repetitive
1
sequences in genome can shed light on fundamental problems in biological science such as
species emergence and differentiation.
Repeats, comprising the vast portion of plant genomes, are grouped into families according to
their similarity. Based on genome organization, these sequences are divided into two major
classes - tandem and dispersed (Flavell 1986, Schmidt & Heslop-Harrison 1998). Tandem
repeats are grouped according to their size into microsatellites with repeating units of 1-5 bp,
minisatellites with unit sizes of 10-40 bp and satellite DNA with the typical repeating unit size of
140-180 or 300-360 bp (Charlesworth et al. 1994). Telomeres and rRNA genes also belong to the
tandemly arranged sequences (Schmidt & Heslop-Harrison 1998). Tandem repeats comprise a
significant portion of the repetitive DNA - ribosomal genes alone may account for up to 10% of
genomic DNA (Pruitt & Meyerowitz 1986).
Plant satellite DNA is often AT-rich. This base composition is sufficiently different from that of
the rest of the genomic DNA, and satellite DNA was initially discovered by CsCl density
gradient centrifugation, where it sediments as a distinct band (Barnes et al. 1985). Ribosomal
DNA can also form a separate, satellite-like peak in the gradient (Hemleben et al. 1977).
However, these genes are not classified as the satellite DNA. On the other hand, plant genomes
may contain “cryptic” satellite component, which can not be separated in density gradients
(Ganal & Hemleben 1986). This DNA could be isolated as restriction satellites (Pech et al.
1979), characterized by recognition sites for specific restriction endonucleases. Therefore, the
definition of satellite DNA was modified according to the increasing knowledge on its
characteristics. It is now agreeable, that the satellite DNA is a typical genome component of the
eukaryotes, which consists of numerous tandemly head-to-tail arranged repeats mostly localized
in constitutive heterochromatin (Hemleben et al. in press).
The typical repeating unit of satellites is either 140-180 or 300-360 bp (Heslop-Harrison 2000).
These particular lengths seem to correlate with the size of a single nucleosome requiring ~146 bp
of DNA to form the two turns around each nucleosome plus 25-30 bp of the linker DNA
(Manuelidis & Chen 1990), and thus they may have been favored in evolution.
Satellite arrays usually occur at a number of discrete sites in the genome, typically one to thirty
(Heslop-Harrison 2000). They may contain many thousands of monomer copies (Macas et al.
2000, Macas et al. 2002). The 180 bp centromeric repeat alone accounts for about 3% of the A.
thaliana genome (Murata et al. 1994). The modern computerized methods of data storage and
2
management allowed to assess more than 160 satellite families from various plants in the
PlantSat database (Macas et al. 2002).
There are only few indications of the satellite DNA function. It was shown, that the specific non-
histone protein SAT14 binds to a cucumber satellite (Fischer et al. 1994). Although satellite
DNA is usually regarded as transcriptionally silent, a significant proportion of RNA transcripts in
rice represented a particular subtelomeric tandem repeat (Wu et al. 1994). Recently it has been
demonstrated, that in maize, the 156-bp CentC centromere repeats are actively transcribed, and a
significant fraction of the resulting RNA is bound, directly or indirectly, to CENH3 (Topp et al.
2004). This important finding can shed the light on the assembling of the functionally active
centromere.
A common feature of both tandemly arranged and dispersed repetitive DNA is the rapid
divergence which leads to changes in sequence composition, distribution among species and
abundance (Schmidt & Heslop-Harrison 1998) and results in species-specific repeat variants
and/or novel sequence families. On the other hand, members of many repetitive families show a
remarkably high conservation. This ambivalence is a key feature of repeats in genome evolution
(Hall et al. 2003).
The exact mechanisms of repeats genesis and evolution are still under discussion. The “concerted
evolution”, initially proposed for the rDNA multigene family (Dover & Tautz 1986), is now also
applied for satellite DNA (Grellet et al. 1986). The core of this concept is that non-reciprocal
DNA exchange causes continual fluctuations in the sequences copy-number and, as a
consequence, promotes the gradual and contiguous spread of a variant throughout a DNA family
(homogenization) and throughout a population (fixation) as a dual process. Another hypothesis is
the “library” one (Salser et al. 1976, Ugarkovic & Plohl 2002) based on the “expansions-
constrictions” model (Southern 1975). It supposes that a set of conserved satellite sequences co-
exist in the genomes of related species, thus forming a satellite DNA library. To the evolutionary
mechanisms changing either copy number or the nucleotide sequence count “breakage and
reunion” (Bedbrook et al. 1980), “slippage replication” (Levison & Gutman 1987), unequal
crossing-over (Smith 1976, Schueler et al. 2001), gene conversion (Dvorak et al. 1987, Orel et
al. 2003), homologous recombination for the sequences containing direct repeats (Siebert &
Puchta 2002) and presumably an amplification by rolling circle (Cuzzoni et al. 1990).
The fast evolution rate leads to a characteristic distribution of the satellites in genomes of closely
and distantly related species. While some of these sequences occur in a wide range of plant taxa,
others are highly specific. This peculiarity makes satellite repeats a useful tool for comparative
3
studies of plant genomes and for the investigation of evolutionary relationship between plant
species (Kamm et al. 1995, Bennetzen 2000, Ohmido et al. 2000, Nouzova et al. 2001).
Dispersed elements are scattered wide over the genome and are often interspersed with other
genomic sequences. Many of these repeats are derived from mobile DNA sequences, in particular
from retrotransposons such as Ty1-copia-like or Ty3-gypsy-like elements (Kalendar et al. 2004).
Retrotransposons, also called class I transposons, are highly amplified components of plant
genomes (Kumar & Bennetzen 1999), but often decay by divergence during reverse transcription
or rearrangements of integrated elements at the DNA level (Bennetzen et al. 1994, SanMiguel et
al. 1996) and due to effects of transposition events (Staginnus et al. 1999, Tahara et al. 2004).
However, there are also dispersed repeats which are not related to retrotransposons, such as
Hch 1 from wild barley (Hueros et al. 1993), pBO3 from rice (Kiefer-Meyer et al. 1996) or
TAS49 from Nicotiana tomentosiformis (Horakova & Fajkus 2000). Recently, comprehensive
studies of legume genomes showed that many families of repetitive sequences are not derived
from retrotransposons (Neumann et al. 2001, Nouzova et al. 2001, Galasso et al. 2001).
The organization of genomic DNA into chromosomes is a fundamental feature of eukaryotic
cells. Chromosomes are nucleoprotein complexes which bear some distinguishable domains like
centromeres and telomeres. Along the chromosome arms the chromatin is condensed unequally,
thus forming heterochromatic regions of higher condensation and less condensed euchromatin.
Heterochromatic regions are usually enriched with repetitive sequences, especially satellites.
They are distinguishable after staining with DAPI as bright dye-positive blocks. Dispersed DNA
sequences, including transposons and retrotransposons, are scattered relatively uniformly along
the chromosomes. Euchromatin is where genes are mostly located and it is only weakly stained
with DAPI (Heslop-Harrison 1996).
Chromosomes of eukaryotes are terminated with specific nucleoprotein complexes – the
telomeres. They are important domains responsible for maintaining of genome stability.
Telomeres permit cells to distinguish chromosome ends from double-strand breaks, thus
preventing chromosome degradation and fusion events (McKnight & Shippen 2004). They also
participate in the establishment of the synaptonemal complex during meiosis (Schwarzacher
2003). Information on telomere structure and function is now available for many vertebrate and
invertebrate animals, plants and fungi. The first plant telomere was cloned from Arabidopsis by
Richards & Ausubel (1988). This sequence is highly conserved, consisting of the short repeat
4
motif (TTTAGGG)n arranged in tandem arrays many hundreds of units long (Fuchs et al. 1995).
Most dicots have Arabidopsis-type telomere. Many Asparagales, however, possess variant
sequences instead (Pich et al. 1996, Adams et al. 2002, de la Herran et al. 2005). The length of
arrays of telomeric repeats varies in different species from 2–5 kb in Arabidopsis thaliana
(Richards & Ausubel 1988), through 8–175 kb in cereals (Vershinin & Heslop-Harrison 1998),
60–160 kb in tobacco (Fajkus et al. 1995) and up to 13-223 kb in tomato (Zhong et al. 1998). The
number of copies of the repeat differs between chromosome arms of the karyotype (Schwarzacher
& Heslop-Harrison 1991) and varies from cell to cell and tissue to tissue (Kilian et al. 1995).
Plant centromeres, which are detectable as primary constrictions or heterochromatic blocks, are
important functional domains responsible for the segregation of the sister chromatids during cell
division. The centromere composition was analyzed in detail for yeast, Drosophila, humans,
partially for Arabidopsis and rice. While the point centromeres of Saccaromyces cerevisiae are
125 bp long and contain no repeats (Clarke 1990), the 40-100 kb long centromeres of another
yeast species, Schizosaccaromyces pombe, include several classes of repeats as well as
chromosome-specific single-copy sequences (Clarke & Baum 1990). Most other eukaryotes have
regional centromeres, spanning up to several megabase pairs. The essential core of the
Drosophila centromere is contained within a 220 kb region of single-copy and middle-repetitive
sequences (Murphy & Karpen 1995). For stable centromeric function it should be bordered by
200 kb of flanking satellite repeats. The major element of the human centromeres, which are up
to 4 Mb long, is a satellite with a 171 bp repeating unit known as alphoid DNA (Willard & Waye
1987a).
The sequence composition of Arabidopsis and rice centromeres proved to be highly variable.
Those of Arabidopsis thaliana contain approximately 20,000 copies of a 178 bp satellite repeat.
These satellite blocks have a very low rate of recombination. The flanking regions are enriched
with transposons and show higher level of recombination (Kumekawa et al. 2000). The
centromeric repeats are interspersed with several expressed genes (Copenhaver et al. 1999). The
centromeres of rice have a different size and complexity. Sequencing of the 124 kb rice
chromosome 4 centromere revealed that it consists of 18 tracts of 379 tandemly arrayed CentO
repeats and 19 centromeric retroelements, but no unique sequences (Zhang et al. 2004). On the
contrary, the centromeric core of the chromosome 8 (Cen8) has a relatively low amount of highly
repetitive satellite DNA CentO, which facilitated its sequencing. It contains a region having a
centromeric protein binding function. It is bordered with a stretch enriched with mainly Ty3-
5
gypsy-retrotransposons (Wu et al. 2004). Moreover, it contains at least four active genes (Nagaki
et al. 2004).
Recently, the long-range organization of centromeres in the wild beet Beta procumbens was
analyzed using a set of repetitive sequences which allowed to develop a structural model of a
plant centromere (Gindullis et al. 2001b). According to this model the centromeric satellite pTS5
form large array which is flanked by the arrays of a non-homologous pericentromeric satellite
pTS4.1. These arrays representing the majority of centromeric and pericentromeric DNA have
few gaps occupied by the Ty3-gypsy-like retrotransposons pBp10, Beetle1 and Beetle2 or
remnants thereof as shown by BACs analysis and FISH on B. procumbens chromosomes
(Gindullis et al. 2001b, Weber in prep.).
However, the pericentromeric satellite pTS4.1 is also found in other regions of chromosomes.
The satellite pTS5 is not present on all B. procumbens centromeres. The attempts to elucidate the
DNA sequence necessary for the centromere function in other plant species delivered similar
results (Heslop-Harrison et al. 1999, Hudakova et al. 2001, Dawe & Hiatt 2004, Zhang et al.
2004, Wu et al. 2004). Various centromere-associated repeats are known from many monocots
(Dong et al. 1998, Miller et al. 1998a, Miller et al. 1998b, Nagaki et al. 1998, Hudakova et al.
2001) and dicots (Harrison & Heslop-Harrison 1995, Schmidt & Heslop-Harrison 1996, Brandes
et al. 1997, Gindullis et al. 2001b). The fact that the centromeric satellite DNA sequences are
amongst the most rapidly evolving (Heslop-Harrison et al. 2003) puts a problem of balance
between the function maintenance and the sequence diversification at the centromere.
The proteins interacting with the centromere also attract attention of the researches (Kurata et al.
2002, ten Hoopen et al. 2002, Houben & Schubert 2003). The nucleosomes of centromeres are
characterized by a special H3-like histone CenH3 (Jiang et al. 2003). The centromere-associated
proteins such as CenH3 (mammalian CENP-A), CENP-C and CENP-E are highly conserved in
most plants, animal and fungi (Talbert et al. 2004). Thus, to fulfil its function in cell division, the
centromeres build a kinetochore complex where the microtubuli of the spindle apparatus are
attached (Yu et al. 2000).
To reveal the exact physical organization of DNA on plant chromosomes, fluorescent in situ
hybridization is of supreme efficiency. This method allows detection and precise localization of
repetitive or single-copy sequences on interphase nuclei, chromosomes or chromatin fibers. A
6
cloned sequence, PCR product, synthetic oligonucleotide as well as total genomic DNA can be
used as probe.
Initially, in situ hybridization with a radioactively labelled probe was developed to visualize
RNA and DNA in mammalian cells (John et al. 1969, Pardue & Gall 1969). Fluorescent in situ
hybridization (FISH) was established for mouse satellite DNA (Manuelidis et al. 1982), followed
by the first application in plants (Rayburn & Gill 1985) and is since than applied in molecular
cytogenetics for the localization of genes, karyotyping and analysis of the genome architecture
(de Jong et al. 1999, Heslop-Harrison 2000).
Multicolour FISH has become a tool for routine diagnostics in mammalian tumor genetics.
However, in plants FISH is not so widely applicable due to hardships with material preparation.
Plants are extremely sensitive to environment and often react to changes in their surrounding by
enhancement of their cell walls which hinders enzymatic preparation. Another obstacle is the
unreliable metaphase index. Not every plant species provides easily accessible and preparable
meristems throughout the year, meaning that the fixation procedure and enzymatic preparation
have to be adjusted for every plant species to achieve high-quality reproducible results. It makes
FISH in plants demanding and labour-intense.
Recently, bacterial artificial chromosomes (BACs) have also been located on chromosomes by
BAC-FISH. This method supports the construction of contigs and positional cloning of the
important genes (Jiang et al. 1995, Gindullis et al. 2001a, Lysak et al. 2001, Suzuki et al. 2001,
Cheng et al. 2002, Koornneef et al. 2003, Lengerova et al. 2004).
Fiber FISH is another powerful tool to study the physical organization of sequences on individual
DNA molecules. It achieves a resolution bridging the megabase molecular techniques, such as
pulsed-field gel electrophoresis and optical analysis of chromosome structures. It was
successfully used for the detailed investigation of chromosomal domains in Arabidopsis (Fransz
et al. 1996) and tomato (Zhong et al. 1998). Although fiber FISH is one of the most important
physical mapping techniques, it has since been applied only in few other laboratories for a
number of plant species like rice (Cheng et al. 2002), apple (Xu et al. 2001), pea and tobacco
(Lilly et al. 2001), wheat (Fukui et al. 2001), the sugar beet mutant PRO1 (Gindullis et al.
2001b) and rye (Alkhimova et al. 2004) to map repetitive or single-copy sequences.
In this way, the plant cytogenetics has evolved from staining techniques allowing a simple
morphological description up to fiber FISH with a near-molecular resolution.
Other breakthrough technologies under way are plant artificial chromosomes. Artificial
chromosomes are especially suitable for transmission of multiple genes or gene complexes into
7
host genomes. The first human artificial chromosomes (HACs) and mammalian artificial
chromosomes (MACs) have already been constructed and are now under intense laboratory tests
(Lindenbaum et al. 2004, Basu et al. 2005). Despite international efforts, plant artificial
chromosomes (PACs) are still under development. The main difficulty is to clone a functional
centromere. The centromeric DNA in higher plants is highly repetitive, consisting mainly of
satellites and Ty3-gypsy-retrotransposons. Not only the centromeres of different plant species
contain non-homologous sequences; the centromeres on different chromosomes within the same
genotype are often composed of different satellites (Gindullis et al. 2001b, Dechyeva et al.
2003). Such blocks of highly repetitive DNA are hardly clonable even in BACs, where they are
often unstable. Moreover, sequencing of these relatively homogenous domains is also
problematic. There is only one successful attempt to construct a PAC in a form of a plant
minichromosome reported so far by Chromatin Inc. aimed at improved crop protection and
increased yield in a range of agricultural species (www.chromatininc.com).
Beta species provide a suitable system for the comparative study of nuclear genome composition
and evolution. The genus Beta contains 14 closely and distantly related species (Table 1) and is
subdivided into the sections Beta, Corollinae, Nanae and Procumbentes with all cultivars (sugar,
fodder and table beet, Swiss chard) exclusively belonging to the section Beta (Barocka 1985).
Sugar beet is a relatively young crop. Its origin could be traced back to 18th century, when it was
selected from crosses between mangold and fodder beet (Fischer 1989). Therefore sugar beet has
limited genetic variability, and wild beets may provide a valuable pool of genetic resources for
this crop (de Bock 1986). To improve the resistance of cultivated beet to biotic and abiotic stress,
it was crossed with B. corolliflora resistant to viruses and the fungus Cercospora beticola and
with the species of the section Procumbentes tolerant to drought, soil salinity and beet cyst
nematode Heterodera schachtii (Van Geyt et al. 1990). The triploid hybrids were generated by
crossing a tetraploid sugar beet with a diploid B. procumbens. A back-crossing with diploid
B. vulgaris followed, and monosome addition lines (Savitsky 1975, Gao et al. 2000) and
fragment addition lines (Brandes at al. 1987, Jung & Wricke 1987) were selected among
offspring. Although resistant to pests and unfavourable environmental conditions, the yields
produced by those hybrids are low. However, the sugar beet addition lines are still a valuable
resource for genomic studies.
8
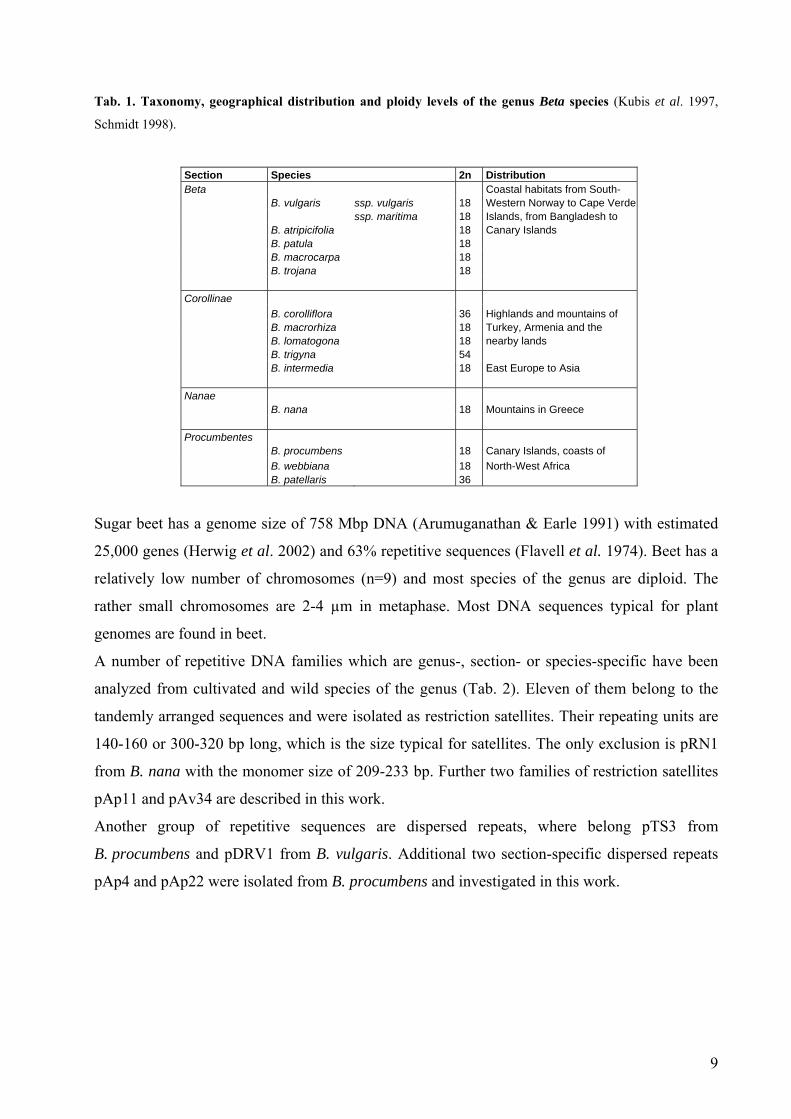
Tab. 1. Taxonomy, geographical distribution and ploidy levels of the genus Beta species (Kubis et al. 1997,
Schmidt 1998).
Section Species 2n Distribution Beta Coastal habitats from South- B. vulgaris ssp. vulgaris 18 Western Norway to Cape Verde ssp. maritima 18 Islands, from Bangladesh to B. atripicifolia 18 Canary Islands B. patula 18 B. macrocarpa 18 B. trojana 18 Corollinae B. corolliflora 36 Highlands and mountains of B. macrorhiza 18 Turkey, Armenia and the B. lomatogona 18 nearby lands B. trigyna 54 B. intermedia 18 East Europe to Asia Nanae B. nana 18 Mountains in Greece Procumbentes B. procumbens 18 Canary Islands, coasts of B. webbiana 18 North-West Africa B. patellaris 36
Sugar beet has a genome size of 758 Mbp DNA (Arumuganathan & Earle 1991) with estimated
25,000 genes (Herwig et al. 2002) and 63% repetitive sequences (Flavell et al. 1974). Beet has a
relatively low number of chromosomes (n=9) and most species of the genus are diploid. The
rather small chromosomes are 2-4 µm in metaphase. Most DNA sequences typical for plant
genomes are found in beet.
A number of repetitive DNA families which are genus-, section- or species-specific have been
analyzed from cultivated and wild species of the genus (Tab. 2). Eleven of them belong to the
tandemly arranged sequences and were isolated as restriction satellites. Their repeating units are
140-160 or 300-320 bp long, which is the size typical for satellites. The only exclusion is pRN1
from B. nana with the monomer size of 209-233 bp. Further two families of restriction satellites
pAp11 and pAv34 are described in this work.
Another group of repetitive sequences are dispersed repeats, where belong pTS3 from
B. procumbens and pDRV1 from B. vulgaris. Additional two section-specific dispersed repeats
pAp4 and pAp22 were isolated from B. procumbens and investigated in this work.
9
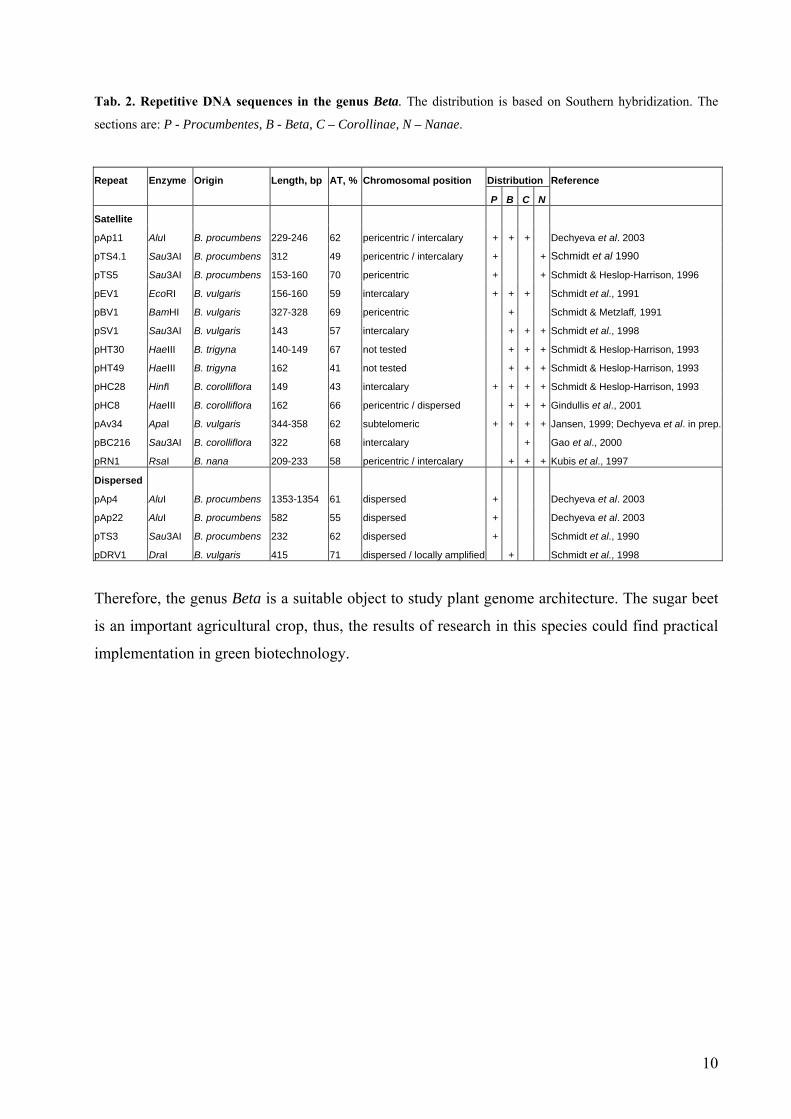
Tab. 2. Repetitive DNA sequences in the genus Beta. The distribution is based on Southern hybridization. The
sections are: P - Procumbentes, B - Beta, C – Corollinae, N – Nanae.
Repeat Enzyme Origin Length, bp AT, % Chromosomal position Distribution Reference
P B C N
Satellite
pAp11 AluI B. procumbens 229-246 62 pericentric / intercalary + + + Dechyeva et al. 2003
pTS4.1 Sau3AI B. procumbens 312 49 pericentric / intercalary + + Schmidt et al 1990
pTS5 Sau3AI B. procumbens 153-160 70 pericentric + + Schmidt & Heslop-Harrison, 1996
pEV1 EcoRI B. vulgaris 156-160 59 intercalary + + + Schmidt et al., 1991
pBV1 BamHI B. vulgaris 327-328 69 pericentric + Schmidt & Metzlaff, 1991
pSV1 Sau3AI B. vulgaris 143 57 intercalary + + + Schmidt et al., 1998
pHT30 HaeIII B. trigyna 140-149 67 not tested + + + Schmidt & Heslop-Harrison, 1993
pHT49 HaeIII B. trigyna 162 41 not tested + + + Schmidt & Heslop-Harrison, 1993
pHC28 HinfI B. corolliflora 149 43 intercalary + + + + Schmidt & Heslop-Harrison, 1993
pHC8 HaeIII B. corolliflora 162 66 pericentric / dispersed + + + Gindullis et al., 2001
pAv34 ApaI B. vulgaris 344-358 62 subtelomeric + + + + Jansen, 1999; Dechyeva et al. in prep.
pBC216 Sau3AI B. corolliflora 322 68 intercalary + Gao et al., 2000
pRN1 RsaI B. nana 209-233 58 pericentric / intercalary + + + Kubis et al., 1997
Dispersed
pAp4 AluI B. procumbens 1353-1354 61 dispersed + Dechyeva et al. 2003
pAp22 AluI B. procumbens 582 55 dispersed + Dechyeva et al. 2003
pTS3 Sau3AI B. procumbens 232 62 dispersed + Schmidt et al., 1990
pDRV1 DraI B. vulgaris 415 71 dispersed / locally amplified + Schmidt et al., 1998
Therefore, the genus Beta is a suitable object to study plant genome architecture. The sugar beet
is an important agricultural crop, thus, the results of research in this species could find practical
implementation in green biotechnology.
10
The aim of this work was to isolate and study repetitive sequences from the genomes of Beta
species to collect the complementing data for the construction of a beet-based plant artificial
chromosome. To achieve this goal, satellite and dispersed repetitive DNA sequences should be
isolated by various cloning strategies from the genomes of B. procumbens, sugar beet
B. vulgaris, B. corolliflora, B. nana and Spinacia oleracea.
Additional families of repetitive sequences should be isolated from the wild beet B. procumbens
and characterized on molecular, genomic and chromosomal levels of organization. On the basis
of taxonomic distribution the repeats specific for the section Procumbentes and suitable as
genome-specific probes should be selected among these DNA sequences.
More representatives of the ApaI restriction satellite pAv34 (Jansen 1999) should be isolated and
characterized from the representative species of the genus Beta and related Chenopodiaceae.
Phylogenetic relationship between these DNA sequences should be investigated. The physical
organization of the sugar beet chromosome ends should be studied by FISH on extended
chromatin fibers.
The sugar beet fragment addition lines PRO1 and PAT2 should be tested with a range of
repetitive DNA probes to get insight into the physical organization of the wild beet
minichromosomes by multicolour fluorescent in situ hybridization. The clones from BAC-Banks
of PRO1 and PAT2 should be tested on chromosome spreads of the fragment addition lines and
B. procumbens and B. patellaris to prove their minichromosome origin and centromeric
localization.
An insight into the centromeric function in beet should be accomplished by fluorescent
immunolocalization of the proteins in situ on the chromosomal mutant PRO1.
11
2. Material and Methods
2.1. Material
Plant material
Plants were grown under greenhouse conditions. As representatives of cultivated
Chenopodiaceae a sugar beet Beta vulgaris subsp. vulgaris Rosamona and Spinacia oleracea
Matador were included in this study. The seeds of the wild beet species Beta vulgaris maritima
(accession 65192), Beta corolliflora (accession 17812), Beta lomatogona (accession 58258),
Beta procumbens (accession 35336), Beta patellaris (accession 54753) and Beta webbiana
(accession 56685) were obtained from Dr. L. Frese (Bundesforschungsanstalt für Landwirtschaft,
Braunschweig-Völkenrode, Germany).The seeds of Beta nana (accession 81FD26) were
provided by Dr. B. Ford-Lloyd, University of Birmingham, United Kingdom. The Beta vulgaris
fragment addition lines PRO1 and PAT2 (Brandes et al. 1987, Jung & Wricke 1987) were
acquired at the Institute of Crop Science and Plant Breeding, Christian-Albrechts University of
Kiel, Germany.
Hosts and vector systems
As a host the strain of Escherichia coli DH10B (Invitrogen) was used.
For the cloning of restriction fragments the high-copy plasmid pUC18 (Roche) was used. For the
cloning of PCR products the high-copy plasmid pGEM-T (Promega) was used.
Culture media and antibiotics (per liter medium)
LB liquid medium Bacto-Trypton 10 g Yeast extract 5 g NaCl 10 g LB freezing medium LB liquid medium + K2HPO4 36 mM KH2PO4 13.2 mM sodium citrate 1.7 mM MgSO4 0.4 mM (NH4)2SO4 6.8 mM
12
glycerol 4.4% v/v LB-Agar LB liquid medium +
Bacto-Agar 15 g Indicator plates LB-Agar + IPTG 0.5 mM X-Gal 0.004% 2 YT- liquid medium Bacto-Trypton 16 g Yeast extract 10 g NaCl 5 g Antibiotics Ampicillin 100 µg/ml medium Chloramphenicol 12.5 µg/ml medium
Solutions 1 x TE buffer Tris/HCl 10 mM EDTA 1 mM pH 8.0 20 x SSC NaCl 3 M sodium citrate 0.3 M pH 7.0 Fixative methanol (100%) 3 v/v
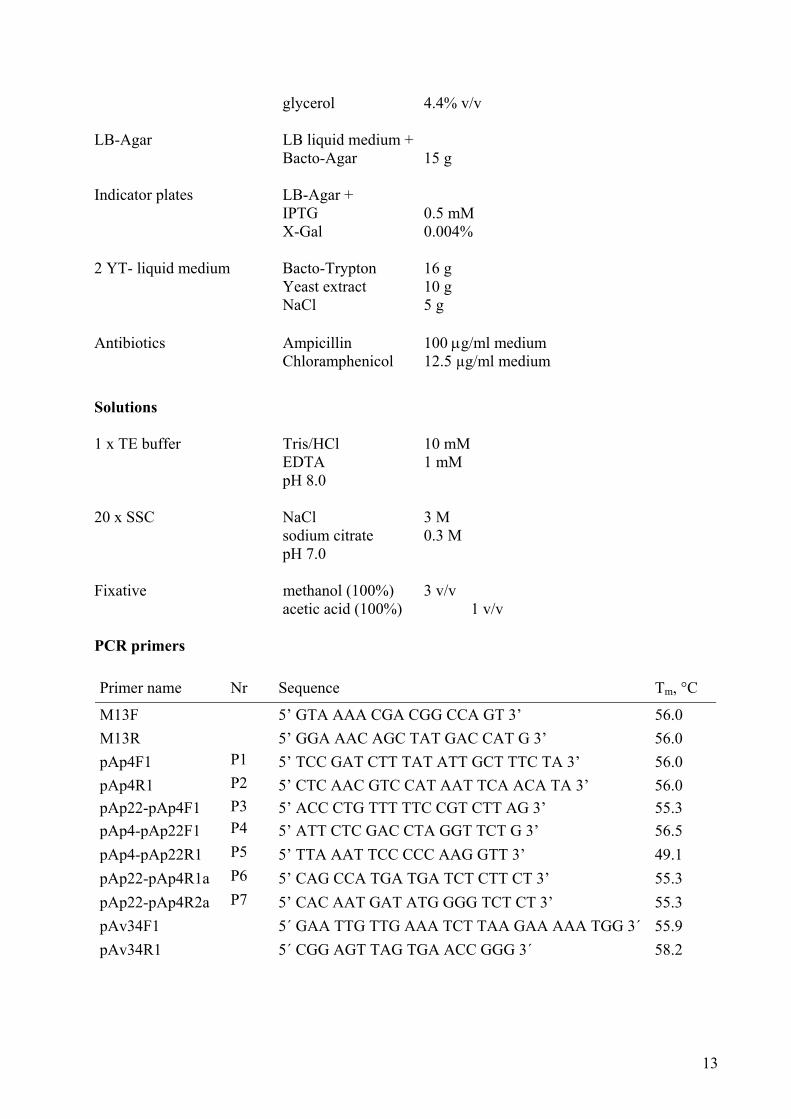
acetic acid (100%) 1 v/v PCR primers Primer name Nr Sequence Tm, °C
M13F 5’ GTA AAA CGA CGG CCA GT 3’ 56.0 M13R 5’ GGA AAC AGC TAT GAC CAT G 3’ 56.0 pAp4F1 P1 5’ TCC GAT CTT TAT ATT GCT TTC TA 3’ 56.0 pAp4R1 P2 5’ CTC AAC GTC CAT AAT TCA ACA TA 3’ 56.0 pAp22-pAp4F1 P3 5’ ACC CTG TTT TTC CGT CTT AG 3’ 55.3 pAp4-pAp22F1 P4 5’ ATT CTC GAC CTA GGT TCT G 3’ 56.5 pAp4-pAp22R1 P5 5’ TTA AAT TCC CCC AAG GTT 3’ 49.1 pAp22-pAp4R1a P6 5’ CAG CCA TGA TGA TCT CTT CT 3’ 55.3 pAp22-pAp4R2a P7 5’ CAC AAT GAT ATG GGG TCT CT 3’ 55.3 pAv34F1 5´ GAA TTG TTG AAA TCT TAA GAA AAA TGG 3´ 55.9 pAv34R1 5´ CGG AGT TAG TGA ACC GGG 3´ 58.2
13
2.2.Methods
2.2.1. Molecular methods
2.2.1.1. Isolation of DNA
The DNA isolation methods are based on the stepwise purification of DNA by the removal of
cell walls, proteins, lipids and other cell components. First, the tissue is mechanically
disintegrated either by grinding in the liquid nitrogen followed by dissolving in a detergents-
containing buffer, or by alkaline lysis. Precipitation of proteins follows, afterwards the RNA
is removed enzymatically and the DNA is deionized and precipitated by washing in ethanol.
Finally, the DNA is resuspended in the appropriate buffer or water and can be stored by +4°C
or –20°C.
Isolation of genomic DNA
Genomic DNA was isolated from young leaves using the CTAB standard protocol (Saghai-
Maroof et al. 1984). CTAB served as a detergent disintegrating membranes to separate DNA
from proteins and lipids. The chelating agent EDTA was added to bind Mg++ to inhibit
nucleases. Proteins were extracted with chloroform-isoamylalcohol mixture. RNA was
removed by RNase A treatment. Residual salts and traces of organic solvents were removed
by subsequent alcohol precipitation. The resulting DNA was pure and can be used in all
molecular and cytological applications.
1. The leaf material was vacuum dried overnight or directly pulverized with the liquid
nitrogen.
2. 3.5 – 5.0 g of the leaf powder (raw weight) were transferred into a 50 ml tube containing
12,5 ml of pre-warmed CTAB buffer (0.1 M Tris, 0.01 M EDTA, 0.7 M NaCl, 1%
CTAB, pH 8.0) and 18 µl ß-mercaptoethanol and incubated for 30 min at 65°C.
3. 5 ml of chloroform:isoamylalcohol = 24:1 v/v was added to the probe, the tube was
vortexed and mixed overhead for 10 min.
4. The sample was centrifuged for 15 min at 5000 rpm, RT.
5. The upper phase was transferred into a 50 ml tube and 2 µg of RNase A were added. The
sample was incubated for 30 min at 37°C.
6. 7 ml of 100% isopropanol were added to the probe and the tube was inverted 20 times
and centrifuged for 2 min at 5000 rpm, RT.
14
7. The pellet was washed with 2 ml of 76% ethanol with 0.2 M sodium acetate, incubated
for 10 min at RT and centrifuged for 1 min at 5000 rpm, RT.
8. Finally, the pellet was washed with 1 ml of 76% ethanol with 10 mM NH4Ac, incubated
for 10 min at RT and centrifuged for 2 min at 5000 rpm, RT.
9. The resulting pellet was dried at RT and dissolved in 200-1000 µl of 1 x TE.
Preparation of high molecular weight DNA
Plant high molecular weight DNA for PFGE was isolated according to Peterson et al. (2000)
as follows:
1. Fresh leaf material was ground in the liquid nitrogen.
2. 10 g of the leaf powder (raw weight) were resuspended in 100 ml of the freshly prepared
cold isolation buffer for 30 min on ice.
3. The suspension was filtered through two layers of Miracloth into 50 ml tubes on ice.
4. The probes were centrifuged for 15 min at 3200 rpm, 4°C.
5. The pellets were resuspended in 25 ml of the isolation buffer and united in one tube.
6. The probe was filtered through one layer of Miracloth and centrifuged for 4 min at 600
rpm, 4°C.
7. The supernatant was transferred into the fresh tube and centrifuged for 15 min at 3200
rpm, 4°C.
8. The pellet was washed twice with 1 x HB.
9. The pellet was resuspended in 50 – 200 µl of 1 x HB pre-warmed to 50°C and added to
the equal volume of 1.75% low melting point agarose (InCert Agarose, FMC) in 1 x
HB with 0.5 M sucrose.
10. The plugs were poured and left to harden for 15 min at 4°C.
11. The plugs were lysed in 0.5 M EDTA pH 9.2 with 1% (w/v) sodium lauryl sarcosine and
0.1 mg/ml proteinase K at 50°C overnight.
12. The plugs were washed as follows: 1 h in 0.5 M EDTA, pH 9.0 at 50°C; 1 h in 0.05 M
EDTA, pH 8.0 on ice; three times for 1 h in 1 x TE with 0.1 mM PMSF at 4°C; three
times for 1 h in 1 x TE at 4°C.
13. The plugs can be stored in 1 x TE at 4°C for some months.
14.
Solutions:
1 x HB buffer Tris 10 mM
KCl 80 mM
15
EDTA 10 mM
pH 9.4
Isolation buffer 1 x HB +
sucrose 0.5 M
spermine 1 mM
spermidine 1 mM
Triton X-100 0.5%
ß-mercaptoethanol 0.15%
PVP 2%
Isolation of plasmid DNA
DNA of the high copy number plasmids pUC18 and pGEM-T was isolated with the GFX
Plasmid Isolation Kit (Amersham Pharmacia) according to the manufacturer’s instructions.
The method is based on alkaline lysis of bacterial cells followed by precipitation of proteins
and binding of the plasmid DNA to nitrocellulose or glass fiber matrix. Afterwards, the
bound DNA is washed with ethanol-containing buffer and eluted in water or 1xTE with a
yield of 10 µg.
Isolation of BAC-DNA
BAC-DNA was prepared as follows:
1. Four glass tubes were filled with 5 ml of 2 x YT medium with chloramphenicol, pre-
warmed to 37°C and inoculated with the BAC clone. The culture grew overnight at 200
rpm, 37°C.
2. The bacterial culture was pelleted into four 2 ml tubes by centrifugation for 3 min at 8000
rpm, RT.
3. The pellet was resuspended in 150 µl of the cold buffer containing 50 mM glucose, 10
mM EDTA, 25 mM Tris, 1% w/v lysozyme, pH 8.0 by vortexing.
4. 200 µl of the freshly prepared 0.2 M NaOH, 0.2% SDS w/v were added to the pellet, the
tubes were inverted four times and incubated 5 min at RT.
5. 150 µl of the cold 3 M potassium acetate, pH 4.8 were added. The tubes were inverted
and incubated 15 min on ice, the 10 min centrifugation at 14000 rpm, 4°C followed.
16
6. The supernatants were transferred into the tubes containing 400 µl of the cold
phenol:chloroform:isoamylalcohol = 24:24:1 v/v and vortexed. A 5 min centrifugation at
14000 rpm, 4°C followed.
7. The supernatants were united in a 2 ml tube, 1 µg of RNase A was added and the samples
were incubated 30 min at 37°C.
8. 800 µl of ice-cold 100% ethanol were added, the tube was vortexed and centrifuged for
15 min at 1400 rpm, 4°C.
9. The pellet was washed with 500 µl of ice-cold 70% ethanol for 5 min at 14000 rpm, 4°C.
10. After drying, the pellet was resuspended in 20 µl sterile distilled water for 20 min at
55°C.
This method yielded two µg BAC-DNA for FISH applications.
2.2.1.2. Restriction of DNA and agarose gel electrophoresis
The method is based on the ability of type II restriction endonucleases to specifically
recognize nucleotide patterns and to cut the DNA strand at this sites. The resulting negatively
charged restriction fragments migrate in the electric field to the positive pole. Smaller
fragments migrate faster, and so the DNA molecules can be separated electrophoretically in
the agarose gel medium according to their size.
Restriction of plasmid or genomic DNA
The restriction was performed at the temperature and in a buffer optimal for the endonuclease
according to the manufacturer’s instructions.
Typically, 500 ng of plasmid DNA were digested with five units of the restriction
endonuclease for 2 h.
For complete digestion, one µg genomic DNA was treated with ten units of the restriction
endonuclease overnight.
For partial digestion, two µg of genomic DNA were treated with 0.25 to 5.0 units of the
restriction endonuclease for two min.
Restriction of high molecular weight DNA
The restriction of high molecular weight DNA was performed directly in plugs as follows:
1. Solidified agarose plugs containing the DNA were equilibrated for one hour at 4°C in the
appropriate restriction buffer.
17
2. The plugs were cut into small pieces, briefly equilibrated at 37°C, and digested for 16 h
with 100 units restriction endonuclease in 200 µl total volume.
3. Reactions were stopped by adding 20 µl 0.5 M EDTA pH 8.0.
Agarose gel electrophoresis
DNA fragments were separated in horizontal electrophoresis systems at 3–9 V/cm in 1 x
TAE buffer (40 mM Tris-Ac, 1 mM EDTA, pH 8.0). The gel concentration varied from
0.75% for genomic DNA to 1.3% for fragments smaller than 300 bp. For visualization of the
DNA, ethidium bromid was added into the gels to final concentration of 5%. The data were
analyzed with the GelDoc 2000 system (BioRad).
Pulsed field agarose gel electrophoresis
For pulsed field electrophoresis separation, the plugs containing HMW DNA were melted at
65°C and loaded onto 1% agarose gel in 0.5 TBE (45 mM Tris, 45 mM boric acid, 0.1 mM
EDTA, pH 8.0). The electrophoresis was performed in a CHEF-DR III Variable Angle
System (BioRad) under following running parameters: ramping from 1 to 40 sec, angle 120°,
6 V/cm, 18 h at 14°C followed by ramping from 3 to 5 sec, angle 120°, 6 V/cm, 6 h at 14°C.
For visualization of the DNA, the gels were stained in 5% ethidium bromid water solution for
10 min.
2.2.1.3. Polymerase chain reaction
PCR is a sensitive method allowing specific amplification of DNA fragments up to 3 kb long.
The particular stretch of DNA to be amplified, called the target sequence, is identified by a
specific pair of DNA primers which are 18-22 bp long. There are three basic steps in a PCR
cycle. The first is the denaturation of the double-strand target. The second step is the
annealing of the primers to their complementary bases on the single-stranded DNA template.
The third is elongation, where DNA is synthesised by a polymerase. Starting from the primer,
the polymerase can read a template strand and match it with complementary nucleotides. The
result were two new helixes in place of the first, each composed of one of the original strands
plus its newly assembled complementary strand. Thus, every cycle results in a doubling of
the number of strands DNA present. The selection of primers as well as optimization of the
annealing temperature and the cycles’ duration and number are crucial for the efficiency of
the reaction and have to be chosen separately for each experiment.
18
In this work, PCR was performed as follows:
1. PCR reaction template DNA 20-50 ng
forwards primer 20 pM
reverse primer 20 pM
10 x PRC buffer (Amersham) 5.0 µl
dNTP (MBI) 10 mM
Taq DNA polymerase (Amersham) 2.5 units
total volume 50 µl
2. PCR program pre-denaturation 94°C 3 min
denaturation 94°C 30 sec ⎤
amplification 56°C 30 sec ⏐35 times
elongation 72°C 90 sec ⎦
final elongation 72°C 5 min
In this cycle, the amplification temperature varied depending on the primers’ base
composition.
2.2.1.4. Ligation of DNA
The method is based on the ability of bacterial cells to maintain and replicate plasmids.
Cloning vectors are specialized artificial plasmids allowing to transfer and accumulate the
desired DNA fragments in the host bacteria. The vectors contain selectable markers,
antibiotic resistance, replication origin and multiple cloning sites/polylinkers. In the
experiments described here, the restriction DNA fragments were cloned into the pUC18
cloning vector (Roche), while the PCR fragments were cloned into the pGEM-T cloning
vector (Promega).
Ligation of DNA restriction fragments
For a sticky-ends ligation, 1 µg of the pUC18 vector were cut with 10 units of the
corresponding polylinker enzyme and the ligation was typically performed as follows:
1. 20-50 ng of the prepared vector were mixed on ice with 40-150 ng of the insert DNA, 1
unit of T-4 ligase (Gibco) and the corresponding volume of the 5x ligase buffer (Gibco).
2. The ligation was performed for 2 h at RT.
19
For a blunt-end ligation, 1 µg of the pUC18 vector were cut with 10 units of the SmaI
endonuclease and ligated as follows:
1. Prior to the ligation, the vector was dephosphorylated with one unit of calf intestine
alkaline phosphatase (MBI) in the corresponding buffer for 30 min at 37°C, followed by
the enzyme inactivation for 15 min at 85°C.
2. 20-50 ng of the prepared vector were mixed on ice with 40-150 ng of the insert DNA, 1
unit of T-4 ligase (Gibco) and the corresponding volume of the 5x ligase buffer (Gibco).
3. The ligation was performed overnight at 4°C.
Ligation of PCR products
PCR products were separated by agarose gel electrophoresis and purified from the gel with
the NucleoSpin Extract Kit (Machery-Nagel) according to the manufacturer’s instructions.
PCR products were cloned into pGEM-T cloning vector according to the manufacturer’s
instructions.
2.2.1.5. DNA transformation
Prior to the transformation, the ligations were purified by ethanol precipitation.
1. 0.1 volume of 3 M sodium acetate and 2.5 volumes of ice-cold 100% ethanol were added
to the ligation volume.
2. The DNA was precipitated for 30 min at –70°C and fallen by centrifugation for 20 min at
14000 rpm, 4°C.
3. The DNA pellet was washed with 200-500 µl of the ice-cold 70% ethanol for 5 min at
14000 rpm, 4°C.
4. The pellets were dried for 3 min at 37°C and resuspended in 10 µl sterile water.
The ligated fragments were transformed into E. coli DH10B electrocompetent cells
(Invitrogen).
1. 1-5 µl of the ligation were mixed in 0.2 cm cuvettes (BioRad) with 25-50 µl of the host
cells and electroporated with the EasyjecT Prima (Equibio) at 1.8 kV.
2. Transformed cells were recovered in 1 ml of liquid LB medium for 35 min at 37°C and
finally grown on indicator plates overnight at 37°C.
3. The white colonies were selected and inoculated in LB medium with ampicillin and
grown overnight at 220 rpm, 37°C.
20
2.2.1.6. Southern hybridization
The method is based on the ability of a DNA probe to bind complimentary to the target DNA.
The target DNA is transferred after the agarose gel electrophoresis onto the positively
charged nylon membrane. The probe is labelled with the radioactive isotop. The produced
pattern is detected by autoradiography.
Preparation of Southern membranes
Agarose gels were exposed to UV light for 1 min and the DNA was transferred by alkaline
method under denaturing conditions in 0.4 N NaOH onto positively charged Hybond N+
membranes (Amersham Pharmacia). The membranes were washed with 2 x SSC for 5
min at RT and fixed for 20 min at 80°C.
Random prime labelling of DNA probes
DNA probes were labelled with 32P as follows:
1. 40-60 ng of the DNA were resuspended in water to a final volume of 70 µl.
2. The probe was denatured for 10 min at 95°C and quickly chilled on ice.
3. The following reagents were added to the probe: 10 µl of 10 x Klenow buffer (USB), 500
units of the Pd(N)6 random primer (Pharmacia Biotech), 4 µl of 0.5 mM dGTP/ dTTP, 2
µl of α-32P-dATP, 2 µl of α-32P-dCTP, 2 µl of Klenow polymerase (USB).
4. The mixture was incubated for 1 h at 37°C.
5. The labelled probe was purified from unincorporated radionucleotides via Sephadex G-50
equilibrated in 1 x TE.
Southern hybridization
The Southern hybridization was performed as follows:
1. The Hybond N+ membranes were briefly rinsed in 2 x SSC and pre-hybridized in 50 ml of
5 x SSPE with 5 x Denhardt solution and 0.2% SDS for 2 h at 60°C.
2. The membranes were transferred into hybridization tubes containing 20 ml hybridization
solution and the labeled heat-denatured probe was added.
3. The membranes were hybridized at 60°C overnight to achieve desired stringency.
4. The membranes were washed twice for 10 min in 1 x SSC/0.1% SDS at 60°C.
5. The autoradiograms were taken on the double-coated X-Ray film Hyperfilm-MP
(Amersham Pharmacia).
21
Solutions:
1 x SSPE Na2HPO4 10 mM
NaCl 150 mM
EDTA 2 mM
pH 7.4
2.2.1.7. Sequence analysis
The dideoxy sequencing method (Sanger & Coulson 1975) is based on the enzymatic
incorporation of ddNTPs into the DNA template by PCR. The nucleotides complementary to
the template are coupled to the infrared labelled primer on the 3' end. When a ddNTP is
incorporated, the extension reaction stops. After the sequencing reaction, the fragments with
the length variation of only one base pair can be separated by the electrophoresis in
acrylamide gel.
Sequencing in denaturing polyacrylamide gel
In the experiments described here, the plasmid DNA was sequenced in 0.25 mm thick 8%
polyacrylamide sequencing gel on a LI-COR 4200 automat using a cycle-sequencing kit
SequiTherm EXCEL II (Epicentre Technologies) following the manufacturer’s instructions.
1. For every probe four separate PCR reactions with each of ddATP, ddCTP, ddGTP and
ddTTP Termination Mixes were performed with the infrared end-labeled primers:
PCR reaction template DNA 75 ng
sequencing primer 2 pM
DMSO 0.2 µl
10 x sequencing buffer 0.6 µl
ddNTP Termination Mix 2 µl
SequiTherm EXCEL II DNA polymerase 1.25 units
total volume 6 µl
PCR program pre-denaturation 95°C 5 min
denaturation 95°C 30 sec ⎤
amplification 56°C 15 sec ⏐30 times
elongation 70°C 60 sec ⎦
22
final elongation 70°C 5 min
The amplification temperature varied depending on the primers’ base composition.
2. 3 µl of Stop/Loading Buffer were added and the probes were denatured for 5 min at 95°C.
3. 1.5 µl probe were loaded onto a sequencing gel and separated at 1.5 kV, 45°c for 16 h.
Denaturing polyacrylamide gel:
Acrylamide solution acrylamide / N,N'-methylenebisacrylamide
(Amersham) 7%
urea 7 M
Tris 134 mM
EDTA 2.5 mM
boric acid 45 mM
pH 7.0
Gel solution acrylamide solution 35 ml
DMSO 350 µl
TEMED 35 µl
ammonium persulfate, 10% 245µl
Sequencing in a capillary automated system
Alternatively, sequencing was performed in an automated capillary electrophoresis system
CEQ 8000 (Beckman Coulter). The capillars are filled with a patented linear polyacrylamide
gel (Beckman Coulter), the samples are denatures and loaded, the voltage program applied
and the data analyzed automatically.
The PCR reactions were performed with unlabelled primers and CEQ DTCS Quick Start Kit
(Beckman Coulter) containing dNTPs, ddNTPs (WellRED label), Tris–HCL, MgCl2 reaction
buffer pH 8.9, Thermo Sequenase DNA Polymerase, pyrophosphatase and glycogen as
follows:
PCR reaction template DNA 200 ng
sequencing primer 3.2 pM
The samples were pre-denatured for 5 min at 95°C and put on ice.
DTCS Premix (Beckman Coulter) 4 µl
total volume 20 µl
23
PCR program denaturation 95°C 20 sec ⎤
amplification 56°C 20 sec ⏐30 times
elongation 60°C 4 min ⎦
The amplification temperature varied depending on the primers’ base composition.
The sequencing was performed according to the manufacturers’ instructions (Beckman
Coulter).
Computerized sequence analysis and databanks research
Sequencing misreadings were corrected and the data were analyzed and aligned with the
DNAStar 4.03 software (Lasergene).
Phylogenetic analyses using either maximum likelihood or neighbor joining were performed
with winPAUP 4.0b10 (Swofford 2002) on a Pentium IV. Maximum likelihood analyses
were executed assuming a Hasegawa, Kishino and Yano model HKY (Hasegawa et al. 1985),
and a rate variation among sites following a gamma distribution G (four categories
represented by mean). HKY+G was chosen as the model that best fits the data by Modeltest
v3.6 (Posada & Crandall 1998) employing the windows interface MTgui (Nuin 2005). The
proposed settings by Modeltest v3.6 were executed in winPAUP 4.0b10. For the pAv34 360
bp-monomers data set the following settings were used: BaseFreq=(0.3235 0.1739 0.1888),
Nst=2, TRatio=0.7455, Rates=gamma, Shape=3.1908, Pinvar=0, whereas the pAv34 subunits
data set employed the following setting: BaseFreq=(0.33760 0.16660 0.16650), Nst=2,
TRatio=0.6851, Rates=gamma, Shape=7.9086, Pinvar=0. As measurement of statistical
support for the individual branches maximum likelihood bootstrap analyses were performed
with 500 replicates, employing the same settings as in the likelihood analyses for the
individual data sets. Topologies found were compiled and drawn using TreeGraph (Müller &
Müller 2004), with the maximum likelihood bootstrap values along the branches.
Homologies with other sequences were investigated by searching the GenBank and EMBL
databases.
24
2.2.2. Molecular cytogenetic methods
2.2.2.1. Preparation of plant chromosomes
Meristematic tissues of young plants are the most suitable material for chromosome
preparations. For the chromosome spreads the tissues have to be treated with metaphase-
arresting agents and fixed.
Fixation of plant material
The plant material was pre-treated and fixed as follows:
1. The flower and leaf material was collected 4-5 h after dawn. Roots from seedlings were
harvested when they reached the length of 0.5-1.0 cm.
2. Flowers were fixed directly in the fixative. Leave and root meristems were pre-treated
with 2 mM 8-hydroxychinolin for 2.5-3.5 h depending on the desirable rate of
chromosome condensation and transferred into fresh fixative.
3. The fixative was changed one after a 2 h incubation at RT. Fixed material could be stored
at –20°C for a few months.
Preparation of mitotic chromosomes
The dropping method enabled to prepare a large number of microscopy slides of uniform
quality. It was applied for the preparation from young leaves and root tips according to
Schwarzacher & Heslop-Harrison (2000) with modifications.
1. Fixed plant material was washed once for 5 min in water and twice for 5 min in citrate
buffer at RT.
2. The material was transferred in the appropriate enzyme solution in citrate buffer:
Enzyme solution for cultivated beet leaves:
17,8% cellulase Aspergillus niger (Sigma C-1184)
0,77% cellulase Onozuka R 10 (Serva 16419)
3,0% pectinase Aspergillus niger (Sigma P-4716)
Enzyme solution for wild beet leaves:
2,0% cellulase Aspergillus niger (Sigma C-1184)
4,0% cellulase Onozuka R 10 (Serva 16419)
2,0% cytohelicase Helix pomatia (Sigma C-8274)
25
0,5% pectolyase Aspergillus japonicus (Fluka 76305)
20% pectinase Aspergillus niger (Sigma P-4716)
Enzyme solution for roots:
2,5% pectinase Aspergillus niger (Fluka 17389)
2,5% cellulase Onozuka R 10 (Serva 16419)
2,5% pectolyase Aspergillus japonicus (Fluka 76305)
1,0% cytohelicase Helix pomatia (Sigma C-8274)
Leaves were incubated for 3 h at 37°C or overnight at RT. Roots were incubated for 1 h at
37°C.
3. Afterwards the material was macerated with the forceps and preparative needle, mixed
carefully with a 200 µl pipette and was incubated again for 10-15 min at 37°C.
4. Material was washed twice with citrate buffer by centrifugation for 5 min at 4000 rpm,
RT.
5. The buffer was replaced with fresh fixative after centrifugation, twice for 5 min at 4000
rpm, RT and once for 6 min at 4500 rpm, RT.
6. After the final centrifugation, the supernatant was carefully removed with a Pasteur
pipette leaving only 100 µl of the nuclei suspension in the tube. The walls of the tube
were carefully rinsed with another 50-100 µl of the fresh fixative.
7. 13 µl of the mixed material were dropped onto an acid-cleaned glass slide from the height
of 50 cm. The slide was shaked off to release the nuclei from the cytoplasm.
8. Slides were examined with the phase-contrast microscope Zeiss Axioscop 40 at
magnifications x10 and x40 and could be stored at 4°C for a few months.
Preparation of meiotic chromosomes
Meiotic chromosomes were prepared from anthers by squashing method, which allowed to
dissect every flower bud individually and thus to get slides with consecutive stages of
meiosis. The buds located at the apex of a flower spike and appearing white after fixation had
young anthers with incomplete meiosis. The 0.45-0.70 mm anthers usually contained meiotic
stages from zygotene to pachytene (Desel 2002) and were suitable material for FISH
chromosomal preparations. However, those sizes gave only an indication, and every
preparation had to be checked individually for the presence of chromosomes of suitable
morphology.
26
1. Fixed flower buds were washed once for 5 min in water and twice for 5 min in citrate
buffer at RT.
2. Material was incubated for up to 3 h at 37°C or overnight at 4°C in the enzyme solution
in citrate buffer containing:
3,0% cellulase Aspergillus niger (Sigma C-1184)
0,3% cellulase Onozuka R 10 (Serva 16419)
0,3% pectolyase Aspergillus japonicus (Fluka 76305)
0,3% cytohelicase Helix pomatia (Sigma C-8274)
3. Buds were dissected individually under a stereo microscope. A single anther was
transferred onto a fresh glass slide in a drop of 60% acetic acid and incubated for 2-3 min.
4. Material was covered with a cover slip, tipped with a toothpick and squashed.
5. The slide was quickly examined under the phase-contrast microscope Zeiss Axioscop 40
at magnifications x20 and x40 and suitable preparations were immediately frozen on dry
ice.
6. Cover slips were flicked off with a razor blade. Slides could be stored at 4°C for a few
months.
Solutions:
Citrate buffer citric acid 4 mM
sodium citrate 6 mM
pH 4.5
2.2.2.2. Preparation of extended DNA fibers
Young tissue without pigments (seedlings or roots) was the most suitable source for the
preparation of extended DNA fibers. The plant material was used directly without pre-
treatment.
1. 10-20 seedlings were chopped in a glass Petri dish on ice in NIB with a razor blade until
the suspension of nuclei with the rests of plant tissue was formed.
2. The suspension was filtered consecutively through the 100 µm, 50 µm and 20 µm nylon
meshes and centrifuged for 4 min at 3000 rpm, 4°C.
3. The pellet of nuclei was carefully dissolved in 20 µl of NIB.
4. To control the quality of the preparation, 2 µl of the nuclei suspension were mixed with
DAPI solution on a glass slide and examined under the UV-microscope.
27
5. 1.5 µl of the nuclei suspension were spread on the upper part of the glass slide and dried
at RT.
6. 40 µl drops of STE were applied onto each end of the slide, the preparation was
incubated, covered with a 50 mm long glass cover slip and incubated horizontally for 1
min.
7. The slide was tilted carefully until the cover slip slid off slowly.
8. The preparation was air-dried in a rack, fixed in fresh fixative for 3 min at RT and
incubated for 30 min at 60°C on a hot plate. Slides have to be used freshly.
Solutions:
NIB: Tris HCl 10 mM
EDTA 10 mM
KCl 100 mM
sucrose 500 mM
spermine 1 mM
spermidine 4 mM
ß-mercaptoethanol 0.1% v/v
pH 9.5
STE: SDS 0.5% w/v
Tris HCl 100 mM
EDTA 5 mM
pH 7.0
2.2.2.3. Labelling of DNA probes for FISH
In order to detect specific DNA sequences on plant chromosomes or chromatin fibers, the
corresponding probes were labelled with biotin or digoxigenin and detected immunologically
with the antibodies coupled to fluorescent fluorochromes.
Labelling by PCR
Labelling by PCR was suitable for DNA probes less than 3 kb long and was performed as
follows:
1. PCR reaction template DNA 20-50 ng
28
forward primer 20 pM
reverse primer 20 pM
10 x PRC buffer (Amersham) 5.0 µl
dNTPs (MBI) 10 mM
digoxigenin-11-dUTP 1.75 nM
or biotin-16-dUTP 3.5 nM
Taq DNA polymerase (Amersham) 2.5 units
total volume 50 µl
2. PCR program pre-denaturation 94°C 3 min
denaturation 94°C 30 sec ⎤
amplification 56°C 30 sec ⏐35 times
elongation 72°C 90 sec ⎦
final elongation 72°C 5 min
The amplification temperature varied depending on the primers’ base composition.
The quality of the labelling was checked by agarose gel electrophoresis. The labelled probe
migrates slower than the unlabelled control PCR product and is visible in the gel as a shifted
band.
Labelling of DNA probes for FISH by nick translation and by random priming
These labelling methods were applied for DNA probes larger than 3 kb.
Labelling by nick translation
The nick translation method is based on the ability of the DNase I to introduce randomly
distributed breaks of a single strand, or nicks, into DNA. The nicks are than filled by DNA-
polymerase I, which replaces the removed nucleotides with digoxigenin- or biotin-labelled
ones.
Labelling by nick translation was performed with DIG-Nick Translation and Biotin-Nick
Translation kits (Roche) following the manufacturer’s instructions.
Labelling by random priming
Digoxigenin-labelled probes can be also generated by the random primed labelling. The
method utilizes 6-10 bp long oligonucleotides (“random primers”) which anneal
29
complementary to the template DNA. The Klenow fragments of E. coli DNA-polymerase I
synthesizes the new complementary strand incorporating digoxigenin-labeled nucleotides.
Labelling by random priming was performed with DIG-High Prime kit (Roche) following the
manufacturer’s instructions.
Assessment of the labelling quality
The quality of the labelling was estimated by the colour reaction.
1. 0.5 µl and 1.0 µl of the probe and 0.5 µl of the control labelled DNA were spotted onto
Hybond N+ membranes (Amersham Pharmacia) and dried for 5 min at RT.
2. The membrane was placed in a UV-transilluminator for 30 sec and equilibrated in 0.1 M
Tris-HCl, 0.15 M NaCl, pH 7.5 for 1 min.
3. The membrane was incubated with 0.5% liquid protein block (Roche) in 0.1 M Tris-HCl,
0.15 M NaCl, pH 7.5 for 30 min.
4. The membrane was incubated with the antibody solution containing 1 µl of anti-DIG-AP
(Roche) and / or 5 µl of anti-biotin-AP (Roche) depending on the labelling in 5 ml of 0.1
M Tris-HCl, 0.15 M NaCl, pH 7.5 for 30 min at 37°C.
5. The membrane was washed in 0.1 M Tris-HCl, 0.15 M NaCl, pH 7.5 for 15 min and in
0.1 M Tris-HCl, 0.01 M NaCl, 0.05 M MgCl2, pH 9.5 for 2 min.
6. The detection solution containing 75 µl of NTP/BCIP (Roche) in 5 ml of 0.1 M Tris-HCl,
0.01 M NaCl, 0.05 M MgCl2, pH 9.5 was poured over the membrane and the probe was
incubated for 10 min in the dark avoiding agitation.
7. The relative intensity of the resulting colour dots allowed to estimate the quality of the
labelling.
The labelled probes were purified from the unincorporated label by ethanol precipitation (see
Chapter 2.2.1.4).
2.2.2.4. Fluorescent in situ hybridization
Fluorescent in situ hybridization is a powerful method allowing the visualization of DNA
sequences labelled with fluorescent dyes on the chromosomes or chromatin fibers under the
UV-microscope. The procedure consists of the pre-treatment of chromosome spreads,
hybridization, post-hybridization washes and the immunological detection of the probes.
30
In situ hybridization on chromosome spreads
In situ hybridization and probe detection was performed according to Heslop-Harrison et al
(1991) modified for beet by Schmidt et al. (1994) During the whole FISH procedure, the
preparations should be treated very carefully and once wet, they should not dry out.
Pre-treatment of chromosome preparations
1. The microscopy slides were aged overnight at 37°C in an incubator. The area containing
chromosome spreads was indicated with a diamond pen.
2. Two µg of RNase A in 200 µl of 2 x SSC were applied per slide, the preparations were
covered with plastic cover slips and incubated in a humid chamber for 1 h at 37°C.
3. After the incubation, the cover slips were carefully removed and the slides were washed
three times for 5 min with 2 x SSC in a Coplin jar.
4. Slides were equilibrated in 0.01 N HCl for 1 min, and 10 µg pepsin in 200 µl of 0.01N
HCl were applied per slide. The preparations were covered with plastic cover slips and
incubated in an in situ thermocycler Touchdown (ThermoHybaid) for 5 min at 37°C.
5. The cover slips were carefully removed and the slides were washed three times for 5 min
with 2 x SSC in a Coplin jar.
6. After washing, the preparations were fixed in freshly prepared 4% formaldehyde solution
for 15 min in a Coplin jar. Three washing steps 10 min each with 2xSSC in a Coplin jar
followed.
7. The slides were dehydrated in 70% and 96% ethanol for 3 min and air-dried.
Hybridization of the probe
8. 30 µl of the hybridization solution were applied in small drops onto dried slides, the
preparations were covered with plastic cover slips, denatured and stepwise chilled in the
in situ thermocycler Touchdown (ThermoHybaid) and hybridized overnight at 37°C in a
humid chamber.
The hybridization solution contained: formamide 50%
dextran sulphate 20%
SDS 0.2%
sonicated salmon sperm DNA 50 ng/µl
labelled probes 10-100 ng/µl
in 2 x SSC
This composition had stringency of 76 % at 37°C.
31
The denaturation program was: 70°C 8 min
55°C 5 min
50°C 2 min
45°C 3 min
37°C overnight
Post-hybridization washing
9. The cover slips were carefully removed in 2 x SSC pre-warmed to 37°C and the
preparations were washed at 79 % stringency in 20% formamide in 0.1 x SSC twice for 5
min at 42°C.
10. The washing solution was removed by rinsing for 5 min in 2 x SSC twice at 42°C and
once at 37°C.
Detection of fluorescent signals
11. The slides were equilibrated in 4 x SSC/0.2% Tween for 5 min at 37°C.
12. 200 µl of 5% BSA in 4 x SSC/0.2% Tween were applied per slide and the preparations
were incubated under plastic cover slips for 30 min at 37°C in a humid chamber.
13. 50 µl of the appropriate antibody dilution in 3% BSA in 4 x SSC/0.2% Tween were
applied per slide and the preparations were incubated under the same plastic cover slips
for 1 h at 37°C in a humid chamber.
Antibody dilutions:
for digoxigenin labelled probes Anti-DIG-FITC (Roche) 1:75
for biotin labelled probes Streptavidin-Cy3 (Sigma) 1:200
14. After the detection, unbound antibody was washed off for 10 min three times in
4 x SSC/0.2% Tween at 37°C.
15. Finally, 2 µg/ml DAPI solution and an anti-fading solution CityFluor AF1 (Chem Lab)
were applied, the preparations were covered with glass cover slips and could be stored at
4°C.
In situ hybridization on DNA fibers
For in situ hybridization on extended DNA fibers the pre-treatment steps are not necessary.
32
1. 30 µl of hybridization solution were applied in small aliquots onto dried slides, the
preparations were covered with plastic cover slips, denatured 2 min at 80°C and
hybridized overnight at 37°C in a humid chamber.
The hybridization solution contained: formamide 50%
dextran sulphate 20%
SDS 0.2%
sonicated salmon sperm DNA 50 ng/µl
labelled probes 10-100 ng/µl
in 2 x SSC
2. The cover slips were carefully removed in 2 x SSC pre-warmed to 37°C and the
preparations were washed at 79 % stringency in 20% formamide in 0.1 x SSC twice for 5
min at 42°C.
3. The stringent washing solution was removed by washing for 5 min in 2 x SSC twice at
42°C and once at 37°C.
4. The slides were equilibrated in 4 x SSC/0.2% Tween for 5 min at 37°C.
5. 200 µl of blocking solution containing 5% BSA in 4 x SSC/0.2% Tween were applied per
slide and the preparations were incubated under plastic cover slips for 30 min at 37°C in a
humid chamber.
6. The probes were detected with an antibody cascade to amplify the signals. 50 µl of the
appropriate antibody dilution in 3% BSA in 4 x SSC/0.2% Tween were applied per slide
and the preparations were incubated under plastic cover slips. Every step was followed by
washing three times for 5 min in 4 x SSC/0.2% Tween at 37°C.
Detection of digoxigenin labelled probes:
Step 1 Anti-DIG-AP (Roche) 1:500
1 h at 37°C
Step 2 Fast Red detection solution (Roche) 1:5000
1 h at 37°C
Detection of biotin labelled probes:
Step 1 Streptavidin-HRP (Probes) 1:100
30 min at RT
Step 2 TSA detection solution (Probes)
5 min at RT
33
7. After the detection, the unbound antibody was washed off for 10 min three times in
4 x SSC/0.2% Tween at 37°C.
8. Finally, 15 µl of 2 µg/ml DAPI solution in an anti-fading solution CityFluor AF1 (Chem
Lab) were applied, the preparations were covered with glass cover slips and could be
stored at 4°C for years.
Re-probing of chromosome preparations
Re-probing of the FISH preparations was performed according to Schwarzacher & Heslop-
Harrison (2000). Prior to re-probing, antibodies and initial probes should be removed from
the slides. The slides should be treated extremely carefully not to damage the preparations.
1. The immersion oil was carefully removed from the cover slips.
2. The slides were pre-warmed in the incubator at 37°C and the cover slips were carefully
flicked off.
3. The preparations were washed once for 5 min in 4 x SSC/0.2% Tween at RT, three times
for 15 min in 4 x SSC/0.2% Tween at RT and once for 5 min in 2 x SSC at RT.
4. The slides were rinsed in 40% formamide in 2 x SSC at 70°C to remove the probe and
washed three times for 5 min in 2 x SSC at RT.
5. The preparations were fixed in freshly prepared 4% formaldehyde solution for 15 min in
a Coplin jar. Three washing steps 10 min each with 2xSSC in a Coplin jar followed.
6. The slides were dehydrated in 70% and 96% ethanol for 3 min and air-dried.
7. The new hybridization mix was applied and the experiment proceeded further according
to the standard FISH protocol.
2.2.2.5. Preparation of chromosome spreads for immunocytochemistry
For the immunocytochemical detection of proteins in the nucleus and cytoplasm, the plant
material should be fixed and processed in a way preserving the native structure of the
proteins. No acid treatment is applicable, and the enzymatic digestion should be controlled
carefully. The most suitable tissues are those without pigments, like roots or ethiolated
seedlings.
1. 10-20 roots were vacuum-infiltrated for 10 min in ice-cold 4% formaldehyde in MTSB
and incubated for 20 min on ice in the same solution.
2. The material was washed three times for 15 min with MTSB on ice.
34
3. The roots were transferred in an embryo cell containing the following enzyme mix:
2,5% pectinase Aspergillus niger (Fluka 17389)
2,5% cellulase Onozuka R 10 (Serva 16419)
2,5% pectolyase Aspergillus japonicus (Fluka 76305)
in MTSB and incubated for 30 min at 37°C.
4. 20 µl of macerated material were centrifuged onto a glass slide with the cytocentrifuge
Cytospin 3 (Shandon) at 2000 rpm for 5 min.
5. The preparations were stained with DAPI and examined with a UV-microscope to check
the quality. The slides could be stored in glycerol at 4°C for a few weeks.
2.2.2.6. Immunocytochemical localization of proteins
1. The preparations were pre-fixed in 4% formaldehyde in PBS for 20 min at RT.
2. The slides were washed three times 10 min in PBS in a Coplin jar at shaking.
3. 200 µl of the blocking solution containing 3% BSA in MTSB/0.2% Tween were applied
and the preparations were incubated under plastic cover slips for 60 min at RT in a humid
chamber.
4. 50 µl of the antibodies:
anti-a-tubulin (mouse-anti-rabbit, Amersham) 1:100
anti-H3 phosphorylated at Ser 10 (polyclonal rabbit, Upstate) 1:400
in 3% BSA in MTSB/0.2% Tween were applied per slide and the preparations were
incubated overnight at 4°C under plastic cover slips in a humid chamber.
5. The slides were washed three times for 10 min in MTSB.
6. The probes were detected with 50 µl of a fluorochrome-conjugated secondary antibody:
anti-mouse-FITC (Roche) 1:30 for anti-a-tubulin
anti-rabbit-rhodamin red (Roche) 1:50 for anti-H3
in 3% BSA in MTSB for 60 min at 37°C under plastic cover slips in a humid chamber.
8. Unspecifically bound antibodies were removed by washing three times for 10 min in
MTSB at RT in a Coplin jar.
9. The preparations were stained with 10 µl of DAPI solution and examined at a UV-
microscope.
35
Solutions:
MTSB: PIPES 50 mM
MgSO4 5 mM
EGTA 5 mM
pH 6.9
PBS NaCl 130 mM
Na2HPO4 7 mM
Na2HPO4 3 mM
pH 7.4
2.2.2.7. UV microscopy
Examination of slides was carried out with a Zeiss Axioplan2 Imaging fluorescent
microscope equipped with the filter sets 01 (DAPI), 15 (Cy3), 09 (FITC) and 25 (DAPI, Cy3
and FITC simultaneously). Photographs were taken on Fujicolor SUPERIA 400 negative
color print film with the following exposure times (in sec):
Fluorochrome Filter set Exposure time (sec)
DAPI filter set 01 0.2-0.5
FITC filter set 09 2-4
Cy3 filter set 15 0.5-1.0
Triple filter set 25 2-4
Double filter set 25 + DAPI-blocking filter 6-8
2.2.2.8. Digital image processing
Negatives were digitized on a Nikon LS-1000 scanner.
Alternatively, the images were acquired directly with the Applied Spectral Imaging v. 3.3
software coupled with a high-resolution CCD camera ASI BV300-20A.
Chromatin fibers were measured using the computer application MicroMeasure v. 3.2 (Reeves
& Tear 2000).
The contrast of digital images was optimized using only functions affecting the whole image
equally, and the images were printed using the Adobe Photoshop v. 3.0 software.
36
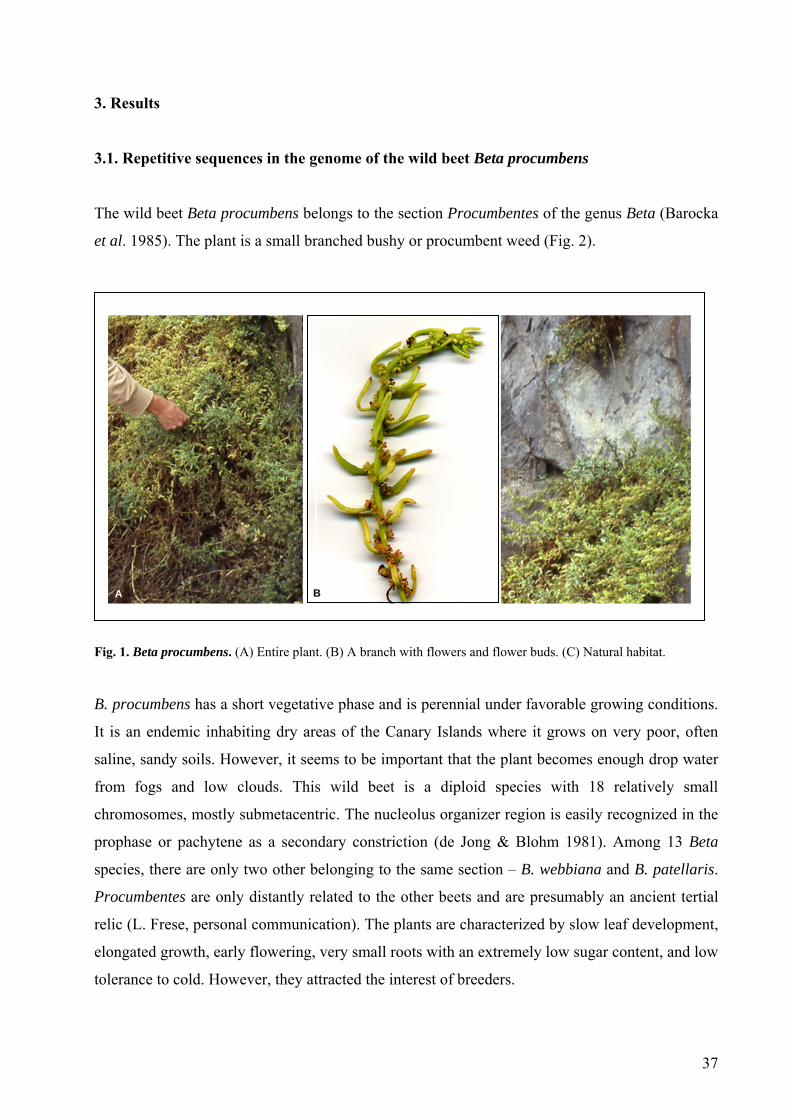
3. Results
3.1. Repetitive sequences in the genome of the wild beet Beta procumbens
The wild beet Beta procumbens belongs to the section Procumbentes of the genus Beta (Barocka
et al. 1985). The plant is a small branched bushy or procumbent weed (Fig. 2).
A B C
Fig. 1. Beta procumbens. (A) Entire plant. (B) A branch with flowers and flower buds. (C) Natural habitat.
B. procumbens has a short vegetative phase and is perennial under favorable growing conditions.
It is an endemic inhabiting dry areas of the Canary Islands where it grows on very poor, often
saline, sandy soils. However, it seems to be important that the plant becomes enough drop water
from fogs and low clouds. This wild beet is a diploid species with 18 relatively small
chromosomes, mostly submetacentric. The nucleolus organizer region is easily recognized in the
prophase or pachytene as a secondary constriction (de Jong & Blohm 1981). Among 13 Beta
species, there are only two other belonging to the same section – B. webbiana and B. patellaris.
Procumbentes are only distantly related to the other beets and are presumably an ancient tertial
relic (L. Frese, personal communication). The plants are characterized by slow leaf development,
elongated growth, early flowering, very small roots with an extremely low sugar content, and low
tolerance to cold. However, they attracted the interest of breeders.
37
While the cultivated beet has a narrow genetic base and is highly susceptible to pests, diseases
and unfavorable environmental conditions, B. procumbens is highly resistant to pests, such as
beet cyst nematode Heterodera schachtii (Savitzky 1978, Yu 1984), the fungus Cercospora
beticola, root rot caused by the bacterium Erwinia carotovora and draught and high salinity (Van
Geyt et al. 1990). Although it was recently shown that a natural gene flow by pollen may occur
between wild and crop beet population (Viard et al. 2004), this event is limited to closely related
species not efficient enough to transfer agriculturally important positive traits like resistance and
tolerance. Therefore numerous attempts have been undertaken to establish hybrids between B.
procumbens and the cultivated sugar beet (Savitsky 1975, De Jong et al. 1986, Brandes et al.
1987, Jung & Wricke 1987).
In order to enable the identification of B. vulgaris x B. procumbens hybrids, genome-specific
repetitive probes such as pTS1, pTS3, pTS4.1 (Schmidt et al. 1990) and pTS5 (Schmidt &
Heslop-Harrison 1996, Salentijn et al. 1994) were isolated from B. procumbens. They proved to
be useful markers in breeding of nematode-resistant beets (Cai et al. 1997) and in the
determination of wild beet sequences in the sugar beet genetic background (Desel et al. 2002,
Gindullis et al. 2001a). Detailed studies of the distribution, organization and evolution of
repetitive sequences of B. procumbens were performed by Schmidt & Heslop-Harrison (1996).
They characterized three Sau3AI satellite repetitive families by sequencing, Southern
hybridization and multi-color FISH.
The purpose of this part of the thesis was to isolate and study additional repetitive DNA families
of the wild beet B. procumbens in order to generate novel genome-specific probes as tools for the
analysis of interspecific Beta hybrids. The molecular structure, genomic organization including
the interspersion of dispersed repeats and species distribution of novel repeat families of
B. procumbens were investigated. Their chromosomal organization in wild and cultivated beet
was analyzed by multi-color fluorescent in situ hybridization.
3.1.1. Satellite repeats of the AluI restriction family
In order to isolate repetitive sequences from B. procumbens, genomic DNA was digested with
AluI, and restriction fragments from 150 to 600 bp were recovered from the gel and cloned. AluI
was selected as a frequently cutting endonuclease which generates restriction fragments in a size
38
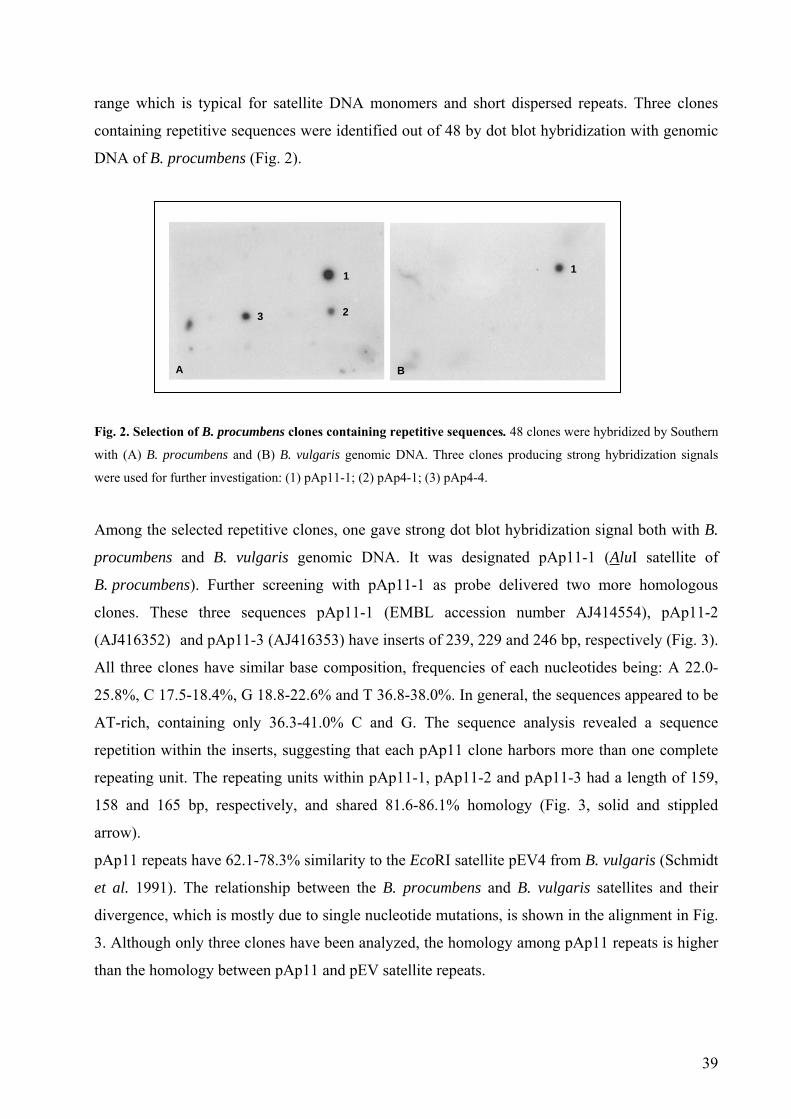
range which is typical for satellite DNA monomers and short dispersed repeats. Three clones
containing repetitive sequences were identified out of 48 by dot blot hybridization with genomic
DNA of B. procumbens (Fig. 2).
A B
1 1
2 3
Fig. 2. Selection of B. procumbens clones containing repetitive sequences. 48 clones were hybridized by Southern
with (A) B. procumbens and (B) B. vulgaris genomic DNA. Three clones producing strong hybridization signals
were used for further investigation: (1) pAp11-1; (2) pAp4-1; (3) pAp4-4.
Among the selected repetitive clones, one gave strong dot blot hybridization signal both with B.
procumbens and B. vulgaris genomic DNA. It was designated pAp11-1 (AluI satellite of
B. procumbens). Further screening with pAp11-1 as probe delivered two more homologous
clones. These three sequences pAp11-1 (EMBL accession number AJ414554), pAp11-2
(AJ416352) and pAp11-3 (AJ416353) have inserts of 239, 229 and 246 bp, respectively (Fig. 3).
All three clones have similar base composition, frequencies of each nucleotides being: A 22.0-
25.8%, C 17.5-18.4%, G 18.8-22.6% and T 36.8-38.0%. In general, the sequences appeared to be
AT-rich, containing only 36.3-41.0% C and G. The sequence analysis revealed a sequence
repetition within the inserts, suggesting that each pAp11 clone harbors more than one complete
repeating unit. The repeating units within pAp11-1, pAp11-2 and pAp11-3 had a length of 159,
158 and 165 bp, respectively, and shared 81.6-86.1% homology (Fig. 3, solid and stippled
arrow).
pAp11 repeats have 62.1-78.3% similarity to the EcoRI satellite pEV4 from B. vulgaris (Schmidt
et al. 1991). The relationship between the B. procumbens and B. vulgaris satellites and their
divergence, which is mostly due to single nucleotide mutations, is shown in the alignment in Fig.
3. Although only three clones have been analyzed, the homology among pAp11 repeats is higher
than the homology between pAp11 and pEV satellite repeats.
39
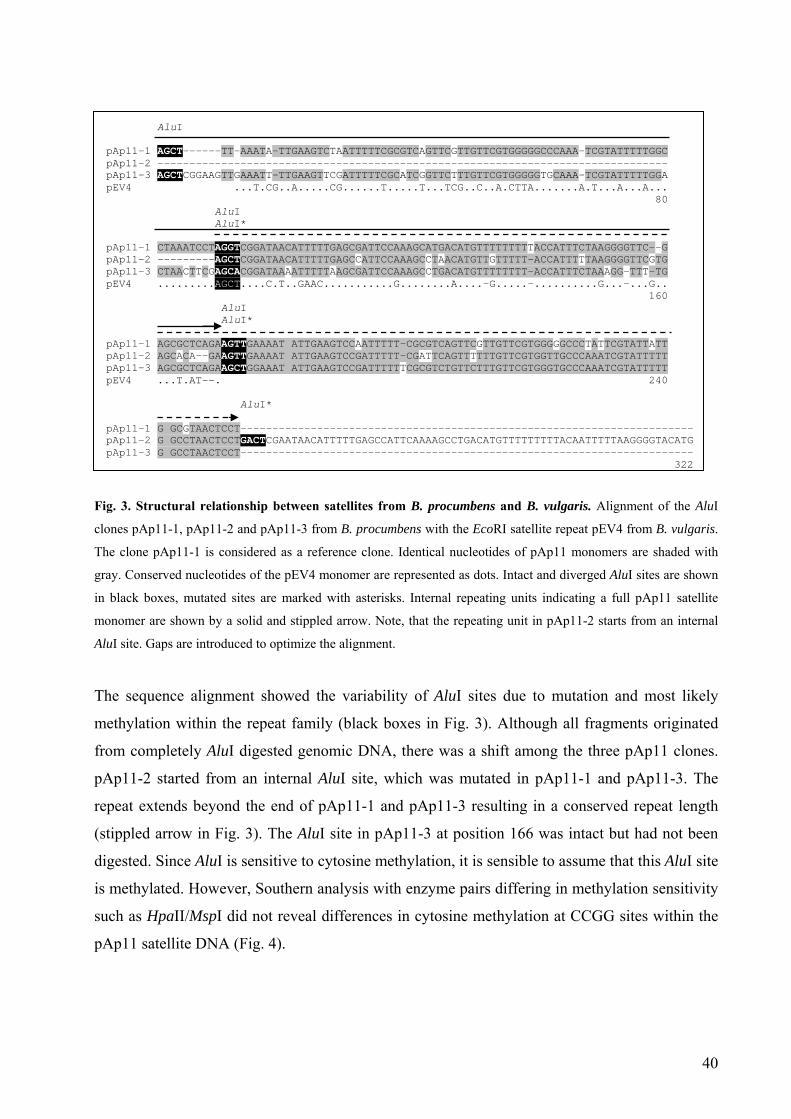
AluI pAp11-1 AGCT------TT-AAATA-TTGAAGTCTAATTTTTCGCGTCAGTTCGTTGTTCGTGGGGGCCCAAA-TCGTATTTTTGGC pAp11-2 -------------------------------------------------------------------------------- pAp11-3 AGCTCGGAAGTTGAAATT-TTGAAGTTCGATTTTTCGCATCGGTTCTTTGTTCGTGGGGGTGCAAA-TCGTATTTTTGGA pEV4 ...T.CG..A.....CG......T.....T...TCG..C..A.CTTA.......A.T...A...A... 80 AluI AluI* pAp11-1 CTAAATCCTAGGTCGGATAACATTTTTGAGCGATTCCAAAGCATGACATGTTTTTTTTTACCATTTCTAAGGGGTTC--G pAp11-2 ---------AGCTCGGATAACATTTTTGAGCCATTCCAAAGCCTAACATGTTGTTTTT-ACCATTTTTAAGGGGTTCGTG pAp11-3 CTAACTTCGAGCACGGATAAAATTTTTAAGCGATTCCAAAGCCTGACATGTTTTTTTT-ACCATTTCTAAAGG-TTT-TG pEV4 .........AGCT....C.T..GAAC...........G........A....-G.....-..........G...-...G.. 160 AluI AluI* pAp11-1 AGCGCTCAGAAGTTGAAAAT ATTGAAGTCCAATTTTT-CGCGTCAGTTCGTTGTTCGTGGGGGCCCTATTCGTATTATT pAp11-2 AGCACA--GAAGTTGAAAAT ATTGAAGTCCGATTTTT-CGATTCAGTTTTTTGTTCGTGGTTGCCCAAATCGTATTTTT pAp11-3 AGCGCTCAGAAGCTGGAAAT ATTGAAGTCCGATTTTTTCGCGTCTGTTCTTTGTTCGTGGGTGCCCAAATCGTATTTTT pEV4 ...T.AT--. 240 AluI* pAp11-1 G GCGTAACTCCT----------------------------------------------------------------------- pAp11-2 G GCCTAACTCCTGACTCGAATAACATTTTTGAGCCATTCAAAAGCCTGACATGTTTTTTTTTACAATTTTTAAGGGGTACATG pAp11-3 G GCCTAACTCCT----------------------------------------------------------------------- 322
Fig. 3. Structural relationship between satellites from B. procumbens and B. vulgaris. Alignment of the AluI
clones pAp11-1, pAp11-2 and pAp11-3 from B. procumbens with the EcoRI satellite repeat pEV4 from B. vulgaris.
The clone pAp11-1 is considered as a reference clone. Identical nucleotides of pAp11 monomers are shaded with
gray. Conserved nucleotides of the pEV4 monomer are represented as dots. Intact and diverged AluI sites are shown
in black boxes, mutated sites are marked with asterisks. Internal repeating units indicating a full pAp11 satellite
monomer are shown by a solid and stippled arrow. Note, that the repeating unit in pAp11-2 starts from an internal
AluI site. Gaps are introduced to optimize the alignment.
The sequence alignment showed the variability of AluI sites due to mutation and most likely
methylation within the repeat family (black boxes in Fig. 3). Although all fragments originated
from completely AluI digested genomic DNA, there was a shift among the three pAp11 clones.
pAp11-2 started from an internal AluI site, which was mutated in pAp11-1 and pAp11-3. The
repeat extends beyond the end of pAp11-1 and pAp11-3 resulting in a conserved repeat length
(stippled arrow in Fig. 3). The AluI site in pAp11-3 at position 166 was intact but had not been
digested. Since AluI is sensitive to cytosine methylation, it is sensible to assume that this AluI site
is methylated. However, Southern analysis with enzyme pairs differing in methylation sensitivity
such as HpaII/MspI did not reveal differences in cytosine methylation at CCGG sites within the
pAp11 satellite DNA (Fig. 4).
40
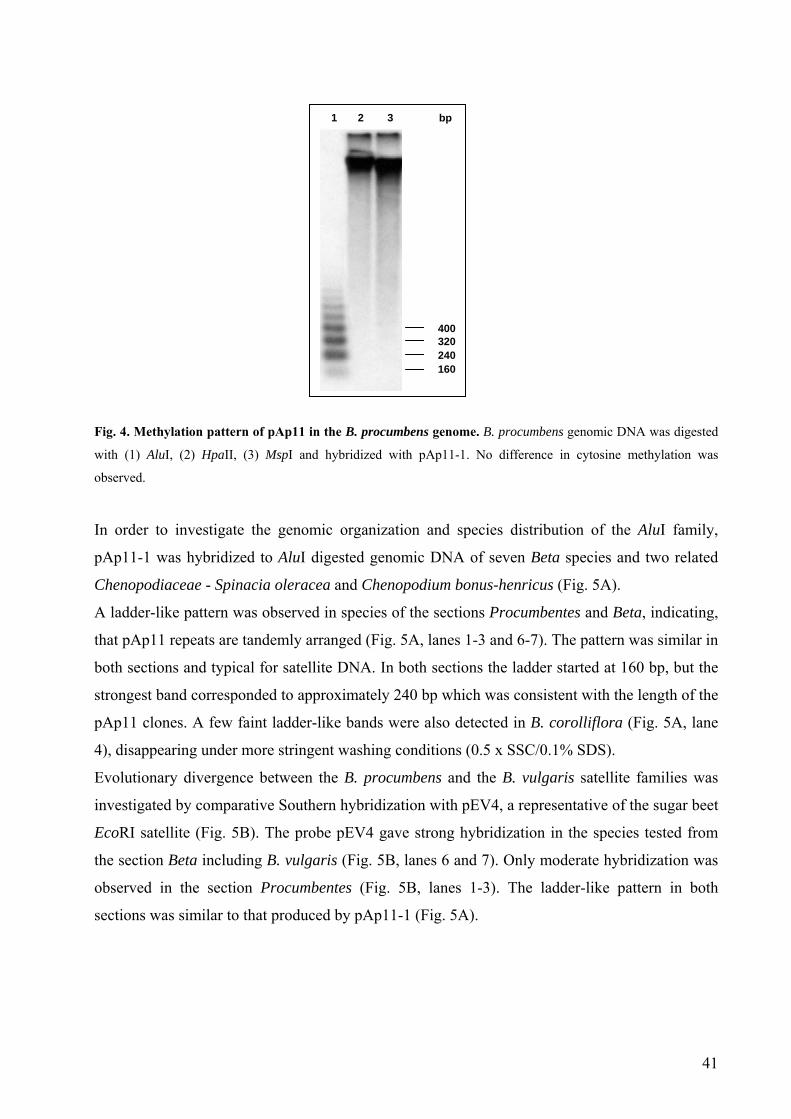
1 2 3 bp
Fig. 4. Methylation pattern of pAp11 i
with (1) AluI, (2) HpaII, (3) MspI an
observed.
In order to investigate the genom
pAp11-1 was hybridized to AluI
Chenopodiaceae - Spinacia olerac
A ladder-like pattern was observe
that pAp11 repeats are tandemly a
both sections and typical for satel
strongest band corresponded to ap
pAp11 clones. A few faint ladder
4), disappearing under more string
Evolutionary divergence between
investigated by comparative South
EcoRI satellite (Fig. 5B). The pro
the section Beta including B. vulg
observed in the section Procum
sections was similar to that produc
160 240 320 400
n the B. procumbens genome. B. procumbens genomic DNA was digested
d hybridized with pAp11-1. No difference in cytosine methylation was
ic organization and species distribution of the AluI family,
digested genomic DNA of seven Beta species and two related
ea and Chenopodium bonus-henricus (Fig. 5A).
d in species of the sections Procumbentes and Beta, indicating,
rranged (Fig. 5A, lanes 1-3 and 6-7). The pattern was similar in
lite DNA. In both sections the ladder started at 160 bp, but the
proximately 240 bp which was consistent with the length of the
-like bands were also detected in B. corolliflora (Fig. 5A, lane
ent washing conditions (0.5 x SSC/0.1% SDS).
the B. procumbens and the B. vulgaris satellite families was
ern hybridization with pEV4, a representative of the sugar beet
be pEV4 gave strong hybridization in the species tested from
aris (Fig. 5B, lanes 6 and 7). Only moderate hybridization was
bentes (Fig. 5B, lanes 1-3). The ladder-like pattern in both
ed by pAp11-1 (Fig. 5A).
41
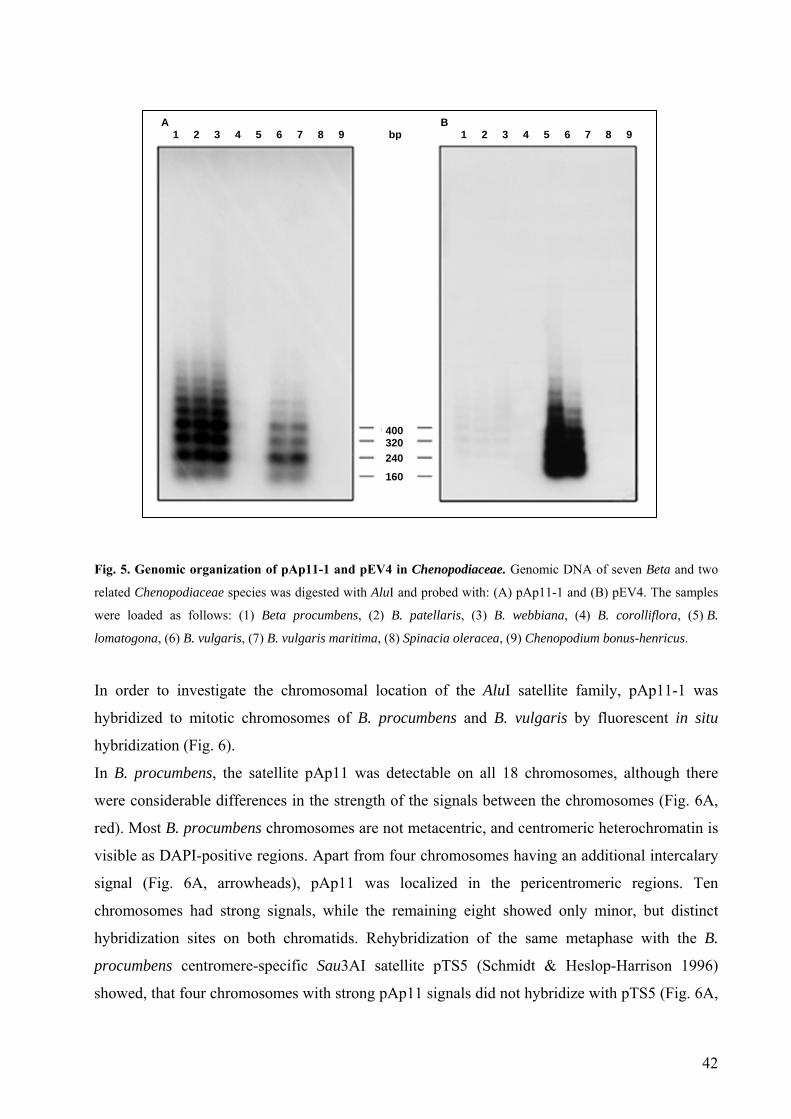
A B 1 2 3 4 5 6 7 8 9 bp 1 2 3 4 5 6 7 8 9
400 320
240
160
Fig. 5. Genomic organization of pAp11-1 and pEV4 in Chenopodiaceae. Genomic DNA of seven Beta and two
related Chenopodiaceae species was digested with AluI and probed with: (A) pAp11-1 and (B) pEV4. The samples
were loaded as follows: (1) Beta procumbens, (2) B. patellaris, (3) B. webbiana, (4) B. corolliflora, (5) B.
lomatogona, (6) B. vulgaris, (7) B. vulgaris maritima, (8) Spinacia oleracea, (9) Chenopodium bonus-henricus.
In order to investigate the chromosomal location of the AluI satellite family, pAp11-1 was
hybridized to mitotic chromosomes of B. procumbens and B. vulgaris by fluorescent in situ
hybridization (Fig. 6).
In B. procumbens, the satellite pAp11 was detectable on all 18 chromosomes, although there
were considerable differences in the strength of the signals between the chromosomes (Fig. 6A,
red). Most B. procumbens chromosomes are not metacentric, and centromeric heterochromatin is
visible as DAPI-positive regions. Apart from four chromosomes having an additional intercalary
signal (Fig. 6A, arrowheads), pAp11 was localized in the pericentromeric regions. Ten
chromosomes had strong signals, while the remaining eight showed only minor, but distinct
hybridization sites on both chromatids. Rehybridization of the same metaphase with the B.
procumbens centromere-specific Sau3AI satellite pTS5 (Schmidt & Heslop-Harrison 1996)
showed, that four chromosomes with strong pAp11 signals did not hybridize with pTS5 (Fig. 6A,
42

green). The two rDNA chromosomes showed weak hybridization with pAp11 and no signal with
the satellite pTS5 (Fig. 6A).
Fig
DN
Pro
Sig
B. v
Alth
pAp
In
the
bet
oth
hyb
of
dem
chr
chr
chr
. 6. Fluorescent in situ hybridization of satellite repeats on Beta chromosomes. Blue fluorescence shows the
A stained with DAPI. The scale bar in panel (B) corresponds to 10 µm. (A) Satellite pAp11 (red) and
cumbentes-specific centromeric repeat pTS5 (green) hybridized to a B. procumbens prometaphase spread.
nals are mostly centromeric (examples arrowed). Arrowheads indicate pAp11 sites at intercalary position. (B) In
ulgaris the satellite repeats pAp11 (green) and pEV4 (red) occupy intercalary regions of all chromosomes.
ough in most positions the repeats co-localize (yellow fluorescence), there are also sites of spatial separation of
11 arrays (arrows).
B. vulgaris, the pAp11 wild beet satellite hybridized only to intercalary sites of the majority of
chromosomes with different signal intensity (Fig. 6B, green). Signal intensity was variable
ween chromosomes: some displayed equally strong hybridization on both arms, while the
ers had a stronger signal on one arm and a weaker signal on the opposite arm. No
ridization in the pericentromeric heterochromatin was detected. Comparative FISH analysis
the same B. vulgaris metaphase by rehybridization with the sugar beet satellite pEV4
onstrated, that at the given stringency of 76 % both satellite families resided in the same
omosomal loci, making an assignment of the pAp11 and pEV4 subfamilies to specific
omosomal regions mostly impossible (Fig. 6B, yellow). However, a single pair of
omosomes carried only arrays of the pAp11 satellite in intercalary position (Fig. 6B, arrows).
43
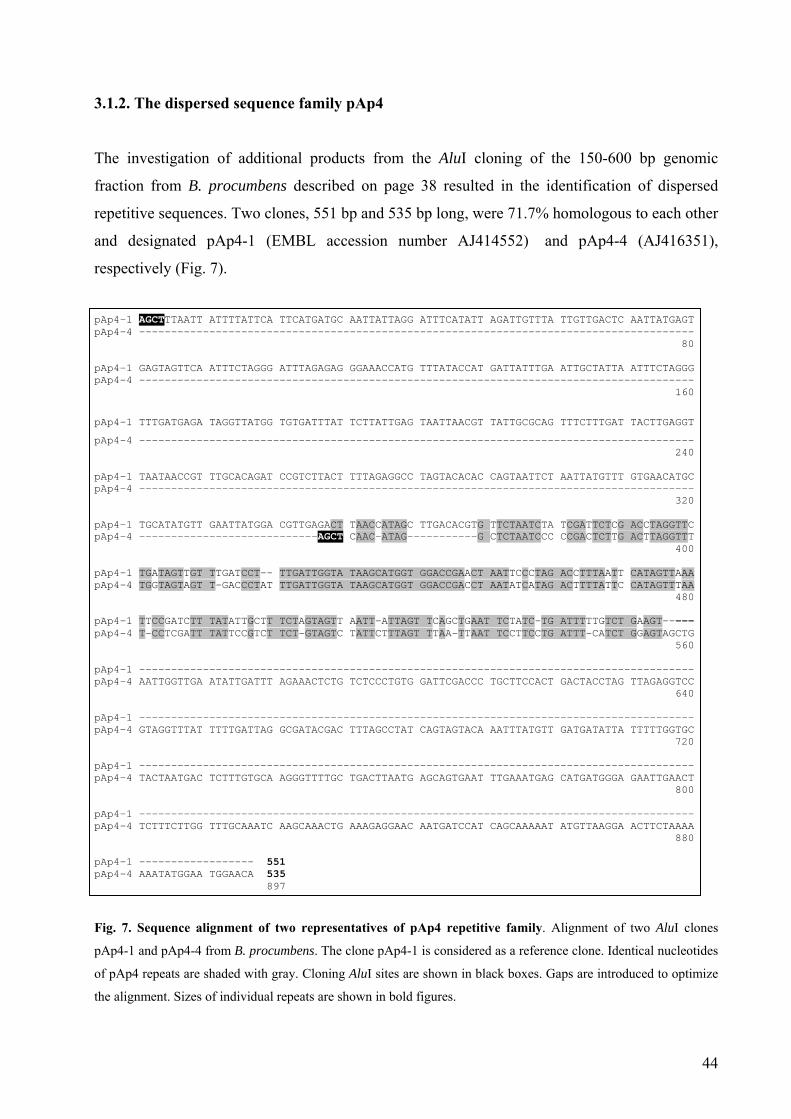
3.1.2. The dispersed sequence family pAp4
The investigation of additional products from the AluI cloning of the 150-600 bp genomic
fraction from B. procumbens described on page 38 resulted in the identification of dispersed
repetitive sequences. Two clones, 551 bp and 535 bp long, were 71.7% homologous to each other
and designated pAp4-1 (EMBL accession number AJ414552) and pAp4-4 (AJ416351),
respectively (Fig. 7).
pAp4-1 AGCTTTAATT ATTTTATTCA TTCATGATGC AATTATTAGG ATTTCATATT AGATTGTTTA TTGTTGACTC AATTATGAGT pAp4-4 --------------------------------------------------------------------------------------- 80 pAp4-1 GAGTAGTTCA ATTTCTAGGG ATTTAGAGAG GGAAACCATG TTTATACCAT GATTATTTGA ATTGCTATTA ATTTCTAGGG pAp4-4 --------------------------------------------------------------------------------------- 160
pAp4-1 TTTGATGAGA TAGGTTATGG TGTGATTTAT TCTTATTGAG TAATTAACGT TATTGCGCAG TTTCTTTGAT TACTTGAGGT
pAp4-4 --------------------------------------------------------------------------------------- 240 pAp4-1 TAATAACCGT TTGCACAGAT CCGTCTTACT TTTAGAGGCC TAGTACACAC CAGTAATTCT AATTATGTTT GTGAACATGC pAp4-4 --------------------------------------------------------------------------------------- 320 pAp4-1 TGCATATGTT GAATTATGGA CGTTGAGACT TAACCATAGC TTGACACGTG TTCTAATCTA TCGATTCTCG ACCTAGGTTC pAp4-4 ----------------------------AGCT CAAC-ATAG-----------G CTCTAATCCC CCGACTCTTG ACTTAGGTTT 400 pAp4-1 TGATAGTTGT TTGATCCT-- TTGATTGGTA TAAGCATGGT GGACCGAACT AATTCCCTAG ACCTTTAATT CATAGTTAAA pAp4-4 TGGTAGTAGT T-GACCCTAT TTGATTGGTA TAAGCATGGT GGACCGACCT AATATCATAG ACTTTTATTC CATAGTTTAA 480 pAp4-1 TTCCGATCTT TATATTGCTT TCTAGTAGTT AATT-ATTAGT TCAGCTGAAT TCTATC-TG ATTTTTGTCT GAAGT----- pAp4-4 T-CCTCGATT TATTCCGTCT TCT-GTAGTC TATTCTTTAGT TTAA–TTAAT TCCTTCCTG ATTT-CATCT GGAGTAGCTG 560 pAp4-1 --------------------------------------------------------------------------------------- pAp4-4 AATTGGTTGA ATATTGATTT AGAAACTCTG TCTCCCTGTG GATTCGACCC TGCTTCCACT GACTACCTAG TTAGAGGTCC 640 pAp4-1 --------------------------------------------------------------------------------------- pAp4-4 GTAGGTTTAT TTTTGATTAG GCGATACGAC TTTAGCCTAT CAGTAGTACA AATTTATGTT GATGATATTA TTTTTGGTGC 720 pAp4-1 --------------------------------------------------------------------------------------- pAp4-4 TACTAATGAC TCTTTGTGCA AGGGTTTTGC TGACTTAATG AGCAGTGAAT TTGAAATGAG CATGATGGGA GAATTGAACT 800 pAp4-1 --------------------------------------------------------------------------------------- pAp4-4 TCTTTCTTGG TTTGCAAATC AAGCAAACTG AAAGAGGAAC AATGATCCAT CAGCAAAAAT ATGTTAAGGA ACTTCTAAAA 880 pAp4-1 ------------------ 551 pAp4-4 AAATATGGAA TGGAACA 535 897
Fig. 7. Sequence alignment of two representatives of pAp4 repetitive family. Alignment of two AluI clones
pAp4-1 and pAp4-4 from B. procumbens. The clone pAp4-1 is considered as a reference clone. Identical nucleotides
of pAp4 repeats are shaded with gray. Cloning AluI sites are shown in black boxes. Gaps are introduced to optimize
the alignment. Sizes of individual repeats are shown in bold figures.
44
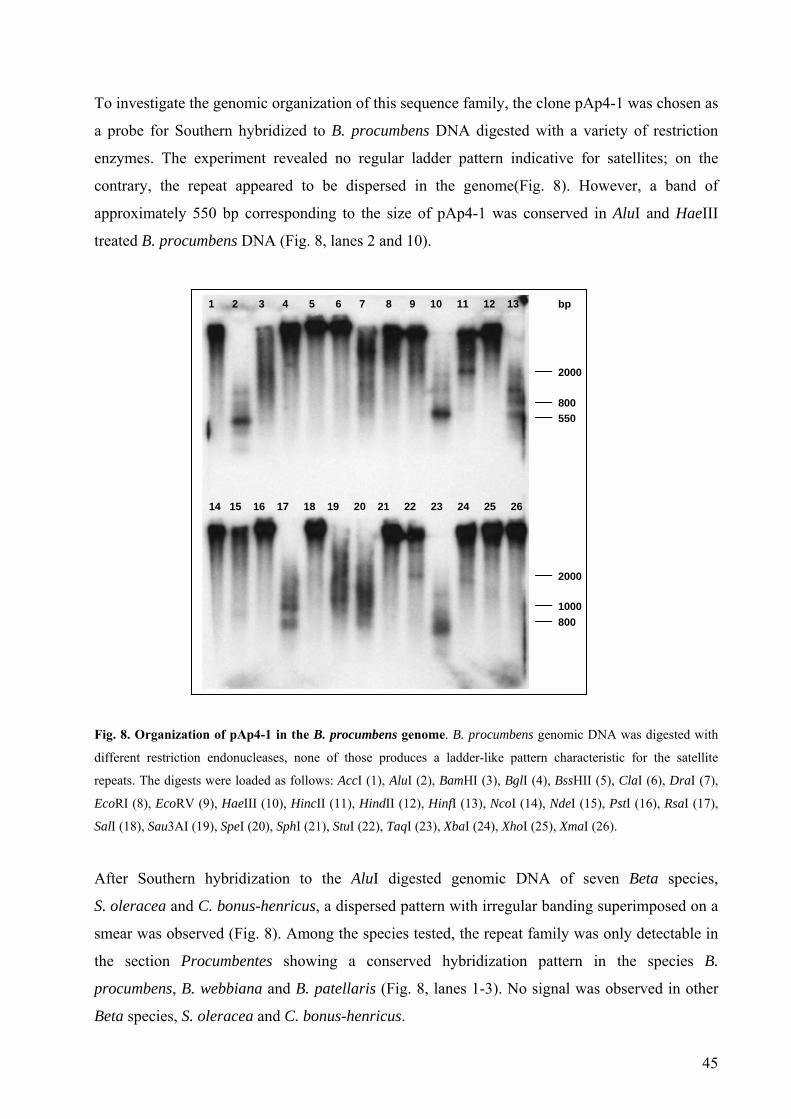
To investigate the genomic organization of this sequence family, the clone pAp4-1 was chosen as
a probe for Southern hybridized to B. procumbens DNA digested with a variety of restriction
enzymes. The experiment revealed no regular ladder pattern indicative for satellites; on the
contrary, the repeat appeared to be dispersed in the genome(Fig. 8). However, a band of
approximately 550 bp corresponding to the size of pAp4-1 was conserved in AluI and HaeIII
treated B. procumbens DNA (Fig. 8, lanes 2 and 10).
13 bp
Fig. 8. Organizati
different restrictio
repeats. The digest
EcoRI (8), EcoRV
SalI (18), Sau3AI (
After Southern
S. oleracea and
smear was obse
the section Pr
procumbens, B.
Beta species, S.
1 2 3 4 5 6 7 8 9 10 11 12 1 2 3 4 5 6 7 8 9 10 11 12 13
14 15 16 17 18 19 20 21 22 23 24 25 26 14 15 16 17 18 19 20 21 22 23 24 25 26
800 1000
2000
800 550
2000
on of pAp4-1 in the B. procumbens genome. B. procumbens genomic DNA was digested with
n endonucleases, none of those produces a ladder-like pattern characteristic for the satellite
s were loaded as follows: AccI (1), AluI (2), BamHI (3), BglI (4), BssHII (5), ClaI (6), DraI (7),
(9), HaeIII (10), HincII (11), HindII (12), HinfI (13), NcoI (14), NdeI (15), PstI (16), RsaI (17),
19), SpeI (20), SphI (21), StuI (22), TaqI (23), XbaI (24), XhoI (25), XmaI (26).
hybridization to the AluI digested genomic DNA of seven Beta species,
C. bonus-henricus, a dispersed pattern with irregular banding superimposed on a
rved (Fig. 8). Among the species tested, the repeat family was only detectable in
ocumbentes showing a conserved hybridization pattern in the species B.
webbiana and B. patellaris (Fig. 8, lanes 1-3). No signal was observed in other
oleracea and C. bonus-henricus.
45
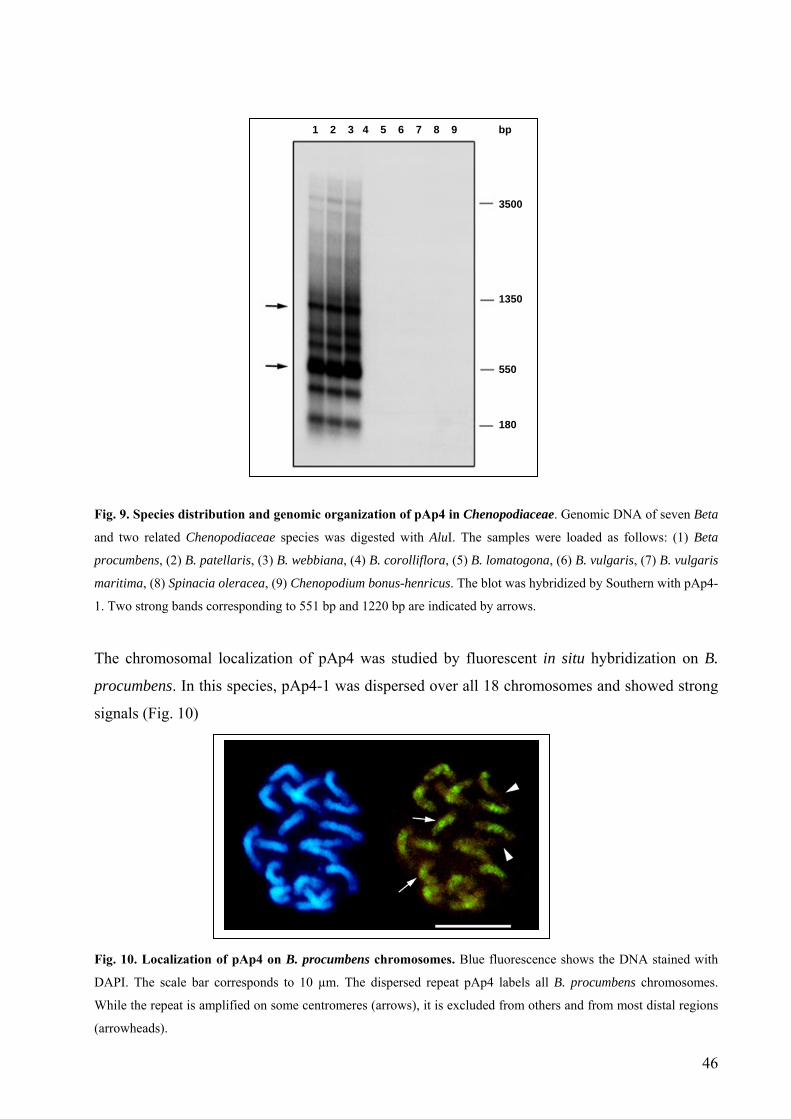
Fig. 9. Species distribution a
and two related Chenopodia
procumbens, (2) B. patellaris
maritima, (8) Spinacia olerac
1. Two strong bands correspo
The chromosomal locali
procumbens. In this spec
signals (Fig. 10)
Fig. 10. Localization of pAp
DAPI. The scale bar corresp
While the repeat is amplified
(arrowheads).
1 2 3 4 5 6 7 8 9 bp
3500
1350
550
180
nd genomic organization of pAp4 in Chenopodiaceae. Genomic DNA of seven Beta
ceae species was digested with AluI. The samples were loaded as follows: (1) Beta
, (3) B. webbiana, (4) B. corolliflora, (5) B. lomatogona, (6) B. vulgaris, (7) B. vulgaris
ea, (9) Chenopodium bonus-henricus. The blot was hybridized by Southern with pAp4-
nding to 551 bp and 1220 bp are indicated by arrows.
zation of pAp4 was studied by fluorescent in situ hybridization on B.
ies, pAp4-1 was dispersed over all 18 chromosomes and showed strong
4 on B. procumbens chromosomes. Blue fluorescence shows the DNA stained with
onds to 10 µm. The dispersed repeat pAp4 labels all B. procumbens chromosomes.
on some centromeres (arrows), it is excluded from others and from most distal regions
46
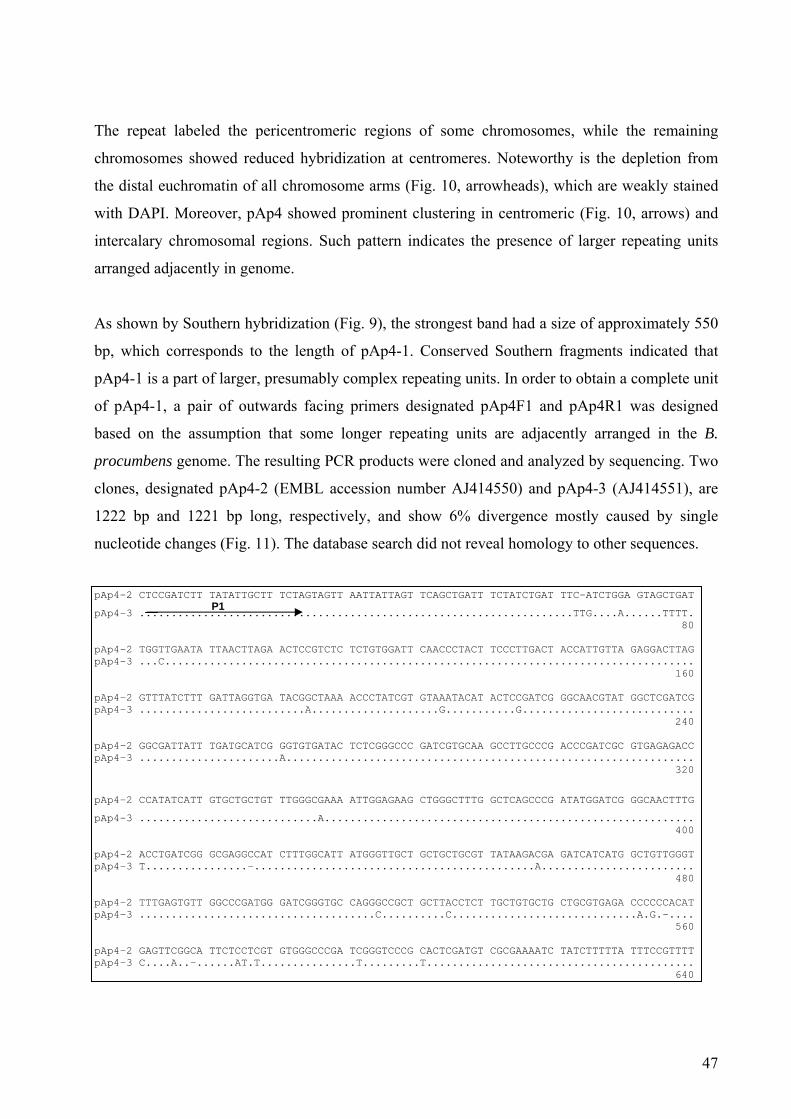
The repeat labeled the pericentromeric regions of some chromosomes, while the remaining
chromosomes showed reduced hybridization at centromeres. Noteworthy is the depletion from
the distal euchromatin of all chromosome arms (Fig. 10, arrowheads), which are weakly stained
with DAPI. Moreover, pAp4 showed prominent clustering in centromeric (Fig. 10, arrows) and
intercalary chromosomal regions. Such pattern indicates the presence of larger repeating units
arranged adjacently in genome.
As shown by Southern hybridization (Fig. 9), the strongest band had a size of approximately 550
bp, which corresponds to the length of pAp4-1. Conserved Southern fragments indicated that
pAp4-1 is a part of larger, presumably complex repeating units. In order to obtain a complete unit
of pAp4-1, a pair of outwards facing primers designated pAp4F1 and pAp4R1 was designed
based on the assumption that some longer repeating units are adjacently arranged in the B.
procumbens genome. The resulting PCR products were cloned and analyzed by sequencing. Two
clones, designated pAp4-2 (EMBL accession number AJ414550) and pAp4-3 (AJ414551), are
1222 bp and 1221 bp long, respectively, and show 6% divergence mostly caused by single
nucleotide changes (Fig. 11). The database search did not reveal homology to other sequences.
pAp4-2 CTCCGATCTT TATATTGCTT TCTAGTAGTT AATTATTAGT TCAGCTGATT TCTATCTGAT TTC-ATCTGGA GTAGCTGAT
pAp4-3 ....................................................................TTG....A......TTTT. P1
80 pAp4-2 TGGTTGAATA TTAACTTAGA ACTCCGTCTC TCTGTGGATT CAACCCTACT TCCCTTGACT ACCATTGTTA GAGGACTTAG pAp4-3 ...C................................................................................... 160 pAp4-2 GTTTATCTTT GATTAGGTGA TACGGCTAAA ACCCTATCGT GTAAATACAT ACTCCGATCG GGCAACGTAT GGCTCGATCG pAp4-3 ..........................A....................G...........G........................... 240 pAp4-2 GGCGATTATT TGATGCATCG GGTGTGATAC TCTCGGGCCC GATCGTGCAA GCCTTGCCCG ACCCGATCGC GTGAGAGACC pAp4-3 ......................A................................................................ 320
pAp4-2 CCATATCATT GTGCTGCTGT TTGGGCGAAA ATTGGAGAAG CTGGGCTTTG GCTCAGCCCG ATATGGATCG GGCAACTTTG
pAp4-3 ............................A.......................................................... 400 pAp4-2 ACCTGATCGG GCGAGGCCAT CTTTGGCATT ATGGGTTGCT GCTGCTGCGT TATAAGACGA GATCATCATG GCTGTTGGGT pAp4-3 T................-............................................A........................ 480 pAp4-2 TTTGAGTGTT GGCCCGATGG GATCGGGTGC CAGGGCCGCT GCTTACCTCT TGCTGTGCTG CTGCGTGAGA CCCCCCACAT pAp4-3 .....................................C..........C.............................A.G.-.... 560 pAp4-2 GAGTTCGGCA TTCTCCTCGT GTGGGCCCGA TCGGGTCCCG CACTCGATGT CGCGAAAATC TATCTTTTTA TTTCCGTTTT pAp4-3 C....A..-......AT.T...............T.........T.......................................... 640
47
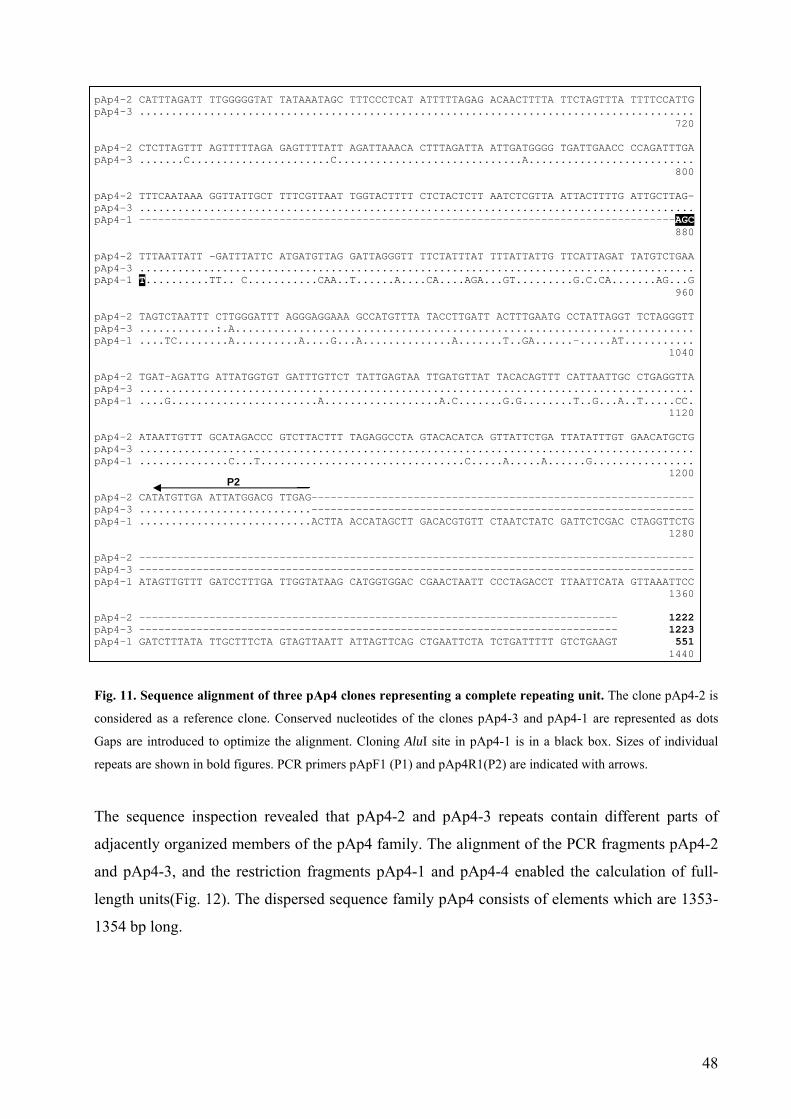
pAp4-2 CATTTAGATT TTGGGGGTAT TATAAATAGC TTTCCCTCAT ATTTTTAGAG ACAACTTTTA TTCTAGTTTA TTTTCCATTG pAp4-3 ....................................................................................... 720 pAp4-2 CTCTTAGTTT AGTTTTTAGA GAGTTTTATT AGATTAAACA CTTTAGATTA ATTGATGGGG TGATTGAACC CCAGATTTGA pAp4-3 .......C......................C.............................A.......................... 800 pAp4-2 TTTCAATAAA GGTTATTGCT TTTCGTTAAT TGGTACTTTT CTCTACTCTT AATCTCGTTA ATTACTTTTG ATTGCTTAG- pAp4-3 ....................................................................................... pAp4-1 ------------------------------------------------------------------------------------AGC 880 pAp4-2 TTTAATTATT –GATTTATTC ATGATGTTAG GATTAGGGTT TTCTATTTAT TTTATTATTG TTCATTAGAT TATGTCTGAA pAp4-3 ....................................................................................... pAp4-1 T..........TT.. C...........CAA..T......A....CA....AGA...GT.........G.C.CA.......AG...G 960 pAp4-2 TAGTCTAATTT CTTGGGATTT AGGGAGGAAA GCCATGTTTA TACCTTGATT ACTTTGAATG CCTATTAGGT TCTAGGGTT pAp4-3 ............:.A........................................................................ pAp4-1 ....TC........A..........A....G...A..............A.......T..GA......-.....AT........... 1040 pAp4-2 TGAT-AGATTG ATTATGGTGT GATTTGTTCT TATTGAGTAA TTGATGTTAT TACACAGTTT CATTAATTGC CTGAGGTTA pAp4-3 ....................................................................................... pAp4-1 ....G.......................A..................A.C.......G.G........T..G...A..T.....CC. 1120 pAp4-2 ATAATTGTTT GCATAGACCC GTCTTACTTT TAGAGGCCTA GTACACATCA GTTATTCTGA TTATATTTGT GAACATGCTG pAp4-3 ....................................................................................... pAp4-1 ..............C...T................................C.....A.....A......G................ 1200 pAp4-2 CATATGTTGA ATTATGGACG TTGAG------------------------------------------------------------ pAp4-3 ...........................------------------------------------------------------------ pAp4-1 ...........................ACTTA ACCATAGCTT GACACGTGTT CTAATCTATC GATTCTCGAC CTAGGTTCTG 1280 pAp4-2 --------------------------------------------------------------------------------------- pAp4-3 --------------------------------------------------------------------------------------- pAp4-1 ATAGTTGTTT GATCCTTTGA TTGGTATAAG CATGGTGGAC CGAACTAATT CCCTAGACCT TTAATTCATA GTTAAATTCC 1360 pAp4-2 --------------------------------------------------------------------------- 1222 pAp4-3 --------------------------------------------------------------------------- 1223 pAp4-1 GATCTTTATA TTGCTTTCTA GTAGTTAATT ATTAGTTCAG CTGAATTCTA TCTGATTTTT GTCTGAAGT 551 1440
P2
Fig. 11. Sequence alignment of three pAp4 clones representing a complete repeating unit. The clone pAp4-2 is
considered as a reference clone. Conserved nucleotides of the clones pAp4-3 and pAp4-1 are represented as dots
Gaps are introduced to optimize the alignment. Cloning AluI site in pAp4-1 is in a black box. Sizes of individual
repeats are shown in bold figures. PCR primers pApF1 (P1) and pAp4R1(P2) are indicated with arrows.
The sequence inspection revealed that pAp4-2 and pAp4-3 repeats contain different parts of
adjacently organized members of the pAp4 family. The alignment of the PCR fragments pAp4-2
and pAp4-3, and the restriction fragments pAp4-1 and pAp4-4 enabled the calculation of full-
length units(Fig. 12). The dispersed sequence family pAp4 consists of elements which are 1353-
1354 bp long.
48
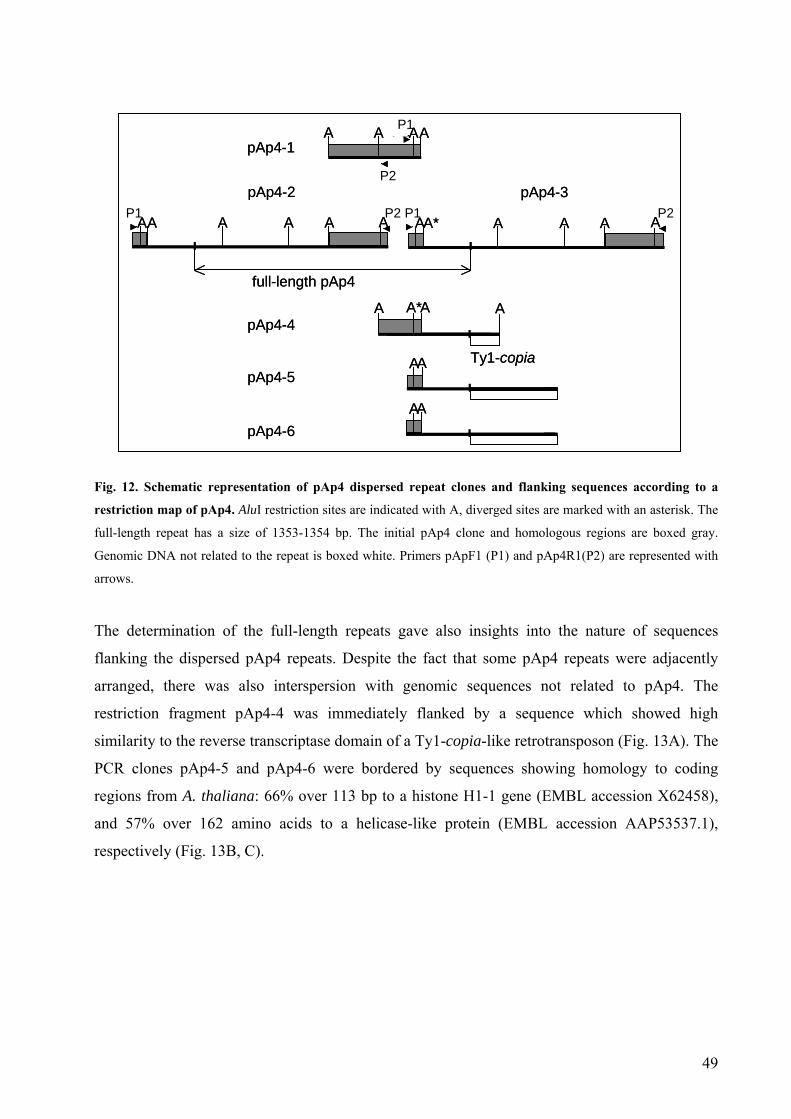
A A AAP1A A AAP1
Fig.
restr
full-l
Geno
arrow
The
flan
arra
restr
simi
PCR
regi
and
resp
pAp4-1
full-length pAp4
pAp4-4A
pAp4-5
pAp4-6
pAp4-2 pAp4-3
A A A AAA
pAp4-1
full-length pAp4
pAp4-4A
pAp4-5
pAp4-6
pAp4-2 pAp4-3
A A A AAA2
12. Schematic representation of pAp4 disperse
iction map of pAp4. AluI restriction sites are indic
ength repeat has a size of 1353-1354 bp. The ini
mic DNA not related to the repeat is boxed white.
s.
determination of the full-length repeats
king the dispersed pAp4 repeats. Despite
nged, there was also interspersion with
iction fragment pAp4-4 was immediatel
larity to the reverse transcriptase domain of
clones pAp4-5 and pAp4-6 were borde
ons from A. thaliana: 66% over 113 bp to
57% over 162 amino acids to a helicas
ectively (Fig. 13B, C).
P1
P1P1
Ty1-copia
A AA*
AA
AA
A A AA*A
Ty1-copia
A AA*
AA
AA
A A AA*A
d repeat clones and flanking sequences acc
ated with A, diverged sites are marked with an
tial pAp4 clone and homologous regions are
Primers pApF1 (P1) and pAp4R1(P2) are repr
gave also insights into the nature of
the fact that some pAp4 repeats were
genomic sequences not related to p
y flanked by a sequence which sho
a Ty1-copia-like retrotransposon (Fig.
red by sequences showing homology
a histone H1-1 gene (EMBL accession
e-like protein (EMBL accession AA
P
P2P2P2P2
AA
ording to a
asterisk. The
boxed gray.
esented with
sequences
adjacently
Ap4. The
wed high
13A). The
to coding
X62458),
P53537.1),
49
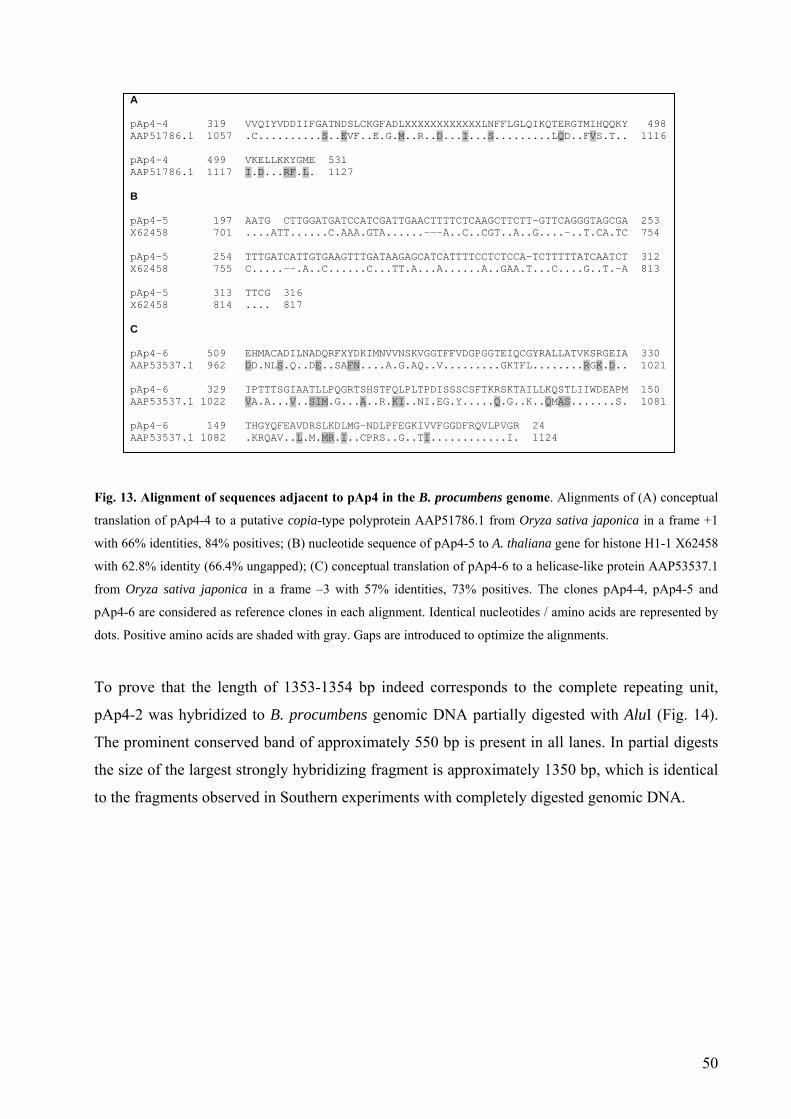
A pAp4-4 319 VVQIYVDDIIFGATNDSLCKGFADLXXXXXXXXXXXXLNFFLGLQIKQTERGTMIHQQKY 498 AAP51786.1 1057 .C..........S..EVF..E.G.M..R..D...I...S.........LQD..FVS.T.. 1116 pAp4-4 499 VKELLKKYGME 531 AAP51786.1 1117 I.D...RF.L. 1127 B pAp4-5 197 AATG CTTGGATGATCCATCGATTGAACTTTTCTCAAGCTTCTT-GTTCAGGGTAGCGA 253 X62458 701 ....ATT......C.AAA.GTA......---A..C..CGT..A..G....-..T.CA.TC 754 pAp4-5 254 TTTGATCATTGTGAAGTTTGATAAGAGCATCATTTTCCTCTCCA-TCTTTTTATCAATCT 312 X62458 755 C.....—-.A..C......C...TT.A...A......A..GAA.T...C....G..T.-A 813 pAp4-5 313 TTCG 316 X62458 814 .... 817 C pAp4-6 509 EHMACADILNADQRFXYDKIMNVVNSKVGGTFFVDGPGGTEIQCGYRALLATVKSRGEIA 330 AAP53537.1 962 DD.NLS.Q..DE..SAFN....A.G.AQ..V.........GKTFL........RGK.D.. 1021 pAp4-6 329 IPTTTSGIAATLLPQGRTSHSTFQLPLTPDISSSCSFTKRSKTAILLKQSTLIIWDEAPM 150 AAP53537.1 1022 VA.A...V..SIM.G...A..R.KI..NI.EG.Y.....Q.G..K..QMAS.......S. 1081 pAp4-6 149 THGYQFEAVDRSLKDLMG-NDLPFEGKIVVFGGDFRQVLPVGR 24 AAP53537.1 1082 .KRQAV..L.M.MR.I..CPRS..G..TI............I. 1124
Fig. 13. Alignment of sequences adjacent to pAp4 in the B. procumbens genome. Alignments of (A) conceptual
translation of pAp4-4 to a putative copia-type polyprotein AAP51786.1 from Oryza sativa japonica in a frame +1
with 66% identities, 84% positives; (B) nucleotide sequence of pAp4-5 to A. thaliana gene for histone H1-1 X62458
with 62.8% identity (66.4% ungapped); (C) conceptual translation of pAp4-6 to a helicase-like protein AAP53537.1
from Oryza sativa japonica in a frame –3 with 57% identities, 73% positives. The clones pAp4-4, pAp4-5 and
pAp4-6 are considered as reference clones in each alignment. Identical nucleotides / amino acids are represented by
dots. Positive amino acids are shaded with gray. Gaps are introduced to optimize the alignments.
To prove that the length of 1353-1354 bp indeed corresponds to the complete repeating unit,
pAp4-2 was hybridized to B. procumbens genomic DNA partially digested with AluI (Fig. 14).
The prominent conserved band of approximately 550 bp is present in all lanes. In partial digests
the size of the largest strongly hybridizing fragment is approximately 1350 bp, which is identical
to the fragments observed in Southern experiments with completely digested genomic DNA.
50
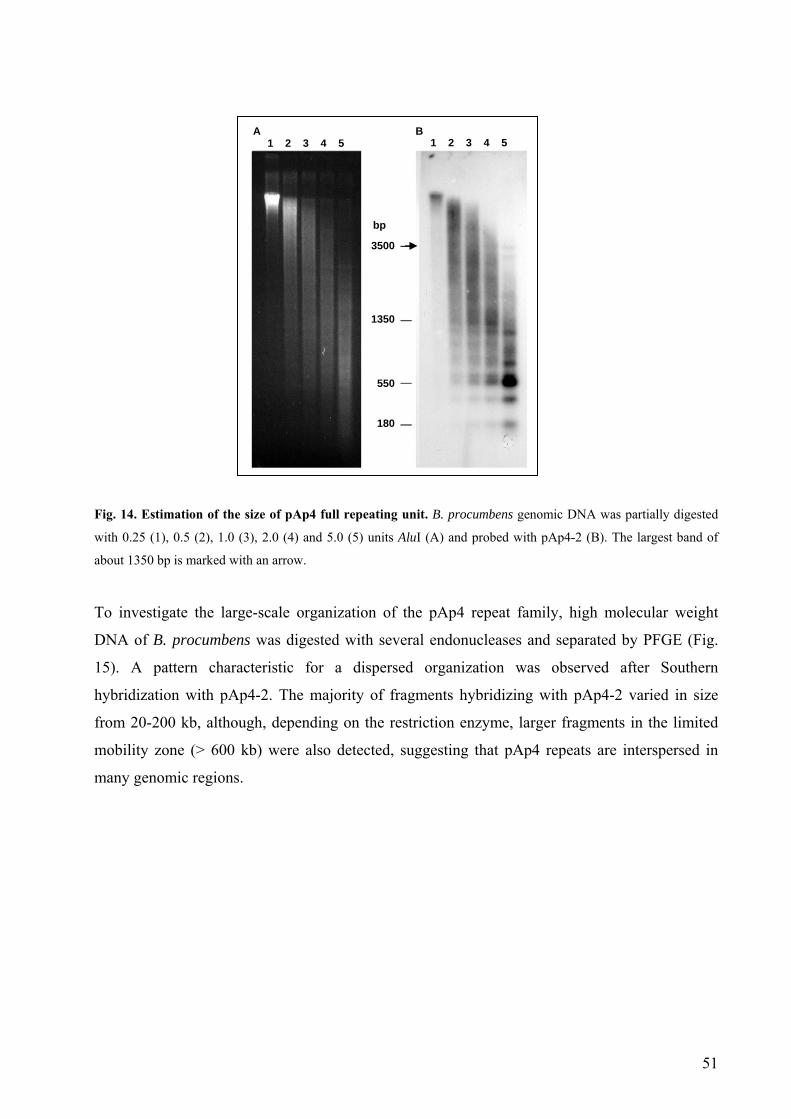
A B
3500 1350
550
180
bp
1 2 3 4 5 1 2 3 4 5
Fig. 14. Estimation of the size of pAp4 full repeating unit. B. procumbens genomic DNA was partially digested
with 0.25 (1), 0.5 (2), 1.0 (3), 2.0 (4) and 5.0 (5) units AluI (A) and probed with pAp4-2 (B). The largest band of
about 1350 bp is marked with an arrow.
To investigate the large-scale organization of the pAp4 repeat family, high molecular weight
DNA of B. procumbens was digested with several endonucleases and separated by PFGE (Fig.
15). A pattern characteristic for a dispersed organization was observed after Southern
hybridization with pAp4-2. The majority of fragments hybridizing with pAp4-2 varied in size
from 20-200 kb, although, depending on the restriction enzyme, larger fragments in the limited
mobility zone (> 600 kb) were also detected, suggesting that pAp4 repeats are interspersed in
many genomic regions.
51
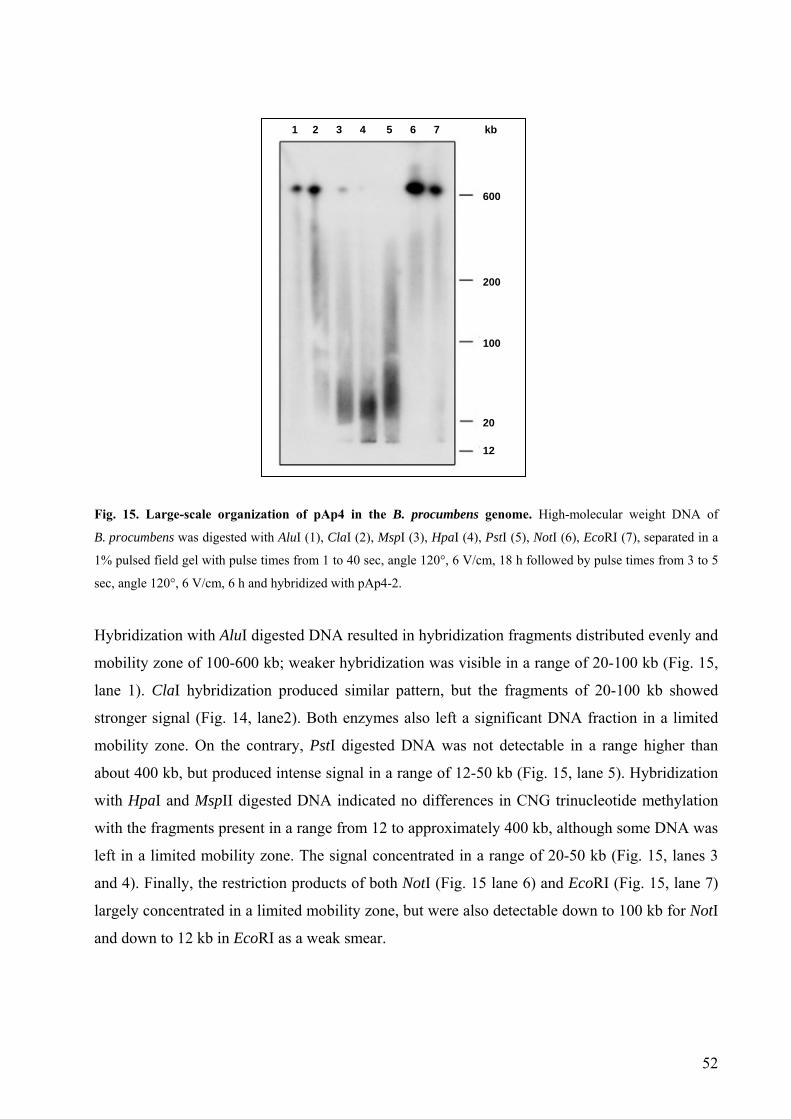
1 2 3 4 5 6 7
600
200
100
20
12
kb
Fig. 15. Large-scale organization of pAp4 in the B. procumbens genome. High-molecular weight DNA of
B. procumbens was digested with AluI (1), ClaI (2), MspI (3), HpaI (4), PstI (5), NotI (6), EcoRI (7), separated in a
1% pulsed field gel with pulse times from 1 to 40 sec, angle 120°, 6 V/cm, 18 h followed by pulse times from 3 to 5
sec, angle 120°, 6 V/cm, 6 h and hybridized with pAp4-2.
Hybridization with AluI digested DNA resulted in hybridization fragments distributed evenly and
mobility zone of 100-600 kb; weaker hybridization was visible in a range of 20-100 kb (Fig. 15,
lane 1). ClaI hybridization produced similar pattern, but the fragments of 20-100 kb showed
stronger signal (Fig. 14, lane2). Both enzymes also left a significant DNA fraction in a limited
mobility zone. On the contrary, PstI digested DNA was not detectable in a range higher than
about 400 kb, but produced intense signal in a range of 12-50 kb (Fig. 15, lane 5). Hybridization
with HpaI and MspII digested DNA indicated no differences in CNG trinucleotide methylation
with the fragments present in a range from 12 to approximately 400 kb, although some DNA was
left in a limited mobility zone. The signal concentrated in a range of 20-50 kb (Fig. 15, lanes 3
and 4). Finally, the restriction products of both NotI (Fig. 15 lane 6) and EcoRI (Fig. 15, lane 7)
largely concentrated in a limited mobility zone, but were also detectable down to 100 kb for NotI
and down to 12 kb in EcoRI as a weak smear.
52
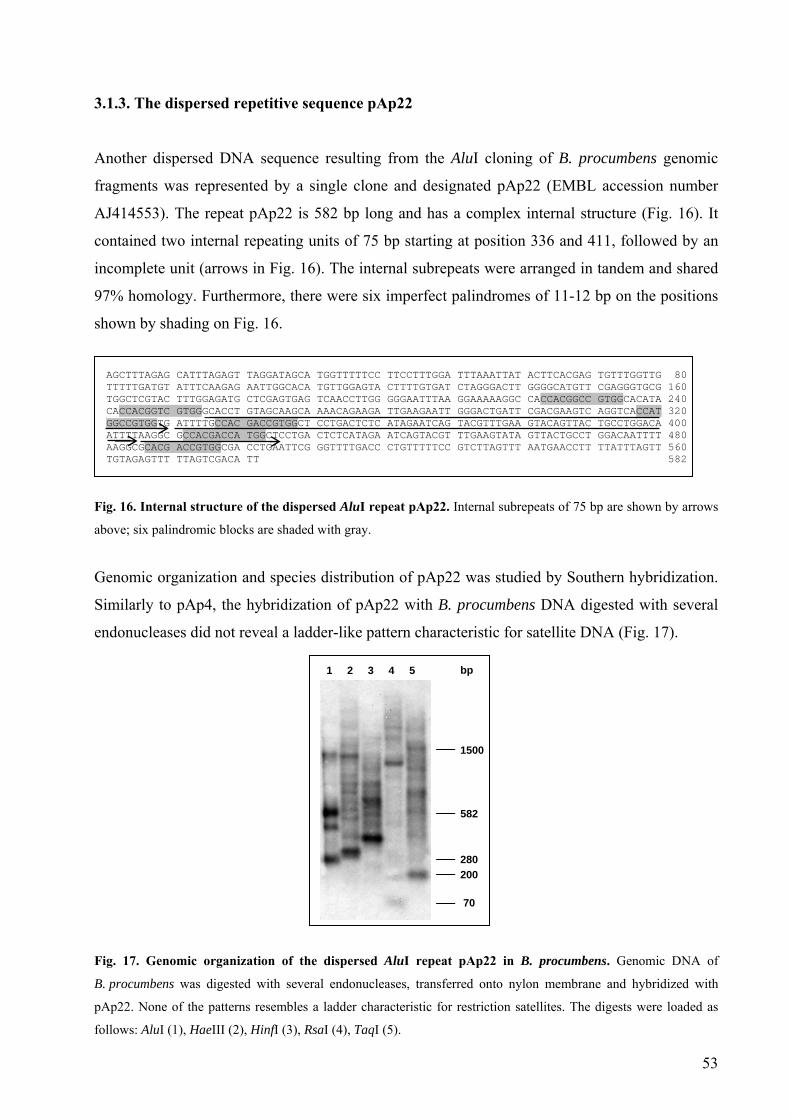
3.1.3. The dispersed repetitive sequence pAp22
Another dispersed DNA sequence resulting from the AluI cloning of B. procumbens genomic
fragments was represented by a single clone and designated pAp22 (EMBL accession number
AJ414553). The repeat pAp22 is 582 bp long and has a complex internal structure (Fig. 16). It
contained two internal repeating units of 75 bp starting at position 336 and 411, followed by an
incomplete unit (arrows in Fig. 16). The internal subrepeats were arranged in tandem and shared
97% homology. Furthermore, there were six imperfect palindromes of 11-12 bp on the positions
shown by shading on Fig. 16.
AGCTTTAGAG CATTTAGAGT TAGGATAGCA TGGTTTTTCC TTCCTTTGGA TTTAAATTAT ACTTCACGAG TGTTTGGTTG 80 TTTTTGATGT ATTTCAAGAG AATTGGCACA TGTTGGAGTA CTTTTGTGAT CTAGGGACTT GGGGCATGTT CGAGGGTGCG 160 TGGCTCGTAC TTTGGAGATG CTCGAGTGAG TCAACCTTGG GGGAATTTAA GGAAAAAGGC CACCACGGCC GTGGCACATA 240 CACCACGGTC GTGGGCACCT GTAGCAAGCA AAACAGAAGA TTGAAGAATT GGGACTGATT CGACGAAGTC AGGTCACCAT 320 GGCCGTGGTG ATTTTGCCAC GACCGTGGCT CCTGACTCTC ATAGAATCAG TACGTTTGAA GTACAGTTAC TGCCTGGACA 400 ATTTTAAGGC GCCACGACCA TGGCTCCTGA CTCTCATAGA ATCAGTACGT TTGAAGTATA GTTACTGCCT GGACAATTTT 480 AAGGCGCACG ACCGTGGCGA CCTGAATTCG GGTTTTGACC CTGTTTTTCC GTCTTAGTTT AATGAACCTT TTATTTAGTT 560 TGTAGAGTTT TTAGTCGACA TT 582
Fig. 16. Internal structure of the dispersed AluI repeat pAp22. Internal subrepeats of 75 bp are shown by arrows
above; six palindromic blocks are shaded with gray.
Genomic organization and species distribution of pAp22 was studied by Southern hybridization.
Similarly to pAp4, the hybridization of pAp22 with B. procumbens DNA digested with several
endonucleases did not reveal a ladder-like pattern characteristic for satellite DNA (Fig. 17).
1 2 3 4 5
200
1500
582
bp
280
70
Fig. 17. Genomic organization of the dispersed AluI repeat pAp22 in B. procumbens. Genomic DNA of
B. procumbens was digested with several endonucleases, transferred onto nylon membrane and hybridized with
pAp22. None of the patterns resembles a ladder characteristic for restriction satellites. The digests were loaded as
follows: AluI (1), HaeIII (2), HinfI (3), RsaI (4), TaqI (5).
53
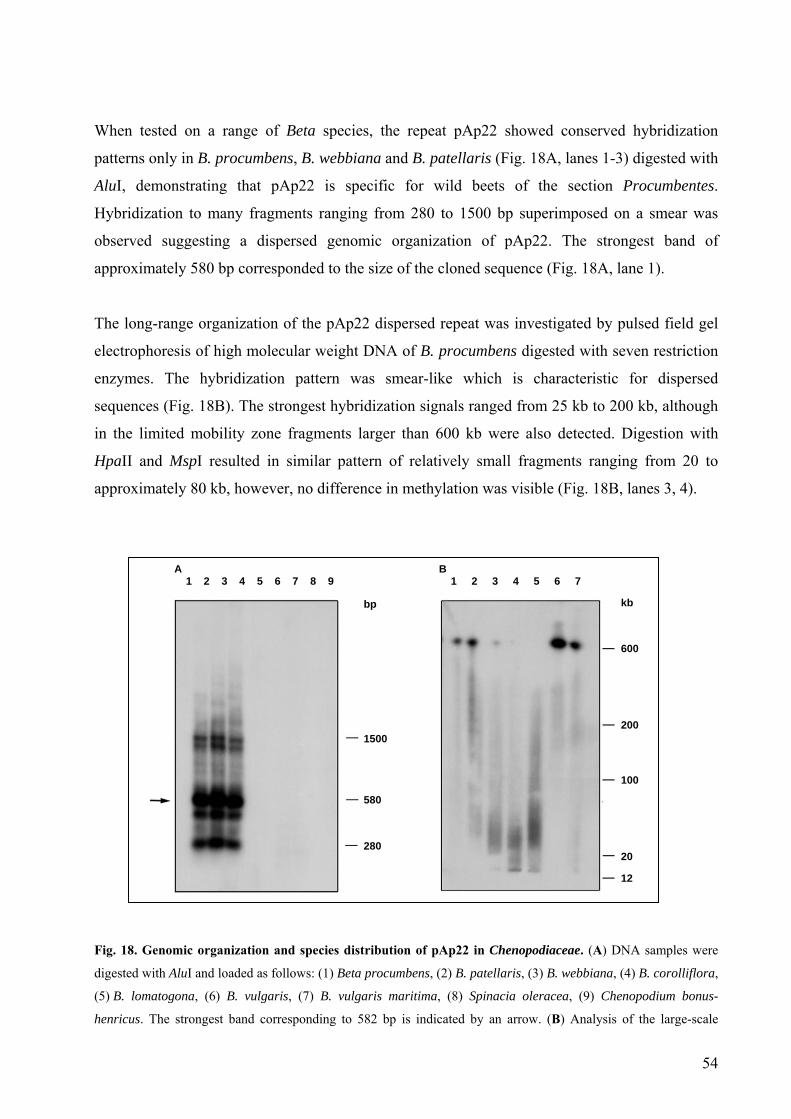
When tested on a range of Beta species, the repeat pAp22 showed conserved hybridization
patterns only in B. procumbens, B. webbiana and B. patellaris (Fig. 18A, lanes 1-3) digested with
AluI, demonstrating that pAp22 is specific for wild beets of the section Procumbentes.
Hybridization to many fragments ranging from 280 to 1500 bp superimposed on a smear was
observed suggesting a dispersed genomic organization of pAp22. The strongest band of
approximately 580 bp corresponded to the size of the cloned sequence (Fig. 18A, lane 1).
The long-range organization of the pAp22 dispersed repeat was investigated by pulsed field gel
electrophoresis of high molecular weight DNA of B. procumbens digested with seven restriction
enzymes. The hybridization pattern was smear-like which is characteristic for dispersed
sequences (Fig. 18B). The strongest hybridization signals ranged from 25 kb to 200 kb, although
in the limited mobility zone fragments larger than 600 kb were also detected. Digestion with
HpaII and MspI resulted in similar pattern of relatively small fragments ranging from 20 to
approximately 80 kb, however, no difference in methylation was visible (Fig. 18B, lanes 3, 4).
A B 1 2 3 4 5 6 7 8 9 1 2 3 4 5 6 7
bp
1500
580
280
kb
600
200
100
20
12
Fig. 18. Genomic organization and species distribution of pAp22 in Chenopodiaceae. (A) DNA samples were
digested with AluI and loaded as follows: (1) Beta procumbens, (2) B. patellaris, (3) B. webbiana, (4) B. corolliflora,
(5) B. lomatogona, (6) B. vulgaris, (7) B. vulgaris maritima, (8) Spinacia oleracea, (9) Chenopodium bonus-
henricus. The strongest band corresponding to 582 bp is indicated by an arrow. (B) Analysis of the large-scale
54
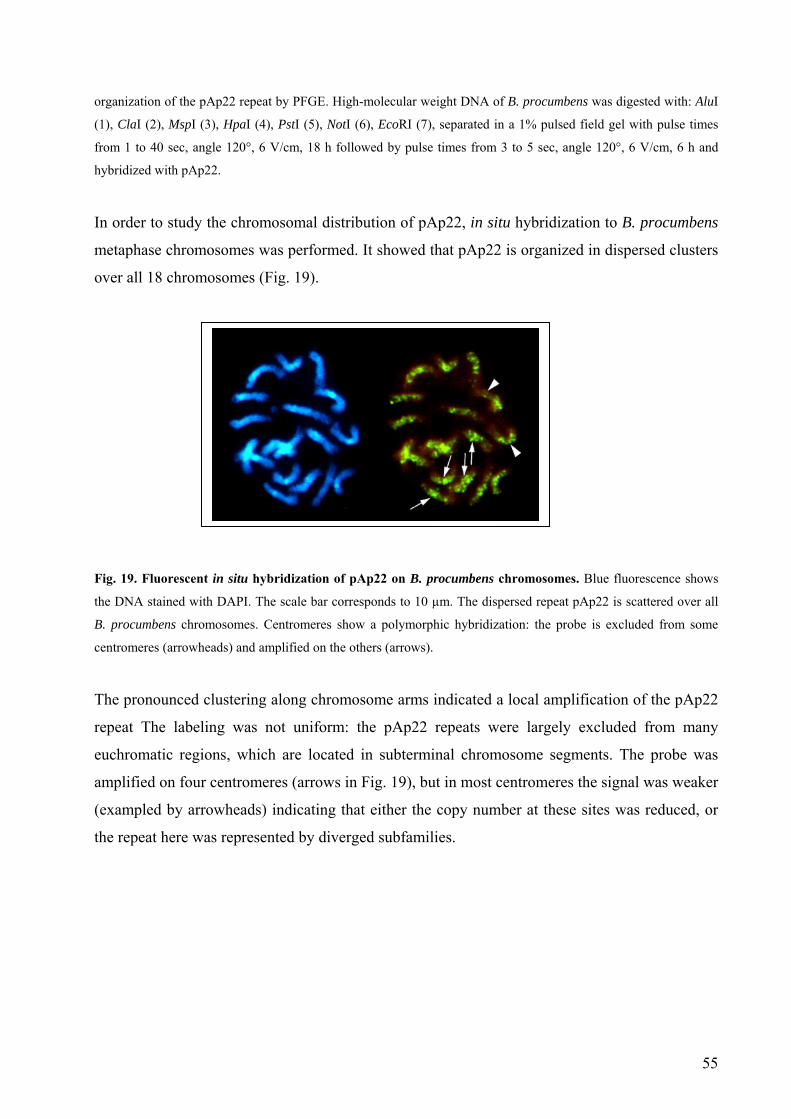
organization of the pAp22 repeat by PFGE. High-molecular weight DNA of B. procumbens was digested with: AluI
(1), ClaI (2), MspI (3), HpaI (4), PstI (5), NotI (6), EcoRI (7), separated in a 1% pulsed field gel with pulse times
from 1 to 40 sec, angle 120°, 6 V/cm, 18 h followed by pulse times from 3 to 5 sec, angle 120°, 6 V/cm, 6 h and
hybridized with pAp22.
In order to study the chromosomal distribution of pAp22, in situ hybridization to B. procumbens
metaphase chromosomes was performed. It showed that pAp22 is organized in dispersed clusters
over all 18 chromosomes (Fig. 19).
Fig. 19. Fluorescent in situ hybridization of pAp22 on B. procumbens chromosomes. Blue fluorescence shows
the DNA stained with DAPI. The scale bar corresponds to 10 µm. The dispersed repeat pAp22 is scattered over all
B. procumbens chromosomes. Centromeres show a polymorphic hybridization: the probe is excluded from some
centromeres (arrowheads) and amplified on the others (arrows).
The pronounced clustering along chromosome arms indicated a local amplification of the pAp22
repeat The labeling was not uniform: the pAp22 repeats were largely excluded from many
euchromatic regions, which are located in subterminal chromosome segments. The probe was
amplified on four centromeres (arrows in Fig. 19), but in most centromeres the signal was weaker
(exampled by arrowheads) indicating that either the copy number at these sites was reduced, or
the repeat here was represented by diverged subfamilies.
55
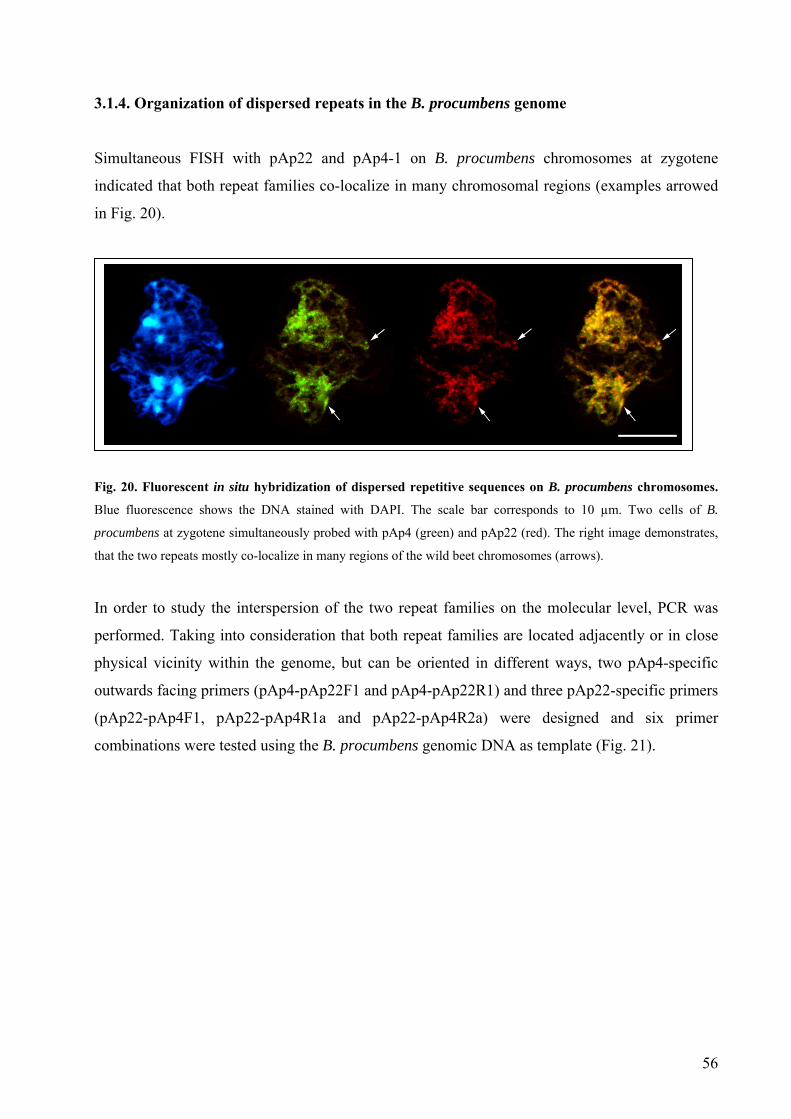
3.1.4. Organization of dispersed repeats in the B. procumbens genome
Simultaneous FISH with pAp22 and pAp4-1 on B. procumbens chromosomes at zygotene
indicated that both repeat families co-localize in many chromosomal regions (examples arrowed
in Fig. 20).
Fig. 20. Fluorescent in situ hybridization of dispersed repetitive sequences on B. procumbens chromosomes.
Blue fluorescence shows the DNA stained with DAPI. The scale bar corresponds to 10 µm. Two cells of B.
procumbens at zygotene simultaneously probed with pAp4 (green) and pAp22 (red). The right image demonstrates,
that the two repeats mostly co-localize in many regions of the wild beet chromosomes (arrows).
In order to study the interspersion of the two repeat families on the molecular level, PCR was
performed. Taking into consideration that both repeat families are located adjacently or in close
physical vicinity within the genome, but can be oriented in different ways, two pAp4-specific
outwards facing primers (pAp4-pAp22F1 and pAp4-pAp22R1) and three pAp22-specific primers
(pAp22-pAp4F1, pAp22-pAp4R1a and pAp22-pAp4R2a) were designed and six primer
combinations were tested using the B. procumbens genomic DNA as template (Fig. 21).
56
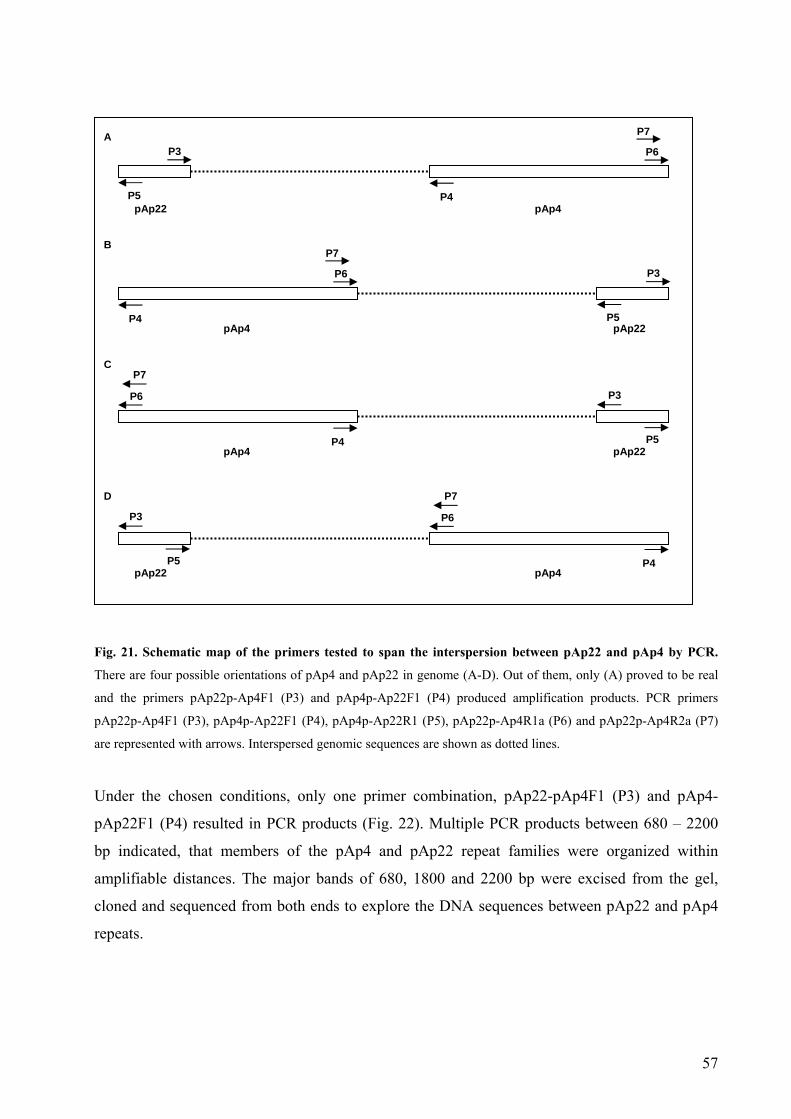
pAp22 pAp4
P3
P5
P7
P6
P4
pAp22
P3
P5 pAp4
P7
P6
P4
pAp22
P3
P5 pAp4
P7
P6
P4
pAp22
P3
P5 pAp4
P7
P6
P4
A
B
C
D
Fig. 21. Schematic map of the primers tested to span the interspersion between pAp22 and pAp4 by PCR.
There are four possible orientations of pAp4 and pAp22 in genome (A-D). Out of them, only (A) proved to be real
and the primers pAp22p-Ap4F1 (P3) and pAp4p-Ap22F1 (P4) produced amplification products. PCR primers
pAp22p-Ap4F1 (P3), pAp4p-Ap22F1 (P4), pAp4p-Ap22R1 (P5), pAp22p-Ap4R1a (P6) and pAp22p-Ap4R2a (P7)
are represented with arrows. Interspersed genomic sequences are shown as dotted lines.
Under the chosen conditions, only one primer combination, pAp22-pAp4F1 (P3) and pAp4-
pAp22F1 (P4) resulted in PCR products (Fig. 22). Multiple PCR products between 680 – 2200
bp indicated, that members of the pAp4 and pAp22 repeat families were organized within
amplifiable distances. The major bands of 680, 1800 and 2200 bp were excised from the gel,
cloned and sequenced from both ends to explore the DNA sequences between pAp22 and pAp4
repeats.
57
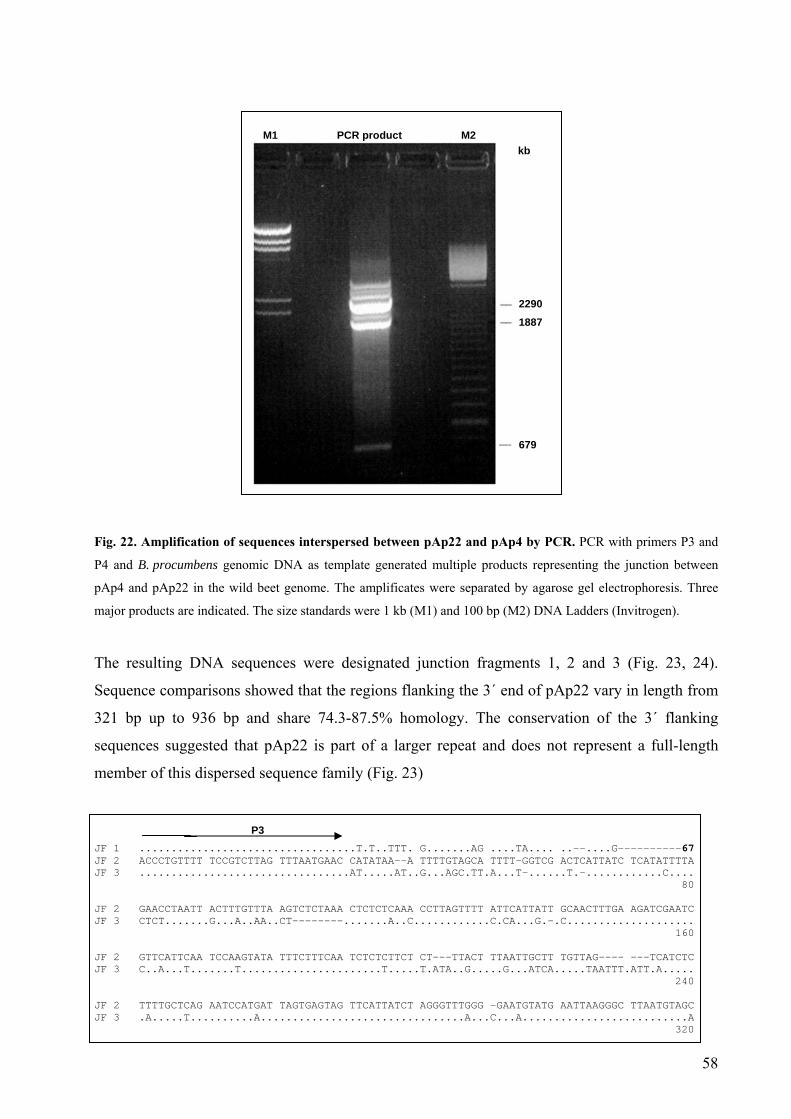
M1 PCR product M2
2290
1887 679
kb
Fig. 22. Amplification of sequences interspersed between pAp22 and pAp4 by PCR. PCR with primers P3 and
P4 and B. procumbens genomic DNA as template generated multiple products representing the junction between
pAp4 and pAp22 in the wild beet genome. The amplificates were separated by agarose gel electrophoresis. Three
major products are indicated. The size standards were 1 kb (M1) and 100 bp (M2) DNA Ladders (Invitrogen).
The resulting DNA sequences were designated junction fragments 1, 2 and 3 (Fig. 23, 24).
Sequence comparisons showed that the regions flanking the 3´ end of pAp22 vary in length from
321 bp up to 936 bp and share 74.3-87.5% homology. The conservation of the 3´ flanking
sequences suggested that pAp22 is part of a larger repeat and does not represent a full-length
member of this dispersed sequence family (Fig. 23)
JF 1 ..................................T.T..TTT. G.......AG ....TA.... ..--....G----------67 JF 2 ACCCTGTTTT TCCGTCTTAG TTTAATGAAC CATATAA—-A TTTTGTAGCA TTTT-GGTCG ACTCATTATC TCATATTTTA JF 3 .................................AT.....AT..G...AGC.TT.A...T-......T.-............C.... 80 JF 2 GAACCTAATT ACTTTGTTTA AGTCTCTAAA CTCTCTCAAA CCTTAGTTTT ATTCATTATT GCAACTTTGA AGATCGAATC JF 3 CTCT.......G...A..AA..CT--------.......A..C............C.CA...G.-.C.................... 160 JF 2 GTTCATTCAA TCCAAGTATA TTTCTTTCAA TCTCTCTTCT CT---TTACT TTAATTGCTT TGTTAG---- ---TCATCTC JF 3 C..A...T.......T......................T.....T.ATA..G.....G...ATCA.....TAATTT.ATT.A..... 240 JF 2 TTTTGCTCAG AATCCATGAT TAGTGAGTAG TTCATTATCT AGGGTTTGGG –GAATGTATG AATTAAGGGC TTAATGTAGC JF 3 .A.....T..........A................................A...C...A..........................A 320
P3
58
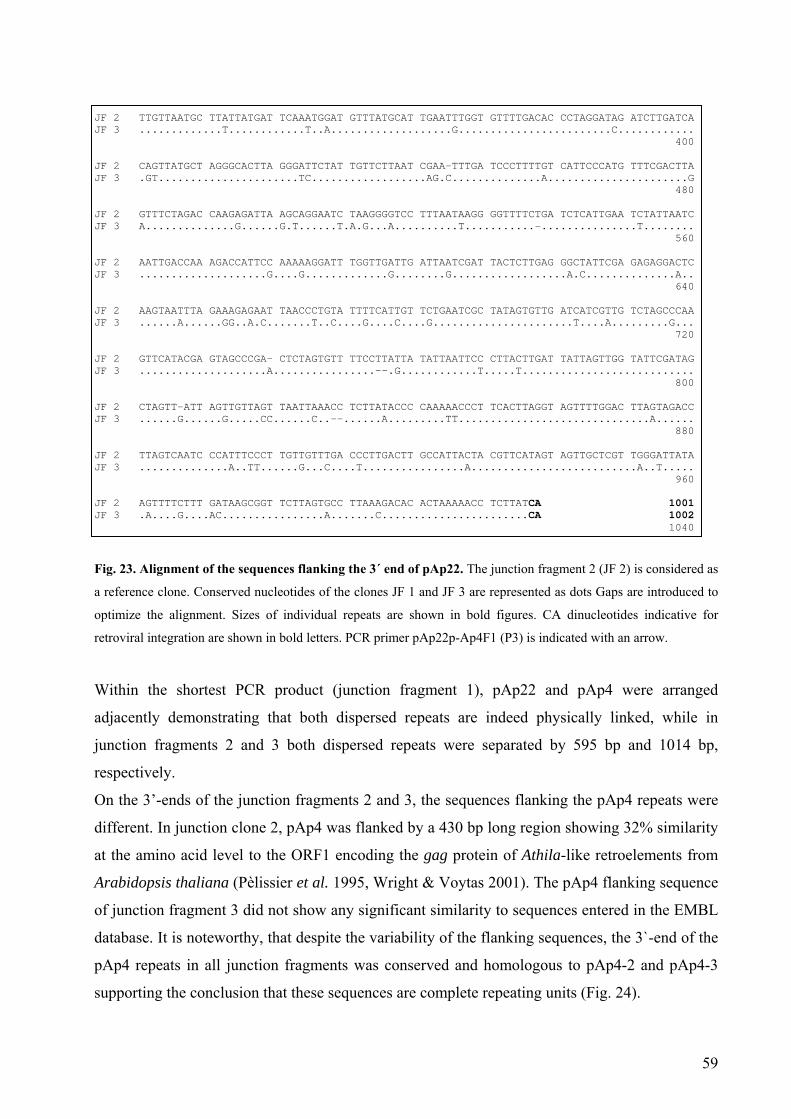
JF 2 TTGTTAATGC TTATTATGAT TCAAATGGAT GTTTATGCAT TGAATTTGGT GTTTTGACAC CCTAGGATAG ATCTTGATCA JF 3 .............T............T..A...................G........................C............ 400 JF 2 CAGTTATGCT AGGGCACTTA GGGATTCTAT TGTTCTTAAT CGAA-TTTGA TCCCTTTTGT CATTCCCATG TTTCGACTTA JF 3 .GT......................TC..................AG.C..............A......................G 480 JF 2 GTTTCTAGAC CAAGAGATTA AGCAGGAATC TAAGGGGTCC TTTAATAAGG GGTTTTCTGA TCTCATTGAA TCTATTAATC JF 3 A..............G......G.T......T.A.G...A..........T...........-...............T........ 560 JF 2 AATTGACCAA AGACCATTCC AAAAAGGATT TGGTTGATTG ATTAATCGAT TACTCTTGAG GGCTATTCGA GAGAGGACTC JF 3 ....................G....G.............G........G..................A.C..............A.. 640 JF 2 AAGTAATTTA GAAAGAGAAT TAACCCTGTA TTTTCATTGT TCTGAATCGC TATAGTGTTG ATCATCGTTG TCTAGCCCAA JF 3 ......A......GG..A.C.......T..C....G....C....G......................T....A.........G... 720 JF 2 GTTCATACGA GTAGCCCGA- CTCTAGTGTT TTCCTTATTA TATTAATTCC CTTACTTGAT TATTAGTTGG TATTCGATAG JF 3 ....................A................--.G............T.....T........................... 800 JF 2 CTAGTT-ATT AGTTGTTAGT TAATTAAACC TCTTATACCC CAAAAACCCT TCACTTAGGT AGTTTTGGAC TTAGTAGACC JF 3 ......G......G.....CC......C..--......A.........TT..............................A...... 880 JF 2 TTAGTCAATC CCATTTCCCT TGTTGTTTGA CCCTTGACTT GCCATTACTA CGTTCATAGT AGTTGCTCGT TGGGATTATA JF 3 ..............A..TT......G...C....T................A..........................A..T..... 960 JF 2 AGTTTTCTTT GATAAGCGGT TCTTAGTGCC TTAAAGACAC ACTAAAAACC TCTTATCA 1001 JF 3 .A....G....AC................A.......C.......................CA 1002 1040
Fig. 23. Alignment of the sequences flanking the 3´ end of pAp22. The junction fragment 2 (JF 2) is considered as
a reference clone. Conserved nucleotides of the clones JF 1 and JF 3 are represented as dots Gaps are introduced to
optimize the alignment. Sizes of individual repeats are shown in bold figures. CA dinucleotides indicative for
retroviral integration are shown in bold letters. PCR primer pAp22p-Ap4F1 (P3) is indicated with an arrow.
Within the shortest PCR product (junction fragment 1), pAp22 and pAp4 were arranged
adjacently demonstrating that both dispersed repeats are indeed physically linked, while in
junction fragments 2 and 3 both dispersed repeats were separated by 595 bp and 1014 bp,
respectively.
On the 3’-ends of the junction fragments 2 and 3, the sequences flanking the pAp4 repeats were
different. In junction clone 2, pAp4 was flanked by a 430 bp long region showing 32% similarity
at the amino acid level to the ORF1 encoding the gag protein of Athila-like retroelements from
Arabidopsis thaliana (Pèlissier et al. 1995, Wright & Voytas 2001). The pAp4 flanking sequence
of junction fragment 3 did not show any significant similarity to sequences entered in the EMBL
database. It is noteworthy, that despite the variability of the flanking sequences, the 3`-end of the
pAp4 repeats in all junction fragments was conserved and homologous to pAp4-2 and pAp4-3
supporting the conclusion that these sequences are complete repeating units (Fig. 24).
59
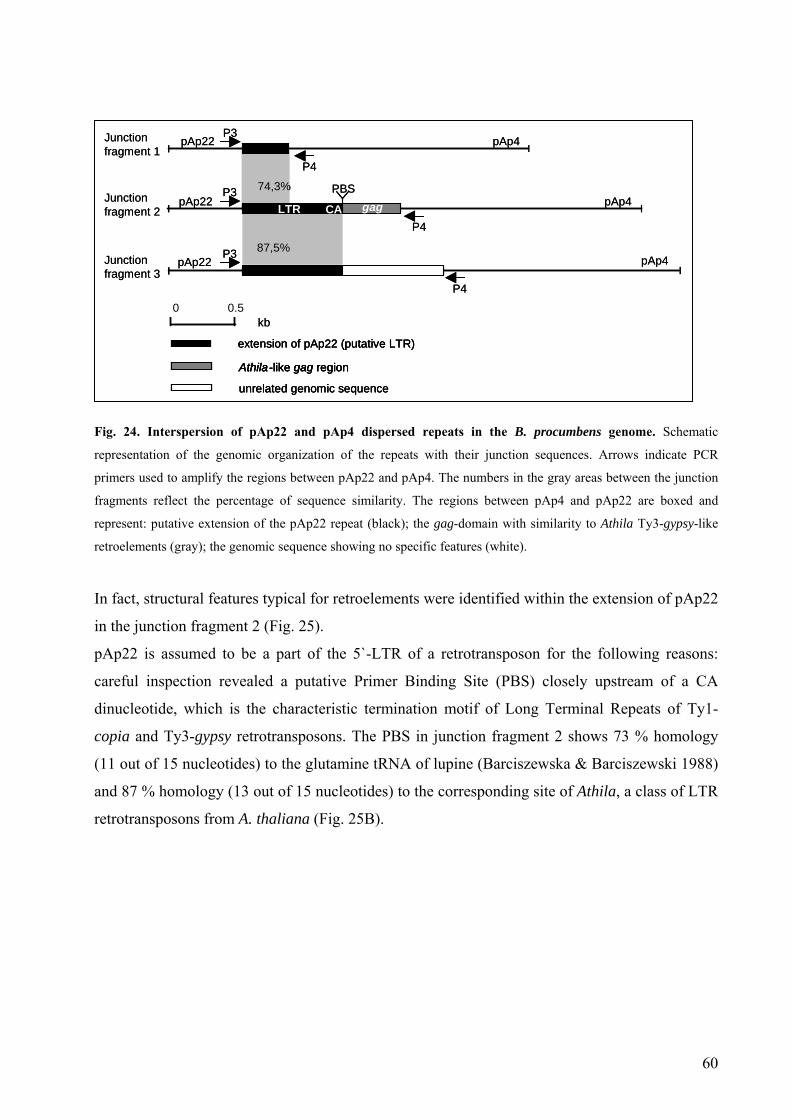
F
r
p
f
r
r
I
i
p
c
d
c
(
a
r
pAp4pAp22P3Junction pAp4pAp22P3Junction
P4
pAp4pAp22P3
P4
fragment 1
Junction fragment 2
Athila -like gag region
extension of pAp22 (putative LTR)
unrelated genomic sequence
pAp4pAp22P3
P4
Junction fragment 3
74,3%
87,5%
0 0.5kb
LTR CA
PBSgag
P4
pAp4pAp22P3
P4
fragment 1
Junction fragment 2
Athila -like gag region
extension of pAp22 (putative LTR)
unrelated genomic sequence
Athila -like gag regionAthila -like gag region
extension of pAp22 (putative LTR)
unrelated genomic sequence
pAp4pAp22P3
P4
Junction fragment 3
74,3%
87,5%
0 0.5kb
LTR CA
PBSgag
ig. 24. Interspersion of pAp22 and pAp4 dispersed repeats in the B. procumbens genome. Schematic
epresentation of the genomic organization of the repeats with their junction sequences. Arrows indicate PCR
rimers used to amplify the regions between pAp22 and pAp4. The numbers in the gray areas between the junction
ragments reflect the percentage of sequence similarity. The regions between pAp4 and pAp22 are boxed and
epresent: putative extension of the pAp22 repeat (black); the gag-domain with similarity to Athila Ty3-gypsy-like
etroelements (gray); the genomic sequence showing no specific features (white).
n fact, structural features typical for retroelements were identified within the extension of pAp22
n the junction fragment 2 (Fig. 25).
Ap22 is assumed to be a part of the 5`-LTR of a retrotransposon for the following reasons:
areful inspection revealed a putative Primer Binding Site (PBS) closely upstream of a CA
inucleotide, which is the characteristic termination motif of Long Terminal Repeats of Ty1-
opia and Ty3-gypsy retrotransposons. The PBS in junction fragment 2 shows 73 % homology
11 out of 15 nucleotides) to the glutamine tRNA of lupine (Barciszewska & Barciszewski 1988)
nd 87 % homology (13 out of 15 nucleotides) to the corresponding site of Athila, a class of LTR
etrotransposons from A. thaliana (Fig. 25B).
60
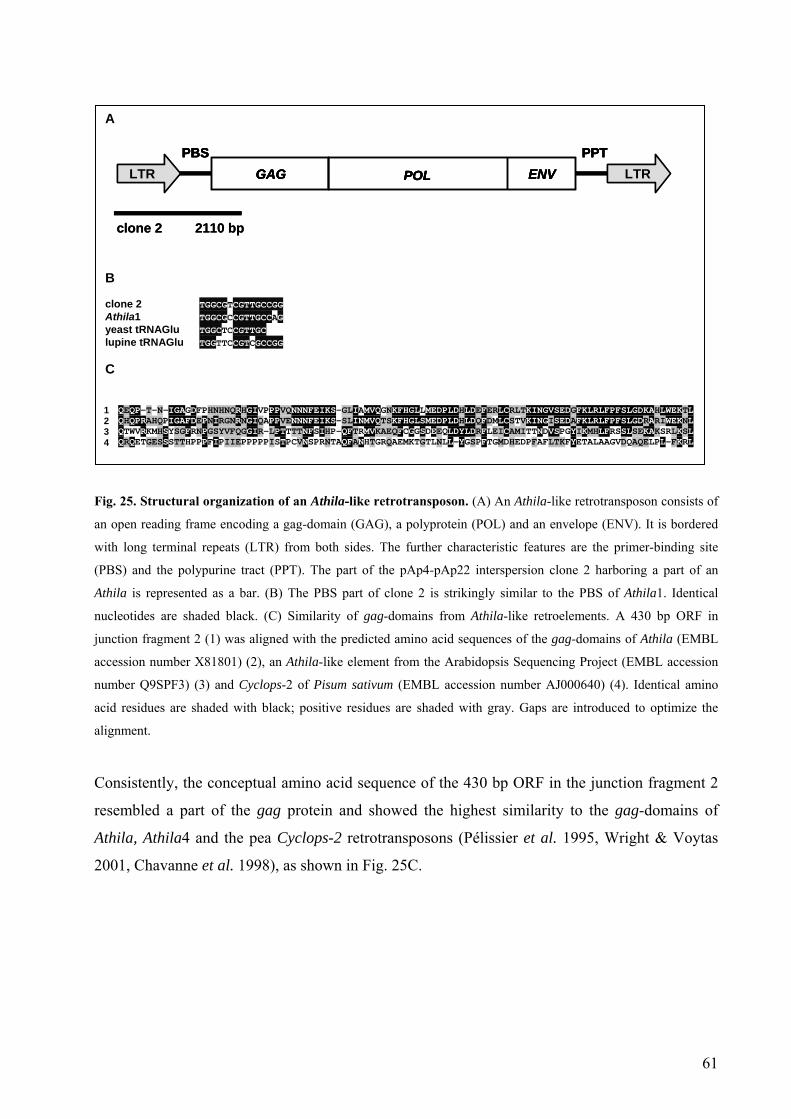
QEQP-T-N-IGAGDFPHNHNQRHGIVPPPVQNNNFEIKS-GLIAMVQGNKFHGLLMEDPLDHLDEFERLCRLTKINGVSEDGFKLRLFPFSLGDKAHLWEKTL QHQPRAHQPIGAFDEPNIRGNRNGIQAPPVENNNFEIKS-SLINMVQTSKFHGLSMEDPLDHLDQFDMLCSTVKINGISEDAFKLRLFPFSLGDRARIWEKNL QTWVRKMHSYSGFRNPGSYVFQGGIR-LPTTTTNFSIHP-QFTRMVKAEQFCGGSDEEQLDYLDRFLEICAMITTNDVSPGYIKMHLFRSSLSEKAKSRLKSL QRQETGESSSTTHPPPFIPIIEPPPPPISTPCVNSPRNTAQFANHTGRQAEMKTGTLNLL-YGSPFTGMDHEDPFAFLTKFYETALAAGVDQAQELPL-FKRL
1 2 3 4
A
GAG ENVPOLLTR LTRPBS PPT
GAG ENVPOL
clone 2 2110 bp
LTR LTRPBS PPT
GAG ENVPOLLTR LTRPBS PPT
GAG ENVPOL
clone 2 2110 bp
LTR LTRPBS PPT
B clone 2 TGGCGTCGTTGCCGG Athila1 TGGCGCCGTTGCCAG yeast tRNAGlu TGGCTCCGTTGC lupine tRNAGlu TGGTTCCGTCGCCGG C
Fig. 25. Structural organization of an Athila-like retrotransposon. (A) An Athila-like retrotransposon consists of
an open reading frame encoding a gag-domain (GAG), a polyprotein (POL) and an envelope (ENV). It is bordered
with long terminal repeats (LTR) from both sides. The further characteristic features are the primer-binding site
(PBS) and the polypurine tract (PPT). The part of the pAp4-pAp22 interspersion clone 2 harboring a part of an
Athila is represented as a bar. (B) The PBS part of clone 2 is strikingly similar to the PBS of Athila1. Identical
nucleotides are shaded black. (C) Similarity of gag-domains from Athila-like retroelements. A 430 bp ORF in
junction fragment 2 (1) was aligned with the predicted amino acid sequences of the gag-domains of Athila (EMBL
accession number X81801) (2), an Athila-like element from the Arabidopsis Sequencing Project (EMBL accession
number Q9SPF3) (3) and Cyclops-2 of Pisum sativum (EMBL accession number AJ000640) (4). Identical amino
acid residues are shaded with black; positive residues are shaded with gray. Gaps are introduced to optimize the
alignment.
Consistently, the conceptual amino acid sequence of the 430 bp ORF in the junction fragment 2
resembled a part of the gag protein and showed the highest similarity to the gag-domains of
Athila, Athila4 and the pea Cyclops-2 retrotransposons (Pélissier et al. 1995, Wright & Voytas
2001, Chavanne et al. 1998), as shown in Fig. 25C.
61
3.2. Organization of subterminal DNA sequences in sugar beet
Telomeres are specific nucleoprotein complexes which terminate eukaryotic chromosomes. They
are key domains responsible for the maintenance of stable chromosomes and genomes. The
information on telomere structure and function is now available for many vertebrate and
invertebrate animals, plants and fungi (Fuchs et al. 1995, McKnight & Shippen 2004). The first
plant telomere was cloned from Arabidopsis by Richards & Ausubel (1988). The sequence at the
telomere is highly conserved, consisting of the short repeat motif (TTTAGGG)n arranged in
tandem arrays of many hundreds of units (Ganal et al. 1991). However, the length of telomeric
arrays is species-specific, ranging from 2-5 kb in Arabidopsis thaliana (Richards & Ausubel
1988), through 8-175 kb in cereals (Vershinin & Heslop-Harrison 1998), up to 60-160 kb in
tobacco (Fajkus et al. 1995) and 13-223 kb in tomato (Zhong et al. 1998). The length of
telomeres differs between chromosome arms within a karyotype (Schwarzacher & Heslop-
Harrison 1991) as well as, depending on age, from cell-to-cell and tissue-to-tissue (Kilian et al.
1995).
Most plants, for example Arabidopsis and wheat, have the tandemly arranged sequence
(TTTAGGG)n as telomeric DNA. However, this is not the case for all plant species (Fuchs et al.
1995). The Arabidopsis-type telomere is absent in onion (Allium cepa) and related genera (Pich
et al. 1996). Many Asparagales have the vertebrate-like telomeric sequence (TTAGGG)n instead
(Fuchs et al. 1995, Adams et al. 2001, Weiss & Scherthan 2002), which is synthesized by a
specific telomerase (Weiss-Schneeweiss et al. 2004), or other variant repeats (Sykorova et al.
2003c). Recently, the absence of the Arabidopsis-type telomere was also reported for the dicot
family Solanaceae (Sykorova et al. 2003b).
In contrast to the telomeric DNA, adjacent sequences have a more complex, often species- or
even chromosome-specific character (Mao et al. 1997, Vischi et al. 2003, Vershinin et al. 1995).
They were found in many plant species (Flavell & Moore 1996). However, the detailed physical
organization of telomeric DNA and subtelomeric satellite repeat has only been studied by fiber
FISH for tomato (Zhong et al. 1998) and Silene (Sykorova et al. 2003a). Subtelomeric repeats
with chromosome-specific distribution may play a role in the recognition of homologous
chromosome ends and have been suggested to be part of a complex chromosome end structure
(Vershinin et al. 1995). The analysis of telomeres and adjacent sequences on rye chromosomes
showed that they are able to evolve in copy number rapidly (Alkhimova et al. 1999). Arrays of
62
these sequences are highly polymorphic among even closely related plant varieties (Broun et al.
1992).
This chapter presents the molecular-cytogenetic characterization of terminal repetitive DNA of
sugar beet B. vulgaris and related species. The sequence structure, satellite evolution, genomic
organization and species distribution of a novel subtelomeric satellite repeat family are described.
Its chromosomal position in wild and cultivated beet as well as its chromosomal relation to
telomeric repeats in sugar beet was analyzed by multi-color fluorescent in situ hybridization on
mitotic chromosomes and extended DNA fibers.
3.2.1. Sequence variation and genomic organization of subtelomeric satellite family
Many tandemly repeated sequences of Beta genomes have been isolated as restriction satellites
(Schmidt & Metzlaff 1991, Schmidt & Heslop-Harrison 1993, Schmidt & Heslop-Harrison 1996,
Kubis et al. 1997, Gao et al. 2000, Dechyeva et al. 2003). In an effort to characterize the major
repetitive DNA of sugar beet genome, its DNA was digested with a range of restriction enzymes
and shot-gun cloned. Among the resulting repetitive clones, a single 363 bp long pAv34 (ApaI
satellite of B. vulgaris, Jansen 1999) was chosen for detailed investigation.
Five additional representatives of this repetitive family were cloned from ApaI restricted
B. vulgaris genomic DNA using pAv34 (EMBL accession number AJ242669) as selection probe
for colony hybridization. They were designated pAv34-1 (AM076742), pAv34-2 (AM076743),
pAv34-17 (AM076744), pAv34-23 (AM076745), and pAv34-32 (AM076746). Sequences
analysis of these five satellites sharing a 89.8-94.7% identity showed presence of two conserved
internal RsaI sites. At the RsaI sites, each 360 bp pAv34 satellite could be divided into two
subunits SU1 and SU2 (Fig. 25 A). The subunits are 47.8-52.8% similar. Thus, the head-to-tail
organized copies of pAv34 could be represented as tandems of the subunits SU1 and SU2 (Fig.
25B).
63
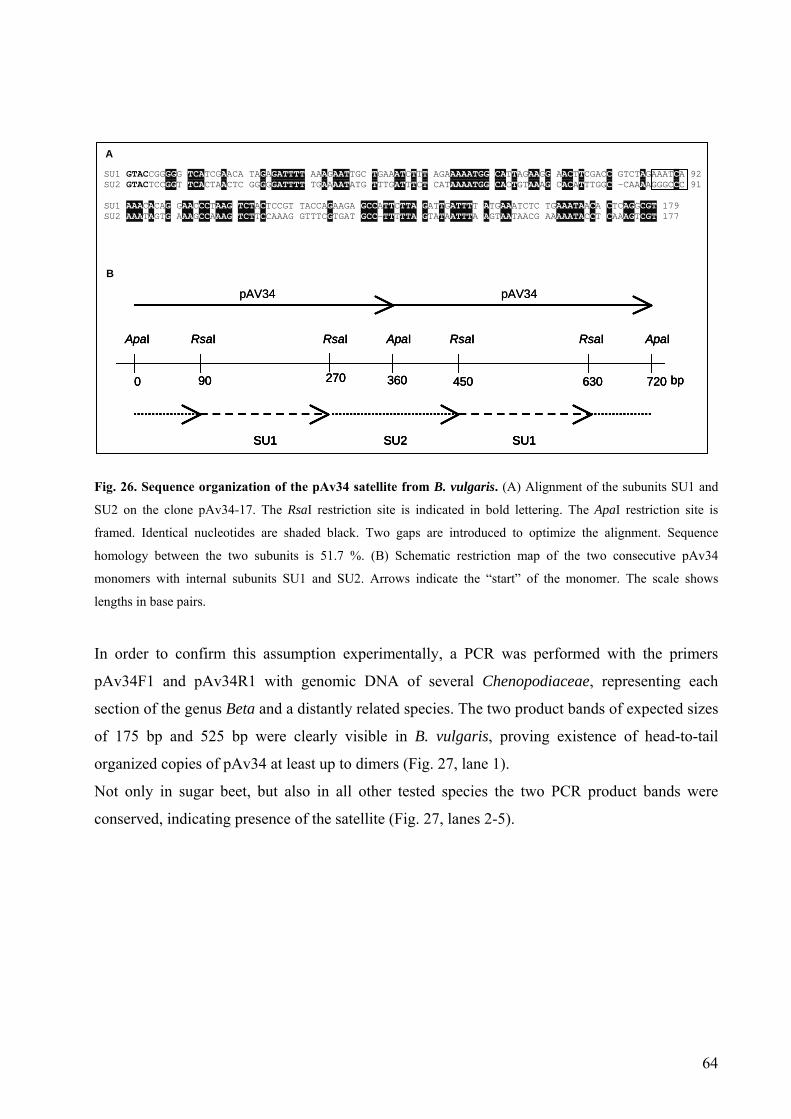
pAV34 pAV34
0 90 270 360 bp
ApaI ApaI ApaIRsaI RsaI RsaI RsaI
720450 630
SU2SU1 SU1
pAV34 pAV34
0 90 270 360 bp
ApaI ApaI ApaIRsaI RsaI RsaI RsaI
720450 6300 90 270 360 bp
ApaI ApaI ApaIRsaI RsaI RsaI RsaI
720450 630
SU2SU1 SU1SU2SU1 SU1SU2SU1 SU1
SU1 GTACCGGGGG TCATCGAACA TAGAGATTTT AAAGAATTGC TGAAATCTTT AGAAAAATGG CATTAGAAGG AACTTCGACC GTCTAGAAATCA 92SU2 GTACTCCGGT TCACTAACTC GGGGGATTTT TGAAAATATG TTTGATTTCT CATAAAATGG CACTGTAAAG CACATTTGGC –CAAAAGGGCCC 91 SU1 AAACACAG GAACCCTAAG TCTACTCCGT TACCAGAAGA GCCATTCTTA GATTGATTTT ATGAAATCTC TGAAATAACA CTCAGGCGT 179 SU2 AAATAGTG AAAGCCAAAG TCTTCCAAAG GTTTCGTGAT GCC-TTTTTA GTATAATTTA AGTAATAACG AAAAATACCT CAAAGTCGT 177
A
B
Fig. 26. Sequence organization of the pAv34 satellite from B. vulgaris. (A) Alignment of the subunits SU1 and
SU2 on the clone pAv34-17. The RsaI restriction site is indicated in bold lettering. The ApaI restriction site is
framed. Identical nucleotides are shaded black. Two gaps are introduced to optimize the alignment. Sequence
homology between the two subunits is 51.7 %. (B) Schematic restriction map of the two consecutive pAv34
monomers with internal subunits SU1 and SU2. Arrows indicate the “start” of the monomer. The scale shows
lengths in base pairs.
In order to confirm this assumption experimentally, a PCR was performed with the primers
pAv34F1 and pAv34R1 with genomic DNA of several Chenopodiaceae, representing each
section of the genus Beta and a distantly related species. The two product bands of expected sizes
of 175 bp and 525 bp were clearly visible in B. vulgaris, proving existence of head-to-tail
organized copies of pAv34 at least up to dimers (Fig. 27, lane 1).
Not only in sugar beet, but also in all other tested species the two PCR product bands were
conserved, indicating presence of the satellite (Fig. 27, lanes 2-5).
64
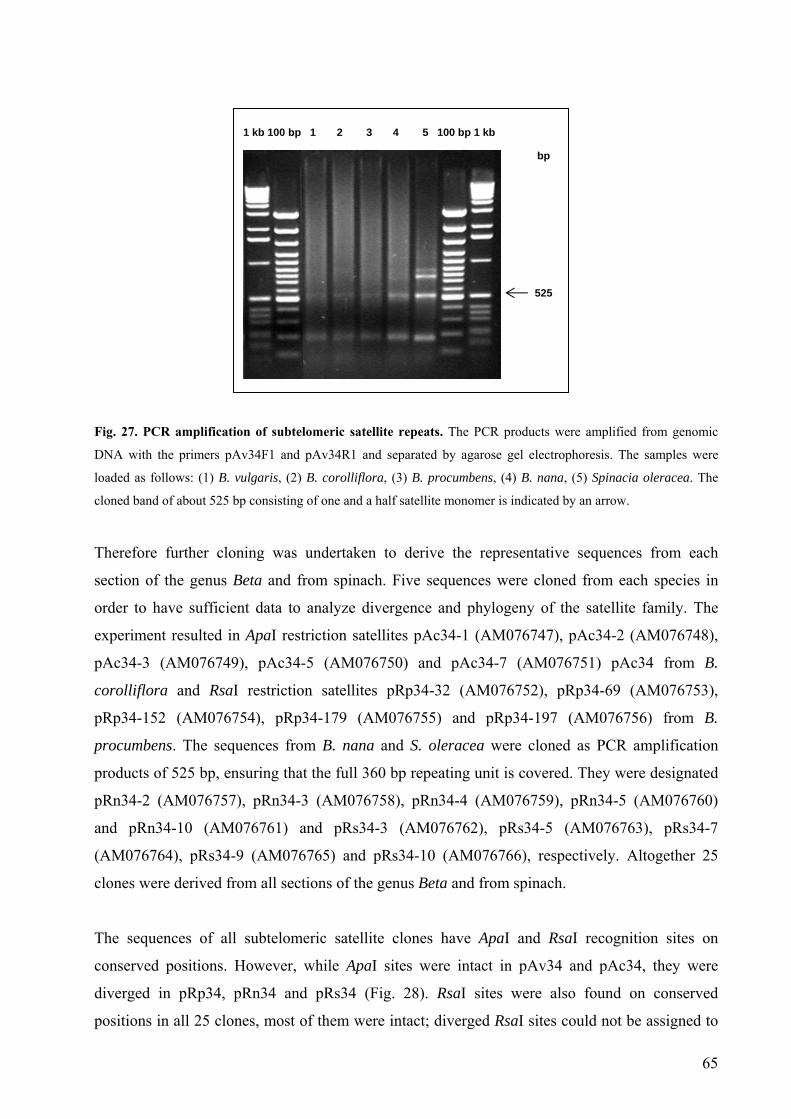
1 kb 100 bp 1 2 3 4 5 100 bp 1 kb
bp
525
Fig. 27. PCR amplification of subtelomeric satellite repeats. The PCR products were amplified from genomic
DNA with the primers pAv34F1 and pAv34R1 and separated by agarose gel electrophoresis. The samples were
loaded as follows: (1) B. vulgaris, (2) B. corolliflora, (3) B. procumbens, (4) B. nana, (5) Spinacia oleracea. The
cloned band of about 525 bp consisting of one and a half satellite monomer is indicated by an arrow.
Therefore further cloning was undertaken to derive the representative sequences from each
section of the genus Beta and from spinach. Five sequences were cloned from each species in
order to have sufficient data to analyze divergence and phylogeny of the satellite family. The
experiment resulted in ApaI restriction satellites pAc34-1 (AM076747), pAc34-2 (AM076748),
pAc34-3 (AM076749), pAc34-5 (AM076750) and pAc34-7 (AM076751) pAc34 from B.
corolliflora and RsaI restriction satellites pRp34-32 (AM076752), pRp34-69 (AM076753),
pRp34-152 (AM076754), pRp34-179 (AM076755) and pRp34-197 (AM076756) from B.
procumbens. The sequences from B. nana and S. oleracea were cloned as PCR amplification
products of 525 bp, ensuring that the full 360 bp repeating unit is covered. They were designated
pRn34-2 (AM076757), pRn34-3 (AM076758), pRn34-4 (AM076759), pRn34-5 (AM076760)
and pRn34-10 (AM076761) and pRs34-3 (AM076762), pRs34-5 (AM076763), pRs34-7
(AM076764), pRs34-9 (AM076765) and pRs34-10 (AM076766), respectively. Altogether 25
clones were derived from all sections of the genus Beta and from spinach.
The sequences of all subtelomeric satellite clones have ApaI and RsaI recognition sites on
conserved positions. However, while ApaI sites were intact in pAv34 and pAc34, they were
diverged in pRp34, pRn34 and pRs34 (Fig. 28). RsaI sites were also found on conserved
positions in all 25 clones, most of them were intact; diverged RsaI sites could not be assigned to
65
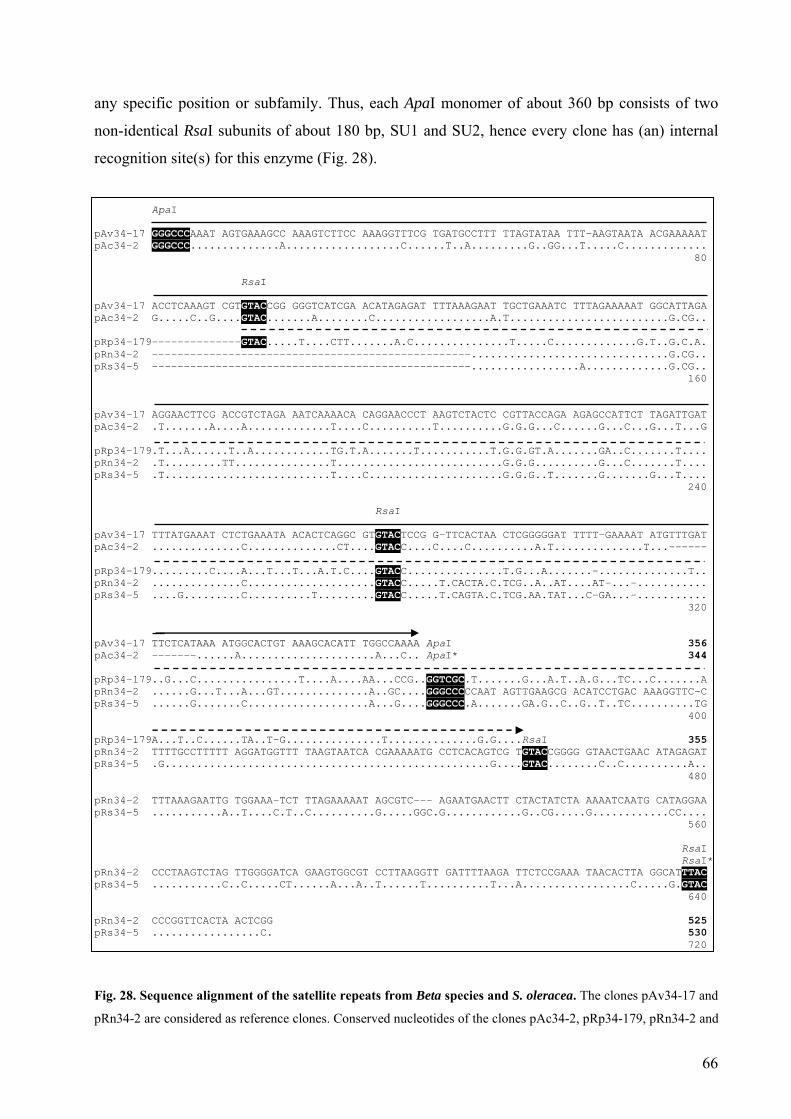
any specific position or subfamily. Thus, each ApaI monomer of about 360 bp consists of two
non-identical RsaI subunits of about 180 bp, SU1 and SU2, hence every clone has (an) internal
recognition site(s) for this enzyme (Fig. 28).
ApaI pAv34-17 GGGCCCAAAT AGTGAAAGCC AAAGTCTTCC AAAGGTTTCG TGATGCCTTT TTAGTATAA TTT-AAGTAATA ACGAAAAAT pAc34-2 GGGCCC..............A..................C......T..A.........G..GG...T.....C............. 80 RsaI pAv34-17 ACCTCAAAGT CGTGTACCGG GGGTCATCGA ACATAGAGAT TTTAAAGAAT TGCTGAAATC TTTAGAAAAAT GGCATTAGA pAc34-2 G.....C..G....GTAC.......A........C..................A.T.........................G.CG.. pRp34-179--------------GTAC.....T....CTT.......A.C...............T.....C.............G.T..G.C.A. pRn34-2 --------------------------------------------------...............................G.CG.. pRs34-5 --------------------------------------------------.................A.............G.CG.. 160 pAv34-17 AGGAACTTCG ACCGTCTAGA AATCAAAACA CAGGAACCCT AAGTCTACTC CGTTACCAGA AGAGCCATTCT TAGATTGAT pAc34-2 .T.......A....A.............T....C..........T..........G.G.G...C......G...C...G...T...G pRp34-179.T...A......T..A............TG.T.A.......T...........T.G.G.GT.A.......GA..C.......T.... pRn34-2 .T.........TT...............T..........................G.G.G..........G...C.......T.... pRs34-5 .T..........................T....C.....................G.G.G..T.......G.......G...T.... 240 RsaI pAv34-17 TTTATGAAAT CTCTGAAATA ACACTCAGGC GTGTACTCCG G-TTCACTAA CTCGGGGGAT TTTT-GAAAAT ATGTTTGAT pAc34-2 ..............C..............CT....GTACC....C....C..........A.T..............T...------ pRp34-179.........C....A...T...T...A.T.C....GTACC...............T.G...A.......-..............T.. pRn34-2 ..............C....................GTACC.....T.CACTA.C.TCG..A..AT....AT-...-........... pRs34-5 ....G.........C..........T.........GTACC.....T.CAGTA.C.TCG.AA.TAT...C-GA...-........... 320 pAv34-17 TTCTCATAAA ATGGCACTGT AAAGCACATT TGGCCAAAA ApaI 356 pAc34-2 -------......A.....................A...C.. ApaI* 344 pRp34-179..G...C................T....A....AA...CCG..GGTCGC.T.......G...A.T..A.G...TC...C.......A pRn34-2 ......G...T...A...GT..............A..GC....GGGCCCCCAAT AGTTGAAGCG ACATCCTGAC AAAGGTTC-C pRs34-5 ......G.......C...................A...G....GGGCCC.A.......GA.G..C..G..T..TC..........TG 400 pRp34-179A...T..C......TA..T-G...............T..............G.G....RsaI 355 pRn34-2 TTTTGCCTTTTT AGGATGGTTT TAAGTAATCA CGAAAAATG CCTCACAGTCG TGTACCGGGG GTAACTGAAC ATAGAGAT pRs34-5 .G...................................................G....GTAC........C..C..........A.. 480 pRn34-2 TTTAAAGAATTG TGGAAA-TCT TTAGAAAAAT AGCGTC--- AGAATGAACTT CTACTATCTA AAAATCAATG CATAGGAA pRs34-5 ...........A..T....C.T..C..........G.....GGC.G............G..CG.....G............CC.... 560 RsaI Rsa * IpRn34-2 CCCTAAGTCTAG TTGGGGATCA GAAGTGGCGT CCTTAAGGTT GATTTTAAGA TTCTCCGAAA TAACACTTA GGCATTTAC pRs34-5 ...........C..C.....CT......A...A..T......T..........T...A.................C.....G.GTAC 640 pRn34-2 CCCGGTTCACTA ACTCGG 525 pRs34-5 .................C. 530 720
Fig. 28. Sequence alignment of the satellite repeats from Beta species and S. oleracea. The clones pAv34-17 and
pRn34-2 are considered as reference clones. Conserved nucleotides of the clones pAc34-2, pRp34-179, pRn34-2 and
66
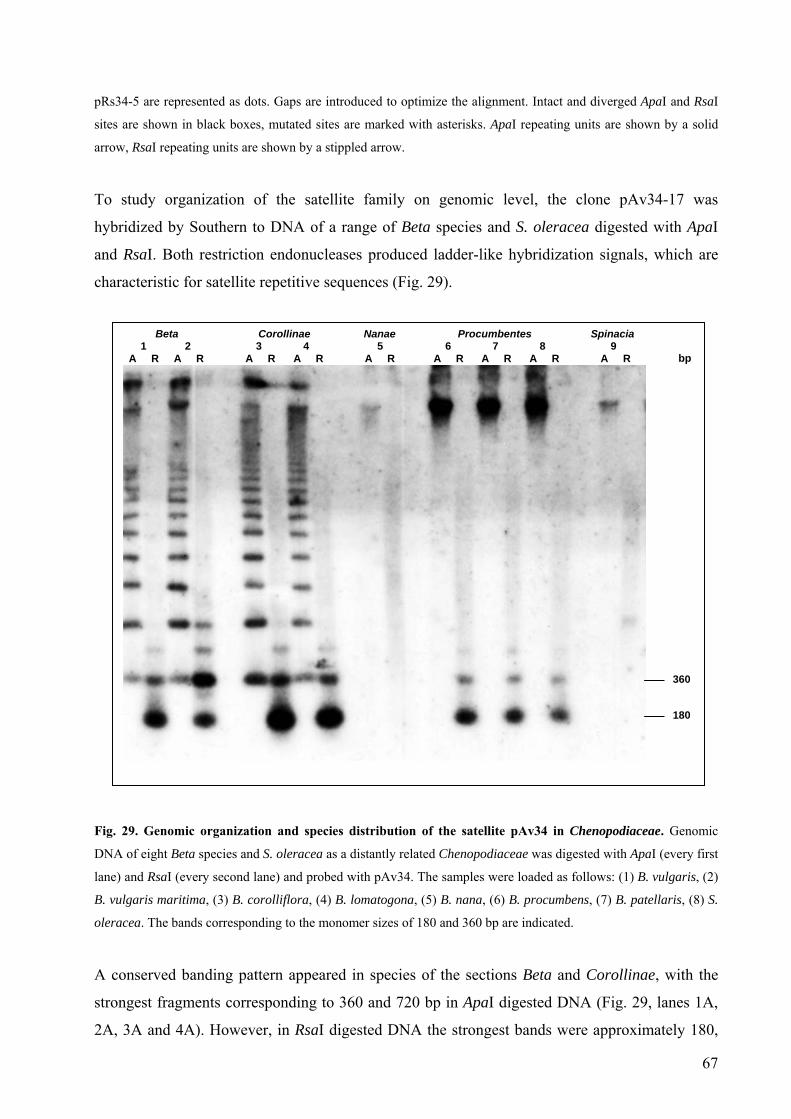
pRs34-5 are represented as dots. Gaps are introduced to optimize the alignment. Intact and diverged ApaI and RsaI
sites are shown in black boxes, mutated sites are marked with asterisks. ApaI repeating units are shown by a solid
arrow, RsaI repeating units are shown by a stippled arrow.
To study organization of the satellite family on genomic level, the clone pAv34-17 was
hybridized by Southern to DNA of a range of Beta species and S. oleracea digested with ApaI
and RsaI. Both restriction endonucleases produced ladder-like hybridization signals, which are
characteristic for satellite repetitive sequences (Fig. 29).
Beta Corollinae Nanae Procumbentes Spinacia 1 2 3 4 5 6 7 8 9 A R A R A R A R A R A R A R A R A R
360
bp
180
Fig. 29. Genomic organization and species distribution of the satellite pAv34 in Chenopodiaceae. Genomic
DNA of eight Beta species and S. oleracea as a distantly related Chenopodiaceae was digested with ApaI (every first
lane) and RsaI (every second lane) and probed with pAv34. The samples were loaded as follows: (1) B. vulgaris, (2)
B. vulgaris maritima, (3) B. corolliflora, (4) B. lomatogona, (5) B. nana, (6) B. procumbens, (7) B. patellaris, (8) S.
oleracea. The bands corresponding to the monomer sizes of 180 and 360 bp are indicated.
A conserved banding pattern appeared in species of the sections Beta and Corollinae, with the
strongest fragments corresponding to 360 and 720 bp in ApaI digested DNA (Fig. 29, lanes 1A,
2A, 3A and 4A). However, in RsaI digested DNA the strongest bands were approximately 180,
67
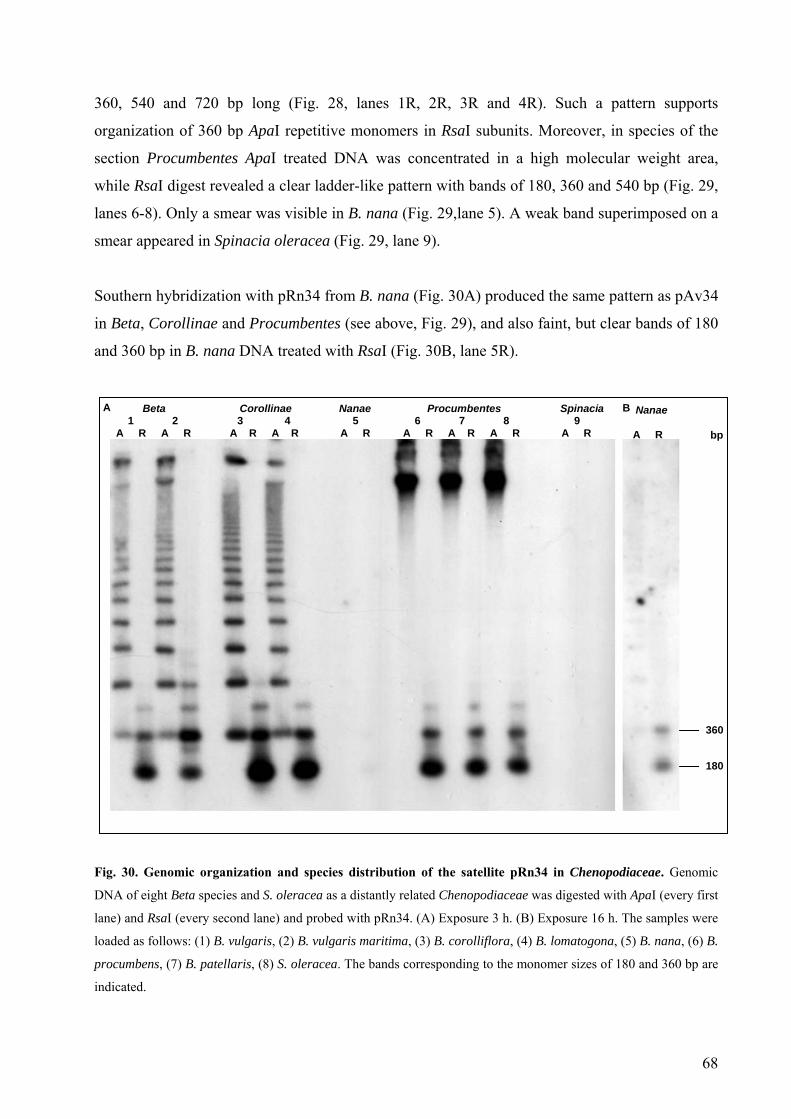
360, 540 and 720 bp long (Fig. 28, lanes 1R, 2R, 3R and 4R). Such a pattern supports
organization of 360 bp ApaI repetitive monomers in RsaI subunits. Moreover, in species of the
section Procumbentes ApaI treated DNA was concentrated in a high molecular weight area,
while RsaI digest revealed a clear ladder-like pattern with bands of 180, 360 and 540 bp (Fig. 29,
lanes 6-8). Only a smear was visible in B. nana (Fig. 29,lane 5). A weak band superimposed on a
smear appeared in Spinacia oleracea (Fig. 29, lane 9).
Southern hybridization with pRn34 from B. nana (Fig. 30A) produced the same pattern as pAv34
in Beta, Corollinae and Procumbentes (see above, Fig. 29), and also faint, but clear bands of 180
and 360 bp in B. nana DNA treated with RsaI (Fig. 30B, lane 5R).
B
A Beta Corollinae Nanae Procumbentes Spinacia 1 2 3 4 5 6 7 8 9 A R A R A R A R A R A R A R A R A R
360
bp
180
Nanae A R
B
Fig. 30. Genomic organization and species distribution of the satellite pRn34 in Chenopodiaceae. Genomic
DNA of eight Beta species and S. oleracea as a distantly related Chenopodiaceae was digested with ApaI (every first
lane) and RsaI (every second lane) and probed with pRn34. (A) Exposure 3 h. (B) Exposure 16 h. The samples were
loaded as follows: (1) B. vulgaris, (2) B. vulgaris maritima, (3) B. corolliflora, (4) B. lomatogona, (5) B. nana, (6) B.
procumbens, (7) B. patellaris, (8) S. oleracea. The bands corresponding to the monomer sizes of 180 and 360 bp are
indicated.
68
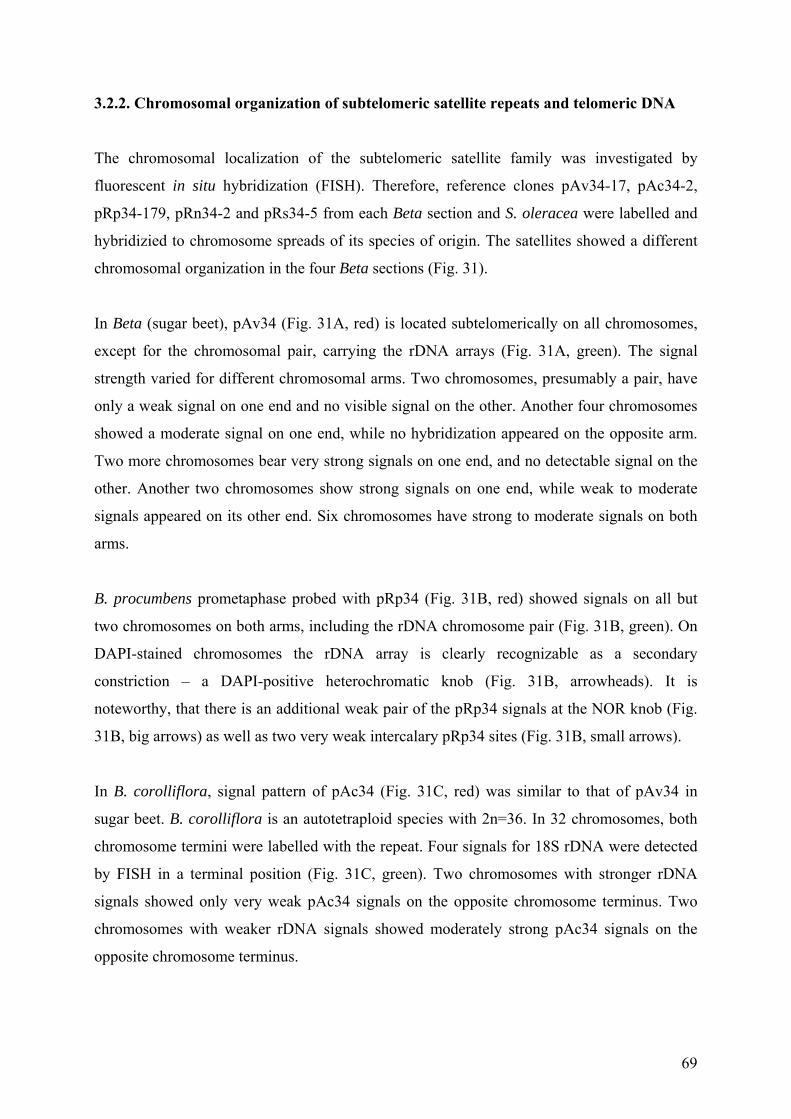
3.2.2. Chromosomal organization of subtelomeric satellite repeats and telomeric DNA
The chromosomal localization of the subtelomeric satellite family was investigated by
fluorescent in situ hybridization (FISH). Therefore, reference clones pAv34-17, pAc34-2,
pRp34-179, pRn34-2 and pRs34-5 from each Beta section and S. oleracea were labelled and
hybridizied to chromosome spreads of its species of origin. The satellites showed a different
chromosomal organization in the four Beta sections (Fig. 31).
In Beta (sugar beet), pAv34 (Fig. 31A, red) is located subtelomerically on all chromosomes,
except for the chromosomal pair, carrying the rDNA arrays (Fig. 31A, green). The signal
strength varied for different chromosomal arms. Two chromosomes, presumably a pair, have
only a weak signal on one end and no visible signal on the other. Another four chromosomes
showed a moderate signal on one end, while no hybridization appeared on the opposite arm.
Two more chromosomes bear very strong signals on one end, and no detectable signal on the
other. Another two chromosomes show strong signals on one end, while weak to moderate
signals appeared on its other end. Six chromosomes have strong to moderate signals on both
arms.
B. procumbens prometaphase probed with pRp34 (Fig. 31B, red) showed signals on all but
two chromosomes on both arms, including the rDNA chromosome pair (Fig. 31B, green). On
DAPI-stained chromosomes the rDNA array is clearly recognizable as a secondary
constriction – a DAPI-positive heterochromatic knob (Fig. 31B, arrowheads). It is
noteworthy, that there is an additional weak pair of the pRp34 signals at the NOR knob (Fig.
31B, big arrows) as well as two very weak intercalary pRp34 sites (Fig. 31B, small arrows).
In B. corolliflora, signal pattern of pAc34 (Fig. 31C, red) was similar to that of pAv34 in
sugar beet. B. corolliflora is an autotetraploid species with 2n=36. In 32 chromosomes, both
chromosome termini were labelled with the repeat. Four signals for 18S rDNA were detected
by FISH in a terminal position (Fig. 31C, green). Two chromosomes with stronger rDNA
signals showed only very weak pAc34 signals on the opposite chromosome terminus. Two
chromosomes with weaker rDNA signals showed moderately strong pAc34 signals on the
opposite chromosome terminus.
69
On a B. nana metaphase spread probed with pRn34 only two terminally located fluorescent
signals was detectable (Fig. 31D, red). The satellite is located on a chromosome pair which
does not harbors the array of 18S-5.8S-25S rRNA genes (Fig. 31D, green).
When pRs34 isolated from S. oleracea was hybridized to the chromosomes of this species,
only a pair of weak double signals on two chromosomes was detectable (Fig. 31E, red). The
signals were located intercalary.
FISH with the telomeric probe pLt11 (TTTAGGG)n on B. vulgaris revealed signals of similar
intensity on both arms of ten chromosomes (Fig. 31F, red). On six chromosomes one end has
a much stronger signal, than the other. On two chromosomes the probe is only present on one
end. The simultaneous hybridization with the rDNA probe pTa71 (Fig. 31F, green)
demonstrated, that the telomeric array is found on the outermost chromosome terminus
distally to the rDNA locus (Fig. 31G, arrowhead). This is the first double localization of the
telomere and the terminal 18S-5.8S-25S rRNA array by FISH on mitotic chromosomes.
A
F E
D C
B
G
Fig. 31. Chromosomal localization of subterminal DNA sequences in Chenopodiaceae species. Blue
fluorescence shows DNA stained with DAPI. The right images in each panel represent computerized overlays of
70
fluorescent signals with the DAPI-stained chromosomes. The scale bar in panel (F) corresponds to 10 µm. (A)
Hybridization of pAv34-17 to B. vulgaris prometaphase chromosomes. Every chromatid end is labeled with the
satellite repeat (red) with exception of the chromosome pair carrying terminal 18S-5.8S-25S rRNA genes
(green). (B) A B. procumbens prometaphase spread hybridized with pRp34-179 (red). Most chromatid ends are
labeled with the repeat, although the strength of the signals vary between chromosomes. There are also two
chromosomes having an intercalary pRp34 site (arrows). In contrast to B. vulgaris, chromosomes with rDNA
sites (green) show hybridization signals on both arms (arrowheads). On DAPI-stained chromosomes the rDNA
loci are clearly visible as heterochromatic knobs. (C) In a B. corolliflora metaphase pAc34-2 (red) labels both
chromosome arms of 32 chromosomes with double signals. Two chromosomes with stronger rDNA signals
(green) show only very faint pAc34 signals on the opposite chromosome terminus. Two chromosomes with
weaker rDNA signals (green) show pAc34 signals only on the opposite chromosome terminus. (D) In B. nana
clear double signals of pRn34-2 (red) are detectable on one arm of one chromosome pair only. rDNA signals
(green) are located on another chromosome pair. (E) There is only a single pair of weak intercalary pRs34-5
signals visible on two S. oleracea chromosomes. (F) Hybridization of the telomeric probe pLt11 to B. vulgaris
metaphase chromosomes. The telomeric array labels both chromosome termini of ten chromosomes with equal
strength. On six chromosomes one telomere gives a much stronger signal, while on two other chromosomes the
probe is only detectable on one arm. The rDNA arrays are visible as green fluorescence. (G) A close-up of the
image in panel F shows, that the telomere (red signal, arrowhead) is located distally from the rDNA array (green)
on the outermost chromosome end.
3.2.3. Fluorescent in situ hybridization to extended chromatin fibers of B. vulgaris
Fluorescent in situ hybridization on mitotic preparations revealed, that pAv34 satellite has
subterminal localization. Therefore, it seemed interesting to study organization of this satellite
and the plant telomere. The metaphase chromosome resolution is too low to analyze physical
organization of closely located DNA sequences in detail. Hence, a high-resolution FISH on
stretched DNA-fibers of B. vulgaris (fiber FISH) was applied to investigate the organization
of the telomere and subtelomeric satellite on individual DNA molecules.
B. vulgaris DNA fibers were subjected to double-target FISH with pLt11 (Fig. 32A and B,
green) and pAv34 (Fig. 32A and B, red). The patterns of green and red tracks of fluorescent
signals were obtained (example shown on Fig. 32B). The relative position of red and green
signals to residual nuclei clearly indicated the order of the satellite arrays, the telomeric repeat
being distal to the subtelomeric pAv34 (Fig. 32B). Most patterns consisted of green and red
signals immediately adjacent or separated by the non-fluorescent spacer. In addition,
individual stretches of green signals were observed (Fig. 32A).
71
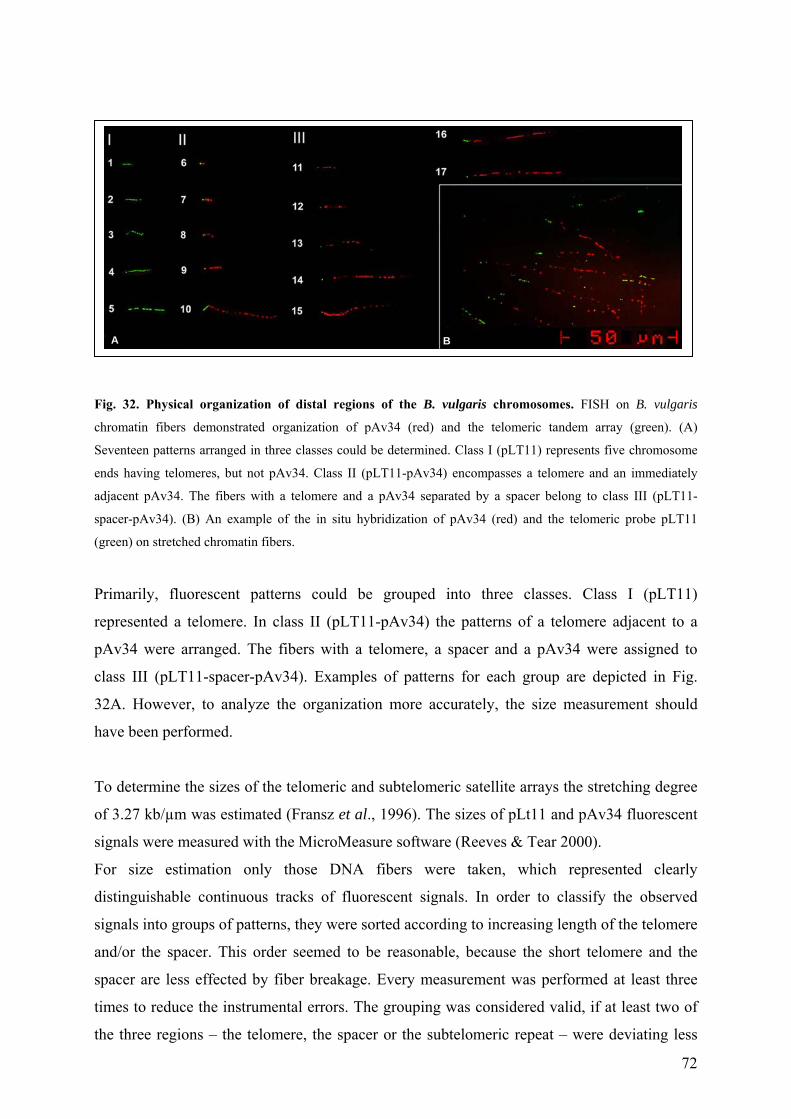
F
c
S
e
a
s
(
P
r
p
c
3
h
T
o
s
F
d
s
a
s
t
t
A B
ig. 32. Physical organization of distal regions of the B. vulgaris chromosomes. FISH on B. vulgaris
hromatin fibers demonstrated organization of pAv34 (red) and the telomeric tandem array (green). (A)
eventeen patterns arranged in three classes could be determined. Class I (pLT11) represents five chromosome
nds having telomeres, but not pAv34. Class II (pLT11-pAv34) encompasses a telomere and an immediately
djacent pAv34. The fibers with a telomere and a pAv34 separated by a spacer belong to class III (pLT11-
pacer-pAv34). (B) An example of the in situ hybridization of pAv34 (red) and the telomeric probe pLT11
green) on stretched chromatin fibers.
rimarily, fluorescent patterns could be grouped into three classes. Class I (pLT11)
epresented a telomere. In class II (pLT11-pAv34) the patterns of a telomere adjacent to a
Av34 were arranged. The fibers with a telomere, a spacer and a pAv34 were assigned to
lass III (pLT11-spacer-pAv34). Examples of patterns for each group are depicted in Fig.
2A. However, to analyze the organization more accurately, the size measurement should
ave been performed.
o determine the sizes of the telomeric and subtelomeric satellite arrays the stretching degree
f 3.27 kb/µm was estimated (Fransz et al., 1996). The sizes of pLt11 and pAv34 fluorescent
ignals were measured with the MicroMeasure software (Reeves & Tear 2000).
or size estimation only those DNA fibers were taken, which represented clearly
istinguishable continuous tracks of fluorescent signals. In order to classify the observed
ignals into groups of patterns, they were sorted according to increasing length of the telomere
nd/or the spacer. This order seemed to be reasonable, because the short telomere and the
pacer are less effected by fiber breakage. Every measurement was performed at least three
imes to reduce the instrumental errors. The grouping was considered valid, if at least two of
he three regions – the telomere, the spacer or the subtelomeric repeat – were deviating less
72
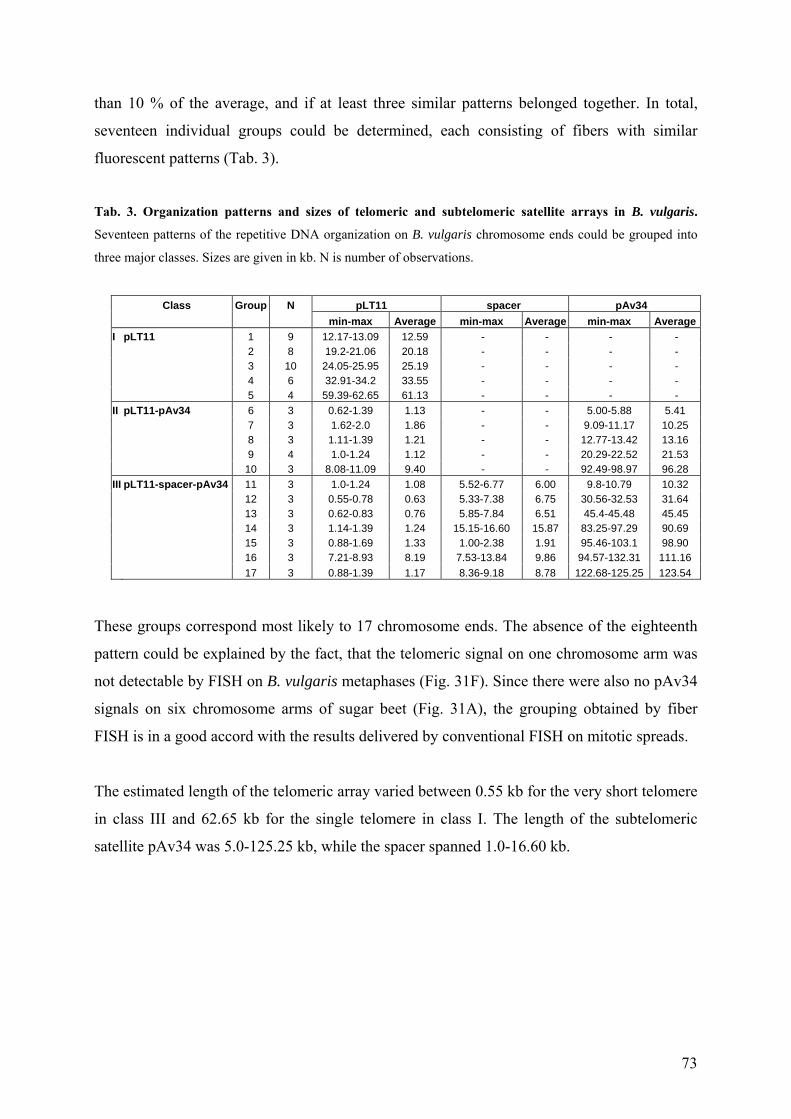
than 10 % of the average, and if at least three similar patterns belonged together. In total,
seventeen individual groups could be determined, each consisting of fibers with similar
fluorescent patterns (Tab. 3).
Tab. 3. Organization patterns and sizes of telomeric and subtelomeric satellite arrays in B. vulgaris.
Seventeen patterns of the repetitive DNA organization on B. vulgaris chromosome ends could be grouped into
three major classes. Sizes are given in kb. N is number of observations.
T
pa
no
si
F
T
in
sa
Class Group N pLT11 spacer pAv34 min-max Average min-max Average min-max AverageI pLT11 1 9 12.17-13.09 12.59 - - - - 2 8 19.2-21.06 20.18 - - - - 3 10 24.05-25.95 25.19 - - - - 4 6 32.91-34.2 33.55 - - - - 5 4 59.39-62.65 61.13 - - - - II pLT11-pAv34 6 3 0.62-1.39 1.13 - - 5.00-5.88 5.41 7 3 1.62-2.0 1.86 - - 9.09-11.17 10.25 8 3 1.11-1.39 1.21 - - 12.77-13.42 13.16 9 4 1.0-1.24 1.12 - - 20.29-22.52 21.53 10 3 8.08-11.09 9.40 - - 92.49-98.97 96.28 III pLT11-spacer-pAv34 11 3 1.0-1.24 1.08 5.52-6.77 6.00 9.8-10.79 10.32 12 3 0.55-0.78 0.63 5.33-7.38 6.75 30.56-32.53 31.64 13 3 0.62-0.83 0.76 5.85-7.84 6.51 45.4-45.48 45.45 14 3 1.14-1.39 1.24 15.15-16.60 15.87 83.25-97.29 90.69 15 3 0.88-1.69 1.33 1.00-2.38 1.91 95.46-103.1 98.90 16 3 7.21-8.93 8.19 7.53-13.84 9.86 94.57-132.31 111.16 17 3 0.88-1.39 1.17 8.36-9.18 8.78 122.68-125.25 123.54
hese groups correspond most likely to 17 chromosome ends. The absence of the eighteenth
ttern could be explained by the fact, that the telomeric signal on one chromosome arm was
t detectable by FISH on B. vulgaris metaphases (Fig. 31F). Since there were also no pAv34
gnals on six chromosome arms of sugar beet (Fig. 31A), the grouping obtained by fiber
ISH is in a good accord with the results delivered by conventional FISH on mitotic spreads.
he estimated length of the telomeric array varied between 0.55 kb for the very short telomere
class III and 62.65 kb for the single telomere in class I. The length of the subtelomeric
tellite pAv34 was 5.0-125.25 kb, while the spacer spanned 1.0-16.60 kb.
73
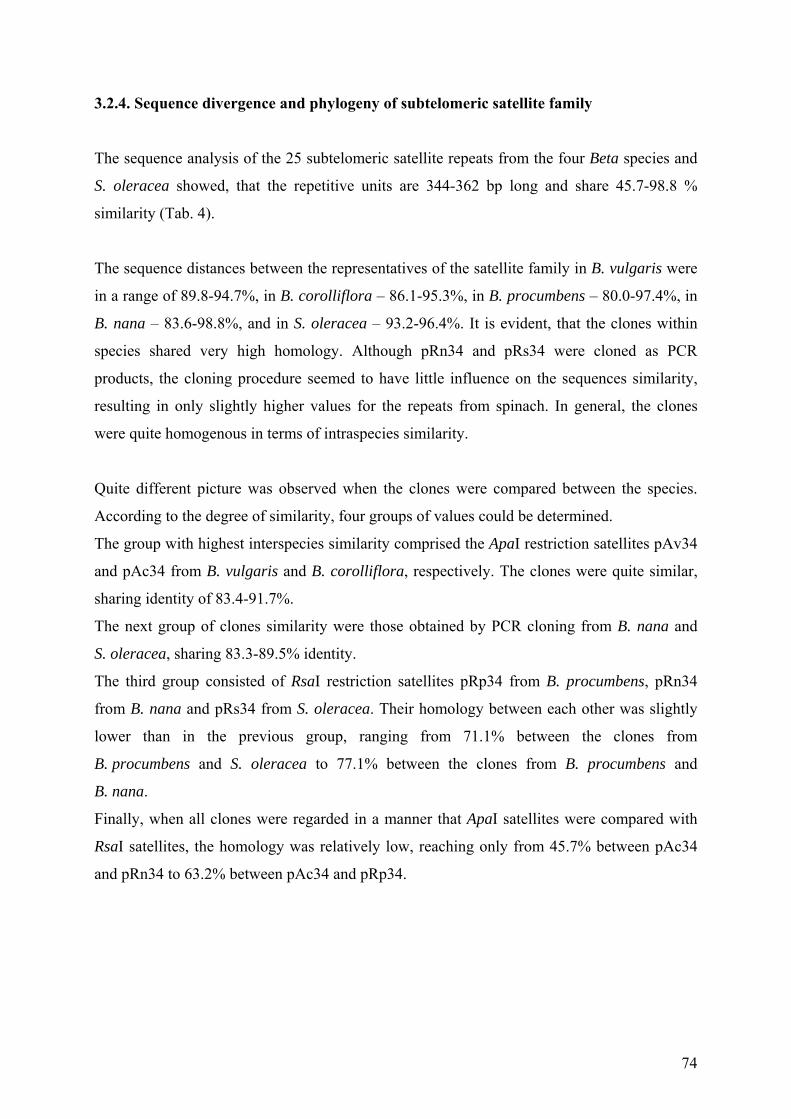
3.2.4. Sequence divergence and phylogeny of subtelomeric satellite family
The sequence analysis of the 25 subtelomeric satellite repeats from the four Beta species and
S. oleracea showed, that the repetitive units are 344-362 bp long and share 45.7-98.8 %
similarity (Tab. 4).
The sequence distances between the representatives of the satellite family in B. vulgaris were
in a range of 89.8-94.7%, in B. corolliflora – 86.1-95.3%, in B. procumbens – 80.0-97.4%, in
B. nana – 83.6-98.8%, and in S. oleracea – 93.2-96.4%. It is evident, that the clones within
species shared very high homology. Although pRn34 and pRs34 were cloned as PCR
products, the cloning procedure seemed to have little influence on the sequences similarity,
resulting in only slightly higher values for the repeats from spinach. In general, the clones
were quite homogenous in terms of intraspecies similarity.
Quite different picture was observed when the clones were compared between the species.
According to the degree of similarity, four groups of values could be determined.
The group with highest interspecies similarity comprised the ApaI restriction satellites pAv34
and pAc34 from B. vulgaris and B. corolliflora, respectively. The clones were quite similar,
sharing identity of 83.4-91.7%.
The next group of clones similarity were those obtained by PCR cloning from B. nana and
S. oleracea, sharing 83.3-89.5% identity.
The third group consisted of RsaI restriction satellites pRp34 from B. procumbens, pRn34
from B. nana and pRs34 from S. oleracea. Their homology between each other was slightly
lower than in the previous group, ranging from 71.1% between the clones from
B. procumbens and S. oleracea to 77.1% between the clones from B. procumbens and
B. nana.
Finally, when all clones were regarded in a manner that ApaI satellites were compared with
RsaI satellites, the homology was relatively low, reaching only from 45.7% between pAc34
and pRn34 to 63.2% between pAc34 and pRp34.
74
Tab. 4. Sequence distances between Beta subtelomeric satellite subfamilies. Percent similarity is calculated
by directly comparing pairs of sequences. Four groups of sequence distances are framed bold.
1 2 3 4 5 6 7 8 9 10 11 12 13 14 15 16 17 18 19 20 21 22 23 24 25 1 pAv34 1 - 2 pAv34 2 94.7 - 3 pAv34 17 93.6 94.2 - 4 pAv34 23 93.1 91.7 90.0 - 5 pAv34 32 91.1 90.3 89.8 90.0 - 6 pAc34 1 90.9 90.3 90.0 90.0 91.7 - 7 pAc34 2 83.4 83.9 82.8 83.4 84.5 86.1 - 8 pAc34 3 90.9 89.5 88.6 89.2 90.3 92.8 86.4 - 9 pAc34 5 91.4 91.1 90.3 91.7 91.7 95.3 86.7 93.9 - 10 pAc34 7 89.2 88.9 88.1 88.4 89.2 92.5 86.1 92.0 93.6 - 11 pRp34 179 58.7 58.4 58.7 59.3 59.6 61.2 55.1 59.8 60.4 60.7 - 12 pRp34 197 58.7 58.4 58.7 59.3 59.6 61.2 54.8 59.8 60.4 59.6 97.4 - 13 pRp34 32 56.8 57.1 57.1 57.9 57.3 59.8 53.7 58.4 59.0 57.9 87.7 87.9 - 14 pRp34 69 58.7 58.2 58.7 59.0 60.1 60.7 54.0 59.3 60.1 57.9 86.6 86.6 88.3 - 15 pRp34 152 60.1 60.4 60.7 60.4 60.7 63.2 56.0 60.9 62.3 60.7 81.5 81.9 80.0 80.8 - 16 pRn34 2 54.6 54.0 54.6 54.6 56.2 57.1 50.7 56.8 57.6 55.1 75.3 76.4 72.9 72.7 74.2 - 17 pRn34 3 55.1 54.6 55.1 54.6 56.8 57.6 51.2 57.3 57.3 55.7 76.0 77.1 73.3 73.3 74.0 98.5 - 18 pRn34 4 54.3 53.7 54.6 53.7 55.7 56.8 50.4 56.5 56.5 54.8 75.3 76.4 72.7 72.7 73.3 98.8 98.5 - 19 pRn34 5 55.4 54.8 55.4 54.8 57.1 57.9 51.2 57.1 57.1 55.4 75.6 76.7 72.9 72.9 73.3 97.4 98.3 97.4 - 20 pRn34 10 49.6 50.1 48.8 49.9 49.0 51.5 45.7 50.7 51.0 50.4 72.2 72.9 69.8 69.4 71.6 84.1 84.5 84.1 83.6 - 21 pSp34 3 54.6 54.6 55.1 53.7 55.7 57.1 51.5 57.9 58.4 56.5 74.4 75.6 72.7 72.0 73.1 89.3 89.5 89.0 88.7 84.4 - 22 pAs34 5 53.2 52.9 53.7 52.6 54.6 56.0 50.1 56.5 57.6 55.1 73.6 74.7 71.1 71.8 72.5 89.2 89.3 88.9 88.3 84.1 94.3 - 23 pAs34 7 53.5 53.2 54.0 52.9 54.3 56.0 50.1 56.5 57.1 55.1 73.3 74.4 71.1 71.1 72.0 89.0 89.2 89.0 88.1 83.6 94.1 94.0 - 24 pSp34 9 54.6 53.2 54.0 52.9 54.8 56.5 50.4 56.5 57.6 55.1 73.8 74.9 70.9 71.6 72.2 89.2 89.3 88.9 88.4 83.3 93.2 94.0 93.7 - 25 pSp34 10 54.3 54.0 54.8 53.5 55.1 56.8 51.0 57.6 58.2 56.2 74.2 75.3 71.8 72.0 72.9 89.3 89.5 89.3 88.4 83.9 94.6 94.3 96.4 93.8 -
To investigate the phylogenetic relationship between the sequences from different species,
they were subjected to maximum likelihood and neighbor joining analyses. Both methods
provided identical trees. The 25 satellite sequences from four Beta species and spinach
appeared arranged in four clades. The only two species-specific clades resolved with strong
bootstrap support were the pRn34 from B. nana and pRp34 from B. procumbens (bootstrap
values 98 % and 86 % respectively). The maximum likelihood analysis indicated that the
satellites pAv34 from B. vulgaris as well as pRs34 from S. oleracea are arranged in specific
clades, although not significantly supported. The relationships of pAc34 from B. corolliflora
were not fully resolved by the maximum likelihood tree and appeared partly distorted in
separate branches. However, a number of smaller species-specific supported clades was
detected among the clones from sugar beet, B. corolliflora and spinach (Fig. 33).
75
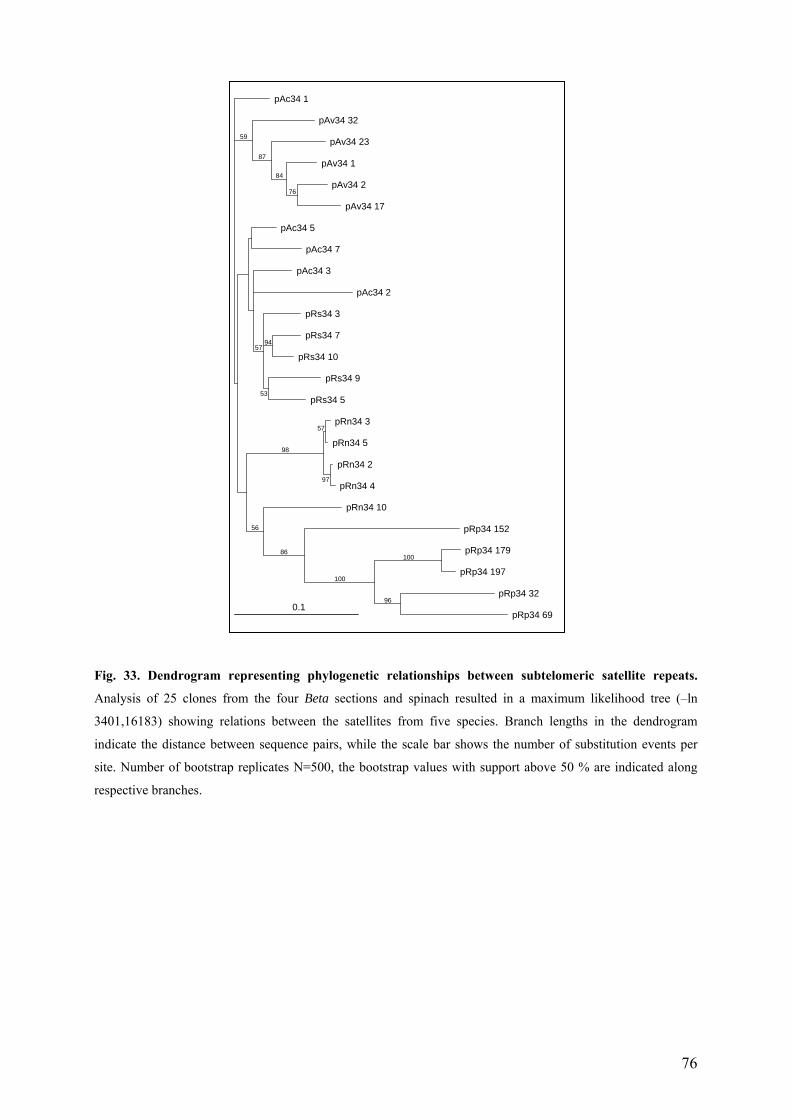
pAc34 1
59 pAv34 32
87 pAv34 23
84 pAv34 1
76 pAv34 2
pAv34 17
pAc34 5 pAc34 7
pAc34 3
pAc34 2
57
pRs34 3
94 pRs34 7
pRs34 10
53 pRs34 9
pRs34 5
98 57 pRn34 3
pRn34 5
97
pRn34 2
pRn34 4
56 pRn34 10
86 pRp34 152
100
100pRp34 179
pRp34 197
96pRp34 32
pRp34 690.1
Fig. 33. Dendrogram representing phylogenetic relationships between subtelomeric satellite repeats.
Analysis of 25 clones from the four Beta sections and spinach resulted in a maximum likelihood tree (–ln
3401,16183) showing relations between the satellites from five species. Branch lengths in the dendrogram
indicate the distance between sequence pairs, while the scale bar shows the number of substitution events per
site. Number of bootstrap replicates N=500, the bootstrap values with support above 50 % are indicated along
respective branches.
76
When the subunits SU1 and SU2 comprising each of the subtelomeric satellite 360 bp
monomers were aligned between each other, they appeared to be highly similar within the
group: 73.9-100 % for SU1 and 72.4-100 % for SU2. On the contrary, the sequence variation
between the groups of subunits SU1 and SU2 was significantly higher – 46.6-58.0 % (Tab. 5
and 6).
Similarly to analysis of complete 360 bp repeating units, the sequence similarities between the
subunits SU1 could be regarded first, within each species; and second, between different
species.
Within the species, the subunits SU1 were mostly similar in B. nana with 86.1-100% (average
93.0%) and the less similar in B. procumbens with 73.9-97.2% (average 85.5%). In the rest of
the species, the subunits SU1 shared similar average homology of 91.5-92.7% in a range of
88.3-95.0% in B. vulgaris, 88.9-95.0% in B. corolliflora and 90.6-93.9% in S. oleracea.
Average homology between SU1 of PCR clones from B. nana and S. oleracea was only
slightly higher than the average homology of ApaI restriction satellites from B. vulgaris and
B. corolliflora. Thus, similarly to the observation of the complete 360 bp monomers, the
cloning method seem to have no effect on the intraspecies subunits similarity.
When the subunits SU1 were compared between the species, the same four similarity groups
(see above, Tab. 4) could be determined.
The highest similarity was shared by the ApaI restriction satellites from B. vulgaris and
B. corolliflora, reaching from 83.3% to 92.8%, or 88.0% on average.
The products of PCR cloning pRn34 and pRs34 had nearly the same homology of 83.3% to
90.5% (average 86.9%), while the RsaI satellites shared lower similarity of 75.0-82.2%
(78.6% on average).
When subunits SU1 from ApaI restriction satellites were compared to RsaI satellites, the
sequence similarities varied between 74.4% and 96.7% (85.5% on average). The most similar
sequences were AluI from B. corolliflora and RsaI from S. oleracea, sharing 86.1-96.7%
homology (average 91.4%), while the most distant among SU1 were RsaI sequences from
B. procumbens and ApaI restriction satellites from B. vulgaris and B. corolliflora with
homology of 74.4-85.0% (79.7% average) (Tab. 5).
77
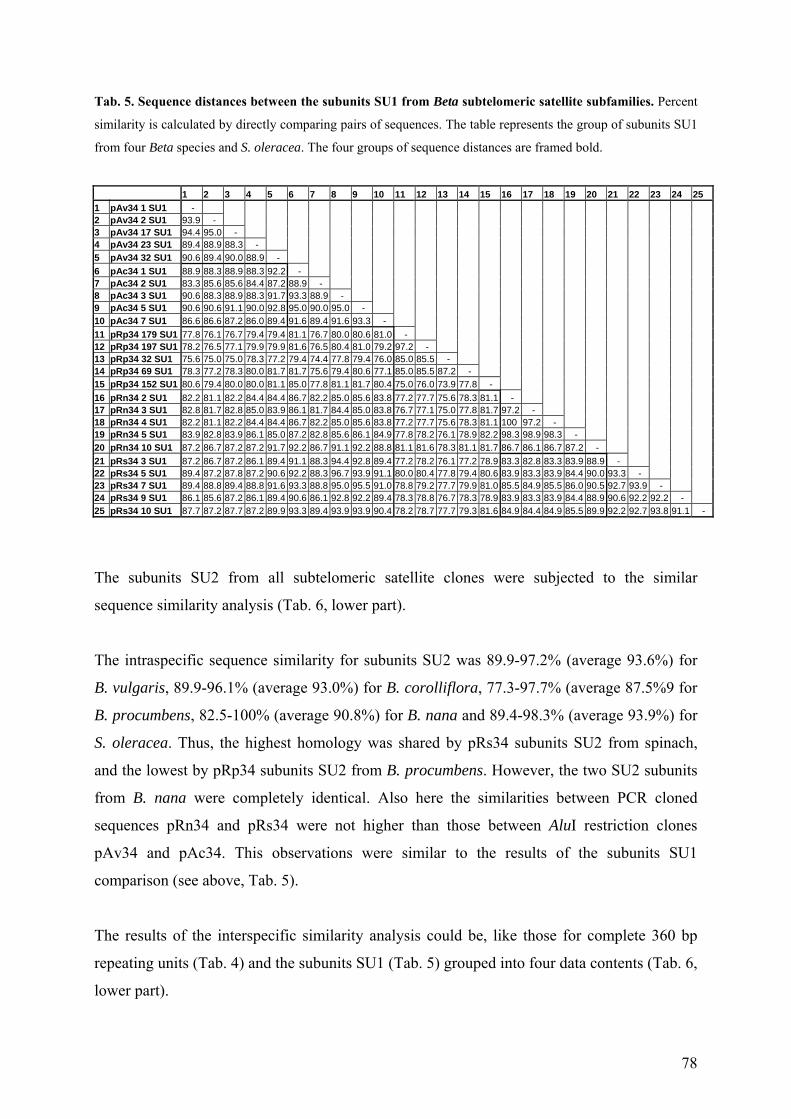
Tab. 5. Sequence distances between the subunits SU1 from Beta subtelomeric satellite subfamilies. Percent
similarity is calculated by directly comparing pairs of sequences. The table represents the group of subunits SU1
from four Beta species and S. oleracea. The four groups of sequence distances are framed bold.
1 2 3 4 5 6 7 8 9 10 11 12 13 14 15 16 17 18 19 20 21 22 23 24 25 1 pAv34 1 SU1 - 2 pAv34 2 SU1 93.9 - 3 pAv34 17 SU1 94.4 95.0 - 4 pAv34 23 SU1 89.4 88.9 88.3 - 5 pAv34 32 SU1 90.6 89.4 90.0 88.9 - 6 pAc34 1 SU1 88.9 88.3 88.9 88.3 92.2 - 7 pAc34 2 SU1 83.3 85.6 85.6 84.4 87.2 88.9 - 8 pAc34 3 SU1 90.6 88.3 88.9 88.3 91.7 93.3 88.9 - 9 pAc34 5 SU1 90.6 90.6 91.1 90.0 92.8 95.0 90.0 95.0 - 10 pAc34 7 SU1 86.6 86.6 87.2 86.0 89.4 91.6 89.4 91.6 93.3 - 11 pRp34 179 SU1 77.8 76.1 76.7 79.4 79.4 81.1 76.7 80.0 80.6 81.0 - 12 pRp34 197 SU1 78.2 76.5 77.1 79.9 79.9 81.6 76.5 80.4 81.0 79.2 97.2 - 13 pRp34 32 SU1 75.6 75.0 75.0 78.3 77.2 79.4 74.4 77.8 79.4 76.0 85.0 85.5 - 14 pRp34 69 SU1 78.3 77.2 78.3 80.0 81.7 81.7 75.6 79.4 80.6 77.1 85.0 85.5 87.2 - 15 pRp34 152 SU1 80.6 79.4 80.0 80.0 81.1 85.0 77.8 81.1 81.7 80.4 75.0 76.0 73.9 77.8 - 16 pRn34 2 SU1 82.2 81.1 82.2 84.4 84.4 86.7 82.2 85.0 85.6 83.8 77.2 77.7 75.6 78.3 81.1 - 17 pRn34 3 SU1 82.8 81.7 82.8 85.0 83.9 86.1 81.7 84.4 85.0 83.8 76.7 77.1 75.0 77.8 81.7 97.2 - 18 pRn34 4 SU1 82.2 81.1 82.2 84.4 84.4 86.7 82.2 85.0 85.6 83.8 77.2 77.7 75.6 78.3 81.1 100 97.2 - 19 pRn34 5 SU1 83.9 82.8 83.9 86.1 85.0 87.2 82.8 85.6 86.1 84.9 77.8 78.2 76.1 78.9 82.2 98.3 98.9 98.3 - 20 pRn34 10 SU1 87.2 86.7 87.2 87.2 91.7 92.2 86.7 91.1 92.2 88.8 81.1 81.6 78.3 81.1 81.7 86.7 86.1 86.7 87.2 - 21 pRs34 3 SU1 87.2 86.7 87.2 86.1 89.4 91.1 88.3 94.4 92.8 89.4 77.2 78.2 76.1 77.2 78.9 83.3 82.8 83.3 83.9 88.9 - 22 pRs34 5 SU1 89.4 87.2 87.8 87.2 90.6 92.2 88.3 96.7 93.9 91.1 80.0 80.4 77.8 79.4 80.6 83.9 83.3 83.9 84.4 90.0 93.3 - 23 pRs34 7 SU1 89.4 88.8 89.4 88.8 91.6 93.3 88.8 95.0 95.5 91.0 78.8 79.2 77.7 79.9 81.0 85.5 84.9 85.5 86.0 90.5 92.7 93.9 - 24 pRs34 9 SU1 86.1 85.6 87.2 86.1 89.4 90.6 86.1 92.8 92.2 89.4 78.3 78.8 76.7 78.3 78.9 83.9 83.3 83.9 84.4 88.9 90.6 92.2 92.2 - 25 pRs34 10 SU1 87.7 87.2 87.7 87.2 89.9 93.3 89.4 93.9 93.9 90.4 78.2 78.7 77.7 79.3 81.6 84.9 84.4 84.9 85.5 89.9 92.2 92.7 93.8 91.1 -
The subunits SU2 from all subtelomeric satellite clones were subjected to the similar
sequence similarity analysis (Tab. 6, lower part).
The intraspecific sequence similarity for subunits SU2 was 89.9-97.2% (average 93.6%) for
B. vulgaris, 89.9-96.1% (average 93.0%) for B. corolliflora, 77.3-97.7% (average 87.5%9 for
B. procumbens, 82.5-100% (average 90.8%) for B. nana and 89.4-98.3% (average 93.9%) for
S. oleracea. Thus, the highest homology was shared by pRs34 subunits SU2 from spinach,
and the lowest by pRp34 subunits SU2 from B. procumbens. However, the two SU2 subunits
from B. nana were completely identical. Also here the similarities between PCR cloned
sequences pRn34 and pRs34 were not higher than those between AluI restriction clones
pAv34 and pAc34. This observations were similar to the results of the subunits SU1
comparison (see above, Tab. 5).
The results of the interspecific similarity analysis could be, like those for complete 360 bp
repeating units (Tab. 4) and the subunits SU1 (Tab. 5) grouped into four data contents (Tab. 6,
lower part).
78
The comparison of PCR-derived sequences from B. nana and S. oleracea revealed similarities
of 80.2-86.0% (average 83.1%) between the subunits SU2.
The similarity between the AluI clones pAv34 and pAc34, subunits SU2 was higher, ranging
from 86.7% to 93.9% (90.3% on average).
The subunits SU2 from RsaI clones pRp34, pRn34 and pRs34 shared the lowest homology of
73.7-79.9% (77.8% average).
Finally, when AluI restriction satellites subunits SU2 were compared to those from RsaI
restriction satellites, the similarity averaged 83.1%, ranging from 72.4% to 93.9%. The lowest
homology was shared between the subunits SU2 from B. procumbens and from AluI
restriction satellites pAv34 and pRC34, reaching 77.4% (72.4-82.4%), while the most similar
were the SU2 sequences from B. corolliflora and S. oleracea, with the values of 86.7-93.9%
(90.3% on average).
The comparison of the subunits SU1 and SU2 from all 25 subtelomeric clones between each
other produces a relatively homogenous data matrix (Tab. 6, upper part).
On average, the similarity values ranged between 41.5% and 54.2% (average 48.1%) and
were drastically lover than those, obtained by comparison of subunits SU1 and SU2 within
each other.
The highest similarity values were characteristic for the subunits SU1 and SU2 from pAv34
of B. vulgaris when compared to the subunits SU2 and SU1 from pRs34 of S. oleracea,
averaging 50.9% and 51.3%, respectively.
The lowest homology of 44.3% average was shared by the subunits SU1 from pRp34 of
B. procumbens and the subunits SU2 from pRn34 of B. nana.
79
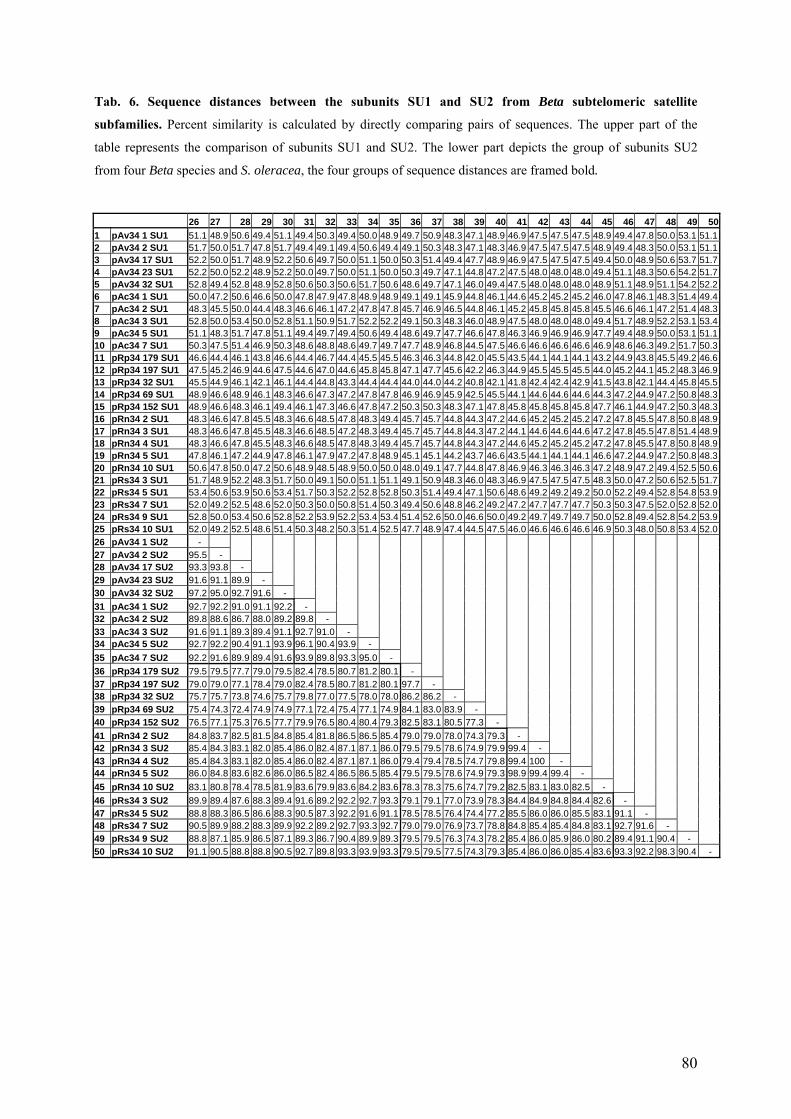
Tab. 6. Sequence distances between the subunits SU1 and SU2 from Beta subtelomeric satellite
subfamilies. Percent similarity is calculated by directly comparing pairs of sequences. The upper part of the
table represents the comparison of subunits SU1 and SU2. The lower part depicts the group of subunits SU2
from four Beta species and S. oleracea, the four groups of sequence distances are framed bold.
26 27 28 29 30 31 32 33 34 35 36 37 38 39 40 41 42 43 44 45 46 47 48 49 501 pAv34 1 SU1 51.1 48.9 50.6 49.4 51.1 49.4 50.3 49.4 50.0 48.9 49.7 50.9 48.3 47.1 48.9 46.9 47.5 47.5 47.5 48.9 49.4 47.8 50.0 53.1 51.12 pAv34 2 SU1 51.7 50.0 51.7 47.8 51.7 49.4 49.1 49.4 50.6 49.4 49.1 50.3 48.3 47.1 48.3 46.9 47.5 47.5 47.5 48.9 49.4 48.3 50.0 53.1 51.13 pAv34 17 SU1 52.2 50.0 51.7 48.9 52.2 50.6 49.7 50.0 51.1 50.0 50.3 51.4 49.4 47.7 48.9 46.9 47.5 47.5 47.5 49.4 50.0 48.9 50.6 53.7 51.74 pAv34 23 SU1 52.2 50.0 52.2 48.9 52.2 50.0 49.7 50.0 51.1 50.0 50.3 49.7 47.1 44.8 47.2 47.5 48.0 48.0 48.0 49.4 51.1 48.3 50.6 54.2 51.75 pAv34 32 SU1 52.8 49.4 52.8 48.9 52.8 50.6 50.3 50.6 51.7 50.6 48.6 49.7 47.1 46.0 49.4 47.5 48.0 48.0 48.0 48.9 51.1 48.9 51.1 54.2 52.26 pAc34 1 SU1 50.0 47.2 50.6 46.6 50.0 47.8 47.9 47.8 48.9 48.9 49.1 49.1 45.9 44.8 46.1 44.6 45.2 45.2 45.2 46.0 47.8 46.1 48.3 51.4 49.47 pAc34 2 SU1 48.3 45.5 50.0 44.4 48.3 46.6 46.1 47.2 47.8 47.8 45.7 46.9 46.5 44.8 46.1 45.2 45.8 45.8 45.8 45.5 46.6 46.1 47.2 51.4 48.38 pAc34 3 SU1 52.8 50.0 53.4 50.0 52.8 51.1 50.9 51.7 52.2 52.2 49.1 50.3 48.3 46.0 48.9 47.5 48.0 48.0 48.0 49.4 51.7 48.9 52.2 53.1 53.49 pAc34 5 SU1 51.1 48.3 51.7 47.8 51.1 49.4 49.7 49.4 50.6 49.4 48.6 49.7 47.7 46.6 47.8 46.3 46.9 46.9 46.9 47.7 49.4 48.9 50.0 53.1 51.110 pAc34 7 SU1 50.3 47.5 51.4 46.9 50.3 48.6 48.8 48.6 49.7 49.7 47.7 48.9 46.8 44.5 47.5 46.6 46.6 46.6 46.6 46.9 48.6 46.3 49.2 51.7 50.311 pRp34 179 SU1 46.6 44.4 46.1 43.8 46.6 44.4 46.7 44.4 45.5 45.5 46.3 46.3 44.8 42.0 45.5 43.5 44.1 44.1 44.1 43.2 44.9 43.8 45.5 49.2 46.612 pRp34 197 SU1 47.5 45.2 46.9 44.6 47.5 44.6 47.0 44.6 45.8 45.8 47.1 47.7 45.6 42.2 46.3 44.9 45.5 45.5 45.5 44.0 45.2 44.1 45.2 48.3 46.913 pRp34 32 SU1 45.5 44.9 46.1 42.1 46.1 44.4 44.8 43.3 44.4 44.4 44.0 44.0 44.2 40.8 42.1 41.8 42.4 42.4 42.9 41.5 43.8 42.1 44.4 45.8 45.514 pRp34 69 SU1 48.9 46.6 48.9 46.1 48.3 46.6 47.3 47.2 47.8 47.8 46.9 46.9 45.9 42.5 45.5 44.1 44.6 44.6 44.6 44.3 47.2 44.9 47.2 50.8 48.315 pRp34 152 SU1 48.9 46.6 48.3 46.1 49.4 46.1 47.3 46.6 47.8 47.2 50.3 50.3 48.3 47.1 47.8 45.8 45.8 45.8 45.8 47.7 46.1 44.9 47.2 50.3 48.316 pRn34 2 SU1 48.3 46.6 47.8 45.5 48.3 46.6 48.5 47.8 48.3 49.4 45.7 45.7 44.8 44.3 47.2 44.6 45.2 45.2 45.2 47.2 47.8 45.5 47.8 50.8 48.917 pRn34 3 SU1 48.3 46.6 47.8 45.5 48.3 46.6 48.5 47.2 48.3 49.4 45.7 45.7 44.8 44.3 47.2 44.1 44.6 44.6 44.6 47.2 47.8 45.5 47.8 51.4 48.918 pRn34 4 SU1 48.3 46.6 47.8 45.5 48.3 46.6 48.5 47.8 48.3 49.4 45.7 45.7 44.8 44.3 47.2 44.6 45.2 45.2 45.2 47.2 47.8 45.5 47.8 50.8 48.919 pRn34 5 SU1 47.8 46.1 47.2 44.9 47.8 46.1 47.9 47.2 47.8 48.9 45.1 45.1 44.2 43.7 46.6 43.5 44.1 44.1 44.1 46.6 47.2 44.9 47.2 50.8 48.320 pRn34 10 SU1 50.6 47.8 50.0 47.2 50.6 48.9 48.5 48.9 50.0 50.0 48.0 49.1 47.7 44.8 47.8 46.9 46.3 46.3 46.3 47.2 48.9 47.2 49.4 52.5 50.621 pRs34 3 SU1 51.7 48.9 52.2 48.3 51.7 50.0 49.1 50.0 51.1 51.1 49.1 50.9 48.3 46.0 48.3 46.9 47.5 47.5 47.5 48.3 50.0 47.2 50.6 52.5 51.722 pRs34 5 SU1 53.4 50.6 53.9 50.6 53.4 51.7 50.3 52.2 52.8 52.8 50.3 51.4 49.4 47.1 50.6 48.6 49.2 49.2 49.2 50.0 52.2 49.4 52.8 54.8 53.923 pRs34 7 SU1 52.0 49.2 52.5 48.6 52.0 50.3 50.0 50.8 51.4 50.3 49.4 50.6 48.8 46.2 49.2 47.2 47.7 47.7 47.7 50.3 50.3 47.5 52.0 52.8 52.024 pRs34 9 SU1 52.8 50.0 53.4 50.6 52.8 52.2 53.9 52.2 53.4 53.4 51.4 52.6 50.0 46.6 50.0 49.2 49.7 49.7 49.7 50.0 52.8 49.4 52.8 54.2 53.925 pRs34 10 SU1 52.0 49.2 52.5 48.6 51.4 50.3 48.2 50.3 51.4 52.5 47.7 48.9 47.4 44.5 47.5 46.0 46.6 46.6 46.6 46.9 50.3 48.0 50.8 53.4 52.026 pAv34 1 SU2 - 27 pAv34 2 SU2 95.5 - 28 pAv34 17 SU2 93.3 93.8 - 29 pAv34 23 SU2 91.6 91.1 89.9 - 30 pAv34 32 SU2 97.2 95.0 92.7 91.6 - 31 pAc34 1 SU2 92.7 92.2 91.0 91.1 92.2 - 32 pAc34 2 SU2 89.8 88.6 86.7 88.0 89.2 89.8 - 33 pAc34 3 SU2 91.6 91.1 89.3 89.4 91.1 92.7 91.0 - 34 pAc34 5 SU2 92.7 92.2 90.4 91.1 93.9 96.1 90.4 93.9 - 35 pAc34 7 SU2 92.2 91.6 89.9 89.4 91.6 93.9 89.8 93.3 95.0 - 36 pRp34 179 SU2 79.5 79.5 77.7 79.0 79.5 82.4 78.5 80.7 81.2 80.1 - 37 pRp34 197 SU2 79.0 79.0 77.1 78.4 79.0 82.4 78.5 80.7 81.2 80.1 97.7 - 38 pRp34 32 SU2 75.7 75.7 73.8 74.6 75.7 79.8 77.0 77.5 78.0 78.0 86.2 86.2 - 39 pRp34 69 SU2 75.4 74.3 72.4 74.9 74.9 77.1 72.4 75.4 77.1 74.9 84.1 83.0 83.9 - 40 pRp34 152 SU2 76.5 77.1 75.3 76.5 77.7 79.9 76.5 80.4 80.4 79.3 82.5 83.1 80.5 77.3 - 41 pRn34 2 SU2 84.8 83.7 82.5 81.5 84.8 85.4 81.8 86.5 86.5 85.4 79.0 79.0 78.0 74.3 79.3 - 42 pRn34 3 SU2 85.4 84.3 83.1 82.0 85.4 86.0 82.4 87.1 87.1 86.0 79.5 79.5 78.6 74.9 79.9 99.4 - 43 pRn34 4 SU2 85.4 84.3 83.1 82.0 85.4 86.0 82.4 87.1 87.1 86.0 79.4 79.4 78.5 74.7 79.8 99.4 100 - 44 pRn34 5 SU2 86.0 84.8 83.6 82.6 86.0 86.5 82.4 86.5 86.5 85.4 79.5 79.5 78.6 74.9 79.3 98.9 99.4 99.4 - 45 pRn34 10 SU2 83.1 80.8 78.4 78.5 81.9 83.6 79.9 83.6 84.2 83.6 78.3 78.3 75.6 74.7 79.2 82.5 83.1 83.0 82.5 - 46 pRs34 3 SU2 89.9 89.4 87.6 88.3 89.4 91.6 89.2 92.2 92.7 93.3 79.1 79.1 77.0 73.9 78.3 84.4 84.9 84.8 84.4 82.6 - 47 pRs34 5 SU2 88.8 88.3 86.5 86.6 88.3 90.5 87.3 92.2 91.6 91.1 78.5 78.5 76.4 74.4 77.2 85.5 86.0 86.0 85.5 83.1 91.1 - 48 pRs34 7 SU2 90.5 89.9 88.2 88.3 89.9 92.2 89.2 92.7 93.3 92.7 79.0 79.0 76.9 73.7 78.8 84.8 85.4 85.4 84.8 83.1 92.7 91.6 - 49 pRs34 9 SU2 88.8 87.1 85.9 86.5 87.1 89.3 86.7 90.4 89.9 89.3 79.5 79.5 76.3 74.3 78.2 85.4 86.0 85.9 86.0 80.2 89.4 91.1 90.4 - 50 pRs34 10 SU2 91.1 90.5 88.8 88.8 90.5 92.7 89.8 93.3 93.9 93.3 79.5 79.5 77.5 74.3 79.3 85.4 86.0 86.0 85.4 83.6 93.3 92.2 98.3 90.4 -
80
To further investigate the relationship between the two subunits, a maximum likelihood and a
neighbor joining analyses were performed. Both methods clearly revealed two major sister
clades - those of subunit 1 and subunit 2 (Fig. 34). The resolution had a maximally possible
bootstrap support of 100%. This means, that subunits SU1 and SU2 even from such distantly
related species as beet and spinach are highly similar with each other. In contrast, the subunits
SU1 are hardly related to subunits SU2 from the same 360 bp repeating unit.
When the subunits SU1 from different species were compared with each other, the sequences
originating from B. vulgaris, B. corolliflora and S. oleracea could not be resolved. On the
other hand, the SU1 sequences from both B. procumbens and B. nana were arranged in
distinct clades with very strong bootstrap supports of 99 %. The smooth division was only
disturbed by the B. nana clone pRn34 10, however without significant bootstrap support (Fig.
34).
In the group of subunits SU2, a similar relationship was observed (Fig. 34) The subunits from
clones pAc34 and pRs34 were not resolved, only for the clade of pAv34 clones there was an
indicative bootstrap value of 70%. On the contrary, the SU2 sequences from pRp34 and
pRn34 clones fell into separate distinct clades with higher bootstrap support of 80 %, being
further separated into two even stronger supported branches of pRp34 (bootstrap value 93 %)
and pRn34 (bootstrap value 100 %). Similarly to division of SU1, the SU2 from B. nana
clone pRn34 10 was arranged more closely to B. procumbens repeats. In this case, the
bootstrap value of 71 % is still significant, giving an indication of a possible relationship for
this sequence (Fig. 34).
81
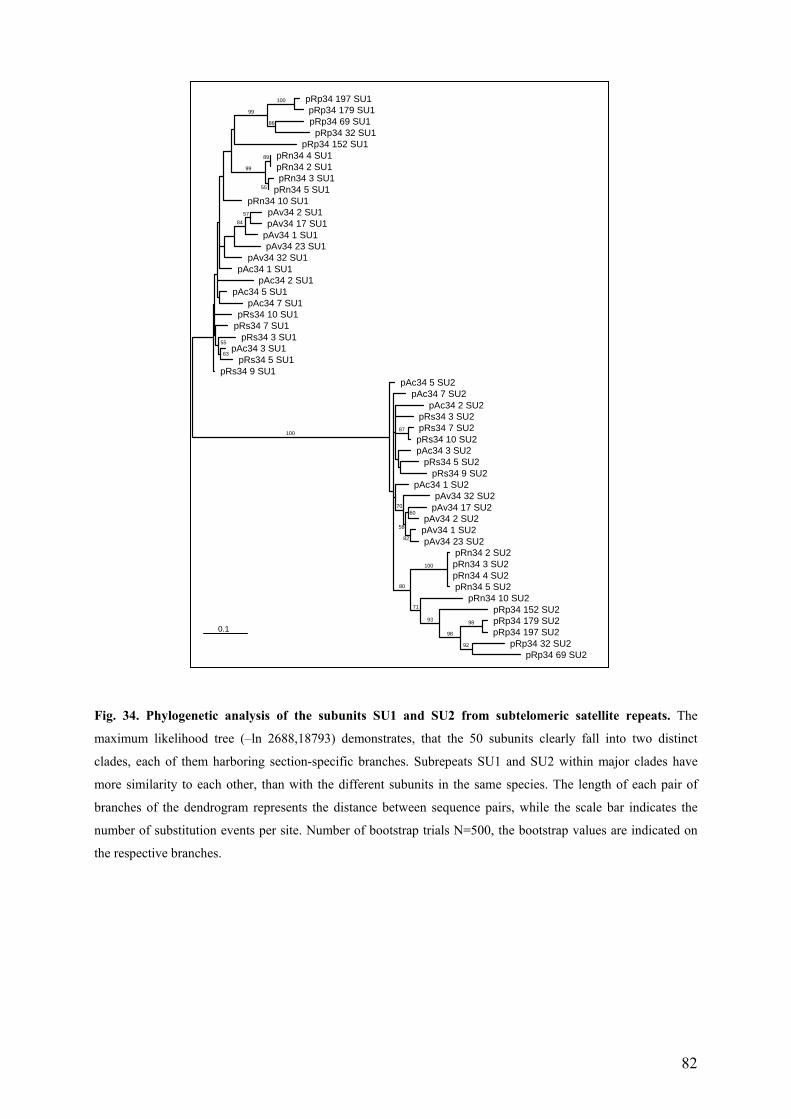
99 100 pRp34 197 SU1
pRp34 179 SU186 pRp34 69 SU1
pRp34 32 SU1pRp34 152 SU1
99 89 pRn34 4 SU1
pRn34 2 SU1
55 pRn34 3 SU1pRn34 5 SU1
pRn34 10 SU1 84
57 pAv34 2 SU1 pAv34 17 SU1
pAv34 1 SU1 pAv34 23 SU1
pAv34 32 SU1 pAc34 1 SU1
pAc34 2 SU1 pAc34 5 SU1
pAc34 7 SU1 pRs34 10 SU1
pRs34 7 SU1 55 pRs34 3 SU1 63 pAc34 3 SU1
pRs34 5 SU1 pRs34 9 SU1
100
pAc34 5 SU2pAc34 7 SU2
pAc34 2 SU2pRs34 3 SU2
87 pRs34 7 SU2pRs34 10 SU2pAc34 3 SU2
pRs34 5 SU2pRs34 9 SU2
pAc34 1 SU2
70pAv34 32 SU2
58
60pAv34 17 SU2
pAv34 2 SU2
82pAv34 1 SU2pAv34 23 SU2
80
100
pRn34 2 SU2pRn34 3 SU2pRn34 4 SU2pRn34 5 SU2
71pRn34 10 SU2
93pRp34 152 SU2
98
98 pRp34 179 SU2 pRp34 197 SU2
92 pRp34 32 SU2 pRp34 69 SU2
0.1
Fig. 34. Phylogenetic analysis of the subunits SU1 and SU2 from subtelomeric satellite repeats. The
maximum likelihood tree (–ln 2688,18793) demonstrates, that the 50 subunits clearly fall into two distinct
clades, each of them harboring section-specific branches. Subrepeats SU1 and SU2 within major clades have
more similarity to each other, than with the different subunits in the same species. The length of each pair of
branches of the dendrogram represents the distance between sequence pairs, while the scale bar indicates the
number of substitution events per site. Number of bootstrap trials N=500, the bootstrap values are indicated on
the respective branches.
82
3.3. Analysis of the B. vulgaris fragment addition lines PRO1 and PAT2 with a set of
repetitive DNA probes
In order to transfer resistance against the cyst nematode Heterodera schachtii in sugar beet, a
number of B. vulgaris monosome addition lines were established. To achieve this aim, a
tetraploid B. vulgaris was crossed with wild beets of the section Procumbentes, either
B. procumbens, or B. patellaris. The resulting triploid offspring was back-crossed with
diploid B. vulgaris, and monosome addition lines having 18 sugar beet chromosomes and a
wild beet chromosome were selected (Savitsky 1975). This plants were subjected to
irradiation, which caused the breakage of the added chromosome. In this way, the addition
lines carrying a single chromosome fragment of B. procumbens (Jung & Wricke 1987) or
B. patellaris (Brandes at al. 1987) were generated. In this work, two of these lines, PRO1 and
PAT2, were analyzed on the molecular level.
The addition line PRO1 (Jung & Wricke 1987) has a 6-9 Mbp large fragment of the
B. procumbens chromosome (Gindullis et al. 2001a). The chromosome mutant PAT2
(Brandes et al. 1987) has a smaller fragment originating from B. patellaris (Jacobs et al. in
prep.). Both minichromosomes are stably transmitted in mitosis and hence should have a
functional centromere.
Therefore, the mutants PRO1 and PAT2 are suitable systems for the isolation of a plant
centromere (Gindullis et al. 2001a). Because the fragments are monosomic, there are no
allelic variations. Well-characterized DNA probes specific for the Procumbentes genomes
allow to distinguish easily the wild beet chromatin in the heterologous B. vulgaris genetic
background. Thus, the individual centromere could be identified, analyzed and dissected. The
centromeric pTS5 satellite arrays of the PRO1 and PAT2 minichromosomes occupy
approximately 115 and 50 kb respectively (Gindullis et al. 2001b, Jacobs et al. in prep.),
which is much shorter than the estimated array size of 157 – 755 kb for the centromeres of the
wild beet chromosomes (Mesbah et al. 2000).
Thus, the centromeric regions of PRO1 and PAT2 are in the size range clonable in bacterial
artificial chromosomes (BACs) which are preferred systems for the generation of large insert
libraries. When compared to yeast artificial chromosome (YAC) vectors, they have a number
of advantages, such as high stability even if the clone contains satellite DNA, a low degree of
chimerism and easy isolation. The BACs are easy to handle and propagate, and since their
first application for the plant species sorghum (Woo et al. 1994), they were used for physical
83
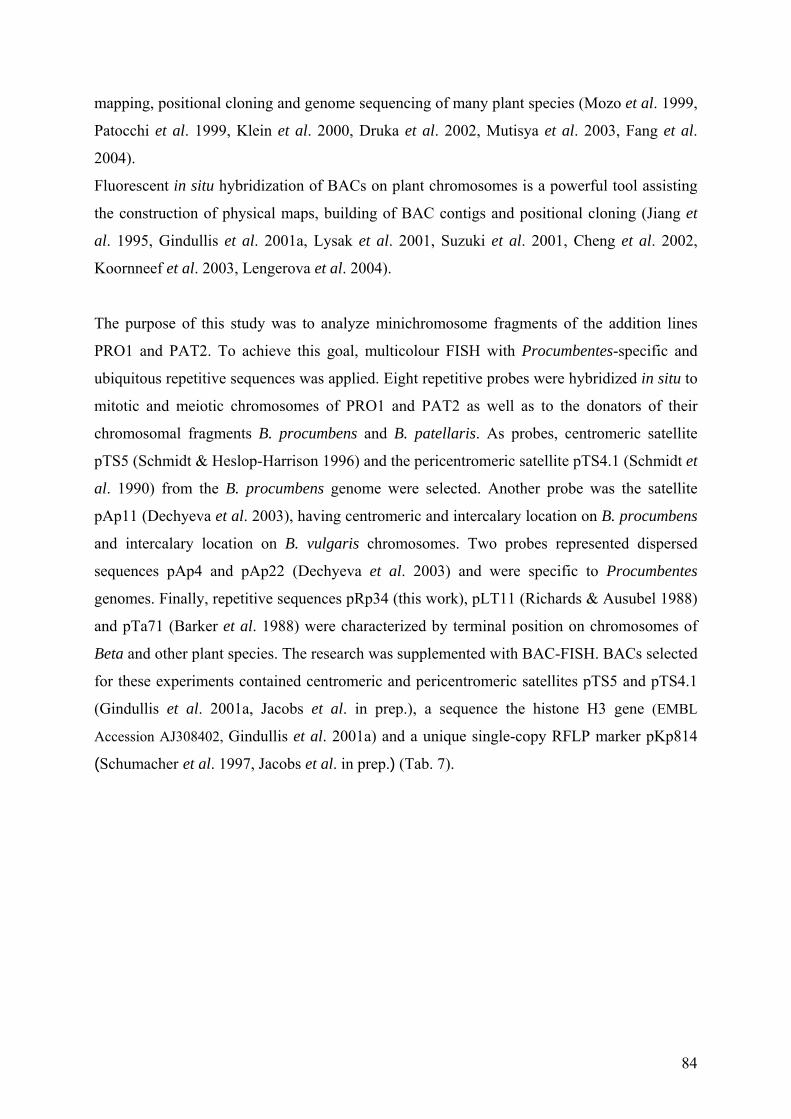
mapping, positional cloning and genome sequencing of many plant species (Mozo et al. 1999,
Patocchi et al. 1999, Klein et al. 2000, Druka et al. 2002, Mutisya et al. 2003, Fang et al.
2004).
Fluorescent in situ hybridization of BACs on plant chromosomes is a powerful tool assisting
the construction of physical maps, building of BAC contigs and positional cloning (Jiang et
al. 1995, Gindullis et al. 2001a, Lysak et al. 2001, Suzuki et al. 2001, Cheng et al. 2002,
Koornneef et al. 2003, Lengerova et al. 2004).
The purpose of this study was to analyze minichromosome fragments of the addition lines
PRO1 and PAT2. To achieve this goal, multicolour FISH with Procumbentes-specific and
ubiquitous repetitive sequences was applied. Eight repetitive probes were hybridized in situ to
mitotic and meiotic chromosomes of PRO1 and PAT2 as well as to the donators of their
chromosomal fragments B. procumbens and B. patellaris. As probes, centromeric satellite
pTS5 (Schmidt & Heslop-Harrison 1996) and the pericentromeric satellite pTS4.1 (Schmidt et
al. 1990) from the B. procumbens genome were selected. Another probe was the satellite
pAp11 (Dechyeva et al. 2003), having centromeric and intercalary location on B. procumbens
and intercalary location on B. vulgaris chromosomes. Two probes represented dispersed
sequences pAp4 and pAp22 (Dechyeva et al. 2003) and were specific to Procumbentes
genomes. Finally, repetitive sequences pRp34 (this work), pLT11 (Richards & Ausubel 1988)
and pTa71 (Barker et al. 1988) were characterized by terminal position on chromosomes of
Beta and other plant species. The research was supplemented with BAC-FISH. BACs selected
for these experiments contained centromeric and pericentromeric satellites pTS5 and pTS4.1
(Gindullis et al. 2001a, Jacobs et al. in prep.), a sequence the histone H3 gene (EMBL
Accession AJ308402, Gindullis et al. 2001a) and a unique single-copy RFLP marker pKp814
(Schumacher et al. 1997, Jacobs et al. in prep.) (Tab. 7).
84
Tab. 7. Repetitive probes and BACs used for the characterization of the fragment addition lines PRO1
and PAT2.
Probe Origin Length, bp Sequence type Accession Reference
Satellite pTS4.1 B. procumbens 312 Sau3AI restriction satellite Z50808 Schmidt et al 1990 pTS5 B. procumbens 153-160 Sau3AI restriction satellite Z50809 Schmidt & Heslop-Harrison 1996pRp34 B. procumbens 352-358 RsaI restriction satellite AM076755 this work pAp11 B. procumbens 229-246 AluI restriction satellite AJ414554 Dechyeva et al. 2003
Dispersed pAp4 B. procumbens 1353-1354 AluI repeat AJ414552 Dechyeva et al. 2003 pAp22 B. procumbens 582 AluI repeat AJ414553 Dechyeva et al. 2003
Telomere pLT11 A. thaliana not tested telomeric repeat not entered Richards & Ausubel 1988
Ribosomal genes pTa71 T. aestivum 4642 25S-18S gene fragment with spacer X07841 Barker et al. 1988
BACs 126L8 PRO1 not tested pTS5 not entered Gindullis et al. 2001a 127H9 PRO1 not tested pTS4.1 not entered Gindullis et al. 2001a 130E19 PRO1 not tested B. vulgaris histone H3 gene not entered Gindullis et al. 2001a 1K22 PAT2 not tested pTS5 not entered Jacobs et al. in prep. 6J10 PAT2 ~ 130 000 pTS4.1 not entered Jacobs et al. in prep. 25H4 PAT2 ~ 70 000 B. vulgaris RFLP-marker pKp814 not entered Jacobs et al. in prep.
The application of the FISH technique is challenging in plant species, especially for the
mapping of single- or low-copy DNA sequences due to difficulties in plant chromosome
preparation. Nevertheless, the data were collected which support the analysis of the PRO1 and
PAT2 BAC libraries and assist the cloning of a functional plant centromere.
85
3.3.1. Physical mapping of repetitive DNA sequences on the chromosomes of the
fragment addition line PRO1 and the parental species B. procumbens
Interspecific hybrids and addition lines of B. vulgaris are a valuable starting material for plant
breeders and an interesting object for fundamental studies on plant genome composition and
evolution. Here, the sugar beet fragment addition line PRO1 was characterized with a set of
eight repetitive DNA probes. These probes represented repetitive DNA sequences cloned
from the genomes of B. procumbens, T. aestivum and A. thaliana and characterized by
different types of organization on plant chromosomes – centromeric, intercalary, dispersed or
terminal.
The probes pTS4.1, pTS5, pAp4 and pAp22 are specific to Procumbentes genomes. The two
satellites pRp34 and pAp11 are also found in other sections of the genus Beta. The telomeric
probe pLt11 and rDNA probe pTa71 are ubiquitous in plants. Thus, this set of probes
represents the DNA sequences with different localization patterns and genome specificity
(Tab. 7).
For each experiment, prior to testing the fragment addition line PRO1, the repetitive probe
was hybridized with the donator of the chromosomal fragment B. procumbens.
The in situ hybridization of B. procumbens with the pericentromeric probe pTS4.1 and the
centromeric pTS5 demonstrated, that the centromeric satellite pTS5 resides on 12 centromeres
out of 18, where it is bordered with the pericentromeric pTS4.1 (Fig. 35A, exampled by
arrowheads). While pTS5 is strictly confined to the centromeres, pTS4.1 occupies
pericentromeric loci of all chromosomes and is found on some intercalary and subterminal
sites where it produces weak signals (Fig. 35A, arrows).
In PRO1, both satellites are detectable only on the minichromosome as clear pairs of signals
(Fig. 35B). pTS5 labels one end of the acrocentric fragment, bordered by pTS4.1 from one
side (Fig. 35C).
86
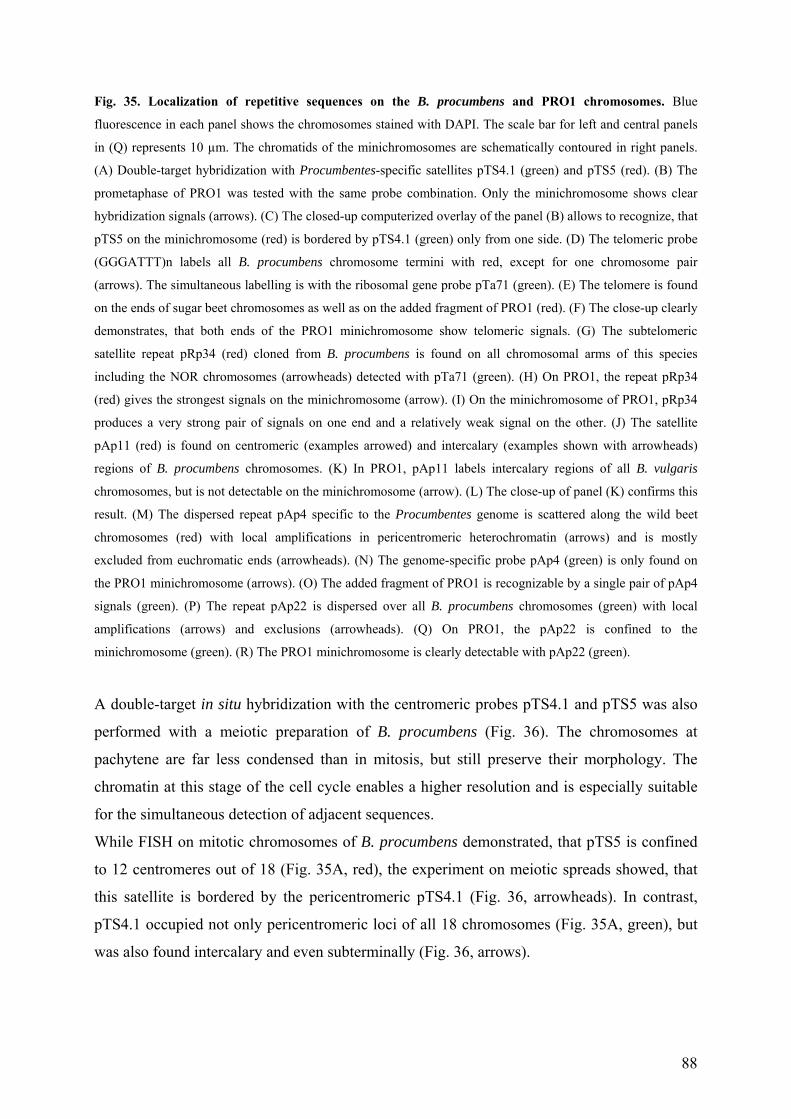
Fig. 35. Localization of repetitive sequences on the B. procumbens and PRO1 chromosomes. Blue
fluorescence in each panel shows the chromosomes stained with DAPI. The scale bar for left and central panels
in (Q) represents 10 µm. The chromatids of the minichromosomes are schematically contoured in right panels.
(A) Double-target hybridization with Procumbentes-specific satellites pTS4.1 (green) and pTS5 (red). (B) The
prometaphase of PRO1 was tested with the same probe combination. Only the minichromosome shows clear
hybridization signals (arrows). (C) The closed-up computerized overlay of the panel (B) allows to recognize, that
pTS5 on the minichromosome (red) is bordered by pTS4.1 (green) only from one side. (D) The telomeric probe
(GGGATTT)n labels all B. procumbens chromosome termini with red, except for one chromosome pair
(arrows). The simultaneous labelling is with the ribosomal gene probe pTa71 (green). (E) The telomere is found
on the ends of sugar beet chromosomes as well as on the added fragment of PRO1 (red). (F) The close-up clearly
demonstrates, that both ends of the PRO1 minichromosome show telomeric signals. (G) The subtelomeric
satellite repeat pRp34 (red) cloned from B. procumbens is found on all chromosomal arms of this species
including the NOR chromosomes (arrowheads) detected with pTa71 (green). (H) On PRO1, the repeat pRp34
(red) gives the strongest signals on the minichromosome (arrow). (I) On the minichromosome of PRO1, pRp34
produces a very strong pair of signals on one end and a relatively weak signal on the other. (J) The satellite
pAp11 (red) is found on centromeric (examples arrowed) and intercalary (examples shown with arrowheads)
regions of B. procumbens chromosomes. (K) In PRO1, pAp11 labels intercalary regions of all B. vulgaris
chromosomes, but is not detectable on the minichromosome (arrow). (L) The close-up of panel (K) confirms this
result. (M) The dispersed repeat pAp4 specific to the Procumbentes genome is scattered along the wild beet
chromosomes (red) with local amplifications in pericentromeric heterochromatin (arrows) and is mostly
excluded from euchromatic ends (arrowheads). (N) The genome-specific probe pAp4 (green) is only found on
the PRO1 minichromosome (arrows). (O) The added fragment of PRO1 is recognizable by a single pair of pAp4
signals (green). (P) The repeat pAp22 is dispersed over all B. procumbens chromosomes (green) with local
amplifications (arrows) and exclusions (arrowheads). (Q) On PRO1, the pAp22 is confined to the
minichromosome (green). (R) The PRO1 minichromosome is clearly detectable with pAp22 (green).
A double-target in situ hybridization with the centromeric probes pTS4.1 and pTS5 was also
performed with a meiotic preparation of B. procumbens (Fig. 36). The chromosomes at
pachytene are far less condensed than in mitosis, but still preserve their morphology. The
chromatin at this stage of the cell cycle enables a higher resolution and is especially suitable
for the simultaneous detection of adjacent sequences.
While FISH on mitotic chromosomes of B. procumbens demonstrated, that pTS5 is confined
to 12 centromeres out of 18 (Fig. 35A, red), the experiment on meiotic spreads showed, that
this satellite is bordered by the pericentromeric pTS4.1 (Fig. 36, arrowheads). In contrast,
pTS4.1 occupied not only pericentromeric loci of all 18 chromosomes (Fig. 35A, green), but
was also found intercalary and even subterminally (Fig. 36, arrows).
88
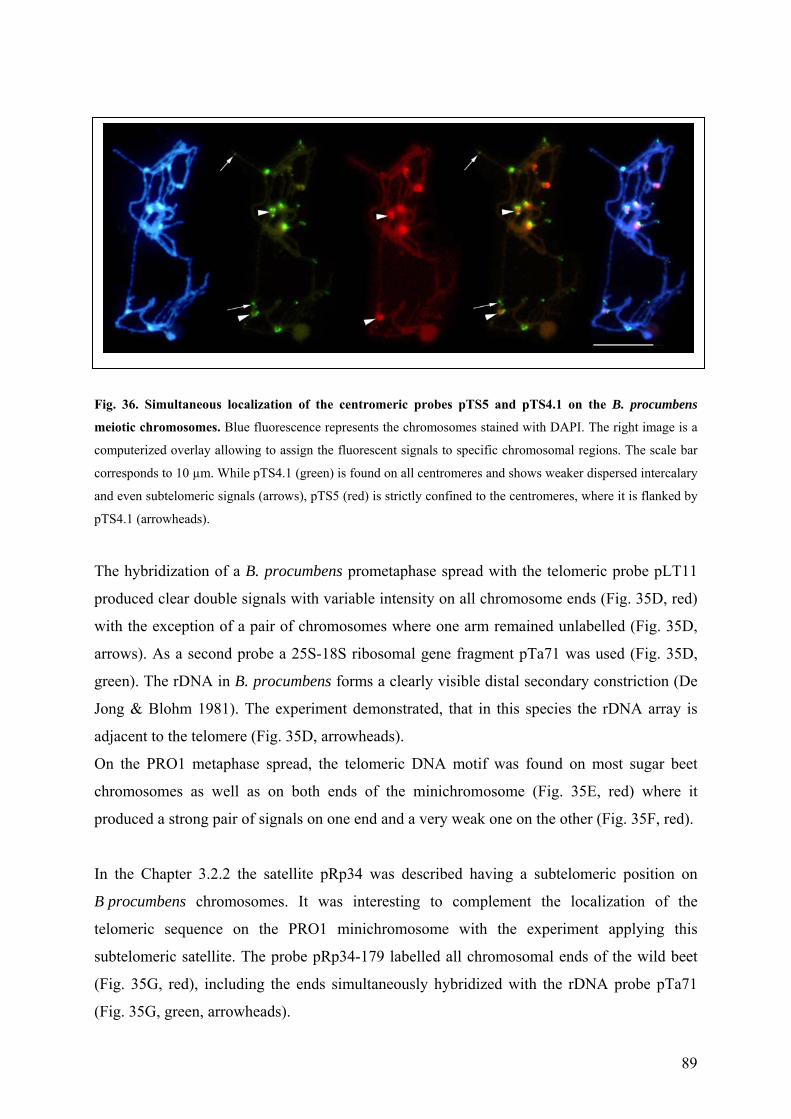
Fig. 36. Simultaneous localization of the centromeric probes pTS5 and pTS4.1 on the B. procumbens
meiotic chromosomes. Blue fluorescence represents the chromosomes stained with DAPI. The right image is a
computerized overlay allowing to assign the fluorescent signals to specific chromosomal regions. The scale bar
corresponds to 10 µm. While pTS4.1 (green) is found on all centromeres and shows weaker dispersed intercalary
and even subtelomeric signals (arrows), pTS5 (red) is strictly confined to the centromeres, where it is flanked by
pTS4.1 (arrowheads).
The hybridization of a B. procumbens prometaphase spread with the telomeric probe pLT11
produced clear double signals with variable intensity on all chromosome ends (Fig. 35D, red)
with the exception of a pair of chromosomes where one arm remained unlabelled (Fig. 35D,
arrows). As a second probe a 25S-18S ribosomal gene fragment pTa71 was used (Fig. 35D,
green). The rDNA in B. procumbens forms a clearly visible distal secondary constriction (De
Jong & Blohm 1981). The experiment demonstrated, that in this species the rDNA array is
adjacent to the telomere (Fig. 35D, arrowheads).
On the PRO1 metaphase spread, the telomeric DNA motif was found on most sugar beet
chromosomes as well as on both ends of the minichromosome (Fig. 35E, red) where it
produced a strong pair of signals on one end and a very weak one on the other (Fig. 35F, red).
In the Chapter 3.2.2 the satellite pRp34 was described having a subtelomeric position on
B procumbens chromosomes. It was interesting to complement the localization of the
telomeric sequence on the PRO1 minichromosome with the experiment applying this
subtelomeric satellite. The probe pRp34-179 labelled all chromosomal ends of the wild beet
(Fig. 35G, red), including the ends simultaneously hybridized with the rDNA probe pTa71
(Fig. 35G, green, arrowheads).
89
The minichromosome of PRO1 was labelled with the B. procumbens-derived satellite much
stronger than the sugar beet chromosomes (Fig. 35H, red, arrow). The cause was most likely
the divergence between the pRp34 from B. procumbens and pAv34 from B. vulgaris which
share 56.8-60.7% similarity (Tab. 4). In this in situ experiment, hybridization stringency was
76%, which was not sufficient to detect all the copies of pAv34 on B. vulgaris chromosomes
with pRp34-179 as probe. The two pairs of the pRp34 signals on the minichromosome have
different strengths (Fig. 35I, red).
The satellite pAp11 labels all B. procumbens chromosomes with the signals of varied
intensity (Fig. 35J, red). Some of the satellite arrays occupy the centromeres (Fig. 35J,
arrows), while the others have an intercalary location (Fig. 35J, arrowheads).
While all B. vulgaris chromosomes in PRO1 have clear pAp11 signals in the intercalary
position (Fig. 35K, green), the minichromosome showed no hybridization signal (Fig. 35K,
arrows, and L).
The Procumbentes-specific pAp4 was dispersed over all B. procumbens chromosomes (Fig.
35M, red). The repeat was amplified in intercalary and pericentromeric heterochromatic
regions (Fig. 35M, arrows), but mostly excluded from distal euchromatic regions where
mainly genes reside (Fig. 35M, arrowheads).
In PRO1, the dispersed repeat pAp4 is not detectable on sugar beet chromosomes and is only
found on the B. procumbens added fragment (Fig. 35N, green, arrows), where it labels both
chromatids (Fig. 35O).
The wild beet dispersed repeat pAp22 is scattered over all B. procumbens chromosomes with
local amplifications (Fig. 35P, arrows). Similarly to pAp4, it was also largely excluded from
euchromatin (Fig. 35P, arrowheads).
In B. vulgaris chromosomal mutant PRO1, the wild beet repeat pAp22 hybridized exclusively
to the B. procumbens chromosome fragment (Fig. 35Q, arrow) giving a clear double signal
(Fig. 35R).
90
3.3.2. Detection of repetitive DNA sequences on the chromosomes of the fragment
addition line PAT2 and the parental species B. patellaris
Another interspecific hybrid generated in an attempt to confer resistance to pests and draught
to the cultivated sugar beet is the fragment addition line PAT2. Similarly to PRO1, it has a
complete set of 18 B. vulgaris chromosomes complemented with a small fragment of a wild
beet chromosome. In this case, the donator of this minichromosome is another representative
of the section Procumbentes, the wild beet species B. patellaris. Unlike B. procumbens, it is a
tetraploid species. In contrast to PRO1, PAT2 has a smaller minichromosome (Jacobs et al. in
prep.) and its transmission rate in meiosis is estimated to be higher (Brandes et al. 1987).
To compare the minichromosome of the fragment addition line PAT2 with that of PRO1, the
same set of repetitive probes was applied (Tab. 7, Chapter 3.3.1). For each experiment, the
repetitive probe was first hybridized to the chromosomes of the parental species B. patellaris
and afterwards tested on the fragment addition line PAT2.
The two centromeric satellites pTS5 and pTS4.1 were hybridized simultaneously to the
tetraploid B. patellaris (Fig. 37A). The satellite pTS5 labelled only twelve centromeres out of
36 (Fig. 37A, red). The signals are strong on two chromosomes (arrowheads), moderate on six
and only barely detectable on remaining four. In pericentromeric loci of all B. patellaris
chromosomes signals of different intensity are detectable after hybridization with the satellite
pTS4.1 (Fig. 37A, green). Moreover, this repetitive probe was also detectable on some
chromosome ends (arrows).
In PAT2, the B. patellaris added fragment was clearly distinguished after fluorescent in situ
hybridization with the genome-specific probes pTS5 and pTS4.1. The both satellites were
limited to the minichromosome (Fig. 37B, arrows). Figure 24C clearly shows, that the
centromeric pTS5 (green) is flanked by pTS4.1 from both ends (red). This is strikingly in
contrast to the hybridization pattern on the PRO1 minichromosome, where only one locus of
the pericentromeric pTS4.1 adjacent to the centromeric pTS5 is detectable (Fig. 35C).
91
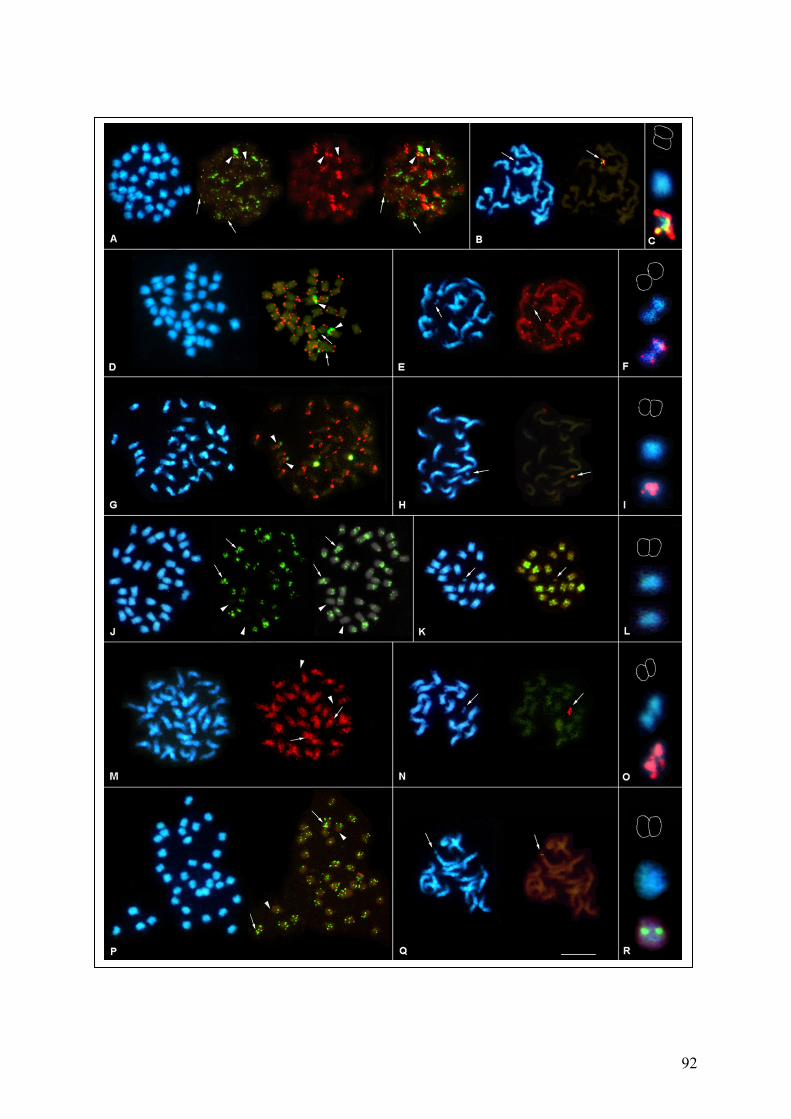
Fig. 37. Repetitive sequences hybridized in situ to the B. patellaris and PAT2 chromosomes. Blue
fluorescence in each panel shows the chromosomes stained with DAPI. The scale bar for left and central panels
in (Q) represents 10 µm. The chromatids of the minichromosomes are schematically contoured in right panels.
(A) The simultaneous labelling of B. patellaris chromosomes with the centromeric satellite pTS5 (green) and
pericentromeric pTS4.1 (red). pTS4.1 is slightly dispersed along the chromosome arms (arrows), while pTS5 is
exclusively centromeric (arrowheads). (B) In PAT2, both satellites are present only on the minichromosome
(arrow). (C) On the PAT2 added fragment, the centromeric array of pTS5 (green) is flanked with pTS4.1 (red)
from both ends. (D) The telomeric probe pLT11 (red) is found on most ends of the B. patellaris chromosomes.
The rDNA sites are detected with the probe pTa71 (green). (E) As expected, the telomere (red) is present on
B. vulgaris chromosomes as well as on the added fragment (arrow). (F) The close-up of the previous panel
shows clear telomeric signals on both ends of the PAT2 minichromosome. (G) The subtelomeric probe pRp34-
179 (red) is found on all but two B. patellaris chromosomes. 25S-18S ribosomal genes are detected with pTa71
(green). (H) The PAT2 minichromosome (arrows) was relatively strong labelled with the pRp34 (red), while the
sugar beet chromosomes showed only weak cross-hybridization. (I) On the close-up of the panel (H) the
minichromosome is labelled with two pairs of the subtelomeric signals. (J) pAp11 (green) is found on the
majority of the B. patellaris chromosomes at intercalary and centromeric (arrows) sites. Only two chromosomes
remained unlabelled (arrowheads). (K) In PAT2, all sugar beet chromosomes bear the pAp11 signals (green), but
not the minichromosome (arrows). (L) No pAp11 signal is detectable on the wild beet added fragment of PAT2.
(M) The dispersed repeat pAp4 (red) labels all chromosomes of B. patellaris in dense clasters, is, however,
reduced at some centromeres (examples arrowed) and is excluded from euchromatic ends (exampled by
arrowheads). (N) In PAT2, the Procumbentes-specific repeat pAp4 (red) is limited to the minichromosome
(arrows). (O) The image demonstrates a lightly dispersed pattern of pAp4 on the PAT2 minichromosome. (P)
pAp22 is dispersed along all B. patellaris chromosomes forming clusters (examples arrowed) and excluded from
some chromosome arms (examples are indicated with arrowheads). (Q) On PAT2 prometaphase only a very
weak pAp22 signal (green) is detectable on the minichromosome (arrows). (R) pAp22 (green) is visible as a
double signal on the PAT2 added fragment.
The telomeric probe pLT11 labelled the ends of all B. patellaris chromosomes relatively
uniformly (Fig. 37D, red). The simultaneous hybridization with the ribosomal gene fragment
pTa71 produced two strong signals, two weak and two barely visible additional signals, all at
the subterminal positions (Fig. 37D, green). The telomeres found adjacent to the larger rDNA
array (Fig. 37D, arrowheads). The only chromosome arms where pLT11 was not detectable
were those with minor pTa71 signals (Fig. 37D, arrows).
As expected, most PAT2 chromosomes demonstrated telomeric signals (Fig. 37E, red). The
signals on the wild beet added fragment were nearly as intense as those on sugar beet
chromosomes (Fig. 37E, arrows). The minichromosome has two pairs of clear signals,
evidently on both ends of the minichromosome (Fig. 37 F, red).
93
The subtelomeric probe pRp34-179 was detected on one or both arms of all except two
B. patellaris chromosomes in subtelomeric positions producing signals of various intensity
(Fig. 37G, red). It is noteworthy that pRp34 signals were found adjacent to the minor sites of
the ribosomal genes (Fig. 37G, green, arrows). The major pTa71 signals (Fig. 37G, green) are
indicated by arrowheads.
Both ends of the PAT2 minichromosome showed the subtelomeric satellite signals, one
weaker than the other (Fig. 37H, arrow, and I). Relatively weak labelling of sugar beet
chromosome ends is due to the cross-hybridization with the homologous satellite pAv34 from
B. vulgaris at hybridization stringency 76% (Fig. 37H).
The satellite pAp11 labelled all B. patellaris chromosomes (Fig. 37J, green) except two,
presumably a chromosome pair (Fig. 37J, arrowheads). It was found in centromeric (Fig. 37J,
arrows) and intercalary sites.
Although pAp11 labelled all sugar beet chromosomes of PAT2 making even minor
intercalary sites clearly visible (Fig. 37K, green), no signals were detectable on the
minichromosome (Fig. 37K, arrow, and L).
The dispersed repeat pAp4 was scattered over all B. patellaris chromosomes (Fig. 37M, red).
Examples of the reduction of the repeat on some centromeres are indicated with arrows, while
examples of the exclusion from euchromatin are shown by arrowheads (Fig. 37M).
On PAT2, the repeat produced 3-4 pairs of relatively weak signals exclusively along the
minichromosome (Fig. 37N, arrow, and O) building a dispersed pattern similar to that on the
chromosomes of B. patellaris (Fig. 37M).
The AluI repeat pAp22 was found on all chromosomes of B. patellaris producing a dispersed
pattern on most of them (Fig. 37P, green). It was clustered with local amplifications on some
intercalary loci (Fig. 37P, examples arrowed), while the signals were mostly reduced in
euchromatin up to the exclusion from some chromosome arms (Fig. 37P, examples indicated
with arrowheads).
On PAT2, the dispersed repeat pAp22 was limited to the minichromosome (Fig. 37Q, arrow)
where only a single pair of very weak signals was detectable (Fig. 37R).
94
3.3.3. Physical localization of BACs on the chromosomes of the B. vulgaris fragment
addition lines PRO1 and PAT2 and the wild beet species B. procumbens and
B. patellaris
Large-insert BAC libraries are a valuable resource for analysis of plant genomes. They
provide researchers with a range of advantages, like ability to clone and maintain large
fragments even though they contain repetitive sequences and easiness to handle in comparison
to YAC libraries. Aiming at the construction of a beet-based plant artificial chromosome, the
BAC libraries of the B. vulgaris fragment addition lines PRO1 (Gindullis et al. 2001a) and
PAT2 (Jacobs et al. in prep.) were constructed. The clones containing centromeric sequences
originating from B. procumbens or B. patellaris minichromosomes were selected using the
satellites pTS5 (Schmidt & Heslop-Harrison 1996) and pTS4.1 (Schmidt et al. 1990) which
are specific for Procumbentes genomes.
To verify that the selected PRO1 and PAT2 BACs contain DNA originating from the wild
beet added fragments, two clones selected from each library using the genome-specific probes
pTS5 and pTS4.1 were randomly chosen. These BACs were hybridized in situ to the mitotic
preparations of the fragment addition lines PRO1 and PAT2 and to the parental species
B. procumbens and B. patellaris, respectively.
Figure 38A (green) shows, that the PRO1 BAC 126L8 containing the centromeric satellite
pTS5 exclusively labels the minichromosome in a mitotic PRO1 metaphase. No additional
signals were detected on the nine B. vulgaris chromosome pairs. A similar result was obtained
with the pTS4-positive PRO1 BAC 127H9 (Fig. 38B, green).
In order to investigate the chromosomal location of these BACs in the wild beet species, they
were hybridized to the early prophases of B. procumbens. The chromosomes at this stage
provide more extended hybridization targets giving a higher resolution. Both BACs label the
majority of the eighteen B. procumbens centromeres (Fig. 38C, D, green). Slight cross-
hybridisation along wild beet chromosomes is caused by the other repetitive sequences
present in the insets of the BACs, most likely retrotransposons.
95
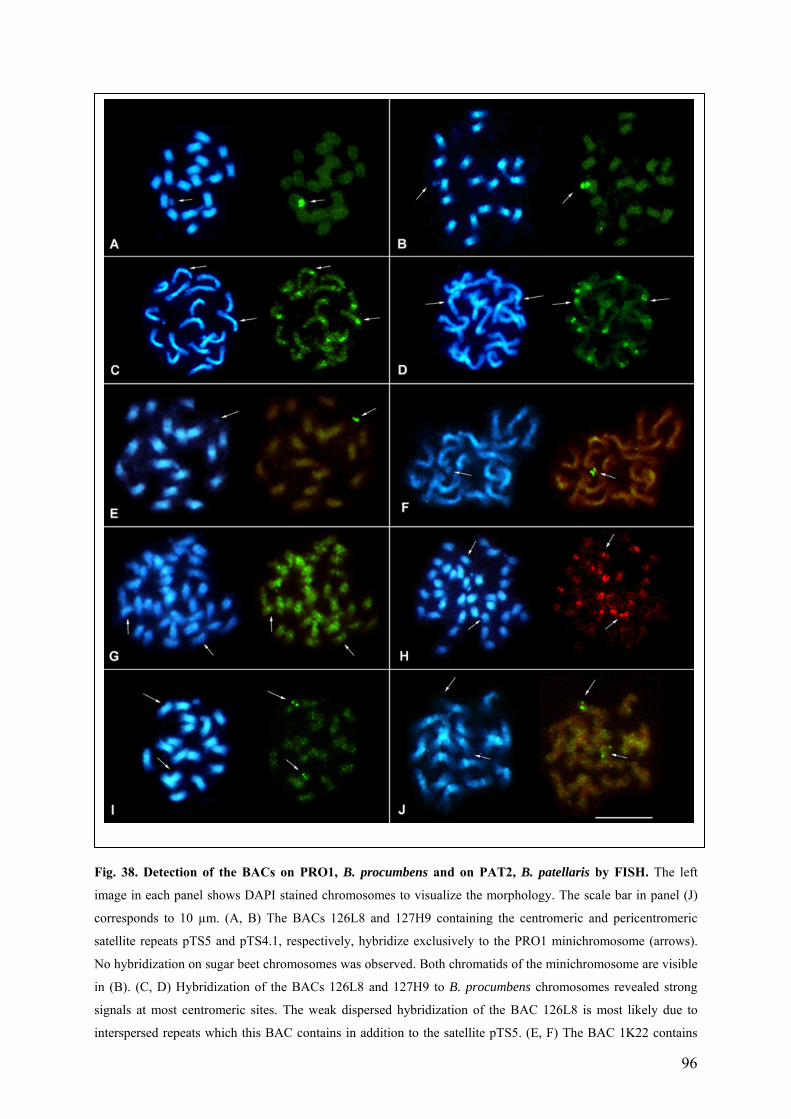
F
i
c
s
N
i
s
i
ig. 38. Detection of the BACs on PRO1, B. procumbens and on PAT2, B. patellaris by FISH. The left
mage in each panel shows DAPI stained chromosomes to visualize the morphology. The scale bar in panel (J)
orresponds to 10 µm. (A, B) The BACs 126L8 and 127H9 containing the centromeric and pericentromeric
atellite repeats pTS5 and pTS4.1, respectively, hybridize exclusively to the PRO1 minichromosome (arrows).
o hybridization on sugar beet chromosomes was observed. Both chromatids of the minichromosome are visible
n (B). (C, D) Hybridization of the BACs 126L8 and 127H9 to B. procumbens chromosomes revealed strong
ignals at most centromeric sites. The weak dispersed hybridization of the BAC 126L8 is most likely due to
nterspersed repeats which this BAC contains in addition to the satellite pTS5. (E, F) The BAC 1K22 contains
96
the centromere-specific satellite repeats pTS5, while the BAC 6J10 contains pericentromeric pTS4.1. Both are
only found at the PAT2 minichromosome (arrows) giving no hybridization signals on B. vulgaris chromosomes.
Note, that in (F) both chromatids of the minichromosomes bear two signals. (G, H) Hybridization of 1K22 and
6J10 to B. patellaris metaphases demonstrated, that the BACs are mostly confined to the centromeres (arrows).
The cross-hybridization along the chromosomes is most likely caused by dispersed repeats which are part of
these BACs’ inserts. (I) The hybridization with the histone-H3-gene-containing BAC 130E19 revealed two
signals on a pair of B. vulgaris chromosomes at an intercalary position (arrows). (J) Hybridization with BAC
25H4 containing the single copy RFLP probe PKP814 produced two subterminal signals on a pair of sugar beet
chromosomes (arrows).
The experiment demonstrated, that the selected BAC clones are indeed derived from the
centromeric region of the PRO1 minichromosome and that they can be isolated using
genome-specific satellite repeats as probes.
Similarly, centromere-positive BACs were selected from the PAT2 BAC library. To show
that the clones contain the centromeric DNA fragments, FISH was performed. Figure 37E,
green, shows, that the pTS5-positive BAC 1K22 labels the PAT2 minichromosome giving a
single pair of fluorescent signals. The pTS4-positive BAC 6J10 on PAT2 prometaphase gave
a distinct pair of double signals on the minichromosome (Fig. 38F, green).
To study the location of these BACs in the genome of origin, B. patellaris metaphases were
used, which allow to assign the probes precisely to specific regions of complete
chromosomes. In this experiment, the BAC clones containing the satellite repeats pTS5 and
pTS4.1 labeled the majority of the 36 B. patellaris centromeres (Fig. 38 G, green and H, red,
respectively). The study demonstrated that the selected BAC clones originate from the
centromeric region of the PAT2 minichromosome.
The BAC library is a useful resource for studying and cloning of genes. Localization of gene-
containing BACs on chromosomes by FISH give insight into organization of the genome and
assists in the arrangement of single BACs into contigs.
To demonstrate this application experimentally, the PRO1 BAC library was probed with the
histone H3 and one of the positive clones was hybridized in situ to PRO1 mitotic preparation.
The BAC 130E19 containing histone H3 gene did not hybridize to the PRO1
minichromosome in the FISH experiment, but gave distinct pairs of signals on two B. vulgaris
chromosomes (Fig. 38I, green).
97
Another BAC-FISH application is integration of linkage maps with sugar beet chromosomes.
It enables to determine the physical position of genetically mapped markers.
For the in situ hybridization experiment, a B. vulgaris RFLP-marker pKp814 located on the
linkage group I of the sugar beet genome integrated map (Schumacher et al. 1997) was
chosen. The PAT2 BAC 25H4 containing the marker pKp814 was used as FISH probe. The
clone did not hybridize to the PAT2 minichromosome, but gave distinct signals on one
B. vulgaris chromosome pair in a subterminal position (Fig. 38J, green).
98
3.4. Identification of the centromere-associated proteins on the B. vulgaris fragment
addition line PRO1
Centromeres play a key role in both mitotic and meiotic nuclear divisions in eukaryotes. They
are chromosomal loci where kinetochores assemble. Many studies have focused on repetitive
sequences located at or near the centromeres and their protein binding regions to identify the
sequences responsible for the centromeric activity of higher eukaryotes (Cleveland et al.
2003). Although there is no evidence for conservation of centromeric DNA sequences, the
proteins that form the kinetochore are similar and conserved among eukaryotes (ten Hoopen
et al. 2000, Choo 2001). An evolutionary highly conserved protein component of centromeric
chromatin found in all eukaryotes examined so far is the centromere-specific variant of the
histone H3 (CenH3), which replaces the canonical H3 in centromeric nucleosomes (Talbert et
al. 2004) and actually defines the boundaries of the centromere (Jiang et al. 2003) serving as a
link between the centromeric DNA and kinetochore protein complex (Blower et al. 2002).
CenH3 is considered to interact with many of the proteins required for chromosome
movement. It is present throughout the cell cycle and co-localizes with the kinetochore protein
CENP-C in meiotic cells. CENP-C is most likely a constitutive kinetochore protein which,
together with the histone-like protein CENP-A, is involved in the assembly of the
kinetochores (Tomkiel et al. 1994) and ensures the transition from metaphase to anaphase
(Politi et al. 2002). The kinesin-like protein CENP-E plays a role in chromosome movement
and spindle checkpoint control in mammals. Its putative analogs Cpel1 and Cpel2 were
detected in barley as well as in field bean (ten Hoopen et al. 2000, ten Hoopen et al. 2002).
Kinetochores are large centromere-associated protein complexes. They generate and regulate
chromosome movement by interacting with microtubules and motor proteins of the spindle
apparatus. Although the ultrastructure of plant kinetochores has been known for many years,
only recently specific kinetochore proteins have been identified (ten Hoopen et al. 2002). The
recent data indicate that plant kinetochores contain homologs of many he proteins found in
animal and fungal kinetochores and that the plant kinetochores consist of distinct biochemical
subdomains with a specific function (Yu et al. 2000). According to Baskin & Cande (1990),
plant kinetochores are described as a proteinaceous "ball" embedded in a "cup" of chromatin,
thus lacking the plate structure characteristic of animal kinetochores. However, more recent
data on the plant kinetochore structure acquired by the combination of molecular methods,
immunostaining and FISH provide the evidence that the plant kinetochore has indeed a
99
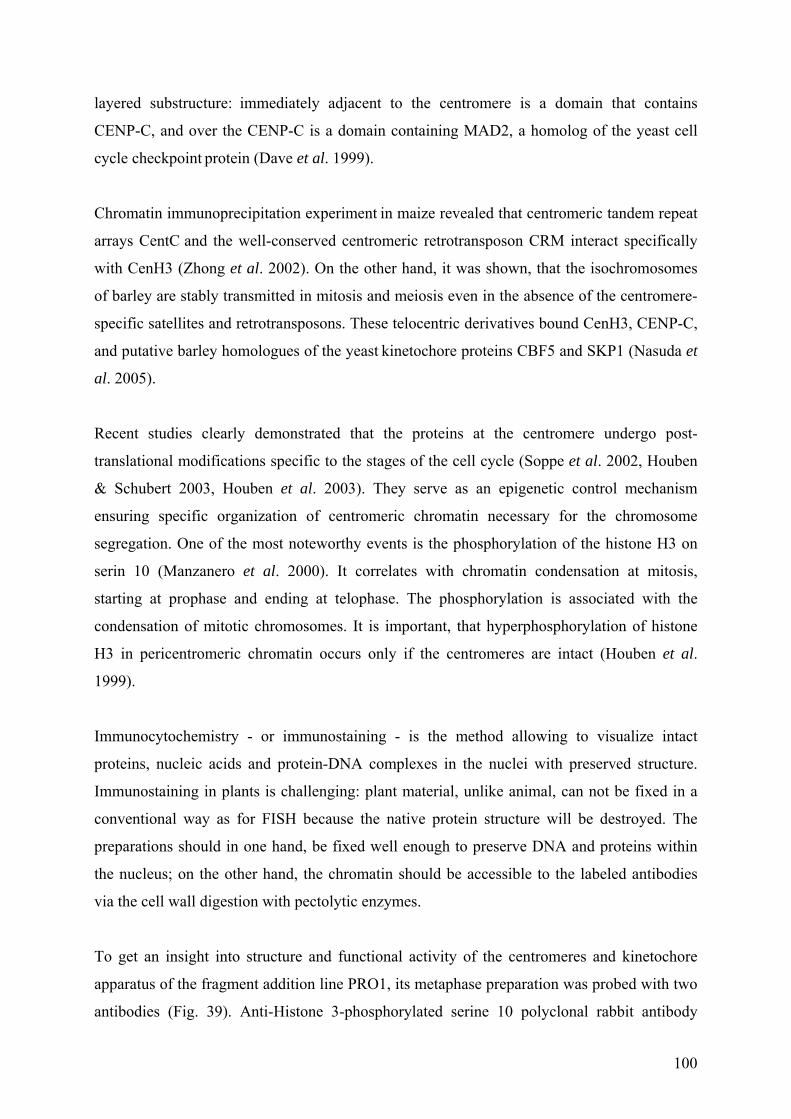
layered substructure: immediately adjacent to the centromere is a domain that contains
CENP-C, and over the CENP-C is a domain containing MAD2, a homolog of the yeast cell
cycle checkpoint protein (Dave et al. 1999).
Chromatin immunoprecipitation experiment in maize revealed that centromeric tandem repeat
arrays CentC and the well-conserved centromeric retrotransposon CRM interact specifically
with CenH3 (Zhong et al. 2002). On the other hand, it was shown, that the isochromosomes
of barley are stably transmitted in mitosis and meiosis even in the absence of the centromere-
specific satellites and retrotransposons. These telocentric derivatives bound CenH3, CENP-C,
and putative barley homologues of the yeast kinetochore proteins CBF5 and SKP1 (Nasuda et
al. 2005).
Recent studies clearly demonstrated that the proteins at the centromere undergo post-
translational modifications specific to the stages of the cell cycle (Soppe et al. 2002, Houben
& Schubert 2003, Houben et al. 2003). They serve as an epigenetic control mechanism
ensuring specific organization of centromeric chromatin necessary for the chromosome
segregation. One of the most noteworthy events is the phosphorylation of the histone H3 on
serin 10 (Manzanero et al. 2000). It correlates with chromatin condensation at mitosis,
starting at prophase and ending at telophase. The phosphorylation is associated with the
condensation of mitotic chromosomes. It is important, that hyperphosphorylation of histone
H3 in pericentromeric chromatin occurs only if the centromeres are intact (Houben et al.
1999).
Immunocytochemistry - or immunostaining - is the method allowing to visualize intact
proteins, nucleic acids and protein-DNA complexes in the nuclei with preserved structure.
Immunostaining in plants is challenging: plant material, unlike animal, can not be fixed in a
conventional way as for FISH because the native protein structure will be destroyed. The
preparations should in one hand, be fixed well enough to preserve DNA and proteins within
the nucleus; on the other hand, the chromatin should be accessible to the labeled antibodies
via the cell wall digestion with pectolytic enzymes.
To get an insight into structure and functional activity of the centromeres and kinetochore
apparatus of the fragment addition line PRO1, its metaphase preparation was probed with two
antibodies (Fig. 39). Anti-Histone 3-phosphorylated serine 10 polyclonal rabbit antibody
100
(Houben et al. 1999) detects the histone H3 which serine 10 close to N-terminus is
phosphorylated. This modification is only found in functional pericentromeric chromatin.
Anti-α-tubulin mouse-anti-rabbit antibody (Amersham) allows to visualize the microtubuli
(Houben et al. 2000) which are part of the mitotic spindle apparatus.
A
B
Fig. 39. Localization of kinetochore proteins on PRO1 mitotic preparation by immunostaining. Blue
fluorescence represents the chromosomes stained with DAPI. Microtubuli are visible as green threads. Serine 10-
phosphorylated histone H3 produces red signals. The right images are computerized overlays. The scale bars
represent 10 µm. (A) Microphotographs taken in different focal planes. (B) A computerized overlay of the
101
different focal planes of the three- dimensional preparation. Arrows example the sites where the microtubuli of
the spindle apparatus are attached to the centromeres.
The immunostaining experiment demonstrated that the centromeres at the PRO1 metaphase
spread were labelled with the antibody against histone 3 phosphorylated at serine 10 (Fig. 39,
red). The sites appeared as bright red signals localized at the DAPI-positive centromeric
regions. The microtubuli were also detectable as green threads (Fig. 39, green). It was clearly
visible at some loci, that the microtubuli are attached to the PRO1 centromeres. (Fig. 39 B,
arrows).
102
4. Discussion
Genomes of higher plants contain large amounts of repetitive sequences which account from
50 % (SanMiguel et al. 1996) up to 95 % of the nuclear DNA (Flavell et al. 1974). The
repeats vary widely in size and sequence, divergence and conservation, genome and
chromosomal organization between related species, accessions and even within a genome
(Heslop-Harrison 2000). Therefore, it is only possible to understand the plant genome
architecture if its repetitive DNA component is studied in detail.
The scope of this work is the molecular and cytogenetic characterization of repetitive DNA
sequences from selected species of the sections Beta, Corollinae, Nanae and Procumbentes
forming the genus Beta.
Repeats isolated from B. procumbens were investigated by sequencing, PFGE, Southern
hybridization and fluorescent in situ hybridization. They were classified according to their
arrangement in the genome and thus assigned either to restriction satellite DNA or to
dispersed repeats.
A satellite DNA family was found in the genomes of selected species from the genus Beta and
even in spinach, a distantly related Chenopodiaceae. It was characterized by the investigation
of molecular structure, genomic and chromosomal organization. This repeat is located mostly
subtelomerically and its physical organization in sugar beet was studied by high-resolution
fiber FISH.
The repetitive DNA sequences characterized in this work enabled the detailed analysis by
FISH of the B. vulgaris fragment addition lines PRO1 and PAT2. The data resulting from
these experiments made it possible to propose models of the physical organization of the
PRO1 and PAT2 monosomic added fragments.
An insight into the structure of centromeres in the B. vulgaris fragment addition line PRO1
was acquired by the immunolocalization of proteins specific for the functional centromeres.
4.1. Satellites as repetitive DNA sequences of plant genomes
As in most higher plants, satellite DNA sequences comprise a large proportion of the
repetitive DNA in genomes of the Beta species. So far, eleven different satellite DNA families
from four sections of the genus have been characterized (Gao et al. 2000, Gindullis et al.
2001b, reviewed by Kubis et al. 1998) (Tab. 8).
103
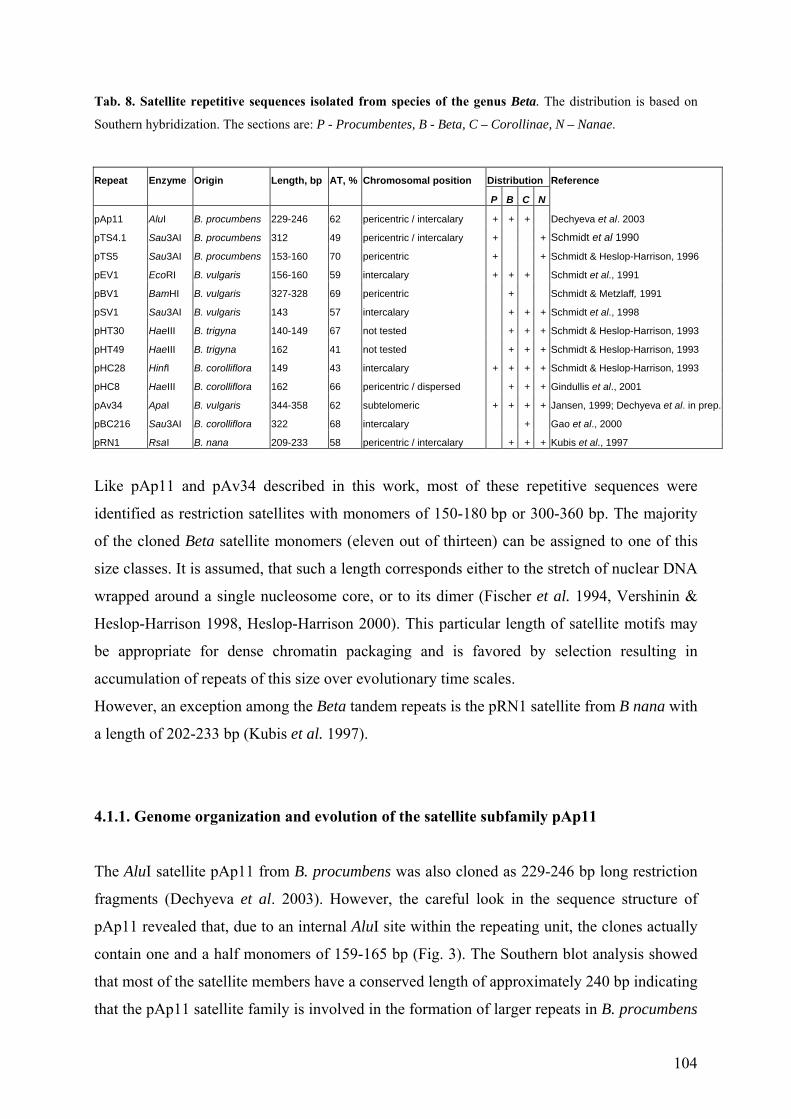
Tab. 8. Satellite repetitive sequences isolated from species of the genus Beta. The distribution is based on
Southern hybridization. The sections are: P - Procumbentes, B - Beta, C – Corollinae, N – Nanae.
Repeat Enzyme Origin Length, bp AT, % Chromosomal position Distribution Reference
P B C N
pAp11 AluI B. procumbens 229-246 62 pericentric / intercalary + + + Dechyeva et al. 2003
pTS4.1 Sau3AI B. procumbens 312 49 pericentric / intercalary + + Schmidt et al 1990
pTS5 Sau3AI B. procumbens 153-160 70 pericentric + + Schmidt & Heslop-Harrison, 1996
pEV1 EcoRI B. vulgaris 156-160 59 intercalary + + + Schmidt et al., 1991
pBV1 BamHI B. vulgaris 327-328 69 pericentric + Schmidt & Metzlaff, 1991
pSV1 Sau3AI B. vulgaris 143 57 intercalary + + + Schmidt et al., 1998
pHT30 HaeIII B. trigyna 140-149 67 not tested + + + Schmidt & Heslop-Harrison, 1993
pHT49 HaeIII B. trigyna 162 41 not tested + + + Schmidt & Heslop-Harrison, 1993
pHC28 HinfI B. corolliflora 149 43 intercalary + + + + Schmidt & Heslop-Harrison, 1993
pHC8 HaeIII B. corolliflora 162 66 pericentric / dispersed + + + Gindullis et al., 2001
pAv34 ApaI B. vulgaris 344-358 62 subtelomeric + + + + Jansen, 1999; Dechyeva et al. in prep.
pBC216 Sau3AI B. corolliflora 322 68 intercalary + Gao et al., 2000
pRN1 RsaI B. nana 209-233 58 pericentric / intercalary + + + Kubis et al., 1997
Like pAp11 and pAv34 described in this work, most of these repetitive sequences were
identified as restriction satellites with monomers of 150-180 bp or 300-360 bp. The majority
of the cloned Beta satellite monomers (eleven out of thirteen) can be assigned to one of this
size classes. It is assumed, that such a length corresponds either to the stretch of nuclear DNA
wrapped around a single nucleosome core, or to its dimer (Fischer et al. 1994, Vershinin &
Heslop-Harrison 1998, Heslop-Harrison 2000). This particular length of satellite motifs may
be appropriate for dense chromatin packaging and is favored by selection resulting in
accumulation of repeats of this size over evolutionary time scales.
However, an exception among the Beta tandem repeats is the pRN1 satellite from B nana with
a length of 202-233 bp (Kubis et al. 1997).
4.1.1. Genome organization and evolution of the satellite subfamily pAp11
The AluI satellite pAp11 from B. procumbens was also cloned as 229-246 bp long restriction
fragments (Dechyeva et al. 2003). However, the careful look in the sequence structure of
pAp11 revealed that, due to an internal AluI site within the repeating unit, the clones actually
contain one and a half monomers of 159-165 bp (Fig. 3). The Southern blot analysis showed
that most of the satellite members have a conserved length of approximately 240 bp indicating
that the pAp11 satellite family is involved in the formation of larger repeats in B. procumbens
104
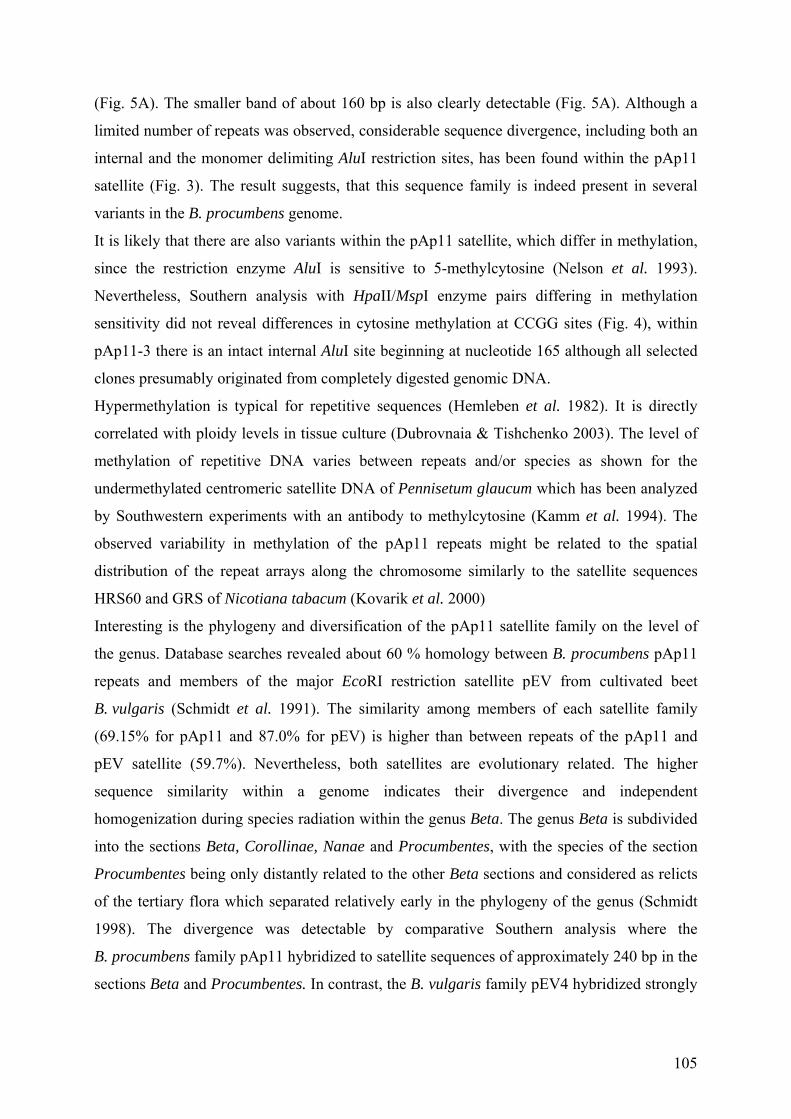
(Fig. 5A). The smaller band of about 160 bp is also clearly detectable (Fig. 5A). Although a
limited number of repeats was observed, considerable sequence divergence, including both an
internal and the monomer delimiting AluI restriction sites, has been found within the pAp11
satellite (Fig. 3). The result suggests, that this sequence family is indeed present in several
variants in the B. procumbens genome.
It is likely that there are also variants within the pAp11 satellite, which differ in methylation,
since the restriction enzyme AluI is sensitive to 5-methylcytosine (Nelson et al. 1993).
Nevertheless, Southern analysis with HpaII/MspI enzyme pairs differing in methylation
sensitivity did not reveal differences in cytosine methylation at CCGG sites (Fig. 4), within
pAp11-3 there is an intact internal AluI site beginning at nucleotide 165 although all selected
clones presumably originated from completely digested genomic DNA.
Hypermethylation is typical for repetitive sequences (Hemleben et al. 1982). It is directly
correlated with ploidy levels in tissue culture (Dubrovnaia & Tishchenko 2003). The level of
methylation of repetitive DNA varies between repeats and/or species as shown for the
undermethylated centromeric satellite DNA of Pennisetum glaucum which has been analyzed
by Southwestern experiments with an antibody to methylcytosine (Kamm et al. 1994). The
observed variability in methylation of the pAp11 repeats might be related to the spatial
distribution of the repeat arrays along the chromosome similarly to the satellite sequences
HRS60 and GRS of Nicotiana tabacum (Kovarik et al. 2000)
Interesting is the phylogeny and diversification of the pAp11 satellite family on the level of
the genus. Database searches revealed about 60 % homology between B. procumbens pAp11
repeats and members of the major EcoRI restriction satellite pEV from cultivated beet
B. vulgaris (Schmidt et al. 1991). The similarity among members of each satellite family
(69.15% for pAp11 and 87.0% for pEV) is higher than between repeats of the pAp11 and
pEV satellite (59.7%). Nevertheless, both satellites are evolutionary related. The higher
sequence similarity within a genome indicates their divergence and independent
homogenization during species radiation within the genus Beta. The genus Beta is subdivided
into the sections Beta, Corollinae, Nanae and Procumbentes, with the species of the section
Procumbentes being only distantly related to the other Beta sections and considered as relicts
of the tertiary flora which separated relatively early in the phylogeny of the genus (Schmidt
1998). The divergence was detectable by comparative Southern analysis where the
B. procumbens family pAp11 hybridized to satellite sequences of approximately 240 bp in the
sections Beta and Procumbentes. In contrast, the B. vulgaris family pEV4 hybridized strongly
105
with species of the section Beta with monomers of approximately 160 bp and very weakly
with Procumbentes species (Fig. 5A, B).
These data indicate that pAp11 was most likely already present as perhaps amplified sequence
family in ancestral Beta genomes. During the species radiation it has been lost or heavily
diverged in the section Corollinae and Nanae but conserved in genomes of Procumbentes and
Beta species. After the species separation, pAp11 possibly gave rise to the reamplification of
the diverged pEV satellite in B. vulgaris while a considerable proportion of the pAp11
sequences remained present (Fig. 40A).
A B
F
i
B
A
c
g
r
4
E
h
t
p
subfamilypAp11subfamily
B. procumbens
species-specifichomogenizationreamplification
B. vulgaris
pEVsubfamily
progenitor of the genus Beta
possibledivergence into
subfamilies
ancestral satelliteamplified
geographicalseparation
subfamilypAp11subfamily
B. procumbens
species-specifichomogenization
B. vulgaris
pEVsubfamily
progenitor of the genus Beta
possibledivergence andreamplification
pAp11 satelliteamplified
subfamilypAp11subfamily
B. procumbens
species-specifichomogenizationreamplification
B. vulgaris
pEVsubfamily
progenitor of the genus Beta
possibledivergence into
subfamilies
ancestral satelliteamplified
geographicalseparation
subfamilypAp11subfamily
B. procumbens
subfamilypAp11subfamily
B. procumbens
species-specifichomogenizationreamplification
B. vulgaris
pEVsubfamily
B. vulgaris
pEVsubfamily
progenitor of the genus Beta
possibledivergence into
subfamilies
ancestral satelliteamplified
geographicalseparation
progenitor of the genus Beta
possibledivergence into
subfamilies
ancestral satelliteamplified
ancestral satelliteamplified
geographicalseparation
subfamilypAp11subfamily
B. procumbens
species-specifichomogenization
B. vulgaris
pEVsubfamily
progenitor of the genus Beta
possibledivergence andreamplification
pAp11 satelliteamplified
subfamilypAp11subfamily
B. procumbens
species-specifichomogenization
B. vulgaris
pEVsubfamily
subfamilypAp11subfamily
B. procumbens
subfamilypAp11subfamily
B. procumbens
species-specifichomogenization
B. vulgaris
pEVsubfamily
B. vulgaris
pEVsubfamily
progenitor of the genus Beta
possibledivergence andreamplification
pAp11 satelliteamplified
progenitor of the genus Beta
possibledivergence andreamplification
pAp11 satelliteamplified
pAp11 satelliteamplified
ig. 40. Schema of possible phylogeny of pAp11 and pEV satellites in Beta genomes. The pAp11 subfamily
s highly amplified in B. procumbens and amplified in B. vulgaris. The pEV4 subfamily is highly amplified in
. vulgaris. pAp11 was presumably an ancestral sequence for pEV.
lternatively, an ancestral satellite DNA sequence present in the genome of a Beta progenitor
ould be diverged into subfamilies and further radiated due to geographical separation in the
enomes of B. procumbens and B. vulgaris, where the subfamilies were homogenized and
eamplified (Fig. 40B).
.1.2. Chromosomal organization of the satellite pAp11 in B. procumbens and B. vulgaris
vidence for the satellite sequence divergence was revealed by fluorescent in situ
ybridization. While on most B. vulgaris chromosomes the pAp11 satellite collocalized with
he satellite pEV4 in intercalary sites, there is a pair of chromosomes which carries only a
Ap11 cluster (Fig. 6B, arrows).
106
In contrast, in B. procumbens the pAp11 satellite is found mostly in pericentromeric regions
(Fig. 6A, arrows). The few exceptions, where intercalary sites are detectable, are exampled by
arrowheads in Fig. 6A. The signals on centromeres have different strengths, reflecting a
chromosome-specific variation of copy number.
The variability of the chromosomal position in B. procumbens and B. vulgaris indicates that
the ancestral pAp11 satellite was involved in major chromosomal rearrangements during the
phylogeny of the Beta species. These rearrangements might have been accompanied by rapid
amplification of pEV suggesting that both satellites have played an important role in the
evolution of Beta chromosomes and in the expansion of intercalary heterochromatin of
B. vulgaris. Comparative genetics of cereal genomes has shown that syntenic blocks are
rearranged between species (Moore et al. 1995). For example, the large chromosomes of
maize and wheat can be displayed by duplicated and rearranged linkage groups of the small
rice chromosomes (Bennetzen & Devos 2002). Although this finding is based on genetic
mapping in grasses, it is known that chromosomal segments show a conservation of gene
content and order across wide taxonomic borders (Gale & Devos 1998). Conserved arrays of
satellite DNA may behave similarly and it is possible that the reorganization processes of
Beta genomes during speciation resulted in rearrangement of chromosome segments
consisting of large blocks of satellite DNA. The minor intercalary pAp11 sites on a few
B. procumbens chromosomes shown in Fig. 6A may represent an early stage of chromosomal
rearrangements which was ongoing during the evolution of the Beta species and accompanied
by homogenization and fixation in newly emerging species such as B. vulgaris.
4.1.3. Organization and evolution of the subtelomeric satellite family in genomes of Beta
species and S. oleracea
Another family of repetitive DNA isolated from species B. vulgaris, B. corolliflora,
B. procumbens and B nana of the genus Beta and from S. oleracea is the subtelomeric
satellite pAv34 with the repeating unit size of 344-358 bp.
Thus, subtelomeric DNA sequence family pAv34, together with the three Beta satellites
pBV1 (Schmidt & Metzlaff 1991), pTS4.1 (Schmidt et al. 1990) and pBC216 (Gao et al.
2000) isolated from the sections Beta, Procumbentes and Corollinae, respectively, belongs to
the size class of 300-360 bp repeats.
107
Closer inspection of the pAv34 monomer sequence structure revealed, that each 360 bp
repeating unit consists of two subunits SU1 and SU2 (Fig. 26), each about 180 bp long. This
length is typical for satellite repeats both in plants (Hemleben et al. 1982, Lin et al. 1999,
Heslop-Harrison 2000) and animals (Pons et al. 1993, Takahashi et al. 2001). The formation
of complex and often larger repeats is a molecular feature typical for satellite DNA and has
been observed in many plant species, such as the grasses Pennisetum (Ingham et al. 1993) and
Avena (Grebenstein et al. 1996), or Arabidopsis thaliana (Simoens et al. 1988).
Recently, a satellite with internal dimeric structure similar to pAv34 was described for the
genus Trifolium (Ansari et al. 2004). The basic repeating unit of Trifolium satellite TrR350 is
350 bp long and consists of an internal direct repeat of 156 bp flanked by unrelated sequences.
However, a pentanucleotide CAAAA motif present within TrR35 and presumably indicative
of a breakage-reunion mechanism of arrays evolution, was not detected in pAv34 sequence.
The repeat variants of eukaryotic satellite DNA can be grouped into subfamilies according to
conserved single base pair mutations, indels (insertions/deletions) (Willard & Waye 1987b,
Charlesworth et al. 1994) or chromosome specificity (Schmidt & Heslop-Harrison 1996).
Sequence analysis of the subtelomeric satellite DNA sequences isolated from different species
- B. vulgaris, B. corolliflora, B. procumbens, B nana and S. oleracea – confirmed, that the
repeat is indeed present in species-specific families. The 360 bp satellite monomers were
grouped species-specifically by maximum likelihood and neighbor joining analysis on the
dendrogram (Fig. 33). The sequence comparison within the groups of the subunits SU1 and
SU2 delivered similar results (Fig. 34).
Strikingly, the homology between the SU1 and SU2 from the same species was only 46.6-
58.0 %, and thus significantly lower, than the homology within the clades of SU1 and SU2
from different species reaching 73.9 %-100 % among the subunits SU1 and 72.4 %-100 % for
the subunits SU2 (Tab. 5 and 6). Analysis of the sequences similarities of the 360 bp
subtelomeric satellite monomers (Fig. 33) and their 180 bp subunits (Fig. 34) from the
investigated Beta species and spinach indicates, that the initial 180 bp subunits SU1 and SU2
initially evolved independently from each other. Further, the two subunits were dimerized into
a 360 bp repetitive monomer early in the phylogeny before separation of the species and
further amplified as a whole 360 bp satellite. A tandemly repeated 500-bp HindIII element
AR21 from Arabidopsis thaliana also arose by duplication of one half of a 180-bp ancestor
sequence and additional insertion of a telomere-like domain between the two duplicated parts
followed by amplification (Simoens et al. 1988). Similarly, KpnI restriction satellites from
108
Pennisetum purpureum, P. squamulantum and P. glaucum are likely to represent a recent
divergence from a common progenitor. Each of these repetitive sequences probably diverged
following amplification of the original sequence (Ingham et al. 1993) Four satellite repeats
found in Helictotrichon convolutum (CON1 and CON2) and H. compressum (COM1 and
COM2) are 346 – 562 bp long, and the longer elements are composed either of shorter
subrepeats arranged in tandem (COM2) or by duplications inserted into an original 369-bp
element (CON2) (Grebenstein et al. 1996). Similarly to pAv34 present in a range of Beta
species and in S. oleracea, repeats related to CON1, CON2, COM1 and COM2 were
discovered in other representatives of genus Helictotrichon and in Aveneae, Andropogoneae
and Oryzeae species. The divergence of the subunits SU1 and SU2 was preserved as the
species radiated, thus resulting in section-specific sequence subsets. The clear species-specific
grouping together with the fact that the representatives of the subtelomeric satellite family
were isolated from all four sections of the genus Beta and from a related species S. oleracea,
indicates that the duplication leading to the emergence of the 360 bp ApaI satellite might have
occurred early in the phylogeny. Thus, the two evolutionary steps could be detected within the
subtelomeric satellite family: first, the diversification of satellites in two groups representing
SU1 and SU2 (Fig. 34); second, the evolution of 360 bp repeats into section-specific satellite
DNA families (Fig. 33 and 34). Although the clones from B. corolliflora and S. oleracea were
not clearly separated by the analyses, this fact could be explained by the limited number of the
repeats. The opposite maintenance of the sequence pattern without any characteristic species-
specific variants was recently described for the ubiquitous pSc119.2 satellite of rye (Contento
et al. 2005).
The close similarity of the subtelomeric satellite sequences from Beta sections and S. oleracea
could be explained by the presence of this sequence family already in an ancestral species
early in the phylogeny. It is unlikely that pAv34 evolved simultaneously in already radiated
species via convergation, since the satellite DNA sequence, in contrast to genes, undergoes no
immediate function-dependant selective pressure. That is why the assumption of common
ancestry for the subtelomeric satellite family with further diversification of this DNA
sequence in individual species seems to be reasonable.
The comparative Southern hybridization revealed a characteristic ladder-like pattern with the
typical for satellites genomic organization in up to 15-mers as ApaI restriction satellites from
Beta and Corollinae (Fig. 29). The RsaI repeats were only detected up to hexameres in
Procumbentes, while only two bands were visible in Nanae (Fig. 30). The only band was
detectable in spinach (Fig. 29, lane 9R). The satellite is highly abundant in Beta, Corollinae
109
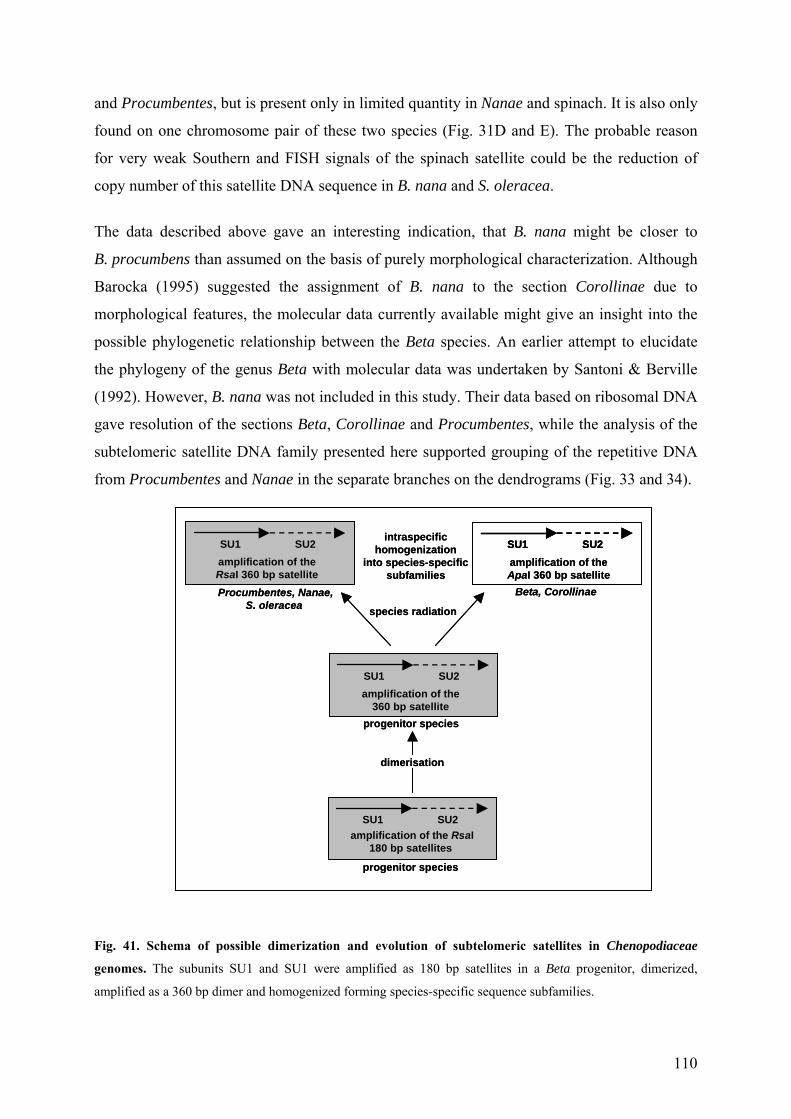
and Procumbentes, but is present only in limited quantity in Nanae and spinach. It is also only
found on one chromosome pair of these two species (Fig. 31D and E). The probable reason
for very weak Southern and FISH signals of the spinach satellite could be the reduction of
copy number of this satellite DNA sequence in B. nana and S. oleracea.
The data described above gave an interesting indication, that B. nana might be closer to
B. procumbens than assumed on the basis of purely morphological characterization. Although
Barocka (1995) suggested the assignment of B. nana to the section Corollinae due to
morphological features, the molecular data currently available might give an insight into the
possible phylogenetic relationship between the Beta species. An earlier attempt to elucidate
the phylogeny of the genus Beta with molecular data was undertaken by Santoni & Berville
(1992). However, B. nana was not included in this study. Their data based on ribosomal DNA
gave resolution of the sections Beta, Corollinae and Procumbentes, while the analysis of the
subtelomeric satellite DNA family presented here supported grouping of the repetitive DNA
from Procumbentes and Nanae in the separate branches on the dendrograms (Fig. 33 and 34).
Fig. 41. Schem
genomes. The
amplified as a 3
a of possible dimerization and evolution of subtelomeric satellites in Chenopodiaceae
subunits SU1 and SU1 were amplified as 180 bp satellites in a Beta progenitor, dimerized,
60 bp dimer and homogenized forming species-specific sequence subfamilies.
progenitor species
dimerisation
species radiation
progenitor species
amplification of theApaI 360 bp satellite
Beta, Corollinae
SU1 SU2amplification of theRsaI 360 bp satelliteProcumbentes, Nanae,
S. oleracea
intraspecific homogenization
into species-specific subfamilies
SU1 SU2
SU1 SU2amplification of the
360 bp satellite
SU1 SU2amplification of the RsaI
180 bp satellites
progenitor species
dimerisation
species radiation
progenitor species
amplification of theApaI 360 bp satellite
Beta, Corollinae
SU1 SU2SU1 SU2amplification of theRsaI 360 bp satelliteProcumbentes, Nanae,
S. oleracea
intraspecific homogenization
into species-specific subfamilies
SU1 SU2SU1 SU2
SU1 SU2SU1 SU2amplification of the
360 bp satellite
SU1 SU2SU1 SU2amplification of the RsaI
180 bp satellites
110
The sequence data representing only five members of each subtelomeric satellite subfamily
are far from being complete, but they give an indication of the possible phylogeny of Beta
species. In comparison to genes, the repetitive DNA represented by thousands of diverged
copies, is highly polymorphic. The reason is the rapid evolution of both tandemly arranged
and dispersed repetitive DNA which leads to changes in the internal sequence structure as
well as in the abundance in the genome. Satellites, together with transposable elements,
contribute to the variability of the plant genome in size and complexity (Kumar & Bennetzen
1999, Heslop-Harrison 2000). The fast evolution rate makes repetitive sequences a useful tool
for comparative studies of plant genomes and for the investigation of evolutionary
relationships between plant species (Kamm et al. 1995, Bennetzen 2000, Ohmido et al. 2000,
Friesen et al. 2001) and suitable genome diagnostics in plant breeding (Schmidt et al. 1997,
Nakayama 2004, Rudd et al. 2005).
The comparative study of the satellite DNA was successfully used to analyze the species
phylogeny for many animals (Pons & Gillespie 2003, Lorite et al. 2004) and some plants
(Kamm et al. 1995, Schmidt & Kudla 1996, Galasso et al. 1997, Kubis et al. 1998). The
evidence points to the evolution of tandem repeats occurring in bursts or evolutionary waves,
perhaps during periods of rapid speciation or stress (Heslop-Harrison 2000). Because
repetitive DNA is a class of sequences which evolves rapidly, it provides an interesting
material for phylogenetic studies. However, any taxonomic conclusions based on molecular
data should be considered carefully. A large number of accessions of the same species should
be tested and the data obtained by other biological sciences should be taken into account.
4.1.4. Physical organization of the DNA sequences in the terminal chromatin of Beta
species and S. oleracea
Satellite DNA is typically found in the heterochromatic regions of the plant chromosomes.
Many satellites were assigned to the centromeric (Kamm et al. 1994, Schmidt & Heslop-
Harrison 1996, Kubis et al. 1998, Dechyeva et al. 2003) or terminal (Vershinin et al. 1995,
Zhong et al. 1998, Kazama et al. 2003) regions of the chromosomes. The physical
organization of the three different tandemly arranged sequences found in the terminal regions
of the chromosomes of four Beta species and S. oleracea was studied in this work.
The subtelomeric satellite family pAv34 showed unique distribution on individual B. vulgaris
chromosomes. Some chromosome ends displayed strong fluorescent signals, while on the
111
others the signals were very weak or not visible. In B. vulgaris, it was found on 26 out of 36
chromosome termini (Fig. 31A, red). It did not label the chromosome pair having the 18S-
5.8S-25S rDNA-array (Fig. 31A, green), namely the chromosome 1 (Bosemark & Bormotov
1971, de Jong & de Bock 1978). The subtelomeric satellite repeat was not detectable on some
chromosome ends of B. vulgaris, probably due to the small size of the target DNA array
(estimated of up to 0.55 kb). Alternatively, the DNA sequence at this particular arms might be
diverged, and, similarly to degenerated and reshuffled interstitial telomeric arrays in tomato
(Presting et al. 1996), not detectable by conserved FISH probe (Zhong et al. 1998).
In B. corolliflora both arms of all except the nucleolus-organizer chromosome pair (Fig. 31C,
green) were labelled by the subtelomeric satellite subfamily pAc34 (Fig. 31C, red). In
B. procumbens the subtelomeric satellite pRp34 is amplified to a different extent on all but
two chromosome ends (Fig. 31B, red). Since most B. procumbens chromosomes are not
metacentric, the position of the centromere combined with relative strength of pRp34
fluorescent signals enables an individual recognition of the chromosomes. In contrast to
B. vulgaris and B. corolliflora, the nucleolar chromosome 3 of B. procumbens (De Jong &
Blom 1981) has clear pRp34 signals on both arms. Such a hybridization pattern could be
explained by the fact, that in B. procumbens the 18S-5.8S-25S rDNA array is located not
terminally, but forms a lateral secondary constriction on prophase and prometaphase
chromosomes (Fig. 31B and 35D, arrowheads). Moreover, a pair of weak pRp34 signals was
detected immediately adjacent to rDNA distally to the chromosome (Fig. 31B, arrowheads).
Subtelomeric repeats are often confined not exclusively subterminally, but have also minor
interstitial sites. The occurrence of subtelomeric satellites in intercalary positions was
reported for tomato, where TGR1 arrays were found distally as well as interstitially in highly
condensed heterochromatic blocks (Zhong et al. 1998). Among the tested Chenopodiaceae
species, a pair of weak additional intercalary signals of pRp34 was only visible on two
B. procumbens chromosomes (Fig. 31B, arrows). Similarly, the NUNSSP subtelomeric
satellite from Nicotiana undulata was found in an intercalary site of a single chromosome pair
(Lim et al. 2005b).
Interesting is the position of the subtelomeric satellite in B. nana, where it was only found on
one end of the two chromosomes (Fig. 31D). This finding is in agreement with the Southern
blot results, where B. nana satellite pRn34 produced only two relatively weak hybridization
bands. Usually, satellite DNA is found on all chromosomes of karyotype (Kubis et al. 1998,
Desel et al. 2002, Lim et al. 2005b). It is rare, that satellite repeats are chromosome-specific,
like STR120 from soybean (Shi et al. 1996), pBC216 and pBC1416 from B. corolliflora (Gao
112
et al. 2000, Gao et al. 2001) and CentBr2 from Brassica rapa (Lim et al. 2005a). Thus,
pRn34 could be used as a chromosomal marker for this species. The similar chromosome
specificity was recently shown for Sobo, a satellite repeat from potato species Solanum
bulbocastanum with the monomer length ~ 360 bp (Tek et al. 2005). This sequence is only
found at the centromere-proximal region of chromosome 7. The Sobo, however, is species
specific, with highly homogenized monomers sharing more than 99 % similarity. It is
considered to evolve from a retrotransposon LTR. Thus, Sobo seems to be a phylogenetically
young sequence, while the satellite 2D8 from potato is present nearly in all Solanum species
(Stupar et al. 2002). Similarly to 2D8, the pAv34 family is evidently an ancient one, since it is
not only found in all Beta sections, but also in a distantly related Chenopodiaceae. B. nana is
an alpine endemic which is characterized by high cold tolerance (Coons 1954). This trait
could be useful to introduce in cultivated beet. However, this wild species is very difficult to
cultivate outside of its natural habitat and the plants are characterized by slow growth (Van
Geyt et al. 1990) No successful attempts to hybridize B. nana with cultivated beet B. vulgaris
have been reported so far.
Similarly to B. nana, there was also a single pair of pRs34 FISH signals detectable on
S. oleracea chromosomes (Fig. 31E). However, these signals were very weak, which is
consistent with the Southern blot results (Fig. 29, lane 9R). Striking was the position of the
signals in spinach – not terminal, but intercalary, in the proximity of the centromere. It is
interesting, that the pRp34 satellite in B. procumbens also occurs in intercalary loci. It is
possible, that the subtelomeric satellite present in progenitor species changed its position in a
species subset by chromosome arm inversion. Thus, when tomato genome was compared with
potato (Tanksley et al. 1992) and pepper (Prince et al. 1993), it gave evidence of multiple arm
inversions and translocations, which might resulted in interstitial telomeric DNA. Another
possible explanation of this phenomenon could be fusion of two chromosomes, one of which
had a terminal pRs34, giving raise to a single chromosome with pRs34 in the middle. This
assumption is supported for spinach by the fact, that it has only 12 chromosomes, unlike beet
with 2n=18. Occurrence of these repeats in intercalary sites may have the mechanism similar
to the described for the interstitial telomeric sites of tomato (Presting et al. 1996). It is
speculated, that the centromere-telomere recombination, chromosome fusion or arm inversion
might have happened in tomato genome in the process of evolution. Evolvement of
chromosomes by fusion mechanism is also described for slash pine P. elliotii, where it is
indicated by the presence of telomeres in intercalary and centromeric regions (Schmidt et al.
113
2000). Presence of the telomeric repeat in intercalary loci was also reported for other pine
species, P. densiflora, P. thunbergii, P. sylvestris, and P. nigra (Hizume et al. 2002). It is
supposed, that in this way the telomere disfunction leading to chromosome fusions may play
an important role in evolution and speciation (Fajkus et al. 2005).
Summarized, the subtelomeric satellites were found on the majority of the chromosome arms
in B. vulgaris and B. corolliflora and on all but two chromosome arms in Procumbentes. The
presence of the subtelomeric satellite in intercalary loci on B. procumbens, B. nana and
S. oleracea chromosomes revealed an interesting phenomenon of alteration of chromosomal
sites for the satellite in different sections of the same genus.
Two other repeats found in distal regions of B. vulgaris chromosomes are arrays of 18S-5.8S-
25S ribosomal genes and the telomeric DNA. Although the subtelomeric satellite pAv34
could not be found immediately adjacent to the terminally located rDNA in B. vulgaris, it was
possible to demonstrate that the telomeric sequence flanks the distal end of the rDNA array
(Fig. 31G, arrowhead). Previously, the similar result was obtained by Desel (2002) on meiotic
chromosomes of sugar beet. However, this is the first evidence of simultaneous localization of
the rDNA and the telomere performed by double-target FISH on a metaphase preparation
where chromosomes clearly preserve their morphology.
The resolution of conventional FISH on mitotic metaphases is relatively low (2-10 Mb) (de
Jong et al. 1999) due to a high degree of chromatin condensation. It is not sufficient to study
the physical organization of adjacent or very closely located sequences. Even though meiotic
chromosomes in pachytene and zygotene are much more decondensed, only sequences which
are at least 50 kb distant from each other can be distinguished (Florijn et al. 1996, Raap et al.
1996). The method overcoming this problem is FISH on extended DNA fibers, which allows
a fine physical mapping of the immediately adjacent (distance less than 1 kb) or interspersed
sequences (Florijn et al. 1995, Fransz et al. 1996). High-resolution fluorescence in situ
hybridization on interphase and pachytene nuclei and extended DNA fibers enabled
microscopic distinction of DNA sequences less than a few thousands of base pairs apart, as
was shown for telomeric repeat and the specific subtelomeric satellite A (TrsA) from rice
(Ohmido et al. 2001) and other plant species (Cheng et al. 2002). However, fiber FISH alone
can not provide a complete picture of the physical organization, while this method lacks
information on orientation of the sequences and morphology and identity of the
114
chromosomes. Therefore, it is feasible to supplement and combine fiber FISH with other
molecular cytogenetics approaches.
In the fiber FISH experiment performed in this study, individual chromosome ends of
B. vulgaris were visualized directly as tracks of fluorescent signals of the subtelomeric
satellite pAv34 and the telomeric repeat probe pLt11. In some cases the two sequences were
separated by a non-fluorescent spacer (Fig. 31). Although a fiber length variation could be
caused by some technical artefacts, the fiber FISH data combined with those delivered by
conventional FISH suggest, that the terminal regions of different B. vulgaris chromosomes
have an individual chromosome-specific organization.
Single arrays of the telomeric repeat detected by fiber FISH are in agreement with the in situ
hybridization on sugar beet metaphases, where pAv34 is not visible on some chromosome
arms.
In fiber FISH experiments, no individual pAv34 arrays were detected. Zhong et al. (1998)
explained their single TGR1 arrays as those corresponding to intercalary sites of the satellite.
Unlike in B. procumbens, no pAv34 intercalary sites were found by FISH on B. vulgaris
metaphase chromosomes. Therefore, we have not expected single stretches of pAv34 and the
lack of single pAv34 fiber FISH signals is in agreement with the absence of interstitial pAv34
sites on B. vulgaris mitotic chromosomes (Fig. 31A, red).
Some tracks of pAv34 arrays are not continuous. This can be an artefact due to a fiber
damage, but as well can be due to the presence of interspersed sequences. It was shown by
fiber FISH that in rice the telomeric repeat and the subtelomeric satellite TrsA may lay as far
as few kilobase pair apart (Ohmido et al. 2001). Interspersion of satellite DNA with
retrotransposons is often observed at centromeres of many plant species, like the centromeric
satellite pTS5 and Ty3-gypsy-like Beetle1 in B. procumbens (Gindullis et al. 2000b). The
Ty3-gypsy retrotransposons CRR of rice and CRM of maize preferentially integrate in
centromeric satellite DNA (Nagaki et al. 2005).
The size of 0.55-62.65 kb estimated for the sugar beet telomeres is at the shorter range of
those found for other higher plants: 3,5 kb for Arabidopsis (Richards et al. 1992), 3-4 kb for
rice chromosomes 6 and 12 (Ohmido et al. 2001, estimated by fiber-FISH) to 30 kb for other
rice chromosomes (Wu & Tanksley 1993, estimated by PFGE), 60-160 kb for tobacco (Fajkus
et al. 1995) and 13-233 kb for tomato (Zhong et al. 1998). An explanation could be
instrumental difficulties in measuring very short telomeric arrays of 0,5-2,0 kb appearing after
in situ experiments as single dots (Fig. 32A). These sizes lie at the limit of detection of the
115
fiber FISH method (Fransz et al. 1996). Telomerase activity is not uniform through plant
tissues. Broken maize chromosome ends can be healed in the embryo, but not in the
endosperm (McClintock 1941). Telomere length and number of telomeric repeat decline in
differentiated cells of barley, resulting in telomeres in the fully expanded leaf being about two
times shorter than in the youngest embryo (Kilian et al. 1995). The reason is that telomerase
is expressed in meristematic tissue and undifferentiated cells, but is low or not detectable in
differentiated tissues of mature plants, like cauliflower, carrots, soybean, rice and Arabidopsis
(Fitzgerald et al. 1996). It was shown on extensive material, that many Asparagales have
alternative to Arabidopsis-type telomeric repeat motif (TTTAGGG)n (Richards & Ausubel
1988) DNA sequences functioning as telomeres (Pich et al. 1996, Adams et al. 2002,
Sykorova et al. 2003c, de la Herran et al. 2005). However, this phenomenon in dicots was so
far found only in some Solanacea species like Cestrum, Vestia and Sessea (Sykorova et al.
2003b).
Although subtelomeric repeats were found in a range of eukaryotes, their function still
remains unclear. They may play a role as buffering blocks separating the telomere from other
functional sequences (Zhong et al. 1998). Subtelomeric repeats may also mediate
chromosome fusion and fission in vertebrates (Meyne et al. 1990). Zhong et al. (1998)
suggest, that in condensed pachytene chromosomes the extreme end is not a telomeric, but a
subtelomeric repeat block, which may thus play a role in the telomere protection as well as in
the attachment of the chromosomes to nuclear membrane.
The characterization of the subtelomeric satellite family pAv34 gives an insight into the
molecular and physical organization of the chromosomal ends in species of the genus Beta
and in S. oleracea. These data add to the information already available on the organization
and composition of chromosomes of the analyzed species. Fiber FISH, which proved to be a
powerful technique for the fine analysis of plant genomes, enabled to study the physical
organization of terminal sequences in sugar beet.
116
4.2. Dispersed repetitive sequences in the genome of B. procumbens
Plant genomes contain numerous dispersed repeats (Bennetzen et al. 1994, Kumar &
Bennetzen 1999, Bureau et al. 1996, Kalendar et al. 2004). Two representatives of this
abundant class of repetitive sequences were isolated from the B. procumbens genome by
cloning of AluI restriction fragments. They were designated pAp4 and pAp22 and were 1354
and 582 bp long, respectively. The dispersed repeats were characterized by sequence analysis,
conventional and pulsed field gel electrophoresis, Southern hybridization and FISH. The
results delivered by investigation on molecular, genomic and chromosomal levels of
organization are consistent with each other and provide a comprehensive picture of structure,
organization and distribution of pAp4 and pAp22. The investigation of the genomic regions
interspersed between the two repeats gave insight into organization and origin of these DNA
sequences in the B. procumbens genome.
Dispersed repeats are often diverged, rearranged or truncated making it difficult to delimit the
border of full-length elements and determine their molecular structure. The identification of
the full-length pAp4 repeats was accomplished by PCR using primers from a partial pAp4
repeat followed by the alignment and assembly of sequenced amplification products (Fig. 11
and 12). Southern experiments with partially digested genomic DNA verified that the largest
complex repeats including pAp4 are approximately 1350 bp long (Fig. 14). Although
dispersed sequences of similar length have been identified in Hordeum chilense (Hueros et al.
1993), Vicia faba (Frediani et al. 1999) and Brassica nigra (Kapila et al. 1996), there are also
many sequence families with shorter or longer repeating units (Kiefer-Meyer et al. 1996,
Schmidt et al. 1998, Aledo et al. 1995). In contrast to the satellite DNA, there is apparently no
preferred size for this class of repetitive sequences in plant genomes.
The dispersed sequence pAp22 has a complex internal structure characterized by direct
sequence repetitions of 75 bp (indicated by arrows in Fig. 16) and the occurrence of short
palindromic motives (Fig. 16, shaded gray). Internal subrepeats are presumably the result of
the rearrangement such as unequal crossing-over (Smith 1976, Schueler et al. 2001) or
slippage replication (Levison & Gutman 1987), and have also been observed in the dispersed
sequences pOD3 and pBO3 from Oryza sativa (Kiefer-Meyer et al. 1995, Kiefer-Meyer et al.
1996) and interspersed Psat elements of Pisum sativum (Neumann et al. 2001). Moreover,
117
similar to the subrepeats in pAp22, the Psat3 repeat contains direct sequence repetitions of 69
bp, which are tandemly arranged and share a homology of 86-94 %.
The FISH experiment demonstrated, that the pAp22 and pAp4 repeats are scattered over all
B. procumbens chromosomes with local clustering and preference for heterochromatic
regions. This observation is consistent with the detection of a smear like pattern on PFGE
Southern experiments which indicate a hybridization of many genomic fragments differing
widely in size. Such chromosomal localization is also characteristic for Ty1-copia
retrotransposons and LINEs (Schmidt et al. 1995, Heslop-Harrison et al. 1997, Katsiotis et al.
1995). In fact, the flanking sequence of pAp4-4 has homology to Ty1-copia-like
retroelements. However, no other signs of pAp4 being actually a part of a retrotransposon
were experimentally found. There was neither similarity to the conserved retroelement coding
domains like reverse transcriptase, integrase or protease (Kumar & Bennetzen 1999) nor
sequence regions resembling tRNA (Kalendar et al. 2004) or target site duplications and
secondary structures characteristic for MITEs (Bureau et al. 1996, Moreno-Vazquez et al.
2005). Although transduction of genomic sequences by plant retroelements has been
described (Bureau et al. 1994, Jin & Bennetzen 1994), it remains unclear whether
retroelements play an active role in the dispersion of pAp4 repeats.
Clusters of pAp4 and, in particular, pAp22 sequences detected on chromosomes as bright
fluorescent signals suggest a higher density in some segments of B. procumbens
chromosomes. Such chromosomal localization is typical for Ty3-gypsy retrotransposons, like
pBp10 (Gindullis et al. 2001b), RIRE2 (Jiang et al. 2002) and the Gas-3 from Ae. speltoides
(Belyayev et al. 2005). Clustered fluorescent signals correspond most likely to adjacently
arranged members of the repeat families, or repeats in close vicinity to each other (Fig. 10 and
19). The determination of a full-length pAp4 repeat by PCR was based on the observation of a
this organization pattern (Fig. 20). It demonstrated the physical linkage of individual pAp4
repeats and verified this assumption on the molecular level (Fig. 23).
Noteworthy is, that the dispersed repeat pAp4 and, to less extent pAp22, show an unusual
exclusion or depletion from the distal and presumably gene-rich euchromatic regions
(Frenster et al. 1963) of B. procumbens chromosomes (Fig. 10, arrowheads). This is in
contrast to the dispersed repeats pDRV1 from B. vulgaris (Schmidt et al. 1998), VfB1 in V.
faba (Frediani et al. 1999) and Dgas44 and R350 from wheat (McNeil et al. 1994). The
depletion of pAp4 and pAp22 repeats from some B. procumbens centromeres (Fig. 19,
arrowheads) may correlate with the amplification of the satellites pAp11 and pTS5 and the
118
retrotransposons Beetle1 and Beetle2 (Weber in prep.) in these loci. A similar distribution was
described for the Ty1-copia retrotransposon Tbv1 and the centromeric BamHI satellite from
B. vulgaris (Schmidt et al. 1995).
FISH on meiotic B. procumbens chromosomes provided a higher resolution and showed that
repeats of the pAp4 and pAp22 families co-localize in many chromosomal regions (Fig. 20).
PCR was used to span the DNA region between the pAp4 and pAp22 repeats and to
investigate their interspersion pattern (Fig. 22). While pAp4 was conserved in all three
junction fragments, variability in size was observed for pAp22 (Fig. 23). Nevertheless, all
analyzed pAp22 representatives showed sequence homology extending over the cloned AluI
restriction fragment strongly indicating that pAp22 belongs to a larger repeating unit such as a
retrotransposon.
Structural features characteristic for retroelements were indeed identified within the extension
of pAp22 in the junction fragment 2 (Fig. 23). When an ORF found downstream of pAp22 in
the junction fragment 2 was subjected to a conceptual translation, its amino acid sequence was
clearly homologous to the gag-domains of Athila, Athila4 and Cyclops-2 retrotransposons
(Pélissier et al. 1995, Wright & Voytas 2001, Chavanne et al. 1998) (Fig. 24C). In contrast,
gag-domains of Ty3-gypsy-like retrotransposons such as the RIRE7 from rice (Kumekawa et
al. 2001) or the Ty1-copia-like BARE-1 (Manninen & Schulman 1993) from barley were not
alignable. Athila, Athila4 and Cyclops-2 belong to a lineage of Ty3-gypsy retrotransposons
containing an envelope-like gene in an additional ORF (Fig. 24A). They are regarded as an
env-class and represent the retrovirus-like elements of plant genomes (Wright & Voytas 1998,
Vicient et al. 2001) building a separate lineage of retroelements (Friesen et al. 2001).
The PBS was another essential structural domain of LTR retrotransposons found in the
junction fragment 2 between the extension of pAp22 and the gag-ORF encoding a capsid
protein (Fig. 24B). The PBS preceding the gag domain is homologous to tRNAs and is
necessary for reverse transcription.
Moreover, a CA dinucleotide indicative for the retroviral insertion was found in the pAp22
extension directly preceding the PBS (Fig. 23). 5’ TG…CA 3’ motif typical for the ends of
LTRs is recognized by retroviral integrase and necessary for integration.
All this facts allow to suppose that pAp22 is in fact a part of an LTR of a retrovirus-like
element. Thus, this study gives the first indication that the env-class of retrotransposons exists
in the genus Beta.
119
Retrotransposons are a dynamic source for the evolution of dispersed repeats, and a large
proportion of dispersed DNA of plant genomes is considered as derivatives or remnants of
transposable elements. More than 13 complex families of dispersed repeats have been found
in a 280 kb stretch of maize DNA (Bennetzen et al.1994), and detailed studies have shown
that most of them belong to various classes of retroelements and may account up to 50 % of
the nuclear DNA (SanMiguel et al. 1996). TRIMs (Terminal-repeat retrotransposons in
miniature) are truncated copies of retrotransposons, which are not capable of autonomous
retrotransposition but have evolved to a separate abundant class of repeats in genomes of
monocotyledonous and dicotyledonous plants (Witte et al. 2001).
Repetitive DNA is subject to different rates of evolution. While some repetitive sequences
such as the satellite families pAp11 and pAv34 discussed in Chapter 4.1 are relatively
conserved in distantly related species, others are characterized by rapid diversification. These
evolutionary changes often results in novel and/or greatly diverged repeat variants, which can
serve as species-specific DNA probes. Both pAp4 and pAp22 are highly specific for
Procumbentes genomes. Therefore, they are suitable section-specific markers for the
identification of Procumbentes chromatin in interspecific Beta hybrids.
120
4.3. Structure of the minichromosomes in the B. vulgaris fragment addition lines
4.3.1. Generation of a physical model of the PRO1 and PAT2 minichromosomes
The application of genome-specific repetitive probes isolated from the wild beet
B. procumbens in combination with repetitive DNA sequences conserved among plant species
enabled to map the minichromosomes of the B. vulgaris fragment addition lines PRO1 and
PAT2. This data complemented the knowledge on the molecular structure of the wild beet
fragments in PRO1 (Gindullis et al. 2001b) and PAT2 (Jacobs et al. in prep). This
information can help to elucidate the origin of the minichromosomes, which are valuable
resource for the improvement of cultivated beet (Cai et al. 1997, Gindullis et al. 2001a).
Localization of repetitive sequences by FISH delivering an insight into the physical
organization of the PRO1 and PAT2 minichromosomes provided useful supporting
information for the analysis of PRO1 and PAT2 BAC libraries.
The BAC libraries were constructed as a tool for the isolation of a functional beet centromere
which could serve as a resource for the construction of a plant artificial chromosome (PAC).
The centromere is a key domain of a PAC ensuring its proper segregation in mitosis and
meiosis. Therefore the first set of the probes analyzed on PRO1 and PAT2 minichromosomes
were the centromeric satellites pTS5 and pTS4.1, complemented with the satellite pAp11
which has centromeric localization on eight of B. procumbens chromosomes and is in
intercalary position on the other ten chromosomes (Fig. 6A).
Hybridization of pTS5 and pTS4.1 on chromosomes of Procumbentes species resulted in a
unique pattern on each centromere, thus allowing to classify the centromeres in those having
(a) only pTS4.1, (b) both satellites present with signals of equal intensity and (c) where pTS5
was much stronger than pTS4.1 (Fig. 35A, 37A).
Both fragment addition lines PRO1 and PAT2 arose spontaneously in the offspring of
B. vulgaris x B. procumbens or B. vulgaris x B. patellaris triploid hybrids back-crossed with
diploid B. vulgaris (Brandes 1992). In PRO1, pTS5 labels one end of the acrocentric
fragment, bordered by adjacent pTS4.1 array from one side only (Fig. 35C). Gindullis et al.
(2001b) suggested that the PRO1 fragment may be a result of a chromosome breakage within
the centromeric pTS5 block which is flanked with pTS4.1 from both sides (examples of this
type of centromere are indicated with arrowheads in Fig. 35A and 36). Alternatively, the
121
PRO1 fragment could originate from one of the chromosomes where the centromeric satellite
pTS5 region is bordered by pericentromeric pTS4.1 only from one side (Fig. 36). As for
PAT2, pTS5 block on its minichromosome is flanked with pTS4.1 arrays from both ends (Fig.
37C), which implies that two breaks have occurred within pericentromeric region. Hence, the
most likely donators of the PAT2 chromosomal fragment are one of the chromosomes
exampled on Fig. 37A by arrowheads. Therefore, the PAT2 centromere, unlike PRO1, is more
similar to the structurally intact wild beet chromosomes.
Hybridization of B. patellaris with pTS5 (Fig. 37A, green) allowed to suppose, that this
species might be an allopolyploid: the pTS5 gave 12 signals of different intensity similar to
the pattern on B. procumbens prometaphase. It is tempting to assume, that one set of
chromosomes of the B. patellaris genome is indeed derived from B. procumbens, while the
remaining 18 chromosomes originate from another, yet unidentified species. Similarly,
hybridization of an allopolyploid N. rustica with the satellite NUNSSP specific to one of the
parental genomes, N. undulata, allowed to distinguish between chromosomes of the
U-genome and P-genome, originating from the different tobacco species, N. paniculata (Lim
et al. 2005b). Alternatively, it was shown for cotton that the repeats from different rDNA
arrays are homogenized, supposedly by interlocus concerted evolution (Wendel et al. 1995). It
is noteworthy, that pTS5 in B. patellaris is found on acrocentric and metacentric
chromosomes, with centromeres recognizable as bright dye-positive blocks on the DAPI-
stained preparation (Fig. 37A, left image). Similarly to B. procumbens, pTS4 signals appeared
on all centromeres of B. patellaris (Fig. 37A, red). A light dispersion of the pericentromeric
Sau3AI satellite I in clusters of different size, including intercalary and subterminal loci, also
was observed (Fig. 37A, arrows).
The consecutive hybridization of a B. procumbens prometaphase with pTS5 (Fig. 6A, green)
and another centromeric satellite pAp11 (Fig. 6A, red) produced a complementary signal
pattern: apart from the rDNA chromosomes, B. procumbens chromosomes carrying minor
pAp11 sites showed a strong amplification of the pTS5 satellite, and vice versa. This finding
leads to the conclusion, that on most B. procumbens centromeres only one satellite repeat
predominates – either pTS5, or pAp11.
After B. patellaris in situ hybridization with pAp11, one chromosome pair was excluded
giving no fluorescent signal (Fig. 37J, arrowheads). This is in contrast to B. procumbens,
where all chromosomes bear pAp11 on different positions (Fig. 6A, red). The remaining
122
hybridization pattern in general is, however, similar to that on B. procumbens, represented by
the centromeric and intercalary loci, single signals and clusters with varied fluorescence
intensity (Fig. 37J, exampled by arrows).
Hence the PRO1 minichromosome was clearly detectable with pTS5 (Fig. 35C) but not with
pAp11 (Fig. 35L) by FISH, it should have originated from a B. procumbens chromosome with
amplified pTS5 and lacking pAp11, like those exampled with arrows in Fig. 6A. On the PAT2
minichromosome, similarly to PRO1, no pAp11 signal was detectable under the given
hybridization stringency of 76% (Fig. 37L). Cross-hybridization with sugar beet
chromosomes (Fig. 35K, 37K) is due to the presence of the pAp11-related pEV satellite
family of B. vulgaris (Schmidt et al. 1991), which is 62.1-78.3% similar to pAp11 (Dechyeva
et al. 2003).
Although the interspecific crosses may result in genome rearrangements (Anamthawat-
Jónsson & Bödvarsdóttir 1998, Barthes & Ricroch 2001, Shaked et al. 2001), it can be
concluded that the PRO1 and PAT2 fragments originate from the chromosomes where pTS5
is amplified, while chromosomes harboring large pAp11 satellite arrays at centromeres can be
excluded.
The telomeres protect the chromosome ends from degradation. They, alongside with
centromeres, are necessary for a functional plant artificial chromosome
(www.chromatininc.com). It was also important to find out, whether PRO1 and PAT2
chromosomal fragments indeed possess telomeres ensuring their stability. Therefore, the next
probes tested on the sugar beet hybrids PRO1 and PAT2 were those located at the
chromosome ends: the Arabidopsis telomeric probe pLT11, the subtelomeric satellite pRp34-
179 originating from B. procumbens and the 25S-18S rDNA probe pTa71 from wheat.
As expected, the telomere was detectable on all chromosomal ends of B. procumbens (Fig.
34D, red) and B. patellaris (Fig. 37D, red) as well as on sugar beet chromosomes of the
fragment addition lines PRO1 (Fig. 34E, red) and PAT2 (Fig. 37E, red).
Noteworthy is, that the telomeres were clearly visible as pairs of fluorescent signals on both
ends of the PRO1 (Fig. 35F) and PAT2 (Fig. 37F) minichromosomes. Thus, PRO1 and PAT2
are indeed structurally complete minichromosomes possessing, alongside with functional
centromeres, the telomeres protecting their ends from disintegration.
Ribosomal DNA genes in eukaryotes are arranged tandemly in thousands of copies. They
reside at the chromosomal loci known as nucleolus organizer regions (NORs) (McClintock
123
1934). These genes are highly conserved in the plants and other eukaryotes. Therefore, it was
expected, that the 18S-25S rDNA probe pTa71 isolated from wheat (Barker et al. 1988)
produced strong hybridization signals at the secondary constriction of B. procumbens (Fig.
35D and G, arrowheads). These domains housing rRNA genes are recognizable as prominent
DAPI-positive structures located distally on two chromosomes (De Jong & Blom 1981). It
can be speculated, that in the tetraploid species B. patellaris, the two strong hybridization
signals most likely correspond to functional rDNA loci (Fig. 37D, arrowheads). It has been
reported for polyploids that only one set of parental rRNA genes is preferentially functional:
expression of rDNA of rye origin is suppressed in amphiploid triticale, and only 1B- and 6B-
rDNA from wheat is functional (Neves at al. 1997). Similar rRNA genes silencing was
observed in natural allotetraploid Arabidopsis suecica and synthetic hybrid of its progenitors
A. thaliana and A. arenosa (Cardaminopsis arenosa) (Pikaard 2001). This epigenetic
phenomenon observed in many animals, like Drosophila and Xenopus (Reeder 1985), and
plants, like Crepis (Navashin 1934), Aegilops x Triticum hybrids (Martini et al. 1982),
Brassica (Chen and Pikaard 1997), is known as nucleolar dominance (Pikaard 1999). Not
only most natural polyploids possess one predominant 18S-5.8S-25S nuclear ribosomal DNA
homolog in their genome; the studies on artificial interspecific hybrids suggested that in some
plants, like Glycine, most or all repeats at one homeologous locus have been lost (Joly et al.
2004). The weak green cross-hybridization signals (Fig. 37D) may correspond to the rDNA
loci from the repressed half of the chromosome set, which is still recognizable by the
heterologous probe used in this experiment. No pTa71 signals were detectable either on PRO1
(Fig. 35H) or on PAT2 (Fig. 37H) minichromosomes.
When probed with the subtelomeric pRp34, B. patellaris (Fig. 37G, red) in contrast to
B. procumbens (Fig. 35G, red) did not produce visible signals on the chromosome ends
carrying the rDNA genes (Fig. 37G, green). On the contrary, the subtelomeric pRp34 signals
were detectable proximal to weaker pTa71 signals (Fig. 37G, arrowheads), most likely caused
by inversion. This is yet another indication, that B. procumbens is not the only genome that
participated in B. patellaris polyploidization.
The subtelomeric satellite pRp34 was, similarly to the telomere, found on both ends of the
added fragments PRO1 (Fig. 35I) and PAT2 (Fig. 37I). The two signals on the PRO1 and
PAT2 minichromosomes (Fig. 35I, 37I) indicate, that not only the telomeres of the added
fragments seem to be intact (Fig. 35F, 37F), but also the other components of the
chromosome ends are present. In PRO1, the probe is very weak at the centromeric end of the
124
acrocentric minichromosome and strong on its distal end. Additional signals on sugar beet
chromosomes (Fig. 35H, 37H) are due to cross-hybridization with the homologous
subtelomeric satellite pAv34 from B. vulgaris belonging to the same repetitive DNA family as
pRp34 (Chapter 3.2). These signals are however relatively weak, while average sequence
similarity between pAv34 and pRp34 is only 58.9% (Tab. 4). The stronger signals on B.
vulgaris chromosomes may correspond to the pAv34 sequence subsets mostly homologous to
pRp34, thus indicating chromosome-specific amplification of the subtelomeric satellite.
Emergence of chromosome-specific DNA is known for human alpha satellite, where ancestral
sequences have evolved into a number of chromosome-specific families, presumably by
cycles of interchromosomal transfers and subsequent amplification leading to
intrachromosomal sequence homogenization (Alexandrov et al. 1988). Representatives of
Sau3AI satellite family I of B. procumbens also form a subfamily pTS6 with distinct
chromosomal position (Schmidt & Heslop-Harrison 1996).
Finally, the two dispersed repetitive families specific for the Procumbentes genomes were
tested. In B. procumbens, pAp4 and pAp22 sequences demonstrated dispersed organization
with local amplifications (Fig. 35M and P, arrows) and exclusions predominantly from
terminal euchromatin (exampled in Fig. 35M and P with arrowheads).
Similarly to the pattern observed in B. procumbens (Fig. 10 and 35M), pAp4 is reduced on
some B. patellaris centromeres (Fig. 37M, arrows) while amplified on the others or
pericentrically, and is largely excluded from euchromatic chromosome ends (Fig. 37M,
exampled with arrowheads).
When compared to pAp4, pAp22 is even less uniformly distributed producing a kind of
banding pattern on B. procumbens chromosomes (Fig. 19 and 35P, green). It is amplified in
some pericentric regions, but not directly on centromeres (Fig. 19, examples indicated with
arrowheads). However, it is similarly to pAp4 excluded from euchromatic ends and even
chromosome arms (Fig. 35P, examples are shown by arrowheads).
On B. patellaris chromosomes, in resemblance to B. procumbens, the repeat pAp22 is
amplified in clusters (Fig. 37P, exampled with arrows) and excluded from euchromatin and
even some chromosome arms (Fig. 37P, arrowheads). On six B. patellaris chromosomes only
a single pair of pAp22 signals was detectable.
In PRO1, the pAp4 (Fig. 35O) and pAp22 (Fig. 35R) FISH signals were visible only on the
B. procumbens derived fragment, but not on chromosomes originating from B. vulgaris (Fig.
35N and Q). It is in agreement with the species distribution revealed by Southern
125
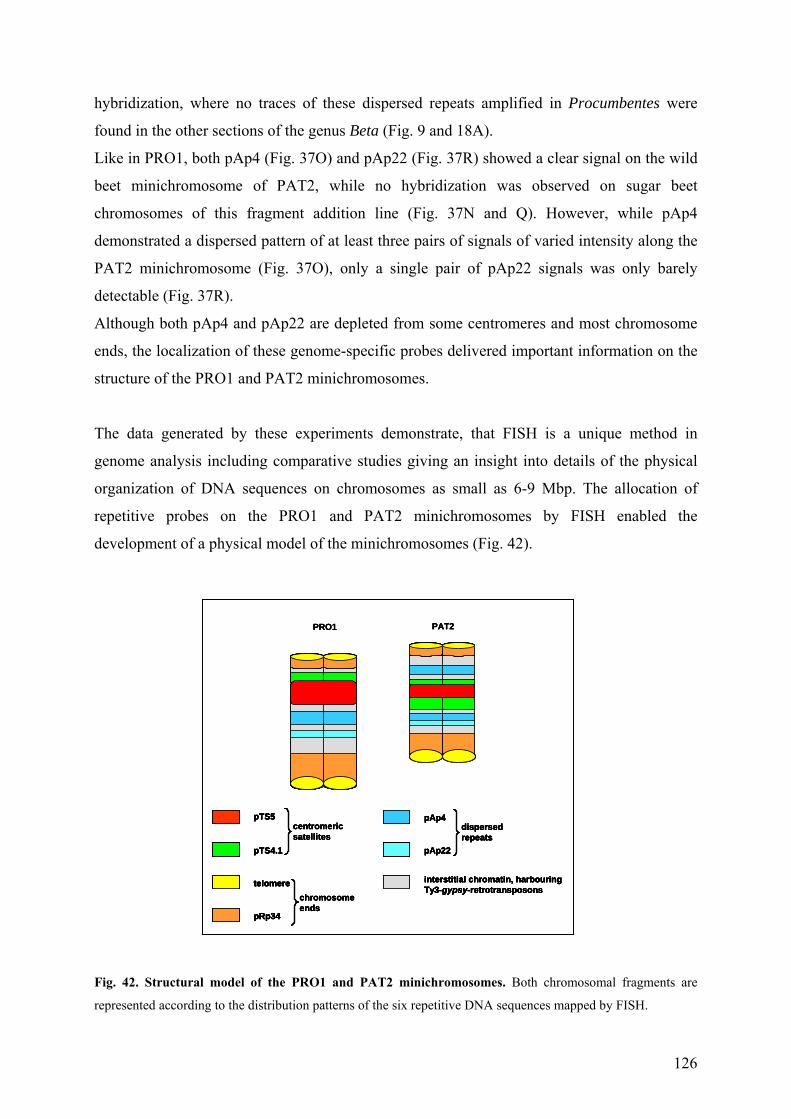
126
hybridization, where no traces of these dispersed repeats amplified in Procumbentes were
found in the other sections of the genus Beta (Fig. 9 and 18A).
Like in PRO1, both pAp4 (Fig. 37O) and pAp22 (Fig. 37R) showed a clear signal on the wild
beet minichromosome of PAT2, while no hybridization was observed on sugar beet
chromosomes of this fragment addition line (Fig. 37N and Q). However, while pAp4
demonstrated a dispersed pattern of at least three pairs of signals of varied intensity along the
PAT2 minichromosome (Fig. 37O), only a single pair of pAp22 signals was only barely
detectable (Fig. 37R).
Although both pAp4 and pAp22 are depleted from some centromeres and most chromosome
ends, the localization of these genome-specific probes delivered important information on the
structure of the PRO1 and PAT2 minichromosomes.
The data generated by these experiments demonstrate, that FISH is a unique method in
genome analysis including comparative studies giving an insight into details of the physical
organization of DNA sequences on chromosomes as small as 6-9 Mbp. The allocation of
repetitive probes on the PRO1 and PAT2 minichromosomes by FISH enabled the
development of a physical model of the minichromosomes (Fig. 42).
Fig. 42. Structural model of the PRO1 and PAT2 minichromosomes. Both chromosomal fragments are
represented according to the distribution patterns of the six repetitive DNA sequences mapped by FISH.
pTS5
pTS4.1
telomere
pRp34
centromeric satellites
chromosome ends
pAp4
pAp22
interstitial chromatin, harbouring Ty3-gypsy-retrotransposons
dispersed repeats
PRO1 PAT2
pTS5
pTS4.1
telomere
pRp34
centromeric satellites
chromosome ends
pAp4
pAp22
interstitial chromatin, harbouring Ty3-gypsy-retrotransposons
dispersed repeats
pTS5
pTS4.1
telomere
pRp34
centromeric satellites
chromosome ends
pAp4
pAp22
interstitial chromatin, harbouring Ty3-gypsy-retrotransposons
dispersed repeats
pTS5
pTS4.1
telomere
pRp34
pTS5
pTS4.1
telomere
pRp34
centromeric satellites
chromosome ends
pAp4
pAp22
interstitial chromatin, harbouring Ty3-gypsy-retrotransposons
dispersed repeats
pAp4
pAp22
interstitial chromatin, harbouring Ty3-gypsy-retrotransposons
dispersed repeats
PRO1 PAT2PRO1 PAT2
The minichromosomes of PRO1 and PAT2 contain most major types of repetitive DNA
characteristic for intact chromosomes of the wild beet species B. procumbens and B.
patellaris. They include arrays of two centromeric and pericentromeric satellites, dispersed
repetitive sequences and are terminated by subtelomeric satellite and the telomere. However,
the transmission rate of the PRO1 and PAT2 fragments in meiosis is lower than expected,
reaching 34.8 % maximal for PRO1 (Brandes et al. 1987). The reason could be the loss or
reduction in size of the chromosomal domains essential for the proper sister chromatid
cohesion and segregation – the centromeres. The experiments performed in this study
demonstrated, that in PRO1 the centromere is located distally, forming an acrocentric
minichromosome. The size of the centromeric pTS5 satellite array has been estimated of 115
kb by fiber FISH (Gindullis et al. 2001a). Wild type B. procumbens chromosomes are
metacentric, submetacentric or acrocentric (Fig. 6A), their centromeric satellite arrays
spanning 157 – 755 kb (Mesbach et al. 2000). Further, it was shown, that telomeric DNA and
the subtelomeric satellite pRp34 are present on both ends of the PRO1 minichromosome,
although on one end the signals are much weaker in comparison to the other (Fig. 35 D).
In PAT2, the centromeric array is even smaller – only about 50 kb estimated by pulsed-field
gel electrophoresis (Jacobs et al. in prep.). However, the minichromosome of this fragment
addition line seems to be meta- or submetacentric, and pTS5 is bordered with pTS4 from both
ends (Fig. 37B and C). The telomere and the subtelomeric satellite pRp34 were also detected
on the both ends of the minichromosome, although amplified to a different extent.
The fact, that the minichromosome of PAT2 contains centromeric pTS5 satellite block
flanked by pericentromeric satellite pTS4 arrays (Fig. 37B and C) as well as the telomere
(Fig. 37E and F) and the subtelomeric satellite repeat (Fig. 37H and I) leads to the conclusion,
that there might be other factors effecting stable transmission of this minichromosome in
meiosis. It was shown in field bean, that the minichromosome containing a wild-type
centromere and comprising approximately 5% of the haploid metaphase complement suffers
loss during meiosis (66% loss in hemizygous and 33% in homozygous condition), while the
minichromosomes comprising approximately 6% of the genome were stably segregating
(Schubert 2001). It is supposed, that lack of additional genomic DNA serving as lateral
support of centromeres or insufficient bivalent stability due to the incapability of chiasma
formation could be the reasons of lower transmission of the very small chromosome
fragments, even though they possess the centromere and the telomeres.
127
4.3.2. Application of BAC-FISH for the analysis of B. vulgaris fragment addition lines
The next step in the characterization of the PRO1 and PAT2 minichromosomes for the
construction of a plant artificial chromosome was the localization of BACs by fluorescent in
situ hybridization. The BACs serving as FISH probes originated from PRO1 and PAT2 BAC
libraries (Gindullis et al. 2000a, Jacobs et al. in prep.). For this experiment, three clones were
chosen from the PRO1 and PAT2 BAC libraries following further criteria. Two BACs from
each library were selected using the centromeric satellite pTS5 and the pericentromeric
pTS4.1 (Schmidt et al. 1990, Schmidt & Heslop-Harrison 1996) as probes. These BACs
originated presumably from the centromeric regions of the wild beet minichromosomes. The
third BACs were chosen to demonstrate feasibility of the libraries for the analysis of
B. vulgaris genome. The PRO1 BAC was selected with a B. vulgaris histone H3 as probe
(EMBL accession AJ308402), and the PAT2 BAC contained an RFLP marker pKp814
(Schumacher et al. 1997).
As expected, the pTS5- and pTS4.1-containing BACs were detected only on the
minichromosomes of PRO1 and PAT2 mitotic chromosome spreads. The pTS5-positive
BACs produced only a pair of signals on both chromosomal fragments (Fig. 38A and E).
However, hybridization with the pTS4.1-containing BACs revealed a remarkable difference
between the fragment addition lines: while there was only a single pair of signals on PRO1
(Fig. 38B), on PAT2 there were two signal pairs separated by a gap (Fig. 38F). This result is
in accord with the double-target hybridization of pTS5 and pTS4.1 on the PAT2
minichromosome (Fig. 37B and C), where centromeric pTS5 is flanked by the
pericentromeric pTS4.1 from both sides.
The pTS5-positive BAC labelled the majority of the eighteen B. procumbens centromeres
(Fig. 38C) consistent with the observation that the satellite repeat pTS5 is localized on most
but not all centromeres in B. procumbens (Fig 6A, green and 35A, green) (Schmidt & Heslop-
Harrison 1996). The weak cross-hybridization along B. procumbens chromosomes is most
likely caused by dispersed repetitive DNA elements, such as pAp4, pAp22 (Dechyeva et al.
2003) and the Ty3-gypsy-like sequences pBp10 (Gindullis et al. 2001b) and Beetle1 and
Beetle2 (Weber in prep.), which are also constituents of these BACs (Gindullis et al. 2001a).
128
In the FISH experiment on B. patellaris metaphases both pTS5- and pTS4.1-positive PAT2
BACs labeled the majority of the 36 B. patellaris centromeres (Fig. 38D and H, arrows). The
strong signals are consistent with the observation that these BAC clones contain large
centromeric satellite repeats. The additional weak hybridization along B. patellaris
chromosomes is caused by dispersed repetitive DNA elements which are contained in the
inserts of these BACs (Jacobs et al. in prep.). The findings demonstrate that the selected BAC
clones are indeed derived from the centromeric region of the PAT2 minichromosome and that
they can be isolated using genome-specific satellite repeats such as pTS5 as probes.
In addition, the PRO1 and PAT2 BAC libraries are a valuable resource for the analysis of the
B. vulgaris genome. The identification of the histone H3 in the PRO1 library (Fig. 38I)
ensures that BACs containing genes of agricultural importance can be identified and that the
libraries can serve as starting point for gene isolation.
The BAC libraries are also useful for the molecular-cytogenetic integration of linkage maps
with sugar beet chromosomes. This can be achieved by FISH with BACs selected by RFLP
probes from individual linkage groups. Such a strategy combines physical and genetic
mapping and will provide information about the coverage of chromosomes by linkage groups.
The possibility to carry out such an investigation was demonstrated in the in situ hybridization
experiment with the single-copy B. vulgaris RFLP-marker pKp814, which is located on the
linkage group I of the sugar beet genome integrated map (Schumacher et al. 1997). A BAC
containing pKp814 was chosen as FISH probe to determine the chromosomal position of the
genetically mapped RFLP-marker. The clone did not hybridize to the PAT2 minichromosome,
but gave distinct signals on two B. vulgaris chromosomes in a subterminal position in the
euchromatic region (Fig. 38J).
The FISH experiments described above allowed to locate unequivocally BACs containing
genes (Fig. 38I, green) and single-copy probes (Fig. 38J, green) on B. vulgaris chromosomes.
They demonstrated, that this cytogenetic application is a valuable tool in physical mapping of
genes of economic importance in sugar beet, like previously shown by localization of BACs
on maize chromosomes and interphase nuclei (Jiang et al. 1995). FISH is also useful for
linking of genetic and physical maps, which was previously demonstrated by assigning of 5S
rDNA with the adjacent cluster of markers in linkage group II to the chromosome IV of
B. vulgaris (Schondelmaier et al., 1997).
129
4.4. Kinetochore proteins in the B. vulgaris hybrid PRO1
Centromeric heterochromatin consists predominantly of repetitive sequences, like satellites
and LTR-retrotransposons, mostly Ty3-gypsy. Both are generally characterized by rapid
divergence and evolution. Thus, species-specific and even chromosome-specific variants and
whole repeat families evolve at the centromere similarly to other chromosomal regions. This
phenomenon can also be observed in beet: not only representatives from different sections of
the genus have different centromere-specific sequences (Gindullis et al. 2001b), but also
within the B. procumbens genome one set of the chromosomes is enriched with the satellite
pTS5 at centromeres, while another bears either pTS6, a diverged member of the Sau3AI
satellite family I (Schmidt & Heslop-Harrison 1996), or an unrelated satellite pAp11
(Dechyeva et al. 2003).
Apparently, there is no universal DNA sequence responsible for the centromeric function in
higher plants. However, the centromeres from one species can sometimes function in related
species (Jin et al. 2004). That means, that an epigenetic mechanism ensuring centromeric
function might exist. One of the first steps in the establishment of a centromere must involve
the deposition of the centromeric histone H3 variant, the CenH3. This protein is generally
viewed as the core of the centromeric complex binding the rest of the components of the inner
kinetochore. Moreover, in maize centromeric retrotransposons (CRMs) and satellite repeats
(CentC) are not only transcribed, but also bound to CenH3, which was shown by
immunoprecipitation (Topp et al. 2004). Another recent study of rice chromosome 8
centromere (Cen8) also indicated that genes within centromeres could be transcribed. Out of
fourteen predicted genes in Cen8, four were active. Moreover, these genes are interspersed
with CenH3 binding sites and are exclusively bound to kinetochore region. Thus, transcription
of the genes within the centromeric domain might contribute to centromere formation (Nagaki
et al. 2004).
Although kinetochores differ in morphology from species to species, recent data have
established that an important group of kinetochore proteins is conserved from Saccharomyces
cerevisiae to humans (Westermann et al. 2003). It was shown by indirect
immunofluorescence, that the kinetochore elements of the higher plants are conserved even
between very distantly related taxa like monocots and dicots. Antibodies against the partial
human proteins CENP-C, CENP-E and CENP-F and against maize CENP-C recognized the
130
centromeric regions of mitotic chromosomes of Vicia faba and/or Hordeum vulgare (ten
Hoopen et al. 2000).
An next important step during formation of a functional kinetochore is the phosphorylation of
the pericentromeric histone H3. This post-translational chromatin modification is
evolutionarily conserved in plants and animals (Manzanero et al. 2000). The changes in the
level of phosphorylation of serine 10 in CenH3 correspond to changes in the cohesion of sister
chromatids in meiosis in maize (Kaszas & Cande 2000). In Secale cereale, Hordeum vulgare
and Vicia faba, the phosphorylation of the pericentromeric histone H3 at serine 10 correlates
with the chromosomes condensation in mitosis (Houben et al. 1999).
The fluorescent immunostaining of proteins in the fragment addition line PRO1 (Jung &
Wricke 1987) allows to compare histone H3 phosphorylation patterns of B. vulgaris
chromosomes and the B. procumbens minichromosome in mitosis, elucidating the behaviour
of the centromeres originating from different species in a single dividing cell. The
experiments presented in this work demonstrated, that the heterologous antibody against
serine 10-phosphorylated histone H3 recognized sugar beet kinetochores (Fig. 39, red). The
visualization of the microtubuli with anti-α-tubulin allowed to visualize whether the
chromosomes are attached to the spindle apparatus during mitosis (Fig. 39B, arrows). It can
be supposed that the kinetochore proteins produced by sugar beet must recognize as well the
centromere of the added fragment, since it shows 100 % transmission rate in mitosis. It was
not possible to demonstrate clearly whether phosphorylated histone H3 and α-tubulin
antibodies were also bound to the centromere of the wild beet minichromosome. The
preparations which are suitable for immunostaining contain cytoplasma proteins hindering
spreading of chromosomes. The preparations are three-dimensional, concealing lower layers
of metaphase spreads from observation. Therefore, the PRO1 minichromosome could not be
morphologically detected.
The immunostaining experiment with the antibodies against serine 10-phosphorylated histone
H3 and α-tubulin gave the first insight into the centromeric function in the B. vulgaris
fragment addition line PRO1. Further studies on this unique material combining the functional
centromeres with the different molecular composition from two distantly related species
would shed the light on the centromeric function in higher plants.
131
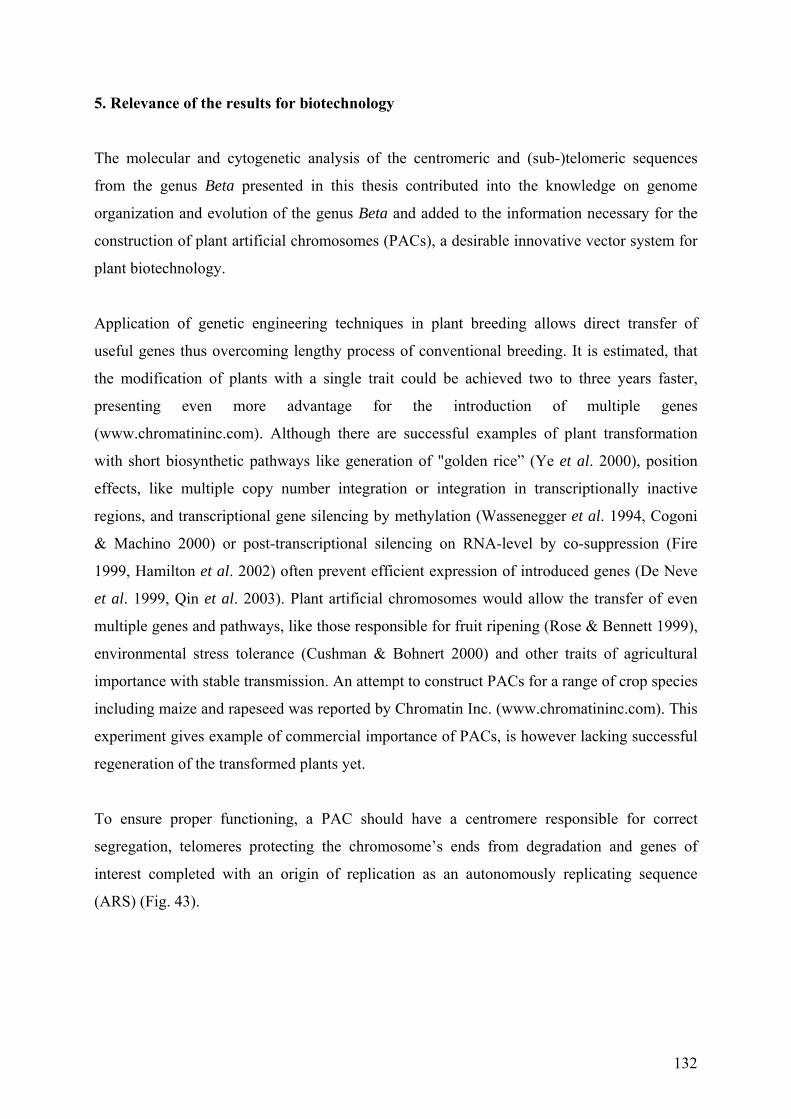
5. Relevance of the results for biotechnology
The molecular and cytogenetic analysis of the centromeric and (sub-)telomeric sequences
from the genus Beta presented in this thesis contributed into the knowledge on genome
organization and evolution of the genus Beta and added to the information necessary for the
construction of plant artificial chromosomes (PACs), a desirable innovative vector system for
plant biotechnology.
Application of genetic engineering techniques in plant breeding allows direct transfer of
useful genes thus overcoming lengthy process of conventional breeding. It is estimated, that
the modification of plants with a single trait could be achieved two to three years faster,
presenting even more advantage for the introduction of multiple genes
(www.chromatininc.com). Although there are successful examples of plant transformation
with short biosynthetic pathways like generation of "golden rice” (Ye et al. 2000), position
effects, like multiple copy number integration or integration in transcriptionally inactive
regions, and transcriptional gene silencing by methylation (Wassenegger et al. 1994, Cogoni
& Machino 2000) or post-transcriptional silencing on RNA-level by co-suppression (Fire
1999, Hamilton et al. 2002) often prevent efficient expression of introduced genes (De Neve
et al. 1999, Qin et al. 2003). Plant artificial chromosomes would allow the transfer of even
multiple genes and pathways, like those responsible for fruit ripening (Rose & Bennett 1999),
environmental stress tolerance (Cushman & Bohnert 2000) and other traits of agricultural
importance with stable transmission. An attempt to construct PACs for a range of crop species
including maize and rapeseed was reported by Chromatin Inc. (www.chromatininc.com). This
experiment gives example of commercial importance of PACs, is however lacking successful
regeneration of the transformed plants yet.
To ensure proper functioning, a PAC should have a centromere responsible for correct
segregation, telomeres protecting the chromosome’s ends from degradation and genes of
interest completed with an origin of replication as an autonomously replicating sequence
(ARS) (Fig. 43).
132
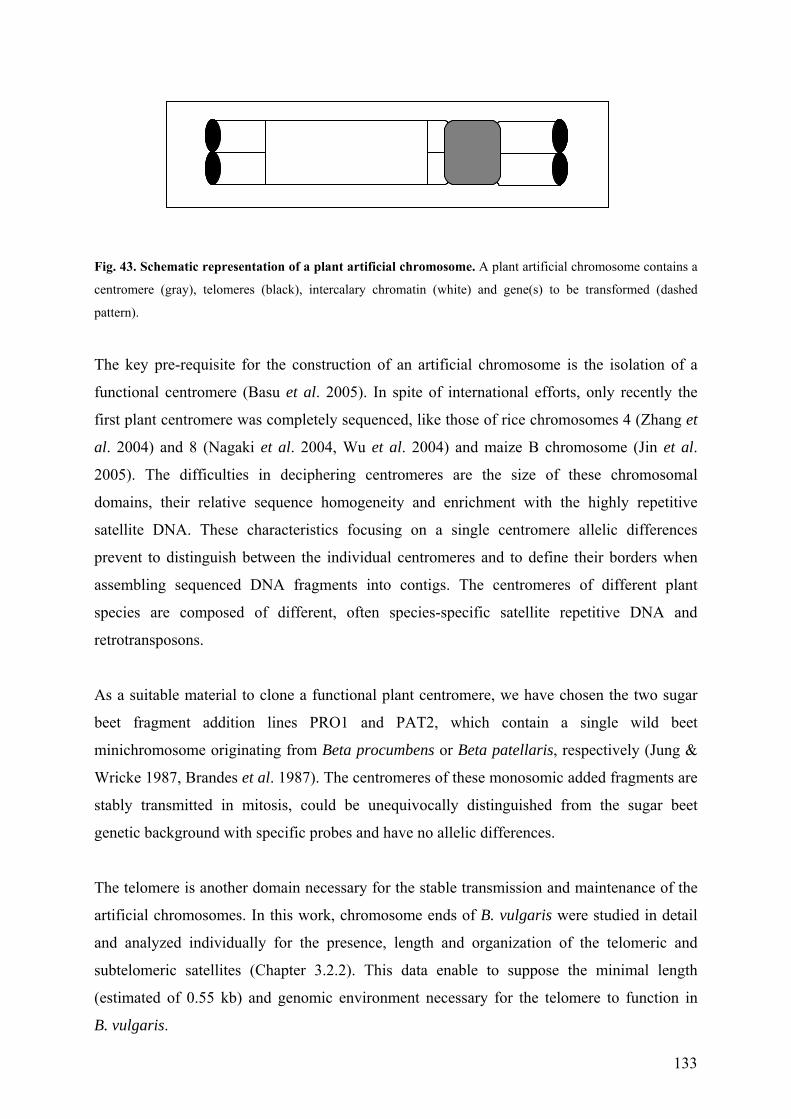
133
Fig. 43. Schematic representation of a plant artificial chromosome. A plant artificial chromosome contains a
centromere (gray), telomeres (black), intercalary chromatin (white) and gene(s) to be transformed (dashed
pattern).
The key pre-requisite for the construction of an artificial chromosome is the isolation of a
functional centromere (Basu et al. 2005). In spite of international efforts, only recently the
first plant centromere was completely sequenced, like those of rice chromosomes 4 (Zhang et
al. 2004) and 8 (Nagaki et al. 2004, Wu et al. 2004) and maize B chromosome (Jin et al.
2005). The difficulties in deciphering centromeres are the size of these chromosomal
domains, their relative sequence homogeneity and enrichment with the highly repetitive
satellite DNA. These characteristics focusing on a single centromere allelic differences
prevent to distinguish between the individual centromeres and to define their borders when
assembling sequenced DNA fragments into contigs. The centromeres of different plant
species are composed of different, often species-specific satellite repetitive DNA and
retrotransposons.
As a suitable material to clone a functional plant centromere, we have chosen the two sugar
beet fragment addition lines PRO1 and PAT2, which contain a single wild beet
minichromosome originating from Beta procumbens or Beta patellaris, respectively (Jung &
Wricke 1987, Brandes et al. 1987). The centromeres of these monosomic added fragments are
stably transmitted in mitosis, could be unequivocally distinguished from the sugar beet
genetic background with specific probes and have no allelic differences.
The telomere is another domain necessary for the stable transmission and maintenance of the
artificial chromosomes. In this work, chromosome ends of B. vulgaris were studied in detail
and analyzed individually for the presence, length and organization of the telomeric and
subtelomeric satellites (Chapter 3.2.2). This data enable to suppose the minimal length
(estimated of 0.55 kb) and genomic environment necessary for the telomere to function in
B. vulgaris.
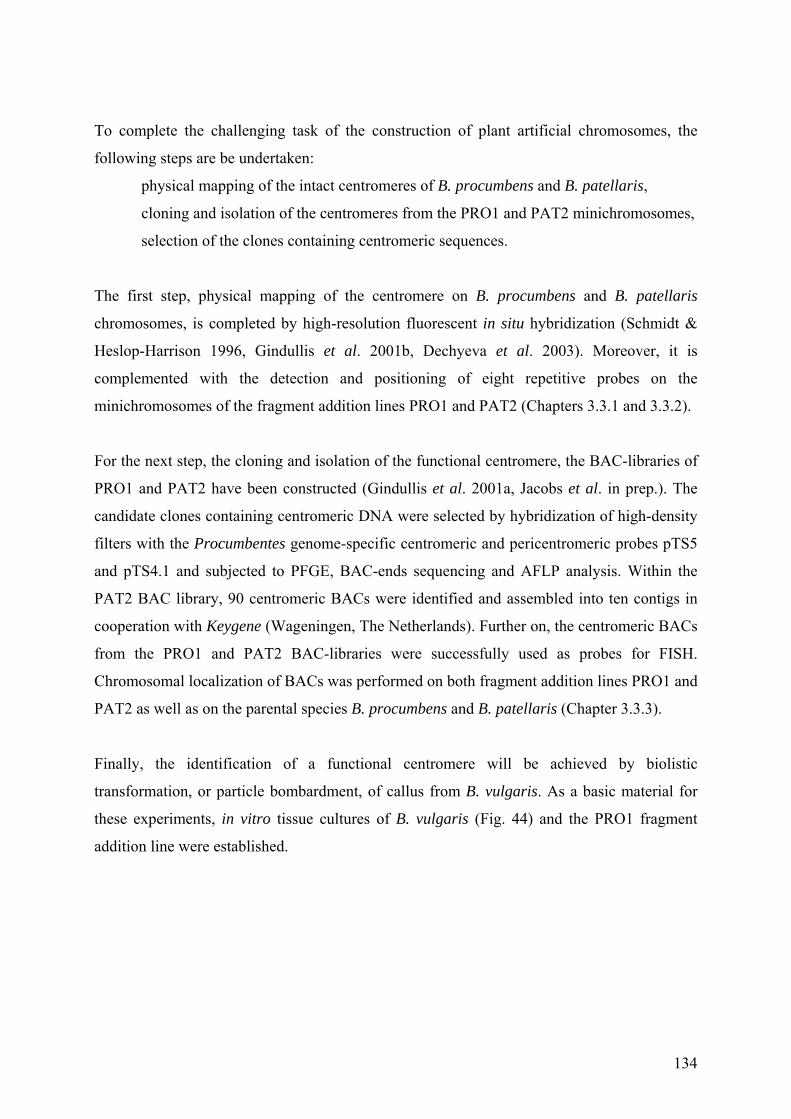
To complete the challenging task of the construction of plant artificial chromosomes, the
following steps are be undertaken:
physical mapping of the intact centromeres of B. procumbens and B. patellaris,
cloning and isolation of the centromeres from the PRO1 and PAT2 minichromosomes,
selection of the clones containing centromeric sequences.
The first step, physical mapping of the centromere on B. procumbens and B. patellaris
chromosomes, is completed by high-resolution fluorescent in situ hybridization (Schmidt &
Heslop-Harrison 1996, Gindullis et al. 2001b, Dechyeva et al. 2003). Moreover, it is
complemented with the detection and positioning of eight repetitive probes on the
minichromosomes of the fragment addition lines PRO1 and PAT2 (Chapters 3.3.1 and 3.3.2).
For the next step, the cloning and isolation of the functional centromere, the BAC-libraries of
PRO1 and PAT2 have been constructed (Gindullis et al. 2001a, Jacobs et al. in prep.). The
candidate clones containing centromeric DNA were selected by hybridization of high-density
filters with the Procumbentes genome-specific centromeric and pericentromeric probes pTS5
and pTS4.1 and subjected to PFGE, BAC-ends sequencing and AFLP analysis. Within the
PAT2 BAC library, 90 centromeric BACs were identified and assembled into ten contigs in
cooperation with Keygene (Wageningen, The Netherlands). Further on, the centromeric BACs
from the PRO1 and PAT2 BAC-libraries were successfully used as probes for FISH.
Chromosomal localization of BACs was performed on both fragment addition lines PRO1 and
PAT2 as well as on the parental species B. procumbens and B. patellaris (Chapter 3.3.3).
Finally, the identification of a functional centromere will be achieved by biolistic
transformation, or particle bombardment, of callus from B. vulgaris. As a basic material for
these experiments, in vitro tissue cultures of B. vulgaris (Fig. 44) and the PRO1 fragment
addition line were established.
134
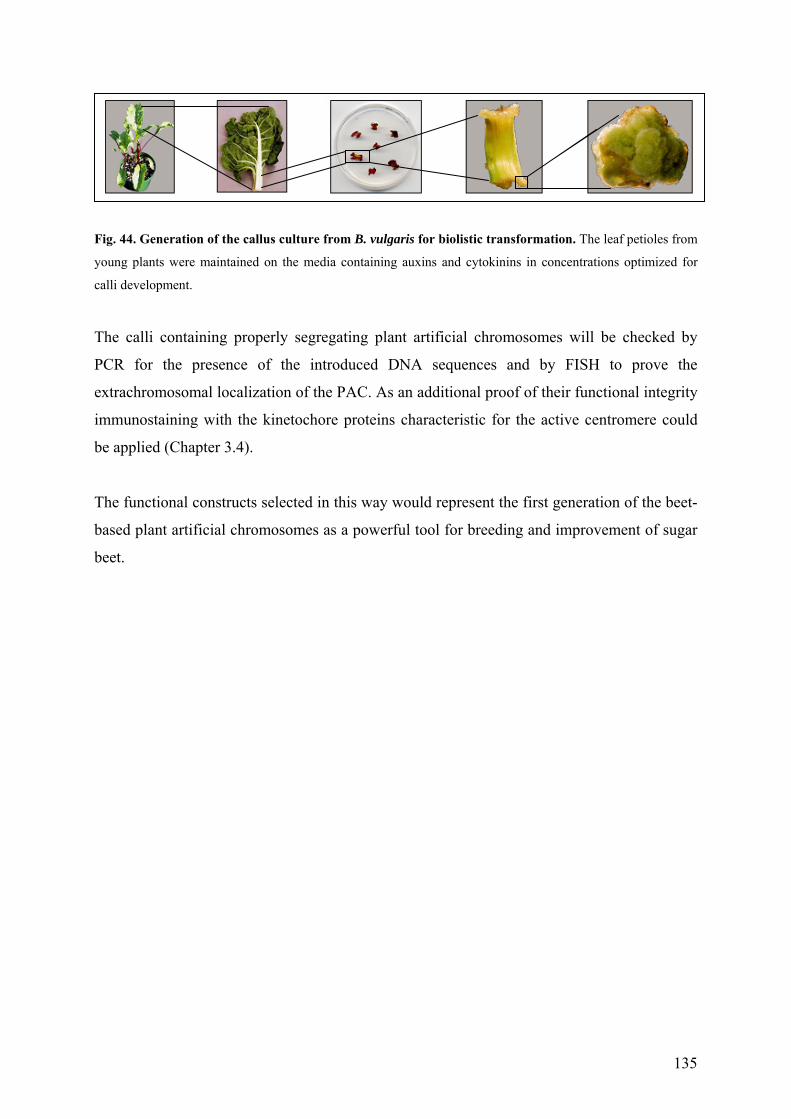
F
y
c
T
P
e
i
b
T
b
b
135
ig. 44. Generation of the callus culture from B. vulgaris for biolistic transformation. The leaf petioles from
oung plants were maintained on the media containing auxins and cytokinins in concentrations optimized for
alli development.
he calli containing properly segregating plant artificial chromosomes will be checked by
CR for the presence of the introduced DNA sequences and by FISH to prove the
xtrachromosomal localization of the PAC. As an additional proof of their functional integrity
mmunostaining with the kinetochore proteins characteristic for the active centromere could
e applied (Chapter 3.4).
he functional constructs selected in this way would represent the first generation of the beet-
ased plant artificial chromosomes as a powerful tool for breeding and improvement of sugar
eet.
6. Summary
The elucidation of the composition and structural organization of genomes of higher plants is
a fundamental problem of modern molecular biology. The genus Beta containing 14 closely
and distantly related species assigned to the sections Beta, Corollinae, Nanae and
Procumbentes provides a suitable system for the comparative study of the nuclear genome
composition and evolution. Sugar beet has a genome size of 758 Mbp DNA with estimated
63 % repetitive sequences. The number of chromosomes is n=9 and most species of the genus
are diploid. The wild beet Beta procumbens Chr. Sm is an important natural pool of resistance
against pests and tolerance to unfavourable growth conditions. Several of its repetitive
sequences, namely pTS3, pTS4.1 and pTS5, were already known and well characterized.
The subject of this research was the isolation and description of new repetitive DNA families
from genomes of this Beta species. This work presents the molecular investigation and
cytogenetic characterization by high-resolution multicolour FISH of the satellite and
dispersed repetitive sequences in wild and cultivated beet species as well as in their hybrids.
A number of new repetitive sequences was isolated from the genome of the wild beet
B. procumbens. According to their genomic organization, the repeats were assigned to the
families of satellite DNA and of dispersed DNA sequences. The AluI restriction satellite
repeats designated pAp11 were 229-246 bp long. Monomers of this satellite DNA are 159-
165 bp long and form subfamilies which could be distinguished by the divergence or
methylation of an internal AluI site. The satellite is amplified in the section Procumbentes, but
also found in species of the section Beta including cultivated beet (Beta vulgaris). The pAp11
satellite is probably an ancient component of Beta genomes, since it exists in distantly related
species of the genus. Moreover, it could be the ancestor of the diverged satellite subfamily
pEV4 in B. vulgaris based on sequence analysis, Southern hybridization and comparative
fluorescent in situ hybridization. While pAp11 was found at centromeric and a few intercalary
sites in B. procumbens, on B. vulgaris chromosomes it formed intercalary blocks of different
sizes on every chromosome arm. It co-localized with the satellite pEV4 from sugar beet on all
except for one of those sites. Thus, there were remarkable differences in the chromosomal
position of pAp11 between species of the sections Procumbentes and Beta, indicating that
both satellites were most likely involved in the expansion or rearrangement of the intercalary
heterochromatin of sugar beet.
136
Other two sequence families described here are the non-homologous dispersed repeats pAp4
and pAp22 which are 1354 and 582 bp long, respectively. Their organization was
characterized on molecular, genomic and chromosomal levels. The two repeats showed a
dispersed organization in the genome and were widely scattered along B. procumbens
chromosomes with local clustering and exclusion from distal euchromatic regions. Both
Southern analysis and FISH showed, that pAp4 and pAp22 are specific for the section
Procumbentes and can be used as DNA probes to discriminate parental genomes in
interspecific hybrids. FISH on meiotic chromosomes giving higher resolution showed that the
both dispersed sequences are co-localized in many chromosomal regions. The interspersion of
these repeats was studied by PCR and enabled the determination of the sequences flanking
pAp4 and pAp22. An analysis of these regions revealed that pAp22 is either derived from or a
part of a Long Terminal Repeat (LTR) of an Athila-like env-class retrotransposon, thus giving
a first indication that these retrovirus-like DNA elements exist in Beta.
An ancient family of subtelomeric satellite DNA pAv34 was isolated from representative beet
species of all four sections of the genus Beta and from spinach, a related Chenopodiaceae. In
order to study the distribution and divergence of this satellite family in the genus Beta, five
clones were analyzed from each of the five species. The genomic organization and species
distribution of the satellites were studied by sequencing and Southern hybridization. The
repeating units in all families are 344-362 bp long and share 46.2-98.8 % similarity. Each
monomer consists of two subunits SU1 and SU2 of 165-184 bp, respectively. The maximum
likelihood and neighbor joining analyses of the 25 subtelomeric satellite monomers and their
subunits allowed to suppose, that the duplication leading to the emergence of the 360 bp
satellite should have occurred early in the phylogeny. The two directions of diversification
could be detected: first, the clustering of satellites in two groups representing the subunits
SU1 and SU2; second, the arrangement of satellite repeats in section-specific groups. The
comparative chromosomal localization of the telomeric repeat, the subtelomeric satellite
family pAv34 and 18S-5.8S-25S rDNA was investigated by multicolour FISH. Each
B. vulgaris chromosome end showed unique physical organization of telomeric repeat and the
subtelomeric satellite pAv34, as studied by high-resolution FISH on extended DNA fibers.
The estimated length of the telomeric array varied between 0.55 kb and 62.65 kb, the length
of the subtelomeric satellite pAv34 was 5.0-125.25 kb, while the spacer between these
sequences spanned 1.0-16.60 kb.
137
The various classes of repeats isolated so far from the wild beets of the section Procumbentes
were used to characterize the minichromosomes of the sugar beet fragment addition lines
PRO1 and PAT2 by FISH. Altogether, eight repetitive probes were applied, including four
families of satellite sequences (pTS4.1, pTS5, pRp34 and pAp11), two dispersed repeats
(pAp4 and pAp22), the 18S-5.8S-25S rDNA and the telomeric repeat. Among the satellite
probes, pTS4.1 and pTS5 were section-specific sequences confined to the centromeric regions
of Procumbentes chromosomes. Another two satellites pAp11 and pRp34 originating from
B. procumbens were also present in other sections of the genus Beta and S. oleracea. While
pAp11 was found at centromeres and intercalary loci, the pRp34 had a subtelomeric position.
The both dispersed repeats pAp4 and pAp22 were exclusively characteristic for the
Procumbentes genomes. The set of the probes utilized in this study allowed to propose a
schematic pattern of repetitive DNA organization on the PRO1 and PAT2 minichromosomes.
According to the information delivered by comparative multi-color FISH, PRO1 has an
acrocentric minichromosome, where the pTS5 centromeric satellite block is bordered with the
pTS4.1 array only from one side. On the contrary, PAT2 possesses a metacentric or
submetacentric chromosome fragment with the centromeric pTS5 region flanked with pTS4.1
satellite arrays from both sides. Both minichromosomes lack visible pAp11 satellite arrays,
but include dispersed repeats pAp4 and pAp22. The PRO1 and PAT2 chromosomal fragments
are terminated by telomeric repeats preceded by the subtelomeric satellite pRp34 from both
ends.
Finally, to confirm the functional integrity of the fragment addition line centromeres, an
immunostaining experiment was performed, where the proteins specific to the active
kinetochore were localized on PRO1 metaphase preparation. It was possible to detect the
serine 10-phosphorylated histone H3 in pericentromeric regions of the PRO1 chromosomes.
The microtubuli attachment sites were also visualized as parts of kinetochore complexes.
138
Zusammenfassung
Die Aufklärung des genauen Aufbaus und der strukturellen Organisation von Genomen
höherer Pflanzen ist eines der grundlegenden Probleme der modernen Molekularbiologie.
Die Gattung Beta besteht aus 14 nah- und fernverwandten Arten, die zur Sektionen Beta,
Corollinae, Nanae und Procumbentes gehören. Sie stellt ein geeignetes System für
vergleichende Studien zur Zusammensetzung und Evolution des Nukleargenoms dar. Die
Zuckerrübe hat eine Genomgröße von 758 Mbp DNA mit etwa 63 % repetitiven Sequenzen.
Die Chromosomenzahl beträgt n=9 und die meiste Arten sind diploid. Die Wildrübe Beta
procumbens Chr. Sm. ist ein wichtiger natürlicher Pool für die Resistenz gegen Schädlinge
und die Toleranz von unvorteilhaften Wachstumsbedingungen. Einige ihrer repetitiven
Sequenzen (pTS3, pTS4.1, und pTS5) sind bereits bekannt und charakterisiert.
Das Thema dieser Forschungsarbeiten war die Isolation und Beschreibung neuer repetitiver
DNA-Familien von Genomen der Beta-Arten. Diese Arbeit stellt die molekulare
Untersuchung und cytogenetische Charakterisierung mit Multicolor-FISH von Satelliten und
dispersen repetitiven Sequenzen in Wild- und Kulturrübenarten und in ihren Hybriden dar.
Es wurde eine Vielzahl neuer repetitiver Sequenzen aus dem Genom der Wildrübe
B. procumbens isoliert. Entsprechend ihrer genomischen Organisation wurden die Repeats zur
Familie der Satelliten-DNA und den dispersen DNA-Sequenzen zugeordnet. Die AluI-
Restriktionssatelliten-Repeats pAp11 waren 229-246 bp lang. Monomere dieser Satelliten-
DNA sind 159-165 bp lang und bilden eine Subfamilie, welche durch die Divergenz oder
Methylierung einer internen AluI-Site gekennzeichnet sein könnte. Der Satellit ist in der
Procumbentes-Sektion amplifiziert, wurde aber auch in Arten der Sektion Beta einschließlich
der Kulturrübe (Beta vulgaris) gefunden. Der pAp11-Satellit ist wahrscheinlich ein alter
Bestandteil von Beta-Genomen, da er in entfernt verwandten Arten der Gattung vorkommt.
Darüber hinaus könnte er, basierend auf Sequenzanalysen, Southern-Hybridisierung und
vergleichender fluoreszent-in situ-Hybridisierung, Vorfahre der divergierten Satelliten-
Subfamilie pEV4 in B. vulgaris sein. Während pAp11 in B. procumbens sowohl an
centromerischen als auch an einigen interkalaren Orten gefunden wurde, bildete er in
B. vulgaris ausgeprägte interkalare Blöcke an jedem Chromosomarm. Mit Ausnahme einen
Ortes war er mit dem Satelliten pEV4 der Zuckerrübe kolokalisiert. Bei der chromosomalen
Lage von pAp11 gab es erhebliche Unterschiede in den Sektionen Procumbentes und Beta.
139
Dies deutete darauf hin, dass beide Satelliten höchstwahrscheinlich an der Ausdehnung bzw.
Umordnung des interkalaren Heterochromatins der Zuckerrübe beteiligt waren.
Die anderen beiden hier beschriebenen Sequenzfamilien sind die Repeats pAp4 und pAp22,
welche 1354 bzw. 582 bp lang sind. Ihre Organisation wurde auf molekularer, genomischer
und chromosomaler Ebene charakterisiert. Die zwei Repeats haben eine disperse
Genomorganisation und sind weit über die B. procumbens-Chromosomen verteilt. Sowohl die
Southern-Analyse als auch die FISH zeigten, dass pAp4 und pAp22 spezifisch für die Sektion
Procumbentes sind und als DNA-Sonden genutzt werden können um elterliche Genome
interspezifischer Hybriden zu unterscheiden. Die höhere auflösende FISH an meiotischen
Chromosomen zeigte, dass beide disperse Sequenzen in vielen chromosomalen Bereichen
kolokalisiert sind. Die Interspersion der Repeats wurde durch PCR untersucht und
ermöglichte die Bestimmung von Sequenzen, die pAp4 und pAp22 flankieren. Die Analyse
dieses Bereiches ergab, dass pAp22 entweder von einem Long Terminal Repeat (LTR) eines
Athila-ähnlichen env-Klasse-Retrotransposons stammt oder ein Teil davon ist. Dies ist die
erste Indikation für die Existenz von Retrovirus-ähnlichen DNA-Elementen in Beta.
Eine alte Familie subtelomerischer Satelliten-DNA wurde von repräsentativen Rübenarten
aller vier Sektionen der Gattung Beta und von Spinat – einer verwandten Chenopodiaceae –
isoliert. Um die Aufteilung und die Divergenz dieser Satellitenfamilie in der Gattung Beta zu
untersuchen, wurden von jeder der fünf Arten fünf Klone analysiert. Die genomische
Organisation und Artenaufteilung der Satelliten wurden mittels Sequenzierung und Southern-
Hybridisierung untersucht. Die wiederholenden Einheiten aller Familien sind 344-362 bp lang
und zeigen 46,2-98,8 % Ähnlichkeit. Jedes Monomer besteht aus den zwei Untereinheiten
SU1 und SU2, welche jeweils 165-184 bp lang sind. Die „maximum likelihood“- and
„neighbour joining“- Analyse der 25 subtelomerischen Satellitenmonomere und ihrer
Untereinheiten führte zu der Vermutung, dass die Duplikation, welche die Formation des 360-
bp-Satelliten verursacht, früh in der Phylogenie stattgefunden haben könnte. Es konnten zwei
Diversifikationsrichtungen detektiert werden: die erste ist die Einordnung der Satelliten in
zwei Gruppen, welche die Untereinheiten SU1 und SU2 repräsentieren; die zweite ist die
sektionsspezifische Gruppierung der Satelliten. Die vergleichende chromosomale Lage der
telomerischen Repeats, der subtelomerischen Satellitenfamilie pAv34 sowie der 18S-5,8S-
25S rDNA wurde durch Multicolor-FISH ermittelt. Jedes B. vulgaris-Chromosomenende
zeigte eine unikale physikalische Organisation der telomerischen Repeats und des
140
subtelomerischen Satellits pAv34 nach der Untersuchung mittels hochauflösender FISH an
gestreckten Chromatinfasern. Die geschätzte Länge des telomerischen Arrays variierte
zwischen 0,55 kb und 62,25 kb, die Länge des subtelomerischen Satelliten pAv34 war 5,0-
125,25 kb, und der Spacer zwischen den beider Sequenzen war 1,0-16,6 kb lang.
Die verschiedenen bisher isolierten Repeatklassen der Wildrüben aus der Sektion
Procumbentes wurden genutzt um die Minichromosomen der Zuckerrüben-
Fragmentadditionslinien PRO1 und PAT2 durch FISH zu charakterisieren. Es wurden
insgesamt acht repetitive Sonden, einschließlich vier Familien von Satellitensequenzen
(pTS4.1, pTS5, pRp34 and pAp11), zwei disperse Repeats (pAp4 and pAp22), die 18S-5.8S-
25S rDNA und das telomerische Repeat, verwendet. Unter den Satellitensonden waren
pTS4.1 und pTS5 Procumbentes-spezifische Sequenzen, die auf die centromerischen
Regionen beschränkt waren. Zwei andere Satelliten (pAp11 und pRp34), die ebenfalls von
B. procumbens stammen, kamen auch in anderen Sektionen der Gattung Beta und in S.
oleracea vor. Während pAp11 an Centromeren und interkalaren Orten gefunden wurde, hatte
pRp34 eine subtelomerische Position. Die beiden dispersen Repeats pAp4 und pAp22 waren
ausschließlich für die Procumbentes-Genome charakteristisch. Der Probensatz, der für diese
Untersuchung benutzt wurde, lässt es zu, eine schematische Darstellung der PRO1- und
PAT2-Minichromosomen aufzustellen. Laut der Information, die durch vergleichende
Multicolor-FISH erworben wurde, besitzt PRO1 ein akrozentrisches Minichromosom, auf
welchem sich ein pTS5-centromerischer Satellitenblock befindet, der nur von einer Seite mit
dem pTS4.1-Array umgebend ist. Andererseits, hat PAT2 ein metazentrisches oder
submetazentrisches chromosomales Fragment mit centromerischem pTS5-Block, das von
beiden Seiten mit pTS4.1-Satellitenarrays flankiert ist. Beide Minichromosomen weisen keine
sichtbaren pAp11-Satellitenarrays auf, aber umfassen die dispersen Repeats pAp4 und pAp22.
Die chromosomalen Fragmente von PRO1 und PAT2 sind mit dem subtelomerischen Satellit
pRp34 und telomerischen Repeat von beiden Seiten begrenzt.
Abschließend wurde, um die funktionale Integrität der Fragmentadditionslinien-Centromere
zu bestätigen, ein Experiment mit Immunfärbung durchgeführt, bei welchem die für aktive
Kinetochore spezifischen Proteine auf PRO1-Metaphasepräparaten lokalisiert wurden. Es war
somit möglich das Serin-10-phosphorylierte Histon H3 in pericentromerischen Regionen des
PRO1-Chromosoms nachzuweisen. Die Mikrotubuli-Bindungsorte wurden ebenfalls als Teile
der Kinetochor-Komplexe visualisiert.
141
Обобщение
Исследование композиции и структурной организации генома высшиx растений
янвляется фундаментальной задачей современной молекулярной биологии. Род Beta
включающий в себя 14 видов подразделяется на отделы Beta, Corollinae, Nanae и
Procumbentes представляет собой удобный объект для сравяительного исследования
композиции и эволюции ядерного генома. Размер генома сахарной свеклы 758 Мбп,
приблизительно 63 % которого составляют повторные последовательяости ДНК.
Xромосомный набор составляет n=9 и большинство представителей рода диплоидны.
Дикий вид Beta procumbens Chr. Sm представляет собой важный естественный ресурс
устойчивости к вредителям и неблагоприятным условиям среды. Часть его
повторяющиxся последовательностей, а именно pTS3, pTS4.1 и pTS5, уже известны и
оxарактеризованы.
Предметом данной работы было открытие и исследование новыx семейств
повторяющиxся последовательностей ДНК данного вида свеклы. Работа описывает
молекулярно-цитогенетическое исследование, включая полиxромяую флуоресцентную
in situ гибридизацию (FISH) с высоким разрешением, сателлитныx и дисперсныx
повторяющиxся последовательностей в дикиx и культурныx видаx свеклы и иx
гибридаx.
Ряд новых повторяющиxся последовательностей был изолирован из генома дикой
свеклы B. procumbens. Согласно с типом геномной организации, повторы были
отнесены к семействам сателлитной ДНК или к дисперсным последовательностям.
Рестрикционные сателлиты AluI длиной 229-246 бп были названы pAp11. Мономеры
этих сателлитов длиной 159-165 бп образуют подсемейства распознаваемые по
дивергенции или метилированию внутреннего сайта AluI. Сателлит амплифицирован в
отделе Procumbentes, но также присутствует в видах отдела Beta, включая культурную
свеклу (Beta vulgaris). Сателлит pAp11 вероятно представляет собой древний
компонент геномов видов Beta, поскольку он присутствует в неблизкородственных
видах рода. Более того, судя по результатам анализа структуры ДНК, Саузерн-
гибридизации и сравнительной флуоресцентной in situ гибридизации, он может
являться предком дивергентного подсемейства сателлитов pEV4 из B. vulgaris. pAp11
занимает центромерные и часть интеркалярных сайтов на хромосомах B. procumbens,
142
однако на хромосомах B. vulgaris он формирует интеркалярные блоки различного
размера на каждом плече. Он колокализован с сателлитом pEV4 на всех этих сайтах за
исключением одного. Таким образом, заметная разница в хромосомной позиции pAp11
между видами Procumbentes и Beta указывает на то, что оба эти сателлита скорее всего
принимали участие в расширении и реструктуризации интеркалярного
гетерохроматина сахарной свеклы.
Еще два семейства ДНК, описанные в данной работе, представляют собой
неродственные дисперсные повторы pAp4 и pAp22, 1354 и 582 бп длиной. Они были
изучены на молекулярном, геномном и хромосомном уровнях организации. Оба
повтора характеризуются дисперсной организацией в геноме и широко разбросаны
вдоль хромосом B. procumbens с местной кластеризацией и исключением из
дистального эухроматина. Саузерн-гибридизация и FISH продемонстрировали, что
pAp4 и pAp22 специфичны для отдела Procumbentes и поэтому могут использоваться
как ДНК-пробы для распознавания родительских геномов в межвидовых гибридах.
FISH с высоким разрешением на хромосомах в мейозе продемонстрировал, что оба
дисперсных повтора большей частью колокализованы. Интерсперсия pAp4 и pAp22
была изучена с помощью ПЦР, которая выявила последовательности ДНК,
окружающие данные повторы. Дальнейший анализ показал, что pAp22 происходит,
либо является частью длинного терминального повтора (LTR) ретротранспозона типа
Athila класса env. Это - первое указание на присутствие ретровирус-подобной ДНК в
геноме Beta.
Древнее семейство субтеломерной сателлитной ДНК pAv34 было обнаружено в
геномах представителей всех четырех отделов рода Beta, а также в родственном виде
Chenopodiaceae – шпинате. С целью изучения распределения и дивергенции этого
семейства последовательностей ДНК в роде Beta были проанализированы по пять
клонов из каждого из пяти видов растений. Организация в геномах и распределение в
видах были изучены путем секвенирования и Саузерн-гибридизации. Мономеры
сателлитов длиной 344-362 бп идентичны на 46.2-98.8 % и состоят из двух субъединиц,
SU1 и SU2, 165-184 бп длиной. Анализ 25 сателлитов и их субъединиц по методам
«мaximum likelihood» и «neighbor joining» позволил предположить, что дупликация,
приведшая к возникновению мономера длиной 360 бп, должна была произойти на
ранних этапах видообразования. Были обнаружены два направления диверсификации
последовательностей ДНК: первое - гомогенизация сателлитов в группы субъединиц
143
SU1 и SU2; и второе - организация сателлитов в видоспецифичные группы.
Сравнительная хромосомная локализация теломерной ДНК, субтеломерного сателлита
pAv34 и 18S-5.8S-25S рДНК была исследована с помощью полихромной FISH. Каждая
хромосома B. vulgaris обладает уникальной взаимной организацией теломерной ДНК и
субтеломерного сателлита pAv34, что было показано на растянутых нитях хроматина с
помощью FISH с высоким разрешением. Длина теломеры оценивается в 0,55-62,65 кб,
длина субтеломерного сателлита pAv34 в 5,0-125,25 кб, а промежуток между ними в
1,0-16,6 кб.
Различные классы повторов ДНК, обнаруженные в геномах диких свекол отдела
Procumbentes, были использованы для описания с помощью FISH минихромосом
гибридных линий PRO1 и PAT2. Пробы включали в себя четыре семейства сателлитов
(pTS4.1, pTS5, pRp34 и pAp11), два дисперсных повтора (pAp4 и pAp22), 18S-5.8S-25S
рДНК и теломерную ДНК. Среди сателлитов, pTS4.1 и pTS5 были специфичны для
центромер хромосом видов Procumbentes. Другие два сателлита, pAp11 и pRp34 из
B. procumbens, также присутствуют в отделе Beta и в S. oleracea. pAp11 находится в
центромерных и интеркалярных регионах, а pRp34 занимает субтеломерное положение.
Оба дисперсных повтора pAp4 и pAp22 находятся исключительно в геномах
Procumbentes. Набор проб использованных в данном исследовании позволил
выработать модель физической организации повторной ДНК на минихромосомах PRO1
и PAT2. Выяснилось, что PRO1 обладает акроцентрическим хромосомным фрагментом,
в противоположность PAT2 с метацентрической или субметацентрической
минихромосомой. Ценромеры обеих минихромосом обогащены сателлитами pTS5 и
pTS4.1, однако сателлит pAp11 выявлен не был. Дисперсные повторы pAp4 и pAp22
находятся на обеих минихромосомах. Хромосомные фрагменты PRO1 и PAT2
оканчиваются сателлитным блоком pRp34 и теломерной ДНК.
Наконец, функциональная целостность центромеры хромосомного фрагмента была
подтверждена с помощью флуоресцентной иммунолокализации белков специфичных
для активного кинетохора. Удалось обнаружить гистон Н3 фосфорилированный по
серину 10 в перицентромерных регионах хромосом PRO1. В составе кинетохорного
комплекса были также найдены сайты прикрепления микротрубочек.
144
7. References Adams SP, Hartman TP, Lim KY, Chase MW, Bennett MD, Leitch IJ, Leitch AR (2001) Loss
and recovery of Arabidopsis-type telomere repeat sequences 5'-(TTTAGGG)(n)-3' in
the evolution of a major radiation of flowering plants. Proc R. Soc Lond B Biol Sci
268: 1541–1546.
Aledo R, Raz R, Monfort A, Vicient CM, Puigdomenech P, Martinez-Izquierdo JA (1995)
Chromosome localization and characterization of a family of long interspersed
repetitive DNA elements from the genus Zea. Theor Appl Genet 90: 1094-1100.
Alexandrov IA, Mitkevich SP, Yurov YB. (1988) The phylogeny of human chromosome
specific alpha satellites. Chromosoma 96: 443-453.
Alkhimova AG, Heslop-Harrison JS, Shchapova AI, Vershinin AV (1999) Rye chromosome
variability in wheat–rye addition and substitution lines. Chromosome Res 7: 205–212.
Alkhimova OG, Mazurok NA, Potapova TA, Zakian SM, Heslop-Harrison JS, Vershinin AV
(2004) Diverse patterns of the tandem repeats organization in rye chromosomes.
Chromosoma 113: 42-52.
Anamthawat-Jonsson K, Bodvarsdottir SK (2001) Genomic and genetic relationships among
species of Leymus (Poaceae: Triticeae) inferred from 18S-26S ribosomal genes. Am J
Bot 88: 553-559.
Ansari HA, Ellison NW, Griffiths AG, Williams WM (2004) A lineage-specific centromeric
satellite sequence in the genus Trifolium. Chromosome Res 12: 357–367.
Arabidopsis Genome Initiative (2000) Analysis of the genome sequence of the flowering
plant Arabidopsis thaliana. Nature 408: 796-815.
Arumuganathan K, Earle ED (1991) Nuclear DNA content of some important plant species.
Plant Mol Biol Rep 9: 208-218.
Barciszewska M, Barciszewski J (1988) Yellow lupin cytoplasmic tRNAGlu is not a cofactor
in chlorophyll biosynthesis. Mol Biol Rep 13: 11-14.
Barker RF, Harberd NP, Jarvis MG, Flavell RB (1988) Structure and evolution of the
intergenic region in a ribosomal DNA repeat unit of wheat. J Mol Biol 201: 1-17.
Barnes SR, James AM, Jameson G (1985) The organization, nucleotide sequence and
chromosomal distribution of a satellite DNA from Allium cepa. Chromosoma 92: 185-
192.
145
Barocka KH (1985) Zucker- und Futterrüben. In: Hoffmann W, Mudra A, Plarre W, eds
Lehrbuch der Züchtung landwirtschaftlicher Kulturpflanzen. Verlag Paul Parey, pp
245-287.
Barthes L, Ricroch A (2001) Interspecific chromosomal rearrangements in monosomic
addition lines of Allium. Genome 44: 929-935.
Baskin TI, Cande WZ (1990) The structure and function of the mitotic spindle in flowering
plants. Annu. Rev. Plant Physiol. Plant Mol Biol 41: 277-315.
Basu J, Stromberg G, Compitello G, Willard HF, Van Bokkelen G (2005) Rapid creation of
BAC-based human artificial chromosome vectors by transposition with synthetic
alpha-satellite arrays. Nucleic Acids Res 33: 587-596.
Bedbrook JR, Jones J, O'Dell M, Thompson RD, Flavell RB (1980) A molecular description
of telometic heterochromatin in secale species. Cell 19: 545-560.
Belyayev A, Raskina O, Nevo E. (2005) Variability of the chromosomal distribution of Ty3-
gypsy retrotransposons in the populations of two wild Triticeae species. Cytogenet
Genome Res 109: 43-49.
Bennett MD (1972) Nuclear DNA content and minimum generation time in herbaceous
plants. Proc R. Soc Lond B Biol Sci 181: 109-135.
Bennett MD, Leitch IJ, Price HJ, Johnston JS (2003) Comparisons with Caenorhabditis (~100
Mb) and Drosophila (~ 175 Mb) using flow cytometry show genome size in
Arabidopsis to be ~157 Mb and thus ~25 % larger than the Arabidopsis Genome
Initiative estimate of ~125 MB. Ann Bot 91: 547-557.
Bennetzen JL, Schrick K, Springer PS, Brown WE, SanMiguel P (1994) Active maize genes
are unmodified and flanked by diverse classes of modified, highly repetitive DNA.
Genome 37: 565-576.
Bennetzen JL (2000) Transposable element contributions to plant gene and genome evolution.
Plant Mol Biol 42:251-269.
Bennetzen JL, Devos K (2002) Plant synteny, colinearity and genome evolution. In:
Encyclopedia of life sciences, Nature Publishing Group.
Bennetzen JL, Freeling M (1997) The unified grass genome: Synergy in synteny. Genome Res
7: 301-306.
Bennetzen JL, Schrick K, Springer PS, Brown WE, SanMiguel P (1994) Active maize genes
are unmodified and flanked by diverse classes of modified, highly repetitive DNA.
Genome 37: 565-576.
146
Bennetzen J, Ma J, Devos KM (2005) Mechanisms of recent genome size variation in
flowering plants. Ann Bot 95: 127-132.
Blower MD, Sullivan BA, Karpen GH (2002) Conserved organization of centromeric
chromatin in flies and humans. Dev Cell 2: 319-330.
Bosemark NO; Bormotov VE (1971). Chromosome morphology in a homozygous line of
sugar beet. Hereditas 69: 205-212.
Brandes A (1992) Erstellung und Charakterisierung von nematodenresistenten Additions- und
Translokationslinien bei B. vulgaris L. PhD Thesis. University of Hannover,
Hannover.
Brandes A, Jung C, Wricke G (1987) Nematode resistance derived from wild beet and its
meiotic stability in sugar beet. Plant Breeding 99: 56-64.
Brandes A, Tompson H, Dean C, Heslop-Harrison JS (1997) Multiple repetitive DNA
sequences in the paracentromeric regions of Arabidopsis thaliana L. Chromosome Res
5: 238-246.
Broun P, Ganal MW, Tanksley SD (1992) Telomeric arrays display high levels of heritable
polymorphism among closely related plant varieties. Proc Natl Acad Sci U S A 89:
1354-1357.
Bureau TE, White SE, Wessler SR (1994) Transduction of a cellular gene by a plant
retroelement. Cell 77: 479-480.
Bureau TE, Ronald PC, Wessler SR (1996) A computer-based systematic survey reveals the
predominance of small inverted-repeat elements in wild-type rice genes. Proc Natl
Acad Sci U S A 93: 8524-8529.
Cai D, Kleine M, Kifle S et al. (1997) Positional cloning of a gene for nematode resistance in
sugar beet. Science 275: 832-834.
Chandler VL, Brendel V (2002) The Maize Genome Sequencing Project. Plant Physiol 130:
1594-1597.
Charlesworth B, Sniegowski P, Stephan W (1994) The evolutionary dynamics of repetitive
DNA in eukaryotes. Nature 371: 215-220.
Chavanne F, Zhang DX, Liaud MF, Cerff R (1998) Structure and evolution of Cyclops: a
novel giant retrotransposon of the Ty3/gypsy family highly amplified in pea and other
legume species. Plant Mol Biol 37: 363-375.
Cheng Z, Buell CR, Wing RA, Jiang J (2002) Resolution of fluorescence in-situ hybridization
mapping on rice mitotic prometaphase chromosomes, meiotic pachytene chromosomes
and extended DNA fibers. Chromosome Res 10: 379-387.
147
Choo KH (2001) Domain organization at the centromere and neocentromere. Dev Cell 1: 165-
177.
Clarke, L. 1990. Centromeres of budding and fission yeast. Trends Genet 6: 150-154.
Clarke L, Baum MP (1990) Functional analysis of a centromere from fission yeast: a role for
centromere-specific repeated DNA sequences. Mol Cell Biol 10: 1863-72.
Cleveland DW, Mao Y, Sullivan KF (2003) Centromeres and kinetochores: From epigenetics
to mitotic checkpoint signaling. Cell 112: 407–421.
Cogoni C, Macino G (2000) Post-transcriptional gene silencing across kingdoms. Current
Opinion in Genetics and Development 10: 638-643.
Contento A, Heslop-Harrison JS, Schwarzacher T (2005) Diversity of a major repetitive DNA
sequence in diploid and polyploid Triticeae. Cytogenet Genome Res 109: 34-42.
Coons GH (1954) The wild species of Beta. Proc. Am. Soc. Sugar Beet Technol 8: 142-147.
Copenhaver GP, Nickel K, Kuromori T et al. (1999) Genetic definition and sequence analysis
of Arabidopsis centromeres. Science 286: 2468-2474.
Cushman JC, Bohnert HJ (2000) Genomic approaches to plant stress tolerance. Curr Opin
Plant Biol 3: 117-124.
Cuzzoni E, Ferretti L, Giordani C, Castiglione S, Sala F (1990) A repeated chromosomal
DNA sequence is amplified as a circular extrachromosomal molecule in rice (Oryza
sativa L.). Mol Gen Genet 222: 58-64.
Chen ZJ, Pikaard CS. (1997) Transcriptional analysis of nucleolar dominance in polyploid
plants: biased expression/silencing of progenitor rRNA genes is developmentally
regulated in Brassica. Proc Natl Acad Sci U S A 94: 3442-3447.
Dawe RK, Reed LM, Yu HG, Muszynski MG, Hiatt EN (1999) A maize homolog of
mammalian CENPC is a constitutive component of the inner kinetochore. Plant Cell
11: 1227-1238.
Dawe RK, Hiatt EN (2004) Plant neocentromeres: fast, focused, and driven. Chromosome Res
12: 655-669.
de Bock ThSM (1986) The genus Beta: domestication, taxonomy and interspecific
hybridization for plant breeding. In: ISHS Acta Horticulturae 182. I International
Symposium on Taxonomy of Cultivated Plants. Wageningen, the Netherlands.
Dechyeva D, Gindullis F, Schmidt T (2003) Divergence of satellite DNA and interspersion of
dispersed repeats in the genome of the wild beet Beta procumbens. Chromosome Res
11: 3-21.
148
De Jong H, de Bock TSM (1978) Use of haploids of Beta vulgaris L. for the study of orcein-
and Giemsa-stained chromosomes. Euphytica 27: 41-47.
De Jong H, Blohm GH (1981) The pachytene chromosomes of Beta procumbens Chr. Sm. In:
Investigation into chromsome morphology of sugar beet and related wild species.
Academisch Proefschrift: Genetica van de Universiteit van Amsterdamm, 33-39.
De Jong H, Speckmann GJ, De Bock ThSM, Van Voorst A (1986). Alien chromosome
fragments conditioning resistance to beet cyst nematode in diploid descendants from
monosomic additions of Beta procumbens to B. vulgaris. Can J Genet Cytol 28: 439-
443.
De Jong H, Fransz P, Zabel P (1999) High resolution FISH in plants: techniques and
applications. Trends in Plant Science 4: 258-263.
De la Herrán R, Cuñado N, Navajas-Perrez R, Santos JL, Ruiz Rejón M, Garrido-Ramos MA,
Ruiz Rejón C (2005) The controversial telomeres of lily plants. Cytogenet Genome
Res 109: 144-147.
De Neve M, De Buck S, De Wilde C, Van Houdt H, Strobbe I, Jacobs A, Van Montagu,
Depicker A. (1999) Gene silencing results in instability of antibody production in
transgenic plants. Mol Gen Genet 260: 582-592.
Desel C (2002) Chromosomale Lokalisierung von repetitiven und unikalen DNA-Sequenzen
durch Fluoreszenz-in situ-Hybridisierung in der Genomanalyse bei Beta-Arten. PhD
Thesis. Christian-Albrechts University, Kiel.
Desel C, Jansen R, Dedong G, Schmidt T (2002) Painting of parental chromatin in Beta
hybrids by multi-colour fluorescent in situ hybridization. Ann Bot 89: 171-81.
Desel C, Jung C, Cai D, Kleine M, Schmidt T (2001) High resolution mapping of YACs and
single-copy gene Hs1pro-1 on Beta vulgaris chromosomes by multi-colour fluorescence
in situ hybridization. Plant Mol Biol 45: 113-122.
Devos KM, Gale MD (2000) Genome relationships: the grass model in current research. Plant
Cell 12: 636-646.
Dong F, Miller JT, Jackson SA, Wang GL, Ronald PC, Jiang J (1998) Rice (Oryza sativa)
centromeric regions consist of complex DNA. Proc Natl Acad Sci 95: 8135-8140.
Dover GA, Tautz D (1986) Conservation and divergence in multigene families: alternatives to
selection and drift. Philos Trans R Soc Lond B Biol Sci 312: 275-289.
149
Druka A, Kudrna D, Kannangara CG, von Wettstein D, Kleinhofs A (2002) Physical and
genetic mapping of barley (Hordeum vulgare) germin-like cDNAs. Proc Natl Acad
Sci U S A 99: 850-855.
Dubrovnaia OV, Tiscchenko EN (2003) Genomic variability of sugar beet morphogenic and
non-morphogenic callus. Tsitol Genet. 37: 23-30.
Dunford RP, Kurata N, Laurie DA, Money TA, Minobe Y, Moore G (1995) Conservation of
fine-scale DNA marker order in the genomes of rice and the Triticeae. Nucl Acids
Res.23: 2724-2728.
Dvorak J, Jue D, Lassner M (1987) Homogenization of tandemly repeated nucleotide
sequences by distance-dependent nucleotide sequence conversion. Genetics 116: 487-
498.
Fajkus J, Kovarik A, Kralovics R, Bezdek M (1995) Organization of telomeric and
subtelomeric chromatin in the higher plant Nicotiana tabacum. Mol Gen Genet 247:
633–638.
Fajkus J, Sykorova E, Leitch AR. (2005) Telomeres in evolution and evolution of telomeres.
Chromosome Res 13: 469-479.
Fang X, Gu S, Xu Z, Chen F, Guo D, Zhang HB, Wu N (2004) Construction of a binary BAC
library for an apomictic monosomic addition line of Beta corolliflora in sugar beet and
identification of the clones derived from the alien chromosome. Theor Appl Genet
108: 1420-1425.
Fire A (1999) RNA-triggered gene silencing. Trends in Genetics 15: 358-363.
Fischer HE (1989) Origin of the `Weisse Schlesische Rübe` (white Silesian beet) and
resynthesis of sugar beet. Euphytica 41: 75-80.
Fischer TC, Groner S, Zentgraf U, Hemleben V (1994) Evidence for nucleosomal phasing and
a novel protein specifically binding to cucumber satellite DNA. Z Naturforsch 49: 79-
86.
Fitzgerald MS, McKnight TD, Shippen DE. (1996) Characterization and developmental
patterns of telomerase expression in plants. Proc Natl Acad Sci U S A 93: 14422-
14427.
Flavell RB (1986) Repetitive DNA and chromosome evolution in plants. Philos Trans R Soc
Lond B Biol Sci 312: 227-242.
Flavell RB, Bennett MD, Smith JB, Smith DB (1974) Genome size and the proportion of
repeated nucleotide sequence DNA in plants. Biochem Genet 12: 257 269.
150
Flavell RB, Moore G (1996) Plant genome constituents and their organisation. In: Foster GD,
Twell D eds Plant Gene Isolation: Principles and Practice. John Wiley & Sons Ltd.
Florijn RJ, Bonden LA, Vrolijk H et al. (1995) High-resolution DNA fiber FISH for genomic
DNA mapping and colour bar-coding of large genes. Hum Mol Genet 4: 831-836.
Florijn RJ, van de Rijke FM, Vrolijk H et al. (1996) Exon mapping by fiber FISH or LR-
PCR. Genomics 38: 277-282.
Fransz PF, Alonso-Blanco C, Liharska T, Peeters AJM, Zabel P, De Jong JH (1996) High
resolution physical mapping in Arabidopsis thaliana and tomato by fluorescence in
situ hybridisation to extended DNA fibres. Plant J 9: 421-430.
Frediani M, Gelati MT, Maggini F et al. (1999) A family of dispersed repeats in the genome
of Vicia faba: structure, chromosomal organization, redundancy modulation, and
evolution. Chromosoma 108: 317-324.
Frenster J, Allfrey VG, Mirsky AE (1963) Repressed and active chromatin isolated from
interphase lymphocytes. Proc Natl Acad Sci U S A 50: 1026-1032.
Friesen N, Brandes A, Heslop-Harrison JS (2001) Diversity, origin, and distribution of
retrotransposons (gypsy and copia) in conifers. Mol Biol Evol 18: 1176-1188.
Fuchs J, Brandes A, Schubert I (1995) Telomere sequence localization and karyotype
evolution in higher plants. Plant Systematics and Evolution 196: 227–241.
Fukui KN, Suzuki G, Lagudah ES et al. (2001) Physical arrangement of retrotransposon-
related repeats in centromeric regions of wheat. Plant Cell Physiol 42: 189-196.
Galasso I, Blanco A, Katsiotis A, Pignone D, Heslop-Harrison JS (1997) Genomic
organization and phylogenetic relationships in the genus Dasypyrum analysed by
Southern and in situ hybridization of total genomic and cloned DNA probes.
Chromosoma 106: 53-61.
Galasso I, Schmidt T, Pignone D (2001) Identification of Lens culinaris ssp. culinaris
chromosomes by physical mapping of repetitive DNA sequences. Chromosome Res 9:
199-209.
Gale MD, Devos KM (1998) Comparative genetics in the grasses. Proc Natl Acad Sci U S A
95: 1971-1974.
Ganal M, Hemleben V (1986) Different AT-rich satellite DNAs in Cucurbita pepo and
Cucurbita maxima. Theor Appl Gen 73: 129-135.
151
Ganal MW, Lapitan NL, Tanksley SD (1991) Macrostructure of the tomato telomeres. Plant
Cell 3: 87-94.
Gao D, Schmidt T, Jung C (2000) Molecular characterization and chromosomal distribution
of species-specific repetitive DNA sequences from Beta corolliflora, a wild relative of
sugar beet. Genome 43: 1073-1080.
Gao D, Guo D, Jung C (2001) Monosomic addition lines of Beta corolliflora Zoss in sugar
beet: cytological and molecular-marker analysis. Theor Appl Genet 103: 240-247.
Gerlach WL, Bedbrook JR (1979) Cloning and characterization of ribosomal RNA genes
from wheat and barley. Nuc Acids Res 7: 1869-1885.
Gindullis F, Dechyeva D, Schmidt T (2001a) Construction and characterization of a BAC
library for the molecular dissection of a single wild beet centromere and sugar beet
(Beta vulgaris) genome analysis. Genome 44: 846-855.
Gindullis F, Desel C, Galasso I, Schmidt T (2001b) The large-scale organization of the
centromeric DNA in Beta species. Genome Res 11: 253-265.
Goff SA, Ricke D, Lan TH et al. (2002) A draft sequence of the rice genome (Oryza sativa L.
ssp. japonica). Science 296: 92-100.
Grebenstein B, Grebenstein O, Sauer W, Hemleben V (1996) Distribution and complex
organization of satellite DNA sequences in Aveneae species. Genome 39: 1045-1050.
Grellet F, Delcasso D, Panabieres F, Delseny M. (1986) Organization and evolution of a
higher plant alphoid-like satellite DNA sequence. J Mol Biol 187: 495-507.
Grotkopp E, Rejmanek M, Sanderson MJ, Rost TL (2004) Evolution of genome size in pines
(Pinus) and its life-history correlates: supertree analysis. Evolution 58: 1705-1729.
Hall SE, Kettler G, Preuss D (2003) Centromere satellites from Arabidopsis populations:
maintenance of conserved and variable domains. Genome Res 13: 195-205.
Hamilton A, Voinnet O, Chappell L, Baulcombe D (2002) Two classes of short interfering
RNA in RNA silencing. EMBO Journal 21: 4671-4679.
Harrison GE, Heslop-Harrison JS (1995) Centromeric repetitive DNA sequences in the genus
Brassica. Theor Appl Genet 90: 157-165.
Hasegawa M, Kishino H, Yano K (1985) Dating of the human-ape splitting by a molecular
clock of mitochondrial DNA. J Mol Evol 22: 160–174.
Hemleben V, Grierson D, Dertmann H (1977) The use of equilibrium centrifugation in
actinomycin-caesium chloride for the purification of ribosomal DNA. Plant Sci Lett 9:
129-135.
152
Hemleben V, Leweke B, Roth A, Stadler J (1982) Organization of highly repetitive satellite
DNA of two Cucurbitaceae species (Cucumis melo and Cucumis sativus). Nucleic
Acids Res. 10: 631-644.
Hemleben V, Kovarik A, Torres-Ruiz RA, Volkov R, Beridze T (in press) Plant highly
repeated satellite DNA: distribution, molecular evolution and use for identification of
hybrids.
Herwig R, Schulz B, Weisshaar B et al. (2002) Construction of a 'unigene' cDNA clone set by
oligonucleotide fingerprinting allows access to 25 000 potential sugar beet genes.
Plant J 32: 845-857.
Heslop-Harrison JS, Schwarzacher T, Anamthawat-Jonsson K, Leitch AR, Shi M, Leitch IJ
(1991) In-situ hybridization with automated chromosome denaturation. Technique 3:
109-116.
Heslop-Harrison JS (1996) Comparative analysis of plant genome architecture. Symp Soc Exp
Biol 50: 17-23.
Heslop-Harrison JS, Brandes A, Taketa S et al. (1997) The chromosomal distributions of
Ty1-copia group retrotransposable elements in higher plants and their implications for
genome evolution. Genetica 100: 197-204.
Heslop-Harrison JS, Murata M, Ogura Y, Schwarzacher T, Motoyoshi F (1999)
Polymorphisms and genomic organization of repetitive DNA from centromeric
regions of Arabidopsis chromosomes. Plant Cell 11: 31-42.
Heslop-Harrison JS (2000) Comparative genome organization in plants: from sequence and
markers to chromatin and chromosomes. Plant Cell 12: 617-635.
Heslop-Harrison JS, Brandes A, Schwarzacher T (2003) Tandemly repeated DNA sequences
and centromeric chromosomal regions of Arabidopsis species. Chromosome Res 11:
241-253.
Hizume M, Shibata F, Matsusaki Y, Garajova Z. (2002) Chromosome identification and
comparative karyotypic analyses of four Pinus species. Theor Appl Genet 105: 491-
497.
Horakova M, Fajkus J (2000) TAS49--a dispersed repetitive sequence isolated from
subtelomeric regions of Nicotiana tomentosiformis chromosomes. Genome 43: 273-
284.
Houben A, Wako T, Furushima-Shimogawara R, Presting G, Kunzel G, Schubert I I, Fukui K
(1999) Short communication: the cell cycle dependent phosphorylation of histone H3
153
is correlated with the condensation of plant mitotic chromosomes. Plant J 18: 675-
679.
Houben A, Demidov D, Gernand D, Meister A, Leach CR, Schubert I (2003) Methylation of
histone H3 in euchromatin of plant chromosomes depends on basic nuclear DNA
content. Plant J 33: 967-973.
Houben A, Schubert I (2003) DNA and proteins of plant centromeres. Curr Opin Plant Biol 6:
554-560.
Hudakova S, Michalek W, Presting GG et al. (2001) Sequence organization of barley
centromeres. Nucleic Acids Res 29: 5029-5035.
Hueros G, Loarce Y, Ferrer E (1993) A structural and evolutionary analysis of a dispersed
repetitive sequence. Plant Mol Biol 22: 635-643.
Ingham LD, Hanna WW, Baier JW, Hannah LC. (1993) Origin of the main class of repetitive
DNA within selected Pennisetum species. Mol Gen Genet. 238: 350-356.
Jacobs G, Dechyeva D, Schmidt T (in prep.) Construction and characterization of a PAT2
BAC library.
Jansen R (1999) Molakulare und zytologische Analyse von repetitiven DNA-Sequencen der
Sektion Corollinae der Gattung Beta. Masterthesis, CAU Kiel.
Jiang J, Gill BS, Wang GL, Ronald PC, Ward DC (1995) Metaphase and interphase
fluorescence in situ hybridization mapping of the rice genome with bacterial artificial
chromosomes. Proc Natl Acad Sci U S A 92: 4487-4491.
Jiang J, Birchler JA, Parrott WA, Dawe RK (2003) A molecular view of plant centromeres.
Trends Plant Sci 8: 570-578.
Jiang N, Jordan IK, Wessler SR. (2002) Dasheng and RIRE2. A nonautonomous long
terminal repeat element and its putative autonomous partner in the rice genome. Plant
Physiol 130: 1697-1705.
Jin W, Melo JR, Nagaki K, Talbert PB, Henikoff S, Dawe RK, Jiang J. (2004) Maize
centromeres: organization and functional adaptation in the genetic background of oat.
Plant Cell 16: 571–581.
Jin YK, Bennetzen JL (1994) Integration and nonrandom mutation of a plasma membrane
proton ATPase gene fragment within the Bs1 retroelement of maize. Plant Cell 6:
1177-1186.
Jin W, Lamb JC, Vega JM, Dawe RK, Birchler JA, Jiang J. (2005) Molecular and functional
dissection of the maize B chromosome centromere. Plant Cell 17: 1412-1423.
154
John HA, Birnstiel ML, Jones KW (1969) RNA-DNA hybrids at the cytological level. Nature
223: 582-587.
Joly S, Rauscher JT, Sherman-Broyles SL, Brown AH, Doyle JJ. (2004) Evolutionary
dynamics and preferential expression of homeologous 18S-5.8S-26S nuclear
ribosomal genes in natural and artificial glycine allopolyploids. Mol Biol Evol 21:
1409-1421.
Jung C, Wricke G (1987) Selection of diploid nematode-resistant sugar beets from addition
lines. Plant Breeding 98: 205-214.
Ingham LD, Hanna WW, Baier JW, Hannah LC (1993) Origin of the main class of repetitive
DNA within selected Pennisetum species. Mol Gen Genet 238: 350-356.
Kalendar R, Vicient CM, Peleg O, Anamthawat-Jonsson K, Bolshoy A, Schulman AH. (2004)
Large retrotransposon derivatives: abundant, conserved but nonautonomous
retroelements of barley and related genomes. Genetics 166: 1437-1450.
Kamm A, Schmidt T, Heslop-Harrison JS (1994) Molecular and physical organization of
highly repetitive, undermethylated DNA from Pennisetum glaucum. Mol Gen Genet
244: 420-425.
Kamm A, Galasso I, Schmidt T, Heslop-Harrison JS (1995) Analysis of a repetitive DNA
family from Arabidopsis arenosa and relationships between Arabidopsis species.
Plant Mol Biol 27: 853-862.
Kapila R, Negi MS, This P, Delseny M, Srivastava PS, Lakshmikumaran M (1996) A new
family of dispersed repeats from Brassica nigra: characterization and localization.
Theor Appl Genet 93: 1123-1129.
Kaszas E, Cande WZ (2000) Phosphorylation of histone H3 is correlated with changes in the
maintenance of sister chromatid cohesion during meiosis in maize, rather than the
condensation of the chromatin. J Cell Sci 113: 3217-3226.
Katsiotis A, Schmidt T, Heslop-Harrison JS (1995) Sequences of Ty1-copia-like
retrotransposon elements in genus Avena. Chromosome Res 3: 52-53.
Kazama Y, Sugiyama R, Matsunaga S et al. (2003) Organization of the KpnI family of
chromosomal distal-end satellite DNAs in Silene latifolia. J Plant Res 116: 317-326.
Kiefer-Meyer MC, Reddy AS, Delseny M (1995) Characterization of a dispersed repetitive
DNA sequence associated with the CCDD genome of wild rice. Genome 38: 681-688.
Kiefer-Meyer MC, Reddy AS, Delseny M (1996) Complex arrangement of dispersed repeated
DNA sequences in Oryza officinalis. Genome 39: 183-190.
155
Kikuchi S, Sato K, Nagata T et al. (2003) Collection, mapping, and annotation of over 28,000
cDNA clones from japonica rice. Science 301: 376-379.
Kilian A, Stiff C, Kleinhofs A (1995) Barley telomeres shorten during differentiation but
grow in callus culture. Proc Nat Acady Sci USA 92: 9555–9559.
Klein PE, Klein RR, Cartinhour SW et al. (2000) A high-throughput AFLP-based method for
constructing integrated genetic and physical maps: progress toward a sorghum genome
map. Genome Res 10: 789-807.
Koornneef M, Fransz P, de Jong H (2003) Cytogenetic tools for Arabidopsis thaliana.
Chromosome Res 11: 183-194.
Kovarik A, Koukalova B, Lim KY et al. (2000) Comparative analysis of DNA methylation in
tobacco heterochromatic sequences. Chromosome Res 8: 527-541.
Kubis S, Heslop-Harrison JS, Schmidt T (1997) A family of differentially amplified repetitive
DNA sequences in the genus Beta reveals genetic variation in Beta vulgaris
subspecies and cultivars. J Mol Evol 44: 310-320.
Kubis S, Heslop-Harrison JS, Schmidt T (1998) Repetitive DNA elements as a major
components of plant genomes. Ann Bot 82: 45-55.
Kumar A, Bennetzen J (1999) Plant retrotransposons. Annu Rev Genet 33: 479-532.
Kumar A, Bennetzen J (2000) Retrotransposons: central players in structure, evolution and
function of plant genomes. Trends Plant Sci 5: 509-510.
Kumekawa N, Hosouchi T, Tsuruoka H, Kotani H. (2000) The size and sequence organization
of the centromeric region of Arabidopsis thaliana chromosome 5. DNA Res 31: 315-
321.
Kumekawa N, Ohmido N, Fukui K, Ohtsubo E, Ohtsubo H (2001) A new gypsy-type
retrotransposon, RIRE7: preferential insertion into the tandem repeat sequence TrsD in
pericentromeric heterochromatin regions of rice chromosomes. Mol Genet Genomics
265: 480-488.
Kurata N, Nonomura K, Harushima Y (2002) Rice genome organization: the centromere and
genome interactions. Ann Bot 90: 427-435.
Lengerova M, Kejnovsky E, Hobza R, Macas J, Grant SR, Vyskot B (2004) Multicolor FISH
mapping of the dioecious model plant, Silene latifolia. Theor Appl Genet 108: 1193-
1199.
Levison G, Gutman GA (1987) Slipped-strand mispairing: a major mechanism for DNA.
sequence evolution. Mol Biol Evol 4: 202-221.
156
Lilly JW, Havey MJ, Jackson SA, Jiang J (2001) Cytogenomic analyses reveal the structural
plasticity of the chloroplast genome in higher plants. Plant Cell 13: 245-254.
Lim KB, de Jong H, Yang TJ et al. (2005) Characterization of rDNAs and tandem repeats in
the heterochromatin of Brassica rapa. Mol Cells 19: 436-444.
Lim KY, Matyasek R, Kovarik A, Fulnecek J, Leitch AR. (2005) Molecular cytogenetics and
tandem repeat sequence evolution in the allopolyploid Nicotiana rustica compared
with diploid progenitors N. paniculata and N. undulata. Cytogenet Genome Res 109:
298-309.
Lin, X.Y. Kaul S, Rounsley S et al. (1999) Sequence and analysis of chromosome 2 of the
plant Arabidopsis thaliana. Nature 402: 761-768.
Lindenbaum M, Perkins E, Csonka E et al. (2004) A mammalian artificial chromosome
engineering system (ACE System) applicable to biopharmaceutical protein production,
transgenesis and gene-based cell therapy. Nucleic Acids Res 32: e172.
Lorite P, Carrillo JA, Tinaut A, Palomeque T (2004) Evolutionary dynamics of satellite DNA
in species of the Genus Formica (Hymenoptera, Formicidae). Gene 332: 159-168.
Lysak MA, Fransz PF, Ali HB, Schubert I (2001) Chromosome painting in Arabidopsis
thaliana. Plant J 28: 689-697.
Macas J, Pozarkova D, Navratilova A, Nouzova M, Neumann P (2000) Two new families of
tandem repeats isolated from genus Vicia using genomic self-priming PCR. Mol Gen
Genet 263: 741-751.
Macas J, Meszaros T, Nouzova M (2002) PlantSat: a specialized database for plant satellite
repeats. Bioinformatics 18: 28-35.
Manninen I, Schulman AH (1993) BARE-1, a copia-like retroelement in barley (Hordeum
vulgare L.). Plant Mol Biol 22: 829-846.
Manuelidis L, Chen TL (1990) A unified model of eukaryotic chromosomes. Cytometry 11: 8-
25.
Manuelidis L, Langer-Safer PR, Ward DC (1982) High-resolution mapping of satellite DNA
using biotin-labeled DNA probes. J Cell Biol 95: 619-625.
Manzanero S, Arana P, Puertas MJ, Houben A (2000) The chromosomal distribution of
phosphorylated histone H3 differs between plants and animals at meiosis.
Chromosoma 109: 308-317.
Mao L, Devos KM, Zhu L, Gale MD (1997) Cloning and genetic mapping of wheat telomere-
associated sequences. Mol Gen Genet 254: 584-591.
157
Martini G, O’Dell M, Flavell RB (1982) Partial inactivation of wheat nucleolus organizers by
nucleolus organizer chromosomes from Aegilops umbellulata. Chromosoma 84: 687-
700.
McClintock B (1934). The relation of a particular chromosomal element to the development
of the nucleoli in Zea mays. Z. Zellforsch. Mikrosk. Anat 21, 294-328.
McClintock B (1941). The stability of broken ends of chromosomes in Zea mays. Genetics
26: 34-82.
McKnight TD, Shippen DE (2004) Plant telomere biology. Plant Cel 16: 794-803.
McNiel D, Lagudah ES, Hohmann U, Appels R (1994) Amplification of DNA sequences in
wheat and its relatives: the Dgas44 and R350 families of repetitive sequences. Genome
37: 320-327.
Mesbah M, Wennekes-Van Eden J, De Jong JH, De Bock TS, Lange W (2000) FISH to
mitotic chromosomes and extended DNA fibres of Beta procumbens in a series of
monosomic additions to beet (B. vulgaris). Chromosome Res 8: 285-293.
Messing J, Bharti AK, Karlowski WM et al. (2004) Sequence composition and genome
organization of maize. Proc Natl Acad Sci U S A. 101: 14349-14354.
Meyne J, Baker RJ, Hobart HH et al. (1990) Distribution of non-telomeric sites of the
(TTAGGG)n telomeric sequence in vertebrate chromosomes. Chromosoma 99: 3-10.
Miller JT, Dong F, Jackson SA, Song J, Jiang J (1998) Retrotransposon-related DNA
sequences in the centromeres of grass chromosomes. Genetics 150: 1615-1623.
Miller T, Jackson SA, Nasuda S et al. (1998) Cloning and characterization of a centromere-
specific repetitive DNA element from Sorghum bicolor. Appl Genet 96: 832-839.
Moore G, Devos KM, Wang Z, Gale MD (1995) Cereal genome evolution. Grasses, line up
and form a circle. Curr Biol 5: 737-739.
Moreno-Vazquez S, Ning J, Meyers BC (2005) hATpin, a family of MITE-like hAT mobile
elements conserved in diverse plant species that forms highly stable secondary
structures. Plant Mol Biol. 58: 869-886.
Mozo T, Dewar K, Dunn P et al. (1999) A complete BAC-based physical map of the
Arabidopsis thaliana genome. Nat Genet 22: 271-275.
Müller J, Müller K (in press) TreeGraph: automated drawing of complex tree figures using an
extensible tree description format. Molec Ecol.
Murphy TA, Karpen GH (1995) Localization of centromere function in a Drosophila
minichromosome. Cell 82: 599-609.
158
Murata M, Ogura Y, Motoyoshi F (1994) Centromeric repetitive sequences in Arabidopsis
thaliana. Jpn J Genet 69:361-371.
Mutisya J, Sathish P, Sun C et al. (2003) Starch branching enzymes in sorghum (Sorghum
bicolor) and barley (Hordeum vulgare): comparative analyses of enzyme structure and
gene expression. J Plant Physiol 160: 921-930.
Nagaki K, Tsujimoto H, Sasakuma T (1998) A novel repetitive sequence of sugar cane, SCEN
family, locating on centromeric regions. Chr Res 6: 295-302.
Nagaki K, Cheng Z, Ouyang S, Talbert PB, Kim M, Jones KM, Henikoff S, Buell CR, Jiang
J. (2004) Sequencing of a rice centromere uncovers active genes. Nat Genet 36: 138-
145.
Nagaki K, Neumann P, Zhang D, Ouyang S, Buell CR, Cheng Z, Jiang J. (2005) Structure,
divergence, and distribution of the CRR centromeric retrotransposon family in rice.
Mol Biol Evol 22: 845-855.
Nakayama S. (2004) Species-specific accumulation of interspersed sequences in genus
Saccharum. Genes Genet Syst. 79: 361-365.
Nasuda S, Hudakova S, Schubert I, Houben A, Endo TR (2005) Stable barley chromosomes
without centromeric repeats. Proc Natl Acad Sci U S A. 102: 9842-9847.
Navashin M. (1934). Chromosomal alterations caused by hybridization and their bearing upon
certain general genetic problems. Cytologia 5: 169–203.
Nelson M, Raschke E, McClelland M (1993) Effect of site-specific methylation on restriction
endonucleases and DNA modification methyltransferases. Nucleic Acids Res 21:
3139-3154.
Neumann P, Nouzova M, Macas J (2001) Molecular and cytogenetic analysis of repetitive
DNA in pea (Pisum sativum L.). Genome 44: 716-728.
Neves N, Silva M, Heslop-Harrison JS, Viegas W. (1997) Nucleolar dominance in triticales:
control by unlinked genes. Chromosome Res. 5: 125-131.
Nouzova M, Neumann P, Navratilova A, Galbraith DW, Macas J (2001) Microarray-based
survey of repetitive genomic sequences in Vicia spp. Plant Mol Biol 45: 229-244.
Nuin PAS. (2005) MTgui - a simple interface to ModelTest. Program distributed by the
author. University Health Network, University of Toronto.
http://www.genedrift.org/mtgui.php.
Ohmido N, Kijima K, Akiyama Y, de Jong JH, Fukui K (2000) Quantification of total
genomic DNA and selected repetitive sequences reveals concurrent changes in
different DNA families in indica and japonica rice. Mol Gen Genet 263: 388-394.
159
Ohmido N, Kijima K, Ashikawa I, de Jong JH, Fukui K (2001) Visualization of the terminal
structure of rice chromosomes 6 and 12 with multicolor FISH to chromosomes and
extended DNA fibers. Plant Mol Biol 47: 413-421.
Orel N, Kyryk A, Puchta H (2003) Different pathways of homologous recombination are used
for the repair of double-strand breaks within tandemly arranged sequences in the plant
genome. Plant J 35: 604-612.
Ozkan H, Tuna M, Arumuganathan K (2003) Nonadditive changes in genome size during
allopolyploidization in the wheat (aegilops-triticum) group. J Hered 94: 260-264
Pardue ML, Gall JG (1969) Molecular hybridization of radioactive DNA to the DNA of
cytological preparations. Proc Natl Acad Sci U S A 64: 600-604.
Patocchi A, Vinatzer BA, Gianfranceschi L, Tartarini S, Zhang HB, Sansavini S, Gessler C
(1999) Construction of a 550 kb BAC contig spanning the genomic region containing
the apple scab resistance gene Vf. Mol Gen Genet 262: 884-891.
Pech M, Igo-Kemenes T, Zachau HG (1979) Nucleotide sequence of a highly repetitive
component of rat DNA. Nucleic Acids Res 25: 417-432.
Pelissier T, Tutois S, Deragon JM, Tourmente S, Genestier S, Picard G (1995) Athila, a new
retroelement from Arabidopsis thaliana. Plant Mol Biol 29: 441-452.
Peterson DG, Tomkins P, Fritsch DA, Wing RA, Paterson AH (2000) Construction of plant
bacterial artificial chromosome (BAC) libraries: an illustrated guide.
Pikaard CS (1999) Nucleolar dominance and silencing of transcription. Trends in Plant
Science 4: 478–483.
Pikaard CS (2001) Genomic change and gene silencing in polyploids. Trends Genet 17: 675-
677.
Pich U, Fuchs J, Schubert I (1996) How do Alliaceae stabilize their chromosome ends in the
absence of TTTAGGG sequences? Chromosome Res 4: 207–213.
Politi V, Perini G, Trazzi S, Pliss A, Raska I, Earnshaw WC, Della Valle G (2002) CENP-C
binds the alpha-satellite DNA in vivo at specific centromere domains. J Cell Sci. 115:
2317-2327.
Pons J, Petitpierre E, Juan C (1993) Characterization of the heterochromatin of the darkling
beetle Misolampus goudoti: cloning of two satellite DNA families and digestion of
chromosomes with restriction enzymes. Hereditas 119: 179-185.
Pons J, Gillespie RG (2003) Common origin of the satellite DNAs of the Hawaiian spiders of
the genus Tetragnatha: evolutionary constraints on the length and nucleotide
composition of the repeats. Gene 313: 169-177.
160
Posada D, Crandall K (1998). Modeltest: testing the model of DNA substitution.
Bioinformatics 14: 817-818.
Presting GG, Frary A, Pillen K, Tanksley SD. (1996) Telomere-homologous sequences occur
near the centromeres of many tomato chromosomes. Mol Gen Genet 251: 526-531.
Presting GG, Malysheva L, Fuchs J, Schubert I (1998) A Ty3/gypsy retrotransposon-like
sequence localizes to the centromeric regions of cereal chromosomes. Plant J 16: 721-
728.
Prince JP, Pochard E, Tanksley SD (1993) Construction of a molecular linkage map of pepper
and a comparison of synteny with tomato. Genome 36: 404-417.
Pruitt RE, Meyerowitz EM (1986) Characterization of the genome of Arabidopsis thaliana. J
Mol Biol 187:169-183.
Qin H, Dong Y, von Arnim AG. (2003) Epigenetic interactions between Arabidopsis
transgenes: characterization in light of transgene integration sites. Plant Mol Biol 52:
217-231.
Raap AK, Florijn RJ, Blonden LAJ et al. (1996) Fiber FISH as a DNA Mapping Tool. Meth
9: 67-73.
Rayburn AL, Gill BS (1985). Use of biotin-labeled probes to map specific DNA sequneces on
wheat chromosomes. J Hered 76: 78-81.
Reeder RH (1985) Mechanisms of nucleolar dominance in animals and plants. J Cell Biol
101: 2013-2016.
Reeves A, Tear J (2000) MicroMeasure for Windows, version 3.3. Free program distributed
by the authors over the Internet from http://www.colostate.edu/Depts/Biology/
MicroMeasure.
Richards EJ, Ausubel FM (1988) Isolation of a higher eukaryotic telomere from Arabidopsis
thaliana. Cell 53: 127–136.
Richards EJ, Chao S, Vongs A, Yang J (1992) Characterization of Arabidopsis thaliana
telomeres isolated in yeast. Nucleic Acids Res 20: 4039-4046.
Rose J, Bennett AB (1999) Cooperative disassembly of the cellulose–xyloglucan network of
plant cell walls: parallels between cell expansion and fruit ripening. Trends in Plant
Science 4: 176-183.
Rudd S, Schoof H, Mayer K. (2005) PlantMarkers--a database of predicted molecular markers
from plants. Nucleic Acids Res. 33: 628-632.
161
Saghai-Maroof, MA, Soliman KM, Jorgensen RA, Allard RW (1984) Ribosomal DNA
spacer-length polymorphisms: mendelian inheritance, chromosomal location and
population dynamics. Proc Natl Acad Sci 81: 8014-8018.
Salentijn EMJ, Sandal NN, Klein-Lankhorst R et al. (1994): Long-range organization of a
satellite DNA family flanking the beet cyst nematode resistance locus (Hs1) on
chromosome 1 of B. patellaris and B. procumbens. Theor Appl Genet 89: 459-466.
Salse J, Piégu B, Cooke R, Delseny M (2002) Synteny between Arabidopsis thaliana and rice
at the genome level: a tool to identify conservation in the ongoing rice genome
sequencing project. Nucleic Acids Res. 30: 2316-2328.
Salser W, Bowen S, Browne D, el-Adli F, Fedoroff N, Fry K et al. (1976) Investigation of the
organization of mammalian chromosomes at the DNA sequence level. Fed Proc. 35:
23-35.
Sanger F, Coulson AF (1975) A rapid method for determining sequences in DNA by primed
synthesis with DNA polymerase. J Mol Biol. 94: 441-448.
SanMiguel P, Tikhonov A, Jin YK et al. (1996) Nested retrotransposons in the intergenic
regions of the maize genome. Science 274: 765-768.
Santoni S, Berville A (1992) Characterization of the nuclear ribosomal DNA units and
phylogeny of Beta L. wild forms and cultivated beets. Theor Appl Genet 83: 533-542.
Savitzky H (1975). Hybridization between Beta vulgaris and B. procumbens and transmission
of nematode (Heterodera schachtii) resistance to sugar beet. Can J Genet Cytol 17:
197-209.
Savitzky H (1978) Nematode (Heterodera schachtii) resistance and meiosis in diploid plants
from interspecific Beta vulgaris x B. procumbens hybrids. Can J Genet Cytol 20: 177-
186.
Shaked H, Kashkush K, Ozkan H, Feldman M, Levy AA (2001) Sequence elimination and
cytosine methylation are rapid and reproducible responses of the genome to wide
hybridization and allopolyploidy in wheat. Plant Cell 13: 1749-1759.
Shi L, Zhu T, Morgante M, Rafalski JA, Keim P (1996) Soybean chromosome painting: a
strategy for somatic cytogenetics. J Hered 87: 308-313.
Schmidt A, Doudrick RL, Heslop-Harrison JS, Schmidt T (2000) The contribution of short
repeats of low sequence complexity to large conifer genomes. Theor Appl Genet 101:
7-14.
162
Schmidt T, Junghans H, Metzlaff M (1990) Construction of Beta procumbens-specific DNA
probes and their application for the screening of B.vulgaris x B.procumbens (2n=19)
addition lines. Theor Appl Genet 79: 177-181.
Schmidt T , Jung C, Metzlaff M (1991) Distribution and evolution of two satellite DNAs in
the genus Beta. Theor Appl Genet 82: 793-799.
Schmidt T, Metzlaff M (1991) Cloning and characterization of a Beta vulgaris satellite DNA
family. Gene 101: 247-250.
Schmidt T, Heslop-Harrison JS (1993) Variability and evolution of highly repeated DNA
sequences in the genus Beta. Genome 36: 1074-1079.
Schmidt T, Schwarzacher T, Heslop-Harrison JS (1994) Physical mapping of rRNA genes by
fluorescent in situ hybridization and structural analysis of 5S rRNA genes and
intergenic spacer sequences in sugar beet (Beta vulgaris). Theor Appl Genet 88: 629-
636.
Schmidt T, Kubis S, Heslop-Harrison JS (1995) Analysis and chromosomal localization of
retrotransposons in sugar beet (Beta vulgaris L.): LINEs and Ty1-copia-like elements
as major components of the genome. Chromosome Res 3: 335-345.
Schmidt T, Heslop-Harrison JS (1996) High resolution mapping of repetitive DNA by in situ
hybridization: molecular and chromosomal features of prominent dispersed and
discretely localized DNA families from the wild beet species Beta procumbens. Plant
Mol Biol 30: 1099-1119.
Schmidt T, Kudla J (1996) The molecular structure, chromosomal organization, and
interspecies distribution of a family of tandemly repeated DNA sequences of
Antirrhinum majus L. Genome 39: 243-248
Schmidt T, Jung C, Heslop-Harrison JS, Kleine M. (1997) Detection of alien chromatin
conferring resistance to the beet cyst nematode (Heterodera schachtii Schm.) in
cultivated beet (Beta vulgaris L.) using in situ hybridization. Chromosome Res.5: 186-
193.
Schmidt T (1998) Habilitationsschrift zur Erlangung der Lehrbefugnis für die Fächer
Biotechnologie und molekulare Pflanzenzüchtung. Habilitation, CAU Kiel, 5.
Schmidt T, Heslop-Harrison JS (1998) Genomes, genes and junk: the large-scale organization
of plant chromosomes. Trends Plant Sci 3: 195-199.
Schmidt T, Kubis S, Katsiotis A, Jung C, Heslop-Harrison JS (1998) Molecular and
chromosomal organization of two repetitive DNA sequences with intercalary locations
in sugar beet and other Beta species. Theor Appl Genet 97: 696-704.
163
Schmidt T, Heslop-Harrison JS (1998) Genomes, genes and junk: the large-scale organization
of plant chromosomes. Trends Plant Sci 3: 195-199.
Schondelmaier J, Schmidt T, Heslop-Harrison JS, Jung C (1997) Genetic and chromosomal
localization of the 5S rDNA locus in sugar beet (Beta vulgaris L.). Genome, 40: 171-
175.
Schubert I (2001) Alteration of chromosome numbers by generation of minichromosomes --
is there a lower limit of chromosome size for stable segregation? Cytogenet Cell
Genet. 93: 175-181.
Schueler MG, Higgins AW, Rudd MK, Gustashaw K, Willard HF (2001) Genomic and
genetic definition of a functional human centromere. Science 294:109-115.
Schumacher K, Schondelmaier J, Barzen E, Steinrücken G, Borchardt D, Weber WE, Jung C,
Salamini F. (1997). Combining different linkage maps in sugar beet (Beta vulgaris L.)
to make one map. Plant Breeding 116: 23-38.
Schwarzacher T (2003) Meiosis, recombination and chromosomes: a review of gene isolation
and fluorescent in situ hybridization data in plants. J Exp Bot 54: 11-23.
Schwarzacher T, Heslop-Harrison JS (1991) In situ hybridization to plant telomeres using
synthetic oligomers. Genome 34: 317-323.
Schwarzacher T, Heslop-Harrison, JS (2000) Practical in situ hybridization. Oxford, UK:
BIOS Scientific Publishers Limited, p 60.
Siebert R, Puchta H (2002) Efficient repair of genomic double-strand breaks by homologous
recombination between directly repeated sequences in the plant genome. Plant Cell.
14: 1121-1131.
Simoens CR, Gielen J, Van Montagu M, Inze D (1988) Characterization of highly repetitive
sequences of Arabidopsis thaliana. Nucleic Acids Res 16: 6753-6766.
Smith PG (1976) Evolution of repeated sequences by unequal crossover. Science 191: 528-
535.
Soppe WJ, Jasencakova Z, Houben A et al. (2002) DNA methylation controls histone H3
lysine 9 methylation and heterochromatin assembly in Arabidopsis. EMBO J 21:
6549-6559.
Southern EM (1975) Long range periodicities in mouse satellite DNA. J Mol Biol. 94: 51-69.
Staginnus C, Winter P, Desel C, Schmidt T, Kahl G. (1999) Molecular structure and
chromosomal localization of major repetitive DNA families in the chickpea (Cicer
arietinum L.) genome. Plant Mol Biol 39: 1037-1050.
164
Stupar RM, Song J, Tek AL, Cheng Z, Dong F, Jiang J (2002) Highly condensed potato
pericentromeric heterochromatin contains rDNA-related tandem repeats. Genetics
162: 1435-1444.
Suzuki G, Ura A, Saito N, Do GS, Seo BB, Yamamoto M, Mukai Y (2001) BAC FISH
analysis in Allium cepa. Genes Genet Syst 76: 251-255.
Swofford DL (2004) PAUP*: Phylogenetic analysis using parsimony (*and other methods),
version 4.0b10. Program distributed by the author. Sinauer, Sunderland, MA.
Sykorova E, Cartagena J, Horakova M, Fukui K, Fajkus J (2003a) Characterization of
telomere-subtelomere junctions in Silene latifolia. Mol Genet Genomics 269: 13-20.
Sykorova E, Lim KY, Chase MW, Knapp S, Leitch IJ, Leitch AR, Fajkus J. (2003b) The
absence of Arabidopsis-type telomeres in Cestrum and closely related genera Vestia
and Sessea (Solanaceae): first evidence from eudicots. Plant J 34: 283-291.
Sykorova E, Lim KY, Kunicka Z, Chase MW, Bennett MD, Fajkus J, Leitch AR (2003c).
Telomere variability in the monocotyledonous plant order Asparagales. Proc R Soc
Lond B Bio Sc 270: 1893–1904.
Tahara M, Aoki T, Suzuka S, Yamashita H, Tanaka M, Matsunaga S, Kokumai S (2004)
Isolation of an active element from a high-copy-number family of retrotransposons in
the sweetpotato genome. Mol Genet Genomics 272: 116-127.
Takahashi T, Kawamura Y, Sakata N (2001) Nucleotide sequence of BamHI family satellite
DNA and its unit length polymorphism in bluegill sunfish Lepomis macrochirus. Mol
Biol Rep 28: 119-122.
Talbert PB, Bryson TD, Henikoff S (2004) Adaptive evolution of centromere proteins in
plants and animals. J Biology 3: 18.
Tanksley SD, Ganal MW, Prince JP et al. (1992) High density molecular linkage maps of the
tomato and potato genomes. Genetics 132: 1141-1160.
Tek AL, Junqui S, Macas J, Jiang J (2005) Sobo, a recently amplified satellite repeat and its
implications on origin of tandemly repeated sequences. Genetics (Epub ahead of
print).
ten Hoopen R, Manteuffel R, Dolezel J, Malysheva L, Schubert I (2000) Evolutionary
conservation of kinetochore protein sequences in plants. Chromosoma 109: 482-489.
ten Hoopen R, Schleker T, Manteuffel R, Schubert I (2002) Transient CENP-E-like
kinetochore proteins in plants. Chromosome Res 10: 561-570.
165
Tomkiel J, Cooke CA, Saitoh H, Bernat RL, Earnshaw WC. (1994) CENP-C is required for
maintaining proper kinetochore size and for a timely transition to anaphase. J Cell Biol
125: 531-545.
Topp CN, Zhong CX, Dawe RK (2004) Centromere-encoded RNAs are integral components
of the maize kinetochore. Proc Natl Acad Sci U S A 101: 15986-15991.
Ugarkovic D, Plohl M. (2002) Variation in satellite DNA profiles--causes and effects. EMBO
J 21: 5955-5959.
Van Geyt JPC, Lange W, Oleo M, De Bock ThSM (1990). Natural variation within the genus
Beta and its possible use for breeding sugar beet: A review. Euphytica 49: 57-76.
Vershinin AV, Schwarzacher T, Heslop-Harrison JS (1995) The large-scale genomic
organization of repetitive DNA families at the telomeres of rye chromosomes. The
Plant Cell 7: 1823–1833.
Vershinin AV, Heslop-Harrison JS (1998) Comparative analysis of the nucleosomal structure
of rye, wheat and their relatives. Plant Mol Biol 36: 1459-1461.
Viard F, Arnaud JF, Delescluse M, Cuguen J (2004) Tracing back seed and pollen flow within
the crop-wild Beta vulgaris complex: genetic distinctiveness vs. hot spots of
hybridization over a regional scale. Mol Ecol 13: 1357-1364.
Vicient CM, Kalendar R, Schulman AH (2001) Envelope-class retrovirus-like elements are
widespread, transcribed and spliced, and insertionally polymorphic in plants. Genome
Res 11: 2041-2049.
Vischi M, Jurman I, Bianchi G, Morgante M (2003) Karyotype of Norway spruce by
multicolor FISH. Theor Appl Genet 107: 591-597.
Volkov RA, Borisjuk NV, Panchuk II, Schweizer D, Hemleben V (1999) Elimination and
rearrangement of parental rDNA in the allotetraploid Nicotiana tabacum. Mol Biol
Evol 16: 311-320.
Wassenegger M, Heimes S, Riedel L, Sanger HL (1994) RNA-directed de novo methylation
of genomic sequences in plants. Cell 76: 567-576.
Weber B (in prep.) Molekulare und cytologische Analyse der Centromer-DNA eines
Minichromosoms der Wildrübe Beta procumbens. PhD Thesis. Dresden University of
Technology, Dresden.
Weiss H, Scherthan H. (2002) Aloe spp.--plants with vertebrate-like telomeric sequences.
Chromosome Res 10: 155-164.
166
Weiss-Schneeweiss H, Riha K, Jang CG, Puizina J, Scherthan H, Schweizer D (2004)
Chromosome termini of the monocot plant Othocallis siberica are maintained by
telomerase, which specifically synthesises vertebrate-type telomere sequences. Plant J
37: 484-493.
Wendel JF, Schnabel A, Seelanan T. (1995) Bidirectional interlocus concerted evolution
following allopolyploid speciation in cotton (Gossypium). Proc Natl Acad Sci U S A
92: 280-284.
Westermann S, Cheeseman IM, Anderson S, Yates JR 3rd, Drubin DG, Barnes G. (2003)
Architecture of the budding yeast kinetochore reveals a conserved molecular core. J
Cell Biol 163: 215-222.
Willard HF, Waye JS (1987a) Hierarchical order in chromosome-specific human alpha
satellite DNA. Trends Genet 3: 192-198.
Willard HF, Waye JS (1987b) Chromosome-specific subsets of human alpha satellite DNA:
analysis of sequence divergence within and between chromosomal subsets and
evidence for an ancestral pentameric repeat. J Mol Evol 25: 207-214
Witte CP, Le QH, Bureau T, Kumar A (2001) Terminal-repeat retrotransposons in miniature
(TRIM) are involved in restructuring plant genomes. Proc Natl Acad Sci U S A 98:
13778-13783.
Woo SS, Jiang J, Gill BS, Paterson AH, Wing RA (1994) Construction and characterization
of a bacterial artificial chromosome library of Sorghum bicolor. Nucleic Acids Res 22:
4922-4931.
Wright DA, Voytas DF (1998) Potential retroviruses in plants: Tat1 is related to a group of
Arabidopsis thaliana Ty3/gypsy retrotransposons that encode envelope-like proteins.
Genetics 149: 703-715.
Wu J, Yamagata H, Hayashi-Tsugane M et al. (2004) Composition and structure of the
centromeric region of rice chromosome 8. Plant Cell 16: 967-976.
Wu KS, Tanksley SD (1993) Genetic and physical mapping of telomeres and macrosatellites
of rice. Plant Mol Biol 22: 861-872.
Wu, T., Wang, Y., and Wu, R. (1994) Transcribed repetitive DNA sequences in telomeric
regions of rice (Oryza sativa). Plant Mol. Biol 26:363-375
Xu M, Song J, Cheng Z, Jiang J, Korban SS (2001) A bacterial artificial chromosome (BAC)
library of Malus floribunda 821 and contig construction for positional cloning of the
apple scab resistance gene Vf. Genome 44: 1104-1113.
167
Ye X, Al-Babili S, Kloti A, Zhang J, Lucca P, Beyer P, Potrykus I. (2000) Engineering the
provitamin A (beta-carotene) biosynthetic pathway into (carotenoid-free) rice
endosperm. Science 287: 303-305.
Yu HG, Hiatt EN, Dawe RK (2000) The plant kinetochore. Trends Plant Sci 5: 543-547.
Yu J, Hu S, Wang J et al. (2002) A draft sequence of the rice genome (Oryza sativa L. ssp.
indica). Science 296: 79-92.
Yu MH (1984) Resistance to Heterodera schachtii in Patellares section of the genus Beta.
Euphytica 33: 633-640.
Zhang X, Wessler S (2004) Genome-wide comparative analysis of the transposable elements
in the related species Arabidopsis thaliana and Brassica oleracea. Proc Natl Acad Sci
U S A 101: 5589-5594.
Zhang Y, Huang Y, Zhang L et al. (2004) Structural features of the rice chromosome 4
centromere. Nucleic Acids Res 32: 2023-2030.
Zhong CX, Marshall JB, Topp C et al. (2002) Centromeric retroelements and satellites
interact with maize kinetochore protein CENH3. Plant Cell 14: 2825-2836.
Zhong XB, Fransz PF, Wennekes-Eden J et al. (1998) FISH studies reveal the molecular and
chromosomal organization of individual telomere domains in tomato. Plant J 13: 507-
517.
168
Versicherung
Hiermit versichere ich, dass ich die vorliegende Arbeit ohne unzulässige Hilfe Dritter und ohne Benutzung anderer als der angegebenen Hilfsmittel angefertigt habe; die aus fremden Quellen direkt oder indirekt übernommenen Gedanken sind als solche kenntlich gemacht. Die Arbeit wurde bisher weder im Inland noch im Ausland in gleicher oder ähnlicher Form einer anderen Prüfungsbehörde vorgelegt.
Daryna Dechyeva
Dresden, Februar 2006

List of publications
Publications
Dechyeva D, Schmidt T (in prep) Characterization of Beta vulgaris fragment addition lines with a
set of repetitive probes by FISH. Annals of Botany
Dechyeva D, Schmidt T (in prep) Organization of Repetitive DNA in Terminal Chromatin of Beta
species. Chromosome Res.
Jacobs G, Dechyeva D, Schmidt T (in prep) Construction and characterization of a PAT2 BAC
library.
Jacobs G*, Dechyeva D*, Menzel G, Dombrowski C, Schmidt T (2004): Molecular characterization
of Vulmar1, a complete mariner transposon of sugar beet and diversity of mariner- and
En/Spm-like sequences in the genus Beta. Genome 47: 1-10. * Both authors contributed equally to this work. Schmidt T, Desel C, Dechyeva D, Fleischer B, Gindullis F, Schmidt A, Heslop-Harrison JS,
Doudrick RL (2004) FISHing repeated DNA sequences in Beta genomes. Chromosomes
Today 14: Kluwer Academic Publishers
Dechyeva D, Gindullis F, Schmidt T (2003) Divergence of satellite DNA and interspersion of
dispersed repeats in the genome of the wild beet Beta procumbens. Chromosome Res. 11: 3-
21.
Gindullis F, Dechyeva D, Schmidt T (2001) Construction and characterization of a BAC library for
the molecular dissection of a single wild beet centromere and sugar beet (Beta vulgaris)
genome analysis. Genome 44: 846-855.
Dechyeva D, Golovko E (1996) Investigation of the proteinase and phospholipase activity of
Bacillus thuringiensis aimed at the selection of prospective strains. News of Kiev University,
Biology 26: 83-87.
Dechyeva D, Melnichuk V (1995): Some biochemical distinctions of the non-specific resistance of
wheat to the rust infection. News of Kiev University, Biology 25: 120-123.
Posters at conferences
Schmidt T, Dechyeva D, Weber B, Wenke T, Menzel G (2004) Plant centromeres - molecular
isolation and application for the development of plant artificial chromosomes. XVth
International Chromosomal Conference, London, UKDechyeva D, Gindullis F, Schmidt T,
Fleischer B (2002) Plant Centromeres - molecular isolation and application for the
development of plant artificial chromosomes. Plant Genomics European Meeting Plant
GEMs 1, Berlin, Deutschland
10.07.06
Dechyeva D, Gindullis F, Schmidt T (2002) Repetitive DNA sequences of the Beta procumbens
genome. 10. Tagung Molekulare Marker der Deutsche Gesellschaft für Pflanzenzüchtung,
Freising, Deutschland
Fleischer B, Gindullis F, Dechyeva D, Schmidt T (2002) Beetle1, a Ty3-gypsy-retrotransposon
highly amplified at centromeres of Beta procumbens chromosomes. Plant & Animal
Genome X, San Diego,USA
Gindullis F, Desel C, Dechyeva D, Schurwanz S, Schmidt T (2001) BAC-FISHing of a plant
centromere. Plant & Animal Genome IX, San Diego,USA
Gindullis F, Dechyeva D, Schmidt T (2001) Construction and characterization of a sugar beet BAC
library for the isolation of a plant centromere. Plant & Animal Genome IX, San Diego, USA
Presentations at conferences
Schmidt T, Fleischer B, Gindullis F, Dechyeva D (2002) The structural composition of the
centromere of a Beta minichromosome. Plant & Animal Genome X, San Diego, USA
Fleischer B, Gindullis F, Dechyeva D, Schmidt T (2002) Beetle1, a Ty3-gypsy-retrotransposon
highly amplified at centromeres of Beta procumbens chromosomes. Plant & Animal
Genome X, San Diego,USA
Schmidt T, Dechyeva D, Gindullis F (2001) Pflanzliche Centromere – molekulare Isolierung und
Nutzung für die Entwicklung künstlicher Pflanzenchromosomen. 19. DECHEMA-
Jahrestagung der Biotechnologen, Leipzig
10.07.06
Acknowledgments
I would like to thank my PhD supervisor Prof. Dr. Thomas Schmidt for providing valuable
scientific guidance. I am also grateful to all my colleagues in Kiel and in Dresden, especially
to Dr. Frank Gindullis, Prof. Dr. Christine Desel and Nicole Pinnow for helping to integrate
both in laboratory activity and in life in Germany. I am also sincerely grateful to Dr. Andreas
Houben and Prof. Dr. Ingo Schubert for the opportunity to perform immunostaining in IPK
Gatersleben, to Prof. Dr. Paul Fransz and his team for learning fiber FISH at the University of
Amsterdam, and to Dr. Dietmar Quandt for assistance with sequences phylogenetic analysis. I
thank Prof. Dr. Pat Heslop-Harrison for helpful discussion of the parts of this work. I express
my gratitude to Dr. Volodymyr Radchuk and Dr. Ruslana Radchuk for supply of literature
and friendly advices. I thank Dr. Sergey Miroshnichenko, Dr. Gerhard Menzel and Dorit
Materni for reading my manuscript. I am endlessly grateful to my school and Kiev University
teachers, especially Prof. Dr. R.P.Vinogradova and Prof. Dr. L.I.Ostapchenko for giving me
an excellent educational opportunity and to my family and friends who supported me on this
way.
This work was funded by the BMBF BioFuture grant.

LEBENSLAUF Name: Daryna Dechyeva Geburtsdatum: 10.07.72 Geburtstort: Sofia, Bulgarien Familienstand: verheiratet Staatsangehörigkeit: ukrainisch Ausbildung: September 1979 – Mai 1989
Mittelschule 89, Kiew, die Ukraine September 1989 – Juni 1994 Kyjiwer Taras Schewtschenko Universität, Kiew, die Ukraine Fachrichtung „Biologie“ Abschluß: Diplombiologin – Biochemikerin, Biologie- und Chemie-Dozentin
Berufstätigkeit: Oktober 1994 – Oktober 1995
Kyjiwer Taras Schewtschenko Universität, Kiew, die Ukraine Fachrichtung „Physiologie and Biochemie der Pflanzen“ Wissenschaftliche Mitarbeiterin November 1995 – März 1999 National Ecological Center of Ukraine, Kiew, die Ukraine Wissenschaftliche Mitarbeiterin April 1999 – Dezember 1999 Kyjiwer Taras Schewtschenko Universität, Kiew, die Ukraine Fachrichtung „Genetik“ Wissenschaftliche Mitarbeiterin Dezember 1999 – April 2003 Christian-Albrecht Universität zu Kiel, Kiel, Deutschland Mitglied der BioFuture Nachwuchsforschergruppe Wissenschaftliche Mitarbeiterin / Doktorandin
ab Mai 2003 Technische Universität Dresden, Dresden, Deutschland Institut für Botanik LS „Zell- und Molekularbiologie der Pflanzen“ Wissenschaftliche Mitarbeiterin / Doktorandin
Dresden, den 2006