N20 Qüestions d'Habitatge
43
20 NOVEMBER 2016 Housing policies compared ///////////////////////////////////////////// QH Qüestions d’Habitatge Version in English
-
Upload
juli-fernandez-duran -
Category
Government & Nonprofit
-
view
16 -
download
0
Transcript of N20 Qüestions d'Habitatge
20NOVEMBER 2016
Housing policies compared
/////////////////////////////////////////////
QHQüestions d’Habitatge
Version in English
Qüestions d’HabitatgeIssue 20. November 2016
CollectionQüestions d’Habitatge
Texts:Josep Maria Montaner, Javier Burón, Àngels Mira Cortadellas, Laurent Ghekiere, European Federa-tion of Public Cooperatives and Social Housing, Pilar García-Almirall, Lenimar Arends, Blanca Gutiérrez Valdivia, Daniela Idrovo, Gina Cleves, Maria Jesús Calvo
Coordination:Jordi PalayImma Santos
Photographs:Jordi López and the Centre for Documentary Photography
Direction:Housing Councillors (Josep Maria Montaner, Vanesa Valiño, Javier Burón, Eva Jou, Merche Montilla, Iván Gallardo, Magda Minguell and Montse Prats)
Edition:Barcelona City CouncilMunicipal Housing Board
All rights reserved
Graphic design:Gerard Medina (www.gmedina.es)
Correction: Lali Forcades, Miguel Vandor, Univerba and Treeloc
Editorial production:Directorate of Image and Editorial ServicesISSN 2462-4152Legal Deposit: B-4847/99
Presentation
Housing policy comparisons 3Josep Maria Montaner, Housing Councillor
The public policy challenge of Barcelona housing 5Javier Burón, Housing Manager
Social housing policies from a local perspective public developers 11Àngels Mira Cortadellas, Head of the Municipal Housing Board
What is the future for housing policies after the crisis? 19Laurent Ghekiere, Head of EU Affairs of the Social Housing Union
EU housing policies: the latest developments 25European Federation of Public, Cooperative & Social Housing
Municipal housing policy model study in Europe and America 31Pilar García-Almirall, Lenimar Arends, Blanca Gutiérrez Valdivia, Daniela Idrovo, Gina Cleves
Annex Barcelona rent report 67
Índex
/////////////////////////////////////////////
Artist’s impression of the development for 49 dwellings for the elderly and 15 lodgings at Carrer Ali Bei, 201. PMHB.
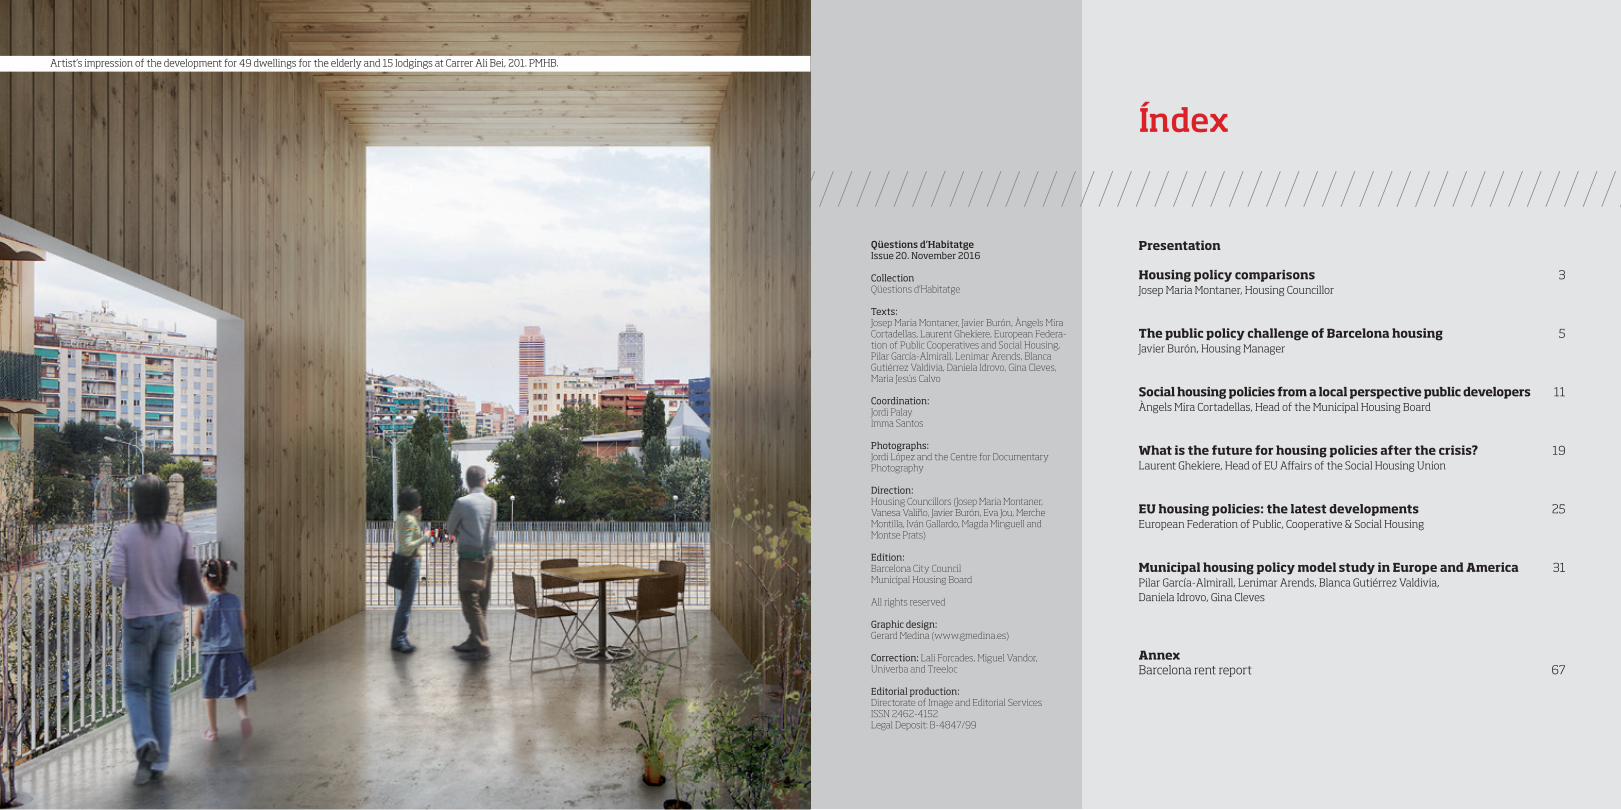
Controlled rent increases, at least in neighbourhoods where there are situations of residential vulnerability, is becoming essential.
While the first edition of the new era for Qüestions d’Habi-tatge was dedicated to summarising and rethinking the Board’s activity, ahead of the new times and the various
strategies for facing the emergency housing situation, this second issue is based on the case study by the team from the Barcelona Sc-hool of Architecture, ETSAB-UPC, led by Pilar Garcia Almirall with the collaboration of Lenimar Arends, Blanca Gutiérrez Valdivia, Da-niela Idrovo and Gina Cleves, regarding a key issue to be addressed by any housing policy: a comparative study among case studies.
For any comparisons to be useful, they must be based on clari-fying the parameters to be compared and being aware of the diffe-rent contexts, linked to various traditions of social housing policies, which cannot be improvised.
The idea is to find out the number of new public houses that are built each year, and also to guarantee the right to housing, restorati-on processes, whether there are measures to control rent increases, what the process is to deal with squatters (whether due to ideology or through necessity) and how problems regarding housing emer-gencies and abnormalities, such as the mortgage crisis and empty housing, have been dealt with.
While preparing this issue, it has been confirmed that, as of 2014, rent prices have once again increased in Barcelona city. They are es-
timated to have increased between 6% and 7% in 2015. While one of the first measures taken by the new municipal government was to substantially increase the financial assistance for rent payment, for which it spent €9 million and helped some 2,000 families and living units, an uncontrolled increase in rent prices calls into question the capacity and effectiveness of these measures.
In this situation, reclaiming control over rent increases, at least in the popular neighbourhoods of the city where there is vulnera-bility with regard to housing, is essential. We must insist that a law be adopted, whether by the Catalan government or the Spanish go-vernment, that would allow municipalities to intervene in the event of an emergency and in the event of abusive rent increases. It is the-refore highly useful to be aware of the procedures for the develop-ment of social rent housing that are in force in influential cities such as Paris, Amsterdam and Berlin, which have strong housing policies and are much more advanced in the defence of tenants’ rights.
This issue will therefore allow us to reflect on and plan public hou-sing policies, in a city with around 10,500 affordable houses, which should really have around 100,000. Å
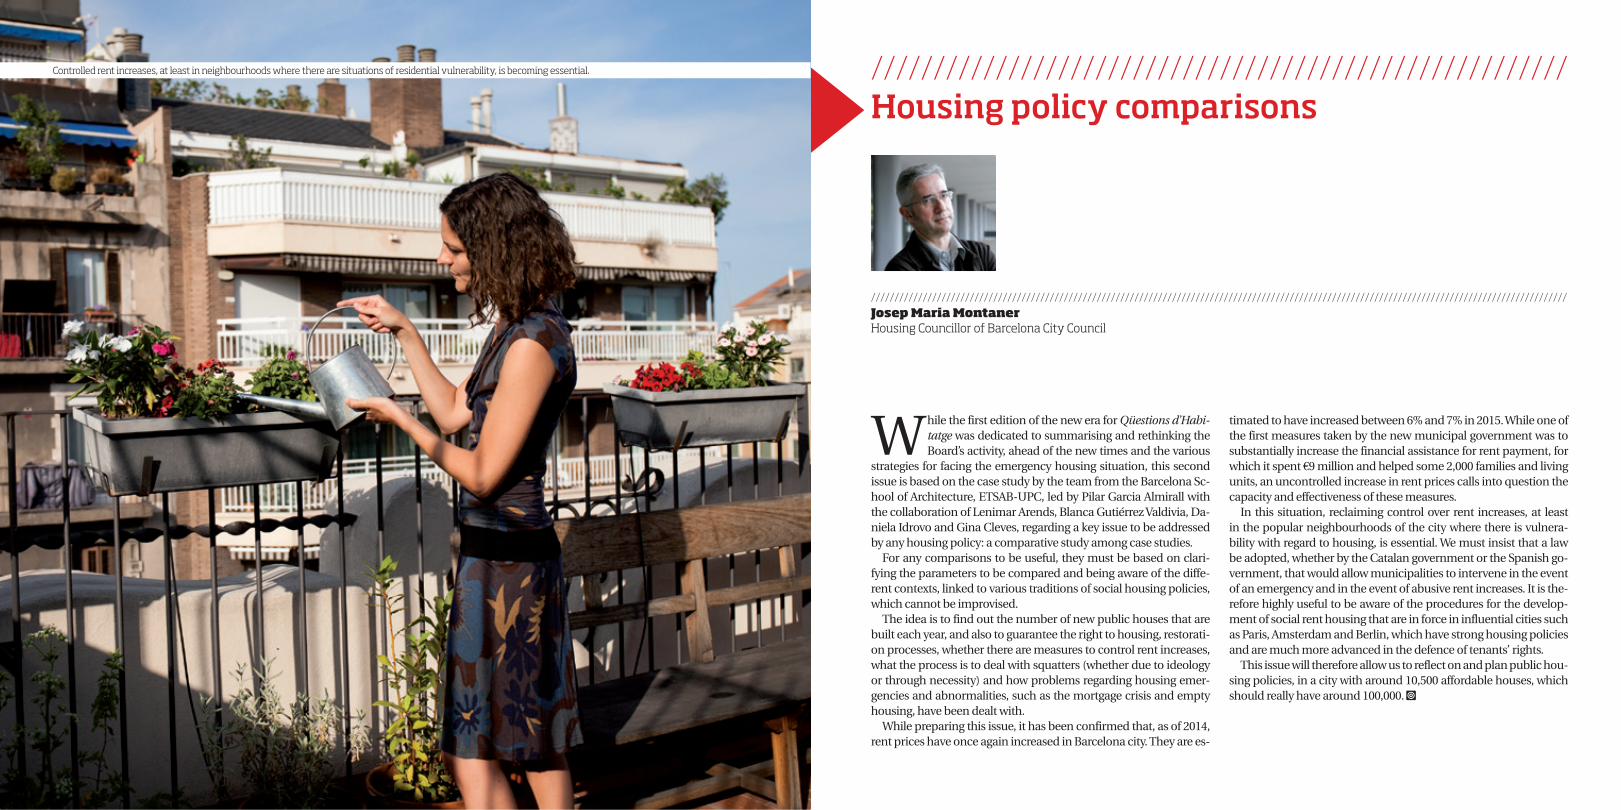
////////////////////////////////////////////////////////Housing policy comparisons
////////////////////////////////////////////////////////////////////////////////////////////////////////////////////////////////////////////////////Josep Maria MontanerHousing Councillor of Barcelona City Council
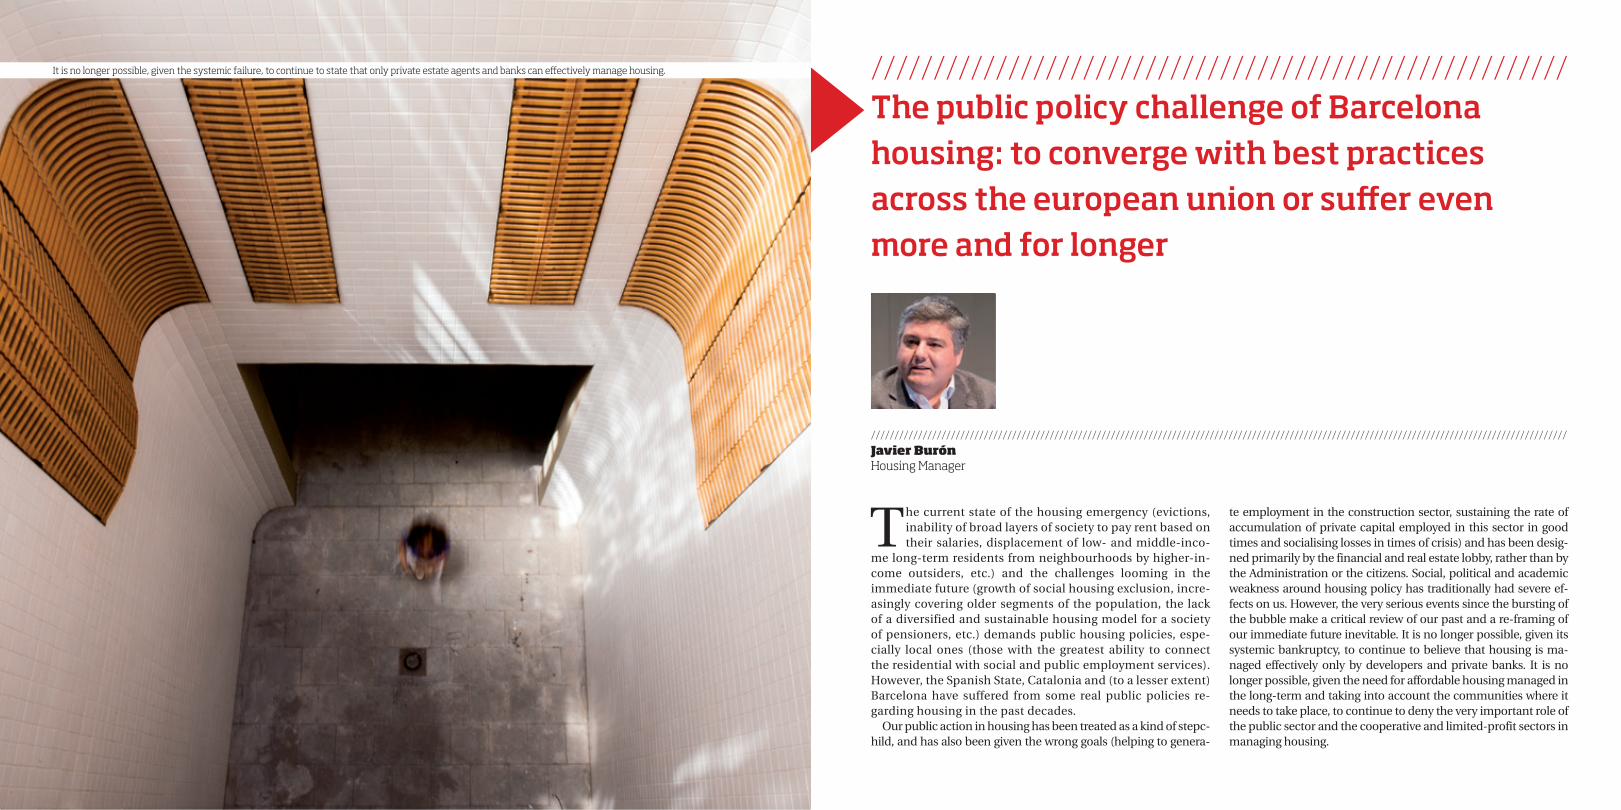
It is no longer possible, given the systemic failure, to continue to state that only private estate agents and banks can effectively manage housing.
The current state of the housing emergency (evictions, inability of broad layers of society to pay rent based on their salaries, displacement of low- and middle-inco-
me long-term residents from neighbourhoods by higher-in-come outsiders, etc.) and the challenges looming in the immediate future (growth of social housing exclusion, incre-asingly covering older segments of the population, the lack of a diversified and sustainable housing model for a society of pensioners, etc.) demands public housing policies, espe-cially local ones (those with the greatest ability to connect the residential with social and public employment services). However, the Spanish State, Catalonia and (to a lesser extent) Barcelona have suffered from some real public policies re-garding housing in the past decades.
Our public action in housing has been treated as a kind of stepc-hild, and has also been given the wrong goals (helping to genera-
te employment in the construction sector, sustaining the rate of accumulation of private capital employed in this sector in good times and socialising losses in times of crisis) and has been desig-ned primarily by the financial and real estate lobby, rather than by the Administration or the citizens. Social, political and academic weakness around housing policy has traditionally had severe ef-fects on us. However, the very serious events since the bursting of the bubble make a critical review of our past and a re-framing of our immediate future inevitable. It is no longer possible, given its systemic bankruptcy, to continue to believe that housing is ma-naged effectively only by developers and private banks. It is no longer possible, given the need for affordable housing managed in the long-term and taking into account the communities where it needs to take place, to continue to deny the very important role of the public sector and the cooperative and limited-profit sectors in managing housing.
////////////////////////////////////////////////////////////////////////////////////////////////////////////////////////////////////////////////////Javier BurónHousing Manager
////////////////////////////////////////////////////////The public policy challenge of Barcelona housing: to converge with best practices across the european union or suffer even more and for longer
////////////////////////////////////////////////////////////////////////////////////////////////////////////////////////////////////////////////////////////////////////////////////////////////////////////////////////////// //////////////////////////////////////////////////////////////////////////////////////////////////////////////////////////////////////////////////////////////////////////////////////////////////////////////////////////////6 7
We need to converge with the best practices in housing that have come about in many EU states. This edition of Questions is a result of our interest in disseminating a comparative approach to housing policy. We are not foolish enough to place anyone on a pedestal, however. In all EU Member States both good and bad practices have been developed. In addition, currently pro-market elements batter against public and nominally for-profit private entities using the EU DG for Competition. But still, Amsterdam, Vienna, Paris, Berlin, Edinburgh, Stockholm and many others re-main leaders that must be taken into account and, to some extent, emulated.
In this context, Barcelona has a special responsibility. It is a tra-ditionally well-managed city with good technical teams, financially sound, with access to credit and a proven ability, compared to past decades, to accept structural challen-ges and emerge successful, at least par-tially, in many of them. Barcelona aims to strengthen, update and guarantee its public housing policies. In addition, the city is especially taken with the idea of helping to establish a network of Cata-lan, Spanish and European cities that gives citizens access to decent housing.
To this end, the Barcelona housing team is already working and will continue to work more vigorously in the coming years on a number of strategic challenges that can be summarised in the fo-llowing verbs/actions:
KNOW (measure, weight and compare). Although it may be hard to believe, in housing one of the first problems of public action (also of the formation of public opi-nion and enabling of citizen activism) is access to information that is high-quality, systematic and diverse. There is much in-formation on housing, but little of it is from datasets over lon-ger periods of time and is uncontested in relation to its quality. Therefore, one of the strategic challenges of today’s housing team is to improve our own instruments in this area and to co-llaborate in generating metropolitan, national and government tools. In this context we must understand the efforts of the city of Barcelona for the creation of an inter-administrative Housing Observatory.
LISTEN (understand, monitor and encourage citi-zen participation). Ten Housing Offices of the Housing Consortium of Barcelona (esta-blished by the City Council and the Regional Government) have as their first mission to be the eyes and ears of the local public service apparatus regarding housing. Obviously, they manage a portfolio of public properties and services available to the public. But they must also be a meeting place for neighbours and their administration that allows the characterisation of housing problems and, thus, helps re-fine public instruments to facilitate the creation of dynamic coope-ratives within civil society and mediate more equitably between all actors in the market. For housing policy (with strong connections to social policy and labour policy) to work, it must be participatory. And that must significantly affect the model of the city’s Housing Of-
fice in the coming years.
FIGHT to solve the housing emergencyWe are aware that the main scourge that the city faces at the moment is the drama of evictions (and the connected phenomenon of irregular occupati-on). We are sparing no effort to solve it.
The city employs a series of financial, staff and material resources to try to detect, stop and solve as many of these cases as possible. We are becoming more and more effective. But we are aware that cer-tain cases are not heard about in time or are not given an optimal, long-term solution. But we can also say that in 100% of cases where we intervene, we prevent people at risk of social housing exclusion from ending up homeless. Obviously the goal is for all of them to firstly be able to live in decent housing (reside in public housing or receive public assistance in renting a private residence) and, in the long term, for them to find work so that they can provide their own housing solution.
SUBSIDISEVery much in connection with the problems of the housing emer-gency, but also as a structural instrument of housing policy, we un-derstand that rent subsidies (provided they contain anti-fraud and anti-inflation mechanisms) should be strengthened. We believe that we are the first Catalan city, and the first in Spain, to devote signifi-
cant amounts of its own resources to public subsidies for state and regional rentals. In the future, we hope that these grants will beco-me less important as a system to prevent evictions, and will become more relevant as a way to encourage affordable rent (optimally they will reach a size that could stabilise prices in some segments of the private rental market).
PRODUCEBarcelona, Catalonia and Spain are still suffering the effects of a dra-ma of incalculable proportions. In past decades, we have produced millions of public housing units, but almost all have been for home ownership (not for rent as in the EU) and do not qualify. That is, eventually a few become homes with prices set by the market (with the exception of the Basque Country, where housing units with pu-blic protection are not disqualified). That is why the city of Barcelona has set as one of its main strategic cha-llenges to have 15,000 public and third sector rental units. To resemble the European cities cited above, there should be more than 100,000 rentals at below-market prices. Right now, though, we have barely 10,000. Given these figures, we are committing to produce in just over five years 50% of what occurred in the past half century. Secondarily, we will also produce housing for urban rehousing and leasehold. But the centre of gravity of our production programme will be in the area of public rentals: social, protected and affordable (these nuances are rele-vant). This will force the City to completely and totally replace the developer mentality (build and sell) with a management mentality (build, rent, service, satisfy, redesign, innovate, etc.).
ACQUIREHowever, not all our efforts will go to subsidising and building be-cause we are aware that right now in the city there are few oppor-tunities to acquire housing at very reasonable prices that can serve firstly to address the housing emergency, but also to strengthen pu-blic service in housing. Therefore, we will maintain, at least for some time, an exceptional policy of buying houses and buildings at below the public cost of production.
MOBILISEAnother area where action is needed, regardless of rent subsidies and production of public rental stock, is in the mobilisation of pri-vate housing (empty, underused, misused, etc.) into the affordable rental pool. We will use economic and financial means to attract a portion of private owners of housing into stable affordable rental schemes. It is not an easy task because in Barcelona, unlike other Catalan and Spanish cities, there is (relatively) little vacant housing and there are strong demand pressures on rental housing. At any rate, although it cannot become as structural an element of our po-licy as generating public rental stock, we must ensure that we take as much advantage as possible of existing housing for use as part of the affordable rental solution.
MUTUALISESince public action is key, the cur-rent housing team has not lost sight of the fact that we can only achieve decent, affordable housing that is sustainable over time if, in addition to public sector action, civil society is also active in this field. It therefo-re seems vital that housing coope-ratives grow (pooling the resources of all kinds of a number of people
is stronger than individuals acting separately). We are not referring only to the cooperative for promoting housing, but particularly co-operatives that manage the useful life of buildings (cession-of-use housing). Housing that is affordable, non-speculative, social (but not public), environmentally sound and community-oriented. That which elsewhere in the EU is called co-housing and which we call cohabitatge should play an important role in the sophistication of local public action in housing, along with the involvement of civil society in solving collective problems. To do this, the public should help, facilitate and accompany. But the key is for civil society to ge-nerate power in terms of housing with its ability to be independent of government and politics.
COOPERATEAlong with cohabitatge, we handle other scenarios for healthy and necessary private partnership. We remain committed to the agre-
//////////////////////////////////////////////////Barcelona hopes to strengthen,
consolidate and guarantee its public housing policies.
//////////////////////////////////////////////////
//////////////////////////////////////////////////////Therefore, Barcelona city has set itself the goal of reaching 15,000 dwellings for public rental
and the third sector as one of its main strategic challenges.
///////////////////////////////////////////////////////
////////////////////////////////////////////////////////////////////////////////////////////////////////////////////////////////////////////////////////////////////////////////////////////////////////////////////////////// //////////////////////////////////////////////////////////////////////////////////////////////////////////////////////////////////////////////////////////////////////////////////////////////////////////////////////////////8 9
ement between the City and the Habitat 3 foundation, part of the Third Sector Housing Bureau of Catalonia. This foundation per-forms, with the support of the public budget, interesting work in mobilising private housing toward affordable rentals in the soci-al support of tenants who need it, as well as empowering people through training and employability. Along with this experience, we also propose the need to direct private professional investment and popular savings to public-private companies that build/purc-hase housing stock to dedicate indefinitely to affordable rentals. An intermediate segment between market rent and public hou-sing, i.e. affordable rent, is extremely necessary in our city. Such companies, known as housing associations elsewhere in the EU, are nominally for-profit to a limited extent. Without prejudice to compensating the investor, the business focus is not on short-term profit, but on the long-term maintenance of a stock of affor-dable rental property, well run and with stable users.
REHABILITATEThis is one of the last of the actions, but this should not be misinterpre-ted. In a city bounded by two rivers, the sea and the mountains and al-most completely built out, there will be no public housing policies worthy of the name if there is not a policy of strong and mature rehabili-tation. At present, various types of rehabilitations of buildings are subsidised. We are working to direct a portion of these resources to the rehabilitation of interiors of the housing of low-income fami-lies. In the same way, we are seeking formulas for agreement with neighbouring communities to gain critical mass in rehabilitation processes to be supported with a pool of deep funding: resources of owners, public subsidies, private credit and collateral, Europe-an public financial facilities, etc. This strategy of agreements with neighbouring communities will also be especially important in implementing the neighbourhood plans that are now beginning to confront the city.
PRESSUREWe conclude this summary with two less-than-amiable actions, but ones that should never be ignored. There are skills that are not
municipal, but are key to addressing housing problems. And a lack of skills should not be confused with lack of interest or of voice. We must make known to the Catalan Parliament and Regional Govern-ment, the Spanish Courts and the National Government that certain actions must be carried out by them, for the benefit of all. The list is long, but we must mention, at least, the need for public budgets for European-style housing policies; creating a public banking ser-vice to serve affordable housing (something routine in many EU states); a tax reform that benefits, rather than penalising, occupied, restored, rental, public, cooperative, affordable or non-speculative housing; it is also necessary that the Catalan and Spanish authoriti-es attempt to adopt systems for modulation and control of private rentals (currently in a very dangerous dynamic, as explained in this issue), such as those in important, responsible European cities. On these and other questions, Barcelona will lobby. We will push to bet-
ter meet the needs and interests of Barcelona’s citizens, but also so that municipalism in terms of housing makes available the means and ins-truments already in the hands of our European counterparts.
SANCTIONThe second not-so-friendly word derives from the need to penalise
those behaviours of citizens that are contrary to the general interest in housing. Fortunately, the idea that the owner of a property can do whatever he or she pleases with their property, even if it means se-rious problems for society as a whole, is being abandoned. There is a wide field of work regarding evictions, empty housing, substandard housing, duty to preserve, tourist housing, gentrification, etc. And the City will be increasingly present in this difficult field (our right is not yet sufficiently established to defend the public and civic inte-rest against the obstacles that are numerous and hard to overcome).
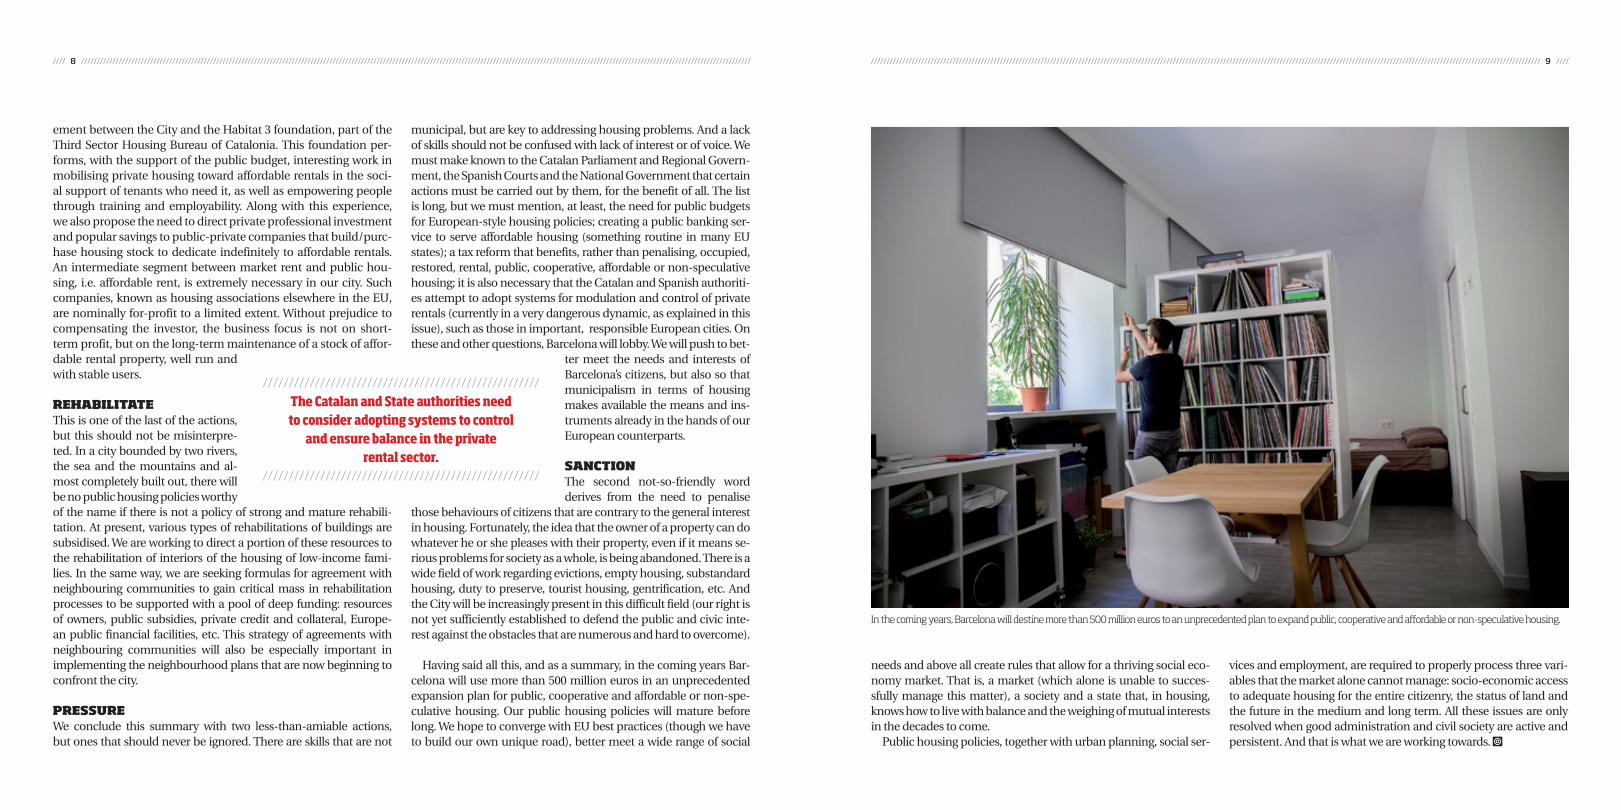
Having said all this, and as a summary, in the coming years Bar-celona will use more than 500 million euros in an unprecedented expansion plan for public, cooperative and affordable or non-spe-culative housing. Our public housing policies will mature before long. We hope to converge with EU best practices (though we have to build our own unique road), better meet a wide range of social
needs and above all create rules that allow for a thriving social eco-nomy market. That is, a market (which alone is unable to succes-sfully manage this matter), a society and a state that, in housing, knows how to live with balance and the weighing of mutual interests in the decades to come.
Public housing policies, together with urban planning, social ser-
vices and employment, are required to properly process three vari-ables that the market alone cannot manage: socio-economic access to adequate housing for the entire citizenry, the status of land and the future in the medium and long term. All these issues are only resolved when good administration and civil society are active and persistent. And that is what we are working towards. Å
/////////////////////////////////////////////////////The Catalan and State authorities need to consider adopting systems to control
and ensure balance in the private rental sector.
/////////////////////////////////////////////////////
In the coming years, Barcelona will destine more than 500 million euros to an unprecedented plan to expand public, cooperative and affordable or non-speculative housing.
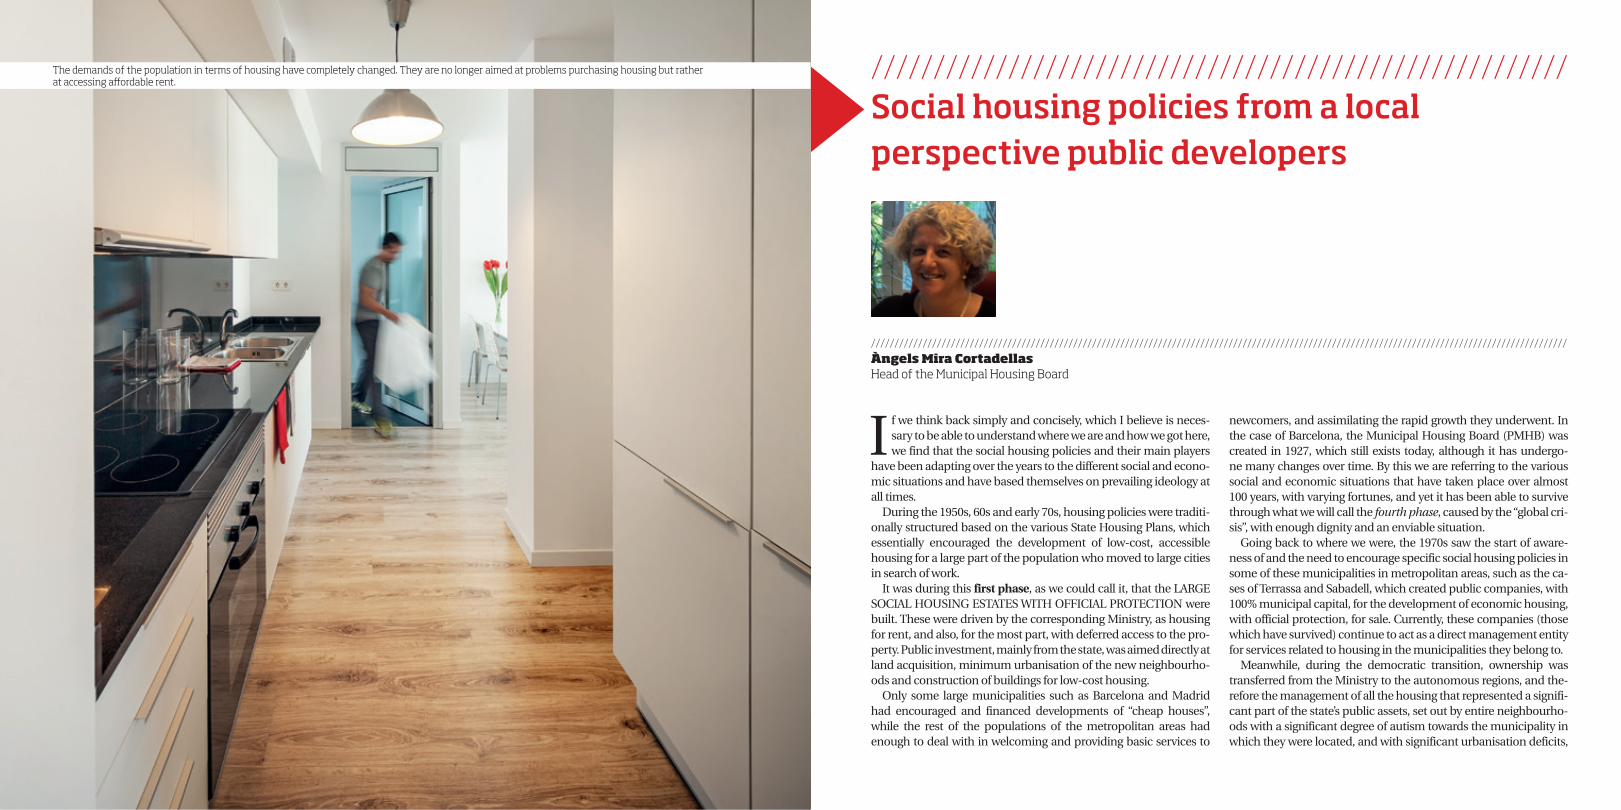
The demands of the population in terms of housing have completely changed. They are no longer aimed at problems purchasing housing but rather at accessing affordable rent.
I f we think back simply and concisely, which I believe is neces-sary to be able to understand where we are and how we got here, we find that the social housing policies and their main players
have been adapting over the years to the different social and econo-mic situations and have based themselves on prevailing ideology at all times.
During the 1950s, 60s and early 70s, housing policies were traditi-onally structured based on the various State Housing Plans, which essentially encouraged the development of low-cost, accessible housing for a large part of the population who moved to large cities in search of work.
It was during this first phase, as we could call it, that the LARGE SOCIAL HOUSING ESTATES WITH OFFICIAL PROTECTION were built. These were driven by the corresponding Ministry, as housing for rent, and also, for the most part, with deferred access to the pro-perty. Public investment, mainly from the state, was aimed directly at land acquisition, minimum urbanisation of the new neighbourho-ods and construction of buildings for low-cost housing.
Only some large municipalities such as Barcelona and Madrid had encouraged and financed developments of “cheap houses”, while the rest of the populations of the metropolitan areas had enough to deal with in welcoming and providing basic services to
newcomers, and assimilating the rapid growth they underwent. In the case of Barcelona, the Municipal Housing Board (PMHB) was created in 1927, which still exists today, although it has undergo-ne many changes over time. By this we are referring to the various social and economic situations that have taken place over almost 100 years, with varying fortunes, and yet it has been able to survive through what we will call the fourth phase, caused by the “global cri-sis”, with enough dignity and an enviable situation.
Going back to where we were, the 1970s saw the start of aware-ness of and the need to encourage specific social housing policies in some of these municipalities in metropolitan areas, such as the ca-ses of Terrassa and Sabadell, which created public companies, with 100% municipal capital, for the development of economic housing, with official protection, for sale. Currently, these companies (those which have survived) continue to act as a direct management entity for services related to housing in the municipalities they belong to.
Meanwhile, during the democratic transition, ownership was transferred from the Ministry to the autonomous regions, and the-refore the management of all the housing that represented a signifi-cant part of the state’s public assets, set out by entire neighbourho-ods with a significant degree of autism towards the municipality in which they were located, and with significant urbanisation deficits,
////////////////////////////////////////////////////////Social housing policies from a local perspective public developers
////////////////////////////////////////////////////////////////////////////////////////////////////////////////////////////////////////////////////Àngels Mira CortadellasHead of the Municipal Housing Board
////////////////////////////////////////////////////////////////////////////////////////////////////////////////////////////////////////////////////////////////////////////////////////////////////////////////////////////// //////////////////////////////////////////////////////////////////////////////////////////////////////////////////////////////////////////////////////////////////////////////////////////////////////////////////////////////12 13
lack of maintenance and various pathologies that had to be faced.That said, public investment in the area of housing, on both a sta-
te and regional level, continued to be among the lowest in Europe. On a municipal level, we began to see some activity, albeit timid, of housing development with official protection.
In the 1980s and 90s, we entered into a second phase, in which, despite the competence regarding housing that had been transfer-red to the autonomous regions, the STATE HOUSING PLANS were what determined the actions that were considered protectable, i.e., likely to be eligible for subsidies and/or regulated financing, and they negotiated the transfer of funds to each of the autonomous re-gions.
To encourage the development of housing at affordable prices (with official protection, appraised price, etc.), a whole system was structured, based on three lines: 1) subsidies to funds lost by deve-lopers – who are paid a small part of the cost, which is more signifi-cant in the case of developments intended for rent; 2) subsidies for buyers of these houses; and 3) specific financing conditions, which are better than those on the free market.
This change represented a tur-ning point, although the effects of this system (which were dama-ging in many cases) were not felt until many years later, with the outbreak of the economic, financial and real-estate crisis which we are still facing today.
As such, what were known as “public developments” of social housing, with public financing, virtually disappeared, and deve-lopers of new social housing, whether public or private, had to se-arch for means in the financial markets.
During the 1980s and 90s, municipalities found themselves ha-ving to assist the population with difficulties accessing housing, and they began to promote, through their own companies, the obtai-ning of land and development of housing with official protection. These houses were mainly for sale, which responded to the main demand at that time and did not undertake long-term debt or futu-re management of this rental stock.
Public development companies of land and housing, essentially
local companies, represented a highly reduced cost that was perfec-tly feasible for their City Councils, as they virtually financed them-selves with the product of their own activity (the development and sale of the houses).
After the turn of the century, we entered a period of ECONOMIC EXPANSION and a spiral of growth in the demand for and prices of housing (well above the increase in prices for all other products). We then enter a third phase, in which we see a series of collateral effects triggered: urban laws which require more land reserves for social housing, new municipal planning that foresees large sectors of residential growth, an increase in the population that is unable to access the free housing market – whether for rent or for purchase – due to the seemingly unstoppable escalation in prices, a desire to regulate the conditions of production, design and access to housing with official protection, etc.
Over these years, local public companies became the executors of the forecasts of the State Hou-sing Plans and Regional Plans, and, specifically, the social housing po-licies. They are the instrument of administrations for the implemen-tation of social integration policies and construction and regeneration of the city, as they not only develop them for sale, but are also involved in transformation and urbanisa-
tion processes, and increase their assets by developing qualified homes for rent, which, once built, they then manage. Third-sector organisations and unions collaborate in this, but essentially in the development for sale; and private companies are engaged solely and exclusively in developing free housing, which is where the real business lies. In this scenario, in implementing new plans, land re-served through official social housing was to stop the City Councils in the form of percentage of transfer, and these were transferred to their public companies.
The growing demand for housing at an affordable price and the availability of land led public developers, in accordance with the mandates of their parent companies, to exponentially increase their production capacity, associated with an increase in their financial debt as the only formula for carrying out the investment.
However, with the product of their activity, not only did they become economically self-sufficient in the development and ma-nagement of their assets, but this activity also left a sufficient mar-gin to be able to continue providing the rest of the services related to housing which were entrusted to it, without having any impact on the budget of the City Councils and, especially, with positive results that allowed them to promote other lines of action, such as the intervention in building and housing restoration programmes, neighbourhood remodelling, and especially in the implementation of equipment and public work.
This was the situation until the time of the GLOBAL CRISIS, which saw a sudden change in the economic cycle, which leads to the fourth phase.
In this new scenario:• The population’s demands with regard to housing have comple-
tely changed. They no longer point us towards the problem of ac-cess to housing purchases, but rather to access to affordable rental housing and the adoption of policies which allow long-term stays in the housing (responding to the mortgage foreclosures and the situations of excessive debt of rent).
/////////////////////////////////////////////////////////During the 1980s and 90s, municipalities found them-selves having to assist the population with difficulties accessing housing, and they began to promote, throu-gh their own companies, the obtaining of land and the
development of housing with official protection. /////////////////////////////////////////////////////////
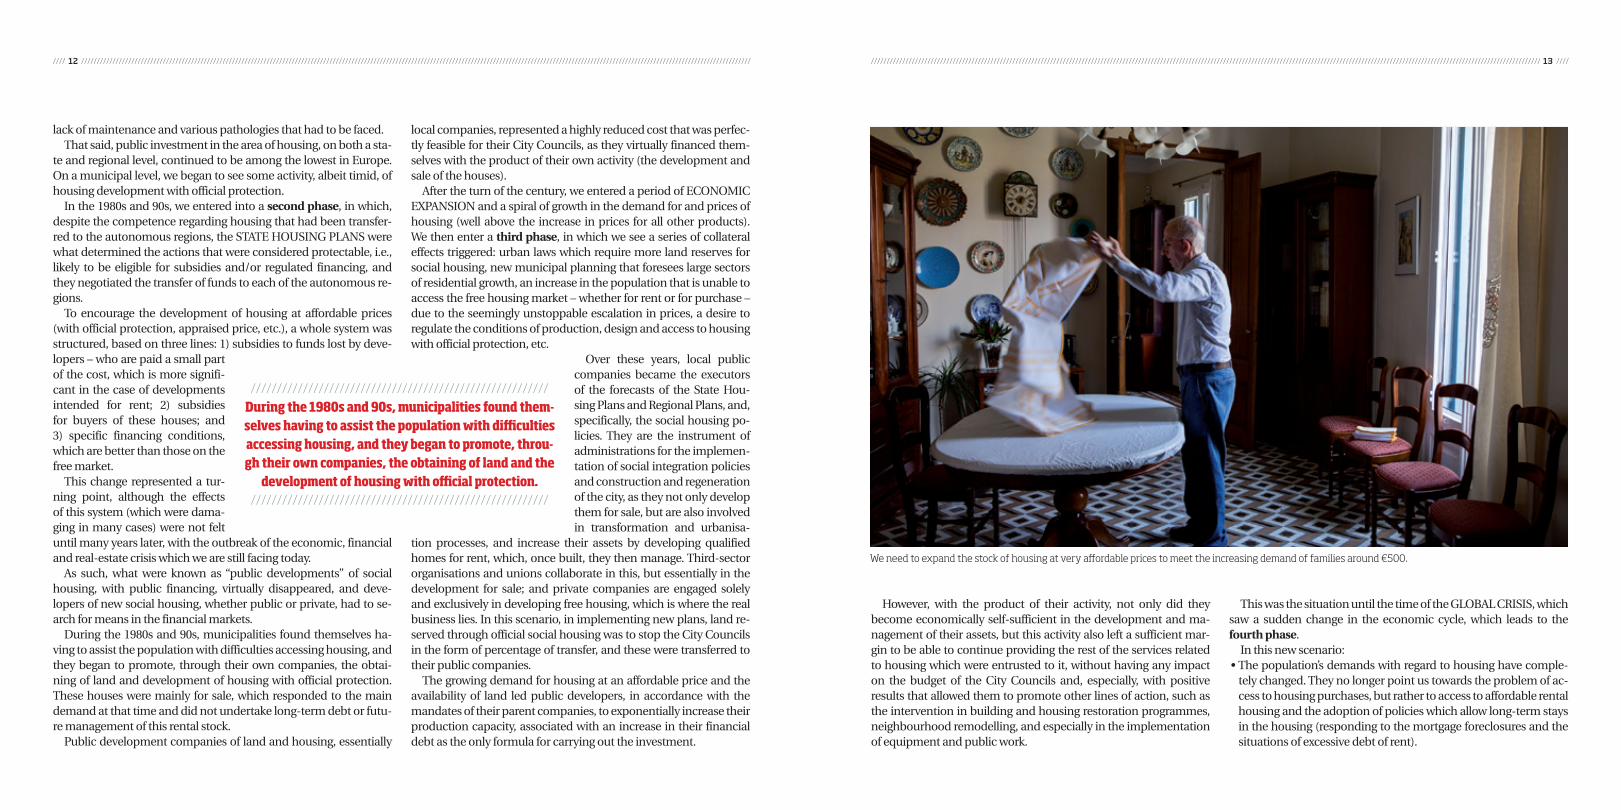
We need to expand the stock of housing at very affordable prices to meet the increasing demand of families around €500.
////////////////////////////////////////////////////////////////////////////////////////////////////////////////////////////////////////////////////////////////////////////////////////////////////////////////////////////// //////////////////////////////////////////////////////////////////////////////////////////////////////////////////////////////////////////////////////////////////////////////////////////////////////////////////////////////14 15
• The main source of income for public housing developers came to a sudden end, that of the margin in operations of development and sales of official social housing. Therefore, not only is it no lon-ger necessary, but it is rather irresponsible to encourage the deve-lopment of new housing if it is not with the direct involvement of the parent company.
• The occupants of public area rental houses often find themsel-ves in situations of extreme need, and therefore cannot even deal with the payment of social rent, with an increase in delinquency, conflict and rotation. This means increased expenses and reduced income for public developers and managers.
• It is necessary to expand the market of rental housing at highly affordable prices (much below the fixed official social housing pri-ces) to meet the ever-increasing demand of families with monthly incomes of around €500, who see access to social rental housing as their only option.
• Public companies are heavily in debt as a result of the expenses incurred in the acquisition and transformation of land and the development of housing, which cannot be placed on the market at official social housing sale prices.
• These companies’ assets are real estate, with no market exit, and they therefore do not have the op-tion of transforming them into the liquid needed to face the structu-ral and financial expenses, with the additional risk, if these are subject to taxation, of falling into a situation of equity imbalance.
• Unsold houses are used to meet the growing demand for social rent, but the income obtained is completely insufficient to cover the financial debt and the rest of the structural expenses.Faced with this situation, it had been hoped that the state admi-
nistration, the precursor of the Housing Plans – executed almost en-tirely at the municipal level – would adopt measures to cover part of the investments made by instruments of local entities or minimise the difficulties in covering the financial debt, and to make it easier for official social housing built to reach the citizens with low income, thus contributing what was necessary to ensure the viability of the companies that had developed them.
On the contrary, the latest changes to the “2009-2012 State Hou-sing and Restoration Plan” were along the lines of withdrawing the assistance foreseen by the Plan itself, and the current “2013-2016 State Plan for promoting rental housing, building restoration and urban regeneration”, despite what was announced in the explana-tory statement, does not set forth commitments with credit entities to encourage refinancing operations or financing new actions, and the assistance set forth is not enough to guarantee the viability of new operations.
If this weren’t enough, through other regulations (such as an amendment to the Urban Rental Act), assistance was removed that had been in effect and that was due to previous plans, and with Law 27/2013 of the Rationalisation and Sustainability Act, despite remai-ning the competence of the municipalities, the “development and management of public social housing” this will be the case with fi-
nancial sustainability criteria.Despite this scenario and the cri-
sis in the traditional model of social housing, which has been left with virtually no assistance, it maintains its strict regulation, by both the state and the autonomous regi-ons, which further complicates the work of public housing managers.
During these crisis years, many of the municipal land and housing companies created in the years of
the economic boom found themselves in a situation of imbalance and closed with great losses, and as such, many of them have been dissolved. Of those that remain, almost all of them have been secto-red. By this I mean that they have stopped being considered as non-fi-nancial market companies and are now considered “non-market” companies, with the automatic consolidation of their debt (usually significant debt resulting from mortgage loans to finance official soci-al rental housing development) with the debt of the parent company to the effects of verification of compliance with regulations regarding budget stability and financial sustainability. This has placed City Councils, who at the time were committed to the creation of afforda-ble rent housing areas, in a situation of excess debt.
This is not the case for the PMHB, which, as we have already mentioned, was created in 1927 to provide housing to the first mi-
gratory waves and which has managed to adapt itself and survive over times. Over its almost 100-year history, the PMHB has deve-loped more than 30,000 houses, has intervened in restoration and remodelling processes of neighbourhoods, and is currently ma-naging more than 6,000 social rent processes; it is currently in a situation of economic balance and continues to be considered as a public entity with market income, which comes mainly from rent.
In the new socioeconomic context, social housing develop-ments alone are not viable, and the management of inexpensive, social, affordable or protected housing stock (whichever name may be used) is not viable either, even though models of excellen-ce are used in its management. The years of self-financed social policies are over. In the specific case of the PMBH, with a cons-truction programme of more than 2,000 houses over the next four years, being aimed mainly for rent, it is forecast that its cost will be covered with a 30% municipal contribution included in the In-vestment Plan of the current coun-cil, and the other 70% with external financing. It would not be possible to approach it any other way.
Therefore, in order to keep the corporate form of public sector entities that provide public servi-ces in housing, the companies in this sector would have to be able to count on the necessary public contributions to cover the cost of the service entrusted to them, and be prepared to undertake this, sin-ce they have specialised staff and experience in this sector, always somewhere between profitability and optimisation of resources and the public service being provided. Alternatively, this cost would have to be undertaken directly by the company providing the service.
We are witnessing the gradual adaptation and transformation of many of the surviving public companies, traditionally mainly aimed at developing land and housing, to other actions in social housing policies that provide services locally, such as: the management of its own rental housing area developed over the years; service brokerage for free rental housing to individuals; all of the services of the Local Housing Offices with agreements with the Catalan government; ser-vice for emergency housing, evictions and, ultimately, the one-stop housing service for citizens.
Having reached this point, we can see that we have reached a fifth phase, in which a major transformation is under way of the model and system to be adapted to the new circumstances and current de-mands of society regarding housing. We must, however, think about developing new policies that facilitate the access to housing and long-term stay of citizens with low income and that have enough resources to guarantee this access and long-term stay as just anot-her public service.
Barcelona has advanced in one aspect that we consider to be very important: adopting a stable municipal assistance system for rent payment for users of the public areas managed by the PMHB. This assistance is structured around two agreements signed with the Department of Social Rights of the City Council: one exclusively for senior citizen housing (currently 22 developments with 1,200 users), and the other, which was created in 2010, for housing for vulnerable
groups and the emergency office (with a further 1,000 beneficiaries). Pursuant to these agreements, and regardless of the rent amount for each house, tenants pay based on a percentage of their income, and the difference is paid directly to PMHB by way of an income subsidy.
We have also made progress when promoting agreements with financial entities and major holders
to make empty homes available for social rent, whether through agreements obtaining usufruct for a period of 8 years (with SAREB and with LA CAIXA), or with the purchase by way of first refusal, as set forth in DL 1/2015, or direct purchase of housing, which then become part of the municipal assets.
The Municipal Housing Board, with its 100-year history, is dealing with the new housing challenges during these times of change , and hopes to be ready to respond to what is coming now and what is to come in the future. Å
/////////////////////////////////////////////////////////We should think about developing new policies that
facilitate access to housing and long-term stay of citi-zens with low incomes and that have enough resour-
ces to guarantee this access and long-term stay as just another public service.
/////////////////////////////////////////////////////////
/////////////////////////////////////////////////////////During the almost 100 years since its foundation, the PMHB has developed more than 30,000 dwellings, it
has been involved in and is involved in processes for the rehabilitation and remodelling of districts and currently
administers more than 6,000 dwellings./////////////////////////////////////////////////////////

›››››››››››Housing policies

›››››››››››››››››››››››››››››››››››››››››››››››››››››››››››››››››››››››Which future for housing policies after the crisis?
The crisis hasn’t spared social housing. Econo-mic models based on banking finance from the market and significant public aid have not
coped well. The UK, Ireland, Italy, Spain and Portugal are experiencing breaks in the continuity of public so-cial housing service by stopping construction of new housing. The withdrawal of banks from the sector and the suppression of public aid for investment has stopped any new offer of social housing in its tracks.
By contrast, economic models based on long term financing mechanisms that are highly regulated, such as dedicated savings accounts or real estate bonds (Denmark, Austria, France) and on diversified public aid have coped with the crisis better. In these countri-es, social housing plays a countercyclical role in terms of investment and jobs while ensuring continuity in the public service and the availability of an affordable supply of housing.
The EU influence is structural. The choices of or-ganisation, financing and definition of the scope of intervention on the housing market are strictly fra-med by Brussels. The principle of subsidiarity, the wide discretionary margins of appreciation in the de-finition of this public service mission are not coping with what is been challenged by the Commission in the context of this check on state aid for Dutch local authority housing. Private operators have rushed into this gap, with a big increase in the number of com-
plaints in Sweden, the Netherlands, Belgium, Luxem-bourg and lately in France. This mobilisation of pri-vate actors is proportional to the effectiveness of the social sector to influence the general conditions of ac-cess to housing. The bigger and more structured it is, the more it is attacked. Brussels has become a com-pulsory gateway for private actors to challenge the choices of national parliaments in terms of housing policy on which they have not been able to exert their influence in the context of the national debate. These complaints have led to in-depth reforms of the scope of the economic model for social housing in the Net-herlands and Sweden. Challenging the principle of universal access mobilby introducing a single ceiling of income of €33,000 per year has deeply shaken the Dutch economic model for social housing and the residential mobility of households. In addition to the administrative burden of checking the income of two million household tenants, a number of them have found themselves, from one day to the next, between two stools: too rich to access or maintain themselves in social housing but not rich enough to access the private sector. More worrying is the fact that a form of blackmail has emerged in the Community dispute. In a striking example in Sweden, private operators with-drew their complaint for state aid for social housing on the same day that the government announced it was giving up classifying the communal public area
›››››››››››››››››››››››››››››Laurent GhekiereChairman of Housing Europe Observatory
01Social and urban diversity and accessibility to housing options are the main challenges facing European cities.
›››››››››››››››››››››››››››››››››››››››››››››››››››››››››››››››››››››››››››››››››››››››››››››››››››››››››››››››››››››››››››››››››››››››››››››››››››››››››››››››››››››››››››››››››› ››››››››››››››››››››››››››››››››››››››››››››››››››››››››››››››››››››››››››››››››››››››››››››››››››››››››››››››››››››››››››››››››››››››››››››››››››››››››››››››››››››››››››››››››››20 21
of services of general public interest and therefore the public service compensation granted to municipal housing companies. They thus obtained via Brussels what the Swedish parliament had refused them up until now in the name of social democracy and the effective implementation of the right to housing for everyone. In addition, instead of the legal security promised, we see a growing dispute and an increase in the number of state aid checks, in particular in the allocation of Structural Funds.
The recent measures adopted in the area of econo-mic governance have amplified the intensity of this influence. The country-specific recommendations defined in the context of the ‘European semester’ are binding measures that may challenge the political choices of EU member states in terms of rental po-licy. For example, can the Swedish parliament refuse to abrogate the framing of rents, a recommendation proposed by DG Ecfin and approved in the Council of Ministers? What about the EU member states right to preserve their so-called ‘exclusive’ competence in terms of housing policy? This is a subsidiarity sub-ject to a toll of some kind. It is a hot issue in France where such a framing of rents is being debated in the National Assembly and in the Senate as part of the Duflot law inspired by the German model. How can countries thus undo in the Council existing legislative provisions in domestic law or being debated in their own parliament?
As for Greece’s recovery plan imposed by the Troika, this has led to the suppression of social hou-sing considered as not necessary for a good that does not come under the category of primary need. The issue of the legitimacy of these decisions is now being asked on the eve of the European elections. This is because, beyond the issue of the conflict over compe-tence, these decisions directly impact the purchasing power of several million households as housing is not only the main item of their expenditure but an item that keeps going up. How can one explain to Euro-peans that, in terms of state aid or macroeconomic
governance, the European Parliament has been quite simply swept aside from the legislative process?
Numerous factors contribute to the maintenance of a high level of demand for housing in the EU. Resi-dential mobility is growing and comes hand in hand with professional mobility and demand is concen-trated in the urban areas where jobs and services are to be found but also where the shortcomings of the market are structural in terms of accessibility.
The demographic and sociological evolutions weaken the creditworthiness of demand, in particu-lar for elderly people and single parent families, whe-re the offer is either unsuitable in terms of products or inaccessible in terms of costs.
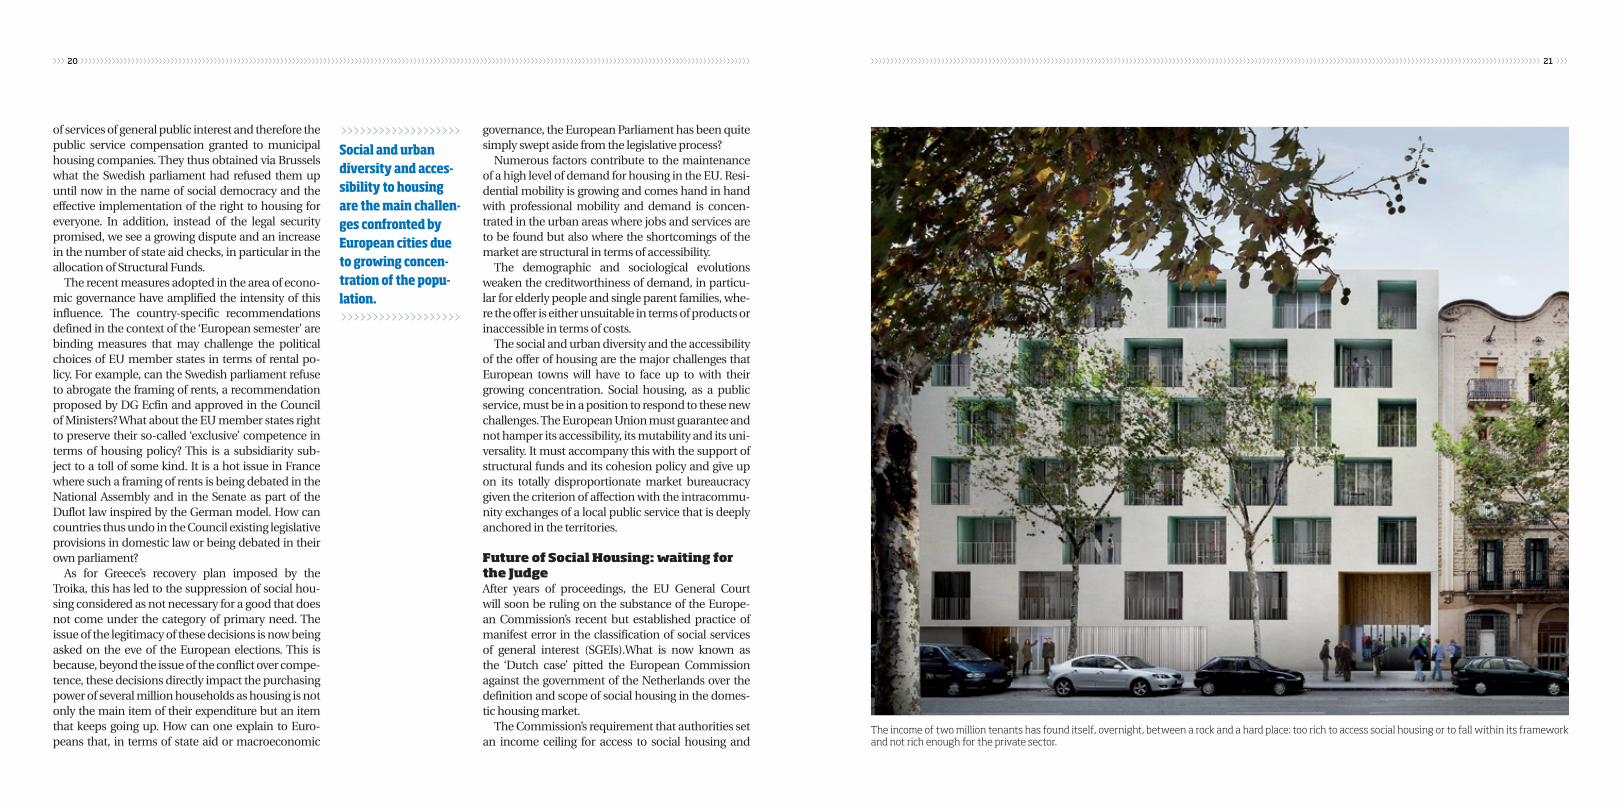
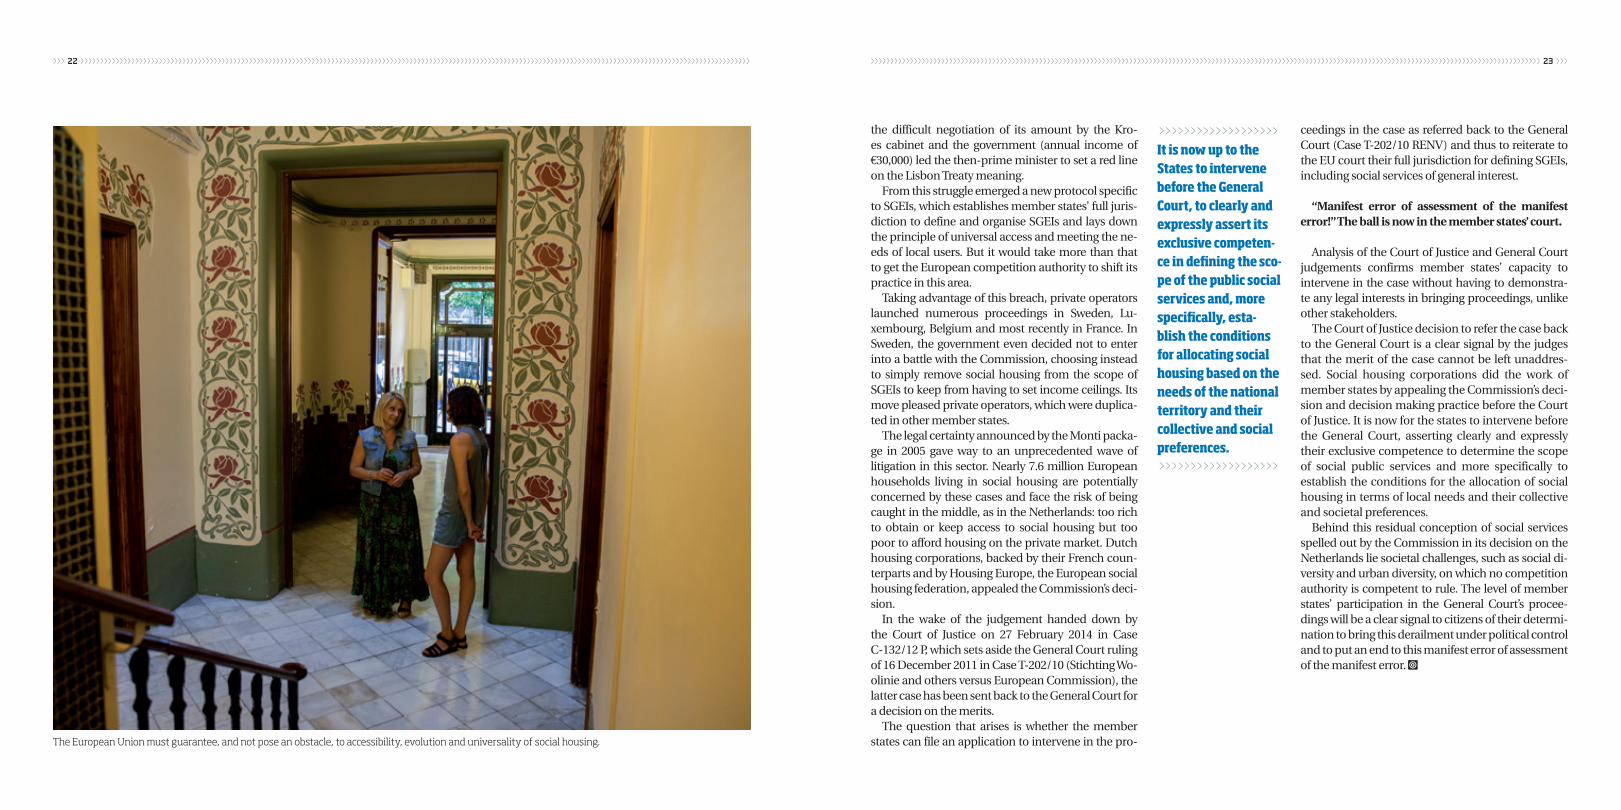
The social and urban diversity and the accessibility of the offer of housing are the major challenges that European towns will have to face up to with their growing concentration. Social housing, as a public service, must be in a position to respond to these new challenges. The European Union must guarantee and not hamper its accessibility, its mutability and its uni-versality. It must accompany this with the support of structural funds and its cohesion policy and give up on its totally disproportionate market bureaucracy given the criterion of affection with the intracommu-nity exchanges of a local public service that is deeply anchored in the territories.
Future of Social Housing: waiting for the JudgeAfter years of proceedings, the EU General Court will soon be ruling on the substance of the Europe-an Commission’s recent but established practice of manifest error in the classification of social services of general interest (SGEIs).What is now known as the ‘Dutch case’ pitted the European Commission against the government of the Netherlands over the definition and scope of social housing in the domes-tic housing market.
The Commission’s requirement that authorities set an income ceiling for access to social housing and
>>>>>>>>>>>>>>>>>>>Social and urban diversity and acces-sibility to housing are the main challen-ges confronted by European cities due to growing concen-tration of the popu-lation.>>>>>>>>>>>>>>>>>>>
The income of two million tenants has found itself, overnight, between a rock and a hard place: too rich to access social housing or to fall within its framework and not rich enough for the private sector.
›››››››››››››››››››››››››››››››››››››››››››››››››››››››››››››››››››››››››››››››››››››››››››››››››››››››››››››››››››››››››››››››››››››››››››››››››››››››››››››››››››››››››››››››››› ››››››››››››››››››››››››››››››››››››››››››››››››››››››››››››››››››››››››››››››››››››››››››››››››››››››››››››››››››››››››››››››››››››››››››››››››››››››››››››››››››››››››››››››››››22 23
the difficult negotiation of its amount by the Kro-es cabinet and the government (annual income of €30,000) led the then-prime minister to set a red line on the Lisbon Treaty meaning.
From this struggle emerged a new protocol specific to SGEIs, which establishes member states’ full juris-diction to define and organise SGEIs and lays down the principle of universal access and meeting the ne-eds of local users. But it would take more than that to get the European competition authority to shift its practice in this area.
Taking advantage of this breach, private operators launched numerous proceedings in Sweden, Lu-xembourg, Belgium and most recently in France. In Sweden, the government even decided not to enter into a battle with the Commission, choosing instead to simply remove social housing from the scope of SGEIs to keep from having to set income ceilings. Its move pleased private operators, which were duplica-ted in other member states.
The legal certainty announced by the Monti packa-ge in 2005 gave way to an unprecedented wave of litigation in this sector. Nearly 7.6 million European households living in social housing are potentially concerned by these cases and face the risk of being caught in the middle, as in the Netherlands: too rich to obtain or keep access to social housing but too poor to afford housing on the private market. Dutch housing corporations, backed by their French coun-terparts and by Housing Europe, the European social housing federation, appealed the Commission’s deci-sion.
In the wake of the judgement handed down by the Court of Justice on 27 February 2014 in Case C-132/12 P, which sets aside the General Court ruling of 16 December 2011 in Case T-202/10 (Stichting Wo-olinie and others versus European Commission), the latter case has been sent back to the General Court for a decision on the merits.
The question that arises is whether the member states can file an application to intervene in the pro-
ceedings in the case as referred back to the General Court (Case T-202/10 RENV) and thus to reiterate to the EU court their full jurisdiction for defining SGEIs, including social services of general interest.
“Manifest error of assessment of the manifest error!” The ball is now in the member states’ court.
Analysis of the Court of Justice and General Court judgements confirms member states’ capacity to intervene in the case without having to demonstra-te any legal interests in bringing proceedings, unlike other stakeholders.
The Court of Justice decision to refer the case back to the General Court is a clear signal by the judges that the merit of the case cannot be left unaddres-sed. Social housing corporations did the work of member states by appealing the Commission’s deci-sion and decision making practice before the Court of Justice. It is now for the states to intervene before the General Court, asserting clearly and expressly their exclusive competence to determine the scope of social public services and more specifically to establish the conditions for the allocation of social housing in terms of local needs and their collective and societal preferences.
Behind this residual conception of social services spelled out by the Commission in its decision on the Netherlands lie societal challenges, such as social di-versity and urban diversity, on which no competition authority is competent to rule. The level of member states’ participation in the General Court’s procee-dings will be a clear signal to citizens of their determi-nation to bring this derailment under political control and to put an end to this manifest error of assessment of the manifest error. Å
>>>>>>>>>>>>>>>>>>>It is now up to the States to intervene before the General Court, to clearly and expressly assert its exclusive competen-ce in defining the sco-pe of the public social services and, more specifically, esta-blish the conditions for allocating social housing based on the needs of the national territory and their collective and social preferences.>>>>>>>>>>>>>>>>>>>
The European Union must guarantee, and not pose an obstacle, to accessibility, evolution and universality of social housing.
›››››››››››››››››››››››››››››››››››››››››››››››››››››››››››››››››››››››Housing policies across the EU: latest developments
In 2011, the EU Network of Independent Experts on Social Inclusion warned that ‘housing and re-lated services emerge as one area which has been
particularly adversely affected by the economic and financial crisis’. Data from Eurostat on governments’ expenditure on “housing and communities’ ameniti-es” confirm that on average public support for hou-sing in the EU 27 has decreased, from 1.1% of GDP in 2003 to 0.8% in 2012.
Nevertheless, the fact that the formation of real estate bubbles has proven to be dangerous for the overall stability of the economy, and that the social and economic impact of the crisis is making access to good quality and affordable housing harder for a large share of the population, seems to have put housing back on the political agenda both at the European le-vel and in many member states.
Looking at recent developments in EU countries, over the past 3 – 4 years, we have identified some key policy issues which at least two or more countries have in common.
Tackling over-indebtedness Some member states were faced with a huge problem of defaulting mortgages that affected on the one hand over-indebted households who risked losing their
homes or simply could not cope with repaying their debt and on the other had the potential to further dis-rupt the stability of the banking system. This led to di-fferent measures: for instance, Italy and Spain set up programmes to support vulnerable defaulting hou-seholds through solidarity funds, and Hungary and Ireland established ‘mortgage to let’ schemes. There were also temporary moratoria on repossessions as well as legal protection for households in debt at risk of losing their primary residence (Ireland, Portugal, Greece, later Spain). The Netherlands and Denmark encouraged re-negotiation of mortgage debt.
Tackling taxation bias towards home ownership At the same time, many countries took the decision to modify tax subsidies incentivising high mortga-ge indebtedness that had for decades supported sustained growth of home ownership and pushed up house prices. For instance, reduction of mort-gage interest deductibility was implemented in the Baltic countries, as well as in the Netherlands and Belgium although in the two latter cases the pha-sing out of such incentives will take some time. On the contrary, no changes to the taxation supporting home owners were implemented in Sweden. This
›››››››››››››››››››››››››››››European Fede-ration of Public Cooperatives and Social Housing
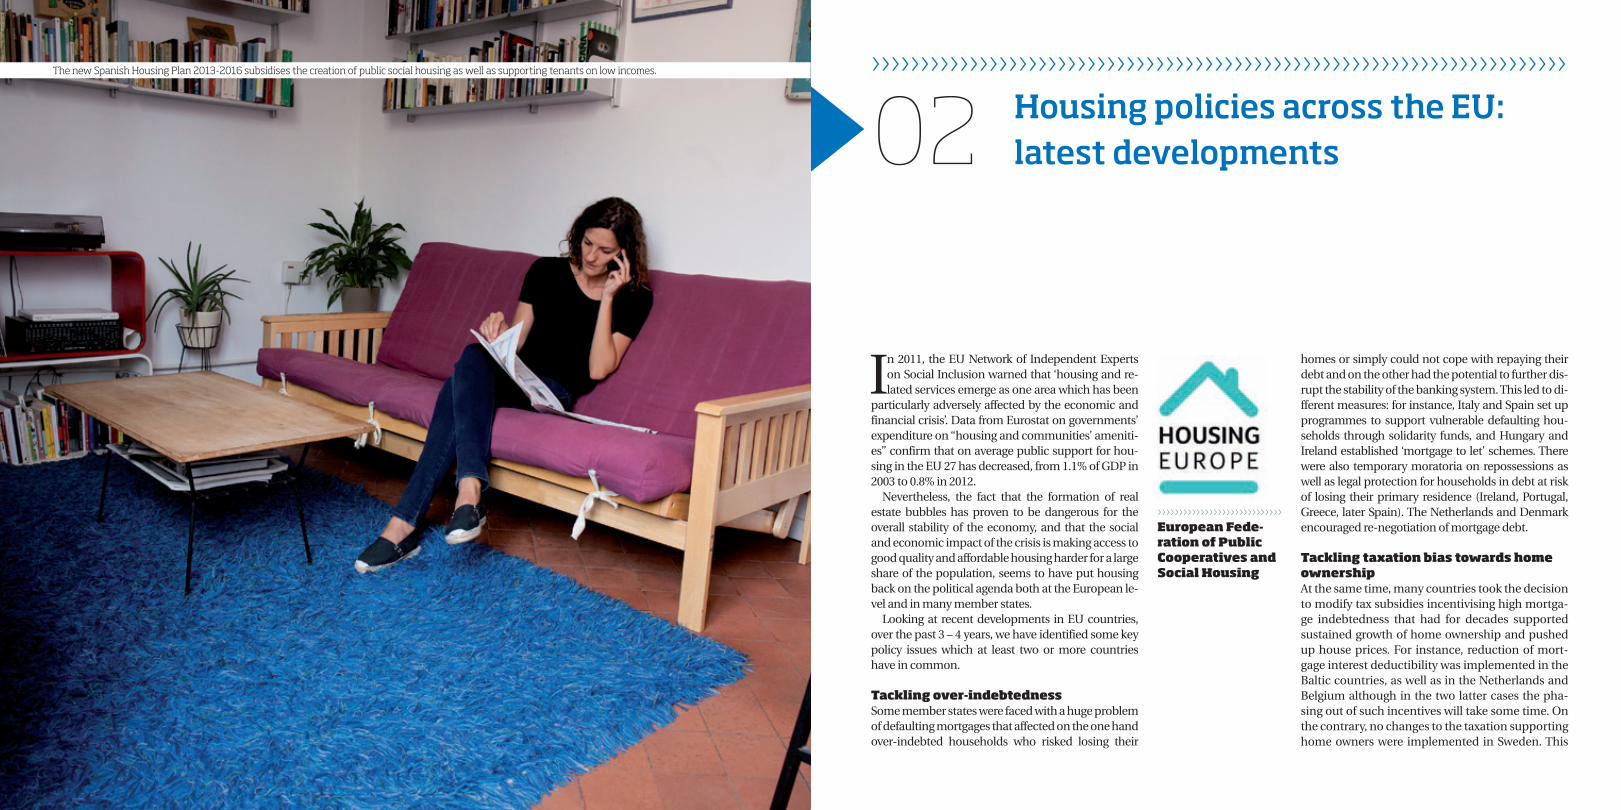
02The new Spanish Housing Plan 2013-2016 subsidises the creation of public social housing as well as supporting tenants on low incomes.
›››››››››››››››››››››››››››››››››››››››››››››››››››››››››››››››››››››››››››››››››››››››››››››››››››››››››››››››››››››››››››››››››››››››››››››››››››››››››››››››››››››››››››››››››› ››››››››››››››››››››››››››››››››››››››››››››››››››››››››››››››››››››››››››››››››››››››››››››››››››››››››››››››››››››››››››››››››››››››››››››››››››››››››››››››››››››››››››››››››››26 27
kind of measures, complemented by banks’ more restrictive lending policies, are leading to less de-mand for home ownership.
Fostering the rental market Interestingly, Spain and Portugal, two countries characterized by a high rate of home ownership and small rental sector, very recently introduced reforms to their tenancy law. In both cases the re-form followed recommendations in this sense from the European Commission (through the 2011CSRs in the case of Spain, and through the Economic Ad-justment Programme in the case of Portugal), and reforms go in the direction of giving more flexibi-lity to landlords for instance to increase rents and speeding up the eviction process, although with reference to protection of the most vulnerable te-nants. At the same time in the Netherlands a com-plex process of reform of the rent setting system is on-going, aimed at splitting the rental sector into a regulated social sector and a non-regulated rental sector which is supposed to attract investment by private actors. In Germany, the rent setting system is also being reviewed but in the opposite direction, with the introduction of further caps to rent increa-ses in high demand areas from 2015.
Reforming social housingIn recent years, a number of countries characterized by a small social housing sector have started deve-loping new social housing programmes. This is true for a number of CEE countries: for instance, Bulgaria recently started a pilot project for social housing for vulnerable and minority groups. A new social hou-sing concept is under discussion in Czech Republic, including temporary housing for emergency situati-ons, as well as provision by the municipality both of social housing and affordable housing; the first one being more socially targeted while affordable housing would be allocated to people below the established income ceiling, with possibility to raise the rent if the
income increases. Lithuania has announced a pro-gramme for the development of subsidised housing. Slovakia is finalizing a new concept of state housing policy which includes strengthening and developing the public rental sector.
Also countries in Southern Europe have adopted plans to support new social housing provision: Por-tugal introduced the new programme ‘Social Rental Market’; the new housing plan in Italy includes fun-ding for the renovation of public social housing as well as funding to the regions to increase social hou-sing supply; and the new Spanish State Housing Plan 2013-2016 subsidises the creation of public social rental housing as well as support to tenants on low income (after cuts to subsidies in 2011 had almost completely stopped social housing construction). Ireland has announced a 6-year strategy to supply 35 000 social housing units, and a thorough reform of social housing delivery and management. This new programmes comes two years after radical cuts in public funding to the sector. Luxemburg has introdu-ced financial measures to foster construction of affor-dable housing and also started supporting provision of new rental housing through planning obligations.
Meanwhile, measures adopted in the Netherlands such as the establishment of an income ceiling for social housing and the introduction of a new levy on housing corporations are leading to a decrease in production of new social dwellings. In England, overall provision of affordable housing, including social rent, affordable rent, intermediate rent and af-fordable home ownership, peaked at 60 480 units in 2010-11 but decreased afterwards to 42 870 units in 2013-14.
In Belgium, Spain and Italy there is an on-going process of restructuring the social housing sector and in particular through mergers of social housing pro-viders.
in Greece, he only body providing housing support in the form of housing allowances and guaranteed on housing loans, OEK, was abolished in 2012 as part of
>>>>>>>>>>>>>>>>>>>Spain and Portugal are characterised as having a high ratio of property owners and a rather small property rental sec-tor, and both have recently introduced legal reforms in relation to rental properties.>>>>>>>>>>>>>>>>>>>
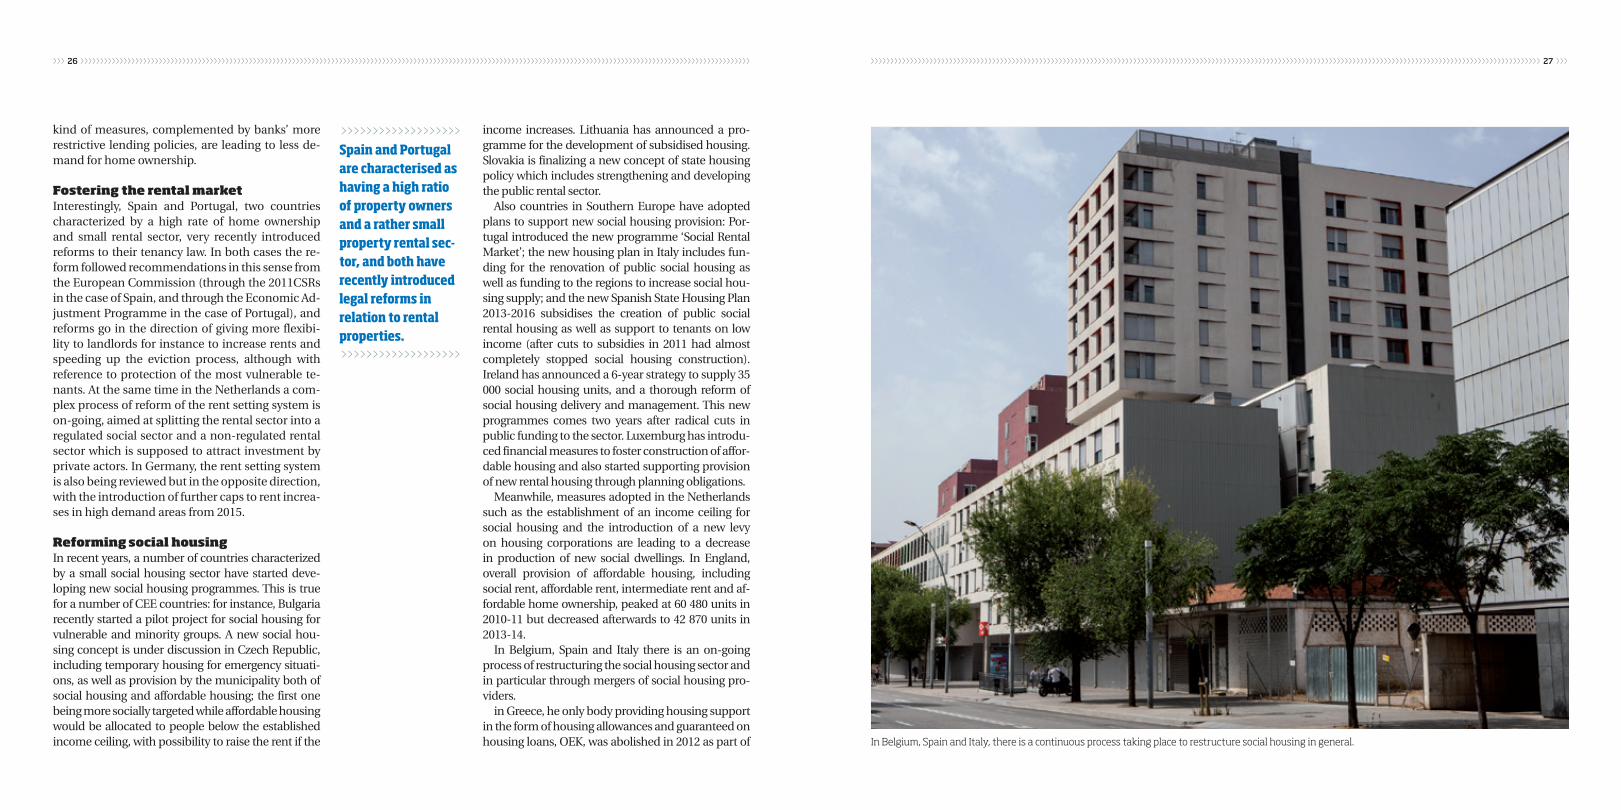
In Belgium, Spain and Italy, there is a continuous process taking place to restructure social housing in general.
›››››››››››››››››››››››››››››››››››››››››››››››››››››››››››››››››››››››››››››››››››››››››››››››››››››››››››››››››››››››››››››››››››››››››››››››››››››››››››››››››››››››››››››››››› ››››››››››››››››››››››››››››››››››››››››››››››››››››››››››››››››››››››››››››››››››››››››››››››››››››››››››››››››››››››››››››››››››››››››››››››››››››››››››››››››››››››››››››››››››28 29
austerity measures. There have been no comprehen-sive attempts as of today to re-establish some form of social housing.
Mobilizing existing housing stock as private property for social use For instance, Belgium and Luxemburg have establis-hed social rental agencies that act as an intermediary between private landlords and low-income house-holds. Most recently there have been attempts to im-plement similar models in Italy, Spain and Hungary. Italy also provides tax incentives to landlords who are willing to charge moderate rents, agreed with the municipality, and has recently increased the related tax benefits. Malta has recently launched a program-me to mobilize privately owned vacant homes for social housing, by guaranteeing rent benefits to the occupants. Ireland and Spain have implemented programmes to use empty homes owned by banks as social housing, and a similar scheme was recently launched in Portugal.
Taxation of empty homes is also being applied, in some cases at local level (Brussels, some Spanish municipalities), in other cases at national level (Por-tugal).
Another very interesting development is that some countries are trying to tackle speculation on land price, for instance through leasing instead of selling public plots in Luxemburg, or through Community Land Trusts (CLT) in Belgium.
Introduction/increase of housing allowancesLithuania has recently introduced rent allowances, and Latvia and Bulgaria have increased the amount of housing benefits, although it remains limited. Lu-xemburg introduced rent subsidies, which in 2011 constituted the largest category of aid by the local social offices. Most recently, the Greek parliament adopted a ‘humanitarian crisis’ bill which includes the temporary introduction of housing allowances
as well as a minimum quota of free electricity for the poorest households.
Programmes to facilitate access to home ownership Italy, Slovakia and Poland have launched program-mes aimed at helping young people / young couples to buy their first home. Romania and Slovenia also provide state guarantees on mortgage loans for first time buyers. England continues to support the Help to Buy scheme which provides equity loans or mort-gage guarantees, and similar programmes exist also in Scotland, Wales and Northern Ireland. In England there is also a possibility for tenants of housing as-sociations and councils to buy their home through Right to Buy/Right to acquire schemes while Scot-land terminated its right to buy programme and the scheme is under discussion in Wales.
Introduction of homelessness strategy In early 2014 the European Parliament adopted a Re-solution on an EU homelessness strategy. The report urges among other measures the Member States to ‘develop social and affordable housing adapted for the most vulnerable individuals in order to prevent social exclusion and homelessness’. Among the EU Member States, Czech Republic, England, Ireland, Luxemburg, Northern Ireland all launched a new ho-melessness strategy recently. Å
* The text is a chapter from the “State of Housing in the EU 2015” report issued by the Housing Europe Observatory.You may access the full report online www.housin-geurope.eu/resource-468/the-state-of-housing-in-the-eu-2015
>>>>>>>>>>>>>>>>>>>In some countries they are attemp-ting to confront the phenomenon of land speculation: for example, Luxem-bourg leases, rather than sells, its public land to Belgium through Community Land Trusts (CLT).>>>>>>>>>>>>>>>>>>>
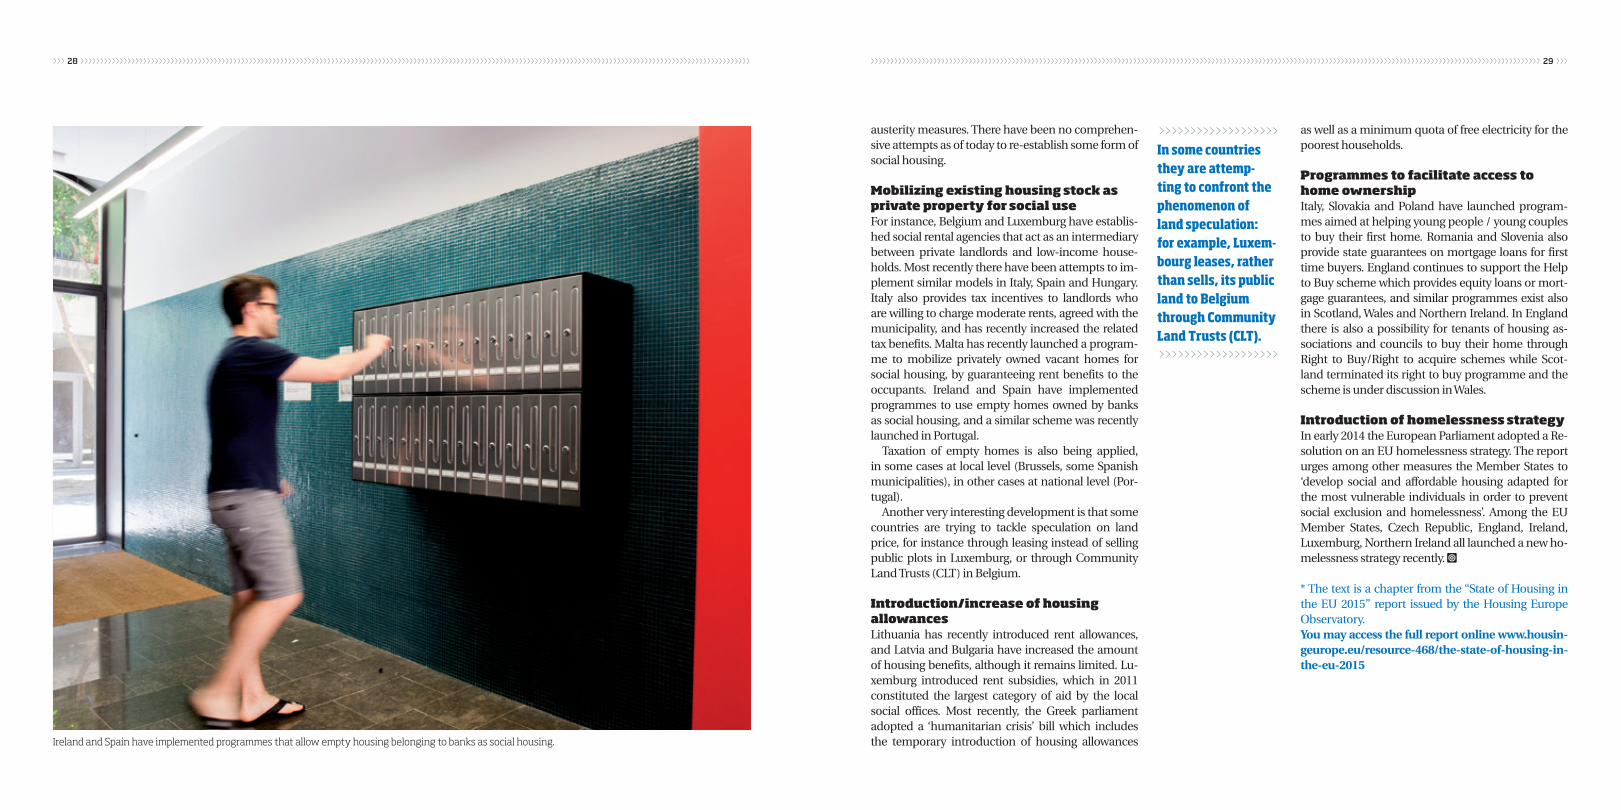
Ireland and Spain have implemented programmes that allow empty housing belonging to banks as social housing.
›››››››››››››››››››››››››››››››››››››››››››››››››››››››››››››››››››››››Models of municipal housing policy in Europe and America
6.1. Presentation of studyThis article is an excerpt of research commissioned by the PMHB in order to collect references on mo-dels of housing policies and systems providing social housing in other cities of Europe and the world. To address the next Barcelona housing plan, the oppor-tunity arises to discuss tools, strategies and lines of action that are implemented in other countries to solve issues such as access to housing or the manage-ment of the public stock of social housing, analysing these policies. The essential motive is to better un-derstand how these policies have been formed and try to extrapolate elements to the context of the city of Barcelona.
In the European context, there are four distinct models of welfare state with a clear impact on the structure, form of access and type of tenancy that make up the housing market. The social democratic model, based on the principle of universality, is a refe-rence for countries with a higher level of social rental housing. The corporatist model develops the princi-ple of subsidiarity, which encourages competition in the rental market in general, although private sector rentals exceed the social. The liberal model, based on restrictive social protection, promotes the status of owner/occupant, despite social rentals having a sig-nificant presence. The Mediterranean model deploys minimum social protection in housing, encourages the status of owner/occupant, produces a decline in renting and has little regard for social rentals.
The work was based on case studies from docu-mentary analysis, with information obtained from the review of various bibliographic sources, docu-ments and statistics from different cities in Euro-pe and America. The study addresses the cities of Amsterdam, Paris and Berlin with their corporatist systems, and London in Europe and New York and Bogotá in the Americas, all three with liberal systems. These welfare models would be in contrast to the Me-diterranean model exemplified by the city of Barcelo-na. The sample selected to develop the case studies is geared to the thematic interests and research questi-ons and to address a diversity of contexts in both hou-sing policy and socio-economic and urban issues.
Addressing this reflection is very relevant at a time when it seems that policy and action lines in housing are not able to meet all the needs of the population and it is necessary to consider a change in strategy. The tradition of housing policies in Spain, after more than a century of existence, is revealed in the figures, measures and continuing forms of intervention. It is marked by a boost in home ownership and indiscri-minate development in terms of construction. They have left the legacy of one of the largest stocks of hou-sing in relation to the number of households and pe-ople in Europe, but with a structural lack of housing for the most vulnerable social sectors.
In Europe, the concept of social/affordable housing identifies homes with prices below the free market pri-ce as being subject to certain routes of direct control
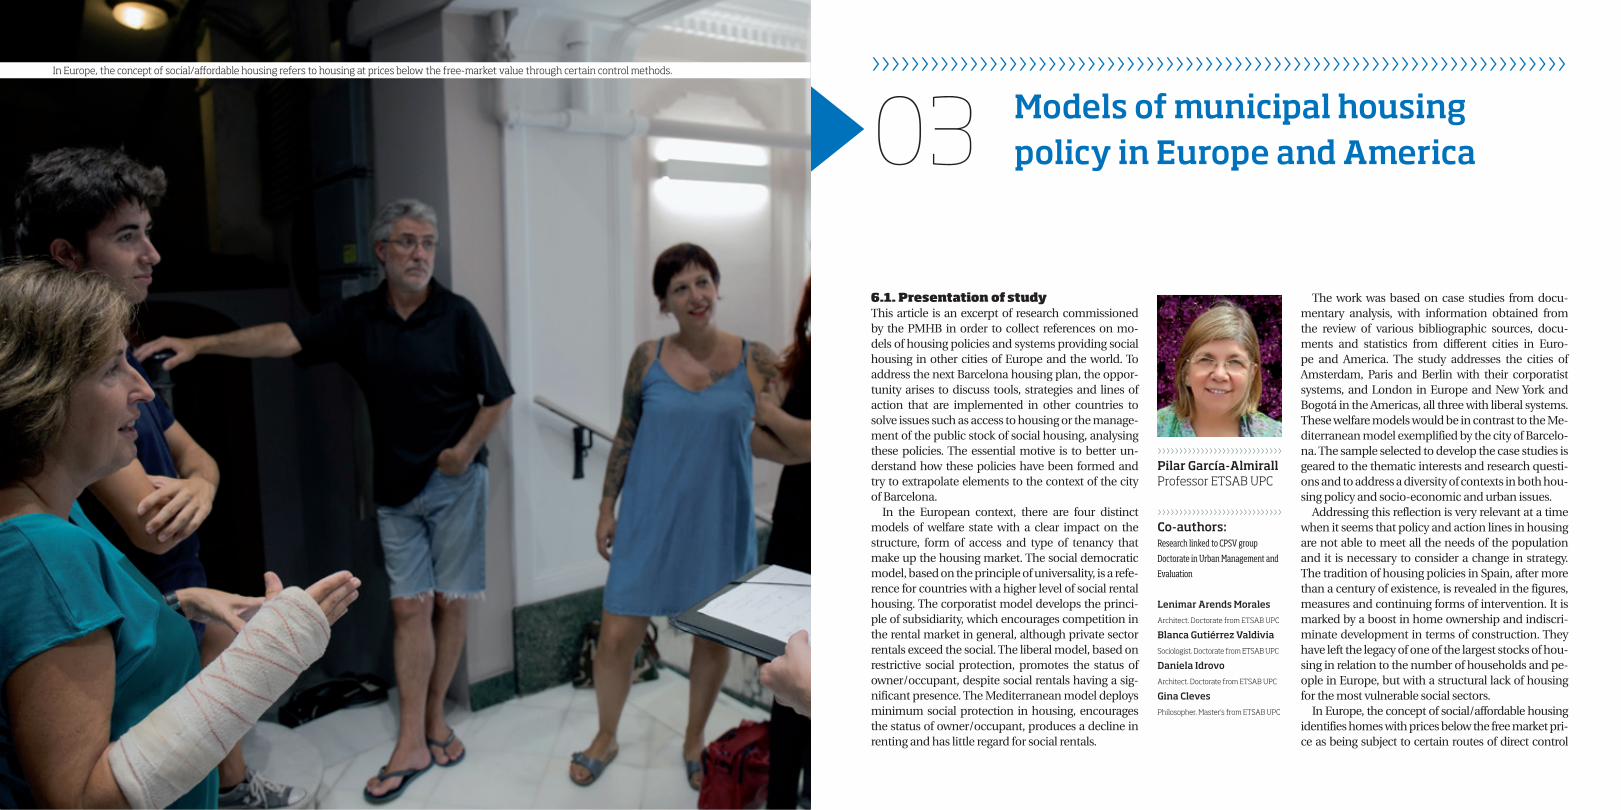
03In Europe, the concept of social/affordable housing refers to housing at prices below the free-market value through certain control methods.
›››››››››››››››››››››››››››››Pilar García-AlmirallProfessor ETSAB UPC
›››››››››››››››››››››››››››››Co-authors:Research linked to CPSV group
Doctorate in Urban Management and
Evaluation
Lenimar Arends Morales
Architect. Doctorate from ETSAB UPC
Blanca Gutiérrez Valdivia
Sociologist. Doctorate from ETSAB UPC
Daniela Idrovo
Architect. Doctorate from ETSAB UPC
Gina Cleves
Philosopher. Master’s from ETSAB UPC
›››››››››››››››››››››››››››››››››››››››››››››››››››››››››››››››››››››››››››››››››››››››››››››››››››››››››››››››››››››››››››››››››››››››››››››››››››››››››››››››››››››››››››››››››› ››››››››››››››››››››››››››››››››››››››››››››››››››››››››››››››››››››››››››››››››››››››››››››››››››››››››››››››››››››››››››››››››››››››››››››››››››››››››››››››››››››››››››››››››››32 33
(such as limiting prices) or indirect control (through information databases on prices/public revenues). The tenancy regime and suppliers vary according to the model of the welfare state in each case. The histo-rical course of each city’s housing policy is also a factor that has a major impact on current policies. The stock of social rental housing - which is on the decline - has an important weight on the total housing stock; in Pa-ris it is 17%, London 23%, Berlin 30%, New York 42% and Amsterdam 48%. Meanwhile, Bogotá offers only home ownership.
The main areas of study are oriented toward lear-ning about:
Tools for planning and action in housing that defi-ne the long-term strategy, such as agendas; and shor-ter term local housing plans linked to the direct needs of each city. Instruments that attempt to scale the ne-eds and incentivise actions, with adequate coverage.
The housing supply system, identifying the diffe-rent provider entities including associations, com-panies and housing cooperatives, which are often non-profit. Operational capacity and volume of acti-vity and their significance due to their traditions and self-financing capacity, such as guarantee funds, or securing of aid, among others. These entities often deal with the management of housing stock, maintai-ning and renovating it. They also act in the allocation of housing, oversight of use and monitoring of users to optimise their ability to offer the “social housing” service that the city needs, always within its availabi-lity.
Public investment that is directed to housing in each country, funding sources that support munici-pal housing programs aimed at housing production, the type of aid to access or subsidise rentals or for the rehabilitation of the building stock.
Finally, the capacity of local government action according to the powers and budgetary autonomy in each case and subordinate actions of agents such as housing associations and other entities.
6.2. Comparative view Comparative reading about models of housing policy and the ensuing activities is shown in Table 2, which details in summary each of the above axes. An inte-resting view that illustrates the scope of the actions carried out in each city and reflects elements that are most common, of those that are most unique. This profiles certain relevant elements that help underpin the dimension in action; they reinforce skills and ope-rational capacity of local governments. Before refer-ring to it, it is necessary to note some considerations to provide context for certain starting situations.
We must first contextualise by pointing out that action on housing transcends the political, econo-mic, legislative and competency frameworks of lo-cal governments in general. In the Spanish case, the active dynamics of production, sale and quick profit expectations have encouraged investment and the high price of housing. They have therefore caused the greatest difficulties of access.
To reverse this situation requires a cultural change of the whole society and of the economic structures that since the dawn of the “era of developmentalism” have used residential construction as an economic engine. Such a change would make it possible to re-serve a space for the concept of housing as a primary need as well as a durable asset, with long-term appli-cations for its useful life and its social function pro-viding shelter, roots and fulfilment of human needs. Progress in this area depends not only on municipal initiatives and policies on housing issues, but must also be seen as a social commitment. It requires the tacit and coordinated will of various public authori-ties in developing a wide range of measures that ad-dress economic, city planning and tax issues.
A second need is to explain that the cities studied
represent societies with very different socio-econo-mic levels (see Table 1), especially in reference to the cost of living. This requires some kind of differentiati-on in terms of wages between the different countries. For example, the comparison between wage levels, taking as a basis the minimum wage and compa-ring based on units of equivalence proposed by the World Bank, shows the Spanish minimum wage to be just above Colombia (0.51) and well below countries such as Germany (2.01) the Netherlands (1.86), Fran-ce (1.80), the United Kingdom (1.68) and the United States (1.24).
Country Monthly minimum Comparable minimum Equivalent salary
wage wage rate
Germany € 1,445 USD 23,835 USD 2.01
Colombia $ 589,500 USD 6,109 USD 0.51
USA USD 1,232 USD 14,784 USD 1.24
France € 1,430 USD 21,447 USD 1.80
Netherlands € 1,485 USD 22,268 USD 1.87
UK £ 1,105 USD 19,961 USD 1.68
Spain € 649 USD 11,887 USD 1.00
A third question refers to the concept noted in the introduction and the significance of social housing. European models feature a housing stock in tenan-cy regimes that maintain the enduring nature of so-cial housing and serve to de-commodify part of the housing stock to meet the housing needs of the po-pulation. This situation is achieved by action with a long tradition, which involves the creation of orga-nisations such as housing associations (Amsterdam, Berlin, London) or equivalent companies (see table 2) (Paris, New York).
Table 1 Comparable minimum wage equivalence
>>>>>>>>>>>>>>>>>>>The social housing stock, which is in decline, has a signi-ficant weight over the total stock; Paris 17%; London 23%; Berlin 30%; NY 42%; and Amsterdam 48%.>>>>>>>>>>>>>>>>>>>
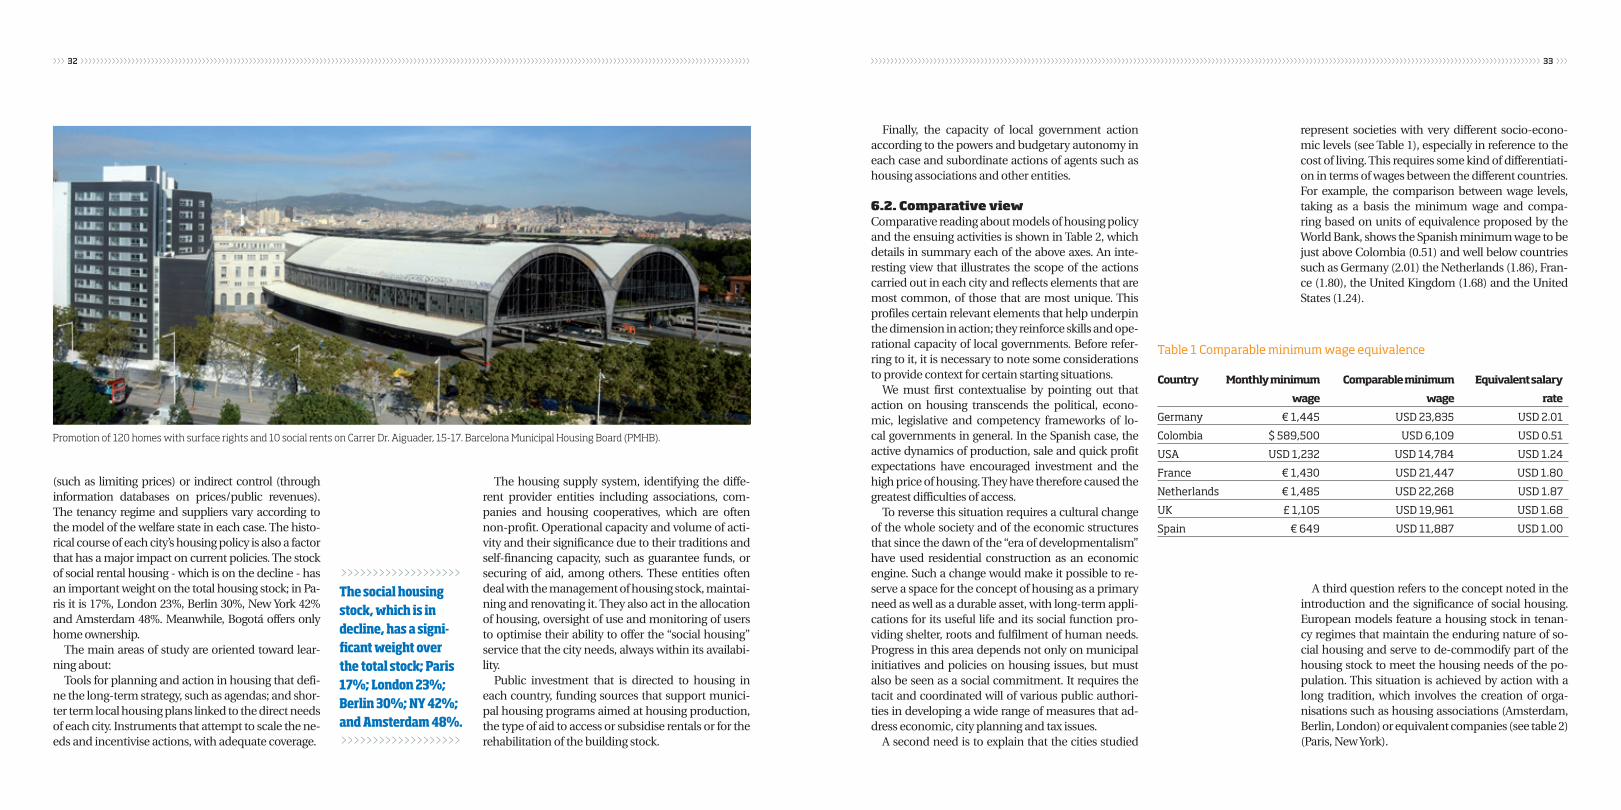
Promotion of 120 homes with surface rights and 10 social rents on Carrer Dr. Aiguader, 15-17. Barcelona Municipal Housing Board (PMHB).
›››››››››››››››››››››››››››››››››››››››››››››››››››››››››››››››››››››››››››››››››››››››››››››››››››››››››››››››››››››››››››››››››››››››››››››››››››››››››››››››››››››››››››››››››› ››››››››››››››››››››››››››››››››››››››››››››››››››››››››››››››››››››››››››››››››››››››››››››››››››››››››››››››››››››››››››››››››››››››››››››››››››››››››››››››››››››››››››››››››››34 35
Housing associations play the main role of provi-ding social housing for various strata of society who need it, taking action on the promotion and manage-ment of social housing. Their aim is to act with criteria apart from own benefit, promoting social cohesion, employment and social integration of neighbours.
The experience of these countries is particularly instructive in regard to the management of housing stock, the robustness of their organisations, means of financing, innovative services, control and mo-nitoring mechanisms oriented toward urban ma-nagement, and improving the living conditions of neighbourhoods and their residents.
Given the constraints of our environment, we highlight points to consider as ways that may be use-ful for directing an improvement in performance in housing. These aspects have served to strengthen solvency in skills and operational capacity of local governments.
A first point to consider would be to implement mechanisms to diversify affordable housing provi-ders and the public-private partnership to stimula-te growth in the stock and quality of social housing. Examples of success that have been studied show mature and solvent organisations that have the capa-city to act in the implementation and management of social housing. These are non-profit corporations, some private with limited profits and subject to re-porting on their activity, spending and reinvestment of profits. They are subject to control over the quan-tity and quality of the service performed in accordan-ce with: the number of households served, increase in the stock in social housing, whether new or refurbis-hed, service quality based on the level of residential satisfaction of the residents (tenants), among others. Some also promote, in disadvantaged neighbourho-ods, various social programmes, such as program-mes aimed at employment, security management, youth activities and support for entrepreneurs and micro-enterprises.
A second point to explore is to promote new ways of financing, fund-raising for affordable rental hou-sing. The first step would be to achieve greater dy-namism in providing sufficient land in quantity and located in well served urban areas, or recovery of obsolete building stock, based on right of first refusal acquisition models. It has been found that decisive action in implementing the instruments of urban management is key to obtaining or transferring land for social housing, thereby securing the gains created by urban planning and development. Another way of raising funds should be through taxation, earmarking or allocating a portion of tax receipts used for public investment specifically for action on housing. Ad-dressing the possibilities of promoting savings-hou-sing systems that finance programmes that create af-fordable housing for rent or right-to-use. Or, as in the French case, to take back the public bank. (Explained in section 3).
• Deploy entities that can exercise direct or indi-rect control over prices or rents in the public and private market. The successful experiences of refe-rence would be the Paris Rents Observatory (OLAP), or rent evaluation systems developed by the housing associations themselves in Amsterdam. Monitoring and analysis of prices, both made searchable and public. The first is an annual publication that inclu-des an assessment of private rental prices according to location, size, age of building and age of contract, among others. A publication that is accessible to the general public that shows private market bench-mark prices and thus indirectly influences them. In the case of Amsterdam, this is an evaluation system that is more complex and open to citizens, which calculates in each case the value of the allowable income applicable for each housing unit based on parameters such as square metres and others, si-mulating a real pricing of the property. It should be noted that some experiences in publishing prices in Spain have been directed more to giving a general statistical market trend rather than estimating real value by product type with a capacity to influence the market.
• Improving information channels and strengt-hening monitoring and development of the hou-sing stock is a priority to maintain the housing in-ventory in good condition. In the cases studied, it is evident that housing organisations have developed very precise mechanisms to know the status of the housing stock, its quality and the wellbeing of its tenants. In our case, some homes could be evalu-ated directly from the Municipal Housing Board of Barcelona, although it should also be addressed in the set of privately owned individual housing units. In that case, the possibilities for evaluating and monitoring of an important part of the housing stock should be articulated through the owners’ associations and current management control sys-tems. A task that could be performed well by en-
gaging communication of data handled by various administrations of the regional government and the city government. This would require reviewing processes and enhancing the technical control of the actions that provide information (ITE building inspections, habitability cells) on the state of the (private and public) housing inventory. Strengthen the performance of the Barcelona Housing Consor-tium, opening channels of interaction and techni-cal coordination between information units of the municipal housing offices, the housing Agency, the housing Observatory, capital transfers, municipal Capital Gains, and other entities relevant to this fi-eld such as the IBI Land Registry.
• Increasing citizen participation in the design of local housing strategies to be more tailored to the real needs of the population and including community members in the allocation of public housing.
Finally, some points have been highlighted that are explored and exemplified in the following sec-tion as lessons learned from the case studies that could be effective and guide the new housing plan of Barcelona.
Below, the comparative table highlights the ma-jor milestones in social housing in the cities studied. Municipal housing policy models show that there is a high degree of autonomy in defining local housing plans. However, in some cities a greater capacity for decision and action can be seen, as well as regulati-on and supervision of entities providing housing, as in the case of Berlin and Amsterdam, including rent control. While in other cases the activity and financing is subject to a more established system in the central (in Paris) or metropolitan (Greater London Authority) government. A special case is that of New York with the New York City Housing Authority (NYCHA), which concentrates its efforts on housing and federal funds. Finally, Bogotá focuses on decisive action parallel to the central government.
>>>>>>>>>>>>>>>>>>>The municipal hou-sing policy models show that there is a high level of auto-nomy in the defini-tion of local housing plans.>>>>>>>>>>>>>>>>>>>
>>>>>>>>>>>>>>>>>>>The main role of housing associa-tions is to provide social housing to the different strata of society that needs it, and are involved in the development and administration of social housing.>>>>>>>>>>>>>>>>>>>
Visiting homes with surface rights on Aviguda Estatut, 57. PMHB.
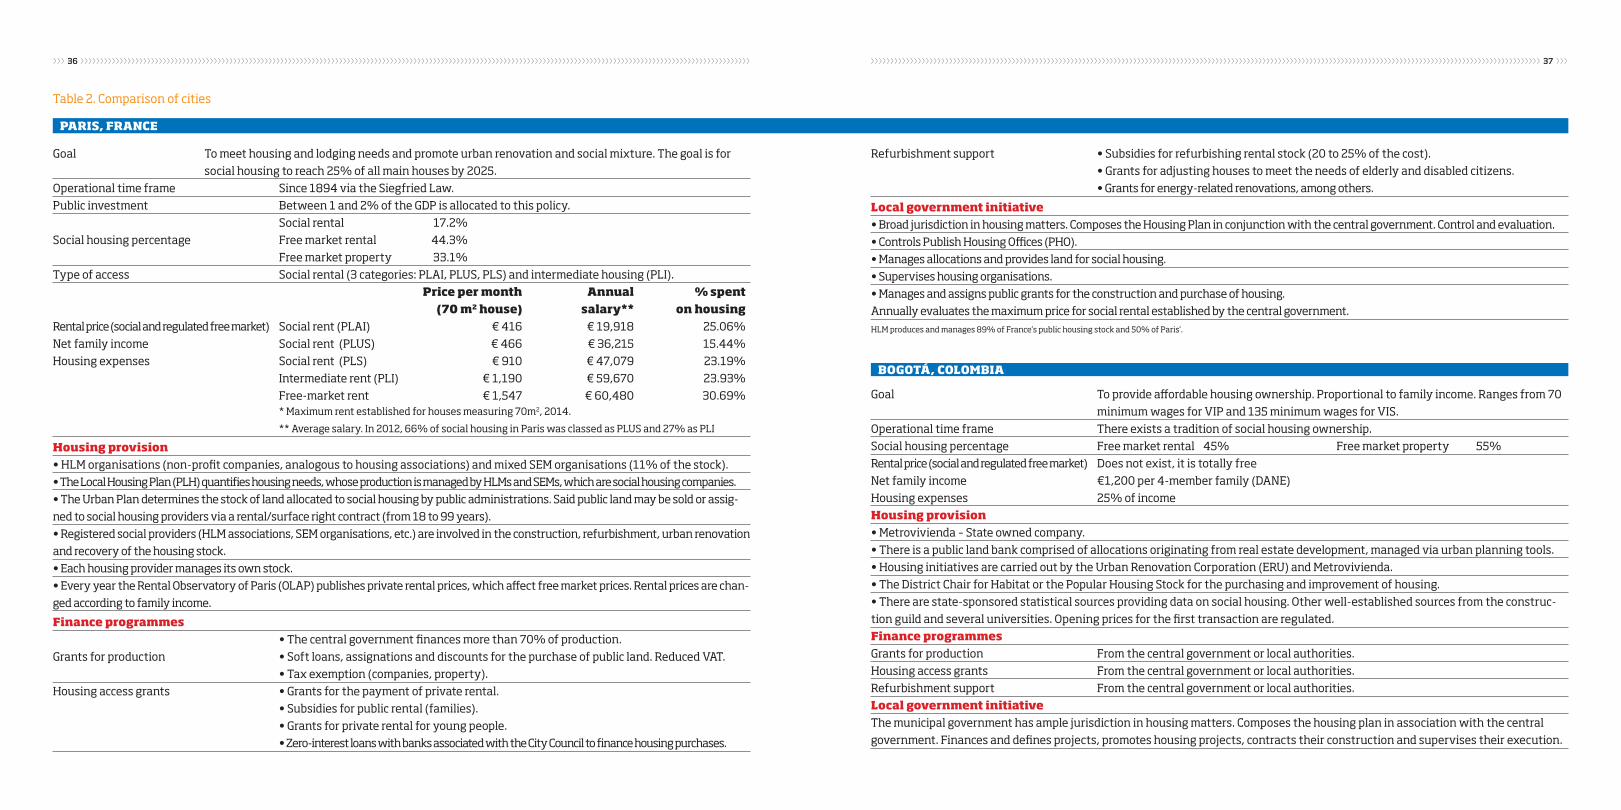
›››››››››››››››››››››››››››››››››››››››››››››››››››››››››››››››››››››››››››››››››››››››››››››››››››››››››››››››››››››››››››››››››››››››››››››››››››››››››››››››››››››››››››››››››› ››››››››››››››››››››››››››››››››››››››››››››››››››››››››››››››››››››››››››››››››››››››››››››››››››››››››››››››››››››››››››››››››››››››››››››››››››››››››››››››››››››››››››››››››››36 37
Paris, FrancE
Goal To meet housing and lodging needs and promote urban renovation and social mixture. The goal is for social housing to reach 25% of all main houses by 2025.Operational time frame Since 1894 via the Siegfried Law.Public investment Between 1 and 2% of the GDP is allocated to this policy. Social rental 17.2% Social housing percentage Free market rental 44.3% Free market property 33.1%Type of access Social rental (3 categories: PLAI, PLUS, PLS) and intermediate housing (PLI). Price per month annual % spent (70 m2 house) salary** on housing Rental price (social and regulated free market) Social rent (PLAI) € 416 € 19,918 25.06% Net family income Social rent (PLUS) € 466 € 36,215 15.44% Housing expenses Social rent (PLS) € 910 € 47,079 23.19% Intermediate rent (PLI) € 1,190 € 59,670 23.93% Free-market rent € 1,547 € 60,480 30.69% * Maximum rent established for houses measuring 70m2, 2014.
** Average salary. In 2012, 66% of social housing in Paris was classed as PLUS and 27% as PLI
Housing provision• HLM organisations (non-profit companies, analogous to housing associations) and mixed SEM organisations (11% of the stock).• The Local Housing Plan (PLH) quantifies housing needs, whose production is managed by HLMs and SEMs, which are social housing companies. • The Urban Plan determines the stock of land allocated to social housing by public administrations. Said public land may be sold or assig-ned to social housing providers via a rental/surface right contract (from 18 to 99 years).• Registered social providers (HLM associations, SEM organisations, etc.) are involved in the construction, refurbishment, urban renovation and recovery of the housing stock.• Each housing provider manages its own stock.• Every year the Rental Observatory of Paris (OLAP) publishes private rental prices, which affect free market prices. Rental prices are chan-ged according to family income.
Finance programmes • The central government finances more than 70% of production. Grants for production • Soft loans, assignations and discounts for the purchase of public land. Reduced VAT. • Tax exemption (companies, property).Housing access grants • Grants for the payment of private rental. • Subsidies for public rental (families). • Grants for private rental for young people. • Zero-interest loans with banks associated with the City Council to finance housing purchases.
Refurbishment support • Subsidies for refurbishing rental stock (20 to 25% of the cost). • Grants for adjusting houses to meet the needs of elderly and disabled citizens. • Grants for energy-related renovations, among others.
Local government initiative• Broad jurisdiction in housing matters. Composes the Housing Plan in conjunction with the central government. Control and evaluation. • Controls Publish Housing Offices (PHO). • Manages allocations and provides land for social housing.• Supervises housing organisations.• Manages and assigns public grants for the construction and purchase of housing. Annually evaluates the maximum price for social rental established by the central government.HLM produces and manages 89% of France’s public housing stock and 50% of Paris’.
Bogotá, coLomBia
Goal To provide affordable housing ownership. Proportional to family income. Ranges from 70 minimum wages for VIP and 135 minimum wages for VIS.Operational time frame There exists a tradition of social housing ownership.Social housing percentage Free market rental 45% Free market property 55% Rental price (social and regulated free market) Does not exist, it is totally free Net family income €1,200 per 4-member family (DANE) Housing expenses 25% of income Housing provision• Metrovivienda – State owned company. • There is a public land bank comprised of allocations originating from real estate development, managed via urban planning tools. • Housing initiatives are carried out by the Urban Renovation Corporation (ERU) and Metrovivienda.• The District Chair for Habitat or the Popular Housing Stock for the purchasing and improvement of housing.• There are state-sponsored statistical sources providing data on social housing. Other well-established sources from the construc-tion guild and several universities. Opening prices for the first transaction are regulated.Finance programmesGrants for production From the central government or local authorities. Housing access grants From the central government or local authorities. Refurbishment support From the central government or local authorities. Local government initiativeThe municipal government has ample jurisdiction in housing matters. Composes the housing plan in association with the central government. Finances and defines projects, promotes housing projects, contracts their construction and supervises their execution.
Table 2. Comparison of cities

›››››››››››››››››››››››››››››››››››››››››››››››››››››››››››››››››››››››››››››››››››››››››››››››››››››››››››››››››››››››››››››››››››››››››››››››››››››››››››››››››››››››››››››››››› ››››››››››››››››››››››››››››››››››››››››››››››››››››››››››››››››››››››››››››››››››››››››››››››››››››››››››››››››››››››››››››››››››››››››››››››››››››››››››››››››››››››››››››››››››38 39
amstErdam, tHE nEtHErLands
Goal To provide controlled, rented social housing at prices lower than those established by the free market. Operational time frame The creation of associations handling the provision of social housing (housing associations) has been regulated since 1901.Public investment More than 3.4% of GDP is allocated to this policy. Social rental 48% Social housing percentage Free market rental 24% Free market property 28%Type of access Social rental (up to €710.68/month) or regulated free market rental (from €710.68 to €1,148 /month).
Price per month annual salary % spent on housing Rental price (social and regulated free market) Max. social housing 710.68 34,911 24.43% Net family income Min. free-market housing 710.68 29,900 28.52% Housing expenses Max free-market housing 1,148 44,656 30.85%Housing provision• Housing associations (425 associations encompassing 191,300 homes) and regulated private housing. • Local plans determine production needs.• 80% of land is municipally owned and public. Private entities are under the obligation to reserve 20 to 30% of all land to social housing.• They participate in the construction, refurbishment/improvement, urban renovation and recovery of the housing stock. Housing associations are always subject to provision requirements in terms of service and accountability. As are private bodies that embrace price regulation.• Housing associations manage their own stock and share a solidarity and guarantee fund.• Valuation criteria are established by valuation laws. These criteria are established via an electronic price allocation system that is reviewed yearly. The municipal housing survey overviews and assesses policies and initiatives.Finance programmesGrants for production Property and VAT exemptions. Land quota deductions.Housing access grants Purchasing guarantees, exemptions and deductions. Starting at €250 and ranging to 20% of the rental price. Refurbishment support Ample grants for housing improvements in districts where renovation plans are in place. Refitting to meet thermal requirements and disability-related needs. Subsidies for the renovation of abandoned or unused housing stock (infrastructure). Local government initiative• Entirely independent in terms of designing local housing plans.• Land use and development. • Manages grants and supervises housing organisations. • Applies value-related regulations (using technical criteria) and determines appropriate rental prices for the municipality.
BErLin, gErmany
Goal To provide housing to people who are excluded from the market. To provide stable, rental housing by purchasing or promoting housing in consolidated districts.Operational time frame Social housing tradition since 1919 Public investment More than 2% of GDP is allocated to this policy. Social rental 30% Social housing percentage Free market rental 56% Free market property 14%Type of access Social housing or subsidised rental. monthly rent Price per m2 month annual salary % spent on housing 1 member family € 211 € 5.42 / m² € 14,100 30% 2 member family € 409 € 5.85 / m² € 27,300 30% 3 member family € 472 € 5.91 / m² € 31,500 30% 4 member family € 531 € 5.90 / m² € 35,400 30%
Housing provision• Housing associations• The urban housing development plan quantifies production.• New development projects assign land, for social housing, to public administrations, which provide them to social housing agents (via rental or transfer).• Housing companies, cooperatives and municipal housing companies are the main housing providers.• Housing companies and cooperatives play a prominent role (80 cooperatives holding over 186,000 homes). They efficiently manage the stock.• The housing plan has promoted control and stabilisation measures concerning long-term rental prices via partnerships between housing providers.Finance programmesGrants for production Soft construction loans for rentals, alongside other aids.Housing access grants Tailored support for rentals and grants for social access.Refurbishment support Grants for improving the housing stock, although the main focus is on creating renovated housing.
Local government initiative• Entirely independent in terms of designing local housing plans.• Land use and development.• Has financing, manages aids and supervises housing organisations.• Applies Lander directives in terms of rental prices.• Evaluates housing plan compliance.
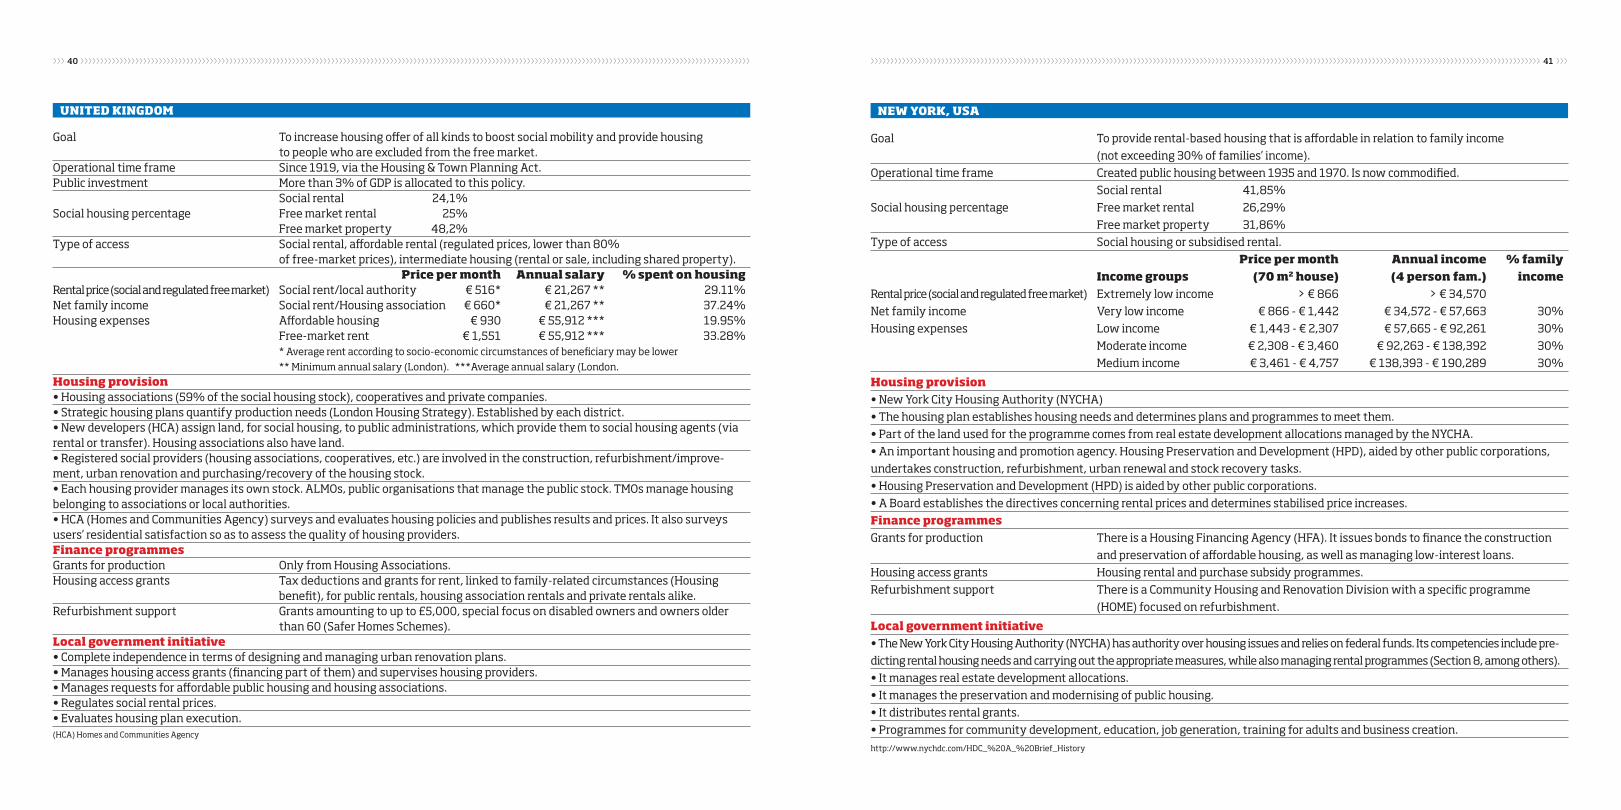
›››››››››››››››››››››››››››››››››››››››››››››››››››››››››››››››››››››››››››››››››››››››››››››››››››››››››››››››››››››››››››››››››››››››››››››››››››››››››››››››››››››››››››››››››› ››››››››››››››››››››››››››››››››››››››››››››››››››››››››››››››››››››››››››››››››››››››››››››››››››››››››››››››››››››››››››››››››››››››››››››››››››››››››››››››››››››››››››››››››››40 41
nEw york, Usa
Goal To provide rental-based housing that is affordable in relation to family income (not exceeding 30% of families’ income).Operational time frame Created public housing between 1935 and 1970. Is now commodified. Social rental 41,85% Social housing percentage Free market rental 26,29% Free market property 31,86%Type of access Social housing or subsidised rental. Price per month annual income % family income groups (70 m2 house) (4 person fam.) income Rental price (social and regulated free market) Extremely low income > € 866 > € 34,570 Net family income Very low income € 866 - € 1,442 € 34,572 - € 57,663 30% Housing expenses Low income € 1,443 - € 2,307 € 57,665 - € 92,261 30% Moderate income € 2,308 - € 3,460 € 92,263 - € 138,392 30% Medium income € 3,461 - € 4,757 € 138,393 - € 190,289 30%
Housing provision• New York City Housing Authority (NYCHA)• The housing plan establishes housing needs and determines plans and programmes to meet them.• Part of the land used for the programme comes from real estate development allocations managed by the NYCHA.• An important housing and promotion agency. Housing Preservation and Development (HPD), aided by other public corporations, undertakes construction, refurbishment, urban renewal and stock recovery tasks.• Housing Preservation and Development (HPD) is aided by other public corporations.• A Board establishes the directives concerning rental prices and determines stabilised price increases.Finance programmesGrants for production There is a Housing Financing Agency (HFA). It issues bonds to finance the construction and preservation of affordable housing, as well as managing low-interest loans.Housing access grants Housing rental and purchase subsidy programmes.Refurbishment support There is a Community Housing and Renovation Division with a specific programme (HOME) focused on refurbishment.
Local government initiative• The New York City Housing Authority (NYCHA) has authority over housing issues and relies on federal funds. Its competencies include pre-dicting rental housing needs and carrying out the appropriate measures, while also managing rental programmes (Section 8, among others).• It manages real estate development allocations. • It manages the preservation and modernising of public housing.• It distributes rental grants.• Programmes for community development, education, job generation, training for adults and business creation. http://www.nychdc.com/HDC_%20A_%20Brief_History
UnitEd kingdom
Goal To increase housing offer of all kinds to boost social mobility and provide housing to people who are excluded from the free market. Operational time frame Since 1919, via the Housing & Town Planning Act.Public investment More than 3% of GDP is allocated to this policy. Social rental 24,1% Social housing percentage Free market rental 25% Free market property 48,2%Type of access Social rental, affordable rental (regulated prices, lower than 80% of free-market prices), intermediate housing (rental or sale, including shared property). Price per month annual salary % spent on housing Rental price (social and regulated free market) Social rent/local authority € 516* € 21,267 ** 29.11% Net family income Social rent/Housing association € 660* € 21,267 ** 37.24% Housing expenses Affordable housing € 930 € 55,912 *** 19.95% Free-market rent € 1,551 € 55,912 *** 33.28% * Average rent according to socio-economic circumstances of beneficiary may be lower ** Minimum annual salary (London). ***Average annual salary (London.Housing provision• Housing associations (59% of the social housing stock), cooperatives and private companies.• Strategic housing plans quantify production needs (London Housing Strategy). Established by each district. • New developers (HCA) assign land, for social housing, to public administrations, which provide them to social housing agents (via rental or transfer). Housing associations also have land.• Registered social providers (housing associations, cooperatives, etc.) are involved in the construction, refurbishment/improve-ment, urban renovation and purchasing/recovery of the housing stock.• Each housing provider manages its own stock. ALMOs, public organisations that manage the public stock. TMOs manage housing belonging to associations or local authorities.• HCA (Homes and Communities Agency) surveys and evaluates housing policies and publishes results and prices. It also surveys users’ residential satisfaction so as to assess the quality of housing providers.Finance programmesGrants for production Only from Housing Associations.Housing access grants Tax deductions and grants for rent, linked to family-related circumstances (Housing benefit), for public rentals, housing association rentals and private rentals alike.Refurbishment support Grants amounting to up to £5,000, special focus on disabled owners and owners older than 60 (Safer Homes Schemes).Local government initiative• Complete independence in terms of designing and managing urban renovation plans.• Manages housing access grants (financing part of them) and supervises housing providers.• Manages requests for affordable public housing and housing associations. • Regulates social rental prices.• Evaluates housing plan execution.(HCA) Homes and Communities Agency
›››››››››››››››››››››››››››››››››››››››››››››››››››››››››››››››››››››››››››››››››››››››››››››››››››››››››››››››››››››››››››››››››››››››››››››››››››››››››››››››››››››››››››››››››› ››››››››››››››››››››››››››››››››››››››››››››››››››››››››››››››››››››››››››››››››››››››››››››››››››››››››››››››››››››››››››››››››››››››››››››››››››››››››››››››››››››››››››››››››››42 43
6.3. Lessons that could guide the new housing plan in Barcelona
6.3.1. Diversify the means of financing and recover the public bank (Paris, France)
ParisThe financing channels dedicated to the creation of a public social housing inventory have proved insuffi-cient. The resources that the Spanish state distributes for support for social housing are diversified between different channels in aid for construction and rehabi-litation, and support for people to be able to pay rent, among others.
A pending issue in our context is the provision of funding that is broad, stable over time and solvent that could be entirely allocated to the construction of social housing for rent. A financing fund with the capacity to undertake significant investments in buil-ding housing stocks that do not require high indeb-tedness and rapid payback. This among other things has been claimed as one of the burdens that have pre-vented the deployment of more active policies in the promotion of social housing for rent.
An example of good practice that could be ex-plored given its significance in the neighbouring country is the delivery system for financing of so-cial housing in France. It is a unique example, has different sources of fund-raising and the stren-gth of the public bank. More than 75% of housing construction is financed by the central government through the public bank (Caisse des Depots et Con-signations - CDC), which has achieved “financial independence” thanks to fund-raising through the “Livret A”, a savings account offered to the general public.
With these funds, they offer different long-term loans with subsidised rates to registered social housing provi-ders (HLM) for the construction of housing and urban facilities for vulnerable populations, in addition to gran-
ting various tax benefits (reduction of VAT, tax exempti-ons, etc.).
In 2012, savings through the Livret A for sustainable development amounted to € 342.6 billion2.
Overall, funding for social housing projects in France comes from the following sources3:• 7 76.5% through loans from the CDC (through the Livret A)• 10% from “equity” capital • 8% subsidies from Local Authorities• 3% State subsidies• 2.5% subsidies or discounts on loans to employe-es (1% of payroll that can be considered as a “hou-sing tax”).
This “housing tax” referring to 1% of payroll has existed since 1953 and specifically comes from com-panies in the non-agricultural private sector. Current-ly it is called “Housing Action” (Action Logement) and since 2006 it is been paid only by companies - non-agricultural - with more than 20 employees.
The fund collected by more than 217,000 compa-nies is managed by the Interprofessional Housing Committees (CIL). Its contribution represents almost all of the funding of ANRU4. Fifty percent (50%) of this fund is used to create housing for workers who are part of the organisation and the rest goes to the Nati-onal Relief Fund for Housing (Fonds National d’Aide au Logement - FNAL) to finance housing outside the CIL. In exchange for this contribution these organisa-tions acquire the right to award some social housing for the workers they represent5.
6.3.2. Mechanisms for management of the social housing inventory: creation of housing associations
AmsterdamThe case of Amsterdam illustrates an example of good practice in the creation and solvency of housing associations that assume full responsibility for the provision and management of social housing. The-se are non-profit entities that assume the delegated function of providing social housing to the municipa-lity, which have been strengthened and renewed with modern management systems. Over time they have disassociated themselves from dependence on sta-te subsidies through a process that began in the 90s when a progressive decline of the public rental sys-tem began, coinciding with a change of government.
Today these associations have full financial auto-nomy and are governed by non-profit principles, sepa-rate from the organisation’s own benefit. They have as their main objective the welfare of citizens, promoting social cohesion, employment and social inclusion of the neighbouring people. However, today these or-ganisations are beginning to compete with for-profit organisations and this has begun to threaten or com-promise their social function.
The uniqueness of Amsterdam is the provision of land by the municipality, which owns 80%6, and which requires costly management in its creation and maintenance. This implies a continued link between buildings’ users and the administration through the system of leaseholds on the land, which is fixed at 50 years and is renewable.
A With this link, the city administration acquires control of the management of how the constructed stock is used since occupants have an annual pay-ment obligation that reverts or transfers when they
leave the property. The important dynamic of over 425 housing associations gives them outstanding weight in their field because they handle a housing stock of 191,300 homes. Given the size, they have had to apply innovative mechanisms and efficient mana-gement in the exercise of their responsibilities.
An example is the set of management tools that through an automated system for registration and allocation of housing ensure maximum objectivity in the allocation to the applicants. In addition, the management of rental contracts and the continuous monitoring of amounts paid, unpaid and deadlines, which provides daily monitoring of the housing in-ventory. Their technical capacity enables assessment of housing and proposing the sale value of leased pro-perties to their tenants and other housing applicants.
Management extends to the allocation of housing assistance (Social Support Act) to accommodate the elderly and people with disabilities. These cases re-quire cooperation with civil organisations dedicated to the care of the elderly or those requiring assistance. It also manages and organises neighbourhood carers and managers who are charged with watching out for the neighbourhood common area and managing complaints received by the Association’s Complaints Committee and responding to the Rent Commission (Huurcommissies) in the area.
They play an effective role in keeping housing and its surroundings in good condition and to achieve this they use service providers (building maintenan-ce, lift, cleaning and small repairs in electricity, water, etc.) who do their work at mutually agreed prices. The quality of life in a neighbourhood is considered es-sential to prevent crime. Likewise, they manage cle-aning, help organise events and other activities and provide funding for playgrounds and sports. Building schools and community centres further strengthens the quality of life in a neighbourhood.
Housing associations in Amsterdam are also a use-ful tool when negotiating services complementary to
2. http://www.economie.gouv.fr/cedef/generalisation-livret-a.3. Housing Europe Review 2012: 31.4. Agència Nacional per a la Renovació Urbana.5. http://www.actionlogement.fr/.
6. http://www.amsterdam.nl/gemeente/organisaties/organisaties/wzs/wo-nen/woonbeleid-onderzoek/woonvisie-amsterdam/woonvisie-wonen/ http://www.amsterdam.nl/wonen-leefomgeving/erfpacht-uitgifte/erfpacht/.
>>>>>>>>>>>>>>>>>>>The uniqueness of Amsterdam is the provision of land by the municipality, of which it is owner of 80%, and which requires costly administration in its creation and mainte-nance.>>>>>>>>>>>>>>>>>>>
>>>>>>>>>>>>>>>>>>>The resources that the Spanish State distributes to su-pport social housing is distributed among different channels in the form of grants for reconstruction and rehabilitation, and assistance to people in order to pay rent, etc.>>>>>>>>>>>>>>>>>>>
›››››››››››››››››››››››››››››››››››››››››››››››››››››››››››››››››››››››››››››››››››››››››››››››››››››››››››››››››››››››››››››››››››››››››››››››››››››››››››››››››››››››››››››››››› ››››››››››››››››››››››››››››››››››››››››››››››››››››››››››››››››››››››››››››››››››››››››››››››››››››››››››››››››››››››››››››››››››››››››››››››››››››››››››››››››››››››››››››››››››44 45
housing because managing a large housing stock is a favourable position when negotiating with suppliers and customers to achieve benefits for their clients. A clear example is the regulation of the price of com-mon services for the properties such as water, electri-city, lifts and counselling, not exceeding 48 euros per month per flat.
Housing associations are funded from the self-ma-nagement of the housing they manage. In addition to that, there is a Guarantee Fund for Social Housing (OSO) created jointly by the various associations, which is constituted as a private organisation created by associations themselves acting as a solidarity fund. (Gemeente Amsterdam, 2009.
• Planning Mechanisms In Amsterdam, planning is a development tool with a permanent position on the agenda, with strategic long-term guidelines that go beyond the politicised vision of a single term in office and has a term of 12 years (2008-2020). To implement these strategies, there is also a four-year operational plan, “We Build Amsterdam (2011-2014)”, which allows strategic lines into concrete actions to be locked in over the short and medium term.
Both instruments have the same goal, an indivisible city where people, regardless of income, training and backgrounds can live in all districts of the city and can choose their home in the market. The planning pro-cess is participatory so that the public gets involved and is responsible not only in the planning process but especially in implementation and evaluation.
In planning, consideration is given to vulnerable and so-called “special” groups, such as young peo-ple, elderly people or those with illnesses. They are small housing units, one or two rooms, designed to accommodate one person. They also promote a small proportion of non-independent housing units, such as student residences or homes included in the programme of university cities, which rent accom-
modation for students (usually homes with shared kitchen and living room, equipped with single rooms for between 6 and 10 students).
• Incentive mechanisms for mixing and diver-sityOne of the fundamental objectives of housing policy is to create a city of mixed neighbourhoods, which is accessible to residents and newcomers and offers many opportunities and diversity.
The city of Amsterdam is strongly committed to diversification of tenancy regimes. This is regulated through the implementation of the 3 different types of tenancy regimes: ownership, social rent and free rent, both within a single plan or block, or even within the same building.
The aim is to create links between neighbours to help improve coexistence and social cohesion.
• Mechanism for awarding housingThe management of the housing stock being auto-mated facilitates the impartial allocation of housing7, since it depends mainly on the time families became enrolled in the single register (WoningNet.nl). This system is interesting because it does not segregate families by place of residence but rather anyone can access housing anywhere in the city as units become available or new ones are built.
• Management of unoccupied built infrastructureAnother relevant strategy to consider is the impe-tus given to the renovation of vacant buildings. This makes it possible for inactive infrastructure that often ends up causing problems, including those related to security, to pass into the hands of housing associati-ons or neighbours to generate new housing options and revitalise neighbourhoods.
This type of infrastructure can be public or pri-vate. In the case of public, it goes directly to bid and housing associations or even organised families can apply to remodel the building for residential purpo-ses (always generating a mixed social composition). If it is private, agreement is reached with the property on improvements and if these cannot be assumed, the city government can serve as an intermediary for the purchase of rights of use of the property by lifting the rental of land and its return, as the case may be.
The case of Amsterdam shows how a system with different non-profit housing entities that manage public housing stock facilitates flexibility, innovation and diversity of mechanisms to promote access to housing of different people and the management and maintenance of the building inventory.
6.3.3. Participatory structures and neighbourhood improvement
LondonAmong the outstanding good practices considered interesting are participatory structures for connec-ting neighbours/tenants with managing associations and local authorities. In cities such as Amsterdam, Paris and London, in which each housing associati-on is responsible for managing its own housing stock, groups with some communication infrastructure and demands regarding neighbourhood issues tend to or-ganise.
In the specific case of the United Kingdom, there is a wide diversity of organisms with functions rela-ted to housing management in which the main task is citizen participation. These are groups that arise under housing associations and are formalised and act as genuine communication channels. They deal with issues related to the organisation of activities as well as instructing residents in the management and operation of housing services.
Particularly in London, there are some references
of these organisations that promote other types of citizen participation, complementary to the more institutionalised public consultation in the process of drafting housing plans or urban renewal programs. These organisations cooperate with others that are higher-level in a certain organic hierarchy that makes them more or less dependent on the local govern-ment. This is because some are located closer and are more controlled by the administration, while others are completely at the service of neighbours.
In general, these groups are very permeable and close to neighbours. Their function is to provide lo-gistical, legal and documentary support in the mana-gement and maintenance of housing and residential complexes. They are also responsible for encouraging activities of coexistence, addressing and resolving some social needs of the neighbourhood, intervening in conflicts and channelling the demands of the re-sidents to local entities. They consist of neighbours with an operational structure at different levels to di-rect the participation of residents with specific agen-cies. They have proven to be a good way of supporting disadvantaged neighbourhood
Examples include:
• Arm’s Length Management Organisations (ALMOs):The so-called “management organisations” (ALMOs) have led to a genuine change in management of pu-blic social housing. They were created in (2002) by municipal governments and non-profit organisati-ons to facilitate the management of homes owned by local authorities by incorporating tenants with a greater voice in the way their properties are managed.
The governing board has a high representation of public housing tenants, these being one-third of the members; the rest of the board is made up of repre-sentatives of local authorities and independent re-presentatives, often with experience in business and 7. http://www.amsterdam.nl/wonen‐ leefomgeving/wonen/.
>>>>>>>>>>>>>>>>>>>In the United Kingdom, there is a wide range of organisations with functions related to the administration of housing and their main objective is the participation of the citizens.>>>>>>>>>>>>>>>>>>>
>>>>>>>>>>>>>>>>>>>One of the funda-mental objectives of the housing policy is to generate a city of mixed neighbour-hoods, accessible to residents and also newcomers and which offers plenty of opportunities and diversity.>>>>>>>>>>>>>>>>>>>
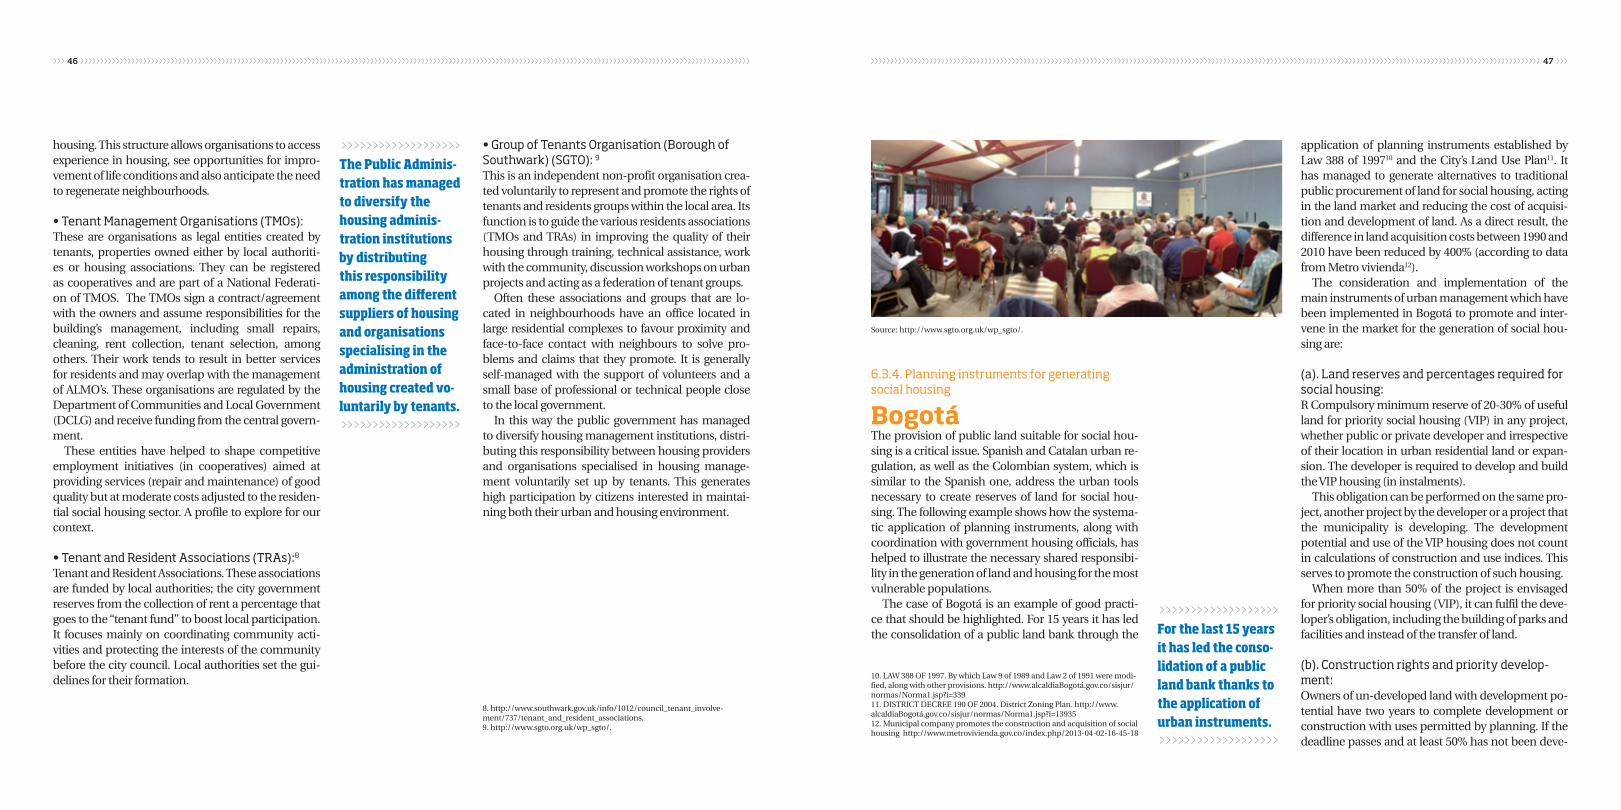
›››››››››››››››››››››››››››››››››››››››››››››››››››››››››››››››››››››››››››››››››››››››››››››››››››››››››››››››››››››››››››››››››››››››››››››››››››››››››››››››››››››››››››››››››› ››››››››››››››››››››››››››››››››››››››››››››››››››››››››››››››››››››››››››››››››››››››››››››››››››››››››››››››››››››››››››››››››››››››››››››››››››››››››››››››››››››››››››››››››››46 47
housing. This structure allows organisations to access experience in housing, see opportunities for impro-vement of life conditions and also anticipate the need to regenerate neighbourhoods.
• Tenant Management Organisations (TMOs): These are organisations as legal entities created by tenants, properties owned either by local authoriti-es or housing associations. They can be registered as cooperatives and are part of a National Federati-on of TMOS. The TMOs sign a contract/agreement with the owners and assume responsibilities for the building’s management, including small repairs, cleaning, rent collection, tenant selection, among others. Their work tends to result in better services for residents and may overlap with the management of ALMO’s. These organisations are regulated by the Department of Communities and Local Government (DCLG) and receive funding from the central govern-ment.
These entities have helped to shape competitive employment initiatives (in cooperatives) aimed at providing services (repair and maintenance) of good quality but at moderate costs adjusted to the residen-tial social housing sector. A profile to explore for our context.
• Tenant and Resident Associations (TRAs):8
Tenant and Resident Associations. These associations are funded by local authorities; the city government reserves from the collection of rent a percentage that goes to the “tenant fund” to boost local participation. It focuses mainly on coordinating community acti-vities and protecting the interests of the community before the city council. Local authorities set the gui-delines for their formation.
• Group of Tenants Organisation (Borough of Southwark) (SGTO): 9
This is an independent non-profit organisation crea-ted voluntarily to represent and promote the rights of tenants and residents groups within the local area. Its function is to guide the various residents associations (TMOs and TRAs) in improving the quality of their housing through training, technical assistance, work with the community, discussion workshops on urban projects and acting as a federation of tenant groups.
Often these associations and groups that are lo-cated in neighbourhoods have an office located in large residential complexes to favour proximity and face-to-face contact with neighbours to solve pro-blems and claims that they promote. It is generally self-managed with the support of volunteers and a small base of professional or technical people close to the local government.
In this way the public government has managed to diversify housing management institutions, distri-buting this responsibility between housing providers and organisations specialised in housing manage-ment voluntarily set up by tenants. This generates high participation by citizens interested in maintai-ning both their urban and housing environment.
6.3.4. Planning instruments for generating social housing
BogotáThe provision of public land suitable for social hou-sing is a critical issue. Spanish and Catalan urban re-gulation, as well as the Colombian system, which is similar to the Spanish one, address the urban tools necessary to create reserves of land for social hou-sing. The following example shows how the systema-tic application of planning instruments, along with coordination with government housing officials, has helped to illustrate the necessary shared responsibi-lity in the generation of land and housing for the most vulnerable populations.
The case of Bogotá is an example of good practi-ce that should be highlighted. For 15 years it has led the consolidation of a public land bank through the
application of planning instruments established by Law 388 of 199710 and the City’s Land Use Plan11. It has managed to generate alternatives to traditional public procurement of land for social housing, acting in the land market and reducing the cost of acquisi-tion and development of land. As a direct result, the difference in land acquisition costs between 1990 and 2010 have been reduced by 400% (according to data from Metro vivienda12).
The consideration and implementation of the main instruments of urban management which have been implemented in Bogotá to promote and inter-vene in the market for the generation of social hou-sing are:
(a). Land reserves and percentages required for social housing:R Compulsory minimum reserve of 20-30% of useful land for priority social housing (VIP) in any project, whether public or private developer and irrespective of their location in urban residential land or expan-sion. The developer is required to develop and build the VIP housing (in instalments).
This obligation can be performed on the same pro-ject, another project by the developer or a project that the municipality is developing. The development potential and use of the VIP housing does not count in calculations of construction and use indices. This serves to promote the construction of such housing.
When more than 50% of the project is envisaged for priority social housing (VIP), it can fulfil the deve-loper’s obligation, including the building of parks and facilities and instead of the transfer of land.
(b). Construction rights and priority develop-ment:Owners of un-developed land with development po-tential have two years to complete development or construction with uses permitted by planning. If the deadline passes and at least 50% has not been deve-
8. http://www.southwark.gov.uk/info/1012/council_tenant_involve-ment/737/tenant_and_resident_associations.9. http://www.sgto.org.uk/wp_sgto/.
10. LAW 388 OF 1997. By which Law 9 of 1989 and Law 2 of 1991 were modi-fied, along with other provisions. http://www.alcaldiaBogotá.gov.co/sisjur/normas/Norma1.jsp?i=33911. DISTRICT DECREE 190 OF 2004. District Zoning Plan. http://www.alcaldiaBogotá.gov.co/sisjur/normas/Norma1.jsp?i=1393512. Municipal company promotes the construction and acquisition of social housing http://www.metrovivienda.gov.co/index.php/2013-04-02-16-45-18
Source: http://www.sgto.org.uk/wp_sgto/.
>>>>>>>>>>>>>>>>>>>The Public Adminis-tration has managed to diversify the housing adminis-tration institutions by distributing this responsibility among the different suppliers of housing and organisations specialising in the administration of housing created vo-luntarily by tenants.>>>>>>>>>>>>>>>>>>>
>>>>>>>>>>>>>>>>>>>For the last 15 years it has led the conso-lidation of a public land bank thanks to the application of urban instruments.>>>>>>>>>>>>>>>>>>>
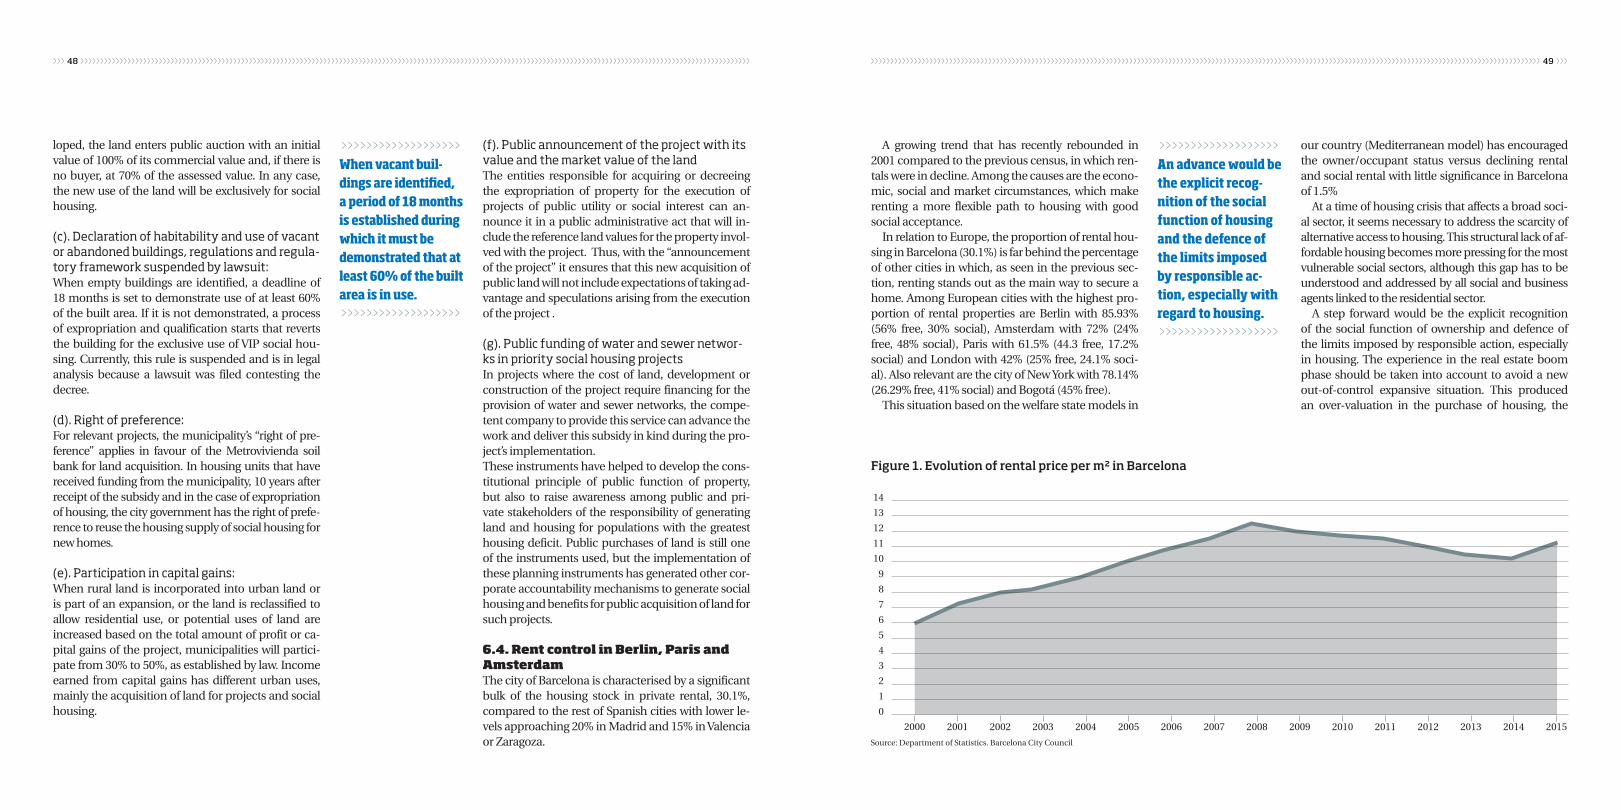
›››››››››››››››››››››››››››››››››››››››››››››››››››››››››››››››››››››››››››››››››››››››››››››››››››››››››››››››››››››››››››››››››››››››››››››››››››››››››››››››››››››››››››››››››› ››››››››››››››››››››››››››››››››››››››››››››››››››››››››››››››››››››››››››››››››››››››››››››››››››››››››››››››››››››››››››››››››››››››››››››››››››››››››››››››››››››››››››››››››››48 49
loped, the land enters public auction with an initial value of 100% of its commercial value and, if there is no buyer, at 70% of the assessed value. In any case, the new use of the land will be exclusively for social housing.
(c). Declaration of habitability and use of vacant or abandoned buildings, regulations and regula-tory framework suspended by lawsuit: When empty buildings are identified, a deadline of 18 months is set to demonstrate use of at least 60% of the built area. If it is not demonstrated, a process of expropriation and qualification starts that reverts the building for the exclusive use of VIP social hou-sing. Currently, this rule is suspended and is in legal analysis because a lawsuit was filed contesting the decree.
(d). Right of preference:For relevant projects, the municipality’s “right of pre-ference” applies in favour of the Metrovivienda soil bank for land acquisition. In housing units that have received funding from the municipality, 10 years after receipt of the subsidy and in the case of expropriation of housing, the city government has the right of prefe-rence to reuse the housing supply of social housing for new homes.
(e). Participation in capital gains:When rural land is incorporated into urban land or is part of an expansion, or the land is reclassified to allow residential use, or potential uses of land are increased based on the total amount of profit or ca-pital gains of the project, municipalities will partici-pate from 30% to 50%, as established by law. Income earned from capital gains has different urban uses, mainly the acquisition of land for projects and social housing.
(f). Public announcement of the project with its value and the market value of the landThe entities responsible for acquiring or decreeing the expropriation of property for the execution of projects of public utility or social interest can an-nounce it in a public administrative act that will in-clude the reference land values for the property invol-ved with the project. Thus, with the “announcement of the project” it ensures that this new acquisition of public land will not include expectations of taking ad-vantage and speculations arising from the execution of the project .
(g). Public funding of water and sewer networ-ks in priority social housing projectsIn projects where the cost of land, development or construction of the project require financing for the provision of water and sewer networks, the compe-tent company to provide this service can advance the work and deliver this subsidy in kind during the pro-ject’s implementation.These instruments have helped to develop the cons-titutional principle of public function of property, but also to raise awareness among public and pri-vate stakeholders of the responsibility of generating land and housing for populations with the greatest housing deficit. Public purchases of land is still one of the instruments used, but the implementation of these planning instruments has generated other cor-porate accountability mechanisms to generate social housing and benefits for public acquisition of land for such projects.
6.4. Rent control in Berlin, Paris and AmsterdamThe city of Barcelona is characterised by a significant bulk of the housing stock in private rental, 30.1%, compared to the rest of Spanish cities with lower le-vels approaching 20% in Madrid and 15% in Valencia or Zaragoza.
A growing trend that has recently rebounded in 2001 compared to the previous census, in which ren-tals were in decline. Among the causes are the econo-mic, social and market circumstances, which make renting a more flexible path to housing with good social acceptance.
In relation to Europe, the proportion of rental hou-sing in Barcelona (30.1%) is far behind the percentage of other cities in which, as seen in the previous sec-tion, renting stands out as the main way to secure a home. Among European cities with the highest pro-portion of rental properties are Berlin with 85.93% (56% free, 30% social), Amsterdam with 72% (24% free, 48% social), Paris with 61.5% (44.3 free, 17.2% social) and London with 42% (25% free, 24.1% soci-al). Also relevant are the city of New York with 78.14% (26.29% free, 41% social) and Bogotá (45% free).
This situation based on the welfare state models in
our country (Mediterranean model) has encouraged the owner/occupant status versus declining rental and social rental with little significance in Barcelona of 1.5%
At a time of housing crisis that affects a broad soci-al sector, it seems necessary to address the scarcity of alternative access to housing. This structural lack of af-fordable housing becomes more pressing for the most vulnerable social sectors, although this gap has to be understood and addressed by all social and business agents linked to the residential sector.
A step forward would be the explicit recognition of the social function of ownership and defence of the limits imposed by responsible action, especially in housing. The experience in the real estate boom phase should be taken into account to avoid a new out-of-control expansive situation. This produced an over-valuation in the purchase of housing, the
>>>>>>>>>>>>>>>>>>>An advance would be the explicit recog-nition of the social function of housing and the defence of the limits imposed by responsible ac-tion, especially with regard to housing.>>>>>>>>>>>>>>>>>>>
>>>>>>>>>>>>>>>>>>>When vacant buil-dings are identified, a period of 18 months is established during which it must be demonstrated that at least 60% of the built area is in use.>>>>>>>>>>>>>>>>>>>
Figure 1. Evolution of rental price per m² in Barcelona
14
13
12
11
10
9
8
7
6
5
4
3
2
1
0
2000 2001 2002 2003 2004 2005 2006 2007 2008 2009 2010 2011 2012 2013 2014 2015
Source: Department of Statistics. Barcelona City Council
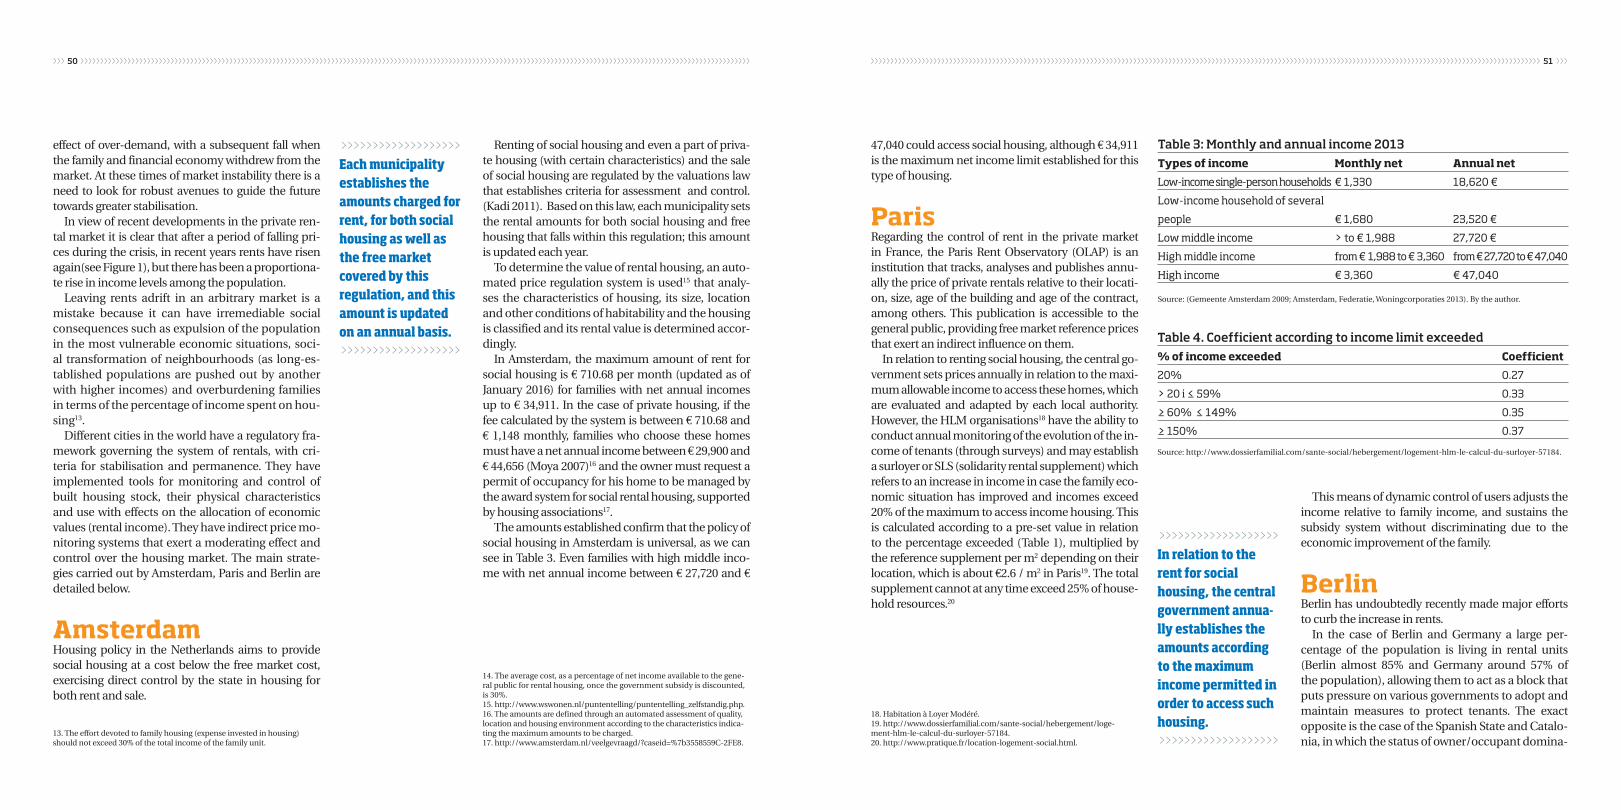
›››››››››››››››››››››››››››››››››››››››››››››››››››››››››››››››››››››››››››››››››››››››››››››››››››››››››››››››››››››››››››››››››››››››››››››››››››››››››››››››››››››››››››››››››› ››››››››››››››››››››››››››››››››››››››››››››››››››››››››››››››››››››››››››››››››››››››››››››››››››››››››››››››››››››››››››››››››››››››››››››››››››››››››››››››››››››››››››››››››››50 51
effect of over-demand, with a subsequent fall when the family and financial economy withdrew from the market. At these times of market instability there is a need to look for robust avenues to guide the future towards greater stabilisation.
In view of recent developments in the private ren-tal market it is clear that after a period of falling pri-ces during the crisis, in recent years rents have risen again(see Figure 1), but there has been a proportiona-te rise in income levels among the population.
Leaving rents adrift in an arbitrary market is a mistake because it can have irremediable social consequences such as expulsion of the population in the most vulnerable economic situations, soci-al transformation of neighbourhoods (as long-es-tablished populations are pushed out by another with higher incomes) and overburdening families in terms of the percentage of income spent on hou-sing13.
Different cities in the world have a regulatory fra-mework governing the system of rentals, with cri-teria for stabilisation and permanence. They have implemented tools for monitoring and control of built housing stock, their physical characteristics and use with effects on the allocation of economic values (rental income). They have indirect price mo-nitoring systems that exert a moderating effect and control over the housing market. The main strate-gies carried out by Amsterdam, Paris and Berlin are detailed below.
AmsterdamHousing policy in the Netherlands aims to provide social housing at a cost below the free market cost, exercising direct control by the state in housing for both rent and sale.
Renting of social housing and even a part of priva-te housing (with certain characteristics) and the sale of social housing are regulated by the valuations law that establishes criteria for assessment and control. (Kadi 2011). Based on this law, each municipality sets the rental amounts for both social housing and free housing that falls within this regulation; this amount is updated each year.
To determine the value of rental housing, an auto-mated price regulation system is used15 that analy-ses the characteristics of housing, its size, location and other conditions of habitability and the housing is classified and its rental value is determined accor-dingly.
In Amsterdam, the maximum amount of rent for social housing is € 710.68 per month (updated as of January 2016) for families with net annual incomes up to € 34,911. In the case of private housing, if the fee calculated by the system is between € 710.68 and € 1,148 monthly, families who choose these homes must have a net annual income between € 29,900 and € 44,656 (Moya 2007)16 and the owner must request a permit of occupancy for his home to be managed by the award system for social rental housing, supported by housing associations17.
The amounts established confirm that the policy of social housing in Amsterdam is universal, as we can see in Table 3. Even families with high middle inco-me with net annual income between € 27,720 and €
47,040 could access social housing, although € 34,911 is the maximum net income limit established for this type of housing.
ParisRegarding the control of rent in the private market in France, the Paris Rent Observatory (OLAP) is an institution that tracks, analyses and publishes annu-ally the price of private rentals relative to their locati-on, size, age of the building and age of the contract, among others. This publication is accessible to the general public, providing free market reference prices that exert an indirect influence on them.
In relation to renting social housing, the central go-vernment sets prices annually in relation to the maxi-mum allowable income to access these homes, which are evaluated and adapted by each local authority. However, the HLM organisations18 have the ability to conduct annual monitoring of the evolution of the in-come of tenants (through surveys) and may establish a surloyer or SLS (solidarity rental supplement) which refers to an increase in income in case the family eco-nomic situation has improved and incomes exceed 20% of the maximum to access income housing. This is calculated according to a pre-set value in relation to the percentage exceeded (Table 1), multiplied by the reference supplement per m2 depending on their location, which is about €2.6 / m2 in Paris19. The total supplement cannot at any time exceed 25% of house-hold resources.20
This means of dynamic control of users adjusts the income relative to family income, and sustains the subsidy system without discriminating due to the economic improvement of the family.
BerlinBerlin has undoubtedly recently made major efforts to curb the increase in rents.
In the case of Berlin and Germany a large per-centage of the population is living in rental units (Berlin almost 85% and Germany around 57% of the population), allowing them to act as a block that puts pressure on various governments to adopt and maintain measures to protect tenants. The exact opposite is the case of the Spanish State and Catalo-nia, in which the status of owner/occupant domina-
13. The effort devoted to family housing (expense invested in housing) should not exceed 30% of the total income of the family unit.
14. The average cost, as a percentage of net income available to the gene-ral public for rental housing, once the government subsidy is discounted, is 30%.15. http://www.wswonen.nl/puntentelling/puntentelling_zelfstandig.php.16. The amounts are defined through an automated assessment of quality, location and housing environment according to the characteristics indica-ting the maximum amounts to be charged.17. http://www.amsterdam.nl/veelgevraagd/?caseid=%7b3558559C-2FE8.
18. Habitation à Loyer Modéré.19. http://www.dossierfamilial.com/sante-social/hebergement/loge-ment-hlm-le-calcul-du-surloyer-57184.20. http://www.pratique.fr/location-logement-social.html.
Table 3: Monthly and annual income 2013
Types of income Monthly net Annual net
Low-income single-person households € 1,330 18,620 €
Low-income household of several
people € 1,680 23,520 €
Low middle income > to € 1,988 27,720 €
High middle income from € 1,988 to € 3,360 from € 27,720 to € 47,040
High income € 3,360 € 47,040
Source: (Gemeente Amsterdam 2009; Amsterdam, Federatie, Woningcorporaties 2013). By the author.
Table 4. Coefficient according to income limit exceeded
% of income exceeded Coefficient
20% 0.27
> 20 i ≤ 59% 0.33
≥ 60% ≤ 149% 0.35
≥ 150% 0.37
Source: http://www.dossierfamilial.com/sante-social/hebergement/logement-hlm-le-calcul-du-surloyer-57184.
>>>>>>>>>>>>>>>>>>>In relation to the rent for social housing, the central government annua-lly establishes the amounts according to the maximum income permitted in order to access such housing.>>>>>>>>>>>>>>>>>>>
>>>>>>>>>>>>>>>>>>>Each municipality establishes the amounts charged for rent, for both social housing as well as the free market covered by this regulation, and this amount is updated on an annual basis.>>>>>>>>>>>>>>>>>>>
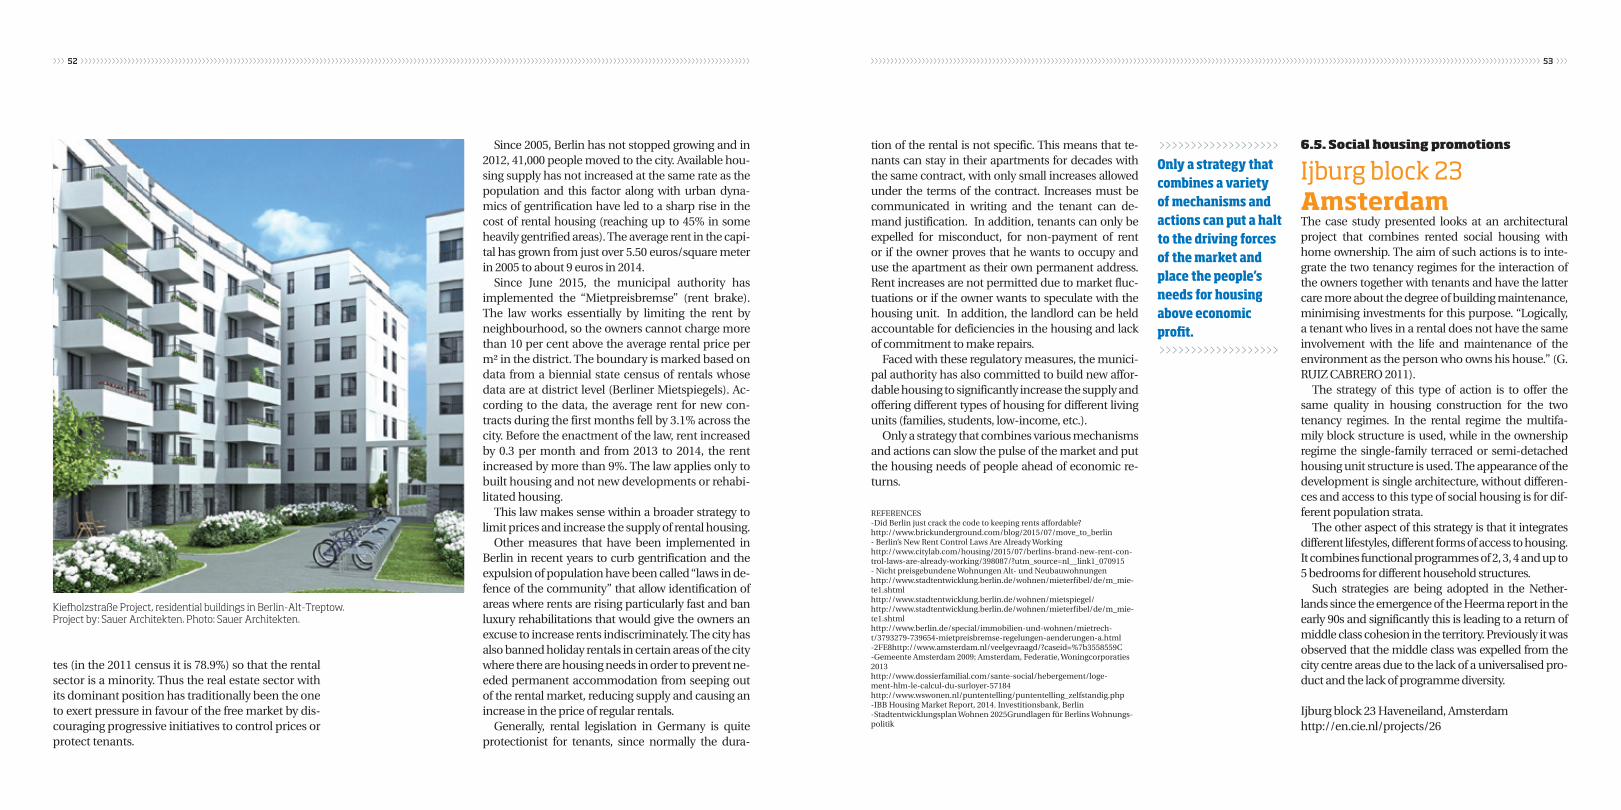
›››››››››››››››››››››››››››››››››››››››››››››››››››››››››››››››››››››››››››››››››››››››››››››››››››››››››››››››››››››››››››››››››››››››››››››››››››››››››››››››››››››››››››››››››› ››››››››››››››››››››››››››››››››››››››››››››››››››››››››››››››››››››››››››››››››››››››››››››››››››››››››››››››››››››››››››››››››››››››››››››››››››››››››››››››››››››››››››››››››››52 53
tes (in the 2011 census it is 78.9%) so that the rental sector is a minority. Thus the real estate sector with its dominant position has traditionally been the one to exert pressure in favour of the free market by dis-couraging progressive initiatives to control prices or protect tenants.
Since 2005, Berlin has not stopped growing and in 2012, 41,000 people moved to the city. Available hou-sing supply has not increased at the same rate as the population and this factor along with urban dyna-mics of gentrification have led to a sharp rise in the cost of rental housing (reaching up to 45% in some heavily gentrified areas). The average rent in the capi-tal has grown from just over 5.50 euros/square meter in 2005 to about 9 euros in 2014.
Since June 2015, the municipal authority has implemented the “Mietpreisbremse” (rent brake). The law works essentially by limiting the rent by neighbourhood, so the owners cannot charge more than 10 per cent above the average rental price per m² in the district. The boundary is marked based on data from a biennial state census of rentals whose data are at district level (Berliner Mietspiegels). Ac-cording to the data, the average rent for new con-tracts during the first months fell by 3.1% across the city. Before the enactment of the law, rent increased by 0.3 per month and from 2013 to 2014, the rent increased by more than 9%. The law applies only to built housing and not new developments or rehabi-litated housing.
This law makes sense within a broader strategy to limit prices and increase the supply of rental housing.
Other measures that have been implemented in Berlin in recent years to curb gentrification and the expulsion of population have been called “laws in de-fence of the community” that allow identification of areas where rents are rising particularly fast and ban luxury rehabilitations that would give the owners an excuse to increase rents indiscriminately. The city has also banned holiday rentals in certain areas of the city where there are housing needs in order to prevent ne-eded permanent accommodation from seeping out of the rental market, reducing supply and causing an increase in the price of regular rentals.
Generally, rental legislation in Germany is quite protectionist for tenants, since normally the dura-
tion of the rental is not specific. This means that te-nants can stay in their apartments for decades with the same contract, with only small increases allowed under the terms of the contract. Increases must be communicated in writing and the tenant can de-mand justification. In addition, tenants can only be expelled for misconduct, for non-payment of rent or if the owner proves that he wants to occupy and use the apartment as their own permanent address. Rent increases are not permitted due to market fluc-tuations or if the owner wants to speculate with the housing unit. In addition, the landlord can be held accountable for deficiencies in the housing and lack of commitment to make repairs.
Faced with these regulatory measures, the munici-pal authority has also committed to build new affor-dable housing to significantly increase the supply and offering different types of housing for different living units (families, students, low-income, etc.).
Only a strategy that combines various mechanisms and actions can slow the pulse of the market and put the housing needs of people ahead of economic re-turns.
REFERENCES-Did Berlin just crack the code to keeping rents affordable?http://www.brickunderground.com/blog/2015/07/move_to_berlin- Berlin’s New Rent Control Laws Are Already Workinghttp://www.citylab.com/housing/2015/07/berlins-brand-new-rent-con-trol-laws-are-already-working/398087/?utm_source=nl__link1_070915- Nicht preisgebundene Wohnungen Alt- und Neubauwohnungenhttp://www.stadtentwicklung.berlin.de/wohnen/mieterf ibel/de/m_mie-te1.shtmlhttp://www.stadtentwicklung.berlin.de/wohnen/mietspiegel/http://www.stadtentwicklung.berlin.de/wohnen/mieterf ibel/de/m_mie-te1.shtmlhttp://www.berlin.de/special/immobilien-und-wohnen/mietrech-t/3793279-739654-mietpreisbremse-regelungen-aenderungen-a.html-2FE8http://www.amsterdam.nl/veelgevraagd/?caseid=%7b3558559C -Gemeente Amsterdam 2009; Amsterdam, Federatie, Woningcorporaties 2013http://www.dossierfamilial.com/sante-social/hebergement/loge-ment-hlm-le-calcul-du-surloyer-57184http://www.wswonen.nl/puntentelling/puntentelling_zelfstandig.php-IBB Housing Market Report, 2014. Investitionsbank, Berlin-Stadtentwicklungsplan Wohnen 2025Grundlagen für Berlins Wohnungs-politik
6.5. Social housing promotions
Ijburg block 23 AmsterdamThe case study presented looks at an architectural project that combines rented social housing with home ownership. The aim of such actions is to inte-grate the two tenancy regimes for the interaction of the owners together with tenants and have the latter care more about the degree of building maintenance, minimising investments for this purpose. “Logically, a tenant who lives in a rental does not have the same involvement with the life and maintenance of the environment as the person who owns his house.” (G. RUIZ CABRERO 2011).
The strategy of this type of action is to offer the same quality in housing construction for the two tenancy regimes. In the rental regime the multifa-mily block structure is used, while in the ownership regime the single-family terraced or semi-detached housing unit structure is used. The appearance of the development is single architecture, without differen-ces and access to this type of social housing is for dif-ferent population strata.
The other aspect of this strategy is that it integrates different lifestyles, different forms of access to housing. It combines functional programmes of 2, 3, 4 and up to 5 bedrooms for different household structures.
Such strategies are being adopted in the Nether-lands since the emergence of the Heerma report in the early 90s and significantly this is leading to a return of middle class cohesion in the territory. Previously it was observed that the middle class was expelled from the city centre areas due to the lack of a universalised pro-duct and the lack of programme diversity.
Ijburg block 23 Haveneiland, Amsterdamhttp://en.cie.nl/projects/26
>>>>>>>>>>>>>>>>>>>Only a strategy that combines a variety of mechanisms and actions can put a halt to the driving forces of the market and place the people’s needs for housing above economic profit.>>>>>>>>>>>>>>>>>>>
Kiefholzstraße Project, residential buildings in Berlin-Alt-Treptow.Project by: Sauer Architekten. Photo: Sauer Architekten.
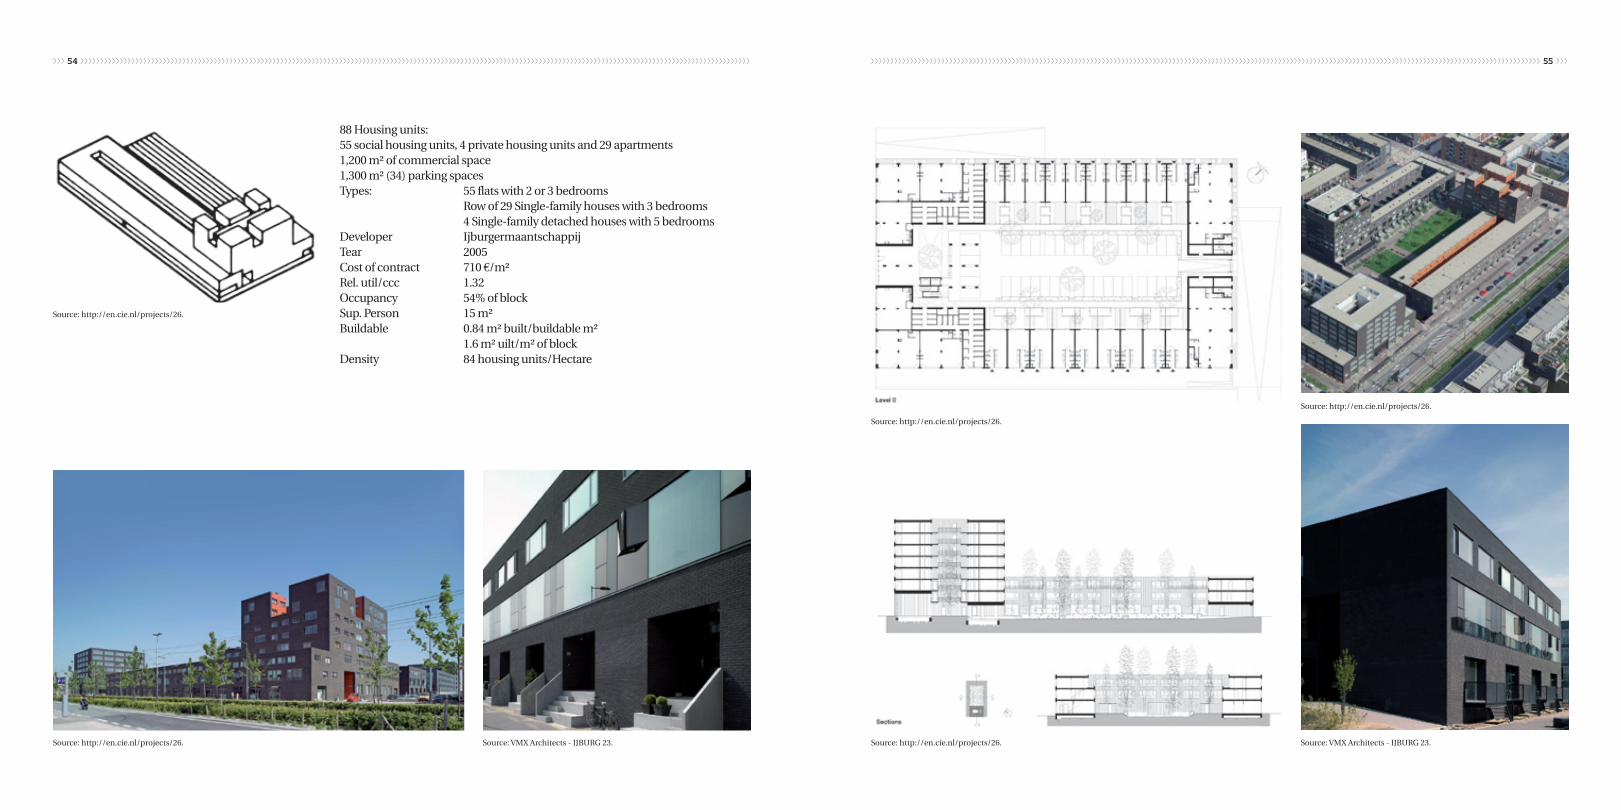
›››››››››››››››››››››››››››››››››››››››››››››››››››››››››››››››››››››››››››››››››››››››››››››››››››››››››››››››››››››››››››››››››››››››››››››››››››››››››››››››››››››››››››››››››› ››››››››››››››››››››››››››››››››››››››››››››››››››››››››››››››››››››››››››››››››››››››››››››››››››››››››››››››››››››››››››››››››››››››››››››››››››››››››››››››››››››››››››››››››››54 55
88 Housing units: 55 social housing units, 4 private housing units and 29 apartments 1,200 m² of commercial space1,300 m² (34) parking spacesTypes: 55 flats with 2 or 3 bedrooms Row of 29 Single-family houses with 3 bedrooms 4 Single-family detached houses with 5 bedroomsDeveloper Ijburgermaantschappij Tear 2005Cost of contract 710 €/m²Rel. util/ccc 1.32Occupancy 54% of blockSup. Person 15 m²Buildable 0.84 m² built/buildable m² 1.6 m² uilt/m² of blockDensity 84 housing units/Hectare
Source: http://en.cie.nl/projects/26.
Source: http://en.cie.nl/projects/26.
Source: VMX Architects - IJBURG 23.
Source: http://en.cie.nl/projects/26.
Source: VMX Architects - IJBURG 23.Source: http://en.cie.nl/projects/26.
Source: http://en.cie.nl/projects/26.
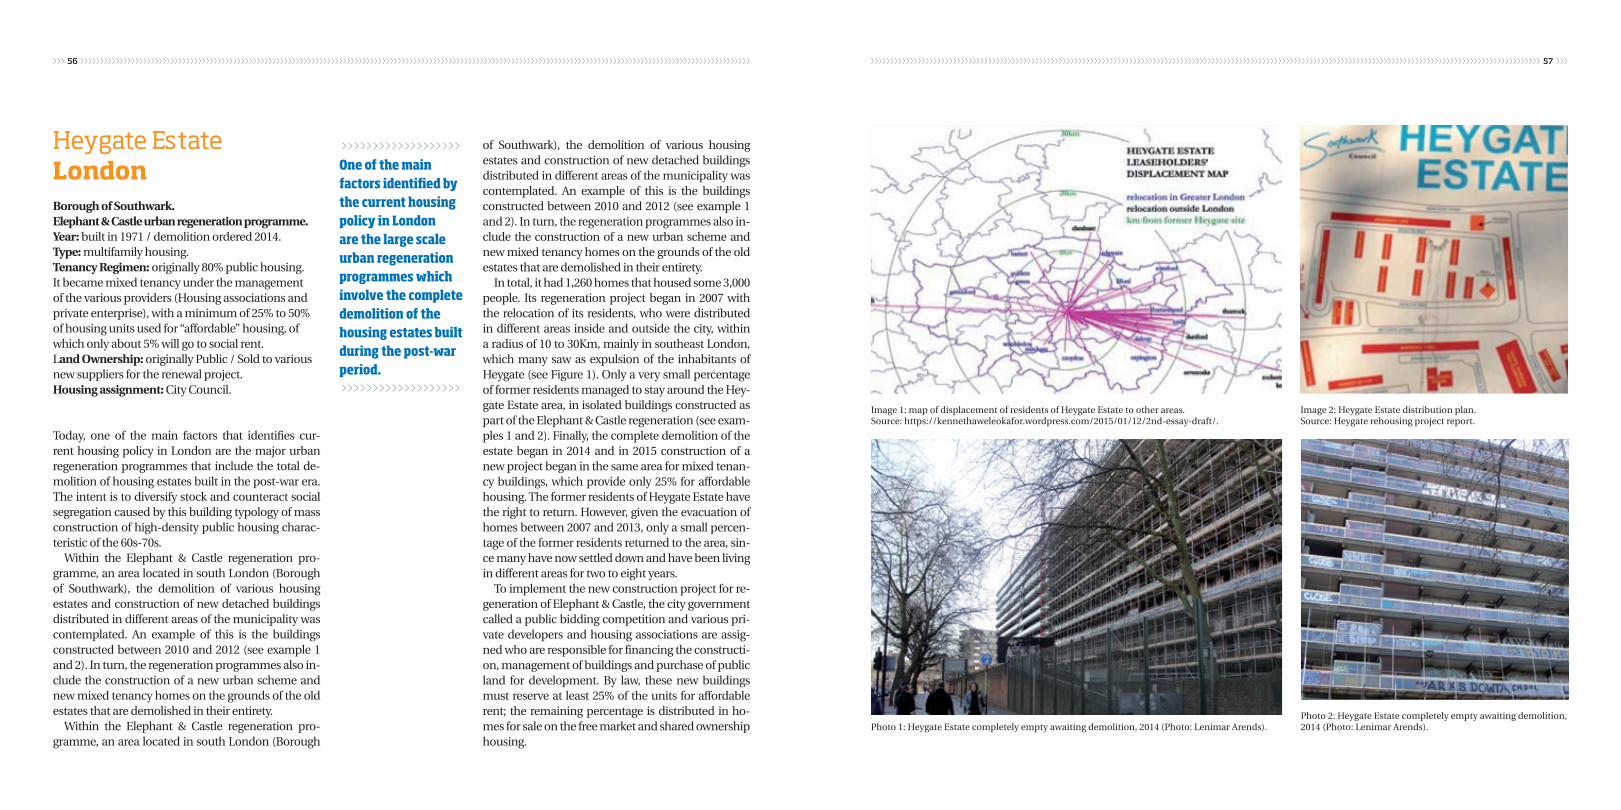
›››››››››››››››››››››››››››››››››››››››››››››››››››››››››››››››››››››››››››››››››››››››››››››››››››››››››››››››››››››››››››››››››››››››››››››››››››››››››››››››››››››››››››››››››› ››››››››››››››››››››››››››››››››››››››››››››››››››››››››››››››››››››››››››››››››››››››››››››››››››››››››››››››››››››››››››››››››››››››››››››››››››››››››››››››››››››››››››››››››››56 57
Heygate EstateLondon Borough of Southwark.Elephant & Castle urban regeneration programme. Year: built in 1971 / demolition ordered 2014. Type: multifamily housing.Tenancy Regimen: originally 80% public housing. It became mixed tenancy under the management of the various providers (Housing associations and private enterprise), with a minimum of 25% to 50% of housing units used for “affordable” housing, of which only about 5% will go to social rent. Land Ownership: originally Public / Sold to various new suppliers for the renewal project.Housing assignment: City Council.
Today, one of the main factors that identifies cur-rent housing policy in London are the major urban regeneration programmes that include the total de-molition of housing estates built in the post-war era. The intent is to diversify stock and counteract social segregation caused by this building typology of mass construction of high-density public housing charac-teristic of the 60s-70s.
Within the Elephant & Castle regeneration pro-gramme, an area located in south London (Borough of Southwark), the demolition of various housing estates and construction of new detached buildings distributed in different areas of the municipality was contemplated. An example of this is the buildings constructed between 2010 and 2012 (see example 1 and 2). In turn, the regeneration programmes also in-clude the construction of a new urban scheme and new mixed tenancy homes on the grounds of the old estates that are demolished in their entirety.
Within the Elephant & Castle regeneration pro-gramme, an area located in south London (Borough
of Southwark), the demolition of various housing estates and construction of new detached buildings distributed in different areas of the municipality was contemplated. An example of this is the buildings constructed between 2010 and 2012 (see example 1 and 2). In turn, the regeneration programmes also in-clude the construction of a new urban scheme and new mixed tenancy homes on the grounds of the old estates that are demolished in their entirety.
In total, it had 1,260 homes that housed some 3,000 people. Its regeneration project began in 2007 with the relocation of its residents, who were distributed in different areas inside and outside the city, within a radius of 10 to 30Km, mainly in southeast London, which many saw as expulsion of the inhabitants of Heygate (see Figure 1). Only a very small percentage of former residents managed to stay around the Hey-gate Estate area, in isolated buildings constructed as part of the Elephant & Castle regeneration (see exam-ples 1 and 2). Finally, the complete demolition of the estate began in 2014 and in 2015 construction of a new project began in the same area for mixed tenan-cy buildings, which provide only 25% for affordable housing. The former residents of Heygate Estate have the right to return. However, given the evacuation of homes between 2007 and 2013, only a small percen-tage of the former residents returned to the area, sin-ce many have now settled down and have been living in different areas for two to eight years.
To implement the new construction project for re-generation of Elephant & Castle, the city government called a public bidding competition and various pri-vate developers and housing associations are assig-ned who are responsible for financing the constructi-on, management of buildings and purchase of public land for development. By law, these new buildings must reserve at least 25% of the units for affordable rent; the remaining percentage is distributed in ho-mes for sale on the free market and shared ownership housing.
Image 1: map of displacement of residents of Heygate Estate to other areas. Source: https://kennethaweleokafor.wordpress.com/2015/01/12/2nd-essay-draft/.
Photo 2: Heygate Estate completely empty awaiting demolition, 2014 (Photo: Lenimar Arends).
Image 2: Heygate Estate distribution plan. Source: Heygate rehousing project report.
Photo 1: Heygate Estate completely empty awaiting demolition, 2014 (Photo: Lenimar Arends).
>>>>>>>>>>>>>>>>>>>One of the main factors identified by the current housing policy in London are the large scale urban regeneration programmes which involve the complete demolition of the housing estates built during the post-war period.>>>>>>>>>>>>>>>>>>>

›››››››››››››››››››››››››››››››››››››››››››››››››››››››››››››››››››››››››››››››››››››››››››››››››››››››››››››››››››››››››››››››››››››››››››››››››››››››››››››››››››››››››››››››››› ››››››››››››››››››››››››››››››››››››››››››››››››››››››››››››››››››››››››››››››››››››››››››››››››››››››››››››››››››››››››››››››››››››››››››››››››››››››››››››››››››››››››››››››››››58 59
To access one of these new affordable housing rental units under the Elephant & Castle regene-ration programme, applicants must apply through the City Council. In the case of ex-residents of the Heygate Estate, the city council considers them on a priority basis. To achieve the relocation of resi-dents, the City proposed different support “packa-ges” that can be accessed according to family situ-ation and tenancy regime. They provide consulting to study each case, offering the purchase of the housing unit to the owners, or subsidies to tenants to access other dwellings in the city, either for ac-cess to affordable rental (on public property or that of housing associations) with the right to return to the area (apply for housing in the area of the for-mer Heygate Estate once regenerated) or support for full or shared purchase of vacant public housing within the municipality.
Examples of detached buildings constructed around Heygate Estate, part of the Elephant & Cast-le urban regeneration:
Example 1: Arch Street Developer and manager of the housing: L&Q Hou-sing AssociationDesign: S333 Architecture & UrbanismOwner of land: PublicArea: 0.2HaConstruction cost: £8,100,000
Completed in 2011. Building with business on bot-tom floor and 52 units of 1, 2 and 3 bedroom hou-sing. 34 units destined for shared ownership and 18 units for social rentals, of which 3 units are occupied by ex-residents of Heygate Estate, according to city council data.
Photos 3 and 4: Heygate Estate in 1975. Photography: David Hulchanski.Source: (https://southwarknotes.files.wordpress.com/2013/06/heygate-1975-jdh11.jpg)
Photo 5: Building on Arch Street. Photography: Lenimar Arends, 2014.
Photo 6: Building on Arch Street. Source: http://www.bdonline.co.uk/wardroper-house-by-sarah-wigglesworth-architects-and-arch-street-by-s333-elephant-and-castle-south-lon-don/5022251.article
Image 3: Ground floor, building on Arch Street.Source: http://www.bdonline.co.uk/wardroper-house-by-sarah-wigglesworth-architects-and-arch-street-by-s333-elephant-and-castle-south-london/5022251.article
Image 4: 4th Floor. Building on Arch Street. Source: http://www.bdonline.co.uk/wardroper-hou-se-by-sarah-wigglesworth-architects-and-arch-street-by-s333-elephant-and-castle-south-lon-don/5022251.article
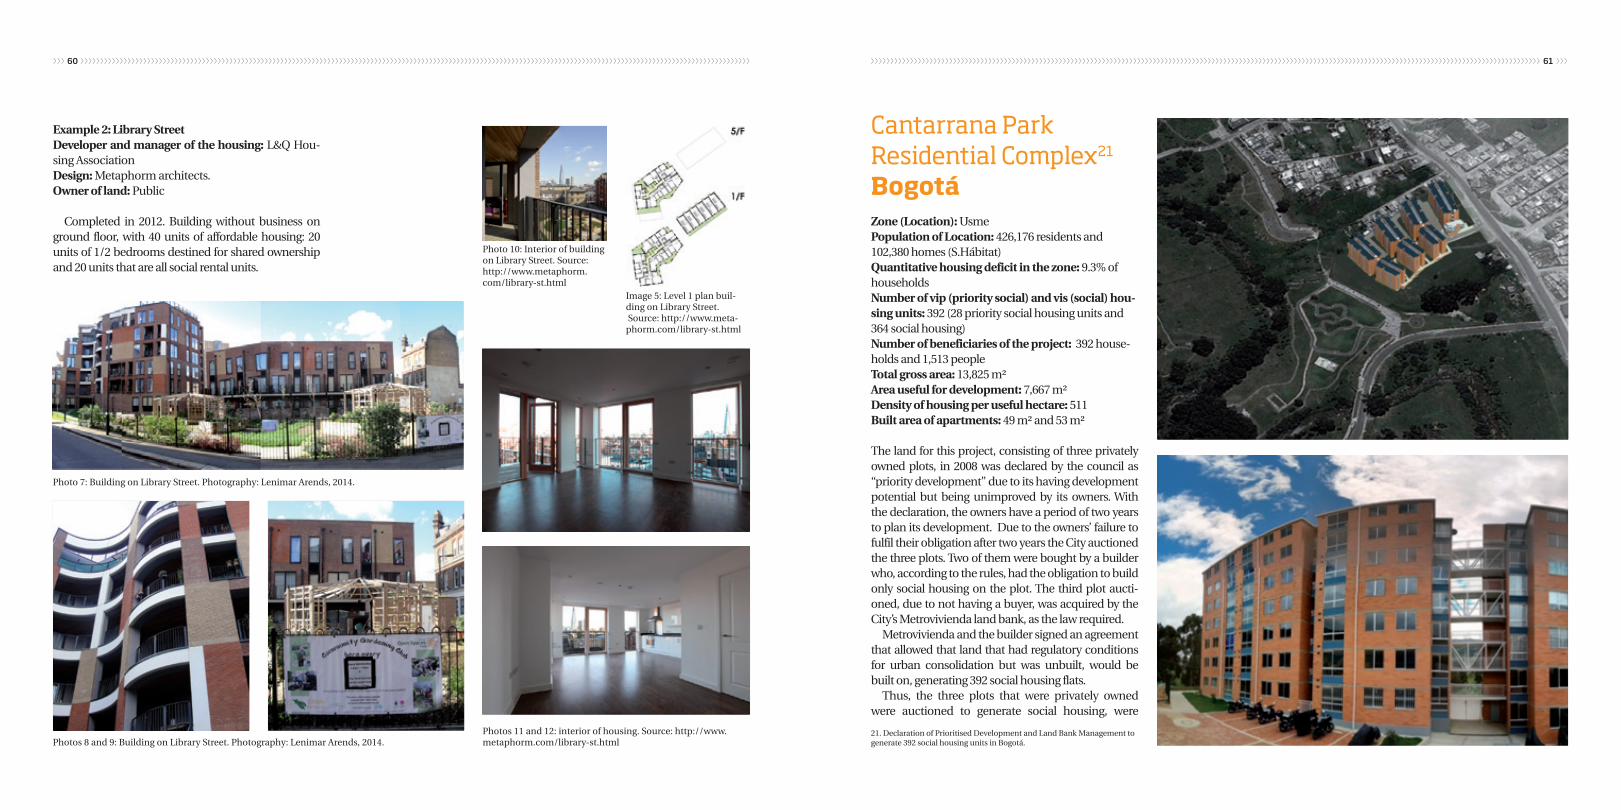
›››››››››››››››››››››››››››››››››››››››››››››››››››››››››››››››››››››››››››››››››››››››››››››››››››››››››››››››››››››››››››››››››››››››››››››››››››››››››››››››››››››››››››››››››› ››››››››››››››››››››››››››››››››››››››››››››››››››››››››››››››››››››››››››››››››››››››››››››››››››››››››››››››››››››››››››››››››››››››››››››››››››››››››››››››››››››››››››››››››››60 61
Example 2: Library StreetDeveloper and manager of the housing: L&Q Hou-sing AssociationDesign: Metaphorm architects.Owner of land: Public
Completed in 2012. Building without business on ground floor, with 40 units of affordable housing: 20 units of 1/2 bedrooms destined for shared ownership and 20 units that are all social rental units.
Cantarrana Park Residential Complex21
BogotáZone (Location): UsmePopulation of Location: 426,176 residents and 102,380 homes (S.Hábitat)Quantitative housing deficit in the zone: 9.3% of householdsNumber of vip (priority social) and vis (social) hou-sing units: 392 (28 priority social housing units and 364 social housing)Number of beneficiaries of the project: 392 house-holds and 1,513 peopleTotal gross area: 13,825 m²Area useful for development: 7,667 m²Density of housing per useful hectare: 511Built area of apartments: 49 m² and 53 m²
The land for this project, consisting of three privately owned plots, in 2008 was declared by the council as “priority development” due to its having development potential but being unimproved by its owners. With the declaration, the owners have a period of two years to plan its development. Due to the owners’ failure to fulfil their obligation after two years the City auctioned the three plots. Two of them were bought by a builder who, according to the rules, had the obligation to build only social housing on the plot. The third plot aucti-oned, due to not having a buyer, was acquired by the City’s Metrovivienda land bank, as the law required.
Metrovivienda and the builder signed an agreement that allowed that land that had regulatory conditions for urban consolidation but was unbuilt, would be built on, generating 392 social housing flats.
Thus, the three plots that were privately owned were auctioned to generate social housing, were
Photo 7: Building on Library Street. Photography: Lenimar Arends, 2014.
Photo 10: Interior of building on Library Street. Source: http://www.metaphorm.com/library-st.html
Image 5: Level 1 plan buil-ding on Library Street. Source: http://www.meta-phorm.com/library-st.html
Photos 8 and 9: Building on Library Street. Photography: Lenimar Arends, 2014.Photos 11 and 12: interior of housing. Source: http://www.metaphorm.com/library-st.html
21. Declaration of Prioritised Development and Land Bank Management to generate 392 social housing units in Bogotá.
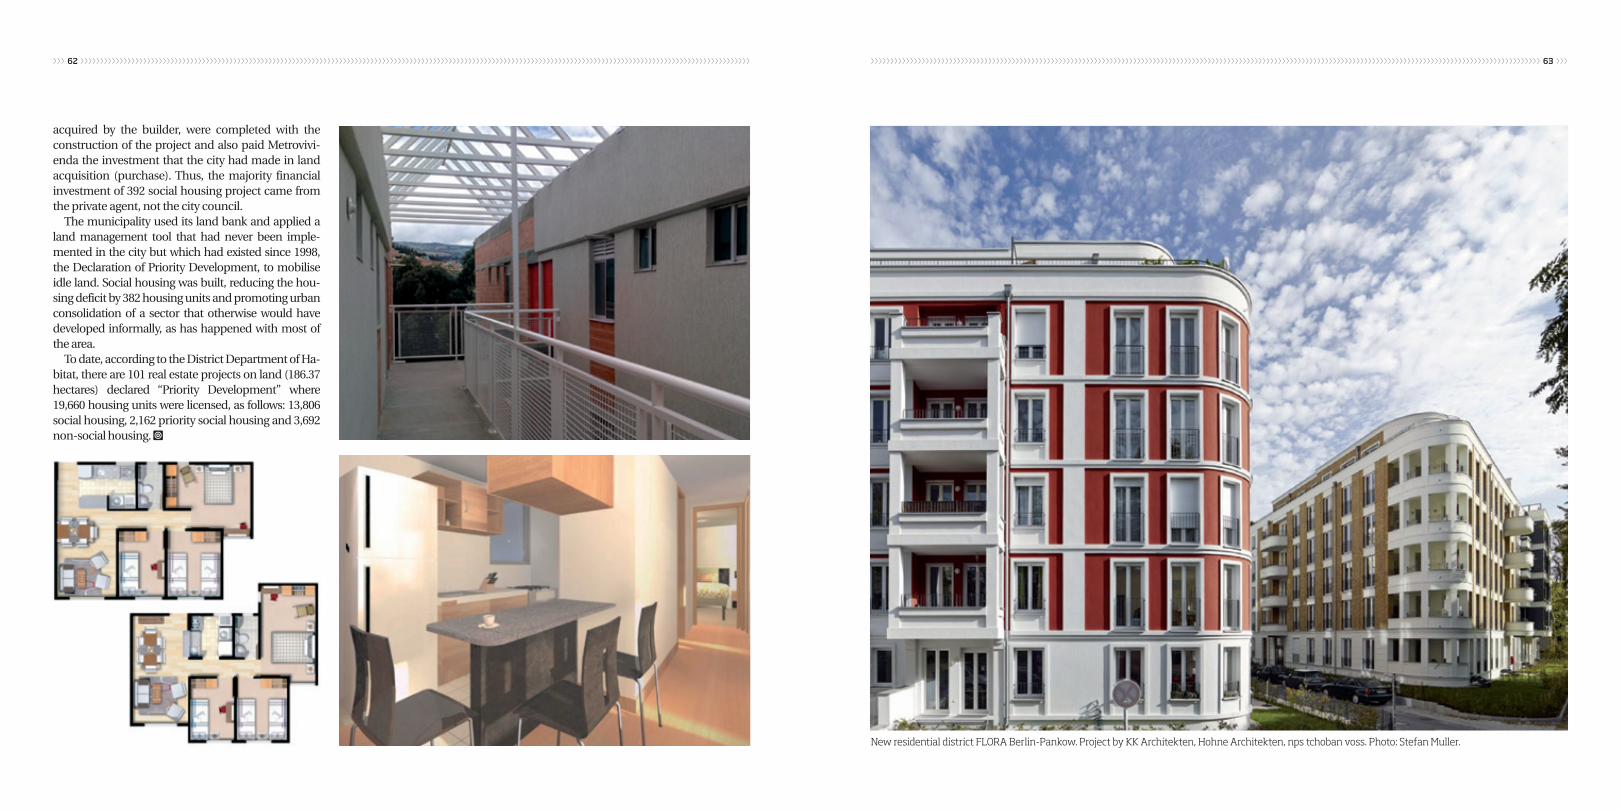
›››››››››››››››››››››››››››››››››››››››››››››››››››››››››››››››››››››››››››››››››››››››››››››››››››››››››››››››››››››››››››››››››››››››››››››››››››››››››››››››››››››››››››››››››› ››››››››››››››››››››››››››››››››››››››››››››››››››››››››››››››››››››››››››››››››››››››››››››››››››››››››››››››››››››››››››››››››››››››››››››››››››››››››››››››››››››››››››››››››››62 63
acquired by the builder, were completed with the construction of the project and also paid Metrovivi-enda the investment that the city had made in land acquisition (purchase). Thus, the majority financial investment of 392 social housing project came from the private agent, not the city council.
The municipality used its land bank and applied a land management tool that had never been imple-mented in the city but which had existed since 1998, the Declaration of Priority Development, to mobilise idle land. Social housing was built, reducing the hou-sing deficit by 382 housing units and promoting urban consolidation of a sector that otherwise would have developed informally, as has happened with most of the area.
To date, according to the District Department of Ha-bitat, there are 101 real estate projects on land (186.37 hectares) declared “Priority Development” where 19,660 housing units were licensed, as follows: 13,806 social housing, 2,162 priority social housing and 3,692 non-social housing. Å
New residential district FLORA Berlin-Pankow. Project by KK Architekten, Hohne Architekten, nps tchoban voss. Photo: Stefan Muller.

)))))))))))))))))))))))Annex
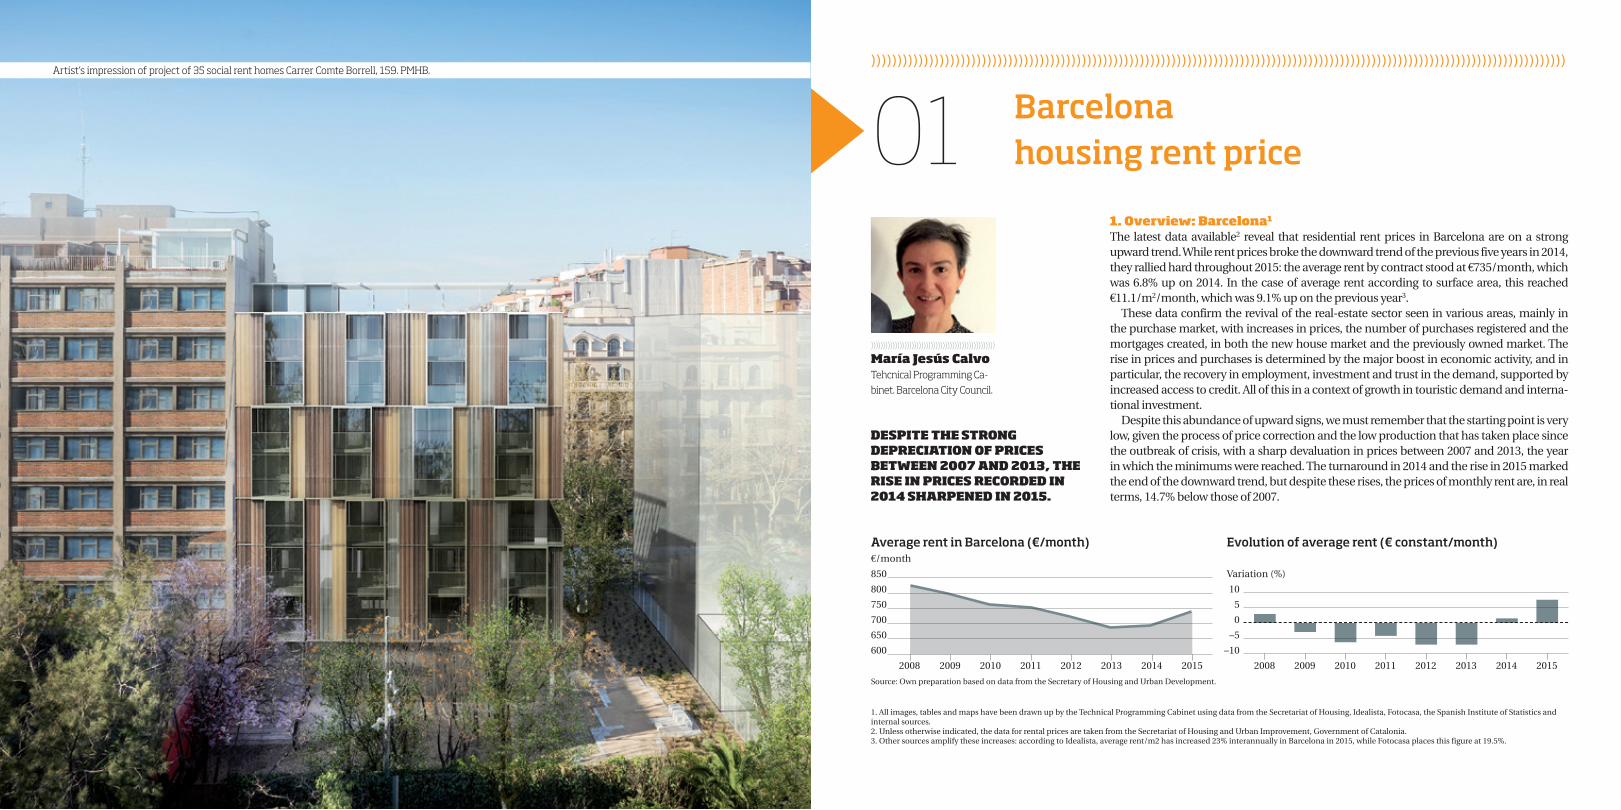
Artist’s impression of project of 35 social rent homes Carrer Comte Borrell, 159. PMHB.))))))))))))))))))))))))))))))))))))))))))))))))))))))))))))))))))))))))))))))))))))))))))))))))))))))))))))))))))))))))))))))))))))
Barcelona housing rent price
1. Overview: Barcelona1
The latest data available2 reveal that residential rent prices in Barcelona are on a strong upward trend. While rent prices broke the downward trend of the previous five years in 2014, they rallied hard throughout 2015: the average rent by contract stood at €735/month, which was 6.8% up on 2014. In the case of average rent according to surface area, this reached €11.1/m2/month, which was 9.1% up on the previous year3.
These data confirm the revival of the real-estate sector seen in various areas, mainly in the purchase market, with increases in prices, the number of purchases registered and the mortgages created, in both the new house market and the previously owned market. The rise in prices and purchases is determined by the major boost in economic activity, and in particular, the recovery in employment, investment and trust in the demand, supported by increased access to credit. All of this in a context of growth in touristic demand and interna-tional investment.
Despite this abundance of upward signs, we must remember that the starting point is very low, given the process of price correction and the low production that has taken place since the outbreak of crisis, with a sharp devaluation in prices between 2007 and 2013, the year in which the minimums were reached. The turnaround in 2014 and the rise in 2015 marked the end of the downward trend, but despite these rises, the prices of monthly rent are, in real terms, 14.7% below those of 2007.
01
DESPITE THE STRONG DEPRECIATION OF PRICES BETWEEN 2007 AND 2013, THE RISE IN PRICES RECORDED IN 2014 SHARPENED IN 2015.
Average rent in Barcelona (€/month)
850
800
750
700
650
600
€/month
2008 2009 2010 2011 2012 2013 2014 2015
Source: Own preparation based on data from the Secretary of Housing and Urban Development.
Evolution of average rent (€ constant/month)
10
5
0
–5
–10
Variation (%)
2008 2009 2010 2011 2012 2013 2014 2015
1. All images, tables and maps have been drawn up by the Technical Programming Cabinet using data from the Secretariat of Housing, Idealista, Fotocasa, the Spanish Institute of Statistics and internal sources.2. Unless otherwise indicated, the data for rental prices are taken from the Secretariat of Housing and Urban Improvement, Government of Catalonia.3. Other sources amplify these increases: according to Idealista, average rent/m2 has increased 23% interannually in Barcelona in 2015, while Fotocasa places this figure at 19.5%.
))))))))))))))))))))))))))))))))))))))))))))))))))))
María Jesús CalvoTehcnical Programming Ca-binet. Barcelona City Council.
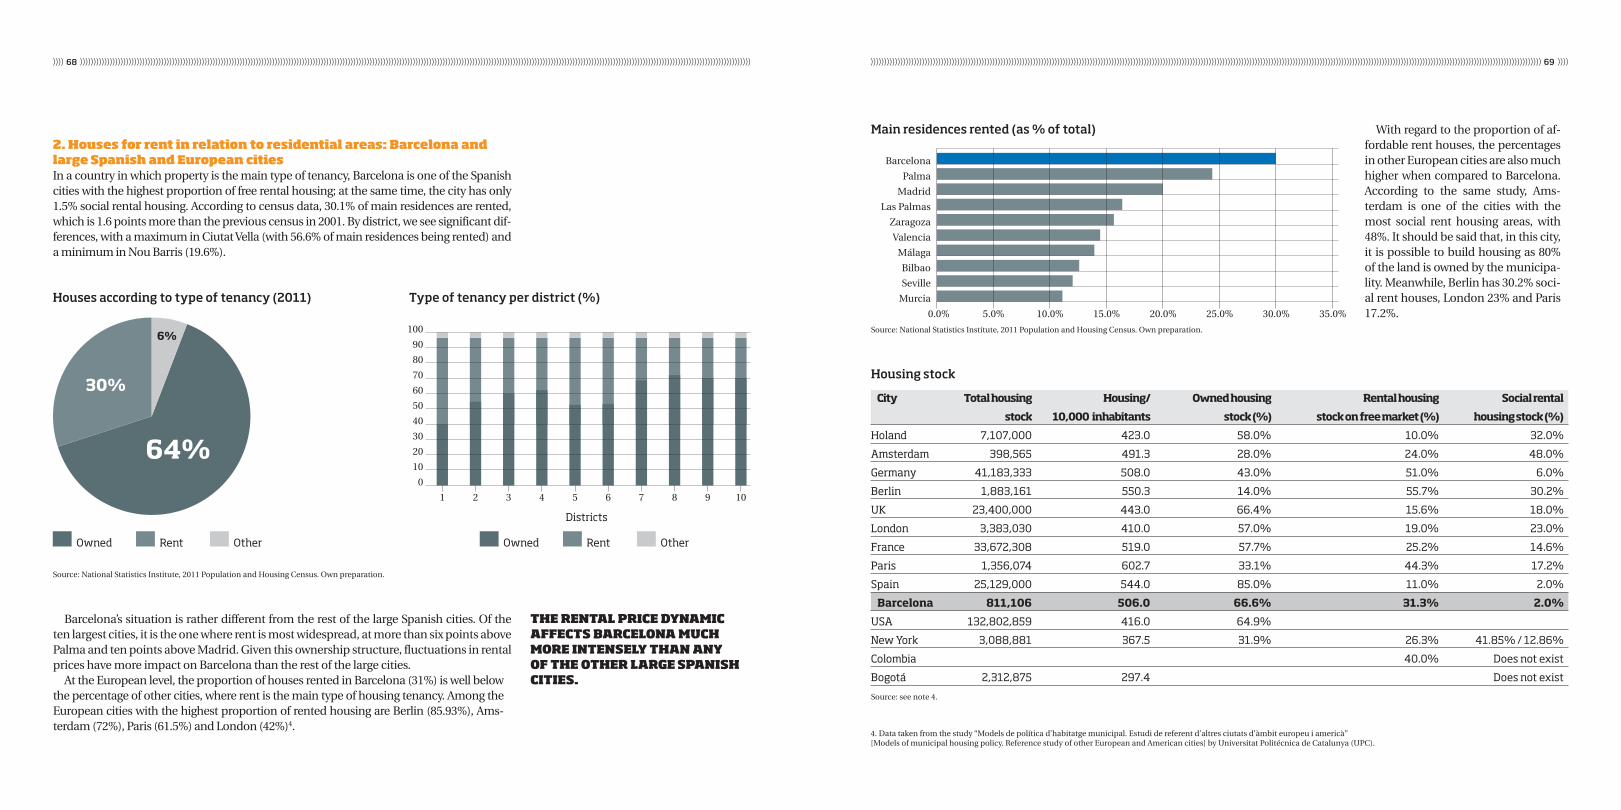
)))))))))))))))))))))))))))))))))))))))))))))))))))))))))))))))))))))))))))))))))))))))))))))))))))))))))))))))))))))))))))))))))))))))))))))))))))))))))))))))))))))))))))))))))))))))))))))))))))))))))))))))))))))))))))))))))))))))))))))))))))))))))))))))))) ))))))))))))))))))))))))))))))))))))))))))))))))))))))))))))))))))))))))))))))))))))))))))))))))))))))))))))))))))))))))))))))))))))))))))))))))))))))))))))))))))))))))))))))))))))))))))))))))))))))))))))))))))))))))))))))))))))))))))))))))))))))))))))))))))68 69
2. Houses for rent in relation to residential areas: Barcelona and large Spanish and European citiesIn a country in which property is the main type of tenancy, Barcelona is one of the Spanish cities with the highest proportion of free rental housing; at the same time, the city has only 1.5% social rental housing. According to census data, 30.1% of main residences are rented, which is 1.6 points more than the previous census in 2001. By district, we see significant dif-ferences, with a maximum in Ciutat Vella (with 56.6% of main residences being rented) and a minimum in Nou Barris (19.6%).
Barcelona’s situation is rather different from the rest of the large Spanish cities. Of the ten largest cities, it is the one where rent is most widespread, at more than six points above Palma and ten points above Madrid. Given this ownership structure, fluctuations in rental prices have more impact on Barcelona than the rest of the large cities.
At the European level, the proportion of houses rented in Barcelona (31%) is well below the percentage of other cities, where rent is the main type of housing tenancy. Among the European cities with the highest proportion of rented housing are Berlin (85.93%), Ams-terdam (72%), Paris (61.5%) and London (42%)4.
THE RENTAL PRICE DYNAMIC AFFECTS BARCELONA MUCH MORE INTENSELY THAN ANY OF THE OTHER LARGE SPANISH CITIES.
Houses according to type of tenancy (2011)
OtherRentOwned
Type of tenancy per district (%)
1 2 3 4 5 6 7 8 9 10
100
90
80
70
60
50
40
30
20
10
0
OtherRentOwned
0.0% 5.0% 10.0% 15.0% 20.0% 25.0% 30.0% 35.0%
Main residences rented (as % of total)
Barcelona
Palma
Madrid
Las Palmas
Zaragoza
Valencia
Málaga
Bilbao
Seville
Murcia
6%
30%
64%
Source: National Statistics Institute, 2011 Population and Housing Census. Own preparation.
Districts
Source: National Statistics Institute, 2011 Population and Housing Census. Own preparation.
With regard to the proportion of af-fordable rent houses, the percentages in other European cities are also much higher when compared to Barcelona. According to the same study, Ams-terdam is one of the cities with the most social rent housing areas, with 48%. It should be said that, in this city, it is possible to build housing as 80% of the land is owned by the municipa-lity. Meanwhile, Berlin has 30.2% soci-al rent houses, London 23% and Paris 17.2%.
Housing stock
City Total housing Housing/ Owned housing Rental housing Social rental
stock 10,000 inhabitants stock (%) stock on free market (%) housing stock (%)
Holand 7,107,000 423.0 58.0% 10.0% 32.0%
Amsterdam 398,565 491.3 28.0% 24.0% 48.0%
Germany 41,183,333 508.0 43.0% 51.0% 6.0%
Berlin 1,883,161 550.3 14.0% 55.7% 30.2%
UK 23,400,000 443.0 66.4% 15.6% 18.0%
London 3,383,030 410.0 57.0% 19.0% 23.0%
France 33,672,308 519.0 57.7% 25.2% 14.6%
Paris 1,356,074 602.7 33.1% 44.3% 17.2%
Spain 25,129,000 544.0 85.0% 11.0% 2.0%
Barcelona 811,106 506.0 66.6% 31.3% 2.0%
USA 132,802,859 416.0 64.9%
New York 3,088,881 367.5 31.9% 26.3% 41.85% / 12.86%
Colombia 40.0% Does not exist
Bogotá 2,312,875 297.4 Does not exist
Source: see note 4.
4. Data taken from the study “Models de política d’habitatge municipal. Estudi de referent d’altres ciutats d’àmbit europeu i americà” [Models of municipal housing policy. Reference study of other European and American cities] by Universitat Politécnica de Catalunya (UPC).

)))))))))))))))))))))))))))))))))))))))))))))))))))))))))))))))))))))))))))))))))))))))))))))))))))))))))))))))))))))))))))))))))))))))))))))))))))))))))))))))))))))))))))))))))))))))))))))))))))))))))))))))))))))))))))))))))))))))))))))))))))))))))))))))))) ))))))))))))))))))))))))))))))))))))))))))))))))))))))))))))))))))))))))))))))))))))))))))))))))))))))))))))))))))))))))))))))))))))))))))))))))))))))))))))))))))))))))))))))))))))))))))))))))))))))))))))))))))))))))))))))))))))))))))))))))))))))))))))))))))70 71
3. Recent dynamic of the rent market in Barcelona
3.1. Number of contractsTogether with the increase in prices, the number of contracts also reflects the greater dy-namism of the market. In recent years, the number of rental contracts registered increased intensely, above 15% per year from 2008-2010, and more moderately from 2011-2013, until stabilising in 2014 and retreating slightly in 2015.
The growing trend in the number of rental contracts signed is due to both economic and demographic factors. First of all, during the most intense years of the crisis, rent became the only viable economic alternative for families who, generally speaking, had seen their inco-me decrease as well as their expectations with regard to access to credit.
Furthermore, from a sociodemographic perspective, the stability in which the population indicators move hides strong underlying trends, such as the proliferation of highly diverse living units which are not necessarily permanent (fluctuating population due to studies or work, etc.) and may have no connection beyond sharing common spaces to reduce expen-ses. Many of these new living units are aimed exclusively towards the rental market.
Number of contracts
50,000
40,000
30,000
20,000
10,000
0
2008 2009 2010 2011 2012 2013 2014 2015
Source: Own preparation based on data from the Secretary of Housing and Urban Development.
THE GROWING TREND IN THE NUMBER OF RENTAL CONTRACTS IS BASED ON BOTH DEMOGRAPHIC AND ECONOMIC FACTORS.
3.2. Evolution of contracts and prices by districtThe number of rental contracts registered is not homogeneous throughout the territory. The data by district show considerable differences: Eixample has 20.8% of all contracts registe-red, while Les Corts only has 4.5% of the total. While these appear to be very clear differen-ces, they fit in with the population weight and residential area of each of the two districts in relation to the city as a whole.
Distribution of the number of contracts by district (en %)(2015)
Rent prices by contract show vast differences by district. The average contract in Sar-rià-Sant Gervasi in 2015 was just over €1,050/month, which was double the average rent in Nou Barris, the district with the lowest average rent in the city.
From 10% to 14% (5) More than 14% (1)From 6% to 10% (3)Less than 6% (1)
BY DISTRICT, THE DIFFERENCES IN PRICES ARE SIGNIFICANT, WHILE GROWTH IS WIDESPREAD.
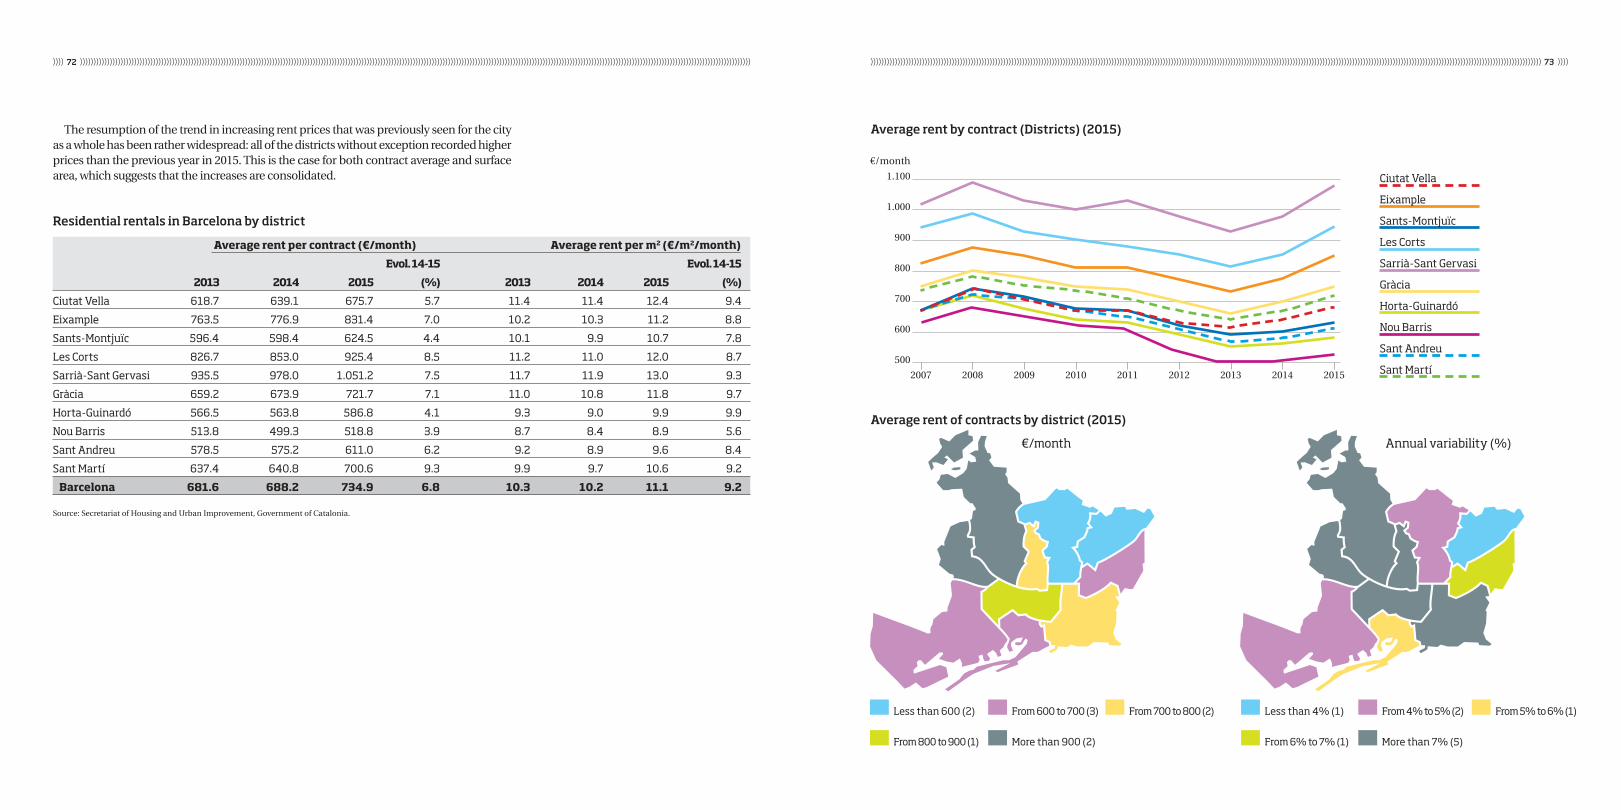
)))))))))))))))))))))))))))))))))))))))))))))))))))))))))))))))))))))))))))))))))))))))))))))))))))))))))))))))))))))))))))))))))))))))))))))))))))))))))))))))))))))))))))))))))))))))))))))))))))))))))))))))))))))))))))))))))))))))))))))))))))))))))))))))))) ))))))))))))))))))))))))))))))))))))))))))))))))))))))))))))))))))))))))))))))))))))))))))))))))))))))))))))))))))))))))))))))))))))))))))))))))))))))))))))))))))))))))))))))))))))))))))))))))))))))))))))))))))))))))))))))))))))))))))))))))))))))))))))))))))72 73
The resumption of the trend in increasing rent prices that was previously seen for the city as a whole has been rather widespread: all of the districts without exception recorded higher prices than the previous year in 2015. This is the case for both contract average and surface area, which suggests that the increases are consolidated.
Residential rentals in Barcelona by district
Average rent per contract (€/month) Average rent per m2 (€/m2/month)
Evol. 14-15 Evol. 14-15
2013 2014 2015 (%) 2013 2014 2015 (%)
Ciutat Vella 618.7 639.1 675.7 5.7 11.4 11.4 12.4 9.4
Eixample 763.5 776.9 831.4 7.0 10.2 10.3 11.2 8.8
Sants-Montjuïc 596.4 598.4 624.5 4.4 10.1 9.9 10.7 7.8
Les Corts 826.7 853.0 925.4 8.5 11.2 11.0 12.0 8.7
Sarrià-Sant Gervasi 935.5 978.0 1.051.2 7.5 11.7 11.9 13.0 9.3
Gràcia 659.2 673.9 721.7 7.1 11.0 10.8 11.8 9.7
Horta-Guinardó 566.5 563.8 586.8 4.1 9.3 9.0 9.9 9.9
Nou Barris 513.8 499.3 518.8 3.9 8.7 8.4 8.9 5.6
Sant Andreu 578.5 575.2 611.0 6.2 9.2 8.9 9.6 8.4
Sant Martí 637.4 640.8 700.6 9.3 9.9 9.7 10.6 9.2
Barcelona 681.6 688.2 734.9 6.8 10.3 10.2 11.1 9.2
Source: Secretariat of Housing and Urban Improvement, Government of Catalonia.
Average rent by contract (Districts) (2015)
Average rent of contracts by district (2015)
€/month Annual variability (%)
Ciutat Vella
Eixample
Sants-Montjuïc
Les Corts
Sarrià-Sant Gervasi
Gràcia
Horta-Guinardó
Nou Barris
Sant Andreu
Sant Martí
From 600 to 700 (3) From 4% to 5% (2)
More than 900 (2) More than 7% (5)
From 700 to 800 (2) From 5% to 6% (1)Less than 600 (2) Less than 4% (1)
From 800 to 900 (1) From 6% to 7% (1)
€/month
1.100
1.000
900
800
700
600
500
2007 2008 2009 2010 2011 2012 2013 2014 2015
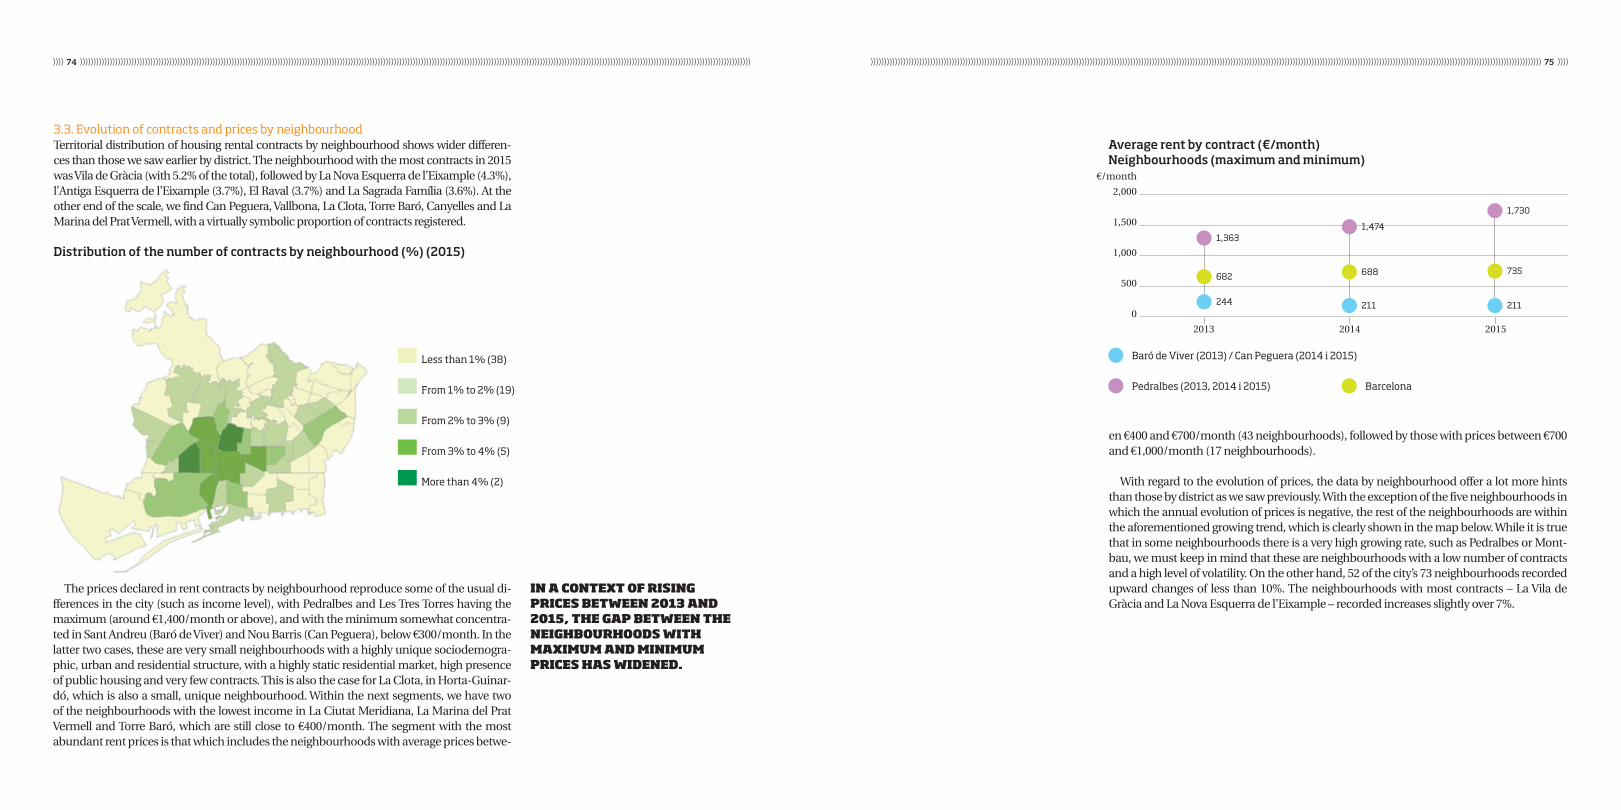
)))))))))))))))))))))))))))))))))))))))))))))))))))))))))))))))))))))))))))))))))))))))))))))))))))))))))))))))))))))))))))))))))))))))))))))))))))))))))))))))))))))))))))))))))))))))))))))))))))))))))))))))))))))))))))))))))))))))))))))))))))))))))))))))))) ))))))))))))))))))))))))))))))))))))))))))))))))))))))))))))))))))))))))))))))))))))))))))))))))))))))))))))))))))))))))))))))))))))))))))))))))))))))))))))))))))))))))))))))))))))))))))))))))))))))))))))))))))))))))))))))))))))))))))))))))))))))))))))))))))74 75
3.3. Evolution of contracts and prices by neighbourhoodTerritorial distribution of housing rental contracts by neighbourhood shows wider differen-ces than those we saw earlier by district. The neighbourhood with the most contracts in 2015 was Vila de Gràcia (with 5.2% of the total), followed by La Nova Esquerra de l’Eixample (4.3%), l’Antiga Esquerra de l’Eixample (3.7%), El Raval (3.7%) and La Sagrada Família (3.6%). At the other end of the scale, we find Can Peguera, Vallbona, La Clota, Torre Baró, Canyelles and La Marina del Prat Vermell, with a virtually symbolic proportion of contracts registered.
Distribution of the number of contracts by neighbourhood (%) (2015)
The prices declared in rent contracts by neighbourhood reproduce some of the usual di-fferences in the city (such as income level), with Pedralbes and Les Tres Torres having the maximum (around €1,400/month or above), and with the minimum somewhat concentra-ted in Sant Andreu (Baró de Viver) and Nou Barris (Can Peguera), below €300/month. In the latter two cases, these are very small neighbourhoods with a highly unique sociodemogra-phic, urban and residential structure, with a highly static residential market, high presence of public housing and very few contracts. This is also the case for La Clota, in Horta-Guinar-dó, which is also a small, unique neighbourhood. Within the next segments, we have two of the neighbourhoods with the lowest income in La Ciutat Meridiana, La Marina del Prat Vermell and Torre Baró, which are still close to €400/month. The segment with the most abundant rent prices is that which includes the neighbourhoods with average prices betwe-
IN A CONTEXT OF RISING PRICES BETWEEN 2013 AND 2015, THE GAP BETWEEN THE NEIGHBOURHOODS WITH MAXIMUM AND MINIMUM PRICES HAS WIDENED.
From 1% to 2% (19)
More than 4% (2)
From 2% to 3% (9)
Less than 1% (38)
From 3% to 4% (5)
Average rent by contract (€/month) Neighbourhoods (maximum and minimum)
€/month
2,000
1,500
1,000
500
0
2013 2014 2015
244 211 211
682 688 735
1,3631,474
1,730
Baró de Viver (2013) / Can Peguera (2014 i 2015)
Pedralbes (2013, 2014 i 2015) Barcelona
en €400 and €700/month (43 neighbourhoods), followed by those with prices between €700 and €1,000/month (17 neighbourhoods).
With regard to the evolution of prices, the data by neighbourhood offer a lot more hints than those by district as we saw previously. With the exception of the five neighbourhoods in which the annual evolution of prices is negative, the rest of the neighbourhoods are within the aforementioned growing trend, which is clearly shown in the map below. While it is true that in some neighbourhoods there is a very high growing rate, such as Pedralbes or Mont-bau, we must keep in mind that these are neighbourhoods with a low number of contracts and a high level of volatility. On the other hand, 52 of the city’s 73 neighbourhoods recorded upward changes of less than 10%. The neighbourhoods with most contracts – La Vila de Gràcia and La Nova Esquerra de l’Eixample – recorded increases slightly over 7%.
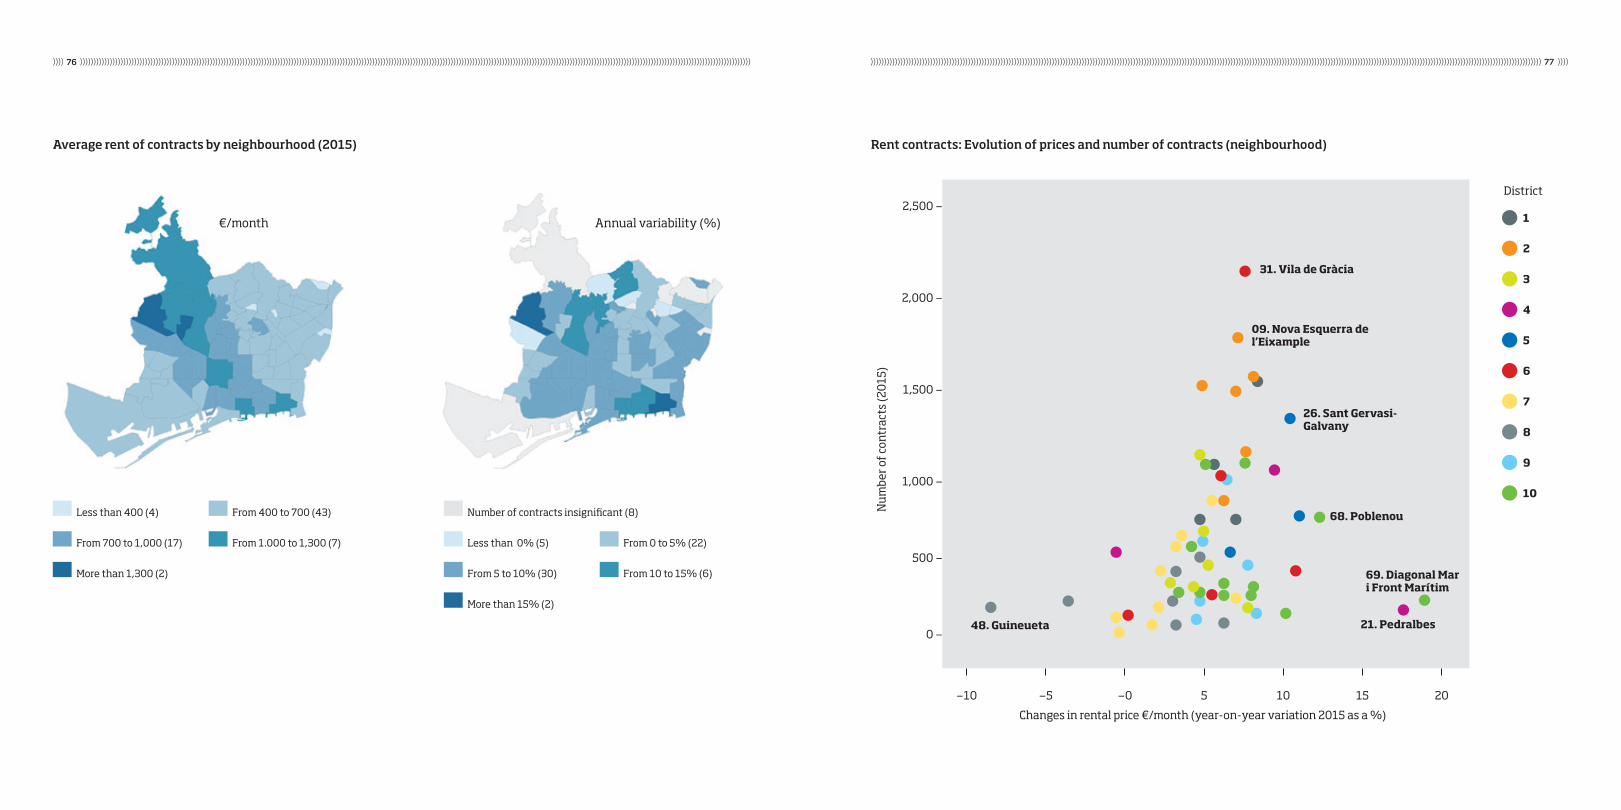
)))))))))))))))))))))))))))))))))))))))))))))))))))))))))))))))))))))))))))))))))))))))))))))))))))))))))))))))))))))))))))))))))))))))))))))))))))))))))))))))))))))))))))))))))))))))))))))))))))))))))))))))))))))))))))))))))))))))))))))))))))))))))))))))))) ))))))))))))))))))))))))))))))))))))))))))))))))))))))))))))))))))))))))))))))))))))))))))))))))))))))))))))))))))))))))))))))))))))))))))))))))))))))))))))))))))))))))))))))))))))))))))))))))))))))))))))))))))))))))))))))))))))))))))))))))))))))))))))))))))76 77
Average rent of contracts by neighbourhood (2015)
From 400 to 700 (43)
From 10 to 15% (6)
From 1.000 to 1,300 (7) From 0 to 5% (22)
More than 15% (2)
More than 1,300 (2) From 5 to 10% (30)
Less than 400 (4) Number of contracts insignificant (8)
From 700 to 1,000 (17) Less than 0% (5)
€/month Annual variability (%)
Rent contracts: Evolution of prices and number of contracts (neighbourhood)
2,500 —
2,000 —
1,500 —
1,000 —
500 —
0 —
—10 —5 —0 5 10 15 20
31. Vila de Gràcia
09. Nova Esquerra de l’Eixample
1
5
3
7
9
2
6
4
8
10
District
Changes in rental price €/month (year-on-year variation 2015 as a %)
Nu
mbe
r of c
ontr
acts
(20
15)
26. Sant Gervasi- Galvany
68. Poblenou
69. Diagonal Mar i Front Marítim
21. Pedralbes48. Guineueta
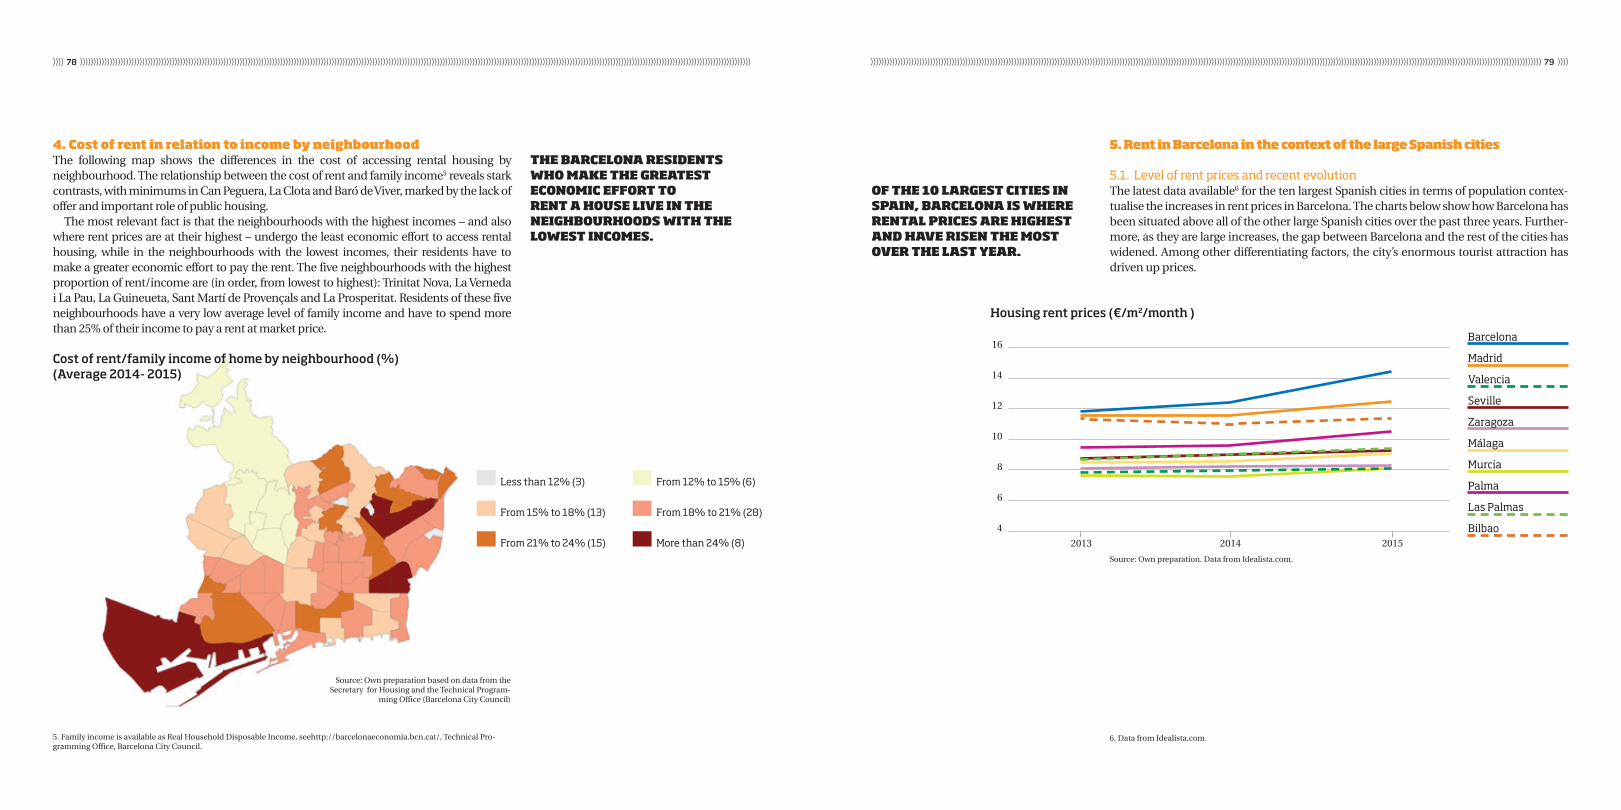
)))))))))))))))))))))))))))))))))))))))))))))))))))))))))))))))))))))))))))))))))))))))))))))))))))))))))))))))))))))))))))))))))))))))))))))))))))))))))))))))))))))))))))))))))))))))))))))))))))))))))))))))))))))))))))))))))))))))))))))))))))))))))))))))))) ))))))))))))))))))))))))))))))))))))))))))))))))))))))))))))))))))))))))))))))))))))))))))))))))))))))))))))))))))))))))))))))))))))))))))))))))))))))))))))))))))))))))))))))))))))))))))))))))))))))))))))))))))))))))))))))))))))))))))))))))))))))))))))))))))78 79
4. Cost of rent in relation to income by neighbourhoodThe following map shows the differences in the cost of accessing rental housing by neighbourhood. The relationship between the cost of rent and family income5 reveals stark contrasts, with minimums in Can Peguera, La Clota and Baró de Viver, marked by the lack of offer and important role of public housing.
The most relevant fact is that the neighbourhoods with the highest incomes – and also where rent prices are at their highest – undergo the least economic effort to access rental housing, while in the neighbourhoods with the lowest incomes, their residents have to make a greater economic effort to pay the rent. The five neighbourhoods with the highest proportion of rent/income are (in order, from lowest to highest): Trinitat Nova, La Verneda i La Pau, La Guineueta, Sant Martí de Provençals and La Prosperitat. Residents of these five neighbourhoods have a very low average level of family income and have to spend more than 25% of their income to pay a rent at market price.
Cost of rent/family income of home by neighbourhood (%)(Average 2014- 2015)
THE BARCELONA RESIDENTS WHO MAKE THE GREATEST ECONOMIC EFFORT TO RENT A HOUSE LIVE IN THE NEIGHBOURHOODS WITH THE LOWEST INCOMES.
From 12% to 15% (6)
From 18% to 21% (28)
More than 24% (8)From 21% to 24% (15)
Less than 12% (3)
From 15% to 18% (13)
5. Family income is available as Real Household Disposable Income, seehttp://barcelonaeconomia.bcn.cat/, Technical Pro-gramming Office, Barcelona City Council.
Source: Own preparation based on data from the Secretary for Housing and the Technical Program-
ming Office (Barcelona City Council)
5. Rent in Barcelona in the context of the large Spanish cities
5.1. Level of rent prices and recent evolutionThe latest data available6 for the ten largest Spanish cities in terms of population contex-tualise the increases in rent prices in Barcelona. The charts below show how Barcelona has been situated above all of the other large Spanish cities over the past three years. Further-more, as they are large increases, the gap between Barcelona and the rest of the cities has widened. Among other differentiating factors, the city’s enormous tourist attraction has driven up prices.
OF THE 10 LARGEST CITIES IN SPAIN, BARCELONA IS WHERE RENTAL PRICES ARE HIGHEST AND HAVE RISEN THE MOST OVER THE LAST YEAR.
6. Data from Idealista.com.
16
14
12
10
8
6
4
2013 20152014
Barcelona
Madrid
Valencia
Seville
Zaragoza
Málaga
Murcia
Palma
Las Palmas
Bilbao
Housing rent prices (€/m2/month )
Source: Own preparation. Data from Idealista.com.
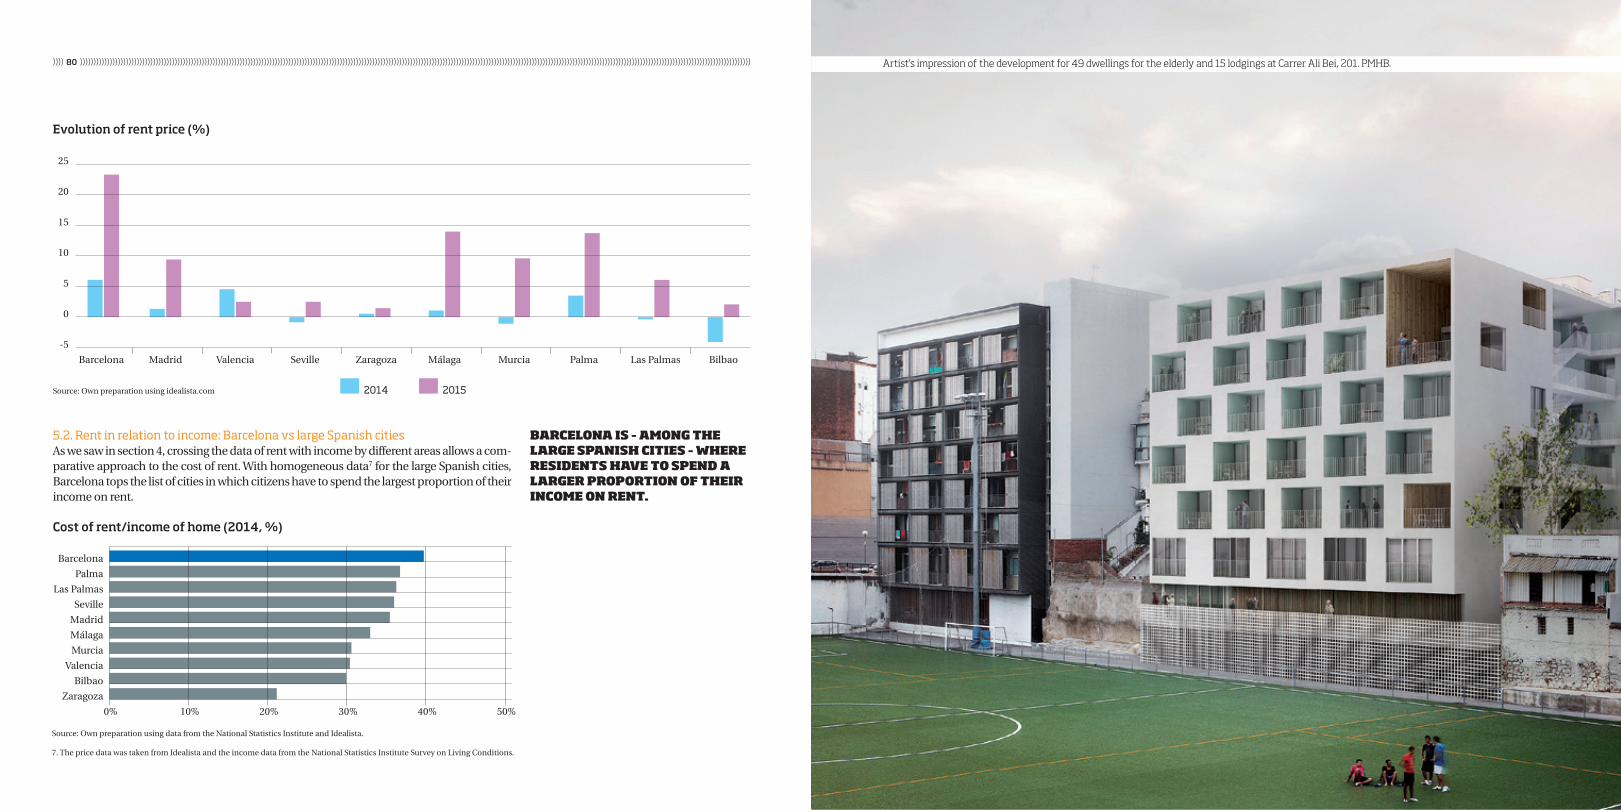
))))))))))))))))))))))))))))))))))))))))))))))))))))))))))))))))))))))))))))))))))))))))))))))))))))))))))))))))))))))))))))))))))))))))))))))))))))))))))))))))))))))))))))))))))))))))))))))))))))))))))))))))))))))))))))))))))))))))))))))))))))))))))))))))))80
Barcelona Madrid Valencia Seville Zaragoza Málaga Murcia Palma Las Palmas Bilbao
Evolution of rent price (%)
25
20
15
10
5
0
-5
2014 2015Source: Own preparation using idealista.com
5.2. Rent in relation to income: Barcelona vs large Spanish citiesAs we saw in section 4, crossing the data of rent with income by different areas allows a com-parative approach to the cost of rent. With homogeneous data7 for the large Spanish cities, Barcelona tops the list of cities in which citizens have to spend the largest proportion of their income on rent.
BARCELONA IS – AMONG THE LARGE SPANISH CITIES – WHERE RESIDENTS HAVE TO SPEND A LARGER PROPORTION OF THEIR INCOME ON RENT.
Source: Own preparation using data from the National Statistics Institute and Idealista.
7. The price data was taken from Idealista and the income data from the National Statistics Institute Survey on Living Conditions.
0% 10% 20% 30% 40% 50%
Cost of rent/income of home (2014, %)
Barcelona
Palma
Las Palmas
Seville
Madrid
Málaga
Murcia
Valencia
Bilbao
Zaragoza
Artist’s impression of the development for 49 dwellings for the elderly and 15 lodgings at Carrer Ali Bei, 201. PMHB.