passant master thesis
168
NOVEL DISPERSION TECHNIQUE OF CARBON NANOTUBE IN COMBINATION WITH NANO SILICA IN CEMENT COMPOSITES TO ENHANCE ITS MECHANICAL PROPERTIES By Passant Ahmed Mohamed Mohamed Youssef A Thesis Submitted to the Faculty of Engineering at Cairo University in Partial Fulfillment of the Requirements for the Degree of MASTER OF SCIENCE in Structural Engineering FACULTY OF ENGINEERING, CAIRO UNIVERSITY GIZA, EGYPT 2015
-
Upload
passant-youssef -
Category
Documents
-
view
41 -
download
2
Transcript of passant master thesis
NOVEL DISPERSION TECHNIQUE OF CARBON
NANOTUBE IN COMBINATION WITH NANO SILICA IN
CEMENT COMPOSITES TO ENHANCE ITS MECHANICAL
PROPERTIES
By
Passant Ahmed Mohamed Mohamed Youssef
A Thesis Submitted to the
Faculty of Engineering at Cairo University
in Partial Fulfillment of the
Requirements for the Degree of
MASTER OF SCIENCE
in
Structural Engineering
FACULTY OF ENGINEERING, CAIRO UNIVERSITY
GIZA, EGYPT
2015
NOVEL DISPERSION TECHNIQUE OF CARBON
NANOTUBE IN COMBINATION WITH NANO SILICA IN
CEMENT COMPOSITES TO ENHANCE ITS MECHANICAL
PROPERTIES
By
Passant Ahmed Mohamed Mohamed Youssef
A Thesis Submitted to the
Faculty of Engineering at Cairo University
in Partial Fulfillment of the
Requirements for the Degree of
MASTER OF SCIENCE
in
Structural Engineering
Under the Supervision of
Asst. Prof. Dr. Mohamed I. Serag Dr. Muhammad S. El-Feky
Associate Professor of Strength of
Materials
Civil Department
Faculty of Engineering, Cairo University
Researcher
Civil Engineering Department
National Research Center
FACULTY OF ENGINEERING, CAIRO UNIVERSITY
GIZA, EGYPT
2015
NOVEL DISPERSION TECHNIQUE OF CARBON
NANOTUBE IN COMBINATION WITH NANO SILICA IN
CEMENT COMPOSITES TO ENHANCE ITS MECHANICAL
PROPERTIES
By
Passant Ahmed Mohamed Mohamed Youssef
A Thesis Submitted to the
Faculty of Engineering at Cairo University
in Partial Fulfillment of the
Requirements for the Degree of
MASTER OF SCIENCE
in
Structural Engineering
Approved by the
Examining Committee
Prof. Dr. Ahmed Khedr Taha Mohamed (External Examiner) Professor and Vice Head of Civil Engineering Department - National Research Center
Prof. Dr. Ahmed Mahmoud Maher Ragab (Internal Examiner) Professor of Strength of Materials - Faculty of Engineering - Cairo University
Asst. Prof. Dr. Mohamed Ismail Abdul Aziz Serag (Thesis Main Advisor) Asst. Professor of Strength of Materials - Faculty of Engineering - Cairo University
Dr. Muhammad Samy Abdul Hakeem El-Feky (Advisor) Researcher in Civil Engineering Department - National Research Center
FACULTY OF ENGINEERING, CAIRO UNIVERSITY
GIZA, EGYPT
2015
Engineer’s Name:
Passant Ahmed Mohamed Mohamed Youssef
Date of Birth: 20/09/1990
Nationality: Egyptian
E-mail: [email protected]
Phone: 002-0128-521-9445
Address: No. 49, El-Oroba St., Haram, Giza, Egypt.
Registration Date: 01/10/2012
Awarding Date: …./…./……..
Degree: Master of Science
Department: Structural Engineering
Supervisors: Asst. Prof. Dr. Mohamed I. Serag
Dr. Muhammad S. El-Feky
Examiners: Prof. Dr. Ahmed Khedr Taha Mohamed (External
examiner)
Prof. Dr. Ahmed Mahmoud Maher Ragab (Internal
examiner)
Asst. Prof. Dr. Mohamed Ismail Abdul Aziz Serag
(Thesis main advisor)
Dr. Muhammad Samy Abdul Hakeem El-Feky (Advisor)
Title of Thesis:
NOVEL DISPERSION TECHNIQUE OF CARBON NANOTUBE IN
COMBINATION WITH NANO SILICA IN CEMENT COMPOSITES TO
ENHANCE ITS MECHANICAL PROPERTIES
Key Words:
Nano Silica; Carbon Nanotube; Sonication; Optimization; Novel Technique,
Agglomeration
Summary:
This thesis studied the influence of the method and duration of applying direct
or indirect sonication energy to disperse Nano silica as well as the influence of
the method and duration of applying direct or indirect sonication energy and/or
homogenizer to carbon Nanotubes to explain the inconsistency in the previous
researches about the behavior of these Nano materials. Secondly, the effect of
superplasticizer on the dispersion of Nano silica and carbon Nanotubes by
optimizing the compressive strength of cement pastes was studied. Finally, a
study was investigated in order to examine the coupled effect of Nano silica and
carbon Nanotubes on the mechanical properties of cement mortars.

i
Acknowledgments
First and above of all, I have to thank Allah for this great chance I have right now. I
thank God for providing me with the opportunity to meet such helpful and wonderful
people those who helped me from the start of this thesis. All praises to Allah for giving
me knowledge, strength, support and patience to present this work.
I would like to express my deepest sense of gratitude to my respectable supervisor;
Prof. Dr. Mohamed I. Serag; who offered me the honor to be one of his students. I
thank him for his continuous advice and encouragement throughout the course of this
thesis. I also thank him for the guidance, caring, patience, and great effort to provide
me with an excellent atmosphere for doing this research.
I would like to thank my supervisor; Dr. Muhammad S. El-Feky; for his
understanding, patience, support and extreme care about the work efficiency. He gave
me a lot of experience about Nanotechnology. He spends very much time instructing
me how to collect data and how to write my thesis, as well as providing useful
suggestions about the experimental program. I have been lucky to get the opportunity to
work under his supervision.
I am also thankful for the kind assistance and efforts done by technicians; Mr. Hamdy
Beheiry and Mr. Ahmed Said; who helped in conducting the thesis experimental work.
I would also like to express my deep thanks to my super mother; Mrs. Hanan; She was
always there inspiring me with her support, love and patience, cheering me up and
stood by me through the good and bad times.
For the living memory of my father; Mr. Ahmed; although I didn't get the chance to
live with you these moments, your presence is still felt in my heart and your character
imprinted in my personality.
Many thanks to my sister; Ms. Dina; my soul mate, for encouraging me to keep on
following our dreams together. My sister; Ms. Menna; thank you for caring about my
well-being and believing in me.
I would like to thank my grandfather and all my lovely family members. They were
always supporting me and encouraging me with their best wishes, guidance and
advices. I thank God for them.
I would like to thank my close friends. They are all my true treasure in my life starting
of my childhood right now.
I feel very lucky to be surrounded by great colleagues; I am thankful to Eng. Sarah
Ibrahim, Eng. Basem Hasan, Eng. Ahmed Yasien, Eng. Mohamed Sherif and Eng.
Rania Salah El-Din.
Finally, I would like to thank the National Research Center, not only for providing the
funding which allowed me to accomplish this research, but also for providing me with
the facilities and workman power to implement the research experimental plan.

ii
Dedication
To my Mother & father's soul,
The reason of what I become today,
Thank you for your love, support and care.
To my sisters,
I am really grateful to both of you,
you have been my inspiration and my soul mates.
To my family,
All the love and respect to you for your support.
iii
Table of Contents
ACKNOWLEDGMENTS .............................................................................................. I
DEDICATION ............................................................................................................... II
TABLE OF CONTENTS ............................................................................................ III
LIST OF TABLES ....................................................................................................... VI
LIST OF FIGURES .................................................................................................... VII
ABSTRACT .............................................................................................................. XIV
CHAPTER 1 : INTRODUCTION ................................................................................ 1
1.1. GENERAL ........................................................................................................ 1
1.2. MOTIVATION ................................................................................................. 3
1.3. OBJECTIVES................................................................................................... 4
1.4. SCOPE OF WORK .......................................................................................... 4
1.5. THESIS LAYOUT ........................................................................................... 5
1.5.1. CHAPTER 1: INTRODUCTION ................................................................................ 5
1.5.2. CHAPTER 2: LITERATURE REVIEW ...................................................................... 5
1.5.3. CHAPTER 3: EXPERIMENTAL PLAN ...................................................................... 5
1.5.4. CHAPTER 4: RESULTS AND DISCUSSION .............................................................. 6
1.5.5. CHAPTER 5: SUMMARY, CONCLUSION AND RECOMMENDATION ......................... 6
CHAPTER 2 : LITERATURE REVIEW .................................................................... 7
2.1. INTRODUCTION ............................................................................................ 7
2.2. THE USE OF NANO SILICA IN CONCRETE ........................................... 8
2.2.1. GENERAL............................................................................................................. 8
2.2.2. INFLUENCE OF NANO SILICA ADDITION ON CEMENT PASTES, AND MORTARS ....... 8
2.3. DIFFICULTIES FACING THE USE OF NANO SILICA IN CONCRETE
10
2.3.1. NANO SILICA AGGLOMERATION ......................................................................... 10
2.3.2. MIXING AND DISPERSION METHODS .................................................................. 12
2.3.3. SUPER PLASTICIZERS COMPATIBILITY ................................................................ 13
2.4. THE USE OF CARBON NANOTUBES IN CONCRETE ......................... 14
2.4.1. GENERAL........................................................................................................... 14
2.4.2. INFLUENCE OF CARBON NANOTUBES ADDITION ON CEMENT PASTES AND
MORTARS ..................................................................................................................... 15
2.4.3. INFLUENCE OF CARBON NANOTUBES ADDITION ON CONCRETE PROPERTIES ...... 19
iv
2.5. DIFFICULTIES FACING CNT USAGE IN CONCRETE ....................... 20
2.5.1. CARBON NANOTUBES AGGLOMERATION ........................................................... 20
2.5.2. MIXING AND DISPERSION METHODS .................................................................. 21
2.5.3. SUPERPLASTICIZERS COMPATIBILITY................................................................. 24
2.6. THE COUPLED EFFECT OF NS AND CNT ON CEMENT
COMPOSITES ............................................................................................................. 25
2.7. STATISTICAL FACTORIAL DESIGN IN CONCRETE RESEARCH . 26
CHAPTER 3 : EXPERIMENTAL PROGRAM ....................................................... 29
3.1. GENERAL ...................................................................................................... 29
3.2. OVERVIEW OF EXPERIMENTAL PROGRAM ..................................... 29
3.2.1. CHARACTERIZATION OF USED MATERIALS ....................................................... 32
3.2.2. CHARACTERIZATION OF USED EQUIPMENT ....................................................... 38
3.2.3. SAMPLES PREPARATION .................................................................................... 42
3.2.3.1. Optimizing the dispersion of materials (phase one) ............................. 42
3.2.3.2. Samples for studying the coupled effect of NS and CNT on cement
mortars behavior (phase two) .................................................................................. 48
3.2.4. CHARACTERIZATION, TESTING AND ANALYSIS ................................................. 50
3.2.4.1. Characterization .................................................................................... 50
3.2.4.2. Testing .................................................................................................. 54
3.2.4.3. Analysis ................................................................................................ 56
CHAPTER 4 : RESULTS AND DISCUSSION ......................................................... 57
4.1. INTRODUCTION .......................................................................................... 57
4.2. OPTIMIZING THE DISPERSION OF NANO SILICA AND CARBON
NANOTUBE (PHASE 1) ............................................................................................. 57
4.2.1. OPTIMIZING THE TYPE AND TIME OF SONICATION ON THE DISPERSION OF NANO
SILICA 57
4.2.1.1. The effect of sonication type on the dispersion of NS (stage 1) .......... 58
4.2.1.2. The effect of sonication time on the dispersion of NS (stage 2) .......... 61
4.2.2. OPTIMIZING THE TYPE AND TIME OF SONICATION ON THE DISPERSION OF CNT . 83
4.2.2.1. The effect of sonication type on the dispersion of CNT (stage 1) ........ 83
4.2.2.2. Introduce a novel technique for the dispersion of CNT (stage 2) ........ 88
4.3. OPTIMIZING THE COUPLE EFFECT OF NANO SILICA AND
CARBON NANOTUBE ON THE MECHANICAL PROPERTIES OF CEMENT
COMPOSITES (PHASE 2) ......................................................................................... 96
4.3.1. OPTIMIZING THE EFFECT OF DIFFERENT DOSAGES OF CNT ON THE MECHANICAL
PROPERTIES OF CEMENT MORTARS (STAGE 1)............................................................... 96
4.3.2. OPTIMIZING THE COUPLE EFFECT OF DIFFERENT DOSAGES OF NS AND CNT ON
THE MECHANICAL PROPERTIES OF CEMENT MORTARS (STAGE 2) ................................ 102
CHAPTER 5 : SUMMARY, CONCLUSION AND RECOMMENDATION ...... 128
v
5.1. SUMMARY ................................................................................................... 128
5.2. CONCLUSION ............................................................................................. 129
5.2.1. OPTIMIZING THE TYPE AND TIME OF SONICATION ON THE DISPERSION OF NANO
SILICA 129
5.2.1.1. The effect of sonication type on the dispersion of NS (stage 1) ........ 129
5.2.1.2. The effect of sonication time on the dispersion of NS (stage 2) ........ 129
5.2.2. OPTIMIZING THE TYPE AND TIME OF SONICATION ON THE DISPERSION OF CNT
129
5.2.2.1. The effect of sonication type on the dispersion of CNT (stage 1) ...... 129
5.2.2.2. Introduce a novel technique for the dispersion of CNT (stage 2) ...... 130
5.2.3. OPTIMIZING THE COUPLE EFFECT OF NANO SILICA AND CARBON NANOTUBE ON
THE MECHANICAL PROPERTIES OF CEMENT COMPOSITES (PHASE 2) ........................... 130
5.2.3.1. Optimizing the effect of different dosages of CNT on the mechanical
properties of cement mortars (stage 1) .................................................................. 130
5.2.3.2. Optimizing the couple effect of different dosages of NS and CNT on
the mechanical properties of cement mortars (stage 2) ......................................... 130
5.3. RECOMMENDATION ............................................................................... 132
REFERENCES ........................................................................................................... 133
APPENDIX A: MASTERSIZER 3000 RESULT SHEET (NS) ............................. 141
APPENDIX B: MASTERSIZER 3000 RESULT SHEET (CNT) .......................... 142
vi
List of Tables
Table 3.1: Properties of Portland cement (wt. %) .......................................................... 32
Table 3.2: Chemical composition of Nano silica (wt %) ............................................... 33
Table 3.3: Physical and chemical characteristics of the polycarboxylate admixture ..... 37
Table 3.4: Bath sonicator properties and specifications ................................................. 39
Table 3.5: Rotor-stator homogenizer properties ............................................................. 41
Table 3.6: Constituents of Nano silica preparation samples .......................................... 42
Table 3.7: The second stage mixtures composition (gm.) .............................................. 43
Table 3.8: Sonication time of carbon Nano tube dispersion samples for direct sonication
........................................................................................................................................ 44
Table 3.9: Sonication time of carbon Nano tube dispersion samples for indirect
sonication ........................................................................................................................ 44
Table 3.10: Mixtures composition (gm.) for 3 cubes 5*5*5 cm3 .................................. 45
Table 3.11: Second stage mixtures composition (gm.) .................................................. 46
Table 3.12 : Phase two / stage one mixes constituents in (gm.) ..................................... 48
Table 3.13: Phase two / stage two mixes constituents in (gm.) ...................................... 49
Table 3.14: Data entry on the testing machine for the compressive strength test .......... 54
Table 3.15: Data entry on the testing machine for the flexure strength test ................... 56
Table 4.1: 7 days compressive strength studying the effect of NS and superplasticizer
on CNT dispersion .......................................................................................................... 87
Table 4.2: Comparison between imported and locally produced CNT properties ......... 95
Table 4.3 : Specific surface area of different dosages of CNT .................................... 100
Table 4.4: Summary of compressive strength effect .................................................... 121
Table 4.5: Summary of compressive strength effect .................................................... 124
vii
List of Figures
Figure 2.1: SWCNT and MWCNT (48) ......................................................................... 15
Figure 2.2: Interaction between COOH-MWCNTs and water molecules during cement
hydration process.(49) .................................................................................................... 16
Figure 2.3: Effect of cement grains on CNTs/CNFs dispersion; the large grains create
zones that are absent of Nanotubes/Nanofibers even after hydration has progressed(51)
........................................................................................................................................ 17
Figure 2.4: Schematic representation of the arrangement of CNTs in a cement matrix:
advantageous (a and c) and disadvantageous (b and d) distribution of the mixed CNTs
and N-CNTs, respectively.(60)....................................................................................... 22
Figure 2.5: Overall schema for CNT breaking. CNTs near the bubble nucleus (green
region) align tangentially during bubble (blue) growth. During collapse, CNTs may
rotate radially and stretch or buckle depending on their length.(61) .............................. 23
Figure 3.1: TEM micrograph of SiO2 Nano particles .................................................... 33
Figure 3.2: X-ray diffraction (XRD) analysis of SiO2 Nano particles.......................... 34
Figure 3.3: TEM micrograph of local carbon Nano tubes particles ............................... 34
Figure 3.4: X-ray diffraction (XRD) of local carbon Nano tube particles. .................... 35
Figure 3.5: Scanning electron microscope (SEM) of local carbon Nano tube particles 35
Figure 3.6: Transmission electron microscope (TEM) micrograph of imported carbon
Nano tubes particles ....................................................................................................... 36
Figure 3.7: Zeta potential distribution of imported carbon Nano tube particles ........... 36
Figure 3.8: Sieve analysis for fine aggregates as compared to the limits of the Egyptian
code of practice............................................................................................................... 37
Figure 3.9: Probe Sonicator ............................................................................................ 38
Figure 3.10: Bath sonicator ............................................................................................ 40
Figure 3.11: high speed homogenizer ............................................................................ 41
Figure 3.12: Schematic diagram showing differences between mixing sequences ........ 43
viii
Figure 3.13: Schematic diagram showing mixing sequence of mixes in order to examine
the effect of superplasticizer on CNT dispersion ........................................................... 45
Figure 3.14: Schematic diagram showing differences between mixing sequences ........ 47
Figure 3.15: Schematic diagram showing the mixing sequence of samples contain CNT
only ................................................................................................................................. 48
Figure 3.16: Schematic diagram showing the mixing sequence of samples contain N.S.
and CNT ......................................................................................................................... 50
Figure 3.17: Particle size analyzer Mastersizer 3000 used for samples dispersion ........ 51
Figure 3.18: The transmission electron microscope (TEM) used for samples
characterization ............................................................................................................... 52
Figure 3.19: Zeta-Sizer 2000 .......................................................................................... 53
Figure 3.20: QUANTA scanning electron microscope used for analysis ...................... 53
Figure 3.21: Universal testing machine 1000 KN .......................................................... 55
Figure 3.22: Data on the machine's screen .................................................................... 55
Figure 3.23: Flexure test using three points beam method ............................................. 56
Figure 4.1: Particle size distribution of Nano silica particles size using direct sonication
method ............................................................................................................................ 59
Figure 4.2 : Cumulative density of Nano silica particles size using direct sonication
method ............................................................................................................................ 59
Figure 4.3: Particle size distribution of Nano silica particles size using indirect
sonication method ........................................................................................................... 60
Figure 4.4: Cumulative density of Nano silica particles size using indirect sonication
method ............................................................................................................................ 60
Figure 4.5: Specific surface area for Nano silica particles using direct sonication
method ............................................................................................................................ 61
Figure 4.6: Specific surface area for Nano silica particles using indirect sonication
method ............................................................................................................................ 61
Figure 4.7: 7 days compressive strength for cement mortars containing 1% NS under
the effect of sonication for 3, 6, 9 and 12 minutes ......................................................... 63
ix
Figure 4.8: 28 days compressive strength for cement mortars containing 1% NS under
the effect of sonication for 3, 6, 9 and 12 minutes ......................................................... 63
Figure 4.9: 7 days compressive strength for cement mortars containing 2% NS under
the effect of sonication for 3, 6, 9 and 12 minutes ......................................................... 64
Figure 4.10: 28 days compressive strength for cement mortars containing 2% NS under
the effect of sonication for 3, 6, 9 and 12 minutes ......................................................... 64
Figure 4.11: Particle size distribution of 1% NS particles size dispersed in water under
the effect of sonication for 0, 3, 6, 9 and 12 minutes ..................................................... 65
Figure 4.12: Cumulative density of 1% NS particles size dispersed in water under the
effect of sonication for 0, 3, 6, 9 and 12 minutes ........................................................... 65
Figure 4.13: Particle size distribution of 2% NS particles size dispersed in water under
the effect of sonication for 0, 3, 6, 9 and 12 minutes ..................................................... 66
Figure 4.14: Cumulative density of 2% NS particles size dispersed in water under the
effect of sonication for 0, 3, 6, 9 and 12 minutes ........................................................... 66
Figure 4.15: Specific surface area for 1% NS dispersed in water under the effect of
sonication for 0, 3, 6, 9 and 12 minutes.......................................................................... 67
Figure 4.16: Specific surface area for 2% NS dispersed in water under the effect of
sonication for 0, 3, 6, 9 and 12 minutes.......................................................................... 67
Figure 4.17: 7 and 28 days compressive strength for cement mortars containing 0.5, 1,
1.5 and 2% NS under the effect of sonication for 3 minutes .......................................... 68
Figure 4.18: 7 and 28 days compressive strength for cement mortars containing 1, 1.5
and 2% NS under the effect of sonication for 6 minutes ................................................ 69
Figure 4.19: 7 and 28 days compressive strength for cement mortars containing 1, 2 and
2.5% NS under the effect of sonication for 12 minutes ................................................. 69
Figure 4.20: 28 days compressive strength for optimum NS sonication time for each
concentration .................................................................................................................. 70
Figure 4.21: Particle size distribution of optimum NS sonication time for each
concentration .................................................................................................................. 71
Figure 4.22: Cumulative density of optimum NS sonication time for each concentration
........................................................................................................................................ 71
Figure 4.23: Specific surface area for optimum NS sonication time for each
concentration .................................................................................................................. 72
x
Figure 4.24: Flexure strength for beams with 1% NS sonicated for 3, 6, 9 and 12
minutes compared by the control batch .......................................................................... 73
Figure 4.25: Flexure strength for beams with 2% NS sonicated for 3, 6, 9 and 12
minutes compared by the control batch .......................................................................... 73
Figure 4.26: Comparison between compressive and flexure strength for beams with 1%
NS sonicated for 3, 6, 9 and 12 minutes compared by the control batch ....................... 74
Figure 4.27: Comparison between compressive and flexure strength for beams with 2%
NS sonicated for 3, 6, 9 and 12 minutes compared by the control batch ....................... 74
Figure 4.28: Comparison between compressive and flexure strength for beams with
different percentages of NS sonicated for 3 minutes ...................................................... 75
Figure 4.29: Comparison between compressive and flexure strength for beams with
different percentages of NS sonicated for 6 minutes ...................................................... 76
Figure 4.30: Comparison between compressive and flexure strength for beams with
different percentages of NS sonicated for 12 minutes.................................................... 76
Figure 4.31: SEM micrograph of the plain cement composite (a) as compared to
optimum cement mortar contained 2.5 wt.% NS sonicated for 12 minutes (b) ............. 78
Figure 4.32: XRD the plain cement composite .............................................................. 79
Figure 4.33: XRD the cement mortar containing 2.5% NS sonicated for 12 min
(NS2.5/12) ...................................................................................................................... 80
Figure 4.34: TGA of the plain cement composite .......................................................... 82
Figure 4.35: TGA the cement mortar containing 2.5% NS sonicated for 12 min
(NS2.5/12) ...................................................................................................................... 82
Figure 4.36: Cumulative density of CNT using direct method ...................................... 85
Figure 4.37: Cumulative density of CNT using indirect method ................................... 85
Figure 4.38: Specific surface area for CNT particles dispersed in water using direct
sonication method ........................................................................................................... 86
Figure 4.39: Specific surface area for CNT particles dispersed in water using indirect
sonication method ........................................................................................................... 86
Figure 4.40: 7 days compressive strength of cement pastes studying the effect of NS
and superplasticizer on CNT dispersion ......................................................................... 88
xi
Figure 4.41: Effect of different methods of CNT treatment on cement pastes 7 days
compressive strength ...................................................................................................... 89
Figure 4.42: Gain in 7 days compressive strength for cement pastes studying different
methods for CNT treatment as compared to cement paste containing superplasticizer
and CNT ......................................................................................................................... 90
Figure 4.43: Gain in 7 days compressive strength for cement pastes studying different
methods for CNT treatment as compared to cement paste containing superplasticizer
only. ................................................................................................................................ 90
Figure 4.44: Particle size distribution of as received and optimum method for CNT
treatment ......................................................................................................................... 91
Figure 4.45: Cumulative density of as received and optimum method for CNT treatment
........................................................................................................................................ 91
Figure 4.46: 3D graph between time of sonication and homogenizer and compressive
strength ........................................................................................................................... 92
Figure 4.47: Contour graph presents the relation between time of sonication and
homogenizer and compressive strength .......................................................................... 92
Figure 4.48: CNT immediately before and after treatment (a), after a week (b), after a
month (c) ........................................................................................................................ 93
Figure 4.49: SEM micrograph of the plain cement paste (a) as compared to optimum
CNT treatment method (S40H10) cement paste (b) ....................................................... 94
Figure 4.50: TEM micrograph of the as received CNT (a) as compared to optimum
CNT treatment method (S40H10) (b)............................................................................. 95
Figure 4.51: 7 days compressive strength for CNT mortars compared by the control
batch ............................................................................................................................... 97
Figure 4.52: 28 days compressive strength for CNT mortars compared by the control
batch ............................................................................................................................... 98
Figure 4.53: Particle size distribution of CNT dispersed in water in different
percentages ..................................................................................................................... 99
Figure 4.54: Cumulative density of CNT dispersed in water in different dosages ........ 99
Figure 4.55: Flexure strength for beams containing 0.01, 0.02 and 0.03% CNT by
cement weight compared by the control batch ............................................................. 100
Figure 4.56: TGA of the cement mortar containing 0.03% CNT (CNT0.03) .............. 101
xii
Figure 4.57: 7 days compressive strength for mortars containing 0.01% CNT and
different percentages of NS .......................................................................................... 104
Figure 4.58: 28 days compressive strength for mortars containing 0.01% CNT and
different percentages of NS .......................................................................................... 104
Figure 4.59: 7 days compressive strength for mortars containing 0.02% CNT and
different percentages of NS .......................................................................................... 105
Figure 4.60: 28 days compressive strength for mortars containing 0.02% CNT and
different percentages of NS .......................................................................................... 105
Figure 4.61: 7 days compressive strength for mortars containing 0.03% CNT and
different percentages of NS .......................................................................................... 106
Figure 4.62: 28 days compressive strength for mortars containing 0.03% CNT and
different dosages of NS ................................................................................................ 106
Figure 4.63: Particle size distribution of samples containing 1% NS and 0.02% CNT
...................................................................................................................................... 108
Figure 4.64: Cumulative density of samples containing 1% NS and 0.02% CNT ....... 108
Figure 4.65: Particle size distribution of samples containing 2% NS and 0.02% CNT
...................................................................................................................................... 109
Figure 4.66: Cumulative density of samples containing 2% NS and 0.02% CNT ....... 109
Figure 4.67: Specific surface area for solutions containing 1% NS and 0.02% CNT .. 110
Figure 4.68: Specific surface area for solutions containing 2% NS and 0.02% CNT .. 110
Figure 4.69: Flexure strength for beams containing 0.01% CNT and different
percentages of NS ......................................................................................................... 112
Figure 4.70: Flexure strength for beams containing 0.02% CNT and different
percentages of NS ......................................................................................................... 112
Figure 4.71: Flexure strength for beams containing 0.03% CNT and different
percentages of NS ......................................................................................................... 113
Figure 4.72: SEM micrograph of a plain cement composite (a) as compared to cement
mortar combined 1 wt.% NS and 0.02 wt.% CNT (b) ................................................. 114
Figure 4.73: SEM micrograph of a plain cement composite (a) as compared to cement
mortar combined 2 wt.% NS and 0.02 wt.% CNT (b) ................................................. 115
xiii
Figure 4.74: TEM micrograph of combined 2 wt.% NS and 0.02 wt.% CNT cement
mortar, (a) mono dispersed CNT, (b) agglomerated NS and CNT .............................. 116
Figure 4.75: XRD the cement mortar containing 0.02% CNT (CNT0.02) .................. 117
Figure 4.76: XRD the cement mortar containing 1% NS sonicated for 3 min (NS1/3)
...................................................................................................................................... 117
Figure 4.77: XRD the cement mortar containing 1% NS sonicated for 3 min combined
with 0.02% CNT (NS1/CNT0.02) ................................................................................ 118
Figure 4.78: XRD the cement mortar containing 2.5% NS sonicated for 12 min
(NS2.5/12) .................................................................................................................... 118
Figure 4.79: XRD the cement mortar containing 2.5% NS sonicated for 12 min
combined with 0.02% CNT (NS2.5/CNT0.02) ............................................................ 119
Figure 4.80: TGA the cement mortar containing 1% NS sonicated for 3 min combined
with 0.02% CNT (NS1/CNT0.02) ................................................................................ 120
Figure 4.81: Actual by Predicted Plot .......................................................................... 123
Figure 4.82: Prediction Profiler .................................................................................... 123
Figure 4.83: Relation between %NS, %CNT and compressive strength ..................... 124
Figure 4.84 : Actual by Predicted Plot ......................................................................... 126
Figure 4.85: Prediction Profiler .................................................................................... 126
Figure 4.86: Relation between %NS, %CNT and compressive strength ..................... 127
Figure 4.87: Contour line between %NS, %CNT and compressive strength ............... 127
xiv
Abstract
Lately, a various efforts were exerted to improve the environmental friendliness of
concrete tomake it suitable as a “GreenBuilding”material and improve the cement
composites tensile strength. Recently, nanotechnology has attracted considerable
scientific interest due to the new potential uses of particles in nanometer scale (<
100nm). Thus industries may be able to re-engineer many existing products that
function at unprecedented levels. Nano materials are needed with cement to react with
excess CH, produce additional C-S-H, refine the pore structure to densify the cement
matrix, reduce permeability of gases and water in concrete, solve corrosion problem in
the reinforcement, act as brides to Nano and micro cracks to increase the tensile
strength and replace cement to reduce CO2 emission. An appropriate dispersion of
carbon nano tubes (CNTs) is a prerequisite for their use in improving the mechanical
properties of cement-based composites as the major problem in utilizing Nano-particles
is that they are highly agglomerated particles which cause loss in their high-surface area
due to grain growth. The dispersion problem has been combated by methods like using
surfactants, usually in combination with sonication. The present study focuses on the
effectiveness of superplasticizers (high-range water-reducing admixtures) and
ultrasonic processing (direct/indirect) on the dispersion of carbon Nano tubes at first in
water and then in cement composites. A qualitative analysis using compressive and
flexure strength tests were conducted in order to investigate the effect of different
dispersion techniques on the mechanical properties of cement composites incorporating
CNT and nano silica particles with different percentages. In addition micro-structural
analysis was carried out to observe the surface morphology and microstructure of
cement composites with different amounts of Nano silica and CNT addition. Statistical
surface response model was introduced correlating the percentage of both, nano silica,
and CNT with the compressive strength of cement mortars, and the effects of studied
parameters will be characterized and analyzed using ANOVA and regression models,
which can identify the primary factors and their interactions on the measured
properties. Finally, the optimization software searches for the greatest overall desirable
percentages of the nano silica and CNT which enhances the cement matrix. The
investigational study results showed that the strength can be improved by the addition
of low concentrations of nano silica and/or CNT, the experimental program helped in
achieving about 55% gain in compressive strength of cement mortars incorporating
0.02% CNT, and 1% nano silica as compared with the control mix, and 100% gain in
flexure strength for mixes containing as low as 0.01% CNT and 0.5% nano silica. The
results from the thesis will be helpful for developing of new modified cementitious
construction materials with enhanced engineering properties.
Key Words:
Nano Silica; Carbon Nanotube; Sonication; Optimization; Novel Technique, Agglomeration
1
Chapter 1 : Introduction
1.1. General
Lately, a various efforts were exerted to improve the environmental friendliness of
concrete tomake it suitable as a “GreenBuilding”material and improve the cement
composites tensile strength. Recently, nanotechnology has attracted considerable
scientific interest due to the new potential uses of particles in nanometer scale (<
100nm). Thus industries may be able to re-engineer many existing products that
function at unprecedented levels.
The cement industry is considered to be one of the most energy consuming industries,
with a high rate of carbon dioxide (CO2) emissions, 5% of these emissions are caused
by global manmade; 50% by chemical manufacturing processes and 40% due to
burning fuel. Extensive research efforts have been directed to reduce the effect of the
cement industry either by improving the efficiency of the cement manufacturing
process or by using supplementary cementitious materials (SCMs), which partially
replace ordinary cement such as fly ash, ground granulated blast furnace slag, natural
pozzolans, and silica fume. The supplementary cementitious materials have been
studied in concrete as pozzolanic materials to react with CH and get the additional C-S-
H; not only to improve the mechanical properties of concrete, but also its workability
and durability (1).
The cement paste phase of concrete is a quasi-brittle material which has low tensile
strength, low ductility, and early development and propagation of micro-cracks due to
shrinkage at early ages. Steel rebars are the commonly used reinforcement for concrete
elements. It is a great desire to tailor the tensile and flexural mechanical properties of
the concrete in order to improve the damage and fracture resistance. The cracks in
concrete structures are mainly due to alkali silica reaction, which is a chemical reaction
in the concrete. Apart from the above, permeability of gases through pores and nano
and micro-cracks in the concrete, which leads to corrosion problem in the
reinforcement of concrete causes further deterioration. In the last few decades,
reinforcing concrete with micro- and macrofibers took place have carried out on the
effects of in controlling the growth of cracks in cement composites, various Nano fibers
have raised the interest of researchers due to their mechanical properties and high
potential in reinforcing cement matrix. Typical reinforcement of cementitious materials
is usually done at the millimeter scale and/or at the micro scale using macro-fibers and
microfibers, respectively. Nano-scale and unique multifunction properties of carbon
Nanotubes (CNTs) make them promising reinforcements to many engineering materials
(2; 3; 4; 5).
2
Nano materials are needed with cement to react with excess CH, produce additional C-
S-H, refine the pore structure to densify the cement matrix, reduce permeability of
gases and water in concrete, solve corrosion problem in the reinforcement, act as brides
to Nano and micro cracks to increase the tensile strength and replace cement to reduce
CO2 emission.
Nano silica is a Nano material which its particles are white powder and spherical. Its
average diameter is 30 nm and the density equals to 2.12 kg/m3. Nano silica acts as
nuclei for cement phases, promoting cement hydration due to its pozzolanic reaction
with calcium hydroxide specially at a very early age and increasing the production of)
C-S-H, thus making the interfacial transition zone (6; 7). It also acts as filler in the
Nano pores due to its fine particle size (there is no need to water to fill inter space),
decreasing the water absorption and thus increasing the durability of the matrix (Oscar
Mendoza et al. 2014). Nano silica helps to reduce the cement content in concrete mixes
as cement replacement; the addition of 1 kg of silica permits a reduction of about 4 kg
of cement and can be higher for NS (6) and improves compressive strength of cement
composites(8).
Carbon Nanotubes have been the subject of many investigations as reinforcement for
several composite applications due to its mechanical properties. They are also highly
flexible and capable of bending in circles and forming bridges crossing micro and Nano
cracks developed in the cement composites(9). Carbon Nanotubes are hollow tubular
channels, formed either by one wall (SWCNT) or several walls (MWCNT) of rolled
graphene sheets(10), having diameters ranging 4 to 100 nm for MWCNT. Their length
is not restricted and can reach micro or even millimeter range. Their Young's modulus
varies between 1000 to 5000 GPa while density is around 2000 kg/m3(9). CNTs exhibit
high aspect ratio (length-to-diameter ratio) ranging from 30 to more than many
thousands for fibers, they are expected to produce stronger and tougher cement
composites than traditional reinforcing materials (e.g. glass fibers or carbon fibers)(10).
Carbon Nanotubes increase the amount of heat released during the hydration of cement
as they act as nucleation spots for hydration product(11). They decrease the porosity as
a filler in cement composites improving the uniform pore size distribution(12). OH–
functional groups grafted onto the surface of the CNT are able to interact with the C–S–
H generating bridges crossing micro and Nano cracks developed in the cement
composites, so CNT help in increasing flexure strength of cement composites(11; 13).
The major problem in utilizing Nano silica and carbon Nanotubes is that they are highly
agglomerated particles which cause loses in their high-surface area due to grain growth.
Effective de-agglomeration and dispersion for Nano-particles is needed to overcome
the bonding forces after wetting the powder; the ultrasonic power breakup of the
agglomerate structures in aqueous and non-aqueous suspensions allows utilizing the
full potential of Nano-sized materials. The addition of proper chemical dispersing
3
admixtures like superplasticizers helps in the de-agglomeration of Nano-particles in
order to cause electrostatic repulsive forces, as well as cement mixtures compressive
strength as some investigators have first dispersed Nano materials in water by using
surfactants and sonication and then added the dispersied materials to cement
composites(14). The extensive use of superplasticizer improves the workability of
cement mixtures.
Dispersion of Nano scale materials, such as carbon Nanotubes (CNTs), has become
dependent on ultrasonic methods specially with chemical dispersing agents(15).
Ultrasound is used in a wide range of physical, chemical and biological processes.
Homogenizing and dispersing are examples for physical processes. Most of the
applications of high-intensity ultrasound are based on cavitation forces effect which
reduce particles size and break the agglomerates(16). Ultrasonication can be applied in
in two ways: directly or indirectly through the walls of the sample container. Direct
sonication is achieved through ultrasonic probes, which are immersed into sample,
performing ultrasonication directly over the solution without any barrier to be crossed
by the ultrasonication wave other than the solution itself. Indirect sonication is
performed using an ultrasonication bath. Ultrasonic probe can be applied by immersion
directly into the sample container. The difference between the two methods make each
system suitable for a different set of applications(17). The use of the double sonicator
system is advantageous not only in cutting down the processing time but also it allows
the use of a probe sonicator into the water bath, instead of immersing it in the fluid
where the CNT or such Nano materials are being dispersed(15).
1.2. Motivation
Since the CNTs increase the flexural strength of the matrix, and NS
particles increase the compressive strength of the matrix, a study is
recommended in order to investigate the combined effects of NS and CNT.
Examine the effect of superplasticizer on the dispersion of Nano silica and
carbon Nanotubes.
Facilitating CNT dispersion and improving the interfacial interaction
between the CNT and the cement matrix by adding NS.
Inconsistency in compressive strength results under the effect of adding
CNT to cement matrix.
Achieving effective dispersion of CNT remains a challenge due to its van
der Waals forces self attraction.
4
1.3. Objectives
Considering the importance of the dispersion of Nano silica and carbon Nanotubes
powders with regards to their performance in cementitious mixes and the scarcity of
information on this subject, as well as the previous research observations that the NS
and CNT effect as cement substitution depends on their nature and treatment method,
and taking into account the reported effects on the ultrasound cavitations. The current
research aims to:
Optimize the dispersion of Nano silica particles with a new developed,
innovative process by applying either direct or indirect sonication energy.
Introduce a novel technique in dispersion of carbon Nanotubes particles by
physical and chemical methods.
Investigate the effect of dispersion on the mechanical properties of cement
composites incorporating Nano silica and CNT with different dosages.
1.4. Scope of Work
In order to achieve the previously mentioned goals, experimental, and statistical
research plan is to be implemented.
The influence of the method and duration of applying direct or indirect
sonication energy to disperse Nano silica will be studied. Particle size distribution
will be introduced to investigate the effect of sonication power on NS particles
dispersion. Characterization of the main properties of prepared cement mortars
containing Nano silica will be investigated using different techniques; design,
electron microscope (SEM), transmission electron microscope (TEM), X-Ray
diffraction (XRD), zeta potential and thermo gravimetric analysis (TGA)
measurements to show the effect of sonication power as well as optimize the
optimum content of NS by weight of cement.
The influence of the method and duration of applying direct or indirect
sonication energy and/or homogenizer to carbon Nanotubes will be studied in order
to show its effect to de-agglomerate and disperse CNT particles. Different process
parameters (homogenizer speed and sonication time) will be optimized
experimentally. Particle size distribution will be introduced to investigate the effect
of carbon Nanotubes optimum treatment method on its particles dispersion.
Characterization of the main properties of prepared cement mortars containing
carbon Nanotubes will be through using different techniques such as scanning
electron microscope (SEM), transmission electron microscope (TEM), X-Ray
5
diffraction (XRD), zeta potential and thermo gravimetric analysis TGA
measurements.
Investigate the effect of superplasticizer on the dispersion of Nano silica and
carbon Nanotubes by optimizing the compressive strength of cement pastes.
Optimize the difference between local and imported carbon Nanotubes by
determine its particle size distribution to show the difference in particles
dispersion after treatment and compressive strength after 7 and 28 days.
Finally, investigate the coupled effect of Nano silica and carbon Nanotubes
on the compressive and flexure strength of mortars. A full factorial design
will be introduced. Characterization of the main properties of dispersed
Nano silica and carbon Nanotubes will be through using scanning electron
microscope (SEM), transmission electron microscope (TEM), X-Ray
diffraction (XRD), zeta potential and thermo gravimetric analysis TGA
measurements.
1.5. Thesis Layout
The proposed thesis will be designed in order to help the reader easily trace the
previously mentioned objectives as follows:
1.5.1. Chapter 1: Introduction
In the first chapter; an introduction to the Nano technology in concrete will be
presented, the main objectives, as well as the scope of work and the thesis layout.
1.5.2. Chapter 2: Literature Review
In the second chapter; literature review about Nano silica and carbon Nanotubes main
properties, as well as the reported factors affecting their behavior. In addition a review
about effect of sonication to solve the agglomeration produced due to mixing Nano
materials in water, as well as the effect of superplasticizer. The use of different
statistical methods in analyzing pastes and mortars behavior will be mentioned.
1.5.3. Chapter 3: Experimental plan
The third chapter will represent the experimental program, starting from the dispersion
techniques of the materials used, the equipments conducted in the experimental
6
program, and ending with the detailed plan of work as well as the characterization
means used in evaluation of results. The utilization of Nano silica and carbon
Nanotubes in mortars, the preparation process using direct and indirect sonication, as
well as the test of mortars flexure strength after 28 days and compressive strength after
7 and 28 days, water curing, after adding Nano silica and carbon Nanotubes.
1.5.4. Chapter 4: Results and Discussion
The fourth chapter represents the results of the conducted experimental program, in
addition to the full discussion and the interpretation of the results.
1.5.5. Chapter 5: Summary, Conclusion and Recommendation
In the last chapter, a summary of the thesis will be introduced, as well as the major
conclusions and recommendations of the experimental plan. The outcome of the thesis
is to produce cement matrix with advanced new properties developed by the innovative
application of NS and CNT addition to the matrix.
7
Chapter 2 : Literature Review
2.1. Introduction
Nanotechnology has changed our vision, expectations and abilities to control the
material world. The developments in Nano-science can also have a great impact on the
field of construction materials. Portland cement, one of the largest commodities
consumed by mankind, is obviously the product with great, but not completely explored
potential. Better understanding and engineering of complex structure of cement based
materials at Nano-level will definitely result in a new generation of concrete, stronger
and more durable, with desired stress-strain behavior and, possibly, with the whole
range of newly introduced smart properties(18).
Nano materials are defined as materials of size less than 100 nm (1 nm = 10–9 m)(19).
Nano silica and carbon Nanotubes are of the most effective Nano materials in the
improvement of cement composites mechnical properties. Their surface area is
increased by the reduction of the particle size; which causes a higher percentage of the
atoms interaction with other matter in consequence agglomeration blocks surface area.
Only well-dispersed or single dispersed particles help to get effective results. Good
dispersion causes reduction in the quantity of Nano materials needed to achieve the
same effects. Most Nano materials are still fairly expensive because of its high
importance for the formulation of some commercial products containing Nano
materials. Nano silica and carbon Nanotubes particles agglomerate during the wetting
so it is produced in a dry process. Although that the particles need to be mixed into
liquid to disperse well (16).
Nano silica and carbon Nanotubes can improve the bond between the aggregates and
cement paste. Studies on cement paste with NS and CNT are absolutely necessary to
understand their influence. Currently these types of Nano materials are being used for
the creation of new materials, devices and systems at molecular, Nano and micro-level.
Nano silica and carbon Nanotubes show unique physical and chemical properties that
can lead to the development of more effective materials than the ones which are
currently available. The extremely fine size of Nano-particles yields favorable
characteristics, because of their high surface area and excellent fire retardant properties;
they can be used in construction in many ways. Addition of NS and CNT to cement and
concrete can lead to significant improvements (20).
8
In this MSc. project the effect of coupled Nano silica and carbon Nanotubes will be
tested on the compressive and flexure strength of cement mortars. In addition to this,
the aim of this research will be extended to find optimum method for the dispersion of
cement particles, cement, NS and CNT.
2.2. The use of Nano silica in concrete
2.2.1. General
Recently, Nano silica appears to be one of the attractive cement substitution alternatives
for researchers. There is some reports studied using Nano silica as cement-based
building material and other studied the mix with other Nano materials. Compared to
other Nano materials, Nano silica has a unique advantage in the potential pozzolanic
reaction with cement hydration products. Due to its ultra-fine particle size, it can
possess a distinct pozzolanic reaction at a very early age (16). One of the important
applications of Nano silica is to improve the hydration of cement blended with fly ash,
slag or other pozzolanic materials (21; 7; 22).
Some authors concluded that Nano silica can improve concrete workability and strength
(23; 24; 25). Also others concluded that when NS (wt.%) is mixed into the cement
mortar in the fresh state it has a direct influence on the water amount required in
cement mixtures, for that higher amounts of water or chemical admixtures are needed
to keep the workability of the mixture (26; 27; 16).
2.2.2. Influence of Nano silica addition on cement pastes, and mortars
Hui Li et al. (2003) studied the mechanical properties of cement mortars containing
Nano-Fe2O3 and Nano-SiO2. The results showed that the compressive and flexural
strengths of the cement mortars mixed with the Nano particles after 7 and 28 days were
higher than that the control batch of a plain cement mortar. Therefore, it is feasible to
add Nano-particles to improve the mechanical properties of concrete. The SEM study
of the microstructures between the cement mortar mixed with the Nano-particles and
the plain cement mortar showed that the Nano-Fe2O3 and Nano silica filled up the
pores and reduced Ca(OH)2 compound among the hydrates(21).
Ye Qing et al. (2005) studied the influence of Nano silica addition on properties of
hardened cement paste as compared with silica fume for measurement of compressive
and bond strengths, and by XRD and SEM analysis. Results indicated that NS made
cement paste thicker and accelerated the cement hydration process. Compressive and
bond strengths of paste–aggregate interface incorporating NS were higher than those
incorporating SF, especially at early ages. And when increasing the NS content, the rate
of bond strength increase was more than that of their compressive strength increase.
9
With 3% NS added, NS digested calcium hydroxide CH crystals, decreased the
orientation of CH crystals, reduced the crystal size of CH gathered at the interface and
improved the interface more effectively than SF. The results suggested that with a small
amount of added NS, the CH crystals at the interface between the hardened cement
paste and aggregate at early ages may be effectively absorbed in high performance
concrete (7).
Byung-Wan Jo et al. (2006) studied the properties of cement mortars with Nano silica.
The results showed that the compressive strengths of mortars with Nano silica particles
were all higher than those of mortars containing silica fume at 7 and 28 days. It is
concluded that the Nano-particles are more valuable in enhancing strength than silica
fume since strength increased as the Nano silica content increased from 3% to 12%.
However, they demonstrated that using higher content of Nano silica must be
accompanied by adjustments to the water and superplasticizer dosage in the mix in
order to ensure that specimens do not suffer cracking. Otherwise, using this much
quantity of Nano-SiO2 could actually lower the strength of composites instead of
improving it, although this finding was not observed in their study.
The continuous hydration progress was monitored by scanning electron micrograph
(SEM) observation, by examining the residual quantity of Ca (OH) 2 and the rate of
heat evolution. The results of these examinations indicate that Nano SiO2 behaved not
only as a filler to improve microstructure, but also as an activator to promote
pozzolanic reaction (28).
Tobón J. I. et al. (2010) studied some physical properties of Portland cement type III
replaced with Nano silica in percentages of 1, 3, 5 and 10%. Main determined
properties were fluidity, normal consistency, setting times, heat of hydration and
compressive strength on pastes and mortars. It was made also a comparative analysis
with samples substituted with commercial silica fume in percentages of 5, 10 and 15%.
Results showed that the Nano silica from 5% started to have a major positive influence
on the mechanical strength of mortars and with a 10% of substitution improvements in
compressive strength up to 120% with respect to the control sample for one day of
curing can be achieved. For longer curing time the improvement is decreased slightly,
to reach near 80% improvement in strength after 28 days of water curing (26).
Sayed Abd El-Baky et al. (2013) study investigated the influence of adding Nano-
silica particles on the properties of fresh and hardened cement mortar through
measurements of workability, compressive and flexure strengths in addition to
measuring by SEM analysis. Nano-silica particles with size of 19 nm had been used by
1, 3, 5, 7 and 10 % by weight of cement content. Results indicated that the cement
mortar workability decreased with increasing Nano-silica addition. On the other hand,
the percentage of 7 % of Nano-silica recorded as optimum percentage in compressive
and flexure strength measured for cement mortar. The improvement in compressive and
flexure strength measured as 55.7 % and 46.9 % respectively, compared with the
11
control mortar, especially at early ages. In addition, the scanning electron microscope
(SEM) analysis of the microstructures showed that the Nano silica filled the cement
paste pores, more homogeneity for cement paste and interfacial zone, by reacting with
calcium hydroxide crystals forming more calcium silicate hydration(8).
Hongjian Du et al. (2014) investigated the durability properties of concrete containing
Nano-silica at dosages of 0.3% and 0.9%, respectively. This study experimentally
measured the properties related to durability of OPC concrete with the addition of
Nano-silica at 0.3% and 0.9%, respectively. The study concluded that in comparison
with the reference concrete, Nano-silica exhibited obvious pozzolanic reaction with the
Portlandite, even at a very early stage. This was verified by the reduced Portlandite
content and the increased compressive strength at 1 day. SEM observations found the
paste more homogeneous for concrete containing Nanosilica(29).
2.3. Difficulties facing the use of Nano silica in concrete
2.3.1. Nano silica agglomeration
When fine particles are added to cement, Nano materials have a strong tendency to
form agglomerates when it contacts with water. This phenomenon affects badly the
rheological behavior of the paste and the ultimate hardened properties. Thus, there is a
need to increase the repulsive forces between particles, by adding proper chemical
admixtures like superplasticizer or by adding extra water to disperse the solid particles
in aqueous solution (16).
Deyu Kong et al. (2012) investigated the influence of Nano-silica agglomeration on
microstructure and properties of the hardened cement-based material by using
precipitated silica with very large agglomerates and silica fume with much smaller ones
as Nano scale additives. The results showed that the addition of either PS or SF refines
pore structure of the hardened cement paste. However, the SEM observation showed
that the pozzolanic C–S–H gels from the agglomerates cannot function as binder. There
even exists interfacial transition zone between the agglomerates and the bulk paste. The
Nano-indentation test indicated that the large agglomerates may become weak zones
due to their low strength and elastic modulus. It is proposed that the microstructure
improvement have nothing to do with the seeding effect, but result from the water-
absorbing, filling, and pozzolanic effects. Through PS addition, compressive strength of
the mortars and their resistance to calcium leaching and chloride penetration were
enhanced. However, these improvements were less significant than those with FS
addition. The reason is that much more fillers are provided whereas much fewer weak
zones are introduced in the mortar with FS addition than that with PS(30).
Hesam Madani et al.(2012) studied the pozzolanic reactivity of mono dispersed Nano
silica hydrosols and their influence on the hydration characteristics of Portland cement.
11
Their study reveals that the Nano silica hydrosols with higher specific surface areas had
faster pozzolanic reactivity, especially at early ages; moreover, the results are indicative
of the accelerating influence of Nano silica and silica fume on the hydration of cement.
As compared with the Nano silica, silica fume had slower pozzolanic reactivity in lime
and cement pastes. The Nano silica hydrosols reduced the initial setting time of the
cement pastes. The use of Nano silica hydrosols with higher specific surface areas or
increasing the dosage of Nano silica led to shorter initial setting time of the pastes.
Shorter initial setting time seems to be due to shortening the induction period of the
pastes through accelerating the conversion of the first-stage C-S-H, surrounding the
cement particles, to the stable form, via fast pozzolanic reactivity. Silica fume did not
have significant pozzolanic reactivity at early ages; therefore, this material not only did
not reduce the initial setting time of the pastes but also delayed it due to less cement
content in its respective cement pastes.
The Nano silica and silica fume reduced the difference between the initial and final
setting times of the pastes, probably due to accelerating the hydration of cement
through providing additional surfaces by silica aggregates for early precipitation of
hydrate products. Nano silica hydrosols and silica fume accelerated early hydration of
cement at the first day. However, by progress of hydration and from 7 days, lower
hydration degree of cement in the pastes containing the Nano silica compared to the
plain paste was observed. Lower hydration degree of cement can be attributed to the
entrapment of some of mix water in the aggregates of Nano silica formed in cement
paste environment, making less water available for the progress of cement hydration.
The cement in paste containing silica fume had higher hydration degree compared to
the cement in pastes containing Nano silica. The pastes containing the Nano silica had
less workability compared to the plain paste and pastes containing silica fume. This is
believed to be due to considerable water absorption in the aggregates of Nano silica
(31).
Deyu Kong et al. (2013) investigated the influence of Nano-silica agglomeration on
fresh properties of the cement paste by using precipitated Nano-silica (PS) with very
large agglomerates and fumed Nano-silica (FS) with much smaller ones as Nano-
strengthening admixtures. The rheological tests revealed that addition of PS showed a
greater influence on rheological behavior of the paste than that of FS, because the very
large agglomerates in PS cannot act as fillers to release free water in the void space
originally contributing to fluidity, but absorb free water originally contributing to
fluidity in paste. Through monitoring the heat evolution, it is interestingly found that
addition of PS accelerated cement hydration more significantly than that of FS though
the latter provides much more seeds than the former, implying that the acceleration may
have nothing to do with the so-called seeding effect. The calcium-adsorption tests
confirmed that the accelerating effect is probably caused by the rapid calcium
absorption of Nano-silica, which can keep always under-saturation of calcium ions in
paste, enabling a higher dissolution rate of calcium and thus an increase of heat
evolution (32).
12
Tina Oertel et al.(2013) studied primary particle size and agglomerate size effects of
amorphous silica in ultra-high performance concrete. The study focuses on the
influence of primary particle sizes and sizes of agglomerates of different amorphous
silica in UHPC. As a reference system, wet-chemically synthesized silica was used with
very high purity, defined particle sizes, narrow primary particle size distributions and
controllable agglomerate sizes. The obtained data were compared to silica fume. The
results indicate that non-agglomerated silica particles produce the highest strength after
7 d, but a clear dependence on primary particle sizes, as suggested by calculations of
packing density, was not confirmed. UHPC may be improved by incorporating an
ameliorated dispersion of silica e.g. through commercial silica sols. Ideal silica fume
dispersion by a common mortar mixing procedure might be impossible, but the
dispersion of silica fume in water using ultrasound leads to at least some improvements.
Furthermore, commercial silica should lead to higher strength if they provide particles
dispersed to their primary particle sizes (e.g. silica sols from ion exchange processes).
The impurity of silica fume seems to have no negative influence on the compressive
strength (33).
2.3.2. Mixing and dispersion methods
Li et al. (2004, 2007) studied the effect of 15 nm Nano silica on mortar and concrete.
To help in the dispersion of Nano silica, Firstly they mixed Nano silica powder with
water and superplasticizer using a mortar mixer for several minutes. However, the
extent of dispersion achieved was not determined (21).
Porro et al. (2005) investigated the effect of Nano SiO2 in powder form with average
particle sizes 5 to 20 nm on cement pastes properties. These researchers dry mixed
Nano silica powder with cement before adding water and did not study the state of
aggregation of the Nano silica (34).
Jo et al. (2007) and Naji Givi et al. (2011) studied pre mixed Nano silica with mixing
water to help with their dispersion and then added the resulting suspensions to the rest
of mix ingredients (28).
Qing et al. (2008) used a similar method to above researches in studying the effect of
Nano silica with particle size of 15 nm and specific surface area of 160 m2/g cement
pastes properties. These researchers also did not consider dispersion state of the Nano
silica used (35).
Amiri et al. (2009) studied the effect of pH varied from 2 to 8.5 on dispersion state of
suspensions of pyrogenic Nano silica with average particle size of 12 nm and specific
surface area of 200m2/g. They used considerable amount of energy included high shear
mixing of diluted Nano silica suspensions for 5 min, followed by sonication for 60 min.
They observed improvement in dispersion with increasing pH values. Average size of
Nano silica aggregates was 0.2 lm after dispersion at pH of 6(36).
13
2.3.3. Super plasticizers compatibility
The addition of Nano silica (NS) improves the particle size distribution, reduces
porosity, and the pozzolanic reaction between NS and calcium hydroxide (CH) yielding
calcium silicate hydrates (C-S-H). These actions enhance mechanical strength (37; 38).
The filling of the inter-particle space composes a dense cement matrix and reduces the
water demand, so there is no need to fill the space with water. In this case, the use of a
superplasticizer is strongly recommended to guarantee the cement matrix workability
(39). When adding superplasticizer, workability at a constant water/cement ratio is
improved. Alternatively, the same plain cement paste workability can be reached with
reduction in water content. In this case, cement materials with higher mechanical
strengths can be obtained (40).
Consequently, admixtures may interact not only with cement but also with other
components. Nonetheless, very few studies have been conducted on the compatibility
of blended cements and PCE admixtures.
Magarotto et al. (2003) concluded that limestone-blended cements adsorb greater
amounts of PCEs and gain better workability than non-blended cements (41).
Alonso et al. (2005, 2007) concluded that the rheological changes induced by PCEs on
fly ash-blended cements are the same to the changes observed in non-blended cement
(42).
Li et al. (2006) found that the adsorption of PCEs on fly ash-blended cement pastes
(with 20% of fly ash) was less intense than non-blended cement pastes (43).
Sahmaran et al. (2006) studied the effect of replacing 15 to 30% of cement with fly
ash and limestone powder in self-consolidating mortars containing PCEs. The results
concluded that the fluidizing effect of used admixtures in the mortars made with
blended was greater than that of non-blended cement (44)
Palacios et al. (2009) concluded that PCEs induce greater flow-ability in pastes
containing slag than in unblended paste; by consequently this effect is enhanced with
the rising percentage of slag in the pastes (45).
Olga Burgos-Montes et al. (2012) studied the compatibility between superplasticizer
admixtures and cements with mineral additions, the investigation explored the effect of
limestone, fly ash and silica fume on Portland cement and the interaction of these
additions with naphthalene (PNS), melamine (PMS), lignosulfonate (LS) and
polycarboxylate (PCE) based admixtures. The results showed that cement–
superplasticizer compatibility was altered by the physical (specific surface) and
chemical (surface charge) characteristics of the mineral additions studied, in addition
limestone has considerable affinity for the polymer molecules, which adsorb onto the
14
surface of its particles, it tends to adsorb PCE admixtures more intensely than the other
additions studied. The steepest decline in yield stress is obtained in the presence of PCE
and PNS. They also conclude that fly ash exhibits greater affinity for PMS than the
other cements and mineral additions studied in this work, yielding similar results for
PMS and PNS. In the case of silica fume, with a high negative zeta potential (-16 mv)
the physical characteristics are dominant. Due to the high specific surface of silica
fume, CEM II/A-D pastes demanded high doses of superplasticizer to improve the
rheological behavior of fresh pastes. The study concluded that while the effects
generated by the traditional admixtures are probably the results of an electrosteric
mechanism, the PCE based superplasticizer stabilizes cement and addition particles by
a sterical mechanism, PCE is adsorbed less intensely and lowers yield stress more
effectively at lower dosages than the other admixtures(46).
J. M. Fernandez et al.(2013) studied the effect of individual and combined addition of
both Nano silica (NS) and polycarboxylate plasticizer (PCE) admixtures on aerial lime
mortars. The sole incorporation of NS increased the water demand, as proved by the
mini-spread flow test. An interaction between NS and hydrated lime particles was
observed in fresh mixtures by means of particle size distribution studies, zeta potential
measurements and optical microscopy, giving rise to agglomerates. On the other hand,
the addition of PCE to a lime mortar increased the flow ability and accelerated the
setting process. PCE was shown to act in lime media as a deflocculating agent,
reducing the particle size of the agglomerates through a steric hindrance mechanism.
Mechanical strengths were improved in the presence of either NS or PCE. The
optimum being attained in the combined presence of both admixtures that involved
relevant micro-structural modifications, as proved by pore size distributions and SEM
observations (47).
2.4. The Use of Carbon Nanotubes in Concrete
2.4.1. General
The most popular type of Nano-tubes is carbon Nano-tubes. In 1991, It was discovered
by the Japanese Scientist Sumio Iijima. A single layer Nano-tube was synthesized in
1993 by mixing metals such as Cobalt and Graphite electrodes. In 1996, Smalley’s
group in Texas, USA developed a method to result single walled CNT with unusually
uniform diameters in high yield (48).
Carbon Nanotubes are a form of carbon having a graphene sheet rolled into a
cylindrical shape, its name coming from the Nanometer diameter size. The length of
SWNTs is not restricted and can reach micro or even millimeter range and can have one
layer or wall (single walled Nanotube) or more than one (multi walled Nanotube). Due
to the energetic requirements the preferable diameter of a single wall Nanotube
(SWNT) is about 1.4 nm, while SWNTs with diameters ranging from 0.4 nm and up to
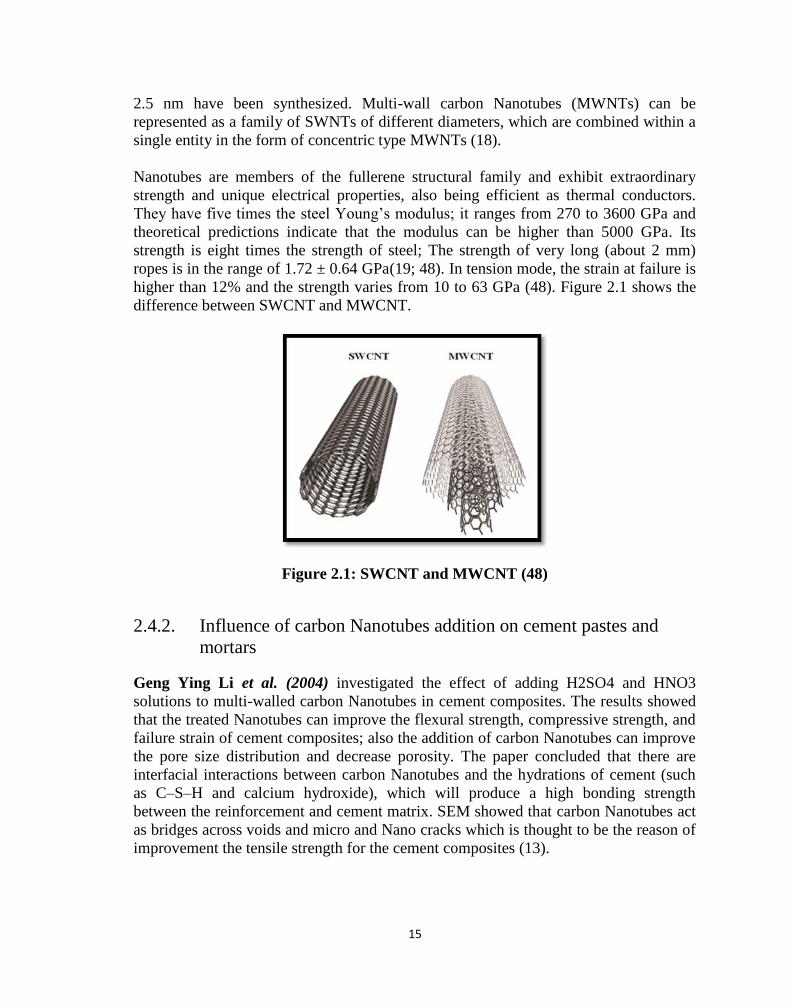
15
2.5 nm have been synthesized. Multi-wall carbon Nanotubes (MWNTs) can be
represented as a family of SWNTs of different diameters, which are combined within a
single entity in the form of concentric type MWNTs (18).
Nanotubes are members of the fullerene structural family and exhibit extraordinary
strength and unique electrical properties, also being efficient as thermal conductors.
TheyhavefivetimesthesteelYoung’smodulus;itranges from 270 to 3600 GPa and
theoretical predictions indicate that the modulus can be higher than 5000 GPa. Its
strength is eight times the strength of steel; The strength of very long (about 2 mm)
ropes is in the range of 1.72 ± 0.64 GPa(19; 48). In tension mode, the strain at failure is
higher than 12% and the strength varies from 10 to 63 GPa (48). Figure 2.1 shows the
difference between SWCNT and MWCNT.
Figure 2.1: SWCNT and MWCNT (48)
2.4.2. Influence of carbon Nanotubes addition on cement pastes and
mortars
Geng Ying Li et al. (2004) investigated the effect of adding H2SO4 and HNO3
solutions to multi-walled carbon Nanotubes in cement composites. The results showed
that the treated Nanotubes can improve the flexural strength, compressive strength, and
failure strain of cement composites; also the addition of carbon Nanotubes can improve
the pore size distribution and decrease porosity. The paper concluded that there are
interfacial interactions between carbon Nanotubes and the hydrations of cement (such
as C–S–H and calcium hydroxide), which will produce a high bonding strength
between the reinforcement and cement matrix. SEM showed that carbon Nanotubes act
as bridges across voids and micro and Nano cracks which is thought to be the reason of
improvement the tensile strength for the cement composites (13).
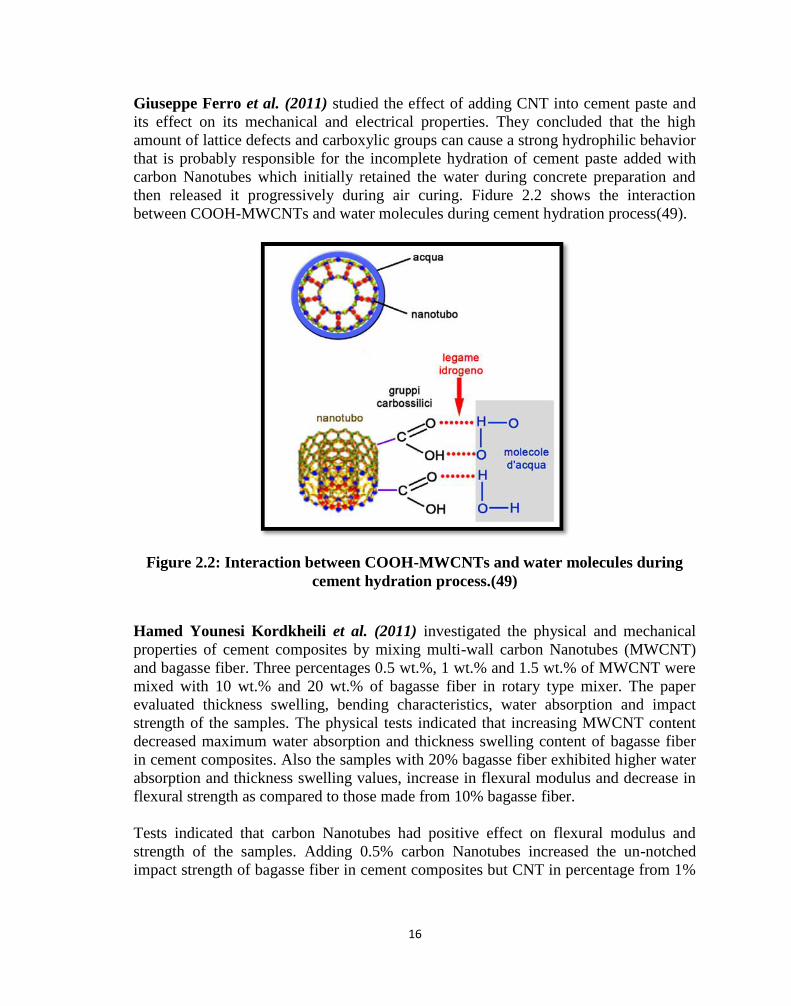
16
Giuseppe Ferro et al. (2011) studied the effect of adding CNT into cement paste and
its effect on its mechanical and electrical properties. They concluded that the high
amount of lattice defects and carboxylic groups can cause a strong hydrophilic behavior
that is probably responsible for the incomplete hydration of cement paste added with
carbon Nanotubes which initially retained the water during concrete preparation and
then released it progressively during air curing. Fidure 2.2 shows the interaction
between COOH-MWCNTs and water molecules during cement hydration process(49).
Figure 2.2: Interaction between COOH-MWCNTs and water molecules during
cement hydration process.(49)
Hamed Younesi Kordkheili et al. (2011) investigated the physical and mechanical
properties of cement composites by mixing multi-wall carbon Nanotubes (MWCNT)
and bagasse fiber. Three percentages 0.5 wt.%, 1 wt.% and 1.5 wt.% of MWCNT were
mixed with 10 wt.% and 20 wt.% of bagasse fiber in rotary type mixer. The paper
evaluated thickness swelling, bending characteristics, water absorption and impact
strength of the samples. The physical tests indicated that increasing MWCNT content
decreased maximum water absorption and thickness swelling content of bagasse fiber
in cement composites. Also the samples with 20% bagasse fiber exhibited higher water
absorption and thickness swelling values, increase in flexural modulus and decrease in
flexural strength as compared to those made from 10% bagasse fiber.
Tests indicated that carbon Nanotubes had positive effect on flexural modulus and
strength of the samples. Adding 0.5% carbon Nanotubes increased the un-notched
impact strength of bagasse fiber in cement composites but CNT in percentage from 1%
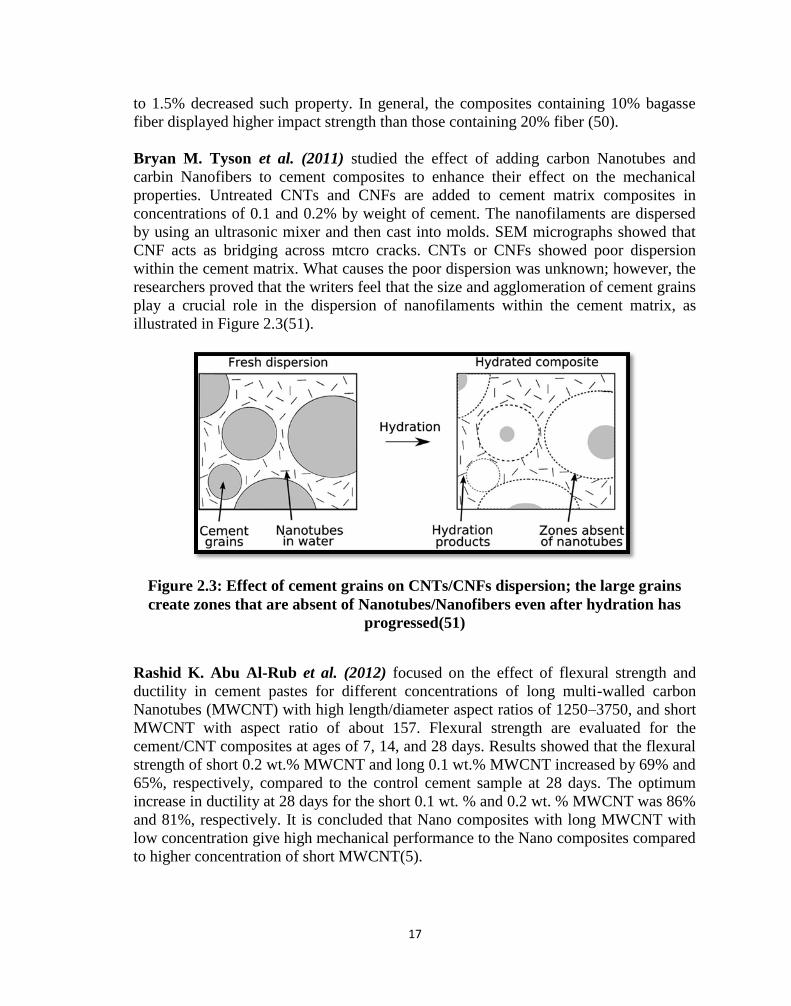
17
to 1.5% decreased such property. In general, the composites containing 10% bagasse
fiber displayed higher impact strength than those containing 20% fiber (50).
Bryan M. Tyson et al. (2011) studied the effect of adding carbon Nanotubes and
carbin Nanofibers to cement composites to enhance their effect on the mechanical
properties. Untreated CNTs and CNFs are added to cement matrix composites in
concentrations of 0.1 and 0.2% by weight of cement. The nanofilaments are dispersed
by using an ultrasonic mixer and then cast into molds. SEM micrographs showed that
CNF acts as bridging across mtcro cracks. CNTs or CNFs showed poor dispersion
within the cement matrix. What causes the poor dispersion was unknown; however, the
researchers proved that the writers feel that the size and agglomeration of cement grains
play a crucial role in the dispersion of nanofilaments within the cement matrix, as
illustrated in Figure 2.3(51).
Figure 2.3: Effect of cement grains on CNTs/CNFs dispersion; the large grains
create zones that are absent of Nanotubes/Nanofibers even after hydration has
progressed(51)
Rashid K. Abu Al-Rub et al. (2012) focused on the effect of flexural strength and
ductility in cement pastes for different concentrations of long multi-walled carbon
Nanotubes (MWCNT) with high length/diameter aspect ratios of 1250–3750, and short
MWCNT with aspect ratio of about 157. Flexural strength are evaluated for the
cement/CNT composites at ages of 7, 14, and 28 days. Results showed that the flexural
strength of short 0.2 wt.% MWCNT and long 0.1 wt.% MWCNT increased by 69% and
65%, respectively, compared to the control cement sample at 28 days. The optimum
increase in ductility at 28 days for the short 0.1 wt. % and 0.2 wt. % MWCNT was 86%
and 81%, respectively. It is concluded that Nano composites with long MWCNT with
low concentration give high mechanical performance to the Nano composites compared
to higher concentration of short MWCNT(5).
18
Sergey Petrunin et al. (2013) reported the effect of multi-wall carbon Nanotubes on
the strength and structure of Portland cement composites by addition of carboxylate.
The study concluded that the optimum compressive strength of 64 MPa (20% increase)
was observed in the composite with 0.13% (by the cement weight) of MWCNT. By
consequence, It was found that grafting of carboxylate on the surface of the Nanotubes
accelerates the hydration of Portland cement and improves early strength. The addition
of carboxylate MWCNT at a very low dosage (0.05% by the cement weight) increased
by 30% for 1-day compressive strength by compared to the control mix (52).
Babak Fakhim et al. (2013) predicted the impact of multiwalled carbon Nanotubes on
the cement hydration products and investigated improvement the quality of cement
hydration products microstructures of cement paste. They concluded from the
micrographs of TGA test that the cement hydration was enhanced in the presence of the
optimum percentage of MWCNT. Increase in MWCNTs while the water/cement ratio
of matrix was held constant, due to the presence of hydrophilic groups on the MWCNT
surfaces and consequently absorption of a non-negligible amount of water, caused
hampering of the hydration of the cement mortar and agglomerating MWCNTs in the
form of clumps(4).
H. K. Kim et al. (2013) presented the results of the effect of carbon Nano tubes on
mechanical and electrical properties of cement composites such as the flow, porosity,
and compressive strength by mixing it with silica fume. Three amounts of CNT (0%,
0.15%, and 0.3% by weight of cement) were added to silica fume in amounts of 0%,
10%, 20%, and 30% by weight of cement.
It concluded that the mix between silica fume and CNT achieved an effective
dispersion for CNT in the cement matrix, which effected well on the mechanical and
electrical properties of cement composites. In the case of the cement composites
without silica fume, the relative values of compressive strength were gain 2% and loss
7% for 0.15 wt. % and 0.3 wt. % CNT additions, respectively. These values were
increased to 32% gain and 12% gain when silica fume was added by 10%. Even when
20% of silica fume was added, the relative values of the compressive strength of
cement composites containing 0.15 wt. % and 0.3 wt.% of CNT were both 15% gain,
which is higher than those of cement composites without silica fume. However, when
silica fume addition was increased to 30%, the relative value of the compressive
strength of cement composites containing 0.3 wt.% caused 6% loss, while that of
cement composites containing 0.15 wt.% caused 16% gain. These results indicated that
the effect of silica fume improved the compressive strength of the cement composites in
addition to CNT. However, when a large amount of silica fume was added (more than
30%), most carbon Nano tubes agglomerations were dispersed densely in silica fume
fields and re-agglomerated as clumps(53).
Baomin Wang et al. (2013) investigated the flexural toughness of MWCNT reinforced
cement composites. The results showed that the addition of CNT improved Portland
19
cement pastes flexure toughness. It increased up to 57.5% for a 0.08 wt. % addition of
MWCNT by weight of cement. The porosity and pore size distribution results indicate
that cement paste containing MWCNT had lower porosity and a more uniform pore size
distribution. The morphological structure of samples showed that MWCNT act as
bridges across micro and Nano cracks and voids and form a network that transfers the
load in tension (12).
Rafat Siddique et al. (2014) presented an overview of some of the research published
on the use of CNT in concrete or mortars. It studied the effect of CNT on properties
such as compressive strength, tensile strength, modulus of elasticity, flexural strength,
porosity, electrical conductivity and shrinkage. The following conclusions had been
drawn from this investigation; CNT have excellent properties in medical, electrical and
construction fields. Cement pastes reinforced with CNT its Young's modulus found to
be higher than the control cement paste. From the SEM micrographs the CNT were
dispersed uniformly in the cement mortar and there was no CNT agglomeration. the
porosity of the pastes decreased also the shrinkage values were found to be lower than
the control pastes. Also there was good interaction between carbon Nanotubes and the
fly ash cement matrix which acts as filler resulting in a denser microstructure and gives
higher strength when compared to the reference fly ash mix without CNT.
Increase of fly ash mixes has been observed with increase in carbon Nanotubes content
with the highest strength achieved with CNT content of 1% by weight. Also the
compressive strength increases with the inclusion of CNT under high strain loading
rate. There was increase in flexure strength when adding CNT compared to the control
cement paste but with higher aspect ratio of CNT, flexural strength found to be
dependent on concentration of CNT. CNT were found to be better than carbon fibers in
enhancing flexure strength (54).
Although numerous papers have studied the influence of carbon Nanotubes on the
properties of cement composites, their effects have not been adequately characterized
yet, and some discrepancies and inconsistencies in compressive and flexure strength
results are witnessed.
2.4.3. Influence of carbon Nanotubes addition on concrete properties
R. Hamzaoui et al. (2012) studied the mechanical properties and microstructure of
mortar and concrete using Carbon Nanotubes (CNT) at 7, 14, 28 and 90 curing days.
Part of the formulation, CNT is dispersed in a liquid solution. Different concentrations
ranging from 0.01% to 0.06% and 0.003% up to 0.01% are used for mortar and
concrete, respectively. Mechanical testing of the modified materials reveals that
maximum compressive strength is obtained for CNT concentrations close to 0.01%wt
and 0.003%wt for mortar and concrete, respectively. The microstructural
characterization of the modified materials suggests that CNT act as bridges between
21
pores and micro and Nano cracks leading to a reduction in porosity and in turn an
increase of compressive strength. The outcomes of the work were:
For mortar, the following concentration were tested 0.01%, 0.02%, 0.03%, 0.06% CNT
of cement weight. it is found that the largest compressive strength when adding 0.01%
of CNT. Also, the gain in the compressive strength for the optimal CNT percentage at
90 days curing in water was 21.2% higher compared to the control batch. However,
further increasing of CNT degrades the compressive strength of mortar.
For concrete, CNT of percentages 0.003%, 0.006%, and 0.01% (by cement weight) was
added to the concrete at 90 days curing time. The maximum compressive strength was
reached for a CNT percentage of 0.003% by cement weight. The gain in compressive
strength was 17.65% with regards to the control batch. The same trend of strength
degradation was observed using a larger amount of CNT (55).
2.5. Difficulties facing CNT usage in concrete
2.5.1. Carbon Nanotubes agglomeration
Grigorij Yakovelv et al. (2006) studied the carbon Nanotubes, synthesized from
aromatic hydrocarbons and the possibilities of production and main technological
properties of Portland cement based foam concrete reinforced by dispersed carbon
Nanotubes. The method of stimulation of dehydropolycon-densation and carbonization
of aromatic hydrocarbons in chemical active environment (melts of aluminum, copper,
nickel, iron salts) was used for carbon Nanotubes synthesis. The results of investigation
of the synthesized carbon Nanotubes by X-ray photoelectron spectroscopy showed that
they contain (80 – 90) % of carbon. The examination of the carbon Nanotubes
microstructure by electron microscope showed that the Nanotubes have a cylindrical
form with diameter up to 100 nm and length up to 20 μm. The Nanotubes were
agglomeratedduetovanderWaalsforceswithadiameterupto30μmandalengthup
to 10 mm. The carbon Nanotubes were used as a high strength dispersed reinforcement
for production of foam non-autoclave concrete produced on the base of Portland
cement. The results of the investigation of the reinforced non-autoclave cement foam
concrete showed that the use of 0.05% carbon Nanotubes by cement weight in
production of these concretes decreases its heat conductivity up to (12 – 20) % and
increases its compressive strength up to 70 %(56).
Jyoti Bharj et al. (2014) discussed the role of dispersion of multi walled carbon
Nanotubes (MWCNT) on the compressive strength of Portland cement paste. Cement-
MWCNT composites were prepared by adding 0.2% (by cement weight) of MWCNT
to Portland cement. Rectangle specimens of size approximately 40mm × 40mm
×160mm were prepared and curing of samples was done for 7, 14, 28 and 35 days.
Water cement ratio was 0.4.
21
The study concluded that due to van der Waals forces resulting from large surface area
of MWCNT, they tend to adhere together causing agglomeration in the cement
composites and it becomes extremely difficult to separate them. Powder mixing of
MWCNT and cement was not suitable for uniform and effective dispersion. The gain in
the compressive strength of cement MWCNT-cement composite was found to be
around 8.2% compared to pure cement composites. Good quality of the CNT water
dispersions significantly affected the mechanical properties of the composite materials.
In aqueous mixing method sonicator was used for mixing the MWCNT within DI water
and breaking the van der Waals forces between the tubes. An increase in compressive
strength up to 22% was observed when CNT were dispersed In DI water with
sonication compared to pure cement composites (9).
2.5.2. Mixing and dispersion methods
Maria S. Konsta-Gdoutous et al. (2008) studied the effect of dispersed MWCNT in
water on the properties of cement paste by applying ultrasonic energy with adding a
commercial surfactant. Results had been showed that ultrasonic achieved good
dispersion for CNT specially when adding the commercial surfactant to CNT with a
weight ratio (CNT to surfactant) within the range of 4 to 6.25(57).
G. T. Caneba et al. (2010) showed a double ultrasonic source to increase carbon
Nanotubes dispersion. In this study, nonlinear wave resonance concepts had been
proposed to contain explanations for the dramatic increase in dispersion performance,
and more specifically, the effect of intermittency chaos. Such a hypothesis was made
because of the similarity between the pressure wave pattern in the double sonication
system and sliding charge density wave with an A.C. electric field, which was cited to
exhibit intermittency behavior. The double ultrasonic source (bath and probe) had been
shown to efficiently disperse carbon Nanotubes, compared to using just the ultrasonic
bath or probe. Acoustics energy analysis based on wave superposition principle had
been shown to be inconsistent with such a dramatic increase in dispersion performance.
Resonance effects in the form of intermittency chaos had been proposed as the likely
theoretical reason for this behavior, which had actually been shown to occur in systems
with two interlocking waves (15).
Anastasia Sobolkina et al. (2012) studied the effect of the dispersion for two types of
carbon nanotubes having different morphologies to improve the mechanical properties
of cement composites. The first type was a mixture of single, double, and multiwalled
CNTs and the second type was aligned, nitrogen-doped, multi-walled CNTs (N-CNTs).
CNTs are difficult to disperse in water because of their strongly hydrophobic surface.
In order to reduce the surface tension and to improve the wetting of the CNTs, The
dispersion in water of two different types of CNTs was investigated by sonication in the
presence of the following surfactants (58; 59): an anionic sodium dodecyl sulfate (SDS)
and a nonionic polyoxyethylene laurylether (Brij 35) due to their good dispersive
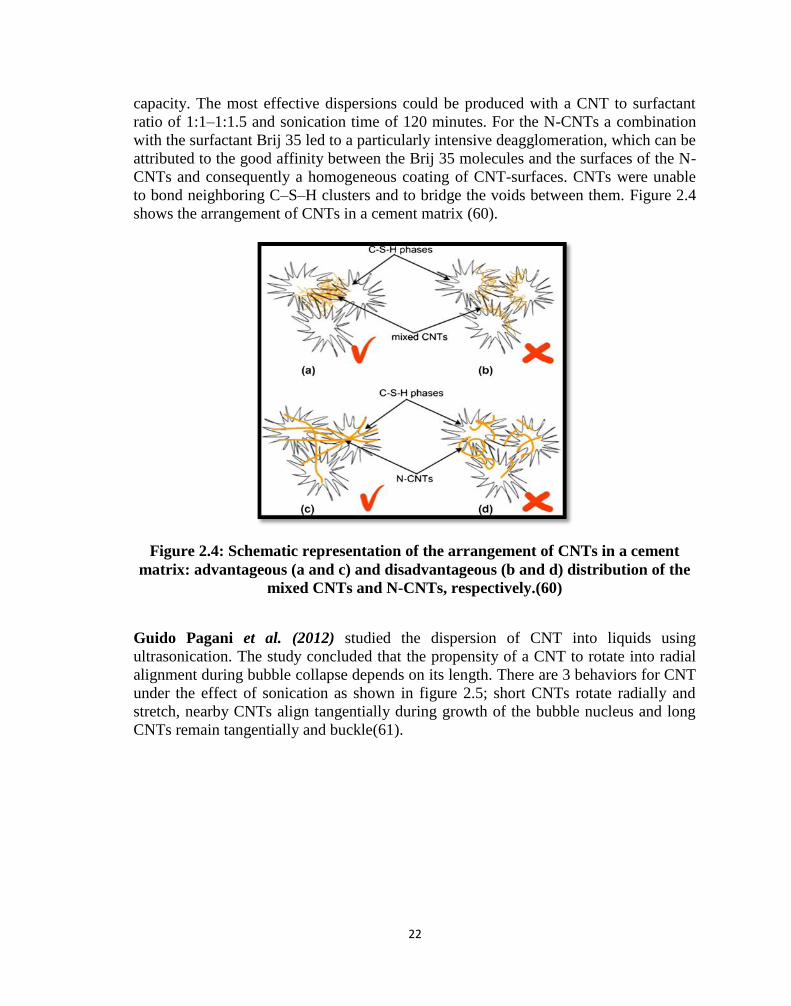
22
capacity. The most effective dispersions could be produced with a CNT to surfactant
ratio of 1:1–1:1.5 and sonication time of 120 minutes. For the N-CNTs a combination
with the surfactant Brij 35 led to a particularly intensive deagglomeration, which can be
attributed to the good affinity between the Brij 35 molecules and the surfaces of the N-
CNTs and consequently a homogeneous coating of CNT-surfaces. CNTs were unable
to bond neighboring C–S–H clusters and to bridge the voids between them. Figure 2.4
shows the arrangement of CNTs in a cement matrix (60).
Figure 2.4: Schematic representation of the arrangement of CNTs in a cement
matrix: advantageous (a and c) and disadvantageous (b and d) distribution of the
mixed CNTs and N-CNTs, respectively.(60)
Guido Pagani et al. (2012) studied the dispersion of CNT into liquids using
ultrasonication. The study concluded that the propensity of a CNT to rotate into radial
alignment during bubble collapse depends on its length. There are 3 behaviors for CNT
under the effect of sonication as shown in figure 2.5; short CNTs rotate radially and
stretch, nearby CNTs align tangentially during growth of the bubble nucleus and long
CNTs remain tangentially and buckle(61).
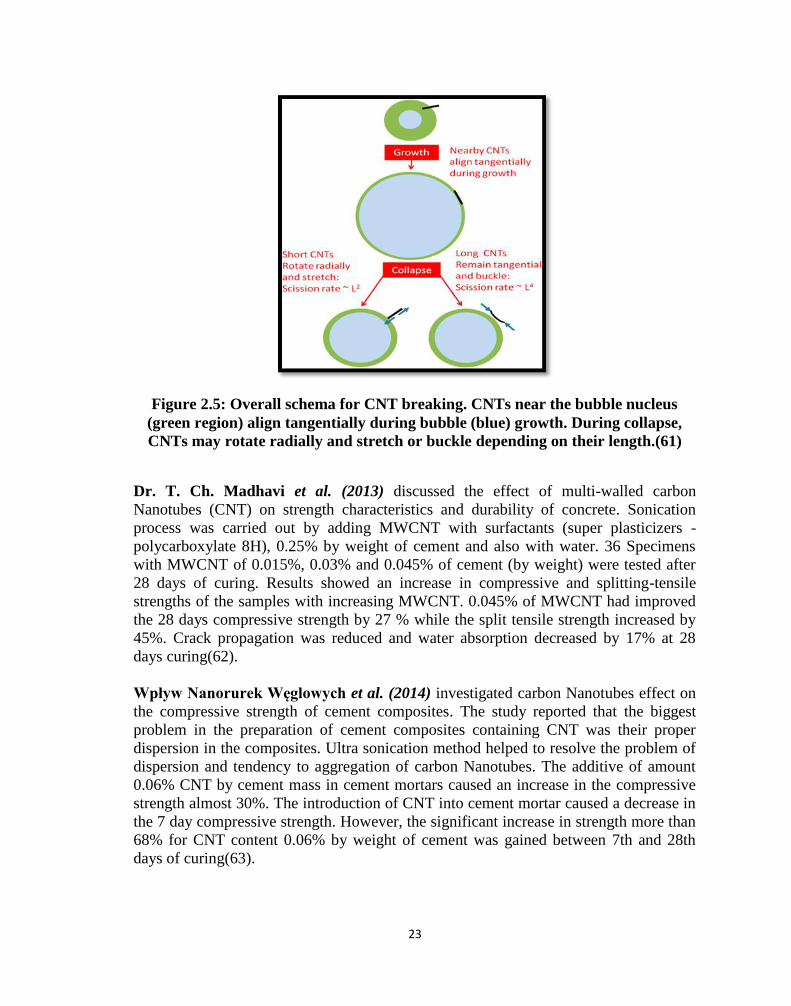
23
Figure 2.5: Overall schema for CNT breaking. CNTs near the bubble nucleus
(green region) align tangentially during bubble (blue) growth. During collapse,
CNTs may rotate radially and stretch or buckle depending on their length.(61)
Dr. T. Ch. Madhavi et al. (2013) discussed the effect of multi-walled carbon
Nanotubes (CNT) on strength characteristics and durability of concrete. Sonication
process was carried out by adding MWCNT with surfactants (super plasticizers -
polycarboxylate 8H), 0.25% by weight of cement and also with water. 36 Specimens
with MWCNT of 0.015%, 0.03% and 0.045% of cement (by weight) were tested after
28 days of curing. Results showed an increase in compressive and splitting-tensile
strengths of the samples with increasing MWCNT. 0.045% of MWCNT had improved
the 28 days compressive strength by 27 % while the split tensile strength increased by
45%. Crack propagation was reduced and water absorption decreased by 17% at 28
days curing(62).
Wpływ Nanorurek Węglowych et al. (2014) investigated carbon Nanotubes effect on
the compressive strength of cement composites. The study reported that the biggest
problem in the preparation of cement composites containing CNT was their proper
dispersion in the composites. Ultra sonication method helped to resolve the problem of
dispersion and tendency to aggregation of carbon Nanotubes. The additive of amount
0.06% CNT by cement mass in cement mortars caused an increase in the compressive
strength almost 30%. The introduction of CNT into cement mortar caused a decrease in
the 7 day compressive strength. However, the significant increase in strength more than
68% for CNT content 0.06% by weight of cement was gained between 7th and 28th
days of curing(63).
24
2.5.3. Superplasticizers compatibility
The real effect of the superplasticizer is to maintain individual CNT separated by
electrostatic repulsion between SP negatively charged particles and negative functional
groups on CNT surface. The high amount of superplasticizer defects and carboxylic
groups can justify a strong hydrophilic behavior that is probably responsible for the
incomplete hydration of cement paste added with carbon Nanotubes which initially
retained the water during concrete preparation(64).
Frank Collins et al. (2011) reported the results of investigations of the dispersion,
workability, and strength of CNT aqueous and CNT–OPC paste mixtures, with and
without several generically different dispersants/surfactants that are compatible as
admixtures in the manufacture of concrete. These included an air entrained, styrene
butadiene rubber, polycarboxylates, calcium naphthalene sulfonate, and lignosulfonate
formulations. Aqueous mixtures were initially assessed for dispersion of CNT,
followed by workability testing of selected OPC–CNT-dispersant/surfactant paste
mixtures. The outcomes of the work were; CNT in aqueous solutions agglomerate
despite mechanical agitation by magnetic stirring and ultra-sonication. Ultra-sonication,
polycarboxylate and lignosulfonate admixtures provided good dispersion of CNT in
aqueous solutions. Styrene butadiene rubber and calcium naphthalene sulfonate
admixtures facilitated rapid agglomeration of CNT; SEM analysis confirmed the
presence of agglomerates of CNT which cause lower compressive strength.
Addition of CNT to OPC paste mixtures reduced consistency and strength. Cement
paste containing CNT consistency was improved in the case of polycarboxylate
admixture addition, with highly flow able mixtures achieved when w/c was lower than
0.35. At w/c of 0.35, the compressive strength of CNT-OPC-PC increased by 25%
higher than reference mixtures which was observed by SEM analysis. The active non-
polar groups within the polycarboxylate molecule disperse CNT (non-polar) while
polar groups disperse cement and water, thereby creating stable dispersions (65).
Oscar Mendoza et al. (2013) studied the effect of superplasticizer and Ca(OH)2 on the
stability of OH functionalized multi walled carbon Nanotube dispersed in water
produced via sonication. It was concluded that Ca(OH)2 affects the stability of
MWCNT dispersions because of its interaction with negative charges of the OH
functional groups, which prevents the electrostatic repulsion between MWCNT and
superplasticizer molecules, generating re-agglomeration of the MWCNT. Sonication is
an effective method for the dispersion of MWCNT to decrease its aspect ratio, but a
balance between the degree of damage induced by it and the dispersion level desired is
required to guarantee that the MWCNT has a convenient mechanical performance when
used in a cement matrix and exposed to tensile strengths. The real effect of the SP
particles is to maintain individual MWCNT separated by electrostatic repulsion
between SP negatively charged particles and negative functional groups on MWCNT
surface. A polycarboxilate super plasticizer or an anionic dispersant is not the most
25
adequate dispersant to generate stable MWCNT to be applied in Portland cement
matrixes, because the alkaline Ca(OH)2 rich environment generated during cement
hydration prevents the SP adsorption onto the MWCNT surface generating re-
agglomeration effects which hinders the electrostatic repulsion between MWCNT
functional groups and SP molecules that maintains individual MWCNT separated(66).
Tomáš Jarolím et al. (2014) aimed to disperse of carbon Nanotubes in aquaeous
solution with use of proper surfactant to produce efficient dispersion. Magnetic stirring
and ultra-sonication was used. The quality of dispersion was examined through
ultraviolet and visible spectroscopy and scanning electron microscopy. Samples of
cement mortar reinforced with carbon Nanotubes were made and their tensile and
compressive strength in the age of 7 and 28 days was tested. Conclusions of examined
physical-mechanical characteristics did not confirm increase in addition of CNT.
Experiments indicated that better compatibility of system superplasticizer, water and
CNT would happen when superplasticizer based on polycarboxylate will be used. This
paper recommended that other researchers should focus on find suitable surfactant and
methods of mixing suspension CNT and surfactant with bigger amount of water and its
influence to stability of whole system CNT-surfactant-water (67).
2.6. The coupled effect of NS and CNT on cement composites
Oscar Mendoza et al. 2014 studied the effect of the re-agglomeration process of Multi-
Walled Carbon Nanotubes (MWCNT) dispersions on the activity of silica Nano
particles at early ages when they were combined in cement matrix.
MWCNT/water/superplasticizer dispersions were produced via sonication and
combined with NS. The study concluded that the interaction of the OH– functional
groups (from the MWCNT) with the Ca(OH)2 re-agglomerated the MWCNT
dispersions, decreasing the surface area of the MWCNT and the NS available to work
as nucleation spots at early ages, and decreased the availability of Ca(OH)2 for the NS
to react with, to form additional C–S–H at latter ages. In general, the combination
between NS and MWCNT decreased the overall kinetics of the hydration reaction. The
combination of NS and MWCNT had an accelerating effect on the hydration reaction
during the first hour because the MWCNT worked as extra nucleation spots for the
hydration products. During the first 24 hours, the presence of individual MWCNT
worked as extra nucleation spots for the hydrates and enhanced the activity of the NS
especially when NS combined with low amount of MWCNT. After 24 hours, The
combination of NS and a high amount of MWCNT had negative effect on the hydration
reaction due to the re-agglomeration process of the MWCNT. By consequence, The
activity of the NS was accelerated, decelerated or completely inhibited depending on
the amounts of MWCNT. The combination of MWCNT with NS did not present any
significant positive effect on the flexural and compressive strengths of mortars after 1
and 3 days of hydration due to the re-agglomeration of MWCNT which decreased the
amount of C–S–H produced. For ANOVA analysis, the null hypothesis was that the
26
factors (MWCNT, NS and its interaction) had no effect on the flexural or compressive
strength of mortars. This indicated that the MWCNT did not work as Nano
reinforcement and affected the activity of the NS and the hydration of cement, at both
early and late ages (11).
Peter Stynoski et al. (201) studied the effect of micro silica additives on properties of
CNT-OPC mortar mixes. They concluded that the silica hindered an accelerating effect
of carbon Nanotubes during the first 24 h of cement hydration. The use of silica
increased the toughness of mixtures containing CNT, especially after 28 days of
hydration also improved the dispersion and bonding of CNTs in cement
composites(68).
2.7. Statistical Factorial Design in Concrete Research
Typically, a trial and error approach is used in selecting and testing a first trial batch,
evaluates the results, and adjusts the mixture proportions; based on deducted
relationships between the parameters (69), finally, re-test the chosen adjusted mixture.
This process is repeated until the required properties are achieved, which may involve
carrying out a large and unpredictable number of trial batches. Statistical experimental
design is an effective scientific and efficient approach for establishing a mixture while
minimizing the number of experimental data points (70). Models are valid for a wide
range of mix proportioning and have a predictive capability for the responses of other
points located within the experimental domain. This design approach was followed by
other authors for various purposes to design and optimize the mixtures, to compare the
responses obtained from various test methods, to analyze the effect of changes in the
parameters and to evaluate trade-offs between key mixture parameters and constituent
materials. Factorial design is widely used in experiments involving many factors. That
is, to study the joint effect of the parameters or factors on responses or dependent
variables, and, to develop models applicable to design and development of experiments
(16).
Soudki et al. (2001) presented the results of a statistical analysis objected to optimize a
concrete mix design for hot climates. A full factorial experiment was used with 3 · 4 x
4 · 3 treatment combinations (432 samples) of 48 mixes at three levels of temperature.
The influences of the water/cement ratio (0.40, 0.50, and 0.60), coarse aggregate/total
aggregate ratio (0.55, 0.60, 0.65, and 0.70), total aggregate/cement ratio (3.0, 4.0, 5.0,
and 6.0), and temperature (24, 38, and 52 o C) on compressive strength were analyzed
using polynomial regression. Polynomial models were developed for concrete strength
as a function of temperature and mix proportion. The optimum concrete mix for
different temperatures was found as well as the mix that is least sensitive to temperature
variations (71).
27
Al Qadi Arabi et al. (2009) used a statistical modeling to solve the influence of key
mixture parameters (cement, water to powder ratio, fly ash and super plasticizer) on the
hardened properties affecting the performance of SCC. The models were valid for a
wide range of mixture proportioning. The derived numerical models used to reduce the
test procedures and number of trials of mix proportioning of SCC. The researchers
concluded that full quadratic models in all the responses resulted the best models (72).
Luciano Senff et al. (2010) reported the effects of Nano silica (NS) and silica fume
(SF) on the compressive strength, water absorption, apparent porosity, and unrestrained
shrinkage and weight loss of mortars up to 28 days curing. Samples with NS (0–7
wt.%), SF (0–20 wt.%) and water/cement ratio (0.35–0.59), were modeled through
factorial design experiments. Nanosilica with 7 wt. % showed the fastest formation of
structures during the rheological measurements. The structure formation influenced
more yield stress than plastic viscosity and the yield stress related well with the spread
on table. Compressive strength, water absorption and apparent porosity showed a lack
of fit of second order of the model for the range interval studied. In addition, the
variation of the unrestrained shrinkage and weight loss of mortars did not follow a
linear regression model. The maximum unrestrained shrinkage increased 80% for NS
mortars (7 days) and 54% (28 days) when compared to SF mortars in the same periods
(73).
Fábio de Paiva Cota et al. (2012) studied the effect of adding carbon nanotubes on the
mechanical properties of polymer-cement composites. A full factorial design had been
performed on 160 samples to identify the contribution provided by the following
factors: polymeric phase addition, CNT weight addition and water/cement ratio. The
response parameters of the full factorial design were the bulk density, apparent
porosity, compressive strength and elastic modulus of the polymer-cement-based
nanocomposites. The study concluded that carbon Nanotubes caused reduction in the
bulk density, the mechanical strength and the modulus of elasticity of the cement
composites, and increased the apparent porosity. The microstructural analysis revealed
a good interface condition between the CNT cluster and cement phase besides the
presence of unhydrated cement grains(74).
M. Sonebi and M. T. Bassuoni (2013) investigated the effect of mixture design
parameters on concrete by statistical modeling. In this study, the effects of water-to-
cement ratio (W/C), cement content and coarse aggregate content on the density, void
ratio, infiltration rate, and compressive strength of Portland cement concrete (PCC)
were modeled by statistical modeling. Two-level factorial design and response surface
methodology (RSM) were used. The mixtures were made with w/c of 0.28–0.40,
cement content in the range of 350–415 kg/m3 and coarse aggregate content 1200–
1400 kg/m3. In addition, examples were given on using multi parametric optimization
to produce a desirability function for satisfying specified criteria including cost. The
results showed that w/c, cement content, coarse aggregate content and their interactions
are key parameters, which significantly affect the characteristic performance of the

28
mixtures. The statistical models in this study facilitated optimizing the mixture
proportions for target performance by reducing the number of trial batches needed (75).
29
Chapter 3 : Experimental Program
3.1. General
The major problem in utilizing Nano-particles is that they are highly agglomerated
particles which cause loss in their high-surface area due to grain growth. Effective de-
agglomeration and dispersion for Nano-particles is needed to overcome the bonding
Van Der Waals forces after wetting which results in the formation of agglomerations in
the form of entangled ropes and clumps that are very difficult to disentangle. The
dispersion problem has been combated by methods like using surfactants, usually in
combination with sonication.
The present study focuses on the effectiveness of superplasticizers (high-range water-
reducing admixtures) and ultrasonic processing (direct/indirect) for the purpose of
dispersing carbon Nano tubes in water and finally pastes. A qualitative analysis using
compressive and flexure strength tests will be conducted in order to investigate the
effect of dispersion on the mechanical properties of cement composites in corroborating
Nano silica and CNT with different dosages.
In addition TEM images, XRD analysis and zeta potential distribution will be carried
out to observe the surface morphology and microstructure of cement composites with
different amounts of Nano silica and CNT addition. Finally, statistical surface response
model will be introduced correlating the percentage of both, nano silica, and CNT with
the compressive strength of cement mortars, and the effects of studied parameters will
be characterized and analyzed using ANOVA and regression models, which can
identify the primary factors and their interactions on the measured properties. Finally
the optimization software searches for the greatest overall desirable percentages of the
nano silica and CNT which enhances the cement matrix.
3.2. Overview of Experimental Program
The experimental test program is designed to achieve the research objectives; the
experimental program is divided into two major phases:
In the first phase, the objective is to provide guidelines for optimizing the dispersion
process of Nano silica and carbon Nanotubes using direct and indirect sonication.
31
A. For Nano silica, it consists of two stages:
The first stage is directed to determine the optimum sonication method of NS particles
dispersion out of direct or indirect sonication. 8 samples are conducted in order to study
the effect of the process parameters on the product quality. The first control sample is
chosen to study the particle sizes of Nano silica without sonication. Three samples
study the effect of direct sonication at 3 different times of sonication (1 min, 3 min, 6
min). The last 4 samples study the effect of indirect sonication at 4 different times (1
min, 3 min, 6 min, 9 min). All other sonication parameters are set for sonication power
100%, frequency 40 KHz and Nano silica/water concentration (1:5) constant for both
direct and indirect sonication. The test setup is a 20 gm. of Nano silica added to 100 ml
water in a flat base glass beaker, and then the beaker is put into the bath sonicator.
The second stage is dedicated testing the compressive and flexure strength after 7 and
28 days for 18 mortar mixes (5*5*5 cm3) by changing the sonication time (from 1.5 to
18 minutes) for different Nano silica amounts (0.5%, 1%, 1.5%, 2% and 2.5% by
cement weight). Cement content is 1 kg, sand is 2 kg, 0.4 w/c and 0.4 wt.%
superplasticizer. Mixes are prepared of cubes and prisms. Guidance and evaluation of
experimental program of the preparation of Nano silica particles are made through
particle size distribution, scanning electron microscope (SEM), X-ray diffraction
(XRD) and thermo gravimetric analysis (TGA).
B. For carbon Nanotubes dispersion, it consists of two stages:
The first stage is directed to determine the optimum sonication method of CNT
particles dispersion out of direct or indirect. The basic properties of carbon Nanotubes
are extreme tensile strength andYoung’smodulusof elasticity, highaspect ratio and
huge specific surface area. Because of this, CNT tend to aggregation and cluster
formation. When load is applied on the composite, those clusters behave like filler with
very poor mechanical properties, causing decrease of both tensile and compressive
strength. Perfect dispersion of CNT is essential to avoid this problem (67). 10 samples
are conducted in order to study the effect of the process parameters on the product
quality. The first control sample is chosen to study the particle sizes of carbon
Nanotubes without sonication. Four samples study the effect of direct sonication at 4
different times of sonication (2 min, 3 min, 6 min, 9 min). The last 5 samples study the
effect of indirect sonication at 4 different times (3 min, 6 min, 9 min, 12 min, 18 min).
All other sonication parameters will be set for sonication power 100%, frequency 40
KHz and carbon Nanotubes/water concentration (1:500) constant for both direct and
indirect sonication. The test setup is a 0.1 gm. of carbon Nanotubes added to 50 ml
water in a flat base glass beaker, and then the beaker is put into the bath sonicator.
31
A study is conducted to improve CNT particles dispersion in water by adding NS and
superplasticizer. Some researchers study the effect of using superplasticizer or other
surfactants on the dispersion of CNT(65; 67). After determine the optimum time and
method of sonication for Nano silica and carbon Nanotubes; 3 samples are chosen, each
sample is a set of pastes cubes (5*5*5 cm3). The paste contained of 523 g cement,
water/cement ratio is 0.6, CNT% and NS% are 0.02% and 1% respectively of cement
weight. Cement, Nano silica and carbon Nanotubes are put in the bath sonicator each in a
separate glass beaker depending on its time of sonication. Then, all components are
mixed together and casted in molds 5*5*5 cm3 to examine the pastes compressive
strength after 7 days.
The second stage studies the optimum dispersion for CNT by adding superplasticizer to
optimize the optimum mixing sequence of CNT within cement matrix. Ten samples are
conducted to study different methods of treatment for carbon Nanotubes by examine
compressive strength of cement pastes.
8 samples of cement pastes are prepared of sets of cubes for each method (5*5*5 cm3).
The paste contained of 523 gm., water/cement ratio is 0.4, 0.02% CNT% of cement
weight and 0.4 wt. % SP. The first sample is chosen to study the compressive strength of
a paste contained of cement, water and SP. The second sample studies the compressive
strength of a paste by adding carbon Nanotubes without sonication and SP. The last 6
samples examine the compressive strength for different methods of carbon Nanotubes
dispersion in water using indirect sonication and homogenizer. The first method is 1 hr.
sonication; the second 1 hr. homogenizer, the third 40 min. sonication then 10 min.
homogenizer, the forth 10 min. homogenizer then 40 min. sonication, the fifth 40 min.
homogenizer then 10 min. sonication and the sixth 30 min. sonication then 30 min.
homogenizer.
In the second phase investigates the effect of dispersion on the mechanical properties
of cement composites incorporating Nano silica and CNT with different dosages, it
consists of two stages:
The first stage tests the effect of different amounts of CNT (0.01%, 0.02% and 0.03%
of cement weight) on 3 samples of cement mortar mixes and prisms. Cement content is
1 kg, sand is 2 kg, 0.4 w/c and 0.4 wt. % superplasticizer. Compressive and flexural
strength are evaluated for the samples after 7 and 28 days of water curing. The
optimum method of sonication for CNT is chosen from the previous studies. Guidance
and evaluation of experimental program of the dispersion of carbon Nanotubes particles
are made through particle size distribution, scanning electron microscope (SEM), X-ray
diffraction (XRD), transmission electron microscope (TEM) and thermo gravimetric
analysis (TGA).
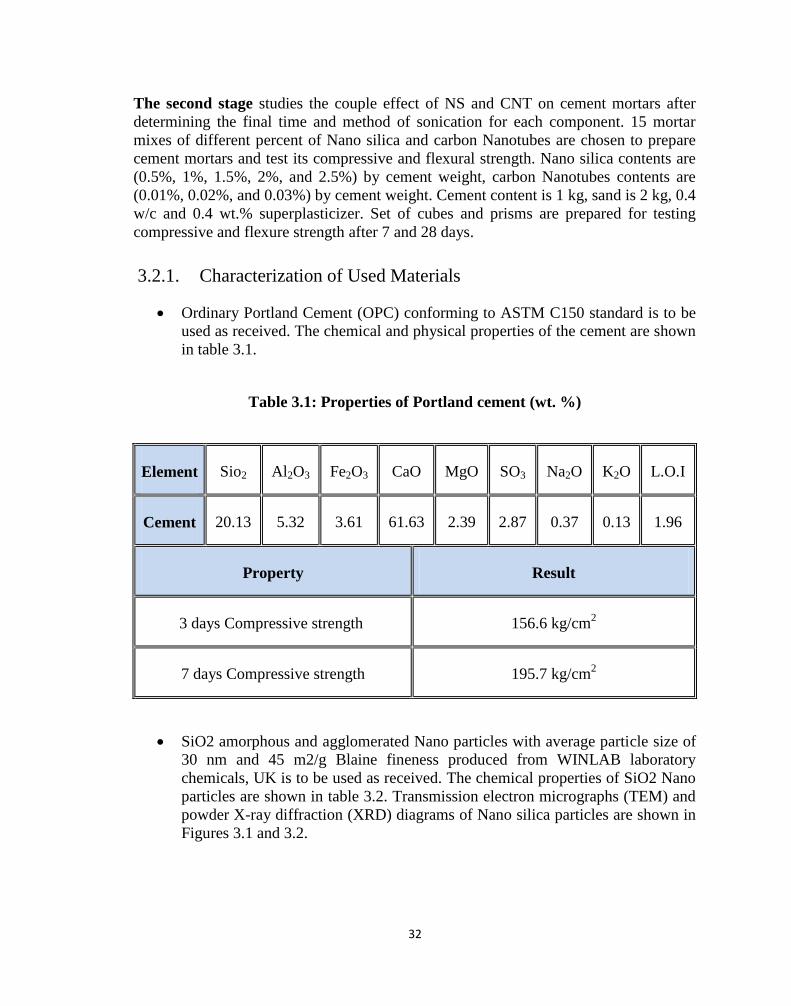
32
The second stage studies the couple effect of NS and CNT on cement mortars after
determining the final time and method of sonication for each component. 15 mortar
mixes of different percent of Nano silica and carbon Nanotubes are chosen to prepare
cement mortars and test its compressive and flexural strength. Nano silica contents are
(0.5%, 1%, 1.5%, 2%, and 2.5%) by cement weight, carbon Nanotubes contents are
(0.01%, 0.02%, and 0.03%) by cement weight. Cement content is 1 kg, sand is 2 kg, 0.4
w/c and 0.4 wt.% superplasticizer. Set of cubes and prisms are prepared for testing
compressive and flexure strength after 7 and 28 days.
3.2.1. Characterization of Used Materials
Ordinary Portland Cement (OPC) conforming to ASTM C150 standard is to be
used as received. The chemical and physical properties of the cement are shown
in table 3.1.
Table 3.1: Properties of Portland cement (wt. %)
Element Sio2 Al2O3 Fe2O3 CaO MgO SO3 Na2O K2O L.O.I
Cement 20.13 5.32 3.61 61.63 2.39 2.87 0.37 0.13 1.96
Property Result
3 days Compressive strength 156.6 kg/cm2
7 days Compressive strength 195.7 kg/cm2
SiO2 amorphous and agglomerated Nano particles with average particle size of
30 nm and 45 m2/g Blaine fineness produced from WINLAB laboratory
chemicals, UK is to be used as received. The chemical properties of SiO2 Nano
particles are shown in table 3.2. Transmission electron micrographs (TEM) and
powder X-ray diffraction (XRD) diagrams of Nano silica particles are shown in
Figures 3.1 and 3.2.
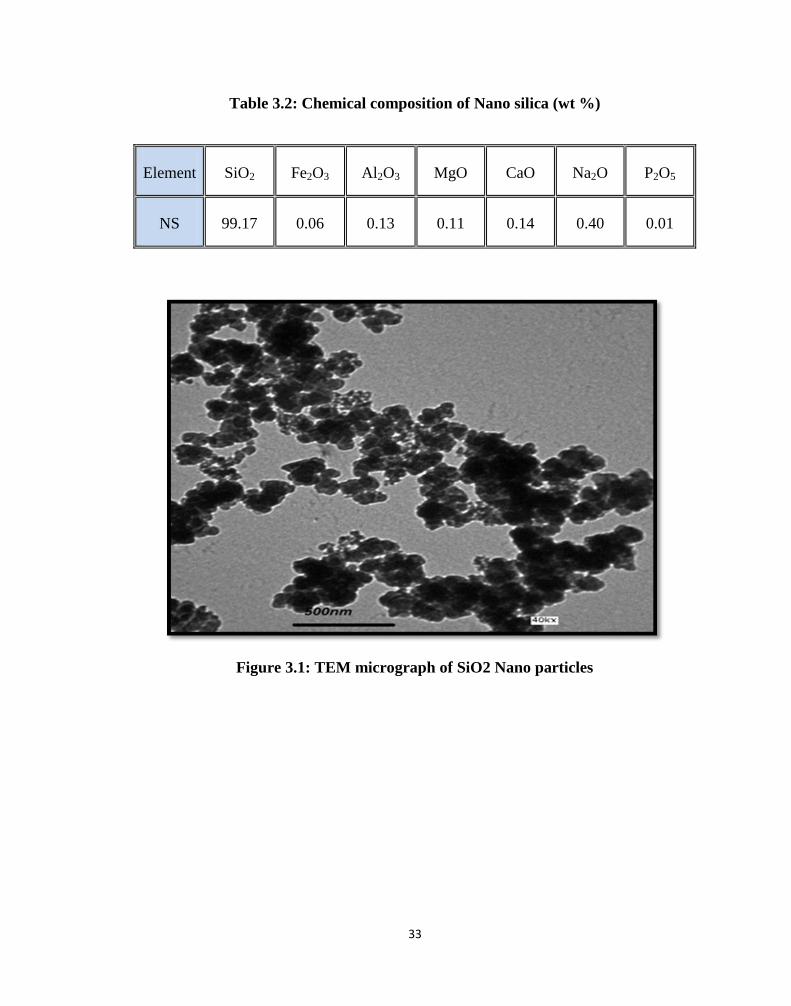
33
Table 3.2: Chemical composition of Nano silica (wt %)
Element SiO2 Fe2O3 Al2O3 MgO CaO Na2O P2O5
NS 99.17 0.06 0.13 0.11 0.14 0.40 0.01
Figure 3.1: TEM micrograph of SiO2 Nano particles
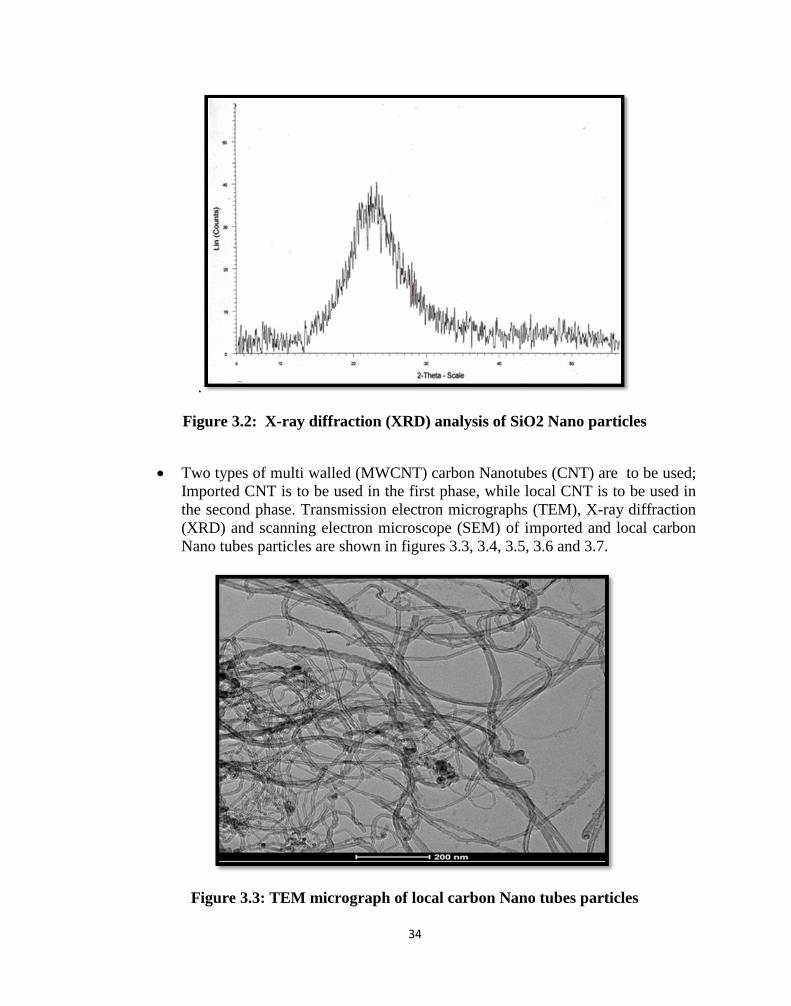
34
.
Figure 3.2: X-ray diffraction (XRD) analysis of SiO2 Nano particles
Two types of multi walled (MWCNT) carbon Nanotubes (CNT) are to be used;
Imported CNT is to be used in the first phase, while local CNT is to be used in
the second phase. Transmission electron micrographs (TEM), X-ray diffraction
(XRD) and scanning electron microscope (SEM) of imported and local carbon
Nano tubes particles are shown in figures 3.3, 3.4, 3.5, 3.6 and 3.7.
Figure 3.3: TEM micrograph of local carbon Nano tubes particles
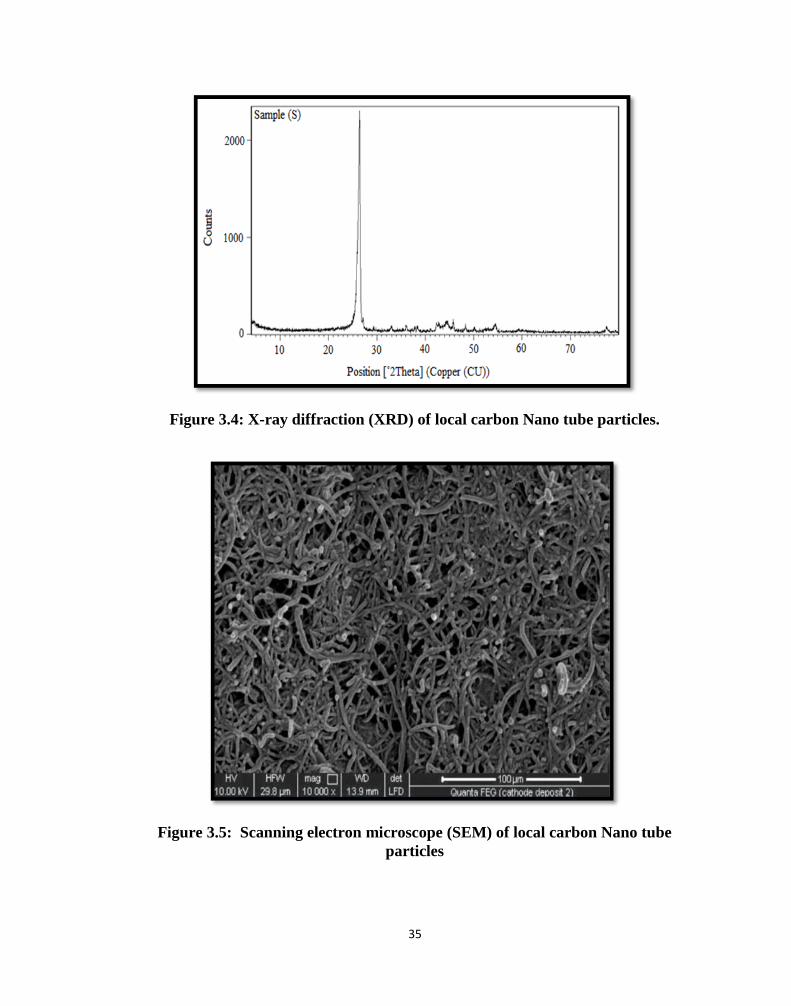
35
Figure 3.4: X-ray diffraction (XRD) of local carbon Nano tube particles.
Figure 3.5: Scanning electron microscope (SEM) of local carbon Nano tube
particles
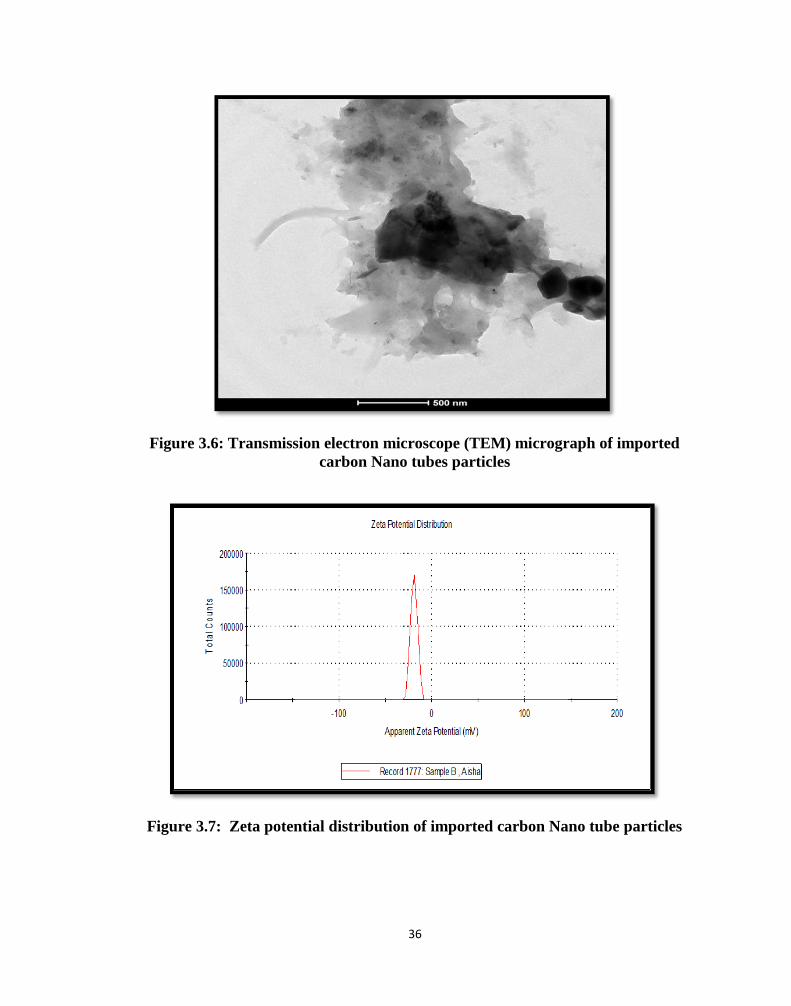
36
Figure 3.6: Transmission electron microscope (TEM) micrograph of imported
carbon Nano tubes particles
Figure 3.7: Zeta potential distribution of imported carbon Nano tube particles
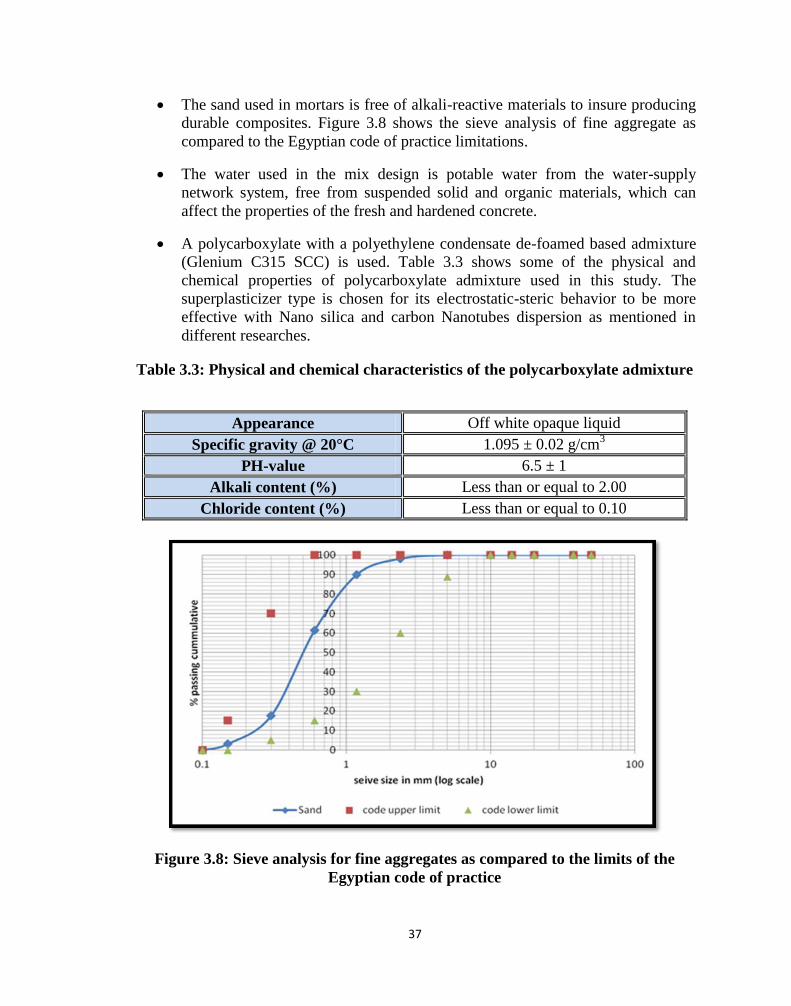
37
The sand used in mortars is free of alkali-reactive materials to insure producing
durable composites. Figure 3.8 shows the sieve analysis of fine aggregate as
compared to the Egyptian code of practice limitations.
The water used in the mix design is potable water from the water-supply
network system, free from suspended solid and organic materials, which can
affect the properties of the fresh and hardened concrete.
A polycarboxylate with a polyethylene condensate de-foamed based admixture
(Glenium C315 SCC) is used. Table 3.3 shows some of the physical and
chemical properties of polycarboxylate admixture used in this study. The
superplasticizer type is chosen for its electrostatic-steric behavior to be more
effective with Nano silica and carbon Nanotubes dispersion as mentioned in
different researches.
Table 3.3: Physical and chemical characteristics of the polycarboxylate admixture
Appearance Off white opaque liquid
Specific gravity @ 20°C 1.095 ± 0.02 g/cm3
PH-value 6.5 ± 1
Alkali content (%) Less than or equal to 2.00
Chloride content (%) Less than or equal to 0.10
Figure 3.8: Sieve analysis for fine aggregates as compared to the limits of the
Egyptian code of practice
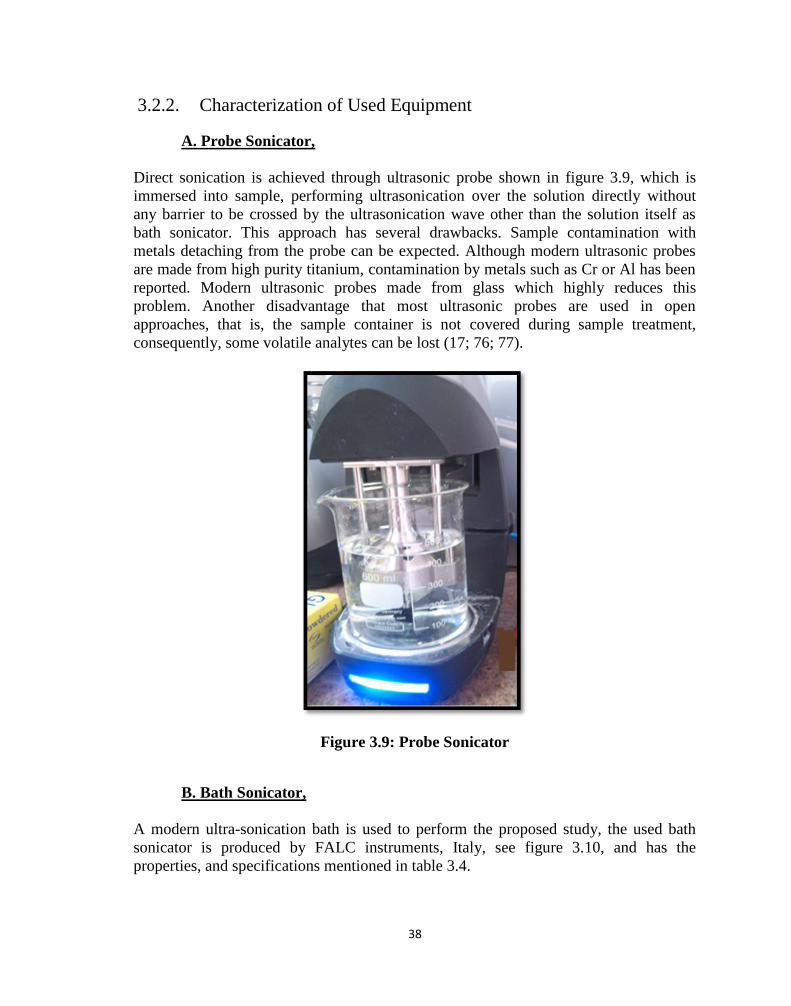
38
3.2.2. Characterization of Used Equipment
A. Probe Sonicator,
Direct sonication is achieved through ultrasonic probe shown in figure 3.9, which is
immersed into sample, performing ultrasonication over the solution directly without
any barrier to be crossed by the ultrasonication wave other than the solution itself as
bath sonicator. This approach has several drawbacks. Sample contamination with
metals detaching from the probe can be expected. Although modern ultrasonic probes
are made from high purity titanium, contamination by metals such as Cr or Al has been
reported. Modern ultrasonic probes made from glass which highly reduces this
problem. Another disadvantage that most ultrasonic probes are used in open
approaches, that is, the sample container is not covered during sample treatment,
consequently, some volatile analytes can be lost (17; 76; 77).
Figure 3.9: Probe Sonicator
B. Bath Sonicator,
A modern ultra-sonication bath is used to perform the proposed study, the used bath
sonicator is produced by FALC instruments, Italy, see figure 3.10, and has the
properties, and specifications mentioned in table 3.4.
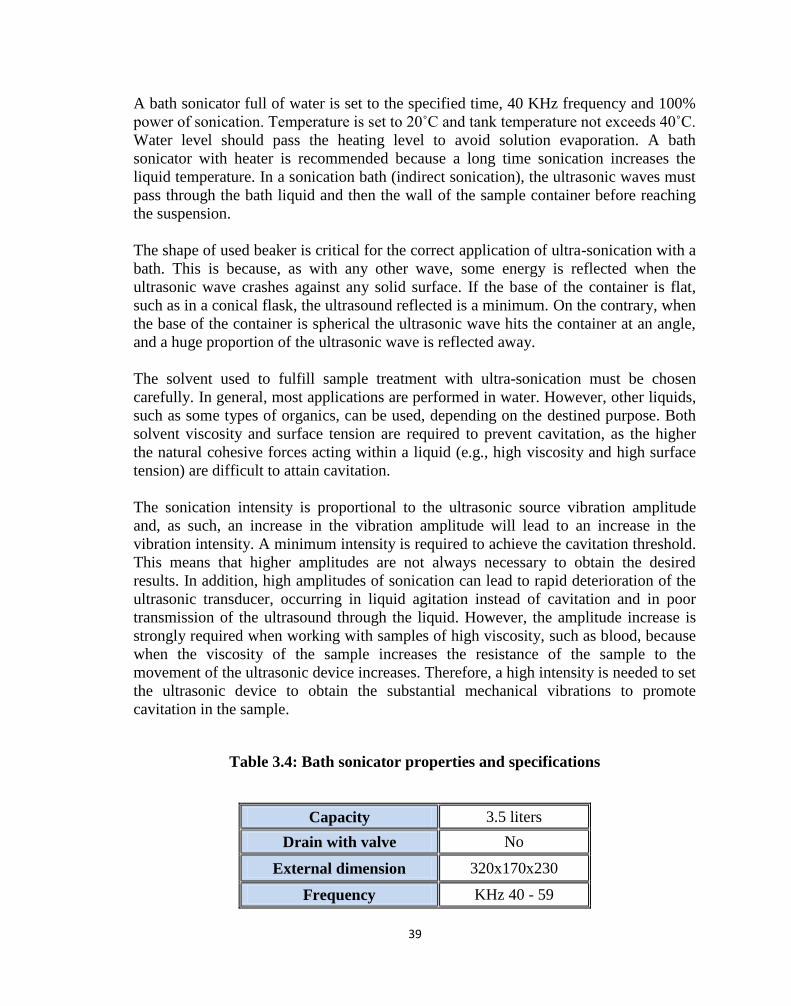
39
A bath sonicator full of water is set to the specified time, 40 KHz frequency and 100%
powerofsonication.Temperatureissetto20˚Candtanktemperaturenotexceeds40˚C.
Water level should pass the heating level to avoid solution evaporation. A bath
sonicator with heater is recommended because a long time sonication increases the
liquid temperature. In a sonication bath (indirect sonication), the ultrasonic waves must
pass through the bath liquid and then the wall of the sample container before reaching
the suspension.
The shape of used beaker is critical for the correct application of ultra-sonication with a
bath. This is because, as with any other wave, some energy is reflected when the
ultrasonic wave crashes against any solid surface. If the base of the container is flat,
such as in a conical flask, the ultrasound reflected is a minimum. On the contrary, when
the base of the container is spherical the ultrasonic wave hits the container at an angle,
and a huge proportion of the ultrasonic wave is reflected away.
The solvent used to fulfill sample treatment with ultra-sonication must be chosen
carefully. In general, most applications are performed in water. However, other liquids,
such as some types of organics, can be used, depending on the destined purpose. Both
solvent viscosity and surface tension are required to prevent cavitation, as the higher
the natural cohesive forces acting within a liquid (e.g., high viscosity and high surface
tension) are difficult to attain cavitation.
The sonication intensity is proportional to the ultrasonic source vibration amplitude
and, as such, an increase in the vibration amplitude will lead to an increase in the
vibration intensity. A minimum intensity is required to achieve the cavitation threshold.
This means that higher amplitudes are not always necessary to obtain the desired
results. In addition, high amplitudes of sonication can lead to rapid deterioration of the
ultrasonic transducer, occurring in liquid agitation instead of cavitation and in poor
transmission of the ultrasound through the liquid. However, the amplitude increase is
strongly required when working with samples of high viscosity, such as blood, because
when the viscosity of the sample increases the resistance of the sample to the
movement of the ultrasonic device increases. Therefore, a high intensity is needed to set
the ultrasonic device to obtain the substantial mechanical vibrations to promote
cavitation in the sample.
Table 3.4: Bath sonicator properties and specifications
Capacity 3.5 liters
Drain with valve No
External dimension 320x170x230
Frequency KHz 40 - 59
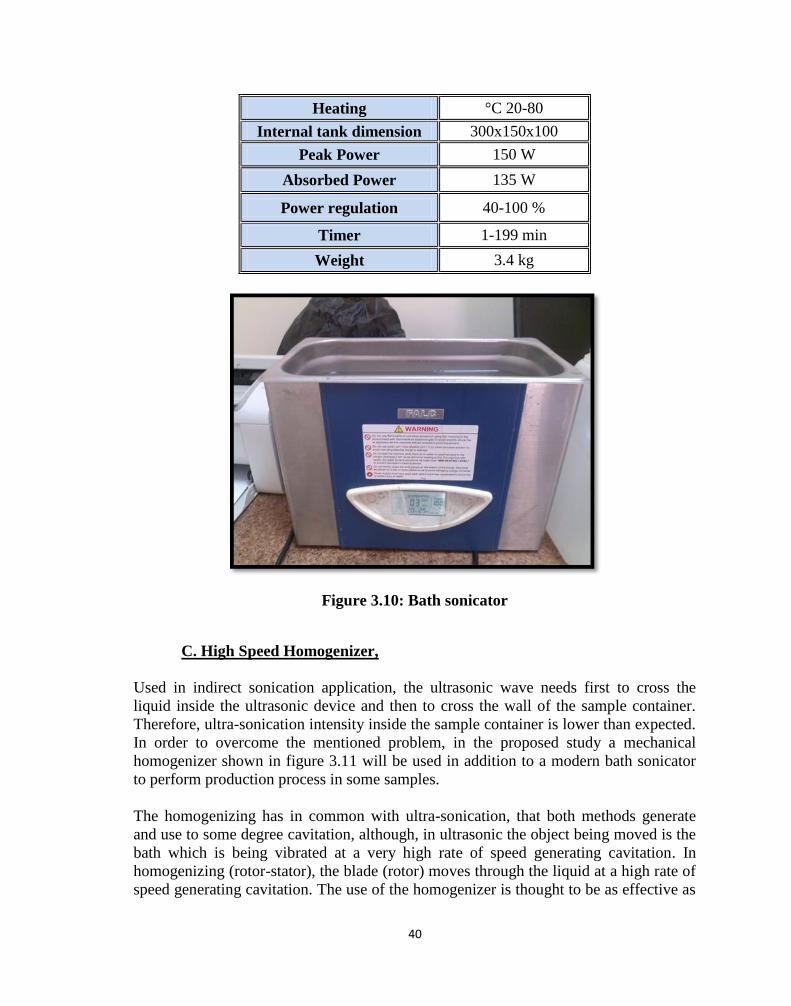
41
Heating °C 20-80
Internal tank dimension 300x150x100
Peak Power 150 W
Absorbed Power 135 W
Power regulation 40-100 %
Timer 1-199 min
Weight 3.4 kg
Figure 3.10: Bath sonicator
C. High Speed Homogenizer,
Used in indirect sonication application, the ultrasonic wave needs first to cross the
liquid inside the ultrasonic device and then to cross the wall of the sample container.
Therefore, ultra-sonication intensity inside the sample container is lower than expected.
In order to overcome the mentioned problem, in the proposed study a mechanical
homogenizer shown in figure 3.11 will be used in addition to a modern bath sonicator
to perform production process in some samples.
The homogenizing has in common with ultra-sonication, that both methods generate
and use to some degree cavitation, although, in ultrasonic the object being moved is the
bath which is being vibrated at a very high rate of speed generating cavitation. In
homogenizing (rotor-stator), the blade (rotor) moves through the liquid at a high rate of
speed generating cavitation. The use of the homogenizer is thought to be as effective as
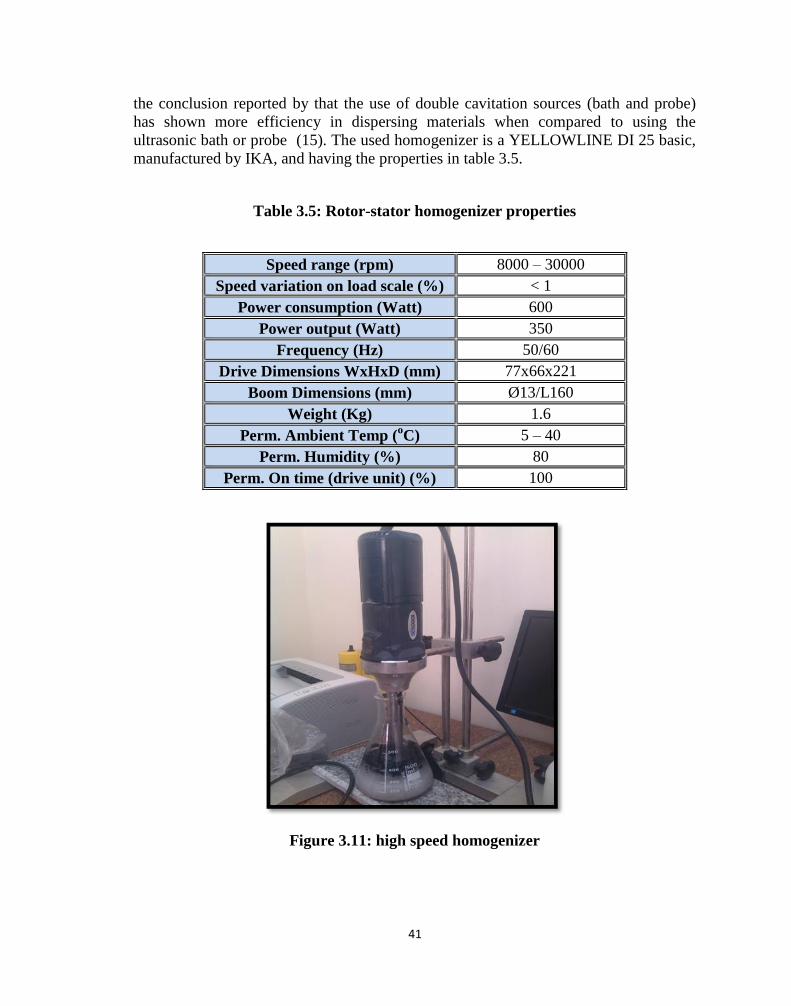
41
the conclusion reported by that the use of double cavitation sources (bath and probe)
has shown more efficiency in dispersing materials when compared to using the
ultrasonic bath or probe (15). The used homogenizer is a YELLOWLINE DI 25 basic,
manufactured by IKA, and having the properties in table 3.5.
Table 3.5: Rotor-stator homogenizer properties
Speed range (rpm) 8000 – 30000
Speed variation on load scale (%) < 1
Power consumption (Watt) 600
Power output (Watt) 350
Frequency (Hz) 50/60
Drive Dimensions WxHxD (mm) 77x66x221
Boom Dimensions (mm) Ø13/L160
Weight (Kg) 1.6
Perm. Ambient Temp (oC) 5 – 40
Perm. Humidity (%) 80
Perm. On time (drive unit) (%) 100
Figure 3.11: high speed homogenizer
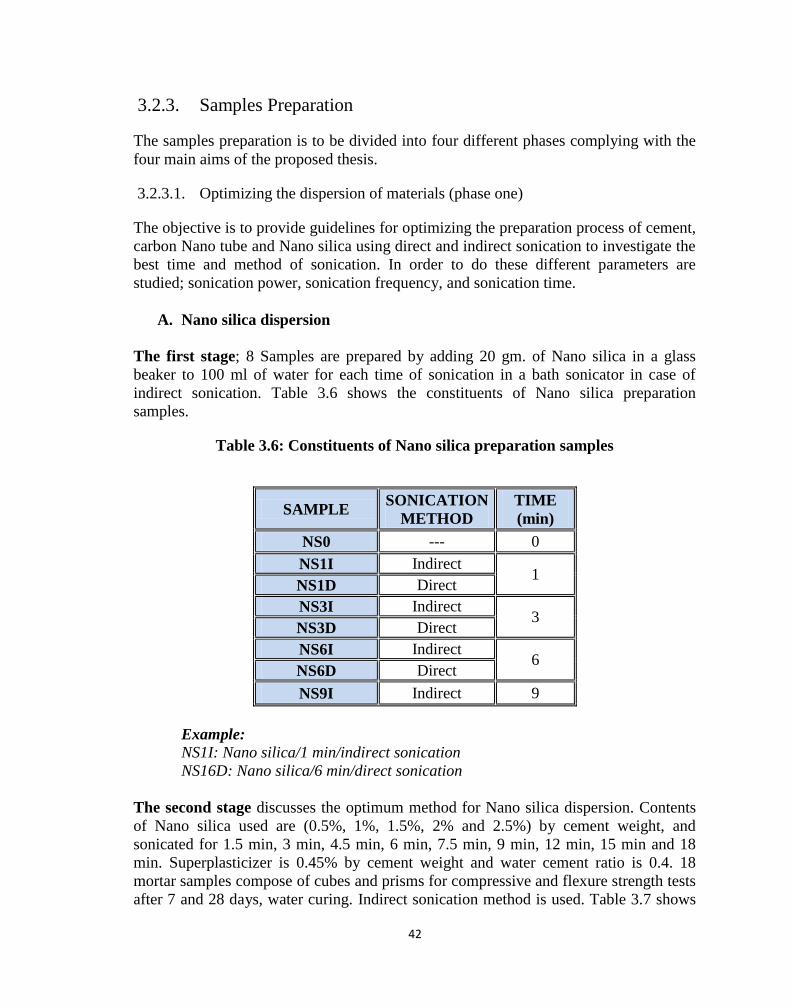
42
3.2.3. Samples Preparation
The samples preparation is to be divided into four different phases complying with the
four main aims of the proposed thesis.
3.2.3.1. Optimizing the dispersion of materials (phase one)
The objective is to provide guidelines for optimizing the preparation process of cement,
carbon Nano tube and Nano silica using direct and indirect sonication to investigate the
best time and method of sonication. In order to do these different parameters are
studied; sonication power, sonication frequency, and sonication time.
A. Nano silica dispersion
The first stage; 8 Samples are prepared by adding 20 gm. of Nano silica in a glass
beaker to 100 ml of water for each time of sonication in a bath sonicator in case of
indirect sonication. Table 3.6 shows the constituents of Nano silica preparation
samples.
Table 3.6: Constituents of Nano silica preparation samples
SAMPLE SONICATION
METHOD
TIME
(min)
NS0 --- 0
NS1I Indirect 1
NS1D Direct
NS3I Indirect 3
NS3D Direct
NS6I Indirect 6
NS6D Direct
NS9I Indirect 9
Example:
NS1I: Nano silica/1 min/indirect sonication
NS16D: Nano silica/6 min/direct sonication
The second stage discusses the optimum method for Nano silica dispersion. Contents
of Nano silica used are (0.5%, 1%, 1.5%, 2% and 2.5%) by cement weight, and
sonicated for 1.5 min, 3 min, 4.5 min, 6 min, 7.5 min, 9 min, 12 min, 15 min and 18
min. Superplasticizer is 0.45% by cement weight and water cement ratio is 0.4. 18
mortar samples compose of cubes and prisms for compressive and flexure strength tests
after 7 and 28 days, water curing. Indirect sonication method is used. Table 3.7 shows
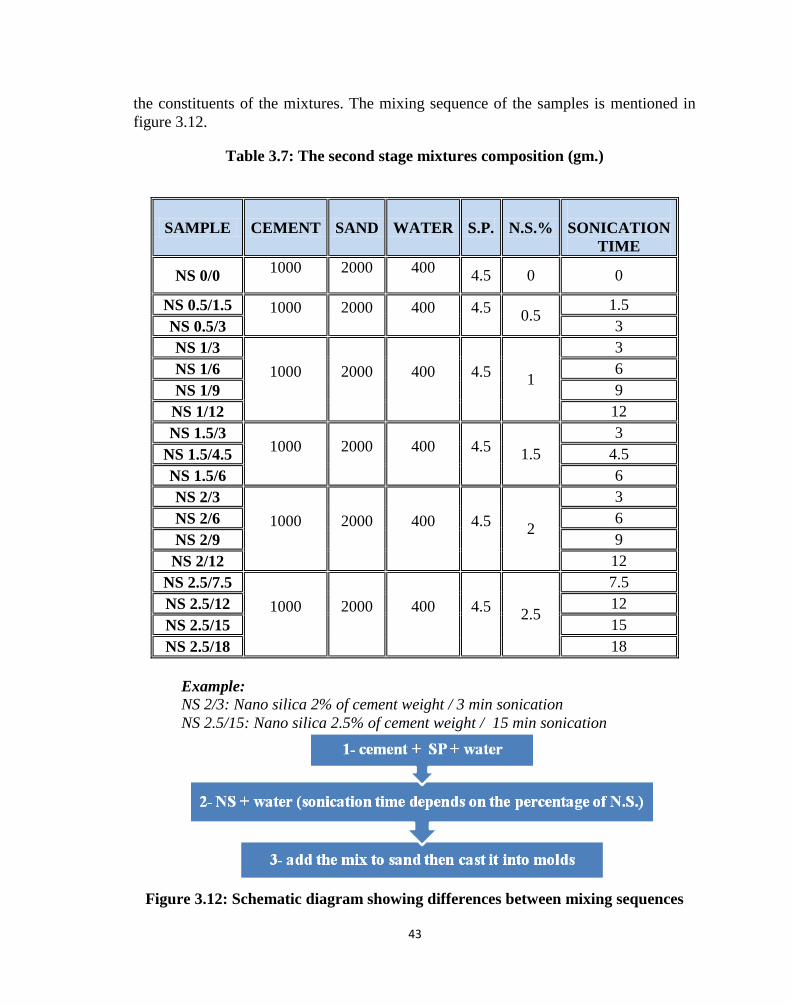
43
the constituents of the mixtures. The mixing sequence of the samples is mentioned in
figure 3.12.
Table 3.7: The second stage mixtures composition (gm.)
SAMPLE CEMENT SAND WATER S.P. N.S.%
SONICATION
TIME
NS 0/0 1000 2000 400
4.5 0 0
NS 0.5/1.5 1000 2000 400 4.5 0.5
1.5
NS 0.5/3 3
NS 1/3
1000 2000 400 4.5 1
3
NS 1/6 6
NS 1/9 9
NS 1/12 12
NS 1.5/3 1000 2000 400 4.5
1.5
3
NS 1.5/4.5 4.5
NS 1.5/6 6
NS 2/3
1000 2000 400 4.5 2
3
NS 2/6 6
NS 2/9 9
NS 2/12 12
NS 2.5/7.5
1000 2000 400 4.5 2.5
7.5
NS 2.5/12 12
NS 2.5/15 15
NS 2.5/18 18
Example:
NS 2/3: Nano silica 2% of cement weight / 3 min sonication
NS 2.5/15: Nano silica 2.5% of cement weight / 15 min sonication
Figure 3.12: Schematic diagram showing differences between mixing sequences
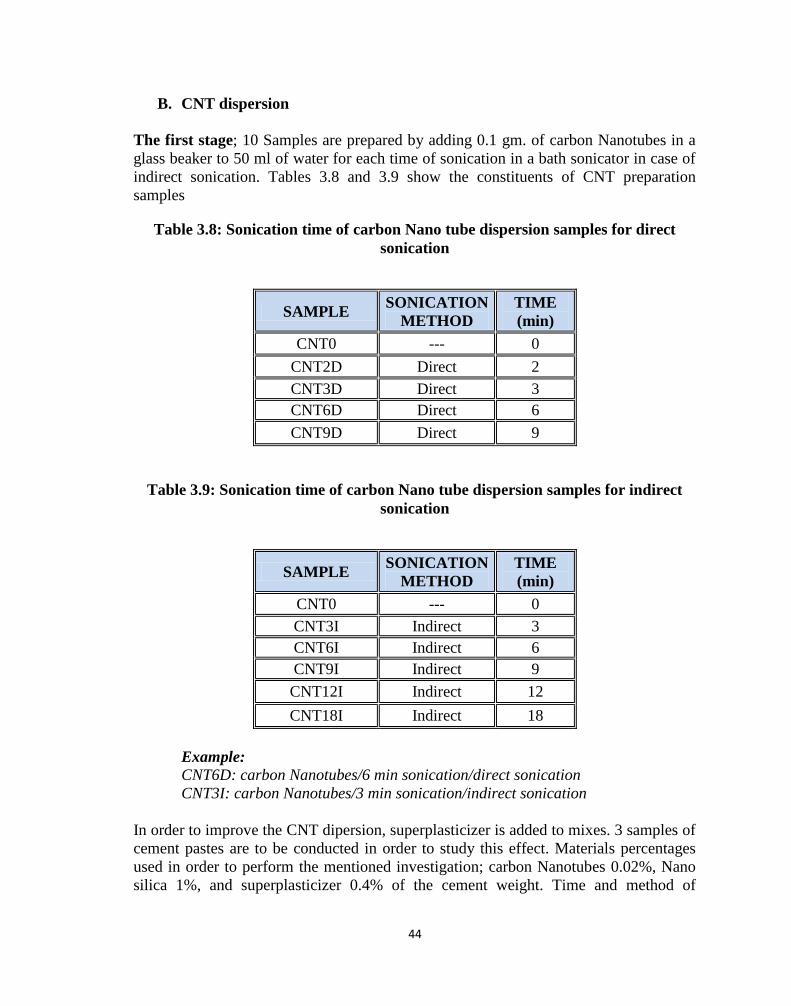
44
B. CNT dispersion
The first stage; 10 Samples are prepared by adding 0.1 gm. of carbon Nanotubes in a
glass beaker to 50 ml of water for each time of sonication in a bath sonicator in case of
indirect sonication. Tables 3.8 and 3.9 show the constituents of CNT preparation
samples
Table 3.8: Sonication time of carbon Nano tube dispersion samples for direct
sonication
SAMPLE SONICATION
METHOD
TIME
(min)
CNT0 --- 0
CNT2D Direct 2
CNT3D Direct 3
CNT6D Direct 6
CNT9D Direct 9
Table 3.9: Sonication time of carbon Nano tube dispersion samples for indirect
sonication
SAMPLE SONICATION
METHOD
TIME
(min)
CNT0 --- 0
CNT3I Indirect 3
CNT6I Indirect 6
CNT9I Indirect 9
CNT12I Indirect 12
CNT18I Indirect 18
Example:
CNT6D: carbon Nanotubes/6 min sonication/direct sonication
CNT3I: carbon Nanotubes/3 min sonication/indirect sonication
In order to improve the CNT dipersion, superplasticizer is added to mixes. 3 samples of
cement pastes are to be conducted in order to study this effect. Materials percentages
used in order to perform the mentioned investigation; carbon Nanotubes 0.02%, Nano
silica 1%, and superplasticizer 0.4% of the cement weight. Time and method of
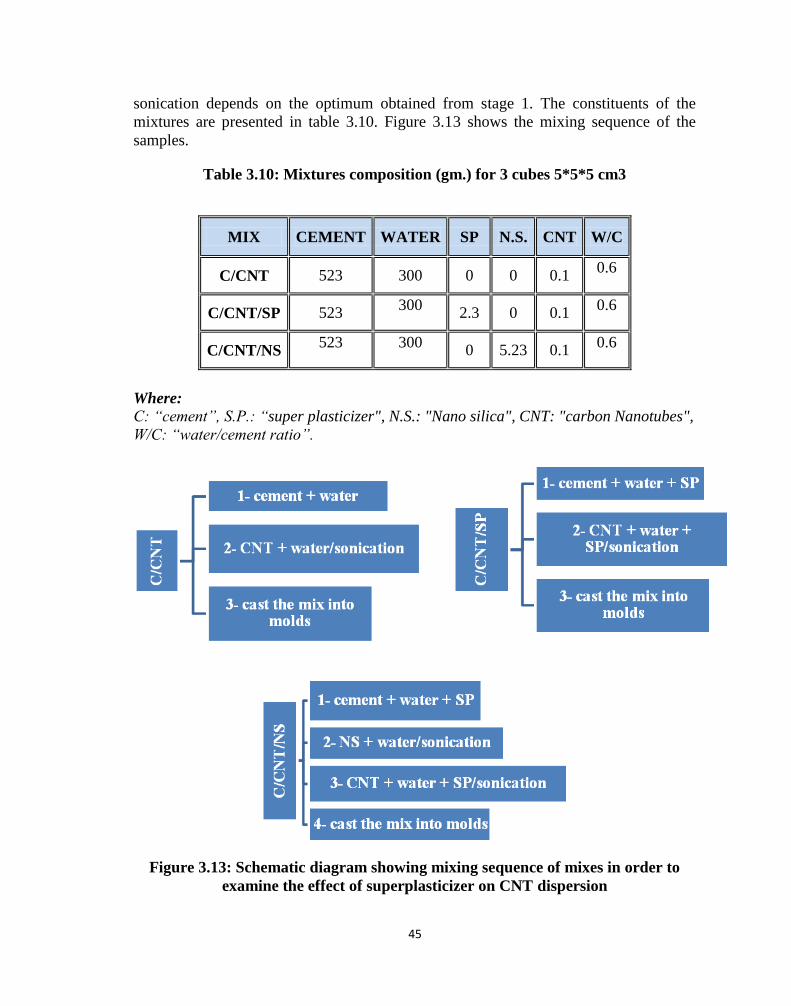
45
sonication depends on the optimum obtained from stage 1. The constituents of the
mixtures are presented in table 3.10. Figure 3.13 shows the mixing sequence of the
samples.
Table 3.10: Mixtures composition (gm.) for 3 cubes 5*5*5 cm3
MIX CEMENT WATER SP N.S. CNT W/C
C/CNT 523 300 0 0 0.1 0.6
C/CNT/SP 523 300
2.3 0 0.1 0.6
C/CNT/NS 523 300
0 5.23 0.1 0.6
Where:
C: “cement”, S.P.: “super plasticizer", N.S.: "Nano silica", CNT: "carbon Nanotubes",
W/C: “water/cement ratio”.
Figure 3.13: Schematic diagram showing mixing sequence of mixes in order to
examine the effect of superplasticizer on CNT dispersion
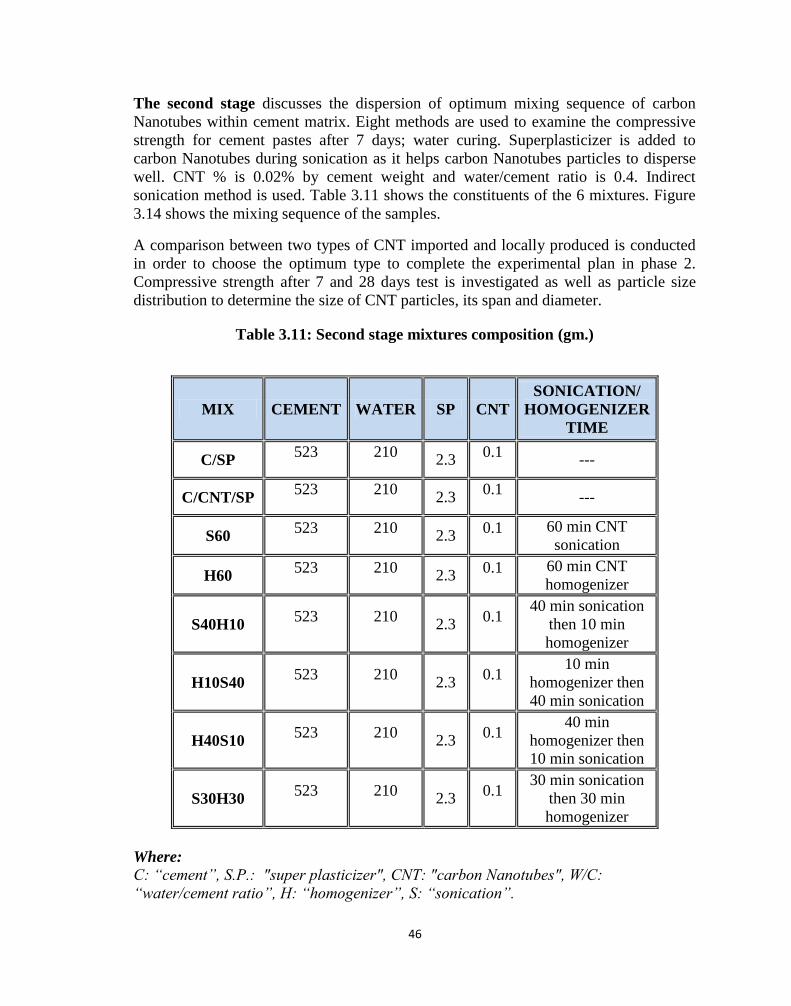
46
The second stage discusses the dispersion of optimum mixing sequence of carbon
Nanotubes within cement matrix. Eight methods are used to examine the compressive
strength for cement pastes after 7 days; water curing. Superplasticizer is added to
carbon Nanotubes during sonication as it helps carbon Nanotubes particles to disperse
well. CNT % is 0.02% by cement weight and water/cement ratio is 0.4. Indirect
sonication method is used. Table 3.11 shows the constituents of the 6 mixtures. Figure
3.14 shows the mixing sequence of the samples.
A comparison between two types of CNT imported and locally produced is conducted
in order to choose the optimum type to complete the experimental plan in phase 2.
Compressive strength after 7 and 28 days test is investigated as well as particle size
distribution to determine the size of CNT particles, its span and diameter.
Table 3.11: Second stage mixtures composition (gm.)
MIX CEMENT WATER SP CNT
SONICATION/
HOMOGENIZER
TIME
C/SP 523 210
2.3 0.1
---
C/CNT/SP 523 210
2.3 0.1
---
S60 523 210
2.3 0.1 60 min CNT
sonication
H60 523 210
2.3 0.1 60 min CNT
homogenizer
S40H10 523 210
2.3 0.1
40 min sonication
then 10 min
homogenizer
H10S40 523 210
2.3 0.1
10 min
homogenizer then
40 min sonication
H40S10 523 210
2.3 0.1
40 min
homogenizer then
10 min sonication
S30H30 523 210
2.3 0.1
30 min sonication
then 30 min
homogenizer
Where:
C: “cement”, S.P.: "super plasticizer", CNT: "carbon Nanotubes", W/C:
“water/cement ratio”, H: “homogenizer”, S: “sonication”.
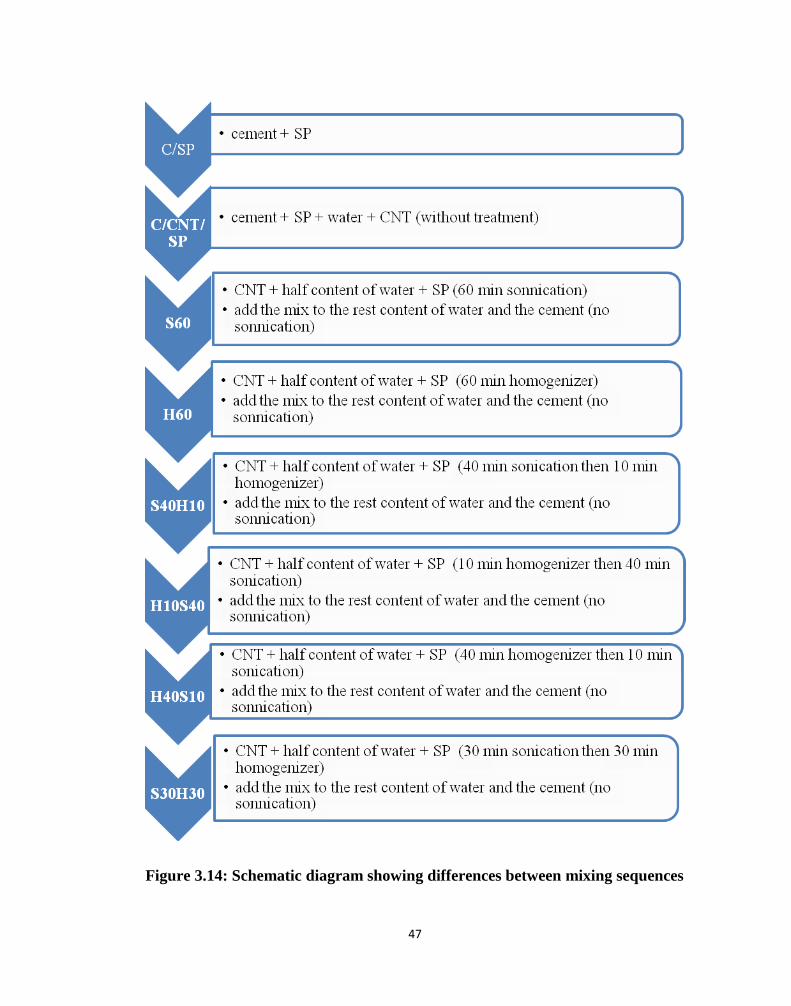
47
Figure 3.14: Schematic diagram showing differences between mixing sequences
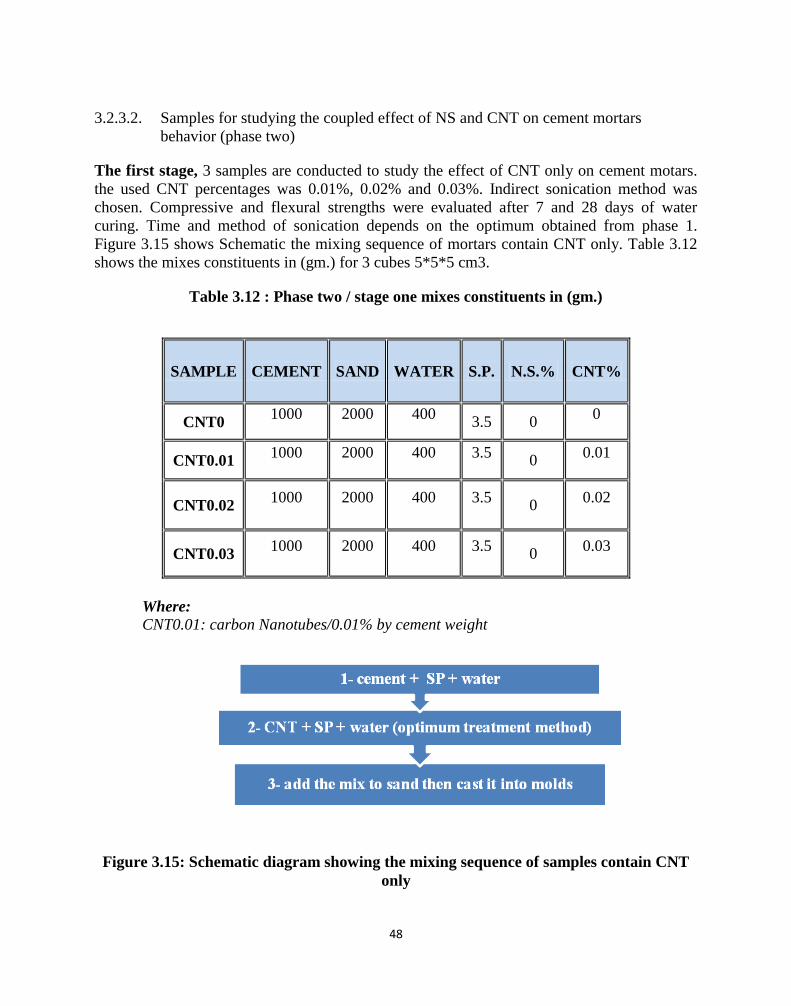
48
3.2.3.2. Samples for studying the coupled effect of NS and CNT on cement mortars
behavior (phase two)
The first stage, 3 samples are conducted to study the effect of CNT only on cement motars.
the used CNT percentages was 0.01%, 0.02% and 0.03%. Indirect sonication method was
chosen. Compressive and flexural strengths were evaluated after 7 and 28 days of water
curing. Time and method of sonication depends on the optimum obtained from phase 1.
Figure 3.15 shows Schematic the mixing sequence of mortars contain CNT only. Table 3.12
shows the mixes constituents in (gm.) for 3 cubes 5*5*5 cm3.
Table 3.12 : Phase two / stage one mixes constituents in (gm.)
SAMPLE CEMENT SAND WATER S.P. N.S.% CNT%
CNT0 1000 2000 400
3.5 0 0
CNT0.01 1000 2000 400 3.5
0 0.01
CNT0.02 1000 2000 400 3.5
0 0.02
CNT0.03 1000 2000 400 3.5
0 0.03
Where:
CNT0.01: carbon Nanotubes/0.01% by cement weight
Figure 3.15: Schematic diagram showing the mixing sequence of samples contain CNT
only
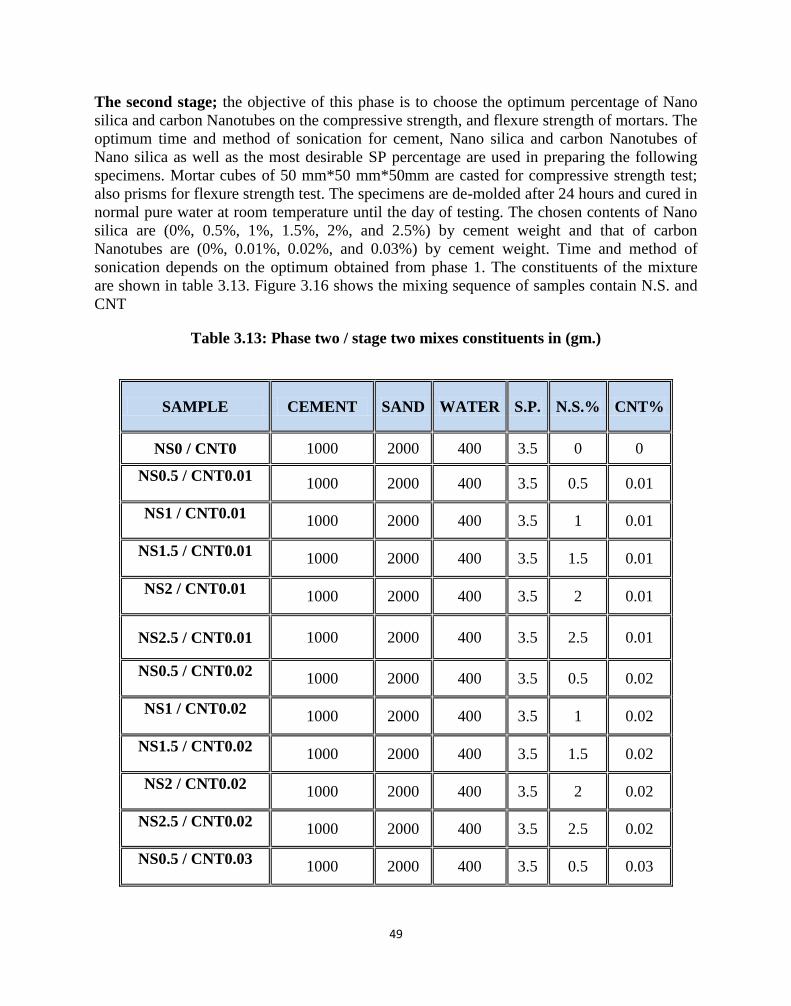
49
The second stage; the objective of this phase is to choose the optimum percentage of Nano
silica and carbon Nanotubes on the compressive strength, and flexure strength of mortars. The
optimum time and method of sonication for cement, Nano silica and carbon Nanotubes of
Nano silica as well as the most desirable SP percentage are used in preparing the following
specimens. Mortar cubes of 50 mm*50 mm*50mm are casted for compressive strength test;
also prisms for flexure strength test. The specimens are de-molded after 24 hours and cured in
normal pure water at room temperature until the day of testing. The chosen contents of Nano
silica are (0%, 0.5%, 1%, 1.5%, 2%, and 2.5%) by cement weight and that of carbon
Nanotubes are (0%, 0.01%, 0.02%, and 0.03%) by cement weight. Time and method of
sonication depends on the optimum obtained from phase 1. The constituents of the mixture
are shown in table 3.13. Figure 3.16 shows the mixing sequence of samples contain N.S. and
CNT
Table 3.13: Phase two / stage two mixes constituents in (gm.)
SAMPLE CEMENT SAND WATER S.P. N.S.% CNT%
NS0 / CNT0 1000 2000 400 3.5 0 0
NS0.5 / CNT0.01 1000 2000 400 3.5 0.5 0.01
NS1 / CNT0.01 1000 2000 400 3.5 1 0.01
NS1.5 / CNT0.01 1000 2000 400 3.5 1.5 0.01
NS2 / CNT0.01 1000 2000 400 3.5 2 0.01
NS2.5 / CNT0.01 1000 2000 400 3.5 2.5 0.01
NS0.5 / CNT0.02 1000 2000 400 3.5 0.5 0.02
NS1 / CNT0.02 1000 2000 400 3.5 1 0.02
NS1.5 / CNT0.02 1000 2000 400 3.5 1.5 0.02
NS2 / CNT0.02 1000 2000 400 3.5 2 0.02
NS2.5 / CNT0.02 1000 2000 400 3.5 2.5 0.02
NS0.5 / CNT0.03 1000 2000 400 3.5 0.5 0.03
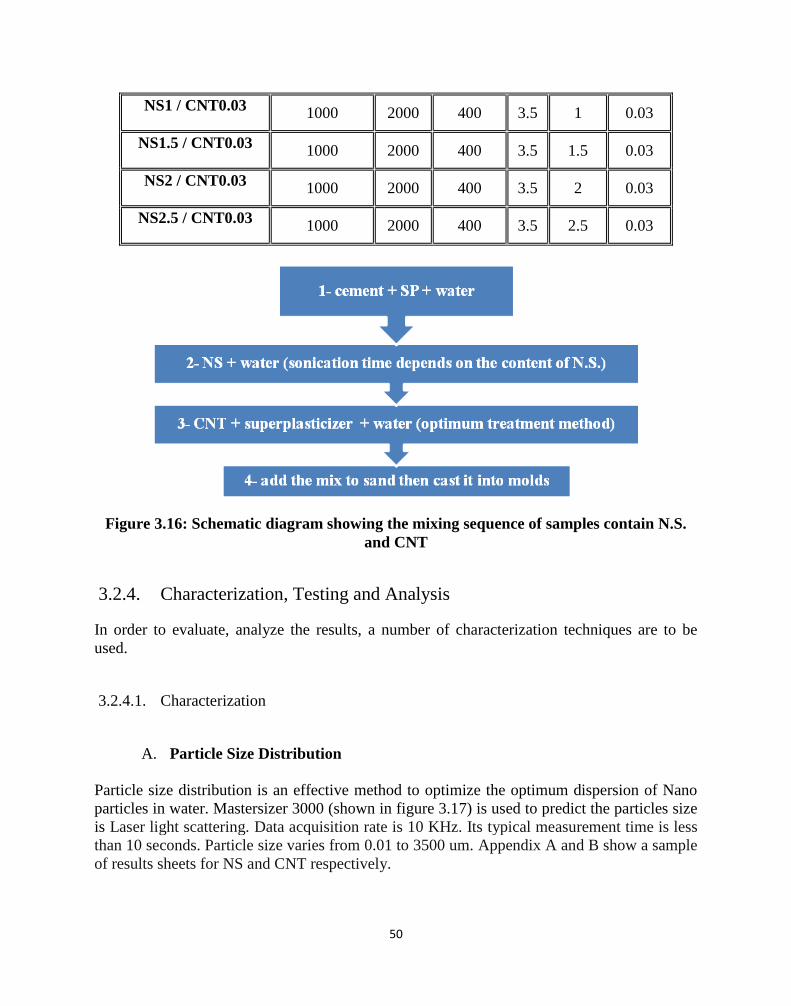
51
NS1 / CNT0.03 1000 2000 400 3.5 1 0.03
NS1.5 / CNT0.03 1000 2000 400 3.5 1.5 0.03
NS2 / CNT0.03 1000 2000 400 3.5 2 0.03
NS2.5 / CNT0.03 1000 2000 400 3.5 2.5 0.03
Figure 3.16: Schematic diagram showing the mixing sequence of samples contain N.S.
and CNT
3.2.4. Characterization, Testing and Analysis
In order to evaluate, analyze the results, a number of characterization techniques are to be
used.
3.2.4.1. Characterization
A. Particle Size Distribution
Particle size distribution is an effective method to optimize the optimum dispersion of Nano
particles in water. Mastersizer 3000 (shown in figure 3.17) is used to predict the particles size
is Laser light scattering. Data acquisition rate is 10 KHz. Its typical measurement time is less
than 10 seconds. Particle size varies from 0.01 to 3500 um. Appendix A and B show a sample
of results sheets for NS and CNT respectively.
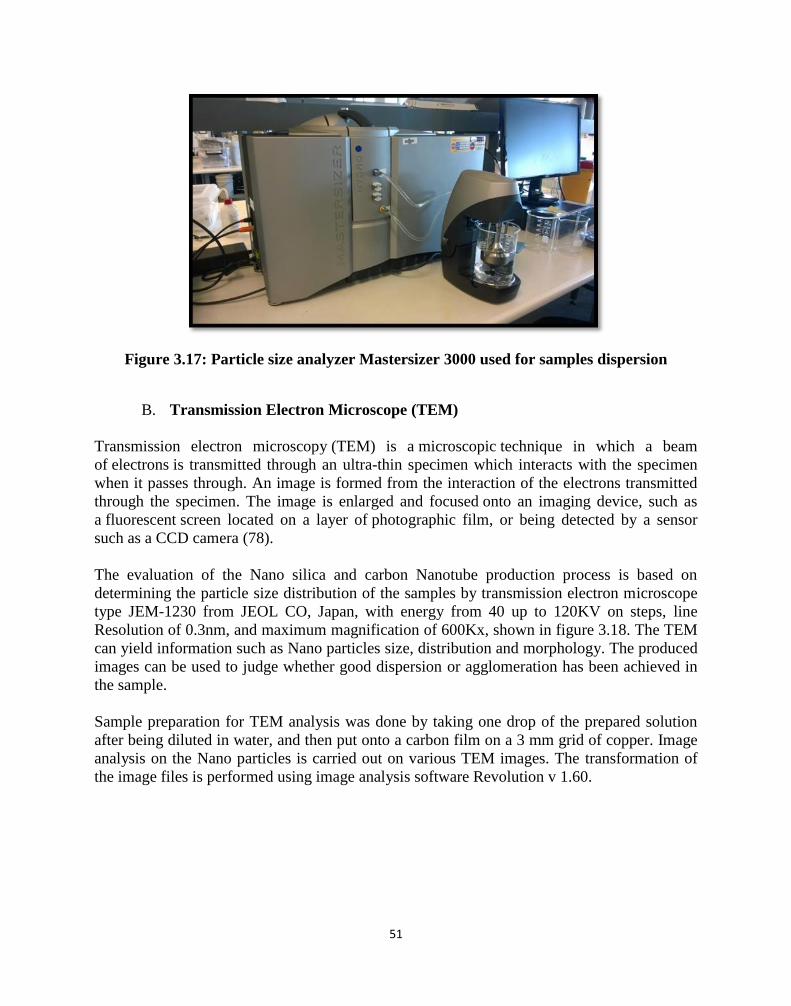
51
Figure 3.17: Particle size analyzer Mastersizer 3000 used for samples dispersion
B. Transmission Electron Microscope (TEM)
Transmission electron microscopy (TEM) is a microscopic technique in which a beam
of electrons is transmitted through an ultra-thin specimen which interacts with the specimen
when it passes through. An image is formed from the interaction of the electrons transmitted
through the specimen. The image is enlarged and focused onto an imaging device, such as
a fluorescent screen located on a layer of photographic film, or being detected by a sensor
such as a CCD camera (78).
The evaluation of the Nano silica and carbon Nanotube production process is based on
determining the particle size distribution of the samples by transmission electron microscope
type JEM-1230 from JEOL CO, Japan, with energy from 40 up to 120KV on steps, line
Resolution of 0.3nm, and maximum magnification of 600Kx, shown in figure 3.18. The TEM
can yield information such as Nano particles size, distribution and morphology. The produced
images can be used to judge whether good dispersion or agglomeration has been achieved in
the sample.
Sample preparation for TEM analysis was done by taking one drop of the prepared solution
after being diluted in water, and then put onto a carbon film on a 3 mm grid of copper. Image
analysis on the Nano particles is carried out on various TEM images. The transformation of
the image files is performed using image analysis software Revolution v 1.60.
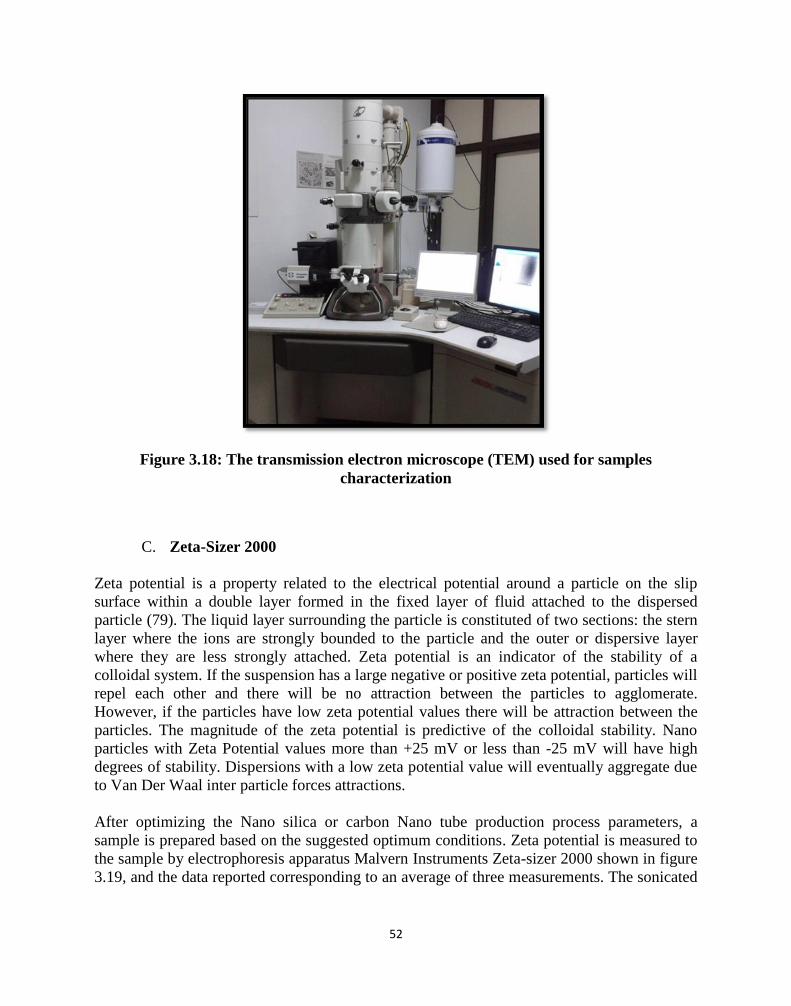
52
Figure 3.18: The transmission electron microscope (TEM) used for samples
characterization
C. Zeta-Sizer 2000
Zeta potential is a property related to the electrical potential around a particle on the slip
surface within a double layer formed in the fixed layer of fluid attached to the dispersed
particle (79). The liquid layer surrounding the particle is constituted of two sections: the stern
layer where the ions are strongly bounded to the particle and the outer or dispersive layer
where they are less strongly attached. Zeta potential is an indicator of the stability of a
colloidal system. If the suspension has a large negative or positive zeta potential, particles will
repel each other and there will be no attraction between the particles to agglomerate.
However, if the particles have low zeta potential values there will be attraction between the
particles. The magnitude of the zeta potential is predictive of the colloidal stability. Nano
particles with Zeta Potential values more than +25 mV or less than -25 mV will have high
degrees of stability. Dispersions with a low zeta potential value will eventually aggregate due
to Van Der Waal inter particle forces attractions.
After optimizing the Nano silica or carbon Nano tube production process parameters, a
sample is prepared based on the suggested optimum conditions. Zeta potential is measured to
the sample by electrophoresis apparatus Malvern Instruments Zeta-sizer 2000 shown in figure
3.19, and the data reported corresponding to an average of three measurements. The sonicated
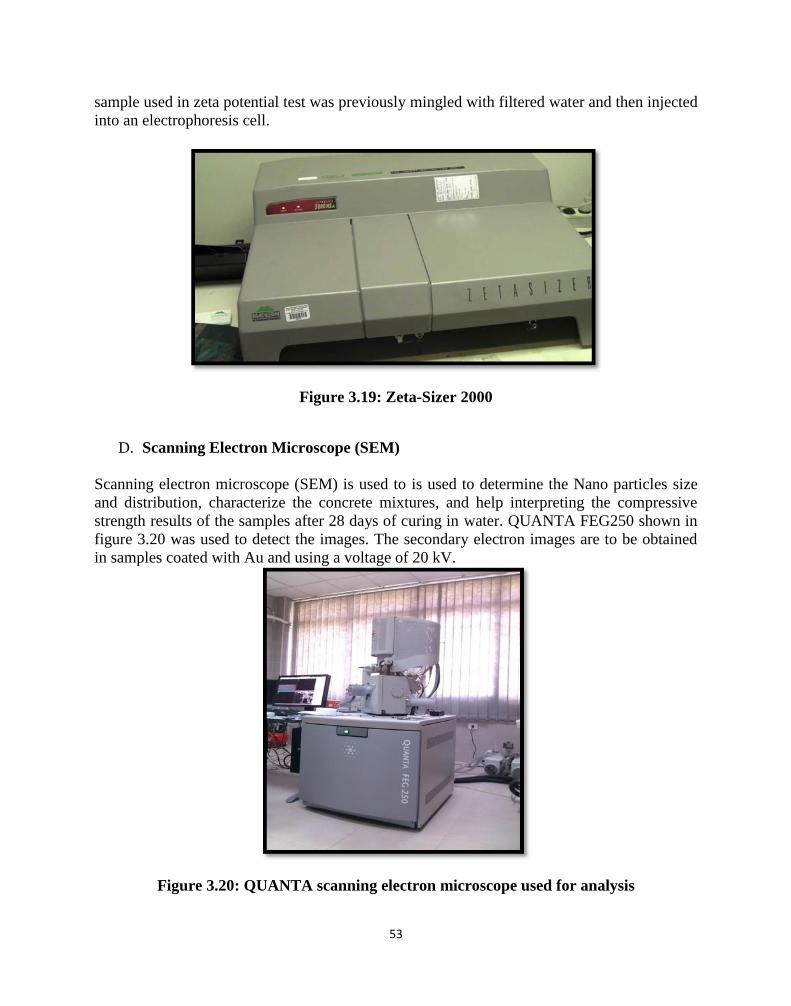
53
sample used in zeta potential test was previously mingled with filtered water and then injected
into an electrophoresis cell.
Figure 3.19: Zeta-Sizer 2000
D. Scanning Electron Microscope (SEM)
Scanning electron microscope (SEM) is used to is used to determine the Nano particles size
and distribution, characterize the concrete mixtures, and help interpreting the compressive
strength results of the samples after 28 days of curing in water. QUANTA FEG250 shown in
figure 3.20 was used to detect the images. The secondary electron images are to be obtained
in samples coated with Au and using a voltage of 20 kV.
Figure 3.20: QUANTA scanning electron microscope used for analysis
54
E. X-ray diffraction XRD
X-ray diffraction (XRD) is one of the best methods for detecting changes in hydration
reaction due to the addition of pozzolanic materials. A mineralogical study is conducted
employing the X-ray diffraction technique (XRD) to identify the formed phases before
andafterexposureto600˚C.Afterperformingthecompressivestrengthtest,thecrushed
concrete cubes of each mix are finely ground and totally mixed. A representative sample
from each mix is undertaken and ground to a very fine powder that passes (75 lm) sieve
and is tested immediately after that.
F. Thermo-gravimetric analysis TGA
The TGA test is widely used for determining the effect of high temperature on hydrated
cement composites. Thermo-gravimetric analysis (TGA) is carried out in mortar or paste
mixes cured in water for 28 days. A TGA850 thermo balance from Mettler Toledo and
STARe software v8.10 was used. The samples are previously milled, washed with
acetone, filtered and then dried at 60 ± 2oC for approximately 30 min. Aluminum
crucibles of 100 mL are used and filled with 30 ± 1 mg of dried sample. Samples are
heated up to 600oC with a heating rate of 10
oC / min in a nitrogen atmosphere.
3.2.4.2. Testing
A. The Compressive Strength Test
The compressive strength test of the concrete samples is determined at 7, and 28 days of
moisture curing as per ASTM C39. The test is carried out using a universal testing machine
SHIMADZU 1000 KN shown in figure 3.21. Table 3.14 shows data entry on the testing
machine. Figure 3.22 shows data on the machine's screen.
Table 3.14: Data entry on the testing machine for the compressive strength test
RATE 0.25 N/mm2/sec.
SPECIMEN DIMENSIONS 50*50 mm2
FORCE RANGE (KN) 0 ~ 150
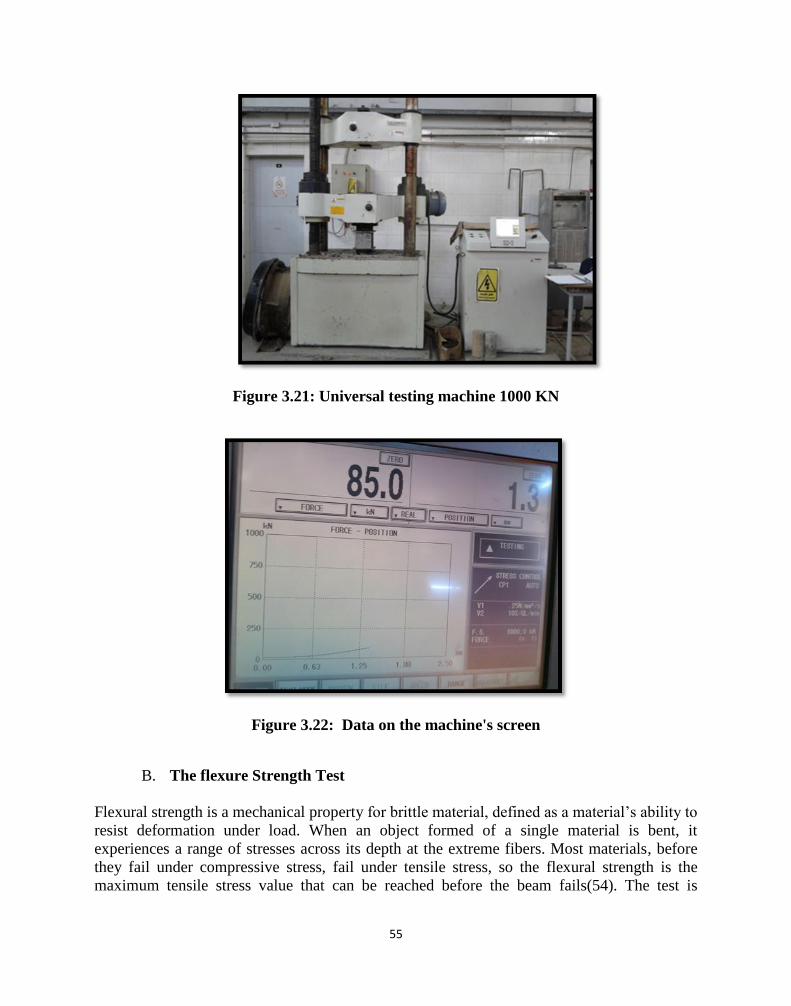
55
Figure 3.21: Universal testing machine 1000 KN
Figure 3.22: Data on the machine's screen
B. The flexure Strength Test
Flexural strength is a mechanical property forbrittlematerial,definedasamaterial’sabilityto
resist deformation under load. When an object formed of a single material is bent, it
experiences a range of stresses across its depth at the extreme fibers. Most materials, before
they fail under compressive stress, fail under tensile stress, so the flexural strength is the
maximum tensile stress value that can be reached before the beam fails(54). The test is
56
determined at 28 days of water curing as per ASTM C78. The test is carried out using a
universal testing machine SHIMADZU 1000 KN shown in figure 3.21. Table 3.15 shows data
entry on the testing machine. Figure 3.23 shows the flexure test using three points beam
method.
Table 3.15: Data entry on the testing machine for the flexure strength test
Figure 3.23: Flexure test using three points beam method
3.2.4.3. Analysis
Statistical experimental design is a more scientific and efficient approach for establishing an
optimized mixture for a given constraint, while minimizing the number of experimental data
points. the effects of studied parameters will be characterized and analyzed using ANOVA
and regression models, which can identify the primary factors and their interactions on the
measured properties. JMP SAS12 program is used to predict the full factorial and response
surface statistical models.
RATE 0.05 N/mm2/sec.
SPECIMEN DIMENSIONS 50*200 mm2
FORCE RANGE (KN) 0 ~ 10
57
Chapter 4 : Results and Discussion
4.1. Introduction
This chapter represents the outcome of the conducted experimental plan. the results will
be discussed and analyzed in order to find out the following:
Optimum dispersion method and time of Nano silica particles using the
proposed technique by applying either direct or indirect sonication energy.
Optimum dispersion method and time of carbon Nanotubes particles through
introducing a novel innovative technique that make use of both; chemical
properties of superplastecizer, and cavitational properties of sonicators ( Direct
and indirect) as well as homogenizer.
The coupled effect of well dispersed NS and CNT on the mechanical properties
of cement composites with different dosages.
Statistical and micro-structural analysis will be introduced in order to identify
the primary factors and their interactions on the measured properties. The
effects of studied parameters will be characterized and analyzed using the full
factorial and response surface statistical models.
4.2. Optimizing the dispersion of Nano silica and carbon
Nanotube (phase 1)
In this phase the effect of sonication methods and time were studied for the effective
dispersion of NS and CNT. The results were introduced using particle size distribution,
specific surface area, compressive and flexure strengths, SEM, TEM, TGA, XRD and
ANOVA statistical analysis.
4.2.1. Optimizing the type and time of sonication on the dispersion of
Nano silica
This step presented the effect of changing sonication time and method for the
dispersion of NS in the cement matrix. The results were introduced using particle size
distribution, specific surface area, compressive and flexure strengths, SEM, TEM, TGA
and XRD.
58
4.2.1.1. The effect of sonication type on the dispersion of NS (stage 1)
This stage presented the effect of changing sonication method either direct or indirect
for the dispersion of NS in the cement matrix. The results were introduced using
particle size distribution and specific surface area.
From the following figures (4.1-4.4);
The sonication time increased the sub-nanometric particle content to reach an
optimum value of 90% at 1 min and 3 min for direct sonication and indirect
sonication respectively instead of 70% for as received sample. While increasing
the indirect sonication time to 9 min decreased the sub-nanometric particle
content to 58%.
The optimum time of sonication for the direct and indirect sonication methods
were found to be 1 minute and 3 minutes respectively.
Increasing sonication time for both methods caused re-agglomeration for NS
particles.
The optimum specific surface area for direct sonication increased by 17% as
compared to as received sample.
Although The optimum specific surface area of the direct sonication method
was higher than that of the indirect method, as shown in figures (4.5-4.6). the
indirect sonication method was chosen as the optimum method for the reason
that the slight increase in the direct sonication time (from 1min to 3 min),
significantly affected the dispersion of the ns particles, while for the indirect
sonication the slight increase in time (from 3min to 6 min), showed less effect
on the NS dispersion as it can be noticed from the specific surface area results.
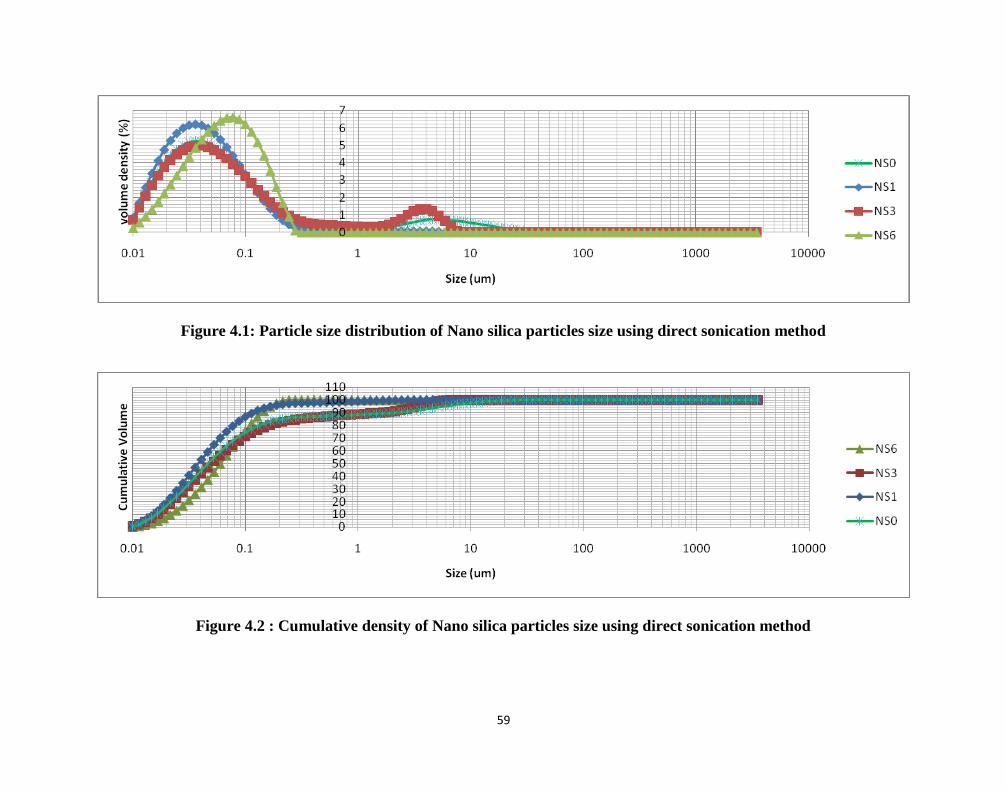
59
Figure 4.1: Particle size distribution of Nano silica particles size using direct sonication method
Figure 4.2 : Cumulative density of Nano silica particles size using direct sonication method
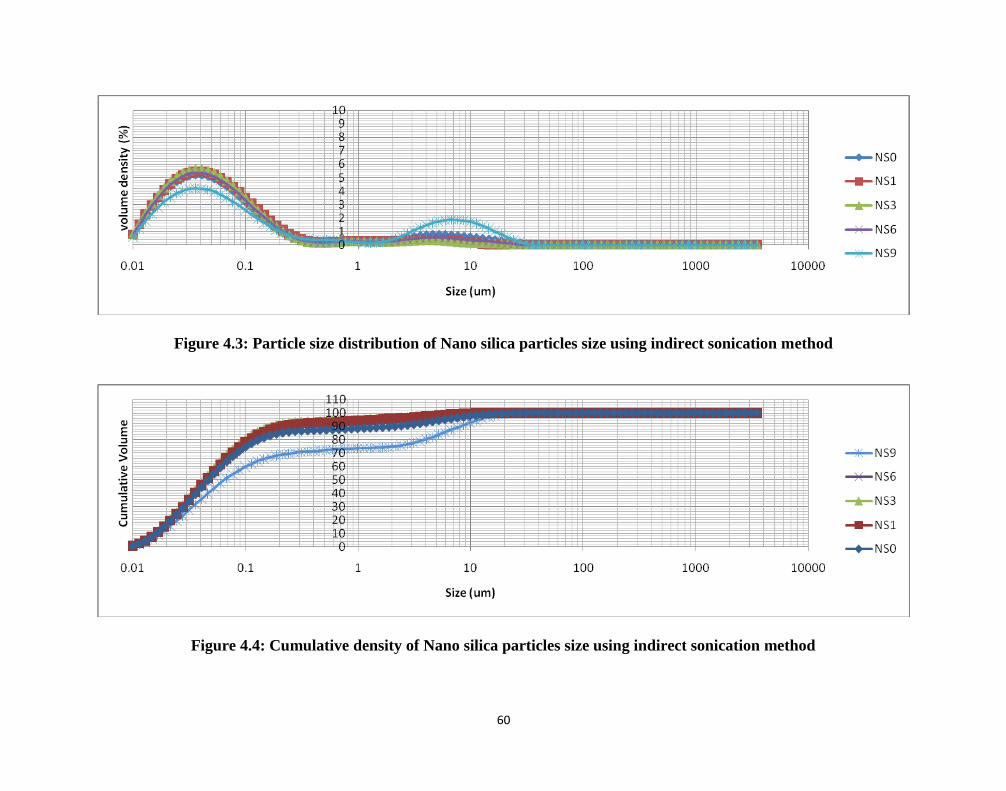
61
Figure 4.3: Particle size distribution of Nano silica particles size using indirect sonication method
Figure 4.4: Cumulative density of Nano silica particles size using indirect sonication method
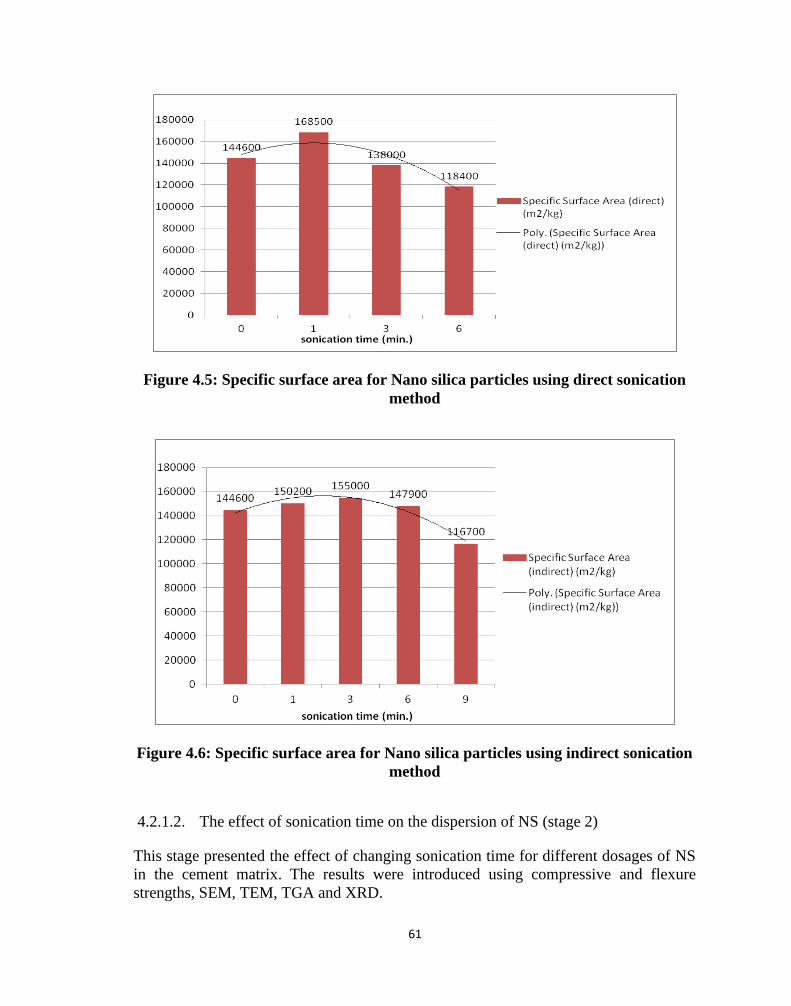
61
Figure 4.5: Specific surface area for Nano silica particles using direct sonication
method
Figure 4.6: Specific surface area for Nano silica particles using indirect sonication
method
4.2.1.2. The effect of sonication time on the dispersion of NS (stage 2)
This stage presented the effect of changing sonication time for different dosages of NS
in the cement matrix. The results were introduced using compressive and flexure
strengths, SEM, TEM, TGA and XRD.
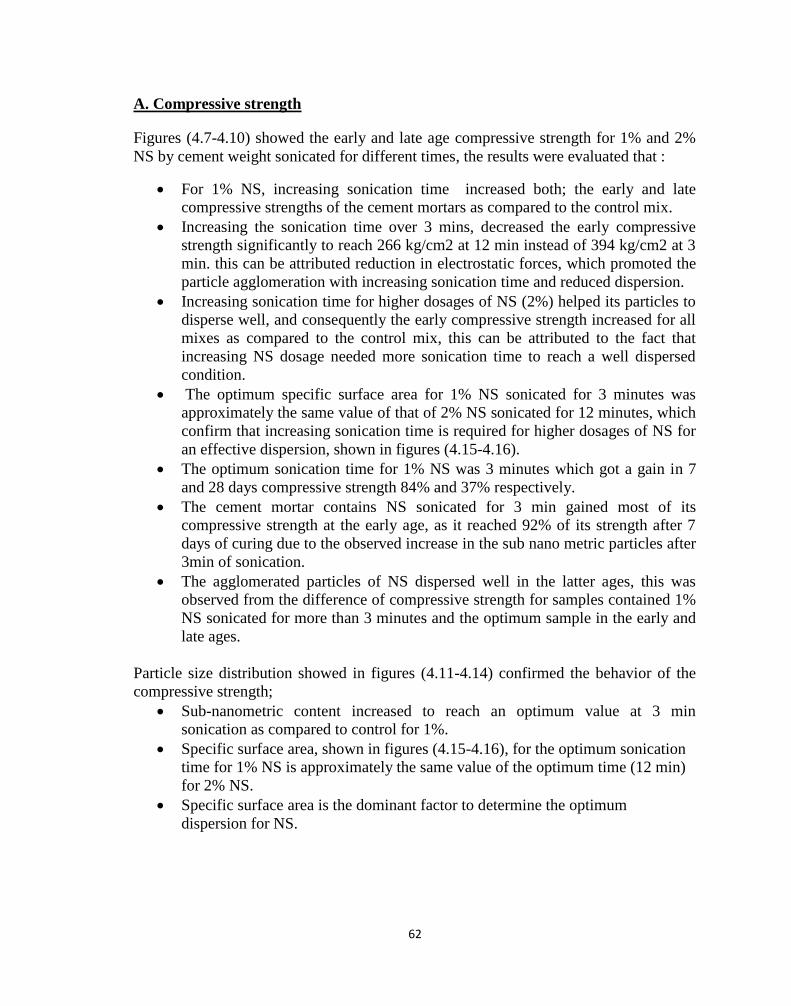
62
A. Compressive strength
Figures (4.7-4.10) showed the early and late age compressive strength for 1% and 2%
NS by cement weight sonicated for different times, the results were evaluated that :
For 1% NS, increasing sonication time increased both; the early and late
compressive strengths of the cement mortars as compared to the control mix.
Increasing the sonication time over 3 mins, decreased the early compressive
strength significantly to reach 266 kg/cm2 at 12 min instead of 394 kg/cm2 at 3
min. this can be attributed reduction in electrostatic forces, which promoted the
particle agglomeration with increasing sonication time and reduced dispersion.
Increasing sonication time for higher dosages of NS (2%) helped its particles to
disperse well, and consequently the early compressive strength increased for all
mixes as compared to the control mix, this can be attributed to the fact that
increasing NS dosage needed more sonication time to reach a well dispersed
condition.
The optimum specific surface area for 1% NS sonicated for 3 minutes was
approximately the same value of that of 2% NS sonicated for 12 minutes, which
confirm that increasing sonication time is required for higher dosages of NS for
an effective dispersion, shown in figures (4.15-4.16).
The optimum sonication time for 1% NS was 3 minutes which got a gain in 7
and 28 days compressive strength 84% and 37% respectively.
The cement mortar contains NS sonicated for 3 min gained most of its
compressive strength at the early age, as it reached 92% of its strength after 7
days of curing due to the observed increase in the sub nano metric particles after
3min of sonication.
The agglomerated particles of NS dispersed well in the latter ages, this was
observed from the difference of compressive strength for samples contained 1%
NS sonicated for more than 3 minutes and the optimum sample in the early and
late ages.
Particle size distribution showed in figures (4.11-4.14) confirmed the behavior of the
compressive strength;
Sub-nanometric content increased to reach an optimum value at 3 min
sonication as compared to control for 1%.
Specific surface area, shown in figures (4.15-4.16), for the optimum sonication
time for 1% NS is approximately the same value of the optimum time (12 min)
for 2% NS.
Specific surface area is the dominant factor to determine the optimum
dispersion for NS.
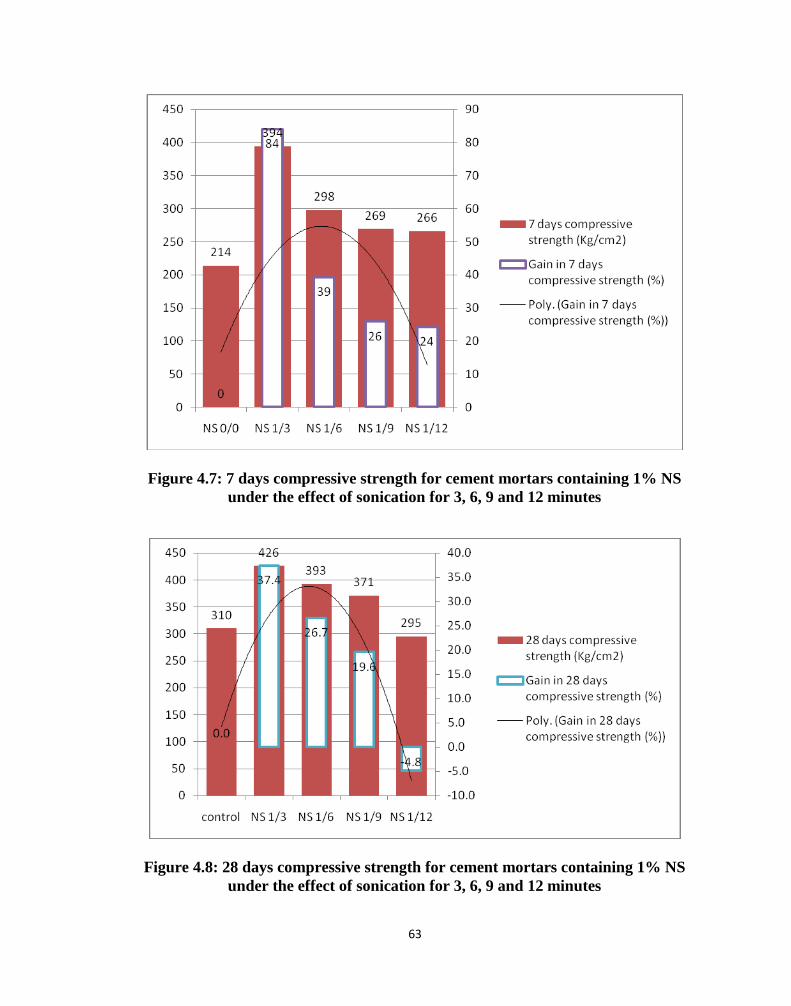
63
Figure 4.7: 7 days compressive strength for cement mortars containing 1% NS
under the effect of sonication for 3, 6, 9 and 12 minutes
Figure 4.8: 28 days compressive strength for cement mortars containing 1% NS
under the effect of sonication for 3, 6, 9 and 12 minutes
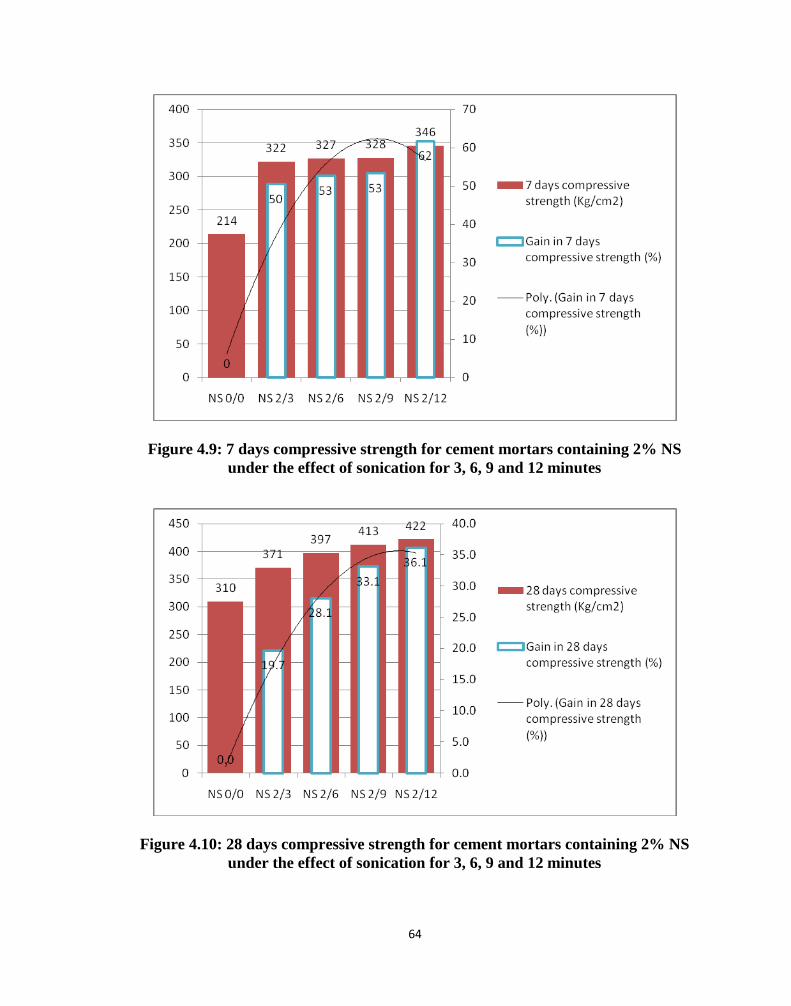
64
Figure 4.9: 7 days compressive strength for cement mortars containing 2% NS
under the effect of sonication for 3, 6, 9 and 12 minutes
Figure 4.10: 28 days compressive strength for cement mortars containing 2% NS
under the effect of sonication for 3, 6, 9 and 12 minutes
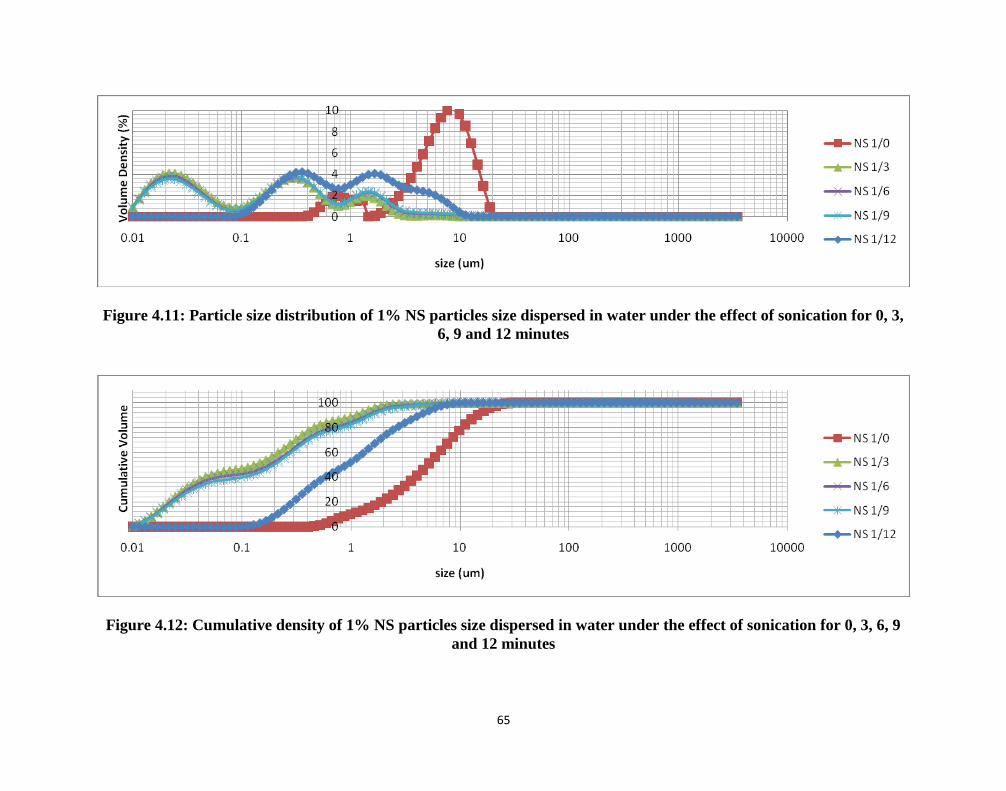
65
Figure 4.11: Particle size distribution of 1% NS particles size dispersed in water under the effect of sonication for 0, 3,
6, 9 and 12 minutes
Figure 4.12: Cumulative density of 1% NS particles size dispersed in water under the effect of sonication for 0, 3, 6, 9
and 12 minutes
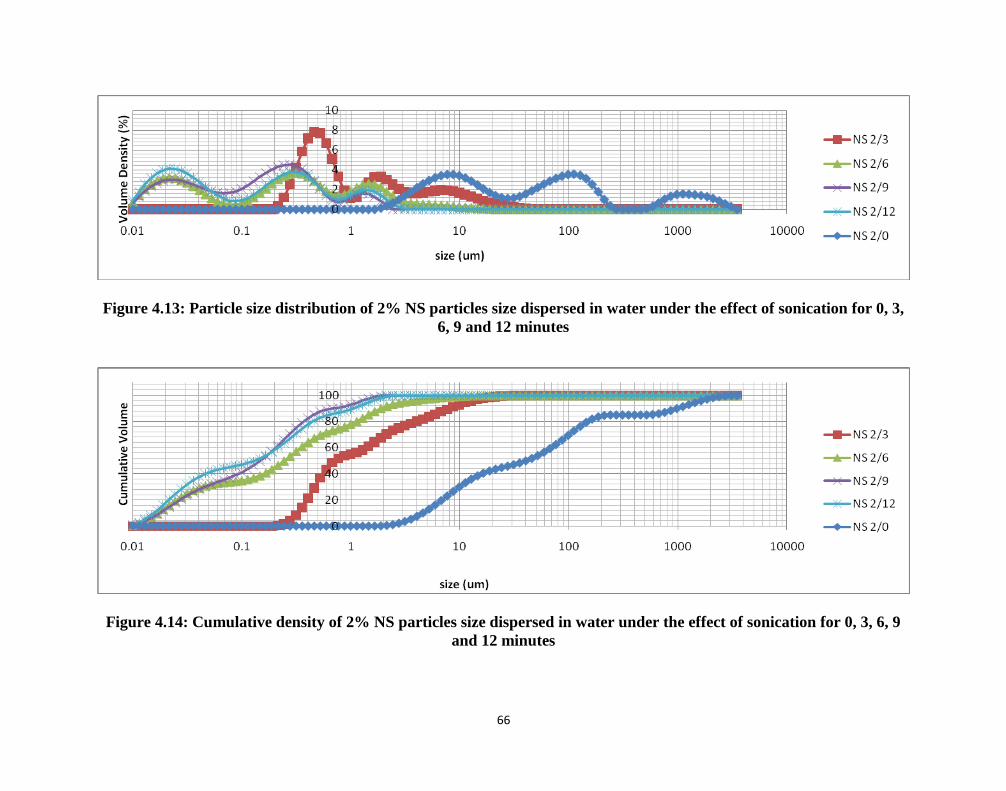
66
Figure 4.13: Particle size distribution of 2% NS particles size dispersed in water under the effect of sonication for 0, 3,
6, 9 and 12 minutes
Figure 4.14: Cumulative density of 2% NS particles size dispersed in water under the effect of sonication for 0, 3, 6, 9
and 12 minutes
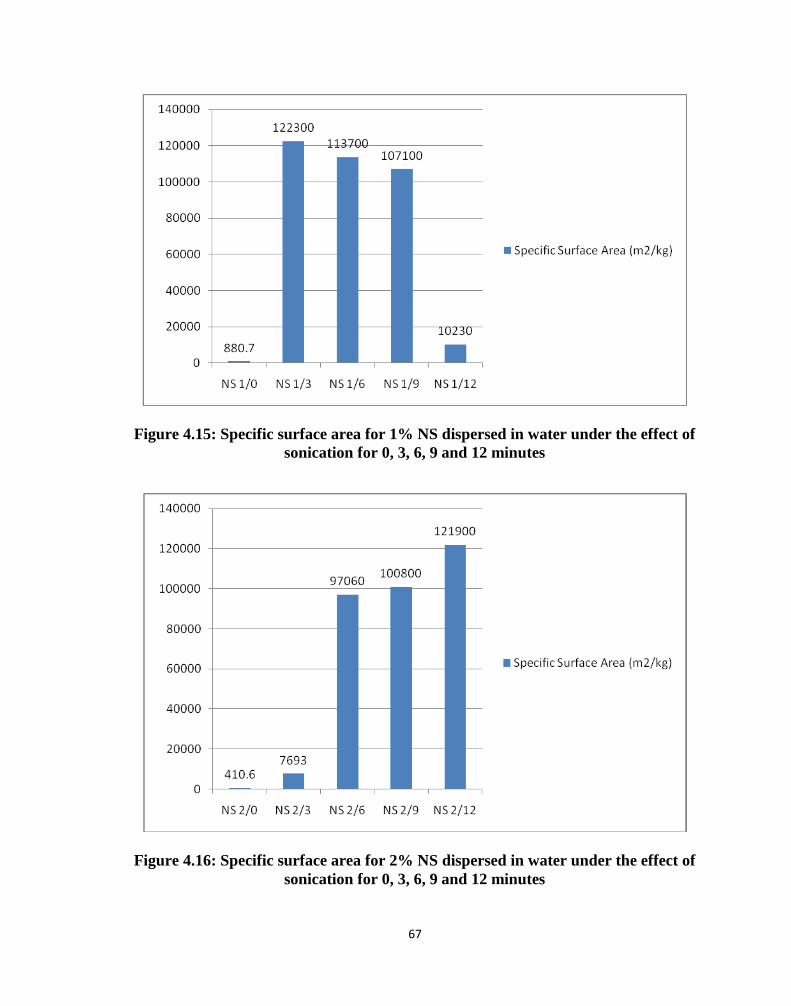
67
Figure 4.15: Specific surface area for 1% NS dispersed in water under the effect of
sonication for 0, 3, 6, 9 and 12 minutes
Figure 4.16: Specific surface area for 2% NS dispersed in water under the effect of
sonication for 0, 3, 6, 9 and 12 minutes
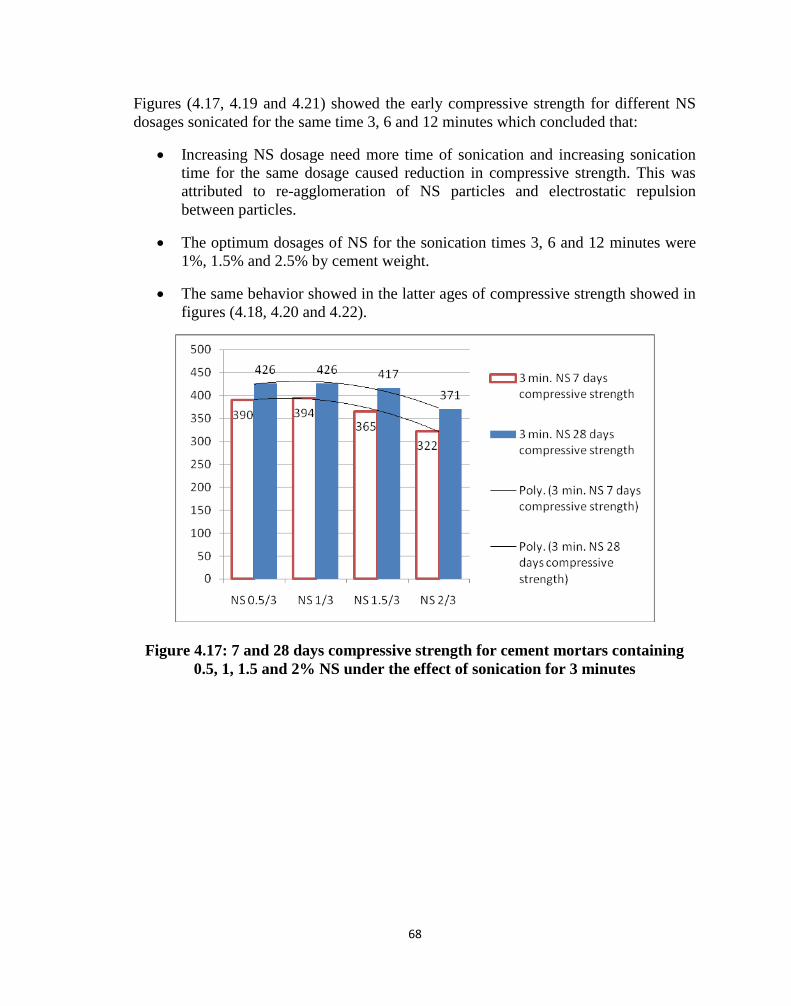
68
Figures (4.17, 4.19 and 4.21) showed the early compressive strength for different NS
dosages sonicated for the same time 3, 6 and 12 minutes which concluded that:
Increasing NS dosage need more time of sonication and increasing sonication
time for the same dosage caused reduction in compressive strength. This was
attributed to re-agglomeration of NS particles and electrostatic repulsion
between particles.
The optimum dosages of NS for the sonication times 3, 6 and 12 minutes were
1%, 1.5% and 2.5% by cement weight.
The same behavior showed in the latter ages of compressive strength showed in
figures (4.18, 4.20 and 4.22).
Figure 4.17: 7 and 28 days compressive strength for cement mortars containing
0.5, 1, 1.5 and 2% NS under the effect of sonication for 3 minutes
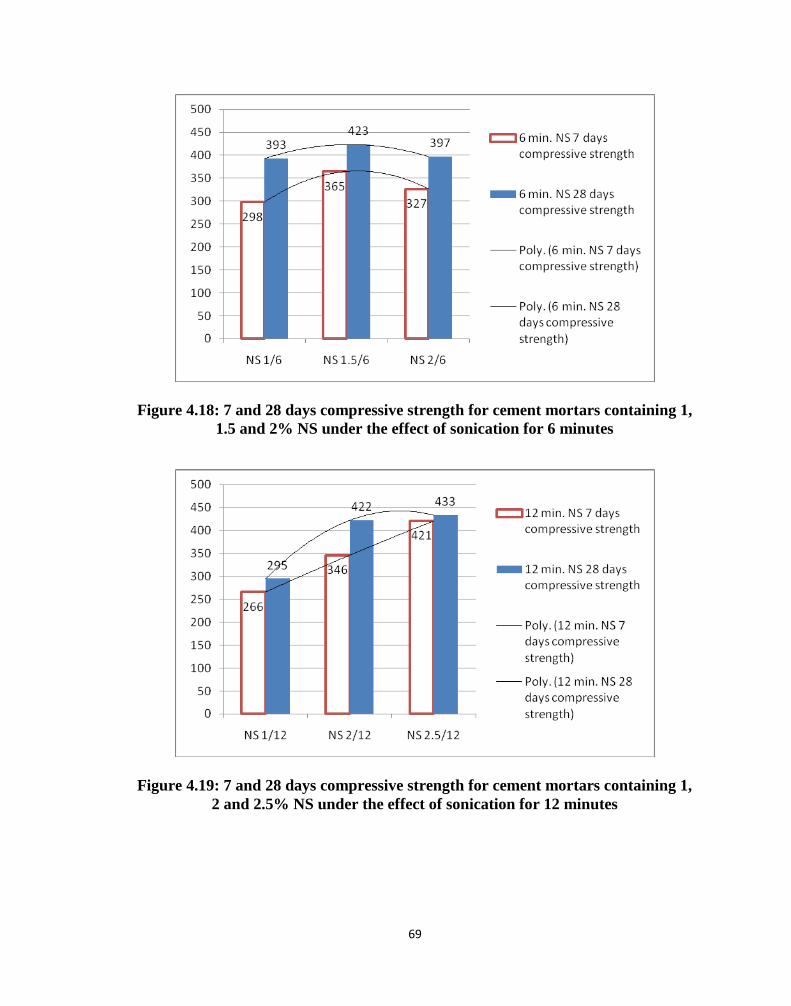
69
Figure 4.18: 7 and 28 days compressive strength for cement mortars containing 1,
1.5 and 2% NS under the effect of sonication for 6 minutes
Figure 4.19: 7 and 28 days compressive strength for cement mortars containing 1,
2 and 2.5% NS under the effect of sonication for 12 minutes
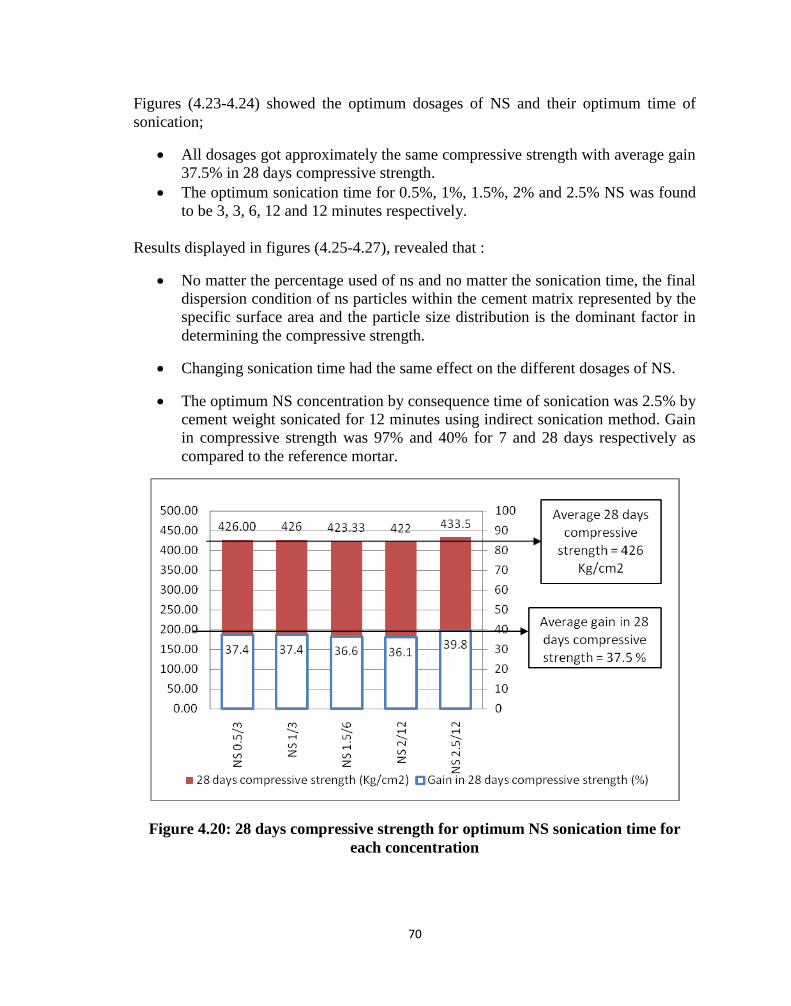
71
Figures (4.23-4.24) showed the optimum dosages of NS and their optimum time of
sonication;
All dosages got approximately the same compressive strength with average gain
37.5% in 28 days compressive strength.
The optimum sonication time for 0.5%, 1%, 1.5%, 2% and 2.5% NS was found
to be 3, 3, 6, 12 and 12 minutes respectively.
Results displayed in figures (4.25-4.27), revealed that :
No matter the percentage used of ns and no matter the sonication time, the final
dispersion condition of ns particles within the cement matrix represented by the
specific surface area and the particle size distribution is the dominant factor in
determining the compressive strength.
Changing sonication time had the same effect on the different dosages of NS.
The optimum NS concentration by consequence time of sonication was 2.5% by
cement weight sonicated for 12 minutes using indirect sonication method. Gain
in compressive strength was 97% and 40% for 7 and 28 days respectively as
compared to the reference mortar.
Figure 4.20: 28 days compressive strength for optimum NS sonication time for
each concentration
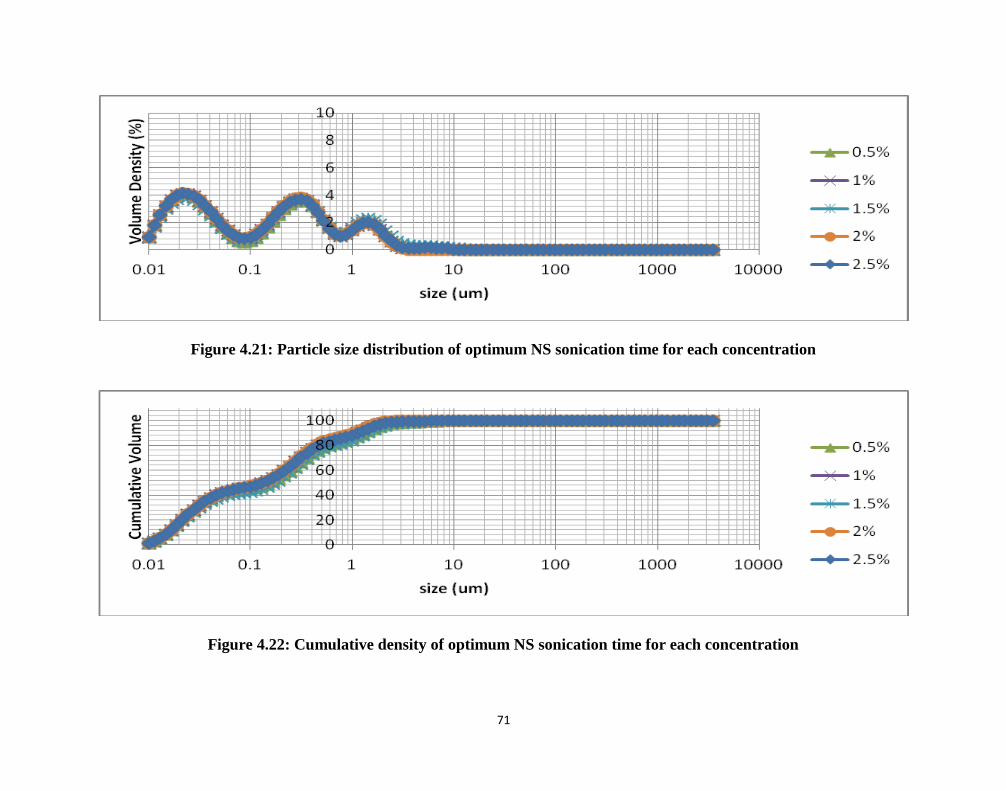
71
Figure 4.21: Particle size distribution of optimum NS sonication time for each concentration
Figure 4.22: Cumulative density of optimum NS sonication time for each concentration
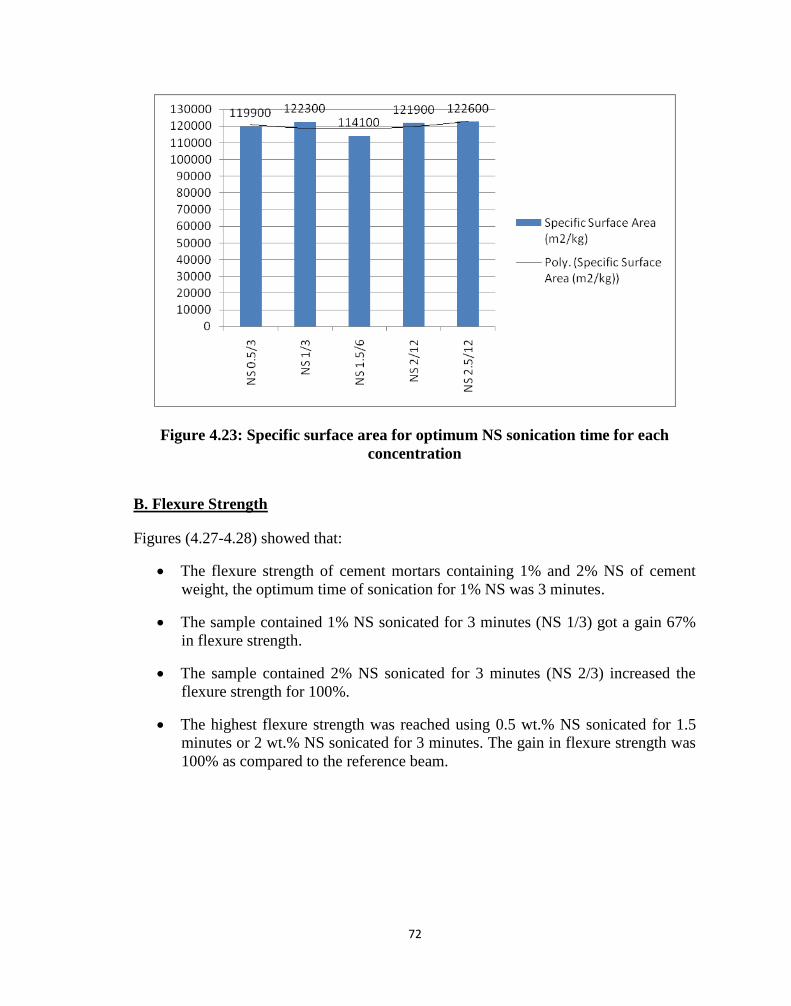
72
Figure 4.23: Specific surface area for optimum NS sonication time for each
concentration
B. Flexure Strength
Figures (4.27-4.28) showed that:
The flexure strength of cement mortars containing 1% and 2% NS of cement
weight, the optimum time of sonication for 1% NS was 3 minutes.
The sample contained 1% NS sonicated for 3 minutes (NS 1/3) got a gain 67%
in flexure strength.
The sample contained 2% NS sonicated for 3 minutes (NS 2/3) increased the
flexure strength for 100%.
The highest flexure strength was reached using 0.5 wt.% NS sonicated for 1.5
minutes or 2 wt.% NS sonicated for 3 minutes. The gain in flexure strength was
100% as compared to the reference beam.
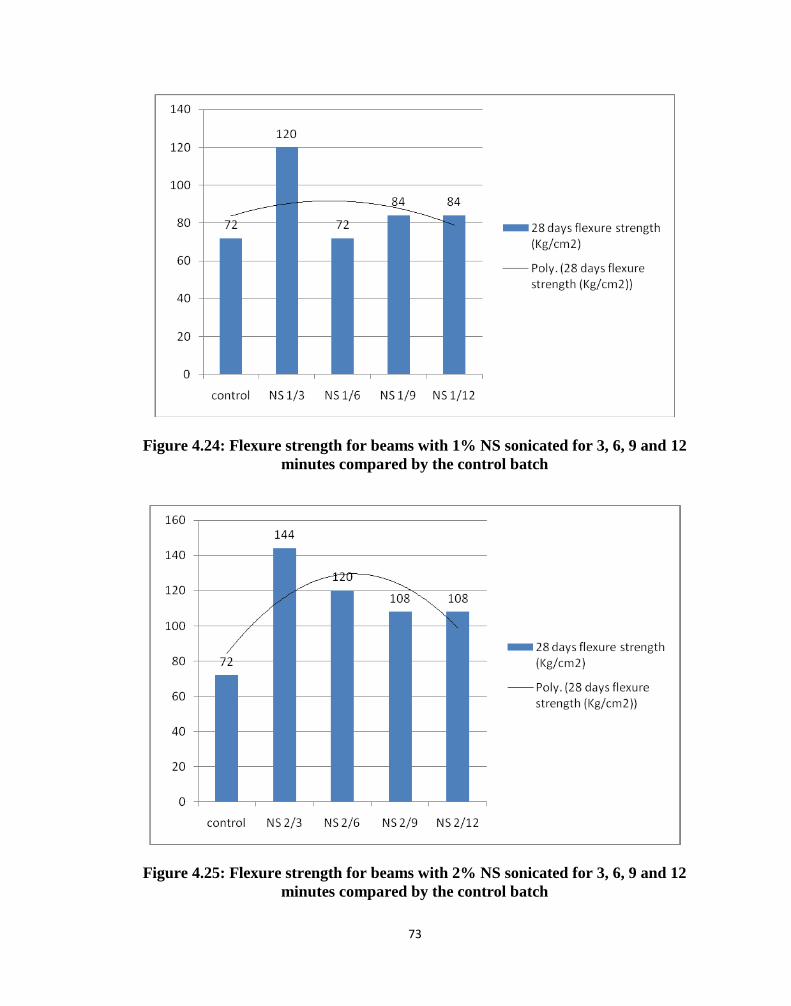
73
Figure 4.24: Flexure strength for beams with 1% NS sonicated for 3, 6, 9 and 12
minutes compared by the control batch
Figure 4.25: Flexure strength for beams with 2% NS sonicated for 3, 6, 9 and 12
minutes compared by the control batch
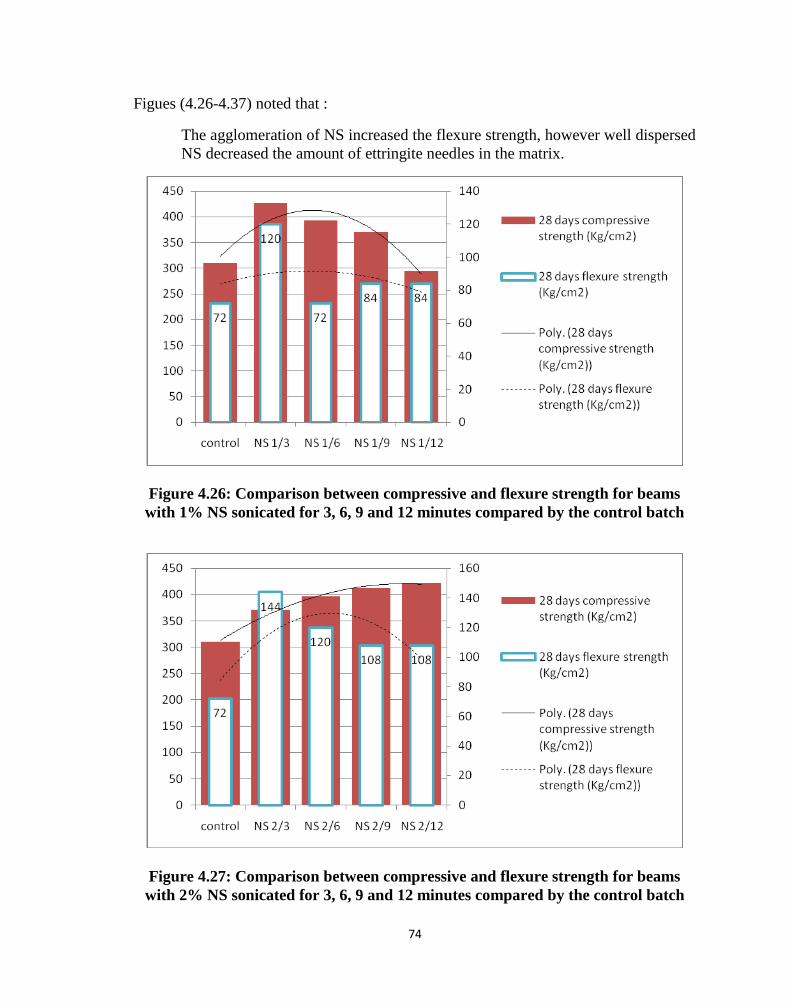
74
Figues (4.26-4.37) noted that :
The agglomeration of NS increased the flexure strength, however well dispersed
NS decreased the amount of ettringite needles in the matrix.
Figure 4.26: Comparison between compressive and flexure strength for beams
with 1% NS sonicated for 3, 6, 9 and 12 minutes compared by the control batch
Figure 4.27: Comparison between compressive and flexure strength for beams
with 2% NS sonicated for 3, 6, 9 and 12 minutes compared by the control batch
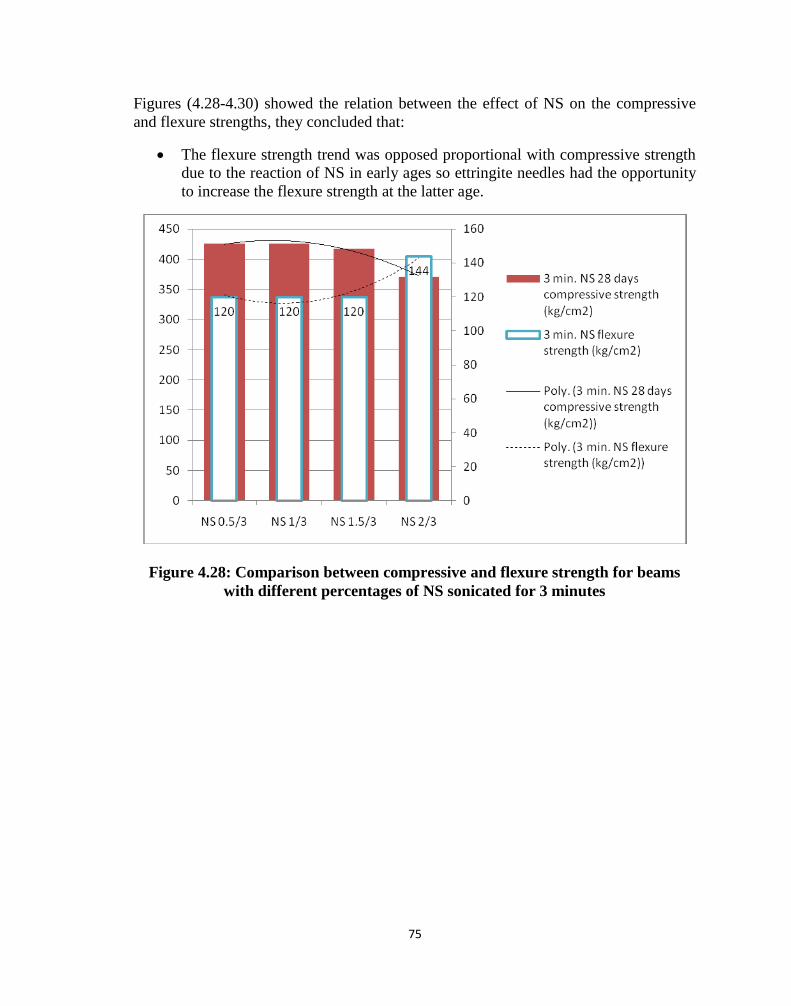
75
Figures (4.28-4.30) showed the relation between the effect of NS on the compressive
and flexure strengths, they concluded that:
The flexure strength trend was opposed proportional with compressive strength
due to the reaction of NS in early ages so ettringite needles had the opportunity
to increase the flexure strength at the latter age.
Figure 4.28: Comparison between compressive and flexure strength for beams
with different percentages of NS sonicated for 3 minutes
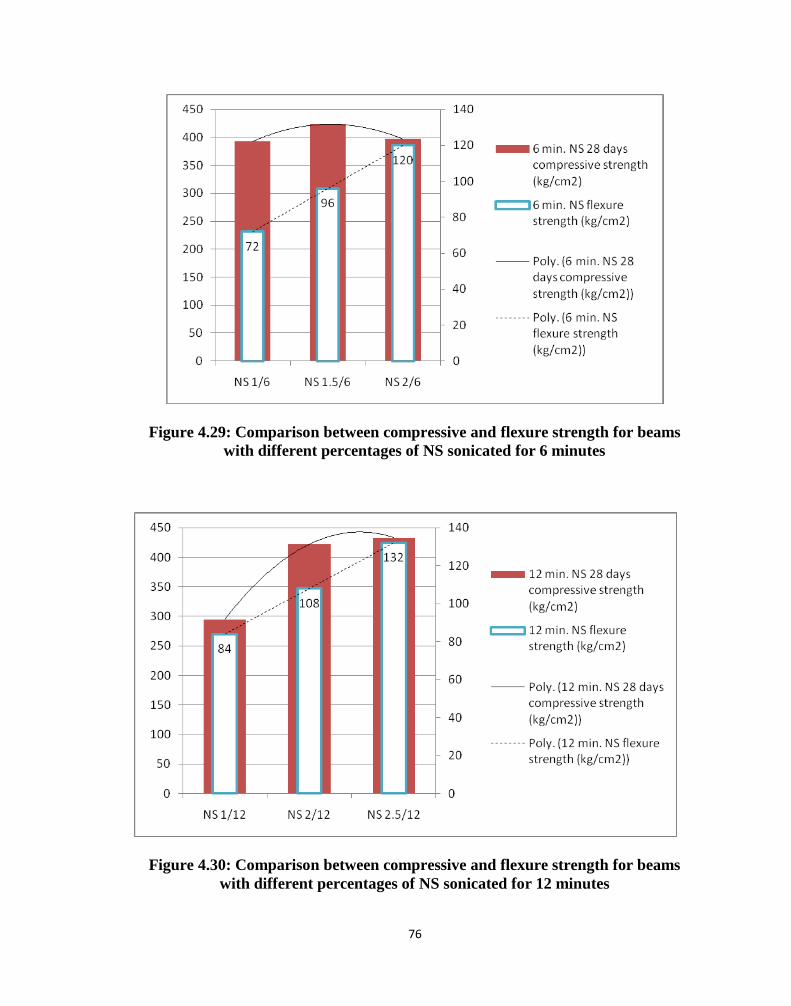
76
Figure 4.29: Comparison between compressive and flexure strength for beams
with different percentages of NS sonicated for 6 minutes
Figure 4.30: Comparison between compressive and flexure strength for beams
with different percentages of NS sonicated for 12 minutes
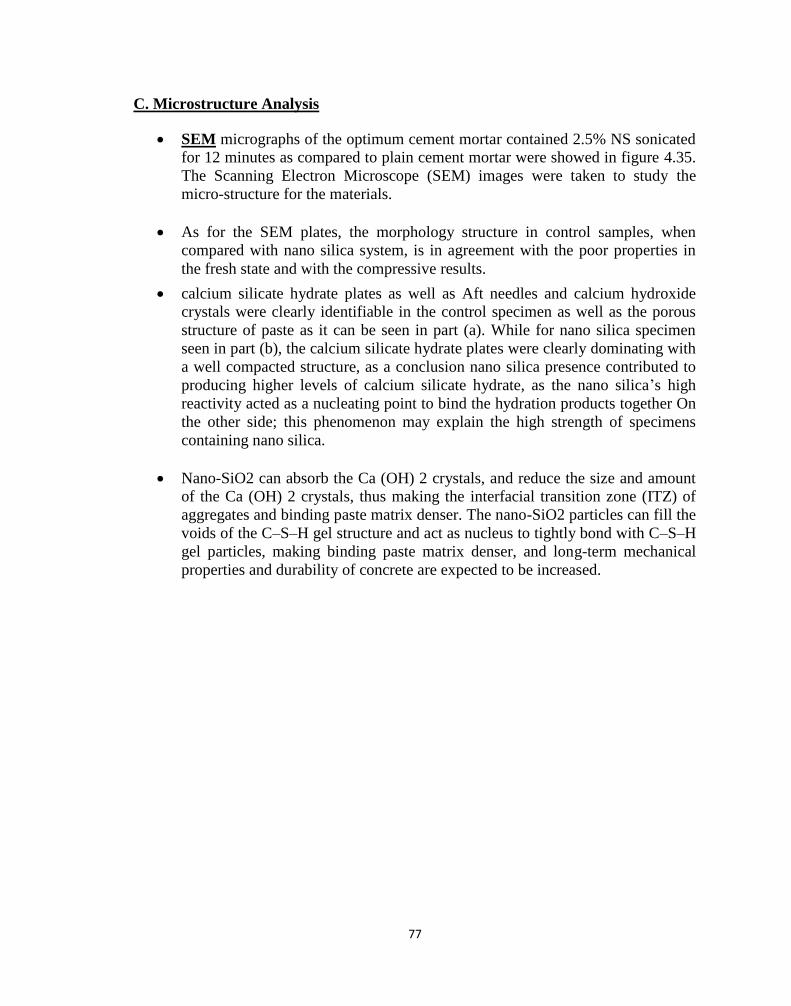
77
C. Microstructure Analysis
SEM micrographs of the optimum cement mortar contained 2.5% NS sonicated
for 12 minutes as compared to plain cement mortar were showed in figure 4.35.
The Scanning Electron Microscope (SEM) images were taken to study the
micro-structure for the materials.
As for the SEM plates, the morphology structure in control samples, when
compared with nano silica system, is in agreement with the poor properties in
the fresh state and with the compressive results.
calcium silicate hydrate plates as well as Aft needles and calcium hydroxide
crystals were clearly identifiable in the control specimen as well as the porous
structure of paste as it can be seen in part (a). While for nano silica specimen
seen in part (b), the calcium silicate hydrate plates were clearly dominating with
a well compacted structure, as a conclusion nano silica presence contributed to
producing higher levels of calcium silicate hydrate, as the nano silica’s high
reactivity acted as a nucleating point to bind the hydration products together On
the other side; this phenomenon may explain the high strength of specimens
containing nano silica.
Nano-SiO2 can absorb the Ca (OH) 2 crystals, and reduce the size and amount
of the Ca (OH) 2 crystals, thus making the interfacial transition zone (ITZ) of
aggregates and binding paste matrix denser. The nano-SiO2 particles can fill the
voids of the C–S–H gel structure and act as nucleus to tightly bond with C–S–H
gel particles, making binding paste matrix denser, and long-term mechanical
properties and durability of concrete are expected to be increased.
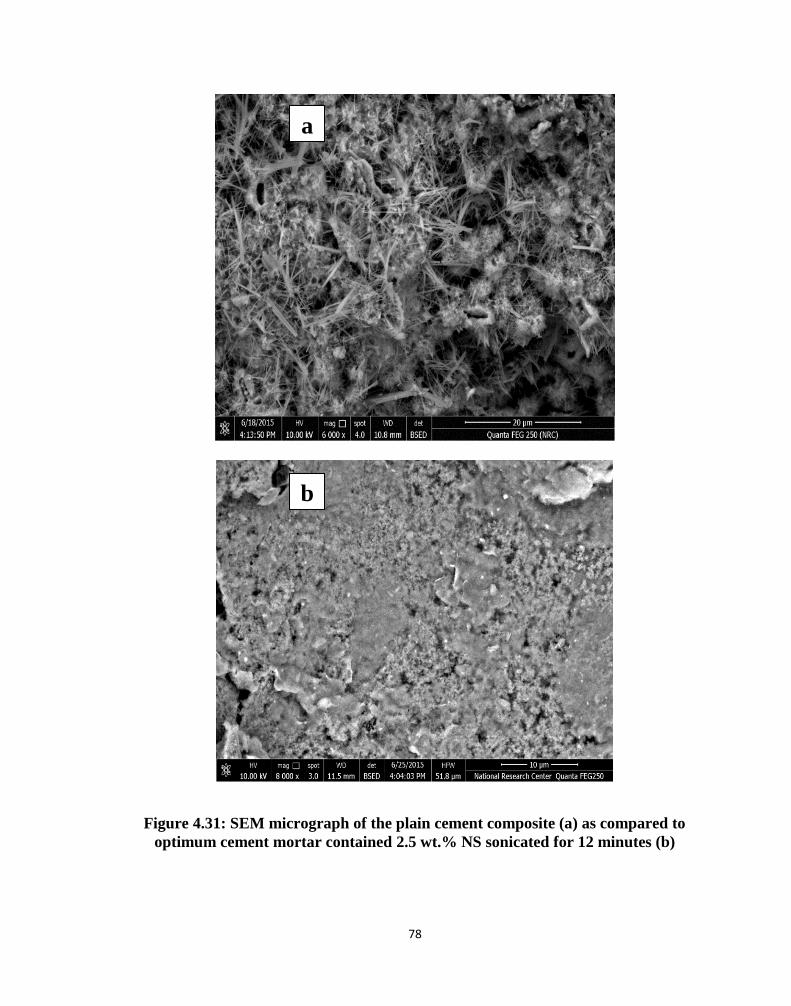
78
Figure 4.31: SEM micrograph of the plain cement composite (a) as compared to
optimum cement mortar contained 2.5 wt.% NS sonicated for 12 minutes (b)
a
b
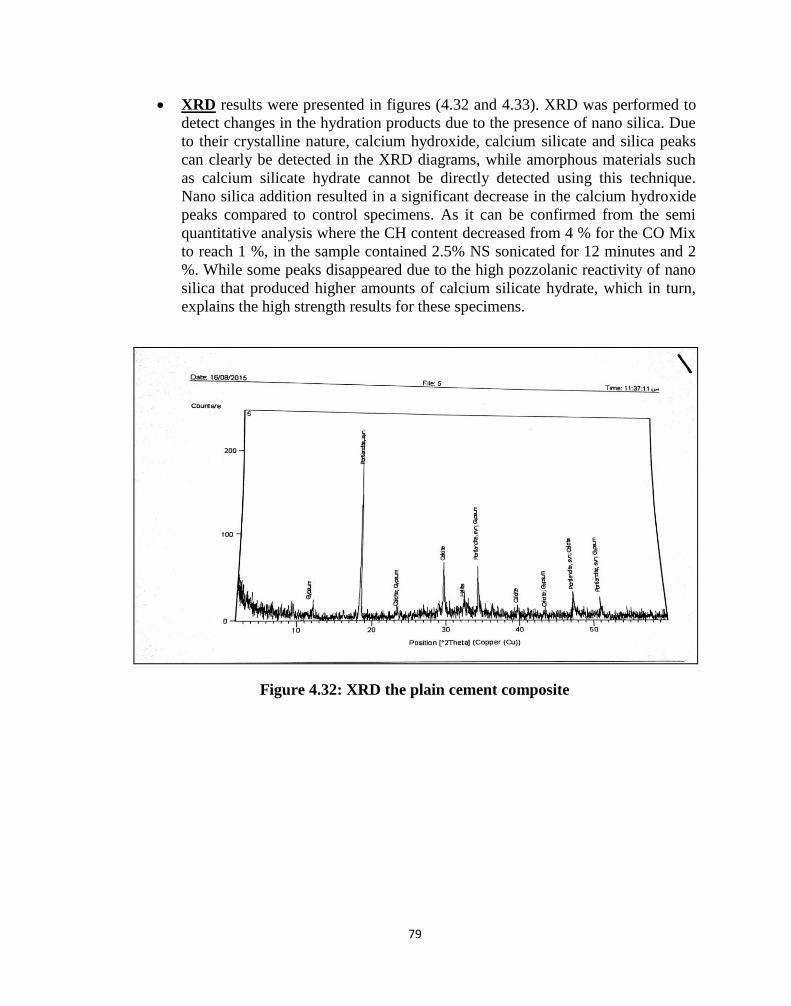
79
XRD results were presented in figures (4.32 and 4.33). XRD was performed to
detect changes in the hydration products due to the presence of nano silica. Due
to their crystalline nature, calcium hydroxide, calcium silicate and silica peaks
can clearly be detected in the XRD diagrams, while amorphous materials such
as calcium silicate hydrate cannot be directly detected using this technique.
Nano silica addition resulted in a significant decrease in the calcium hydroxide
peaks compared to control specimens. As it can be confirmed from the semi
quantitative analysis where the CH content decreased from 4 % for the CO Mix
to reach 1 %, in the sample contained 2.5% NS sonicated for 12 minutes and 2
%. While some peaks disappeared due to the high pozzolanic reactivity of nano
silica that produced higher amounts of calcium silicate hydrate, which in turn,
explains the high strength results for these specimens.
Figure 4.32: XRD the plain cement composite
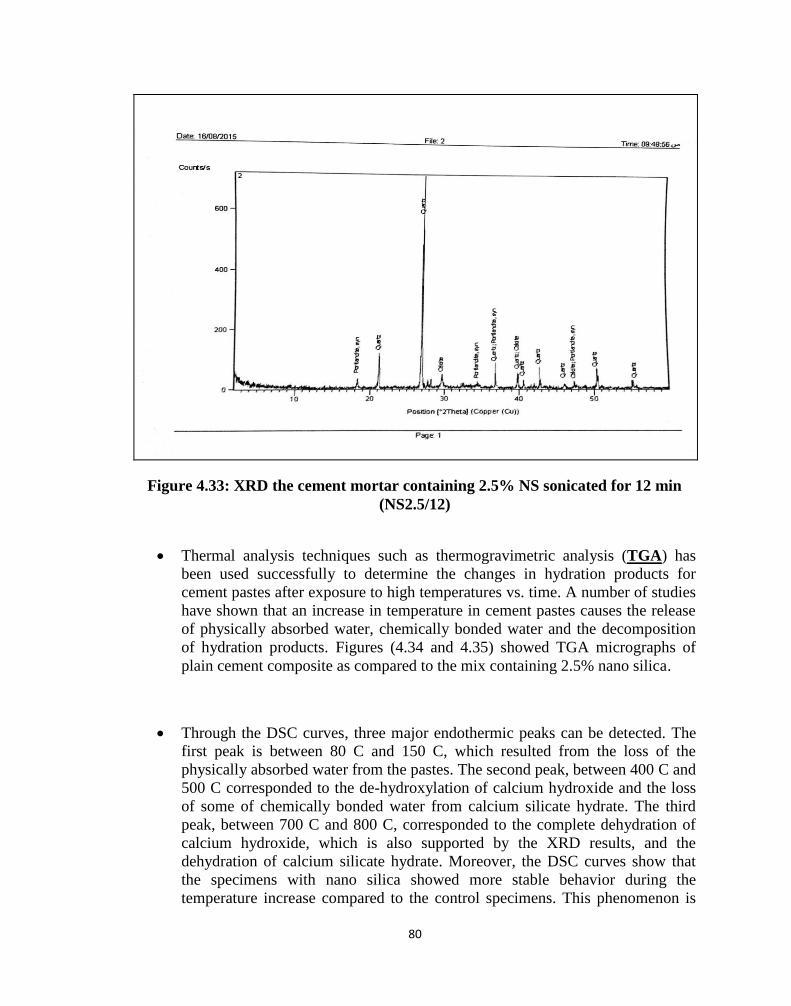
81
Figure 4.33: XRD the cement mortar containing 2.5% NS sonicated for 12 min
(NS2.5/12)
Thermal analysis techniques such as thermogravimetric analysis (TGA) has
been used successfully to determine the changes in hydration products for
cement pastes after exposure to high temperatures vs. time. A number of studies
have shown that an increase in temperature in cement pastes causes the release
of physically absorbed water, chemically bonded water and the decomposition
of hydration products. Figures (4.34 and 4.35) showed TGA micrographs of
plain cement composite as compared to the mix containing 2.5% nano silica.
Through the DSC curves, three major endothermic peaks can be detected. The
first peak is between 80 C and 150 C, which resulted from the loss of the
physically absorbed water from the pastes. The second peak, between 400 C and
500 C corresponded to the de-hydroxylation of calcium hydroxide and the loss
of some of chemically bonded water from calcium silicate hydrate. The third
peak, between 700 C and 800 C, corresponded to the complete dehydration of
calcium hydroxide, which is also supported by the XRD results, and the
dehydration of calcium silicate hydrate. Moreover, the DSC curves show that
the specimens with nano silica showed more stable behavior during the
temperature increase compared to the control specimens. This phenomenon is
81
most likely due to the high amount of high-density calcium silicate hydrate in
these specimens that was not affected by high temperature exposure.
The same figures show the results of thermogravimetric analysis, which
represents the change in mass for the specimens before and after exposure to
high temperatures from 30 C to 900 C. Three main mass losses were observed at
150 C, 450 C and 750 C in the specimens. The specimens showed a dramatic
increase in mass loss starting at approximately 650 C. This result can be
accounted as a confliction point for the disintegration of the hydration products,
which explains the radical decrease in strength for specimens exposed to higher
temperature.
The loss in weight observed for the control Mix from 30 to 400 (13%) was
much higher than the mix containing nano silica (2%), this can be attributed to
the larger amount of CH in the control mix as compared to the mixes containing
nano silica. This is in good agreement with the compressive strength results.
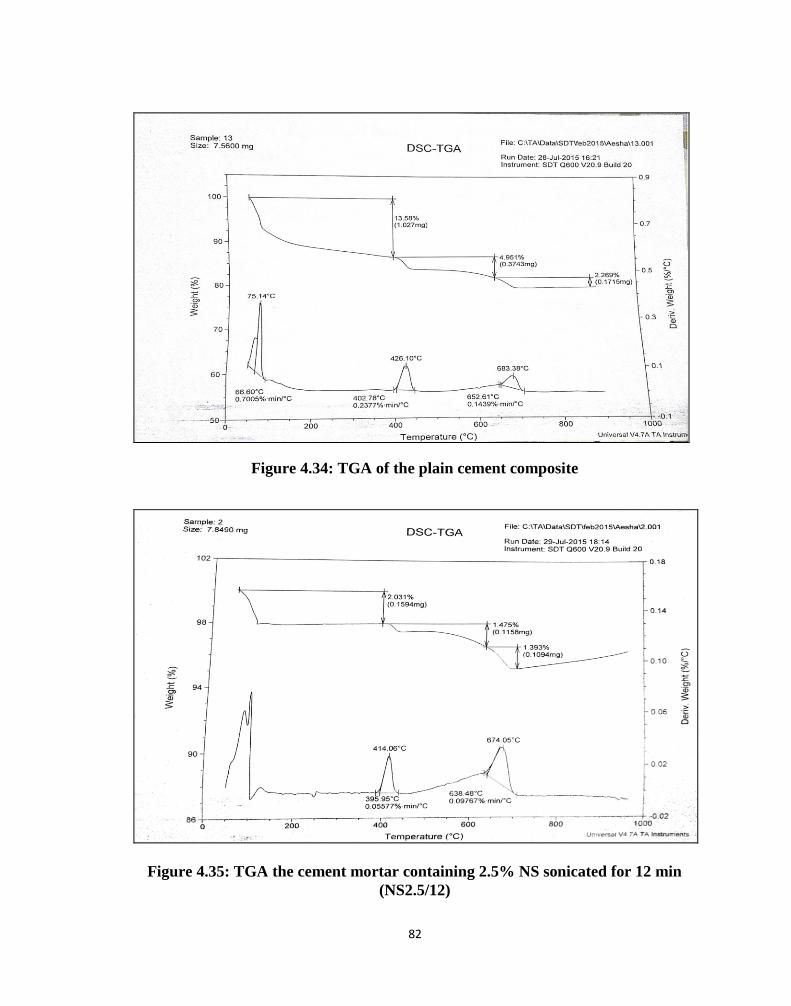
82
Figure 4.34: TGA of the plain cement composite
Figure 4.35: TGA the cement mortar containing 2.5% NS sonicated for 12 min
(NS2.5/12)
83
4.2.2. Optimizing the type and time of sonication on the dispersion of
CNT
The following part aims to reach an optimum dispersion level of CNT through the
introduction of different techniques including sonicators and homogenizers. The
dispersion level was evaluated through; particle size distribution, specific surface area,
cements pastes compressive strength, SEM, TEM and ANOVA statistical analysis. In
addition a comparison occurred between the properties of two types of CNT, imported
and locally produced.
4.2.2.1. The effect of sonication type on the dispersion of CNT (stage 1)
In this stage the effect of sonication type either; direct or indirect on the dispersion of
CNT was investigated through PSD and their specific surface area.
Particle size distribution represented in figures (4.36and 4.37) showed the following:
The application of either the direct or the indirect sonication methods enhanced
the dispersion of the CNT particles significantly.
No matter the time of application was, the dispersion of the CNT particles was
affected significantly by applying either of the sonication types.
As for the direct sonication; increasing the time of application increased the
dispersion level. the agglomerates size (D50) decreased significantly to reach
less than 25 micrometers after 3 min of application instead of the 100
micrometers of the as received CNT.
While for the indirect sonication; increasing the time of application increased
the dispersion level. the agglomerates size (D50) decreased significantly to
reach less than 20 micrometers after 6 min of application instead of the 100
micrometers of the as received CNT.
Increasing direct sonication time over 3 min caused re-agglomeration for CNT
particles. the agglomerates size (D50) increased to reach about 30 micrometers
after 9 min of application instead of the 25 micrometers reached after 3 min.
Increasing indirect sonication time over 6 min caused re-agglomeration for CNT
particles. the agglomerates size (D50) increased to reach about 25 micrometers
after 9 min of application instead of 20 micrometers after 6 min.
The optimum sonication time using direct and indirect sonication for CNT
dispersion was found to be 3 and 6 minutes respectively.
For 3 minutes sonication in both methods, the agglomerates size (DV50)
reached 25 um
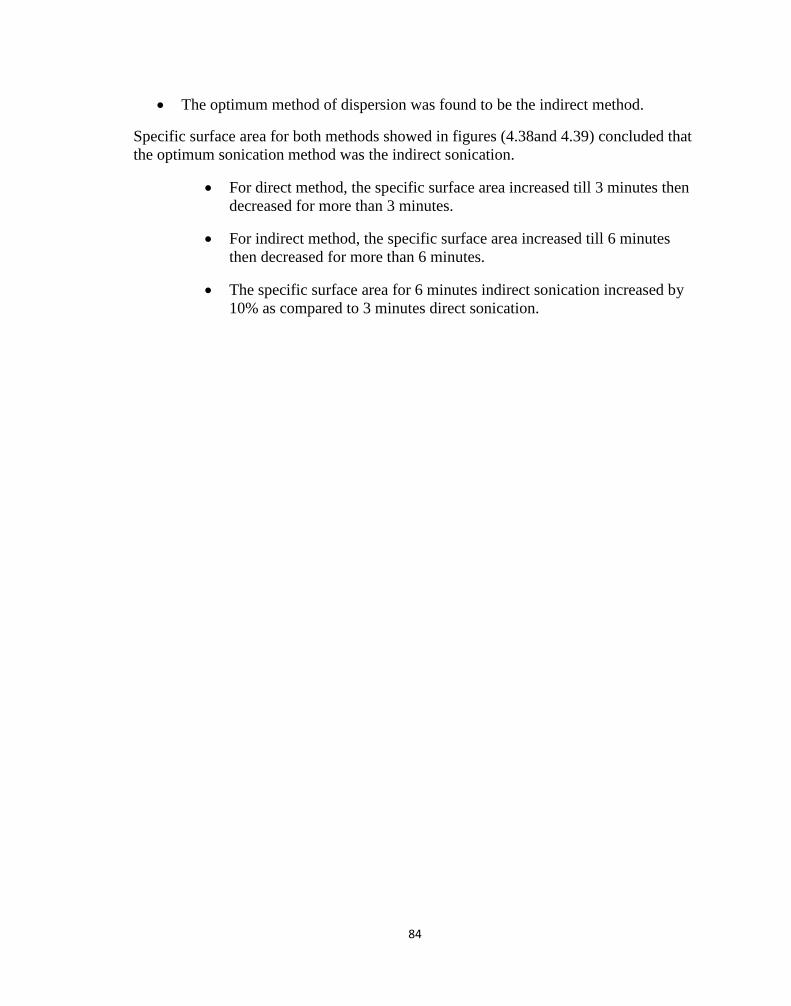
84
The optimum method of dispersion was found to be the indirect method.
Specific surface area for both methods showed in figures (4.38and 4.39) concluded that
the optimum sonication method was the indirect sonication.
For direct method, the specific surface area increased till 3 minutes then
decreased for more than 3 minutes.
For indirect method, the specific surface area increased till 6 minutes
then decreased for more than 6 minutes.
The specific surface area for 6 minutes indirect sonication increased by
10% as compared to 3 minutes direct sonication.
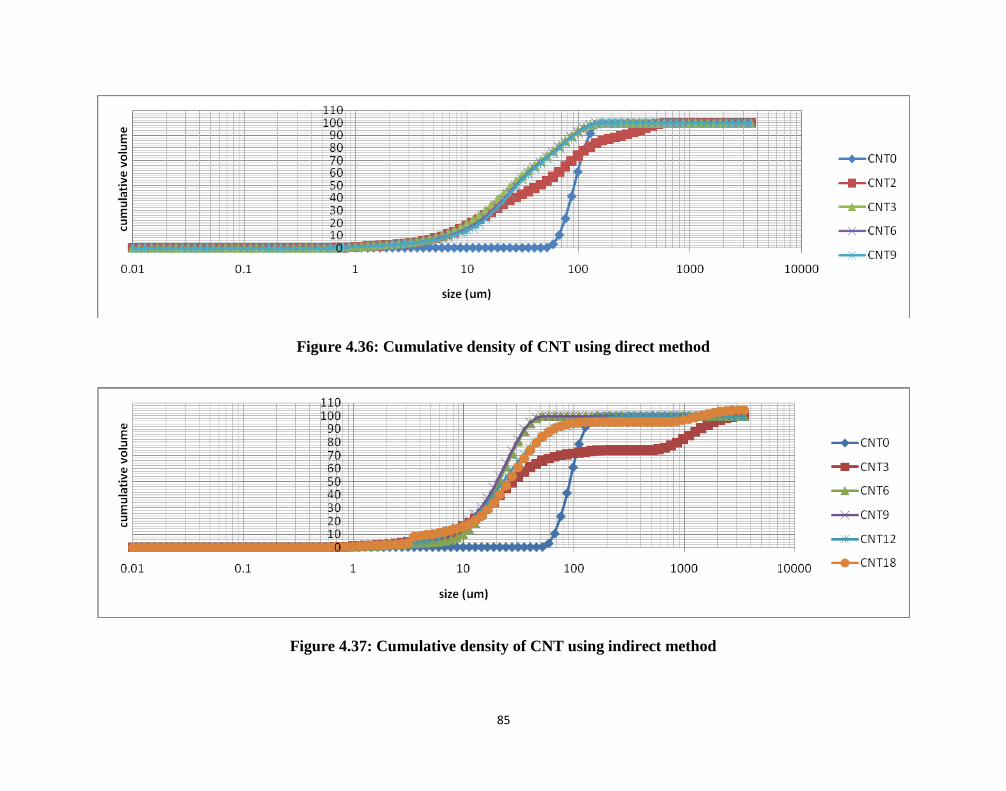
85
Figure 4.36: Cumulative density of CNT using direct method
Figure 4.37: Cumulative density of CNT using indirect method
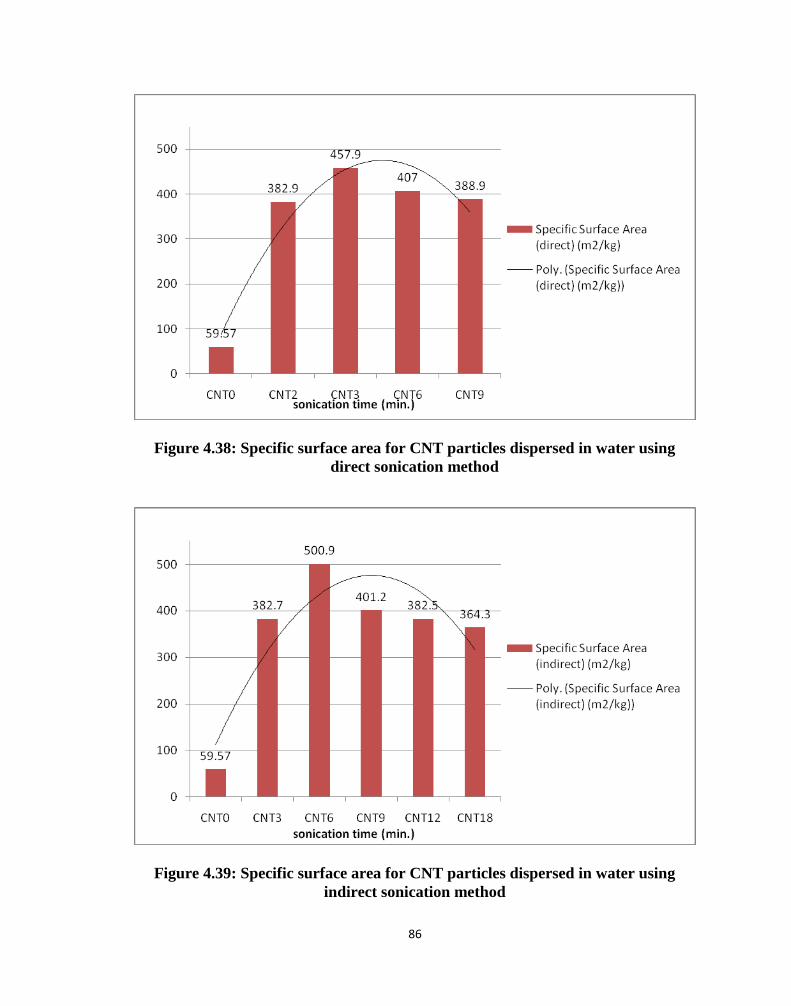
86
Figure 4.38: Specific surface area for CNT particles dispersed in water using
direct sonication method
Figure 4.39: Specific surface area for CNT particles dispersed in water using
indirect sonication method
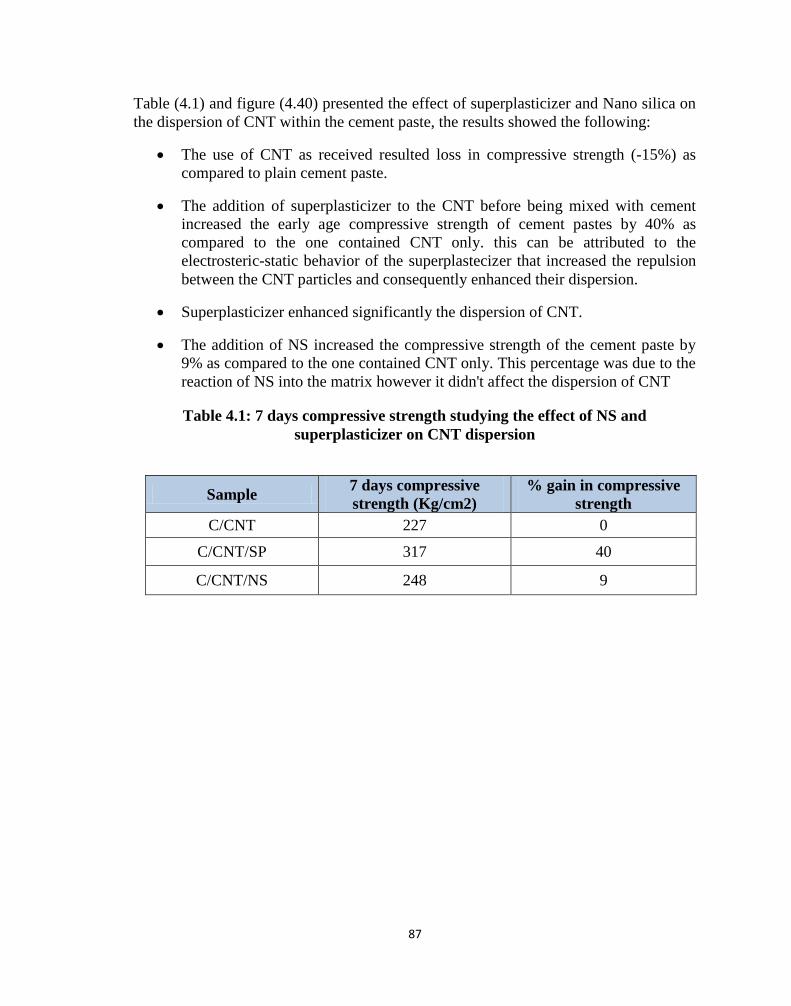
87
Table (4.1) and figure (4.40) presented the effect of superplasticizer and Nano silica on
the dispersion of CNT within the cement paste, the results showed the following:
The use of CNT as received resulted loss in compressive strength (-15%) as
compared to plain cement paste.
The addition of superplasticizer to the CNT before being mixed with cement
increased the early age compressive strength of cement pastes by 40% as
compared to the one contained CNT only. this can be attributed to the
electrosteric-static behavior of the superplastecizer that increased the repulsion
between the CNT particles and consequently enhanced their dispersion.
Superplasticizer enhanced significantly the dispersion of CNT.
The addition of NS increased the compressive strength of the cement paste by
9% as compared to the one contained CNT only. This percentage was due to the
reaction of NS into the matrix however it didn't affect the dispersion of CNT
Table 4.1: 7 days compressive strength studying the effect of NS and
superplasticizer on CNT dispersion
% gain in compressive
strength
7 days compressive
strength (Kg/cm2) Sample
0 227 C/CNT
40 317 C/CNT/SP
9 248 C/CNT/NS
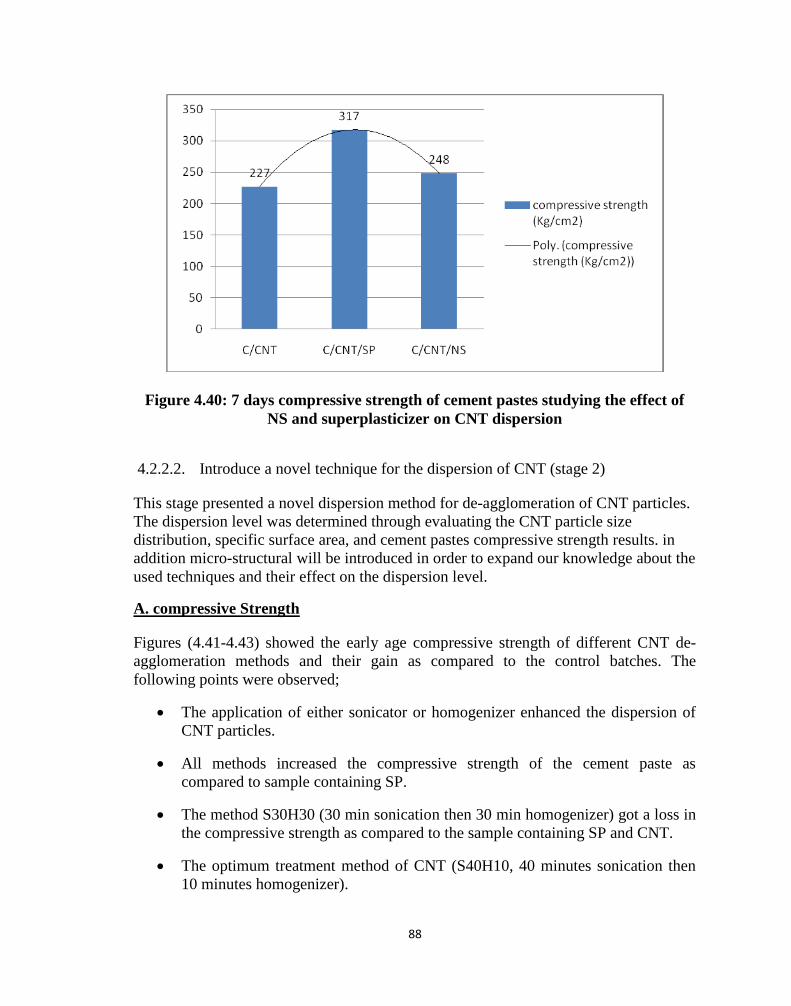
88
Figure 4.40: 7 days compressive strength of cement pastes studying the effect of
NS and superplasticizer on CNT dispersion
4.2.2.2. Introduce a novel technique for the dispersion of CNT (stage 2)
This stage presented a novel dispersion method for de-agglomeration of CNT particles.
The dispersion level was determined through evaluating the CNT particle size
distribution, specific surface area, and cement pastes compressive strength results. in
addition micro-structural will be introduced in order to expand our knowledge about the
used techniques and their effect on the dispersion level.
A. compressive Strength
Figures (4.41-4.43) showed the early age compressive strength of different CNT de-
agglomeration methods and their gain as compared to the control batches. The
following points were observed;
The application of either sonicator or homogenizer enhanced the dispersion of
CNT particles.
All methods increased the compressive strength of the cement paste as
compared to sample containing SP.
The method S30H30 (30 min sonication then 30 min homogenizer) got a loss in
the compressive strength as compared to the sample containing SP and CNT.
The optimum treatment method of CNT (S40H10, 40 minutes sonication then
10 minutes homogenizer).
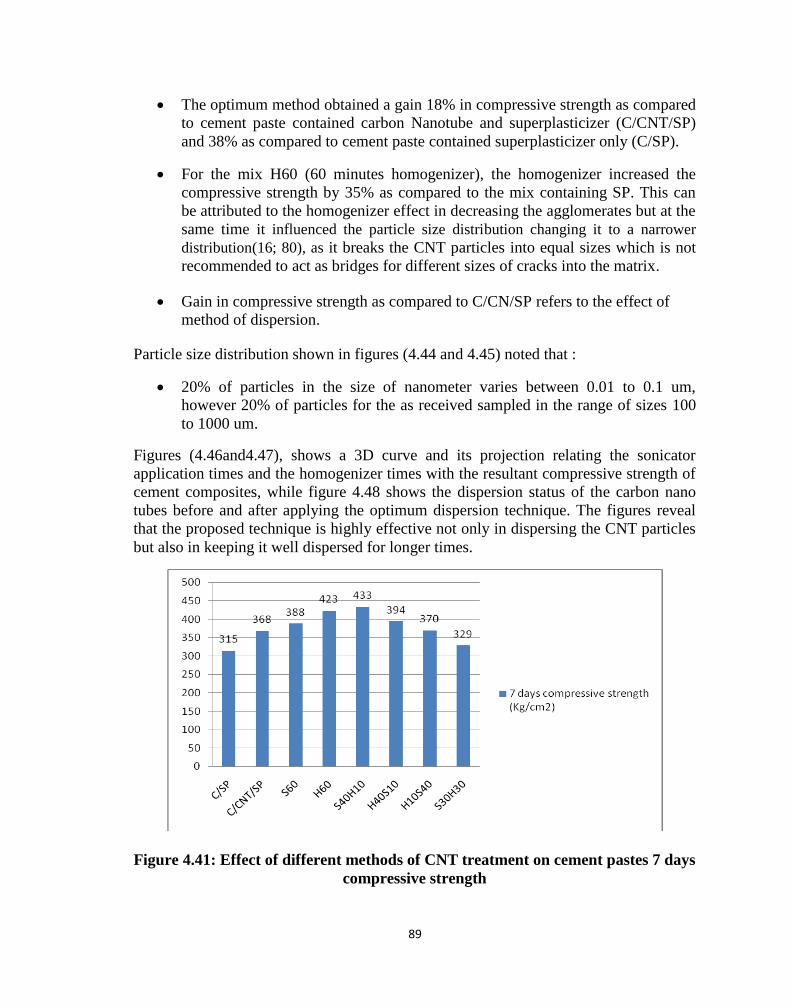
89
The optimum method obtained a gain 18% in compressive strength as compared
to cement paste contained carbon Nanotube and superplasticizer (C/CNT/SP)
and 38% as compared to cement paste contained superplasticizer only (C/SP).
For the mix H60 (60 minutes homogenizer), the homogenizer increased the
compressive strength by 35% as compared to the mix containing SP. This can
be attributed to the homogenizer effect in decreasing the agglomerates but at the
same time it influenced the particle size distribution changing it to a narrower
distribution(16; 80), as it breaks the CNT particles into equal sizes which is not
recommended to act as bridges for different sizes of cracks into the matrix.
Gain in compressive strength as compared to C/CN/SP refers to the effect of
method of dispersion.
Particle size distribution shown in figures (4.44 and 4.45) noted that :
20% of particles in the size of nanometer varies between 0.01 to 0.1 um,
however 20% of particles for the as received sampled in the range of sizes 100
to 1000 um.
Figures (4.46and4.47), shows a 3D curve and its projection relating the sonicator
application times and the homogenizer times with the resultant compressive strength of
cement composites, while figure 4.48 shows the dispersion status of the carbon nano
tubes before and after applying the optimum dispersion technique. The figures reveal
that the proposed technique is highly effective not only in dispersing the CNT particles
but also in keeping it well dispersed for longer times.
Figure 4.41: Effect of different methods of CNT treatment on cement pastes 7 days
compressive strength
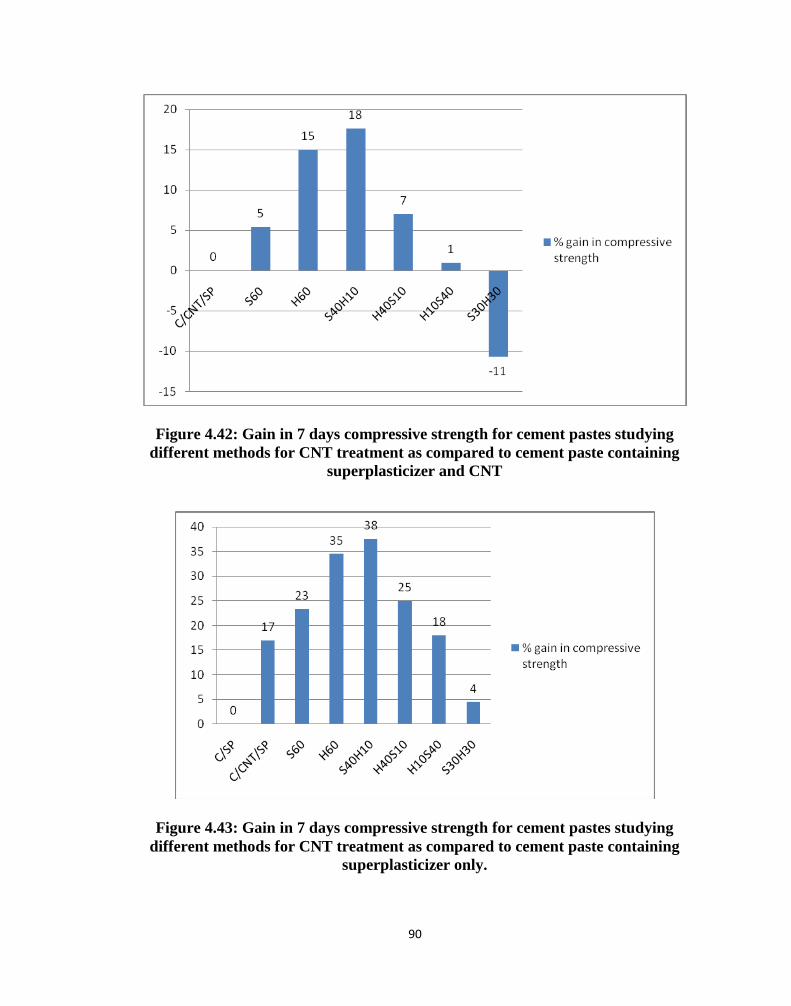
91
Figure 4.42: Gain in 7 days compressive strength for cement pastes studying
different methods for CNT treatment as compared to cement paste containing
superplasticizer and CNT
Figure 4.43: Gain in 7 days compressive strength for cement pastes studying
different methods for CNT treatment as compared to cement paste containing
superplasticizer only.
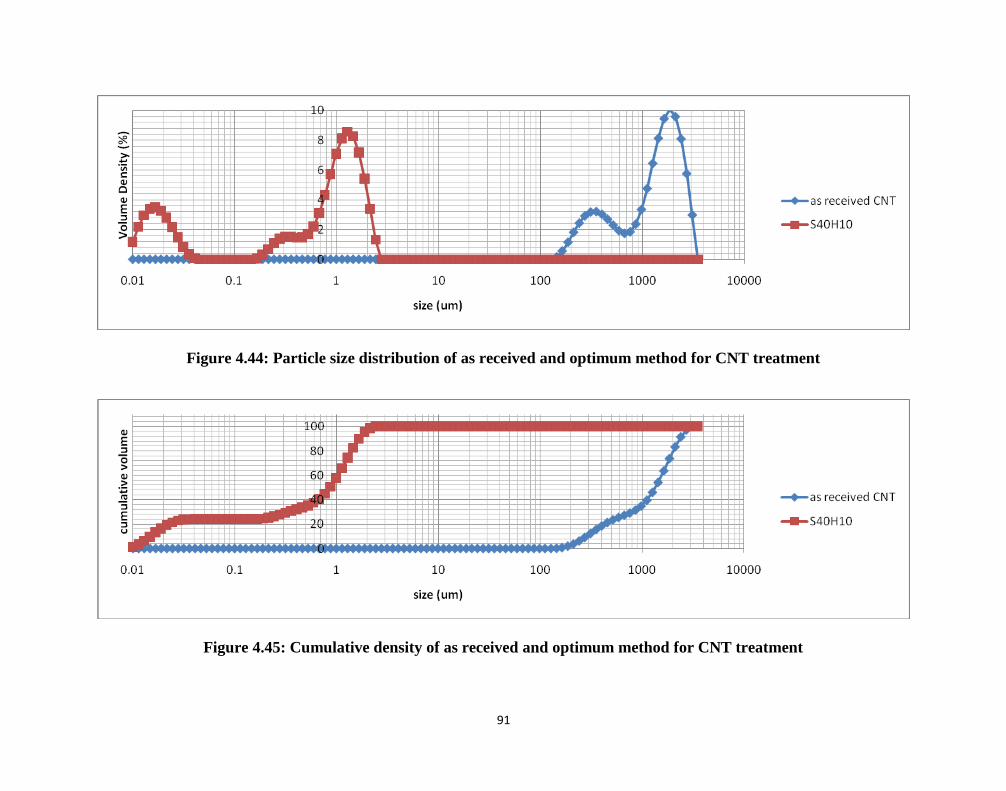
91
Figure 4.44: Particle size distribution of as received and optimum method for CNT treatment
Figure 4.45: Cumulative density of as received and optimum method for CNT treatment
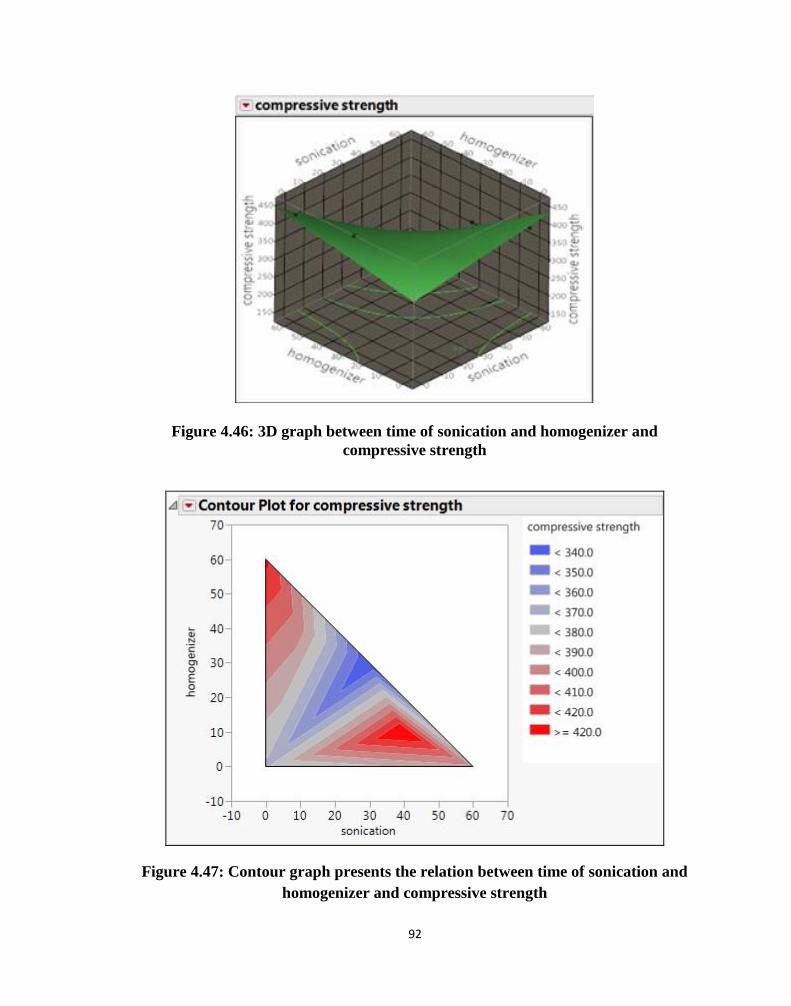
92
Figure 4.46: 3D graph between time of sonication and homogenizer and
compressive strength
Figure 4.47: Contour graph presents the relation between time of sonication and
homogenizer and compressive strength
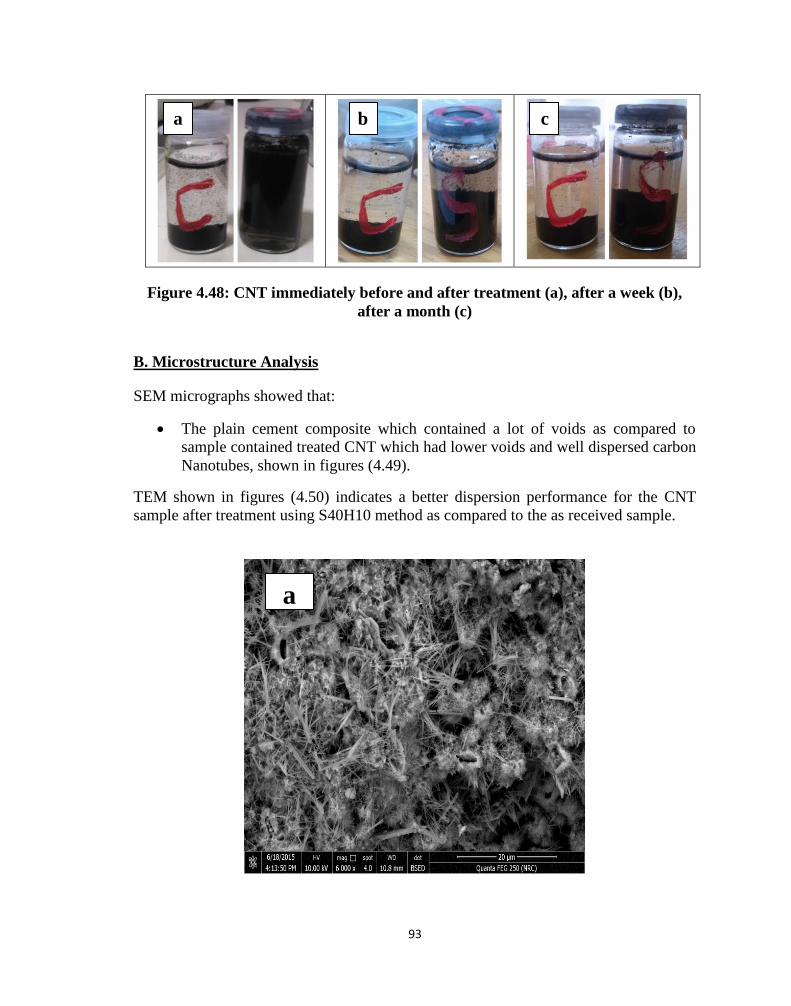
93
Figure 4.48: CNT immediately before and after treatment (a), after a week (b),
after a month (c)
B. Microstructure Analysis
SEM micrographs showed that:
The plain cement composite which contained a lot of voids as compared to
sample contained treated CNT which had lower voids and well dispersed carbon
Nanotubes, shown in figures (4.49).
TEM shown in figures (4.50) indicates a better dispersion performance for the CNT
sample after treatment using S40H10 method as compared to the as received sample.
a
a b c
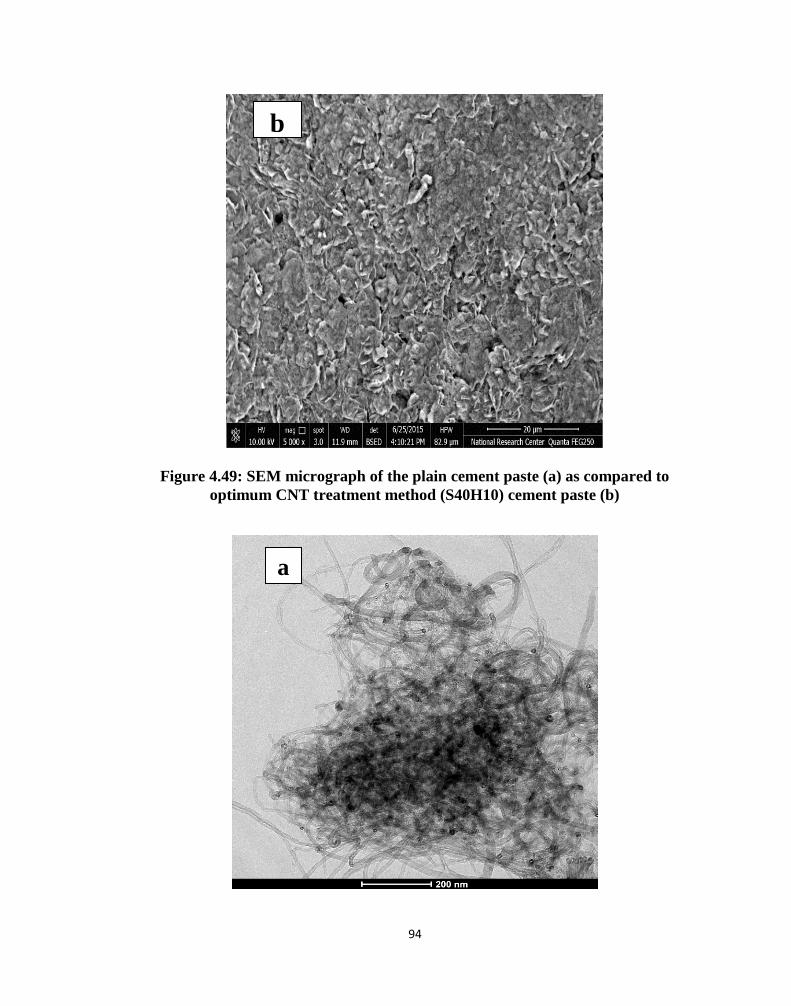
94
Figure 4.49: SEM micrograph of the plain cement paste (a) as compared to
optimum CNT treatment method (S40H10) cement paste (b)
b
a
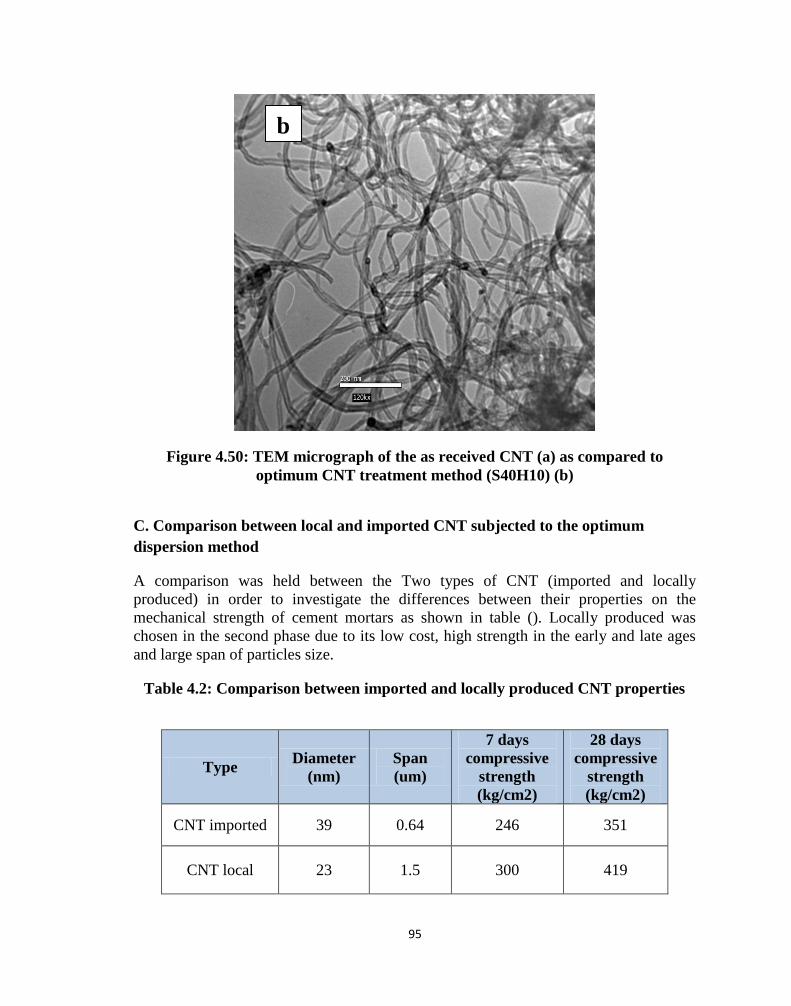
95
Figure 4.50: TEM micrograph of the as received CNT (a) as compared to
optimum CNT treatment method (S40H10) (b)
C. Comparison between local and imported CNT subjected to the optimum
dispersion method
A comparison was held between the Two types of CNT (imported and locally
produced) in order to investigate the differences between their properties on the
mechanical strength of cement mortars as shown in table (). Locally produced was
chosen in the second phase due to its low cost, high strength in the early and late ages
and large span of particles size.
Table 4.2: Comparison between imported and locally produced CNT properties
28 days
compressive
strength
(kg/cm2)
7 days
compressive
strength
(kg/cm2)
Span
(um)
Diameter
(nm) Type
351 246 0.64 39 CNT imported
419 300 1.5 23 CNT local
b
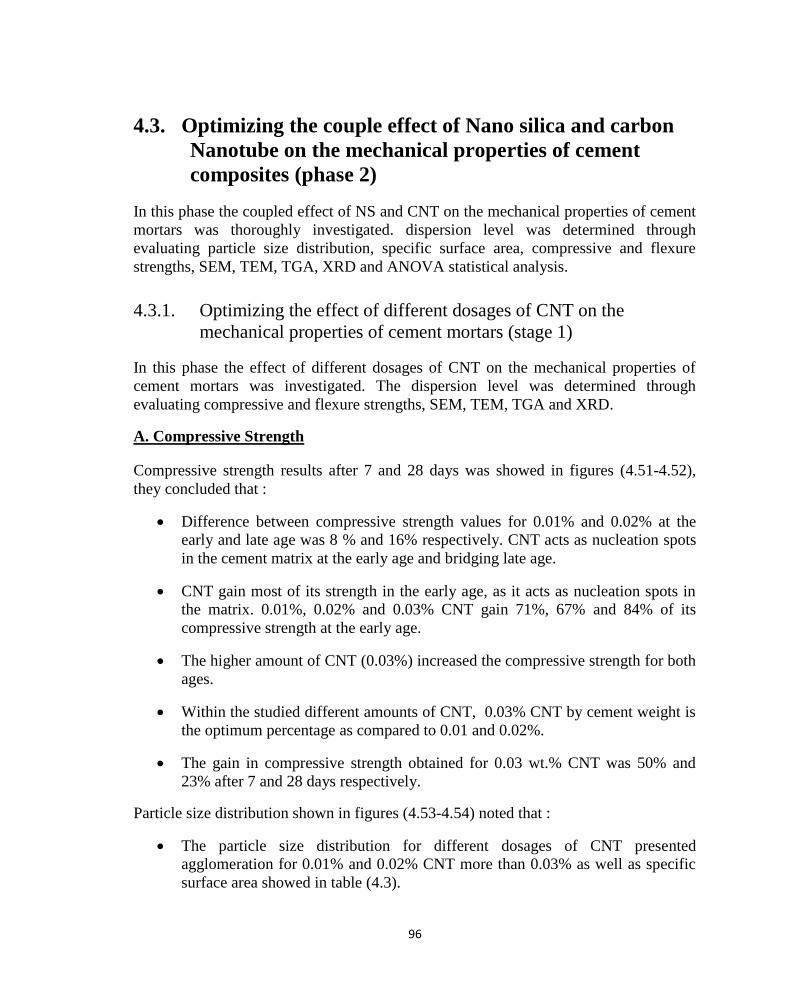
96
4.3. Optimizing the couple effect of Nano silica and carbon
Nanotube on the mechanical properties of cement
composites (phase 2)
In this phase the coupled effect of NS and CNT on the mechanical properties of cement
mortars was thoroughly investigated. dispersion level was determined through
evaluating particle size distribution, specific surface area, compressive and flexure
strengths, SEM, TEM, TGA, XRD and ANOVA statistical analysis.
4.3.1. Optimizing the effect of different dosages of CNT on the
mechanical properties of cement mortars (stage 1)
In this phase the effect of different dosages of CNT on the mechanical properties of
cement mortars was investigated. The dispersion level was determined through
evaluating compressive and flexure strengths, SEM, TEM, TGA and XRD.
A. Compressive Strength
Compressive strength results after 7 and 28 days was showed in figures (4.51-4.52),
they concluded that :
Difference between compressive strength values for 0.01% and 0.02% at the
early and late age was 8 % and 16% respectively. CNT acts as nucleation spots
in the cement matrix at the early age and bridging late age.
CNT gain most of its strength in the early age, as it acts as nucleation spots in
the matrix. 0.01%, 0.02% and 0.03% CNT gain 71%, 67% and 84% of its
compressive strength at the early age.
The higher amount of CNT (0.03%) increased the compressive strength for both
ages.
Within the studied different amounts of CNT, 0.03% CNT by cement weight is
the optimum percentage as compared to 0.01 and 0.02%.
The gain in compressive strength obtained for 0.03 wt.% CNT was 50% and
23% after 7 and 28 days respectively.
Particle size distribution shown in figures (4.53-4.54) noted that :
The particle size distribution for different dosages of CNT presented
agglomeration for 0.01% and 0.02% CNT more than 0.03% as well as specific
surface area showed in table (4.3).
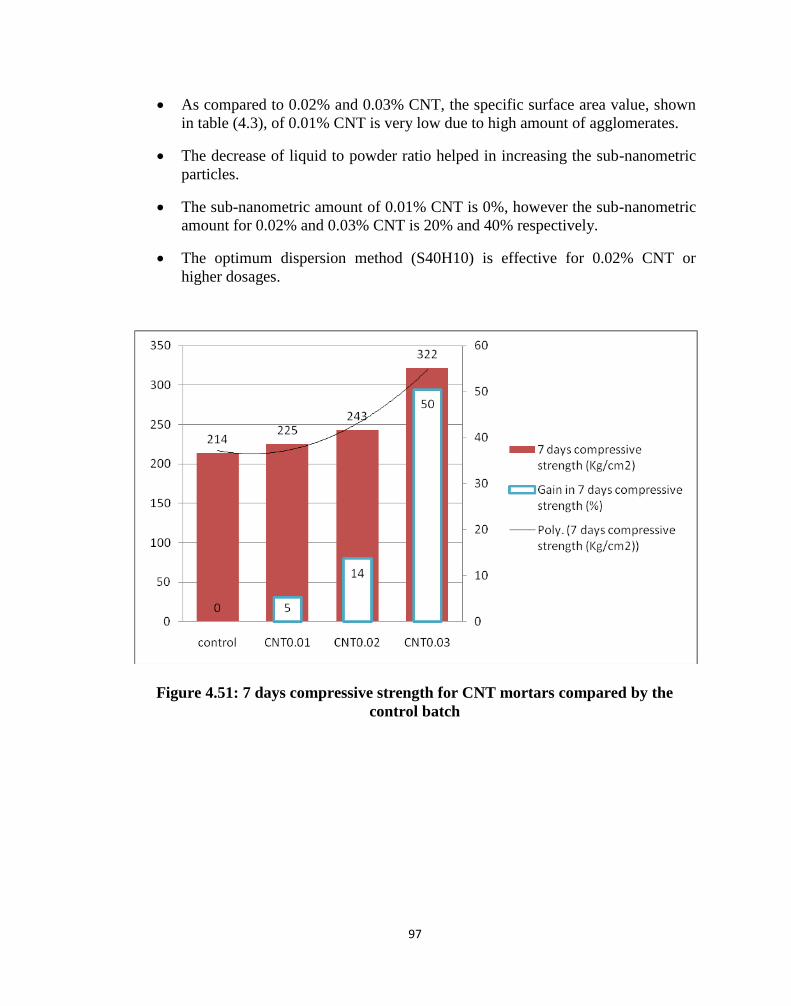
97
As compared to 0.02% and 0.03% CNT, the specific surface area value, shown
in table (4.3), of 0.01% CNT is very low due to high amount of agglomerates.
The decrease of liquid to powder ratio helped in increasing the sub-nanometric
particles.
The sub-nanometric amount of 0.01% CNT is 0%, however the sub-nanometric
amount for 0.02% and 0.03% CNT is 20% and 40% respectively.
The optimum dispersion method (S40H10) is effective for 0.02% CNT or
higher dosages.
Figure 4.51: 7 days compressive strength for CNT mortars compared by the
control batch
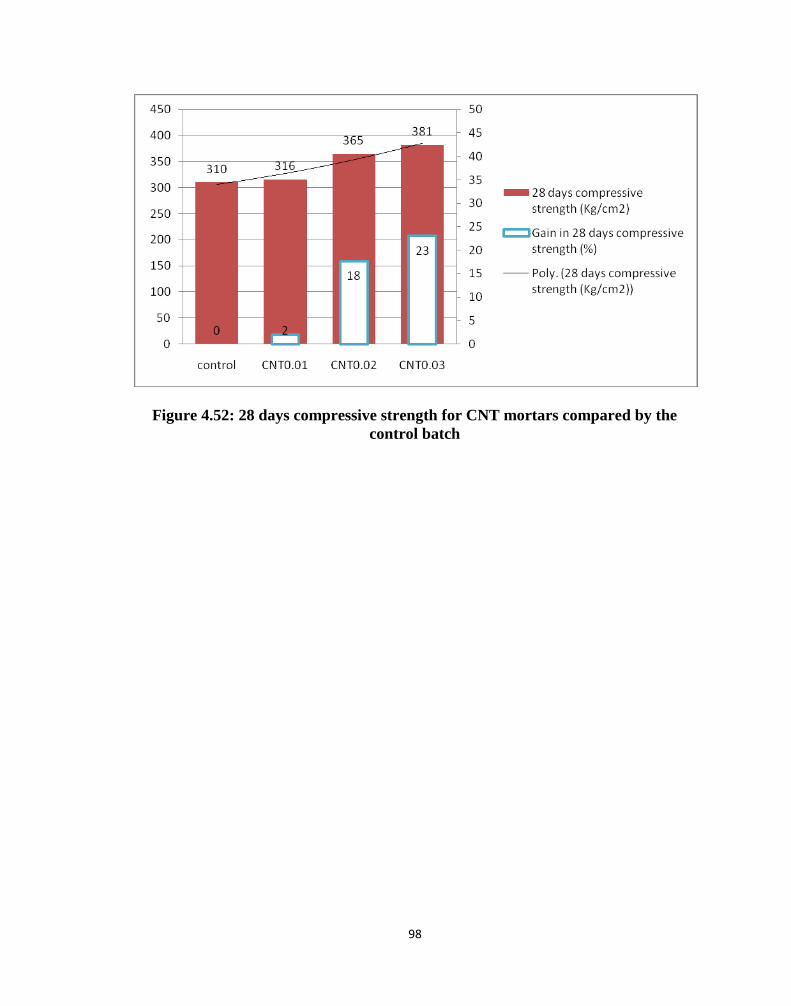
98
Figure 4.52: 28 days compressive strength for CNT mortars compared by the
control batch
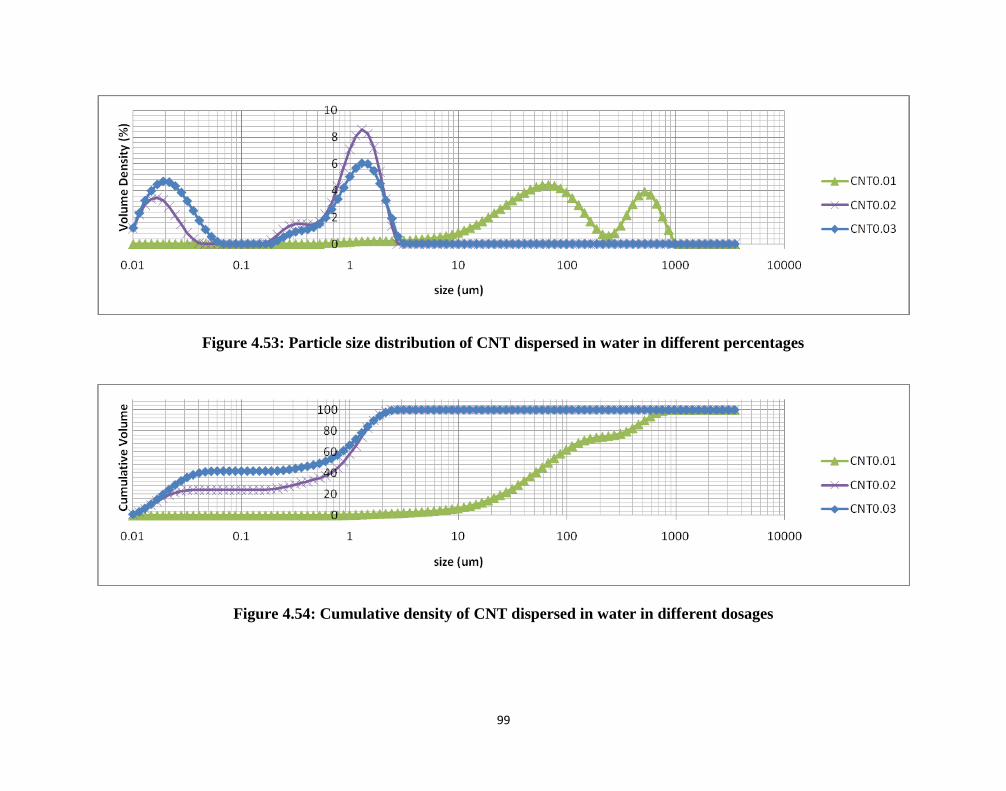
99
Figure 4.53: Particle size distribution of CNT dispersed in water in different percentages
Figure 4.54: Cumulative density of CNT dispersed in water in different dosages
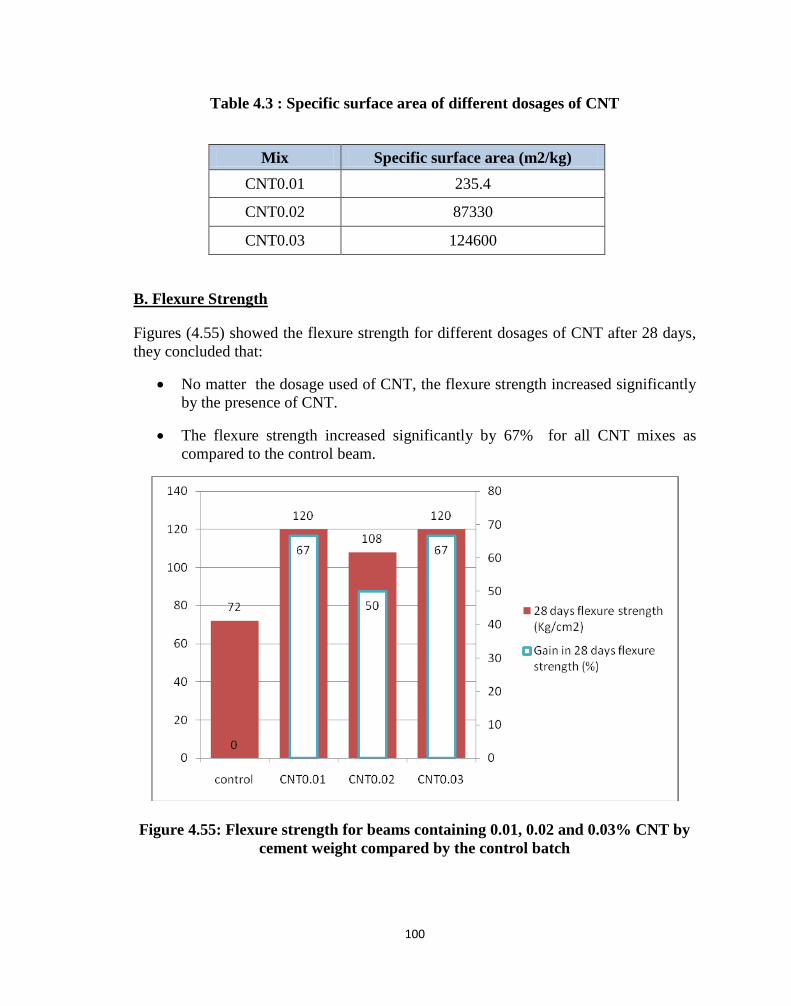
111
Table 4.3 : Specific surface area of different dosages of CNT
Mix Specific surface area (m2/kg)
CNT0.01 235.4
CNT0.02 87330
CNT0.03 124600
B. Flexure Strength
Figures (4.55) showed the flexure strength for different dosages of CNT after 28 days,
they concluded that:
No matter the dosage used of CNT, the flexure strength increased significantly
by the presence of CNT.
The flexure strength increased significantly by 67% for all CNT mixes as
compared to the control beam.
Figure 4.55: Flexure strength for beams containing 0.01, 0.02 and 0.03% CNT by
cement weight compared by the control batch

111
C. Microstructure Analysis
Figure (4.56) showed TGA result of the mix containing 0.03% CNT. The loss in
weight observed for the control Mix from 30 to 400 (13%) was much higher
than the mix containing carbon nano tube (5.5%), this can be attributed to the
larger amount of CH in the control mix as compared to the mixes containing
carbon nano tube due to the behavior of the carbon nano tube as a nucleation
sites increasing the C-S-H production and consequently decreasing the CH
content in the mix. This is in good agreement with the compressive strength
results.
Figure 4.56: TGA of the cement mortar containing 0.03% CNT (CNT0.03)
112
4.3.2. Optimizing the couple effect of different dosages of NS and CNT
on the mechanical properties of cement mortars (stage 2)
In this stage the coupled effect of NS and CNT on the mechanical properties of cement
mortars will be represented. The results were introduced using particle size distribution,
specific surface area, compressive and flexure strengths, SEM, TEM, TGA, XRD and
ANOVA statistical analysis.
A. Compressive Strength
Compressive strength after 7 and 28 days for different dosages of NS and CNT
illustrated in figures (4.57-4.62) showed the following:
For mixes containing 0.01%, and 0.02% CNT, increasing NS content up to 1%
increased both; the early and late compressive strengths of cement mortars. The
gain in the late compressive strength reached 35% by the addition of 1% NS, as
compared to the control mix (0% NS, 0% CNT).
Increasing NS content higher than 1% decreased significantly the compressive
strength of mixes containing 0.01% (NS1/CNT0.01), and 0.02% CNT
(NS1/CNT0.02). The strength loss reached -22% after 28 days of curing by the
addition of 2.5% NS, as compared to the control mix (0% NS, 0% CNT).
The addition of NS to mixes containing 0.03% CNT decreased the compressive
strength of all mixes. The strength loss reached -16% after 28 days of curing by
the addition of 2.5% NS (NS2.5/CNT0.03), as compared to the control mix (0%
NS, 0% CNT).
The utilization of small amounts of NS (less than 1%) with small amounts of
CNT (less than 0.02%) helped in increasing the compressive strength of cement
mortars at both; the early and late ages, while by utilizing higher dosages of
CNT, significant strength loss has been observed. This can be attributed to the
following points;
a) The interaction of the OH– functional groups from the CNT with the
Ca(OH)2 re-agglomerates the CNT dispersions and the Ca(OH)2,
decreasing the surface area of the nano particles available to work as
nucleation spots at early ages, and decreases the availability of Ca(OH)2
for the NS to react with, to form additional C–S–H at latter ages. The
combination of these two effects decreases the overall strength of the
mixes(11).
b) The combination of NS and a low amount of CNT thought to be affecting
the hydration reaction due to the presence of individual CNT that works as
extra nucleation spots for the hydrates and enhance the activity of the NS.
113
c) The combination of NS and a high amount of CNT thought to be of a
negative effect on the hydration reaction due to the re-agglomeration
process of the CNT, which hinders the activity of the NS and affects
negatively the production of hydrates of the cement.
d) The effect of the re-agglomeration process of the CNT dispersions on the
activity of the NS and the hydration of the cement depends on the
concentration of CNT and the hydration time. A higher amount of CNT
will be more susceptible to re-agglomeration, and as hydration time
progresses the amount of Ca(OH)2 released in the matrix by the cement
will be higher, and the re-agglomeration will be accelerated.
e) The activity of the NS is accelerated, decelerated or completely inhibited
depending on the amounts of CNT and Ca(OH)2 present in the matrix.
The re-agglomeration process of the CNT will decrease the surface area
available for the particles to work as extra nucleation spots and eventually
will hinder the activity of the NS and affect the hydration of cement.
The utilization of high amounts of NS (more than 1%) with either small or high
amounts of CNT decreased the compressive strength of cement mortars at both;
the early and late ages. Adding 2.5% NS with 0.01% CNT (NS2.5/CNT0.01)
decreased the compressive strength by -20% as compared to cement mortar
containing 0.01% CNT only. While adding 2.5% NS with 0.02%
(NS2.5/CNT0.02) or 0.03% CNT (NS2.5/CNT0.03) decreased the compressive
strength for about -45% as compared to cement mortar containing 0.02% and
0.03% CNT respectively. This can be attributed to the previous mentioned
points in addition;
a) NS particles cannot easily disperse within the cement matrix due to their
high surface energy, they become more agglomerated and the voids
appear which affect the compressive strength gain (16).
b) The large agglomerates suck the mix water between its particles making
less water available for the progress of cement hydration.
The optimum compressive strength value was for the sample containing 0.02%
CNT adding to 1% NS (NS1/CNT0.02). The gain in compressive strength
reached 72% and 35% after 7 and 28 days respectively.
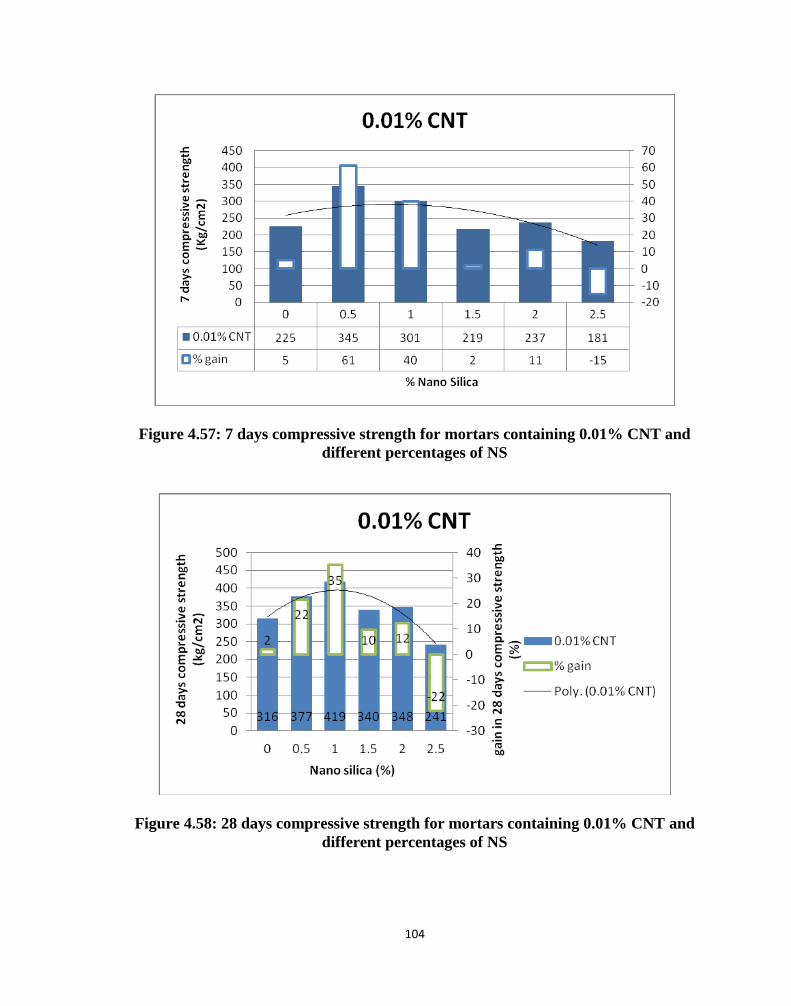
114
Figure 4.57: 7 days compressive strength for mortars containing 0.01% CNT and
different percentages of NS
Figure 4.58: 28 days compressive strength for mortars containing 0.01% CNT and
different percentages of NS
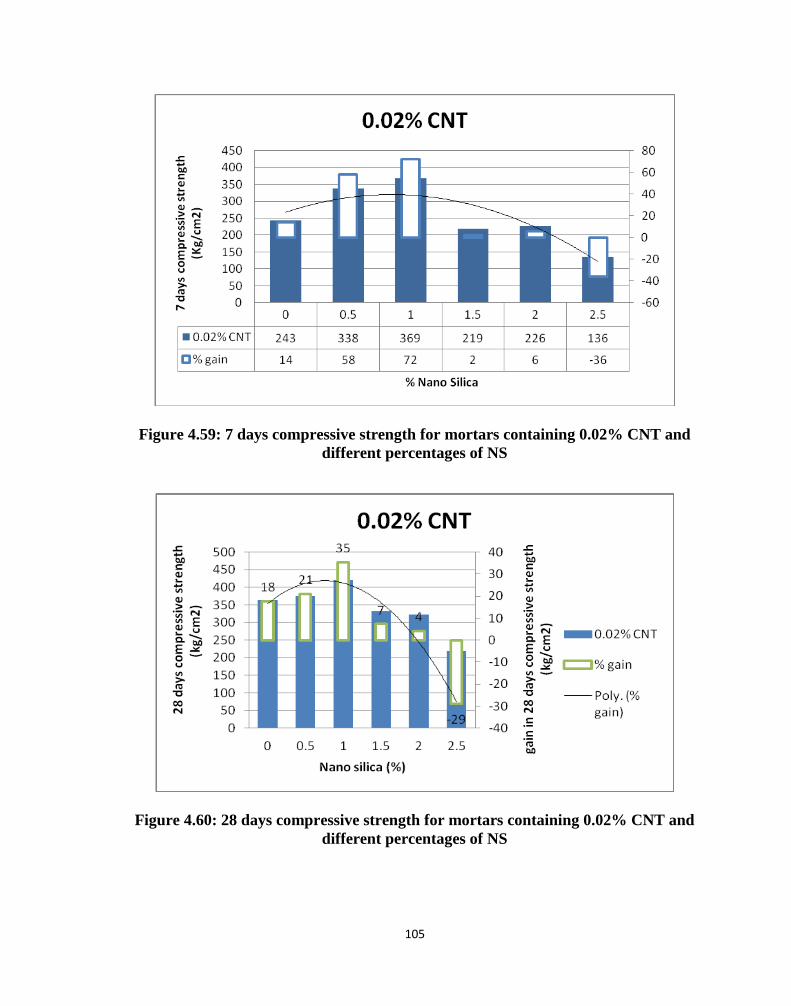
115
Figure 4.59: 7 days compressive strength for mortars containing 0.02% CNT and
different percentages of NS
Figure 4.60: 28 days compressive strength for mortars containing 0.02% CNT and
different percentages of NS
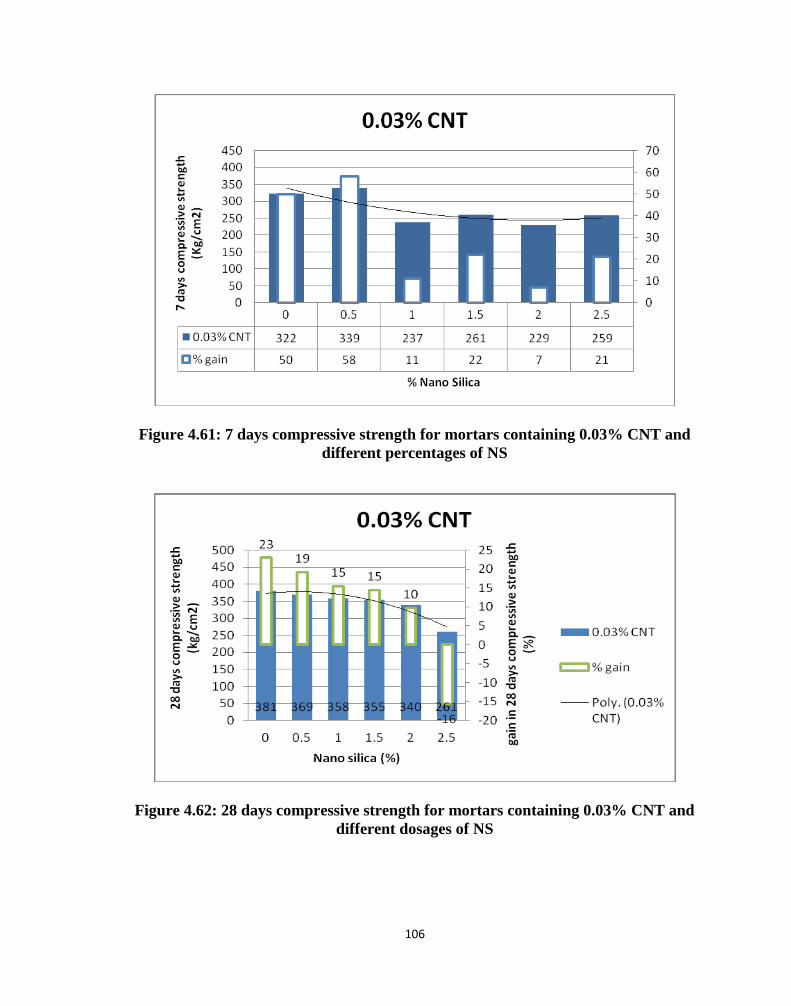
116
Figure 4.61: 7 days compressive strength for mortars containing 0.03% CNT and
different percentages of NS
Figure 4.62: 28 days compressive strength for mortars containing 0.03% CNT and
different dosages of NS
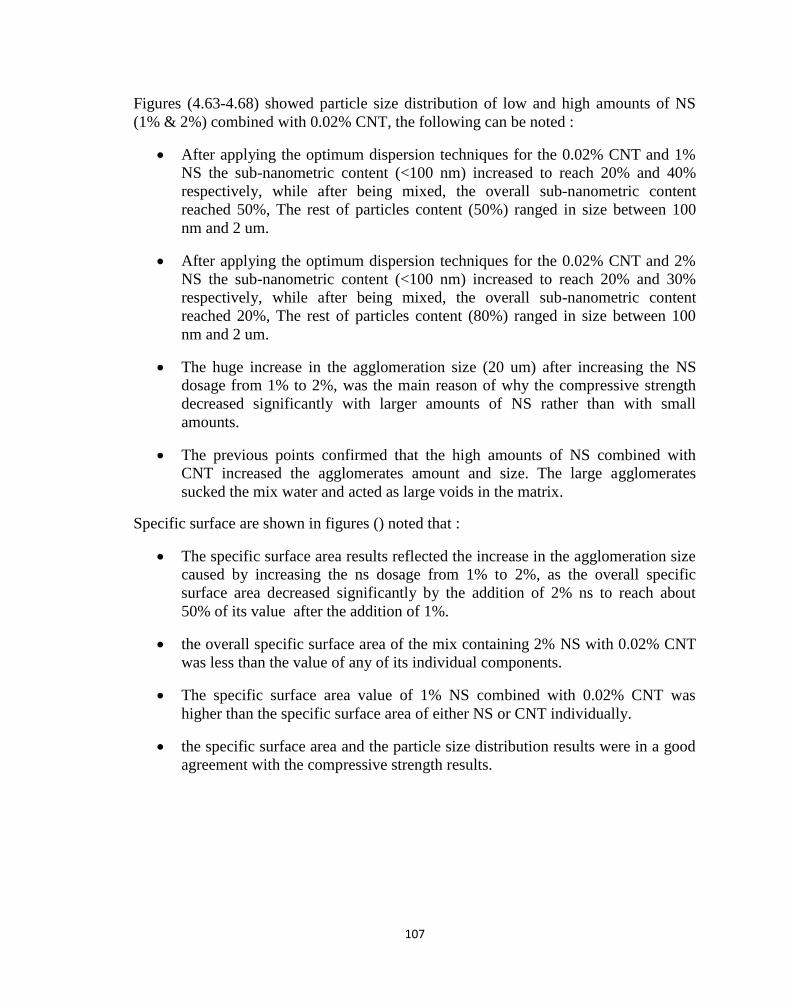
117
Figures (4.63-4.68) showed particle size distribution of low and high amounts of NS
(1% & 2%) combined with 0.02% CNT, the following can be noted :
After applying the optimum dispersion techniques for the 0.02% CNT and 1%
NS the sub-nanometric content (<100 nm) increased to reach 20% and 40%
respectively, while after being mixed, the overall sub-nanometric content
reached 50%, The rest of particles content (50%) ranged in size between 100
nm and 2 um.
After applying the optimum dispersion techniques for the 0.02% CNT and 2%
NS the sub-nanometric content (<100 nm) increased to reach 20% and 30%
respectively, while after being mixed, the overall sub-nanometric content
reached 20%, The rest of particles content (80%) ranged in size between 100
nm and 2 um.
The huge increase in the agglomeration size (20 um) after increasing the NS
dosage from 1% to 2%, was the main reason of why the compressive strength
decreased significantly with larger amounts of NS rather than with small
amounts.
The previous points confirmed that the high amounts of NS combined with
CNT increased the agglomerates amount and size. The large agglomerates
sucked the mix water and acted as large voids in the matrix.
Specific surface are shown in figures () noted that :
The specific surface area results reflected the increase in the agglomeration size
caused by increasing the ns dosage from 1% to 2%, as the overall specific
surface area decreased significantly by the addition of 2% ns to reach about
50% of its value after the addition of 1%.
the overall specific surface area of the mix containing 2% NS with 0.02% CNT
was less than the value of any of its individual components.
The specific surface area value of 1% NS combined with 0.02% CNT was
higher than the specific surface area of either NS or CNT individually.
the specific surface area and the particle size distribution results were in a good
agreement with the compressive strength results.
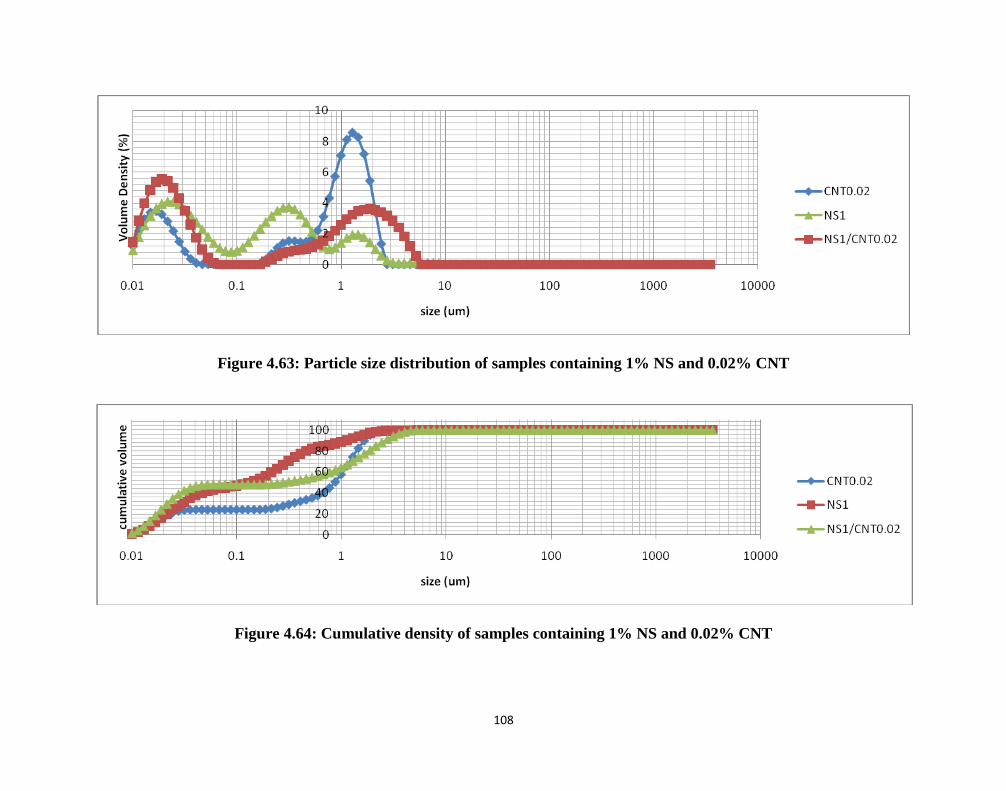
118
Figure 4.63: Particle size distribution of samples containing 1% NS and 0.02% CNT
Figure 4.64: Cumulative density of samples containing 1% NS and 0.02% CNT
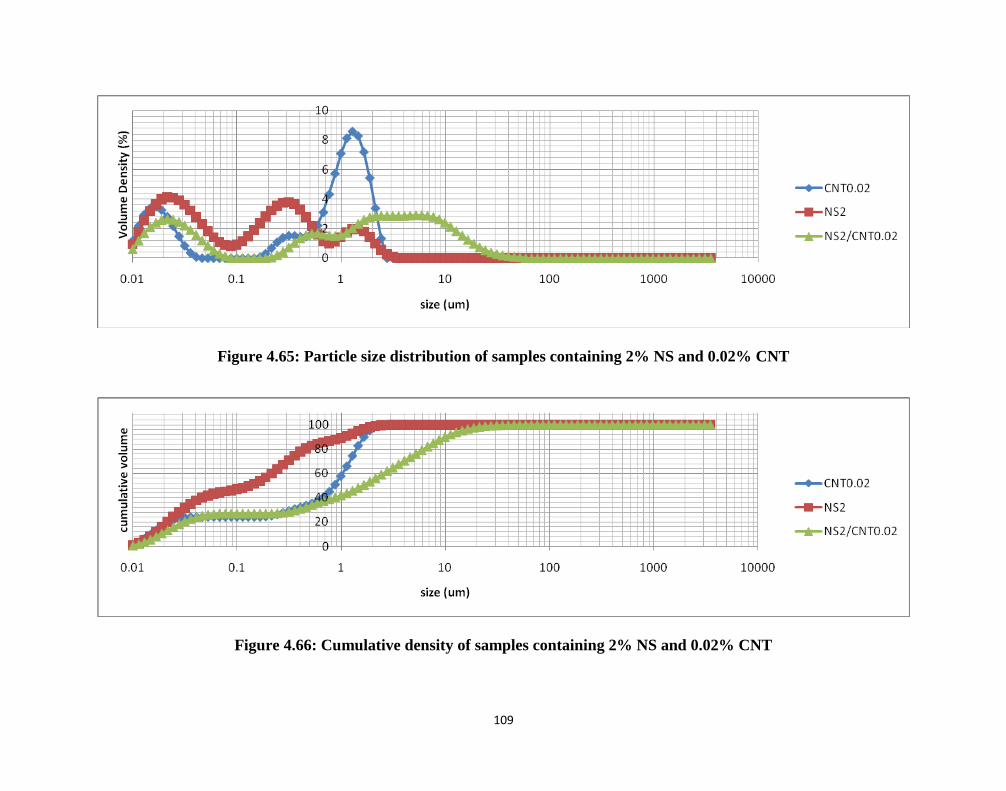
119
Figure 4.65: Particle size distribution of samples containing 2% NS and 0.02% CNT
Figure 4.66: Cumulative density of samples containing 2% NS and 0.02% CNT
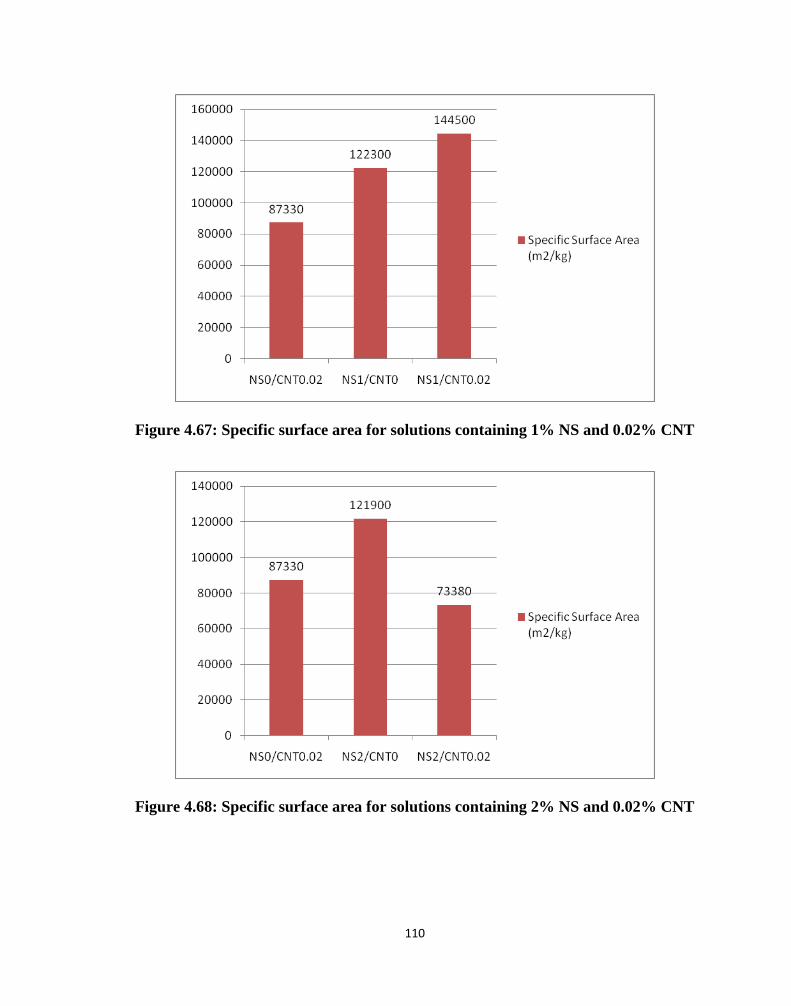
111
Figure 4.67: Specific surface area for solutions containing 1% NS and 0.02% CNT
Figure 4.68: Specific surface area for solutions containing 2% NS and 0.02% CNT
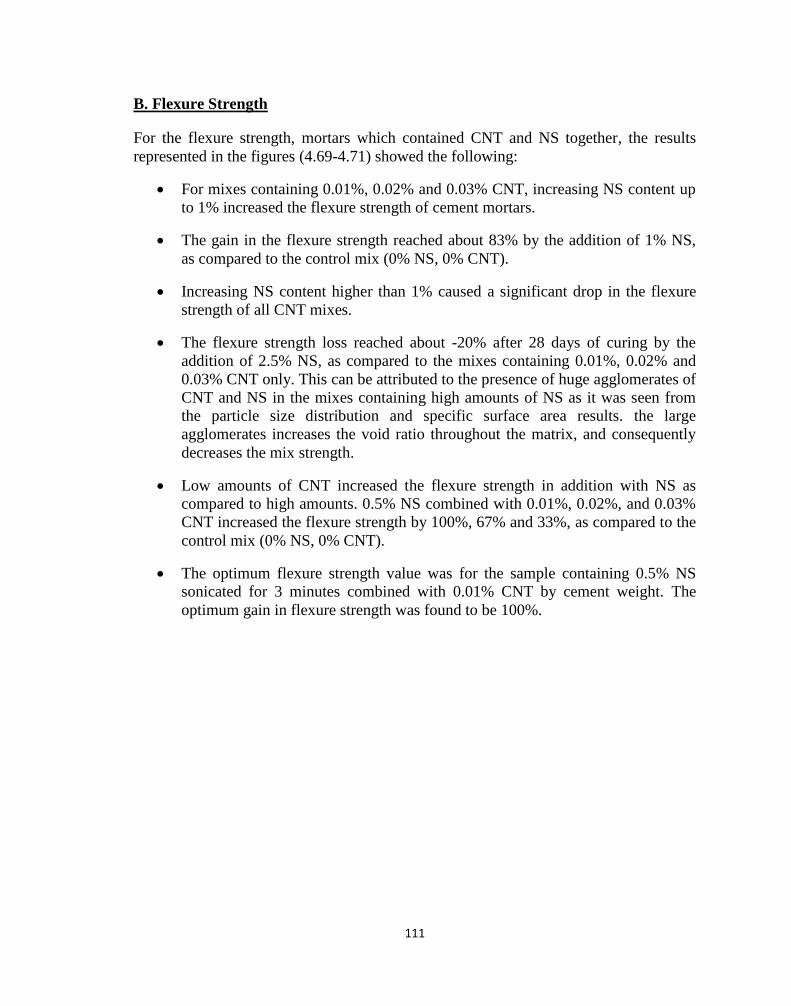
111
B. Flexure Strength
For the flexure strength, mortars which contained CNT and NS together, the results
represented in the figures (4.69-4.71) showed the following:
For mixes containing 0.01%, 0.02% and 0.03% CNT, increasing NS content up
to 1% increased the flexure strength of cement mortars.
The gain in the flexure strength reached about 83% by the addition of 1% NS,
as compared to the control mix (0% NS, 0% CNT).
Increasing NS content higher than 1% caused a significant drop in the flexure
strength of all CNT mixes.
The flexure strength loss reached about -20% after 28 days of curing by the
addition of 2.5% NS, as compared to the mixes containing 0.01%, 0.02% and
0.03% CNT only. This can be attributed to the presence of huge agglomerates of
CNT and NS in the mixes containing high amounts of NS as it was seen from
the particle size distribution and specific surface area results. the large
agglomerates increases the void ratio throughout the matrix, and consequently
decreases the mix strength.
Low amounts of CNT increased the flexure strength in addition with NS as
compared to high amounts. 0.5% NS combined with 0.01%, 0.02%, and 0.03%
CNT increased the flexure strength by 100%, 67% and 33%, as compared to the
control mix (0% NS, 0% CNT).
The optimum flexure strength value was for the sample containing 0.5% NS
sonicated for 3 minutes combined with 0.01% CNT by cement weight. The
optimum gain in flexure strength was found to be 100%.
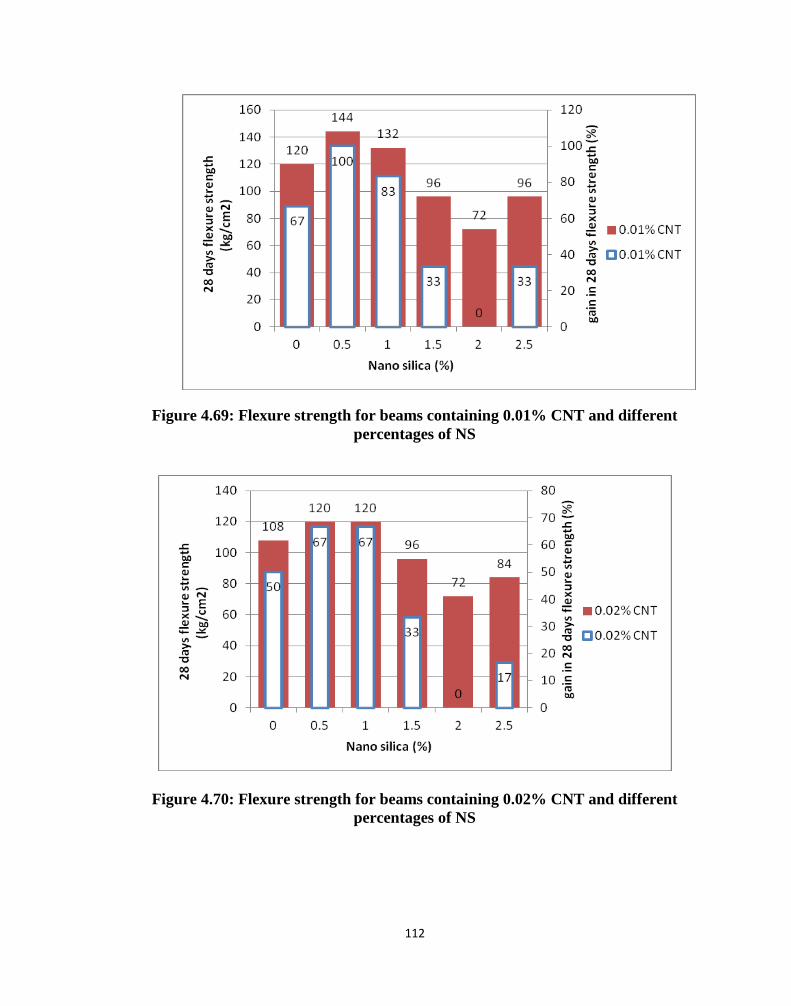
112
Figure 4.69: Flexure strength for beams containing 0.01% CNT and different
percentages of NS
Figure 4.70: Flexure strength for beams containing 0.02% CNT and different
percentages of NS
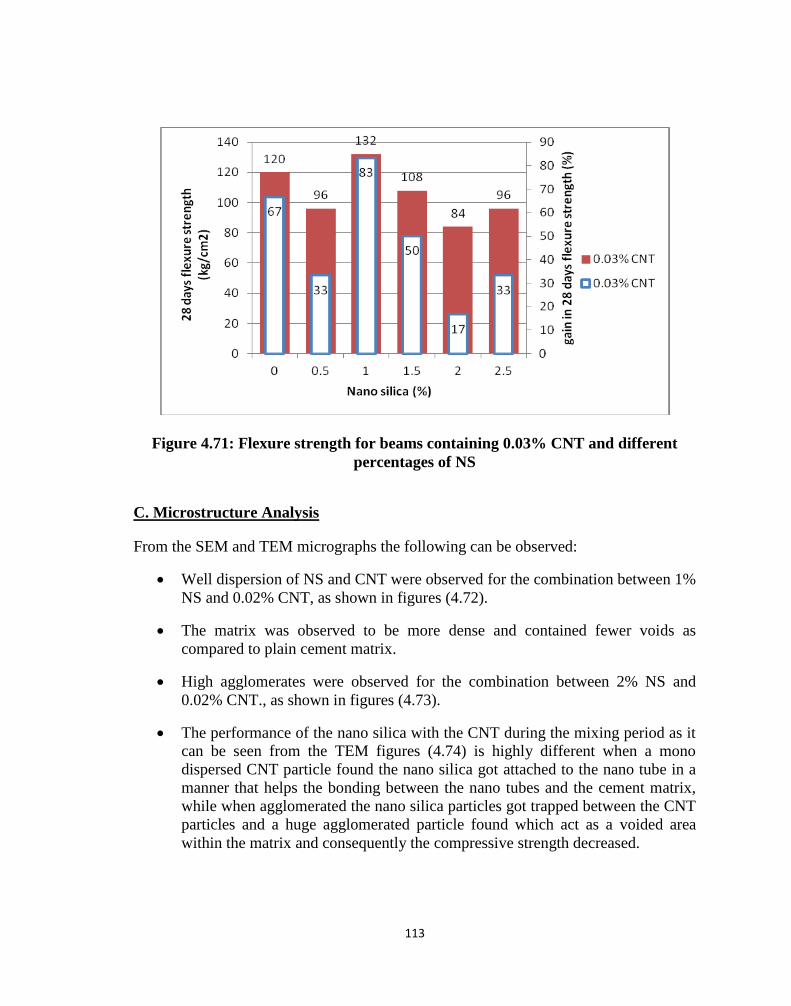
113
Figure 4.71: Flexure strength for beams containing 0.03% CNT and different
percentages of NS
C. Microstructure Analysis
From the SEM and TEM micrographs the following can be observed:
Well dispersion of NS and CNT were observed for the combination between 1%
NS and 0.02% CNT, as shown in figures (4.72).
The matrix was observed to be more dense and contained fewer voids as
compared to plain cement matrix.
High agglomerates were observed for the combination between 2% NS and
0.02% CNT., as shown in figures (4.73).
The performance of the nano silica with the CNT during the mixing period as it
can be seen from the TEM figures (4.74) is highly different when a mono
dispersed CNT particle found the nano silica got attached to the nano tube in a
manner that helps the bonding between the nano tubes and the cement matrix,
while when agglomerated the nano silica particles got trapped between the CNT
particles and a huge agglomerated particle found which act as a voided area
within the matrix and consequently the compressive strength decreased.
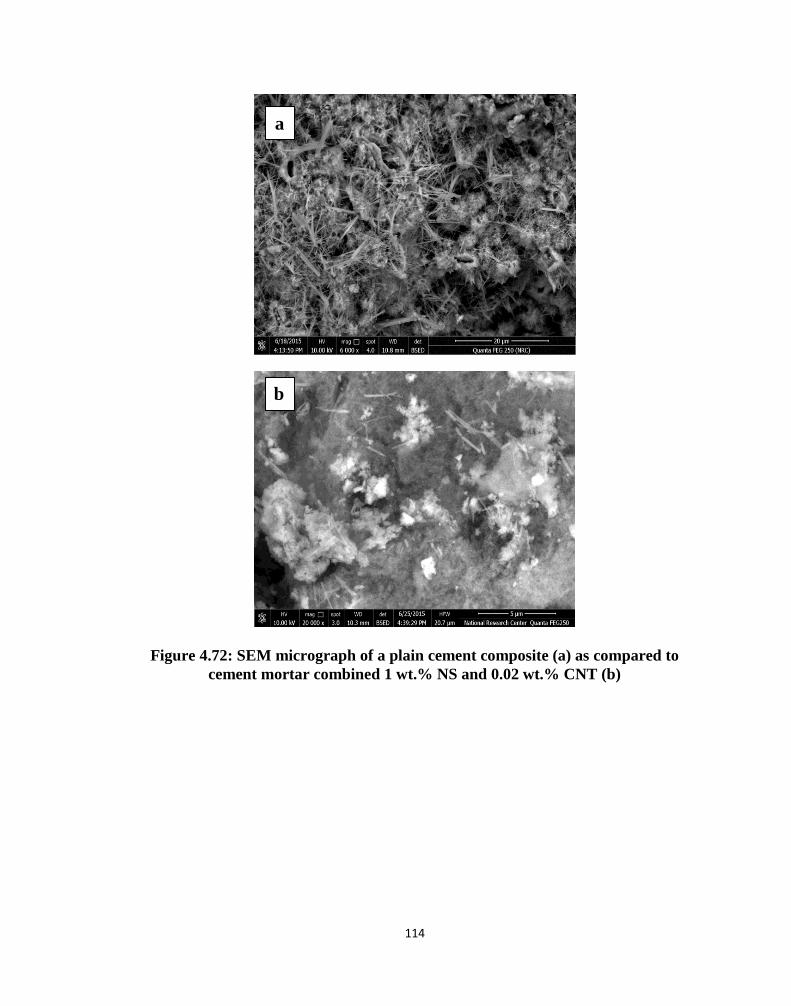
114
Figure 4.72: SEM micrograph of a plain cement composite (a) as compared to
cement mortar combined 1 wt.% NS and 0.02 wt.% CNT (b)
a
b
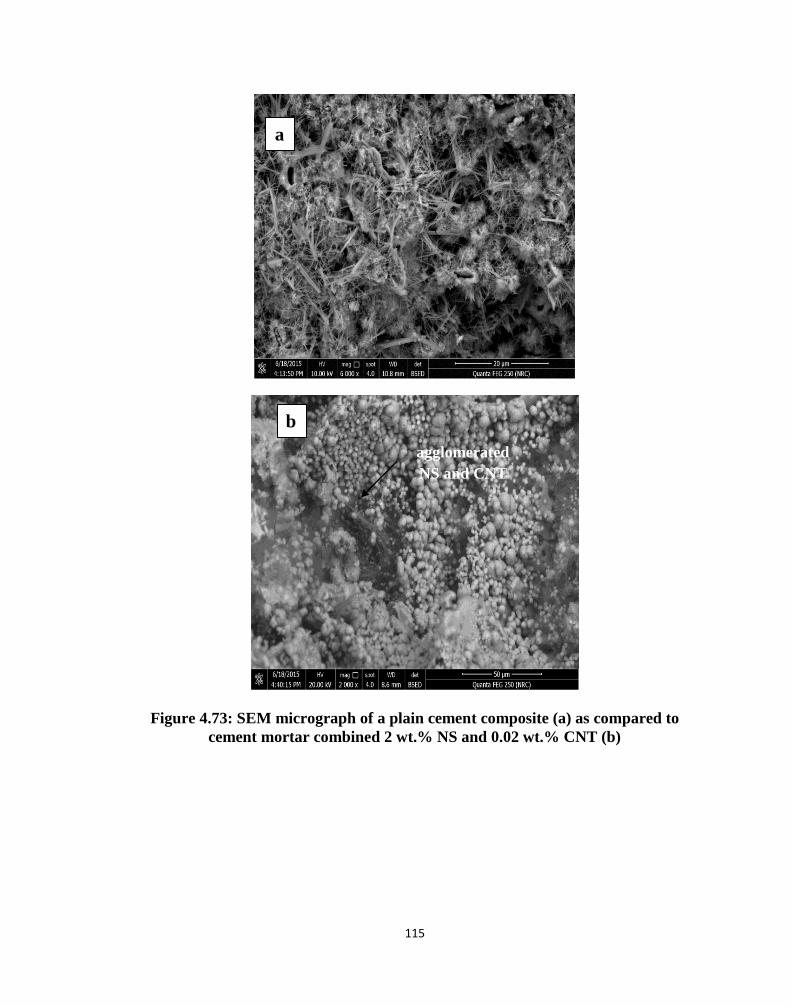
115
Figure 4.73: SEM micrograph of a plain cement composite (a) as compared to
cement mortar combined 2 wt.% NS and 0.02 wt.% CNT (b)
agglomerated
NS and CNT
a
b
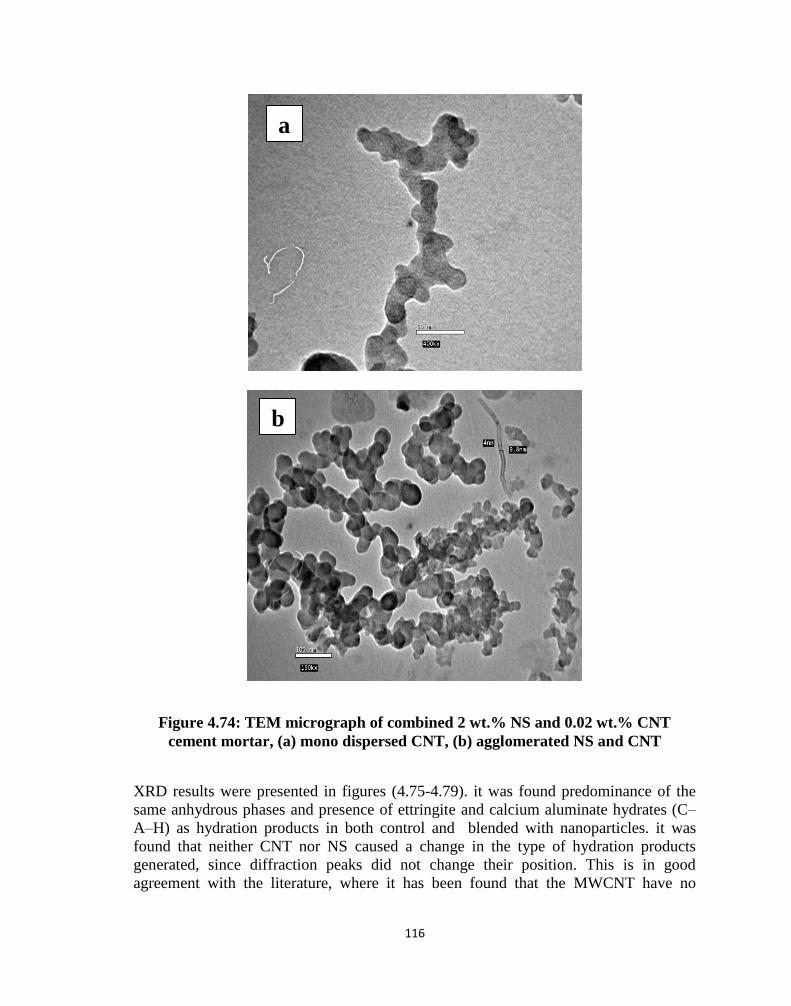
116
Figure 4.74: TEM micrograph of combined 2 wt.% NS and 0.02 wt.% CNT
cement mortar, (a) mono dispersed CNT, (b) agglomerated NS and CNT
XRD results were presented in figures (4.75-4.79). it was found predominance of the
same anhydrous phases and presence of ettringite and calcium aluminate hydrates (C–
A–H) as hydration products in both control and blended with nanoparticles. it was
found that neither CNT nor NS caused a change in the type of hydration products
generated, since diffraction peaks did not change their position. This is in good
agreement with the literature, where it has been found that the MWCNT have no
a
b
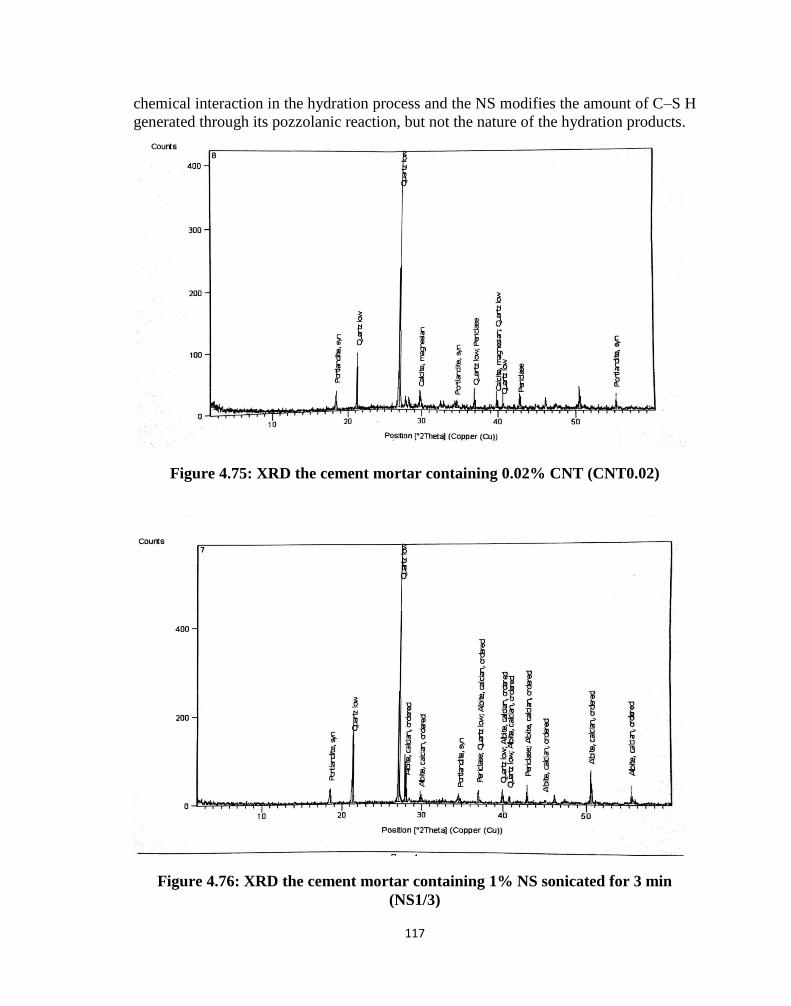
117
chemical interaction in the hydration process and the NS modifies the amount of C–S H
generated through its pozzolanic reaction, but not the nature of the hydration products.
Figure 4.75: XRD the cement mortar containing 0.02% CNT (CNT0.02)
Figure 4.76: XRD the cement mortar containing 1% NS sonicated for 3 min
(NS1/3)
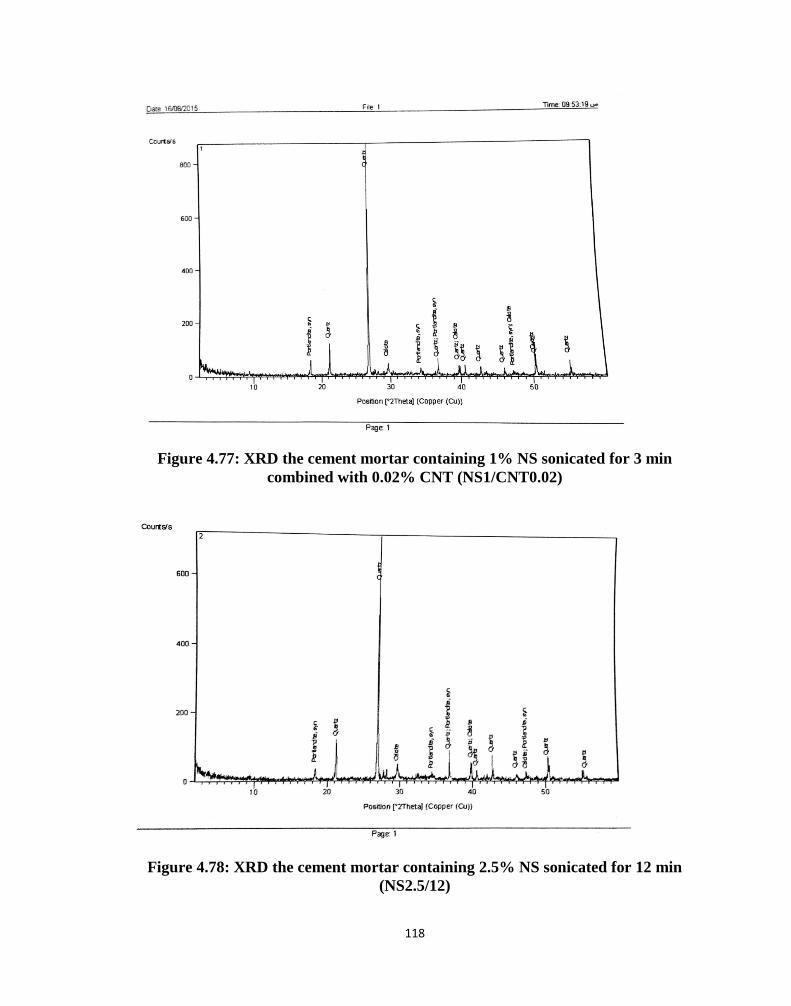
118
Figure 4.77: XRD the cement mortar containing 1% NS sonicated for 3 min
combined with 0.02% CNT (NS1/CNT0.02)
Figure 4.78: XRD the cement mortar containing 2.5% NS sonicated for 12 min
(NS2.5/12)
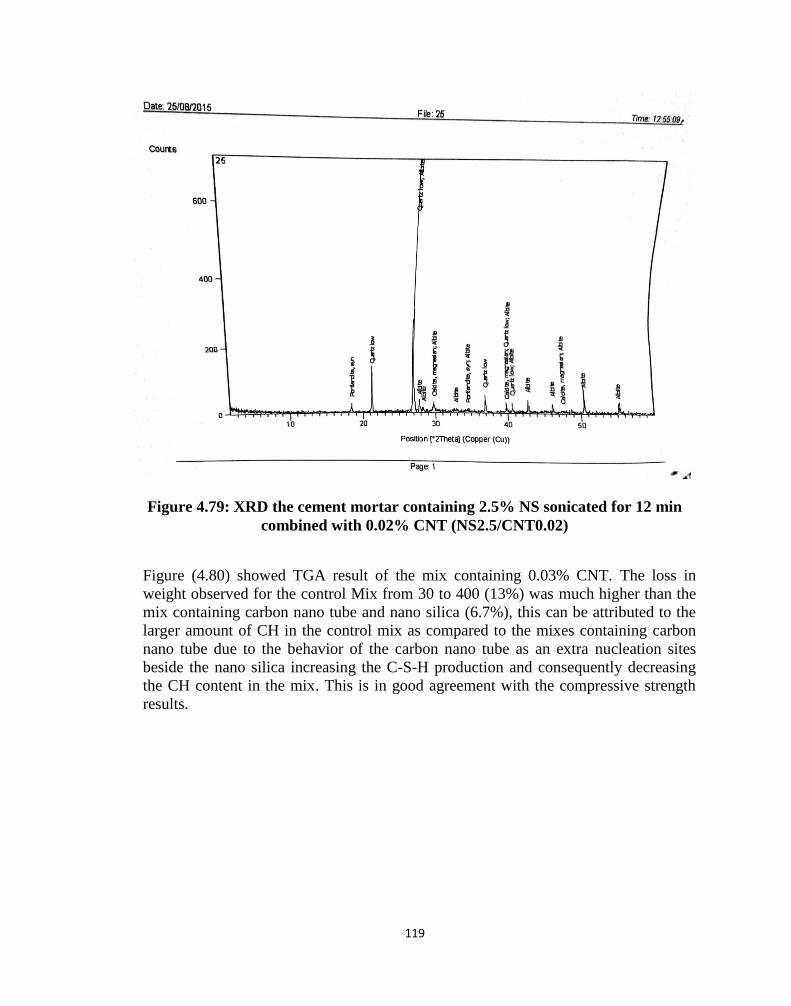
119
Figure 4.79: XRD the cement mortar containing 2.5% NS sonicated for 12 min
combined with 0.02% CNT (NS2.5/CNT0.02)
Figure (4.80) showed TGA result of the mix containing 0.03% CNT. The loss in
weight observed for the control Mix from 30 to 400 (13%) was much higher than the
mix containing carbon nano tube and nano silica (6.7%), this can be attributed to the
larger amount of CH in the control mix as compared to the mixes containing carbon
nano tube due to the behavior of the carbon nano tube as an extra nucleation sites
beside the nano silica increasing the C-S-H production and consequently decreasing
the CH content in the mix. This is in good agreement with the compressive strength
results.
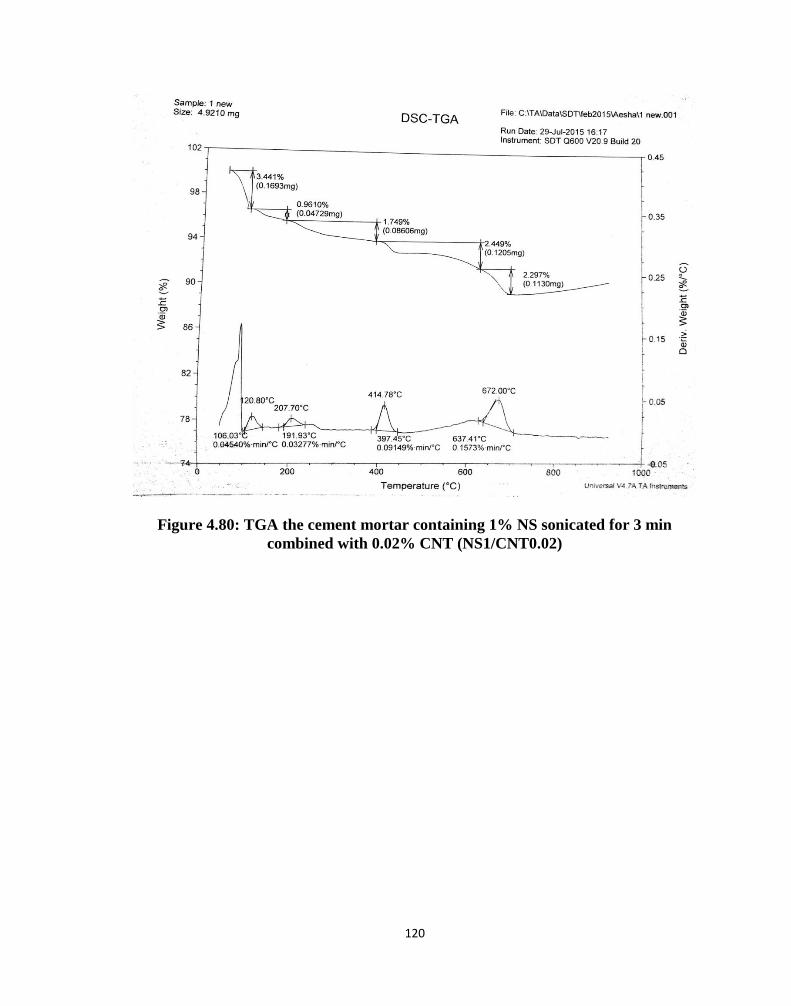
121
Figure 4.80: TGA the cement mortar containing 1% NS sonicated for 3 min
combined with 0.02% CNT (NS1/CNT0.02)
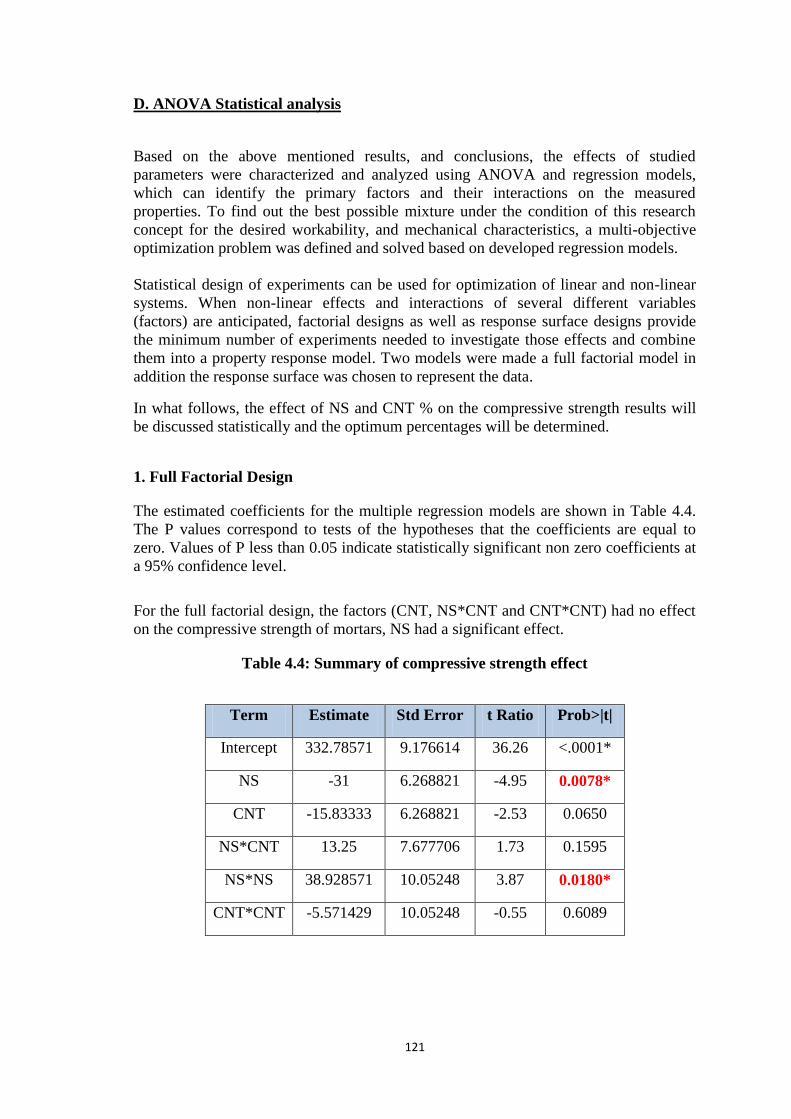
121
D. ANOVA Statistical analysis
Based on the above mentioned results, and conclusions, the effects of studied
parameters were characterized and analyzed using ANOVA and regression models,
which can identify the primary factors and their interactions on the measured
properties. To find out the best possible mixture under the condition of this research
concept for the desired workability, and mechanical characteristics, a multi-objective
optimization problem was defined and solved based on developed regression models.
Statistical design of experiments can be used for optimization of linear and non-linear
systems. When non-linear effects and interactions of several different variables
(factors) are anticipated, factorial designs as well as response surface designs provide
the minimum number of experiments needed to investigate those effects and combine
them into a property response model. Two models were made a full factorial model in
addition the response surface was chosen to represent the data.
In what follows, the effect of NS and CNT % on the compressive strength results will
be discussed statistically and the optimum percentages will be determined.
1. Full Factorial Design
The estimated coefficients for the multiple regression models are shown in Table 4.4.
The P values correspond to tests of the hypotheses that the coefficients are equal to
zero. Values of P less than 0.05 indicate statistically significant non zero coefficients at
a 95% confidence level.
For the full factorial design, the factors (CNT, NS*CNT and CNT*CNT) had no effect
on the compressive strength of mortars, NS had a significant effect.
Table 4.4: Summary of compressive strength effect
Term Estimate Std Error t Ratio Prob>|t|
Intercept 332.78571 9.176614 36.26 <.0001*
NS -31 6.268821 -4.95 0.0078*
CNT -15.83333 6.268821 -2.53 0.0650
NS*CNT 13.25 7.677706 1.73 0.1595
NS*NS 38.928571 10.05248 3.87 0.0180*
CNT*CNT -5.571429 10.05248 -0.55 0.6089
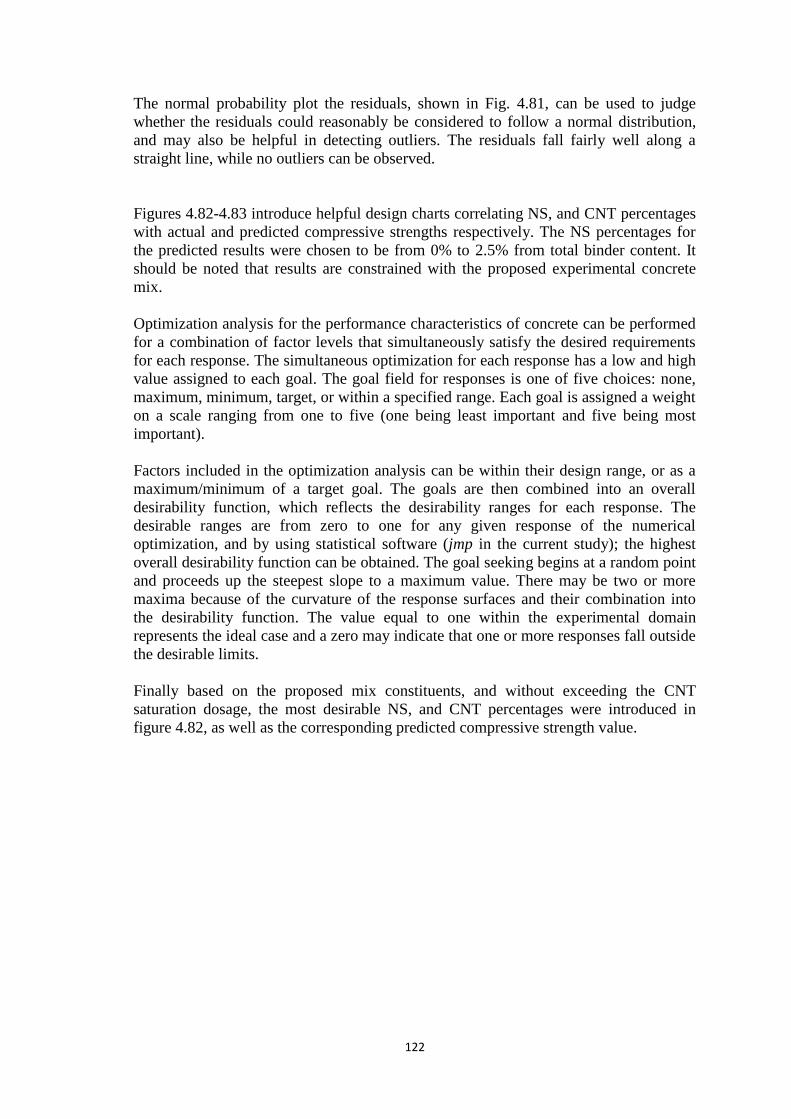
122
The normal probability plot the residuals, shown in Fig. 4.81, can be used to judge
whether the residuals could reasonably be considered to follow a normal distribution,
and may also be helpful in detecting outliers. The residuals fall fairly well along a
straight line, while no outliers can be observed.
Figures 4.82-4.83 introduce helpful design charts correlating NS, and CNT percentages
with actual and predicted compressive strengths respectively. The NS percentages for
the predicted results were chosen to be from 0% to 2.5% from total binder content. It
should be noted that results are constrained with the proposed experimental concrete
mix.
Optimization analysis for the performance characteristics of concrete can be performed
for a combination of factor levels that simultaneously satisfy the desired requirements
for each response. The simultaneous optimization for each response has a low and high
value assigned to each goal. The goal field for responses is one of five choices: none,
maximum, minimum, target, or within a specified range. Each goal is assigned a weight
on a scale ranging from one to five (one being least important and five being most
important).
Factors included in the optimization analysis can be within their design range, or as a
maximum/minimum of a target goal. The goals are then combined into an overall
desirability function, which reflects the desirability ranges for each response. The
desirable ranges are from zero to one for any given response of the numerical
optimization, and by using statistical software (jmp in the current study); the highest
overall desirability function can be obtained. The goal seeking begins at a random point
and proceeds up the steepest slope to a maximum value. There may be two or more
maxima because of the curvature of the response surfaces and their combination into
the desirability function. The value equal to one within the experimental domain
represents the ideal case and a zero may indicate that one or more responses fall outside
the desirable limits.
Finally based on the proposed mix constituents, and without exceeding the CNT
saturation dosage, the most desirable NS, and CNT percentages were introduced in
figure 4.82, as well as the corresponding predicted compressive strength value.
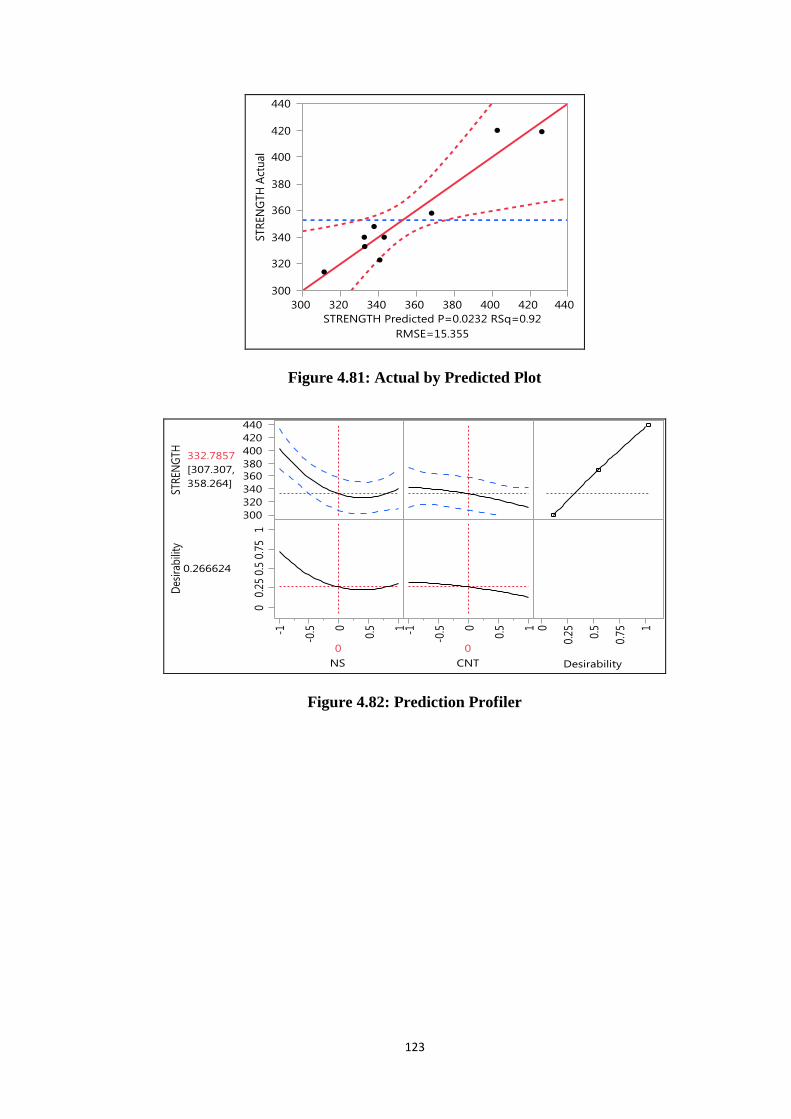
123
Figure 4.81: Actual by Predicted Plot
Figure 4.82: Prediction Profiler
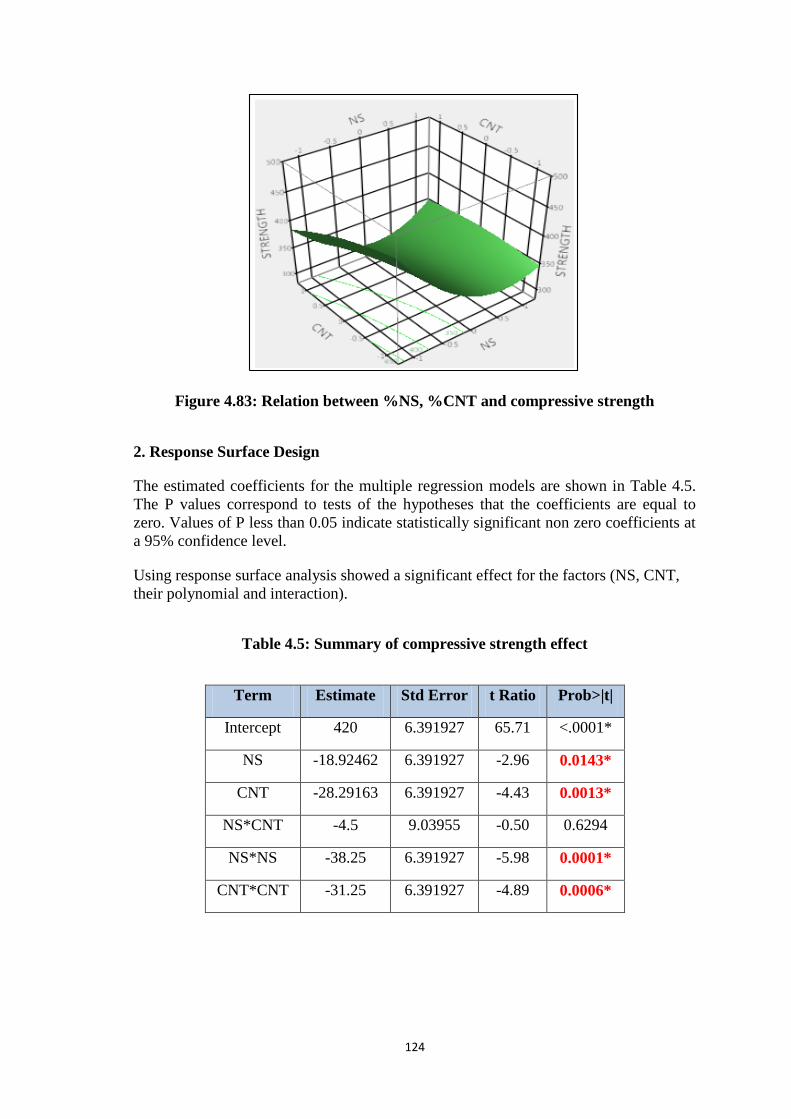
124
Figure 4.83: Relation between %NS, %CNT and compressive strength
2. Response Surface Design
The estimated coefficients for the multiple regression models are shown in Table 4.5.
The P values correspond to tests of the hypotheses that the coefficients are equal to
zero. Values of P less than 0.05 indicate statistically significant non zero coefficients at
a 95% confidence level.
Using response surface analysis showed a significant effect for the factors (NS, CNT,
their polynomial and interaction).
Table 4.5: Summary of compressive strength effect
Term Estimate Std Error t Ratio Prob>|t|
Intercept 420 6.391927 65.71 <.0001*
NS -18.92462 6.391927 -2.96 0.0143*
CNT -28.29163 6.391927 -4.43 0.0013*
NS*CNT -4.5 9.03955 -0.50 0.6294
NS*NS -38.25 6.391927 -5.98 0.0001*
CNT*CNT -31.25 6.391927 -4.89 0.0006*
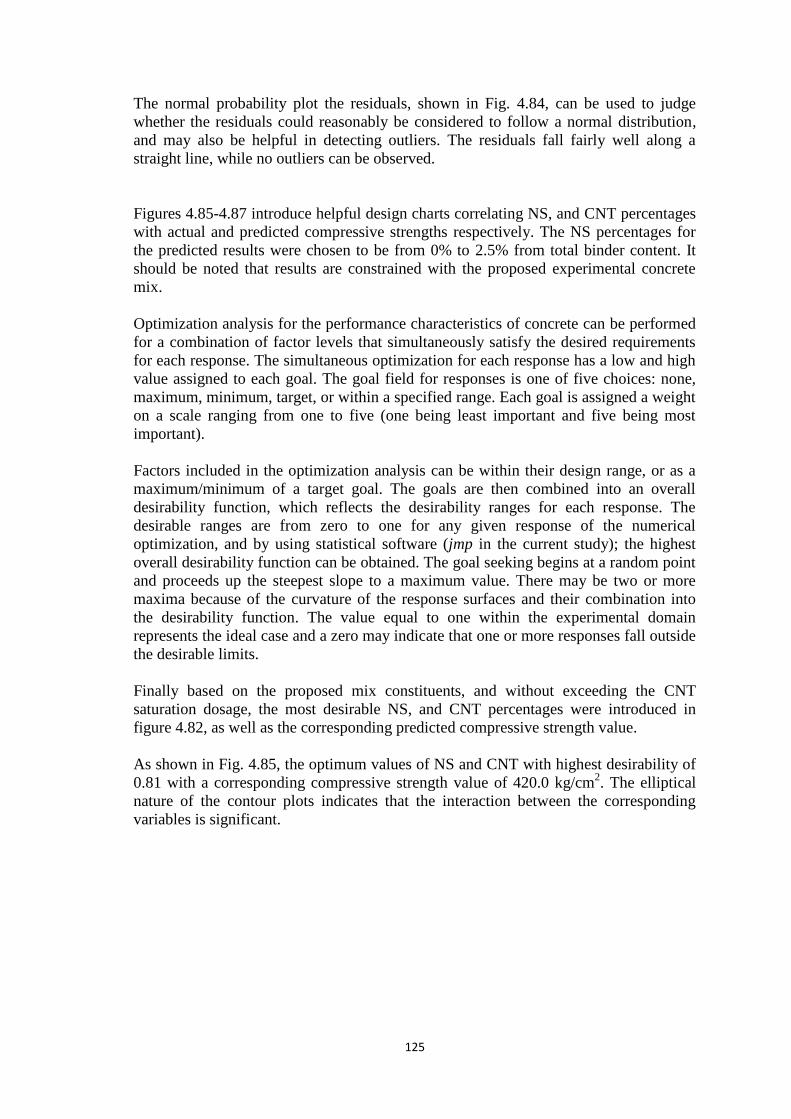
125
The normal probability plot the residuals, shown in Fig. 4.84, can be used to judge
whether the residuals could reasonably be considered to follow a normal distribution,
and may also be helpful in detecting outliers. The residuals fall fairly well along a
straight line, while no outliers can be observed.
Figures 4.85-4.87 introduce helpful design charts correlating NS, and CNT percentages
with actual and predicted compressive strengths respectively. The NS percentages for
the predicted results were chosen to be from 0% to 2.5% from total binder content. It
should be noted that results are constrained with the proposed experimental concrete
mix.
Optimization analysis for the performance characteristics of concrete can be performed
for a combination of factor levels that simultaneously satisfy the desired requirements
for each response. The simultaneous optimization for each response has a low and high
value assigned to each goal. The goal field for responses is one of five choices: none,
maximum, minimum, target, or within a specified range. Each goal is assigned a weight
on a scale ranging from one to five (one being least important and five being most
important).
Factors included in the optimization analysis can be within their design range, or as a
maximum/minimum of a target goal. The goals are then combined into an overall
desirability function, which reflects the desirability ranges for each response. The
desirable ranges are from zero to one for any given response of the numerical
optimization, and by using statistical software (jmp in the current study); the highest
overall desirability function can be obtained. The goal seeking begins at a random point
and proceeds up the steepest slope to a maximum value. There may be two or more
maxima because of the curvature of the response surfaces and their combination into
the desirability function. The value equal to one within the experimental domain
represents the ideal case and a zero may indicate that one or more responses fall outside
the desirable limits.
Finally based on the proposed mix constituents, and without exceeding the CNT
saturation dosage, the most desirable NS, and CNT percentages were introduced in
figure 4.82, as well as the corresponding predicted compressive strength value.
As shown in Fig. 4.85, the optimum values of NS and CNT with highest desirability of
0.81 with a corresponding compressive strength value of 420.0 kg/cm2. The elliptical
nature of the contour plots indicates that the interaction between the corresponding
variables is significant.
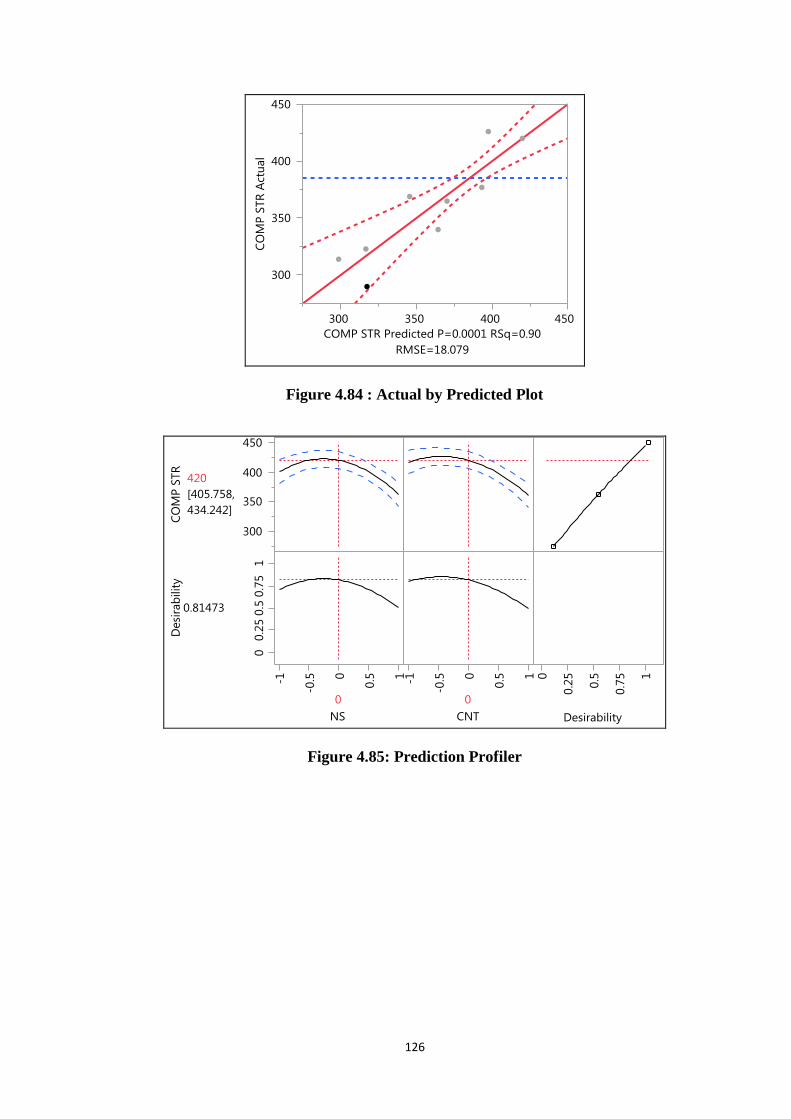
126
Figure 4.84 : Actual by Predicted Plot
Figure 4.85: Prediction Profiler
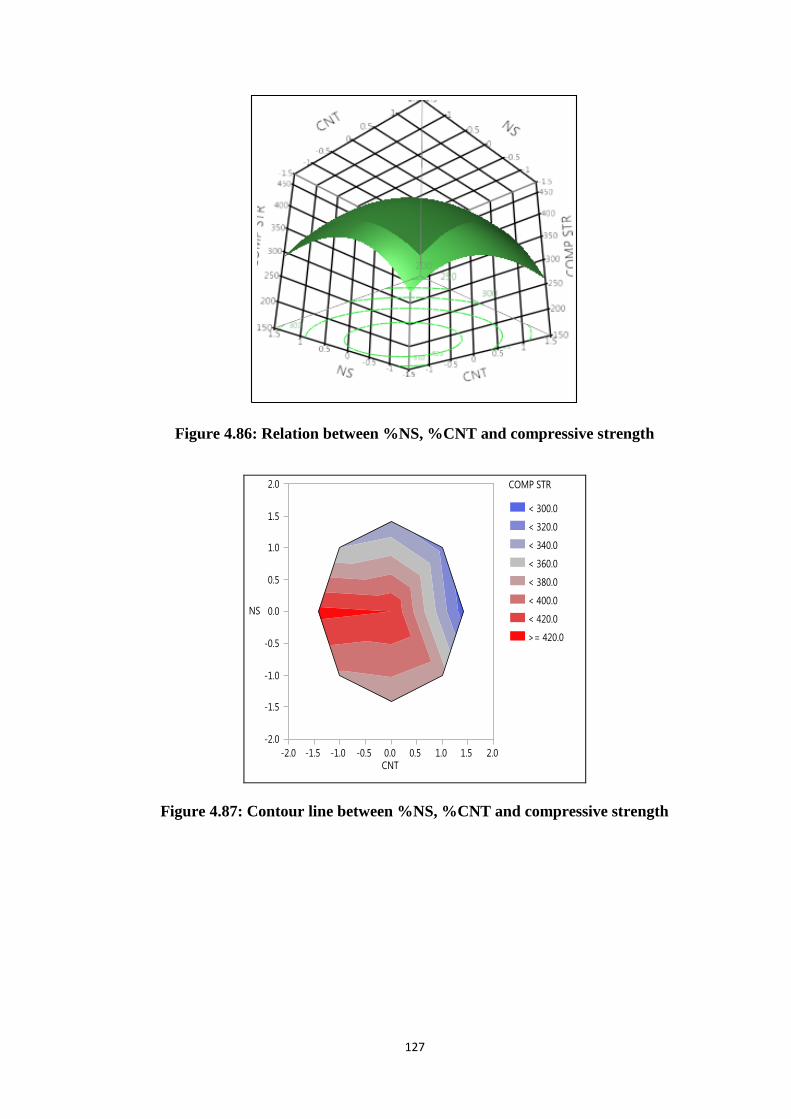
127
Figure 4.86: Relation between %NS, %CNT and compressive strength
Figure 4.87: Contour line between %NS, %CNT and compressive strength
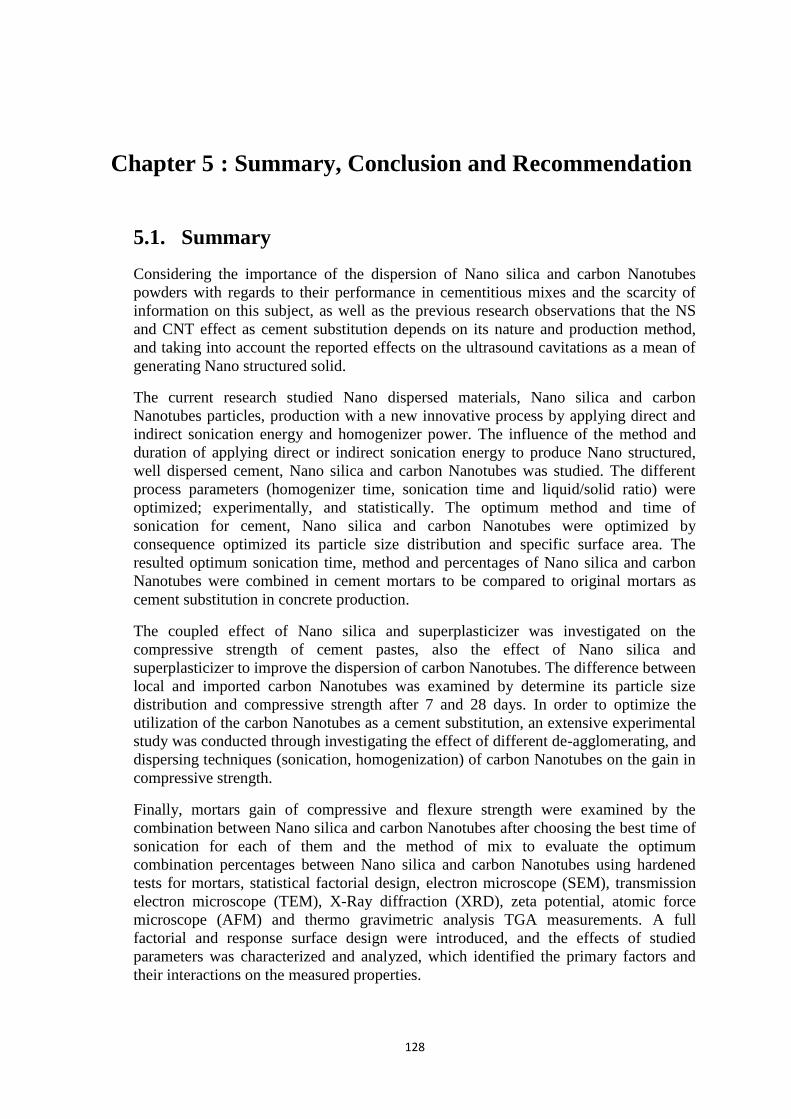
128
Chapter 5 : Summary, Conclusion and Recommendation
5.1. Summary
Considering the importance of the dispersion of Nano silica and carbon Nanotubes
powders with regards to their performance in cementitious mixes and the scarcity of
information on this subject, as well as the previous research observations that the NS
and CNT effect as cement substitution depends on its nature and production method,
and taking into account the reported effects on the ultrasound cavitations as a mean of
generating Nano structured solid.
The current research studied Nano dispersed materials, Nano silica and carbon
Nanotubes particles, production with a new innovative process by applying direct and
indirect sonication energy and homogenizer power. The influence of the method and
duration of applying direct or indirect sonication energy to produce Nano structured,
well dispersed cement, Nano silica and carbon Nanotubes was studied. The different
process parameters (homogenizer time, sonication time and liquid/solid ratio) were
optimized; experimentally, and statistically. The optimum method and time of
sonication for cement, Nano silica and carbon Nanotubes were optimized by
consequence optimized its particle size distribution and specific surface area. The
resulted optimum sonication time, method and percentages of Nano silica and carbon
Nanotubes were combined in cement mortars to be compared to original mortars as
cement substitution in concrete production.
The coupled effect of Nano silica and superplasticizer was investigated on the
compressive strength of cement pastes, also the effect of Nano silica and
superplasticizer to improve the dispersion of carbon Nanotubes. The difference between
local and imported carbon Nanotubes was examined by determine its particle size
distribution and compressive strength after 7 and 28 days. In order to optimize the
utilization of the carbon Nanotubes as a cement substitution, an extensive experimental
study was conducted through investigating the effect of different de-agglomerating, and
dispersing techniques (sonication, homogenization) of carbon Nanotubes on the gain in
compressive strength.
Finally, mortars gain of compressive and flexure strength were examined by the
combination between Nano silica and carbon Nanotubes after choosing the best time of
sonication for each of them and the method of mix to evaluate the optimum
combination percentages between Nano silica and carbon Nanotubes using hardened
tests for mortars, statistical factorial design, electron microscope (SEM), transmission
electron microscope (TEM), X-Ray diffraction (XRD), zeta potential, atomic force
microscope (AFM) and thermo gravimetric analysis TGA measurements. A full
factorial and response surface design were introduced, and the effects of studied
parameters was characterized and analyzed, which identified the primary factors and
their interactions on the measured properties.
129
5.2. Conclusion
5.2.1. Optimizing the type and time of sonication on the dispersion of
Nano silica
5.2.1.1. The effect of sonication type on the dispersion of NS (stage 1)
Nano silica dispersion using direct and indirect sonication was significantly
enhanced.
The optimum time of direct sonication was found to be 1 minute, while 3 minutes
were found to be the optimum dispersion time when using indirect sonication.
By comparing the specific surface area and particle size distribution for Nano silica
particles; the optimum sonication method was chosen to be the indirect sonication.
5.2.1.2. The effect of sonication time on the dispersion of NS (stage 2)
NS with different dosages increased the compressive strength at 3 min. sonication
till 1% and then re-agglomerated for the higher percentages, the same trend occurred
for 6 and 12 min.
Flexure strength trend is opposed proportional with compressive strength due to the
reaction of NS in early ages so ettringite needles had the opportunity to increase the
flexure strength at the latter age.
The optimum time of sonication for the following percentages of NS by cement
weight 0.5%, 1%, 1.5%, 2% and 2.5% was 3, 3, 6, 12 and 12 minutes respectively.
In general, the gain in compressive strength in early age was higher than that in latter
age because most of NS reacted with CH early.
The optimum NS concentration by consequence time of sonication was 2.5% by
cement weight sonicated for 12 minutes using indirect sonication method. Gain in
compressive strength was 97% and 40% for 7 and 28 days respectively as compared
to the reference mortar.
Specific surface area is the dominant factor to determine the optimum dispersion
time and dosage of NS.
The highest flexure strength was reached using 0.5 wt.% NS sonicated for 1.5
minutes or 2 wt.% NS sonicated for 3 minutes. The gain in flexure strength was
100% as compared to the reference beam.
5.2.2. Optimizing the type and time of sonication on the dispersion of
CNT
5.2.2.1. The effect of sonication type on the dispersion of CNT (stage 1)
Sonication is an effective dispersion method for carbon Nanotubes but a balance
between the degree of damage induced by it and the dispersion level desired has to
be found to guarantee that the MWCNT will have an adequate mechanical
performance when introduced in a cement matrix and exposed to compressive and
flexure strengths.
Carbon Nanotubes improves the mechanical behavior of composite at the small
strain. This improvement disappears at relatively large strain because the completely
131
de-bonded Nanotubes behave like voids in the matrix and may weaken the
composite. The increase of interface adhesion between carbon Nanotubes and
polymer matrix may significantly improve the composite behavior at the large
strain(80).
The use of CNT as received resulted in loss of compressive strength (-15%).
The adding of SP helped the CNT to disperse well and increased the compressive
strength of cement pastes by 40% as compared to that one contained CNT only, so
SP enhanced significantly the dispersion of CNT.
5.2.2.2. Introduce a novel technique for the dispersion of CNT (stage 2)
The optimum treatment method of CNT (S40H10) obtained a gain 62% in
compressive strength.
Homogenizer (H60) breaks the CNT particles into equal sizes which is not
recommended to act as bridges for different sizes of cracks into the matrix.
5.2.3. Optimizing the couple effect of Nano silica and carbon Nanotube
on the mechanical properties of cement composites (phase 2)
5.2.3.1. Optimizing the effect of different dosages of CNT on the mechanical
properties of cement mortars (stage 1)
Within the studied different amounts of CNT, 0.03% CNT by cement weight is the
optimum percentage as compared to 0.01 and 0.02%.
The gain in compressive strength obtained for 0.03 wt.% CNT was 50% and 23%
after 7 and 28 days respectively.
No matter the dosage used of CNT to increase the flexure strength, the flexure
strength increased significantly by 67% for all CNT mixes as compared to the
control beam.
5.2.3.2. Optimizing the couple effect of different dosages of NS and CNT on the
mechanical properties of cement mortars (stage 2)
The combined effect of NS and CNT was examined on cement mortars. The
optimum combination was 0.02% CNT and 1% NS. Gain in compressive strength
obtained was 72% and 35% after 7 and 28 days.
As for the flexure strength, mortars which contained CNT and NS together, the
optimum content was 0.5% NS sonicated for 3 minutes combined with 0.01% CNT
by cement weight. The gain in strength was 100%.
The combination of NS with low amount of CNT had a positive effect on the
hydration reaction, presence of individual CNT worked as extra nucleation spots for
the hydrates and enhanced the activity of the NS.
The combination of CNT and a high amount of NS had negative effect on the
hydration reaction. NS sucks water between its particles and affect negatively the
production of hydrates of the cement due to its re-agglomeration.
The combination of NS and a high amount of CNT had negative effect on the
hydration reaction. Ca(OH)2 affected the stability of CNT dispersion due to its
interaction with negative charges of the OH functional groups, which caused
131
generated re-agglomeration of CNT and decreased the availability of Ca(OH)2 for
the NS to react with and produce more C-S-H.
As for the statistical analysis, the response surface model showed to represent the
CNT – NS coupled interaction effectively as compared to the full factorial model.
132
5.3. Recommendation
The research work achieved in this thesis has showed several areas where further
research is necessary. It is recommended that fulfillment should be made into the
following:
Study the effect of more dosages of NS and CNT on the mechanical properties of the
cement composites.
Study the effect of different types of fly ash, silica fume, micro silica etc. combined
with CNT.
Study the effect of specific surface area to get optimum compressive strength.
Higher percentages of CNT by cement weight combined to NS is strongly
recommended to study its effect.
Study the effect of adding different weights and types of superplasticizer on the
dispersion of CNT and the mechanical properties of cement composites by
combined to NS.
Introduce a technique for the dispersion of NS and CNT together.
133
References
1. Maheswaran S.; Bhuvaneshwari B.; G.S., Palani; Iyer, Nagesh R and S.,
Kalaiselvam. " An Overview on the Influence of Nano Silica in Concrete and a
Research Initiative ". Chennai, INDIA : Research Journal of Recent Sciences, 2012.
Vol. 2. ISSN 2277-2502.
2. S. Altoubat, A. Yazdanbakhsh, and K.-A. Rieder. " Shear behavior of macro-
synthetic fiber-reinforced concrete beams without stirrups ". s.l. : ACI Materials
Journal, vol. 106, no. 4, pp. 381–389, 2009.
3. C. Wang, K.-Z. Li, H.-J. Li, G.-S. Jiao, J. Lu and D.-S. Hou. " Effect of carbon
fiber dispersion on the mechanical properties of carbon fiber-reinforced cement-based
composites ". s.l. : Materials Science and Engineering A, vol. 487, no. 1-2, pp. 52–57,
2008.
4. Babak Fakhim Abolfazl Hassani Alimorad Rashidi and Parviz Ghodousi. "
Predicting the impact of multiwalled carbon Nanotubes on the cement hydration
products and durability of cementitious matrix using artificial neural network modeling
technique ". s.l. : The ScientificWorld Journal, 2013.
5. Al-Rub, Rashid K. Abu; Ashour, Ahmad I. and Tyson, Bryan M. " On the aspect
ratio effect of multi-walled carbon nanotube reinforcements on the mechanical
properties of cementitious nanocomposites ". s.l. : Construction and Building Materials
35 (2012) 647–655, 2012.
6. G.Quercia and H. J. H. Brouwers. " Application of nano-silica (nS) in concrete
mixtures ". Denmark : 8th fib PhD Symposium in Kgs. Lyngby, 2010.
7. Qing, Y.; Zhang, Z.; Kong, D. and Chen, R. " Influence Of Nano-Sio2 Addition on
Properties of Hardened Cement Paste as Compared With Silica Fume ". s.l. :
Construction and Building Materials 21: 539-545, 2005.
8. EL-Baky, Sayed Abd; Yehia, Sameh and Khalil, Ibrahim S. " Influence of
Nanon-silica addition on properties of fresh and hardened cement mortar ". Czech
Republic : NANOcon 2013, 2013.
9. Bharj, Jyoti; Singh, Sarabjit; Chander, Subhash and Singh, Rabinder. " Role of
dispersion of multiwalled carbon Nanotubes on compressive strength of cement paste ".
India : International Journal of Mathematical, Computational, Physical and Quantum
Engineering, 2014. Vol. 8.
10. Simone Musso, Jean-Marc Tulliani, Giuseppe Ferro and Alberto Tagliaferro. "
Influence of carbon nanotubes structure on the mechanical behavior of cement
composites ". s.l. : Composites Science and Technology 69, 2009.
134
11. Oscar Mendoza, Germán Sierra and Jorge I. Tobón. " Effect of the
reagglomeration process of multi-walled carbon nanotubes dispersions on the early
activity of nanosilica in cement composites ". s.l. : Construction and Building Materials
54, 550–557, 2014.
12. Wang, Baomin; Han, Yu and Liu, Shuai. " Effect of highly dispersed carbon
nanotubes on the flexural toughness of cement-based composites ". s.l. : Construction
and Building Materials 46 (2013) 8–12, 2013.
13. Li, Geng Ying; b, Pei Ming Wang and Zhao, Xiaohua. " Mechanical behavior
and microstructure of cement composites incorporating surface-treated multi-walled
carbon Nanotubes ". s.l. : Carbon 43; 1239–1245, 2004.
14. G.T. Caneba, Dutta C., Agrawal V. and Rao M. " Novel ultrasonic dispersion of
carbon Nanotubes ". s.l. : Journal of Minerals & Materials Characterization &
Engineering, 2010. Vol. 9.
15. El-Feky, Muhammad Samy. " Optimizing the preparation and utilization of Nano
silica to enhance concrete properties and behaviour, Ph.D thesis ". Faculty of
Engineering, Cairo University : s.n., 2014.
16. Hugo Miguel Santos, Carlos Lodeiro and Jose-Luis Capelo-MartRnez. " The
power of ultrasound ". s.l. : Ultrasound in Chemistry: Analytical Applications, 2009.
17. Ardavan Yazdanbakhsh, Zachary Grasley, Bryan Tyson and Rashid K. Abu
Al-Rub. " Distribution of Carbon Nanofibers and Nanotubes in Cementitious
Composites ". Washington : Transportation Research Record: Journal of the
Transportation Research Board no. 2142, 2010.
18. Sobolev, Konstantin; Flores, Ismael; Hermosillo, Roman; Torres-Martínez and
Leticia M. " Nanomaterials and Nanotechnology for high performance cement
composites ". USA : s.n., 2006.
19. Olar, Radu. " Nanomaterials and Nanotechnologies for civil engineering ". s.l. :
Technical University ofIaşi,2011.
20. Jemimah Carmichael.M and Prince Arulraj.G. " Influence of nano materials on
consistency, setting time and compressive strength of cement mortar ". India :
Engineering Science and Technology: An International Journal (ESTIJ), 2012. Vol. 2.
No.1.
21. Hui, L.; Hui-Gang, X.; Jie, Y. and Jinping, O. " Microstructure Of Cement
Mortar With Nano Particles ". s.l. : Composites Part B: Engineering 35: 185-189, 2003.
22. Jal, P.K.; Sudarshan, M.; Saha, A.; Sabita, P. and Mishra, B.K. " Synthesis and
characterization of Nanosilica prepared by precipitation method ". s.l. : Colloidals and
Surface 240: 173-178, 2004.
135
23. Sobolev, K; Flores, I; Torres-Martinez, Lm; Valdez, Pl; Zarazua, E and
Cuellar, El. " Engineering of Sio2 Nano Particles For Optimal Performance in Nano
Cement Based Materials ". Prague, Czech Republic : Nanotechnology In Construction:
Proceedings Of The Nicom3 (3rd International Symposium On Nanotechnology In
Construction), 2009.
24. Sobolev, K. and Ferrada-Gutiérrez, M. " How Nanotechnology Can Change The
Concrete World: Part 2 ". s.l. : Am Ceram Soc Bull 84(11):16–9, 2005.
25. Li, H; Xiao, H-G; Yuan, J and Ou, J. " Microstructure of cement mortar with
Nano particles ". s.l. : Compos. Building Engineering 35(2):185–9, 2004.
26. Tobon, J. I; Restrepo, O. J; Paya, J. " Comparative Analysis of Performance of
Portland Cement Blended With Nanosilica and Silica Fume ". 2010.
27. F. Sanchez and K. Sobolev. " Nanotechnology in Concrete – A Review ". s.l. :
Construction Building Materials 24:2060–71, 2010.
28. Jo, Bw; Kim, Ch; Tae, G; Park, Jb. " Characteristics Of Cement Mortar With
Nano- Sio2 Particles ". s.l. : Construction Building Materials 21(6):1351–5, 2007.
29. Du, Hongjian; Du, Suhuan; Liu, Xuemei. " Durability performances of concrete
with nano-silica ". s.l. : Construction and Building Materials 73 (2014) 705–712, 2014.
30. Deyu Kong, Xiangfei Du , Su Wei , Hua Zhang , Yang Yang and Surendra P.
Shah. " Influence of Nano-Silica Agglomeration on Microstructure and Properties of
the Hardened Cement-Based Materials ". s.l. : Construction And Building Materials 37
(707–715), 2012.
31. Hesam Madani, Alireza Bagheri and Tayebeh Parhizkar. " The pozzolanic
reactivity of mono dispersed Nanosilica hydrosols and their influence on the hydration
characteristics of Portland cement ". s.l. : Cement And Concrete Research 42; 1563–
1570, 2012.
32. Deyu Kong, Yong Su, Xiangfei Du, Yang Yang, Su Wei and Surendra P. Shah.
" Influence of Nano-silica agglomeration on fresh properties of cement pastes ". s.l. :
Construction and Building Materials 43 (557–562), 2013.
33. Tina Oertel, Frank Hutter , Ricarda Tanzer, Uta Helbig and Gerhard Sextl. "
Primary particle size and agglomerate size effects of amorphous silica in ultra-high
performance concrete ". s.l. : Cement & Concrete Composites 37 (61-67), 2013.
34. Porro A, Dolado Js, Campillo I, Erkizia E, Miguel Y De, Ibara Ysaezde,
Ayuela A. " Effect of Nanosilica Additions on Cement Pastes. in: Applications of
Nanotechnology in Concrete Design ". 2005.
136
35. Qing, Y; Zenan, Z; Li, S; Rongshen, C. " A Comparative Study on the Pozzolanic
Activity Between Nano-Sio2 and Silica Fume ". s.l. : J Wuhan Univ Technol – Mater
Sci, 2008.
36. Amiri A, Øye G and Sjo Blem J. " Influence of Ph, high salinity and particle
concentration on stability and rheological properties of aqueous suspensions of fumed
silica ". s.l. : Colloid Interfaces A: Physicochemical Eng Asp 349:43–54, 2009.
37. J.Y. Shih, T.P. Chang and T.C. Hsiao. " Effect of Nanosilica on Characterization
of Portland cement Composite ". s.l. : Mater. Sci. Eng. A-Struct. 424, 2006.
38. M.H. Zhang and J. Islam. " Use Of Nano-silica to reduce setting time and
increase early strength of concretes with high volumes of fly ash or slag ". s.l. : Constr.
Build. Mater. 29, 2012.
39. Plank, C. Schroefl, M. Gruber, M. Lesti, R. Sieber. " Effectiveness of
Polycarboxylate Superplasticizers In Ultra-High Strength Concrete: The Importance
Of Pce Compatibility With Silica Fume ". s.l. : J. Adv. Concr. Technol. 7, 2009.
40. A. Papo, L. Piani. " Effect Of Various Superplasticizers On The Rheological
Properties Of Portland Cement Pastes ". s.l. : Cem. Concr. Res. 34, 2004.
41. Magarotto R, Torresan I and Zeminian N. " Influence of the molecular weight of
polycarboxylate ether superplasticizers on the rheological properties of fresh cement
pastes, mortar and concrete ". s.l. : 11th International Congress On The Chemistry Of
Cement, 2003.
42. Alonso Mm, Palacios M, Puertas F, De La Torre Ag and Aranda Mag. " Effect
Of Polycarboxylate Admixture Structure On Cement Paste Rheology ". s.l. : Mater
Construc build., 2007.
43. Li C, Feng N-Q, Li Y-D and Chen R-J. " Effects Of Polyethylene Oxide Chains
On The Performance Of Polycarboxylate-Type Waters Reducers ". s.l. : Cem Concr
Res, 2006.
44. Sahmaran M, Christianto Ha and Yaman. " The effect of chemical admixtures
and mineral additives on the properties of self compacting mortars ". s.l. : Cem. Concr.
Compos., 2006.
45. Palacios M, Puertas F, Bowen P and Houst Yf. " Effect of Pcs superplasticizers
on the rheological properties and hydration process of slag-blended cement pastes ".
s.l. : J. Mater Sci, 2009.
46. Olga Burgos-Montes, Marta Palacios, Patricia Rivilla, Francisca Puertas. "
Compatibility Between Superplasticizer Admixtures And Cements With Mineral
Additions ". s.l. : Construction And Building Materials 31, 2012.
137
47. J.M. Fernández A, A. Duran A, I. Navarro-Blasco A, J. Lanas B, R. Sirera A
and J.I. Alvarez. " Influence Of Nanosilica And A Polycarboxylate Ether
Superplasticizer On The Performance Of Lime Mortars ". s.l. : Cement And Concrete
Research 43, 2013.
48. Balaguru, Perumalsamy and Chong, Ken. " Nanotechnology and concrete:
research opportunities ". USA :ProceedingsofACISessionon“Nanotechnologyof
Concrete: Recent Developments and FuturePerspectives”,2006.
49. Ferro, Giuseppe; Tulliani, Jean-Marc and Musso, Simone. " Carbon nanotubes
cement composites ". Italy : s.n., 2011. ISBN 978-88-95940-36-6.
50. Kordkheili, Hamed Younesi; Hiziroglu, Salim and Farsi, Mohammad. " Some
of the physical and mechanical properties of cement composites manufactured from
carbon nanotubes and bagasse fiber ". s.l. : Materials and Design 33; 395–398, 2011.
51. Bryan M. Tyson, Rashid K. Abu Al-Rub, Ardavan Yazdanbakhsh and
Zachary Grasley. " Carbon Nanotubes and Carbon Nanofibers for Enhancing the
Mechanical Properties of Nanocomposite ". s.l. : American Society of Civil Engineers,
2011.
52. Petrunin, Sergey; Vaganov, Viktor and Sobolev, Konstantin. " The effect of
functionalized carbon nanotubes on the performance of cement composites ". Czech
Republic : NANOcon 2013, 2013.
53. Kim, H.K.; Nam, I.W. and Lee, H.K. " Enhanced effect of carbon nanotube on
mechanical and electrical properties of cement composites by incorporation of silica
fume ". s.l. : Composite Structures 107 (2014) 60–69, 2013.
54. Siddique, Rafat; Mehta, Ankur. " Effect of carbon nanotubes on properties of
cement mortars ". s.l. : Construction and Building Materials 50 (2014) 116–129, 2014.
55. Hamzaoui, R.; Bennabi, A.; S.Guessasma; Khelifa, M.R. and Leklou, N. "
Optimal Carbon NanoTubes concentration incorporated in mortar and concrete ". s.l. :
Advanced Materials Research 587, 2012.
56. Yakovlev, Grigorij; Keriene, Jadvyga; Gailius, Albinas; Girniene, Ingrida. "
Cement Based Foam Concrete Reinforced by Carbon Nanotubes ". Russia : Materials
Science, 2006. Vol. Vol. 12. ISSN 1392–1320.
57. Maria S. Konsta-Gdoutos, Zoi S. Metxa and Surendra P. Shah. " Nanoimaging
of highly dispersed carbon Nanotube reinforced cement based materials ". s.l. :
Seventh intnl. RILEM symp. on fibre reinforced concrete : design and applications,
2008.
58. Jiang L., Gao L. and Sun J. " Production of aqueous colloidal dispersion of
carbon nanotubes ". s.l. : Colloid Interface Sci.; 260:89–94, 2003.
138
59. Chapell MA., George AJ., Dontsova KM., Porter BE., Price CL. and Zhou P. "
Surfactive stabilisation of multi-walled carbon nanotubes dispersion with dissolved
humic substances ". s.l. : Environ Poll;157:1081–7, 2009.
60. Anastasia Sobolkina, Viktor Mechtcherine, Vyacheslav Khavrus, Diana Maier,
Mandy Mende, Manfred Ritschel and Albrecht Leonhardt. " Dispersion of carbon
nanotubes and its influence on the mechanical properties of the cement matrix ". s.l. :
Cement & Concrete Composites 34 (2012) 1104–1113, 2012.
61. Guido Pagani, Micah J. Green, Philippe Poulin and Matteo Pasquali. "
Competing mechanisms and scaling laws for carbon nanotube scission by
ultrasonication ". s.l. : physical applied sciences conf., 2012.
62. Dr.T.Ch.Madhavi; Pavithra.P; Singh, Sushmita Baban; Raj, S.B.Vamsi; Paul,
Surajit. " Effect of Multiwalled Carbon Nanotubes On Mechanical Properties of
Concrete ". chennai city, India : international journal of scientific research, 2013. Vol.
2. ISSN No 2277 - 8179.
63. Weglowych, Wplywnaborurek; Ściskanie, Wytrzmalosc NA; Cementowych,
Kompozytow. " Carbon nanotubes influence on the compressive strength of cement
composites ". Poland : Technical transactions, civil engineering, 2014.
64. Carbon nanotubes cement composites. Ferro, Giuseppe, Tulliani, Jean-Marc and
Musso, Simone. Italy : s.n., 2011. ISBN 978-88-95940-36-6.
65. Collins, Frank; Lambert, John and Duan, Wen Hui. " The influences of
admixtures on the dispersion, workability, and strength of carbon Nanotube–OPC
paste mixtures ". s.l. : Cement & Concrete Composites 34: 201–207, 2012.
66. Oscar Mendoza, Germán Sierra and Jorge I. Tobón. " Influence of super
plasticizer and Ca(OH)2 on the stability of functionalized multi-walled carbon
nanotubes dispersions for cement composites applications ". s.l. : Construction and
Building Materials 47, 2013.
67. Jarolim, Tomáš; Labaj, Martin and Hela, Rudolf. " Possibilities of dispergation
of carbon Nanotubes in aquaeous solution ". Czech Republic : NANOcon 2014, 2014.
68. Peter Stynoski, Paramita Mondal and Charles Marsh. " Effects of silica
additives on fracture properties of carbon nanotube and carbon fiber reinforced
Portland cement mortar ". s.l. : Cement & Concrete Composites 55, 232–240, 2015.
69. Okamura H, Ozawa K and Ouchi M. " Self-compacting concrete ". s.l. : Struct.
Concr.; 1:3–17, 2000.
70. Nehdi Ml and Summer J. " Optimization of ternary cementitious mortar blends
using factorial experimental plans ". s.l. : Material Struct.; 35:495–503, 2002.
139
71. Soudki, K.A., El-Salakawy, E.F.and Elkum, N.B. " Full Factorial Optimization
Of Concrete Mix Design For Hot Climates ". s.l. : Journal Of Materials In Civil
Engineering, Asce 13 (6), 2001.
72. Al Qadi Arabi, N.S., Mustapha, Kamal Nasharuddin, Al-Mattarneh, Hashem,
Qahir, N.S., Al-Kadi, Qahir N.S. " Central Composite Design Models For
Workability And Strength Of Self-Compacting Concrete ". s.l. : Journal Of Engineering
And Applied Science 4 (3), 2009.
73. L. Senffa, D. Hotza, W.L. Repette, V.M. Ferreira and J.A. Labrincha. "
Mortars with Nano-Sio2 and micro-Sio2 investigated by experimental design ". s.l. :
Constr. Build. Mater. 24, 2010.
74. Fábio de Paiva Cotaa, Túlio Hallak Panzeraa, Marco Antônio Schiavona,
André Luís Christoforo, Paulo Henrique Ribeiro Borges, Chris Bowen and
Fabrizio Scarpa. " Full Factorial Design Analysis of Carbon Nanotube Polymer-
Cement Composites ". s.l. : Materials Research 15(4): 573-580, 2012.
75. M. Sonebi and M.T. Bassuoni. " Investigating the effect of mixture design
parameters on pervious concrete by statistical modeling ". s.l. : Construction and
Building Materials 38, 2013.
76. Wibetoe, G., Takuwa, D.T., Lund, W. and Sawula, G. s.l. :Fresenius’Journalof
Analytical Chemistry, 363, 46–54, 1999.
77. Santos, H.M. and Capelo, J.L. s.l. : Talanta, 73, 795–802, 2007.
78. [Online] July 23, 2015. http://www.wikipedia.org.
79. Srinivasan S., Barbhuiya S., Charan D. and Pandey S.P. " Characterizing
Cement Superplasticizer Interaction Using Zeta Potential Measurements ". s.l. :
Construction Building Materials, 2010.
80. Rashad, Alaa M. " A comprehensive overview about the effect of nano-SiO2 on
some properties of traditional cementitious materials and alkali-activated fly ash ".
s.l. : Construction and Building Materials 52 (2014) 437–464, 2014.
81. Li, H.; Zhang, M.; Ou, J. " Abrasion Resistance of Concrete Containing Nano
Particles for Pavement ". s.l. : Wear 260, 2006.
82. J Bjornstrom, A Martinelli and A Matic. " Accelerating Effects of Colloidal
Nano- Silica For Beneficial Calcium Silicate Hydrate Formation in Cement ". s.l. :
Chem Phys Lett 2004; 392(1–3):242–8.
83. M. Valipour, A. Mirdamadi, M. Shekarchi. " Comparative study of nano-SiO2
and silica fume on gas permeability of high performance concrete (HPC) ". s.l. :
Proceedings of FraMCoS-7, 2010.
141
84. Mostafa, Jalal; Esmaeel, Mansouri; Mohammad, Sharifipour and Reza,
Pouladkhan Ali. " Mechanical, rheological, durability and micro structural properties
of high performance self-compacting concrete containing Sio2 micro and
Nanoparticles ". s.l. : Materials And Design 34; 389–400, 2012.
85. Šmilaue, Vít; Hlavácek, Petr and Padevet, Pavel. " Micromechanical Analysis of
Cement Paste with Carbon Nanotubes ". Czech Republic : Acta Polytechnica, 2012.
Vol. 52.
86. Said, A.M.; Zeidan, M.S.; Bassuoni, M.T. and Tian, Y. " Properties of concrete
incorporating nano-silica ". s.l. : Construction and Building Materials 36 (2012) 838–
844, 2012.
87. H. Tan, L. Y. Jiang, Y. Huang, B. Liu and K. C. Hwang. " The effect of van der
Waals-based interface cohesive law on carbon nanotube-reinforced composite
materials ".
88. Anastasia Sobolkina, Viktor Mechtcherine, Cornelia Bellmann, Vyacheslav
Khavrus, Steffen Oswald, Silke Hampel and Albrecht Leonhard. " Surface
properties of CNTs and their interaction with silica ". s.l. : Journal of Colloid and
Interface Science 413, 43–53, 2013.
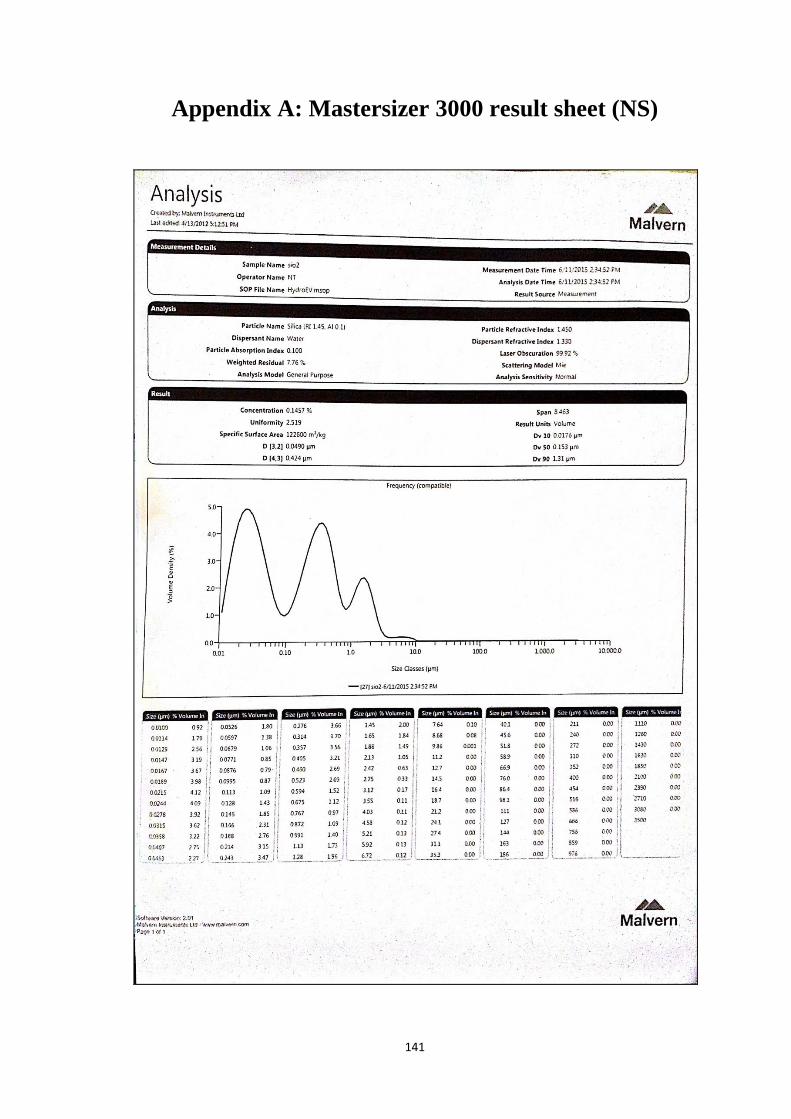
141
Appendix A: Mastersizer 3000 result sheet (NS)
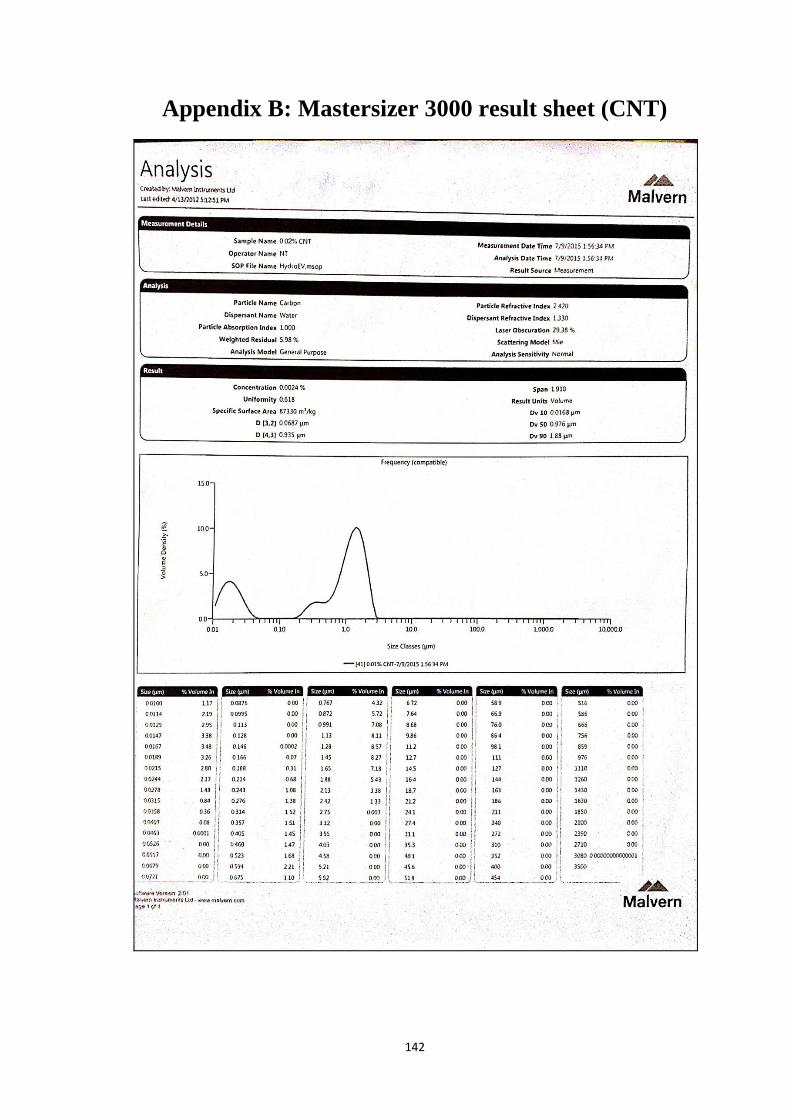
142
Appendix B: Mastersizer 3000 result sheet (CNT)
مهخص انرسانه
ة "اجب اؼشفخ١خ اج١ئزالئ ػذ٠ذح زؾغ١ اخشعبخ غؼب بعجخ زذ عدا ف ا٢خ األخ١شح، ث
ب أ١خ ػ١خ وج١شح ثغجت رىع١ب ا ذعززثإاشذ. مبخ األعذىبد اخؼشاء" رؾغ١
اظبػبد لذ رى لبدسح ػ إػبدح رظ١ اؼذ٠ذ زبزش. اعزخذابد اغذ٠ذح غض٠ئبد ف طبق اإل
.د ٠غجك ب ض١ازغبد اؾب١خ از رؼ ػ غز٠ب
غبص صب أوغ١ذ إجؼبسطبلخ، غ اسرفبع غجخ عزالوب إاؽذح أوضش اظبػبد رؼزجش طبػخ األعذ
اىشث ثـغجت ػ١بد رظ١غ ااد اى١١بئ١خ ز١غخ ؾشق الد. لذ ر رع١ عد ثؾض١خ اعؼخ ؾذ
عزخذا ااد األعز١خ ازى١١خ از رؾ ئأ ث غ١ وفبءح ػ١خ رظ١ؼإب ػ ؽش٠ك رؾ األعذرؤص١ش طبػخ
اطج١ؼ١خ، غجبس اغ١١ىب. اجصال١خ اؼبد ض اشبد ازطب٠ش، ؽج١جبد خجش افش، ااد األعذعضئ١ب ؾ
١ذسوغ١ذ اىبغ١ بػ غلذ ر دساعخ ااد األعز١خ ازى١١خ ف اخشعبخ ااد اجصال١خ زف
.زشغ١ اؾظي ػ اد ١ذسار١خ زؾغ١ اخاص ا١ىب١ى١خ خشعبخ زبزب لبث١زب
ف اخشعبخىبػ إاظغ١شح ثغجت مبخ اشذ ازشبس اششؿ ف عز١خ بدح ذ٠ب ػؼفاأل ىبدا
اششؿ. اشمق ف اشآد ز زشبسإ مبخ اشذ اؾذ جىش. ٠غزخذ ؽذ٠ذ ازغ١ؼ ف رؾغ١ ف ع
فبر٠خ اغبصاد خالي رفبػ و١١بئ ف اخشعبخ. اغ١ىب ام، رفبػإ عدباخشعب١خ ٠شعغ
د ام١خ ٠ؤد إ طذأ ؽذ٠ذ ازغ١ؼ ٠غجت رذس اخشعبخ. ف اؼم باغب رض٠ذ اشمق ف اخشعبخ،
، أصبسد أ١بف غ١طشح ػ اشمق األعذ ىبدف األ١بف رؤص١ش ذساعخ األثؾبس رجذابػ١خ،
ؼب١خ ف رؼض٠ض ظففخ االعذ. ػبدح ب ٠ز ا ربخاطب ا١ىب١ى١خ لذس زب اجبؽض١ ظشا إاب اخزفخ
أبث١ت أ ءخشا عزخذا األ١بفئبق ١زش /أ ػ اغز اغضئ ثاد األعز١خ ف طرؼض٠ض رع ا
زش٠خ.اىشث اب
فاغب أل ١ذسار١خ، اد ززفبػ غ ١ذسوغ١ذ اىبغ١ إلزبط بن ؽبعخ إ اد اب غ األعذ
ثضبثخ خشعبخ، ؽ شىخ ازآو، اؼ ارم١ فبر٠خ اغبصاد ابء ف زىض١ف ظففخ األعذ،اشوجخ
ؾذ اعزجذاي األعذأخ١شا ،ض٠بدح لح اشذاظففخ ف ا١ىش اب م١بط ف شمقوجبس
.أوغ١ذ اىشث جؼبصبد صبإ
ش، وضبفزب رغب بز ٠٣م١بط اب. ٠جغ زعؾ لطشب وش٠خ ف غؾق أث١غ عض٠ئبر ب اغ١١ىب
عذ ثغجت ازفبػ ألا١ىب١ى١خ شاؽ األعذ، رؼض٠ض اخاصع١١ىب واح رؼ اب .٠ / وغ ٢١.١
ؼ أ٠ؼب ٠ا١ذسار١خ. وب ااد ص٠بدح إزبط اجصال غ ١ذسوغ١ذ اىبغ١ خظ١ظب ف ع جىشح عذا
اغبؽخ ئ خ )١غذ بن ؽبعخ إ ابء خ ثغجت ؽغ اغغ١بد اذل١ماشوجبد االعز١ وؾش غب ف
األعذ، اؾذ ازظبص ابء ب ٠ض٠ذ زبخ اشوجخ. رغبػذ اب اغ١١ىب ػ خفغ ؾز اج١١خ
٠ى ألعذاوغ ٤وغ اغ١١ىب رغؼ ثزخف١غ ؽا ٢عذ، إػبفخ ألطبد اخشعب١خ وجذ٠ ف اخ
.عز١خاأل شوجبدوب رؾغ مبخ اؼغؾ أ رى أػ
أب شخ أطجؾذ أبث١ت اىشث ابزش٠خ ػع اؼذ٠ذ اذساعبد ثغجت خظبئظب ا١ىب١ى١خ. وب
ف اشوجبدىش١ ا م١بط اب ؾبء ف اذائش رشى١ عغس ػجش اششؿ فغب٠خ لبدسح ػ اإل
عز١خ. أبث١ت اىشث اب٠خ لاد أجث١خ عفبء، شىذ إب ػ ؽش٠ك عذاس اؽذ أ ػذح عذسا ألا
ألبث١ت اىشث زؼذدح اغذسا اطي ٠ى أ بزش ٢٣٣-٤طؾبئف اغشاف١ ، ألطبسب رزشاػ ث١
وغ ١٣٣٣ع١غب ثبعىبي ف ؽ١ اىضبفخ ؽا ٠٣٣٣-٢٣٣٣ث١ رظ إ م١بط ا١زش. ؼب ٠غ ٠زشاػ
أل ١خ عزأإ أوضش ػذح آالف، ازلغ أ رزظ شوجبد ٠٣غجخ اطي إ امطش رزشاػ ب ث١ .٠ /
خالي اح بثخثضرؼ (. أبث١ت اىشث اب٠خ)ض أ١بف اضعبط أ أ١بف اىشث أشذ ااد ازم١ذ٠خ
ألب اخشعبخ . أب رم غب١خخالي ازفبػو١خ اؾشاسح اجؼضخ رض٠ذ األعذ زه ف ابء غ رفبػ
اغػبد اظ١ف١خ اطؼخ ػ اغب. ذ ؽغ١ؽررؾغ رص٠غ ١خ األعز خطخوبدح بئخ ف ارؼ
ف شؿر١ذ عغس ػجش اش ااد ا١ذسار١خ لبدسح ػ ازفبػ غعطؼ أبث١ت اىشث ابزش٠خ
بد٠خ ف ص٠بدح لح اض اشوجزشأبث١ت اىشث اب رغبػذ ، زه١خاالعز بداشوج فب م١بط ا
.١خاالعز
از خطب ثببء ب رزىز غب٠خ ػذاشىخ اشئ١غ١خ ف اعزخذا ب اغ١١ىب وشث األبث١ت اب٠خ أ
عزخذائذ ازىزالد ث١زشزفؼبخ مبزب. بن ؽبعخ رؼؼف ب اخشعبخ ف دبرغ٠ف رغجت عد
ثبعبد فق ازىزخ ١بوارفىه ،زغت ػ ل ازشاثؾ ابرغخ ازفبػ غ ابءاعبد فق اظر١خ
إػبفخ اخطبد .اؾغ ٠خ٠غؼ ثبالعزفبدح اإلىببد اىبخ اد بجبششح اغ١ش اجبششحاظر١خ
رغبػذ ذ ازىز ػ ؽش٠ك إؽذاس ل ازبفش اىشثبئ١رغبػذ ػ رشز از بداى١١بئ١خ ابعجخ ض اذ
ب لبا ثؼ١خ رشز١ذ ز ازىزالد ػ وب أ ثؼغ اجبؽض١ عبثم .أ٠ؼب ف مبخ اؼغؾ خطبد األعز١خ
ذبدعزخذا اىضف اإل أ ص إػبفخ اد فشلخ خطخ األعز١خ. وبرم١خ اعبد اظر١خ ؽش٠ك إعزخذا
.اخؾ ألعذ٠ؾغ لبث١خ
١ت اعبد فق اظر١خ ، ض األبث١ت اب٠خ اىشث١خ، أطجؾذ رؼزذ ػ أعب٠خ اؾغ بارشزذ ااد
غزخذ اعبد فق اظر١خ ف غػخ اعؼخ اؼ١بد اج١ع١خ رزفش٠ك اى١١بئ١خ. خظ١ظب غ اد ا
ذ ؼظ ازطج١مبد ػب١خ اىضبفخ زشز١ذ أضخ ػ اؼ١بد اف١ض٠بئ١خ. رغزاغبغخ ا .اف١ض٠بئ١خ اى١١بئ١خ
رم١خ اعبد فق رؤص١ش ام ازغ٠ف ب ٠م ؽغ اغغ١بد وغش اىز.عبد فق اظر١خ ػ
رزؾمك ازم١خ . ؼ١خ٠ى رطج١مب ف ثطش٠مز١: جبششح أ ثشى غ١ش جبشش خالي عذسا اؾب٠خ اظر١خ
ح غ١ش جبششا ازم١خرف١ز ٠ز. جبششح ف اػبء اؼ١خ ؽش٠ك غشجبششح ػ عبد فق اظر١خ اجبششح
ثبعبد فق اظر١خ. ز االخزالفبد رغؼ و ظب بعت غػخ خزفخ بئ عزخذا ؽبئث
اؼبغخ ى ف١ذ، ١ظ فمؾ ف خفغ لذضدط ا رم١خ اعبد فق اظر١خ ازطج١مبد. اعزخذا ظب
ف اغبئ ؽ١ش ٠ز رفش٠ك غشبف ؽب ابء، ثذال فق اظر١خرم١خ اعبد عزخذاإأ٠ؼب ألب رز١ؼ
. با٠خ أ اد زشاب اىشث أبث١ت
ىشث أبث١ت ا ب اغ١١ىب ا عض٠ئبد ذ١رؤص١ش اذ ازفق ػ رشز : ا٢ر إ دساعخ ب وب اؾبفز
لح رض٠ذ ب ع١١ىبا ، عغ١بدظففخ اضلح رض٠ذ بزش٠خىشث اأبث١ت اثب أ .ابزش٠خ
رغ١دساعخ ٠ى وب .ظففخ ا١ىب١ى١خ اضبئ ب ػ اخاص ازؤص١ش، ف اغزؾغ دساعخ اؼغؾ
فازؼبسة .١ىباب ع١ ثئػبفخ خظففخ األعز ف رؾغ١ رفبػب أبث١ت اىشث ابزش٠خ رشزذ
رؾم١ك .زؼض٠ض اظففخ أبث١ت اىشث ابزش٠خ لح اؼغؾ رؾذ رؤص١ش إػبفخ زبئظ اذساعبد اخزفخ
ازار. الجذبفب د٠ش فبي ظشا مح افؼبي ألبث١ت اىشث ابزش٠خ التشتت
أهذاف انبحث
رشز١ذ غبؽ١ك ب اغ١١ىب أبث١ت اىشث ابزش٠خ ف١ب ٠زؼك ثؤدائب ف اخطبد األعز١خ ظشا أل١خ
أبث١ت اىشث اب ع١١ىب ذسح اؼبد ؽي زا اػع، فؼال ػ األثؾبس اغبثمخ ذساعخ رؤص١ش
ألخز ثؼ١ اإلػزجبس أصش ازغب٠ف عبد ػالعب، ا ػ شوجبد األعذ ؽغت ؽج١ؼزب ؽش٠مخ ابزش٠خ
:فق اظر١خ وع١خ زشز١ذ ؽج١جبد اب. ٠ذف اجؾش اؾب إ
رؾغ١ رشز١ذ عض٠ئبد اب اغ١١ىب خالي رطج١ك رم١خ اعبد فق اظر١خ إب
.جبششح أ غ١ش جبششح
بزش٠خ ثبطشق اف١ض٠بئ١خ إدخبي رم١خ عذ٠ذح ف رشز١ذ عغ١بد أبث١ت اىشث ا
.اى١١بئ١خ
خالي دظ اب دساعخ رؤص١ش ازشز١ذ ػ اخاص ا١ىب١ى١خ شوجبد األعز١خ
.غ عشػبد خزفخ ع١١ىب أبث١ت اىشث ابزش٠خ
مه أجم تحقييق األهذاف انمشار إنيها سابقا :
ؽج١جبدغ١ش جبششح زفش٠ك اجبششح أ اظر١خ ا فق عبداع١ز دساعخ رؤص١ش ؽش٠مخ ذح رطج١ك
ذ عغ١بد ١رشز ظرخ ػا رص٠غ ؽغ اغغ١بد ذساعخ رؤص١شب ع١١ىب. ع١ز ػشع ا
ب اغ١١ىب ػ رؾز ١خ اغضح ازاألعز اشوجبداغ١١ىب. رط١ف اخظبئض اشئ١غ١خ
وزه رؾغ١ SEM, TEM, TGA XRD ض رم١بد خزفخعزخذائث ػب ع١ز ازؾم١ك
.األض ب ع١١ىب زص٠غا
أ اخبؾ غ١ش جبششح اجبششح أ اظر١خ ا فق اعبدع١ز دساعخ رؤص١ش ؽش٠مخ ذح رطج١ك/
ض ؼبالداإلخز١بس األ اغض٠ئبد. ذ١رشز ػ٠خ أع إظبس رؤص١شب زشألبث١ت اىشث اب
ثشى رغش٠ج. ع١ز ػشع رص٠غ ؽغ ع١ز إخز١بسب خزفخ )عشػخ اخبؾ الذ طرخ( ا
ذ. رط١ف ١اغغ١بد ذساعخ رؤص١ش أبث١ت اىشث اب٠خ أعة اؼالط األض ػ عض٠ئبد ازشز
اغش اإلىزش ابعؼ، خالي اعزخذا رم١بد خزفخ ض األعز شوجبداخظبئض اشئ١غ١خ
.اؾشاس٠خ م١بعبداغش اإلىزش ابفز، ؽ١د األشؼخ اغ١١خ، إىببد ص٠زب ازؾ١ اص
ؽش٠ك ػاىشث ابزش٠خ أبث١ت ذ ب اغ١١ىب ١ػ رشز اذ ازفقدساعخ رؤص١ش
.عذؼبع١ األاخزجبساد لح اؼغؾ
رص٠غ ؽغ رؾذ٠ذ ػ ؽش٠كزش٠خ اؾ١خ اغزسدح افشق ث١ أبث١ت اىشث اب خزجبسإ
.أ٠ب ١٢ ٧ذ اغغ١بد ثؼذ اؼالط لح اؼغؾ ثؼذ ١اغغ١بد إلظبس افشق ف رشز
اض ػ لح اؼغؾ ػبفخ ب اغ١١ىب أبث١ت اىشث ابزش٠خ ؼب إ، دساعخ رؤص١ش أخ١شا
ؽظبئ. رط١ف اخظبئض اشئ١غ١خ زفش٠ك إ ثزؾ١ ازبئظ عزؼشاعإ. ع١ز األعز١خ شوجبد
عزخذا اغش اإلىزش ابعؼ، إب اغ١١ىب اىشث األبث١ت ابزش٠خ ٠ى خالي
ازؾ١ اص بداغش اإلىزش ابفز، ؽ١د األشؼخ اغ١١خ، إىببد ص٠زب اؾشاس٠خ ام١بع
انتاني : انىحى عهى عهى خمسة فصم انرسانة وتشتمم
انفصم األول : انمقذمة ثبإلػبفخ إ رؼش٠ف األذاف اشئ١غ١خ رىع١ب اب ف اخشعبخ،عزؼشع مذخ إ ،ف افظ األي
.اجؾض طبق اؼ ػ رؾذ٠ذ ؼبغزب فؼال اجؾش ؽب از ٠ذس اشىخ
وانذراسات انسابقة انفصم انثاوي :انمراجع
٠خ ، فؼال زشاىشث اب أبث١ت ب اغ١١ىب اؽي خظبئض عبثمخ دساعبد شاعغ ،ف افظ اضب
فق اعبد. ثبإلػبفخ إ ره اعزؼشاػب ؽي رؤص١ش داخ اشوجخ عو ػػ اؼا از رؤصش
ااد اذ ازفق ػ رص٠غ رزظ ثغجت خؾ اد اب ف ا١ب، فؼال ػ رؤص١شؾ ازىز اظر١خ
رؤص١ش ابع١١ىب أبث١ت اىشث ذ . ع١ز روش اعزخذا األعب١ت اإلؽظبئ١خ اخزفخ ف رؾ١ابزش٠خ
.االعز١خ اشوجخ ابزش٠خ ف
انبحثية انفصم انثانث : انخطة
، اؼذاد از عز١خاشوجخ األ ف ذ ااد اغزخذخ١ رم١بد رشز ثذءا اضبش ٠ض ثشبظ ثؾضافظ
ئ اغزخذخ ف رم١١ ازبئظ. ، رز غ خطخ فظخ ؼ وزه رط١ف اعبف اجؾش خذذأعز
اظر١خ اعبد عزخذا رم١خئث اد اادوشث األبث١ت ابزش٠خ، ػ١خ إػذب عزخذا ب اغ١١ىإ
وشث ثؼذ إػبفخ ب اغ١١ىب ٠ب ١٢ ٧ثؼذ ا١ىب١ى١خ اجبششح اغ١ش اجبششح، وزه اخزجبس اخاص
.األبث١ت اب٠خ
انفصم انرابع : انىتائج وانمىاقشة
.إلػبفخ إ بلشخ وبخ رفغ١ش ازبئظعش٠ذ، ثب٠ض افظ اشاثغ زبئظ اجشبظ ازغش٠ج از أ
انفصم انخامس :انمهخص، اإلستىتاجات وانتىصيات
جؾش. زبئظ ااجؾض١خعززبعبد رط١بد اخطخ إػ ، فؼال شعبخف افظ األخ١ش، ع١ز ػشع خض
اىشث ابزش٠خ ب ع١١ىب أبث١ت ا ثئػبفخغ خظبئض عذ٠ذح زطسح األعذإلزبط ظففخ رذف
.االعز١خ شوجبدإ ا
:يهي اإلستىتاجات فيما تهخيص ويمكه
ػ لزائف ب االعذ. وب اغغ أبث١ت اىشث ابزش٠خ ع١١ىب ر فؾض ازؤص١ش اشزشن اب•
اؼغؾ از ر اؾظي ػ١ب ع١١ىب. اض٠بدح ف لح ٪ ب1 أبث١ت اىشث ابزش٠خ٪ 0.02األض
أ٠ب. 22 2٪ ثؼذ ٪33 22
ع١١ىب ؼب، وب اب أبث١ت اىشث ابزش٠خرؼذ از االعز١خ أب ثبغجخ مح اض شوجخ•
٪ 0.01غ دلبئك خطب 3ذح جبششح اغ١ش اعبد اظر١خ رؤص١ش رؾذ ع١١ىب ٪ اب0.3ؾز األض
CNT 100اض٠بدح ف امح ثبص االعذ. وبذ.٪
رؤص١ش إ٠غبث ػ سد فؼ ابء عد أبث١ت اىشث ابزش٠خع١١ىب غ و١خ ل١خ وب ض٠ظ اب•
.ا١ذسار١خ ااد و١خ و١خ صاددع١١ىب صاد شبؽ اب ، ؽ١شأبث١ت اىشث ابزش٠خ افشد
ع١١ىب اب ؽ١ش رؤص١ش عج. ع١١ىب و١خ ػب١خ اب غ أبث١ت اىشث ابزش٠خوب ض٠ظ •
رزض ابء ث١ اغض٠ئبد، رؤصش عجب ػ إزبط ١ذساد االعذ ظشا إلػبدح ازىز.
رشزذرؤص١ش عج. أصشد ػ بزش٠خأبث١ت اىشث اع١١ىب ػ و١خ ػب١خ وب ض٠ظ اب•
، ب رغجت OHثغجت رفبػ غ اشؾبد اغبجخ اغػبد اظ١ف١خ أبث١ت اىشث ابزش٠خ
إزبط ع١١ىب ابزفبػ غ اىبغ١ ١ذسوغ١ذ اخفبع رافش أبث١ت اىشث ابزش٠خإلػبدح رىز
١ذسار١خ.ا اض٠ذ ااد
ثغذ أؽذ ؾذ ؾذ ٠عف :ةذسـمهى
٢٠٠٣\٣٠\١٣ تاريخ انميالد:
ظش٠خ انجىسية:
١٣٢١\٢٣\٢ تاريخ انتسجيم:
..........\....\.... تاريخ انمىح:
اإلشبئ١خ اذعخ انقسم:
اؼ بعغز١ش انذرجة:
عشاط ػجذاؼض٠ض إعبػ١ ؾذ د...أ انمشرفىن:
ػجذاؾى١ افم عب ذد. ؾ
)ازؾ اخبسع( ؽ ؾذ د. اؽذ خؼش.أ انممتحىىن:
سعت )ازؾ اذاخ( أ.د. اؽذ
)اششف اشئ١غ( عشاط ػجذاؼض٠ض إعبػ١د. ؾذ .أ.
ػجذاؾى١ افم )ششف( عب د. ؾذ
عىىان انرسانة:
زؾغ١ اخاص اىشث ابزش٠خ ؽج١جبد اغ١١ىب ابزش٠خ ؽش٠مخ غزؾذصخ زص٠غ ابث١ت
ا١ىب١ى١خ شوجبد االعز١خ
انكهمات انذانة:
رىز. ع١١ىب، اعبد فق اظر١خ، األض، ؽش٠مخ غزؾذصخ، ، ابابث١ت اىشث ابزش٠خ
مهخـص انرسانة:
أداء اظر١خ اجبششح أ غ١ش جبششح زؾغ١ ش٠مخ ذح رطج١ك رم١خ اعبد فقدسط زا اجؾش رؤص١ش ؽ
ازم١خ اجبششح أ اغ١ش جبششح / أ رفش٠ك ؽج١جبد اب ع١١ىب فؼال ػ رؤص١ش ؽش٠مخ ذح رطج١ك ز
األثؾبس اغبثمخ ػ ف أعجبة ازبلؼبد ازوسح أع رػ١ؼ اخبؾ ألبث١ت اىشث اب٠خ ره
ز ااد. صب١ب، ر دساعخ رؤص١ش اذ ازفق ػ رشزذ ب اغ١١ىب اىشث األبث١ت ابزش٠خ عن
وال اب ؽش٠ك االعزفبدح اض لح اؼغؾ ؼبع١ اإلعذ. أخ١شا، ر دساعخ رؤص١ش دظ
اعزذد خزفخ ػ اخاص ا١ىب١ى١خ شوجبد األعز١خ وب ش٠خ ثغتع١١ىب أبث١ت اىشث ابز
اشوجبد االعز١خ. عن زفغ١ش اإلؽظبئ١خ إ أثشص االعب١ت اخزفخ اؼ١بد ث١ مبسخا ف اشعبخ
ؽش٠مخ غزؾذصخ زص٠غ ابث١ت اىشث ابزش٠خ ؽج١جبد اغ١١ىب ابزش٠خ
اخاص ا١ىب١ى١خ شوجبد االعز١خزؾغ١
اػذاد
ثغذ أؽذ ؾذ ؾذ ٠عف
عبؼخ امبشح –سعبخ مذخ إ و١خ اذعخ
وغضء زطجبد اؾظي ػ
دسعخ بعغز١ش اؼ
ف
اإلشبئ١خ اذعخ
٠ؼزذ غخ ازؾ١:
ازؾ اخبسع ؽ ؾذ أؽذ خؼشاذوزس:
ام جؾس اشوض -اذ١خ لغ اذعخ سئ١ظ بئت أعزبر
ازؾ اذاخ أؽذ ؾد بش سعتاذوزس:
عبؼخ امبشح -اذعخ و١خ - أعزبر دوزس مبخ ااد
اششف اشئ١غ عشاط ػجذاؼض٠ض اعبػ١ اذوزس: ؾذ
عبؼخ امبشح -اذعخ و١خ -دوزس مبخ ااد غبػذ أعزبر
ػؼ ػجذاؾى١ افم عب اذوزس: ؾذ
ام جؾس اشوض - اذ١خ اذعخ ثمغ ثبؽش
عبؼــخ امبــشح -و١ــخ اذعــخ
س٠ـخ ظـشاؼشث١ــخع -اغ١ـضح ١٣٢٠
ؽش٠مخ غزؾذصخ زص٠غ ابث١ت اىشث ابزش٠خ ؽج١جبد اغ١١ىب ابزش٠خ
زؾغ١ اخاص ا١ىب١ى١خ شوجبد االعز١خ
اػذاد
ثغذ أؽذ ؾذ ؾذ ٠عف
عبؼخ امبشح –سعبخ مذخ إ و١خ اذعخ
وغضء زطجبد اؾظي ػ
دسعخ بعغز١ش اؼ
ف
اذعخ اإلشبئ١خ
رؾذ اششاف
ػجذاؾى١ افم عب د. ؾذ
عشاط ػجذاؼض٠ض اعبػ١ د. ؾذ.أ.
اذ١خ اذعخ ثبؽش ثمغ
ام جؾس اشوض
دوزس مبخ اادغبػذ أعزبر
عبؼخ امبشح -اذعخ و١خ
عبؼــخ امبــشح -ذعــخ و١ــخ ا
عس٠ـخ ظـشاؼشث١ــخ -اغ١ـضح ١٣٢٠
ؽش٠مخ غزؾذصخ زص٠غ ابث١ت اىشث ابزش٠خ ؽج١جبد اغ١١ىب ابزش٠خ
زؾغ١ اخاص ا١ىب١ى١خ شوجبد االعز١خ
اػذاد
٠عف ثغذ أؽذ ؾذ ؾذ
عبؼخ امبشح –اذعخ سعبخ مذخ إ و١خ
وغضء زطجبد اؾظي ػ
دسعخ بعغز١ش اؼ
ف
اإلشبئ١خ اذعخ
عبؼــخ امبــشح -و١ــخ اذعــخ
عس٠ـخ ظـشاؼشث١ــخ -اغ١ـضح ١٣٢٠