Predictors of prenatal care satisfaction among pregnant ...
14
RESEARCH ARTICLE Open Access Predictors of prenatal care satisfaction among pregnant women in American Samoa Oluwaseyi Adeyinka 1 , Anne Marie Jukic 1 , Stephen T. McGarvey 2 , Bethel T. Muasau-Howard 3 , Mata’uitafa Faiai 4 and Nicola L. Hawley 1* Abstract Background: Pregnant women in American Samoa have a high risk of complications due to overweight and obesity. Prenatal care can mitigate the risk, however many women do not seek adequate care during pregnancy. Low utilization of prenatal care may stem from low levels of satisfaction with services offered. Our objective was to identify predictors of prenatal care satisfaction in American Samoa. Methods: A structured survey was distributed to 165 pregnant women receiving prenatal care at the Lyndon B Johnson Tropical Medical Center, Pago Pago. Women self-reported demographic characteristics, pregnancy history, and satisfaction with prenatal care. Domains of satisfaction were extracted using principal components analysis. Scores were summed across each domain. Linear regression was used to examine associations between maternal characteristics and the summed scores within individual domains and for overall satisfaction. Result: Three domains of satisfaction were identified: satisfaction with clinic services, clinic accessibility, and physician interactions. Waiting ≥ 2 h to see the doctor negatively impacted satisfaction with clinic services, clinic accessibility, and overall satisfaction. Living > 20 min from the clinic was associated with lower clinic accessibility, physician interactions, and overall satisfaction. Women who were employed/on maternity leave had lower scores for physician interactions compared with unemployed women/students. Women who did not attend all their appointments had lower overall satisfaction scores. Conclusions: Satisfaction with clinic services, clinic accessibility and physician interactions are important contributors to prenatal care satisfaction. To improve patient satisfaction prenatal care clinics should focus on making it easier for women to reach clinics, improving waiting times, and increasing time with providers. Keywords: Prenatal care, Satisfaction, American Samoa, Physician interactions, Clinic accessibility Background Obesity, either before or during pregnancy, is an established risk factor for a number of maternal and fetal health complications [1–3]. Obesity in pregnant women is associated with increased incidence of pre- eclampsia, gestational diabetes, fetal macrosomia, and stillbirth [4]. In spite of this, the proportion of United States women of reproductive age who are overweight or obese at the time of conception con- tinues to climb, mirroring trends among the general population; approximately 60% of women of reproductive age are overweight or obese [5–7]. Comparatively, as a result of rapid demographic and nutritional transition, almost 90% of American Sa- moan women of childbearing age are overweight or obese [8]. American Samoa is an unincorporated island territory of the United States located ~2400 miles southwest of Hawaii. The population receives benefits from its affili- ation with the US such as the Special Supplemental Nutrition Program for Women, Infants, and Children (WIC) and Medicaid access, but the island remains a medically underserved and health care professional shortage area [9, 10]. Prenatal care is considered essen- tial for a healthy pregnancy [11] but is particularly im- portant in the American Samoan setting to ensure that * Correspondence: [email protected] 1 Department of Chronic Disease Epidemiology, School of Public Health, Yale University, 60 College Street, New Haven, CT 06520-8034, USA Full list of author information is available at the end of the article © The Author(s). 2017 Open Access This article is distributed under the terms of the Creative Commons Attribution 4.0 International License (http://creativecommons.org/licenses/by/4.0/), which permits unrestricted use, distribution, and reproduction in any medium, provided you give appropriate credit to the original author(s) and the source, provide a link to the Creative Commons license, and indicate if changes were made. The Creative Commons Public Domain Dedication waiver (http://creativecommons.org/publicdomain/zero/1.0/) applies to the data made available in this article, unless otherwise stated. Adeyinka et al. BMC Pregnancy and Childbirth (2017) 17:381 DOI 10.1186/s12884-017-1563-6
Transcript of Predictors of prenatal care satisfaction among pregnant ...
RESEARCH ARTICLE Open Access
Predictors of prenatal care satisfactionamong pregnant women in American SamoaOluwaseyi Adeyinka1, Anne Marie Jukic1, Stephen T. McGarvey2, Bethel T. Muasau-Howard3, Mata’uitafa Faiai4
and Nicola L. Hawley1*
Abstract
Background: Pregnant women in American Samoa have a high risk of complications due to overweight andobesity. Prenatal care can mitigate the risk, however many women do not seek adequate care during pregnancy.Low utilization of prenatal care may stem from low levels of satisfaction with services offered. Our objective was toidentify predictors of prenatal care satisfaction in American Samoa.
Methods: A structured survey was distributed to 165 pregnant women receiving prenatal care at the Lyndon BJohnson Tropical Medical Center, Pago Pago. Women self-reported demographic characteristics, pregnancy history,and satisfaction with prenatal care. Domains of satisfaction were extracted using principal components analysis.Scores were summed across each domain. Linear regression was used to examine associations between maternalcharacteristics and the summed scores within individual domains and for overall satisfaction.
Result: Three domains of satisfaction were identified: satisfaction with clinic services, clinic accessibility, andphysician interactions. Waiting ≥ 2 h to see the doctor negatively impacted satisfaction with clinic services,clinic accessibility, and overall satisfaction. Living > 20 min from the clinic was associated with lower clinicaccessibility, physician interactions, and overall satisfaction. Women who were employed/on maternity leavehad lower scores for physician interactions compared with unemployed women/students. Women who did notattend all their appointments had lower overall satisfaction scores.
Conclusions: Satisfaction with clinic services, clinic accessibility and physician interactions are importantcontributors to prenatal care satisfaction. To improve patient satisfaction prenatal care clinics should focus onmaking it easier for women to reach clinics, improving waiting times, and increasing time with providers.
Keywords: Prenatal care, Satisfaction, American Samoa, Physician interactions, Clinic accessibility
BackgroundObesity, either before or during pregnancy, is anestablished risk factor for a number of maternal andfetal health complications [1–3]. Obesity in pregnantwomen is associated with increased incidence of pre-eclampsia, gestational diabetes, fetal macrosomia,and stillbirth [4]. In spite of this, the proportion ofUnited States women of reproductive age who areoverweight or obese at the time of conception con-tinues to climb, mirroring trends among the generalpopulation; approximately 60% of women of
reproductive age are overweight or obese [5–7].Comparatively, as a result of rapid demographic andnutritional transition, almost 90% of American Sa-moan women of childbearing age are overweight orobese [8].American Samoa is an unincorporated island territory
of the United States located ~2400 miles southwest ofHawaii. The population receives benefits from its affili-ation with the US such as the Special SupplementalNutrition Program for Women, Infants, and Children(WIC) and Medicaid access, but the island remains amedically underserved and health care professionalshortage area [9, 10]. Prenatal care is considered essen-tial for a healthy pregnancy [11] but is particularly im-portant in the American Samoan setting to ensure that
* Correspondence: [email protected] of Chronic Disease Epidemiology, School of Public Health, YaleUniversity, 60 College Street, New Haven, CT 06520-8034, USAFull list of author information is available at the end of the article
© The Author(s). 2017 Open Access This article is distributed under the terms of the Creative Commons Attribution 4.0International License (http://creativecommons.org/licenses/by/4.0/), which permits unrestricted use, distribution, andreproduction in any medium, provided you give appropriate credit to the original author(s) and the source, provide a link tothe Creative Commons license, and indicate if changes were made. The Creative Commons Public Domain Dedication waiver(http://creativecommons.org/publicdomain/zero/1.0/) applies to the data made available in this article, unless otherwise stated.
Adeyinka et al. BMC Pregnancy and Childbirth (2017) 17:381 DOI 10.1186/s12884-017-1563-6
women enter prenatal care early and receive qualitycare so that some of the risk associated withoverweight/obesity during pregnancy can be mitigated.Gestational diabetes and hypertensive disorders of preg-nancy, related to overweight/obesity, are both prevalent is-sues among those of Samoan ethnicity [12, 13] andrequire early detection and continued management.Hawley et al. [14] used clinical record data from
American Samoa to describe prenatal care utilizationamong women receiving care at the main hospital andone of the community health centers in AmericanSamoa between 2001 and 2008. Using Kotelchuck’s cri-teria for adequacy of prenatal care [15] they found thatfew women (less than 25%) received adequate careduring pregnancy, based on the timing of entry intocare and the number of appointments attended.Several factors determine pregnant women’s
utilization of prenatal care services during pregnancy.Known barriers to prenatal care in American Samoamirror those that have been established globally, suchas financial barriers (unemployment, lack of transpor-tation), lack of child care for other children, and latepregnancy recognition [14]. However, one factor thathas not yet been explored as a barrier to adequateprenatal care utilization in American Samoa is satis-faction with prenatal care services. In other settingsit has been shown that a woman who is dissatisfiedwith her prenatal care, specifically with the patient-provider interaction, is less likely to follow the pre-natal care regimen; she is also less likely to utilizeprenatal care in future pregnancies [16–19]. Inaddition, across all types of medical care, Chemir,Alemseged, and Workneh [20] explain that, “a satis-fied patient will recommend [a] center’s services, ex-pressing their satisfaction to four or five people,while a dissatisfied patient, on the other hand, willcomplain to twenty or more”, suggesting that dissat-isfaction with prenatal care may impact both individ-ual behavior and the behavior of a woman’s peers.Prior research exploring prenatal care satisfaction inother settings has found that socio-demographiccharacteristics such as race/ethnicity, occupation,educational attainment, and religion are significantlyassociated with satisfaction with care [20–24]. Thesefactors have not been investigated in AmericanSamoa.This paper describes factors associated with satisfac-
tion with prenatal care in American Samoa and identi-fies specific patient groups that are less satisfied withtheir care. By identifying these groups, initiatives canbe developed to address their specific needs. Further-more, this study incorporates qualitative data to eluci-date more about the prenatal care experience forpregnant women in American Samoa.
MethodsSettingAmerican Samoa is an unincorporated US territory andhome to a population of 54,194 (2016) [25] predomin-antly made up of native Samoans who are recognized asUS nationals. Fifty-eight percent of families have in-comes below the US poverty level [ref]. Health care isprovided by one full service hospital – the Lyndon BJohnson Tropical Medical Center (LBJTMC) - and threeprimary care centers run by the American SamoanDepartment of Health. Prenatal care is provided at all ofthese locations. The three primary care centers deliverprenatal care to low-risk pregnancies until 28 weeks ges-tation using a system of nurse practitioners supportedby a clinician at each site. LBJTMC provides care tosome low risk pregnancies (particularly those in the im-mediate geographic area around the hospital), high-riskpregnancies, and all women beyond 28 weeks gestation.At LBJTMC, prenatal care is provided by clinicians withspecialist training in obstetrics and gynecology. Thereare allied health professionals (nutritionists, physicaltherapists) available but there are few and demand oftenexceeds capacity. Approximately 97% of the 1300 birthsin the territory each year occur at LBJTMC. While thereis a history of home births attended by traditional birthattendants [26] in the territory, a similar proportion ofbirths have occurred at LBJTMC for more than 15 years.
Data collectionA 59-question survey targeting utilization, content, andsatisfaction with prenatal care was distributed to a con-venience sample of patients in the prenatal care clinicat the Lyndon B Johnson Tropical Medical Center,American Samoa between July and August 2014 andagain in August 2015. LBJTMC is the only full servicehospital in American Samoa, providing prenatal care tosome low risk pregnancies (others are seen at commu-nity health centers), all high-risk pregnancies, and allwomen in the final trimester of their pregnancy(women are referred from the community health cen-ters during the third trimester) [14]. The Departmentof Health managed community health centers includethe Tafuna, Amouli and Leone Community HealthCenters. Although the survey was only conducted atthe LBJTMC, participants were asked to report whichof the clinics they attended most frequently duringtheir pregnancy.The eligibility criteria for participation were that the
participants must be over 18 years of age and must haveattended at least two prenatal care visits before the visitduring which they were enrolled into the study, to allowthem to adequately reflect on their experience and theircare. Trained study staff approached all women waitingin the prenatal care clinic, explained the purpose and
Adeyinka et al. BMC Pregnancy and Childbirth (2017) 17:381 Page 2 of 14
protocol of the study, asked screening questions to gaugeeligibility and, if participants were eligible and willing,gained informed consent. The questionnaires were self-administered in the prenatal care clinic waiting room andpresented questions in both English and Samoan lan-guages side-by-side to accommodate local language pref-erences. Participants self-reported their demographiccharacteristics, receipt of prenatal care, interactions withhealth professionals, and their satisfaction with prenatalcare. The questionnaire was based on the Centers forDisease Control (CDC) Pregnancy Risk Assessment andMonitoring Survey (PRAMS) [27] and the Prenatal CareSatisfaction Questionnaire, which was developed specific-ally for use in low-income settings [28]. An open-endedcomment section was included at the end of the survey tosolicit additional participant comments about their experi-ence of prenatal care. The questionnaire instrument canbe found in Additional file 1.Data was collected from 174 participants. 215 pa-
tients were approached; of these, 34 did not meet eligi-bility criteria and seven participants declined toparticipate. After data collection was complete, oneparticipant was excluded from all analyses because shewas determined not to have met eligibility criteria(only discovered after data collection) and a furthereight participants were excluded from this analysisbecause they did not have complete satisfactionquestionnaire data, leaving 165 participants for thisanalysis. The sample represented approximately 8% ofthe unique prenatal care patients seen by LBJTMCeach year.Institutional review boards at Brown University
(Protocol #1405001052) and the American SamoaDepartment of Health reviewed the study protocol andgave their approval. Participants in this study gavewritten informed consent.
Predictor variablesDemographic variables such as age, marital status, resi-dent status, education level, and employment statuswere included in the analysis as potential predictors ofprenatal care satisfaction. Age was categorized into fiveyear age groups between 20 and 36 years, with those20 years and younger and 36 and older consideredseparately. Marital status was dichotomized withwomen either married or cohabiting versus nevermarried, separated, divorced, or widowed. Participantswere classified as a resident of American Samoa or anon-resident. Residency status was considered here asnon-residents do not have the same access to govern-ment services and benefits (WIC services, Medicaid,etc.) as residents. Non-residents in the sample werepredominantly from the neighboring island of inde-pendent Samoa, which is nearly identical in ethnic
background and cultural history. It is common forwomen in Samoa to travel to American Samoa andstay with extended family during pregnancy and forthe birth of their child. Related to this, racial/ethnicbackground was collected by the survey but becausemore than 98% of the sample identified themselves asSamoan/Pacific Islander, it was not examined as a pre-dictor of satisfaction. Education level was categorizedinto secondary school or less versus higher educationand women were classified as employed, on maternityleave, unemployed or students.Maternal characteristics related to pregnancy that
were included as predictors of satisfaction includedself-reported pre-pregnancy weight, trimester at thetime of the survey, pregnancy complications, parity,and prior pregnancy losses. Pre-pregnancy weight wascategorized into data-driven tertiles. Body mass index(BMI) could not be calculated due to substantial mis-reporting of height in the self-reported questionnaire.Parity was categorized based on number of live births.Women who answered yes to a question enquiringabout first pregnancy were categorized as nulliparousunless they went on to specify a number of prior livebirths. The prior pregnancy loss variable was createdby subtracting the number pregnancies that resulted inlive births from the number of times a woman hadbeen pregnant before this pregnancy.Structural predictors included distance from the par-
ticipant’s home to the clinic, health insurance status,WIC enrollment (which is based on residency statusand means testing), appointment attendance, waitingtime at the clinic and average time spent withclinicians. “Clinic distance” was defined as the drivingdistance from the participant’s home to their mostvisited clinic. This was calculated using Google maps(www.maps.google.com). The questions about preg-nancy complications, health insurance, WIC enroll-ment were asked in a yes/no format. Women were alsoasked to respond yes or no to the question “Did youattend all of the prenatal care visits that were sched-uled for you?” Total time spent at the clinic was cate-gorized into 30-min intervals from 0 to more than twohours. The amount of time spent waiting to see thedoctor and spent talking with the doctor were asked asopen-ended questions and analyzed as continuousvariables.
Outcome variable: Satisfaction with prenatal careThe Prenatal Care Satisfaction Questionnaire developedby Raube et al. [24] comprised 22 of the 59 questions onthe survey. Response options for each question were ona Likert scale from Excellent (5) to Poor (1). No reversescoring was needed due to the structure of thequestionnaire.
Adeyinka et al. BMC Pregnancy and Childbirth (2017) 17:381 Page 3 of 14
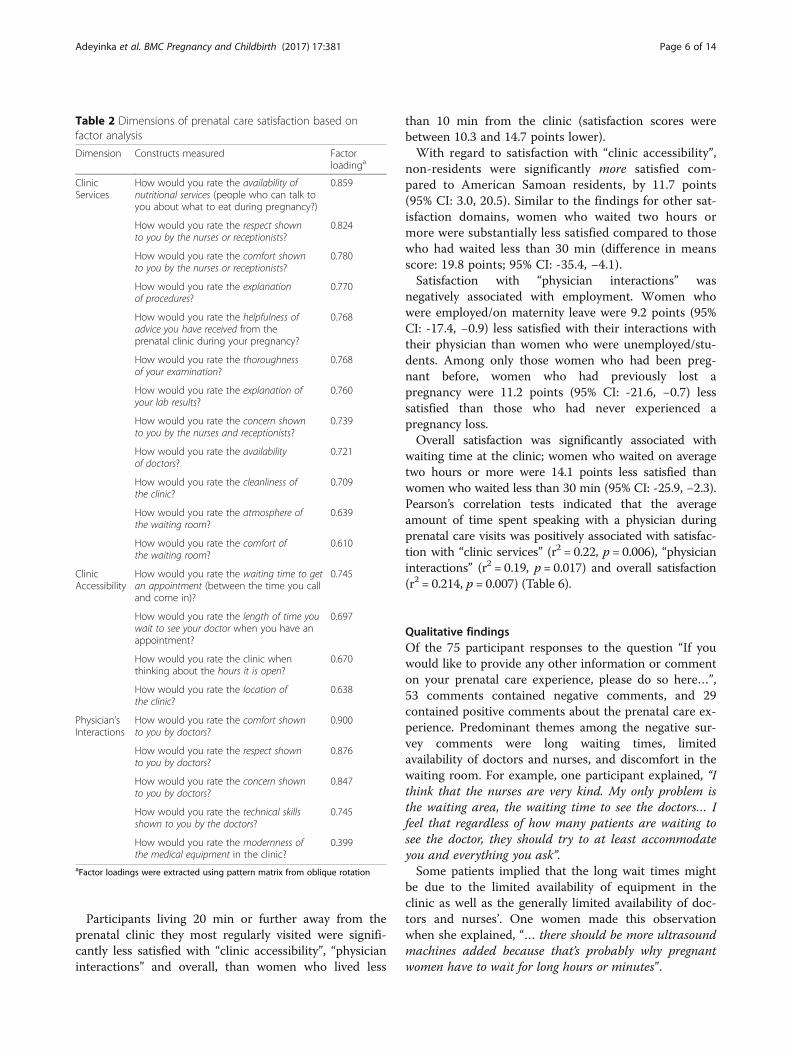
Identification of satisfaction domains: Principalcomponents analysisAn exploratory principal components analysis (PCA)was conducted to determine domains of satisfaction thatshould be considered in analysis. Using the StatisticalProgram for the Social Sciences (SPSS; Version 22.0,SPSS Inc., Illinois, USA) an initial PCA was conductedon the 22 items with no rotation. Following the initialPCA, one question (How would you rate the explanationof treatment options?) registered a loading of less than0.30 (the threshold set a priori) and was removed, likelybecause few participants reported complications forwhich treatment was required (see Table 1). A secondPCA was then conducted on the 21 remaining itemswith oblique rotation (direct oblimin). The Kaiser-Meyer-Olkin (KMO) measure verified the sampling ad-equacy for the analysis, KMO = 0.94. Bartlett’s test ofsphericity, X2 (210) = 3756.19, p < 0.001, indicated thatcorrelations between items were sufficiently large forPCA [29]. An initial analysis was run to obtain eigen-values for each component in the data. Three compo-nents had eigenvalues over Kaiser’s criterion of 1 and incombination explained 76.45% of the variance. Given thesufficiency of the sample size and Kaiser’s criterion onthe three components, we retained all three componentsin the final analysis. Table 2 shows the factor loadingsafter rotation.Responses to questions within each of the three satis-
faction domains were summed to create a satisfactionscore for each, and all of the responses summed tocreate an “overall” satisfaction score. Scores werenormalized on a 0–100 scale to account for the differentnumbers of questions contributing to the scores in eachdomain and to allow scores to be compared acrossdomains.
Statistical analysisThe number of participants per group for categoricalvariables (as percentages) and means for continuous var-iables were computed for all participants. Based on thenormal distribution of outcome variables, independentsamples t-tests and ANOVA were used to examine un-adjusted differences in mean satisfaction scores amongdifferent demographic and characteristic variables.Multivariable linear regression was used to calculate
adjusted mean difference estimates in satisfaction scoresusing SAS software (Version 9.3; SAS Institute Inc.,Cary, NC, USA). Age, parity, resident status, and em-ployment status were kept in all multivariable models re-gardless of statistical significance at the bivariate levelbecause of their role as key sociodemographic character-istics of the sample. Other sociodemographic variablesthat were associated with the satisfaction outcomes at ap value of 0.1 or less in bivariate analyses were included
as categorical covariates in the multivariable regressionmodels. Models were checked for critical assumptionsand evaluated for appropriateness according to varianceinflation factor, condition index, leverage, and Cook’sdistance model diagnostics.One continuous predictor, time spent talking with the
doctor, was analyzed independently against the satisfac-tion domains using Pearson’s correlations.
Qualitative analysisOpen-ended patient feedback on the prenatal care ex-perience was solicited at the end of the questionnairewith the statement, “If you would like to provide anyother information or comment on your prenatal care ex-perience, please do so here…” Seventy-five participants(43.1%) chose to provide feedback. All comments writtenin Samoan were translated into English by Samoan re-search staff. Two of the authors (OA and NH) independ-ently categorized the comments based on positive ornegative content. If a comment contained both types ofcontent it was included in both categories. The two re-viewers met to reach consensus on the categorization ofparticipant comments.
ResultsThe average age of participants in the sample was26.7 years (Table 1). Over 70% of the participants weremarried or cohabitating with a partner. Over three quar-ters of the sample were residents of American Samoa,with non-residents mostly from neighboring Samoa.Approximately 57% of the sample was in their thirdtrimester at the time of the survey, which reflects thegeneral prenatal care population at LBJTMC [8, 14].Eighty-one percent reported having received all of theircare at LBJ and over 90% reported having attended allthe appointments scheduled for them. For most womenthis was not a first pregnancy, with the average parity ofthe sample being 2.7 births.The PCA analysis identified three ‘domains’ of satisfac-
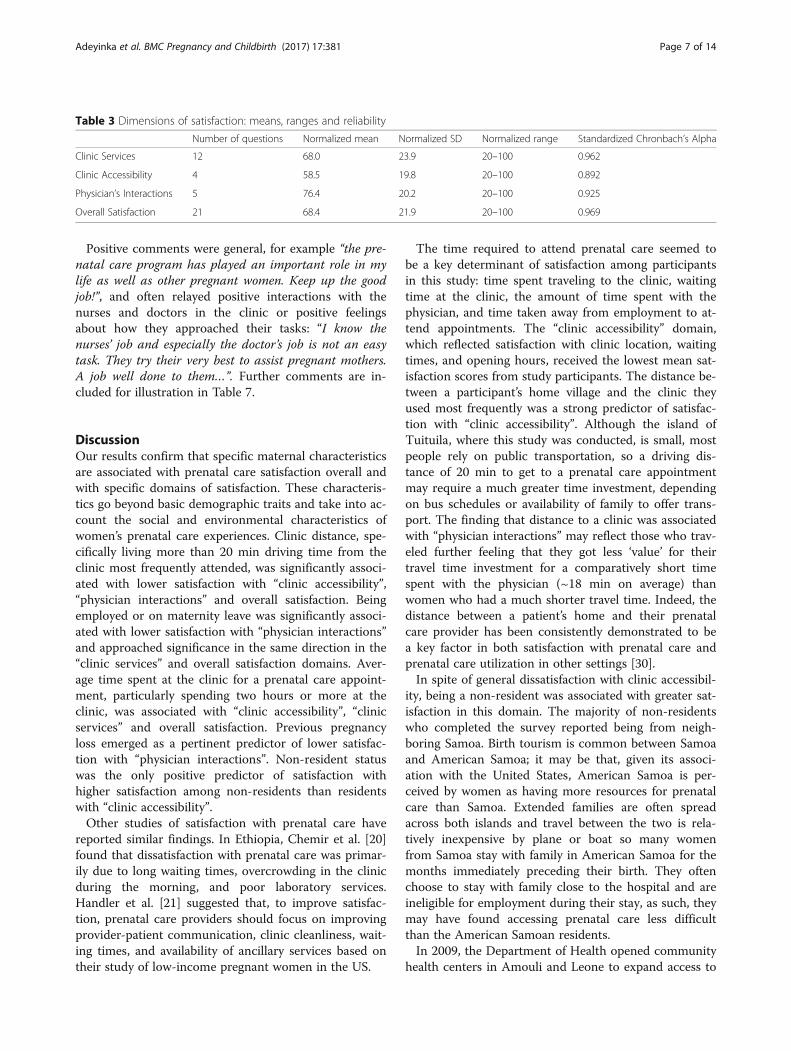
tion. The items that clustered within each componentsuggest that component one represented satisfaction with“clinic services”, component two represented satisfactionwith “clinic accessibility”, and component three satisfac-tion with “physician interactions”. The questions withinthe “clinic services” component, the “accessibility” compo-nent and the “physician interactions” component andoverall satisfaction all had high internal consistency withChronbach’s alphas 0.96, 0.89, 0.93 and 0.97 respectively.Table 3 presents the normalized mean satisfaction
scores for each domain. Mean satisfaction was lowest for“Accessibility” (58.5 points out of 100) and highest inthe “Physician Interactions” domain (76.4 points). Over-all satisfaction had a normalized mean of 68.4 points outof 100.
Adeyinka et al. BMC Pregnancy and Childbirth (2017) 17:381 Page 4 of 14
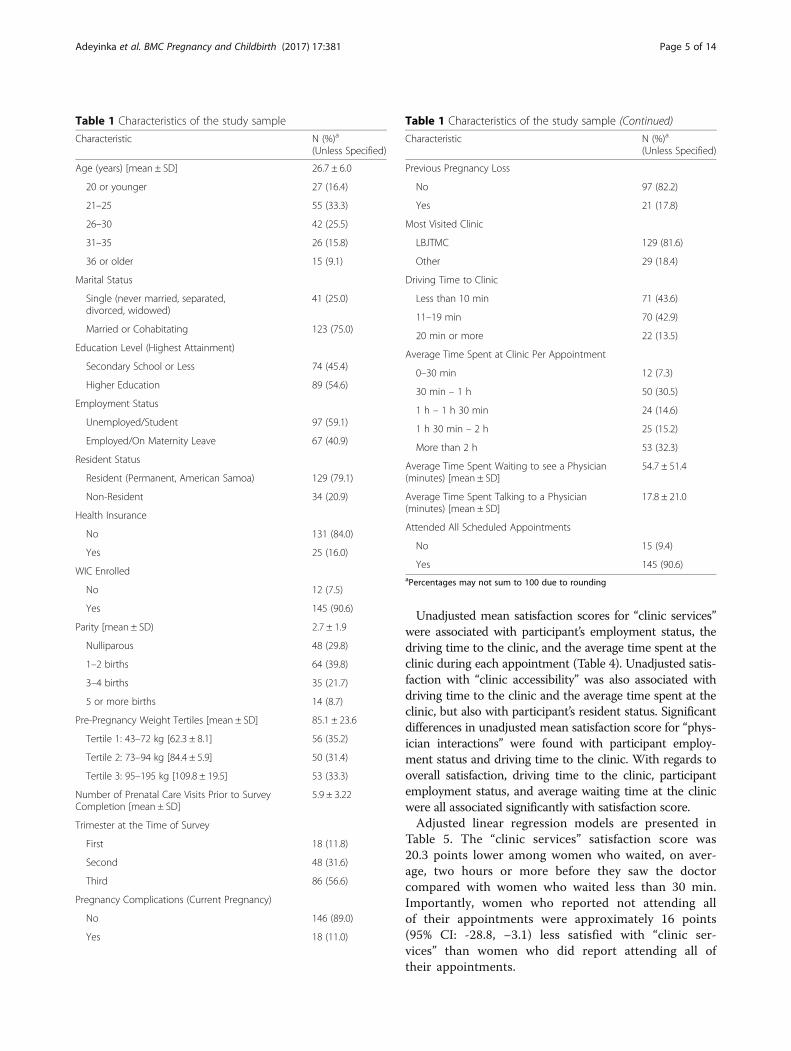
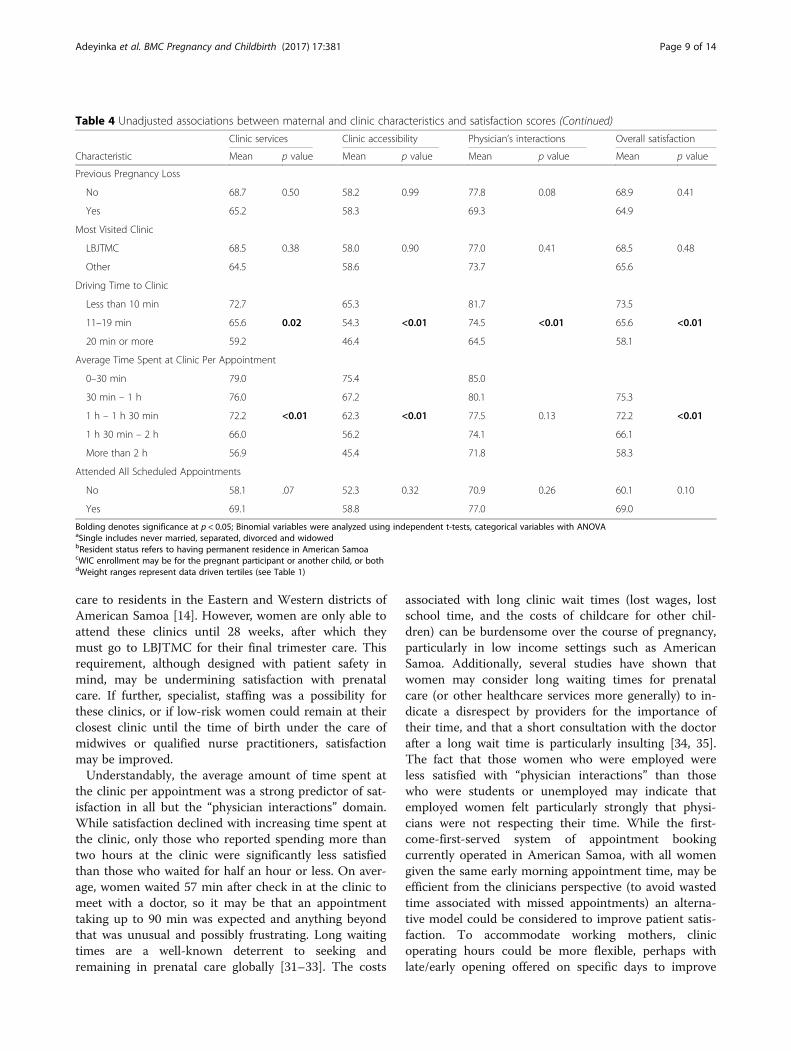
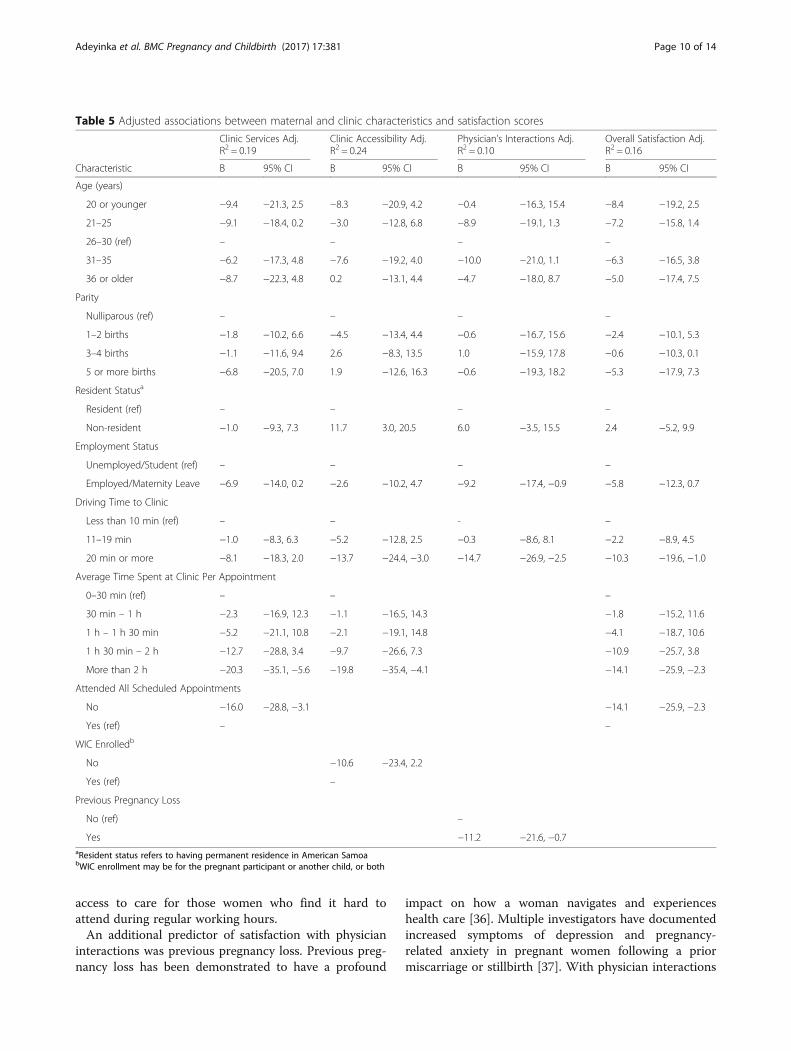
Unadjusted mean satisfaction scores for “clinic services”were associated with participant’s employment status, thedriving time to the clinic, and the average time spent at theclinic during each appointment (Table 4). Unadjusted satis-faction with “clinic accessibility” was also associated withdriving time to the clinic and the average time spent at theclinic, but also with participant’s resident status. Significantdifferences in unadjusted mean satisfaction score for “phys-ician interactions” were found with participant employ-ment status and driving time to the clinic. With regards tooverall satisfaction, driving time to the clinic, participantemployment status, and average waiting time at the clinicwere all associated significantly with satisfaction score.Adjusted linear regression models are presented in
Table 5. The “clinic services” satisfaction score was20.3 points lower among women who waited, on aver-age, two hours or more before they saw the doctorcompared with women who waited less than 30 min.Importantly, women who reported not attending allof their appointments were approximately 16 points(95% CI: -28.8, −3.1) less satisfied with “clinic ser-vices” than women who did report attending all oftheir appointments.
Table 1 Characteristics of the study sample
Characteristic N (%)a
(Unless Specified)
Age (years) [mean ± SD] 26.7 ± 6.0
20 or younger 27 (16.4)
21–25 55 (33.3)
26–30 42 (25.5)
31–35 26 (15.8)
36 or older 15 (9.1)
Marital Status
Single (never married, separated,divorced, widowed)
41 (25.0)
Married or Cohabitating 123 (75.0)
Education Level (Highest Attainment)
Secondary School or Less 74 (45.4)
Higher Education 89 (54.6)
Employment Status
Unemployed/Student 97 (59.1)
Employed/On Maternity Leave 67 (40.9)
Resident Status
Resident (Permanent, American Samoa) 129 (79.1)
Non-Resident 34 (20.9)
Health Insurance
No 131 (84.0)
Yes 25 (16.0)
WIC Enrolled
No 12 (7.5)
Yes 145 (90.6)
Parity [mean ± SD) 2.7 ± 1.9
Nulliparous 48 (29.8)
1–2 births 64 (39.8)
3–4 births 35 (21.7)
5 or more births 14 (8.7)
Pre-Pregnancy Weight Tertiles [mean ± SD] 85.1 ± 23.6
Tertile 1: 43–72 kg [62.3 ± 8.1] 56 (35.2)
Tertile 2: 73–94 kg [84.4 ± 5.9] 50 (31.4)
Tertile 3: 95–195 kg [109.8 ± 19.5] 53 (33.3)
Number of Prenatal Care Visits Prior to SurveyCompletion [mean ± SD]
5.9 ± 3.22
Trimester at the Time of Survey
First 18 (11.8)
Second 48 (31.6)
Third 86 (56.6)
Pregnancy Complications (Current Pregnancy)
No 146 (89.0)
Yes 18 (11.0)
Table 1 Characteristics of the study sample (Continued)
Characteristic N (%)a
(Unless Specified)
Previous Pregnancy Loss
No 97 (82.2)
Yes 21 (17.8)
Most Visited Clinic
LBJTMC 129 (81.6)
Other 29 (18.4)
Driving Time to Clinic
Less than 10 min 71 (43.6)
11–19 min 70 (42.9)
20 min or more 22 (13.5)
Average Time Spent at Clinic Per Appointment
0–30 min 12 (7.3)
30 min – 1 h 50 (30.5)
1 h – 1 h 30 min 24 (14.6)
1 h 30 min – 2 h 25 (15.2)
More than 2 h 53 (32.3)
Average Time Spent Waiting to see a Physician(minutes) [mean ± SD]
54.7 ± 51.4
Average Time Spent Talking to a Physician(minutes) [mean ± SD]
17.8 ± 21.0
Attended All Scheduled Appointments
No 15 (9.4)
Yes 145 (90.6)aPercentages may not sum to 100 due to rounding
Adeyinka et al. BMC Pregnancy and Childbirth (2017) 17:381 Page 5 of 14
Participants living 20 min or further away from theprenatal clinic they most regularly visited were signifi-cantly less satisfied with “clinic accessibility”, “physicianinteractions” and overall, than women who lived less
than 10 min from the clinic (satisfaction scores werebetween 10.3 and 14.7 points lower).With regard to satisfaction with “clinic accessibility”,
non-residents were significantly more satisfied com-pared to American Samoan residents, by 11.7 points(95% CI: 3.0, 20.5). Similar to the findings for other sat-isfaction domains, women who waited two hours ormore were substantially less satisfied compared to thosewho had waited less than 30 min (difference in meansscore: 19.8 points; 95% CI: -35.4, −4.1).Satisfaction with “physician interactions” was
negatively associated with employment. Women whowere employed/on maternity leave were 9.2 points (95%CI: -17.4, −0.9) less satisfied with their interactions withtheir physician than women who were unemployed/stu-dents. Among only those women who had been preg-nant before, women who had previously lost apregnancy were 11.2 points (95% CI: -21.6, −0.7) lesssatisfied than those who had never experienced apregnancy loss.Overall satisfaction was significantly associated with
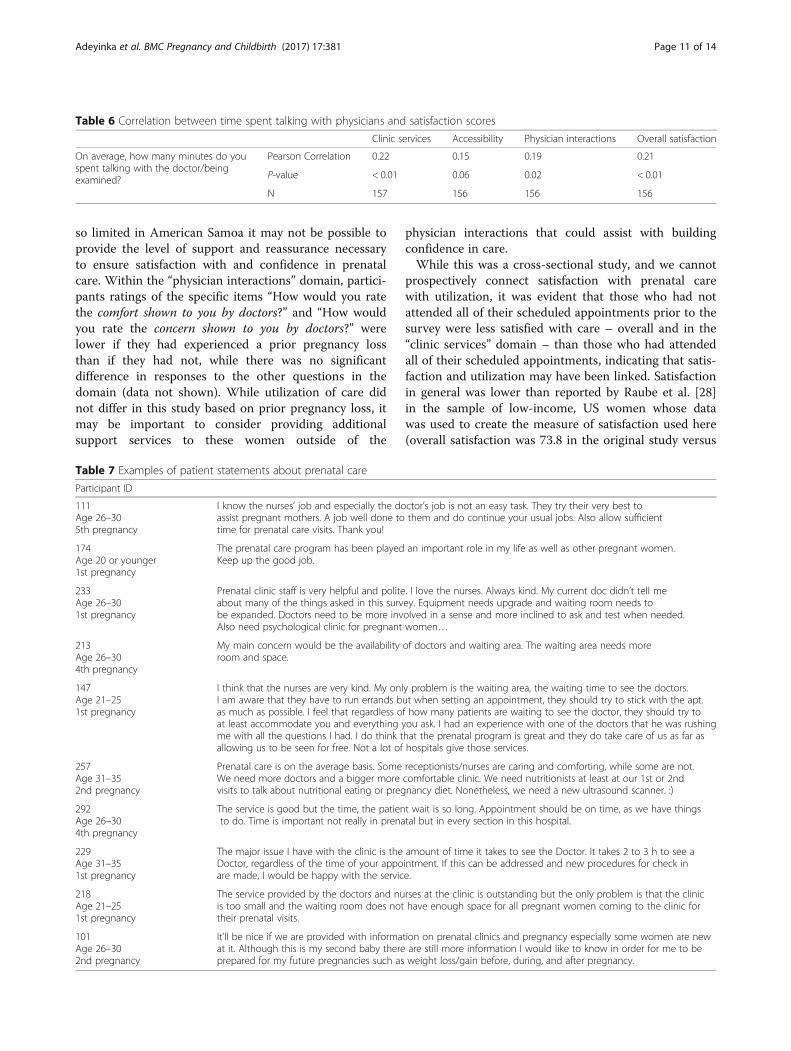
waiting time at the clinic; women who waited on averagetwo hours or more were 14.1 points less satisfied thanwomen who waited less than 30 min (95% CI: -25.9, −2.3).Pearson’s correlation tests indicated that the averageamount of time spent speaking with a physician duringprenatal care visits was positively associated with satisfac-tion with “clinic services” (r2 = 0.22, p = 0.006), “physicianinteractions” (r2 = 0.19, p = 0.017) and overall satisfaction(r2 = 0.214, p = 0.007) (Table 6).
Qualitative findingsOf the 75 participant responses to the question “If youwould like to provide any other information or commenton your prenatal care experience, please do so here…”,53 comments contained negative comments, and 29contained positive comments about the prenatal care ex-perience. Predominant themes among the negative sur-vey comments were long waiting times, limitedavailability of doctors and nurses, and discomfort in thewaiting room. For example, one participant explained, “Ithink that the nurses are very kind. My only problem isthe waiting area, the waiting time to see the doctors… Ifeel that regardless of how many patients are waiting tosee the doctor, they should try to at least accommodateyou and everything you ask”.Some patients implied that the long wait times might
be due to the limited availability of equipment in theclinic as well as the generally limited availability of doc-tors and nurses’. One women made this observationwhen she explained, “… there should be more ultrasoundmachines added because that’s probably why pregnantwomen have to wait for long hours or minutes”.
Table 2 Dimensions of prenatal care satisfaction based onfactor analysis
Dimension Constructs measured Factorloadinga
ClinicServices
How would you rate the availability ofnutritional services (people who can talk toyou about what to eat during pregnancy?)
0.859
How would you rate the respect shownto you by the nurses or receptionists?
0.824
How would you rate the comfort shownto you by the nurses or receptionists?
0.780
How would you rate the explanationof procedures?
0.770
How would you rate the helpfulness ofadvice you have received from theprenatal clinic during your pregnancy?
0.768
How would you rate the thoroughnessof your examination?
0.768
How would you rate the explanation ofyour lab results?
0.760
How would you rate the concern shownto you by the nurses and receptionists?
0.739
How would you rate the availabilityof doctors?
0.721
How would you rate the cleanliness ofthe clinic?
0.709
How would you rate the atmosphere ofthe waiting room?
0.639
How would you rate the comfort ofthe waiting room?
0.610
ClinicAccessibility
How would you rate the waiting time to getan appointment (between the time you calland come in)?
0.745
How would you rate the length of time youwait to see your doctor when you have anappointment?
0.697
How would you rate the clinic whenthinking about the hours it is open?
0.670
How would you rate the location ofthe clinic?
0.638
Physician’sInteractions
How would you rate the comfort shownto you by doctors?
0.900
How would you rate the respect shownto you by doctors?
0.876
How would you rate the concern shownto you by doctors?
0.847
How would you rate the technical skillsshown to you by the doctors?
0.745
How would you rate the modernness ofthe medical equipment in the clinic?
0.399
aFactor loadings were extracted using pattern matrix from oblique rotation
Adeyinka et al. BMC Pregnancy and Childbirth (2017) 17:381 Page 6 of 14
Positive comments were general, for example “the pre-natal care program has played an important role in mylife as well as other pregnant women. Keep up the goodjob!”, and often relayed positive interactions with thenurses and doctors in the clinic or positive feelingsabout how they approached their tasks: “I know thenurses’ job and especially the doctor’s job is not an easytask. They try their very best to assist pregnant mothers.A job well done to them…”. Further comments are in-cluded for illustration in Table 7.
DiscussionOur results confirm that specific maternal characteristicsare associated with prenatal care satisfaction overall andwith specific domains of satisfaction. These characteris-tics go beyond basic demographic traits and take into ac-count the social and environmental characteristics ofwomen’s prenatal care experiences. Clinic distance, spe-cifically living more than 20 min driving time from theclinic most frequently attended, was significantly associ-ated with lower satisfaction with “clinic accessibility”,“physician interactions” and overall satisfaction. Beingemployed or on maternity leave was significantly associ-ated with lower satisfaction with “physician interactions”and approached significance in the same direction in the“clinic services” and overall satisfaction domains. Aver-age time spent at the clinic for a prenatal care appoint-ment, particularly spending two hours or more at theclinic, was associated with “clinic accessibility”, “clinicservices” and overall satisfaction. Previous pregnancyloss emerged as a pertinent predictor of lower satisfac-tion with “physician interactions”. Non-resident statuswas the only positive predictor of satisfaction withhigher satisfaction among non-residents than residentswith “clinic accessibility”.Other studies of satisfaction with prenatal care have
reported similar findings. In Ethiopia, Chemir et al. [20]found that dissatisfaction with prenatal care was primar-ily due to long waiting times, overcrowding in the clinicduring the morning, and poor laboratory services.Handler et al. [21] suggested that, to improve satisfac-tion, prenatal care providers should focus on improvingprovider-patient communication, clinic cleanliness, wait-ing times, and availability of ancillary services based ontheir study of low-income pregnant women in the US.
The time required to attend prenatal care seemed tobe a key determinant of satisfaction among participantsin this study: time spent traveling to the clinic, waitingtime at the clinic, the amount of time spent with thephysician, and time taken away from employment to at-tend appointments. The “clinic accessibility” domain,which reflected satisfaction with clinic location, waitingtimes, and opening hours, received the lowest mean sat-isfaction scores from study participants. The distance be-tween a participant’s home village and the clinic theyused most frequently was a strong predictor of satisfac-tion with “clinic accessibility”. Although the island ofTuituila, where this study was conducted, is small, mostpeople rely on public transportation, so a driving dis-tance of 20 min to get to a prenatal care appointmentmay require a much greater time investment, dependingon bus schedules or availability of family to offer trans-port. The finding that distance to a clinic was associatedwith “physician interactions” may reflect those who trav-eled further feeling that they got less ‘value’ for theirtravel time investment for a comparatively short timespent with the physician (~18 min on average) thanwomen who had a much shorter travel time. Indeed, thedistance between a patient’s home and their prenatalcare provider has been consistently demonstrated to bea key factor in both satisfaction with prenatal care andprenatal care utilization in other settings [30].In spite of general dissatisfaction with clinic accessibil-
ity, being a non-resident was associated with greater sat-isfaction in this domain. The majority of non-residentswho completed the survey reported being from neigh-boring Samoa. Birth tourism is common between Samoaand American Samoa; it may be that, given its associ-ation with the United States, American Samoa is per-ceived by women as having more resources for prenatalcare than Samoa. Extended families are often spreadacross both islands and travel between the two is rela-tively inexpensive by plane or boat so many womenfrom Samoa stay with family in American Samoa for themonths immediately preceding their birth. They oftenchoose to stay with family close to the hospital and areineligible for employment during their stay, as such, theymay have found accessing prenatal care less difficultthan the American Samoan residents.In 2009, the Department of Health opened community
health centers in Amouli and Leone to expand access to
Table 3 Dimensions of satisfaction: means, ranges and reliability
Number of questions Normalized mean Normalized SD Normalized range Standardized Chronbach’s Alpha
Clinic Services 12 68.0 23.9 20–100 0.962
Clinic Accessibility 4 58.5 19.8 20–100 0.892
Physician’s Interactions 5 76.4 20.2 20–100 0.925
Overall Satisfaction 21 68.4 21.9 20–100 0.969
Adeyinka et al. BMC Pregnancy and Childbirth (2017) 17:381 Page 7 of 14
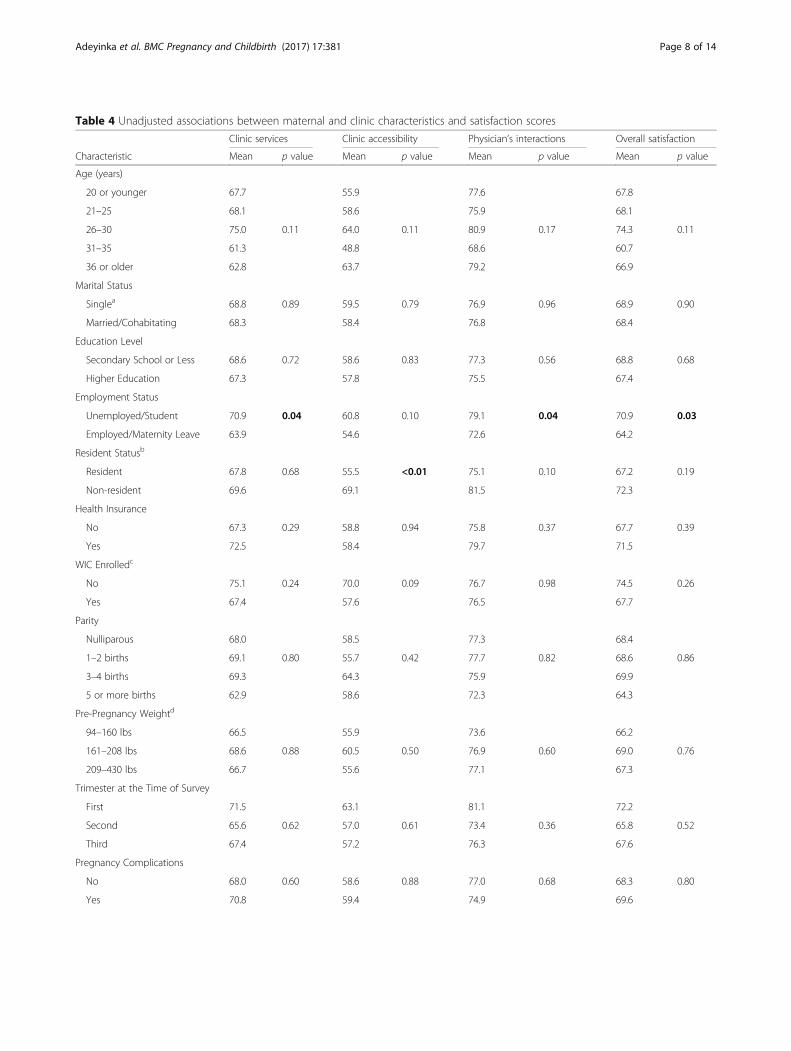
Table 4 Unadjusted associations between maternal and clinic characteristics and satisfaction scores
Clinic services Clinic accessibility Physician’s interactions Overall satisfaction
Characteristic Mean p value Mean p value Mean p value Mean p value
Age (years)
20 or younger 67.7 55.9 77.6 67.8
21–25 68.1 58.6 75.9 68.1
26–30 75.0 0.11 64.0 0.11 80.9 0.17 74.3 0.11
31–35 61.3 48.8 68.6 60.7
36 or older 62.8 63.7 79.2 66.9
Marital Status
Singlea 68.8 0.89 59.5 0.79 76.9 0.96 68.9 0.90
Married/Cohabitating 68.3 58.4 76.8 68.4
Education Level
Secondary School or Less 68.6 0.72 58.6 0.83 77.3 0.56 68.8 0.68
Higher Education 67.3 57.8 75.5 67.4
Employment Status
Unemployed/Student 70.9 0.04 60.8 0.10 79.1 0.04 70.9 0.03
Employed/Maternity Leave 63.9 54.6 72.6 64.2
Resident Statusb
Resident 67.8 0.68 55.5 <0.01 75.1 0.10 67.2 0.19
Non-resident 69.6 69.1 81.5 72.3
Health Insurance
No 67.3 0.29 58.8 0.94 75.8 0.37 67.7 0.39
Yes 72.5 58.4 79.7 71.5
WIC Enrolledc
No 75.1 0.24 70.0 0.09 76.7 0.98 74.5 0.26
Yes 67.4 57.6 76.5 67.7
Parity
Nulliparous 68.0 58.5 77.3 68.4
1–2 births 69.1 0.80 55.7 0.42 77.7 0.82 68.6 0.86
3–4 births 69.3 64.3 75.9 69.9
5 or more births 62.9 58.6 72.3 64.3
Pre-Pregnancy Weightd
94–160 lbs 66.5 55.9 73.6 66.2
161–208 lbs 68.6 0.88 60.5 0.50 76.9 0.60 69.0 0.76
209–430 lbs 66.7 55.6 77.1 67.3
Trimester at the Time of Survey
First 71.5 63.1 81.1 72.2
Second 65.6 0.62 57.0 0.61 73.4 0.36 65.8 0.52
Third 67.4 57.2 76.3 67.6
Pregnancy Complications
No 68.0 0.60 58.6 0.88 77.0 0.68 68.3 0.80
Yes 70.8 59.4 74.9 69.6
Adeyinka et al. BMC Pregnancy and Childbirth (2017) 17:381 Page 8 of 14
care to residents in the Eastern and Western districts ofAmerican Samoa [14]. However, women are only able toattend these clinics until 28 weeks, after which theymust go to LBJTMC for their final trimester care. Thisrequirement, although designed with patient safety inmind, may be undermining satisfaction with prenatalcare. If further, specialist, staffing was a possibility forthese clinics, or if low-risk women could remain at theirclosest clinic until the time of birth under the care ofmidwives or qualified nurse practitioners, satisfactionmay be improved.Understandably, the average amount of time spent at
the clinic per appointment was a strong predictor of sat-isfaction in all but the “physician interactions” domain.While satisfaction declined with increasing time spent atthe clinic, only those who reported spending more thantwo hours at the clinic were significantly less satisfiedthan those who waited for half an hour or less. On aver-age, women waited 57 min after check in at the clinic tomeet with a doctor, so it may be that an appointmenttaking up to 90 min was expected and anything beyondthat was unusual and possibly frustrating. Long waitingtimes are a well-known deterrent to seeking andremaining in prenatal care globally [31–33]. The costs
associated with long clinic wait times (lost wages, lostschool time, and the costs of childcare for other chil-dren) can be burdensome over the course of pregnancy,particularly in low income settings such as AmericanSamoa. Additionally, several studies have shown thatwomen may consider long waiting times for prenatalcare (or other healthcare services more generally) to in-dicate a disrespect by providers for the importance oftheir time, and that a short consultation with the doctorafter a long wait time is particularly insulting [34, 35].The fact that those women who were employed wereless satisfied with “physician interactions” than thosewho were students or unemployed may indicate thatemployed women felt particularly strongly that physi-cians were not respecting their time. While the first-come-first-served system of appointment bookingcurrently operated in American Samoa, with all womengiven the same early morning appointment time, may beefficient from the clinicians perspective (to avoid wastedtime associated with missed appointments) an alterna-tive model could be considered to improve patient satis-faction. To accommodate working mothers, clinicoperating hours could be more flexible, perhaps withlate/early opening offered on specific days to improve
Table 4 Unadjusted associations between maternal and clinic characteristics and satisfaction scores (Continued)
Clinic services Clinic accessibility Physician’s interactions Overall satisfaction
Characteristic Mean p value Mean p value Mean p value Mean p value
Previous Pregnancy Loss
No 68.7 0.50 58.2 0.99 77.8 0.08 68.9 0.41
Yes 65.2 58.3 69.3 64.9
Most Visited Clinic
LBJTMC 68.5 0.38 58.0 0.90 77.0 0.41 68.5 0.48
Other 64.5 58.6 73.7 65.6
Driving Time to Clinic
Less than 10 min 72.7 65.3 81.7 73.5
11–19 min 65.6 0.02 54.3 <0.01 74.5 <0.01 65.6 <0.01
20 min or more 59.2 46.4 64.5 58.1
Average Time Spent at Clinic Per Appointment
0–30 min 79.0 75.4 85.0
30 min – 1 h 76.0 67.2 80.1 75.3
1 h – 1 h 30 min 72.2 <0.01 62.3 <0.01 77.5 0.13 72.2 <0.01
1 h 30 min – 2 h 66.0 56.2 74.1 66.1
More than 2 h 56.9 45.4 71.8 58.3
Attended All Scheduled Appointments
No 58.1 .07 52.3 0.32 70.9 0.26 60.1 0.10
Yes 69.1 58.8 77.0 69.0
Bolding denotes significance at p < 0.05; Binomial variables were analyzed using independent t-tests, categorical variables with ANOVAaSingle includes never married, separated, divorced and widowedbResident status refers to having permanent residence in American SamoacWIC enrollment may be for the pregnant participant or another child, or bothdWeight ranges represent data driven tertiles (see Table 1)
Adeyinka et al. BMC Pregnancy and Childbirth (2017) 17:381 Page 9 of 14
access to care for those women who find it hard toattend during regular working hours.An additional predictor of satisfaction with physician
interactions was previous pregnancy loss. Previous preg-nancy loss has been demonstrated to have a profound
impact on how a woman navigates and experienceshealth care [36]. Multiple investigators have documentedincreased symptoms of depression and pregnancy-related anxiety in pregnant women following a priormiscarriage or stillbirth [37]. With physician interactions
Table 5 Adjusted associations between maternal and clinic characteristics and satisfaction scores
Clinic Services Adj.R2 = 0.19
Clinic Accessibility Adj.R2 = 0.24
Physician’s Interactions Adj.R2 = 0.10
Overall Satisfaction Adj.R2 = 0.16
Characteristic B 95% CI B 95% CI B 95% CI B 95% CI
Age (years)
20 or younger −9.4 −21.3, 2.5 −8.3 −20.9, 4.2 −0.4 −16.3, 15.4 −8.4 −19.2, 2.5
21–25 −9.1 −18.4, 0.2 −3.0 −12.8, 6.8 −8.9 −19.1, 1.3 −7.2 −15.8, 1.4
26–30 (ref) – – – –
31–35 −6.2 −17.3, 4.8 −7.6 −19.2, 4.0 −10.0 −21.0, 1.1 −6.3 −16.5, 3.8
36 or older −8.7 −22.3, 4.8 0.2 −13.1, 4.4 −4.7 −18.0, 8.7 −5.0 −17.4, 7.5
Parity
Nulliparous (ref) – – – –
1–2 births −1.8 −10.2, 6.6 −4.5 −13.4, 4.4 −0.6 −16.7, 15.6 −2.4 −10.1, 5.3
3–4 births −1.1 −11.6, 9.4 2.6 −8.3, 13.5 1.0 −15.9, 17.8 −0.6 −10.3, 0.1
5 or more births −6.8 −20.5, 7.0 1.9 −12.6, 16.3 −0.6 −19.3, 18.2 −5.3 −17.9, 7.3
Resident Statusa
Resident (ref) – – – –
Non-resident −1.0 −9.3, 7.3 11.7 3.0, 20.5 6.0 −3.5, 15.5 2.4 −5.2, 9.9
Employment Status
Unemployed/Student (ref) – – – –
Employed/Maternity Leave −6.9 −14.0, 0.2 −2.6 −10.2, 4.7 −9.2 −17.4, −0.9 −5.8 −12.3, 0.7
Driving Time to Clinic
Less than 10 min (ref) – – - –
11–19 min −1.0 −8.3, 6.3 −5.2 −12.8, 2.5 −0.3 −8.6, 8.1 −2.2 −8.9, 4.5
20 min or more −8.1 −18.3, 2.0 −13.7 −24.4, −3.0 −14.7 −26.9, −2.5 −10.3 −19.6, −1.0
Average Time Spent at Clinic Per Appointment
0–30 min (ref) – – –
30 min – 1 h −2.3 −16.9, 12.3 −1.1 −16.5, 14.3 −1.8 −15.2, 11.6
1 h – 1 h 30 min −5.2 −21.1, 10.8 −2.1 −19.1, 14.8 −4.1 −18.7, 10.6
1 h 30 min – 2 h −12.7 −28.8, 3.4 −9.7 −26.6, 7.3 −10.9 −25.7, 3.8
More than 2 h −20.3 −35.1, −5.6 −19.8 −35.4, −4.1 −14.1 −25.9, −2.3
Attended All Scheduled Appointments
No −16.0 −28.8, −3.1 −14.1 −25.9, −2.3
Yes (ref) – –
WIC Enrolledb
No −10.6 −23.4, 2.2
Yes (ref) –
Previous Pregnancy Loss
No (ref) –
Yes −11.2 −21.6, −0.7aResident status refers to having permanent residence in American SamoabWIC enrollment may be for the pregnant participant or another child, or both
Adeyinka et al. BMC Pregnancy and Childbirth (2017) 17:381 Page 10 of 14
so limited in American Samoa it may not be possible toprovide the level of support and reassurance necessaryto ensure satisfaction with and confidence in prenatalcare. Within the “physician interactions” domain, partici-pants ratings of the specific items “How would you ratethe comfort shown to you by doctors?” and “How wouldyou rate the concern shown to you by doctors?” werelower if they had experienced a prior pregnancy lossthan if they had not, while there was no significantdifference in responses to the other questions in thedomain (data not shown). While utilization of care didnot differ in this study based on prior pregnancy loss, itmay be important to consider providing additionalsupport services to these women outside of the
physician interactions that could assist with buildingconfidence in care.While this was a cross-sectional study, and we cannot
prospectively connect satisfaction with prenatal carewith utilization, it was evident that those who had notattended all of their scheduled appointments prior to thesurvey were less satisfied with care – overall and in the“clinic services” domain – than those who had attendedall of their scheduled appointments, indicating that satis-faction and utilization may have been linked. Satisfactionin general was lower than reported by Raube et al. [28]in the sample of low-income, US women whose datawas used to create the measure of satisfaction used here(overall satisfaction was 73.8 in the original study versus
Table 6 Correlation between time spent talking with physicians and satisfaction scores
Clinic services Accessibility Physician interactions Overall satisfaction
On average, how many minutes do youspent talking with the doctor/beingexamined?
Pearson Correlation 0.22 0.15 0.19 0.21
P-value < 0.01 0.06 0.02 < 0.01
N 157 156 156 156
Table 7 Examples of patient statements about prenatal care
Participant ID
111Age 26–305th pregnancy
I know the nurses’ job and especially the doctor’s job is not an easy task. They try their very best toassist pregnant mothers. A job well done to them and do continue your usual jobs. Also allow sufficienttime for prenatal care visits. Thank you!
174Age 20 or younger1st pregnancy
The prenatal care program has been played an important role in my life as well as other pregnant women.Keep up the good job.
233Age 26–301st pregnancy
Prenatal clinic staff is very helpful and polite. I love the nurses. Always kind. My current doc didn’t tell meabout many of the things asked in this survey. Equipment needs upgrade and waiting room needs tobe expanded. Doctors need to be more involved in a sense and more inclined to ask and test when needed.Also need psychological clinic for pregnant women…
213Age 26–304th pregnancy
My main concern would be the availability of doctors and waiting area. The waiting area needs moreroom and space.
147Age 21–251st pregnancy
I think that the nurses are very kind. My only problem is the waiting area, the waiting time to see the doctors.I am aware that they have to run errands but when setting an appointment, they should try to stick with the apt.as much as possible. I feel that regardless of how many patients are waiting to see the doctor, they should try toat least accommodate you and everything you ask. I had an experience with one of the doctors that he was rushingme with all the questions I had. I do think that the prenatal program is great and they do take care of us as far asallowing us to be seen for free. Not a lot of hospitals give those services.
257Age 31–352nd pregnancy
Prenatal care is on the average basis. Some receptionists/nurses are caring and comforting, while some are not.We need more doctors and a bigger more comfortable clinic. We need nutritionists at least at our 1st or 2ndvisits to talk about nutritional eating or pregnancy diet. Nonetheless, we need a new ultrasound scanner. :)
292Age 26–304th pregnancy
The service is good but the time, the patient wait is so long. Appointment should be on time, as we have thingsto do. Time is important not really in prenatal but in every section in this hospital.
229Age 31–351st pregnancy
The major issue I have with the clinic is the amount of time it takes to see the Doctor. It takes 2 to 3 h to see aDoctor, regardless of the time of your appointment. If this can be addressed and new procedures for check inare made, I would be happy with the service.
218Age 21–251st pregnancy
The service provided by the doctors and nurses at the clinic is outstanding but the only problem is that the clinicis too small and the waiting room does not have enough space for all pregnant women coming to the clinic fortheir prenatal visits.
101Age 26–302nd pregnancy
It’ll be nice if we are provided with information on prenatal clinics and pregnancy especially some women are newat it. Although this is my second baby there are still more information I would like to know in order for me to beprepared for my future pregnancies such as weight loss/gain before, during, and after pregnancy.
Adeyinka et al. BMC Pregnancy and Childbirth (2017) 17:381 Page 11 of 14
68.4 here) and lower than that reported among AfricanAmerican women in a managed care organization in theUS Midwest (overall satisfaction: 80.3) [24]. This sug-gests that further attention should be paid to monitoringand improving satisfaction in this setting, to ensure con-tinued attendance at the individual and community level.Our data suggest that efforts to this effect should be fo-cused on improving organizational aspects of care inparticular: improving waiting times and increasingaccessibility.Several studies have examined alternative organizational
models of prenatal care and measured satisfaction withcare as an outcome. Randomized controlled trials in theUK [38], the US [39] and Zimbabwe [40] compared fewer,more objectively focused prenatal care visits with standardof care. Fewer visits should reduce the cumulative timespent traveling to the clinic and waiting, but satisfactionwith these programs varied; satisfaction was increased inpatients assigned to fewer visits in Zimbabwe and the US,but British patients reported lower satisfaction and moreanxiety about pregnancy progress. Advancing this litera-ture, a recent study in California tested a new model ofcare (OB Nest) and compared fewer prenatal care visitssupported by virtual connections (8 office visits plus 6telephone or online nurse visits) to twelve standard of careoffice visits [41] and preliminary results suggested that theprogram improved patient satisfaction (OB Nest = 95%versus usual care = 77%, p < 0.001) [42]. In very limited re-source settings, reducing prenatal care visits has been as-sociated with increased perinatal mortality [43] andAmerican Samoa may not be equipped to facilitate virtualmonitoring, so it would be hard to advocate for either ofthese as an option for improving prenatal care delivery inthis setting. One option that may be feasible is group pre-natal care. There is a building literature to suggest thatnurse/midwife led prenatal care and education, deliveredvia facilitated discussion to groups of 8–12 women simul-taneously, is associated with large improvements in satis-faction, utilization and pregnancy outcomes [23, 44, 45].In American Samoa offering group prenatal care to‘healthy’ pregnancies (those with no complications otherthan overweight) may improve satisfaction and also re-duce burden on the practicing physicians, potentially re-ducing waiting times for others.There are some limitations to our study. While we
used a satisfaction questionnaire that had been previ-ously validated for use in other settings [28] we onlyidentified three specific domains of satisfaction com-pared to the seven that were extracted in the initialquestionnaire development. The reasons why the ques-tionnaire produced fewer domains requires further in-vestigation. Our domains did demonstrate highreliability and good construct validity, but the fact thatour final adjusted models explained between 10 and
24% of variation in satisfaction does suggest that thereare other aspects of satisfaction that were not capturedby the questionnaire. Further qualitative work may benecessary to understand women’s expectations of careand their satisfaction with it. Perhaps most pertinentof the limitations was that the questionnaire was lim-ited in terms of its ability to explore cultural, social orlinguistic factors that may be influencing women’s en-gagement with prenatal care. There is evidence thatcultural beliefs about pregnancy and the appropriateprovider of prenatal care may influence timing of initi-ation of care or the type of care Samoan women seek[26], but how these beliefs may influence satisfactiononce a patient has enrolled in clinical care is still to beexplored. Reports from neighboring independentSamoa have described ‘clashes’ between Westernizedmedicine and traditional birthing practices whichprioritize women’s “social, cultural, and emotionalsafety” over their “biological safety” [26] but these is-sues have been little explored in American Samoa.Similarly, language barriers between patient and pro-
vider have been associated with lower satisfaction withcare [46]. Prenatal care clinicians in American Samoaare often from outside of the culture and are unfamiliarwith the local language. The effect of provider ethnicity/primary language on satisfaction with care should be fur-ther explored in new research.A further limitation was the self-report nature of
the questionnaire, which may have introduced bias.Two pertinent issues arose: a lack of detailed infor-mation about the severity of pregnancy complications,which may have affected reports of satisfaction andthe frequent misreporting of height (implausibility ofvalues) which made it impossible to examine whetheroverweight or obesity impacted satisfaction orutilization. However, while weight status has been as-sociated with differential prenatal care utilization inother settings [7, 47] we suspect that it is unlikely tobe an issue in American Samoa since more than 90%of women are overweight or obese upon conception[8] and there is little stigma attached to pregnancybody size in this setting [48]. A significant strength toour study was the fact that we surveyed women dur-ing pregnancy, as opposed to many studies who haveasked about satisfaction retrospectively, meaning thatwe may expect little bias based on birth experiences.
ConclusionsPrenatal care satisfaction is an important determinantof prenatal care utilization and in American Samoa,where many pregnancies are high risk, ensuringadequate utilization of prenatal care services isimperative. This study suggests that there is substan-tial room for improvement in pregnant women’s
Adeyinka et al. BMC Pregnancy and Childbirth (2017) 17:381 Page 12 of 14
satisfaction with prenatal care in American Samoa,and that efforts to improve satisfaction should focuson improving waiting times and clinic accessibility.Further research is necessary to explore other socialand cultural factors that may be impacting satisfactionwith care and preventing optimal utilization ofprenatal care services.
Additional file
Additional file 1: Prenatal care questionnaire. Questionnaire instrumentused to collect data on prenatal care satisfaction. (PDF 125 kb)
AbbreviationsBMI: Body mass index; CDC: Centers for disease control; CI: Confidenceinterval; LBJTMC: Lyndon b johnson tropical medical center; PCA: Principalcomponents analysis; PRAMS: Pregnancy risk assessment and monitoringsurvey; WIC: Women, infants and children
AcknowledgementsThe authors would like to thank Renu Nadkarni, Jeanette Sternberg Lamband Sefilina Skelton who all contributed to the collection of these data.
FundingNo funding was received for this study.
Availability of data and materialsThe dataset analyzed during the current study is not publicly available dueto restrictions in the IRB agreement but may be available from thecorresponding author upon reasonable request.
Authors’ contributionsNH, STM and BTM conceived the original study. MF performed the datacollection in American Samoa. OA was responsible for data analysis andinterpretation, with supervision from AMJ and NH. All authors contributed tocritical revision of this manuscript, approved the final manuscript, and takeresponsibility for its content.
Ethics approval and consent to participateInstitutional review boards at Brown University (Protocol #1405001052) andthe American Samoa Department of Health reviewed the study protocol andgave their approval. Participants in this study gave written informed consent.
Consent for publicationNot applicable.
Competing interestsOA, AMJ, STM, MF and NH have no competing interests to declare. BTM is aprenatal care provider in American Samoa; she participated in the design ofthe study and reviewed the final manuscript but was not involved in datacollection, data analysis or interpretation.
Publisher’s NoteSpringer Nature remains neutral with regard to jurisdictional claims inpublished maps and institutional affiliations.
Author details1Department of Chronic Disease Epidemiology, School of Public Health, YaleUniversity, 60 College Street, New Haven, CT 06520-8034, USA. 2InternationalHealth Institute, Department of Epidemiology, School of Public Health,Brown University, Providence, USA. 3Lyndon B Johnson Tropical MedicalCenter, Pago Pago, American Samoa. 4Division of Natural Sciences andMathematics, Chaminade University, Honolulu, USA.
Received: 16 September 2016 Accepted: 3 November 2017
References1. Baeten JM, Bukusi EA, Lambe M. Pregnancy complications and outcomes
among overweight and obese nulliparous women. Am J Public Health.2001;91:436–40.
2. Crane JM, White J, Murphy P, Burrage L, Hutchens D. The effect ofgestational weight gain by body mass index on maternal and neonataloutcomes. J Obstet Gynaecol Can. 2009;31:28–35.
3. Siega-Riz AM, Siega-Riz AM, Laraia B. The implications of maternaloverweight and obesity on the course of pregnancy and birth outcomes.Matern Child Health J. 2006;10:S153–6.
4. Mission JF, Marshall NE, Caughey AB. Pregnancy risks associated withobesity. Obstet Gynecol Clin N Am. 2015;42:335–53.
5. Vahratian A. Prevalence of overweight and obesity among women ofchildbearing age. Matern Child Health J. 2009;13:268–73.
6. Ogden CL, Carroll MD, Kit BK, Flegal KM. Prevalence of childhood and adultobesity in the United States, 2011-2012. JAMA. 2014;311:806–14.
7. Zozzaro-Smith PE, Bacak S, Conway C, Park J, Glantz JC, Thornburg LL.Association between obesity during pregnanct and the adequacy ofprenatal care. Matern Child Health J. 2016;20(1):158–63.
8. Hawley NL, Johnson W, Hart CN, Triche EW, Ah Ching J, Muasau-Howard B,McGarvey ST. Gestational weight gain among American Samoan womenand its impact on delivery and infant outcomes. BMC Pregnancy Childbirth.2015;5:10.
9. Health Services and Resource Administration Data Warehouse. Designatedhealth professional shortage areas. 2016. https://datawarehouse.hrsa.gov/tools/analyzers/hpsafind.aspx. Accessed 16 Sept 2016.
10. National Women, Infants, and Children (WIC) Organization. How WICimpacts the people of American Samoa. 2016. https://www.nwica.org/states/american-samoa. Accessed 16 Sept 2016.
11. European Board and College of Obstetrics and Gynaecology (EBCOG)Scientific Committee. The public health importance of antenatal care. FactsViews Vis Obgyn. 2015;7:5–6.
12. Schempf AH, Mendola P, Hamilton BE, Hayes DK, Makuc DM. Perinataloutcomes for Asian, native Hawaiian, and other Pacific islander mothers ofsingle and multiple race/ethnicity: California and Hawaii, 2003-2005.Am J Pub Health. 2010;100(5):877–87.
13. Chang AL, Hurwitz E, Miyamura J, Kaneshiro B, Sentell T. Maternal risk factorsand perinatal outcomes among Pacific islander groups in Hawaii: a retrospectivecohort study using statewide data. BMC Pregnancy Childbirth. 2015;15:239.
14. Hawley NL, Brown C, Nu’usolia O, Ah Ching J, Muasau-Howard B, McGarveyST. Barriers to adequate prenatal care utilization in American Samoa. MaternChild Health J. 2014;18:2284–92.
15. Kotelchuck M. An evaluation of the Kessner adequacy of prenatal care indexand a proposed adequacy of prenatal care utilization index. Am J PublicHealth. 1994;84:1414–20.
16. Wheatley RR, Kelley MA, Peacock N, Delgado J. Women’s narratives on qualityin prenatal care: a multicultural perspective. Qual Health Res. 2008;18:1586–98.
17. Higgins P, Murray ML, Williams EM. Self-esteem, social support, andsatisfaction differences in women with adequate and inadequate prenatalcare. Birth. 1994;21:26–33.
18. Duong DV, Binns CW, Lee AH. Utilization of delivery services at the primaryhealth level in rural Vietnam. Soc Sci Med. 2004;59:2585–95.
19. Moore P, Hepworth JT. Use of perinatal and infant health services byMexican-American Medicaid enrollees. JAMA. 1994;272:297–304.
20. Chemir F, Alemseged F, Workneh D. Satisfaction with focused antenatalcare service and associated factors among pregnant women attendingfocused antenatal care at health centers in Jimma town, Jimma zone, southWest Ethiopia: a facility-based cross-sectional study triangulated withqualitative study. BMC Res Notes. 2014;7:164.
21. Handler A, Rosenberg D, Raube K, Kelley MA. Health care characteristics associatedwith women’s satisfaction with prenatal care. Med Care. 1998;36:679–94.
22. Handler A, Rosenberg D, Raube K, Lyons S. Satisfaction and use of prenatalcare: their relationship among African-American women in a large managedcare organization. Birth. 2003;30:23–30.
23. Jafari F, Eftekhar H, Mohammad K, Fotouhi A. Does group prenatal careaffect satisfaction and prenatal care utilization in Iranian pregnant women?Iran J Public Health. 2010;39:52–62.
Adeyinka et al. BMC Pregnancy and Childbirth (2017) 17:381 Page 13 of 14
24. Handler A, Rosenberg D, Raube K, Lyons S. Prenatal care characteristics andAfrican-American women’s satisfaction with care in a managed careorganization. Womens Health Issues. 2003;13:93–103.
25. CIA World Factbook. American Samoa. https://www.cia.gov/library/publications/the-world-factbook/geos/print_aq.html. Accessed 12 July 2017.
26. Barclay L, Aiavao F, Fenwick J, Tooloa PK. Midwive’s Tales: stories of Traditional& Professional Birthing in Samoa. CA: Vanderbilt University Press; 2005.
27. Gilbert BC, Shulman HB, Fischer LA, Rogers MM. The pregnancy riskassessment monitoring system (PRAMS): methods and 1996 responserates from 11 states. Matern Child Health J. 1999;3:199–209.
28. Raube K, Handler A, Rosenberg D. Measuring satisfaction among low-incomewomen: a prenatal care questionnaire. Matern Child Health J. 1998;2:25–33.
29. Field A. Discovering statistics using IBM SPSS statistics. 4th ed. London: SagePublications; 2013. p. 665–719.
30. Simkhada B, Teijlingen ER, Porter M, Simkhada P. Factors affecting theutilization of antenatal care in developing countries: systematic reviewof the literature. J Adv Nurs. 2008;61:244–60.
31. Dye TD, Wojtowycz MA. Organisational variation, satisfaction, and women’stime investment in prenatal care. Paediatr Perinat Epidemiol. 1999;13:158–69.
32. Ganle JK, Parker M, Fitzpatrick R, Otupiri E. A qualitative study of health systembarriers to accessibility and utilization of maternal and newborn healthcareservices in Ghana after user-fee abolition. BMC Pregnancy Childbirth. 2014;14:425.
33. Heaman MI, Sword W, Elliot L, Moffatt M, Helewa ME, Morris H, Gregory P, TjadenL, Cook C. Barriers and facilitators related to use of prenatal care by inner-citywomen: perceptions of healthcare providers. BMC Pregnancy Childbirth. 2015;15:2.
34. Institute of Medicine Committee to Study Outreach for Prenatal Care. Barriers tothe use of prenatal care. In: Brown SS, editor. Prenatal care: reaching mothers,reaching infants. Washington, DC: National Academy Press; 1988. p. 54–87.
35. Lacy NL, Paulman A, Reuter MD, Lovejoy B. Why we don’t come: patientperceptions on no-shows. Ann Fam Med. 2004;2:541–5.
36. Gold KJ. Navigating care after a baby dies: a systematic review of parentexperiences with health providers. J Perinatol. 2006;27:230–7.
37. Lamb EH. The impact of previous perinatal loss on subsequent pregnancyand parenting. J Perinat Educ. 2002;11:33–40.
38. Sikorski J, Wilson J, Clement S, Das S, Smeeton N. A randomised controlledtrial comparing two schedules of antenatal visits: the antenatal care project.BMJ. 1999;312:546–53.
39. McDuffie RS, Beck A, Bischoff K, Cross J, Orleans M. Effect of frequency ofprenatal care visits on perinatal outcome among low-risk women. Arandomized controlled trial. JAMA. 1996;275:847–51.
40. Munjanja SP, Lindmark G, Nyström L. Randomized controlled trial of areduced-visits programme of antenatal care in Harare, Zimbabwe. Lancet.1996;348:364–9.
41. Ridegway JL, LeBlanc A, Branda M, Harms RW, Morris MA, Nesbitt K,Gostout BS, Barkey LM, Sobolewski SM, Brodrick E, Inselman J, Baron A,Sivly A, Baker M, Finnie D, Chaudhry R, Famuyide AO. Implementation ofa new prenatal care model to reduce office visits and increaseconnectivity and continuity of care: protocol for a mixed-methods study.BMC Pregnancy Childbirth. 2015;15:323.
42. Butler Tobah YS, LeBlanc A, Branda M, Inselman J, Gostout B, FamuyideA. OB Nest – a novel approach to prenatal care. In: Proceedings of theAmerican College of Obstetricians and Gynecologists’ 2016 annualclinical and scientific meeting; 2016 may 14–17. Washington, DC:Philadelphia: ACOG; 2016. Abstract No. 21.
43. Dowswell T, Carroli G, Duley L, Gates S, Gülmezoglu AM, Khan-NeelofurD, Piaggio GG. Alternative versus standard packages of antenatal care forlow-risk pregnancy. Cochrane Database Syst Rev. 2010;6:CD000934.
44. Ickovics JR, Kershaw TS, Westdahl C, Magriples U, Massey Z, Reynolds H,Rising SS. Group prenatal care and perinatal outcomes: a randomizedcontrolled trial. Obstet Gynecol. 2007;110:330–9.
45. Tilden EL, Hersh SR, Emeis CL, Weinstein SR, Caughey AB. Group prenatalcare: review of outcomes and recommendations for modelimplementation. Obstet Gynecol Surv. 2014;69:46–55.
46. Novick G. Women’s experience of prenatal care: an integrative review.J Midwifery Womens Health. 2009:226–37.
47. Chu SY, Bachman DJ, Callaghan WM, Whitlock EP, Dietz PM, Berg CJ, O’Keefe-Rosetti M, Bruce FC, Hornbrook MC. Association between obesity duringpregnancy and increased use of healthcare. New Engl J Med. 2008;358:1444–53.
48. Sternberg-Lamb JM. Maternal attitudes and practices towards a healthypregnancy in American Samoa: Brown University, Undergraduate Thesis.Providence: Brown University; 2015.
• We accept pre-submission inquiries
• Our selector tool helps you to find the most relevant journal
• We provide round the clock customer support
• Convenient online submission
• Thorough peer review
• Inclusion in PubMed and all major indexing services
• Maximum visibility for your research
Submit your manuscript atwww.biomedcentral.com/submit
Submit your next manuscript to BioMed Central and we will help you at every step:
Adeyinka et al. BMC Pregnancy and Childbirth (2017) 17:381 Page 14 of 14