Presentación de PowerPoint Situacional...Dirección Regional de Salud Piura 0 1000 2000 3000 4000...
77
Dirección Regional de Salud Piura Dirección Regional de Salud Piura Oficina de Epidemiología Sala de Situación de Salud de Piura Semana Epidemiológica N ° 23 - 2018 (avance hasta el día 14.06.18) La sala de situación de salud es un producto de la Oficina de Epidemiología de la Dirección Regional de Salud Piura. Se autoriza su uso total o parcial siempre y cuando se citen expresamente las fuentes de información de este producto.
Transcript of Presentación de PowerPoint Situacional...Dirección Regional de Salud Piura 0 1000 2000 3000 4000...
Dirección Regional de Salud Piura
Dirección Regional de Salud PiuraOficina de Epidemiología
Sala de Situación de Salud de Piura
Semana Epidemiológica N° 23 -2018(avance hasta el día 14.06.18)
La sala de situación de salud es un producto de la Oficina de Epidemiología de la Dirección Regional de Salud Piura. Se autoriza su uso total o parcial siempre y cuando se citen expresamente las fuentes de información de este producto.

Dirección Regional de Salud Piura
Fuente: DIRESA PIURA/OEPI (*) Avande SE N° 24
Situación Actual de dengue en Piura 2018
Estratificación de DengueConfirmados Probables Total
CASTILLA 31 217 248 1.69 22.42
PIURA 24 193 217 1.40 19.62
VEINTISEIS DE OCTUBRE 16 112 128 0.83 11.57
SULLANA 23 81 104 0.57 9.40
CHULUCANAS 10 90 100 1.28 9.04
CATACAOS 8 67 75 1.01 6.78
TAMBO GRANDE 16 11 27 0.22 2.44
SECHURA 1 24 25 0.57 2.26
CURA MORI 2 22 24 1.26 2.17
SALITRAL (P) 2 20 22 2.56 1.99
LA UNION 0 15 15 0.36 1.36
MANCORA 6 9 15 1.14 1.36
BELLAVISTA 5 8 13 0.33 1.18
LA ARENA 4 8 12 0.31 1.08
SAN JUAN DE BIGOTE 0 11 11 1.64 0.99
PAITA 2 9 11 0.12 0.99
PARIÐAS 1 5 6 0.07 0.54
BUENOS AIRES 0 4 4 0.49 0.36
IGNACIO ESCUDERO 1 3 4 0.20 0.36
MORROPON 0 3 3 0.21 0.27
LA MATANZA 0 3 3 0.23 0.27
MARCAVELICA 1 2 3 0.10 0.27
RINCONADA LLICUAR 0 3 3 0.94 0.27
LOS ORGANOS 0 3 3 0.31 0.27
CANCHAQUE 1 1 2 0.24 0.18
VICE 2 0 2 0.14 0.18
QUERECOTILLO 0 1 1 0.04 0.09
BERNAL 0 1 1 0.13 0.09
FRIAS 0 1 1 0.04 0.09
LAS LOMAS 0 1 1 0.04 0.09
LANCONES 1 0 1 0.07 0.09
PACAIPAMPA 0 1 1 0.04 0.09
YAMANGO 0 1 1 0.10 0.09
SALITRAL 0 1 1 0.15 0.09
EL TALLAN 0 1 1 0.20 0.09
HUANCABAMBA 0 1 1 0.03 0.09
HUARMACA 0 1 1 0.02 0.09
OTRAS DIRESAS 1 14 15 0.00
TOTAL 158 948 1106 0.59 100
Número de casosIncidencia x
1000%DISTRITOS

Dirección Regional de Salud Piura
0
1000
2000
3000
4000
5000
6000
1 8 15 22 29 36 43 50 5 12 19 26 33 40 47 1 8 15 22 29 36 43 50 5 12 19 26 33 40 47 2 9 16 23 30 37 44 51 6 13 20
Nº
CA
SO
S
S.E.
2013
1973
2014
2685
2015
19903
2016
7594
2017
43835
2018 *
1106
Fuente: DIRESA PIURA/OEPI (*) Avande SE N° 24
Número de casos de dengue, Piura 2013 – 2018 *
"Fenómeno de El Niño Costero"
Desde la SE 1 hasta avance de la SE 24, se han notificado 1106casos de dengue en el departamento de Piura.En el 2017, en el mismo periodo se notificó 40287 en al región laTIA fue de 213.5 casos por 10 mil hab. Asimismo, se notificó 41fallecidos por dengue.
AÑOS 2013 2014 2015 2016 2017 2018
N° CASOS 1973 2685 19903 7594 43835 1106
Incidencia por
10 mil hab.10.9 14.7 107.9 40.9 234.0 5.9
Defunciones 2 5 23 18 41 0
Dirección Regional de Salud Piura
Fuente: DIRESA PIURA/OEPI (*) Avande SE N° 24
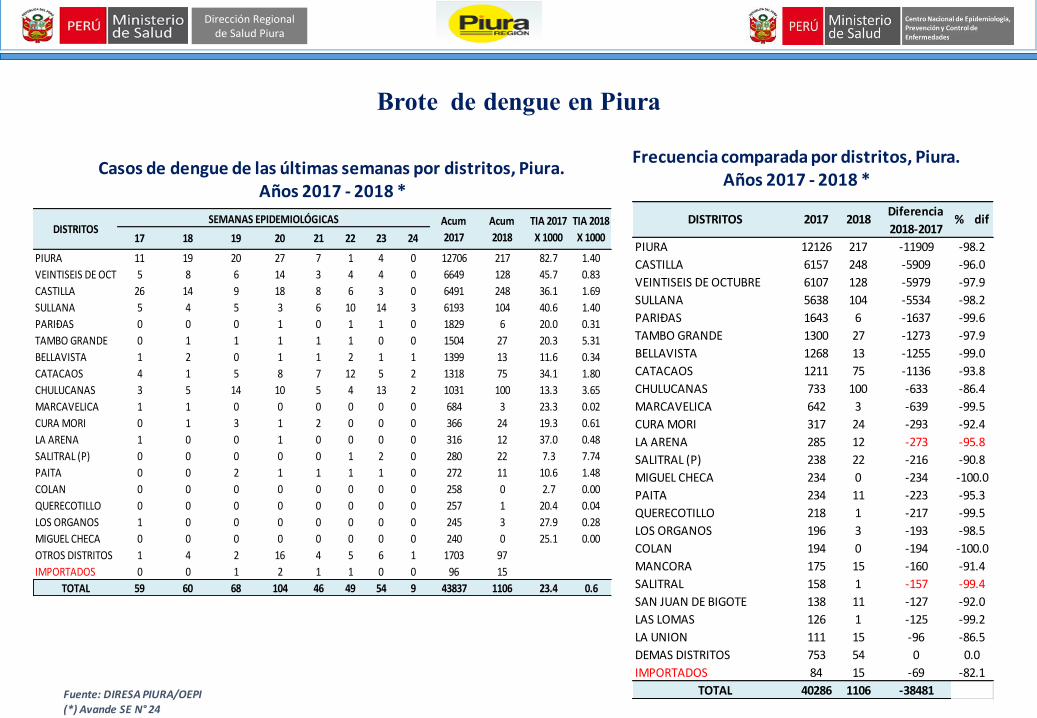
Brote de dengue en Piura
Frecuencia comparada por distritos, Piura. Años 2017 - 2018 *
PIURA 12126 217 -11909 -98.2
CASTILLA 6157 248 -5909 -96.0
VEINTISEIS DE OCTUBRE 6107 128 -5979 -97.9
SULLANA 5638 104 -5534 -98.2
PARIÐAS 1643 6 -1637 -99.6
TAMBO GRANDE 1300 27 -1273 -97.9
BELLAVISTA 1268 13 -1255 -99.0
CATACAOS 1211 75 -1136 -93.8
CHULUCANAS 733 100 -633 -86.4
MARCAVELICA 642 3 -639 -99.5
CURA MORI 317 24 -293 -92.4
LA ARENA 285 12 -273 -95.8
SALITRAL (P) 238 22 -216 -90.8
MIGUEL CHECA 234 0 -234 -100.0
PAITA 234 11 -223 -95.3
QUERECOTILLO 218 1 -217 -99.5
LOS ORGANOS 196 3 -193 -98.5
COLAN 194 0 -194 -100.0
MANCORA 175 15 -160 -91.4
SALITRAL 158 1 -157 -99.4
SAN JUAN DE BIGOTE 138 11 -127 -92.0
LAS LOMAS 126 1 -125 -99.2
LA UNION 111 15 -96 -86.5
DEMAS DISTRITOS 753 54 0 0.0
IMPORTADOS 84 15 -69 -82.1
TOTAL 40286 1106 -38481
% difDiferencia
2018-2017DISTRITOS 2017 2018
Casos de dengue de las últimas semanas por distritos, Piura. Años 2017 - 2018 *
17 18 19 20 21 22 23 24
PIURA 11 19 20 27 7 1 4 0 12706 217 82.7 1.40
VEINTISEIS DE OCTUBRE5 8 6 14 3 4 4 0 6649 128 45.7 0.83
CASTILLA 26 14 9 18 8 6 3 0 6491 248 36.1 1.69
SULLANA 5 4 5 3 6 10 14 3 6193 104 40.6 1.40
PARIÐAS 0 0 0 1 0 1 1 0 1829 6 20.0 0.31
TAMBO GRANDE 0 1 1 1 1 1 0 0 1504 27 20.3 5.31
BELLAVISTA 1 2 0 1 1 2 1 1 1399 13 11.6 0.34
CATACAOS 4 1 5 8 7 12 5 2 1318 75 34.1 1.80
CHULUCANAS 3 5 14 10 5 4 13 2 1031 100 13.3 3.65
MARCAVELICA 1 1 0 0 0 0 0 0 684 3 23.3 0.02
CURA MORI 0 1 3 1 2 0 0 0 366 24 19.3 0.61
LA ARENA 1 0 0 1 0 0 0 0 316 12 37.0 0.48
SALITRAL (P) 0 0 0 0 0 1 2 0 280 22 7.3 7.74
PAITA 0 0 2 1 1 1 1 0 272 11 10.6 1.48
COLAN 0 0 0 0 0 0 0 0 258 0 2.7 0.00
QUERECOTILLO 0 0 0 0 0 0 0 0 257 1 20.4 0.04
LOS ORGANOS 1 0 0 0 0 0 0 0 245 3 27.9 0.28
MIGUEL CHECA 0 0 0 0 0 0 0 0 240 0 25.1 0.00
OTROS DISTRITOS 1 4 2 16 4 5 6 1 1703 97
IMPORTADOS 0 0 1 2 1 1 0 0 96 15
TOTAL 59 60 68 104 46 49 54 9 43837 1106 23.4 0.6
TIA 2018
X 1000
SEMANAS EPIDEMIOLÓGICAS TIA 2017
X 1000DISTRITOS
Acum
2017
Acum
2018

Dirección Regional de Salud Piura
Fuente: DIRESA PIURA/OEPI (*) Avande SE N° 24
Tasa de incidencia de las últimas 10 SE por distritos Piura, 2018
• La tendencia se muestra estable en las últimas semana en losdistritos de Piura, Castilla, Los Organos, Catacaos, Chulucanas,Sullana.
0.00
1.00
2.00
3.00
4.00
5.00
6.00
15 16 17 18 19 20 21 22 23 24
Semanas Epidemiológicas
PIURA VEINTISEIS DE OCTUBRE
0.00
1.00
2.00
3.00
4.00
5.00
6.00
15 16 17 18 19 20 21 22 23 24
Semanas Epidemiológicas
CASTILLA SULLANA PARIÐAS
0.00
1.00
2.00
3.00
4.00
5.00
6.00
15 16 17 18 19 20 21 22 23 24
Semanas Epidemiológicas
BELLAVISTA TAMBO GRANDE
CATACAOS
0.00
1.00
2.00
3.00
4.00
5.00
6.00
15 16 17 18 19 20 21 22 23 24
Semanas Epidemiológicas
CHULUCANAS MARCAVELICA CURA MORI
0.00
1.00
2.00
3.00
4.00
5.00
6.00
15 16 17 18 19 20 21 22 23 24
Semanas Epidemiológicas
LA ARENA SALITRAL (P)
PAITA
0.00
1.00
2.00
3.00
4.00
5.00
6.00
15 16 17 18 19 20 21 22 23 24
Semanas Epidemiológicas
COLAN QUERECOTILLO
0.00
1.00
2.00
3.00
4.00
5.00
6.00
15 16 17 18 19 20 21 22 23 24
Semanas Epidemiológicas
LOS ORGANOS MIGUEL CHECA

Dirección Regional de Salud Piura
Fuente: DIRESA PIURA/OEPI (*) Avande SE N° 24
Pirámide de casos de dengueDepartamento Piura - 2018
8% 6% 4% 2% 0% 2% 4% 6% 8% 10%
0-4
5-9
10-14
15-19
20-24
25-29
30-34
35-39
40-44
45-49
50-54
55-59
60-64
65-69
70-74
75-79
80+
Porcentaje
Edad
Hombres Mujeres
44,8% 55,2%

Dirección Regional de Salud Piura
Fuente: DIRESA PIURA/OEPI (*) Avande SE N° 24
Casos de Dengue y Febriles Departamento Piura 2018*
1 2 3 4 5 6 7 8 9 10 11 12 13 14 15 16 17 18 19 20 21 22 23 24
FEBRILES 696 700 814 766 795 860 886 910 922 947 969 104 781 114 158 155 165 134 150 180 181 138 45 0
CASOS DENGUE 27 29 34 28 35 29 30 50 37 42 38 46 28 55 79 67 59 60 68 105 47 50 54 9
0
1000
2000
3000
4000
5000
6000
7000
8000
N°
de
Ca
so
s1 2 3 4 5 6 7 8 9 10 11 12 13 14 15 16 17 18 19 20 21 22 23
FEBRILES 750 962 967 944 821 141016627516167319262242245227823834359547574440397134563398278520612202
CASOS DENGUE 45 47 49 57 83 125 171 249 354 592 794 109716432600344245114255559643483492236317991458
0
1000
2000
3000
4000
5000
6000
7000
8000
N°
de
Ca
sos
2017 2018

Dirección Regional de Salud Piura
Fuente: DIRESA PIURA/OEPI (*) Avande SE N° 24
Defunciones confirmadas por dengue en Piura
Casos e indicadores de muerte relacionadas a dengue. Piura 2017 - 2018 *
Defunciones confirmadas de dengue por distrito – 2017
DISTRITO
N°
DEFUNCIONES
CONFIRMADAS
PIURA 17
CASTILLA 7
CATACAOS 4
SULLANA 2
TAMBO GRANDE 2
BELLAVISTA 2
VEINTISEIS DE OCTUBRE 2
LA MATANZA 2
LA UNION 1
QUERECOTILLO 1
IMPORTADO (TUMBES) 1
TOTAL 41
Brote 2017* 2018*
Casos notificados 40289 1106
Casos sin signos de alarma 34580 1044
Casos con signos de alarma 5583 58
Dengue grave 126 4
Muertes 41 0
Indicadores de gravedad y mortalidad
% de casos con signos de alarma 13.86 5.24
% de casos graves 0.31 0.36
Tasa de letalidad general (%) 0.10 0.00
Tasa de letalidad de casos graves (%) 32.5 0.0
Región Piura 2014 -2015
Dirección Regional de Salud Piura
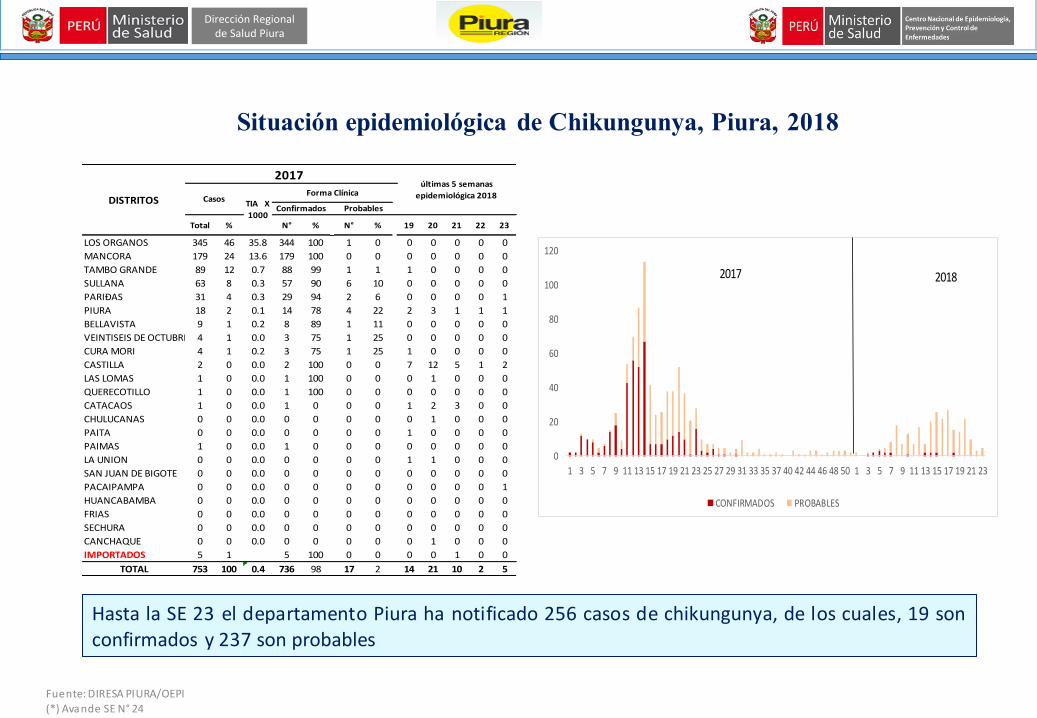
Hasta la SE 23 el departamento Piura ha notificado 256 casos de chikungunya, de los cuales, 19 sonconfirmados y 237 son probables
Situación epidemiológica de Chikungunya, Piura, 2018
Fuente: DIRESA PIURA/OEPI (*) Avande SE N° 24
0
20
40
60
80
100
120
1 3 5 7 9 11 13 15 17 19 21 23 25 27 29 31 33 35 37 40 42 44 46 48 50 1 3 5 7 9 11 13 15 17 19 21 23
CONFIRMADOS PROBABLES
2017 2018
Total % N° % N° % 19 20 21 22 23
LOS ORGANOS 345 46 35.8 344 100 1 0 0 0 0 0 0
MANCORA 179 24 13.6 179 100 0 0 0 0 0 0 0
TAMBO GRANDE 89 12 0.7 88 99 1 1 1 0 0 0 0
SULLANA 63 8 0.3 57 90 6 10 0 0 0 0 0
PARIÐAS 31 4 0.3 29 94 2 6 0 0 0 0 1
PIURA 18 2 0.1 14 78 4 22 2 3 1 1 1
BELLAVISTA 9 1 0.2 8 89 1 11 0 0 0 0 0
VEINTISEIS DE OCTUBRE 4 1 0.0 3 75 1 25 0 0 0 0 0
CURA MORI 4 1 0.2 3 75 1 25 1 0 0 0 0
CASTILLA 2 0 0.0 2 100 0 0 7 12 5 1 2
LAS LOMAS 1 0 0.0 1 100 0 0 0 1 0 0 0
QUERECOTILLO 1 0 0.0 1 100 0 0 0 0 0 0 0
CATACAOS 1 0 0.0 1 0 0 0 1 2 3 0 0
CHULUCANAS 0 0 0.0 0 0 0 0 0 1 0 0 0
PAITA 0 0 0.0 0 0 0 0 1 0 0 0 0
PAIMAS 1 0 0.0 1 0 0 0 0 0 0 0 0
LA UNION 0 0 0.0 0 0 0 0 1 1 0 0 0
SAN JUAN DE BIGOTE 0 0 0.0 0 0 0 0 0 0 0 0 0
PACAIPAMPA 0 0 0.0 0 0 0 0 0 0 0 0 1
HUANCABAMBA 0 0 0.0 0 0 0 0 0 0 0 0 0
FRIAS 0 0 0.0 0 0 0 0 0 0 0 0 0
SECHURA 0 0 0.0 0 0 0 0 0 0 0 0 0
CANCHAQUE 0 0 0.0 0 0 0 0 0 1 0 0 0
IMPORTADOS 5 1 5 100 0 0 0 0 1 0 0
TOTAL 753 100 0.4 736 98 17 2 14 21 10 2 5
últimas 5 semanas
epidemiológica 2018DISTRITOS
2017
Confirmados ProbablesCasos
TIA X
1000
Forma Clínica

Dirección Regional de Salud Piura
Chikungunya en departamento de Piura, 2018*
Casos de Chikungunya por distritos y semanas epidemiológicas. Piura, años 2017 – 2018*
Fuente: DIRESA PIURA/OEPI (*) Avande SE N° 24
Mapa de Casos de Chikungunya1 2 3 4 5 6 7 8 9 10 11 12 13 14 15 16 17 18 19 20 21 22 23
CASTILLA 0 0 0 0 0 2 3 2 13 4 6 6 7 4 16 19 17 20 10 7 12 5 1 2 156
PIURA 16 2 0 1 1 0 0 3 3 2 5 1 6 1 0 2 4 2 1 2 3 1 1 1 42
VEINTISEIS DE OCTUBRE 2 0 0 0 0 0 1 2 1 0 2 0 2 1 2 0 1 0 0 0 0 0 0 0 12
CATACAOS 0 0 0 0 0 0 1 1 0 0 0 0 1 0 0 1 0 2 0 1 2 3 0 0 12
CHULUCANAS 0 0 0 0 0 1 0 0 0 0 0 0 0 0 2 1 0 0 2 0 1 0 0 0 7
PAITA 0 0 0 0 0 0 0 0 0 1 0 0 1 0 0 0 0 1 0 1 0 0 0 0 4
SULLANA 56 0 0 0 0 1 0 0 0 0 0 0 0 0 0 2 0 0 0 0 0 0 0 0 3
LOS ORGANOS 331 0 0 0 0 0 0 0 0 0 0 0 0 0 0 0 0 0 0 0 0 0 0 0 0
TAMBO GRANDE 89 0 0 0 0 0 0 0 1 0 0 0 0 0 0 0 0 0 1 1 0 0 0 0 3
PARIÐAS 24 0 0 0 0 0 0 0 0 0 0 0 0 0 0 0 0 0 0 0 0 0 0 1 1
MANCORA 164 0 0 0 0 0 0 0 0 0 0 0 0 0 0 0 0 0 0 0 0 0 0 0 0
LAS LOMAS 1 0 0 0 0 0 0 0 0 0 0 0 0 0 0 0 0 0 0 0 1 0 0 0 1
BELLAVISTA 9 0 0 0 0 0 0 0 0 0 0 0 0 0 0 0 0 0 0 0 0 0 0 0 0
SECHURA 0 0 0 0 0 0 0 0 0 0 0 0 0 0 0 1 0 0 0 0 0 0 0 0 1
CURA MORI 4 0 0 0 0 0 0 0 0 0 0 0 0 0 0 0 0 0 0 1 0 0 0 0 1
LA UNION 0 0 0 0 0 0 0 0 0 0 0 0 0 0 0 0 0 0 0 1 1 0 0 0 2
SAN JUAN DE BIGOTE 0 0 0 0 0 0 0 0 0 0 0 0 0 0 0 0 0 1 0 0 0 0 0 0 1
SECHURA 0 0 0 0 0 0 0 0 0 0 0 0 0 0 0 1 0 0 0 0 0 0 0 0 1
HUANCABAMBA 0 0 0 0 1 0 0 0 0 0 0 0 0 0 0 0 0 0 0 0 0 0 0 0 1
PAIMAS 1 0 0 0 0 0 0 0 0 0 0 0 0 0 0 0 0 0 0 0 0 0 0 0 0
RINCONADA LLICUAR 0 0 0 0 0 0 0 0 0 0 0 0 0 0 0 0 0 0 0 0 0 1 1 0 2
FRIAS 0 0 0 0 0 0 0 0 0 0 0 0 0 0 0 0 0 0 1 0 0 0 0 0 1
PACAIPAMPA 0 0 0 0 0 0 0 0 0 0 0 0 0 0 0 0 0 0 0 0 0 0 0 1 1
CANCHAQUE 0 0 0 0 0 0 0 0 0 0 0 0 0 0 0 0 0 0 0 0 1 0 0 0 1
IMPORTADOS 4 0 0 1 0 0 0 0 0 0 0 0 0 1 0 0 0 0 0 0 1 0 0 0 3
Total 701 2 0 2 2 4 5 8 18 7 13 7 17 7 20 27 22 26 15 14 22 10 3 5 256
Distritos
2017
(Hasta
SE N° 23)
TOTAL
2018
2018
Semanas

Dirección Regional de Salud Piura
Pirámide de casos de Chikungunya
Departamento Piura, 2018*
Fuente: DIRESA PIURA/OEPI (*) Avande SE N° 24
30% 20% 10% 0% 10% 20% 30%
NIÑO (0 -11 )
ADOLESCENTE (12 -17)
JOVEN (18 - 29 )
ADULTO (30 - 59 )
ADULTO MAYOR (60 + )
Porcentaje
Etapas de Vida
Hombres Mujeres
43,8% 56,3%
Dirección Regional de Salud Piura
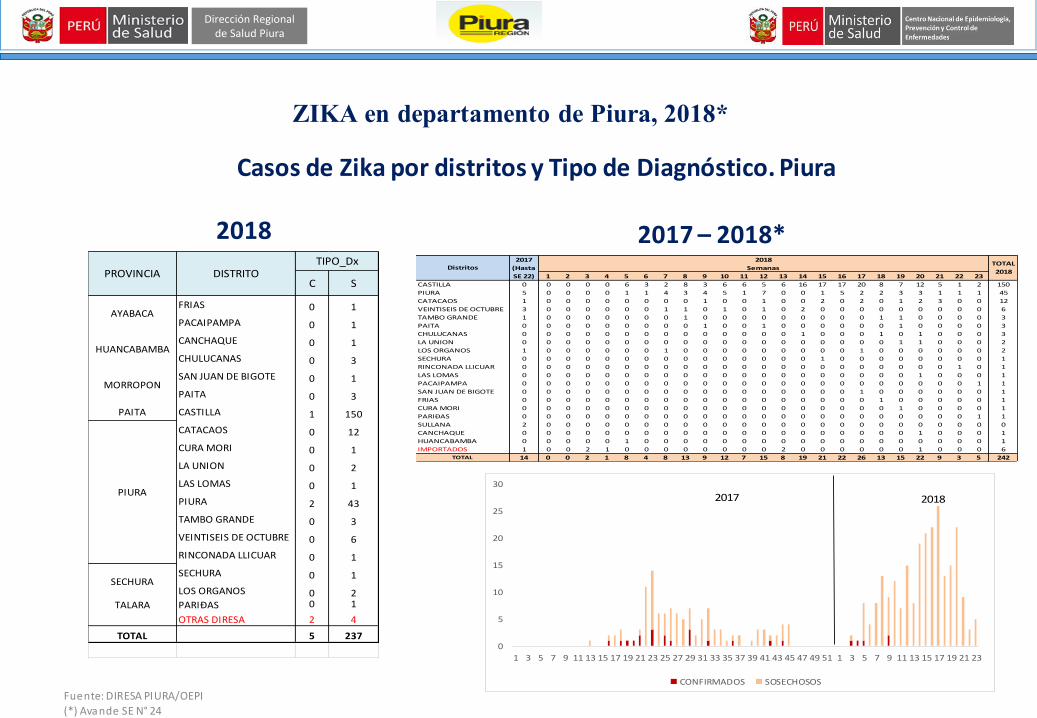
ZIKA en departamento de Piura, 2018*
Casos de Zika por distritos y Tipo de Diagnóstico. Piura
Fuente: DIRESA PIURA/OEPI (*) Avande SE N° 24
2018 2017 – 2018*
C S
FRIAS 0 1
PACAIPAMPA 0 1
CANCHAQUE 0 1
CHULUCANAS 0 3
SAN JUAN DE BIGOTE 0 1
PAITA 0 3
PAITA CASTILLA 1 150
CATACAOS 0 12
CURA MORI 0 1
LA UNION 0 2
LAS LOMAS 0 1
PIURA 2 43
TAMBO GRANDE 0 3
VEINTISEIS DE OCTUBRE 0 6
RINCONADA LLICUAR 0 1
SECHURA 0 1
LOS ORGANOS 0 2TALARA PARIÐAS 0 1
OTRAS DIRESA 2 4
TOTAL 5 237
SECHURA
PIURA
AYABACA
HUANCABAMBA
MORROPON
PROVINCIA DISTRITOTIPO_Dx
0
5
10
15
20
25
30
1 3 5 7 9 11 13 15 17 19 21 23 25 27 29 31 33 35 37 39 41 43 45 47 49 51 1 3 5 7 9 11 13 15 17 19 21 23
CONFIRMADOS SOSECHOSOS
2017 2018
1 2 3 4 5 6 7 8 9 10 11 12 13 14 15 16 17 18 19 20 21 22 23
CASTILLA 0 0 0 0 0 6 3 2 8 3 6 6 5 6 16 17 17 20 8 7 12 5 1 2 150
PIURA 5 0 0 0 0 1 1 4 3 4 5 1 7 0 0 1 5 2 2 3 3 1 1 1 45
CATACAOS 1 0 0 0 0 0 0 0 0 1 0 0 1 0 0 2 0 2 0 1 2 3 0 0 12
VEINTISEIS DE OCTUBRE 3 0 0 0 0 0 0 1 1 0 1 0 1 0 2 0 0 0 0 0 0 0 0 0 6
TAMBO GRANDE 1 0 0 0 0 0 0 0 1 0 0 0 0 0 0 0 0 0 1 1 0 0 0 0 3
PAITA 0 0 0 0 0 0 0 0 0 1 0 0 1 0 0 0 0 0 0 1 0 0 0 0 3
CHULUCANAS 0 0 0 0 0 0 0 0 0 0 0 0 0 0 1 0 0 0 1 0 1 0 0 0 3
LA UNION 0 0 0 0 0 0 0 0 0 0 0 0 0 0 0 0 0 0 0 1 1 0 0 0 2
LOS ORGANOS 1 0 0 0 0 0 0 1 0 0 0 0 0 0 0 0 0 1 0 0 0 0 0 0 2
SECHURA 0 0 0 0 0 0 0 0 0 0 0 0 0 0 0 1 0 0 0 0 0 0 0 0 1
RINCONADA LLICUAR 0 0 0 0 0 0 0 0 0 0 0 0 0 0 0 0 0 0 0 0 0 0 1 0 1
LAS LOMAS 0 0 0 0 0 0 0 0 0 0 0 0 0 0 0 0 0 0 0 0 1 0 0 0 1
PACAIPAMPA 0 0 0 0 0 0 0 0 0 0 0 0 0 0 0 0 0 0 0 0 0 0 0 1 1
SAN JUAN DE BIGOTE 0 0 0 0 0 0 0 0 0 0 0 0 0 0 0 0 0 1 0 0 0 0 0 0 1
FRIAS 0 0 0 0 0 0 0 0 0 0 0 0 0 0 0 0 0 0 1 0 0 0 0 0 1
CURA MORI 0 0 0 0 0 0 0 0 0 0 0 0 0 0 0 0 0 0 0 1 0 0 0 0 1
PARIÐAS 0 0 0 0 0 0 0 0 0 0 0 0 0 0 0 0 0 0 0 0 0 0 0 1 1
SULLANA 2 0 0 0 0 0 0 0 0 0 0 0 0 0 0 0 0 0 0 0 0 0 0 0 0
CANCHAQUE 0 0 0 0 0 0 0 0 0 0 0 0 0 0 0 0 0 0 0 0 1 0 0 0 1
HUANCABAMBA 0 0 0 0 0 1 0 0 0 0 0 0 0 0 0 0 0 0 0 0 0 0 0 0 1
IMPORTADOS 1 0 0 2 1 0 0 0 0 0 0 0 0 2 0 0 0 0 0 0 1 0 0 0 6
TOTAL 14 0 0 2 1 8 4 8 13 9 12 7 15 8 19 21 22 26 13 15 22 9 3 5 242
TOTAL
2018Distritos
2017
(Hasta
SE 22)
2018
Semanas

Dirección Regional de Salud Piura
Sindrome Guillaín Barré en departamento de Piura, 2018*
Casos de SGB por distritos y Tipo de Diagnóstico. Piura
Fuente: DIRESA PIURA/OEPI (*) Avande SE N° 24
0
1
2
1 3 5 7 9 11 13 15 17 19 21 23 25 27 29 31 33 35 37 39 41 43 45 47 49 51 1 3 5 7 9 11 13 15 17 19 21 23
2017 2018
SEMANAS EPIDEMIOLÓGICAS
C S
MORROPON BUENOS AIRES 0 1
LA UNION 1 0
TAMBO GRANDE 0 1
TALARA PARIÐAS 0 1
OTRAS DIRESA 0 0TOTAL 1 3
PIURA
PROVINCIA DISTRITOTIPO_Dx

Dirección Regional de Salud Piura
Malaria (Vivax + Falciparum) en departamento de Piura, 2018*
Fuente: DIRESA PIURA/OEPI (*) Avande SE N° 24
2010 2011 2012 2013 2014 2015 2016 2017 2018
AYABACA 0 1 0 0 0 0 0 0 0
BELLAVISTA 1536 650 160 6 6 10 0 0 0
BUENOS AIRES 3 0 0 0 0 0 0 0 0
CANCHAQUE 0 8 0 0 0 0 0 0 0
CASTILLA 7 0 1 1 0 0 2 0 0
CATACAOS 7 0 1 1 1 0 0 0 0
CHALACO 1 0 0 0 0 0 0 0 0
CHULUCANAS 20 6 0 0 1 0 0 0 0
CURA MORI 1 0 0 0 0 0 0 0 0
EL CARMEN DE LA FRONTERA 0 0 0 0 0 0 0 0 0
FRIAS 0 0 0 0 0 0 0 0 0
HUANCABAMBA 2 0 1 0 0 0 0 0 0
HUARMACA 4 10 1 1 0 0 0 0 0
IGNACIO ESCUDERO 6 0 1 0 0 0 0 0 0
JILILI 11 3 0 0 0 0 0 0 0
LA ARENA 7 1 0 0 0 0 0 0 0
LA HUACA 2 42 2 3 0 0 0 0 0
LA MATANZA 2 0 0 0 0 0 0 0 0
LA UNION 0 0 0 0 0 0 0 0 0
LAGUNAS 0 0 0 0 0 0 2 0 0
LALAQUIZ 0 0 0 0 0 0 0 0 0
LANCONES 8 5 2 0 0 0 0 0 0
LAS LOMAS 7 1 0 0 0 0 0 3 1
DEMAS DISTRITOS 1079 1383 79 11 5 6 4 3 3
IMPORTADOS 16 12 3 1 14 6 2 3 9
TOTAL 3505 260 26 14 30 14 2 8 13
DISTRITOSAÑOS
Dirección Regional de Salud Piura
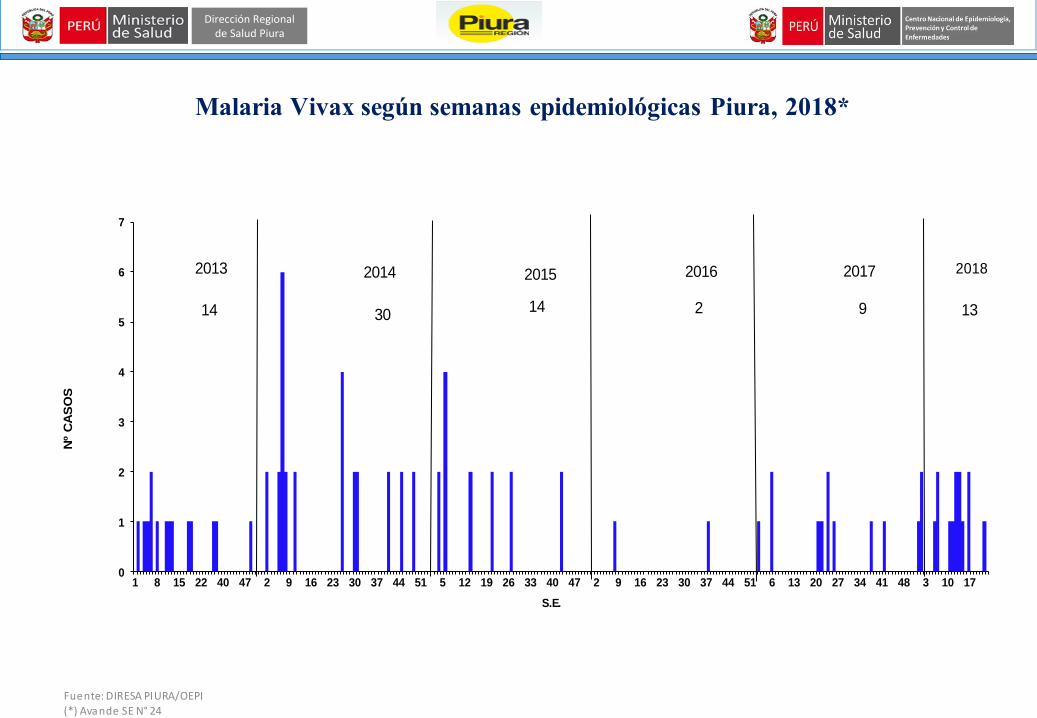
Malaria Vivax según semanas epidemiológicas Piura, 2018*
Fuente: DIRESA PIURA/OEPI (*) Avande SE N° 24
0
1
2
3
4
5
6
7
1 8 15 22 40 47 2 9 16 23 30 37 44 51 5 12 19 26 33 40 47 2 9 16 23 30 37 44 51 6 13 20 27 34 41 48 3 10 17
Nº
CA
SO
S
S.E.
2013
14
2014
30
2015
14
2016
2
2017
9
2018
13

Dirección Regional de Salud Piura
Fuente: DIRESA PIURA/OEPI (*) Avande SE N° 24
Casos de Bartonelosis según distritosDepartamento de Piura años 2000 – 2016 y 2018*
2000 2001 2002 2003 2004 2005 2006 2007 2008 2009 2010 2011 2012 2013 2014 2015 2016 2017 2018
HUANCABAMBA 89 82 100 142 57 42 12 23 61 37 12 19 10 8 4 2 3 2 1
SONDORILLO 6 9 31 50 44 11 14 2 4 0 8 34 8 4 2 0 1 0 0
LA MATANZA 0 1 0 0 0 0 0 0 0 0 0 0 0 0 0 0 0 0 0
CANCHAQUE 0 1 0 1 1 49 1 3 0 0 0 0 0 67 0 0 0 0 0
FRIAS 3 0 0 0 0 0 0 0 0 0 0 0 0 0 0 0 0 0 0
CHULUCANAS 1 0 0 0 0 0 0 0 0 0 0 0 0 0 0 0 0 0 0
SONDOR 6 7 77 48 52 8 8 4 2 31 21 14 4 1 2 0 0 1 0
TAMBO GRANDE 0 0 0 0 0 0 0 0 0 0 0 0 0 0 0 2 0 0 0
SAN MIGUEL DE EL FAIQUE 0 0 0 0 0 0 3 1 0 0 1 0 0 0 0 0 0 0 0
SULLANA 0 0 1 0 1 0 0 0 0 0 0 0 0 0 0 0 0 0 0
HUARMACA 1 0 4 3 0 0 0 0 0 0 0 0 0 0 0 0 0 0 0
SAN JUAN DE BIGOTE 1 0 0 0 0 0 0 0 0 0 0 0 0 0 0 0 0 0 0
EL CARMEN DE LA FRONTERA 3 2 9 36 27 9 1 1 0 0 1 163 39 5 0 0 0 0 0
SALITRAL (P) 0 0 0 0 0 0 0 0 1 0 0 0 0 0 0 0 0 0 0
CHALACO 0 0 1 0 0 0 0 0 0 0 0 0 0 0 0 0 0 0 0
QUERECOTILLO 0 0 0 0 0 0 0 3 0 0 0 0 0 0 0 0 0 0 0
AYABACA 0 0 1 0 0 0 0 0 0 0 1 0 0 0 0 0 0 0 0
PACAIPAMPA 0 0 1 2 0 0 0 0 0 0 0 0 0 0 0 0 0 0 0
LALAQUIZ 0 1 0 0 2 9 2 0 0 1 0 15 1 446 6 0 0 0 0
OTRAS DIRESAS 2 4 2 5 4 1 1 1 2 0 2 49 8 7 0 0 0 1 0
Total general 112 107 227 287 188 129 42 38 70 69 46 294 70 538 14 4 4 4 1
DISTRITOSAÑOS
Dirección Regional de Salud Piura
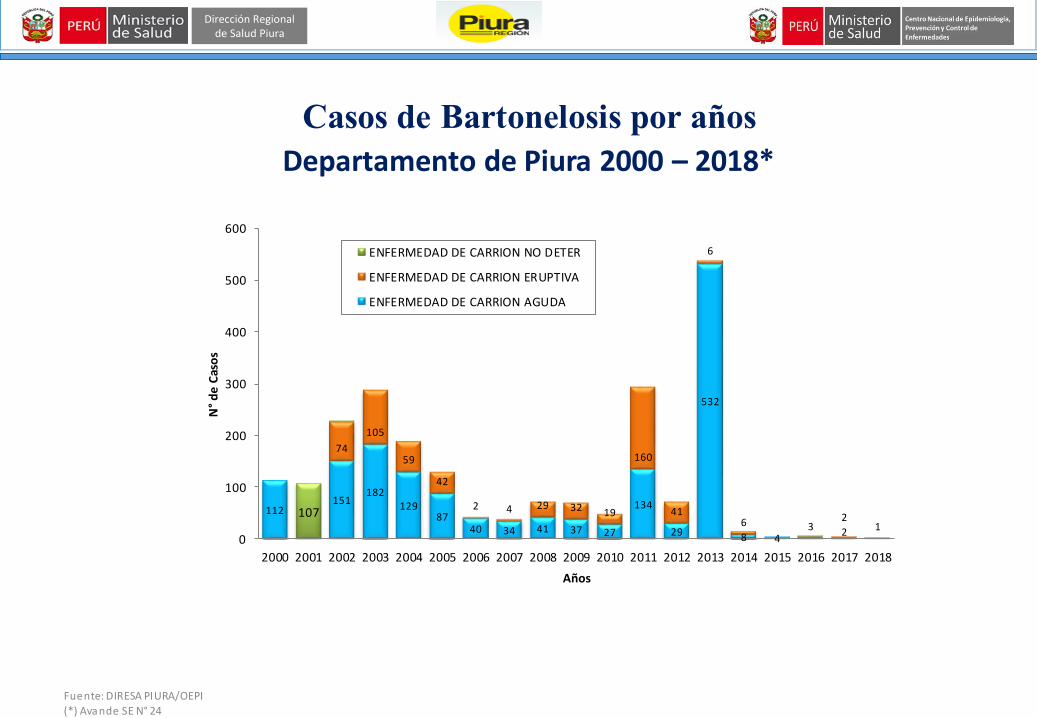
Casos de Bartonelosis por añosDepartamento de Piura 2000 – 2018*
Fuente: DIRESA PIURA/OEPI (*) Avande SE N° 24
112151
182129
8740 34 41 37 27
134
29
532
8 42
74
105
59
42
2 4 29 32 19
160
41
6
6 32
1107
0
100
200
300
400
500
600
2000 2001 2002 2003 2004 2005 2006 2007 2008 2009 2010 2011 2012 2013 2014 2015 2016 2017 2018
N°
de
Cas
os
Años
ENFERMEDAD DE CARRION NO DETER
ENFERMEDAD DE CARRION ERUPTIVA
ENFERMEDAD DE CARRION AGUDA
Dirección Regional de Salud Piura
Fuente: DIRESA PIURA/OEPI (*) Avande SE N° 24
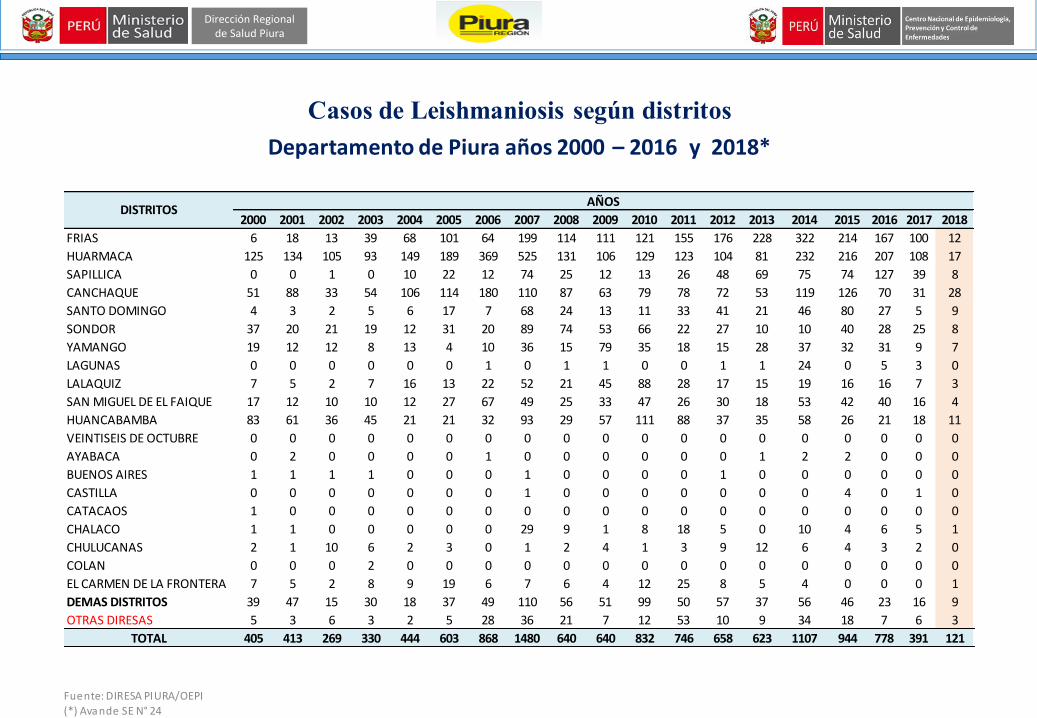
Casos de Leishmaniosis según distritosDepartamento de Piura años 2000 – 2016 y 2018*
2000 2001 2002 2003 2004 2005 2006 2007 2008 2009 2010 2011 2012 2013 2014 2015 2016 2017 2018
FRIAS 6 18 13 39 68 101 64 199 114 111 121 155 176 228 322 214 167 100 12
HUARMACA 125 134 105 93 149 189 369 525 131 106 129 123 104 81 232 216 207 108 17
SAPILLICA 0 0 1 0 10 22 12 74 25 12 13 26 48 69 75 74 127 39 8
CANCHAQUE 51 88 33 54 106 114 180 110 87 63 79 78 72 53 119 126 70 31 28
SANTO DOMINGO 4 3 2 5 6 17 7 68 24 13 11 33 41 21 46 80 27 5 9
SONDOR 37 20 21 19 12 31 20 89 74 53 66 22 27 10 10 40 28 25 8
YAMANGO 19 12 12 8 13 4 10 36 15 79 35 18 15 28 37 32 31 9 7
LAGUNAS 0 0 0 0 0 0 1 0 1 1 0 0 1 1 24 0 5 3 0
LALAQUIZ 7 5 2 7 16 13 22 52 21 45 88 28 17 15 19 16 16 7 3
SAN MIGUEL DE EL FAIQUE 17 12 10 10 12 27 67 49 25 33 47 26 30 18 53 42 40 16 4
HUANCABAMBA 83 61 36 45 21 21 32 93 29 57 111 88 37 35 58 26 21 18 11
VEINTISEIS DE OCTUBRE 0 0 0 0 0 0 0 0 0 0 0 0 0 0 0 0 0 0 0
AYABACA 0 2 0 0 0 0 1 0 0 0 0 0 0 1 2 2 0 0 0
BUENOS AIRES 1 1 1 1 0 0 0 1 0 0 0 0 1 0 0 0 0 0 0
CASTILLA 0 0 0 0 0 0 0 1 0 0 0 0 0 0 0 4 0 1 0
CATACAOS 1 0 0 0 0 0 0 0 0 0 0 0 0 0 0 0 0 0 0
CHALACO 1 1 0 0 0 0 0 29 9 1 8 18 5 0 10 4 6 5 1
CHULUCANAS 2 1 10 6 2 3 0 1 2 4 1 3 9 12 6 4 3 2 0
COLAN 0 0 0 2 0 0 0 0 0 0 0 0 0 0 0 0 0 0 0
EL CARMEN DE LA FRONTERA 7 5 2 8 9 19 6 7 6 4 12 25 8 5 4 0 0 0 1
DEMAS DISTRITOS 39 47 15 30 18 37 49 110 56 51 99 50 57 37 56 46 23 16 9
OTRAS DIRESAS 5 3 6 3 2 5 28 36 21 7 12 53 10 9 34 18 7 6 3
TOTAL 405 413 269 330 444 603 868 1480 640 640 832 746 658 623 1107 944 778 391 121
AÑOSDISTRITOS
Dirección Regional de Salud Piura
Fuente: DIRESA PIURA/OEPI (*) Avande SE N° 24
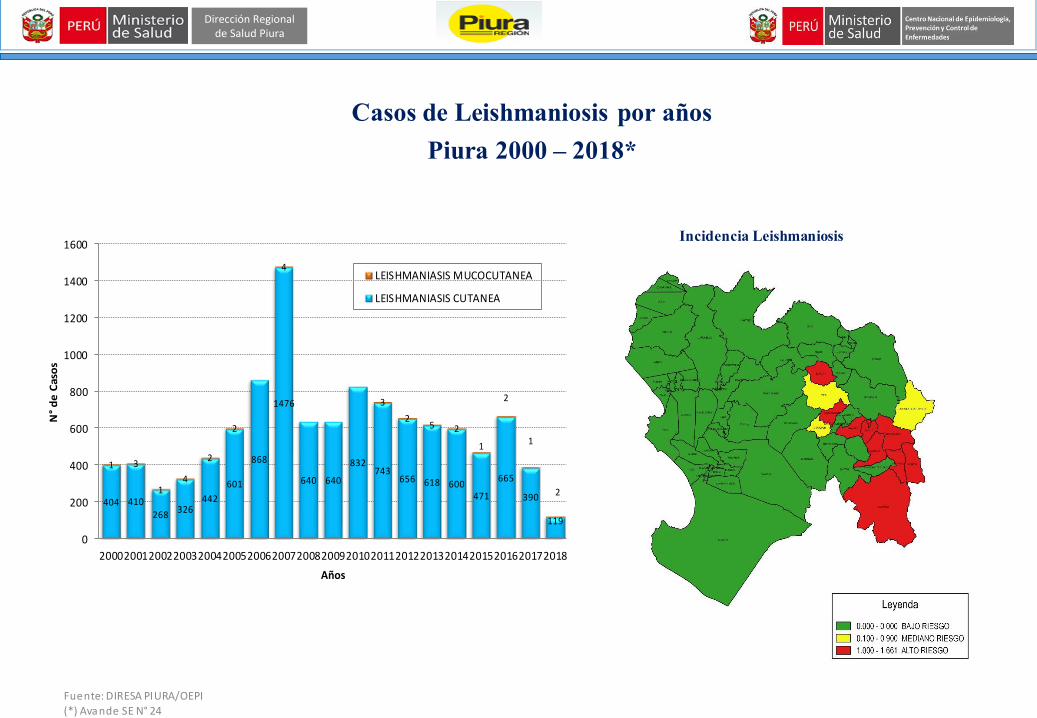
Casos de Leishmaniosis por añosPiura 2000 – 2018*
404 410
268326
442
601
868
1476
640 640
832743
656 618 600471
665
390
119
1 3
14
2
2
4
3
25 2
1
2
1
2
0
200
400
600
800
1000
1200
1400
1600
2000200120022003200420052006200720082009201020112012201320142015201620172018
N°
de
Cas
os
Años
LEISHMANIASIS MUCOCUTANEA
LEISHMANIASIS CUTANEA
Incidencia Leishmaniosis

Dirección Regional de Salud Piura
Fuente: DIRESA PIURA/OEPI (*) Avande SE N° 24
Casos de Leishmaniosis por semanas, Piura 2017 - 2018*
13
1313
10
20
25
10
6
12
21
46
9
14
1112
10
6
1012
6 6
1111
3
7
10
24
65
6
10
34
2 24
5
10
23 3 3 3
23
43
5
1
53
5
10
4 46
2
6
34
8
46
109
8
53
45
1
54
0
5
10
15
20
25
30
1 3 5 7 9 11 13 15 17 19 21 23 25 27 29 31 33 35 37 39 41 43 45 47 49 51 1 3 5 7 9 11 13 15 17 19 21 23
2017 2018
Dirección Regional de Salud Piura
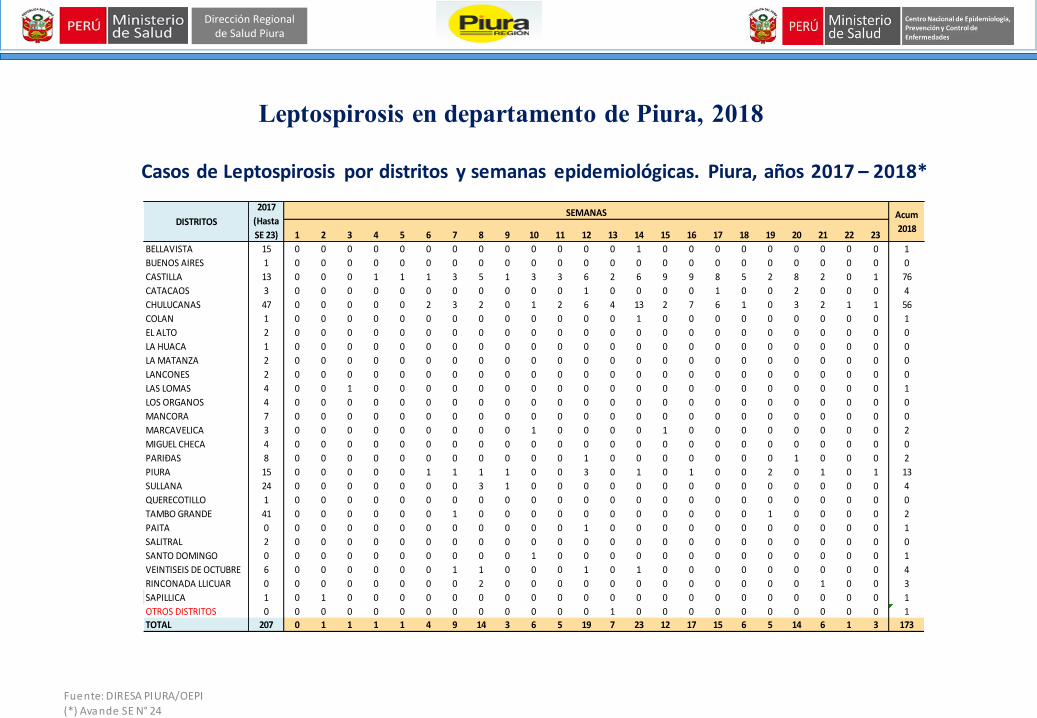
Leptospirosis en departamento de Piura, 2018
Casos de Leptospirosis por distritos y semanas epidemiológicas. Piura, años 2017 – 2018*
Fuente: DIRESA PIURA/OEPI (*) Avande SE N° 24
1 2 3 4 5 6 7 8 9 10 11 12 13 14 15 16 17 18 19 20 21 22 23
BELLAVISTA 15 0 0 0 0 0 0 0 0 0 0 0 0 0 1 0 0 0 0 0 0 0 0 0 1
BUENOS AIRES 1 0 0 0 0 0 0 0 0 0 0 0 0 0 0 0 0 0 0 0 0 0 0 0 0
CASTILLA 13 0 0 0 1 1 1 3 5 1 3 3 6 2 6 9 9 8 5 2 8 2 0 1 76
CATACAOS 3 0 0 0 0 0 0 0 0 0 0 0 1 0 0 0 0 1 0 0 2 0 0 0 4
CHULUCANAS 47 0 0 0 0 0 2 3 2 0 1 2 6 4 13 2 7 6 1 0 3 2 1 1 56
COLAN 1 0 0 0 0 0 0 0 0 0 0 0 0 0 1 0 0 0 0 0 0 0 0 0 1
EL ALTO 2 0 0 0 0 0 0 0 0 0 0 0 0 0 0 0 0 0 0 0 0 0 0 0 0
LA HUACA 1 0 0 0 0 0 0 0 0 0 0 0 0 0 0 0 0 0 0 0 0 0 0 0 0
LA MATANZA 2 0 0 0 0 0 0 0 0 0 0 0 0 0 0 0 0 0 0 0 0 0 0 0 0
LANCONES 2 0 0 0 0 0 0 0 0 0 0 0 0 0 0 0 0 0 0 0 0 0 0 0 0
LAS LOMAS 4 0 0 1 0 0 0 0 0 0 0 0 0 0 0 0 0 0 0 0 0 0 0 0 1
LOS ORGANOS 4 0 0 0 0 0 0 0 0 0 0 0 0 0 0 0 0 0 0 0 0 0 0 0 0
MANCORA 7 0 0 0 0 0 0 0 0 0 0 0 0 0 0 0 0 0 0 0 0 0 0 0 0
MARCAVELICA 3 0 0 0 0 0 0 0 0 0 1 0 0 0 0 1 0 0 0 0 0 0 0 0 2
MIGUEL CHECA 4 0 0 0 0 0 0 0 0 0 0 0 0 0 0 0 0 0 0 0 0 0 0 0 0
PARIÐAS 8 0 0 0 0 0 0 0 0 0 0 0 1 0 0 0 0 0 0 0 1 0 0 0 2
PIURA 15 0 0 0 0 0 1 1 1 1 0 0 3 0 1 0 1 0 0 2 0 1 0 1 13
SULLANA 24 0 0 0 0 0 0 0 3 1 0 0 0 0 0 0 0 0 0 0 0 0 0 0 4
QUERECOTILLO 1 0 0 0 0 0 0 0 0 0 0 0 0 0 0 0 0 0 0 0 0 0 0 0 0
TAMBO GRANDE 41 0 0 0 0 0 0 1 0 0 0 0 0 0 0 0 0 0 0 1 0 0 0 0 2
PAITA 0 0 0 0 0 0 0 0 0 0 0 0 1 0 0 0 0 0 0 0 0 0 0 0 1
SALITRAL 2 0 0 0 0 0 0 0 0 0 0 0 0 0 0 0 0 0 0 0 0 0 0 0 0
SANTO DOMINGO 0 0 0 0 0 0 0 0 0 0 1 0 0 0 0 0 0 0 0 0 0 0 0 0 1
VEINTISEIS DE OCTUBRE 6 0 0 0 0 0 0 1 1 0 0 0 1 0 1 0 0 0 0 0 0 0 0 0 4
RINCONADA LLICUAR 0 0 0 0 0 0 0 0 2 0 0 0 0 0 0 0 0 0 0 0 0 1 0 0 3
SAPILLICA 1 0 1 0 0 0 0 0 0 0 0 0 0 0 0 0 0 0 0 0 0 0 0 0 1
OTROS DISTRITOS 0 0 0 0 0 0 0 0 0 0 0 0 0 1 0 0 0 0 0 0 0 0 0 0 1
TOTAL 207 0 1 1 1 1 4 9 14 3 6 5 19 7 23 12 17 15 6 5 14 6 1 3 173
DISTRITOSAcum
2018
SEMANAS2017
(Hasta
SE 23)

Dirección Regional de Salud Piura
Loxocelismo en departamento de Piura, 2018
Casos de Loxocelismo por distritos. Piura, años 2007 – 2018*
Fuente: DIRESA PIURA/OEPI (*) Avande SE N° 24
0
20
40
60
80
100
120
140
AÑOSN
°C
AS
OS
2007 2008 2009 2010 2011 2012 2013 2014 2015 2016 2017 2018
CHULUCANAS 6 16 0 7 22 20 18 4 0 7 17 4
SULLANA 0 0 0 0 0 0 15 46 16 11 4 0
CASTILLA 2 12 15 10 9 4 0 14 6 2 1 1
PIURA 4 14 2 20 6 3 6 4 2 0 1 4
BELLAVISTA 0 0 0 0 0 0 0 10 6 1 1 0
TAMBO GRANDE 0 0 0 0 0 0 0 10 2 0 1 0
LA MATANZA 1 1 0 0 3 4 0 2 0 0 0 0
MARCAVELICA 0 0 0 0 0 0 2 6 0 3 0 0
QUERECOTILLO 0 0 0 0 0 0 2 4 0 2 1 0
CATACAOS 1 0 1 1 2 1 1 0 0 0 1 0
HUANCABAMBA 0 0 0 0 0 1 6 0 0 0 0 0
COLAN 0 0 0 0 0 0 0 4 2 0 0 0
PAITA 0 0 0 1 0 0 1 2 2 0 0 0
BUENOS AIRES 0 0 0 0 1 0 0 0 2 0 1 1
PARIÐAS 0 0 0 0 0 0 0 2 2 0 0 0
MORROPON 0 0 0 2 0 0 0 0 0 2 0 0
SAN JUAN DE BIGOTE 0 0 0 1 0 0 0 2 0 0 0 0
LAS LOMAS 0 0 0 0 0 0 0 2 0 0 1 0
LA ARENA 1 0 0 0 0 0 1 0 0 0 1 0
CURA MORI 0 0 0 0 0 0 0 0 2 0 0 0
PAIMAS 0 0 0 0 0 0 0 2 0 0 0 0
VICE 0 0 1 1 0 0 0 0 0 0 0 0
FRIAS 0 0 0 0 0 0 0 0 2 0 0 0
DEMAS DISTRITOS 0 2 0 0 1 2 1 2 0 5 1 1
IMPORTADOS 0 0 0 0 1 1 0 2 0 0 1 0
TOTAL 15 45 19 43 45 36 53 118 44 33 32 11
DISTRITOSAÑOS

Dirección Regional de Salud Piura
Ofidismo en departamento de Piura, 2018
Casos de Ofidismo por distritos. Piura, años 2000 – 2018*
Fuente: DIRESA PIURA/OEPI (*) Avande SE N° 24
912
73
6165
30
52
62
75
29
70
4340
59
70
42
50
64
34
0
10
20
30
40
50
60
70
80
AÑOS
N°
CA
SO
S
2000 2001 2002 2003 2004 2005 2006 2007 2008 2009 2010 2011 2012 2013 2014 2015 2016 2017 2018
CHULUCANAS 4 0 29 31 14 10 20 35 34 12 31 10 19 13 8 2 14 26 19
CASTILLA 1 0 7 1 2 1 2 1 5 4 3 5 0 4 2 0 1 4 0
SALITRAL (P) 1 0 0 0 0 0 0 0 0 0 3 1 0 1 0 0 2 3 1
PIURA 1 0 1 1 0 0 0 1 8 0 4 4 2 3 0 10 1 3 2
TAMBO GRANDE 0 5 21 16 39 12 17 10 1 3 2 9 9 13 14 2 2 3 1
HUARMACA 0 0 0 1 1 1 0 1 0 0 0 0 0 0 0 2 2 3 0
LA MATANZA 0 0 2 5 2 0 7 4 9 1 10 2 2 3 2 0 4 3 6
SAN MIGUEL DE EL FAIQUE 0 0 0 0 0 0 0 0 1 1 1 2 0 0 0 0 0 2 0
YAMANGO 0 0 0 0 0 0 1 0 1 0 0 0 1 0 0 0 3 2 0
SALITRAL 0 0 0 0 0 0 0 0 0 0 0 0 0 0 0 0 0 1 0
CURA MORI 0 0 1 0 0 0 0 0 0 0 0 1 0 1 0 0 0 1 0
SONDOR 0 0 1 0 0 0 0 0 0 0 0 0 1 0 0 0 0 1 0
LA ARENA 1 0 0 0 0 0 1 2 3 0 0 0 0 2 2 0 0 1 0
CANCHAQUE 0 0 2 1 1 2 0 1 0 0 6 0 0 1 2 2 4 1 1
SAN JUAN DE BIGOTE 0 0 0 0 1 1 0 0 0 0 0 0 0 0 0 0 1 1 0
AYABACA 0 0 0 0 0 0 0 0 0 0 0 0 0 0 2 0 0 1 0
HUANCABAMBA 0 1 0 1 1 0 0 0 0 0 1 1 1 0 2 6 0 1 0
SANTO DOMINGO 0 0 1 0 0 0 0 0 0 0 0 0 0 0 0 0 1 1 0
LA UNION 0 0 2 1 1 0 3 1 1 2 2 0 1 3 2 0 0 1 0
SONDORILLO 0 0 0 0 0 0 0 0 0 0 0 0 0 0 2 2 0 1 0
CATACAOS 0 1 0 1 3 0 0 1 0 1 0 1 1 0 0 0 2 1 1
DEMAS DISTRITOS 1 5 6 2 0 3 1 5 12 5 7 6 3 13 32 16 11 3 3
IMPORTADOS 0 0 0 0 0 0 0 0 0 0 0 1 0 2 0 0 1 0 0
TOTAL 9 12 73 61 65 30 52 62 75 29 70 43 40 59 70 42 49 64 34
DISTRITOSAÑOS

Dirección Regional de Salud Piura
Conjuntivitis en departamento de Piura, 2018
Casos de Conjuntivitis por distritos. Piura, años 2013 –2018*
Fuente: DIRESA PIURA/OEPI (*) Avande SE N° 24
2013 2014 2015 2016 2017 2018
HUARMACA 36 122 24 62 44 32
SAN JUAN DE BIGOTE 18 24 38 23 19 3
SAN MIGUEL DE EL FAIQUE 73 96 52 20 19 9
CHULUCANAS 0 8 24 37 31 52
CASTILLA 36 202 212 23 4 0
LA MATANZA 2 14 2 5 5 0
BERNAL 3 2 6 16 16 10
BELLAVISTA DE LA UNION 2 12 4 4 7 6
HUANCABAMBA 21 30 20 10 14 7
VICE 6 6 4 4 10 8
SALITRAL (P) 46 68 34 23 13 11
LALAQUIZ 8 20 34 7 8 2
SANTA CATALINA DE MOSSA 1 2 8 0 4 1
EL CARMEN DE LA FRONTERA 1 0 2 0 2 0
SECHURA 47 50 28 3 12 4
LA UNION 0 0 0 0 1 0
YAMANGO 15 30 26 10 7 15
VEINTISEIS DE OCTUBRE 0 0 0 2 0 1
SONDOR 2 2 2 0 2 0
SANTO DOMINGO 0 0 0 0 0 0
MORROPON 24 28 16 11 0 0
SULLANA 0 0 0 0 0 0
PACAIPAMPA 0 0 0 0 0 0
CHALACO 0 0 0 0 0 0
PAITA 1 0 0 1 0 0
CATACAOS 79 182 6 0 0 0
PIURA 26 28 8 1 0 0
SONDORILLO 0 0 0 0 1 0
LA ARENA 12 12 0 0 0 0
TAMBO GRANDE 0 0 0 0 0 1
FRIAS 0 0 0 0 1 0
CANCHAQUE 93 118 66 26 20 24
CURA MORI 4 36 14 8 0 0
RINCONADA LLICUAR 1 0 0 0 0 0
BUENOS AIRES 4 28 0 0 1 2
CRISTO NOS VALGA 1 0 0 2 1 0
IMPORTADOS 0 0 0 0 1 1
TOTAL 562 1120 630 298 243 189
DISTRITOSAÑOS
Casos de Conjuntivitis por distritos. Piura, 2017 –2018*
0
2
4
6
8
10
12
14
16
1 2 3 4 5 6 7 8 9 10 11 12 13 14 15 16 17 18 19 20 21 22 23 24 25 26 27 28 29 30 31 32 33 34 35 36 37 38 39 40 41 42 43 44 45 46 47 48 49 50 51 52 1 2 3 4 5 6 7 8 9 10 11 12 13 14 15 16 17 18 19 20 21 22 23
2017 2018

Dirección Regional de Salud Piura
2012 2013 2014 2015 2016 2017 2018
Nº M. Materna 15 15 12 13 18 23 14
RMM X 100 MIL NV 39.7 39.4 32.9 34.9 46.5 62.9 37.7
0.0
10.0
20.0
30.0
40.0
50.0
60.0
70.0
0
5
10
15
20
25
Ra
zón
de
M.M
ate
rna
x 1
00 M
il N
V
Nº
DE
CA
SO
S
Casos y Razón de Muerte Materna por Años
REGION DE SALUD PIURA: 2012 - 2018*
Fuente: DIRESA PIURA/OEPI (*) Avande SE N° 24
Casos y Razón de Muerte Materna según AñosDepartamento de Piura, 2012 - 2018 *

Dirección Regional de Salud Piura
50
46
27
33
4139
28
3234
2928
42
3436
14
0
10
20
30
40
50
60
2004 2005 2006 2007 2008 2009 2010 2011 2012 2013 2014 2015 2016 2017 2018
Nº
CA
SO
S
AÑOS
Comportamiento de las Muertes Materna por AñosREGION DE SALUD PIURA: 2004 - 2018*
Fuente: DIRESA PIURA/OEPI (*) Avande SE N° 24
Comportamiento de las Muertes Maternas según AñosDepartamento de Piura, 2004 - 2018 *

Dirección Regional de Salud Piura
Fuente: DIRESA PIURA/OEPI (*) Avande SE N° 24
Casos de Muerte Materna (Directa + Indirecta) según distritosDepartamento de Piura, 2012 - 2018 *
DISTRITO PROCED. 2012 2013 2014 2015 2016 2017 2018* Acumulado %
PIURA 1 3 3 3 4 0 2 16 7.3
HUANCABAMBA 3 2 1 5 1 4 0 16 7.3
CASTILLA 1 2 2 5 2 2 1 15 6.9
CATACAOS 1 1 2 2 4 2 0 12 5.5
PARIÑAS 0 1 1 2 3 4 1 12 5.5
SULLANA 1 2 1 5 2 1 0 12 5.5
SAPILLICA 1 3 3 1 3 0 0 11 5.0
PAITA 1 1 1 3 1 2 1 10 4.6
SECHURA 1 0 1 0 4 2 0 8 3.7
FRIAS 1 0 2 2 1 1 1 8 3.7
CHULUCANAS 2 0 0 1 2 2 0 7 3.2
TAMBO GRANDE 0 0 2 1 0 2 2 7 3.2
BELLAVISTA 2 1 1 1 1 0 0 6 2.8
HUARMACA 2 1 1 1 1 0 0 6 2.8
LA UNION 2 0 1 1 0 2 0 6 2.8
LAS LOMAS 2 1 1 0 1 0 0 5 2.3
AYABACA 1 1 0 0 0 1 1 4 1.8
VICE 1 2 0 0 0 0 0 3 1.4
BERNAL 1 0 1 0 1 0 0 3 1.4
MARCAVELICA 0 0 0 0 0 2 1 3 1.4
PACAIPAMPA 1 0 0 1 0 1 0 3 1.4
LAGUNAS 0 1 0 1 0 0 0 2 0.9
YAMANGO 0 1 0 0 1 0 0 2 0.9
MORROPON 0 0 0 0 0 2 0 2 0.9
CHALACO 0 0 0 2 0 0 0 2 0.9
EL ALTO 1 0 0 1 0 0 0 2 0.9
PAIMAS 0 0 1 0 0 1 0 2 0.9
OTROS DISTRITOS 8 3 4 2 2 4 3 26 11.9
OTRAS REGIONES 0 3 0 2 0 1 1 7 3.2
TOTAL 34 29 29 42 34 36 14 218 100

Dirección Regional de Salud Piura
15
14
13
12
11 111
09
7 7 75
4 4 43 3 3
0.0
20.0
40.0
60.0
80.0
100.0
120.0
0
2
4
6
8
10
12
14
16
PIU
RA
CA
ST
ILL
A
HU
AN
CA
BA
MB
A
PA
RIÑ
AS
SU
LL
AN
A
CA
TA
CA
OS
SA
PIL
LIC
A
PA
ITA
SE
CH
UR
A
TA
MB
O G
RA
ND
E
FR
IAS
CH
UL
UC
AN
AS
HU
AR
MA
CA
BE
LL
AV
IST
A
LA
UN
ION
AY
AB
AC
A
LA
S L
OM
AS
MA
RC
AV
EL
ICA
CU
RA
MO
RI
MO
RR
OP
ON
YA
MA
NG
O
PA
CA
IPA
MP
A
EL
CA
RM
EN
DE
…
VIC
E
CH
AL
AC
O
BE
RN
AL
LA
GU
NA
S
PA
IMA
S
MA
NC
OR
A
EL
AL
TO
IGN
AC
IO…
SIC
CH
EZ
SA
NT
O D
OM
ING
O
SO
ND
OR
ILL
O
CO
LA
N
LA
AR
EN
A
SA
LIT
RA
L
LA
LA
QU
IZ
LA
BR
EA
VE
INT
ISE
IS D
E…
JIL
ILI
QU
ER
EC
OT
ILL
O
SA
N M
IGU
EL
DE
…
Po
rce
nta
je
Nº
Ca
so
s
Distritos que concentran el 80% de los casos de Muerte MaternaREGION DE SALUD PIURA: 2013 - 2018*
19 Distritos que concentran el 80% de los casos de M. Materna en los últimos 5 Años
Fuente: DIRESA PIURA/OEPI (*) Avande SE N° 24
Distritos que concentran el 80% de los casos de Muerte Materna Departamento de Piura, 2013 - 2018 *

Dirección Regional de Salud Piura
1 1 1 1 1 1 11 1
2
1 1 1
0
1
2
3
4
5
PIU
RA
MA
RC
AV
EL
ICA
TA
MB
O G
RA
ND
E
PA
ITA
CA
ST
ILL
A
PA
RIÑ
AS
SO
ND
OR
ILLO
AY
AB
AC
A
JIL
ILI
EL
CA
RM
EN
DE
LA
FR
ON
TE
RA
FR
IAS
SA
N J
UA
N D
E M
IRA
FL
OR
ES
CA
SO
S
DISTRITOS
Casos de Muerte Materna por Según Distrito de ProcedenciaREGION DE SALUD PIURA: 2018*
MM. DIRECTA
MM. INDIRECTA
Fuente: DIRESA PIURA/OEPI (*) Avande SE N° 24
Casos de Muerte Materna según Distrito de ProcedenciaDepartamento de Piura, 2018 *

Dirección Regional de Salud Piura
2012 2013 2014 2015 2016 2017 2018
Sierra 44.1 34.5 31.0 33.3 20.6 27.8 35.7
Costa 55.9 65.5 69.0 66.7 79.4 69.4 64.3
Selva 0.0 0.0 0.0 0.0 0.0 2.8 0.0
0.0
10.0
20.0
30.0
40.0
50.0
60.0
70.0
80.0
90.0
Po
rce
nta
je
Porcentaje de Casos de Muerte Materna por Años Según Regiones NaturalesREGION DE SALUD PIURA: 2012 - 2018*
Fuente: DIRESA PIURA/OEPI (*) Avande SE N° 24
Muerte Materna según Regiones NaturalesDepartamento de Piura, 2012 - 2018 *
Dirección Regional de Salud Piura
Fuente: DIRESA PIURA/OEPI (*) Avande SE N° 24
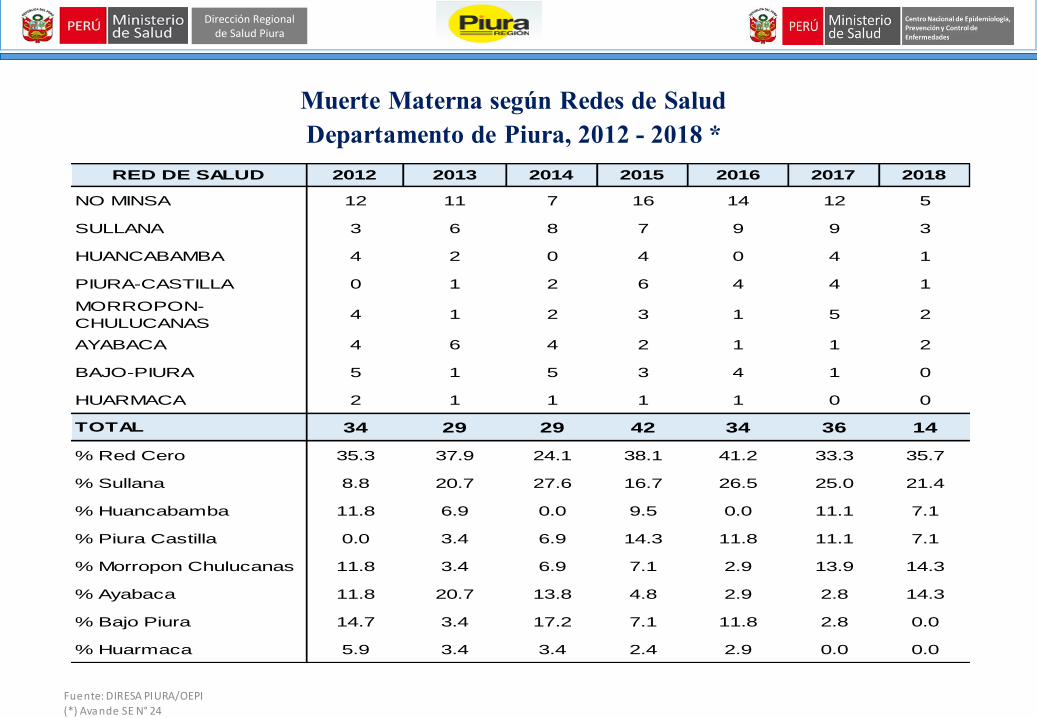
Muerte Materna según Redes de SaludDepartamento de Piura, 2012 - 2018 *
RED DE SALUD 2012 2013 2014 2015 2016 2017 2018
NO MINSA 12 11 7 16 14 12 5
SULLANA 3 6 8 7 9 9 3
HUANCABAMBA 4 2 0 4 0 4 1
PIURA-CASTILLA 0 1 2 6 4 4 1
MORROPON-
CHULUCANAS4 1 2 3 1 5 2
AYABACA 4 6 4 2 1 1 2
BAJO-PIURA 5 1 5 3 4 1 0
HUARMACA 2 1 1 1 1 0 0
TOTAL 34 29 29 42 34 36 14
% Red Cero 35.3 37.9 24.1 38.1 41.2 33.3 35.7
% Sullana 8.8 20.7 27.6 16.7 26.5 25.0 21.4
% Huancabamba 11.8 6.9 0.0 9.5 0.0 11.1 7.1
% Piura Castilla 0.0 3.4 6.9 14.3 11.8 11.1 7.1
% Morropon Chulucanas 11.8 3.4 6.9 7.1 2.9 13.9 14.3
% Ayabaca 11.8 20.7 13.8 4.8 2.9 2.8 14.3
% Bajo Piura 14.7 3.4 17.2 7.1 11.8 2.8 0.0
% Huarmaca 5.9 3.4 3.4 2.4 2.9 0.0 0.0
Dirección Regional de Salud Piura
Fuente: DIRESA PIURA/OEPI (*) Avande SE N° 24
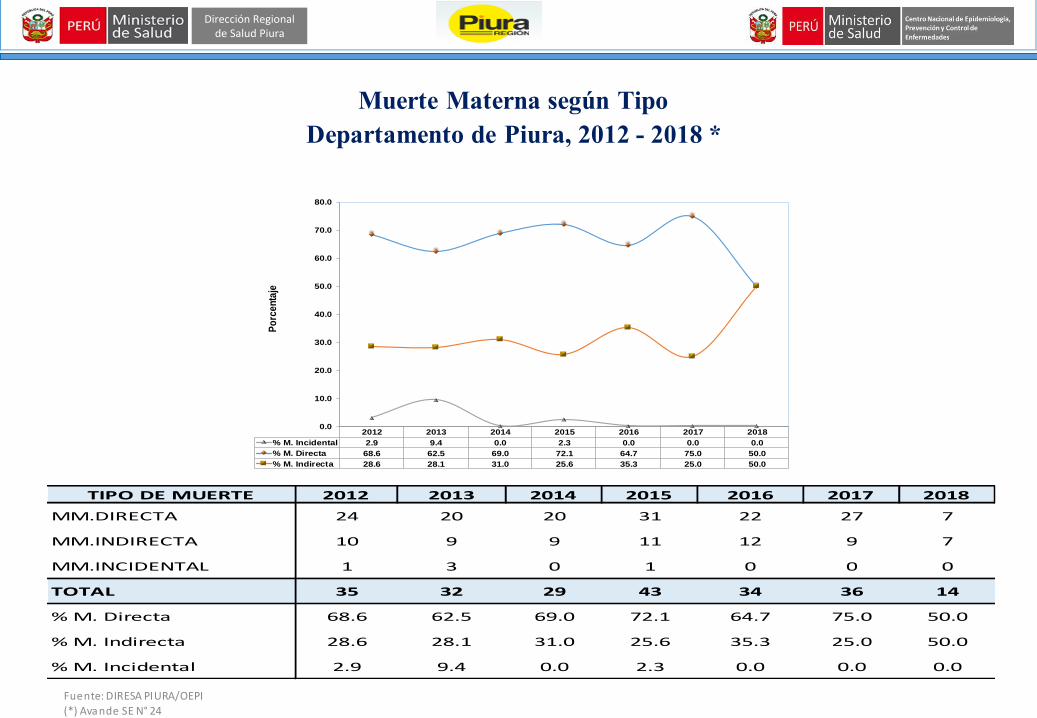
Muerte Materna según TipoDepartamento de Piura, 2012 - 2018 *
2012 2013 2014 2015 2016 2017 2018
% M. Incidental 2.9 9.4 0.0 2.3 0.0 0.0 0.0
% M. Directa 68.6 62.5 69.0 72.1 64.7 75.0 50.0
% M. Indirecta 28.6 28.1 31.0 25.6 35.3 25.0 50.0
0.0
10.0
20.0
30.0
40.0
50.0
60.0
70.0
80.0
Po
rce
nta
je
TIPO DE MUERTE 2012 2013 2014 2015 2016 2017 2018
MM.DIRECTA 24 20 20 31 22 27 7
MM.INDIRECTA 10 9 9 11 12 9 7
MM.INCIDENTAL 1 3 0 1 0 0 0
TOTAL 35 32 29 43 34 36 14
% M. Directa 68.6 62.5 69.0 72.1 64.7 75.0 50.0
% M. Indirecta 28.6 28.1 31.0 25.6 35.3 25.0 50.0
% M. Incidental 2.9 9.4 0.0 2.3 0.0 0.0 0.0

Dirección Regional de Salud Piura
Fuente: DIRESA PIURA/OEPI (*) Avande SE N° 24
Muerte Materna según Ciclo de VidaDepartamento de Piura, 2012 - 2018 *
Adolescente7.1%
Adulto50.0%
Joven42.9%
%12 - 177.1%
%18 - 2942.9%%30 - 49
50.0%
2012 2013 2014 2015 2016 2017 2018
Adolescente 4 0 0 1 1 1 1
Adulto 15 14 15 21 18 14 7
Joven 14 15 14 20 15 21 6
Niño 1 0 0 0 0 0 0
Total general 34 29 29 42 34 36 14
%Adolescente 11.8% 0.0% 0.0% 2.4% 2.9% 2.8% 7.1%
%Adulto 44.1% 48.3% 51.7% 50.0% 52.9% 38.9% 50.0%
%Joven 41.2% 51.7% 48.3% 47.6% 44.1% 58.3% 42.9%
%Niño 2.9% 0.0% 0.0% 0.0% 0.0% 0.0% 0.0%
CICLOS DE VIDAAÑOS

Dirección Regional de Salud Piura
Fuente: DIRESA PIURA/OEPI (*) Avande SE N° 24
Muerte Materna según Momento del FallecimientoDepartamento de Piura, 2012 - 2018 *
2012 2013 2014 2015 2016 2017 2018
% Parto 8.8% 13.8% 13.8% 7.1% 5.9% 2.8% 7.1%
% Puerperio 55.9% 58.6% 62.1% 71.4% 67.6% 52.8% 57.1%
% Embarazo 35.3% 27.6% 24.1% 21.4% 26.5% 44.4% 35.7%
0.0%
10.0%
20.0%
30.0%
40.0%
50.0%
60.0%
70.0%
80.0%
Po
rce
nta
je
Puerperio57.1%
Embarazo35.7%
Parto7.1%
2012 2013 2014 2015 2016 2017 2018
Puerperio 19 17 18 30 23 19 8
Embarazo 12 8 7 9 9 16 5
Parto 3 4 4 3 2 1 1
Otro 0 0 0 0 0 0 0
Total general 34 29 29 42 34 36 14
% Puerperio 55.9% 58.6% 62.1% 71.4% 67.6% 52.8% 57.1%
% Embarazo 35.3% 27.6% 24.1% 21.4% 26.5% 44.4% 35.7%
% Parto 8.8% 13.8% 13.8% 7.1% 5.9% 2.8% 7.1%
Fuente: Notificacion Inmediata
AÑOSMOMENTO

Dirección Regional de Salud Piura
Fuente: DIRESA PIURA/OEPI (*) Avande SE N° 24
Muerte Materna según Causa Genérica de la MuerteDepartamento de Piura, 2018 *
HIPERTENSION GESTACIONAL
42.9%
HEMORRAGIA7.1%
OTRA CAUSA42.9%
INFECCION/SEPSIS7.1%
2017 2018
HIPERTENSION
GESTACIONAL12 6
HEMORRAGIA 10 1
OTRA CAUSA 10 6
INFECCION/SEPSIS 4 1
Total general 36 14
CAUSA GENERICAAÑOS
REGION DESALUD PIURA : MORTALIDAD
MATERNA, POR AÑOS SEGÚN CAUSA
GENERICA DE MUERTE
AÑO 2018 (Hasta S.E. Nº 23)

Dirección Regional de Salud Piura
Fuente: DIRESA PIURA/OEPI (*) Avande SE N° 24
Muerte Materna según Causa Genérica de la MuerteDepartamento de Piura, 2018 *
CAUSA GENERAL 2016 2017 2018 Grafico
HEMORRAGIA 3 4 1
HIPERTENSION
GESTACIONAL5 8 6
OTRA CAUSA 8 8 6
INFECCION/SEPSIS 2 3 1

Dirección Regional de Salud Piura
Fuente: DIRESA PIURA/OEPI (*) Avande SE N° 24
Muerte Materna según Lugar de FallecimientoDepartamento de Piura, 2018 *
2012 2013 2014 2015 2016 2017 2018
ESSALUD 13 11 8 17 15 13 5
MINSA 8 10 17 17 12 12 4
DOMICILIO 4 4 4 2 6 7 3
TRAYECTO 2 1 0 4 1 3 2
OTRO 7 3 0 0 0 1 0
PRIVADO 0 0 0 2 0 0 0
Total general 34 29 29 42 34 36 14
REGION DE SALUD PIURA : MORTALIDAD MATERNA, POR AÑOS SEGÚN
INSTITUCION U OTRO DE FALLECIMIENTO
AÑO 2012 - 2018 (Hasta S.E. Nº 23)
Lugar de FallecimientoAÑOS
ESSALUD35.7%
MINSA28.6%
DOMICILIO21.4%
TRAYECTO14.3%
OTRO0.0%
PRIVADO0.0%

Dirección Regional de Salud Piura
Mortalidad Materna por Tipo y AñosDepartamento de Piura, 2018
Fuente: DIRESA PIURA/OEPI (*) Avande SE N° 24
0
5
10
15
20
25
30
35
40
45
2012 2013 2014 2015 2016 2017 2018
24
20 20
31
22
27
7
10
9 9
11
12
9
7
1
3
1
Nº
de
Caso
s
AÑOS
MM.DIRECTA MM.INDIRECTA MM.INCIDENTAL

Dirección Regional de Salud Piura
Mortalidad Materna por Tiempo de permanencia en el Establecimiento de SaludDepartamento de Piura, 2018
Fuente: DIRESA PIURA/OEPI (*) Avande SE N° 24
0
5
10
15
20
25
30
35
40
2012 2013 2014 2015 2016 2017 2018
22
1315
23
13 12
1
5
3
5
5
5 7
3
1
8
5
8
9 7
4
Nº
de
Caso
s
Años
< 24 Horas
1 - 3 dias
> 3 dias

Dirección Regional de Salud Piura
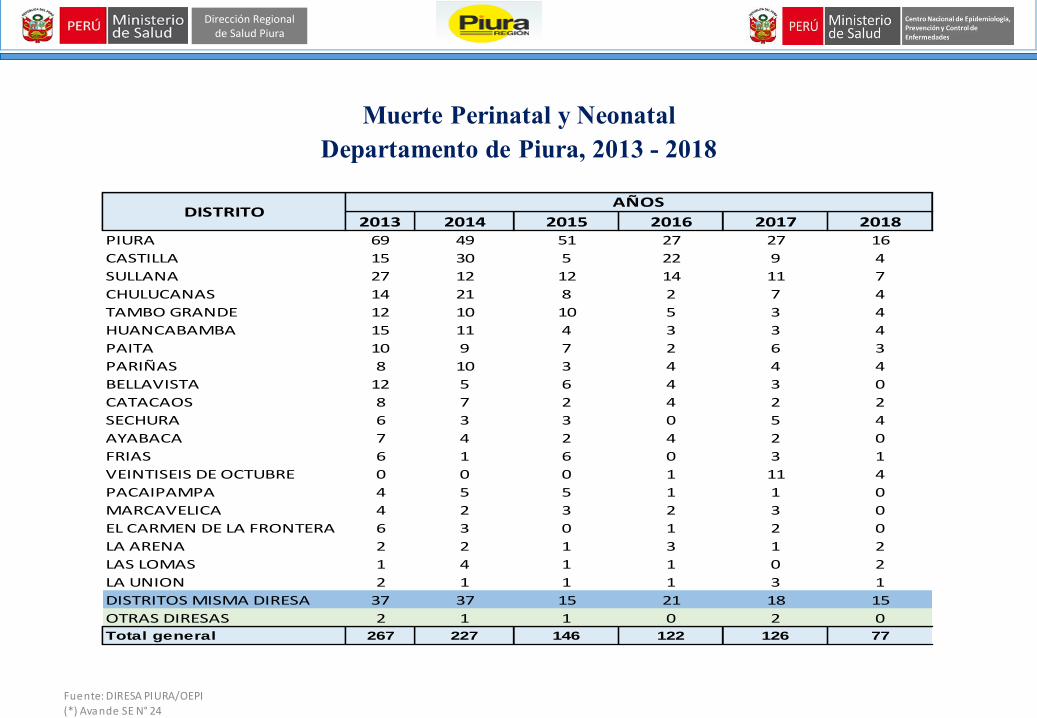
Muerte Perinatal y NeonatalDepartamento de Piura, 2013 - 2018
Fuente: DIRESA PIURA/OEPI (*) Avande SE N° 24
0.00
2.00
4.00
6.00
8.00
10.00
12.00
14.00
2013 2014 2015 2016 2017 2018
Ta
sa M
ort
alid
ad
Tasas de Muerte Fetal - Neonatal - PerinatalREGION DE SALUD PIURA: 2013 - 2018*
T.M. FETAL T.M. NEONATAL T.M. PERINATAL
INDICADOR 2013 2014 2015 2016 2017 2018
M. FETAL 249 231 183 170 209 98
M. NEONATAL 267 227 146 122 126 62
M. PERINATAL 465 412 303 256 310 150
NACIMIENTOS 37,208 37,647 37,281 37,076 36,876 37,152
T.M. FETAL 6.69 6.14 4.91 4.59 5.67 2.64
T.M. NEONATAL 7.18 6.03 3.92 3.29 3.42 1.67
T.M. PERINATAL 12.50 10.94 8.13 6.90 8.41 4.04
Dirección Regional de Salud Piura
Muerte Perinatal y NeonatalDepartamento de Piura, 2013 - 2018
Fuente: DIRESA PIURA/OEPI (*) Avande SE N° 24
2013 2014 2015 2016 2017 2018PIURA 69 49 51 27 27 16
CASTILLA 15 30 5 22 9 4
SULLANA 27 12 12 14 11 7
CHULUCANAS 14 21 8 2 7 4
TAMBO GRANDE 12 10 10 5 3 4
HUANCABAMBA 15 11 4 3 3 4
PAITA 10 9 7 2 6 3
PARIÑAS 8 10 3 4 4 4
BELLAVISTA 12 5 6 4 3 0
CATACAOS 8 7 2 4 2 2
SECHURA 6 3 3 0 5 4
AYABACA 7 4 2 4 2 0
FRIAS 6 1 6 0 3 1
VEINTISEIS DE OCTUBRE 0 0 0 1 11 4
PACAIPAMPA 4 5 5 1 1 0
MARCAVELICA 4 2 3 2 3 0
EL CARMEN DE LA FRONTERA 6 3 0 1 2 0
LA ARENA 2 2 1 3 1 2
LAS LOMAS 1 4 1 1 0 2
LA UNION 2 1 1 1 3 1
DISTRITOS MISMA DIRESA 37 37 15 21 18 15
OTRAS DIRESAS 2 1 1 0 2 0
Total general 267 227 146 122 126 77
AÑOSDISTRITO

Dirección Regional de Salud Piura
Muerte Perinatal y Neonatal según redes de saludDepartamento de Piura, 2013 - 2018
Fuente: DIRESA PIURA/OEPI (*) Avande SE N° 24
2013 2014 2015 2016 2017 2018 2013 2014 2015 2016 2017 2018
ESSALUD 142 146 100 88 90 45 27.5 31.9 30.4 30.2 27.0 22.3
PIURA - CASTILLA 109 82 57 55 69 65 21.1 17.9 17.3 18.9 20.7 32.2
BAJO PIURA 0 0 0 5 1 2 0.0 0.0 0.0 1.7 0.3 1.0
HUANCABAMBA 36 35 19 14 16 10 7.0 7.6 5.8 4.8 4.8 5.0
HUARMACA 7 6 2 0 0 0 1.4 1.3 0.6 0.0 0.0 0.0
MORROPON - CHUL 71 49 33 24 54 27 13.8 10.7 10.0 8.2 16.2 13.4
SULLANA 138 134 116 101 101 51 26.7 29.3 35.3 34.7 30.3 25.2
AYABACA 13 6 2 4 2 2 2.5 1.3 0.6 1.4 0.6 1.0
TOTAL 516 458 329 291 333 202 100.0 100.0 100.0 100.0 100.0 100.0
RED DE SALUDAÑOS % PORCENTAJE

Dirección Regional de Salud Piura
121104
92 95 99
125
123
118
93
41
68
77
0
50
100
150
200
250
300
2013 2014 2015 2016 2017 2018
M. NEONATAL M. FETAL
Muerte Perinatal y NeonatalDepartamento de Piura, 2013 – 2018 *
Fuente: DIRESA PIURA/OEPI (*) Avande SE N° 24
Dirección Regional de Salud Piura
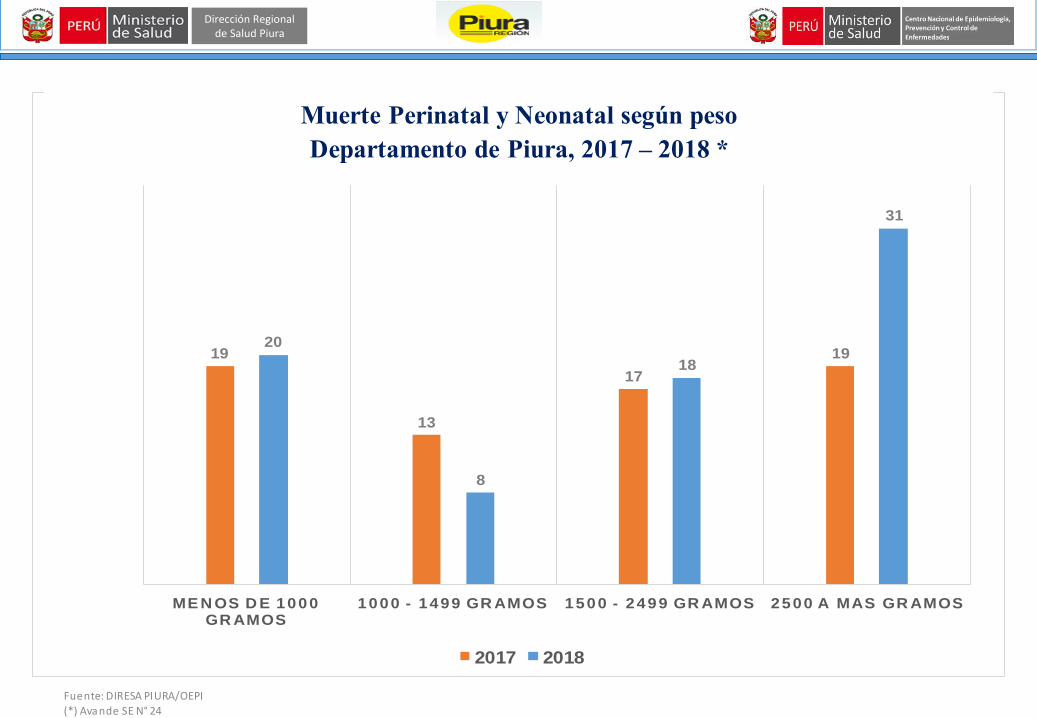
19
13
17
1920
8
18
31
ME N OS D E 1000 GR AMOS
1000 - 1499 GR AMOS 1500 - 2499 GR AMOS 2500 A MAS GR AMOS
CASOS DE MUERTE NEONATAL SEGÚN PESOREGION DE SALUD PIURA: 2017 - 2018*
2017 2018
Muerte Perinatal y Neonatal según pesoDepartamento de Piura, 2017 – 2018 *
Fuente: DIRESA PIURA/OEPI (*) Avande SE N° 24
Dirección Regional de Salud Piura
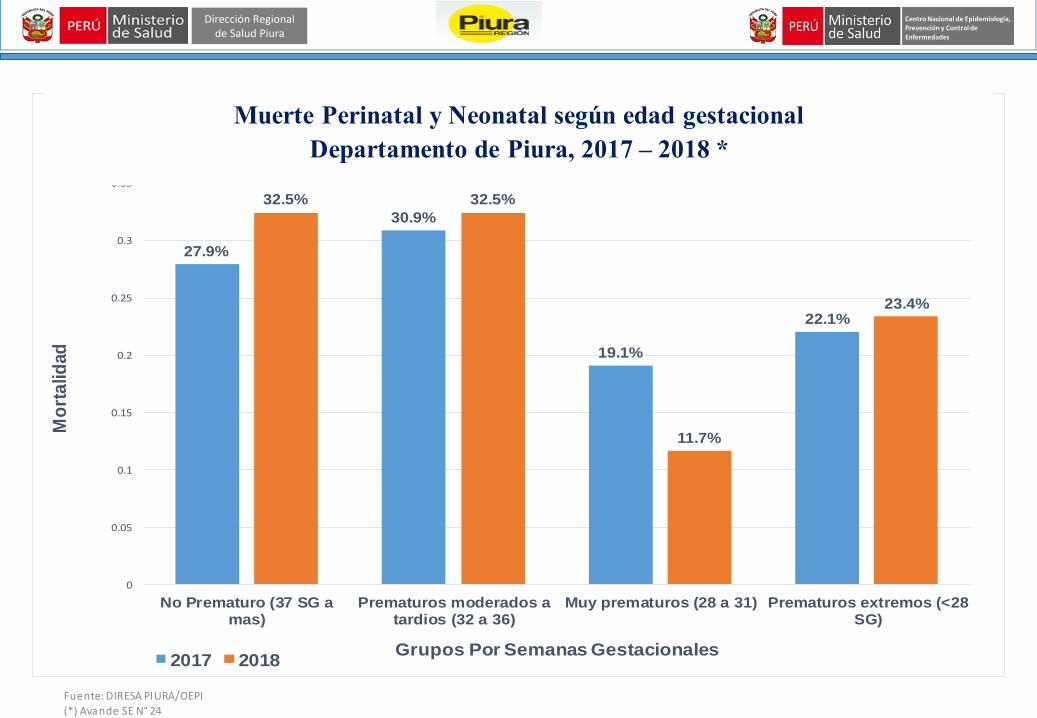
27.9%
30.9%
19.1%
22.1%
32.5% 32.5%
11.7%
23.4%
0
0.05
0.1
0.15
0.2
0.25
0.3
0.35
No Prematuro (37 SG amas)
Prematuros moderados atardios (32 a 36)
Muy prematuros (28 a 31) Prematuros extremos (<28SG)
Mo
rta
lid
ad
Grupos Por Semanas Gestacionales
Casos de Muerte Neonatal Según Edad GestacionalREGION DE SALUD PIURA: 2017 - 2018*
2017 2018
Muerte Perinatal y Neonatal según edad gestacionalDepartamento de Piura, 2017 – 2018 *
Fuente: DIRESA PIURA/OEPI (*) Avande SE N° 24

Dirección Regional de Salud Piura
27.9%
72.1%
32.5%
67.5%
0
0.1
0.2
0.3
0.4
0.5
0.6
0.7
0.8
No Prematuros Prematuros
Mo
rta
lid
ad
Grupos Por Semanas Gestacionales
Casos de Muerte Neonatal Según Edad GestacionalREGION DE SALUD PIURA: 2017 - 2018*
2017 2018
Muerte Perinatal y Neonatal según edad gestacionalDepartamento de Piura, 2017 – 2018 *
Fuente: DIRESA PIURA/OEPI (*) Avande SE N° 24

Dirección Regional de Salud Piura
24
31
13
30
32
15
0
5
10
15
20
25
30
35
Primeras 24 horas Dias 1 a 7 Dias 8 a 28
Mo
talid
ad
Casos de Muerte Neonatal Según Ocurrencia de MuerteREGION DE SALUD PIURA: 2017 - 2018*
2017 2018
Muerte Perinatal y Neonatal según ocurrencia de muerteDepartamento de Piura, 2017 – 2018 *
Fuente: DIRESA PIURA/OEPI (*) Avande SE N° 24

Dirección Regional de Salud Piura
59
9
72
5
0
10
20
30
40
50
60
70
80
Establecimiento de Salud Domicilio
Mo
talid
ad
Casos de Muerte Neonatal Según Atencion de PartoREGION DE SALUD PIURA: 2017 - 2018*
2017 2018
Muerte Perinatal y Neonatal según atención de partoDepartamento de Piura, 2017 - 2018
Fuente: DIRESA PIURA/OEPI (*) Avande SE N° 24

Dirección Regional de Salud Piura
Gráfico BabiesDepartamento de Piura, 2018
Fuente: DIRESA PIURA/OEPI (*) Avande SE N° 24
Muerte Neonatal
ANTES DEL
PARTO
DURANTE EL
PARTO
DESPUES DEL
PARTOTOTAL SALUD MATERNA
500-1499 grs 51 2 28 81 CUIDADO DURANTE EL EMBARAZO
1500-2499 grs 33 2 18 53 CUIDADO DURANTE EL PARTO
> 2500 grs 33 4 31 68 CUIDADO DURANTE EL RN
TOTAL 117 8 77 202
PESOMuerte Fetal
Muerte Neonatal
ANTES DEL
PARTO
DURANTE EL
PARTO
DESPUES DEL
PARTO
500-1499 grs
1500-2499 grs
> 2500 grs
32.7% 3.0% 24.3%
PESO
Muerte Fetal
40.1%
117
8
77
0
20
40
60
80
100
120
140
ANTES DEL PARTO DURANTE EL PARTO DESPUES DEL PARTO

Dirección Regional de Salud Piura
Defunciones Fetales y Neonatales según peso y momento de muerteDepartamento de Piura, 2018
Fuente: DIRESA PIURA/OEPI (*) Avande SE N° 24
Anteparto Intraparto Total < 24 Horas 1 - 7 dias 8 - 28 dias Total
Muy Bajo Peso Nº 51 2 53 12 12 4 28 81
500-1499 grs % 43.6 1.7 42.4 40.0 37.5 26.7 36.4 40.1
Bajo Peso Nº 33 2 35 10 5 3 18 53
1500-2499 grs % 28.2 1.7 28.0 33.3 15.6 20.0 23.4 26.2
Peso Normal Nº 33 4 37 8 15 8 31 68
> 2500 grs % 28.2 3.4 29.6 26.7 46.9 53.3 40.3 33.7
Nº 117 8 125 30 32 15 77 202
% 93.6 6.4 61.9 39.0 41.6 19.5 38.1 100.0
TOTAL
PESO Muerte Fetal Tiempo de sobrevivencia de la muerte neonatalTOTAL
GENERAL: FETAL
Y NEONATAL

Dirección Regional de Salud Piura
Fuente: DIRESA PIURA/OEPI (*) Avande SE N° 24
SITUACION SEMANAL DE NOTIFICACION DE INMUNOPREVENIBLES
AÑOS - 2017 - 2018 (Hasta S.E. Nº 23) REGION DE SALUD PIURA
Confirmado Descartado Probable TOTAL Confirmado Descartado Probable TOTAL
RUBEOLA 0 9 0 9 0 6 0 6
RUBEOLA CONGENITA 0 0 0 0 0 0 0 0
SARAMPION 0 1 0 1 0 7 0 7
PFA 0 1 0 1 0 0 0 0
TOS FERINA 11 17 0 28 15 18 7 40
DIFTERIA 0 1 0 1 0 0 0 0
TETANOS NEONATAL 0 0 0 0 0 0 0 0
TETANOS 0 0 0 0 2 0 0 2
MENINGITIS MENINGOCOCICA 0 0 0 0 0 0 0 0
FIEBRE AMARILLA SELVATICA 0 0 0 0 0 0 0 0
HEPATITIS A 12 7 1 20 18 0 3 21
HEPATITIS B 5 4 0 9 1 8 6 15
ESAVI EVENTO ADVERSO POST VAC 0 0 3 3 0 0 1 1
VARICELA SIN COMPLICACIONES 477 0 0 477 233 0 0 233
VARICELA CON OTRAS COMPLICACIONES 27 2 0 29 17 0 2 19
INFLUENZA ESTACIONAL 0 0 0 0 13 0 0 13
INFLUENZA A H1N1 0 0 0 0 27 0 0 27
INFLUENZA A H3N2 2 0 0 2 1 0 0 1
T O T A L 534 42 4 580 327 39 19 385Fuente: Direc.Reg.Salud Piura/DEIS/Sist.Vig.Inmuno(*) Sarampión Tasa x 100,000 Pob. Gral. (***) Tétanos Neonatal Tasa x 1000 < 1 año
(**) Parálisis Flácida Aguda Tasa x 100,000 < 15 años Otros daños Tasa x 10,000 Pob.Gral.
AÑO 2017 AÑO 2018
ENFERMEDAD TIPO DE DIAGNOSTICOTIPO DE DIAGNOSTICO
Dirección Regional de Salud Piura
Fuente: DIRESA PIURA/OEPI (*) Avande SE N° 24
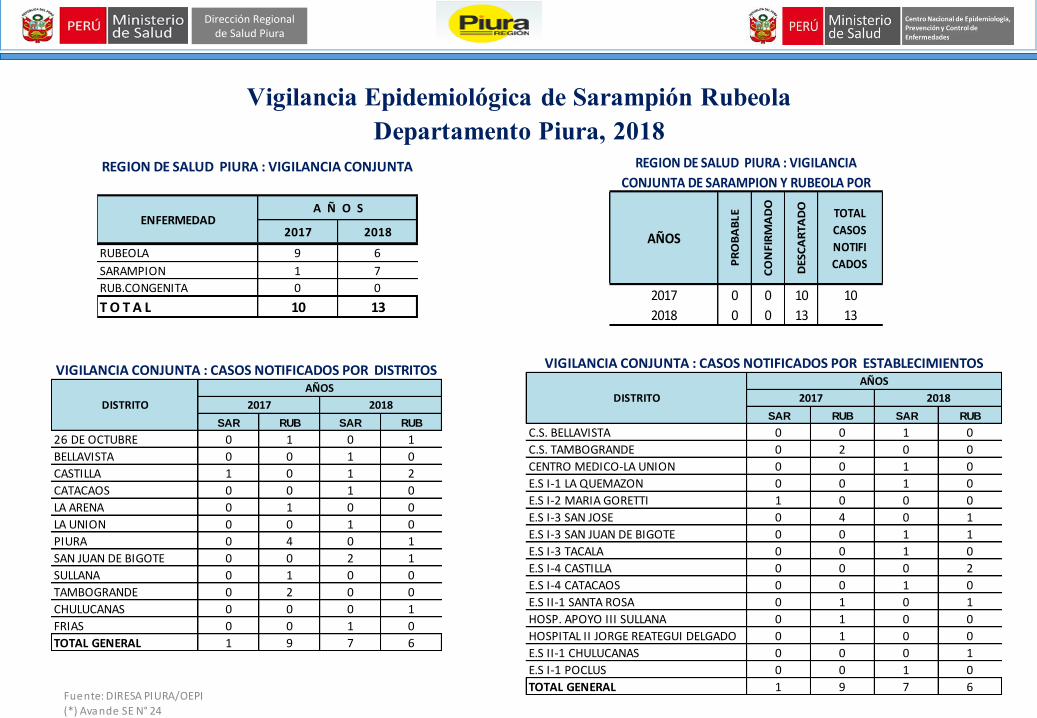
Vigilancia Epidemiológica de Sarampión RubeolaDepartamento Piura, 2018
2017 2018
RUBEOLA 9 6
SARAMPION 1 7
RUB.CONGENITA 0 0
T O T A L 10 13
ENFERMEDADA Ñ O S
REGION DE SALUD PIURA : VIGILANCIA CONJUNTA
AÑOS
PR
OB
AB
LE
CO
NFI
RM
AD
O
DES
CA
RTA
DO
2017 0 0 10
2018 0 0 13 13
REGION DE SALUD PIURA : VIGILANCIA
CONJUNTA DE SARAMPION Y RUBEOLA POR
TOTAL
CASOS
NOTIFI
CADOS
10
VIGILANCIA CONJUNTA : CASOS NOTIFICADOS POR ESTABLECIMIENTOS
SAR RUB SAR RUB
C.S. BELLAVISTA 0 0 1 0
C.S. TAMBOGRANDE 0 2 0 0
CENTRO MEDICO-LA UNION 0 0 1 0
E.S I-1 LA QUEMAZON 0 0 1 0
E.S I-2 MARIA GORETTI 1 0 0 0
E.S I-3 SAN JOSE 0 4 0 1
E.S I-3 SAN JUAN DE BIGOTE 0 0 1 1
E.S I-3 TACALA 0 0 1 0
E.S I-4 CASTILLA 0 0 0 2
E.S I-4 CATACAOS 0 0 1 0
E.S II-1 SANTA ROSA 0 1 0 1
HOSP. APOYO III SULLANA 0 1 0 0
HOSPITAL II JORGE REATEGUI DELGADO 0 1 0 0
E.S II-1 CHULUCANAS 0 0 0 1
E.S I-1 POCLUS 0 0 1 0
TOTAL GENERAL 1 9 7 6
DISTRITO 2017 2018
AÑOSVIGILANCIA CONJUNTA : CASOS NOTIFICADOS POR DISTRITOS
SAR RUB SAR RUB
26 DE OCTUBRE 0 1 0 1
BELLAVISTA 0 0 1 0
CASTILLA 1 0 1 2
CATACAOS 0 0 1 0
LA ARENA 0 1 0 0
LA UNION 0 0 1 0
PIURA 0 4 0 1
SAN JUAN DE BIGOTE 0 0 2 1
SULLANA 0 1 0 0
TAMBOGRANDE 0 2 0 0
CHULUCANAS 0 0 0 1
FRIAS 0 0 1 0
TOTAL GENERAL 1 9 7 6
AÑOS
2017 2018DISTRITO

Dirección Regional de Salud Piura
Fuente: DIRESA PIURA/OEPI (*) Avande SE N° 24
Vigilancia Epidemiológica de Sarampión RubeolaIndicadores EpidemiológicosDepartamento de Piura, 2018
INDICADORES DE LA VIGILANCIA CONJUNTA ESTÁNDAR 2017 2018
% Notificación Semanal (Cobertura) 100 93 88
Nº casos sopechosos de Sarampión-Rubéola 10 13
Tasa x 100,000 hab.> o = 2 x 100,000
Pob.Gral0.5 0.7
% Visita Domiciliaria en ≤ 48 horas 100 0 23
% Casos con investigación adecuada (ficha completa) 100 50 46
% de muestras que llegan al laboratorio del INS antes
de 5 días.100 50 77
% de muestras con resultados de laboratorio INS ≤ 4
días 100 29 54
REGION DE SALUD PIURA : INDICADORES DE LA VIGILANCIA DE SARAMPION Y RUBEOLA
5.1
2.8
1.6
0.9
2.8
5.2
1.9
2.0
1.20
1.41
0.91 0.530.7
0.0
1.0
2.0
3.0
4.0
5.0
6.0
2006 2007 2008 2009 2010 2011 2012 2013 2014 2015 2016 2017 2018
Tasa
No
tifi
caci
ón
X 1
00
,00
0 P
ob
.gra
l AÑOS
REGION SALUD PIURA : TASA NOTIFICACION DE LA VIGILANCIA CONJUNTA SR
AÑOS 2006 - 2018 (Hasta S.E. Nº 23)
Fuente: Direc.Reg.Salud Piura/DEIS/Sist.Vig.Inmuno

Dirección Regional de Salud Piura
Fuente: DIRESA PIURA/OEPI (*) Avande SE N° 24
Vigilancia Epidemiológica Sarampión Rubeola Departamento de Piura, 2018 *
7
2
3
1
0
1
2
3
4
5
6
7
8
<1 a 1 a 2 - 4 a 5 - 9 a 10 a +
Nº
C
A S
O S
REGION DE SALUD PIURA: SARAMPION/RUBEOLA NOTIFICADOS POR EDAD
AÑO 2018 (Hasta S.E. Nº 23)
Fuente: Direc.Reg.Salud Piura/DEIS/Sist.Vig.InmunoFuente: Direc.Reg.Salud Piura/DEIS/Sist.Vig.Inmuno
FEMENINO46%
MASCULINO54%
REGION DE SALUD PIURA : SARAMPION/RUBEOLA NOTIFICADOS POR SEXO
AÑO 2018 (Hasta S.E. Nº 23)

Dirección Regional de Salud Piura
Fuente: DIRESA PIURA/OEPI (*) Avande SE N° 24
Vigilancia Epidemiológica Sarampión Rubeola Departamento de Piura, 2018 *
INDICE DE RIESGO: VACUNA SPR EN NIÑOS DE 1 año2016-2017
93
93103
95
98
102
112
91
83
96
105
89
84
62
0
20
40
60
80
100
120
0
10
20
30
40
50
60
70
2005 2006 2007 2008 2009 2010 2011 2012 2013 2014 2015 2016 2017 2018
Co
be
rtu
ra
Nº
de
Ca
so
s
REGION SALUD PIURA : SARAMPION/RUBEOLA TASA DE NOTIFICACION Y COBERTURA
Nº Casos (C + P) Cobertura
AÑO 2018 (Hasta S.E. Nº 23)

Dirección Regional de Salud Piura
Fuente: DIRESA PIURA/OEPI (*) Avande SE N° 24
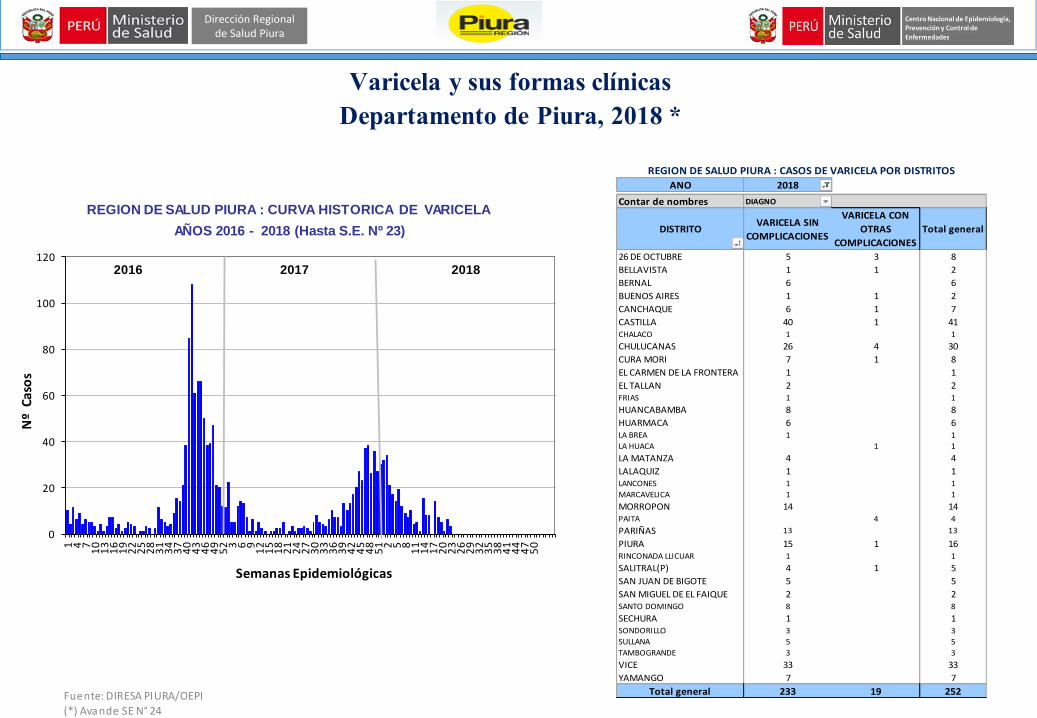
Varicela y sus formas clínicasDepartamento de Piura, 2018 *
0
10
20
30
40
1 3 5 7 9 11
13
15
17
19
21
23
25
27
29
31
33
35
37
39
41
43
45
47
49
51
Nº
Caso
s
Semanas Epidemiológicas
REGION DE SALUD PIURA : Distribución Semanal de Varicela
NEUMONIA DEBIDA A VARICELA
ENCEFALITIS DEBIDA A VARICELA
MENINGITIS DEBIDA A VARICELA
VARICELA CON OTRAS
COMPLICACIONESVARICELA SIN COMPLICACIONES
2017
AÑOS 2017 - 2018 (Avance Hasta SE.Nº 23)
Fuente: Direcc.Reg.Salud Piura/DEIS/Sist.Vig.InmunoFuente: Direcc.Reg.Salud Piura/DEIS/Sist.Vig.Inmuno
-60.33
-6.61
-3.31
-2.48
0.00
0.00
-1.65
-0.83
0.00
0.00-0.83
0.00
-0.83
0.00
0.00
61.54
7.69
2.31
2.31
0.00
0.00
0.77
1.54
0.77
0.77
0.00
0.00
0.00
0.77
80 60 40 20 0 20 40 60 80
0 - 4 a
10 - 14
15 - 19
20 - 24
25 - 29
30 - 34
35 - 39
40 - 44
45 - 49
50 - 54
55 - 59
60 - 64
65 - 69
70 - 74
75 +
(%) PORCENTAJEG
RU
PO
S Q
UIN
QU
EN
AL
ES
REGION DE SALUD PIURA : VARICELA PIRAMIDE POBLACIONAL
AÑO 2018 (Hasta S.E. Nº 23)
Fuente: Direcc.Reg.Salud Piura/DEIS/Sist.Vig.Inmuno
VARICELA SIN
COMPLICACIONES, 92%
VARICELA CON OTRAS
COMPLICACIONES, 8%
REGION DE SALUD PIURA : VARICELA SEGUN FORMAS CLINICAS
AÑO 2018 (Hasta S.E. Nº 23)
Dirección Regional de Salud Piura
Fuente: DIRESA PIURA/OEPI (*) Avande SE N° 24
Varicela y sus formas clínicasDepartamento de Piura, 2018 *
0
20
40
60
80
100
120
1 4 71
01
31
61
92
22
52
83
13
43
74
04
34
64
95
2 3 6 91
21
51
82
12
42
73
03
33
63
94
24
54
85
1 2 5 81
11
41
72
02
32
62
93
23
53
84
14
44
75
0
Nº
Cas
os
Semanas Epidemiológicas
2016 2017 2018
REGION DE SALUD PIURA : CURVA HISTORICA DE VARICELA
AÑOS 2016 - 2018 (Hasta S.E. Nº 23)
Fuente: Direcc.Reg.Salud Piura/DEIS/Sist.Vig.InmunoFuente: Direcc.Reg.Salud Piura/DEIS/Sist.Vig.Inmuno
REGION DE SALUD PIURA : CASOS DE VARICELA POR DISTRITOS
ANO 2018
Contar de nombres DIAGNO
DISTRITOVARICELA SIN
COMPLICACIONES
VARICELA CON
OTRAS
COMPLICACIONES
Total general
26 DE OCTUBRE 5 3 8
BELLAVISTA 1 1 2
BERNAL 6 6
BUENOS AIRES 1 1 2
CANCHAQUE 6 1 7
CASTILLA 40 1 41CHALACO 1 1
CHULUCANAS 26 4 30
CURA MORI 7 1 8
EL CARMEN DE LA FRONTERA 1 1
EL TALLAN 2 2FRIAS 1 1
HUANCABAMBA 8 8
HUARMACA 6 6LA BREA 1 1
LA HUACA 1 1
LA MATANZA 4 4
LALAQUIZ 1 1LANCONES 1 1
MARCAVELICA 1 1
MORROPON 14 14PAITA 4 4
PARIÑAS 13 13
PIURA 15 1 16RINCONADA LLICUAR 1 1
SALITRAL(P) 4 1 5
SAN JUAN DE BIGOTE 5 5
SAN MIGUEL DE EL FAIQUE 2 2SANTO DOMINGO 8 8
SECHURA 1 1SONDORILLO 3 3
SULLANA 5 5
TAMBOGRANDE 3 3
VICE 33 33
YAMANGO 7 7
Total general 233 19 252

Dirección Regional de Salud Piura
Fuente: DIRESA PIURA/OEPI (*) Avande SE N° 24
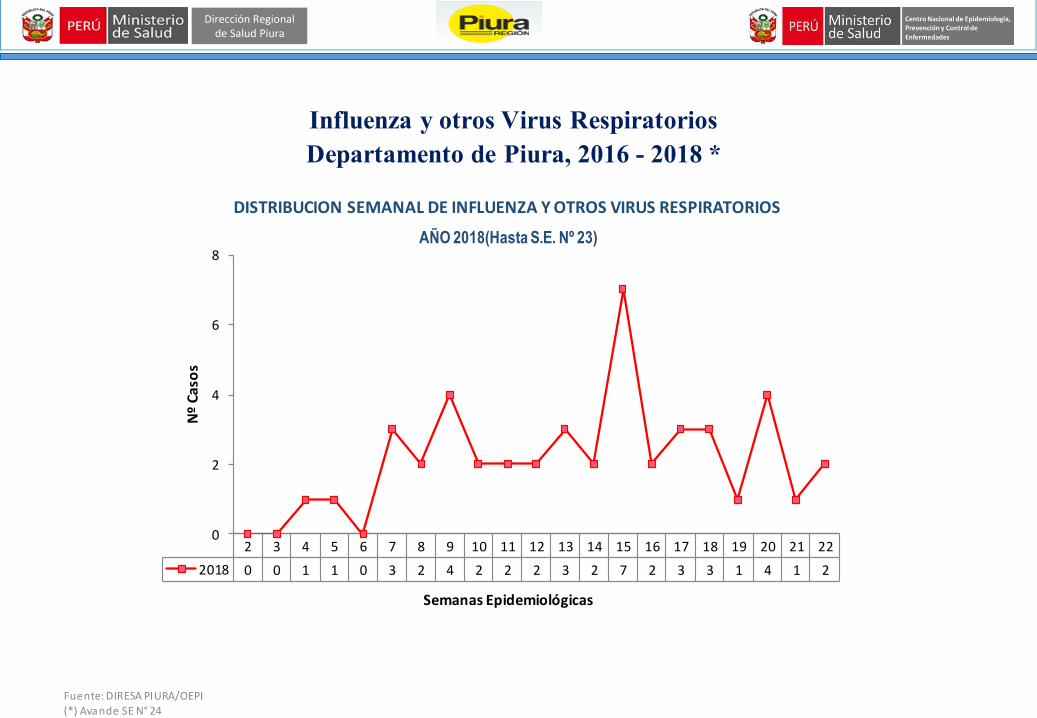
Influenza y otros Virus RespiratoriosDepartamento de Piura, 2016 - 2018 *
RESUMEN DE LA VIGILANCIA EPIDEMIOLOGICA DE INFLUENZA Y OTROS VIRUS RESPIRATORIOSAÑOS - 2016 - 2018 (Hasta S.E. Nº 23)
H1N1
pdm. 09 H3N2 IFU A
2016 462 107 34 0 67 2 1 1 212 46 203 9
2017 9 0 2 0 0 0 0 0 2 22 6 0
2018 66 30 2 1 13 0 0 0 46 70 13 0
Fuente: Direcc.Reg.Salud Piura/DEIS/Sist.Vig.Inmuno
FallecidosMetapneumovirus
Total
Positivos
FLU
Negativo%
Positividad
Nº
NotificadosAÑOS Adenovirus
Parainfluenza
2
INFLUENZA AInfluenza
B
Dirección Regional de Salud Piura
Fuente: DIRESA PIURA/OEPI (*) Avande SE N° 24
Influenza y otros Virus RespiratoriosDepartamento de Piura, 2016 - 2018 *
2 3 4 5 6 7 8 9 10 11 12 13 14 15 16 17 18 19 20 21 22
2018 0 0 1 1 0 3 2 4 2 2 2 3 2 7 2 3 3 1 4 1 2
0
2
4
6
8
Nº
Cas
os
Semanas Epidemiológicas
DISTRIBUCION SEMANAL DE INFLUENZA Y OTROS VIRUS RESPIRATORIOS
AÑO 2018(Hasta S.E. Nº 23)
Fuente: Direcc.Reg.Salud Piura/OEPI/Sist.Vig.Inmuno

Dirección Regional de Salud Piura
Fuente: DIRESA PIURA/OEPI (*) Avande SE N° 24
Influenza y otros Virus RespiratoriosDepartamento de Piura, 2016 - 2018 *
-1500.00 -1000.00 -500.00 0.00 500.00 1000.00 1500.00 2000.00
0 a 4
5 a 9
10 a 14
15 a 19
20 a 24
25 a 29
30 a 34
35 a 39
40 a 44
45 a 49
50 a 54
55 a 59
60 a 64
65 a 69
70 a 74
75 a 79
80 a +
(%) PORCENTAJE
GR
UP
OS
Q
UIN
QU
EN
AL
ES
PIRAMIDE POBLACIONAL DE INFLUENZA Y OTROS VIRUS RESPIRATORIOS
AÑOS 2016 - 2018 (Hasta S.E. Nº 23)
Fuente: Direcc.Reg.Salud Piura/OEPI/Sist.Vig.Inmuno
0
3
6
9
12
15
18
0-4 a 5-19 a 20-39 a 40-64 a 65-80 a 80 a +
Nº
C A
S O
S
REGION DE SALUD PIURA: DISTRIBUCION POR EDAD Y SEXO
Hombre
Mujer
AÑO 2018 (Hasta SE.Nº 23)
Fuente: Direcc.Reg.Salud Piura/OEPI/Sist.Vig.Inmuno
MASCULINO
44%FEMENINO
56%
REGION DE SALUD PIURA : DISTRIBUCION POR SEXO
AÑOS 2016 - 2018 (Hasta S.E. Nº 23)
Fuente: Direcc.Reg.Salud Piura/OEPI/Sist.Vig.Inmuno

Dirección Regional de Salud Piura
Fuente: DIRESA PIURA/OEPI (*) Avande SE N° 24
0
10
20
30
40
50
60
70
80
1 4 7 10 13 16 19 22 25 28 31 34 37 40 43 46 49 52 3 6 9 12 15 18 21 24 27 30 33 36 39 42 45 48 51 2 5 8 11 14 17 20 23 26 29 32 35 38 41 44 47 50
Nº
Caso
s
Semanas Epidemiológicas
REGION DE SALUD PIURA : CURVA HISTORICA DE INFLUENZA Y OTROS VIRUS RESPIRATORIOS
2016 2017 2018
AÑOS - 2016 - 2018 (Hasta S.E. Nº 23)
Fuente: Direcc.Reg.Salud Piura/DEIS/Sist.Vig.Inmuno
Influenza y otros Virus RespiratoriosDepartamento de Piura, 2016 - 2018 *

Dirección Regional de Salud Piura
Fuente: DIRESA PIURA/OEPI (*) Avande SE N° 24
Influenza y Otros Virus RespiratoriosDepartamento de Piura, 2016 - 2018 *
H1N1 pdm.
09 H3N2 IFU A
PIURA 38 20 2 1 10 0 33 87 0
CASTILLA 19 6 0 0 3 0 9 47 0
CHULUCANAS 4 2 0 0 0 0 2 50 0
TAMBO GRANDE 1 1 0 0 0 0 1 100 0
26 DE OCTUBRE 1 1 0 0 0 0 1 100 0
SECHURA 1 0 0 0 0 0 0 0 0
LALAQUIZ 1 0 0 0 0 0 0 0 0
IGNACIO ESCUDERO 1 0 0 0 0 0 0 0 0
T O T A L 66 30 2 1 13 0 46 70 0
DISTRIBUCION DE INFLUENZA Y OTROS VIRUS RESPIRATORIOS POR DISTRITOS
INFLUENZA A
Influenza B Fallecidos
AÑO 2018(Hasta S.E. Nº 23)
%
Positividad
Nº
NotificadosAdenovirus
Total
Positivos
FLU
DISTRITOS
H1N1 pdm.
09 H3N2 IFUA A
E.S I-4 CASTILLA 18 4 1 0 2 0 7 39 0 0
E.S I-4 PACHITEA 37 24 1 1 11 0 37 100 0 0
E.S II-1 CHULUCANAS 5 2 0 0 0 0 2 40 2 0
E.S II-1 SANTA ROSA 5 0 0 0 0 0 0 0 1 0
HOSPITAL III JOSE CAYETANO HEREDIA 1 0 0 0 0 0 0 0 1 1
TOTAL GENERAL 66 30 2 1 13 0 46 70 3 0
DISTRIBUCION DE INFLUENZA Y OTROS VIRUS RESPIRATORIOS POR ESTABLECIMIENTOS NOTIFICANTES
AÑO 2018(Hasta S.E. Nº 23)
Influenza B Adenovirus Fallecidos%
Positividad
ESTABLECIMIENTO
NOTIFICANTE
No se tomó
muestra
Nº
Notificados
INFLUENZA A Total
Positivos
FLU

Dirección Regional de Salud Piura
Fuente: DIRESA PIURA/OEPI (*) Avande SE N° 24
Enfermedades Diarreicas Agudas (EDAS)Departamento de Piura, 2017 - 2018 *
REGION SALUD DE PIURA : FACTOR DE RIESGO EDAS
SE-23 Acumulado TIA X 10000 SE-23 Acumulado TIA X 10000 SE-23 Acumulado TIA X 10000 SE-23 Acumulado TIA X 10000
EDA's Acuosa 1079 26207 143.2 919 29982 162.6 1206 37837 203.6 953 27961 150.4
EDA's Acuosa < 5 a 530 13601 719.8 496 13724 745.0 536 14981 786.0 387 11003 577.3
EDA Disenterica 24 576 3.1 8 317 1.7 30 461 2.5 13 196 1.05
HOSPITALIZACIONES % % % %
EDA Acuosa 6 102 0 11 210 1 6 172 0 4 192 1
EDA Disentérica 1 4 1 0 0 0 0 0 0 0 0 0
DEFUNCIONES SE-23 AcumuladoT.M X
100000SE-23 Acumulado
T.M X
100000SE-23 Acumulado
T.M X
100000SE-23 Acumulado
T.M X
100000
EDA Acuosa 0 3 0.16 0 0 0.00 0 0 0.00 0 0 0.00
DAA_< 5 AÑOS 0 0 0.00 0 0 0.00 0 0 0.00 0 0 0.00
EDA Disentérica 0 0 0.00 0 0 0.00 0 0 0.00 0 0 0.00
RESUMEN: EDA
ACUOSA-EDA
DISENTERICA
AÑO 2015 AÑO 2016 AÑO 2017 AÑO 2018

Dirección Regional de Salud Piura
Fuente: DIRESA PIURA/OEPI (*) Avande SE N° 24
Enfermedades Diarreicas Agudas (EDAS)Departamento de Piura, 2017 - 2018 *
La diarrea aguda suele durar menos de 7días y no más de 14 días. En los primerosmeses de la vida, un cambio en laconsistencia de las heces es más indicativode diarrea que el número dedeposiciones.
Las EDA clasificada como diarrea agudaacuosa, se define por presentar aumento enfrecuencia (3 o más veces en 24 horas),fluidez y/o volumen de las deposiciones encomparación a lo habitual, con pérdidavariable de agua y electrolitos y cuyaduración es menor de 14 días.
REGION DE SALUD PIURA : DIARREA ACUOSA CANAL ENDEMICOHasta S.E. Nº 23 . METODO: MEDIANA GEOMETRICA
0
500
1000
1500
2000
2500
1 3 5 7 9 11 13 15 17 19 21 23 25 27 29 31 33 35 37 39 41 43 45 47 49 51
N°
de
Ep
iso
dio
s d
e E
DA
s
Semanas epidemiologicas
Zona Seguridad
Zona Epidemia
Z o n a É x i t o
Zona Alarma
REGION DE SALUD PIURA : EPISODIOS DE EDAS
AÑOS 2017 - 2018 (Hasta S.E. Nº 23)
0
500
1000
1500
2000
2500
1 4 7 10
13
17
19
22
25
28
31
34
37
40
43
46
49
52
+ 5 AÑOS 1-4 AÑOS <1 AÑO AÑO 2017
SEMANAS EPIDEMIOLOGICAS

Dirección Regional de Salud Piura
Fuente: DIRESA PIURA/OEPI (*) Avande SE N° 24
Enfermedades Diarreicas Agudas (EDAS)Departamento de Piura, 2016 - 2018 *
FACTOR DE RIESGO DE DIARREA AGUDA ACUOSA
REGION DE SALUD PIURA : DIARREA ACUOSA CURVA HISTORICA
AÑOS 2016 - 2018 (Hasta S.E. Nº 23)
AÑO 2016(ACUM.SE.23=29063 CASOS)AÑO 2017(ACUM.SE.23=36631 CASOS)AÑO 2018(ACUM.SE.23=27961 CASOS)
0
500
1000
1500
2000
2500
1 8 15 22 29 36 43 50 5 12 19 26 33 40 47 2 9 16 23 30 37 44 51
Nº
Ca
so
s
Semanas Epidemiológicas
2016 2017 2018

Dirección Regional de Salud Piura
Fuente: DIRESA PIURA/OEPI (*) Avande SE N° 24
Enfermedades Diarreicas Agudas (EDAS)Departamento de Piura, 2017 - 2018 *
982
788
135
828
547
99
0
200
400
600
800
1000
1200
< 1 año 1-4 años > 5 años
T I x 10,000 Hab.
Grupo de Edad
2017 2018
AÑOS 2017 - 2018 (Hasta S.E. Nº 23)
TASA DE INCIDENCIA DE EDA POR GRUPO ETAREO
Hospitalizados
192
1%
No
Hospitalizados
27769
99%
REGION SALUD PIURA: CASOS HOSPITALIZADOS POR EDA
AÑO 2018 (Hasta S.E. Nº 23) REGION DE SALUD PIURA
Fuente: Direcc.Reg.Salud-Piura/DEIS/Sist.Vig.EDA's
Hosp. < 5 A
5629%
Hosp. > 5 A
13671%
Dirección Regional de Salud Piura
Fuente: DIRESA PIURA/OEPI (*) Avande SE N° 24
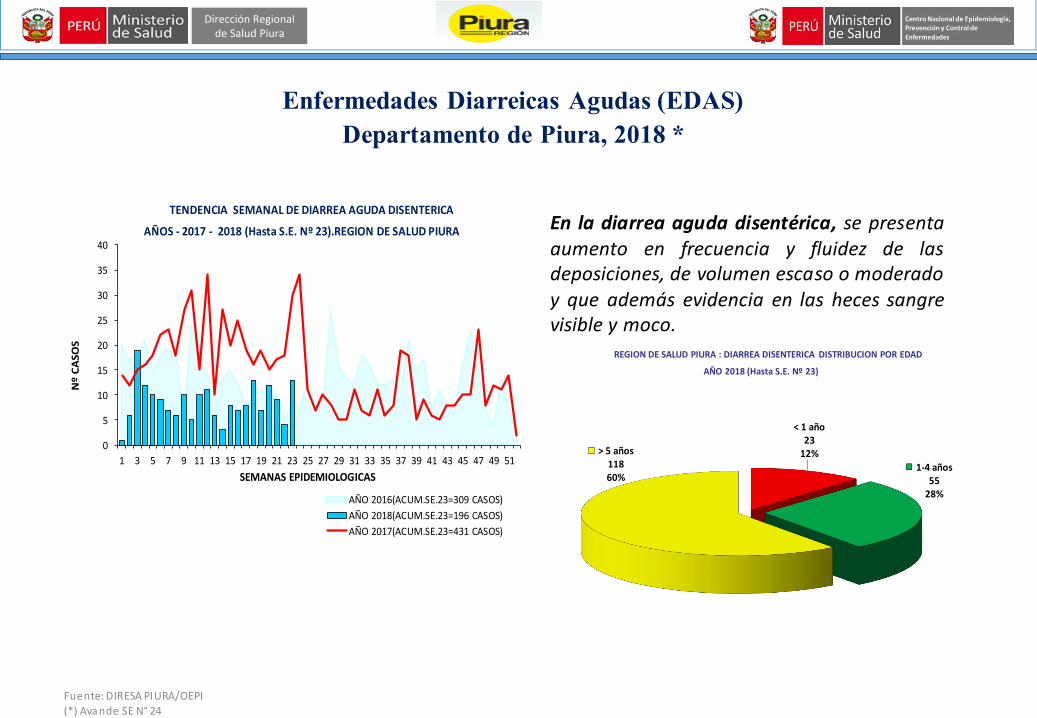
Enfermedades Diarreicas Agudas (EDAS)Departamento de Piura, 2018 *
En la diarrea aguda disentérica, se presentaaumento en frecuencia y fluidez de lasdeposiciones, de volumen escaso o moderadoy que además evidencia en las heces sangrevisible y moco.
0
5
10
15
20
25
30
35
40
1 3 5 7 9 11 13 15 17 19 21 23 25 27 29 31 33 35 37 39 41 43 45 47 49 51
Nº
CA
SO
S
SEMANAS EPIDEMIOLOGICAS
TENDENCIA SEMANAL DE DIARREA AGUDA DISENTERICA
AÑO 2016(ACUM.SE.23=309 CASOS)
AÑO 2018(ACUM.SE.23=196 CASOS)
AÑO 2017(ACUM.SE.23=431 CASOS)
AÑOS - 2017 - 2018 (Hasta S.E. Nº 23).REGION DE SALUD PIURA
Fuente: Direcc.Reg.Salud-Piura/DEIS/Sist.Vig.EDA's
< 1 año23
12%
1-4 años55
28%
> 5 años11860%
REGION DE SALUD PIURA : DIARREA DISENTERICA DISTRIBUCION POR EDAD
AÑO 2018 (Hasta S.E. Nº 23)

Dirección Regional de Salud Piura
Fuente: DIRESA PIURA/OEPI (*) Avande SE N° 24
Enfermedades Diarreicas Agudas (EDAS)Departamento de Piura, 2018 *
37837
461
27961
1960
5000
10000
15000
20000
25000
30000
35000
40000
EDA Acuosa EDA Disentérica
Nº
CA
SO
S
2017 2018
AÑOS - 2017 - 2018 (Hasta S.E. Nº 23).REGION DE SALUD PIURA
CLASIFICACION POR TIPO CLINICO DE ENFERMEDAD DIARREICA
12 13 11 13 16 19 2026
31
45
61
49
64
45
95
82
143
0
20
40
60
80
100
120
140
160
0
5000
10000
15000
20000
25000
30000
35000
40000
45000
20
02
20
03
20
04
20
05
20
06
20
07
20
08
20
09
20
10
20
11
20
12
20
13
20
14
20
15
20
16
20
17
20
18
Ra
zó
n
Nº
CA
SO
S
Años
EDA Acuosa EDA Disentérica RAZON
AÑOS 2002 - 2018 (Hasta S.E. Nº 23).REGION DE SALUD PIURA
CASOS DE EDA POR TIPO Y RAZON DE EDA/DISENTERICA

Dirección Regional de Salud Piura
Fuente: DIRESA PIURA/OEPI (*) Avande SE N° 24
Enfermedades Diarreicas Agudas (EDAS)Departamento de Piura, 2018 *
FACTOR DE RIESGO DE DIARREA AGUDA DISENTERICA
REGION DE SALUD PIURA : DIARREA DISENTERICA CURVA HISTORICA
AÑOS 2016 - 2018 (Hasta S.E. Nº 23)
AÑO 2016(ACUM.SE.23=309 CASOS)AÑO 2017(ACUM.SE.23=431 CASOS)AÑO 2018(ACUM.SE.23=196 CASOS)
0
5
10
15
20
25
30
35
40
1 8 15 22 29 36 43 50 5 12 19 26 33 40 47 2 9 16 23 30 37 44 51
Nº
Ca
so
s
Semanas Epidemiológicas
2016 2017 2018

Dirección Regional de Salud Piura
Fuente: DIRESA PIURA/OEPI (*) Avande SE N° 24
Infecciones Respiratorias Agudas (IRAS)Departamento de Piura, 2013 - 2018 *
2013 2014 2015 2016 2017 2018
Total 64943 60616 61964 67432 62748 60759
IA 3467 3208 3364 3538 3460 3326
0
500
1000
1500
2000
2500
3000
3500
4000
0
10000
20000
30000
40000
50000
60000
70000
80000
Tasa
In
cid
en
cia
x 1
0 0
00
< 5
añ
os
Ep
iso
dio
s p
or
IRA
s
AÑOS 2016 - 2018 (Hasta S.E. Nº 23)
REGION DE SALUD PIURA : EPISODIOS E INCIDENCIAS ACUMULADAS DE IRA (no neumonia) EN MENORES DE 5 AÑOS
Fuente: Direc. Reg. Salud Piura/OEPI/Sist.Vig.IRA's
Hasta S.E. Nº 23 . METODO: MEDIANA GEOMETRICA
REGION DE SALUD PIURA : IRA (no neumonia) CANAL ENDEMICO
0
1000
2000
3000
4000
5000
6000
1 3 5 7 9 11 13 15 17 19 21 23 25 27 29 31 33 35 37 39 41 43 45 47 49 51
N°
de
Ep
iso
dio
s
de
IR
As
Semanas epidemiológicas
Zona Seguridad
Zona Epidemia
Zona Éxito
Zona Alarma
Fuente: Direc. Reg. Salud Piura/OEPI/Sist.Vig.IRA's

Dirección Regional de Salud Piura
Fuente: DIRESA PIURA/OEPI (*) Avande SE N° 24
Infecciones Respiratorias Agudas (IRAS)Departamento de Piura, 2018 *
SE-23 Acum TIA X
10000SE-23 Acum TIA X
10000SE-23 Acum TIA X
10000SE-23 Acum TIA X
10000
IRA's (no neumonias) 3589 61964 3364 3336 67432 3538 3295 62705 3458 4247 60759 3326
NEUMONIAS (no graves)
<5 años14 577 31 32 453 24 21 431 24 36 344 19
NEUMONIAS (no graves)
5 a 60 a + 21 17 0.1 53 1014 6.1 76 1604 9.5 106 1538 9
NG + EMG_Casos < 5 a 13 270 15 5 173 9 9 282 16 28 142 8
NG+EMG_Hosp. < 5 a 12 244 90.4% 5 151 1 7 272 96.5% 11 131 92.3%
SOB ASMA 66 1251 68 53 793 42 47 1103 61 82 927 51
DEFUNCIONES SE-23 AcumT.Mx
10000SE-23 Acum
T.Mx
10000SE-23 Acum
T.Mx
10000SE-23 Acum
T.Mx
10000
Def. Intra- Hosp. 0 6 0.34 0 32 1.78 0 31 1.71 0 24 1.27
Def. Extra- Hosp. 0 0 0.00 0 1 0.06 0 0 0.00 0 2 0.11
RESUMEN
AÑO 2018AÑO 2015 AÑO 2016 AÑO 2017
FACTOR DE RIESGO IRAS
Dirección Regional de Salud Piura
Fuente: DIRESA PIURA/OEPI (*) Avande SE N° 24
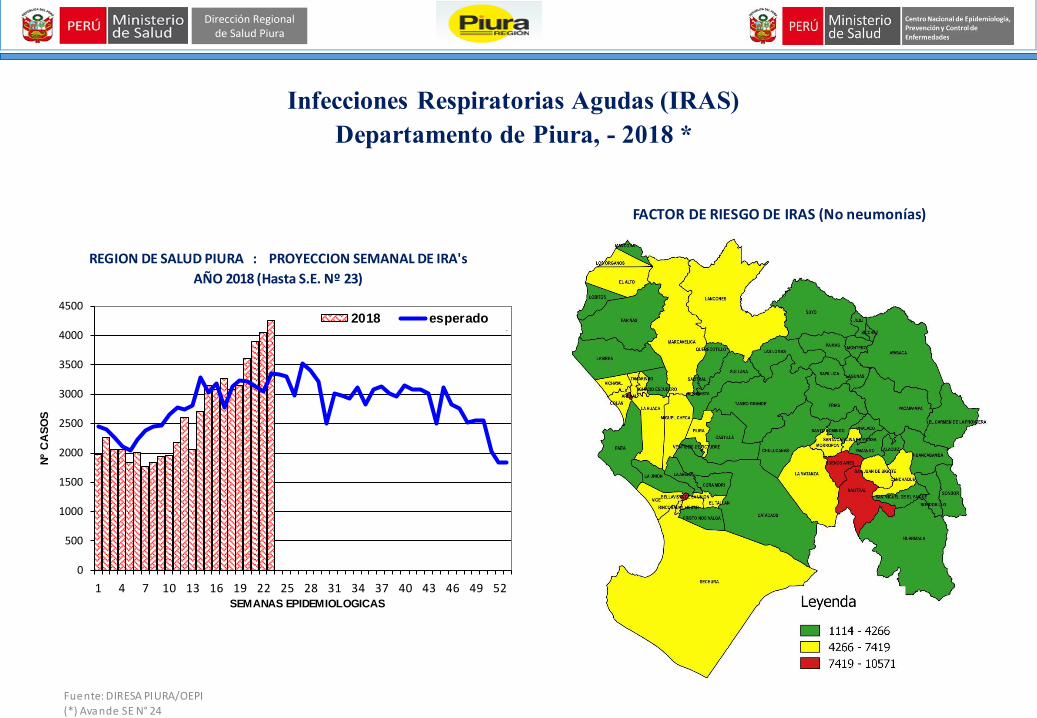
Infecciones Respiratorias Agudas (IRAS)Departamento de Piura, - 2018 *
FACTOR DE RIESGO DE IRAS (No neumonías)
REGION DE SALUD PIURA : PROYECCION SEMANAL DE IRA's
AÑO 2018 (Hasta S.E. Nº 23)
0
500
1000
1500
2000
2500
3000
3500
4000
4500
1 4 7 10 13 16 19 22 25 28 31 34 37 40 43 46 49 52
Nº
CA
SO
S
SEMANAS EPIDEMIOLOGICAS
2018 esperado

Dirección Regional de Salud Piura
Fuente: DIRESA PIURA/OEPI (*) Avande SE N° 24
Infecciones Respiratorias Agudas (IRAS)Departamento de Piura, - 2018 *
< 2 meses23374% 2 - 11 meses
1626727%
1 - 4 años4215569%
REGION DE SALUD PIURA : DISTRIBUCION POR EDAD DE IRA's (No Neumonias)
AÑO 2018 (Hasta S.E. Nº 23)
REGION DE SALUD PIURA : COMPORTAMIENTO SEMANAL DE IRA's
AÑOS 2017 - 20018 (Hasta S.E. Nº 23)
0
500
1000
1500
2000
2500
3000
3500
4000
4500
1 4 7 10 13 16 19 22 25 28 31 34 37 40 43 46 49 52
Nº
CA
SO
S
SEMANAS EPIDEMIOLOGICAS
1 - 4 AÑOS 2 - 11 M <2 M AÑO 2017
Fuente: Direc.Reg.Salud Piura/OEPI/Sist.Vig.IRA's

Dirección Regional de Salud Piura
Fuente: DIRESA PIURA/OEPI (*) Avande SE N° 24
Infecciones Respiratorias Agudas (IRAS)Departamento de Piura, - 2018 *
REGION DE SALUD PIURA: FACTOR DE RIESGO DE NEUMONIA < 5 años
REGION DE SALUD PIURA: NEUMONIA (no grave) CURVA HISTORICA
AÑOS 2016 - 2018. Hasta S.E. Nº 23
AÑO 2016(ACUM.SE.23=453 CASOS)
AÑO 2017(ACUM.SE.23=431 CASOS)
AÑO 2018(ACUM.SE.23=344 CASOS)
0
5
10
15
20
25
30
35
40
45
1 6 11 16 21 26 31 36 41 46 51 4 9 14 19 24 29 34 39 44 49 2 7 12 17 22 27 32 37 42 47 52
Nº
Ca
so
s
Semanas Epidemiologicas
2016 2017 2018

Dirección Regional de Salud Piura
Fuente: DIRESA PIURA/OEPI (*) Avande SE N° 24
Infecciones Respiratorias Agudas (IRAS)Departamento de Piura, - 2018 *
REGION DE SALUD PIURA: FACTOR DE RIESGO DE NEU_GVE
0
5
10
15
20
25
30
35
40
45
1 5 8 11 14 17 20 23 26 29 32 35 38 41 44 47 50
Nº
CASO
S
SEMANAS EPIDEMIOLOGICAS
AÑO 2016(ACUM.SE.23=453 CASOS)
AÑO 2018(ACUM.SE.23=344 CASOS)
AÑO 2017(ACUM.SE.23=431 CASOS)
TENDENCIA SEMANAL NEUMONIA (no grave) < 5 AÑOS
AÑOS 2016 - 2018 (Hasta S.E. Nº 23)

Dirección Regional de Salud Piura
Fuente: DIRESA PIURA/OEPI (*) Avande SE N° 24
Infecciones Respiratorias Agudas (IRAS)Departamento de Piura, 2013 - 2018 *
DEFUNCIONES POR NEUMONIA
GRUPO DE EDADAcumulado
Hasta SE Nº 23Nº DIH Nº DEH
2 m 1 1 0
2-11M 0 0 0
1-4 A 0 0 0
5 - 9 AÑOS 0 0 0
10-19 AÑOS 0 0 0
20-59 AÑOS 4 4 0
60 A + 20 19 1
T O T A L 25 24 1
2006 2007 2008 2009 2010 2011 2012 2013 2014 2015 2016 2017 2018
NG+EMG_CASOS 512 449 412 388 493 443 461 302 261 270 173 282 142
DEF-INTRA-MURAL 7 4 4 0 0 1 0 11 14 6 32 31 24
NG+EMG_HOSP 497 419 372 367 416 396 412 236 229 244 151 272 131
0
5
10
15
20
25
30
35
0
100
200
300
400
500
600
NG
+E
MG
_H
OS
P.
NEUMONIA GRAVE_HOSPITALIZADAS Y DEFUNCION INTRAMURAL
DE
F_
INT
RA
_M
UR
AL
AÑO 2018 (Hasta S.E. Nº 23). REGION DE SALUD PIURA
DE
F_
INT
RA
_M
UR
AL
Fuente: Direc. Reg. Salud Piura/OEPI/Sist.Vig.IRA's
INDICADOR DE SEVERIDAD : (Nº HOSPITALIZACIONES/ NUMERO DE NEUMONIA GRAVE)
AÑO 2018 (Hasta S.E. Nº 23). REGION DE SALUD PIURA
E_SALUD NOTIFICANTE NGR_M2 HOS_M2SEVERIDAD
PorcentajeNGR_2_11 HOS_2_11
SEVERIDAD
Porcentaje NGR_1_4A HOS_1_4A
SEVERIDAD
Porcentaje
C.S. AYABACA 0 0 0 0 0 0 1 0 0
E.S I-1 CHOCO 1 0 0 0 0 0 1 0 0
E.S I-1 JUZGARA 0 0 0 0 0 0 1 0 0
E.S I-4 SALITRAL 0 0 0 1 0 0 0 0 0
E.S II-1 CHULUCANAS 0 0 0 1 1 100 0 0 0
E.S II-1 CHULUCANAS 1 0 0 0 0 0 3 3 100
HOSPITAL LAS MERCEDES-PAITA 1 0 0 6 4 67 3 1 33
P.S. COMUNIDAD SALUDABLE 2 0 0 3 0 0 14 0 0

Dirección Regional de Salud Piura
Fuente: DIRESA PIURA/OEPI (*) Avande SE N° 24
Infecciones Respiratorias Agudas (IRAS)Departamento de Piura, 2018 *
FACTOR DE RIESGO DE SOB_ASMACOMPORTAMIENTO SEMANAL DE SOB-ASMA
AÑO 2018 (Hasta S.E. Nº 23)
0
20
40
60
80
100
120
1 4 7 10 13 17 19 22 25 28 31 34 37 40 43 46 49 52
Nº
CA
SO
S
SEMANAS EPIDEMIOLOGICAS
2 - 4 AÑOS <2 AÑOS AÑO 2015
Fuente: Direcc.Reg.Salud Piura/DEIS/Sist.Vig.IRA's