Presentación de PowerPoint - Andemostoyota fortuner 5.321 2.013 hyundai i 10 gl 5.080 2.013...
13
Sector Automotor Asociación Colombiana de Vehículos Automotores www.andemos.org Informe Traspasos Noviembre Colombia, 2018
Transcript of Presentación de PowerPoint - Andemostoyota fortuner 5.321 2.013 hyundai i 10 gl 5.080 2.013...

Sector Automotor
Asociación Colombiana de Vehículos Automotoreswww.andemos.org
Informe Traspasos NoviembreColombia, 2018

TRASPASOS
Asociación Colombiana de Vehículos Automotoreswww.andemos.org
Fuente: RUNT, Cálculos ANDEMOSInforme Completo: www.andemos.org
RESUMEN SECTOR 2018Numero de Unidades
ACUMULADO
Noviembre
223.550
301.520
502.937
733.980
26.290
26.979
45.446
70.638
Vehiculos Nuevos
Motos Usadas
Motos Nuevas
Vehiculos Usados
Asociación Colombiana de Vehículos Automotoreswww.andemos.org
Fuente: RUNT, Cálculos ANDEMOSInforme Completo: www.andemos.org
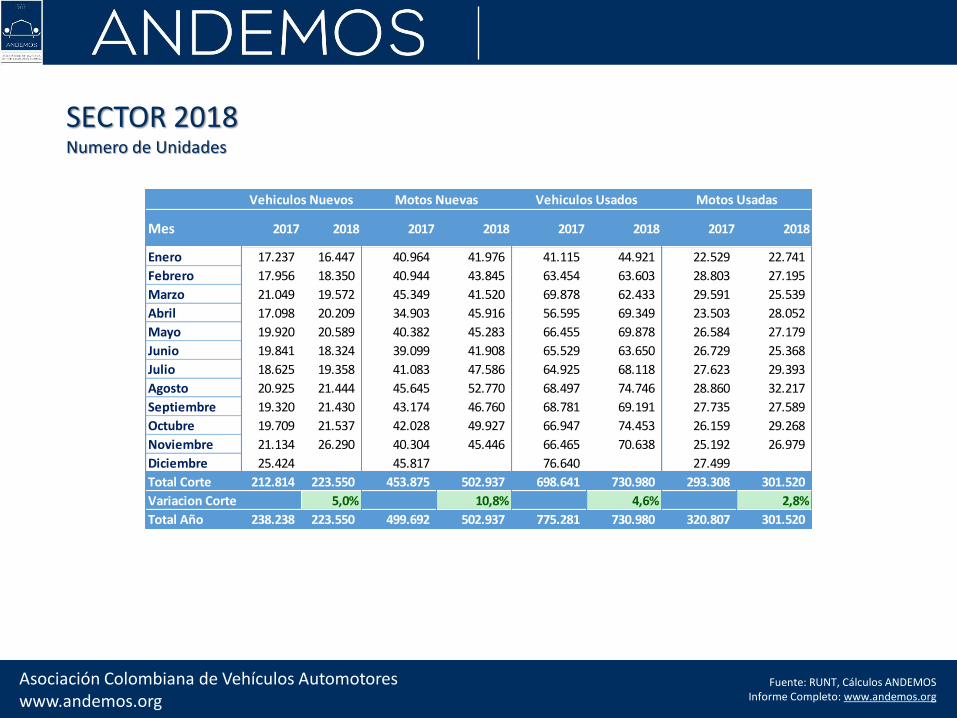
SECTOR 2018Numero de Unidades
Mes 2017 2018 2017 2018 2017 2018 2017 2018
Enero 17.237 16.447 40.964 41.976 41.115 44.921 22.529 22.741
Febrero 17.956 18.350 40.944 43.845 63.454 63.603 28.803 27.195
Marzo 21.049 19.572 45.349 41.520 69.878 62.433 29.591 25.539
Abril 17.098 20.209 34.903 45.916 56.595 69.349 23.503 28.052
Mayo 19.920 20.589 40.382 45.283 66.455 69.878 26.584 27.179
Junio 19.841 18.324 39.099 41.908 65.529 63.650 26.729 25.368
Julio 18.625 19.358 41.083 47.586 64.925 68.118 27.623 29.393
Agosto 20.925 21.444 45.645 52.770 68.497 74.746 28.860 32.217
Septiembre 19.320 21.430 43.174 46.760 68.781 69.191 27.735 27.589
Octubre 19.709 21.537 42.028 49.927 66.947 74.453 26.159 29.268
Noviembre 21.134 26.290 40.304 45.446 66.465 70.638 25.192 26.979
Diciembre 25.424 45.817 76.640 27.499
Total Corte 212.814 223.550 453.875 502.937 698.641 730.980 293.308 301.520
Variacion Corte 5,0% 10,8% 4,6% 2,8%
Total Año 238.238 223.550 499.692 502.937 775.281 730.980 320.807 301.520
Motos NuevasVehiculos Nuevos Vehiculos Usados Motos Usadas

41.1
15
63.4
54
69.8
78
56.5
95
66.4
55
65.5
29
64
.92
5
68.4
97
68.7
81
66.9
47
66.4
65
76
.64
0
44.9
21
63.6
03
62.4
33
69.3
49
69.8
78
63.6
50
68.1
18
74.7
46
69.1
91
74.4
53
70.6
38
-
TRASPASOS
Asociación Colombiana de Vehículos Automotoreswww.andemos.org
Fuente: RUNT, Cálculos ANDEMOSInforme Completo: www.andemos.org
2017 2018
EVOLUCION TRASPASOS
Vehículos Usados
22.5
29
28.8
03
29.5
91
23.5
03
26.5
84
26.7
29
27.6
23
28
.86
0
27.7
35
26.1
59
25.1
92
27.4
99
22.7
41
27
.19
5
25.5
39
28.0
52
27.1
79
25.3
68
29.3
93
32.2
17
27.5
89
29.2
68
26.9
79
-
Motos Usadas

TRASPASOS
Asociación Colombiana de Vehículos Automotoreswww.andemos.org
Fuente: RUNT, Cálculos ANDEMOSInforme Completo: www.andemos.org
VEHICULOS Nuevos VEHICULOS Usados
Relación TRASPASOS vs NUEVOS
1,8 1,6 1,6 1,6 1,7 1,7 1,6 1,6 1,7 1,7 1,7
16
.44
7
18
.35
0
19
.57
2
20
.20
9
20
.58
9
18
.32
4
19
.35
8
21
.44
4
21
.43
0
21
.53
7
26
.29
0
44
.92
1
66
.60
3
62
.43
3
69
.34
9
69
.87
8
63
.65
0
68
.11
8
74
.74
6
69
.19
1
74
.45
3
70
.63
8
22
.74
1
27
.19
5
25
.53
9
28
.05
2
27
.17
9
25
.36
8
29
.39
3
32
.21
7
27
.58
9
29
.26
8
26
.97
9
41
.97
6
43
.84
5
41
.52
0
45
.91
6
45
.28
3
41
.90
8
47
.58
6
52
.77
0
46
.76
0
49
.92
7
45
.44
6
MOTOS Nuevas MOTOS Usadas
2,4 3,6 3,2 3,4 3,4 3,5 3,5 3,5 3,2 3,5 2,7

Automovil Utilitario ComercialCarga <10,5T
Pick Up Taxi ComercialPasajeros
Van ComercialCarga >10,5T
115.490
71.267
9.450 13.184 7.890 2.650 1.569 2.050
432.926
141.535
45.515 44.474 27.547
15.485 5.633 17.869
TRASPASOS
Asociación Colombiana de Vehículos Automotoreswww.andemos.org
Fuente: RUNT, Cálculos ANDEMOSInforme Completo: www.andemos.org
Vehículos Nuevos Vehículos Usados
SEGMENTOS: Relación Traspasos v.s NuevosAcumulado
3,7 2,0 4,8 3,4 3,5 5,8 3,6 11,9

TRASPASOS
Asociación Colombiana de Vehículos Automotoreswww.andemos.org
Fuente: RUNT, Cálculos ANDEMOSInforme Completo: www.andemos.org
Traspasos por Línea Y Promedio año
Traspasos y Año Modelo
MARCA LINEATraspasos
Realizados
Promedio año Modelo mas
Traspasado
CHEVROLET SPARK 37.177 2.013
CHEVROLET AVEO 19.594 2.009
CHEVROLET SAIL 14.564 2.015
CHEVROLET AVEO EMOTION 10.115 2.011
FORD FIESTA 9.419 2.014
CHEVROLET OPTRA 8.841 2.008
TOYOTA HILUX 8.884 2.009
KIA NEW SPORTAGE LX 7.688 2.013
CHEVROLET SPRINT 7.288 1.995
MAZDA 2 7.564 2.014
CHEVROLET LUV D MAX 6.967 2.009
HYUNDAI ATOS PRIME GL 6.848 2.009
CHEVROLET SWIFT 5.941 1.995
SUZUKI SWIFT 945 1.995
CHEVROLET CAPTIVA SPORT 6.789 2.012
RENAULT TWINGO AUTHENTIQUE 6.514 2.007
CHEVROLET TRACKER 6.829 2.015
MAZDA 3 6.828 2.014
KIA PICANTO EX 6.498 2.013
RENAULT LOGAN FAMILIER 5.891 2.013
RENAULT STEPWAY 5.828 2.013
KIA RIO UB EX 5.739 2.015
CHEVROLET NPR 5.253 2.007
TOYOTA PRADO 5.545 2.013
TOYOTA FORTUNER 5.321 2.013
HYUNDAI i 10 GL 5.080 2.013
CHEVROLET GRAND VITARA 3.122 2.006
SUZUKI GRAND VITARA 3.122 2.006
NISSAN MARCH 5.008 2.015
OTROS 495.782
Total general 730.984

TRASPASOS
Asociación Colombiana de Vehículos Automotoreswww.andemos.org
Fuente: RUNT, Cálculos ANDEMOSInforme Completo: www.andemos.org
Traspasos Vehículos Por Marca
MARCA Ene Feb Mar Abr May Jun Jul Ago Sep Oct Nov TotalMARKET
SHARE
CHEVROLET 14.320 19.939 19.405 21.699 21.666 19.789 21.080 23.082 21.096 22.524 21.284 225.884 30,9%
RENAULT 7.273 10.173 9.793 10.925 10.670 10.068 10.827 11.920 10.580 11.598 11.003 114.830 15,7%
MAZDA 3.454 4.967 4.830 5.397 5.463 5.137 5.459 5.751 5.383 5.929 5.502 57.272 7,8%
KIA 2.904 3.840 3.817 4.053 4.146 3.774 3.959 4.545 4.324 4.571 4.355 44.288 6,1%
HYUNDAI 2.870 3.825 3.729 4.223 4.150 3.647 4.047 4.409 4.033 4.284 4.102 43.319 5,9%
TOYOTA 2.086 3.158 3.234 3.605 3.700 3.221 3.485 3.881 3.654 4.015 3.953 37.992 5,2%
NISSAN 2.121 3.071 2.948 3.424 3.415 2.997 3.357 3.616 3.388 3.682 3.677 35.696 4,9%
FORD 1.891 2.751 2.880 3.094 3.160 2.835 3.022 3.361 3.291 3.463 3.170 32.918 4,5%
VOLKSWAGEN 1.181 1.759 1.698 1.787 1.882 1.858 1.967 2.161 2.033 2.123 1.990 20.439 2,8%
MITSUBISHI 665 1.071 1.042 1.204 1.204 1.075 1.178 1.337 1.264 1.276 1.232 12.548 1,7%
SUZUKI 465 717 669 729 794 690 695 858 760 824 757 7.958 1,1%
MERCEDES BENZ 373 521 604 572 661 634 608 669 793 778 725 6.938 0,9%
DODGE 389 548 533 628 703 566 589 672 621 640 621 6.510 0,9%
BMW 301 495 520 549 616 517 520 637 616 631 611 6.013 0,8%
INTERNATIONAL 371 466 533 494 559 423 500 530 502 555 622 5.555 0,8%
HONDA 274 464 418 428 489 402 457 527 478 511 475 4.923 0,7%
KENWORTH 313 397 350 460 467 393 432 519 426 516 473 4.746 0,6%
DAEWOO 266 380 375 416 463 388 439 460 419 482 403 4.491 0,6%
PEUGEOT 206 343 313 353 396 351 386 442 411 417 398 4.016 0,5%
DAIHATSU 259 393 310 367 380 325 357 441 378 411 373 3.994 0,5%
OTRAS 2.939 4.325 4.432 4.942 4.894 4.564 4.754 4.928 4.741 5.223 4.912 50.654 6,9%
Total general 44.921 63.603 62.433 69.349 69.878 63.654 68.118 74.746 69.191 74.453 70.638 730.984 100

TRASPASOS
Asociación Colombiana de Vehículos Automotoreswww.andemos.org
Fuente: RUNT, Cálculos ANDEMOSInforme Completo: www.andemos.org
Por Línea
LINEA Ene Feb Mar Abr May Jun Jul Ago Sep Oct Nov TotalMARKET
SHARE
SPARK 2.395 3.434 3.250 3.486 3.458 3.231 3.473 3.846 3.419 3.717 3.468 37.177 5,1%
AVEO 1.254 1.720 1.695 1.958 1.869 1.667 1.879 1.966 1.806 1.923 1.857 19.594 2,7%
SAIL 904 1.230 1.190 1.320 1.457 1.334 1.365 1.585 1.395 1.466 1.318 14.564 2,0%
AVEO EMOTION 612 881 873 945 1.001 907 965 1.022 942 1.037 930 10.115 1,4%
FIESTA 564 826 826 863 902 809 848 939 903 1.016 923 9.419 1,3%
HILUX 490 726 749 868 906 776 763 909 883 891 924 8.885 1,2%
OPTRA 551 753 805 864 833 730 831 950 819 871 834 8.841 1,2%
NEW SPORTAGE LX 492 684 660 728 684 654 715 799 726 783 763 7.688 1,1%
2 467 630 617 682 699 654 725 804 757 790 739 7.564 1,0%
SPRINT 443 662 631 747 715 650 684 728 682 717 629 7.288 1,0%
LUV D MAX 446 614 609 647 695 602 658 710 647 663 676 6.967 1,0%
SWIFT 429 608 576 656 663 607 631 684 665 712 655 6.886 0,9%
ATOS PRIME GL 437 594 626 656 687 564 637 650 647 684 666 6.848 0,9%
TRACKER 431 585 587 603 634 545 629 725 695 680 716 6.830 0,9%
3 429 527 566 612 639 611 608 690 699 726 721 6.828 0,9%
CAPTIVA SPORT 425 571 594 623 644 629 604 669 645 725 660 6.789 0,9%
TWINGO AUTHENTIQUE 419 600 553 628 600 599 634 699 608 578 596 6.514 0,9%
PICANTO EX 470 582 570 606 614 567 576 660 611 634 608 6.498 0,9%
LOGAN FAMILIER 363 526 502 511 573 541 603 614 517 554 587 5.891 0,8%
STEPWAY 353 521 498 534 553 515 534 583 515 613 609 5.828 0,8%
OTRAS 32.547 46.329 45.456 50.812 51.052 46.462 49.756 54.514 50.610 54.673 51.759 533.970 73,0%
Total general 44.921 63.603 62.433 69.349 69.878 63.654 68.118 74.746 69.191 74.453 70.638 730.984 100

TRASPASOS
Asociación Colombiana de Vehículos Automotoreswww.andemos.org
Fuente: RUNT, Cálculos ANDEMOSInforme Completo: www.andemos.org
Por Año Modelo
AÑO MODELO Ene Feb Mar Abr May Jun Jul Ago Sep Oct Nov TotalMARKET
SHARE
2012 3.840 5.550 5.323 5.659 5.623 5.287 5.550 6.118 5.678 6.029 5.784 60.441 8,3%
2013 3.873 5.363 5.410 5.704 5.835 5.068 5.504 6.194 5.569 6.025 5.821 60.366 8,3%
2011 3.370 4.680 4.780 5.186 5.174 4.653 4.932 5.401 5.008 5.473 5.100 53.757 7,4%
2015 3.302 4.665 4.462 4.921 5.021 4.548 4.886 5.534 5.102 5.785 5.357 53.583 7,3%
2014 3.190 4.357 4.213 4.746 4.859 4.367 4.579 5.265 4.900 5.191 4.993 50.660 6,9%
2008 2.816 3.826 3.623 3.995 4.176 3.752 4.106 4.344 4.009 4.285 4.075 43.007 5,9%
2016 2.317 3.331 3.351 3.589 3.832 3.366 3.495 3.981 3.802 3.967 3.984 39.015 5,3%
2007 2.355 3.428 3.281 3.582 3.604 3.300 3.628 3.830 3.517 3.761 3.591 37.877 5,2%
2009 2.014 2.949 2.738 3.136 3.154 2.875 2.967 3.333 3.098 3.210 3.128 32.602 4,5%
2017 1.902 2.769 2.715 2.972 3.027 2.895 3.046 3.340 3.091 3.284 3.213 32.254 4,4%
2010 2.015 2.723 2.743 3.058 2.929 2.743 2.834 3.178 2.838 3.062 2.914 31.037 4,2%
2006 1.624 2.307 2.304 2.580 2.506 2.280 2.505 2.604 2.458 2.629 2.460 26.257 3,6%
2005 1.283 1.726 1.764 1.898 1.981 1.735 1.949 2.023 1.803 1.998 1.920 20.080 2,7%
2018 854 1.277 1.480 1.760 1.761 1.495 1.573 1.897 1.994 2.022 2.066 18.179 2,5%
1998 866 1.309 1.290 1.454 1.436 1.296 1.339 1.537 1.347 1.463 1.337 14.674 2,0%
2004 793 1.193 1.172 1.348 1.288 1.351 1.223 1.337 1.262 1.338 1.304 13.609 1,9%
1997 758 1.176 1.016 1.283 1.166 1.174 1.212 1.331 1.255 1.301 1.174 12.846 1,8%
2003 780 1.150 1.075 1.232 1.182 1.138 1.224 1.326 1.187 1.300 1.180 12.774 1,7%
1995 752 1.028 960 1.187 1.154 1.028 1.158 1.175 1.164 1.193 1.105 11.904 1,6%
1996 673 981 984 1.114 1.091 993 1.084 1.179 1.093 1.152 999 11.343 1,6%
OTRAS 5.544 7.815 7.749 8.945 9.079 8.310 9.324 9.819 9.016 9.985 9.133 94.719 13,0%
Total general 44.921 63.603 62.433 69.349 69.878 63.654 68.118 74.746 69.191 74.453 70.638 730.984 100

TRASPASOS
Asociación Colombiana de Vehículos Automotoreswww.andemos.org
Fuente: RUNT, Cálculos ANDEMOSInforme Completo: www.andemos.org
Por Departamento
DEPARTAMENTO Ene Feb Mar Abr May Jun Jul Ago Sep Oct Nov TotalMARKET
SHARE
Bogota D.C. 14.889 22.660 23.690 25.123 25.965 24.173 25.250 27.730 25.926 27.701 26.759 269.866 36,9%
Antioquia 8.807 12.324 11.208 12.289 12.234 11.011 11.874 13.157 12.281 13.086 12.134 130.405 17,8%
Valle del Cauca 4.731 6.941 6.502 7.147 7.071 6.619 7.015 7.684 6.977 7.493 7.283 75.463 10,3%
Cundinamarca 3.944 5.056 5.359 5.756 5.850 5.281 5.786 6.099 5.718 6.130 5.487 60.466 8,3%
Santander 2.442 3.234 2.995 3.491 3.535 3.097 3.381 3.847 3.487 3.791 3.524 36.824 5,0%
Caldas 1.600 1.831 1.817 2.006 2.108 1.791 1.921 2.170 1.947 2.049 1.946 21.186 2,9%
Risaralda 1.369 1.564 1.545 1.789 1.744 1.558 1.733 1.793 1.671 1.804 1.747 18.317 2,5%
Atlantico 1.224 1.377 1.334 1.786 1.600 1.569 1.688 1.948 1.768 1.856 1.828 17.978 2,5%
Tolima 535 1.006 1.061 1.304 1.218 1.042 1.166 1.285 1.054 1.295 1.209 12.175 1,7%
Narino 631 982 908 1.106 1.333 978 1.123 1.221 1.152 1.297 1.121 11.852 1,6%
Boyaca 798 1.072 857 1.204 1.157 1.040 1.010 1.201 1.094 1.198 1.180 11.811 1,6%
Huila 733 984 882 1.189 1.044 917 1.032 1.154 1.066 1.146 1.089 11.236 1,5%
Quindio 781 921 841 1.070 781 1.009 1.072 1.077 932 1.108 1.016 10.608 1,5%
Meta 482 760 715 898 923 775 852 958 965 994 941 9.263 1,3%
Norte de Santander 451 664 563 709 730 613 717 752 644 746 711 7.300 1,0%
Bolivar 381 535 551 607 655 507 651 763 611 707 602 6.570 0,9%
Cauca 310 503 448 486 550 482 497 501 544 565 572 5.458 0,7%
Cordoba 144 249 216 321 348 246 370 344 301 375 323 3.237 0,4%
Magdalena 201 243 279 271 202 208 216 268 269 263 265 2.685 0,4%
Cesar 133 183 186 237 259 238 230 236 244 256 262 2.464 0,3%
OTRAS 335 514 476 560 571 500 534 558 540 593 639 5.820 0,8%
Total general 44.921 63.603 62.433 69.349 69.878 63.654 68.118 74.746 69.191 74.453 70.638 730.984 100

TRASPASOS
Asociación Colombiana de Vehículos Automotoreswww.andemos.org
Fuente: RUNT, Cálculos ANDEMOSInforme Completo: www.andemos.org
Por Ciudad
CIUDAD Ene Feb Mar Abr May Jun Jul Ago Sep Oct Nov TotalMARKET
SHARE
BOGOTA 14.889 22.660 23.690 25.123 25.965 24.173 25.250 27.730 25.926 27.701 26.759 269.866 36,9%
CALI 3.632 5.340 4.999 5.452 5.456 5.154 5.322 5.887 5.409 5.686 5.603 57.940 7,9%
ENVIGADO 3.508 4.890 4.349 4.849 4.739 4.206 4.598 5.214 4.832 5.136 4.668 50.989 7,0%
MEDELLIN 2.576 3.665 3.409 3.617 3.686 3.232 3.608 3.952 3.687 4.001 3.651 39.084 5,3%
MANIZALES 1.407 1.631 1.591 1.740 1.865 1.568 1.681 1.944 1.710 1.811 1.724 18.672 2,6%
SABANETA 1.271 1.681 1.597 1.713 1.790 1.640 1.673 1.858 1.747 1.802 1.775 18.547 2,5%
BUCARAMANGA 1.229 1.572 1.467 1.754 1.765 1.532 1.631 1.862 1.712 1.799 1.696 18.019 2,5%
COTA 1.109 1.255 1.323 1.533 1.585 1.385 1.566 1.544 1.468 1.584 1.414 15.766 2,2%
PEREIRA 1.117 1.223 1.240 1.407 1.381 1.226 1.366 1.413 1.320 1.451 1.405 14.549 2,0%
BARRANQUILLA 937 1.012 958 1.340 1.158 1.161 1.277 1.473 1.278 1.352 1.385 13.331 1,8%
IBAGUE 454 867 813 1.018 961 833 929 1.031 919 1.027 989 9.841 1,3%
LA CALERA 591 729 821 755 903 791 821 968 805 849 812 8.845 1,2%
FUNZA 455 631 780 825 740 661 729 777 784 724 685 7.791 1,1%
PASTO 405 602 551 638 804 575 649 748 679 794 686 7.131 1,0%
GIRON 455 582 577 629 610 604 662 764 668 798 707 7.056 1,0%
FLORIDABLANCA 529 617 571 652 702 562 628 695 667 726 684 7.033 1,0%
MOSQUERA 440 517 550 629 619 549 628 687 613 700 549 6.481 0,9%
ARMENIA 432 499 470 599 295 598 590 602 500 618 572 5.775 0,8%
NEIVA 359 464 400 550 491 369 484 533 512 505 495 5.162 0,7%
BELLO 314 453 394 466 502 460 493 499 494 490 483 5.048 0,7%
OTRAS 8.812 12.713 11.883 14.060 13.861 12.375 13.533 14.565 13.461 14.899 13.896 144.058 19,7%
Total general 44.921 63.603 62.433 69.349 69.878 63.654 68.118 74.746 69.191 74.453 70.638 730.984 100

Sector Automotor
Asociación Colombiana de Vehículos Automotoreswww.andemos.org
Informe Traspasos
Colombia, 2018