PROJECTE O TESINA D’ESPECIALITAT · Treball Final de Carrera - Tesina Enginyeria de Camins,...
72
PROJECTE O TESINA D’ESPECIALITAT Títol Applicability and Limitations of the SWASH model to predict Wave Overtopping Autor/a Víctor Martínez Pés Tutor/a Agustín Sánchez-Arcilla Conejo Francesc Xavier Gironella i Cobos Henk Jan Verhagen Departament Enginyeria Hidràulica, Marítima i Ambiental Intensificació Enginyeria Marítima Data Octubre 2013
Transcript of PROJECTE O TESINA D’ESPECIALITAT · Treball Final de Carrera - Tesina Enginyeria de Camins,...

PROJECTE O TESINA D’ESPECIALITAT
Títol
Applicability and Limitations of the SWASH model to
predict Wave Overtopping
Autor/a
Víctor Martínez Pés
Tutor/a
Agustín Sánchez-Arcilla Conejo
Francesc Xavier Gironella i Cobos
Henk Jan Verhagen
Departament
Enginyeria Hidràulica, Marítima i Ambiental
Intensificació
Enginyeria Marítima
Data
Octubre 2013
Applicability and Limitations of
the SWASH model to predict
Wave Overtopping
Treball Final de Carrera - Tesina
Enginyeria de Camins, Canals i Ports
Octubre 2013
Autor: Víctor Martínez Pés
Tutors: Agustín Sánchez-Arcilla Conejo
Francesc Xavier Gironella i Cobos
Henk Jan Verhagen
Universitat Politècnica de Catalunya
Escola Tècnica Superior d’Enginyers de
Camins, Canals i Ports de Barcelona
Departament d’Enginyeria Hidràulica,
Marítima i Ambiental
Technische Universiteit Delft
Faculteit Civiele Techniek en
Geowetenschappen
Department of Hydraulic Engineering
TESINA. Enginyeria de Camins, Canals i Ports. Applicability and Limitations of the SWASH model to predict Wave Overtopping 1
Acknowledgements
First of all, I would like to thank all people from the Technische Universiteit Delft, especially of
the Department of Hydraulic Engineering, who made me feel very comfortable during my stay
in the Netherlands and helped me with my thesis.
I express my gratitude to ir. Henk J. Verhagen for being my thesis supervisor at TU Delft and
guide me throughout it with his valuable advice. I am also very thankful to ir. Bert van den Berg
for advising and helping me during my work. Our periodic discussions about the next steps to
model and the obtained results in SWASH were really useful. Furthermore, I give thanks to
dr.ir. Marcel Zijlema for supporting me with SWASH, explaining me how the software works,
answering my doubts and trying to find an explanation to the faced problems.
In addition to them, I can not forget ir. Pieter B. Smit, who told me how I could solve the
instability problems I had when I started modelling dikes; and ir. Jeroen van den Bos, with
whom I talked about the crest permeability with more insight, and discussed about how to
model breakwaters in small-scale models and in SWASH. Besides, I exchanged some interesting
ideas with Tomohiro Suzuki (Flanders Hydraulic Research/Universiteit Gent), who is also using
SWASH in his research to model wave overtopping.
I acknowledge Dr. Agustín Sánchez-Arcilla for being my supervisor at Universitat Politècnica de
Catalunya (UPC), contacting with TU Delft to find a supervisor before going there and giving
me advice. Besides him, I am also thankful to Francesc Xavier Gironella for helping me in the
last stages.
I must thank Joan Alabart Llinás, friend and also exchange student from UPC at TU Delft, for
helping me with SWASH. He taught me how the software works and we had interesting
discussions about how things could be introduced in SWASH and about the properties and
limitations of the software.
Last, but not least, I appreciate all forms of support and encouragement given by my family
and close friends during this long year I have been working (mostly abroad and far from home)
on this topic.
Finished in Delft in June 2013 and defended in Barcelona in November 2013.
Abstract
TESINA. Enginyeria de Camins, Canals i Ports. Applicability and Limitations of the SWASH model to predict Wave Overtopping 2
Author: Víctor Martínez Pés
Supervisors: Agustín Sánchez-Arcilla Conejo (UPC), Francesc Xavier Gironella i Cobos (UPC),
Henk Jan Verhagen (TU Delft)
The main aim of this minor thesis is to evaluate if we can accurately predict the mean wave
overtopping discharge in rubble mound breakwaters with the tools we currently have. In first
place, the available methods (Eurotop formulas and improvements proposed by some authors,
Lykke Andersen and Burcharth formula and Neural Networks), are critically assessed focussing
on how the berm influence is described. In second place, a new numerical tool called SWASH
will be tested.
SWASH has been developed quite recently at TU Delft from the basis of SWAN. It is a non-
hydrostatic wave-flow model that uses the non-linear shallow water equations to predict wave
transformation and covers a wide range of hydraulic processes. However, it has not been
verified yet for wave overtopping. Therefore, verifying if SWASH is able to model wave
overtopping is the most important and innovative target of this thesis.
In order to make sure that everything works fine, intermediate steeps have been modelled and
analysed. Firstly, wave propagation was tested by simulating a wave flume. Afterwards, a
smooth impermeable dike was introduced to see how this structure affects the waves and if
overtopping could be measured. Later, a rubble mound breakwater described as a porous
structure in SWASH was studied. All simulations were performed in a flume without scaling.
On one hand, the measured overtopping at dikes is considered to be fairly good though only
13 tests were performed and analysed. Then, further and more extensive research should be
conducted for different initial situations to validate the model. The SWASH output discharges
are smaller than the 5% lower limit of Eurotop and Neural Network predictions. Nevertheless,
they were close values and they have the same order of magnitude, which is very important
when comparing overtopping values. No refection analysis was done. The smaller discharges
are believed to be explained by the fact that SWASH does not describe splash, and therefore,
only overtopping due to waves running up the slope, but not due to “spray” is taken into
account. In addition to this, it is thought that SWASH does not model accurately enough wave
breaking over abrupt changes in bottom geometry or steep slopes resulting in underestimation
of overtopping.
On the other hand, SWASH is not able to predict wave overtopping at rubble mound
breakwaters. A breakwater is not well modelled in SWASH, because porous structures are
dealt as a numerical dissipation box and not as a physical obstacle for incoming waves. As a
result, waves are damped but not diverted upwards, so there is no overtopping. The reasons
why this happens and some recommendations are given in this thesis. Besides, some ideas
about how to introduce a multi-layer structure are explained.
Keywords: Wave overtopping, SWASH, rubble mound breakwater, dike, Eurotop, Neural
Networks, non-linear shallow water equations, wave-flow model, porous structure in SWASH,
validation of SWASH.
Resum
TESINA. Enginyeria de Camins, Canals i Ports. Applicability and Limitations of the SWASH model to predict Wave Overtopping 3
Autor: Víctor Martínez Pés
Tutors: Agustín Sánchez-Arcilla Conejo (UPC), Francesc Xavier Gironella i Cobos (UPC), Henk
Jan Verhagen (TU Delft)
L’objectiu principal d’aquesta tesina és avaluar si amb les eines que tenim actualment, podem
predir acuradament el cabal mitjà d’ultrapassament en dics en talús. En primer lloc, els
mètodes disponibles (fórmules de l’Eurotop manual i millores proposades per diversos autors,
la fórmula de Lykke Andersen i Burcharth i les xarxes neuronals) s’expliquen i es critiquen. A
més, s’estudia amb més detall com descriuen la influència d’una berma. En segon lloc, una
nova eina numèrica anomenada SWASH és posada a prova.
SWASH ha estat desenvolupat recentment a TU Delft a partir del programa SWAN i està basat
en resoldre les equacions d’aigües somes (aproximació de les equacions de Navier-Stokes).
Aquest nou model flux-ona no hidrostàtic és capaç de predir transformacions d’onatge i
descriure un ampli ventall de processos hidràulics. Tot i això, encara no ha estat verificat per
ultrapassament. Així doncs, l’objectiu més important i la component més innovadora
d’aquesta tesina és validar si SWASH pot modelar ultrapassament.
Per tal d’assegurar que tot funciona correctament, s’han modelat i analitzat diversos passos
intermedis. Primerament, l’onatge s’ha propagat en un flume numèric. A continuació, s’ha
introduït un dic impermeable i llis (dike) per veure com aquesta estructura afecta l’onatge i si
es podien mesurar els cabals d’ultrapassament. Després, s’ha descrit en SWASH un dic en talús
(breakwater) com a estructura porosa. Totes les simulacions s’han fet en un canal sense reduir
les dimensions reals.
Per una banda, el cabal mesurat en dics impermeables es pot considerar parcialment
satisfactori, malgrat que només s’han fet i analitzat 13 simulacions. Així doncs, és necessari
ampliar la recerca investigant més casos diferents. L’ultrapassament donat per SWASH és
proper als valors predits per Eurotop i les xarxes neuronals i tenen el mateix ordre de
magnitud. Això és molt important quan es parla d’aquest fenomen. Malgrat tot, les mesures
sempre es troben per sota els percentils 5% predits per ambdós mètodes. Cal dir que no s’ha
analitzat la magnitud de l’ona reflectida. El fet que el cabal mesurat sigui inferior s’explica pel
fet que SWASH és incapaç de descriure esquitxos. Com a conseqüència, només té en compte
les ones que remunten el dic fins a ultrapassar-lo, però no les “gotes” d’aigua que desprèn
l’onatge en trencar i que superen el dic per inèrcia. Una altra explicació és que SWASH no
modela prou acuradament trencament d’ones quan hi ha canvis bruscos en el perfil del fons.
Per altra banda, SWASH no és capaç de predir ultrapassament en dics en talús. Aquestes
estructures no estan ben modelades en el programa, perquè aquest tracta les estructures
poroses com un objecte que dissipa l’energia de l’onatge incident, però no com un obstacle
físic que obstaculitza la propagació. Com a resultat, les ones s’esmorteixen, però no es desvien
verticalment, de manera que no hi ha ultrapassament. Els motius pels quals això passa
s’expliquen en aquesta tesina, junt amb algunes recomanacions sobre com es podria resoldre.
A més, es comenta com es podria descriure una estructura amb diferents capes.
Paraules clau: ultrapassament, SWASH, dics en talús, dics, Eurotop, xarxes neuronals,
equacions d’aigües somes, model flux-ona, estructura porosa a SWASH, validació de SWASH.

Table of Contents
TESINA. Enginyeria de Camins, Canals i Ports. Applicability and Limitations of the SWASH model to predict Wave Overtopping 4
Table of Contents
Acknowledgments ........................................................................................................................ 1
Abstract ........................................................................................................................................ 2
Resum (Abstract in Catalan) ......................................................................................................... 3
Table of Contents ......................................................................................................................... 4
List of tables ................................................................................................................................. 7
List of figures ................................................................................................................................ 8
1. Introduction ......................................................................................................................... 10
1.1. Objectives .................................................................................................................... 10
1.2. Wave Overtopping ....................................................................................................... 10
1.3. Types of Structures ...................................................................................................... 11
1.3.1. Coastal dikes and embankment seawalls .......................................................... 12
1.3.2. Armoured rubble slopes and mounds ............................................................... 12
1.3.3. Vertical and steep structures ............................................................................ 14
1.4. Methodology and essay structure................................................................................ 15
2. Overtopping Formulas ......................................................................................................... 17
2.1. Eurotop ........................................................................................................................ 17
2.1.1. Overtopping due to waves ................................................................................ 17
2.1.2. Oblique waves .................................................................................................. 21
2.1.3. Influence of a berm ........................................................................................... 22
2.1.4. Effect of the armoured crest ............................................................................. 24
2.1.5. Definition of the crest height and effect of wave walls..................................... 24
2.1.6. Overtopping volumes........................................................................................ 25
2.1.7. Improved formula by Lioutas ............................................................................ 26
2.1.8. Improved formula by Krom ............................................................................... 27
2.1.9. Improved influence factor for berm breakwaters ............................................. 29
2.1.10. Conclusions ....................................................................................................... 29
2.2. Lykke Andersen and Burcharth formula ....................................................................... 30
2.2.1. Laboratory tests ................................................................................................ 31
2.2.2. Guidelines for initial slopes other than 1:1.25 .................................................. 32
2.2.3. Other restrictions .............................................................................................. 32
2.2.4. Conclusions ....................................................................................................... 33
2.2.5. Comparison with Eurotop ................................................................................. 33
Table of Contents
TESINA. Enginyeria de Camins, Canals i Ports. Applicability and Limitations of the SWASH model to predict Wave Overtopping 5
2.3. Neural Networks .......................................................................................................... 35
2.3.1. Description ........................................................................................................ 35
2.3.2. Database ........................................................................................................... 36
2.3.3. Modelling .......................................................................................................... 36
2.3.4. Training and Evaluation .................................................................................... 37
2.3.5. Applications ...................................................................................................... 37
2.3.6. Conclusions ....................................................................................................... 38
3. SWASH ................................................................................................................................. 39
3.1. Description and properties of the software ................................................................. 39
3.2. Modelling and testing .................................................................................................. 40
3.2.1. Procedure ......................................................................................................... 40
3.2.2. Simulation tests to check the model ................................................................. 41
3.2.2.1. Wave propagation in deep and shallow water .......................................... 41
3.2.2.2. Impermeable smooth dike ........................................................................ 43
3.2.2.3. Rubble mound breakwater with an impermeable core............................. 52
3.2.3. Porosity in SWASH ............................................................................................ 56
3.2.4. Conclusions ....................................................................................................... 60
4. Conclusions and recommendations ..................................................................................... 62
4.1. Conclusions and discussion .......................................................................................... 62
4.2. Recommendations ....................................................................................................... 64
5. References ........................................................................................................................... 66
5.1. Consulted documents .................................................................................................. 66
5.2. Consulted websites ...................................................................................................... 68
5.3. Cited documents .......................................................................................................... 68
Appendices ................................................................................................................................. 70
A. Summary of the SWASH scripts .......................................................................................... 71
Table of contents ................................................................................................................ 71
List of tables ....................................................................................................................... 72
List of figures ...................................................................................................................... 74
A.1. Introduction.............................................................................................................. 79
A.2. Wave propagation trials ........................................................................................... 79
A.3. Wave propagation without the influence of the structure ..................................... 129
A.4. Impermeable smooth dike ..................................................................................... 134
A.5. First trials with a porous structure ......................................................................... 155

Table of Contents
TESINA. Enginyeria de Camins, Canals i Ports. Applicability and Limitations of the SWASH model to predict Wave Overtopping 6
A.6. Rubble mound breakwater with an impermeable core .......................................... 161
A.7. Rubble mound breakwater with a permeable core ................................................ 171
A.8. Chronological sequence ......................................................................................... 173
A.9. SWASH codes ......................................................................................................... 174
B. Summary of the Matlab scripts ........................................................................................ 179
B.1. Introduction............................................................................................................ 179
B.2. Wave per wave analysis ......................................................................................... 180
B.3. Spectral wave analysis ............................................................................................ 181
B.4. Dike overtopping .................................................................................................... 185
B.5. Rubble mound overtopping .................................................................................... 188
List of Tables
TESINA. Enginyeria de Camins, Canals i Ports. Applicability and Limitations of the SWASH model to predict Wave Overtopping 7
List of Tables
Table 2.1. Roughness factors for 1:1.5 slope. These values (T. Bruce, J.W. van der Meer, L. Franco, J.M.
Pearson, 2009) are an update of the values given at Eurotop. ................................................................ 20
Table 2.2. Relation between the crest width and the overtopping reduction coefficient (Eurotop). ........ 24
Table 2.3. Range of parameters tested by Lykke Andersen in his PhD Thesis (Lykke Andersen, 2006). .... 31
Table 3.1. Measured wave data at the wave generator in a flume without any hydraulic structure.
SWASH only simulates here wave propagation. ...................................................................................... 45
Table 3.2. Measured data in a flume without any hydraulic structure at the location of the toe of the
structure................................................................................................................................................. 45
Table 3.3. Measured wave data at the wave generator in a flume with an impermeable dike. Notice that
there is some reflection due to the smooth and impermeable dike although many waves overtopped in
the simulation. ....................................................................................................................................... 46
Table 3.4. Measured wave data at the toe of the dike. Long waves are observed. .................................. 46
Table 3.5. Estimations of mean wave overtopping over impermeable smooth dikes given by Eurotop
empirical formulas, SWASH and Neural Networks. Only the incoming wave without reflection has been
considered. ............................................................................................................................................. 47
Table 3.6. Estimations of mean wave overtopping over impermeable smooth dikes given by Eurotop
empirical formulas, SWASH and Neural Networks. Only the incoming wave without reflection measured
at the location of the structure toe has been considered. ....................................................................... 50
Table 3.7. Estimations of mean wave overtopping over rubble mound breakwaters with an impermeable
core given by Eurotop empirical formulas, SWASH and Neural Networks. Only the incoming wave
without reflection measured at the location of the structure toe has been considered. ......................... 54

List of Figures
TESINA. Enginyeria de Camins, Canals i Ports. Applicability and Limitations of the SWASH model to predict Wave Overtopping 8
List of Figures
Figure 1.1. Coastal dike covered by grass (source: Eurotop, photo from Schüttrumpf). .......................... 12
Figure 1.2. Rubble mound breakwater at the Malamocco inlet of the Venice Lagoon
(http://www.salve.it/it/gallery/cantierimalamocco.htm). ...................................................................... 13
Figure 1.3. Vertical breakwater in Jersey
(http://commons.wikimedia.org/wiki/File:St_Catherines_Breakwater.jpg). ........................................... 15
Figure 2.1. Geometric description of the berm parameters (Eurotop)..................................................... 23
Figure 2.2. Section of a berm breakwater section (Eurotop). .................................................................. 25
Figure 2.3. Scheme of the structure profile with all the parameters. (Van Gent et al., 2007). ................. 36
Figure 2.4. Schematization of the Neural Network. (Van Gent et al., 2007). ............................................ 37
Figure 3.1. Wave spectrum at the wave generator in simulation Propagation01.sws. ............................. 45
Figure 3.2. Wave spectrum at the location of the toe of the structure in a wave propagation test
(Propagation01.sws) without the structure itself. A second peak around 11 s and long waves can be
observed. This would be the result from some wave dissipation during the wave propagation. ............. 46
Figure 3.3. Wave spectrum at the wave generator with a dike (Dike01.sws). The shape is similar to the
recorded without dike. ........................................................................................................................... 46
Figure 3.4. Wave spectrum recorded at the toe of the dike (Dike01.sws). Many peaks and long waves are
observed compared with the situation without a dike. The reflection produced by the smooth dike and
the waves running up and down the slope would explain them.............................................................. 47
Figure 3.5. Measured discharge over time at the end of the crest of Dike01.sws (2.5 m freeboard). Many
waves overtop the dike. ......................................................................................................................... 48
Figure 3.6. Measured discharge over time at the end of the crest of Dike02.sws (5 m freeboard). Only a
few waves go over the crest and the overtopping volumes are small. .................................................... 49
Figure 3.7. Dispersion graph comparing the measured discharge in SWASH with the predicted
overtopping by the Eurotop formulas and the Neural Network. The lower and upper limits of Eurotop
and NN are also plotted. The three results of SWAH that gave nil overtopping are not drawn. ............... 51
Figure 3.8. Profile of the flume with the breakwater profile (Imp_Mound01.sws), the mean water level
(set-up) and the crest and trough limits of the spectral wave height. ..................................................... 53
Figure 3.9. Profile of the breakwater with the waves going through (Imp_Mound01.sws). The waves
break approximately 5 m in front of the toe, while they should do so on the first third of the slope. ..... 53
Figure 3.10. Recorded net discharge over time at the end of the crest (Imp_Mound01.sws). The positive
values mean discharge in the propagating wave direction. ..................................................................... 53
Figure 3.11. Breakwater profile with a thin porous structure (armour) placed over a bottom variation
(impermeable core). The impermeable core is the same profile as one of the previously tested dikes. No
agitation is recorded behind the structure. The strange values plotted inside the core correspond to the
wave output values given by SWASH, which are non-sense in the dry points. The script file is
Mound02.sws. ........................................................................................................................................ 55
Figure 3.12. Porosity considered in the water body by SWASH along the flume in script
Imp_Mound01.sws. ................................................................................................................................ 57

List of Figures
TESINA. Enginyeria de Camins, Canals i Ports. Applicability and Limitations of the SWASH model to predict Wave Overtopping 9
Figure 3.13. Porosity considered by SWASH at the breakwater location. It is constant in the entire water
depth. A porosity grading can be seen along the slopes and constant values under the crest and where
there is no structure. These values were used in Imp_Mound01.sws. .................................................... 57
Figure 3.14. Waves propagating through the breakwater in simulation Imp_Mound02.sws. The blue lines
represent the crest and trough of the recorded significant wave height. Only a progressive damping is
observed. ............................................................................................................................................... 58
Figure 3.15. Difference between the real water surface inside the porous structure and the water level
measured in SWASH. (Mellink, 2012). ..................................................................................................... 58
Figure 3.16. Wave breaking 5 meters in front of the breakwater toe (Imp_Mound01.sws). No run-up or
overtopping takes place. ........................................................................................................................ 59
Figure 3.17. Profile of an impermeable smooth dike (Dike05.sws). Waves break on the slope at 4-meter
water depth and run-up the slope. The recorded set-up includes the run-up water tongue. Some
agitation is also recorded behind the dike due to large wave overtopping. SWASH is not able to give
wave outputs where there is not always water, which explains the strange values shown in the plot. ... 59

1. Introduction
TESINA. Enginyeria de Camins, Canals i Ports. Applicability and Limitations of the SWASH model to predict Wave Overtopping 10
1. Introduction
1.1. Objectives
The aim of this work is to study if the available methods are able to describe and predict
accurately wave overtopping on rubble mound breakwaters. The developed empirical formulas
will be analysed to see which parameters and what range do they cover and how they deal
with certain aspects. A critic assessment of them will follow. Also other methods such as
Neural Networks will be treated.
Furthermore, the effect of a berm will be studied with more insight. Thus, the influence on
overtopping of its geometrical parameters, such as the berm width, will be analysed. Besides,
the generic and specific formulas will be criticised.
New software called SWASH will be tested to see if it can be a good tool to predict wave
overtopping in this kind of structures. The initial idea was to build a model with a breakwater
and compare the recorded results with the predicted values by the empirical formulas and real
measurements (if it was possible). However, this could be a very ambitious target for software
that has just been developed and that it is likely to give some problems. For this reason, it was
thought to start easy and add new features to the model step by step to be sure that it works
properly. Thus, the main objective of this thesis, and then the main focus of this research, is to
validate SWASH for wave overtopping.
As a last objective, but closely related to the previous one, this thesis will give some feedback
about SWASH in order to help the software developers to improve it. To do that, the problems
and limitations that arise when working with SWASH will be analysed, and from them, some
recommendations will be given.
1.2. Wave Overtopping
Overtopping takes place when a wave breaks into the coastal structure and the water runs up
on the seaward face and goes over the crest to the landward slope. It happens if the wave run-
up level is higher than the crest height. However, this concept does not play any role in vertical
structures, since it is only important in smooth and rough slopes. It is considered the wave run-
up height that is only exceeded by the 2% of all incoming waves. This parameter is represented
by the symbol .
Wave overtopping occurs in a very random way, as it is not constant in time and volume of
water, but a mean discharge over the crest is considered. Therefore, a mean discharge per
linear meter of width q is defined as wave overtopping.
This mean discharge is easy to be measured and lets us identify if we have or not an
overtopping problem related to a certain structure, but it does not give us enough information
about the magnitude of the problem or the caused damage. To evaluate that, we need to
know the number of overtopping waves (or a ratio) and the wave overtopping volume.

1. Introduction
TESINA. Enginyeria de Camins, Canals i Ports. Applicability and Limitations of the SWASH model to predict Wave Overtopping 11
The volume of water, V, that comes over the crest of the structure is given in volume per unit
of width and per wave. Large overtopping volumes are associated to a small number of
overtopping waves. The maximum overtopped volume, which allows us to evaluate a flood or
storm damage, depends on the storm duration, the ratio of overtopping waves and the mean
discharge q.
In chapter 2, 3 methods to compute wave overtopping are commented. They are the formulas
recommended by the Eurotop manual (and some improvements proposed by several authors),
one formula developed by Lykke Anderson and Burcharth for rubble mound berm breakwaters
and the use of Neural Networks. Then, the influence of the different factors are shown and
analysed. Nevertheless, it is known that overtopping reduces when there’s a berm, a gentle
slope or a large roughness. If the structure is permeable, wave run up and overtopping reduces
too. Wave run-up also depends on the wave period and it increases in case of long waves. We
will see if these methods take that into account or not and also which are their weak points.
Besides these empirical methods, we will look in chapter 3 if a new numerical model called
SWASH can be a valid tool to compute overtopping.
For the analysis, it is considered the water depth at the toe of the structure, which gives us an
upper bound of the wave height. Hence an increase of the sea water level due to any surge
(storm, low pressure), wind set-up, greenhouse effect, astronomical tide or expansion may
increase wave heights and reduce the structure height related to the Sea Water Level,
resulting in larger wave run-up and overtopping.
There are three different forms of overtopping characterized by the way the water goes over
the structure. In first place, the “green water” overtopping occurs when the wave run-up
reaches a higher level than the crest height and a “continuous” sheet of water passes over it.
The second one, the “white water” or “spray” overtopping, takes place when the waves break
onto the seaward side and produce large volumes of splash. Many droplets of water are kept
in the air and cross over the seawall due to their own momentum or an onshore wind. There is
not a continuous overtopping. The last one, and the least important and negligible, is
generated by the onshore wind that carries over the structure spray of the wave crests. The
spray does not generate significant volumes of overtopping, but it is dangerous because it
reduces visibility, for instance. It may be large when the overtopping discharge is low and
there are very strong winds. Both “green water” and “white water” were recorded during
model tests and predicted in empirical formulas.
1.3. Types of structures
Wave overtopping affects any type of structures built on the shoreline, independently of its
design purpose. They could even be flood defences that protect the hinterland from the sea or
rivers, revetments build against coastal erosion or harbour breakwaters that offer protected
areas for ships.
Four types of structures can be distinguished: sloping dikes and embankment seawalls;
armoured rubble slopes and mounds; vertical and steep structures and dunes. However, this

1. Introduction
TESINA. Enginyeria de Camins, Canals i Ports. Applicability and Limitations of the SWASH model to predict Wave Overtopping 12
essay was initially focussed on overtopping over rubble mound structures though dikes are
treated when validating SWASH.
It is very important to be aware of which kind of structure are we studying, because they will
not have close responses to wave run-up. Indeed, their behaviour can be too different. For this
reason, the three kinds of structures are presented to avoid misunderstandings.
1.3.1. Coastal dikes and embankment seawalls
Sloping dikes have been used along the coasts and rivers in many countries to protect the land
behind from flooding. They are simple and cheap structures, easy to build and to raise their
level, with a low visual impact (or lower than others) and do not need especial materials.
They consist on an earth embankment, built with clay to make it impervious, with some
protection against erosion like grass, asphalt, rock or concrete (blocks). The crest could have a
vertical wall. A berm or some rough elements may be present on the seaward slope to
dissipate wave energy and reduce run-up.
The most important feature of this type of structure is that it is impermeable. Therefore, water
cannot go through the structure by means of porous media flow. Water can only overtop the
dike.
Figure 1.1. Coastal dike covered by grass (source: Eurotop, photo from Schüttrumpf).
1.3.2. Armoured rubble slopes and mounds
This kind of structure built with layers of quarried rock is used to build breakwaters, groins,
revetments and protections of the toe of other structures. They dissipate a large proportion of

1. Introduction
TESINA. Enginyeria de Camins, Canals i Ports. Applicability and Limitations of the SWASH model to predict Wave Overtopping 13
the incoming wave energy when the waves break without significant displacement of armour
units. Significantly more energy dissipation occurs than with an equivalent smooth (and
impermeable) slope because of the higher roughness and porosity of the armour layer.
They are quite easy to build, but hard and heavy rock or concrete blocks are needed, which
make them more expensive than sloping dikes.
Like the dikes and embankment seawalls, the armoured rubble slopes and mounds can be
complemented with a berm on the seaward slope or a vertical wall on the crest.
Figure 1.2. Rubble mound breakwater at the Malamocco inlet of the Venice Lagoon
(http://www.salve.it/it/gallery/cantierimalamocco.htm).
In this kind of structures, wave overtopping has been often more important than wave run-up.
For this reason, the crest height of the rock slopes and rubble mound structures has been
designed in order to limit overtopping or transmission (in case of low crested structures or
port breakwaters) to acceptable levels rather than to prevent them.
The under layer and the core also play a role. If the core is permeable, the run-up water can
percolate into it and the run-up on the seaward slope surface decreases to a constant
maximum height. However, if the core is not permeable, the water accumulates in the armour
layer between the impermeable core and the slope surface. Then, the run-up water can not go
down and the run-up increases. It may be significant for large Iribarren numbers.
Reshaped and non-reshaped berm breakwaters
There is a difference between a breakwater with a berm and a berm breakwater. The first one
is a common rubble mound with a berm that is designed in such a way that the berm reduces
1. Introduction
TESINA. Enginyeria de Camins, Canals i Ports. Applicability and Limitations of the SWASH model to predict Wave Overtopping 14
the wave loads and wave overtopping. The idea comes from the dikes with a berm. In contrast,
the second one is built with a rock slope that is allowed to be reshaped by the (storm) waves
into a stable profile. The idea of this kind of breakwaters is not far from the beach equilibrium
profile indeed. The name berm breakwater comes from the lower part of the reshaped profile,
which resembles a berm although the equilibrium profile is different from the initial one and
determines the breakwater stability against wave attack.
Then, berm breakwaters are totally a different design concept than a rubble mound
breakwater. They require a large amount of material, but smaller sizes to be stable, because
the reshaped profile “gives stability”. This allows constructors to use rock in a more effective
and cheaper way, when it is available. There are 3 types of berm breakwaters depending on
the allowed reshaping:
- the statically stable non-reshaping berm breakwaters: only some stones are allowed to
move in a similar way to a conventional rubble mound breakwater. It is a complete
multi-layered structure to optimize all the rock with the heaviest blocks at the berm.
- statically stable reshaping berm breakwater: the profile is allowed to reshape into a
profile (in 1-3 storms) that is stable and where rocks do not move. It is formed by a
core and a rock armour.
- Dynamically stable reshaping berm breakwater: the profile is reshaped into a stable
profile for the current wave conditions, but the individual stones move up and down
the slope with the changing wave conditions. It is formed by a core and a rock armour.
1.3.3. Vertical and steep structures
Vertical and steep structures are often used in cities where there is a lack of available space to
build defences, and in deep water maritime works (harbour breakwaters and quays) where a
huge amount of material would be necessary and now, saved.
Using stone or concrete blocks, concrete floating caissons or other materials vertical or very
steep walls can be build and give a more optimal solution to the previous situations. However,
waves are reflected and break directly on the wall, which produces high impact pressures and
sudden and large overtopping.
Composite vertical structures where the emergent part of it is vertical, even if it has a small
berm in front of it, and vertical structures which have curve parapet on the upper part of the
wall are also included in this group.
In this kind of structures, wave overtopping can be reduced with a curve return parapet that
deviates the upward flow, or a rough slope in front of it or dissipation chambers that dissipate
energy.

1. Introduction
TESINA. Enginyeria de Camins, Canals i Ports. Applicability and Limitations of the SWASH model to predict Wave Overtopping 15
Figure 1.3. Vertical breakwater in Jersey (http://commons.wikimedia.org/wiki/File:St_Catherines_Breakwater.jpg).
1.4. Methodology and essay structure
This thesis consists of two clear different parts:
In the first one, the actual knowledge about wave overtopping in rubble mound breakwaters is
summarized and critically assessed. The berm behaviour and description is more deeply
analysed. However, spatial distribution of wave overtopping behind the crest is not studied. In
section 2.1 the Eurotop manual formulas and the improvements suggested by A. Lioutas, J.C.
Krom, S. Sigurdson and J.W. van der Meer are commented. A specific formula for berm
breakwaters proposed by Lykke Andersen and Burcharth is analysed in section 2.2. Finally, in
section 2.3 Neural Networks are briefly introduced. This part, which comprises chapter 2, is
merely a review of the state of the art and it is not new research itself. Therefore, readers who
already have insight in these topics can perfectly skip it, because most of the information
would be known for them. They can jump to next chapter then, which focusses on the main
research point.
The second part is focused on SWASH and it is described in chapter 3. As it has been told
before, this is the main research topic of this thesis and its highlight. SWASH software is
introduced and their features are described in section 3.1. Later in section 3.2, SWASH has
been tested to see if it could be used as a tool to compute wave overtopping. To do that, a
model has been built step by step by adding new things until we are able to simulate a real
breakwater. All these phases or steps are described and the arisen problems and limitations

1. Introduction
TESINA. Enginyeria de Camins, Canals i Ports. Applicability and Limitations of the SWASH model to predict Wave Overtopping 16
are commented together with the results. Afterwards in section 3.3, the way how SWASH
deals with porosity is explained with deeper insight. Partial conclusions are discussed in detail
in each section and they are summarized at the end of the chapter (section 3.4).
Finally, the conclusions and recommendations of this thesis are discussed in chapter 4. The
majority of the conclusions are about SWASH validation for wave overtopping, but few of them
come from the methods commented in chapter 2. All recommendations are given as a
feedback to SWASH developers to improve the model.
The thesis report includes two appendices:
The appendix A is a summary of the majority of the SWASH simulations performed during this
work. The input parameters and results are commented in detail. As a consequence, this
appendix is very long and it has 108 pages. For this reason it has its own table of contents and
lists of tables and figures. The codes of 3 SWASH scripts are also included.
The summary of SWASH scripts was written as a laboratory notebook at the same time tests
were run. Therefore, the main purpose was to collect and analyse the results as soon as the
simulations were performed, and give a useful tool to anyone starting working with SWASH, so
he could benefit from the acquired experience. The partial conclusions written there are
nothing more than ideas and thoughts and should not be considered as strong and definitive
arguments or statements. All the valid explanations and conclusions are commented in
chapter 3.
In appendix B the most important Matlab programmes used to analyse the results are
commented. They are either scripts or functions that analyse the wave records obtained with
SWASH or compute wave overtopping to speed up calculations.

2. Overtopping Formulas
TESINA. Enginyeria de Camins, Canals i Ports. Applicability and Limitations of the SWASH model to predict Wave Overtopping 17
2. Overtopping Formulas
After doing some research and studying the present literature, three different ways to
calculate the wave overtopping discharge in rubble mound structures can be distinguished:
TAW/Eurotop guidelines, Lykke Andersen & Burcharth formula and Neural Networks. All of
them are based or supported on experimental tests and are presented in this chapter.
These empirical formulas depend on tests data and include parameters from the waves and
the structure geometry. Sometimes the slope is included with the Irribaren number (also
known as breaker parameter). Also the variables may be dimensionless, for example freeboard
height referred to the wave height.
2.1. Eurotop
The Eurotop manual (2007) recommends using the formulas given by the TAW 2002, which
was a Technical Report of wave run up and wave overtopping at dikes that was used in the
Netherlands as a design guideline. The Eurotop manual presents these formulas with some
improvements and modifications replacing the previous one.
First of all, it must be known that most research about wave overtopping has been done over
smooth dikes and little over rough sloping structures. As a result, the formulas of slopping
dikes are rather developed and work quite well.
Secondly, rubble mound structures are similar to dikes as they have close profiles and they are
formed by different layers. However, they have steeper slopes than dikes and larger
permeability and porosity because of the fact that they are built with big blocks, which reduces
wave run-up and overtopping. For example, the steepness of the slopes of these structures is
around 1:1.5.
As a consequence of both arguments, the basic formulas of the dikes and embankment
seawalls can be applied with some modifications.
In fact, they specially suffer from a lack of research over some specific topics such as berms.
This results in absence of specific formulas (and then formulas from smooth slopes are also
adopted even though they may be wrong) or enough data to test or improve the accepted
formulas.
In this method, the slope is included through the Irribaren number and some influence factors
take into account the role played by rough elements, wave walls, berms, oblique wave attack,
etc. The berm influence factor is the same as in dikes.
Different authors have proposed some improvements to these formulas and they are
commented at the end in sections 2.1.7, 2.1.8 and 2.1.9.
2. Overtopping Formulas
TESINA. Enginyeria de Camins, Canals i Ports. Applicability and Limitations of the SWASH model to predict Wave Overtopping 18
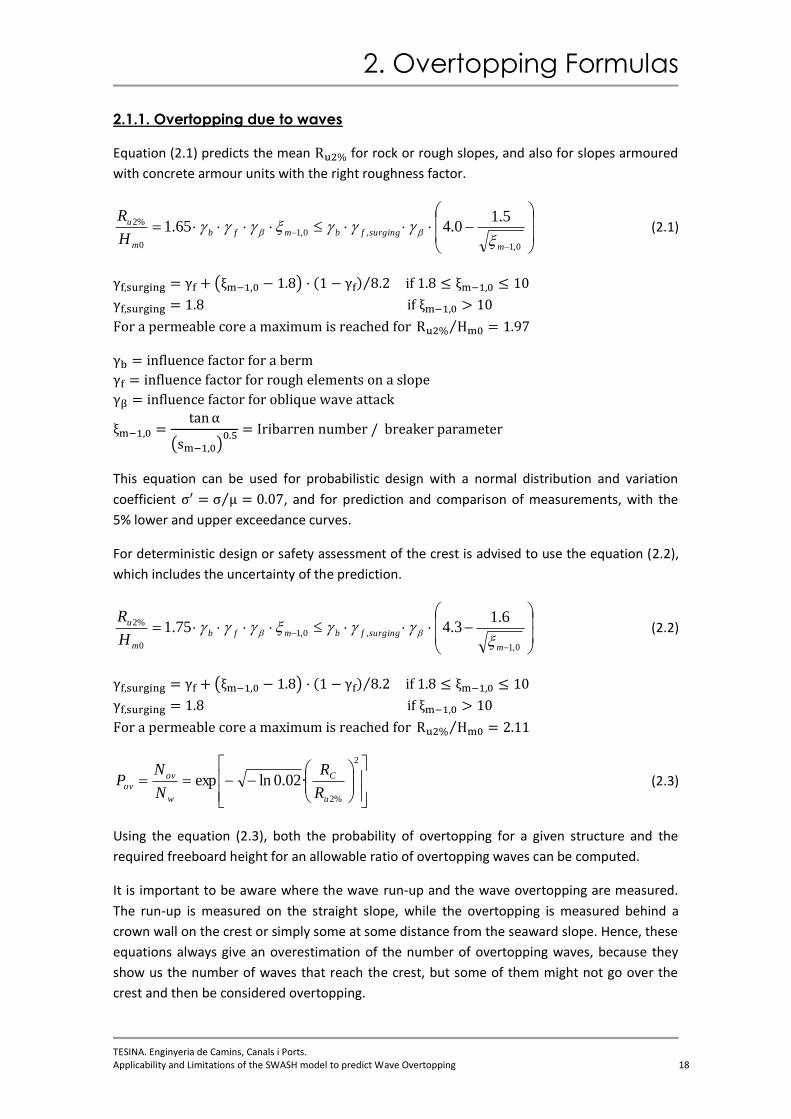
2.1.1. Overtopping due to waves
Equation (2.1) predicts the mean for rock or rough slopes, and also for slopes armoured
with concrete armour units with the right roughness factor.
0,1
,0,1
0
%2 5.10.465.1
m
surgingfbmfb
m
u
H
R
(2.1)
( ) ( ) ⁄
⁄
( )
This equation can be used for probabilistic design with a normal distribution and variation
coefficient ⁄ , and for prediction and comparison of measurements, with the
5% lower and upper exceedance curves.
For deterministic design or safety assessment of the crest is advised to use the equation (2.2),
which includes the uncertainty of the prediction.
0,1
,0,1
0
%2 6.13.475.1
m
surgingfbmfb
m
u
H
R
(2.2)
( ) ( ) ⁄
⁄
2
%2
·02.0lnexpu
C
w
ov
ovR
R
N
NP (2.3)
Using the equation (2.3), both the probability of overtopping for a given structure and the
required freeboard height for an allowable ratio of overtopping waves can be computed.
It is important to be aware where the wave run-up and the wave overtopping are measured.
The run-up is measured on the straight slope, while the overtopping is measured behind a
crown wall on the crest or simply some at some distance from the seaward slope. Hence, these
equations always give an overestimation of the number of overtopping waves, because they
show us the number of waves that reach the crest, but some of them might not go over the
crest and then be considered overtopping.

2. Overtopping Formulas
TESINA. Enginyeria de Camins, Canals i Ports. Applicability and Limitations of the SWASH model to predict Wave Overtopping 19
In chapter 1 a mean wave overtopping discharge has been defined as an average value per unit
of width. It lets us model this random phenomenon, but it has a clear limitation: it can only be
computed for almost constant wave and water level conditions. This should not surprise us,
since when we characterise a sea-state we are used to work with short time records, so that
quasi-stationary conditions could be easily assumed.
The mean overtopping discharge formula has the following pattern:
( ) (2.4)
( ) ⁄
⁄
First, it is necessary to distinguish whether waves are in breaking or non-breaking conditions,
because the overtopping response may be different in both cases. To do that, we can compute
the Iribarren number and check if the waves are in the “plunging”
regime (they usually break) or in the “surging” regime (they do not usually
break). The TAW 2002 Report sets the limit in . Hence, in the interface would
be better to compute both cases.
With no breaking conditions, the waves are not critically influenced by the structure toe or the
preceding slope. As a consequence, overtopping waves run up over the wall resulting in “green
water” overtopping and apply a smooth-varying load.
With breaking conditions, the waves are mainly influenced by the water depth and, as a result,
some waves break violently against de structure.
To calculate the overtopping mean discharge, the same equations for smooth slopes can be
used. These equations are:
fm
C
m
vfbmm
C
mb
m
H
R
Hg
q
H
R
Hg
q
03
0
00,1
0,13
0
·6.2·exp2.0
·
··
·75.4·exp
tan
067.0
· (2.5)
fm
C
m
vfbmm
C
mb
m
H
R
Hg
q
H
R
Hg
q
03
0
00,1
0,13
0
·3.2·exp2.0
·
··
·3.4·exp
tan
067.0
· (2.6)
Equation (2.5) should be used for probabilistic design and prediction or comparison of
measurements. Wave overtopping discharge can be calculated for breaking and non-breaking

2. Overtopping Formulas
TESINA. Enginyeria de Camins, Canals i Ports. Applicability and Limitations of the SWASH model to predict Wave Overtopping 20
waves. It is assumed that the coefficients 4.75 and 2.6 have a normal distribution with
standard deviations and respectively. For deterministic design or safety
assessment it is advised to use equation (2.6), which increases the average discharge by one
standard deviation.
The upper bound appears for values near to , which is close to the borderline
defined in the TAW 2002 . Therefore, it can be said that the wave breaking
behaviour plays a role. As in rubble mound structures the slope steepness is around 1:1.5,
large breaking parameters result and the previous equations reduce to:
fm
C
mH
R
Hg
q
03
0
·6.2·exp2.0
· (2.7)
fm
C
mH
R
Hg
q
03
0
·3.2·exp2.0
· (2.8)
The Eurotop manual only presents the last 2 equations for rubble mound structures ((2.7) and
(2.8)). Even though it may work well for the common slopes and as an upper bound they are
conservative, the first part should not be forgotten, since in certain situations, large
overestimations may be considered.
Type of armour layer Number of layers Roughness factor ( )
Smooth impermeable slope - 1.00
Rock (two layers; permeable core) 2 0.40 (0.37-0.43)
Rock (two layers; impermeable core) 2 0.55
Rock (one layer; permeable core) 1 0.45
Rock (one layer; impermeable core) 1 0.60
Cube 2 0.47 (0.44-0.50)
Cube 1 0.49 (0.46-0.52)
Antifer 2 0.50 (0.46-0.55)
HARO 2 0.47 (0.44-0.50)
Tetrapod 2 0.38 (0.35-0.42)
Accropode 1 0.46 (0.43-0.48)
Core-Loc ® 1 0.44 (0.41-0.47)
Xbloc ® 1 0.44 (0.41-0.49)
Dolosse 2 0.43
Berm breakwater 2 0.40
Icelandic breakwater (reshaped) 2 0.35
Table 2.1. Roughness factors for 1:1.5 slope. These values (T. Bruce, J.W. van der Meer, L. Franco, J.M. Pearson,
2009) are an update of the values given at Eurotop.

2. Overtopping Formulas
TESINA. Enginyeria de Camins, Canals i Ports. Applicability and Limitations of the SWASH model to predict Wave Overtopping 21
Notice that with these formulas there is no influence of the slope and the wave period. These
may seem surprising, but for simple breakwaters it may be a reasonable assumption according
to tests.
The different roughness factors are shown in table 2.1. They have been obtained from
experimental research. Eurotop collects the results of the European Project CLASH, which
provided an extensive database from European scale models and structures. Later, some
updates were made. In the consulted tables it is not clear what is considered as a “layer”. The
point of confusion is that armour rock breakwaters have one or 2 armour layers with two-rock-
diameter thickness each (so 2 layers of rock in each armour layer), and the concrete mounds
have one or two layers of concrete units placed over a filter or directly over the core.
The experimental tests show that the roughness of the structure slightly depends on the slope
angle and the breaking parameter. Besides it, some experimental research found these values
low. Therefore, this factor should be checked with experimental tests for each structure.
2.1.2. Oblique waves
The angle of wave attack is defined at the toe of the structure after the wave propagation to
this point (refraction, shoaling and diffraction).
Wave run-up and wave overtopping can be assumed to be equally distributed along the axis of
the dike. If it is curved, run-up and overtopping will change. They will increase on concave
curves due to fact that the flux of wave energy will concentrate on a shorter length of seaward
slope, and decrease in case of convex curves because of the opposite reason.
In CLASH some specific tests were performed to evaluate the effect of the oblique waves. Test
were made on a rubble mound breakwater with a slope of 1:2 and a rock or cubes armour (for
further information, Eurotop refers to Andersen and Burcharth, 2004). A linear relationship
between the angle of wave attack ( ) and the influence factor was found. However,
overtopping reduces much faster with an increasing .
| | | | (2.9)
For | | the result | | can be applied and no overtopping is assumed when
| | .
Valérie Vanlishout studied in her Master Thesis (2008) oblique wave transmission through
rough impermeable rubble mound submerged breakwaters. It is a completely different topic
than the one treated in this thesis, but during her research she studied the uncoupled effect of
the roughness and the core permeability, which is an interesting point. After some laboratory
tests and analysing the obtained data, Vanlishout concluded that the permeability of the core
has no influence on the breakwater response to oblique waves. Thus, it is the roughness of the
structure what matters most rather than the permeability of the core when talking of oblique
waves transmission.
This conclusion comes from studying oblique wave transmission in submerged breakwaters,
however, this conclusion might be general. Then, it would be expected that the roughness

2. Overtopping Formulas
TESINA. Enginyeria de Camins, Canals i Ports. Applicability and Limitations of the SWASH model to predict Wave Overtopping 22
factor that appears in the Eurotop formulas is more influenced by the roughness than the
permeability of the core.
2.1.3. Influence of a berm
A berm is defined when a part of the structure profile has a slope that varies between
horizontal and 1:15, while if it is steeper than 1:8, it is called a slope.
When the Eurotop Manual was written little research about rubble mound berm breakwaters
had been done. Despite the lack of information, the definition of the berm influence
parameter used for smooth slope structures was adopted (2.10). Hence, it was assumed that a
rubble permeable berm would behave as an impermeable (dike) berm.
Berms reduce wave run-up and wave overtopping. The influence factor of a berm depends on
the width (B) and the vertical difference between the middle of the berm and the Sea Water
Level (dB), which describe the berm.
Equation (2.10) lets us compute the reduction factor.
( ) (2.10)
(
)
(
)
is the horizontal length measured between the points of the down and upper slope that
differ from the berm level. The geometry of the berm is drawn in figure 2.1.
The reduction of wave run-up or wave overtopping is maximum for a berm on the still water
level ( ) and decreases with raising . If the berm lies below or above
(from SWL1), it has no influence on the process.
The assumption made that if the berm depth is too deep ( ), it does not affect
run-up or overtopping could be right, because it is assumed that waves break when
, so it does not influence wave breaking and the waves break
on the main slope. Nevertheless, I do not think that the other statement is completely true.
My argument is that if a berm lies above (or some times ) it works as a breakwater
with a large crest width. It is true that wave run-up will not change, because the maximum run-
up level will be below the berm height (or little water will reach the berm height and there will
stop or percolate). But overtopping will have a significant reduction, since splash water must
go over the berm and the crest width. To give an idea of the reduction although the physical
1 SWL: Sea Water Level

2. Overtopping Formulas
TESINA. Enginyeria de Camins, Canals i Ports. Applicability and Limitations of the SWASH model to predict Wave Overtopping 23
phenomenon is not the same, it is advised to compare the reduction factors of the table 2.2.
Just compare the initial crest width against an equivalent crest width that includes the berm.
As a result, I think that a different reduction factor should be used for run-up and overtopping,
or at least a modification of the formula of overtopping discharge when the berm lies above
the SWL. In the last alternative, a correction of the crest width that takes into account the
slope berm can be useful.
Figure 2.1. Geometric description of the berm parameters (Eurotop).
As the dikes and embankment seawalls have smooth gentle slopes, the breaker parameter is
low and has a large influence in the formulas ((2.5) and (2.6)). In contrast to this situation,
rubble slopes and mound have steep slopes and the breaker parameter is quite high. As a
consequence, there is a situation of non-breaking waves and the maximum value for the
previous equations is used (that corresponds to equations (2.7) and (2.8)), and no berm
influence factor is found. Then, we conclude that the berm only plays a role in rubble slopes
whose slope is so gentle that the upper bound of the commented equations is not reached
(and then, can be used).
This conclusion comes from assuming the formulas from dikes because of little previous
research. However, that may be wrong, since the berm must have an influence on
overtopping, even a little one. Thus, it is clear that there is a big spot in the Eurotop manual for
rubble mound structures and berms have to be deeply studied.

2. Overtopping Formulas
TESINA. Enginyeria de Camins, Canals i Ports. Applicability and Limitations of the SWASH model to predict Wave Overtopping 24
J.C. Krom (2012) studied the influence of a berm on overtopping in rubble mounds in his MSc
Thesis. He confirmed what I had previously thought about how EurOtop formulae deal with
berms, and after performing some laboratory tests he proposed some improvements, which
are given in section 2.1.8.
Sigurdson and van der Meer (2012) have proposed an influence factor for berm breakwaters
that would replace and . It is commented in section 2.1.9.
2.1.4. Effect of the armoured crest
The width of the slope crest can be used to reduce overtopping. The wider the crest, the more
water can percolate through, more energy can be dissipated and thus, the more overtopping
decreases. This reduction takes place when the crest width is at least 3 nominal diameters ( )
long.
Eurotop refers to Besley (1999) to describe how to calculate the influence of a wide armoured
crest. First the wave overtopping for a simple slope with a crest width of must be
computed2. Secondly, the reduction coefficient (2.11) should be applied to the overtopping
discharge. The table 2.2 shows some results.
( ⁄ ) (2.11)
Crest width (GC) Reduction coefficient (Cr)
0.9934
0.6828
0.3225
0.1523
0.0340
0.0076
Table 2.2. Relation between the crest width and the overtopping reduction coefficient (Eurotop).
A larger reduction was obtained for an accropode slope, since equation (2.11) was found for a
rock slope and may be conservative.
2.1.5. Definition of the crest height and effect of wave walls
Equations (2.7) and (2.8) consider a crest with a width of and a wall behind the slope
that has the same height as the armour layer crest ( ). Since part of the overtopping
waves will percolate through the armour and will not go over the crest (and the wall), a less
higher wave wall ( ) will not reduce significantly overtopping. Nevertheless, the
elimination of the wall would lead to an overtopping increase. It is known from the available
2 The width of the crest of a rubble mound structure like breakwaters or revetments is usually .

2. Overtopping Formulas
TESINA. Enginyeria de Camins, Canals i Ports. Applicability and Limitations of the SWASH model to predict Wave Overtopping 25
data that the crest width is more important than the wave wall height when reducing
overtopping.
Figure 2.2. Section of a berm breakwater section (Eurotop).
A way to consider this effect is using the given equations with the larger height. If the wall
height is higher than the armour crest height ( ), use the wall height ( ). Otherwise,
use the armour crest height ( ).
If we consider a wall that crosses the whole crest into an impermeable core, water can not go
through the armour. With this kind of impermeable structure, when overtopping occurs, all
the water must go over the crest.
A. Lioutas (2010) and J.C. Krom (2012) suggested in their MSc Thesis to take into account the
permeability of the crest by using and , respectively.
The determination of the crest height was found to be of critical importance.
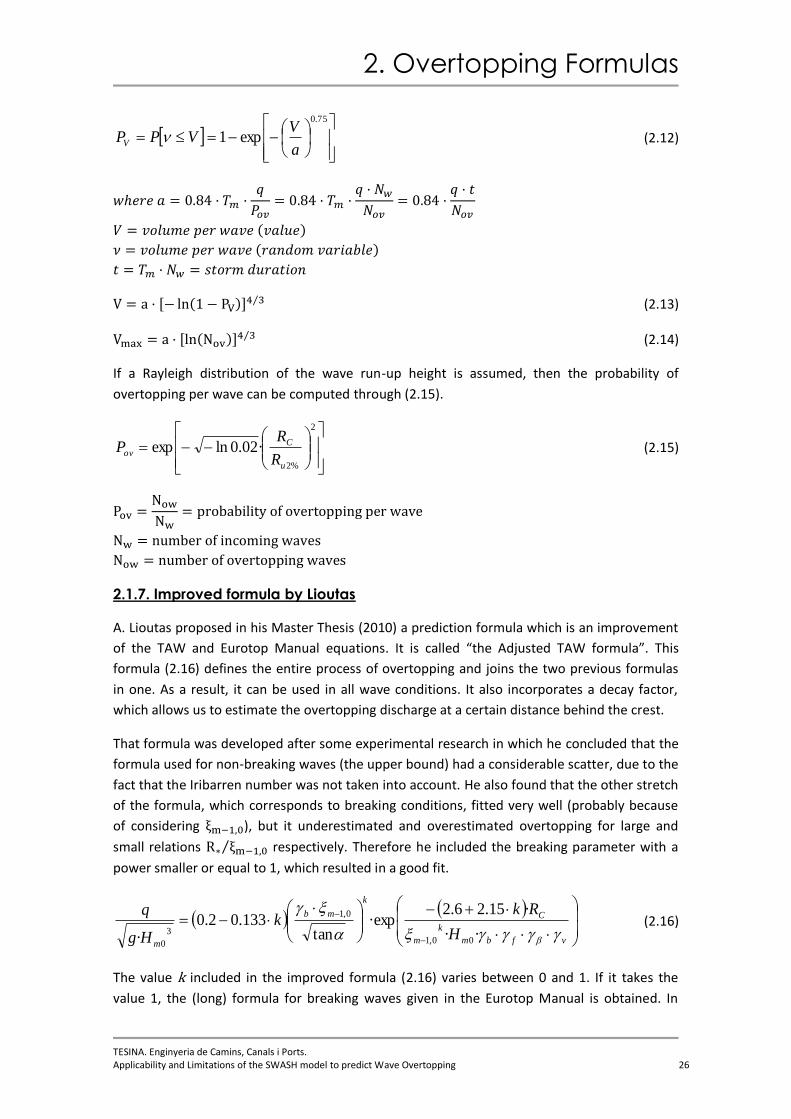
2.1.6. Overtopping volumes
A Weibull distribution with two parameters is used to describe the overtopping volume per
wave. These are a shape factor 0.75 and a scale factor , which depends on the mean
overtopping rate the mean wave period and the probability of overtopping waves . As
a result of this probability distribution, a few waves generate the larger overtopping volumes,
as it can be observed in the nature.
Expression (2.12) shows the cumulative probability function of overtopping volumes per wave
and (2.13), the overtopping volume per wave for a given probability of exceedance . If the
number of overtopping waves is known, equation (2.14) gives the maximum overtopping
volume in a storm.
2. Overtopping Formulas
TESINA. Enginyeria de Camins, Canals i Ports. Applicability and Limitations of the SWASH model to predict Wave Overtopping 26
75.0
exp1a
VVPPV (2.12)
( )
( )
[ ( )] ⁄ (2.13)
[ ( )] ⁄ (2.14)
If a Rayleigh distribution of the wave run-up height is assumed, then the probability of
overtopping per wave can be computed through (2.15).
2
%2
·02.0lnexpu
C
ovR
RP (2.15)
2.1.7. Improved formula by Lioutas
A. Lioutas proposed in his Master Thesis (2010) a prediction formula which is an improvement
of the TAW and Eurotop Manual equations. It is called “the Adjusted TAW formula”. This
formula (2.16) defines the entire process of overtopping and joins the two previous formulas
in one. As a result, it can be used in all wave conditions. It also incorporates a decay factor,
which allows us to estimate the overtopping discharge at a certain distance behind the crest.
That formula was developed after some experimental research in which he concluded that the
formula used for non-breaking waves (the upper bound) had a considerable scatter, due to the
fact that the Iribarren number was not taken into account. He also found that the other stretch
of the formula, which corresponds to breaking conditions, fitted very well (probably because
of considering ), but it underestimated and overestimated overtopping for large and
small relations ⁄ respectively. Therefore he included the breaking parameter with a
power smaller or equal to 1, which resulted in a good fit.
vfbm
k
m
C
k
mb
mH
Rkk
Hg
q
··
·15.26.2·exp
tan133.02.0
· 00,1
0,1
3
0
(2.16)
The value k included in the improved formula (2.16) varies between 0 and 1. If it takes the
value 1, the (long) formula for breaking waves given in the Eurotop Manual is obtained. In

2. Overtopping Formulas
TESINA. Enginyeria de Camins, Canals i Ports. Applicability and Limitations of the SWASH model to predict Wave Overtopping 27
contrast, the upper bound which corresponds to non-breaking conditions is obtained when
. A. Lioutas proposes using the value , since it fits best his experimental tests.
After using this formula all the data follow the same trend line and no groups are formed,
resulting in a low spread.
The decay factor is not included in the above written formula, since it is not the study of the
overtopping distribution behind the crest the aim of this thesis. However, the reduction factor
is
, where is the landward end of the crest ( increases
landwards). is a crest width reduction factor like explained in section 2.1.4., but it is
added in the denominator of the exponential function.
As I commented in section 2.1.5, Lioutas defined the crest freeboard as
to take into account the crest permeability.
Afterwards in Lioutas et al. (2012), this formula was re-adjusted (2.17) and a better fit was
obtained with and . For overtopping just behind the crest
is recommended (see 2.18).
00,1
0,1
3
0·
·15.26.2·exp
tan133.02.0
· mcf
k
vbm
C
k
mb
mH
Rkk
Hg
q
(2.17)
(2.18)
2.1.8. Improved formula by Krom
J.C. Krom continues in his Master Thesis the research that A. Lioutas had begun. He performed
more experiments with a permeable non-reshaping berm and analysed and compared all the
new and previous results.
His first conclusion was that the existing formulations are not able to predict accurately the
wave overtopping discharges of the physical small-scale models. The latest formula given by
Liotas (2.17) had the better fit though it was not enough.
Based on his experimental data, a good fit was achieved when the crest freeboard was defined
as to take into account the crest permeability.
According to his reasoning, with an impermeable berm part of the wave energy is
concentrated over the berm because of the smaller water depth and the rest is dissipated.
Therefore, it is the most efficient mechanism to dissipate wave energy and this is the way it
works for dikes, which explains how the influence factors are defined in EurOtop. This is called
the “fully impermeable” berm, for which the Eurotop berm parameters apply.
In contrast, the waves can partially propagate through a permeable berm, so less energy is
dissipated and the waves can reach the main slope before breaking. However, the
irregularities of the berm and its roughness dissipate some energy through turbulence. If the
berm lies above water level this turbulent dissipation increases. Despite the more turbulence,

2. Overtopping Formulas
TESINA. Enginyeria de Camins, Canals i Ports. Applicability and Limitations of the SWASH model to predict Wave Overtopping 28
the propagation through the berm makes that impermeable berms dissipate more energy
before reaching the main slope.
For permeable berms below SWL, the berm affects the waves and make them steeper. As a
result, there is more energy dissipated in wave breaking and run-up and overtopping discharge
reduces, but less than for impermeable berms.
For permeable berms above SWL, it does not affect waves until they break on the berm slope,
so the berm acts as an extended crest rather than a berm, because energy is not dissipated
before the main slope. This berm is more permeable, irregular and rougher and dissipates
more energy, and thus, run-up and overtopping are reduced. Wind waves do not “generate” a
flow of water over the berm, because it percolates. There is a kind of decay. Only some swell
waves propagate through the berm and reach the main slope, where they run-up and may
overtop. Hence, the reduction is stronger for sea waves than for swell waves. This situation
dissipates more energy than equivalent impermeable berms and that permeable berms below
SWL due to the larger importance of roughness.
The first change was to incorporate the breaking parameter in the formula through the
roughness factor as it was already done for run-up. Since for long waves, the roughness of the
slope does not reduce overtopping anymore, the upper limit is changed from to
. The resulting expression is:
{
( ) ( )
(2.19)
surgingfbm
C
mH
R
Hg
q
,03
0
·6.2·exp2.0
·
(2.20)
The equation 2.20 incorporates the berm influence factor and the Iribarren number through
the new roughness factor. The spreading caused by the different wave steepness is not found
anymore. Although it was developed from tests with berm breakwaters, this new equation
gives a better fit for simple rough slopes.
From the comparison of the results of the new tests and the previous formulas with the
expected physical behaviour, the berm influence factor was redefined in equation (2.21).
{ ( )
(
)
(2.21)
and are parameters that define the material permeability (and maybe more
properties). They are defined to be 1 for a fully impermeable berm and 0 for a theoretical fully
permeable berm made of air. Since only one type of material was used, Krom fitted these
paramaters with the values and . It is important to recall that only
one berm above SWL was tested, which explains that the vertical position is not included.
Notice that for berms above water level a decay function is used whereas the same type of

2. Overtopping Formulas
TESINA. Enginyeria de Camins, Canals i Ports. Applicability and Limitations of the SWASH model to predict Wave Overtopping 29
function is used below SWL. The other factors are computed according to the EurOtop (see
equation 2.10 in section 2.1.3).
When this new berm factor is used in the Adjusted TAW formula from Lioutas a significantly
better fit is found.
2.1.9. Improved influence factor for berm breakwaters
S. Sigurdarson and J.W. van der Meer proposed in an ICCE conference on Coastal Engineering
in 2012 an improved influence factor for berm breakwaters (2.23). This factor should be
used instead of on the formulas presented in the Eurotop Manual (2.22). Using this new
factor and re-analysing some experimental data on berm breakwaters, they found that the
improved formula is as reliable as the formulas given for steep smooth (dikes) and rough
(rubble mound) slopes. However, this formula has been recently developed and has been
roughly validated.
fm
C
mH
R
Hg
q
03
0
·6.2·exp2.0
· (2.22)
This new factor takes into account the wave steepness and the berm width. As a consequence,
the wave period through the wave steepness is now in the formula (2.23).
BBm
C
mH
R
Hg
q
03
0
·6.2·exp2.0
· (2.23)
The authors commented that in contrast to steep slope profiles, it was known that wave
overtopping in berm breakwaters depend on the wave period. This is true for permeable
berms, which dissipate quite effectively the energy of short waves. This wave period influence
was found by the authors although it depends on the type of berm breakwater. As in the berm
influence factor of Eurotop (found in dikes and applied in rubble mounds), a wider berm
reduces wave overtopping. The mean discharge also reduces with shorter and steep waves.
2.1.10. Conclusions
Eurotop can give reasonably good predictions for rubble mound simple slopes, but not for
breakwaters with a berm, since the behaviour of a permeable armour layer is very much
different than a smooth an impermeable dike. Besides modelling the berm as it was a dike,
reshaped berm breakwaters can only be introduced as a composite slope and the mean slope
is used for the calculations, which is not realistic.
The influence of the permeable crest is not totally known and further research is necessary. As
a consequence, it is not clear which freeboard should be used in the formulas.

2. Overtopping Formulas
TESINA. Enginyeria de Camins, Canals i Ports. Applicability and Limitations of the SWASH model to predict Wave Overtopping 30
Lioutas; Krom; and Sigurdson and van der Meer have proposed quite recently different
improvements to the Eurotop formulations. They were developed at the same time from two
different approaches and have improved the predictions for the analysed data set. However,
they have not been compared and we do not know which of them performs better.
2.2. Lykke Andersen and Burcharth formula
Lykke Andersen deeply studied rubble mound breakwaters and realised his PhD Thesis over
scale effects and berm breakwaters (Hydraulic Response of Rubble Mound Breakwaters. Scale
Effects – Berm Breakwaters, 2006). He and his fellow Burcharth from Aalborg University
presented in 2004 a formula to compute overtopping of berm breakwaters. This formula
(improved in 2005) is presented in this section.
Data of 634 tests (565 from Lykke Andersen and Burcharth and the rest from other five
authors) was used to fit the formula through multi-parameter fitting, based on a routine that
minimise the square errors of the overtopping discharge logarithms.
The developed formula (2.24) is valid for berm breakwaters with no superstructure.
Overtopping is given at the back of the crest and .
( )
(
) (2.24)
√
{ (
)
√
(
)
The factor has a variation coefficient 2.22. All parameters involved are referred to
the non-reshaped profile (initial slope) to make it easier. The stability parameter describes
the reshaping of the berm breakwater. In case of non-reshaping berm breakwaters, .
From observing the variables, it is noticed that the rock parameters (size and density) only
affect . However, the large number of parameters involved makes it not handy to use the
formula.
The data of other researchers used to fit the formula also includes tests with multi-layer berm
breakwaters. For this reason, the formula can be used for this type of breakwaters when the

2. Overtopping Formulas
TESINA. Enginyeria de Camins, Canals i Ports. Applicability and Limitations of the SWASH model to predict Wave Overtopping 31
largest size is applied in the formula due to the limited allowed reshaping in this kind of
structures.
To conclude with, it is demonstrated that the formula can predict overtopping of
homogeneous and multi-layer berm breakwaters with high accuracy. A little overestimation of
the discharge has been found for reshaped profiles in contrast to non-reshaped.
2.2.1. Laboratory tests
Before their study, there was very limited and no systematic research over berm breakwaters.
They presented a dimensionless overtopping formula for berm breakwaters based a large
parametric model test study with berm breakwaters. 565 tests were performed and the data
from other authors was used, resulting in a 695-test database. The formula was derived for
statically and dynamically stable berm breakwaters as well as non-reshaping statically stable
berm breakwaters, all with homogeneous berms.
Their tests were conducted in a wave flume at Aalborg University. The model structure had no
coronation structure and overtopping was measured behind the crest. Table 2.3 shows the
range of parameters tested. Most of the tests (594) were performed with reshaping berm
breakwaters and a few (59) with fixed front geometry.
Parameter Range
Peak wave steepness ( ) 0.010 - 0.054
Wave height at the toe of the structure ( ) 0.064 - 0.164 m
Water depth at the toe of the structure (h) 0.24, 0.34, 0.44 m
Crest and armour crest freeboard ( ⁄ ) 0.08, 0.11, 0.14, 0.17 m
Crest width ( ) 0.17, 0.24, 0.31, 0.38 m
Berm width (B) 0.00, 0.20, 0.30, 0.40, 0.50. 0.65 m
Berm elevation ( ) 0.04 (above SWL), 0.00, 0.04, 0.12 m
Front slope below berm 1:1.25
Front slope above berm 1:1.25
Rear slope 1:1.25
Stability number ( ) 0.96 – 4.86
Stability index including wave period ( ) 16.8 – 163
Reynolds number for berm stones ( )
Armour 1: 3.32·104 to 4.92·104
Armour 2: 3.13·104 to 3.91·104
Armour 3: 1.60·104 to 2.44·104
Table 2.3. Range of parameters tested by Lykke Andersen in his PhD Thesis (Lykke Andersen, 2006).
The formula was based on tests with initial slopes of 1:1.25, which was the natural repose
angle for the tested armour materials. However, guidelines on how to modify this formula for
other slopes are also given (see section 2.2.2).

2. Overtopping Formulas
TESINA. Enginyeria de Camins, Canals i Ports. Applicability and Limitations of the SWASH model to predict Wave Overtopping 32
As data for multi-layer berm breakwaters (Icelandic type) are included, the conclusions on the
usage of the derived formula will cover also multi-layer berm breakwaters.
To study the influence of the breakwater reshaping, 59 tests were done with fixed front
geometry. The structure was the same used in other tests, but a net was put to avoid rock
movements. Then, the influence of rock displacements in overtopping could be studied.
However, I think that these models did not actually represent non-reshaping breakwaters, in
which the layers of rock should be disposed so that they do not move on stable slopes.
Therefore it is not clear to me if this formula was thought for stable berm breakwaters, whose
(design) slope is stable for most of the wave conditions, although Lykke Andersen wrote in his
conclusions that non-reshaping breakwaters were completely covered by his formula.
Although the formula was developed for reshaping breakwaters and it has a factor that takes
into account the effect of profile reshape, better overtopping estimations are found for non-
reshaping profiles, since some overestimation occur in reshaped profiles. Besides this
accuracy, higher overtopping discharges values take place in reshaped berm breakwaters
because of their smoother slope.
2.2.2. Guidelines for initial slopes other than 1:1.25
Since the present tests were all performed with initial slopes 1:1.25, some guidelines were
given by the authors to use the formula for other initial slopes.
The argument is based on the fact that the reshaped profiles are almost identical for a given
volume of stones and do not depend on the initial lower slope. At least, this seems to be true
for dynamically stable profiles and drives to the conclusion that B has to be enlarged by
( ) ( ( ) ). For a very stable structure with very limited damage it is
believed that the down slope has very little influence on the overtopping discharge. Therefore
the correction should not be done in such cases as it could lead to unsafe results for slopes
flatter than 1:1.25.
In case of different initial front slopes above the berm, it is advised to modify B and GC so the
distance to the back of the crest is the same as for a slope 1:1.25. That means increasing both
B and with the length ( ) ( ( ) ) .
Note that the berm length may be modified twice if the upper and lower slopes differ from
1:1.25.
2.2.3. Other restrictions
Some dependency on the overtopping discharge with the water depth was found for
⁄ due to wave breaking (higher threshold for flatter foreshores). Despite the
influence of the foreshore slope and the water depth in the wave height distribution, these
two parameters were not included in the formula, since only one foreshore was tested and
mostly non-breaking waves were performed in the flume. Therefore, it is advised to verify the
formula for cases with heavy wave breaking on the breakwater slope and in deep water.
Conservative results are expected in case of heavy wave breaking.

2. Overtopping Formulas
TESINA. Enginyeria de Camins, Canals i Ports. Applicability and Limitations of the SWASH model to predict Wave Overtopping 33
The influence of the grading of the armour rocks on the overtopping discharge was not studied
in their study even though it may exist, since grading plays a role in the structure porosity and
reshaping.
Remember that the formula was developed for breakwaters with no superstructure. In that
situation, a reduction will surely occur, but is not modelled.
2.2.4. Conclusions
Lykke Andersen and Burcharth developed a very specific formula for a very specific case
looking at many variables. As a result, they obtained a very complex formula that gives a good
fit for all kind of berm breakwaters. The reshaping behaviour is introduced through a factor,
so that the input parameters come from the non-reshaped profile description, which makes it
easier. However, because the formula was obtained from a multivariable fitting method, the
formula includes lots of parameters and it is very complex. Therefore, the formula is not very
handy to use and there is no physical approach behind it, only statistics.
Few breakwaters profiles were tested although it is justified that the reshaped profiles will be
the same whatever the building profile. However, I do not think that the non-reshaping berm
breakwaters are well studied, since only one slope was tested. There are guidelines to adapt
the input values for different slopes, but flatter slopes than 1:1.25 are said to give unsafe
predictions. Besides it, no superstructure was studied. Furthermore, it should be verified for
heavy wave breaking though the authors comment that they expect conservative results.
Despite the fact that there is no direct influence of the porosity or multiple layers in the
formula, accurately predictions both for homogeneous and multi-layered berm breakwaters
are obtained, which apparently looks contradictory.
For these reasons, further research with different sections and wave conditions should be
performed although this specific formula seems to work well for berm breakwaters.
2.2.5. Comparison with Eurotop
The formula recommended in the Eurotop manual has the following generic form:
f
vfb
b
RCA
sRC
s
A
Q·
·exp
·tan
·exp
tan
min
0
0 (2.25)
In case of breaking waves, the formula includes the following variables:
. When there are non-breaking waves, the parameters that represent the berm
disappear (commented in 2.1.3).
In reshaped berm breakwaters, the final berm has a steeper slope than the range considered
in the berms definition. As a result, the resulting berm must be introduced with a composite

2. Overtopping Formulas
TESINA. Enginyeria de Camins, Canals i Ports. Applicability and Limitations of the SWASH model to predict Wave Overtopping 34
slope profile and the average slope is used. It must be said that this formula does not cover
well this type of structure, since there is too much scatter.
The formula proposed by Lykke Andersen and Burcharth is:
( )
(
) (2.26)
We can observe that more variables are present in this formula:
, but the slope angle is not present since only one was tested. The
wave obliquity may be considered by multiplying the discharge by an orientation factor.
may be taken into account within , and in the reduction factor for crest
wider than , but it is not inside the formula as it is in Lykke’s. If we insert this
coefficient in the Eurotop formula, we get:
*
*0
0
*
0
0
5.1·6.2
·exp612.0
5.1·tan
·75.4exp
tan20502.0
min
5.1exp06.3·6.2
·exp2.0
·tan
·75.4exp
tan067.0
min
GR
GsR
s
GR
sR
sQ
f
vfb
b
f
vfb
b
(2.27)
If we consider front waves:
( )
(
)
(2.28)
*
*0
0
5.1·6.2
·exp612.0
5.1·tan
·75.4exp
tan20502.0
min
GR
GsR
sQ
f
fb
b
(2.29)
Applying logarithms and considering 1:1.25 slope and , we respectively get:
( )
(2.30)
(2.31)
(2.32)

2. Overtopping Formulas
TESINA. Enginyeria de Camins, Canals i Ports. Applicability and Limitations of the SWASH model to predict Wave Overtopping 35
Few terms can be directly compared, because of the different relations between variables
obtained from experimental research. Only Lykke’s and Eurotop’s upper bound can be
compared.
2.3. Neural Networks
The wave overtopping phenomenon involves too many variables from the sea hydrodynamics
and the structure geometry and properties that can not be properly analysed in current
experimental tests. They can describe quite well the response of a certain “common and
simple” structure, but not all the relations between all variables and some influence factors
are often added to model uncertainties or unknowns.
These are some of the general disadvantages of the empirical formulas derived from
experimental tests. Nevertheless, there is a way to improve the predictions made on the basis
of the available data: the use of Neural Networks.
2.3.1. Description
Neural Networks are data driven models that work as a multiple regression fit for cause-effect
relations. They do not give a relation between parameters as a result, but they are very useful
for solving difficult modelling, where there is large amount of experimental data and an
unclear interrelationship of parameters.
Provided that a huge amount of (reliable) data is available, a very precise solution (output) will
be given for the considered variables (input). However, the input parameters should be
according to the ones used in the initial database from which the Neural Network was
developed, i.e. the problem to be solved must be similar to the experimental data.
A method that uses Neural Networks can estimate wave overtopping discharges (or run-up or
whatever) for a wide range of coastal structures, so wide that they do not have anything in
common such as vertical walls, rubble mounds and dikes. Given an accurate description of the
structure and the waves as an input (that should be treated in a certain way), the same
method can deal with any kind of structure as long as enough data from other structures are in
the database. This point overcomes the restrictions from experimental tests, which are done
with very strict models, and, therefore, whose results are only valid for these intervals of
parameters. Nevertheless, the initial database must be very extensive, since it should include
variation intervals of all input parameters.
In one hand, the main advantages of the Neural Networks are that only one method is used for
all types of structures, instead of different equations for each simplified case (Vertical, Mounds
and Dikes as in most guidelines) without restrictions of the number of parameters; and that
good predictions are obtained in spite of our ignorance of the relationship between the
different parameters.

2. Overtopping Formulas
TESINA. Enginyeria de Camins, Canals i Ports. Applicability and Limitations of the SWASH model to predict Wave Overtopping 36
In the other hand, an endless large amount of data is needed to build the database and the
NN3. This data has to be reliable and must be accurately treated to build an homogeneous
database, which is a titanic work before preparing the NN.
2.3.2. Database
The European project CLASH collected around 10000 overtopping tests from several
laboratories before 2004. This extensive database has been used for setting up the few Neural
Networks proposed by some authors.
Each test is described by 3 hydraulic parameters ( , 4 and ); 12 structural
parameters ( , , , , , , , , , , and ); a Reliability Factor (RF)
that estimates the reliability and uncertainties of the test procedure and results; and a
Complexity Factor (CF) which evaluates if the structure has been correctly described with the
structural parameters. A Weight Factor was built combining the Reliability and Complexity
Factors, so that the most reliable tests had a larger weight in the NN configuration and training
(see next points). The most unreliable or most complex data was taken out to avoid unreliable
results. Figure 2.3 shows all input parameters.
Figure 2.3. Scheme of the structure profile with all the parameters. (Van Gent et al., 2007).
All the input and output variables were scaled to using Froude’s similarity law.
Roughness and slopes are not affected by this scaling.
2.3.3. Modelling
The Neural Network is organized in three layers that contain several neurons and the
connections between them and the neurons of other layers. The neurons of the same layer are
not connected and work as a processing units. The key idea of this structure is embracing all
the possible relationships between the input parameters. Each neuron gets the information
from the preceding layer as a weighted sum of outputs, applies a non-linear activation function
and generates an output.
The first layer is formed by all the input parameters and the third one by the output parameter
(only one in this NN). The middle layer (hidden layer) and their connections are set during a
3 NN: Neural Network
4 The mean spectral period at the toe of the structure.

2. Overtopping Formulas
TESINA. Enginyeria de Camins, Canals i Ports. Applicability and Limitations of the SWASH model to predict Wave Overtopping 37
training process. The number of neurons within a hidden layer work as adjustable parameters.
Therefore, an increase of them reduces the differences between the predicted output (by the
NN) and the observed one due to a larger number of degrees of freedom. However, it cannot
be increased without limitations, because the NN would model fluctuations in the data set and
the accuracy will not decrease.
The training process with the database assigns some weights to the connectivities. Then, the
stronger the influence of some input parameters, the stronger their links will be. It sets the
number of neurons of the hidden layers too.
Figure 2.4. Schematization of the Neural Network. (Van Gent et al., 2007).
2.3.4. Training and Evaluation
First of all, the data set must be divided in two sets (it is a partition). A larger one is used to
“train” the NN, and a shorter one “tests” the NN. Each set is used only once, i.e. the test set
does not train the NN and vice versa.
In second place comes the training or learning phase, in which the NN is adjusted and its
weights are calibrated until the predicted results meet the registered ones, which are
considered as targets. During this process, the differences between the estimated and
measured overtopping (quantified in an error function) are minimised through an iterative
process.
Finally, in the test phase a testing data set evaluates the calibrated NN. As a conclusion, the
predictions of the NN may be influenced by the chosen training set, so the partition must be
made carefully. Nevertheless, there is a way to overcome this limitation by using Resampling
Techniques. This strategy consists in training many NN with different training and testing sets.
As a result, a set of NN (which may not have the same output for the same input) is obtained.
This set lets us evaluate the uncertainty of the model (not the database, which once treated is
considered right).
2.3.5. Applications
Besides predicting the overtopping discharge for a given structure and wave conditions, the
Neural Network is capable to predict the influence of a certain input parameter, such as wave

2. Overtopping Formulas
TESINA. Enginyeria de Camins, Canals i Ports. Applicability and Limitations of the SWASH model to predict Wave Overtopping 38
angle, crest freeboard or slope. Furthermore, a confidence interval can be estimated from
using Resample Techniques.
The NN can not predict as an output, even when these situations are included in the
training set. This is another weak point of the NN (a part from all of them related to the
database). Zero output is simply not possible and large (and wrong) overestimations of the
overtopping discharge occur in the area of low overtopping. However, it is possible to “cheat”
the NN through a combined classifier-quantifier model. This consists in using two neural
networks. The first one just computes an estimation of the output discharge and decides
whether it can be neglected or not. If it can be neglected it is considered null. In the other
case, the second NN predicts a more accurate discharge for the non-zero cases. This model
was developed within the CLASH project as a part of the PhD Thesis of Verhaeghe (2005).
2.3.6. Conclusions
Neural Networks are useful tools that let us predict the mean overtopping discharge in a wide
range of coastal structures using one single model. This model includes all the relations
between the wave and structure parameters and offers a rather accurate estimation. It is a
stronger and more robust model than empirical formulae, but it needs a painstaking work.
Neural Networks can not predict a null output, but this problem can be “easily” solved by using
a classifier NN that works as a filter.
The prediction reliability is totally based on the reliability of the used database and, up to a
point on the training set. For these reasons the used database must be carefully treated and
chosen. However, the uncertainties of the prediction can be estimated.
Besides to the data reliability, the model would only predict accurately the overtopping
discharge over those structures whose description is included in the database’s input intervals.
As a consequence, its extensive range of applicability reduces to the data used to train the
Neural Network.
Lykke Andersen deeply studied rubble mound berm breakwaters, proposed a formula and
compared it with the CLASH Neural Network. He concluded that his experimental formula
performed better than the NN due to the few berm breakwaters included in the database (82
over approximately 8000). Although this NN worked very well for berm breakwaters included
in the training set, the predictions for other berm breakwaters not included were bad. It was
expected that, if his laboratory tests data were included in the database, the NN would
perform better.
Due to Lykke Andersen conclusion, few data of the rubble mound berm breakwaters and the
large time needed to prepare NN, they will not be used in this thesis for this purpose.

3. SWASH
TESINA. Enginyeria de Camins, Canals i Ports. Applicability and Limitations of the SWASH model to predict Wave Overtopping 39
3. SWASH
SWASH (Simulating Waves till Shore) is a non-hydrostatic wave-flow model recently developed
by TU Delft from the basis of the SWAN software. The main aim of this new software is to
predict the wave transformation from offshore conditions to the shore in order to study wave
phenomenon in beaches, harbours and coastal waters.
This software uses the non-linear shallow water equations (Navier-Stokes depth averaged) and
can describe complex phenomenon related to rapidly varied flows, such as wave breaking and
run-up at the shoreline, between other coastal processes. A large range of conditions can be
simulated and thus, many processes modelled of different hydraulic interests.
In the next section, the properties of the software will be briefly described. For more detailed
and extensive explanation, the reader is referred to the SWASH website and the paper written
by Marcel Zijlema et al. (2011).
3.1. Description and properties of the software
Since SWASH is ruled by the non-linear shallow water equations, the model runs in a depth-
averaged mode or a multi-layered mode, in which the vertical domain is divided in many
layers. To obtain a better prediction the model would use more layers rather than higher order
derivatives. In fact, it does not use more than second order spatial derivatives and gets second
order accurate approximations in time and space. The use of different layers allows us to
overcome the limitations of using these “simplified” Navier-Stokes equations. However, using
more layers means more operations and thus, larger computation time and more numerical
errors.
This numerical model works with second order finite differences and different grids. Each
parameter (water depth, velocity, etc.) can be defined independently of the others in their
own special grid. This is valid for the input and output values. Afterwards, all these grids are
superposed. If their nodes coincide with the ones of the computational mesh, the model uses
those values. Otherwise, it makes a linear interpolation of the values of the “property grids”.
On the one hand no fine meshes must be defined if the values of some parameters are
constant or have just a linear variation, which is a main advantage. On the other hand, if the
parameters can not be described with a simple pattern, interpolations between meshes with
different sizes can lead to major unexpected and unreliable results. Be aware that 2
interpolations may be done (from the input grid to the computational one and from the last
one to the output grid) and thus, errors might be amplified.
Mass and momentum are strictly conserved at a discrete level (i.e. each element). This allows
the model to track the actual location of incipient wave breaking. Broken waves can propagate
and change their form due to the momentum conservation. This approach is valid for hydraulic
jumps, dam-break problems and flooding situations. Then a similarity between wave breaking
and hydraulic jumps is set, and, therefore, energy dissipation is already considered.
Furthermore, non-linear wave properties of breaking waves are preserved.

3. SWASH
TESINA. Enginyeria de Camins, Canals i Ports. Applicability and Limitations of the SWASH model to predict Wave Overtopping 40
As commented before, SWASH can be used to study a large list of physical phenomena and
predicts a large amount of outputs, including elevations, depth-averaged velocities and
discharges. Therefore, it can be used as a numerical model flume to test hydraulic structures,
such as breakwaters and estimate wave overtopping.
However, this new software has some limitations.
The first one is that the developers of this software put more emphasis on the hydraulic
computation and processes rather than in the physical objects. For this reason, some
limitations appear when describing structures such as breakwaters, since some parameters
can only be introduced as constant values. For example, a multilayer breakwater can not be
described with layers with different porosities. Then, a constant value must be used. In fact, a
single value is introduced for each node of the grid. Also there are some limitations in
describing objects with very low porosity. New updates are expected to solve these limitations.
The second one is related to the main advantage. The model was designed for a wide range of
possible applications, because it can compute everything, but the model has not been verified
yet. So, we do not know yet if the results are good or not. As there are lots of different
situations, this process is thought to take long. In a first phase the model has to be calibrated
with some real data, so that from a certain input values we get a measured real output. During
this process, some unknown coefficients that appear in the equations will be given a certain
value. Once it is done, in a second phase, the model has to be tested and compared with other
results from other methods such as empirical equations or Neural Networks or measured data.
Then we will know if the software works and give acceptable results or must be improved.
3.2. Modelling and testing
3.2.1. Procedure
In this thesis SWASH will be used to predict wave overtopping of berm breakwaters, and the
results will be compared with the already commented empirical formulas. This software has
not been verified for overtopping yet. Thus, this thesis will also check if it works properly in this
specific situation.
Before testing a specific structure (berm breakwater), a simpler model needs to be described.
Then, all the initial and boundary conditions and all the commands that the software needs to
start the computation and give a result will be fixed. Since it is a kind of non-scaled flume test
(with the real dimensions) and the description of the breakwater is not complex, this is the
most difficult task. In this part, simple waves and the breakwater geometry will be introduced.
Afterwards, the “real” structure to be tested and the design waves will be introduced, but the
model will not change much.
This simple model will be built following different phases. In each step, some new inputs or
boundary parameters will be introduced and checked to make sure that they have been
correctly processed. This procedure allows us to identify problems earlier and solve them
faster and in an easier way.

3. SWASH
TESINA. Enginyeria de Camins, Canals i Ports. Applicability and Limitations of the SWASH model to predict Wave Overtopping 41
The first step consists in checking if the spectrum wave has been correctly introduced and if it
propagates right. To do that, a deep water flume (h=100 m) is built, so that the waves are not
affected by the bottom. In this flume, the waves are generated at one side and the significant
wave height is measured at the other side. From these measured values, a wave spectrum will
be built using Matlab, which should coincide with the input.
The second step introduces the limitation of water depth, since it is reduced from 100 to 10
meters. This is the only difference with the previous model. Wave heights are also measured at
the end of the flume and then a wave spectrum is built. If the wave height is small compared
to the water depth, no big differences should be appreciated.
In the third step a smooth and impervious structure is introduced at one side. Wave
overtopping can be measured in this simple dike. The main objective is checking if it can be
correctly computed.
Afterwards in the fourth step a rubble mound breakwater will be introduced in order to look
what happens when a permeable structure is described. It will be a simple geometry, but a
porosity and porous size field will be defined.
Finally, the real geometry will be described in the fifth step. As all the other parameters have
been previously verified, no problems are expected to come to light in this last step.
3.2.2. Simulation tests to check the model
3.2.2.1. Wave propagation in deep and shallow water
First I tried the model with a water depth of and a wave with a significant height of
3.5 m and a period of 10 s. We are in deep water conditions and no problems should be
expected. However, at the beginning the computations did not work properly. For this reason
(and after some tests in shallow water), I reduced to a water depth of and a wave
defined with and . Waves were introduced as a regular waves and
spectrum waves.
To analyse the output waves, which were recorded on a time-water level table, two Matlab
scripts were created. One analyses the register wave per wave using the zero down-crossing
criterion to split the waves. The mean and significant wave height and the wave period are
given. Easily the range of wave periods and wave heights can be obtained. It also gives as an
output the mean water level and . Besides it, and are computed through the
water elevation variance. A second script does the spectral analysis. First the spectrum and the
graphs with the Power Spectral Density (or Variance Density Spectrum) are built through
averaging some periodograms and, afterwards, many wave parameters are computed from
the previous spectrum and the spectral moments. They are: , , , , and
. However, the latter two are hardly used.
For further information about these Matlab scripts, look at the appendix B (Summary of the
Matlab scripts), where is explained how they work.
3. SWASH
TESINA. Enginyeria de Camins, Canals i Ports. Applicability and Limitations of the SWASH model to predict Wave Overtopping 42
These tests worked and I could get some interesting conclusions, which are given later with
some comparisons with shallow water tests.
One of the objectives of this thesis is to check if SWASH works properly when talking of
overtopping as a part of the verification tests of this software, which was recently developed.
Because it is quite new and only a few people have worked with it, some definition errors and
other problems were likely to occur. For this reason, it was decided to include some of the
problems faced during this thesis where it is explained how the model was built. It is thought
to be an interesting point for people who want to know more about SWASH.
I worked with SWASH version 1.10A. The current software version is 1.20A.
The first tests with shallow water were performed with a water depth of 10 m and a wave
defined by a significant wave height of 3.5 m and a mean period of 10 s. These are
intermediate water conditions indeed though they are close to the shallow water boundary,
but they will be referred as shallow water tests. The majority of the tests run without any
problem though some commands used in deep water did not work. The following conclusions
were drown from these tests:
- The wave spectrum was not well defined. The built spectrum is not close to the
introduced data, since smaller and much shorter waves were measured.
- When spectrum waves were introduced as an input in deep water, strong dissipation
occurred. This phenomenon did not take place in shallow water. The reasons were
that the generated spectrum waves were so steep that broke. The dissipative
behaviour of wave propagation in deep water conditions enhanced the wave height
reduction.
- Be careful with how the wave spectrum is computed with Matlab. It is important to
check it first with regular waves. However, do not compare the significant wave
heights, but , since the first one is a concept that makes no sense with regular
waves, especially when it is obtained from the variance!
- Regular waves were well introduced both in deep and shallow water.
- A strong reduction of mean water level took place in shallow water tests. It was larger
when regular waves were introduced instead of spectrum waves. An increase of water
depth reduced this effect.
- SWASH computes and as output parameters from the variance of the water
level elevation. For this reason, the significant wave height value given for regular
waves makes no sense. SWASH does not compute the wave spectrum and does not
give wave periods as an output either.
The SWASH scripts and their results are not commented in this section. For further information
about the used commands in each script, comments, comparisons and conclusions, please look
at the appendix A (Summary of the SWASH scripts).

3. SWASH
TESINA. Enginyeria de Camins, Canals i Ports. Applicability and Limitations of the SWASH model to predict Wave Overtopping 43
Finally these problems could be solved. The large water level changes were a sort of resonance
effect in the wave flume that could be solved with an appropriate sponge layer at the end.
Realize how important is to fix the right length for this layer, that should be at least three
times the wave length (even though in the User Manual version 1.10 the necessary length was
not specified). Although the wave spectrum can be defined through the mean and peak wave
periods as input parameters, the spectrum signal is built from the peak period. Hence, the
equivalent peak period was computed from the mean one in the first step. It resulted that this
computation was wrong introduced and the bug needed to be fixed. With the newer SWASH
version 1.20 or using the peak wave period and the appropriate sponge layer length these
problems could be overcome. Then (and using the peak period), a structure can be introduced
in the next step.
There is some dissipation along the flume. The reason could be the influence of the bottom
rather than numerical dissipation. The tests were performed in intermediate water depth close
to shallow water conditions, so there is some dissipative behaviour. The spectrum graph at the
end of the flume is wider, the peak periods do not change and the mean periods show little
variations. For these reasons, the interaction with the bottom would explain the little wave
dissipation that is observed.
In the next section, some results of propagated waves are shown and compared with the
measured waves under the influence of a structure.
3.2.2.2. Impermeable smooth dike
After reducing the time step, which was not stable although I had managed to simulate wave
propagation, I started working with an impervious smooth dike and wave overtopping was
measured over it. SWASH adjusts the time step according to the given computation grid and
the range of Courant numbers, so in fact the time step was reduced by changing the range of
Courant numbers, which had led to larger and unstable time steps.
The computational grid has a size of 1 m and the input range of Courant numbers is between
0.1 and 0.25. An initial time step of 0.001 s was introduced, which fits this range of Courant
numbers and also fits with the output tables, which give results every 0.05 s.
The commands DISCRET UPW UMOM H BDF and DISCRET UPW WMOM H BDF have been used
to discretize the horizontal advective terms of the momentum equations. A second order
backwards upwind scheme has been applied to solve the equations in a stable way.
The smooth and impervious dike is introduced as a bottom variation. In fact, the dike is a part
of the bottom that remains above the initial water level. This is the only way to introduce an
impervious structure, because small porosity values can not be introduced in SWASH, since
some terms of the momentum equations have (a power of) the porosity in the denominator
(see section 3.3). For this reason, it is not advised to use porosity values smaller than 0.1 to
avoid problems. As no bottom friction was assumed, it was already a smooth bottom.
However, it would be good to compare a model with a real case to see, for instance, if some
friction should be added.
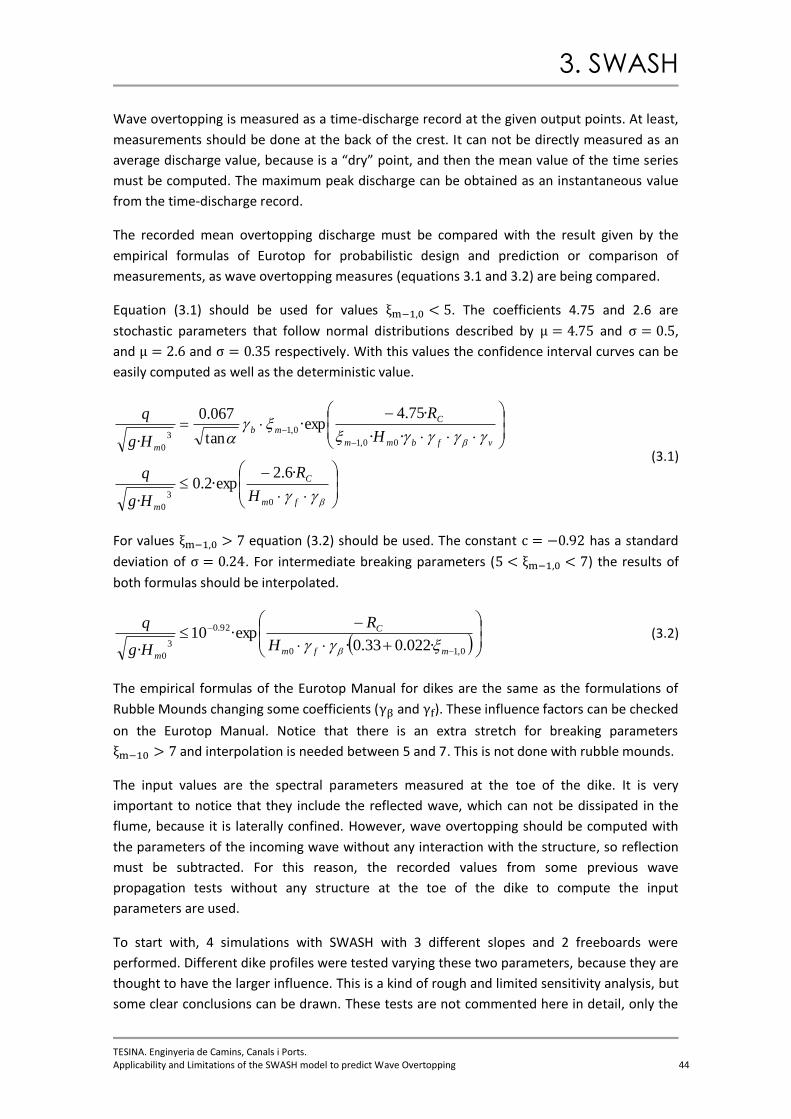
3. SWASH
TESINA. Enginyeria de Camins, Canals i Ports. Applicability and Limitations of the SWASH model to predict Wave Overtopping 44
Wave overtopping is measured as a time-discharge record at the given output points. At least,
measurements should be done at the back of the crest. It can not be directly measured as an
average discharge value, because is a “dry” point, and then the mean value of the time series
must be computed. The maximum peak discharge can be obtained as an instantaneous value
from the time-discharge record.
The recorded mean overtopping discharge must be compared with the result given by the
empirical formulas of Eurotop for probabilistic design and prediction or comparison of
measurements, as wave overtopping measures (equations 3.1 and 3.2) are being compared.
Equation (3.1) should be used for values . The coefficients 4.75 and 2.6 are
stochastic parameters that follow normal distributions described by and ,
and and respectively. With this values the confidence interval curves can be
easily computed as well as the deterministic value.
fm
C
m
vfbmm
C
mb
m
H
R
Hg
q
H
R
Hg
q
03
0
00,1
0,13
0
·6.2·exp2.0
·
··
·75.4·exp
tan
067.0
· (3.1)
For values equation (3.2) should be used. The constant has a standard
deviation of . For intermediate breaking parameters ( ) the results of
both formulas should be interpolated.
0,10
92.0
3
0·022.033.0·
·exp10· mfm
C
mH
R
Hg
q
(3.2)
The empirical formulas of the Eurotop Manual for dikes are the same as the formulations of
Rubble Mounds changing some coefficients ( and ). These influence factors can be checked
on the Eurotop Manual. Notice that there is an extra stretch for breaking parameters
and interpolation is needed between 5 and 7. This is not done with rubble mounds.
The input values are the spectral parameters measured at the toe of the dike. It is very
important to notice that they include the reflected wave, which can not be dissipated in the
flume, because it is laterally confined. However, wave overtopping should be computed with
the parameters of the incoming wave without any interaction with the structure, so reflection
must be subtracted. For this reason, the recorded values from some previous wave
propagation tests without any structure at the toe of the dike to compute the input
parameters are used.
To start with, 4 simulations with SWASH with 3 different slopes and 2 freeboards were
performed. Different dike profiles were tested varying these two parameters, because they are
thought to have the larger influence. This is a kind of rough and limited sensitivity analysis, but
some clear conclusions can be drawn. These tests are not commented here in detail, only the
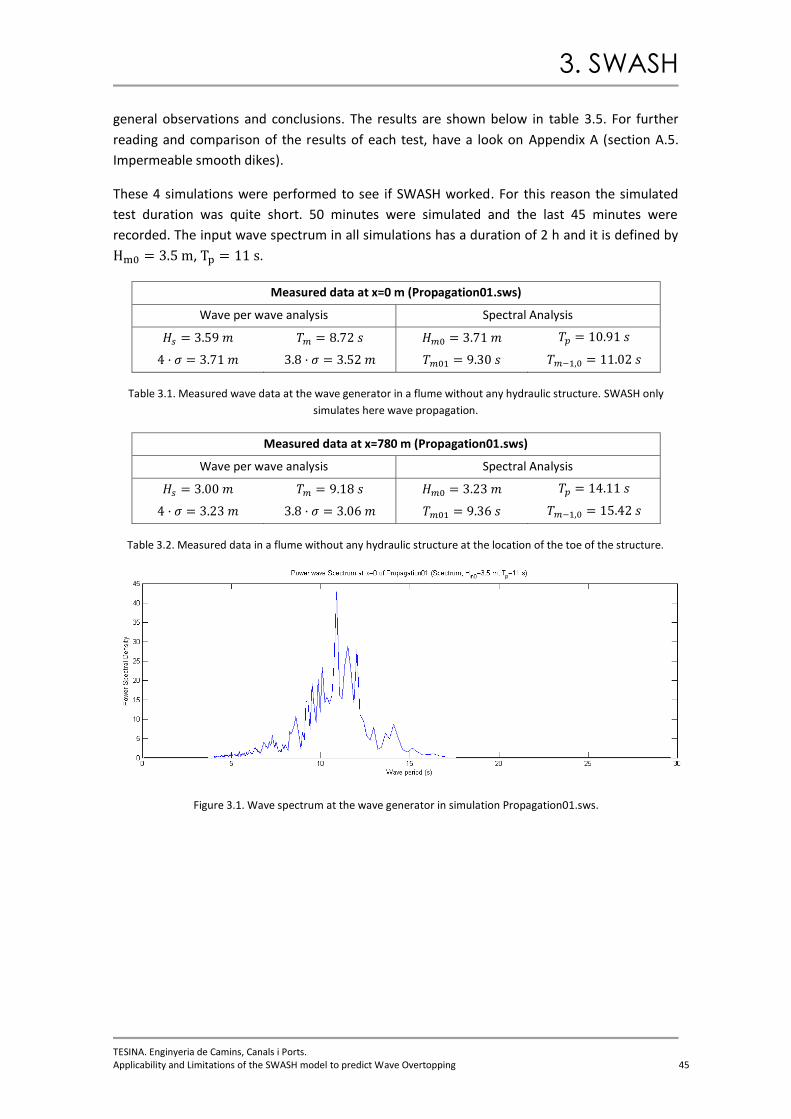
3. SWASH
TESINA. Enginyeria de Camins, Canals i Ports. Applicability and Limitations of the SWASH model to predict Wave Overtopping 45
general observations and conclusions. The results are shown below in table 3.5. For further
reading and comparison of the results of each test, have a look on Appendix A (section A.5.
Impermeable smooth dikes).
These 4 simulations were performed to see if SWASH worked. For this reason the simulated
test duration was quite short. 50 minutes were simulated and the last 45 minutes were
recorded. The input wave spectrum in all simulations has a duration of 2 h and it is defined by
, .
Measured data at x=0 m (Propagation01.sws)
Wave per wave analysis Spectral Analysis
Table 3.1. Measured wave data at the wave generator in a flume without any hydraulic structure. SWASH only
simulates here wave propagation.
Measured data at x=780 m (Propagation01.sws)
Wave per wave analysis Spectral Analysis
Table 3.2. Measured data in a flume without any hydraulic structure at the location of the toe of the structure.
Figure 3.1. Wave spectrum at the wave generator in simulation Propagation01.sws.
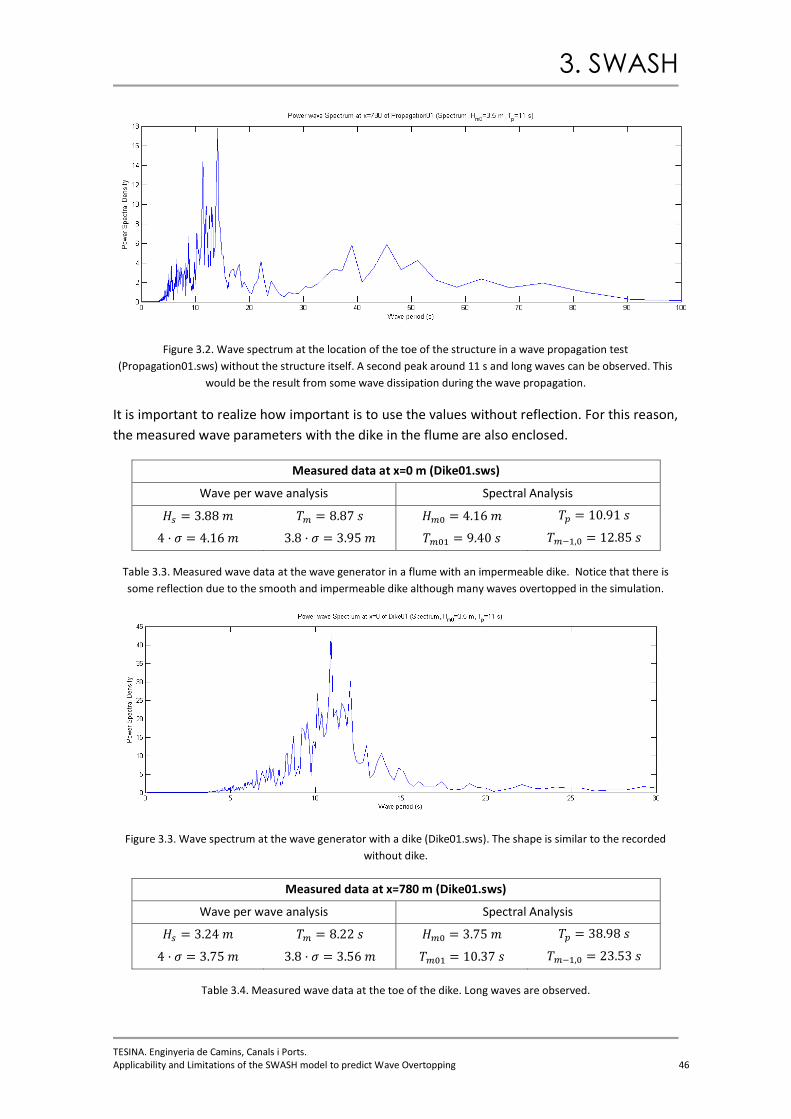
3. SWASH
TESINA. Enginyeria de Camins, Canals i Ports. Applicability and Limitations of the SWASH model to predict Wave Overtopping 46
Figure 3.2. Wave spectrum at the location of the toe of the structure in a wave propagation test
(Propagation01.sws) without the structure itself. A second peak around 11 s and long waves can be observed. This
would be the result from some wave dissipation during the wave propagation.
It is important to realize how important is to use the values without reflection. For this reason,
the measured wave parameters with the dike in the flume are also enclosed.
Measured data at x=0 m (Dike01.sws)
Wave per wave analysis Spectral Analysis
Table 3.3. Measured wave data at the wave generator in a flume with an impermeable dike. Notice that there is
some reflection due to the smooth and impermeable dike although many waves overtopped in the simulation.
Figure 3.3. Wave spectrum at the wave generator with a dike (Dike01.sws). The shape is similar to the recorded
without dike.
Measured data at x=780 m (Dike01.sws)
Wave per wave analysis Spectral Analysis
Table 3.4. Measured wave data at the toe of the dike. Long waves are observed.

3. SWASH
TESINA. Enginyeria de Camins, Canals i Ports. Applicability and Limitations of the SWASH model to predict Wave Overtopping 47
Figure 3.4. Wave spectrum recorded at the toe of the dike (Dike01.sws). Many peaks and long waves are observed
compared with the situation without a dike. The reflection produced by the smooth dike and the waves running up
and down the slope would explain them.
Model
( ) Slope
( ⁄ )
( )⁄
( )⁄
( )⁄
Dike01.sws 2.5 1:2 5.36 478.1 267.0 487.6 207.8 - 1106
Dike02.sws 5 1:2 5.36 69.3 22.8 190.7 84.81 - 421.6
Dike03.sws 5 1:3 3.57 65.0 21.1 262.0 98.14 - 678.3
Dike04.sws 2.5 1:4 2.68 486.1 269.3 577.3 258.9 - 1318
Table 3.5. Estimations of mean wave overtopping over impermeable smooth dikes given by Eurotop empirical
formulas, SWASH and Neural Networks. Only the incoming wave without reflection has been considered.
As shown in table 3.5, SWASH computes an overtopping discharge that is always smaller than
the estimated values from the formulas of the Wave Overtopping Manual (Eurotop). They
have the same order of magnitude, which is very important, although the relative differences
look quite large (56%, 33%, 32% and 55% respectively). Overtopping increases with a lower
freeboard. Despite the fact that SWASH gives smaller discharge values, this is reasonable
according to the Wave Overtopping Manual, because the empirical formulas tend to
overestimate the wave overtopping discharge, as wave overtopping is measured behind the
crest and the number of waves that reach the crest on the front slope is computed. Hence,
SWASH gives results which should be “on the safer side” of the empirical formulations. For
these reasons, it is concluded at this stage that SWASH computes quite accurate the mean
wave overtopping discharge when compared to the Eurotop guidelines.
Furthermore, the on-line free Neural Network available at Deltares5 website was used to check
the results. This NN6 is incorporated in the software BREAKWAT, developed by Deltares,
although the latter software requires purchasing a licence, and it was developed with the
database created through the European Project CLASH.
5 Deltares, formally WL | Delft Hydraulics, is a research institute that collaborates with TU Delft. It is an independent
non-profit company. 6 NN: Neural Network
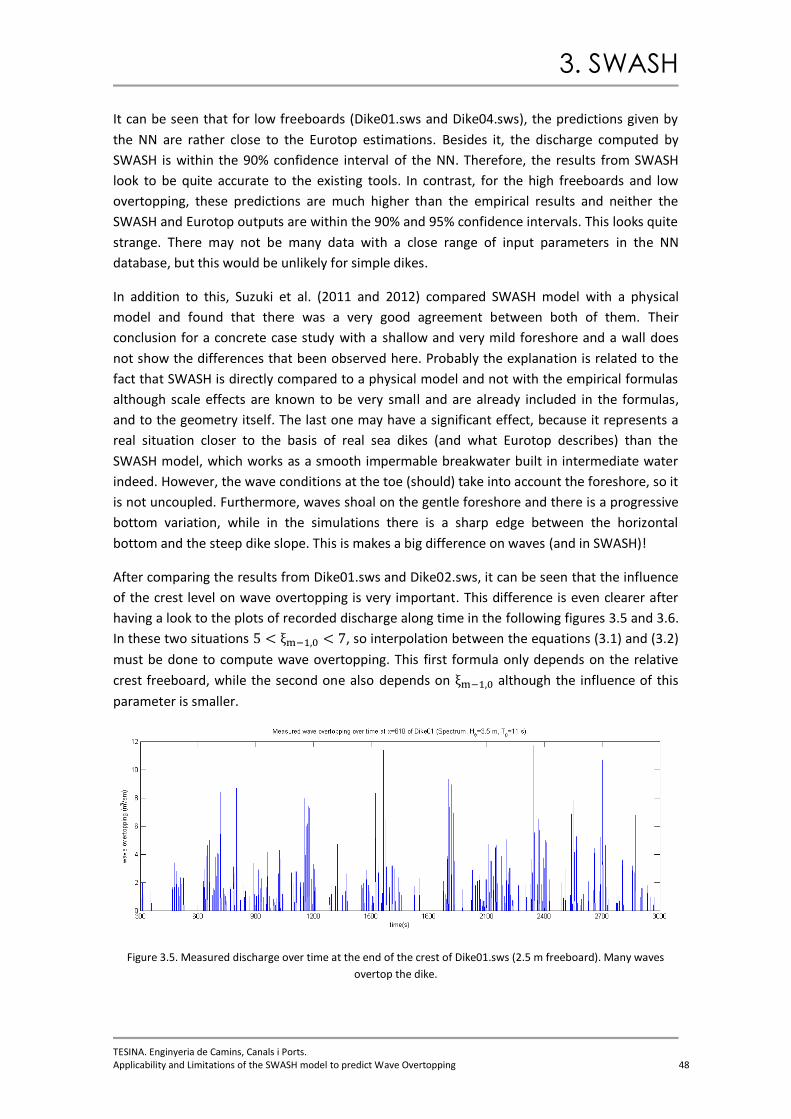
3. SWASH
TESINA. Enginyeria de Camins, Canals i Ports. Applicability and Limitations of the SWASH model to predict Wave Overtopping 48
It can be seen that for low freeboards (Dike01.sws and Dike04.sws), the predictions given by
the NN are rather close to the Eurotop estimations. Besides it, the discharge computed by
SWASH is within the 90% confidence interval of the NN. Therefore, the results from SWASH
look to be quite accurate to the existing tools. In contrast, for the high freeboards and low
overtopping, these predictions are much higher than the empirical results and neither the
SWASH and Eurotop outputs are within the 90% and 95% confidence intervals. This looks quite
strange. There may not be many data with a close range of input parameters in the NN
database, but this would be unlikely for simple dikes.
In addition to this, Suzuki et al. (2011 and 2012) compared SWASH model with a physical
model and found that there was a very good agreement between both of them. Their
conclusion for a concrete case study with a shallow and very mild foreshore and a wall does
not show the differences that been observed here. Probably the explanation is related to the
fact that SWASH is directly compared to a physical model and not with the empirical formulas
although scale effects are known to be very small and are already included in the formulas,
and to the geometry itself. The last one may have a significant effect, because it represents a
real situation closer to the basis of real sea dikes (and what Eurotop describes) than the
SWASH model, which works as a smooth impermable breakwater built in intermediate water
indeed. However, the wave conditions at the toe (should) take into account the foreshore, so it
is not uncoupled. Furthermore, waves shoal on the gentle foreshore and there is a progressive
bottom variation, while in the simulations there is a sharp edge between the horizontal
bottom and the steep dike slope. This is makes a big difference on waves (and in SWASH)!
After comparing the results from Dike01.sws and Dike02.sws, it can be seen that the influence
of the crest level on wave overtopping is very important. This difference is even clearer after
having a look to the plots of recorded discharge along time in the following figures 3.5 and 3.6.
In these two situations , so interpolation between the equations (3.1) and (3.2)
must be done to compute wave overtopping. This first formula only depends on the relative
crest freeboard, while the second one also depends on although the influence of this
parameter is smaller.
Figure 3.5. Measured discharge over time at the end of the crest of Dike01.sws (2.5 m freeboard). Many waves
overtop the dike.

3. SWASH
TESINA. Enginyeria de Camins, Canals i Ports. Applicability and Limitations of the SWASH model to predict Wave Overtopping 49
Figure 3.6. Measured discharge over time at the end of the crest of Dike02.sws (5 m freeboard). Only a few waves
go over the crest and the overtopping volumes are small.
The other 2 dikes have a relatively large and wave overtopping should be
computed through the second branch of the equation (3.1), which is an upper bound that does
not depend on and only on the relative freeboard and the influence factors of slope
roughness and wave obliqueness. As a result, no comparisons strictly related to the slope can
be made between these two tests. The slope does not affect much the waves at the toe (there
is not a significant difference, only 0.1 m). In addition to this and as it was expected, much
larger overtopping is measured with a lower crest.
If we want to compare the results from the Dike01.sws and Dike02.sws with Dike03.sws and
Dike04.sws, we must be aware that we are comparing different formulas, or different
stretches.
A small and ridiculous reduction of the overtopping discharge is found with milder slopes when
there is a high crest, but the “same result” is found with low freeboards. The numbers are very
close and have the same order of magnitude. It seems that there is no influence of the slope
though and only on the freeboard. These observations agree with the second stretch of
equation (3.1), which does not depend on the slope, and with (3.2), where the coefficient that
multiplies or ( ) is 15 times smaller than the other, reducing the influence of the
slope. Then, in this brief sensitivity analysis, the results measured in SWASH and the
differences between the different cases are satisfactory and in line with the predictions given
by the Eurotop formulas.
It would be interesting to test SWASH for even smaller Iribarren numbers. It thought that the
most interesting option would be decreasing the wave period instead of increasing the wave
height or decreasing the slope, since quite high and long waves and a very gentle slope of 1:4
have been already tested.
Remember that the values of the spectral analysis at the toe of the dike have been used to
compute the expected wave overtopping through the empirical formulations of Eurotop, and
that the wave height at the that place includes the reflected wave (which can not be dissipated
in the flume). The data from only the incoming wave is obtained from Propagation01.sws, a

3. SWASH
TESINA. Enginyeria de Camins, Canals i Ports. Applicability and Limitations of the SWASH model to predict Wave Overtopping 50
SWASH simulation that propagates the same wave spectrum and measures the waves at the
same point without the structure.
Since the results of these 4 simulations were thought to be satisfactory and no problems
related to SWASH were found, more tests with a longer simulated duration time and different
wave conditions were performed. The results are shown in table 3.6.
The dimensionless discharges have been also plotted in figure 3.7. In the graph, the measured
discharge in SWASH can be compared to the predictions of Eurotop and Neural Networks. The
exponential function that fits the measured discharges has a correlation factor .
The mean and the 90% confidence interval of both methods are drawn. As it can be seen, the
fitted function of the measured overtopping discharge is always below the lower 5% limit
predicted by both methods. The measured values are very close to the limit for high
overtopping, but the difference increases for lower discharges. The latter could be explained
due to the low reliability of small values of wave overtopping. In addition to this, the tests
Dike11.sws, Dike12.sws and Dike13.sws were not included on the graph, because no
overtopping was recorded. Previously, it has been commented that the Eurotop formulas tend
to overestimate the discharges, which may explain why SWASH underestimation, although
these overestimations are found to be small in other cases. Furthermore, absolutely no
calibration of friction and reflection was done. Friction should not be important, because a
smooth dike was considered and with friction discharges would reduce. In contrast, the
interaction with the reflected wave may be quite important, since it may slow down the
incoming overtopping wave and reduce it. This is just a hypothesis. After analysing the
magnitude of the reflected wave, it will be known if this has an influence on the results.
Simulation
( ) Slope
Incoming wave at the
toe without reflection
( ⁄ )
( )⁄
( )⁄
( )⁄ ( ) ( )
Dike01.sws 2.5 1:2 3.23 15.42 5.36 478.1 267.0 487.6 207.8 - 1106
Dike02.sws 5 1:2 3.23 15.42 5.36 69.3 22.8 190.7 84.81 - 421.6
Dike03.sws 5 1:3 3.23 15.42 3.57 65.0 21.1 262.0 98.14 - 678.3
Dike04.sws 2.5 1:4 3.23 15.42 2.68 486.1 269.3 577.3 258.9 - 1318
Dike05.sws 2.5 1:2 3.19 14.35 5.02 464.8 261.5 456.5 211.0 – 1003
Dike06.sws 5 1:2 3.19 14.35 5.02 60.9 20.9 174.1 81.3 – 326.9
Dike07.sws 5 1:3 3.19 14.35 3.35 60.6 18.3 252.5 93.6 – 617.4
Dike08.sws 2.5 1:4 3.19 14.35 2.51 465.2 260.4 547.8 272.3 – 1170
Dike09.sws 2.5 1:2 1.82 8.00 3.70 43.2 3.8 64.1 25.3 – 165.8
Dike10.sws 2.5 1:2 1.40 7.46 3.94 10.0 0.43 20.3 6.5 – 64.9
Dike11.sws 5 1:2 1.82 8.00 3.70 1.22 0 2.3 0.8 – 5.7
Dike12.sws 5 1:3 1.82 8.00 2.47 1.22 0 1.6 0.7 – 3.5
Dike13.sws 2.5 1:4 1.82 8.00 1.85 43.2 0 30.3 16.8 – 55.3
Table 3.6. Estimations of mean wave overtopping over impermeable smooth dikes given by Eurotop empirical
formulas, SWASH and Neural Networks. Only the incoming wave without reflection measured at the location of the
structure toe has been considered.

3. SWASH
TESINA. Enginyeria de Camins, Canals i Ports. Applicability and Limitations of the SWASH model to predict Wave Overtopping 51
The majority of the measured discharges in SWASH have the same order of magnitude of the
Eurotop predictions. This means that the results are quite good though some relatively
important differences are found for low crests and small waves. As the Eurotop formulas do in
the considered range, practically no differences are found between different slopes and
same freeboard. In both cases, the differences are negligible. In contrast, a completely
different behaviour was found in NN. It was surprising that with steeper slopes, less
overtopping was predicted with large waves. However, the opposite was observed with
smaller waves. The NN was mainly developed from small-scale models and a prototype was
here considered. Then, it is likely that some scaling and modelling effects would influence the
predictions. In addition to this, for impermeable crests it was asked to consider a width of zero
meters (CLASH workpackage 8, Coveld et al., 2005). Then, the measured discharge was in fact
the recorded at the beginning of the crest, which is slightly larger than at the back, because
there are waves that reach the top, but not the end of the crest. These two factors would
explain some overestimation with respect to Eurotop.
Finally, and after thinking about the different types of wave overtopping (see section 1.2) and
how SWASH models water motion, it became clear that SWASH does not describe all of them.
Since SWASH uses the Navier-Stokes shallow water equations, it can only describe the motion
of a continuous fluid body. Therefore, “green water” overtopping (continuous water sheet that
runs up the slope and overtops) is taken into account, but not “white water” or “spray”
overtopping (due to splash). The latter one needs a model such as MAC (Marker And Cell), VOF
(Volume Of Fluid) or SPH (Smoothed-Particle Hydrodynamics) to describe the behaviour of the
water particles that are suspended after breaking and travel over the structure. These
methods are not described in this thesis. SWASH models wave breaking in a simpler way taking
into account the integral aspects of the process such as bulk energy dissipation and wave
height reduction, but not splash. Thus, SWASH is only able to give reasonable good predictions
in situations where “green water” overtopping is predominant, e.g. beaches and mild dikes.
Figure 3.7. Dispersion graph comparing the measured discharge in SWASH with the predicted overtopping by the
Eurotop formulas and the Neural Network. The lower and upper limits of Eurotop and NN are also plotted. The three
results of SWAH that gave nil overtopping are not drawn.
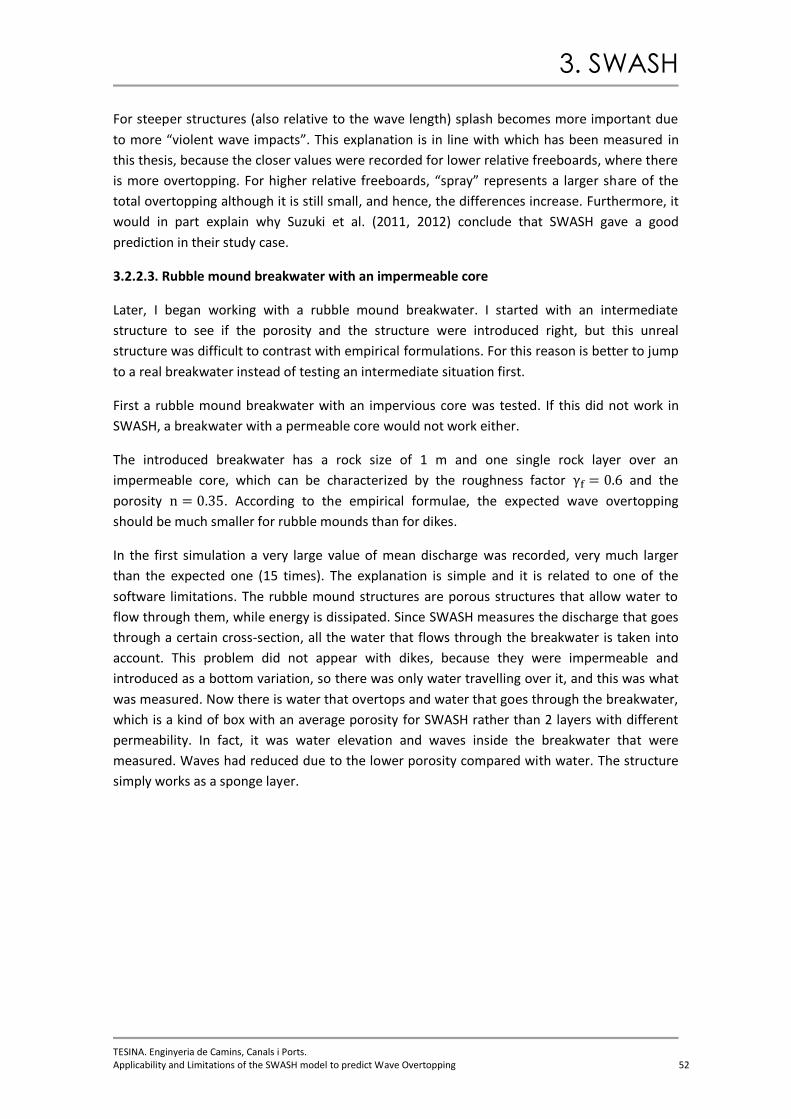
3. SWASH
TESINA. Enginyeria de Camins, Canals i Ports. Applicability and Limitations of the SWASH model to predict Wave Overtopping 52
For steeper structures (also relative to the wave length) splash becomes more important due
to more “violent wave impacts”. This explanation is in line with which has been measured in
this thesis, because the closer values were recorded for lower relative freeboards, where there
is more overtopping. For higher relative freeboards, “spray” represents a larger share of the
total overtopping although it is still small, and hence, the differences increase. Furthermore, it
would in part explain why Suzuki et al. (2011, 2012) conclude that SWASH gave a good
prediction in their study case.
3.2.2.3. Rubble mound breakwater with an impermeable core
Later, I began working with a rubble mound breakwater. I started with an intermediate
structure to see if the porosity and the structure were introduced right, but this unreal
structure was difficult to contrast with empirical formulations. For this reason is better to jump
to a real breakwater instead of testing an intermediate situation first.
First a rubble mound breakwater with an impervious core was tested. If this did not work in
SWASH, a breakwater with a permeable core would not work either.
The introduced breakwater has a rock size of 1 m and one single rock layer over an
impermeable core, which can be characterized by the roughness factor and the
porosity . According to the empirical formulae, the expected wave overtopping
should be much smaller for rubble mounds than for dikes.
In the first simulation a very large value of mean discharge was recorded, very much larger
than the expected one (15 times). The explanation is simple and it is related to one of the
software limitations. The rubble mound structures are porous structures that allow water to
flow through them, while energy is dissipated. Since SWASH measures the discharge that goes
through a certain cross-section, all the water that flows through the breakwater is taken into
account. This problem did not appear with dikes, because they were impermeable and
introduced as a bottom variation, so there was only water travelling over it, and this was what
was measured. Now there is water that overtops and water that goes through the breakwater,
which is a kind of box with an average porosity for SWASH rather than 2 layers with different
permeability. In fact, it was water elevation and waves inside the breakwater that were
measured. Waves had reduced due to the lower porosity compared with water. The structure
simply works as a sponge layer.

3. SWASH
TESINA. Enginyeria de Camins, Canals i Ports. Applicability and Limitations of the SWASH model to predict Wave Overtopping 53
Figure 3.8. Profile of the flume with the breakwater profile (Imp_Mound01.sws), the mean water level (set-up) and
the crest and trough limits of the spectral wave height.
Figure 3.9. Profile of the breakwater with the waves going through (Imp_Mound01.sws). The waves break
approximately 5 m in front of the toe, while they should do so on the first third of the slope.
Besides, due to the waves, here the net discharge and not the absolute discharge must be
considered. It is important to remember about the oscillatory motion of waves, so water
moves forward and backwards. If the net discharge is computed using an output vector, a
value close to the predicted overtopping (about the 46%) is obtained. This includes the flow
through the breakwater. In dikes it was not necessary to worry about the discharge vector,
because over the crest there was water moving only in the same direction. This was checked
and the same results were reached.
Figure 3.10. Recorded net discharge over time at the end of the crest (Imp_Mound01.sws). The positive values
mean discharge in the propagating wave direction.

3. SWASH
TESINA. Enginyeria de Camins, Canals i Ports. Applicability and Limitations of the SWASH model to predict Wave Overtopping 54
The software can not split the flow in these two components (over and through the
breakwater), because SWASH does not consider the breakwater as a physical obstacle with
some porosity that allows water to go through and stops part of it making it go over through
splash or a water tongue. The software models the rubble mound as a kind of sponge layer in
which the wave goes through and some energy is dissipated. As a result, there is no water
travelling over the structure. From the measured water depth and absolute and net velocities
the same absolute and net discharge are computed. In fact, the introduced structure height is
only used (in combination with the structure and water porosities and the water depth) to
compute an average porosity value to be used in the equations. As a result, SWASH does not
consider the structure geometry (freeboard, slope, etc.) as a physical boundary as it is done
with the bottom layer or as I did with dikes. One example of this is the location of the breaking
waves (see figure 3.9). This will be commented in section 3.3, where it is explained with more
detail how SWASH deals with porosity.
Nevertheless, the introduced breakwater has an impervious core and one layer of one-meter
size rock placed on it, which means that water can only flow through the armour layer and
over it. Assuming this stone size and this single rock layer, the armour width will be around 2
meters ( ), so little water can go through. Thus, I think that it can be assumed that a
considerable part of the water flow through the cross-section would be overtopping. However,
this is a risky assumption since little is really known about permeable crests and its influence
on overtopping.
Later, different breakwaters with a lower expected overtopping were simulated and much
larger net discharges were measured. As a consequence, it is clear that the measured net
discharge in SWASH cannot be trusted to be an indicator of the wave overtopping. The table
3.7 includes the results. The Eurotop prediction takes into account the width of the permeable
crest (section 2.1.4).
Simulation
( ) Slope
( )
( )
( ⁄ )
( )⁄
( )⁄
( )⁄
Imp_Mound01.sws 2.5 1:2 3.23 15.42 5.36 38.1 17.45 195.4 21.39 - 2245
Imp_Mound02.sws 5 1:2 3.23 15.42 5.36 1.3 15.5 8.8 1.317 – 65.57
Imp_Mound03.sws 5 1:1 3.23 15.42 10.72 1.3 18.9 38.5 3.86 – 339.9
Imp_Mound04.sws 2.5 1:2 1.87 8.20 14.99 0.27 6.2 3.5 0.554 – 21.56
Table 3.7. Estimations of mean wave overtopping over rubble mound breakwaters with an impermeable core given
by Eurotop empirical formulas, SWASH and Neural Networks. Only the incoming wave without reflection measured
at the location of the structure toe has been considered.
The discharge measured by SWASH in the first 3 simulations hardly changes. Furthermore, the
four dimensionless discharges (not included in the table) are within a very small range
between and , so it can be assumed that there is a kind of
constant discharge value that depends on the wave properties and the introduced porosity in
SWASH.

3. SWASH
TESINA. Enginyeria de Camins, Canals i Ports. Applicability and Limitations of the SWASH model to predict Wave Overtopping 55
This list of new problems was thought to be overcome by modelling the impermeable core as
it had been done with dikes. A more realistic model would result from this approach and the
discharge over the core crest, which would be the discharge going over and through the
permeable crest, could be measured. The impermeable core was described as a bottom
variation and a porous structure over it representing the armour layer was added. Two
different tests were performed: the first one with only the seaward slope covered by this
permeable layer and the second one with the complete armour layer over the core. However,
none of them worked. SWASH interpreted the emerged part of the core as an impermeable
wall and nothing was measured beyond it. It is not know why it did not work, but it is thought
to be related to how the software deals with the porous structures. Probably, SWASH did not
understand that a porous structure was placed over a part of the bottom that is above the
initial water level and remains dry during part of the time.
Figure 3.11. Breakwater profile with a thin porous structure (armour) placed over a bottom variation (impermeable
core). The impermeable core is the same profile as one of the previously tested dikes. No agitation is recorded
behind the structure. The strange values plotted inside the core correspond to the wave output values given by
SWASH, which are non-sense in the dry points. The script file is Mound02.sws.
To sum up, SWASH models the breakwater as a kind of sponge box that dissipates energy of
the waves going through rather than a set of big stones. The water body is continuous and
there is no splash going over the breakwater or water tongue running up and down the slope.
As a consequence, the only water particles that will go over the crest will be the wave itself if it
is enough big. The net water discharge through the cross-section was measured, but it includes
all the water, so it is not possible to distinguish wave overtopping discharge from the flow
inside the breakwater. From the considerations made about our rubble mound breakwater
cross-section, I think that the inner flow will be small, because of the thickness of the single
rock porous layer over an impervious thick core. As a result, big part of the water flow should
be overtopping, which is enhanced by the impermeable core, because water can not go
through and cumulates (as commented in Eurotop). However, I did not manage to introduce a
multi-layered structure with an impermeable core in SWASH, which would let me directly
measure the discharge over it; research results do not agree how much water goes over and
through the crest, so any hypothesis about this division is doubtful; and it is clear that SWASH
does not model waves breaking on rubble mound breakwaters as we physically understand.
Therefore, I conclude that this is not a good model to study wave overtopping on rubble
mound breakwaters (yet).

3. SWASH
TESINA. Enginyeria de Camins, Canals i Ports. Applicability and Limitations of the SWASH model to predict Wave Overtopping 56
3.3. Porosity in SWASH
SWASH models porous flow through the Forchheimer law (3.3), which is an improvement of
the Darcy law by adding a turbulent term to the laminar one:
x
p
guubuaI
w
fff
1 (3.3)
The Forchheimer formula can be derived from the Navier-Stokes equations and it results in the
following expression (Andersen and Burcharth, 1995):
2
50
32
50
3
2111
f
n
f
n
uDgn
nu
Dgn
nI
(3.4)
The Forchheimer equation is only valid for stationary conditions and the coefficients and
must be determined experimentally. Polubarinova-Kocina (1952) extended the Forchheimer
formula by adding a local acceleration term and a new coefficient. However, the initial 2
coefficients are different in non-stationary conditions according to Van Gent (1993).
This brief introduction to porous flow summarizes what B. Mellink (2012) explained with more
detail in his Master Thesis, where he referred to all the original publications.
A porous structure is introduced in SWASH through 3 input grids, in which the structure height
above the bottom level, the grain size and the porosity are introduced. As it has been
commented previously, porosity values smaller than 0.1 can not be introduced (because a
power of 3 is at the denominator) and this value is considered to represent an impermeable
wall. Water has got porosity 1. From the introduced structure porosity and height and the
water depth from the surface to the structure height, an average porosity value is computed.
This value will be used in the computations with the total water depth going from the surface
to the bottom. So the structure height is only taken into account as a weight factor to compute
the average porosity to be applied in the total water depth and the physical structure is
ignored afterwards. Therefore, if there is a slope, SWASH will consider a varying average
porosity along it (see figures 3.12 and 3.13), but not the slope as a physic boundary (as it does
with dikes), because the bottom is below. As a result, a porous structure acts as a sponge layer
that slows down the water flowing through it rather than an obstacle that diverts the flow (and
thus, there is no overtopping and only a continuous wave).

3. SWASH
TESINA. Enginyeria de Camins, Canals i Ports. Applicability and Limitations of the SWASH model to predict Wave Overtopping 57
Figure 3.12. Porosity considered in the water body by SWASH along the flume in script Imp_Mound01.sws.
Figure 3.13. Porosity considered by SWASH at the breakwater location. It is constant in the entire water depth. A
porosity grading can be seen along the slopes and constant values under the crest and where there is no structure.
These values were used in Imp_Mound01.sws.
In addition to this, the porosity is only taken into account in the horizontal component of the
momentum conservation equations. Hence, only the horizontal velocity component is damped
by the porous structure, while the porosity does not affect the vertical component. This is
quite an unreal situation, because it is assumed that the water particles can move up and
down inside a porous structure as easy as outside without any kind of friction and energy
losses. The consequence is that there is a continuous water surface even inside the porous
structure, because it simply propagates slower in the horizontal plane.
In reality, there is a discontinuity in the water elevation inside a rubble mound breakwater (or
any kind of permeable structure), because the water level inside can not follow the water
surface variations from outside due to grain friction. Then, both flows are “uncoupled”, since
the vertical propagation accelerations are different. Only close to the interphase zone, inertia
of the incoming waves is enough strong to overcome internal friction and keep the inner
surface variations.
As it can be seen in figures 3.14, 3.15 and 3.16, there is not a (fast) decrease of the water level
or the wave height inside the breakwater.

3. SWASH
TESINA. Enginyeria de Camins, Canals i Ports. Applicability and Limitations of the SWASH model to predict Wave Overtopping 58
Figure 3.14. Waves propagating through the breakwater in simulation Imp_Mound02.sws. The blue lines represent
the crest and trough of the recorded significant wave height. Only a progressive damping is observed.
Figure 3.15. Difference between the real water surface inside the porous structure and the water level measured in
SWASH. (Mellink, 2012).
What can be observed in all simulations with a porous structure is that the waves break
between 5 and 10 m in front of the breakwater toe, which is not true. They should break on
the slope at the point where the current wave height is larger than the maximum allowed by
the water depth [ ] .

3. SWASH
TESINA. Enginyeria de Camins, Canals i Ports. Applicability and Limitations of the SWASH model to predict Wave Overtopping 59
Figure 3.16. Wave breaking 5 meters in front of the breakwater toe (Imp_Mound01.sws). No run-up or overtopping
takes place.
This contrasts to what happens with dikes, where the bottom variation reduces the water
depth inducing wave breaking. The waves break where they are expected to do so. Just
compare figures 3.16 and 3.17, where the same profiles and waves were simulated. This is a
proof that SWASH does not consider the structure profile as the most important feature that
interacts with waves outside the breakwater. Instead, it is its porosity.
Figure 3.17. Profile of an impermeable smooth dike (Dike05.sws). Waves break on the slope at 4-meter water depth
and run-up the slope. The recorded set-up includes the run-up water tongue. Some agitation is also recorded
behind the dike due to large wave overtopping. SWASH is not able to give wave outputs where there is not always
water, which explains the strange values shown in the plot.
For SWASH, the porous structure begins at the toe, where the porosity of the propagation
medium begins to reduce. The reduction of porosity along the whole structure width increases
the flow resistance and slows down the propagating wave. Part of it goes through and it is
damped (transmitted wave), but the other part can not and water “accumulates” in front of
the structure as it would do in a flow contraction rising the water level (reflected wave). This is
how I would explain that the wave “notices” the structure “much earlier”.
Nevertheless, the (precise) numerical reason that explains it is not that clear. Probably it would
be a mix of the lack of vertical damping, calibration of the transmitted and reflected wave, the
way the structure itself has been modelled and the formulation of overtopping.

3. SWASH
TESINA. Enginyeria de Camins, Canals i Ports. Applicability and Limitations of the SWASH model to predict Wave Overtopping 60
I could even say that part of the water that accumulates in front of the structure, and part of
the wave volume that propagates through it without vertical damping, would be the
overtopping volume that is missing.
B. Mellink in his Master Thesis (2012) studied the wave interaction with a porous breakwater.
He did some small scale tests and compared the experimental results with a numerical model
built with SWASH. Although he focused on wave reflection and transmission, he faced some
problems with SWASH modelling that are thought to have the same origin. Therefore, his
experience and conclusions are very important for this thesis.
Reflection and transmission was not calibrated in the tests performed in this thesis although if
it is done, the computed wave overtopping on dikes may be more reliable and comparable to
experimental data. The default parameters were not changed.
For a vertical porous structure, Mellink found that the experimentally determined Forchheimer
constants gave a severe underestimation of the reflected wave and an overestimation of the
transmitted wave in SWASH compared to the analytical and experimental data. The calibrated
values were unrealistic, but gave a good fit. However, it is not sure if this is only needed for
vertical structures or the same behaviour always takes place.
Mellink also comments a suggestion of Van Gent about the need of higher values in SWASH.
His hypothesis is that the interphase between the water and the porous medium is not well
modelled, because vertical accelerations near the water surface behave differently in a porous
medium. This would explain why there is not a discontinuity in the water surface. The
transition between both phases is modelled in SWASH by a continuity formulation. This leads
to a larger incoming wave, and thus, a smaller reflected wave and a larger transmitted one.
This transition effect was found to be lower in wider porous blocks.
3.4. Conclusions
In this section the conclusions reached with SWASH are summarized.
Wave propagation is well modelled with SWASH. Some small dissipation takes place, but it can
be explained by the physical behaviour of waves in intermediate water conditions. The wave
height outputs given by SWASH ( and ) match with the computed parameters
through spectral analysis ( √ and √ ) and the water elevation
variance ( and √ ). The measured significant wave height through
wave per wave analysis is slightly smaller than the spectral value , around
, which is something already known. In order to avoid reflection, it is very important to
introduce an enough big sponge layer at the end. A length of about 3 times the wave length
will suffice. Otherwise a standing wave will take place.
The best way to model a dike in SWASH is with a bottom variation, because it is an
impermeable bottom boundary and water can flow over it without any problem. Some
roughness could be added as a bottom friction. Despite absolutely no calibration for friction
and reflexion was done, the performed tests showed promising good predictions of wave
overtopping. The measured discharges over the dike crest were always smaller than the

3. SWASH
TESINA. Enginyeria de Camins, Canals i Ports. Applicability and Limitations of the SWASH model to predict Wave Overtopping 61
predicted values using the Eurotop formulas for dikes (and also using Neural Networks), but
they had the same “order of magnitude”, which is quite important when talking about
overtopping. However, all measured results appeared to be below the 5% lower limit of
Eurotop and Neural Network predictions.
One reason why the measured overtopping is always smaller is due to the fact that SWASH is
not able to describe splash. Therefore, the “white water” or “spray” overtopping is not in the
model, and so, the measured overtopping in SWASH does not include this part of the total
overtopping, which is estimated to be less than 10%. Only the continuous water tongue that
runs up the slope and overtops, which is called “green water”, is modelled by the shallow
water equations. For this reason, the differences increase with low overtopping values in dikes
with high relative freeboards, because a larger share of the total overtopping corresponds to
“white water”. Besides the missing splash, differences increase because of the lower reliability
of the formulas for very small overtopping discharges. As a recommendation, it would be nice
to test more different situations, analyse first the reflected wave to see if the magnitude is
right and if it affects the overtopping discharge, and add and calibrate friction on the slope due
to grass or any kind of smooth revetment.
Furthermore, other hypothesis related to the software modelling itself could explain this
systematic underestimation. The first one could be related to some possible limitations of the
modelling of wave breaking on steep slopes compared to mild ones, because Suzuki et al.
(2011 and 2012) showed that good estimations of wave overtopping were predicted in a very
shallow foreshore with a wall at the end. However, they also comment in Suzuki et al. (2011)
that some discrepancies were seen with small overtopping volumes in combination with a
rapidly varying topographic feature, such as a sea-wall. They considered that the reason may
be the inability of depth integrated models to represent the water tongue of the overtopping
waves. The latter could be the second reason, since their conclusions are in line with the fact
that there is an abrupt variation between the horizontal bottom and the dike slope (more than
what they tested). Maybe, SWASH does not model it accurately. Besides, this sharp edge
coincides with a computation grid node, which may have an influence on the computations.
SWASH can not predict overtopping in rubble mound breakwaters. In fact, it can not model
overtopping in any kind of permeable structure. Because of the way how porous structures are
dealt in SWASH, overtopping simply does not occur. The wave goes through the structure and
it is damped and part of its energy dissipated, but the flow is not diverted due to the
interference of the structure. The vertical velocities of the wave are not affected by the
porosity, so there is a continuous smooth water surface. The structure itself is not modelled as
a kind of boundary that interacts with waves, since they do not break on the slope, but before
reaching the toe of the structure. As a consequence, SWASH must be improved in this field by
adding the porosity to the vertical component of the flow equations and rethinking how the
structure geometry is introduced in the computations as a limit of the water depth. Somehow,
both inner and outer flow should be split, but at the same time linked by a small interphase
zone. Furthermore, at the moment the discharge and flow velocities can only be measured as
an average output value of the full (or layer) cross-section of the flume or the structure, but
not over a certain height.
4. Conclusions and recommendations
TESINA. Enginyeria de Camins, Canals i Ports. Applicability and Limitations of the SWASH model to predict Wave Overtopping 62
4. Conclusions and recommendations
In this chapter the conclusions reached in this thesis are exposed. Besides, some
recommendations about further research or future improvements of SWASH are given.
4.1. Conclusions and discussion
From the study of the available methods and the critic assessment done in chapter 2, it is clear
that Eurotop formulas give quite accurate good predictions of wave overtopping on simple
rubble mound slopes. However, the definition of the freeboard that should be used when the
crest is permeable is not clear yet. Neural Networks can be a powerful tool to compute
overtopping discharges in very complex structures, but the reliability of the results depends
very much on the availability of close situations in the database.
Little research had been done for breakwaters with a berm before the publication of the
Eurotop manual. As a result, in this manual a berm is modelled in the same way as in dikes.
However, the behaviour of a permeable berm combined with an armour layer is very much
different than an impermeable one with a smooth and impervious slope. Furthermore, for
reshaped berm breakwaters the mean slope was used to compute wave overtopping, which is
not realistic. Neural Networks can not be used either, because a few structures with a berm
were included in the database. One solution is using the formula developed by Lykke Andersen
and Burcharth for berm breakwaters, but only one slope was tested for non-reshaping
breakwaters and the equation was obtained through a multivariable fit, which resulted in a
very complex expression that is not handy to use.
Krom (from the work of Lioutas) and Sigurdson and van der Meer have proposed quite recently
different improvements to the Eurotop formulations starting from different approaches.
However, they have not been compared and we do not know which of them performs better.
At the moment, SWASH can not be used as a tool to predict wave overtopping in rubble
mound breakwaters, because it is not able to model this phenomenon in porous structures. In
contrast reflection and transmission could be studied with this software after calibration
according to Mellink. This was not done in this thesis though. As it has been commented in
chapter 3 with more detail, porous structures are not modelled in SWASH as a physical
obstacle for water flow, but as a dissipative box that damps the wave going through. In fact,
incoming waves are stopped and they break before reaching the structure toe. As a result, the
flow is not diverted upwards as overtopping and the wave is only slowed down and the wave
height reduces. The breakwater geometry does not interact with the waves, because it is not a
boundary for them that induce wave breaking. It is only an input to determine the average
porosity value to be used in the Forchheimer equation that describes water flow through a
porous media considering the entire water column. Furthermore, the porosity only affects the
horizontal component of the velocity. Thus, the vertical water motion is not hindered by the
porous structure, which is not realistic. For these reasons, it is clear that SWASH needs further
development for porous structures.

4. Conclusions and recommendations
TESINA. Enginyeria de Camins, Canals i Ports. Applicability and Limitations of the SWASH model to predict Wave Overtopping 63
Despite not working with permeable structures, SWASH is able to model wave overtopping on
impermeable dikes giving “promising” results although improvements must be made to get
good results. The measured discharges (13) are close to the predicted ones by Eurotop and
Neural Networks, they have the same order of magnitude and an exponential function can be
fitted with . Nevertheless, the measured trend function is smaller than the 5%
lower limit of both methods. The reflected wave has not been analysed and compared to any
analytical or experimental method, therefore, its influence in the results is unknown. The
recorded “interaction” between the dike and the waves fits what really happens, because in
low crested dikes, a large sheet of water running up the slope has been recorded through the
wave set-up (“green water” overtopping), waves break on the slope when the critical depth is
reached and some wave agitation due to overtopping is measured behind the dike. There are
several reasons that could explain why SWASH underestimates wave overtopping.
In first place, SWASH is based on the Navier-Stokes shallow water equations, and thus, only a
continuous water body can be modelled. The consequence is that splash cannot be described,
so “white water” overtopping is not taken into account. This is a reason why the measured
wave overtopping in SWASH is always smaller than the predicted one, because a share is
(always) missing. This also could explain the larger differences found for low overtopping
values, because in these cases spray overtopping has more weight. However, overtopping due
to splash is always visually overestimated, it represents approximately less than 10% of the
total discharge and it is only important in very violent breaking.
The second reason is the low reliability of the empirical formulas and Neural Networks for low
overtopping discharges. This would explain the larger differences for this range of values, but
not the systematic underestimation.
In third place, the mathematical computations done by SWASH on the slope may not be
enough accurate, which has led to lower overtopping discharges. The causes are not clear
though. There may be some limitations or drawbacks in wave breaking on steep slopes.
Furthermore, quite an abrupt bottom variation is found between the horizontal foreshore and
the dike slope. This sharp edge may not be well modelled. Perhaps a finer mesh is needed to
describe better the process around the edge and the slope. It may not be a good idea to
compare the results of the simulations performed in this thesis with the very gentle foreshores
tested by Suzuki et al., because both situations are globally very different.
SWASH is a software tool that was developed for a very wide range of hydraulic situations. As a
consequence, it must use the same code and procedure to deal with absolutely different
situations. In addition to this, more emphasis was put on describing hydraulic processes rather
than boundary conditions and relations with certain structures. As a result, quite a robust
model was built with many applications such as wave propagation, which works quite well in
1D and 2D models, but it lacks of detail on certain issues such as flow through porous
structures, breakwaters description and interaction with waves and splash. Probably, for multi-
layered structures with many details such as a toe, a berm or a crown wall, specialized
software would give much better results at this moment. Besides, only in situations with mild
slopes (in relation to the incoming wave length) such as beaches or very gentle sloping dikes,
where there are no abrupt geometry variations, and where the largest share of wave

4. Conclusions and recommendations
TESINA. Enginyeria de Camins, Canals i Ports. Applicability and Limitations of the SWASH model to predict Wave Overtopping 64
overtopping corresponds to waves running up the slope and not to water particles that travel
over the crest due to splash, SWASH will give accurately good predictions to wave overtopping.
In other situations where splash is more important or the geometry presents “sharp edges”, it
is advised to use another type of model, e.g. VOF or SPH.
4.2. Recommendations
Many recommendations can be done about aspects of SWASH that need to be improved in the
future and about how to continue verifying if it is a good model.
SWASH has been roughly verified for impermeable dikes in this thesis, but only a few cases
were tested and the simulations were not calibrated for friction. Therefore, it is recommended
to test more dike profiles and/or wave conditions to get more results. These new simulations
should include situations with a low relative freeboard (and large expected relative
overtopping) to enlarge the range of tested parameters. Besides performing more tests, the
amount of reflection should be validated with existing analytical, empirical or physical models,
and if it were needed, the model should be calibrated.
The results show a nice trend of measured discharge, but there is still room for improvement
to correct the current underestimation of the wave overtopping. Otherwise, the range of
situations in which it could be used as a valid tool will be quite limited. Two main
recommendations are given:
- The numerical model should describe splash either in the BREAK mode or in a new one
to be able to give precise predictions of wave overtopping in any impermeable slope.
- Improve the “behaviour” of SWASH in abrupt geometry variations when modelling
wave overtopping. At the moment, it looks like the software cannot properly deal with
them. However, it is a finer mesh that perhaps is necessary to describe these
phenomena. It is advised to look first at the transition points and sharp edges instead
of at the steep elements, because the problem is related to variations from horizontal
or very gentle foreshores to steep slopes or vertical walls in a short distance. When the
length of the first element is very much longer than the second one, the differences
decrease.
The way how SWASH deals with porous structures should be clearly improved. Mellink already
proposed some measures about that (which I reaffirm) and new ones have been added:
- Porosity should be included in the vertical component of the equations that model the
water motion, so that the vertical movements are damped inside the porous structure.
This recommendation was also given by Mellink and it is supported with the results of
this thesis.
- The interphase between water and the porous structure should be improved in such a
way that there is not a (very) smooth transition between the water surface inside and
outside the breakwater. This zone would have to link an inner and an outer flow that
seem to be “uncoupled” rather than “continuous”. Furthermore, part of the water

4. Conclusions and recommendations
TESINA. Enginyeria de Camins, Canals i Ports. Applicability and Limitations of the SWASH model to predict Wave Overtopping 65
flow should be diverted into overtopping when the waves impact the structure.
Probably, this would be the most difficult recommendation to implement in SWASH.
Mellink already thought about improving the interphase, but the problem is more
evident and important when studying wave overtopping, because it can not be simply
overcome by calibrating the reflection and transmission coefficients of the
Forchheimer formula as he did.
- Related to the previous one, the structure geometry should act as a boundary bottom.
Despite being a permeable body that allows waves to propagate through, the
breakwater slope must induce wave breaking on it, because it limits water depth. The
porous structure should be modelled in a closer way to an impermeable bottom
condition to deal with the water flow outside it.
- In order to be able to describe wave interaction with rubble mound breakwaters,
SWASH should be able to model multilayer porous structures. It could be done by
superposing two (or more) grids of the commands POROSITY, PSIZE and HSTRUCTURE.
For example, the first one would represent the core and the second one, the armour
layer. Another alternative could be developing the idea that was previously tried
without success, which consisted on placing a porous structure over an impermeable
core described by a bottom variation. However, first it would be necessary to solve the
problems that have appeared and model water flow through an emerged porous
structure. On one hand, the first idea would need to further develop the modelling of
water flow through a porous media following the previously given recommendations.
On the other hand, the second one could be a way to overcome some of the problems
faced in SWASH without building a more complicated model, provided that the global
performance was found to be good enough.
- SWASH can only measure discharge through the complete cross-section, but not on a
part of it. Then, the software could not measure wave overtopping on rubble mound
breakwaters in case the found problems with porosity were solved. For this reason, it
would be a good idea to create a new output parameter that is able to measure
discharge over a certain specified height.

5. References
TESINA. Enginyeria de Camins, Canals i Ports. Applicability and Limitations of the SWASH model to predict Wave Overtopping 66
5. References
5.1. Consulted documents
Bruce, T., van der Meer, J.W., Franco, L., & Pearson, J.M. Overtopping performance of different
armour units for rubble mound breakwaters. Coastal Engineering, Volume 56, Issue 2. February
2009, Pages 166-179.
Casas Prat, M. Overview of Ocean Wave Statistics. Tesina d’Enginyeria de Camins, Canals i
Ports, Escola Tècnica Superior d’Enginyers de Camins, Canals i Ports de Barcelona, Universitat
Politècnica de Catalunya. 2008.
Available on: http://hdl.handle.net/2099.1/6034
Costal Engineering Manual. U.S. Army Corps of Engineers. 2008
Coveld, E.M., Van Gent, M.R.A., & Pozueta, B. Crest Level Assessment of Coastal Structures by
full-scale monitoring, neural network prediction and hazard analysis on permissible wave
overtopping. CLASH. EVK3-CT-2001-00058. Neural Network. Manual NN_OVERTOPPING. Clash
Work Package 8. Delft Hydraulics. 2005.
EurOtop. Wave Overtopping of Sea Defences and Related Structures: Assessment Manual.
Environmental Agency, UK; Expertise Netwerk Waterkeren, NL; Kuratorium für Forschung im
Küsteningenieurwesen, DE. 2007.
Available on: www.overtopping-manual.com
Jumelet, H.D. The influence of core permeability on armour layer stability. MSc Thesis, TU
Delft. 2010.
Available on:
http://repository.tudelft.nl/view/ir/uuid%3A38e5cf5c-bcf5-4433-a7cd-80334d79bb88/
Krom, J.K. Wave overtopping at rubble mound breakwaters with a non-reshaping berm. MSc
thesis, TU Delft. 2012.
Available on:
http://resolver.tudelft.nl/uuid:984bc5e5-8c04-4d35-b34a-2b871f636fa1
Lioutas, A.C. Experimental research on spatial distribution of overtopping. MSc Thesis, TU
Delft. 2010.
Available on:
http://repository.tudelft.nl/view/ir/uuid%3A0122fe2e-0260-489f-b258-6e167fa9a621
Lioutas, A., Smith, G.M., & Verhagen, H.J. Spatial distribution of overtopping. Proceedings of
33rd International Conference on Coastal Engineering, Santander, Spain, 2012.
Available on:
http://repository.tudelft.nl/view/ir/uuid%3A8fcdd179-3761-45dc-af70-ed2bbf7c3be4

5. References
TESINA. Enginyeria de Camins, Canals i Ports. Applicability and Limitations of the SWASH model to predict Wave Overtopping 67
Lykke Andersen, T., & Burcharth, H.F. Overtopping of Berm Breakwaters. Extension of
Overtopping Formula. Second International Coastal Symposium in Iceland, Höfn, Hornafjördur,
Iceland, 5-8 June 2005. Abstracts and Papers. Edited by G. Viggosson. 2005.
Lykke Andersen, T. Hydraulic Response of Rubble Mound Breakwaters. Scale Effects – Berm
Breakwaters. PhD Thesis, Aalborg University. 2006.
Mellink, B.A. Numerical and experimental research of wave interaction with a porous
breakwater. MSc Thesis, TU Delft. 2012.
Available on: http://repository.tudelft.nl/view/ir/uuid%3A8c8d74ac-0990-4043-8d9c-ab2017719908/
TAW. Technical Report on Wave Run-up and Wave Overtopping at Dikes. Technical Advisory
Committee on Water Defences, The Netherlands. 2002.
Sigurdarson, S., & van der Meer, J.W. Wave Overtopping at berm breakwaters in line with
Eurotop. Proceedings of 33rd International Conference on Coastal Engineering, Santander,
Spain, 2012.
Available on: http://journals.tdl.org/icce/index.php/icce/article/view/6914
Stewart, R.H. Introduction to Physical Oceanography. Department of Oceanography, Texas
A&M University. 2008.
Open source book available on:
http://oceanworld.tamu.edu/resources/ocng_textbook/contents.html
Suzuki, T.; Verwaest, T.; Hassan, W.; Veale, W.; Reyns, J.; Trouw, K.; Troch, P.; & Zijlema, M.
The applicability of SWASH model for wave transformation and wave overtopping: A case
study for the Flemish coast. Proceedings of the 5th International Conference on Advanced
COmputational Methods in ENgineering (ACOMEN 2011), Liège, Belgium, 2011.
Suzuki, T.; Verwaest, T.; Veale, W.; Reyns, J.; Trouw, K.; & Zijlema, M. A numerical study on the
effect of beach nourishment on wave overtopping in shallow foreshores. Proceedings of 33rd
International Conference on Coastal Engineering, Santander, Spain, 2012.
Available on:
http://repository.tudelft.nl/view/ir/uuid%3Acfcb5a27-52b4-40ae-9169-24007b45c9ff/
SWASH User Manual. The SWASH team, TU Delft (Faculty of Civil Engineering and Geosciences,
Environmental Fluid Mechanics Section). 2010-2012.
Available on: http://swash.sourceforge.net/
Van Gent, M.R.A., van den Boogaard, H.F.P., Pozueta, B., & Medina, J.R. Neural Network
modelling of wave overtopping at coastal structures. Coastal Engineering, Volume 54, Issue 8,
August 2007, Pages 586–593.

5. References
TESINA. Enginyeria de Camins, Canals i Ports. Applicability and Limitations of the SWASH model to predict Wave Overtopping 68
Vanlishout, V. Oblique wave transmission through rough impermeable rubble mound
submerged breakwaters. MSc Thesis, Universiteit Gent and TU Delft. 2008.
Verhaeghe, H., De Rouck, J., & van der Meer, J. Combined classifier–quantifier model: A 2-
phases neural model for prediction of wave overtopping at coastal structures. Coastal
Engineering, Volume 55, Issue 5, May 2008, Pages 357–374.
Verhagen, H.J., d'Angremond, K., van Roode, F. Breakwaters and closure dams. 2nd Edition,
Delft, VSSD. 2012.
Zijlema, M., Stelling, G., & Smit, P. SWASH: An operational public domain code for simulating
wave fields and rapidly varied flows in coastal waters. Coastal Engineering, Volume 58, Issue
10, October 2011, Pages 992-1012.
Available on: http://www.sciencedirect.com/science/article/pii/S0378383911000974
5.2. Consulted websites:
Support for Matlab:
http://www.mathworks.nl/support/tech-notes/1700/1702.html
Breakwat/Deltares on-line Neural Network:
http://www.deltares.nl/en/software/629100/breakwat
http://www.deltares.nl/en/software/630304/overtopping-neural-network
5.3. Cited documents
Besley, P. Overtopping of seawalls – design and assessment manual. R& D Technical Report W
178, Environmental Agency, Bristol. 1999. ISBN 1-85705-069-X
Burcharth, H.F., & Andersen, O. On the one-dimensional steady and unsteady porous flow
equations. Coastal Engineering, (No. 24):p. 233-257, 1995.
Forchheimer, P. Wasserbewegung durch boden. Zeitschrift des Vereines Deutscher Ingenieuer,
45th edtition. 1901.
Lykke Andersen, T., Burcharth, H.F. Crest Level Assessment of Coastal Structures by full-scale
monitoring, neural network prediction and hazard analysis on permissible wave overtopping.
CLASH. EVK3-CT-2001-00058 D24 Report on Additional Tests – Part A: Effect of obliqueness,
short-crested waves and directional spreading. CLASH work package 5. Aalborg University.
2004.
Polubarinova-Kocina, O. Theory of motion of ground water. Gosudarstv. Izdat. Tehn.-Teor.,
Moscow, 1952. translated as Polubarinova-Kochina, P. Ya. (1962). Theory of ground water
movement. Princeton, NJ: Princeton University Press.

5. References
TESINA. Enginyeria de Camins, Canals i Ports. Applicability and Limitations of the SWASH model to predict Wave Overtopping 69
Van Gent, M.R.A. Stationary and oscillatory flow through course porous media.
Communications on Hydraulic and Geotechnical Engineering 93-9, Delft University of
Technology, June 1993.

Appendices
TESINA. Enginyeria de Camins, Canals i Ports. Applicability and Limitations of the SWASH model to predict Wave Overtopping 70
Appendices
The thesis report includes two appendices:
- Appendix A. Summary of the SWASH scripts
- Appendix B. Summary of the Matlab scripts
The appendix A is a summary of the majority of the SWASH simulations performed during this
work. The input parameters and results are commented in detail. As a consequence, this
appendix is very long and it has 108 pages. For this reason it has its own table of contents and
lists of tables and figures.
The summary of SWASH scripts was written as a laboratory notebook at the same time tests
were run. Therefore, the main purpose was to collect and analyse the results as soon as the
simulations were performed and give a useful tool to anyone starting working with SWASH, so
he could benefit from the acquired experience. The partial conclusions written there are
nothing more than ideas and thoughts and should not be considered as strong arguments. All
the valid explanations and conclusions are commented in chapter 3.
The codes of 3 SWASH scripts are also included at the end, but the input files are not.
In appendix B the most important used Matlab programmes are commented. They are either
scripts or functions that analyse the wave records obtained with SWASH or compute wave
overtopping to speed up calculations.