Role of Mfn2 in Macrophage Inflammatory...
170
Role of Mfn2 in Macrophage Inflammatory Responses Juan Tur Torres ADVERTIMENT. La consulta d’aquesta tesi queda condicionada a l’acceptació de les següents condicions d'ús: La difusió d’aquesta tesi per mitjà del servei TDX (www.tdx.cat) i a través del Dipòsit Digital de la UB (diposit.ub.edu) ha estat autoritzada pels titulars dels drets de propietat intel·lectual únicament per a usos privats emmarcats en activitats d’investigació i docència. No s’autoritza la seva reproducció amb finalitats de lucre ni la seva difusió i posada a disposició des d’un lloc aliè al servei TDX ni al Dipòsit Digital de la UB. No s’autoritza la presentació del seu contingut en una finestra o marc aliè a TDX o al Dipòsit Digital de la UB (framing). Aquesta reserva de drets afecta tant al resum de presentació de la tesi com als seus continguts. En la utilització o cita de parts de la tesi és obligat indicar el nom de la persona autora. ADVERTENCIA. La consulta de esta tesis queda condicionada a la aceptación de las siguientes condiciones de uso: La difusión de esta tesis por medio del servicio TDR (www.tdx.cat) y a través del Repositorio Digital de la UB (diposit.ub.edu) ha sido autorizada por los titulares de los derechos de propiedad intelectual únicamente para usos privados enmarcados en actividades de investigación y docencia. No se autoriza su reproducción con finalidades de lucro ni su difusión y puesta a disposición desde un sitio ajeno al servicio TDR o al Repositorio Digital de la UB. No se autoriza la presentación de su contenido en una ventana o marco ajeno a TDR o al Repositorio Digital de la UB (framing). Esta reserva de derechos afecta tanto al resumen de presentación de la tesis como a sus contenidos. En la utilización o cita de partes de la tesis es obligado indicar el nombre de la persona autora. WARNING. On having consulted this thesis you’re accepting the following use conditions: Spreading this thesis by the TDX (www.tdx.cat) service and by the UB Digital Repository (diposit.ub.edu) has been authorized by the titular of the intellectual property rights only for private uses placed in investigation and teaching activities. Reproduction with lucrative aims is not authorized nor its spreading and availability from a site foreign to the TDX service or to the UB Digital Repository. Introducing its content in a window or frame foreign to the TDX service or to the UB Digital Repository is not authorized (framing). Those rights affect to the presentation summary of the thesis as well as to its contents. In the using or citation of parts of the thesis it’s obliged to indicate the name of the author.
Transcript of Role of Mfn2 in Macrophage Inflammatory...
Role of Mfn2 in Macrophage Inflammatory Responses
Juan Tur Torres
ADVERTIMENT. La consulta d’aquesta tesi queda condicionada a l’acceptació de les següents condicions d'ús: La difusió d’aquesta tesi per mitjà del servei TDX (www.tdx.cat) i a través del Dipòsit Digital de la UB (diposit.ub.edu) ha estat autoritzada pels titulars dels drets de propietat intel·lectual únicament per a usos privats emmarcats en activitats d’investigació i docència. No s’autoritza la seva reproducció amb finalitats de lucre ni la seva difusió i posada a disposició des d’un lloc aliè al servei TDX ni al Dipòsit Digital de la UB. No s’autoritza la presentació del seu contingut en una finestra o marc aliè a TDX o al Dipòsit Digital de la UB (framing). Aquesta reserva de drets afecta tant al resum de presentació de la tesi com als seus continguts. En la utilització o cita de parts de la tesi és obligat indicar el nom de la persona autora. ADVERTENCIA. La consulta de esta tesis queda condicionada a la aceptación de las siguientes condiciones de uso: La difusión de esta tesis por medio del servicio TDR (www.tdx.cat) y a través del Repositorio Digital de la UB (diposit.ub.edu) ha sido autorizada por los titulares de los derechos de propiedad intelectual únicamente para usos privados enmarcados en actividades de investigación y docencia. No se autoriza su reproducción con finalidades de lucro ni su difusión y puesta a disposición desde un sitio ajeno al servicio TDR o al Repositorio Digital de la UB. No se autoriza la presentación de su contenido en una ventana o marco ajeno a TDR o al Repositorio Digital de la UB (framing). Esta reserva de derechos afecta tanto al resumen de presentación de la tesis como a sus contenidos. En la utilización o cita de partes de la tesis es obligado indicar el nombre de la persona autora. WARNING. On having consulted this thesis you’re accepting the following use conditions: Spreading this thesis by the TDX (www.tdx.cat) service and by the UB Digital Repository (diposit.ub.edu) has been authorized by the titular of the intellectual property rights only for private uses placed in investigation and teaching activities. Reproduction with lucrative aims is not authorized nor its spreading and availability from a site foreign to the TDX service or to the UB Digital Repository. Introducing its content in a window or frame foreign to the TDX service or to the UB Digital Repository is not authorized (framing). Those rights affect to the presentation summary of the thesis as well as to its contents. In the using or citation of parts of the thesis it’s obliged to indicate the name of the author.
Doctoral Program in Biomedicine
Role of Mfn2 in Macrophage
Inflammatory Responses
Memory submitted by Juan Tur Torres
To qualify for the degree of Doctor by the
University of Barcelona
Thesis director Dr. Jorge Lloberas Cavero Professor of Immunology
Thesis director Dr. Antonio Celada Cotarelo Professor of Immunology


ACKNOWLEDGEMENTS
3
Acknowledgements
This Ph.D. thesis is the result of the efforts of many people that have helped me, both scientifically and personally, to successfully advance through this journey. In the first place I am deeply grateful to my mentors Antonio Celada and Jorge Lloberas of the University of Barcelona for accepting me to their lab and for giving me the opportunity to get involved in a very interesting and stimulating project. They have given me the strength and knowledge to grow and improve as a scientist. It has been a great honor to work under their supervision for all these years. I would also like to express my most sincere gratitude to Professor Antonio Zorzano and his group from the IRB for their collaboration and continuous support, which enormously enriched my knowledge and greatly improved this thesis. I am also indebted to Professor Emil R. Unanue and his group from the Washington University for accepting me to their lab during my stay in the USA. It has been an honor to work with such bright and nice people, who made me feel warmly welcomed despite being in a foreign country. I appreciate the generosity of Professor Zorzano and Professor Ángel Nebreda (IRB) for kindly giving us the LoxP and Cre mice that allowed the development of this work in the first place. I would also like to thank Professors Susana Merino (UB) and Carlos Ardavín (CSIC, Madrid) who kindly gave us some of the bacterial strains we used in this thesis. I would also like to extensively thank all the staff from the flow cytometry, genomics, microscopy, and animal facilities for their excellent technical support and for being always helpful. Thanks also to all my lab mates and friends for all the moments we have shared, which made this process more bearable and kept me going all these years.

ACKNOWLEDGEMENTS
4
Finally, I don’t know how to express my gratitude to my family and loved ones for all their unconditional support. No matter what, you were always there, helping me in both good and bad moments. I am sure that without you it would have been impossible to be where I am now. To conclude, I am profoundly grateful to all the institutions that with their funding and support allowed me to successfully carry on this work. I hope that they continue offering the new generations the great opportunity they’ve given to me. - FI pre-doctoral fellowship from the Generalitat de Catalunya - IRB Barcelona pre-doctoral fellowship - FPU pre-doctoral fellowship and Estancias breves FPU fellowship from
the Ministerio de Educación, cultura y deporte

INDEX

INDEX
7
Contents:
Acknowledgements ............................................................................................... 3
INDEX .................................................................................................................. 7
Contents: ................................................................................................................. 11
List of figures: ....................................................................................................... 11
List of tables: ......................................................................................................... 13
List of abbreviations ........................................................................................... 15
INTRODUCTION ............................................................................................ 19
1) The immune system ...................................................................................... 21
1.1) Macrophage origin and ontogeny ................................................................ 22
1.1) Macrophages functions and role in inflammation ................................ 24
1.3) Macrophage activation states ........................................................................ 25
1.4) Pro-inflammatory signaling in macrophages .......................................... 27
2) Macrophages and mitochondria ............................................................... 33
2.1) Mitochondrial metabolism governs macrophage activation ............ 33
2.2) Mitochondrial-mediated antiviral immunity .......................................... 37
2.3) Inflammasome activation and mitochondria .......................................... 39
2.4) Mitochondrial ROS in innate immune responses .................................. 43
3) Mitochondrial dynamics .............................................................................. 49
3.1) Mitochondrial fusion ......................................................................................... 50
3.2) Mitochondrial fission ........................................................................................ 54
3.3) Physiological functions of mitochondrial dynamics ............................ 55
3.4) Mfn2: A mitochondrial protein with roles beyond fusion ................. 57
3.5) Known roles of mitochondrial dynamics in immune responses ..... 61
OBJECTIVES AND HYPOTHESIS ............................................................... 65
1) Hypothesis ..................................................................................................... 67
2) Objectives ...................................................................................................... 67
EXPERIMENTAL PROCEDURES ................................................................ 69
1) Mice ..................................................................................................................... 71
2) Reagents ............................................................................................................ 71
3) Macrophage culture ...................................................................................... 71
4) Flow cytometry analysis .............................................................................. 72
4.1) General procedure .............................................................................................. 72
4.2) Extracellular marker staining ........................................................................ 72
INDEX
8
4.3) Intracellular NF-κB staining ........................................................................... 73
4.4) Cell cycle ................................................................................................................. 73
4.5) ROS measurements ............................................................................................ 73
4.6) Mitochondrial membrane potential ............................................................ 74
4.7) Mitochondrial mass............................................................................................ 74
4.8) Apoptotic bodies phagocytosis ..................................................................... 74
4.9) Apoptosis ................................................................................................................ 74
5) ATP production ............................................................................................... 74
6) Mitochondrial respiration and glycolytic metabolism ..................... 74
7) Mitochondrial fluorescence microscopy ................................................ 75
8) Arginase activity assay ................................................................................. 76
9) RNA extraction, reverse-PCR, and qPCR ................................................. 76
10) Mitochondrial DNA quantification ......................................................... 78
11) Telomere measurement ............................................................................ 78
12) Western blot protein analysis ................................................................. 78
13) Antigen presentation assay ...................................................................... 79
14) ELISA and “ELISA-like” assays ................................................................. 80
14.1) TNF-α..................................................................................................................... 80
14.2) Nitric oxide measurements .......................................................................... 80
14.3) Cell proliferation ............................................................................................... 80
15) In vitro assays with bacteria .................................................................... 80
15.1) Aeromonas hydrophila phagocytosis assay ............................................ 80
15.2) Bactericidal activity ......................................................................................... 80
15.3) Staphylococcus aureus and Escherichia coli phagocytosis assay ... 81
15.4) Listeria monocytogenes infection to check RNA expression ........... 81
16) Animal models .............................................................................................. 81
16.1) Dinitrofenolbenzene contact-induced inflammation ........................ 81
16.2) Listeria infection ............................................................................................... 81
16.3) Tuberculosis infection .................................................................................... 82
17) Statistical analysis ....................................................................................... 82
RESULTS .......................................................................................................... 83
1) Expression of mfn2 in macrophages and KO generation .............. 85
1.1) Mfn2 is highly expressed in macrophages and induced upon
inflammation .................................................................................................................. 85
1.2) Mitochondrial fusion protein expression in myeloid KO mice ... 86
2) Characterization of Mfn2-/- macrophages ........................................... 88
INDEX
9
2.1) Mfn2 does not affect macrophage differentiation from bone
marrow ............................................................................................................................. 88
2.2) Macrophage proliferation and senescence are independent on Mfn2
............................................................................................................................................. 90
3) Mitochondrial morphology and function regulation by Mfn2 ....... 92
3.1) Mfn2 maintains a properly structured mitochondrial network ..... 92
3.2) Mfn2 controls mitochondrial membrane potential and respiration
............................................................................................................................................. 94
3.3) Glycolysis is not affected by Mfn2 deficiency .......................................... 97
3.4) The lack of Mfn2 impairs ROS production ............................................... 97
4) Mfn2 is crucial for macrophage pro-inflammatory activation .... 100
4.1) The lack of Mfn2 impairs the activation of ERK, p38, and NF-κB
signaling pathways .................................................................................................... 100
4.2) Mfn2 is crucial for the production of pro-inflammatory mediators
........................................................................................................................................... 102
4.3) Mfn2 mediates pro-inflammatory activation through ROS
generation ..................................................................................................................... 104
4.4) ER stress responses are not affected by Mfn2 ...................................... 106
4.5) Mfn2 does not affect anti-inflammatory activation ............................ 107
5) Mfn2 involvement in autophagy, apoptosis, phagocytosis, and
antigen presentation ........................................................................................ 109
5.1) Mfn2 permits autophagosome-lysosome fusion ................................. 109
5.2) Mfn2 controls excessive induction of apoptosis .................................. 110
5.3) Mfn2 modulates the expression of class-A scavenger receptors .. 111
5.4) Mfn2 deficiency impairs bacterial phagocytosis ................................. 112
5.5) Mfn2 is necessary for the removal of apoptotic bodies .................... 114
5.6) The lack of Mfn2 is associated with defective bactericidal activity
and protein processing ............................................................................................ 116
6) In vivo models ................................................................................................ 119
6.1) Listeria monocytogenes ................................................................................. 119
6.2) Mycobacterium tuberculosis ....................................................................... 121
6.3) DNFB-induced ear inflammation model ................................................. 123
DISCUSSION .................................................................................................. 125
DISCUSSION ......................................................................................................... 127
CONCLUSIONS.............................................................................................. 141
Conclusions .......................................................................................................... 143

INDEX
10
REFERENCES ................................................................................................ 145
References: .......................................................................................................... 147
ANNEXES ....................................................................................................... 165
Publications ........................................................................................................ 167
Supplementary Figures ................................................................................... 167
INDEX
11
List of figures:
Figure 1. Innate and adaptive immune system. ........................................................ 22
Figure 2 Heterogeneity in the origin of tissue-resident macrophages. The contribution of each macrophage origin ..................................................................... 23
Figure 3. Multiple functions of macrophages. ............................................................ 24
Figure 4. Macrophage activation states ........................................................................ 26
Figure 5 LPS-TLR4 signaling cascade ............................................................................ 29
Figure 6. RLR anti-viral pathways .................................................................................. 30
Figure 7. Inflammasome activation................................................................................ 32
Figure 8. Metabolic profile in pro-inflammatory (i.e. LPS-activated) macrophages ........................................................................................................................... 35
Figure 9. Metabolic profile in anti-inflammatory (i.e. IL-4-stimulated) macrophages ........................................................................................................................... 36
Figure 10. Mitochondria are master regulators of anti-viral responses ........ 38
Figure 11. Mitochondria modulate inflammasome activation ........................... 41
Figure 12. Negative feedback during inflammasome activation........................ 43
Figure 13. Oxidative phosphorylation and the generation of mROS. ............... 44
Figure 14. TLR signaling activates mROS production via TRAF6-ECSIT. ....... 45
Figure 15. Mitochondrial ROS are components in inflammatory signaling. . 48
Figure 16. Fusion and fission regulate mitochondrial morphologY. ................ 49
Figure 17. Schematic of mitochondrial fusion. .......................................................... 50
Figure 18. Schematic structure of the mitofusins. ................................................... 51
Figure 19. OPA1 topology and domains ....................................................................... 53
Figure 20. Outer mitochondrial membrane fusion .................................................. 53
Figure 21. Mechanism of mitochondrial fission. ....................................................... 54
Figure 22. Complementation of mitochondrial function by fusion ................... 55
Figure 23. Mitochondrial life cycle and the contribution of mitochondrial dynamics and mitochondria quality control. ............................................................. 57
Figure 24. Mitochondrial dynamics govern antiviral signaling .......................... 63
Figure 25. Mfn2 is necessary for inflammasome activation ................................ 64
Figure 26. Gating strategy for BMDM flow cytometry analysis .......................... 72
Figure 27. Mfn2 is highly expressed in macrophages ............................................ 85
Figure 28. mfn2 but not mfn1 is overexpressed upon TLR stimulation ......... 86
Figure 29. Mitochondrial fusion protein expression in Mfn2-/- mice ............... 87
Figure 30. Macrophage differentiation is not affected by Mfn2 deficiency ... 89
Figure 31. Mfn2 has no effect on macrophage proliferation or senescence . 91
INDEX
12
Figure 32. Mfn2 maintains mitochondrial structure .............................................. 93
Figure 33. Mfn2-/- macrophages lose their mΔΨ. ..................................................... 94
Figure 34. Mfn2 promotes mitochondrial respiration ........................................... 96
Figure 35. Mfn2 does not affect glycolytic activity in macrophages ................. 97
Figure 36. Mfn2 enhances ROS production ................................................................. 99
Figure 37. Mfn2 promotes NF-κB and MAPK activation...................................... 101
Figure 38. MKP1 expression is not affected by Mfn2 ............................................ 102
Figure 39. Mfn2 is crucial for macrophage pro-inflammatory activation .... 103
Figure 40. ROS is required for macrophage pro-inflammatory activation .. 105
Figure 41. Mfn2 does not affect ER stress responses ........................................... 106
Figure 42. Mfn2 is not involved in anti-inflammatory activation .................... 108
Figure 43. Mfn2 modulates autophagy ....................................................................... 110
Figure 44. The lack of Mfn2 is associated with excessive apoptotis ............... 111
Figure 45. Mfn2 enhances the expression of class-A scavenger receptors .. 112
Figure 46. The lack of Mfn2 impairs bacterial phagocytosis. ............................ 114
Figure 47. Mfn2 is necessary for the removal of apoptotic bodies ................. 115
Figure 48. Loss of Mfn2 is associated with reduced bactericidal activity .... 116
Figure 49. Antigen presentation is defective in Mfn2-/- macrophages .......... 118
Figure 50. Mfn2-/- macrophages fail to protect mice from listeria................... 120
Figure 51. The lack of Mfn2 in macrophages reduces the protection against tuberculosis ............................................................................................................................ 122
Figure 52. Mfn2 in macrophages is required for sterile inflammation ......... 124
INDEX
13
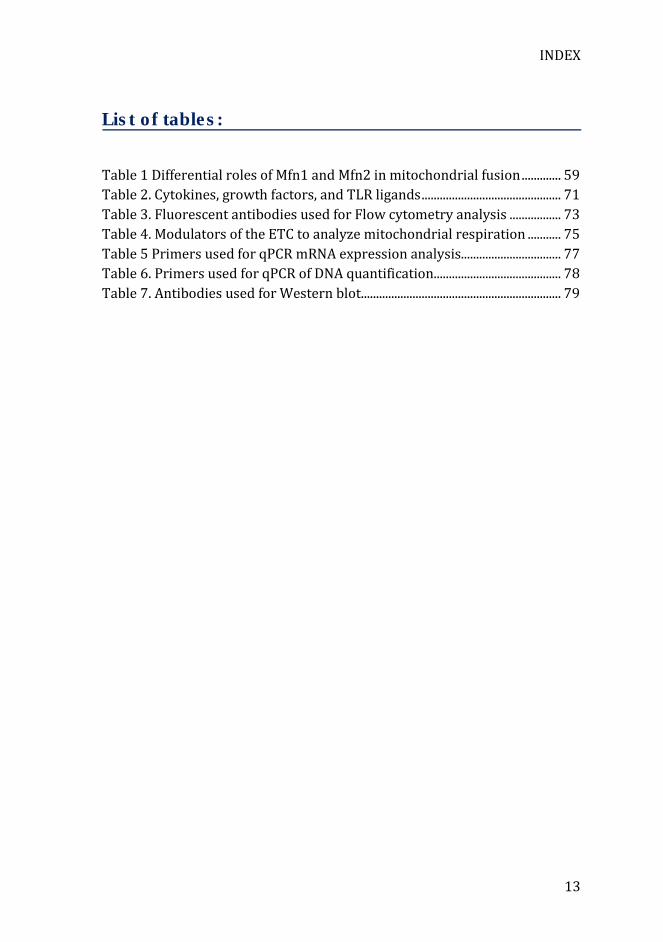
List of tables:
Table 1 Differential roles of Mfn1 and Mfn2 in mitochondrial fusion ............. 59
Table 2. Cytokines, growth factors, and TLR ligands .............................................. 71
Table 3. Fluorescent antibodies used for Flow cytometry analysis ................. 73
Table 4. Modulators of the ETC to analyze mitochondrial respiration ........... 75
Table 5 Primers used for qPCR mRNA expression analysis................................. 77
Table 6. Primers used for qPCR of DNA quantification.......................................... 78
Table 7. Antibodies used for Western blot .................................................................. 79

INDEX
15
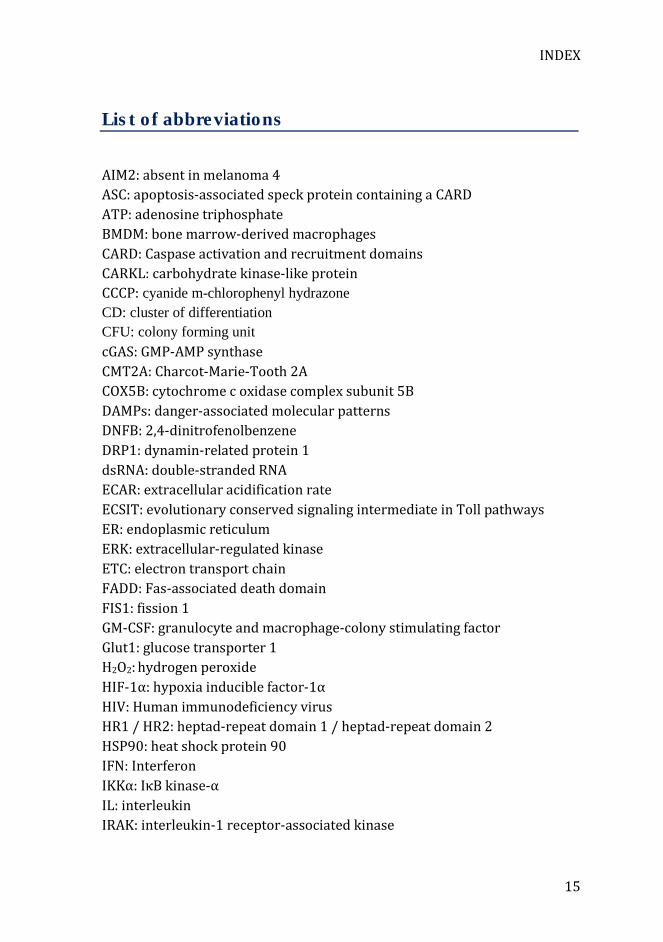
List of abbreviations
AIM2: absent in melanoma 4 ASC: apoptosis-associated speck protein containing a CARD ATP: adenosine triphosphate BMDM: bone marrow-derived macrophages CARD: Caspase activation and recruitment domains CARKL: carbohydrate kinase-like protein CCCP: cyanide m-chlorophenyl hydrazone
CD: cluster of differentiation
CFU: colony forming unit cGAS: GMP-AMP synthase CMT2A: Charcot-Marie-Tooth 2A COX5B: cytochrome c oxidase complex subunit 5B DAMPs: danger-associated molecular patterns DNFB: 2,4-dinitrofenolbenzene DRP1: dynamin-related protein 1 dsRNA: double-stranded RNA ECAR: extracellular acidification rate ECSIT: evolutionary conserved signaling intermediate in Toll pathways ER: endoplasmic reticulum ERK: extracellular-regulated kinase ETC: electron transport chain FADD: Fas-associated death domain FIS1: fission 1 GM-CSF: granulocyte and macrophage-colony stimulating factor Glut1: glucose transporter 1 H2O2: hydrogen peroxide HIF-1α: hypoxia inducible factor-1α HIV: Human immunodeficiency virus HR1 / HR2: heptad-repeat domain 1 / heptad-repeat domain 2 HSP90: heat shock protein 90 IFN: Interferon IKKα: IκB kinase-α IL: interleukin IRAK: interleukin-1 receptor-associated kinase
INDEX
16
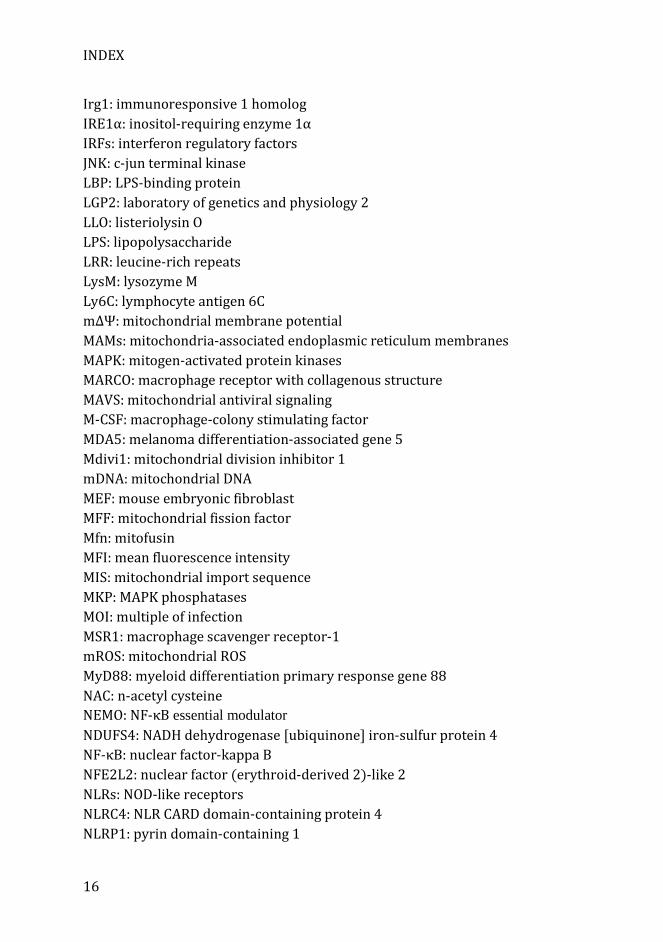
Irg1: immunoresponsive 1 homolog IRE1α: inositol-requiring enzyme 1α IRFs: interferon regulatory factors JNK: c-jun terminal kinase LBP: LPS-binding protein LGP2: laboratory of genetics and physiology 2 LLO: listeriolysin O LPS: lipopolysaccharide LRR: leucine-rich repeats LysM: lysozyme M Ly6C: lymphocyte antigen 6C mΔΨ: mitochondrial membrane potential MAMs: mitochondria-associated endoplasmic reticulum membranes MAPK: mitogen-activated protein kinases MARCO: macrophage receptor with collagenous structure MAVS: mitochondrial antiviral signaling M-CSF: macrophage-colony stimulating factor MDA5: melanoma differentiation-associated gene 5 Mdivi1: mitochondrial division inhibitor 1 mDNA: mitochondrial DNA MEF: mouse embryonic fibroblast MFF: mitochondrial fission factor Mfn: mitofusin MFI: mean fluorescence intensity MIS: mitochondrial import sequence MKP: MAPK phosphatases MOI: multiple of infection MSR1: macrophage scavenger receptor-1 mROS: mitochondrial ROS MyD88: myeloid differentiation primary response gene 88 NAC: n-acetyl cysteine NEMO: NF-κB essential modulator
NDUFS4: NADH dehydrogenase [ubiquinone] iron-sulfur protein 4 NF-κB: nuclear factor-kappa B NFE2L2: nuclear factor (erythroid-derived 2)-like 2 NLRs: NOD-like receptors NLRC4: NLR CARD domain-containing protein 4 NLRP1: pyrin domain-containing 1
INDEX
17
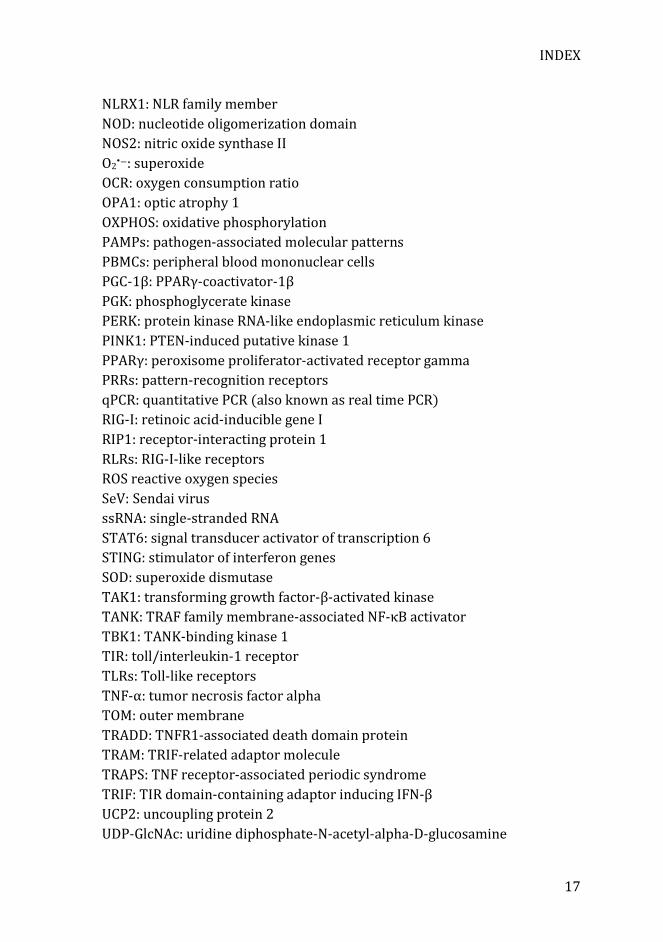
NLRX1: NLR family member NOD: nucleotide oligomerization domain NOS2: nitric oxide synthase II O2
�−: superoxide OCR: oxygen consumption ratio OPA1: optic atrophy 1 OXPHOS: oxidative phosphorylation PAMPs: pathogen-associated molecular patterns PBMCs: peripheral blood mononuclear cells PGC-1β: PPARγ-coactivator-1β PGK: phosphoglycerate kinase PERK: protein kinase RNA-like endoplasmic reticulum kinase PINK1: PTEN-induced putative kinase 1 PPARγ: peroxisome proliferator-activated receptor gamma PRRs: pattern-recognition receptors qPCR: quantitative PCR (also known as real time PCR) RIG-I: retinoic acid-inducible gene I RIP1: receptor-interacting protein 1 RLRs: RIG-I-like receptors ROS reactive oxygen species SeV: Sendai virus ssRNA: single-stranded RNA STAT6: signal transducer activator of transcription 6 STING: stimulator of interferon genes SOD: superoxide dismutase TAK1: transforming growth factor-β-activated kinase TANK: TRAF family membrane-associated NF-κB activator TBK1: TANK-binding kinase 1 TIR: toll/interleukin-1 receptor TLRs: Toll-like receptors TNF-α: tumor necrosis factor alpha TOM: outer membrane TRADD: TNFR1-associated death domain protein TRAM: TRIF-related adaptor molecule TRAPS: TNF receptor-associated periodic syndrome TRIF: TIR domain-containing adaptor inducing IFN-β UCP2: uncoupling protein 2 UDP-GlcNAc: uridine diphosphate-N-acetyl-alpha-D-glucosamine

INDEX
18
uPFK2: isoform of phosphofructokinase-2 VDACs: voltage-dependent anion-selective channels VSV: vesicular stomatitis virus

INTRODUCTION

INTRODUCTION
21
1) The immune system
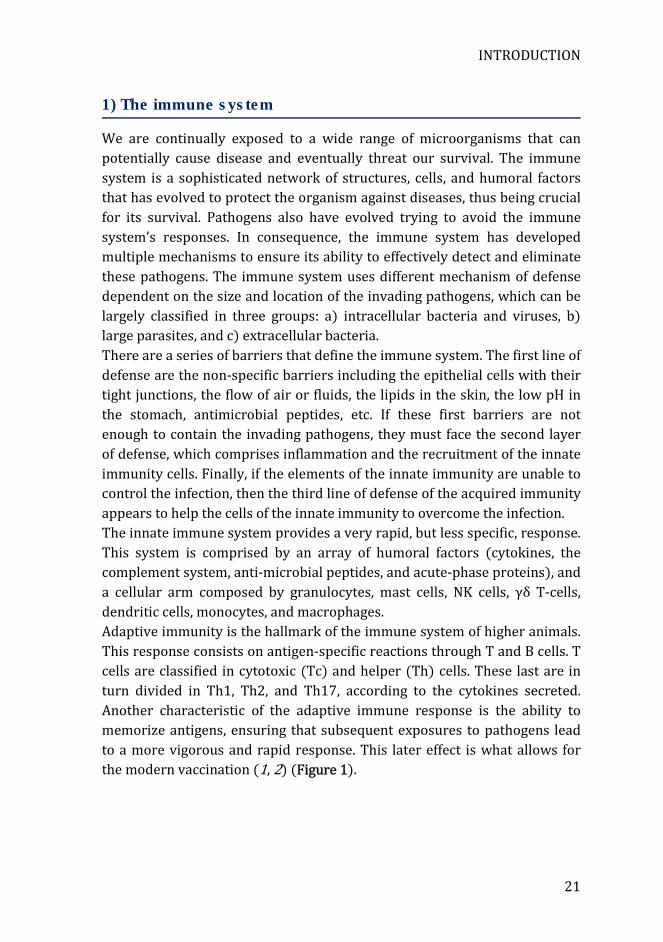
We are continually exposed to a wide range of microorganisms that can potentially cause disease and eventually threat our survival. The immune system is a sophisticated network of structures, cells, and humoral factors that has evolved to protect the organism against diseases, thus being crucial for its survival. Pathogens also have evolved trying to avoid the immune system’s responses. In consequence, the immune system has developed multiple mechanisms to ensure its ability to effectively detect and eliminate these pathogens. The immune system uses different mechanism of defense dependent on the size and location of the invading pathogens, which can be largely classified in three groups: a) intracellular bacteria and viruses, b) large parasites, and c) extracellular bacteria. There are a series of barriers that define the immune system. The first line of defense are the non-specific barriers including the epithelial cells with their tight junctions, the flow of air or fluids, the lipids in the skin, the low pH in the stomach, antimicrobial peptides, etc. If these first barriers are not enough to contain the invading pathogens, they must face the second layer of defense, which comprises inflammation and the recruitment of the innate immunity cells. Finally, if the elements of the innate immunity are unable to control the infection, then the third line of defense of the acquired immunity appears to help the cells of the innate immunity to overcome the infection. The innate immune system provides a very rapid, but less specific, response. This system is comprised by an array of humoral factors (cytokines, the complement system, anti-microbial peptides, and acute-phase proteins), and a cellular arm composed by granulocytes, mast cells, NK cells, γδ T-cells, dendritic cells, monocytes, and macrophages. Adaptive immunity is the hallmark of the immune system of higher animals. This response consists on antigen-specific reactions through T and B cells. T cells are classified in cytotoxic (Tc) and helper (Th) cells. These last are in turn divided in Th1, Th2, and Th17, according to the cytokines secreted. Another characteristic of the adaptive immune response is the ability to memorize antigens, ensuring that subsequent exposures to pathogens lead to a more vigorous and rapid response. This later effect is what allows for the modern vaccination (1, 2) (Figure 1).
INTRODUCTION
22
Figure 1. Innate and adaptive immune system (3).
1.1) Macrophage origin and ontogeny
Macrophages and monocytes are major effectors and regulators of the immune system. Macrophages can be originated from circulating monocytes, or derived from embryonic precursors and produced locally in the different tissues. In adult individuals, monocytes are generated in the bone marrow from hematopoietic myeloid precursors. These precursors overcome successive steps of differentiation in response to different growth factors, including macrophage-colony stimulating factor (M-CSF), granulocyte-macrophage-colony stimulating factor (GM-SCF), and interleukin-3 (IL-3), which activate a range of transcription factors such as PU.1, resulting in the generation of monocytes (4, 5). Monocytes are classified into two separate populations depending on the expression level of their extracellular markers, specifically the lymphocyte antigen 6C (Ly6C). Ly6Clow (CD14low/CD16high in humans) are long-lived circulating monocytes that patrol and keep the integrity of the endothelium under surveillance (6). On the other hand, Ly6Chigh (CD14high/CD16low in humans) are a short-lived subset of monocytes that are actively recruited to the site of inflammation in a CCR2-dependent way. This last subset of monocytes is the precursor of macrophages at the inflammatory loci (7).
INTRODUCTION
23
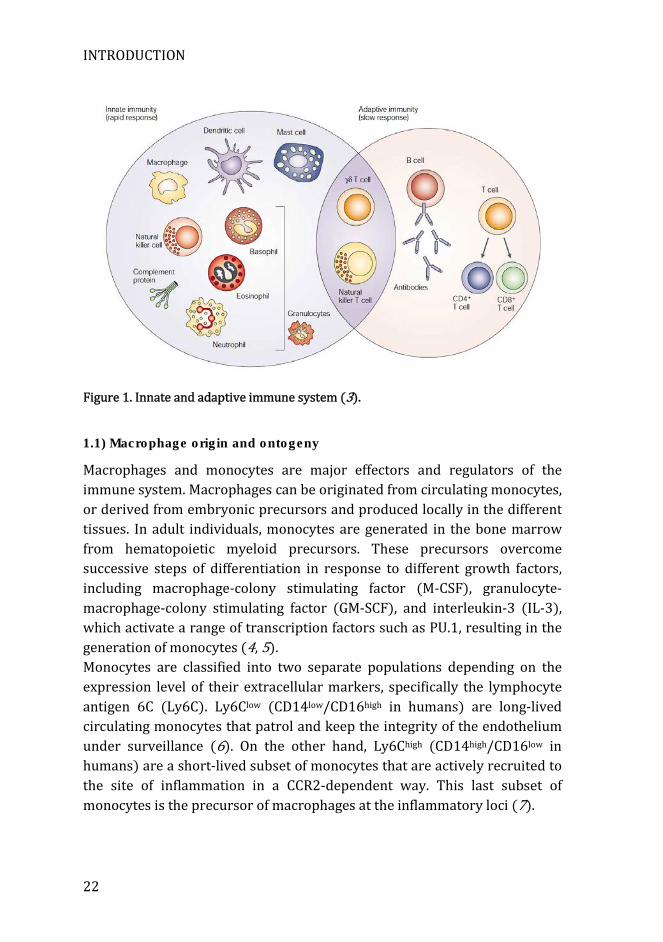
Until recently, the paradigm was that circulating monocytes generated in the bone marrow were continuously repopulating tissues with resident macrophages. However, several lineage-tracking studies have revealed that the contribution of circulating monocytes to tissue-resident macrophages is restricted to few specific tissues including gut, heart, pancreas, and dermis. By contrast, most tissue-resident macrophages are derived from embryonic precursors that seed the tissues before birth and are maintained mainly by local proliferation throughout the life of the organism. These embryonic precursors are generated in the yolk sack and in the fetal liver, producing two waves that will sequentially colonize the different tissues with resident macrophages. These tissue resident macrophages (i.e. Kupffer cells, Langerhans cells, microglia, etc.) perform different functions that are necessary for the tissue homeostasis (Figure 2)(8).
Figure 2 Heterogeneity in the origin of tissue-resident macrophages. The contribution of each macrophage origin (i.e. yolk sac, fetal liver, and bone marrow-derived monocytes) depend on the tissue and the changes during development (8).
INTRODUCTION
24
In addition, upon inflammation, circulating Ly6Chigh monocytes can migrate to the affected tissues and differentiate to macrophages. These recruited cells are responsible to boost inflammation, or to start anti-inflammatory responses when required (9, 10). In normal conditions, these recruited populations disappear, as they cannot self-maintain. However, in cases of severe inflammatory processes where the resident macrophage population is partially lost, blood monocytes can replace these populations and self-renew themselves (7).
1.1) Macrophages functions and role in inflammation
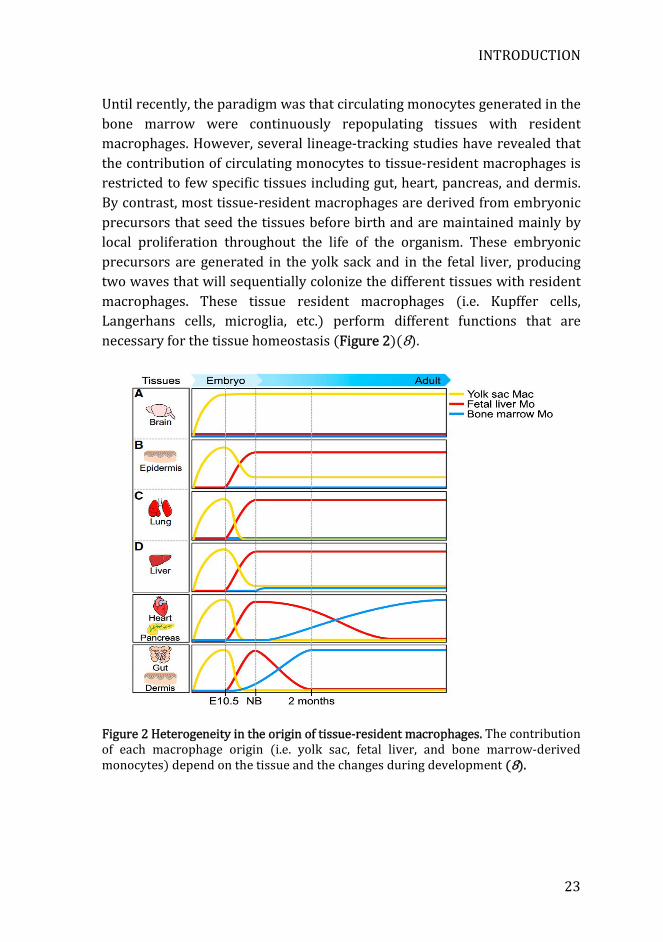
Macrophages are cells from the myeloid lineage that play a broad range of functions depending on their origin, environment, or whether they are recruited or tissue-resident. Failure to properly perform these functions usually results in different flaws and diseases (Figure 3) (11).
Figure 3. Multiple functions of macrophages (11).
INTRODUCTION
25
In this thesis, we will focus on the role of macrophages in inflammation. The inflammatory process is the body’s immediate response to damage produced either by pathogens or by noxious stimuli such as chemicals, or physical injury. Acute inflammation is a short-term response that usually follows the next steps: infiltration of leukocytes to the damaged region, removal of the injury’s trigger, and healing of the tissue. The first cells to reach the inflammatory locus are usually the neutrophils. These cells phagocyte and eliminate most of the infectious agents. In addition, they release a wide range of molecules that cause damage to the surrounding tissue. Neutrophils die shortly after the extravasation. Then, between 24 and 48h, monocytes arrive to the site of inflammation, differentiating to macrophages. These cells first have a pro-inflammatory activity and phagocyte and eliminate the remaining pathogens. After that, macrophages develop an anti-inflammatory profile, and proceed to remove all the apoptotic cells, and produce molecules to repair the damaged tissue. Furthermore, macrophages can also act as antigen presenting cells, serving as a link between innate and adaptive immune responses. Phagocyted material is processed and loaded to MHC class II molecules, which together with the expression of other co-stimulatory proteins such as CD86 and CD80 allow the antigen presentation to specific CD4+ T-cells. Inflammation has to be tightly regulated, because an uncontrolled response can cause damage to the host leading to disease including autoimmunity, atherosclerosis, neurodegenerative diseases, and cancer among more than 100 types of inflammatory diseases (12).
1.3) Macrophage activation states
To perform their functional activities, macrophages need to become activated. Both recruited and resident macrophages are highly plastic cells that modify their activation state in response to a broad range of environmental changes. The best-characterized states of activation are pro-inflammatory macrophages (also known as classically or “M1-like” macrophages) and anti-inflammatory macrophages (commonly known as alternatively activated or “M2-like” macrophages). Pro-inflammatory macrophages are in charge of the defense against pathogens and to create an inflammatory microenvironment following injury. These macrophages show a marked production of pro-inflammatory mediators (cytokines, chemokines, and prostaglandins) and reactive oxygen and nitrogen species
INTRODUCTION
26
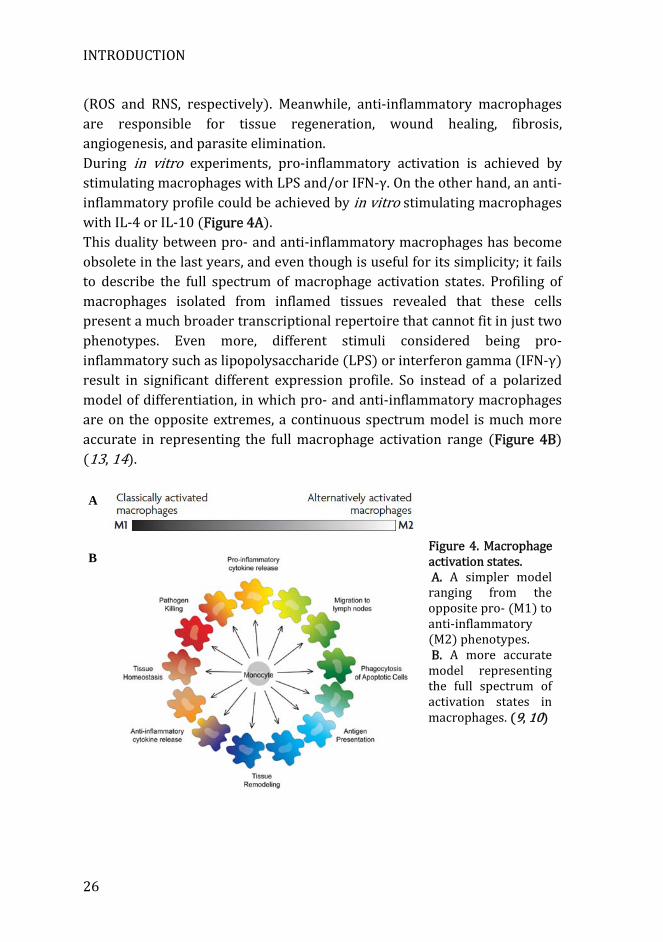
(ROS and RNS, respectively). Meanwhile, anti-inflammatory macrophages are responsible for tissue regeneration, wound healing, fibrosis, angiogenesis, and parasite elimination. During in vitro experiments, pro-inflammatory activation is achieved by stimulating macrophages with LPS and/or IFN-γ. On the other hand, an anti-inflammatory profile could be achieved by in vitro stimulating macrophages with IL-4 or IL-10 (Figure 4A). This duality between pro- and anti-inflammatory macrophages has become obsolete in the last years, and even though is useful for its simplicity; it fails to describe the full spectrum of macrophage activation states. Profiling of macrophages isolated from inflamed tissues revealed that these cells present a much broader transcriptional repertoire that cannot fit in just two phenotypes. Even more, different stimuli considered being pro-inflammatory such as lipopolysaccharide (LPS) or interferon gamma (IFN-γ) result in significant different expression profile. So instead of a polarized model of differentiation, in which pro- and anti-inflammatory macrophages are on the opposite extremes, a continuous spectrum model is much more accurate in representing the full macrophage activation range (Figure 4B) (13, 14).
A
B
Figure 4. Macrophage activation states. A. A simpler model ranging from the opposite pro- (M1) to anti-inflammatory (M2) phenotypes. B. A more accurate model representing the full spectrum of activation states in macrophages. (9, 10)
INTRODUCTION
27
1.4) Pro-inflammatory signaling in macrophages
Inflammation usually starts when macrophages and other immune cells detect microbial structures trough pattern-recognition receptors (PRRs). These receptors sense highly conserved molecules known as pathogen-associated molecular patterns (PAMPs), including bacterial cell wall compounds, nucleic acids, and proteins. There are several families of PRRs involved in PAMP recognition: Toll-like receptors (TLRs), retinoic acid-inducible gene I (RIG-I)-like receptors (RLRs), nucleotide oligomerization domain (NOD)-like receptors (NLRs), scavenger receptors, and C-type lectin receptors amount others. Upon interaction with their ligand, these PRRs trigger multiple signaling pathways, including nuclear factor-kappa B (NF-κB), interferon regulatory factors (IRFs), and mitogen-activated protein kinases (MAPK). This activates the transcription of pro-inflammatory cytokines, chemokines, type I interferons (IFNs), and co-stimulatory molecules, which are necessary to generate robust immune responses (15). Apart from sensing microbial PAMPs, immune cells are also able to detect endogenous molecules released during cellular damage and stress through PRRs, triggering inflammatory responses. These danger-associated molecular patterns (DAMPs) are endogenous factors, usually sequestered within intracellular compartments, and therefore under normal conditions cannot be recognized by PRRs. However, under conditions of cellular stress or tissue injury, these molecules could be released. These DAMPs include reactive oxygen species (ROS), mitochondrial DNA (mDNA), N-formyl peptides, acid uric crystals, and adenosine triphosphate (ATP) among others. Notably, these molecules can be released either in association or in absence of microbial infection (16, 17). The most relevant inflammatory pathways in this current thesis, are analyzed in further detail below.
1.4.1) LPS and TLR4 signaling pathway
LPS is one of the outer membrane’s components of gram-negative bacteria. The structure of this molecule consists on a lipid A (endotoxin), an oligosaccharide core, and the O-antigen. The only region detected by the immune system is the lipid A, which is recognized by TLR4, a receptor found at the endosomal and cellular membranes. Lipid A is bound to the circulating LPS-binding protein (LBP), which transform LPS micelles into monomers.
INTRODUCTION
28
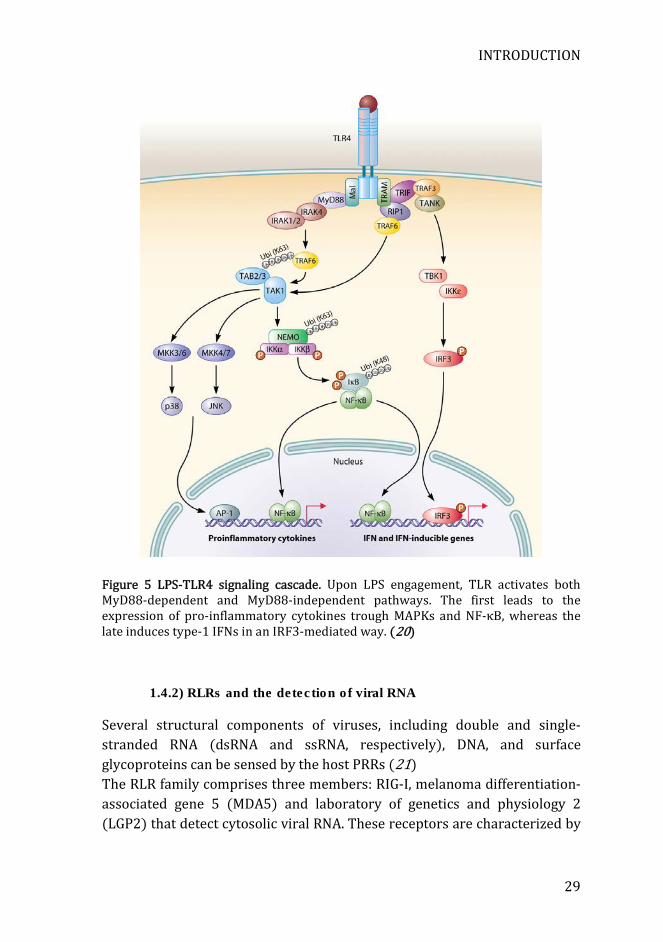
This complex is bound by CD14, TLR4-myeloid differentiation 2 (MD2), and TLR4 at the cell’s surface. These interactions trigger a sequence of signaling cascades that generate a strong inflammatory response (18). Like other TLRs, TLR4 is composed of extracellular leucine-rich repeats (LRRs) with a horseshoe-shaped solenoid. The intracellular part of TLR4 is composed of the highly conserved toll/interlukin-1 receptor (TIR) domains. In order to become activated, the complex TLR4-LPS need to interact with other TLR4-LPS complexes by oligomerization. Once activated, TLR4 TIR domains bind to different adaptor proteins, including myeloid differentiation primary response gene 88 (MyD88), TIR domain-containing adaptor protein (TIRAP or Mal), TIR domain-containing adaptor inducing IFN-β (TRIF), and TRIF-related adaptor molecule (TRAM). MyD88 and TIR activate the “MyD88-dependent pathway” that culminates in the activation of NF-κB and MAPKs, leading to the expression of pro-inflammatory genes. MyD88 recruits and activates the IL-1 receptor-associated kinase (IRAK), which in turn associates with the E3 ubiquitin ligase TNF receptor associated factor 6 (TRAF6). TRAF6 links polyubiquitin chains to the transforming growth factor-activated protein kinase 1 (TAK1) and the IκB kinase (IKK) subunit NF-κB essential modifier (NEMO). TAK1 phosphorylate the inhibitory IκB protein. Following phosphorylation, IκB is degraded in the proteasome, allowing the activation and translocation of NF-κB to the nucleus, inducing the transcription of a broad range of pro-inflammatory genes. Furthermore, TAK1 also phosphorylates the members of the MAPK kinase (MAPKK or MAP2K) family. These kinases activate by phosphorylation p38, extracellular regulated kinase (ERK), and c-jun N-terminal kinase (JNK). These signaling pathways lead to activation of the transcription factor activator protein 1 (AP1), resulting also in the expression of pro-inflammatory genes. On the other hand, the adaptor protein TRIF activates the so-called “MyD88-independent pathway” that culminates in the activation of IRF3, leading to the expression of type-1 IFNs. TRIF recruits the receptor-interacting protein 1 (RIP1), which in turn activates both the NF-κB and MAPKs signaling pathways. In addition, TRIF also recruits TRAF3. TRAF3 activates both the Tank-binding kinase 1 (TBK1) and IKKε, resulting in the phosphorylation and activation of IRF3, which translocates to the nucleus and activates the transcription of type-1 IFNs(Figure 5) (19, 20).
INTRODUCTION
29
Figure 5 LPS-TLR4 signaling cascade. Upon LPS engagement, TLR activates both MyD88-dependent and MyD88-independent pathways. The first leads to the expression of pro-inflammatory cytokines trough MAPKs and NF-κB, whereas the late induces type-1 IFNs in an IRF3-mediated way. (20)
1.4.2) RLRs and the detection of viral RNA
Several structural components of viruses, including double and single-stranded RNA (dsRNA and ssRNA, respectively), DNA, and surface glycoproteins can be sensed by the host PRRs (21) The RLR family comprises three members: RIG-I, melanoma differentiation-associated gene 5 (MDA5) and laboratory of genetics and physiology 2 (LGP2) that detect cytosolic viral RNA. These receptors are characterized by
INTRODUCTION
30
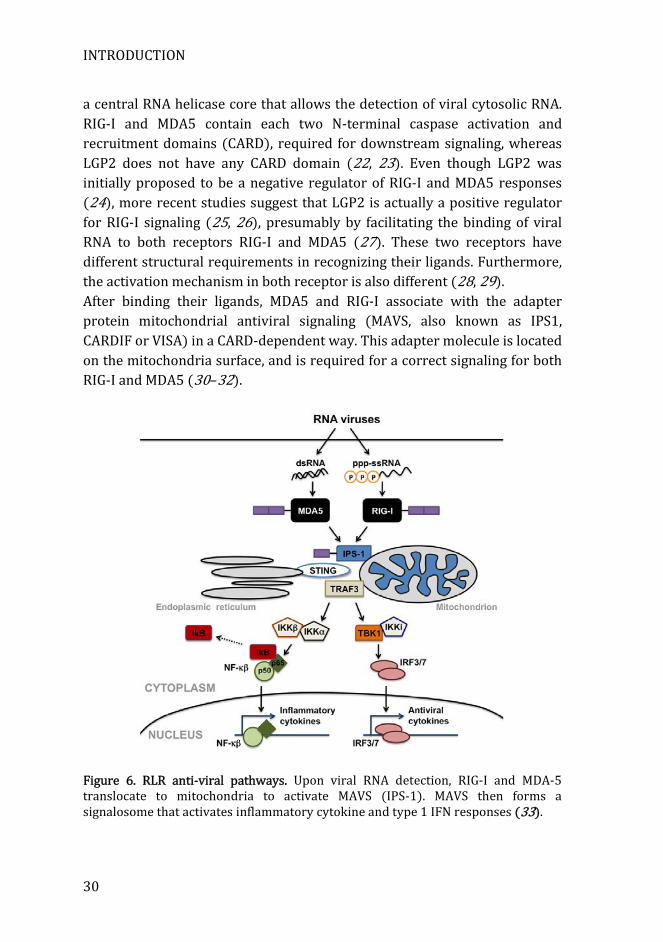
a central RNA helicase core that allows the detection of viral cytosolic RNA. RIG-I and MDA5 contain each two N-terminal caspase activation and recruitment domains (CARD), required for downstream signaling, whereas LGP2 does not have any CARD domain (22, 23). Even though LGP2 was initially proposed to be a negative regulator of RIG-I and MDA5 responses (24), more recent studies suggest that LGP2 is actually a positive regulator for RIG-I signaling (25, 26), presumably by facilitating the binding of viral RNA to both receptors RIG-I and MDA5 (27). These two receptors have different structural requirements in recognizing their ligands. Furthermore, the activation mechanism in both receptor is also different (28, 29). After binding their ligands, MDA5 and RIG-I associate with the adapter protein mitochondrial antiviral signaling (MAVS, also known as IPS1, CARDIF or VISA) in a CARD-dependent way. This adapter molecule is located on the mitochondria surface, and is required for a correct signaling for both RIG-I and MDA5 (30–32).
Figure 6. RLR anti-viral pathways. Upon viral RNA detection, RIG-I and MDA-5 translocate to mitochondria to activate MAVS (IPS-1). MAVS then forms a signalosome that activates inflammatory cytokine and type 1 IFN responses (33).
INTRODUCTION
31
MAVS presents an N-terminal CARD domain, a proline-rich region and a C-terminal transmembrane region. The CARD domain of MAVS interacts with RIG-I and MDA5 CARDs. When this interaction takes place, MAVS is induced to form large polymers in a prion-like mechanism (34). Using this mechanism, more MAVS are recruited and converted in prion-like filaments, forming very large aggregates that allow a rapid and robust amplification of RLS signaling (35). This leads to the recruitment many proteins to mitochondria forming a signalosome. This signaling culminates with MAVS-dependent activation of IRF3 and IRF7 pathways to produce type I IFNs, and on the other hand to the expression of pro-inflammatory cytokines mediated by NF-κB (Figure 6) (36, 37).
1.4.3) Inflammasome activation
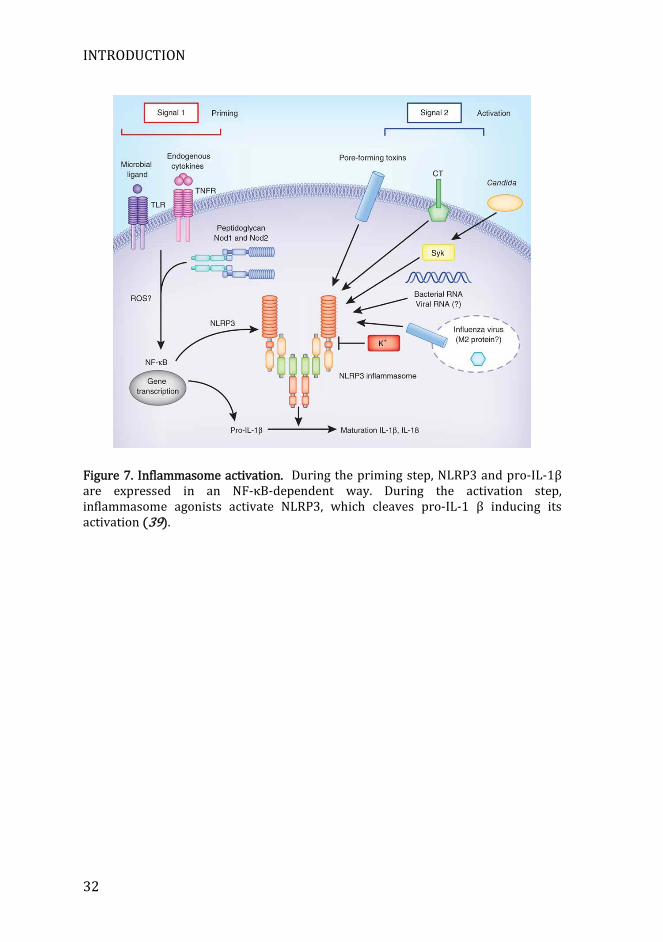
Upon interaction of PAMPs with TLRs and RLRs, the transcription of pro-inflammatory genes is triggered through the signaling pathways NF-κB, IRFs, and MAPKs (15). Another group of PRRs use a completely different mechanism, consisting on assembling multimeric-signaling complexes known as inflammasomes. The basic structure of these inflammasomes consists on a sensor molecule, the adaptor protein apoptosis-associated speck protein containing a CARD (ASC) and caspase-1. ASC has one pyrin domain, to interact with the sensor molecule, and one CARD, to interact with caspase-1. Upon assembly, caspase-1 proteolytically activates pro-inflammatory cytokines IL-1β and IL-18. The release of both cytokines is a two-step process. First there is the expression of the inflammasome components and the inactive form of both pro-IL-1β and pro-IL-18, in a TLR-dependent fashion. This is called the priming step. The second step is the assembly of the inflammasome upon recognition of its ligand, and proteolytic cleavage of IL-1β and IL-18 zymogens by caspase 1 (17, 38) (Figure 7).
INTRODUCTION
32
Figure 7. Inflammasome activation. During the priming step, NLRP3 and pro-IL-1β are expressed in an NF-κB-dependent way. During the activation step, inflammasome agonists activate NLRP3, which cleaves pro-IL-1 β inducing its activation (39).
INTRODUCTION
33
2) Macrophages and mitochondria
Mitochondria are maternally inherited organelles that are crucial in a wide range of cellular functions, including energy generation, biosynthesis of molecules, Ca2+ homeostasis, production of ROS, and regulation of cell death. Even though these organelles are crucial for their role in metabolism, mounting evidence suggest that mitochondria are also master regulators of immune responses. Firstly, immune signaling pathways are highly integrated with metabolism, which provides the energetic requirements and intermediate metabolites necessary for each situation (40, 41). Secondly, mitochondria act as centrally positioned hubs that regulate innate immune signaling pathways, including RLR, and NLR. Lastly, mitochondria are also able to sense and integrate cellular damage and stress signals, initiating inflammatory responses (42–44). In this section, we will discuss all these relations between mitochondria and innate immune responses in macrophages.
2.1) Mitochondrial metabolism governs macrophage activation
Changes in the activation state of macrophages involve a coordinated regulation at both metabolic and transcriptional level (41, 42, 45). Pro-inflammatory macrophages are metabolically characterized by increased glycolysis and lactate production, even in conditions of oxygen availability (the so-called Warburg effect). They are also characterized by an induction in the pentose phosphate pathway, which is crucial to generate NADPH, a molecule necessary to produce ROS and nitric oxide (both required for the respiratory burst associated to phagocytosis). In contrast, anti-inflammatory and pro-fibrotic macrophages show increased fatty acid oxidation, as well as decreased glycolysis (42, 46, 47). The metabolic differences between pro- and anti-inflammatory macrophages might be explained by the swiftness of response. Pro-inflammatory macrophages rely on glycolysis to fuel short, rapid, and intense bursts of activation at the sites of inflammation or infection. In contrast, the latter use fatty acid oxidation to sustain the more long-term process of inflammation resolution, tissue repair and parasite fighting (41).
INTRODUCTION
34
2.1.1) Metabolic reprogramming in pro-inflammatory macrophages
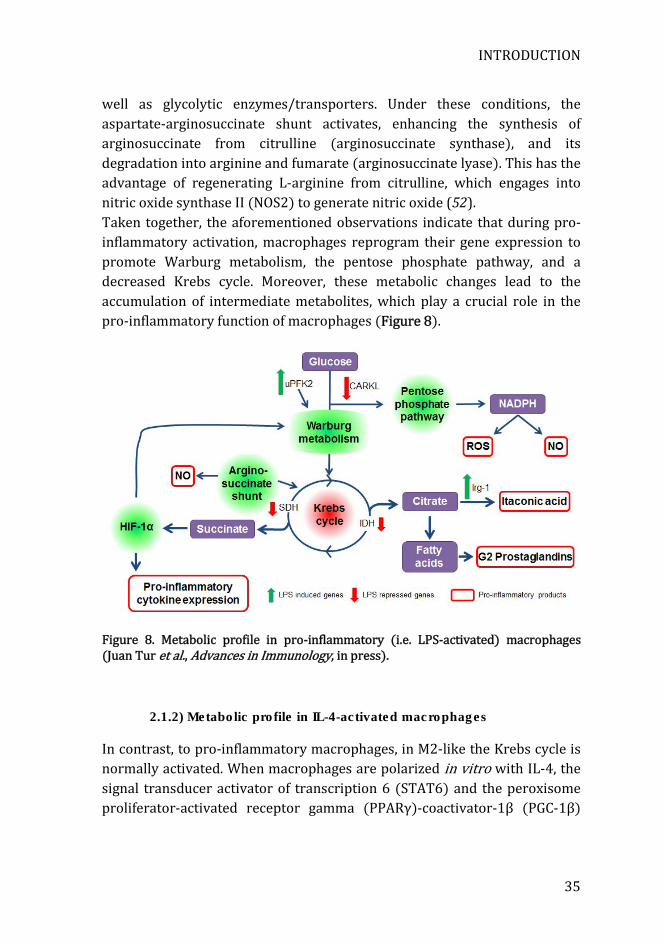
Upon LPS activation, macrophages start expressing the highly active isoform of phosphofructokinase-2 (uPFK2) that strongly promotes glycolysis. In contrast, M2-like or inactivated macrophages express instead the much less active isoform PFKFB1(48, 49). Hypoxia inducible factor-1α (HIF-1α) is a key mediator of the Warburg effect, and it is also up regulated in pro-inflammatory macrophages. This factor induces the expression of glucose transporter 1 (Glut1) and phosphoglycerate kinase (PGK), both responsible for enhanced glycolysis. Deletion of HIF-1α impairs pro-inflammatory activation in macrophages, demonstrating that glycolysis and inflammatory activation are coupled processes (50, 51). Another feature of macrophage’s pro-inflammatory activation is the down regulation of the carbohydrate kinase-like protein (CARKL), an enzyme that catalyzes the formation of sedoheptulose 7-phosphate, an inhibitor of the pentose phosphate pathway. Upon LPS stimulation, CARKL is strongly down regulated, thus increasing pentose phosphate pathway and glycolysis. This is required for LPS-induced superoxide generation and the production of pro-inflammatory cytokines (46). Finally, a recent study by Jha et al. (52) combining transcriptomics and metabolomics approaches has provided a much deeper understanding of the metabolic changes that occur during macrophage polarization. In pro-inflammatory macrophages, Krebs cycle activity is reduced by inhibition in two sites. Inhibition of the first step is caused by a severe downregulation of isocitrate dehydrogenase expression, which converts isocitrate to α-ketoglutarate. This conversion leads to an accumulation of citrate, which is redirected to the production of itaconic acid (52), a metabolite with antibacterial properties, particularly against Salmonella enterica and Mycobacterium tuberculosis (53). Interestingly, immunoresponsive 1 homolog (Irg1), which catalyzes the production of itaconic acid, is also overexpressed, enhancing even more the production of this metabolite. Furthermore, the accumulated citrate is also used for the synthesis of fatty acids, which can be used for prostaglandin production, another hallmark of the pro-inflammatory macrophage phenotype. The second step reduced in the Krebs cycle is at the level of succinate dehydrogenase, which converts succinate into fumarate. Accumulated succinate stabilizes HIF-1α (52), inducing the expression of pro-inflammatory genes such as IL-1β (54) as
INTRODUCTION
35
well as glycolytic enzymes/transporters. Under these conditions, the aspartate-arginosuccinate shunt activates, enhancing the synthesis of arginosuccinate from citrulline (arginosuccinate synthase), and its degradation into arginine and fumarate (arginosuccinate lyase). This has the advantage of regenerating L-arginine from citrulline, which engages into nitric oxide synthase II (NOS2) to generate nitric oxide (52). Taken together, the aforementioned observations indicate that during pro-inflammatory activation, macrophages reprogram their gene expression to promote Warburg metabolism, the pentose phosphate pathway, and a decreased Krebs cycle. Moreover, these metabolic changes lead to the accumulation of intermediate metabolites, which play a crucial role in the pro-inflammatory function of macrophages (Figure 8).
Figure 8. Metabolic profile in pro-inflammatory (i.e. LPS-activated) macrophages (Juan Tur et al., Advances in Immunology, in press).
2.1.2) Metabolic profile in IL-4-activated macrophages
In contrast, to pro-inflammatory macrophages, in M2-like the Krebs cycle is normally activated. When macrophages are polarized in vitro with IL-4, the signal transducer activator of transcription 6 (STAT6) and the peroxisome proliferator-activated receptor gamma (PPARγ)-coactivator-1β (PGC-1β)
INTRODUCTION
36
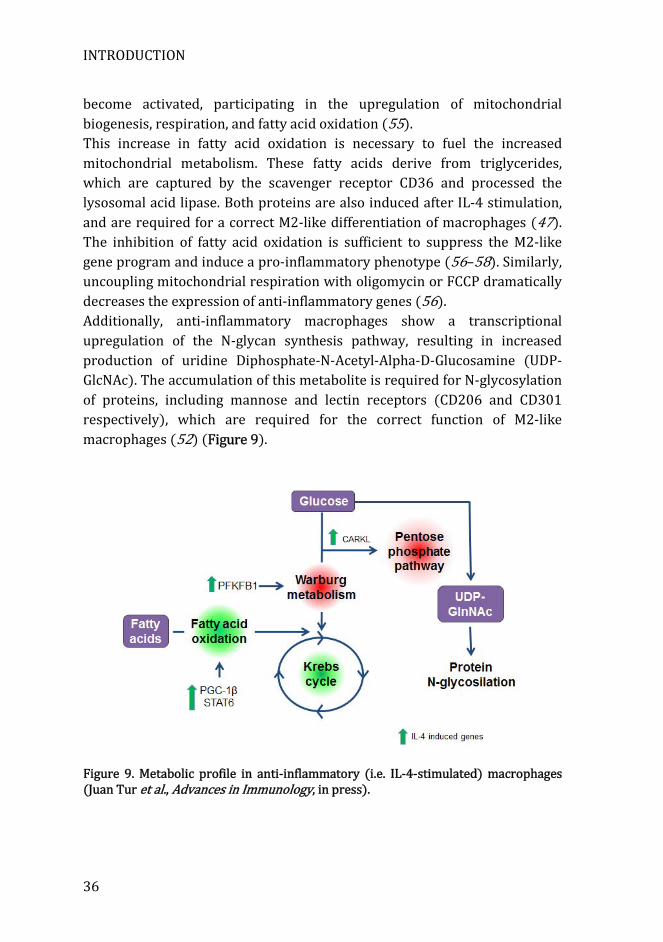
become activated, participating in the upregulation of mitochondrial biogenesis, respiration, and fatty acid oxidation (55). This increase in fatty acid oxidation is necessary to fuel the increased mitochondrial metabolism. These fatty acids derive from triglycerides, which are captured by the scavenger receptor CD36 and processed the lysosomal acid lipase. Both proteins are also induced after IL-4 stimulation, and are required for a correct M2-like differentiation of macrophages (47). The inhibition of fatty acid oxidation is sufficient to suppress the M2-like gene program and induce a pro-inflammatory phenotype (56–58). Similarly, uncoupling mitochondrial respiration with oligomycin or FCCP dramatically decreases the expression of anti-inflammatory genes (56). Additionally, anti-inflammatory macrophages show a transcriptional upregulation of the N-glycan synthesis pathway, resulting in increased production of uridine Diphosphate-N-Acetyl-Alpha-D-Glucosamine (UDP-GlcNAc). The accumulation of this metabolite is required for N-glycosylation of proteins, including mannose and lectin receptors (CD206 and CD301 respectively), which are required for the correct function of M2-like macrophages (52) (Figure 9).
Figure 9. Metabolic profile in anti-inflammatory (i.e. IL-4-stimulated) macrophages (Juan Tur et al., Advances in Immunology, in press).
INTRODUCTION
37
To sum up, the differentiation of macrophages to an M2-like phenotype involves a change in their transcriptional program to favor an active Krebs cycle and enhanced fatty acid oxidation to fuel it. Furthermore, the N-glycosylation of key proteins in this phenotype is enhanced by the accumulation of UDP-GlcNAc.
2.2) Mitochondrial-mediated antiviral immunity
2.2.1) Proteins that regulate MAVS signaling
The location of MAVS to mitochondria, as well as being crucial for antiviral signaling, positions mitochondria as a central platform in innate immune responses against viruses. Due to its location at the mitochondrial membrane and Mitochondrial-ER associated membranes (MAMs,) several mitochondrial and endoplasmic reticulum (ER) proteins can directly interact with MAVS, and modulate its downstream signaling. One of the major modulators of MAVS signaling is stimulator of interferon genes (STING, also known as MITA, MPYS, and ERIS). This transmembrane protein is mainly located in the ER in basal conditions (59, 60). Upon viral infection, STING dimerizes and interacts with MAVS at the mitochondrial surface (60). After that, TBK1 is recruited to STING, forming a complex containing MAVS-STING-IRF3-TKB1. Then TBK1 phosphorylates IRF3, triggering the expression of type 1 IFNs and cellular antiviral responses (61). Another cofactor that facilitates MAVS signaling is the translocase of the outer membrane (TOM) complex. TOM is a multiprotein complex located in the outer mitochondrial membrane that recognizes nuclear-encoded mitochondrial pre-proteins and import them into the transmembrane space of mitochondria (62). During RNA virus infection, TOM strongly interacts with MAVS through its clamp domain, recruiting TBK1 and IRF3 to mitochondria. This leads to IRF3 phosphorylation, and consequently to the activation of the antiviral response (63). There are also other cofactors that negatively regulate MAVS signaling. One of these factors is the NLR family member, NLRX1. This factor is located at the outer mitochondrial membrane, and it is able to interact with MAVS through its CARD domain, disrupting NF-κB and IRF3 signaling during viral infections (64).
INTRODUCTION
38
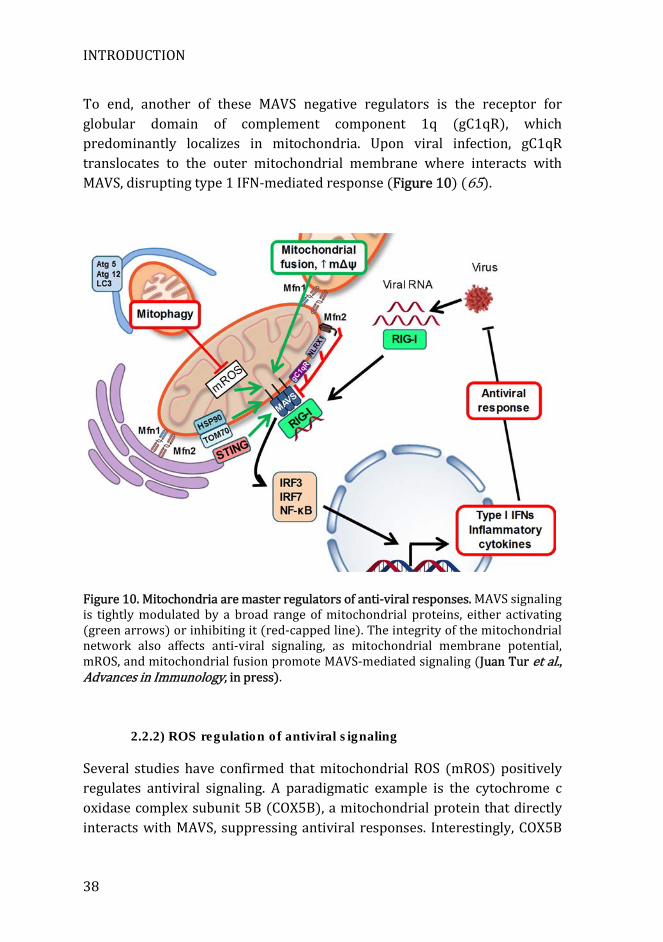
To end, another of these MAVS negative regulators is the receptor for globular domain of complement component 1q (gC1qR), which predominantly localizes in mitochondria. Upon viral infection, gC1qR translocates to the outer mitochondrial membrane where interacts with MAVS, disrupting type 1 IFN-mediated response (Figure 10) (65).
Figure 10. Mitochondria are master regulators of anti-viral responses. MAVS signaling is tightly modulated by a broad range of mitochondrial proteins, either activating (green arrows) or inhibiting it (red-capped line). The integrity of the mitochondrial network also affects anti-viral signaling, as mitochondrial membrane potential, mROS, and mitochondrial fusion promote MAVS-mediated signaling (Juan Tur et al., Advances in Immunology, in press).
2.2.2) ROS regulation of antiviral signaling
Several studies have confirmed that mitochondrial ROS (mROS) positively regulates antiviral signaling. A paradigmatic example is the cytochrome c oxidase complex subunit 5B (COX5B), a mitochondrial protein that directly interacts with MAVS, suppressing antiviral responses. Interestingly, COX5B
INTRODUCTION
39
functions as a terminal enzyme of the electron transporting chain inhibiting mROS production. This negative regulation of mROS is responsible for the impairment in antiviral signaling (66). Another study involving the use of autophagy-deficient cells revealed enhanced RLR signaling. These cells accumulate dysfunctional mitochondria that produce large amounts of mROS. Antioxidant treatment reversed increased antiviral signaling, thereby revealing that the amplification of RLR signaling is dependent on ROS. Additionally, increasing mROS production in wild type cells by means of rotenone treatment also results in enhanced RLR signaling (67). Finally, another study demonstrated that ROS are essential for RIG-I mediated IRF-3 phosphorylation and dimerization, and the subsequent production of IFN-β (68) (Figure 10).
2.3) Inflammasome activation and mitochondria
2.3.1) The mitochondrion is a platform for inflammasome activation
Recent studies suggest that there is a very tight relationship between mitochondria and inflammasome activation. Similarly to what happens with MAVS-mediated antiviral signaling, mitochondria acts as a signaling platform for inflammasome activation (44). Under basal conditions NLRP3 is located to ER, but upon activation, both NLRP3 and the adaptor protein ASC translocate to MAMs in the perinuclear region (69). One crucial step here is the spatial rearrangement of mitochondria around ER membranes. This rearrangement occurs through a microtubule and dynein-mediated mechanism that is required for inflammasome assembly (70). Furthermore, the antiviral signaling protein MAVS is also required for optimal NLRP3 inflammasome activity. In response to inflammasome activators, MAVS favors NLRP3 recruitment to mitochondria, and the subsequent maturation of IL-1β (71). Altogether these data indicate that mitochondria are signaling platforms for inflammasome assembly and activation.
2.3.2) Mitochondrial signals in inflammasome activation
Several mitochondrial-driven signals, such mROS, cytosolic mDNA, cardiolipin, and mitochondrial Ca2+ influx, are associated with NLRP3 inflammasome activation. NLRP3 stimulation by most of its agonists, such ATP, silica, or nigericin, induces and requires an increase in mROS generation. Experimental manipulation that decreases mROS production
INTRODUCTION
40
also results in attenuation of inflammasome responses, thereby suggesting that these molecules are necessary for inflammasome activation (72, 73). Several mechanisms have been put forward to explain mROS-mediated activation of the inflammasome, including modification of endogenous molecules to generate DAMPs, direct oxidation of NLRP3, and induction of mitochondrial dysfunction, allowing the release of mitochondrial components to the cytosol (74). However, there are some exceptions where mROS are dispensable for NLRP3 activation, such as activation by some viruses or with the antibiotic linezolid (75). In addition to mROS, mDNA is another mitochondrial-derived molecule that activates NLRP3 inflammasome. Upon mitochondrial dysfunction, oxidized mDNA is released to the cytosol, where binds and activates NLRP3 (76, 77). Similarly, cardiolipin, a phospholipid normally located in the inner mitochondrial membrane, is exposed to the cytosol-facing outer membrane when mitochondria are damaged, activating NLRP3 inflammasome (75). Ca2+ is another activator of NLRP3 inflammasome that can also lead to mitochondrial disruption, releasing mROS and mDNA, which further increase inflammasome activation (78). In most circumstances, activation of the NLRP3 inflammasome is associated with mitochondrial dysfunction. Nonetheless, there is some controversy as to whether mitochondrial damage is upstream or downstream caspase-1 activation. Yu et al. (79) showed that AIM2 and NLRP3 activation leads to caspase-1-dependent mitochondrial dysfunction, including membrane depolarization and permeabilization, placing mitochondrial damage downstream of caspase-1 activation. However, a number of studies have reached the opposite conclusion, placing mitochondrial dysfunction upstream of caspase-1 activation (74). Recently, using two distinct models, Zhong’s group (80) demonstrated that mitochondrial damage is upstream of caspase-1. First, they used macrophages deficient for NLRP3, ASC and caspase-1. These cells exhibit the same level of mitochondrial dysfunction as control macrophages when incubated with inflammasome agonists. They also used macrophages containing a constitutively activated variant of NLRP3, which release IL-1β without needing inflammasome agonists. These macrophages do not show mitochondrial damage when compared to control macrophages in absence of NLRP3 agonists. These findings support the notion that mitochondrial dysfunction is independent and upstream of caspase-1 activation. Finally, ER stress can also trigger inflammasome activation through inositol-requiring enzyme 1α (IRE1α) pathway. IRE1α
INTRODUCTION
41
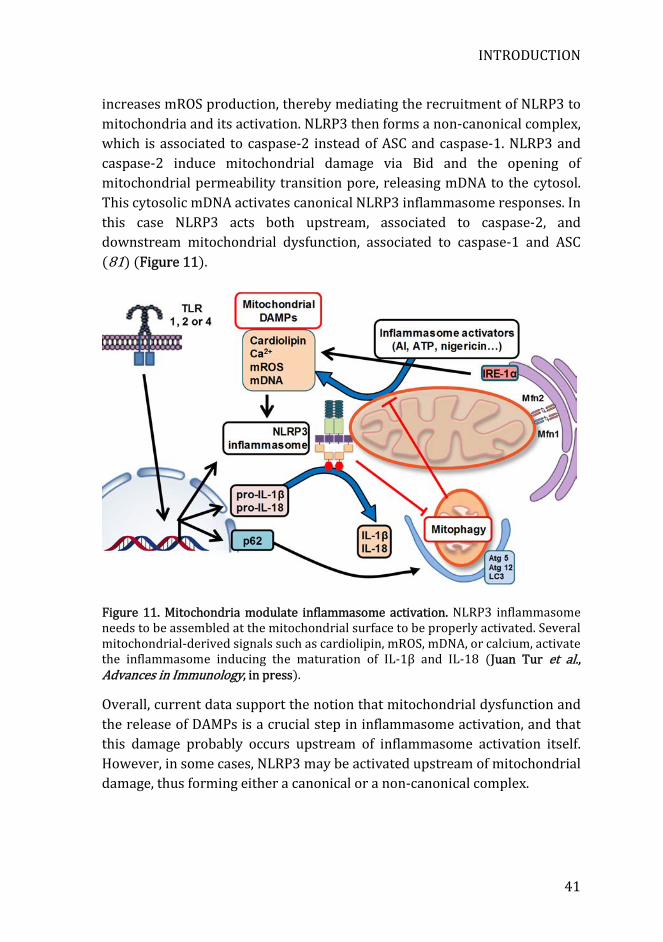
increases mROS production, thereby mediating the recruitment of NLRP3 to mitochondria and its activation. NLRP3 then forms a non-canonical complex, which is associated to caspase-2 instead of ASC and caspase-1. NLRP3 and caspase-2 induce mitochondrial damage via Bid and the opening of mitochondrial permeability transition pore, releasing mDNA to the cytosol. This cytosolic mDNA activates canonical NLRP3 inflammasome responses. In this case NLRP3 acts both upstream, associated to caspase-2, and downstream mitochondrial dysfunction, associated to caspase-1 and ASC (81) (Figure 11).
Figure 11. Mitochondria modulate inflammasome activation. NLRP3 inflammasome needs to be assembled at the mitochondrial surface to be properly activated. Several mitochondrial-derived signals such as cardiolipin, mROS, mDNA, or calcium, activate the inflammasome inducing the maturation of IL-1β and IL-18 (Juan Tur et al., Advances in Immunology, in press).
Overall, current data support the notion that mitochondrial dysfunction and the release of DAMPs is a crucial step in inflammasome activation, and that this damage probably occurs upstream of inflammasome activation itself. However, in some cases, NLRP3 may be activated upstream of mitochondrial damage, thus forming either a canonical or a non-canonical complex.
INTRODUCTION
42
2.3.3) Mitophagy restrains inflammasome activation
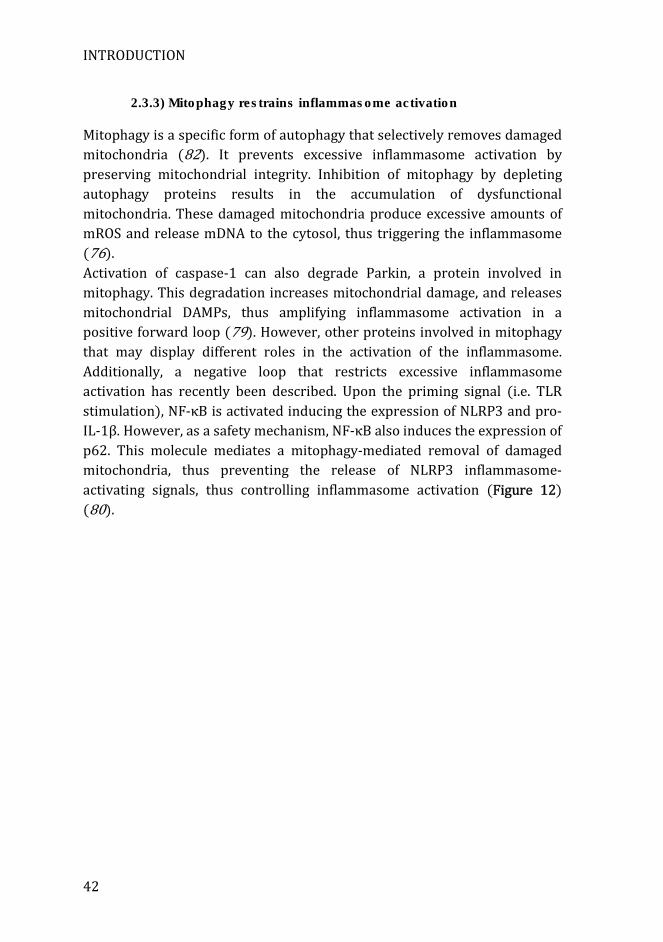
Mitophagy is a specific form of autophagy that selectively removes damaged mitochondria (82). It prevents excessive inflammasome activation by preserving mitochondrial integrity. Inhibition of mitophagy by depleting autophagy proteins results in the accumulation of dysfunctional mitochondria. These damaged mitochondria produce excessive amounts of mROS and release mDNA to the cytosol, thus triggering the inflammasome (76). Activation of caspase-1 can also degrade Parkin, a protein involved in mitophagy. This degradation increases mitochondrial damage, and releases mitochondrial DAMPs, thus amplifying inflammasome activation in a positive forward loop (79). However, other proteins involved in mitophagy that may display different roles in the activation of the inflammasome. Additionally, a negative loop that restricts excessive inflammasome activation has recently been described. Upon the priming signal (i.e. TLR stimulation), NF-κB is activated inducing the expression of NLRP3 and pro-IL-1β. However, as a safety mechanism, NF-κB also induces the expression of p62. This molecule mediates a mitophagy-mediated removal of damaged mitochondria, thus preventing the release of NLRP3 inflammasome-activating signals, thus controlling inflammasome activation (Figure 12) (80).
INTRODUCTION
43
Figure 12. Negative feedback during inflammasome activation. To avoid excessive activation of the inflammasome, autophagy is activated at the same time as the expression of NLRP3. This allows the removal of damaged mitochondria, restricting the release of DAMPs (83).
2.4) Mitochondrial ROS in innate immune responses
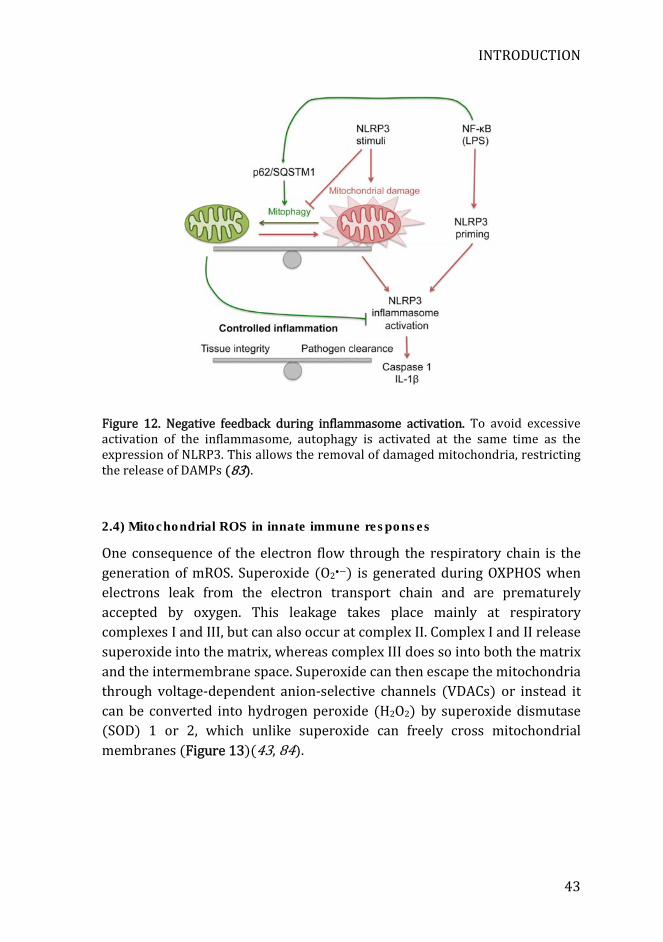
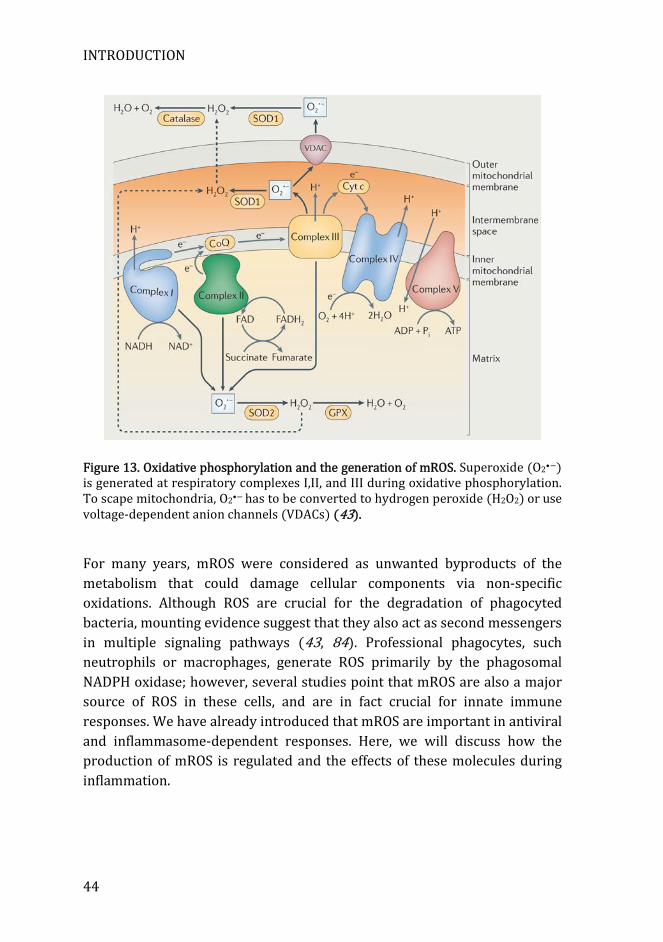
One consequence of the electron flow through the respiratory chain is the generation of mROS. Superoxide (O2•−) is generated during OXPHOS when electrons leak from the electron transport chain and are prematurely accepted by oxygen. This leakage takes place mainly at respiratory complexes I and III, but can also occur at complex II. Complex I and II release superoxide into the matrix, whereas complex III does so into both the matrix and the intermembrane space. Superoxide can then escape the mitochondria through voltage-dependent anion-selective channels (VDACs) or instead it can be converted into hydrogen peroxide (H2O2) by superoxide dismutase (SOD) 1 or 2, which unlike superoxide can freely cross mitochondrial membranes (Figure 13)(43, 84).
INTRODUCTION
44
Figure 13. Oxidative phosphorylation and the generation of mROS. Superoxide (O2•−) is generated at respiratory complexes I,II, and III during oxidative phosphorylation. To scape mitochondria, O2•− has to be converted to hydrogen peroxide (H2O2) or use voltage-dependent anion channels (VDACs) (43).
For many years, mROS were considered as unwanted byproducts of the metabolism that could damage cellular components via non-specific oxidations. Although ROS are crucial for the degradation of phagocyted bacteria, mounting evidence suggest that they also act as second messengers in multiple signaling pathways (43, 84). Professional phagocytes, such neutrophils or macrophages, generate ROS primarily by the phagosomal NADPH oxidase; however, several studies point that mROS are also a major source of ROS in these cells, and are in fact crucial for innate immune responses. We have already introduced that mROS are important in antiviral and inflammasome-dependent responses. Here, we will discuss how the production of mROS is regulated and the effects of these molecules during inflammation.
INTRODUCTION
45
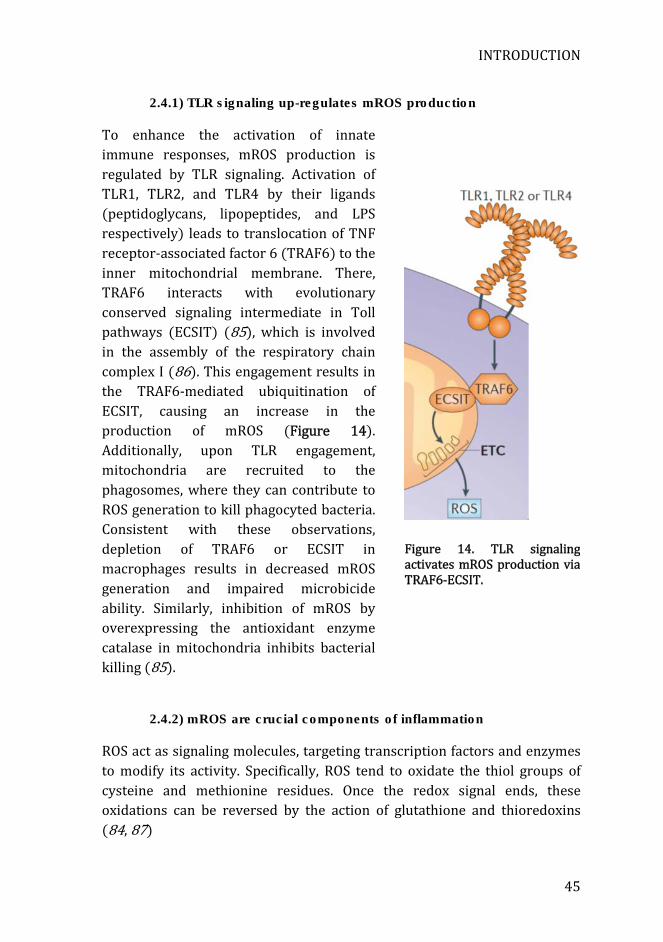
Figure 14. TLR signaling activates mROS production via TRAF6-ECSIT.
2.4.1) TLR signaling up-regulates mROS production
To enhance the activation of innate immune responses, mROS production is regulated by TLR signaling. Activation of TLR1, TLR2, and TLR4 by their ligands (peptidoglycans, lipopeptides, and LPS respectively) leads to translocation of TNF receptor-associated factor 6 (TRAF6) to the inner mitochondrial membrane. There, TRAF6 interacts with evolutionary conserved signaling intermediate in Toll pathways (ECSIT) (85), which is involved in the assembly of the respiratory chain complex I (86). This engagement results in the TRAF6-mediated ubiquitination of ECSIT, causing an increase in the production of mROS (Figure 14). Additionally, upon TLR engagement, mitochondria are recruited to the phagosomes, where they can contribute to ROS generation to kill phagocyted bacteria. Consistent with these observations, depletion of TRAF6 or ECSIT in macrophages results in decreased mROS generation and impaired microbicide ability. Similarly, inhibition of mROS by overexpressing the antioxidant enzyme catalase in mitochondria inhibits bacterial killing (85).
2.4.2) mROS are crucial components of inflammation
ROS act as signaling molecules, targeting transcription factors and enzymes to modify its activity. Specifically, ROS tend to oxidate the thiol groups of cysteine and methionine residues. Once the redox signal ends, these oxidations can be reversed by the action of glutathione and thioredoxins (84, 87)
INTRODUCTION
46
The most well-known mechanism of ROS-mediated activation of inflammatory signaling pathway is the inhibition of MAPK phosphatases (MKP) by oxidation of their catalytic center, a process that allows the sustained activation of MAPKs. However, the possibility that ROS directly activate MAPK cannot be discarded (88). Specifically, ROS has been shown to prevent the dephosphorylation of JNK (89), ERK (90, 91), and p38 (91), enhancing pro-inflammatory signaling. As macrophages produce ROS at both mitochondria and NADPH oxidase, it is difficult to evaluate the relative contribution of each source to the activation of inflammatory signaling pathways. In spite of limited knowledge in this regard, several studies have revealed that specifically mROS are crucial molecules the generation of inflammatory responses in macrophages. In the first place, Balua and colleagues (92) demonstrated that peripheral blood mononuclear cells (PBMCs) from patients with the TNF receptor-associated periodic syndrome (TRAPS) show increased mROS levels, as well as enhanced MAPK activation and inflammatory cytokine production. Treatment with antioxidants reversed the increased inflammatory phenotype, thereby demonstrating the central role of ROS. Furthermore, they confirmed that the effects are specifically attributable to mROS, as deletion of NADPH oxidases did not reverse the phenotype. A second study using KO for NADH dehydrogenase [ubiquinone] iron-sulfur protein 4 (NDUFS4), further confirmed the notion that mROS activate inflammatory signaling. NDUFS4 is a subunit of the electron transport chain (ETC) complex I that is required for oxidative phosphorylation and represses mROS production. In response to LPS, macrophages deficient for NDUFS4 showed increased mROS as well as increased expression of pro-inflammatory cytokines (93). Finally, a third study demonstrated that mROS are directly involved in LPS-mediated production of pro-IL-1β. LPS-activated macrophages treated with either metformin (a drug for type-2 diabetes) or with rotenone (a respiratory complex I inhibitor), showed decreased mROS generation and, consequently, a decrease in pro-IL-1β expression. Furthermore, treatment with MitoQ, a specific mROS scavenger, inhibits pro-IL-1β expression, further confirming the role of mROS in inflammatory activation (94). The specific role of mROS in inflammation has been further confirmed by modulation of the uncoupling protein 2 (UCP2), a mitochondrial protein that is distributed ubiquitously, but shows higher expression in macrophages. The modulation of UCP2 generates moderate mitochondrial uncoupling with
INTRODUCTION
47
reduction in electron leak from OXPHOS, resulting in a significant decrease in mROS generation (95). UCP2 overexpression in macrophages produces a significant decrease in mROS production, which leads to a decrease in the inducible nitric oxide synthase (NOS2) and in the production of nitric oxide (96). In contrast, upon LPS stimulation, UCP2-/- macrophages generate more mROS, thus resulting in enhanced ERK, p38, and NF-κB signaling, and increased induction of pro-inflammatory mediators, such as nitric oxide, IL-6 and IL-1β. Moreover, these effects of UCP2 deficiency are reversed with ROS scavenging. This observation therefore supports the notion that mROS drive macrophage inflammatory signaling (97, 98). UCP2 is also involved in a negative regulation of mROS in the immune responses against pathogenic microorganisms. UCP2-/- mice exhibit enhanced resistance to Toxoplasma gondii (99) and Listeria monocytogenes infection (98). Additionally, UCP2-deficient macrophages show increased toxoplamacidal activity, as well as increased bactericidal activity against Salmonella typhimurium, thanks to the increase in ROS production (99). In fact, other pathogens such Leishmania, have even developed survival strategies involving induction of UCP2 to inhibit mROS generation. In a model of leishmaniosis, down-regulation of UCP2 increases mROS production, thus leading to enhanced p38 and ERK activation, increased pro-inflammatory cytokine production, and decreased survival of the parasite (100). Due to its importance during inflammation and infection, UCP2 must be tightly regulated. Upon LPS stimulation, UCP2 is rapidly down-regulated in a p38 and JNK-dependent manner (96, 101). This down-regulation of UCP2 leads to an increase in mROS production, which further activates p38, initiating a signaling amplification loop that enhances the inflammatory response (Figure 15)(101).
INTRODUCTION
48
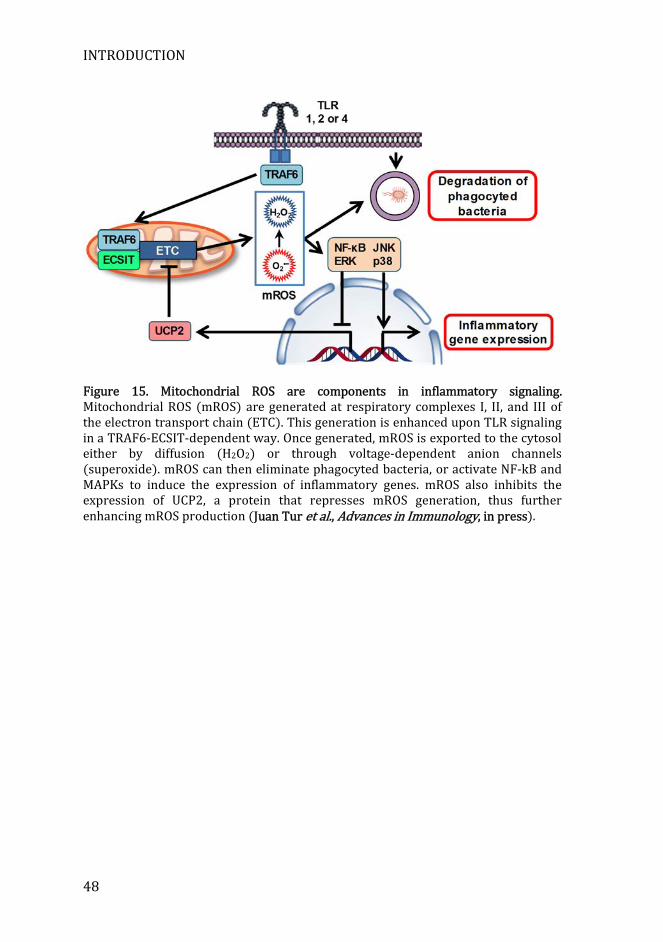
Figure 15. Mitochondrial ROS are components in inflammatory signaling. Mitochondrial ROS (mROS) are generated at respiratory complexes I, II, and III of the electron transport chain (ETC). This generation is enhanced upon TLR signaling in a TRAF6-ECSIT-dependent way. Once generated, mROS is exported to the cytosol either by diffusion (H2O2) or through voltage-dependent anion channels (superoxide). mROS can then eliminate phagocyted bacteria, or activate NF-kB and MAPKs to induce the expression of inflammatory genes. mROS also inhibits the expression of UCP2, a protein that represses mROS generation, thus further enhancing mROS production (Juan Tur et al., Advances in Immunology, in press).
INTRODUCTION
49
3) Mitochondrial dynamics
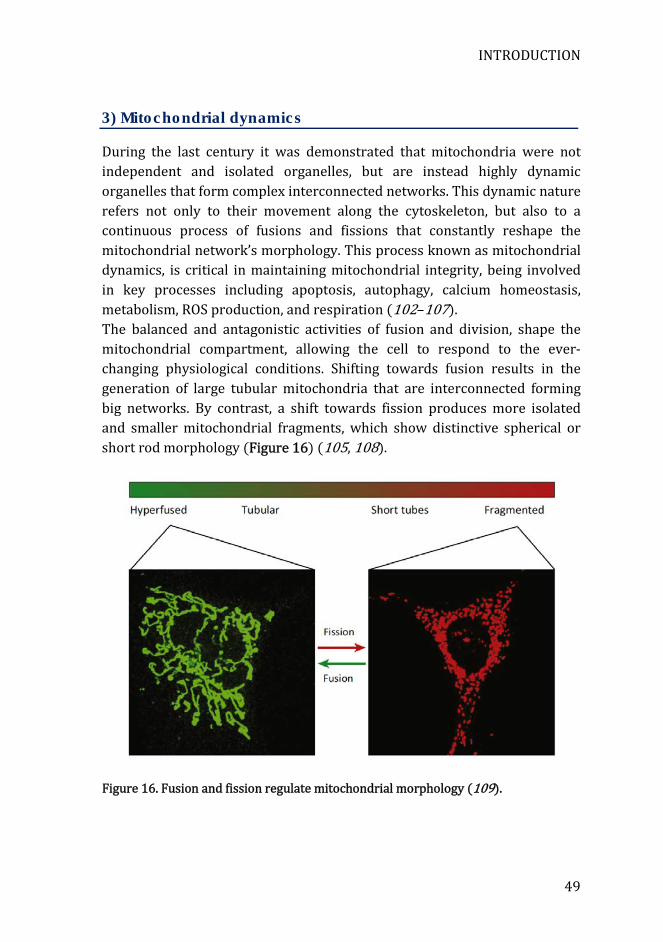
During the last century it was demonstrated that mitochondria were not independent and isolated organelles, but are instead highly dynamic organelles that form complex interconnected networks. This dynamic nature refers not only to their movement along the cytoskeleton, but also to a continuous process of fusions and fissions that constantly reshape the mitochondrial network’s morphology. This process known as mitochondrial dynamics, is critical in maintaining mitochondrial integrity, being involved in key processes including apoptosis, autophagy, calcium homeostasis, metabolism, ROS production, and respiration (102–107). The balanced and antagonistic activities of fusion and division, shape the mitochondrial compartment, allowing the cell to respond to the ever-changing physiological conditions. Shifting towards fusion results in the generation of large tubular mitochondria that are interconnected forming big networks. By contrast, a shift towards fission produces more isolated and smaller mitochondrial fragments, which show distinctive spherical or short rod morphology (Figure 16) (105, 108).
Figure 16. Fusion and fission regulate mitochondrial morphology (109).
INTRODUCTION
50
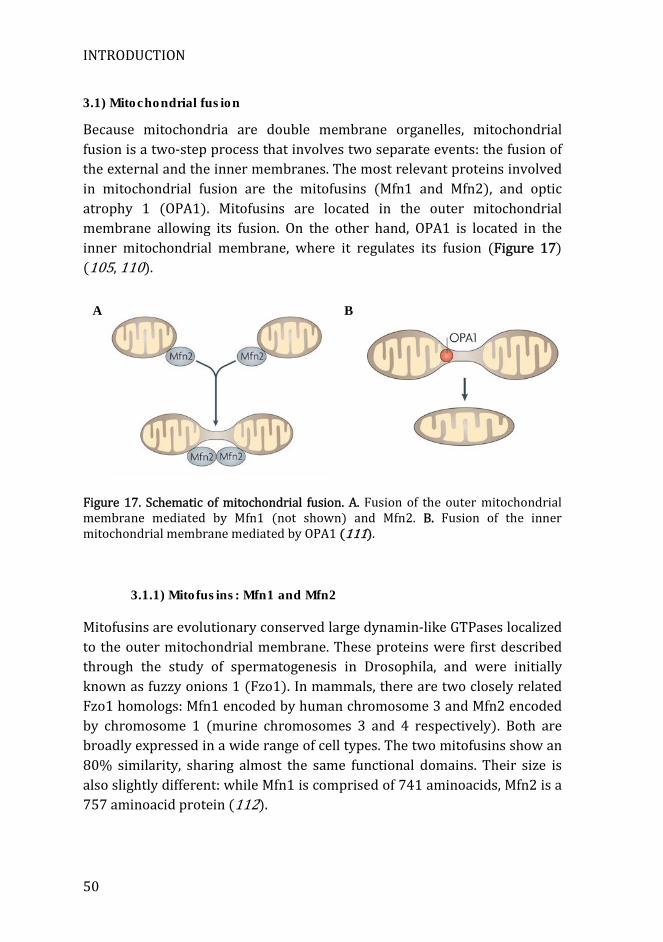
3.1) Mitochondrial fusion
Because mitochondria are double membrane organelles, mitochondrial fusion is a two-step process that involves two separate events: the fusion of the external and the inner membranes. The most relevant proteins involved in mitochondrial fusion are the mitofusins (Mfn1 and Mfn2), and optic atrophy 1 (OPA1). Mitofusins are located in the outer mitochondrial membrane allowing its fusion. On the other hand, OPA1 is located in the inner mitochondrial membrane, where it regulates its fusion (Figure 17) (105, 110).
Figure 17. Schematic of mitochondrial fusion. A. Fusion of the outer mitochondrial membrane mediated by Mfn1 (not shown) and Mfn2. B. Fusion of the inner mitochondrial membrane mediated by OPA1 (111).
3.1.1) Mitofusins: Mfn1 and Mfn2
Mitofusins are evolutionary conserved large dynamin-like GTPases localized to the outer mitochondrial membrane. These proteins were first described through the study of spermatogenesis in Drosophila, and were initially known as fuzzy onions 1 (Fzo1). In mammals, there are two closely related Fzo1 homologs: Mfn1 encoded by human chromosome 3 and Mfn2 encoded by chromosome 1 (murine chromosomes 3 and 4 respectively). Both are broadly expressed in a wide range of cell types. The two mitofusins show an 80% similarity, sharing almost the same functional domains. Their size is also slightly different: while Mfn1 is comprised of 741 aminoacids, Mfn2 is a 757 aminoacid protein (112).
A B

INTRODUCTION
51
Both mitofusins are integral transmembrane proteins with the carboxyl and the amino-terminal parts exposed to the cytosol, and a small part facing the intermembrane space and splitting in two the transmembrane domain. The carboxyl-terminal domain contains the bipartite transmembrane domain and a heptad-repeat domain (HR2, also known as coiled-coil domain). The amino-terminal domain contains a GTPase domain and another heptad-repeat domain (HR1). The HR2 domain is responsible for the tethering of two adjacent mitochondrial membranes through the formation of a dimeric anti-parallel coiled-coil structure. This interaction can be either homotypic (Mfn1-Mfn1 or Mfn2-Mfn2) or heterotypic (Mfn1-Mfn2) (113). The GTPase domain is comprised of five GTPase motifs (G1 to G5) that specifically bind GTP and catalyze its hydrolysis. Fusion activity of Mfn1 and Mfn2 is completely dependent on their GTPase activity. Mfn2 also presents a proline-rich region next to the transmembrane domain that would presumably modulate the protein-protein interactions (Figure 18) (105).
Figure 18. Schematic structure of the mitofusins. A) Topology of Mfn1 and Mfn2 domains. G1 to G5: GTPase motifs. CC1 and CC2: coiled-coil 1 and 2 (also known as HR1 and HR2). TM: transmembrane domain. PR: proline-rich region (61). B) Predicted 3-D structure for Mfn2 (Image from protein data bank).
A
B
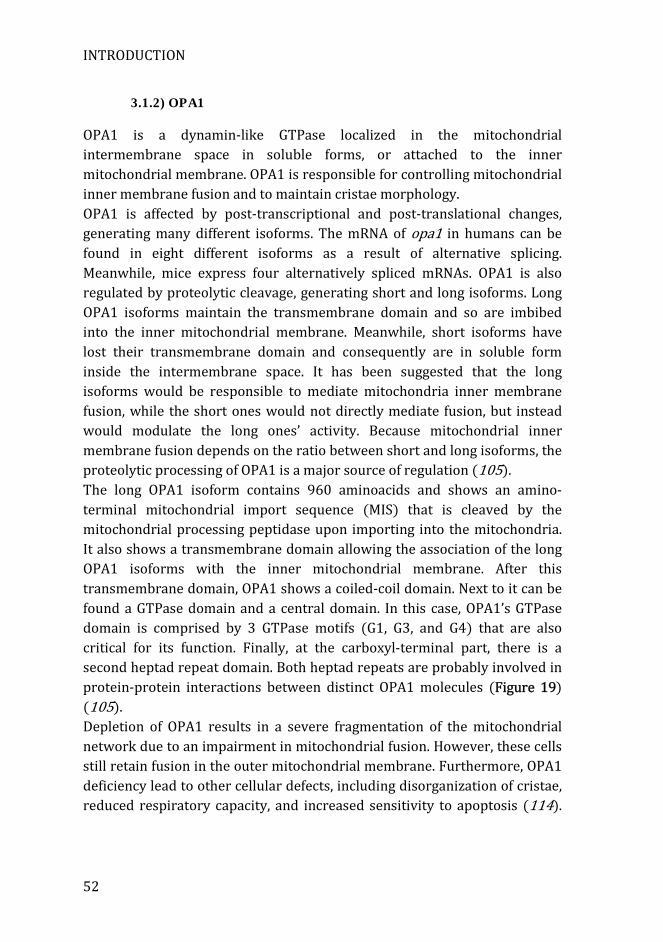
INTRODUCTION
52
3.1.2) OPA1
OPA1 is a dynamin-like GTPase localized in the mitochondrial intermembrane space in soluble forms, or attached to the inner mitochondrial membrane. OPA1 is responsible for controlling mitochondrial inner membrane fusion and to maintain cristae morphology. OPA1 is affected by post-transcriptional and post-translational changes, generating many different isoforms. The mRNA of opa1 in humans can be found in eight different isoforms as a result of alternative splicing. Meanwhile, mice express four alternatively spliced mRNAs. OPA1 is also regulated by proteolytic cleavage, generating short and long isoforms. Long OPA1 isoforms maintain the transmembrane domain and so are imbibed into the inner mitochondrial membrane. Meanwhile, short isoforms have lost their transmembrane domain and consequently are in soluble form inside the intermembrane space. It has been suggested that the long isoforms would be responsible to mediate mitochondria inner membrane fusion, while the short ones would not directly mediate fusion, but instead would modulate the long ones’ activity. Because mitochondrial inner membrane fusion depends on the ratio between short and long isoforms, the proteolytic processing of OPA1 is a major source of regulation (105). The long OPA1 isoform contains 960 aminoacids and shows an amino-terminal mitochondrial import sequence (MIS) that is cleaved by the mitochondrial processing peptidase upon importing into the mitochondria. It also shows a transmembrane domain allowing the association of the long OPA1 isoforms with the inner mitochondrial membrane. After this transmembrane domain, OPA1 shows a coiled-coil domain. Next to it can be found a GTPase domain and a central domain. In this case, OPA1’s GTPase domain is comprised by 3 GTPase motifs (G1, G3, and G4) that are also critical for its function. Finally, at the carboxyl-terminal part, there is a second heptad repeat domain. Both heptad repeats are probably involved in protein-protein interactions between distinct OPA1 molecules (Figure 19) (105). Depletion of OPA1 results in a severe fragmentation of the mitochondrial network due to an impairment in mitochondrial fusion. However, these cells still retain fusion in the outer mitochondrial membrane. Furthermore, OPA1 deficiency lead to other cellular defects, including disorganization of cristae, reduced respiratory capacity, and increased sensitivity to apoptosis (114).
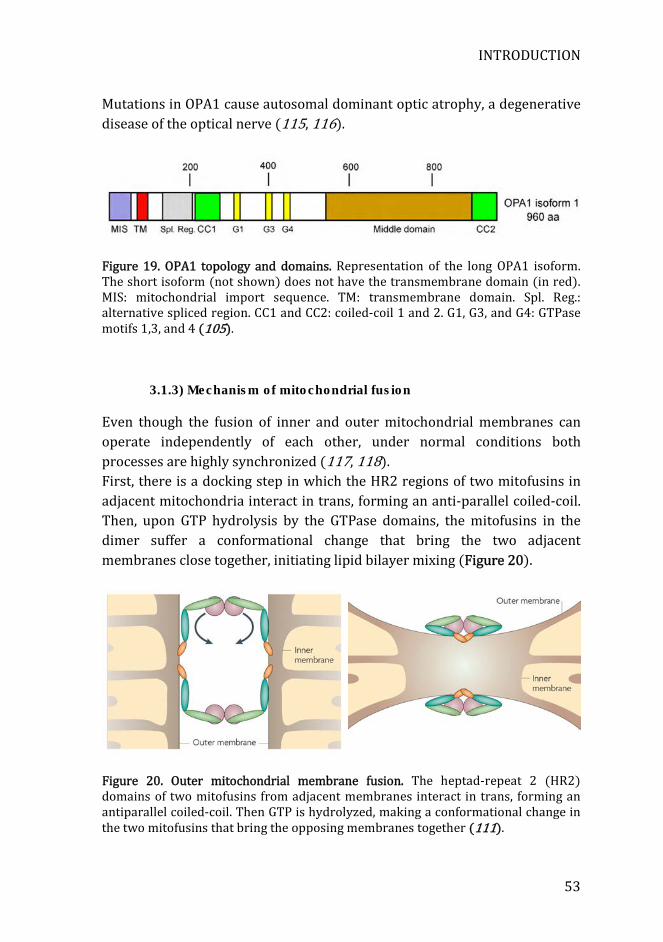
INTRODUCTION
53
Mutations in OPA1 cause autosomal dominant optic atrophy, a degenerative disease of the optical nerve (115, 116).
Figure 19. OPA1 topology and domains. Representation of the long OPA1 isoform. The short isoform (not shown) does not have the transmembrane domain (in red). MIS: mitochondrial import sequence. TM: transmembrane domain. Spl. Reg.: alternative spliced region. CC1 and CC2: coiled-coil 1 and 2. G1, G3, and G4: GTPase motifs 1,3, and 4 (105).
3.1.3) Mechanism of mitochondrial fusion
Even though the fusion of inner and outer mitochondrial membranes can operate independently of each other, under normal conditions both processes are highly synchronized (117, 118). First, there is a docking step in which the HR2 regions of two mitofusins in adjacent mitochondria interact in trans, forming an anti-parallel coiled-coil. Then, upon GTP hydrolysis by the GTPase domains, the mitofusins in the dimer suffer a conformational change that bring the two adjacent membranes close together, initiating lipid bilayer mixing (Figure 20).
Figure 20. Outer mitochondrial membrane fusion. The heptad-repeat 2 (HR2) domains of two mitofusins from adjacent membranes interact in trans, forming an antiparallel coiled-coil. Then GTP is hydrolyzed, making a conformational change in the two mitofusins that bring the opposing membranes together (111).
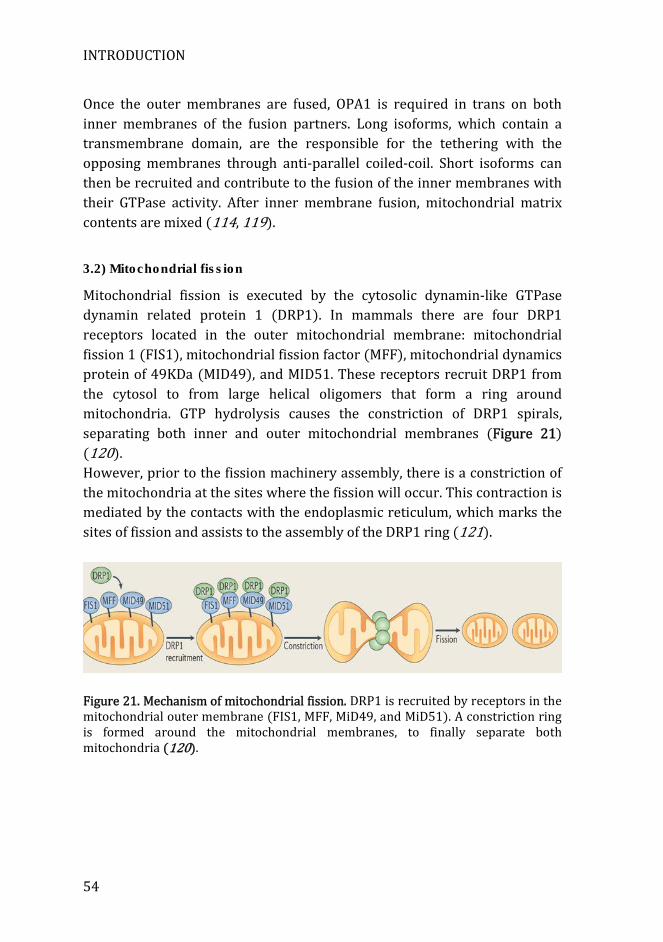
INTRODUCTION
54
Once the outer membranes are fused, OPA1 is required in trans on both inner membranes of the fusion partners. Long isoforms, which contain a transmembrane domain, are the responsible for the tethering with the opposing membranes through anti-parallel coiled-coil. Short isoforms can then be recruited and contribute to the fusion of the inner membranes with their GTPase activity. After inner membrane fusion, mitochondrial matrix contents are mixed (114, 119).
3.2) Mitochondrial fission
Mitochondrial fission is executed by the cytosolic dynamin-like GTPase dynamin related protein 1 (DRP1). In mammals there are four DRP1 receptors located in the outer mitochondrial membrane: mitochondrial fission 1 (FIS1), mitochondrial fission factor (MFF), mitochondrial dynamics protein of 49KDa (MID49), and MID51. These receptors recruit DRP1 from the cytosol to from large helical oligomers that form a ring around mitochondria. GTP hydrolysis causes the constriction of DRP1 spirals, separating both inner and outer mitochondrial membranes (Figure 21) (120). However, prior to the fission machinery assembly, there is a constriction of the mitochondria at the sites where the fission will occur. This contraction is mediated by the contacts with the endoplasmic reticulum, which marks the sites of fission and assists to the assembly of the DRP1 ring (121).
Figure 21. Mechanism of mitochondrial fission. DRP1 is recruited by receptors in the mitochondrial outer membrane (FIS1, MFF, MiD49, and MiD51). A constriction ring is formed around the mitochondrial membranes, to finally separate both mitochondria (120).
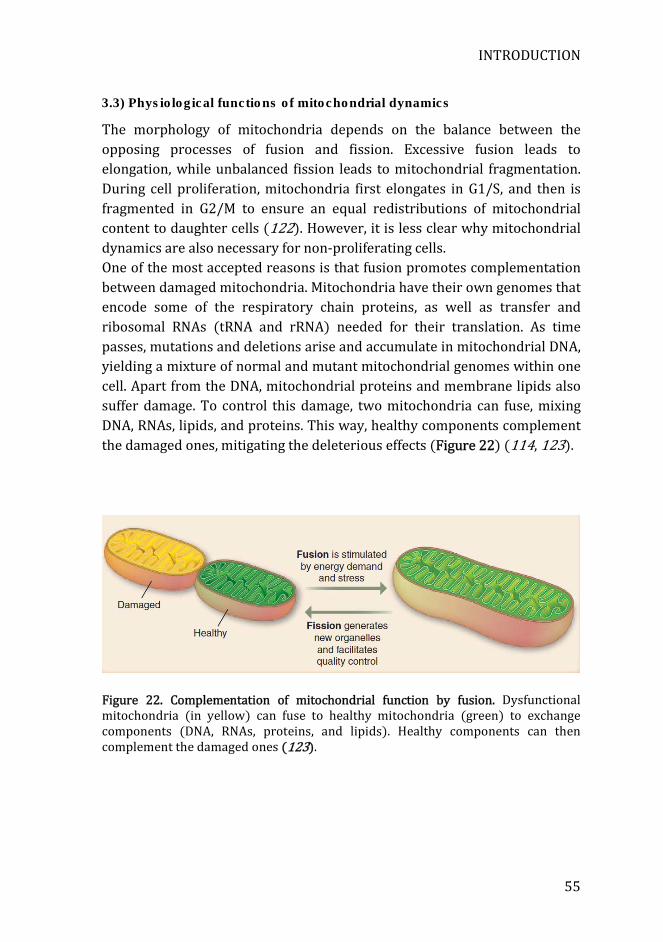
INTRODUCTION
55
3.3) Physiological functions of mitochondrial dynamics
The morphology of mitochondria depends on the balance between the opposing processes of fusion and fission. Excessive fusion leads to elongation, while unbalanced fission leads to mitochondrial fragmentation. During cell proliferation, mitochondria first elongates in G1/S, and then is fragmented in G2/M to ensure an equal redistributions of mitochondrial content to daughter cells (122). However, it is less clear why mitochondrial dynamics are also necessary for non-proliferating cells. One of the most accepted reasons is that fusion promotes complementation between damaged mitochondria. Mitochondria have their own genomes that encode some of the respiratory chain proteins, as well as transfer and ribosomal RNAs (tRNA and rRNA) needed for their translation. As time passes, mutations and deletions arise and accumulate in mitochondrial DNA, yielding a mixture of normal and mutant mitochondrial genomes within one cell. Apart from the DNA, mitochondrial proteins and membrane lipids also suffer damage. To control this damage, two mitochondria can fuse, mixing DNA, RNAs, lipids, and proteins. This way, healthy components complement the damaged ones, mitigating the deleterious effects (Figure 22) (114, 123).
Figure 22. Complementation of mitochondrial function by fusion. Dysfunctional mitochondria (in yellow) can fuse to healthy mitochondria (green) to exchange components (DNA, RNAs, proteins, and lipids). Healthy components can then complement the damaged ones (123).
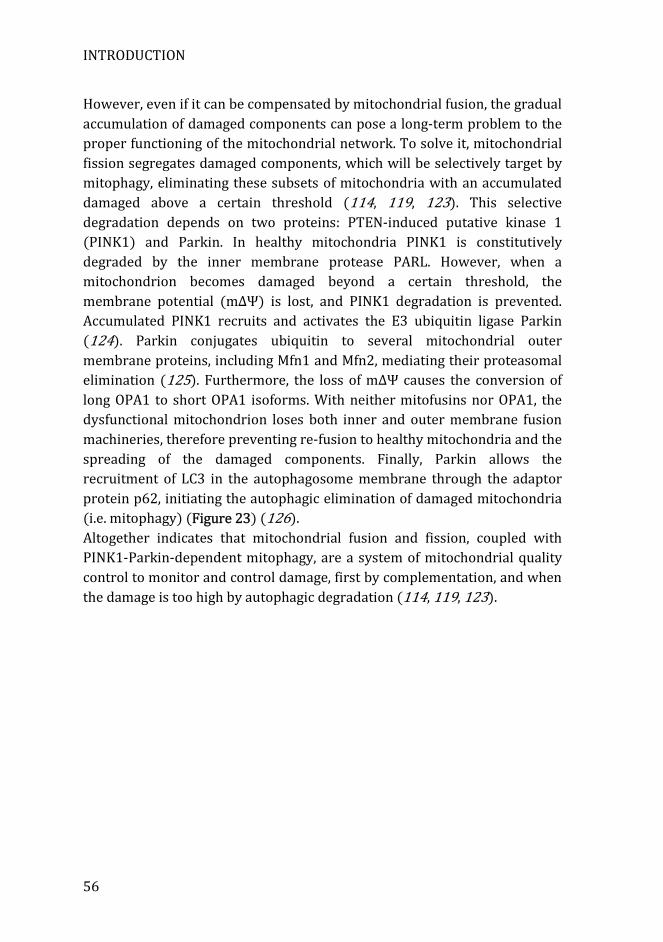
INTRODUCTION
56
However, even if it can be compensated by mitochondrial fusion, the gradual accumulation of damaged components can pose a long-term problem to the proper functioning of the mitochondrial network. To solve it, mitochondrial fission segregates damaged components, which will be selectively target by mitophagy, eliminating these subsets of mitochondria with an accumulated damaged above a certain threshold (114, 119, 123). This selective degradation depends on two proteins: PTEN-induced putative kinase 1 (PINK1) and Parkin. In healthy mitochondria PINK1 is constitutively degraded by the inner membrane protease PARL. However, when a mitochondrion becomes damaged beyond a certain threshold, the membrane potential (mΔΨ) is lost, and PINK1 degradation is prevented. Accumulated PINK1 recruits and activates the E3 ubiquitin ligase Parkin (124). Parkin conjugates ubiquitin to several mitochondrial outer membrane proteins, including Mfn1 and Mfn2, mediating their proteasomal elimination (125). Furthermore, the loss of mΔΨ causes the conversion of long OPA1 to short OPA1 isoforms. With neither mitofusins nor OPA1, the dysfunctional mitochondrion loses both inner and outer membrane fusion machineries, therefore preventing re-fusion to healthy mitochondria and the spreading of the damaged components. Finally, Parkin allows the recruitment of LC3 in the autophagosome membrane through the adaptor protein p62, initiating the autophagic elimination of damaged mitochondria (i.e. mitophagy) (Figure 23) (126). Altogether indicates that mitochondrial fusion and fission, coupled with PINK1-Parkin-dependent mitophagy, are a system of mitochondrial quality control to monitor and control damage, first by complementation, and when the damage is too high by autophagic degradation (114, 119, 123).
INTRODUCTION
57
Figure 23. Mitochondrial life cycle and the contribution of mitochondrial dynamics and mitochondria quality control. Mitochondria gradually accumulate damage, but its effects are avoided by complementation through mitochondrial fusion. Damaged components are ultimately segregated by mitochondrial fission. Mitochondria with accumulated above a certain threshold become depolarized, and are degraded by PINK1-Parkin-mediated mitophagy (126).
3.4) Mfn2: A mitochondrial protein with roles beyond fusion
Even though both mitofusins are highly homologous and share almost the same domains (except for the proline-rich region in Mfn2), they have different functional roles. In this section the differences between Mfn1 and Mfn2 in mitochondrial fusion, and the other functional roles of Mfn2 will be discussed.
3.4.1) Differences in mitochondrial fusion between Mfn1 and Mfn2
Mfn1 and Mfn2 appear to play redundant roles regarding mitochondrial fusion. Interestingly, the phenotype of cells lacking Mfn1 differ significantly
INTRODUCTION
58
of Mfn2-null cells, demonstrating that they have distinct roles in controlling mitochondrial fusion (Table 1). Overexpression of Mfn2 in fibroblasts altered mitochondrial morphology, generating either reticular structures or extensive perinuclear clusters. On the other hand, Mfn1 overexpression modifies mitochondrial morphology but on a different way, generating grape-like perinuclear clusters. Knocking out Mfn1 or Mfn2 in mouse embryonic fibroblasts (MEFs) result in a fragmented mitochondrial network. However, there are differences between the two mitofusins. While Mfn1 deficiency generates either very short mitochondrial tubules or small spheres that are uniform in size and broadly dispersed, loss of Mfn2 produces less fragmentation, generating mitochondrial spheres of varying sizes concentrated near the nucleus (127). These observations could be explained because Mfn1 shows a much higher GTPase activity, and therefore tethers mitochondria more efficiently than Mfn2. Despite that, Mfn2 still shows a higher affinity for GTP than Mfn1 (128). Both mitofusins are essential for embryonic development. Mice deficient in either single mitofusin die during mid-gestation due to a lethal placental defect. However, while Mfn2-deficient embryos specifically show a severe disruption of the trophoblast giant cell layer in the placenta. By contrast, Mfn1-deficient embryos’ giant cells are normal. Exogenously expressing mitofusins in the placenta can prevent the embryonic lethality of either of these KO. By this way, Mfn1 KO become fully viable and fertile, and do not present any physiological alterations, even one year after birth. Conversely, Mfn2 KO mice, although viable, show impaired cerebellar development with dysfunction in Purkinje cells. Most of these mice dice between 1 and 17 days after being born. One explanation for these neurological defects is that Mfn2 plays a major role in the axonal transport of mitochondria and the maintenance the axonal projections of dopaminergic neurons. Mutations of the mfn2 gene in humans are mainly associated with the autosomal dominant neurodegenerative disease Charcot-Marie-Tooth 2A (CMT2A). Other hereditary motor and sensory neuropathies have been also associated with mfn2 mutations (129). Finally, OPA1 requires Mfn1 to undergo inner mitochondrial membrane fusion. Such functional dependence has not been detected between Mfn2 and OPA1. This suggests that while Mfn1 would be the responsible to engage mitochondrial fusion in coordination with inner membrane fusion, Mfn2 fusion may be independent and more focused on other functions (130, 131).
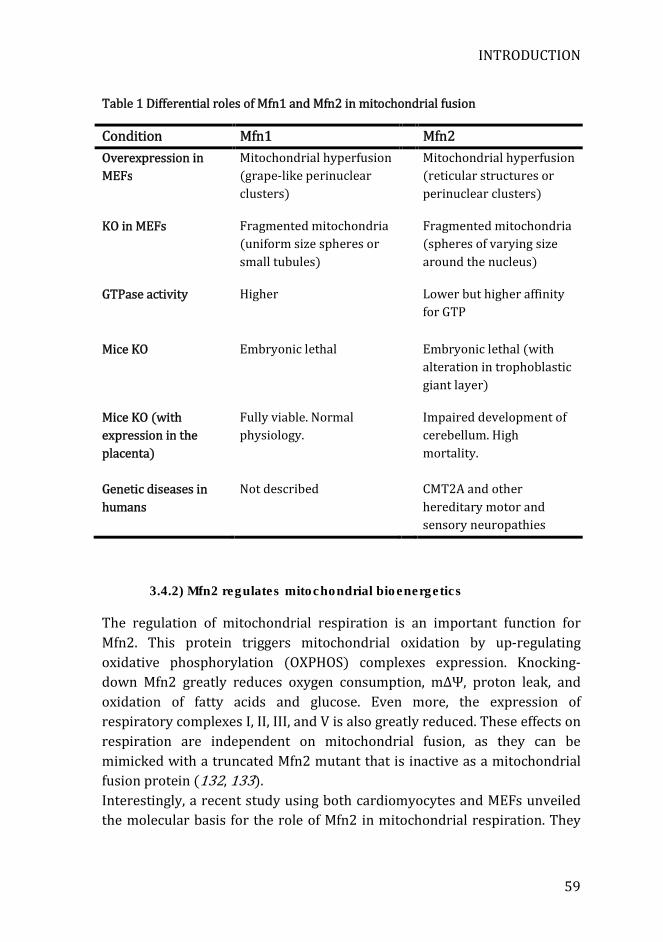
INTRODUCTION
59
Table 1 Differential roles of Mfn1 and Mfn2 in mitochondrial fusion
Condition Mfn1 Mfn2
Overexpression in MEFs
Mitochondrial hyperfusion (grape-like perinuclear clusters)
Mitochondrial hyperfusion (reticular structures or perinuclear clusters)
KO in MEFs Fragmented mitochondria (uniform size spheres or small tubules)
Fragmented mitochondria (spheres of varying size around the nucleus)
GTPase activity Higher Lower but higher affinity for GTP
Mice KO Embryonic lethal Embryonic lethal (with alteration in trophoblastic giant layer)
Mice KO (with expression in the placenta)
Fully viable. Normal physiology.
Impaired development of cerebellum. High mortality.
Genetic diseases in humans
Not described CMT2A and other hereditary motor and sensory neuropathies
3.4.2) Mfn2 regulates mitochondrial bioenergetics
The regulation of mitochondrial respiration is an important function for Mfn2. This protein triggers mitochondrial oxidation by up-regulating oxidative phosphorylation (OXPHOS) complexes expression. Knocking-down Mfn2 greatly reduces oxygen consumption, mΔΨ, proton leak, and oxidation of fatty acids and glucose. Even more, the expression of respiratory complexes I, II, III, and V is also greatly reduced. These effects on respiration are independent on mitochondrial fusion, as they can be mimicked with a truncated Mfn2 mutant that is inactive as a mitochondrial fusion protein (132, 133). Interestingly, a recent study using both cardiomyocytes and MEFs unveiled the molecular basis for the role of Mfn2 in mitochondrial respiration. They
INTRODUCTION
60
demonstrate that Mfn2 regulates the terpenoid biosynthesis pathway, which is required to maintain mitochondrial coenzyme Q (ubiquinone) levels for optimal function of the respiratory chain. Decreased respiration in Mfn2-null cells can be rescued with coenzyme Q10 complementation (134). In keeping with this role of Mfn2 in metabolism, several human conditions characterized by defective mitochondrial oxidation, such as type 2 diabetes mellitus and obesity are associated with decreased mfn2 expression. Conversely, conditions characterized by increased mitochondrial oxidation, including exercise and weight loss are associated with increased expression of this gene (132, 135, 136).
3.4.3) Mfn2 mediates mitochondria-ER contacts
Finally, another specific function of Mfn2 is allowing the contacts between ER and mitochondria. In addition to being located at the mitochondria, Mfn2 can also be found on MAMs (137). There, it mediates the tethering between the two organelles, also regulating the ER’s morphology and calcium transfer between both organelles (137–139). Furthermore, Mfn2 decreases ER stress responses by inhibiting protein kinase RNA-like endoplasmic reticulum kinase (PERK) pathway (138).
3.4.4) Mfn2 modulates the cell fate
Mfn2 is involved in cell fate, regulating the decisions to undergo apoptosis, proliferation, and senescence. First, as evidenced in different cell models, mfn2 overexpression inhibits proliferation. In these cases, Mfn2 act as a suppressor of proliferation through interaction with p21ras and Raf-1, resulting in the inhibition of ERK1/2 signaling pathway (140–142). Second, cellular senescence has also been associated with elongation of the mitochondrial network and increased expression of mfn2. Furthermore, abnormally enlarged mitochondria can per se trigger premature senescence (143). Finally, Mfn2 has been considered to be either pro- or anti-apoptotic depending on the cellular status and environment. During hypoxic conditions, Mfn2 displays anti-apoptotic functions, both in vitro and in vivo (144). On the other hand, some cytokines and growth factors such adiponectin, up regulate mfn2 expression, inhibiting ERK1/2 signaling pathway and leading to an induction of apoptosis (145). Lastly, Mfn2 also interacts with the pro-apoptotic proteins Bax and Bak, but how this interaction modulates apoptosis is still unclear (146).
INTRODUCTION
61
3.5) Known roles of mitochondrial dynamics in immune responses
In this section we will expose what is currently known about the role of mitochondrial dynamics in immune responses. For the time being, it has been confirmed that mitochondrial dynamics play a major role specifically in two types of immune responses: RIG-I-mediated anti-viral responses and inflammasome activation.
3.5.1) Mitochondrial dynamics regulate antiviral immunity
In the last years several studies have demonstrated that mitochondrial dynamics play an important role in the regulation of RLR-mediated antiviral responses (147–151). First, Koshiba’s group (147) showed that the HR1 regions of Mfn2 interact with MAVS, sequestering this protein in a non-productive state, and inhibiting downstream signaling by NF-κB and IRF3 upon RIG-I activation. These effects are specific for Mfn2, as manipulation of its homolog Mfn1 was found to have no effect on RIG-1-mediated signaling. A year later, Castanier et al. (148) reported that RIG-1-mediated signaling can be regulated through manipulation of mitochondrial dynamics. The promotion of mitochondrial elongation by silencing DRP1 or FIS1 increases phosphorylation of IRF3 and IκB upon viral infection. Similarly, the induction of mitochondrial fragmentation by silencing Mfn1 or OPA1 has the opposite effect. These data demonstrate that elongation and fusion of mitochondria specifically enhances MAVS signaling, whereas mitochondrial fragmentation impairs it. Interestingly, in addition to being regulated by mitochondrial dynamics, MAVS can regulate this process. The proposed mechanism is that under basal conditions Mfn1 is sequestered by MAVS interaction, but when RIG-I engages MAVS, Mfn1 is released, allowing the fusion between adjacent mitochondria that will favor antiviral signaling. Furthermore, this mitochondrial elongation triggers ER-mitochondria associations, thus promoting the interaction of MAVS with STING to further enhance antiviral signaling (148). In line with this later study, Onoguchi et al. (149) also demonstrated that Mfn1 plays a critical role in RIG-I-induced antiviral signaling, as overexpression of Mfn1 increased IFN-β promoter activity, whereas its silencing abolished such activity. However, there are some discrepancies with the other two studies mentioned above. First, Onoguchi’s group found that Mfn2 overexpression had no effect in antiviral signaling and thus
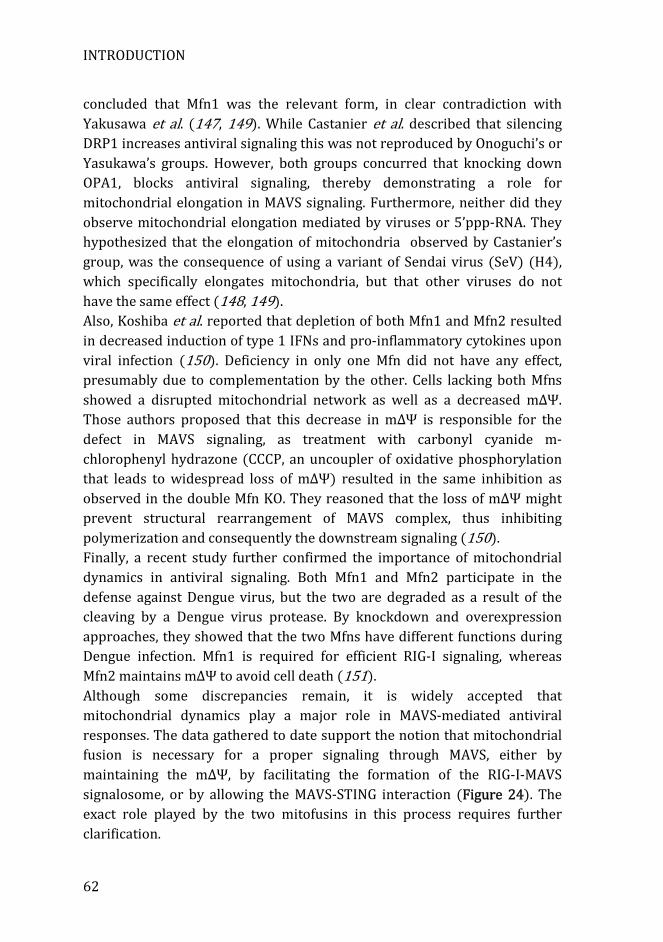
INTRODUCTION
62
concluded that Mfn1 was the relevant form, in clear contradiction with Yakusawa et al. (147, 149). While Castanier et al. described that silencing DRP1 increases antiviral signaling this was not reproduced by Onoguchi’s or Yasukawa’s groups. However, both groups concurred that knocking down OPA1, blocks antiviral signaling, thereby demonstrating a role for mitochondrial elongation in MAVS signaling. Furthermore, neither did they observe mitochondrial elongation mediated by viruses or 5’ppp-RNA. They hypothesized that the elongation of mitochondria observed by Castanier’s group, was the consequence of using a variant of Sendai virus (SeV) (H4), which specifically elongates mitochondria, but that other viruses do not have the same effect (148, 149). Also, Koshiba et al. reported that depletion of both Mfn1 and Mfn2 resulted in decreased induction of type 1 IFNs and pro-inflammatory cytokines upon viral infection (150). Deficiency in only one Mfn did not have any effect, presumably due to complementation by the other. Cells lacking both Mfns showed a disrupted mitochondrial network as well as a decreased mΔΨ. Those authors proposed that this decrease in mΔΨ is responsible for the defect in MAVS signaling, as treatment with carbonyl cyanide m-chlorophenyl hydrazone (CCCP, an uncoupler of oxidative phosphorylation that leads to widespread loss of mΔΨ) resulted in the same inhibition as observed in the double Mfn KO. They reasoned that the loss of mΔΨ might prevent structural rearrangement of MAVS complex, thus inhibiting polymerization and consequently the downstream signaling (150). Finally, a recent study further confirmed the importance of mitochondrial dynamics in antiviral signaling. Both Mfn1 and Mfn2 participate in the defense against Dengue virus, but the two are degraded as a result of the cleaving by a Dengue virus protease. By knockdown and overexpression approaches, they showed that the two Mfns have different functions during Dengue infection. Mfn1 is required for efficient RIG-I signaling, whereas Mfn2 maintains mΔΨ to avoid cell death (151). Although some discrepancies remain, it is widely accepted that mitochondrial dynamics play a major role in MAVS-mediated antiviral responses. The data gathered to date support the notion that mitochondrial fusion is necessary for a proper signaling through MAVS, either by maintaining the mΔΨ, by facilitating the formation of the RIG-I-MAVS signalosome, or by allowing the MAVS-STING interaction (Figure 24). The exact role played by the two mitofusins in this process requires further clarification.
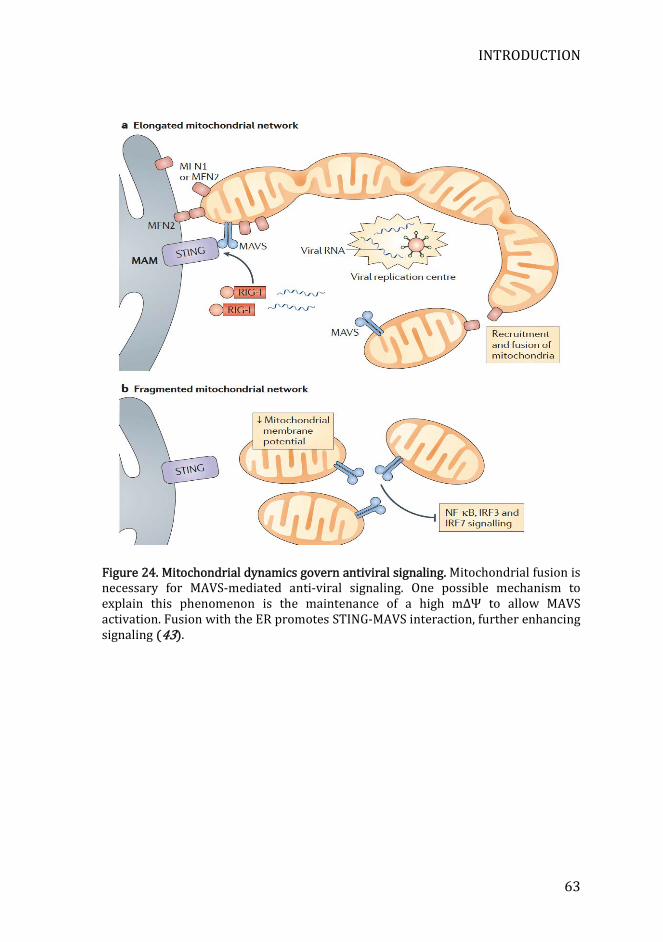
INTRODUCTION
63
Figure 24. Mitochondrial dynamics govern antiviral signaling. Mitochondrial fusion is necessary for MAVS-mediated anti-viral signaling. One possible mechanism to explain this phenomenon is the maintenance of a high mΔΨ to allow MAVS activation. Fusion with the ER promotes STING-MAVS interaction, further enhancing signaling (43).
INTRODUCTION
64
3.5.2) Mitochondrial dynamics in inflammasome activation
In analogy to antiviral signaling, the integrity of the mitochondrial network is crucial for correct inflammasome signaling. Loss of mΔΨ dramatically reduces inflammasome activation and IL-1β production. Moreover, the mitochondrial fusion protein Mfn2 also interacts with both MAVS and NLRP3 in a mΔΨ-dependent manner. This interaction is required for the proper assembly and activation of the inflammasome at the mitochondrial surface (152). The fact that Mfn2 is necessary for inflammasome activation suggests that, as well as with antiviral signaling, mitochondrial elongation is a requisite for inflammasome activation (Figure 25). Recently, Park et al. (153) by using macrophages deficient for the mitochondrial fission protein DRP1 confirmed this hypothesis. These macrophages show increased mitochondrial elongation and enhanced NLPR3 assembly and IL-1β secretion. Furthermore, mitochondrial elongation promotes ERK activation, which is a prerequisite step to recruit NLRP3 to mitochondria, and thus activate the inflammasome.
Figure 25. Mfn2 is necessary for inflammasome activation. Mitochondrial fusion is a prerequisite for a correct assembly and activation of the NLRP3 inflammasome (152).

OBJECTIVES AND HYPOTHESIS

HYPOTHESIS AND OBJECTIVES
67
1) Hypothesis
Mitochondrial fusion regulates mROS, mΔΨ, autophagy, and apoptosis, which are all crucial parameters in the regulation of inflammatory responses in macrophages. As major regulator of mitochondrial fusion, Mfn2 is crucial for the functional activity of macrophages.
2) Objectives
• Characterize mfn2 expression in macrophages.
• Determine the role of Mfn2 in the regulation of mitochondrial physiology and morphology in macrophages.
• Evaluate the regulation of signaling pathways by Mfn2, and their implication in macrophage activity.
• Determine the function of Mfn2 in immune responses using in vivo models.

EXPERIMENTAL PROCEDURES

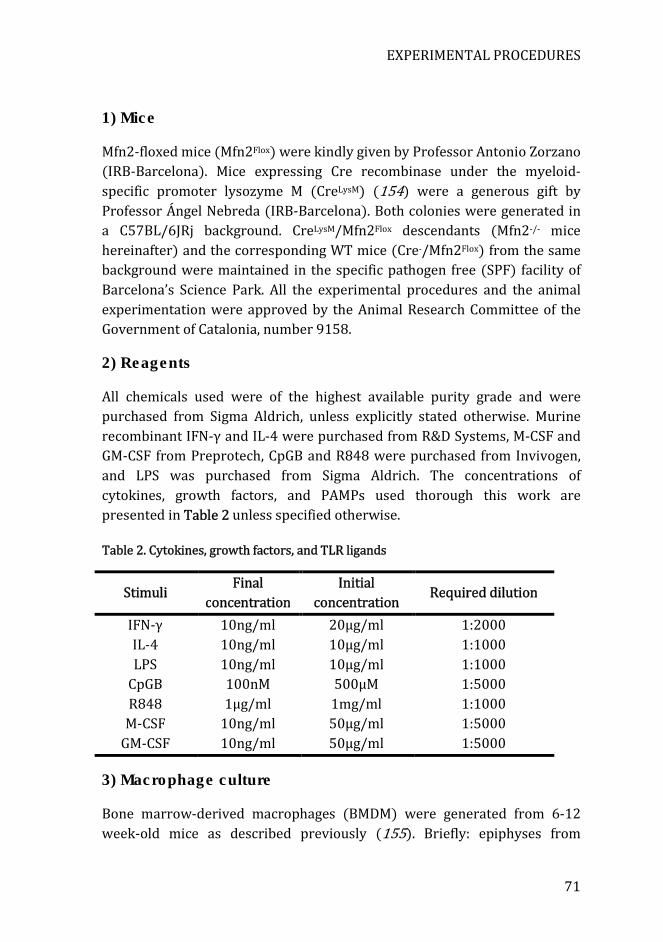
EXPERIMENTAL PROCEDURES
71
1) Mice
Mfn2-floxed mice (Mfn2Flox) were kindly given by Professor Antonio Zorzano (IRB-Barcelona). Mice expressing Cre recombinase under the myeloid-specific promoter lysozyme M (CreLysM) (154) were a generous gift by Professor Ángel Nebreda (IRB-Barcelona). Both colonies were generated in a C57BL/6JRj background. CreLysM/Mfn2Flox descendants (Mfn2-/- mice hereinafter) and the corresponding WT mice (Cre-/Mfn2Flox) from the same background were maintained in the specific pathogen free (SPF) facility of Barcelona’s Science Park. All the experimental procedures and the animal experimentation were approved by the Animal Research Committee of the Government of Catalonia, number 9158.
2) Reagents
All chemicals used were of the highest available purity grade and were purchased from Sigma Aldrich, unless explicitly stated otherwise. Murine recombinant IFN-γ and IL-4 were purchased from R&D Systems, M-CSF and GM-CSF from Preprotech, CpGB and R848 were purchased from Invivogen, and LPS was purchased from Sigma Aldrich. The concentrations of cytokines, growth factors, and PAMPs used thorough this work are presented in Table 2 unless specified otherwise.
Table 2. Cytokines, growth factors, and TLR ligands
Stimuli Final
concentration Initial
concentration Required dilution
IFN-γ 10ng/ml 20μg/ml 1:2000 IL-4 10ng/ml 10μg/ml 1:1000 LPS 10ng/ml 10μg/ml 1:1000
CpGB 100nM 500μM 1:5000 R848 1μg/ml 1mg/ml 1:1000
M-CSF 10ng/ml 50μg/ml 1:5000 GM-CSF 10ng/ml 50μg/ml 1:5000
3) Macrophage culture
Bone marrow-derived macrophages (BMDM) were generated from 6-12 week-old mice as described previously (155). Briefly: epiphyses from
EXPERIMENTAL PROCEDURES
72
femora and tibiae were removed, and these bones were flushed with pre-warmed DMEM to extract the bone marrow. Bone marrow cells were cultured in plastic dishes with DMEM-containing 20% FBS (Gibco, Invitrogen), 30% of L-cell-conditioned media as M-CSF source, penicillin 100U/ml, and streptomycin 100μg/ml. Cells were incubated at 37ºC in a humidified 5% CO2 atmosphere. A homogenous population of adherent macrophages was obtained after seven days of culture (>99% CD11b and F4/80 positive cells). Unless explicitly stated otherwise, BMDM were left 16h in media without M-CSF to synchronize cell cycles prior to stimulation. Murine peritoneal macrophages were obtained from a peritoneal lavage with sterile PBS as described previously (156).
4) Flow cytometry analysis
4.1) General procedure
After staining, samples were acquired in a Gallios Flow Cytometer (Beckman coulter). Unless otherwise specified, the following gating strategy was pursued: first, macrophages (or leukocytes when specified), were selected depending on their forward (FS-A) and side scatter (SS-A). Then, singlets were selected using FS-A and the signal peak height (FS-H) parameters. Finally, dead cells were discriminated by DAPI staining when possible (Figure 26). Data was analyzed with FlowJo 10 (Treestar).
Figure 26. Gating strategy for BMDM flow cytometry analysis. Forward scatter (FS-A) is represented in the x-axis. Side scatter (SS-A), peak height (FS-H), and DAPI are represented in the y-axis.
4.2) Extracellular marker staining
BMDM were collected, resuspended in staining buffer (5%FBS in PBS), and seeded in 96-well plates. FcγRs were blocked using an anti-CD16/CD32
FS-A / SS-A FS-A / FS-H FS-A / DAPI
EXPERIMENTAL PROCEDURES
73
antibody (BD Pharmigen) for 15 minutes at 4ºC. Labeling was performed incubating the cells with the correspondent antibody mix for 30 minutes at 4ºC. An isotype for each antibody was always used as control. Used fluorescent antibodies are presented in Table 3.
Table 3. Fluorescent antibodies used for Flow cytometry analysis
Antigen Company Fluorochrome Dilution
B220 (CD45R) Biolegend AF700 1:500 MCSF-R (CD115) eBioscience PE 1:200
CD11b Biolegend Brilliant Violet 711 1:1000 CD3 Biolegend FITC 1:100
F4/80 eBioscience APC 1:100 CD45 eBioscience PE-Cy7 1:2000
MHC-II I-A/I-E BD Pharmigen FITC 1:200 Ly6C BD Pharmigen FITC 1:50
4.3) Intracellular NF-κB staining
BMDM were collected, resuspended in staining buffer, and transferred to 96-well plates. Cells were fixed in 4% paraformaldehyde for 15min. After that, cells were permeabilized with 0.2% Triton-X10 for 5min. BMDM were then blocked and stained as explained in section 4.2. The antibody used was Phospho-NF-κB subunit p65 (Ser531)-FITC (Cell Signaling) diluted 1:50. In this case, DAPI gating was not used to discriminate dead cells.
4.4) Cell cycle
BMDM were stimulated for 24h and then fixed with 95% ethanol. Then, cells were incubated with propidium iodide (PI) and RNAse A. Cell cycle distributions were analyzed according to the IP staining (G1, S, and G2).
4.5) ROS measurements
Mitochondrial superoxide production (mROS) was measured by incubating BMDM with MitoSox red (Molecular Probes) as described in the manufacturer’s instructions. Hydrogen peroxide (total cellular ROS) was measured by staining cells with 50μM 2’7’-dichlorofluorescin diacetate (DCF-DA) (Sigma Aldrich) as described previously (157). When indicated, 5μM antimycin A or 10mM n-acetyl cysteine (NAC) were used as modulators of ROS production.
EXPERIMENTAL PROCEDURES
74
4.6) Mitochondrial membrane potential
Mitochondrial membrane potential was assessed with TMRE-Mitochondrial potential assay kit (Abcam) following the manufacturer’s instructions.
4.7) Mitochondrial mass
To stain mitochondria and quantify mitochondrial mass, BMDM were stained with Mitotracker green (Invitrogen) following the manufacturer’s instructions. Mean fluorescence intensity (MFI) was used to measure mitochondrial mass.
4.8) Apoptotic bodies phagocytosis
Apoptotic bodies were obtained by incubating mice thymocytes with 30μM etoposide for 16h. After that, apoptotic cells were stained with CFSE, and added to a BMDM culture in a 10:1 proportion. After 1h of incubation, non-phagocyted apoptotic cells were washed out, and macrophages were analyzed by flow cytometry. Incubation with 2μg/ml cytochalascin D (Sigma Aldrich) prior phagocytosis was used as negative control.
4.9) Apoptosis
Apoptotis was determined by incubating BMDM with Annexin V-FITC Apoptosis Detection Kit (Abcam) as specified by the manufacturer. Live (double negative), necrotic (DAPI positive), early (Annexin-V positive), and late apoptotic (double positive) cell populations are detected by flow cytometry.
5) ATP production
BMDM were washed in cold PBS and then lysed by thermal shock in 100mM Tris-HCl + 4mM EDTA (pH 7.75) buffer. ATP from lysates was measured using ATP-determination kit (Life technologies) according to the manufacturer’s protocol. The results were expressed relative to the protein quantity, calculated by the Bradford assay.
6) Mitochondrial respiration and glycolytic metabolism
An XF24 analyzer (Seahorse Biosciences) was used to measure BMDM mitochondrial function in real time. Macrophages were seeded into XF24 cell culture plates at a density of 2x10⁵cells/well and left 16h in media without M-CSF in a 37ºC-humidified incubator with 5%CO2. Media was replaced by
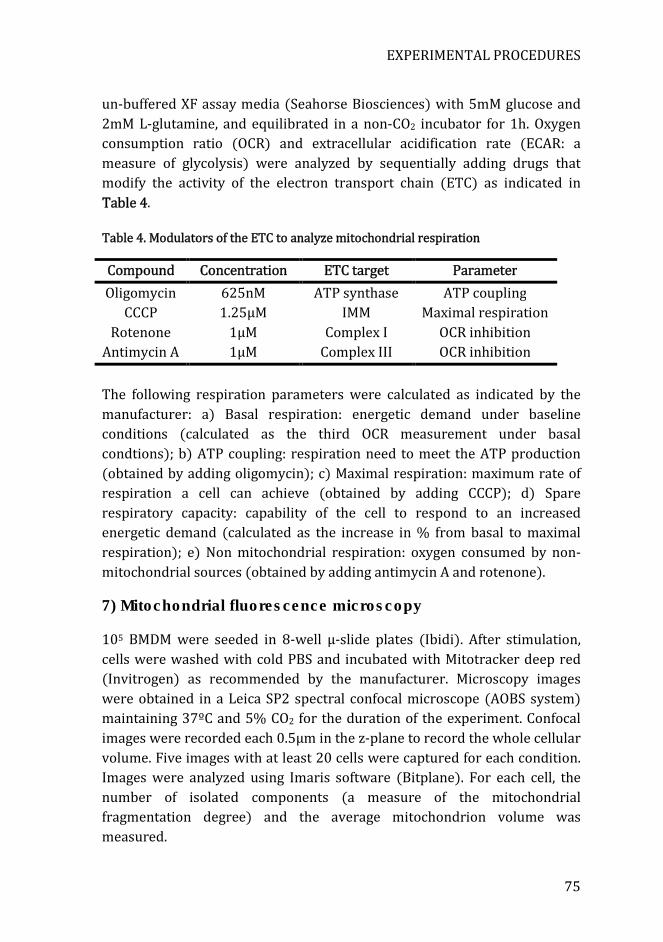
EXPERIMENTAL PROCEDURES
75
un-buffered XF assay media (Seahorse Biosciences) with 5mM glucose and 2mM L-glutamine, and equilibrated in a non-CO2 incubator for 1h. Oxygen consumption ratio (OCR) and extracellular acidification rate (ECAR: a measure of glycolysis) were analyzed by sequentially adding drugs that modify the activity of the electron transport chain (ETC) as indicated in Table 4.
Table 4. Modulators of the ETC to analyze mitochondrial respiration
Compound Concentration ETC target Parameter
Oligomycin 625nM ATP synthase ATP coupling CCCP 1.25μM IMM Maximal respiration
Rotenone 1μM Complex I OCR inhibition OCR inhibition Antimycin A 1μM Complex III
The following respiration parameters were calculated as indicated by the manufacturer: a) Basal respiration: energetic demand under baseline conditions (calculated as the third OCR measurement under basal condtions); b) ATP coupling: respiration need to meet the ATP production (obtained by adding oligomycin); c) Maximal respiration: maximum rate of respiration a cell can achieve (obtained by adding CCCP); d) Spare respiratory capacity: capability of the cell to respond to an increased energetic demand (calculated as the increase in % from basal to maximal respiration); e) Non mitochondrial respiration: oxygen consumed by non-mitochondrial sources (obtained by adding antimycin A and rotenone).
7) Mitochondrial fluorescence microscopy
105 BMDM were seeded in 8-well μ-slide plates (Ibidi). After stimulation, cells were washed with cold PBS and incubated with Mitotracker deep red (Invitrogen) as recommended by the manufacturer. Microscopy images were obtained in a Leica SP2 spectral confocal microscope (AOBS system) maintaining 37ºC and 5% CO2 for the duration of the experiment. Confocal images were recorded each 0.5μm in the z-plane to record the whole cellular volume. Five images with at least 20 cells were captured for each condition. Images were analyzed using Imaris software (Bitplane). For each cell, the number of isolated components (a measure of the mitochondrial fragmentation degree) and the average mitochondrion volume was measured.
EXPERIMENTAL PROCEDURES
76
8) Arginase activity assay
Arginase activity was measured as described previously (158). Briefly, BMDM were cultured in 96-well plates and stimulated with IL-4 for 24h. After washing, cells were lysed in 0.1%Triton. Arginase activity was measured in the lysates by adding L-arginine and MnCl2, and finally, after reacting with α-ISPP, the optical density at 540nm was read.
9) RNA extraction, reverse-PCR, and qPCR
Total RNA was extracted, purified, and treated with DNAse by using the ReliaPrep RNA system Kit (Promega) as recommended by the manufacturer. 400ng of RNA were retrotranscribed to cDNA using Moloney murine leukemia virus (MMLV) reverse transcriptase RNAse H Minus (Promega) following the manufacturer’s specifications. Quantitative PCR (qPCR or real-time PCR) was performed using SYBR Green Master Mix (Applied Biosystems) as recommended by the manufacturer. Non-retrotranscribed RNA samples were used as negative controls for each gene. If signal was detected in these negative controls (< 32 Ct), the primer pairs used were discarded and replaced with alternative ones for the same gene. Furthermore, the amplification efficiency for each pair of primers was calculated by making a standard curve of serially diluted cDNA samples. Only the pairs of primers with an amplification efficiency of 100±10% were used. Data was analyzed by the ΔΔCt method (159) using Biogazelle Qbase+ software (Biogazelle). Gene expression was normalized to three reference genes (i.e. housekeeping genes): Hprt1, L14, and Sdha (unless otherwise specified). The stability of these reference genes was determined every time by checking that their geNorm M value was lower than 0.5 (160). The primer sequences used are presented in Table 5.
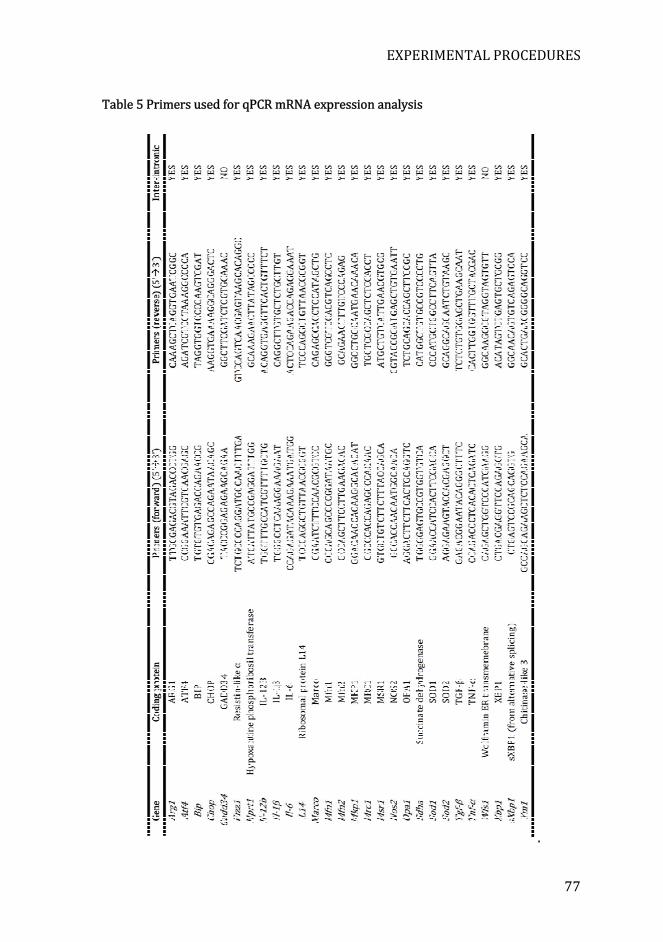
EXPERIMENTAL PROCEDURES
77
.
Table 5 Primers used for qPCR mRNA expression analysis
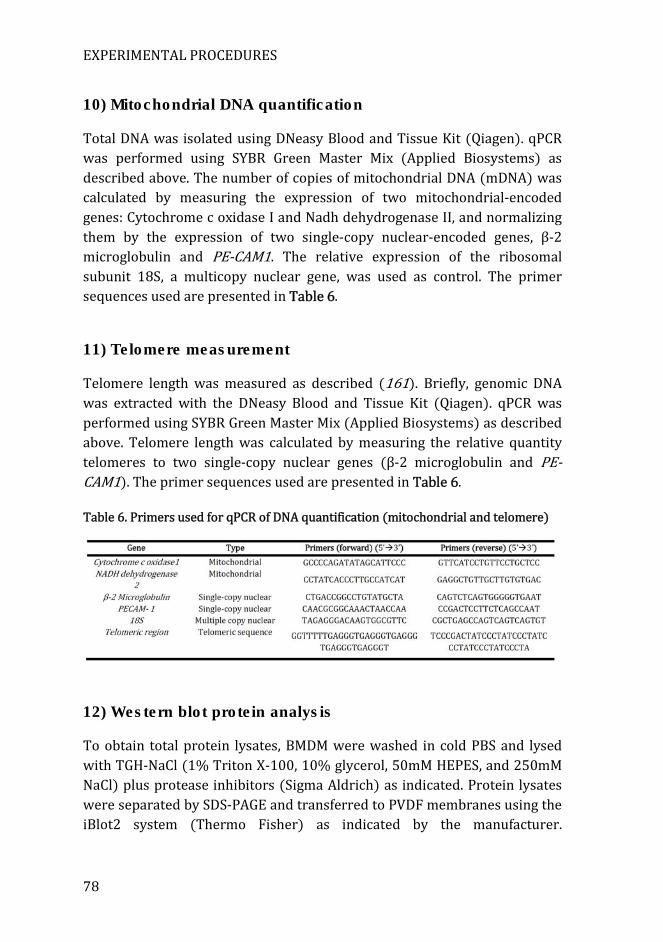
EXPERIMENTAL PROCEDURES
78
10) Mitochondrial DNA quantification
Total DNA was isolated using DNeasy Blood and Tissue Kit (Qiagen). qPCR was performed using SYBR Green Master Mix (Applied Biosystems) as described above. The number of copies of mitochondrial DNA (mDNA) was calculated by measuring the expression of two mitochondrial-encoded genes: Cytochrome c oxidase I and Nadh dehydrogenase II, and normalizing them by the expression of two single-copy nuclear-encoded genes, β-2 microglobulin and PE-CAM1. The relative expression of the ribosomal subunit 18S, a multicopy nuclear gene, was used as control. The primer sequences used are presented in Table 6.
11) Telomere measurement
Telomere length was measured as described (161). Briefly, genomic DNA was extracted with the DNeasy Blood and Tissue Kit (Qiagen). qPCR was performed using SYBR Green Master Mix (Applied Biosystems) as described above. Telomere length was calculated by measuring the relative quantity telomeres to two single-copy nuclear genes (β-2 microglobulin and PE-CAM1). The primer sequences used are presented in Table 6.
Table 6. Primers used for qPCR of DNA quantification (mitochondrial and telomere)
12) Western blot protein analysis
To obtain total protein lysates, BMDM were washed in cold PBS and lysed with TGH-NaCl (1% Triton X-100, 10% glycerol, 50mM HEPES, and 250mM NaCl) plus protease inhibitors (Sigma Aldrich) as indicated. Protein lysates were separated by SDS-PAGE and transferred to PVDF membranes using the iBlot2 system (Thermo Fisher) as indicated by the manufacturer.
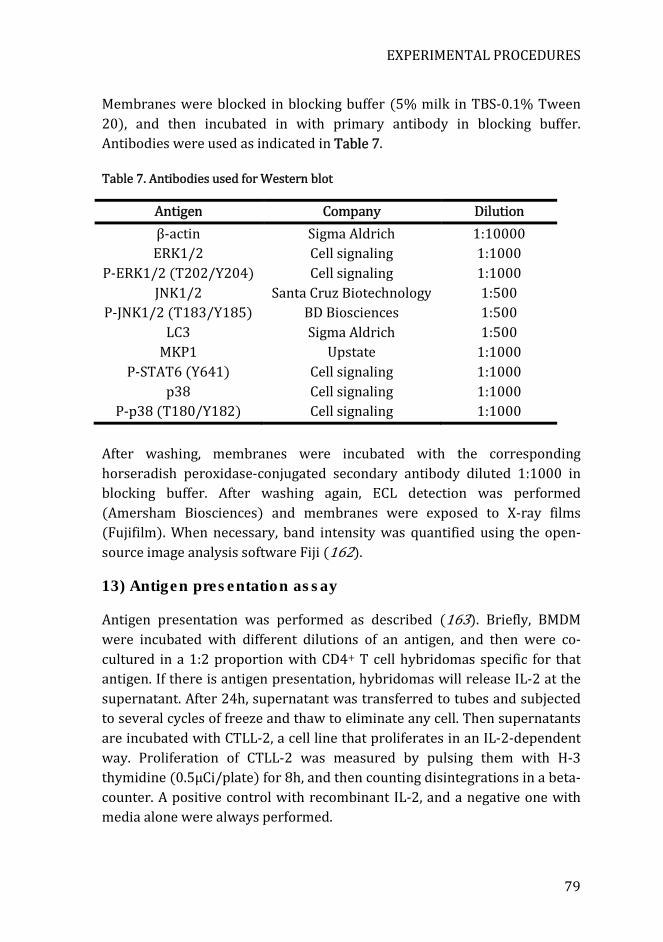
EXPERIMENTAL PROCEDURES
79
Membranes were blocked in blocking buffer (5% milk in TBS-0.1% Tween 20), and then incubated in with primary antibody in blocking buffer. Antibodies were used as indicated in Table 7.
Table 7. Antibodies used for Western blot
Antigen Company Dilution
β-actin Sigma Aldrich 1:10000 ERK1/2 Cell signaling 1:1000
P-ERK1/2 (T202/Y204) Cell signaling 1:1000 JNK1/2 Santa Cruz Biotechnology 1:500
P-JNK1/2 (T183/Y185) BD Biosciences 1:500 LC3 Sigma Aldrich 1:500
MKP1 Upstate 1:1000 P-STAT6 (Y641) Cell signaling 1:1000
p38 Cell signaling 1:1000 P-p38 (T180/Y182) Cell signaling 1:1000
After washing, membranes were incubated with the corresponding horseradish peroxidase-conjugated secondary antibody diluted 1:1000 in blocking buffer. After washing again, ECL detection was performed (Amersham Biosciences) and membranes were exposed to X-ray films (Fujifilm). When necessary, band intensity was quantified using the open-source image analysis software Fiji (162).
13) Antigen presentation assay
Antigen presentation was performed as described (163). Briefly, BMDM were incubated with different dilutions of an antigen, and then were co-cultured in a 1:2 proportion with CD4+ T cell hybridomas specific for that antigen. If there is antigen presentation, hybridomas will release IL-2 at the supernatant. After 24h, supernatant was transferred to tubes and subjected to several cycles of freeze and thaw to eliminate any cell. Then supernatants are incubated with CTLL-2, a cell line that proliferates in an IL-2-dependent way. Proliferation of CTLL-2 was measured by pulsing them with H-3 thymidine (0.5μCi/plate) for 8h, and then counting disintegrations in a beta-counter. A positive control with recombinant IL-2, and a negative one with media alone were always performed.
EXPERIMENTAL PROCEDURES
80
14) ELISA and “ELISA-like” assays
14.1) TNF-α
BMDM were plated in 96-well plates and left untreated or stimulated with 10ng/ml LPS for the indicated times. Supernatant was collected, and diluted 1/8. Mouse TNF-α ELISA Ready-SET-go! kit (eBioscience) was used as indicated by the manufacturer.
14.2) Nitric oxide measurements
BMDM were plated in 96-well plates and left untreated or stimulated as indicated. Supernatant was collected and nitrites measured by the Griess Reagent Kit (Promega) following the commercial protocol.
14.3) Cell proliferation
BMDM were cultured in 96-well plates with different concentrations of L-cell for the specified time. Cellular proliferation was measured using the Cell Proliferation ELISA BrdU kit (Roche) as specified by the manufacturer.
15) In vitro assays with bacteria
15.1) Aeromonas hydrophila phagocytosis assay
Aeromonas hydrophila (serovar O:34) with a pWIL plasmid-containing eGFP were kindly given by Professor Susana Merino (University of Barcelona). BMDM cultured without antibiotics were infected at multiple of infection (MOI) 25 for different periods of time. After that, phagocytosis was stopped by washing cells five times with 5mM EDTA in PBS. eGFP fluorescence inside macrophages was quantified by flow cytometry.
15.2) Bactericidal activity
BMDM were infected with MOI 25 of Aeromonas hydrophila (serovar O:34) and phagocytosis assay was performed for 60min as above. After that, cells were washed and incubated with 300μg/ml of gentamycin for 1h to eliminate non-phagocyted bacteria. Media was then replaced with gentamycin 100μg/ml, and macrophages were left incubating for the specified time to allow elimination of phagocyted bacteria. At each time point, media were washed of antibiotic, and macrophages were lysed with 0.02%TritonX-100. Lysates were serially diluted, cultured in LB plates, and left growing for 24 to 48h. Colony forming units (CFU) were then counted.
EXPERIMENTAL PROCEDURES
81
15.3) Staphylococcus aureus and Escherichia coli phagocytosis assay
pHrodo red S. aureus BioParticles (Molecular probes) and pHrodo green E. coli BioParticles (Molecular probes) were used to measure phagocytosis as specified in the manufacturer’s protocol.
15.4) Listeria monocytogenes infection to check RNA expression
BMDM cultured in antibiotic-free media were infected at MOI 5 with exponentially growing Listeria monocytogenes (strain10403S). After 30min of incubation, media is exchanged for new one with 5μg/ml gentamycin to eliminate non-phagocyted bacteria. RNA was extracted 6h later as explained in section 9.
16) Animal models
16.1) Dinitrofenolbenzene contact-induced inflammation
2,4-dinitrofenolbenzene (DNFB) was diluted 1% in acetone. Female mice were anesthetized with isoflurane, and 10μl of 1%DNFB were homogeneously applied to the whole extension of one ear. Vehicle alone (acetone) was applied to the other mouse’s ear as a control (164). At the specified times, mice were euthanized and a punch of the same radius was made at both treated and control ear. Ear punches were weighted, and then each one was used for both RNA extraction (as explained in Section 9) and histology. For histology, ear punches were fixed in 4% paraformaldehyde for 24h and embedded in paraffin. Ear sections were stained with hematoxylin and eosin. Images were collected with a Nikon E800 microscope, and ear thickness measurements were calculated with Fiji software (162).
16.2) Listeria infection
Listeria monocytogenes (strain10403S) was kindly given by Professor Carlos Ardavín (National Center for Biotechnology/CSIC, Madrid, Spain). 2x10⁴cfu/Kg of exponentially growing listeria were injected intraperitoneally to WT and Mfn2-/- female mice. Survival, weight, and clinical symptoms were monitored twice a day. When all the surviving mice started to recover weight (day 12 post-infection) the experiment was stopped.
EXPERIMENTAL PROCEDURES
82
Additionally, a group of 3 mice of each genotype was separated from the others. These mice were sacrificed at day 2 post-infection, and spleen and liver were mechanically lysed, passed through a nylon strainer, serially diluted, and seeded in brain-heart media plates to quantify CFUs.
16.3) Tuberculosis infection
For this experiment female mice were shipped and kept under controlled conditions in the P3 high-security facility of the “Unitat de Tuberculosis Experimental de l’Hospital Germans Trias i Pujol”. Animals were infected with a low-dose aerosol (100 CFU/mice) of Mycobacterium tuberculosis (strain H37Rv) and survival was monitored for 6 weeks. Additionally, at week 3 post-infection three mice from each group were sacrificed, and lungs and spleen lysates were seeded to count CFUs.
17) Statistical analysis
Data was analyzed using the non-parametric Mann-Whitney U test. When two or more variables were compared, a two-way ANOVA test followed by a Bonferroni correction was used. Survival curves were compared using the Mantel-Cox (log-rank) test. Statistical analyses were performed using GraphPad Prism 6.0 software.

RESULTS

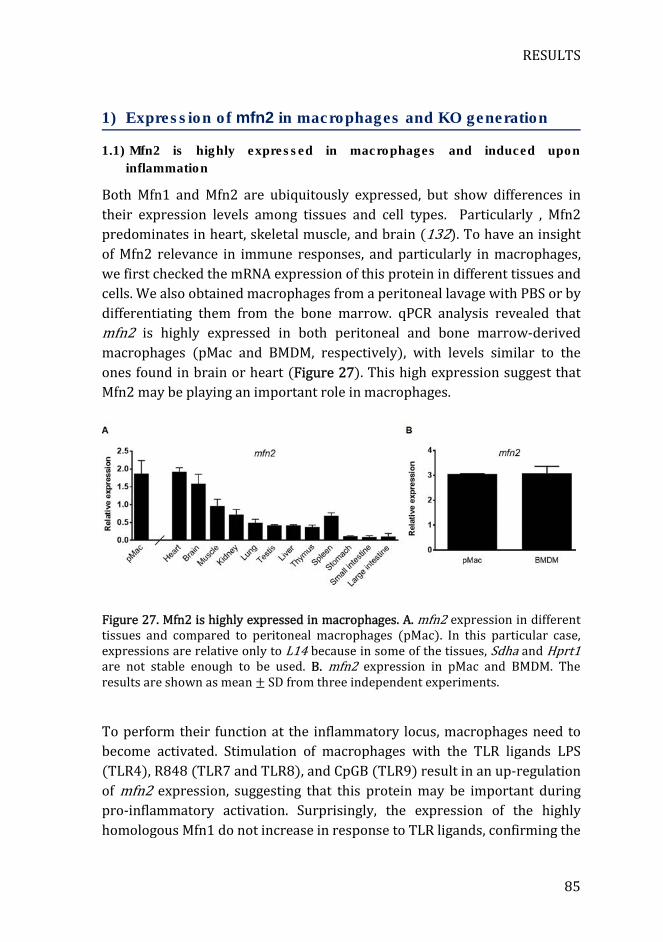
RESULTS
85
1) Expression of mfn2 in macrophages and KO generation
1.1) Mfn2 is highly expressed in macrophages and induced upon
inflammation
Both Mfn1 and Mfn2 are ubiquitously expressed, but show differences in their expression levels among tissues and cell types. Particularly , Mfn2 predominates in heart, skeletal muscle, and brain (132). To have an insight of Mfn2 relevance in immune responses, and particularly in macrophages, we first checked the mRNA expression of this protein in different tissues and cells. We also obtained macrophages from a peritoneal lavage with PBS or by differentiating them from the bone marrow. qPCR analysis revealed that mfn2 is highly expressed in both peritoneal and bone marrow-derived macrophages (pMac and BMDM, respectively), with levels similar to the ones found in brain or heart (Figure 27). This high expression suggest that Mfn2 may be playing an important role in macrophages.
Figure 27. Mfn2 is highly expressed in macrophages. A. mfn2 expression in different tissues and compared to peritoneal macrophages (pMac). In this particular case, expressions are relative only to L14 because in some of the tissues, Sdha and Hprt1 are not stable enough to be used. B. mfn2 expression in pMac and BMDM. The results are shown as mean ± SD from three independent experiments.
To perform their function at the inflammatory locus, macrophages need to become activated. Stimulation of macrophages with the TLR ligands LPS (TLR4), R848 (TLR7 and TLR8), and CpGB (TLR9) result in an up-regulation of mfn2 expression, suggesting that this protein may be important during pro-inflammatory activation. Surprisingly, the expression of the highly homologous Mfn1 do not increase in response to TLR ligands, confirming the
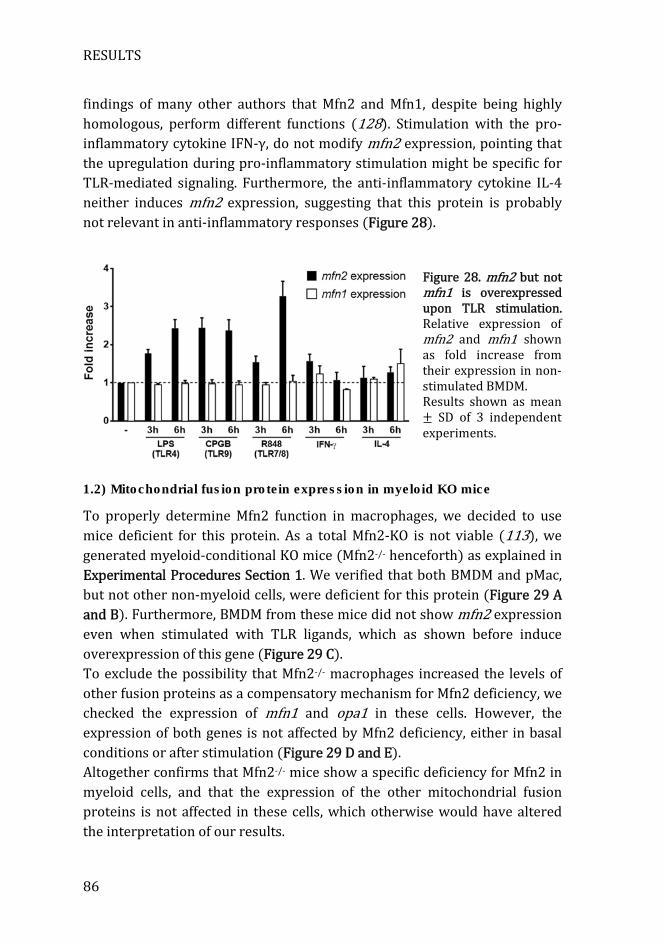
RESULTS
86
findings of many other authors that Mfn2 and Mfn1, despite being highly homologous, perform different functions (128). Stimulation with the pro-inflammatory cytokine IFN-γ, do not modify mfn2 expression, pointing that the upregulation during pro-inflammatory stimulation might be specific for TLR-mediated signaling. Furthermore, the anti-inflammatory cytokine IL-4 neither induces mfn2 expression, suggesting that this protein is probably not relevant in anti-inflammatory responses (Figure 28).
Figure 28. mfn2 but not mfn1 is overexpressed upon TLR stimulation. Relative expression of mfn2 and mfn1 shown as fold increase from their expression in non-stimulated BMDM. Results shown as mean ± SD of 3 independent experiments.
1.2) Mitochondrial fusion protein expression in myeloid KO mice
To properly determine Mfn2 function in macrophages, we decided to use mice deficient for this protein. As a total Mfn2-KO is not viable (113), we generated myeloid-conditional KO mice (Mfn2-/- henceforth) as explained in Experimental Procedures Section 1. We verified that both BMDM and pMac, but not other non-myeloid cells, were deficient for this protein (Figure 29 A and B). Furthermore, BMDM from these mice did not show mfn2 expression even when stimulated with TLR ligands, which as shown before induce overexpression of this gene (Figure 29 C). To exclude the possibility that Mfn2-/- macrophages increased the levels of other fusion proteins as a compensatory mechanism for Mfn2 deficiency, we checked the expression of mfn1 and opa1 in these cells. However, the expression of both genes is not affected by Mfn2 deficiency, either in basal conditions or after stimulation (Figure 29 D and E). Altogether confirms that Mfn2-/- mice show a specific deficiency for Mfn2 in myeloid cells, and that the expression of the other mitochondrial fusion proteins is not affected in these cells, which otherwise would have altered the interpretation of our results.
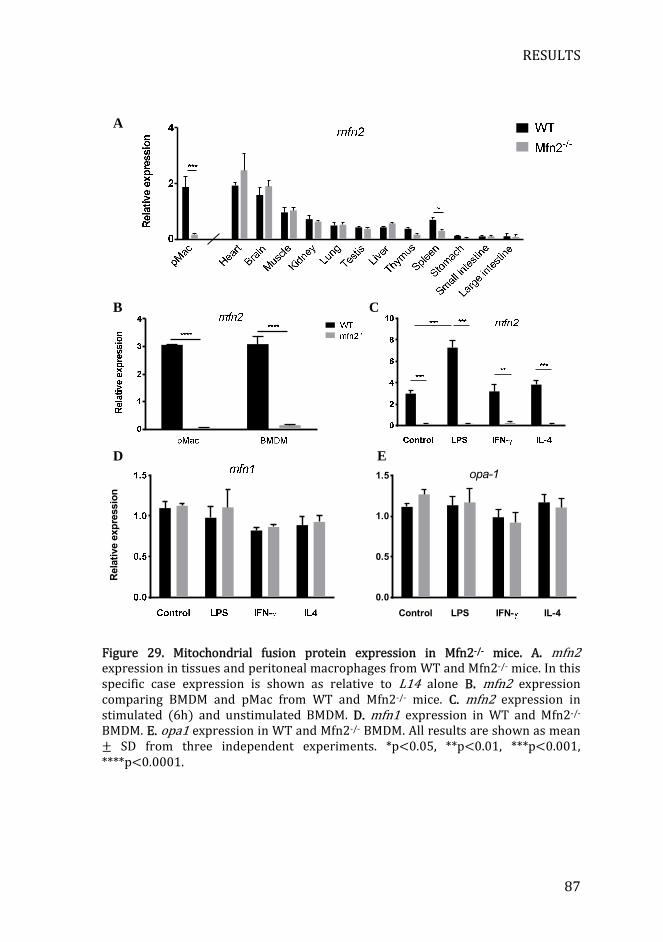
RESULTS
87
Figure 29. Mitochondrial fusion protein expression in Mfn2-/- mice. A. mfn2 expression in tissues and peritoneal macrophages from WT and Mfn2-/- mice. In this specific case expression is shown as relative to L14 alone B. mfn2 expression comparing BMDM and pMac from WT and Mfn2-/- mice. C. mfn2 expression in stimulated (6h) and unstimulated BMDM. D. mfn1 expression in WT and Mfn2-/- BMDM. E. opa1 expression in WT and Mfn2-/- BMDM. All results are shown as mean ± SD from three independent experiments. *p<0.05, **p<0.01, ***p<0.001, ****p<0.0001.
A
B C
opa-1
Control LPS IFN- IL-4
0.0
0.5
1.0
1.5
Rela
tive e
xp
ressio
n
D E
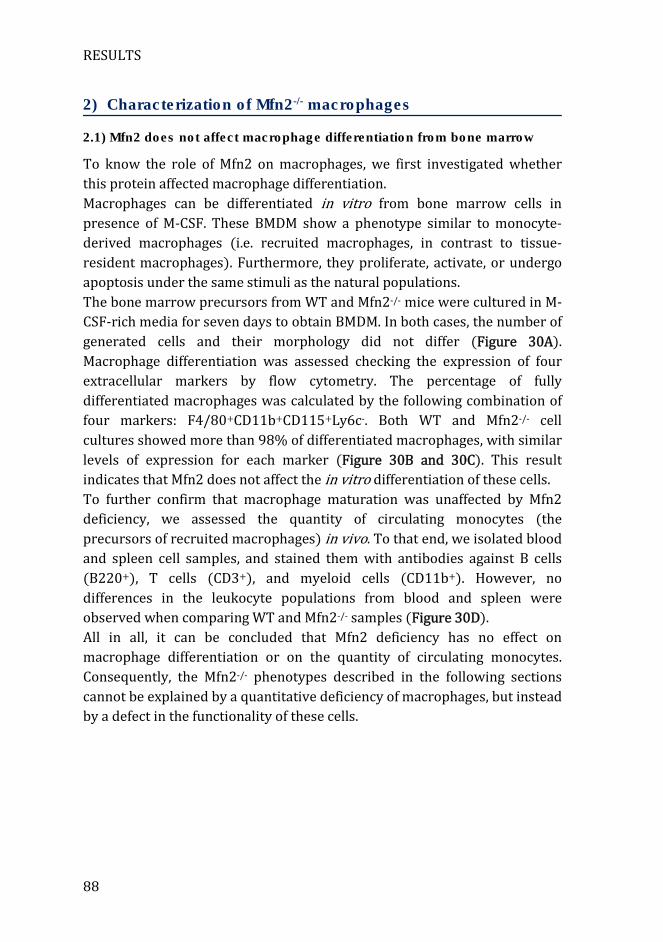
RESULTS
88
2) Characterization of Mfn2-/- macrophages
2.1) Mfn2 does not affect macrophage differentiation from bone marrow
To know the role of Mfn2 on macrophages, we first investigated whether this protein affected macrophage differentiation. Macrophages can be differentiated in vitro from bone marrow cells in presence of M-CSF. These BMDM show a phenotype similar to monocyte-derived macrophages (i.e. recruited macrophages, in contrast to tissue-resident macrophages). Furthermore, they proliferate, activate, or undergo apoptosis under the same stimuli as the natural populations. The bone marrow precursors from WT and Mfn2-/- mice were cultured in M-CSF-rich media for seven days to obtain BMDM. In both cases, the number of generated cells and their morphology did not differ (Figure 30A). Macrophage differentiation was assessed checking the expression of four extracellular markers by flow cytometry. The percentage of fully differentiated macrophages was calculated by the following combination of four markers: F4/80+CD11b+CD115+Ly6c-. Both WT and Mfn2-/- cell cultures showed more than 98% of differentiated macrophages, with similar levels of expression for each marker (Figure 30B and 30C). This result indicates that Mfn2 does not affect the in vitro differentiation of these cells. To further confirm that macrophage maturation was unaffected by Mfn2 deficiency, we assessed the quantity of circulating monocytes (the precursors of recruited macrophages) in vivo. To that end, we isolated blood and spleen cell samples, and stained them with antibodies against B cells (B220+), T cells (CD3+), and myeloid cells (CD11b+). However, no differences in the leukocyte populations from blood and spleen were observed when comparing WT and Mfn2-/- samples (Figure 30D). All in all, it can be concluded that Mfn2 deficiency has no effect on macrophage differentiation or on the quantity of circulating monocytes. Consequently, the Mfn2-/- phenotypes described in the following sections cannot be explained by a quantitative deficiency of macrophages, but instead by a defect in the functionality of these cells.
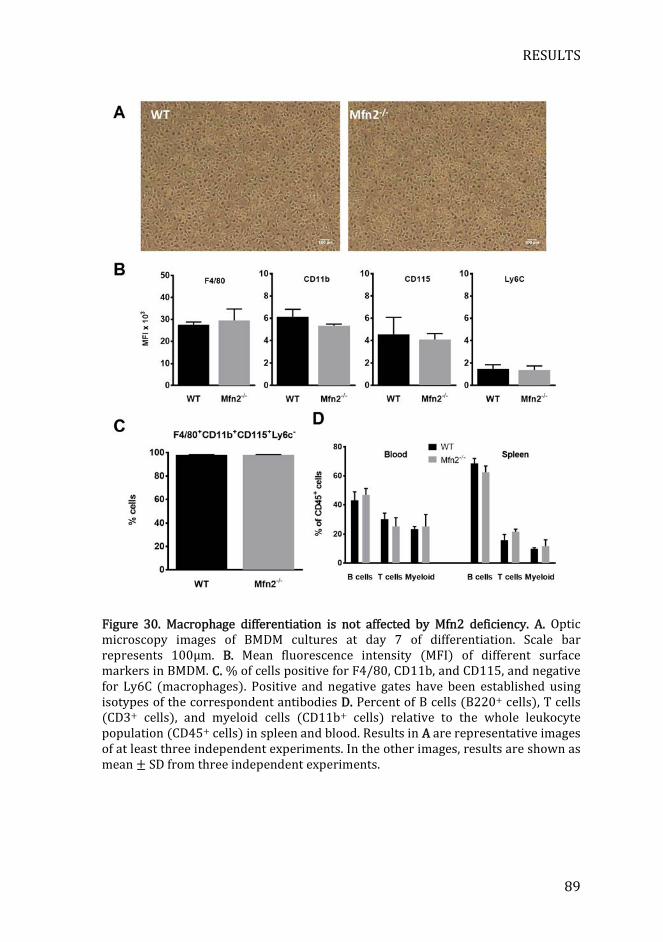
RESULTS
89
Figure 30. Macrophage differentiation is not affected by Mfn2 deficiency. A. Optic microscopy images of BMDM cultures at day 7 of differentiation. Scale bar represents 100μm. B. Mean fluorescence intensity (MFI) of different surface markers in BMDM. C. % of cells positive for F4/80, CD11b, and CD115, and negative for Ly6C (macrophages). Positive and negative gates have been established using isotypes of the correspondent antibodies D. Percent of B cells (B220+ cells), T cells (CD3+ cells), and myeloid cells (CD11b+ cells) relative to the whole leukocyte population (CD45+ cells) in spleen and blood. Results in A are representative images of at least three independent experiments. In the other images, results are shown as mean ± SD from three independent experiments.
RESULTS
90
2.2) Macrophage proliferation and senescence are independent on Mfn2
Because in some cellular models Mfn2 regulates proliferation (137–139) and senescence (143), we checked if the same happens in macrophages. We first measured macrophage telomere length, as telomere shortening is strongly associated with senescence (165, 166). However, both WT and Mfn2-/- macrophages show the same telomere length (Figure 31A), suggesting that in these cells Mfn2 does not affect senescence. We then evaluated whether Mfn2 was affecting proliferation. In macrophages and other leukocytes, proliferation is crucial for their development, as well as to produce fast and effective immune responses. Macrophages proliferate in response to the growth factor M-CSF upon interaction with its receptor (CD115). To know if Mfn2 was modulating this process, we stimulated BMDM with different concentrations of M-CSF for 24h and then measured proliferation by quantifying the incorporation of BrdU. Contrary to what has been described in some other cellular models (140, 141), there are no changes in the proliferation of Mfn2-/- macrophages (Figure 31B). Furthermore, we stained M-CSF-stimulated macrophages with propidium iodide to evaluate the cell cycle distribution by flow cytometry. However, as well as with proliferation, the cell cycle distributions of WT and Mfn2-/- macrophages are indistinguishable from each other (Figure 31C and 31D), confirming that Mfn2 has no effect on proliferation.
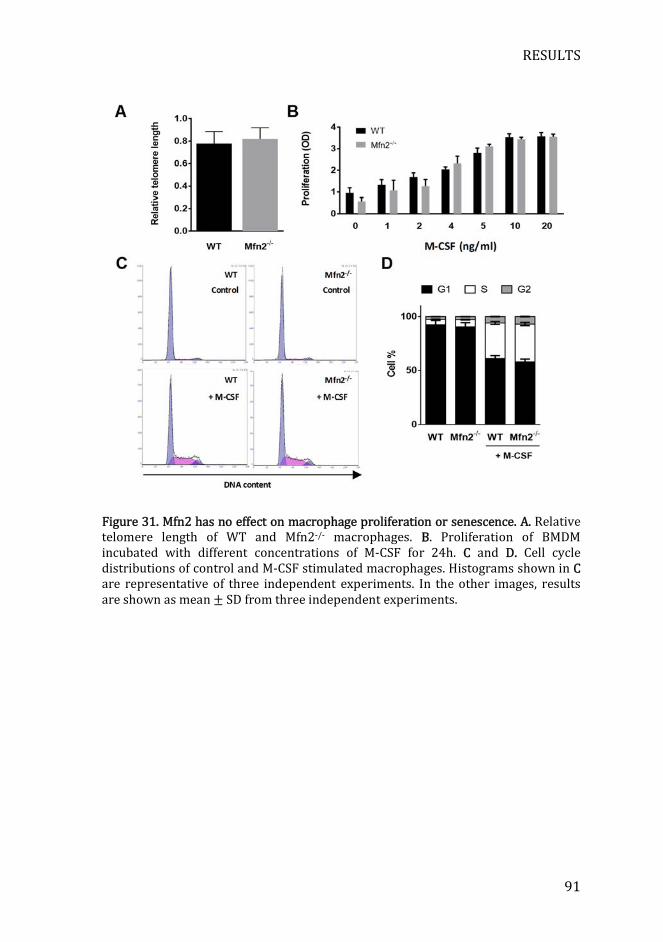
RESULTS
91
Figure 31. Mfn2 has no effect on macrophage proliferation or senescence. A. Relative telomere length of WT and Mfn2-/- macrophages. B. Proliferation of BMDM incubated with different concentrations of M-CSF for 24h. C and D. Cell cycle distributions of control and M-CSF stimulated macrophages. Histograms shown in C are representative of three independent experiments. In the other images, results are shown as mean ± SD from three independent experiments.
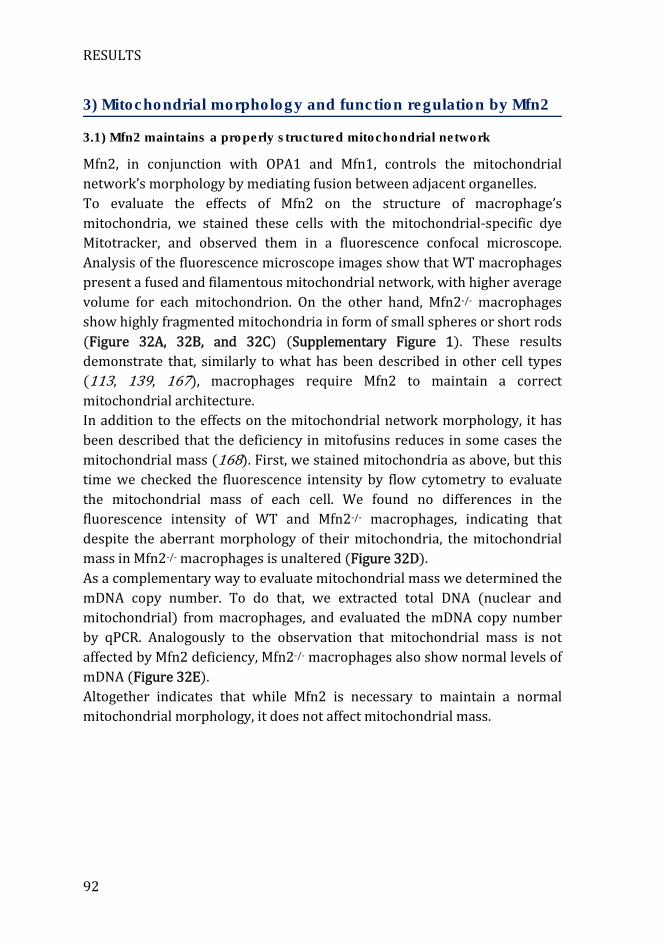
RESULTS
92
3) Mitochondrial morphology and function regulation by Mfn2
3.1) Mfn2 maintains a properly structured mitochondrial network
Mfn2, in conjunction with OPA1 and Mfn1, controls the mitochondrial network’s morphology by mediating fusion between adjacent organelles. To evaluate the effects of Mfn2 on the structure of macrophage’s mitochondria, we stained these cells with the mitochondrial-specific dye Mitotracker, and observed them in a fluorescence confocal microscope. Analysis of the fluorescence microscope images show that WT macrophages present a fused and filamentous mitochondrial network, with higher average volume for each mitochondrion. On the other hand, Mfn2-/- macrophages show highly fragmented mitochondria in form of small spheres or short rods (Figure 32A, 32B, and 32C) (Supplementary Figure 1). These results demonstrate that, similarly to what has been described in other cell types (113, 139, 167), macrophages require Mfn2 to maintain a correct mitochondrial architecture. In addition to the effects on the mitochondrial network morphology, it has been described that the deficiency in mitofusins reduces in some cases the mitochondrial mass (168). First, we stained mitochondria as above, but this time we checked the fluorescence intensity by flow cytometry to evaluate the mitochondrial mass of each cell. We found no differences in the fluorescence intensity of WT and Mfn2-/- macrophages, indicating that despite the aberrant morphology of their mitochondria, the mitochondrial mass in Mfn2-/- macrophages is unaltered (Figure 32D). As a complementary way to evaluate mitochondrial mass we determined the mDNA copy number. To do that, we extracted total DNA (nuclear and mitochondrial) from macrophages, and evaluated the mDNA copy number by qPCR. Analogously to the observation that mitochondrial mass is not affected by Mfn2 deficiency, Mfn2-/- macrophages also show normal levels of mDNA (Figure 32E). Altogether indicates that while Mfn2 is necessary to maintain a normal mitochondrial morphology, it does not affect mitochondrial mass.
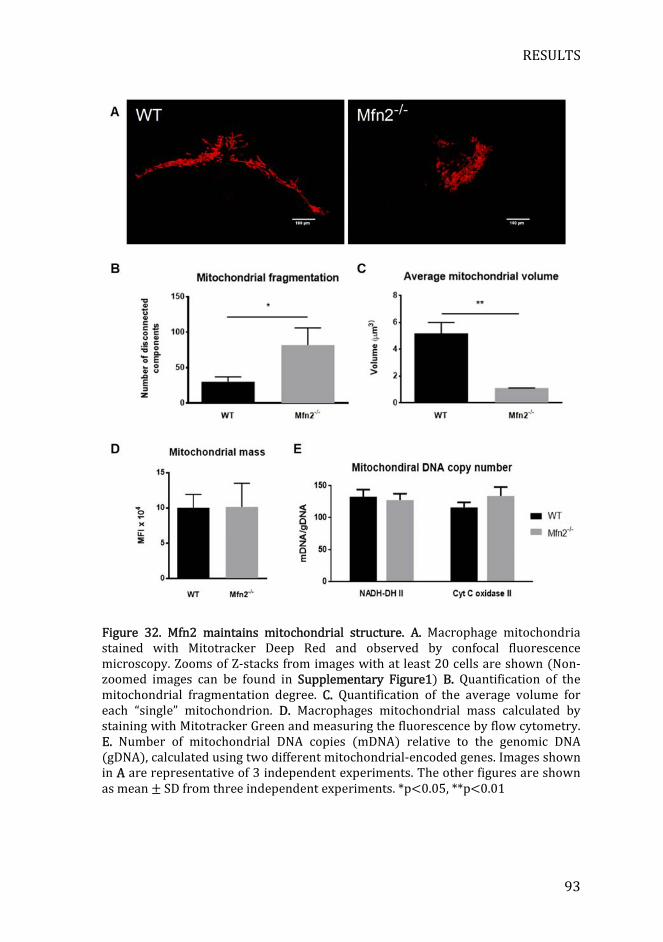
RESULTS
93
Figure 32. Mfn2 maintains mitochondrial structure. A. Macrophage mitochondria stained with Mitotracker Deep Red and observed by confocal fluorescence microscopy. Zooms of Z-stacks from images with at least 20 cells are shown (Non-zoomed images can be found in Supplementary Figure1) B. Quantification of the mitochondrial fragmentation degree. C. Quantification of the average volume for each “single” mitochondrion. D. Macrophages mitochondrial mass calculated by staining with Mitotracker Green and measuring the fluorescence by flow cytometry. E. Number of mitochondrial DNA copies (mDNA) relative to the genomic DNA (gDNA), calculated using two different mitochondrial-encoded genes. Images shown in A are representative of 3 independent experiments. The other figures are shown as mean ± SD from three independent experiments. *p<0.05, **p<0.01
RESULTS
94
3.2) Mfn2 controls mitochondrial membrane potential and respiration
Then, we investigated how Mfn2 affected mitochondrial function. We evaluated how this protein modulates mitochondrial membrane potential (mΔΨ) and respiration, two interlinked processes that are crucial for the production of ATP and mROS. Mitochondria produce energy by establishing an electrochemical proton motive force across their inner membrane that drives oxidative phosphorylation (OXPHOS). The force driving protons into the mitochondria is the combination of both the mΔΨ (electrical gradient) and the mitochondrial pH gradient (chemical gradient). To evaluate mΔΨ we used the fluorescent probe tetramethylrhodamine ethyl ester (TMRE). This fluorescent lipophilic cationic dye accumulates in active mitochondria due to their relative negative charge. More polarized mitochondria (and so, more negatively charged) will accumulate TMRE, whereas depolarized mitochondria will accumulate less (169). Flow cytometry analysis show that Mfn2-/- macrophages present decreased mΔΨ when compared to WT cells. Additionally, we induced mitochondrial membrane potential depolarization with the uncoupler CCCP as negative control. mΔΨ decreases after CCCP stimulation in both WT and Mfn2-/- macrophages (Figure 33).
Figure 33. Mfn2-/- macrophages lose their mΔΨ. Flow cytometry analysis of the mΔΨ measured by TMRE staining. Histograms are representative of three independent experiments. Bars graphs are shown as mean ± SD from three independent experiments. ***p<0.001.
RESULTS
95
Next, we performed a complete profiling of the mitochondrial respiration by measuring in real time the oxygen consumption ratio (OCR) of macrophages (Figure 34A). The first four measurements were performed without stimulation to check the basal respiration. This parameter shows the oxygen consumption required to meet cellular energetic demand under baseline conditions. In this case, Mfn2-/- macrophages show slightly decreased, but not significant, basal mitochondrial respiration compared to their WT counterparts (Figure 34B). During the following four measurements, we stimulated these macrophages with oligomycin A, which blocks the F0 subunit of the ATP synthase, to calculate the proportion of basal respiration that is being used to produce ATP. The OCR from WT and Mfn2-/- macrophages was indistinguishable under these conditions, showing that the respiration to meet the production of ATP is not affected by Mfn2 deficiency (Figure 34C). Alternatively, we determined quantity of ATP in these macrophages using a luciferase-based method. No differences in the production of ATP were observed between WT and Mfn2-/-, confirming the results obtained in the OCR analysis that Mfn2 is not necessary for the ATP production (Figure 34D). The maximal respiratory capacity of a cell can be achieved by dissipation of the mitochondrial proton gradient with an uncoupler such as CCCP. Maximal mitochondrial respiration is severely diminished in Mfn2-/- macrophages when compared to their WT counterparts (Figure 34E). The maximal mitochondrial respiratory capacity also this allows the calculation of the spare respiratory capacity. This parameter is the increase in percentage from basal to maximal respiration, which indicates the ability of a cell to respond to an increased energetic demand such as during stress conditions (47). The spare respiratory capacity of Mfn2-/- macrophages is also decreased compared to WT (Figure 34F) because they fail to significantly increase their respiration from basal conditions. This result indicates that Mfn2-/- macrophages are respiring to their maximum capacity at basal conditions, and that when facing a metabolic challenge, they are unable to further increase their respiration. To sum up, our findings demonstrate that in macrophages Mfn2 is necessary to maintain a normal mΔΨ as well as to allow a high enough maximal respiratory capacity to face challenges that require increased OCR.
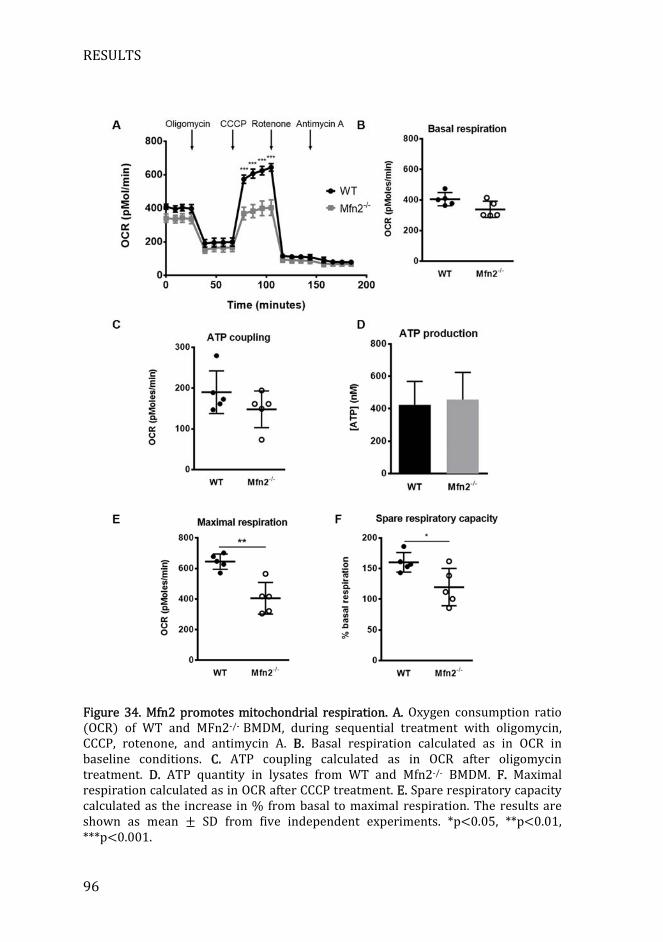
RESULTS
96
Figure 34. Mfn2 promotes mitochondrial respiration. A. Oxygen consumption ratio (OCR) of WT and MFn2-/- BMDM, during sequential treatment with oligomycin, CCCP, rotenone, and antimycin A. B. Basal respiration calculated as in OCR in baseline conditions. C. ATP coupling calculated as in OCR after oligomycin treatment. D. ATP quantity in lysates from WT and Mfn2-/- BMDM. F. Maximal respiration calculated as in OCR after CCCP treatment. E. Spare respiratory capacity calculated as the increase in % from basal to maximal respiration. The results are shown as mean ± SD from five independent experiments. *p<0.05, **p<0.01, ***p<0.001.
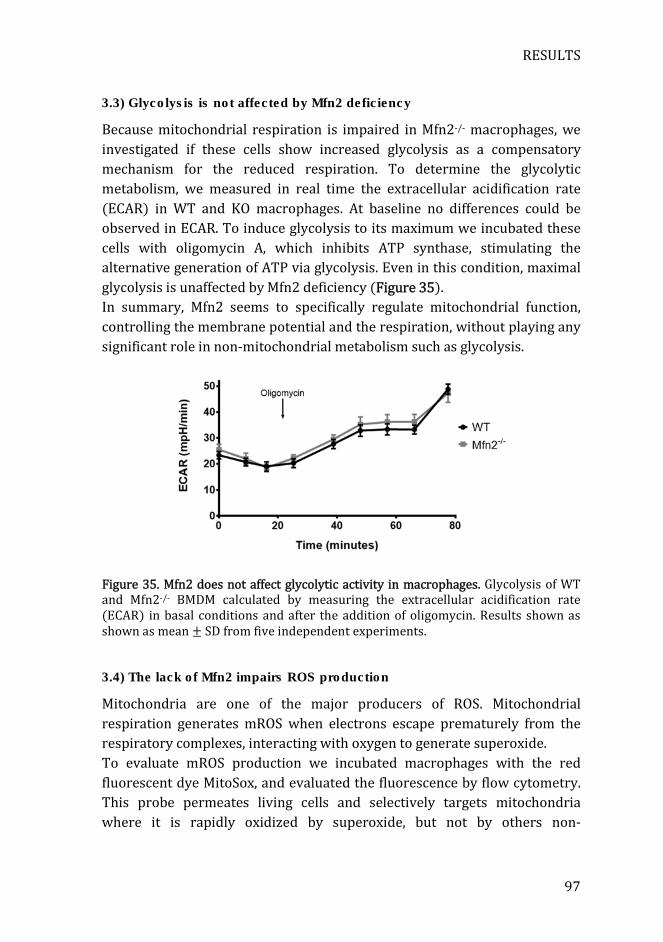
RESULTS
97
3.3) Glycolysis is not affected by Mfn2 deficiency
Because mitochondrial respiration is impaired in Mfn2-/- macrophages, we investigated if these cells show increased glycolysis as a compensatory mechanism for the reduced respiration. To determine the glycolytic metabolism, we measured in real time the extracellular acidification rate (ECAR) in WT and KO macrophages. At baseline no differences could be observed in ECAR. To induce glycolysis to its maximum we incubated these cells with oligomycin A, which inhibits ATP synthase, stimulating the alternative generation of ATP via glycolysis. Even in this condition, maximal glycolysis is unaffected by Mfn2 deficiency (Figure 35). In summary, Mfn2 seems to specifically regulate mitochondrial function, controlling the membrane potential and the respiration, without playing any significant role in non-mitochondrial metabolism such as glycolysis.
Figure 35. Mfn2 does not affect glycolytic activity in macrophages. Glycolysis of WT and Mfn2-/- BMDM calculated by measuring the extracellular acidification rate (ECAR) in basal conditions and after the addition of oligomycin. Results shown as shown as mean ± SD from five independent experiments.
3.4) The lack of Mfn2 impairs ROS production
Mitochondria are one of the major producers of ROS. Mitochondrial respiration generates mROS when electrons escape prematurely from the respiratory complexes, interacting with oxygen to generate superoxide. To evaluate mROS production we incubated macrophages with the red fluorescent dye MitoSox, and evaluated the fluorescence by flow cytometry. This probe permeates living cells and selectively targets mitochondria where it is rapidly oxidized by superoxide, but not by others non-
RESULTS
98
mitochondrial ROS. Consistent with the decreased mitochondrial respiration in the absence of Mfn2, the production of mROS is decreased in non-stimulated Mfn2-/- macrophages (Figure 36A). Additionally, upon LPS stimulation WT macrophages increase mROS production, confirming the results obtained by West and colleagues (85). Meanwhile, LPS-stimulated Mfn2-/- macrophages fail to increase mROS production, showing significantly lower levels than even unstimulated WT macrophages. Furthermore, stimulation of Mfn2-/- macrophages with antimycin A, which strongly induces mROS by directly interacting with respiratory complex III, produces less mROS than their WT counterparts (Figure 36A). In addition to measure mROS, we also checked the abundance of total cellular ROS by flow cytometry with the fluorescent probe DCF-DA. This probe is not specific for any particular type of ROS (in contrast to MitoSox, which is specific for mROS), responding to every ROS activity within the cell. Thus, it will detect mROS that escapes from mitochondria, but also the ROS produced by other sources such as NADPH oxidases. Consistent with the decreased mROS production, Mfn2-/- macrophages also show decreased cytoplasmic ROS in basal conditions, with an even more accentuated decrease after LPS stimulation relative to WT macrophages (Figure 36B). Furthermore, the expression of the antioxidant enzymes mitochondrial catalase and SOD2 is not affected by Mfn2 deficiency (Figure 36C), demonstrating that the decrease in ROS levels is due to a reduction in production instead of increased degradation. In summary, Mfn2 is required for a correct production of mROS and to show normal levels of cellular ROS, in both basal and LPS activation conditions.

RESULTS
99
Figure 36. Mfn2 enhances ROS production. A. mROS measured by MitoSox staining of WT and Mfn2-/- BMDM. B. Total cellular ROS measured by DCF-DA staining of WT and Mfn2-/- BMDM. C Relative mRNA expression for m-catalase and Sod2 in control and LPS-stimulated BMDM. Graphs are shown as mean ± SD from three independent experiments. Histograms are representative of three independent experiments. *p<0.05, **p<0.01, ***p<0.001. NAC= n-acetyl cysteine, AA=antimycin A.
RESULTS
100
4) Mfn2 is crucial for macrophage pro-inflammatory activation
4.1) The lack of Mfn2 impairs the activation of ERK, p38, and NF-κB
signaling pathways
ROS are crucial components of inflammation. In addition to their role in the degradation of phagocyted bacteria, they also act as second messengers enhancing many signaling pathways, including NF-κB and MAPKs (43). As ROS production is disrupted in Mfn2-/- macrophages, we hypothesized that it could severely impair pro-inflammatory activation in these cells. Therefore, we investigated whether signaling pathways involved in inflammation were affected by Mfn2 deficiency. We first checked the activation of NF-κB measuring p65 subunit’s phosphorylation by flow cytometry. We observed that Mfn2-/- macrophages show a small but significant decrease in p65 phosphorylation after LPS activation (Figure 37A), indicating that the NF-κB pathway is less activated in these cells. We then analyzed the LPS-mediated activation of three MAPKs: JNK1/2; p38, and ERK1/2, measuring their phosphorylation by Western blot. WT and Mfn2-/- macrophages show no difference in JNK1/2 activation after LPS stimulation (Figure 37B and 37C). However, Mfn2-/- macrophages show a much lower activation in both p38 and ERK, with the highest differences compared to WT found at 15 and 30 minutes after LPS stimulation (Figure 37B and 37C). Because one of the mechanisms to enhance MAPKs activation is a downregulation of MKPs, we evaluated the levels of MKP1 in WT and Mfn2-/- macrophages. However, we did not find any differences in the protein or mRNA levels (Figure 38), indicating that Mfn2 does not activate MAPKs through downregulation of their phosphatase. Altogether, these results indicate that Mfn2 is necessary for a correct activation/phosphorylation of p38 and ERK1/2, and to a lesser degree of NF-κB. However, it seems that Mfn2 does not affect JNK1/2 activation in a significant way, suggesting a certain degree of specificity in the activation of target signaling pathways mediated by this protein.
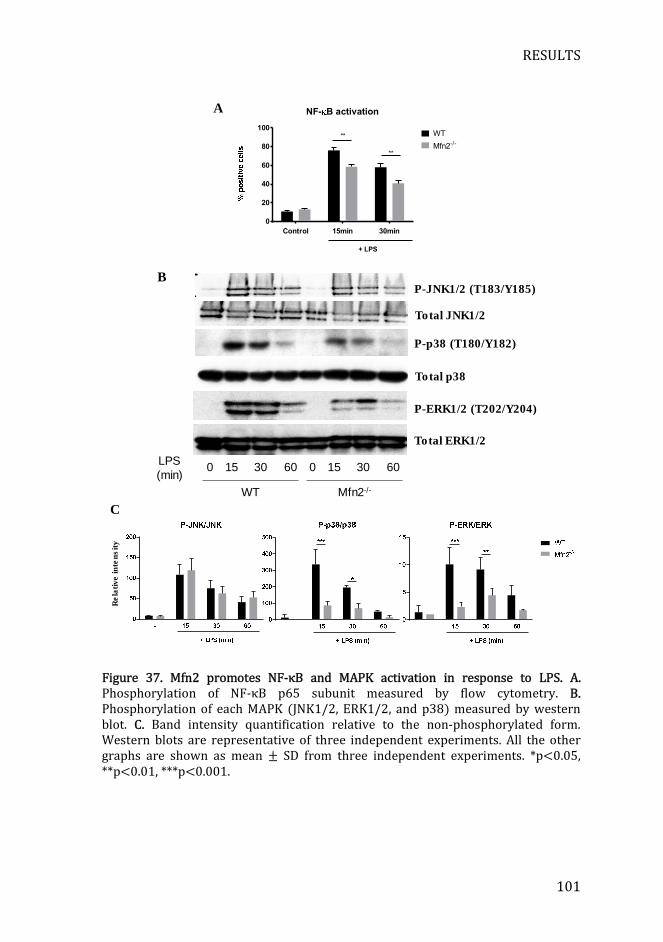
RESULTS
101
Figure 37. Mfn2 promotes NF-κB and MAPK activation in response to LPS. A. Phosphorylation of NF-κB p65 subunit measured by flow cytometry. B. Phosphorylation of each MAPK (JNK1/2, ERK1/2, and p38) measured by western blot. C. Band intensity quantification relative to the non-phosphorylated form. Western blots are representative of three independent experiments. All the other graphs are shown as mean ± SD from three independent experiments. *p<0.05, **p<0.01, ***p<0.001.
NF- B activation
Control 15min 30min
0
20
40
60
80
100WT
Mfn2-/-
+ LPS
**
**
LPS
(min)0 15 30 60 0 15 30 60
WT Mfn2-/-
P-ERK1/2 (T202/Y204)
Total ERK1/2
P-p38 (T180/Y182)
Total p38
P-JNK1/2 (T183/Y185)
Total JNK1/2
Re
lati
ve
in
ten
sit
yA
B
C
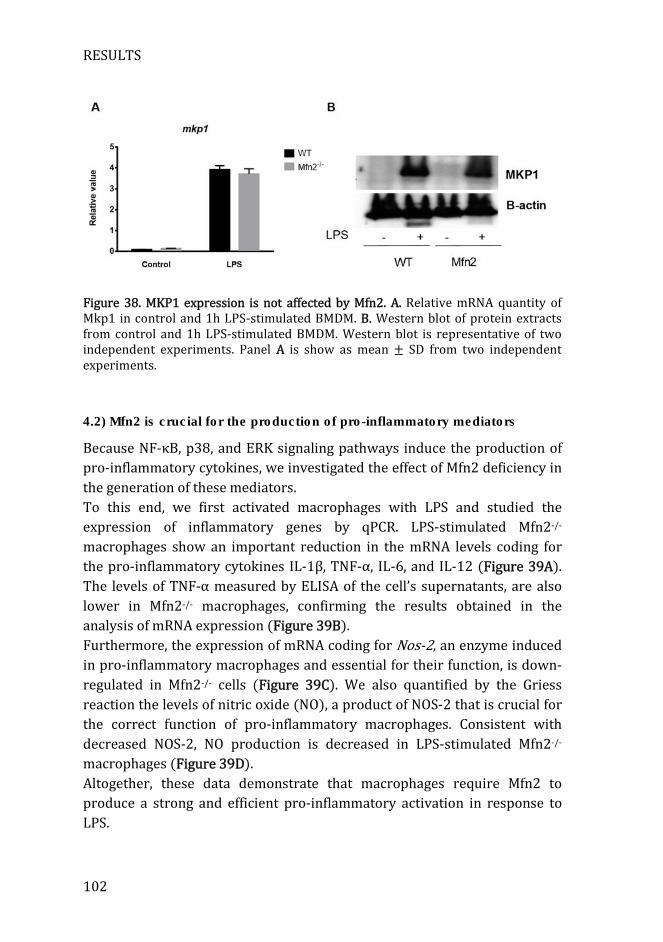
RESULTS
102
Figure 38. MKP1 expression is not affected by Mfn2. A. Relative mRNA quantity of Mkp1 in control and 1h LPS-stimulated BMDM. B. Western blot of protein extracts from control and 1h LPS-stimulated BMDM. Western blot is representative of two independent experiments. Panel A is show as mean ± SD from two independent experiments.
4.2) Mfn2 is crucial for the production of pro-inflammatory mediators
Because NF-κB, p38, and ERK signaling pathways induce the production of pro-inflammatory cytokines, we investigated the effect of Mfn2 deficiency in the generation of these mediators. To this end, we first activated macrophages with LPS and studied the expression of inflammatory genes by qPCR. LPS-stimulated Mfn2-/- macrophages show an important reduction in the mRNA levels coding for the pro-inflammatory cytokines IL-1β, TNF-α, IL-6, and IL-12 (Figure 39A). The levels of TNF-α measured by ELISA of the cell’s supernatants, are also lower in Mfn2-/- macrophages, confirming the results obtained in the analysis of mRNA expression (Figure 39B). Furthermore, the expression of mRNA coding for Nos-2, an enzyme induced in pro-inflammatory macrophages and essential for their function, is down-regulated in Mfn2-/- cells (Figure 39C). We also quantified by the Griess reaction the levels of nitric oxide (NO), a product of NOS-2 that is crucial for the correct function of pro-inflammatory macrophages. Consistent with decreased NOS-2, NO production is decreased in LPS-stimulated Mfn2-/- macrophages (Figure 39D). Altogether, these data demonstrate that macrophages require Mfn2 to produce a strong and efficient pro-inflammatory activation in response to LPS.
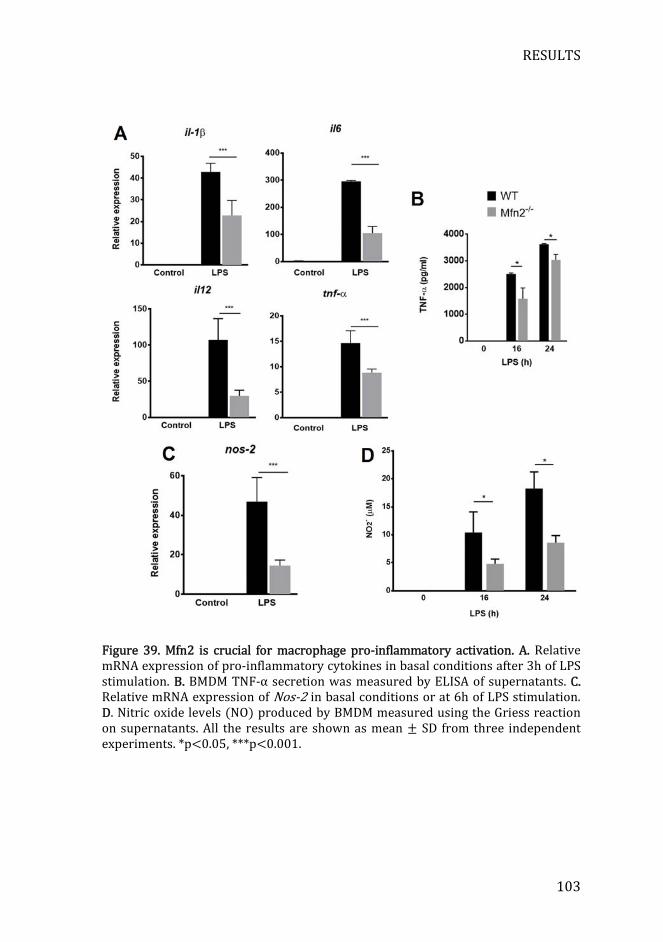
RESULTS
103
Figure 39. Mfn2 is crucial for macrophage pro-inflammatory activation. A. Relative mRNA expression of pro-inflammatory cytokines in basal conditions after 3h of LPS stimulation. B. BMDM TNF-α secretion was measured by ELISA of supernatants. C. Relative mRNA expression of Nos-2 in basal conditions or at 6h of LPS stimulation. D. Nitric oxide levels (NO) produced by BMDM measured using the Griess reaction on supernatants. All the results are shown as mean ± SD from three independent experiments. *p<0.05, ***p<0.001.
RESULTS
104
4.3) Mfn2 mediates pro-inflammatory activation through ROS generation
As exposed in the introduction, the decrease in ROS production in Mfn2-/- macrophages is a likely mechanism to explain their inability to undergo pro-inflammatory responses. To check if ROS is involved in LPS-mediated pro-inflammatory responses in macrophages, we pre-treated these cells for 1h with the antioxidant n-acetyl cysteine (NAC). As demonstrated before, NAC pre-treatment abolish total cellular ROS (Figure 36B) and mROS (Figure 36A) production in both basal and LPS-activated conditions. WT macrophages pre-treated with NAC show a decrease in the LPS-dependent activation of ERK and p38 signaling pathways (Figure 40A and 40B), demonstrating that ROS are necessary for the activation of these two pathways. Furthermore, qPCR analysis revealed pre-treating WT macrophages with NAC for 1h results in decreased expression of pro-inflammatory genes in response to LPS. Notably, pro-inflammatory gene expression in NAC pre-treated WT macrophages is highly similar to the expression in Mfn2-/- macrophages stimulated only with LPS. In the case of Mfn2-/- macrophages, NAC pre-treatment also reduces pro-inflammatory gene expression, though the reduction is much subtler than the one observed in WT macrophages (Figure 40C). These results confirm that ROS is necessary for a correct pro-inflammatory activation in macrophages, and suggest that a reduction of ROS could be the mechanism behind the defect in pro-inflammatory activation observed in Mfn2-/- macrophages.
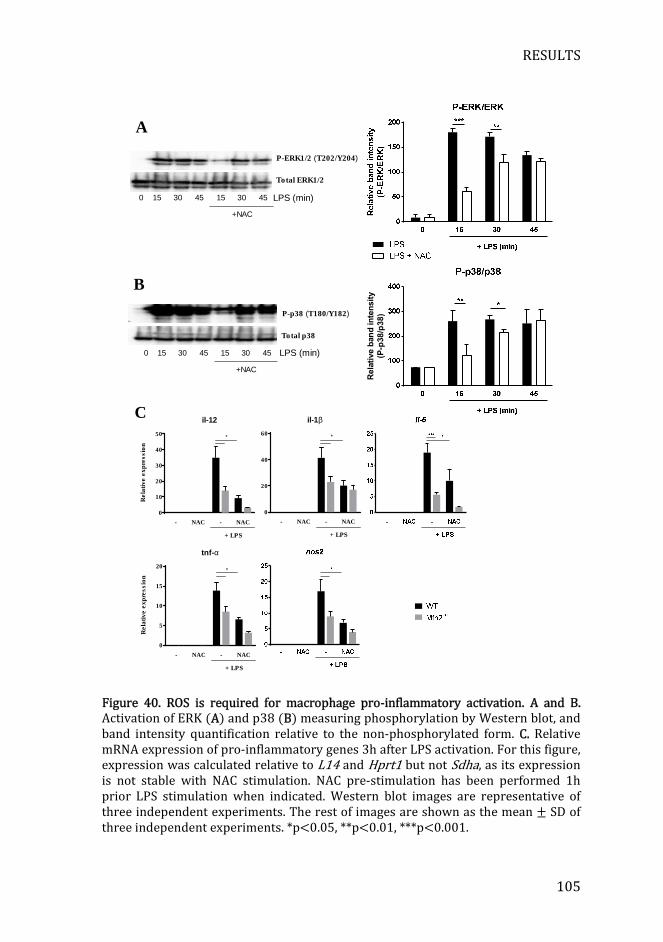
RESULTS
105
Figure 40. ROS is required for macrophage pro-inflammatory activation. A and B. Activation of ERK (A) and p38 (B) measuring phosphorylation by Western blot, and band intensity quantification relative to the non-phosphorylated form. C. Relative mRNA expression of pro-inflammatory genes 3h after LPS activation. For this figure, expression was calculated relative to L14 and Hprt1 but not Sdha, as its expression is not stable with NAC stimulation. NAC pre-stimulation has been performed 1h prior LPS stimulation when indicated. Western blot images are representative of three independent experiments. The rest of images are shown as the mean ± SD of three independent experiments. *p<0.05, **p<0.01, ***p<0.001.
A
B
Rela
tive
ban
d in
ten
sit
y
(P-p
38
/p3
8)
0 15 30 45 15 30 45
+NAC
P-ERK1/2 (T202/Y204)
Total ERK1/2
0 15 30 45 15 30 45
+NAC
P-p38 (T180/Y182)
Total p38
LPS (min)
LPS (min)
C
tnf-α
- NAC - NAC
0
5
10
15
20
Rela
tive e
xp
ressio
n
+ LPS
*
il-12
- NAC - NAC
0
10
20
30
40
50
Rela
tive e
xp
ressio
n
+ LPS
*
il-1β
- NAC - NAC
0
20
40
60
+ LPS
*
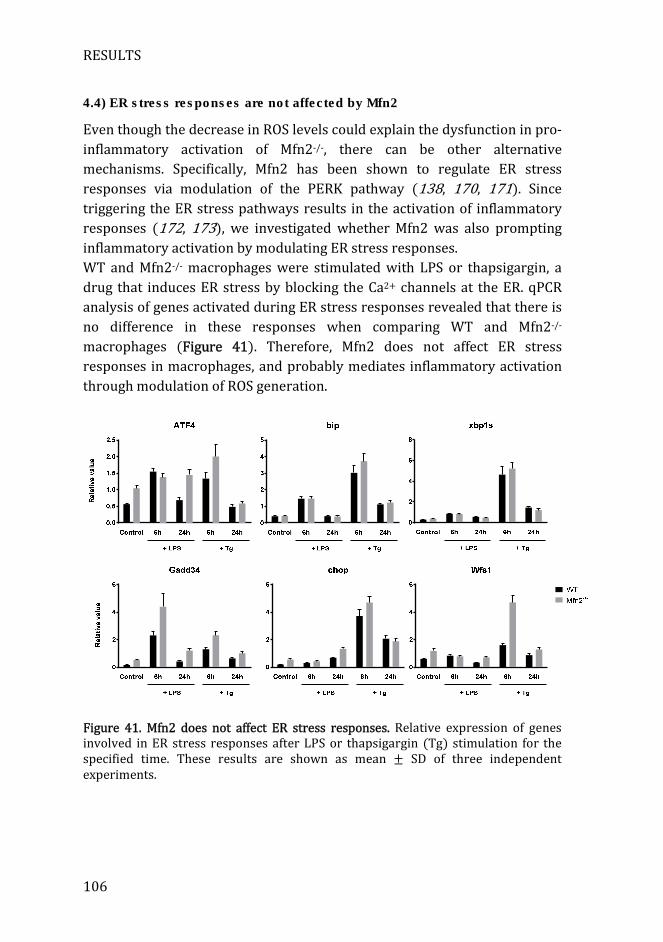
RESULTS
106
4.4) ER stress responses are not affected by Mfn2
Even though the decrease in ROS levels could explain the dysfunction in pro-inflammatory activation of Mfn2-/-, there can be other alternative mechanisms. Specifically, Mfn2 has been shown to regulate ER stress responses via modulation of the PERK pathway (138, 170, 171). Since triggering the ER stress pathways results in the activation of inflammatory responses (172, 173), we investigated whether Mfn2 was also prompting inflammatory activation by modulating ER stress responses. WT and Mfn2-/- macrophages were stimulated with LPS or thapsigargin, a drug that induces ER stress by blocking the Ca2+ channels at the ER. qPCR analysis of genes activated during ER stress responses revealed that there is no difference in these responses when comparing WT and Mfn2-/- macrophages (Figure 41). Therefore, Mfn2 does not affect ER stress responses in macrophages, and probably mediates inflammatory activation through modulation of ROS generation.
Figure 41. Mfn2 does not affect ER stress responses. Relative expression of genes involved in ER stress responses after LPS or thapsigargin (Tg) stimulation for the specified time. These results are shown as mean ± SD of three independent experiments.
RESULTS
107
4.5) Mfn2 does not affect anti-inflammatory activation
Macrophages show a wide range of activation states, from with pro- and anti-inflammatory are only two opposite extremes. These two phenotypes can, in certain circumstances, repress the activation of the other. For example, the production of polyamines or the depletion of L-arginine that occurs during anti-inflammatory activation (i.e. IL-4 or IL-10 stimulation) can suppress NO synthesis (174). To confirm whether the impairment in pro-inflammatory activation observed in Mfn2-/- macrophages was due to a specific defect in pro-inflammatory pathways, and not a consequence of increased anti-inflammatory activation, we evaluated how Mfn2 deficiency affected this anti-inflammatory phenotype. We stimulated macrophages with the anti-inflammatory cytokine IL-4 and measured the expression of anti-inflammatory-related genes. qPCR analysis revealed that there are no significant differences in the expression of the anti-inflammatory-related markers arginase-1 (Arg1), mannose receptor (Mrc), resistin-like alpha (Fizz1), and chitinase-3-like (Ym1) between WT and Mfn2-/- IL-4-stimulated macrophages. Even so, a tendency for increased expression for some of these genes can be observed in Mfn2-/- macrophages (Figure 42A). To further confirm these results, we evaluated the enzymatic activity of arginase-1, which is associated with anti-inflammatory activation. Even though the arginase-1 enzymatic activity is slightly higher in IL-4-stimulated Mfn2-/-, no significant differences compared to WT macrophages have been observed (Figure 42B). We also checked the activation of STAT6, the major transcription factor involved in IL-4-mediated signaling. However, as expected by the anti-inflammatory gene expression, STAT6 phosphorylation is not affected by Mfn2 deficiency (Figure 42C). Altogether, these results confirm that Mfn2 deficiency specifically affects macrophage pro-inflammatory activation, without significantly altering the anti-inflammatory activation.
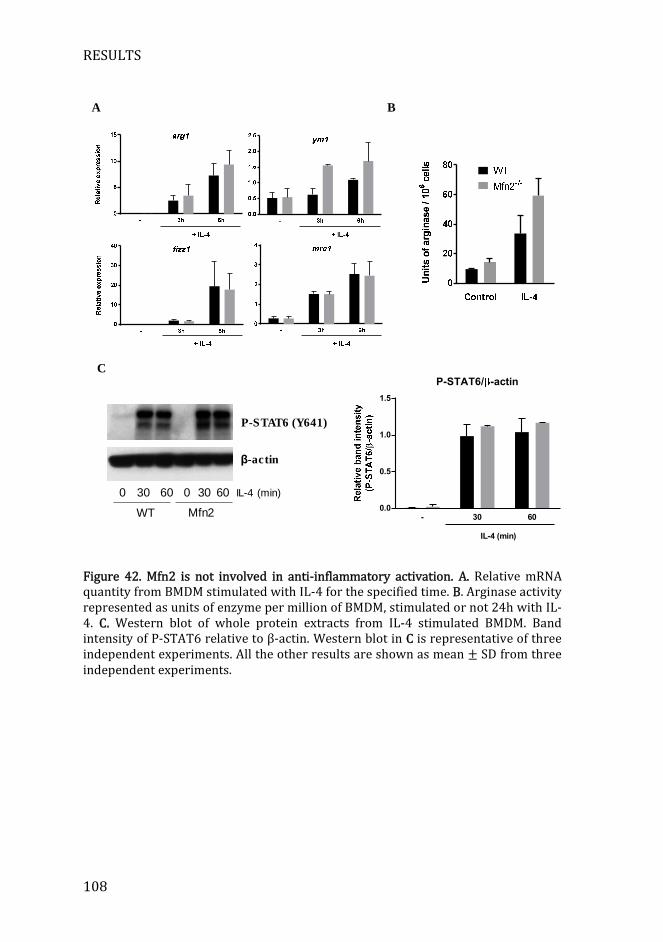
RESULTS
108
Figure 42. Mfn2 is not involved in anti-inflammatory activation. A. Relative mRNA quantity from BMDM stimulated with IL-4 for the specified time. B. Arginase activity represented as units of enzyme per million of BMDM, stimulated or not 24h with IL-4. C. Western blot of whole protein extracts from IL-4 stimulated BMDM. Band intensity of P-STAT6 relative to β-actin. Western blot in C is representative of three independent experiments. All the other results are shown as mean ± SD from three independent experiments.
A B
C
0 30 60 0 30 60
WT Mfn2
P-STAT6 (Y641)
β-actin
P-STAT6/ -actin
- 30 600.0
0.5
1.0
1.5
IL-4 (min)
IL-4 (min)
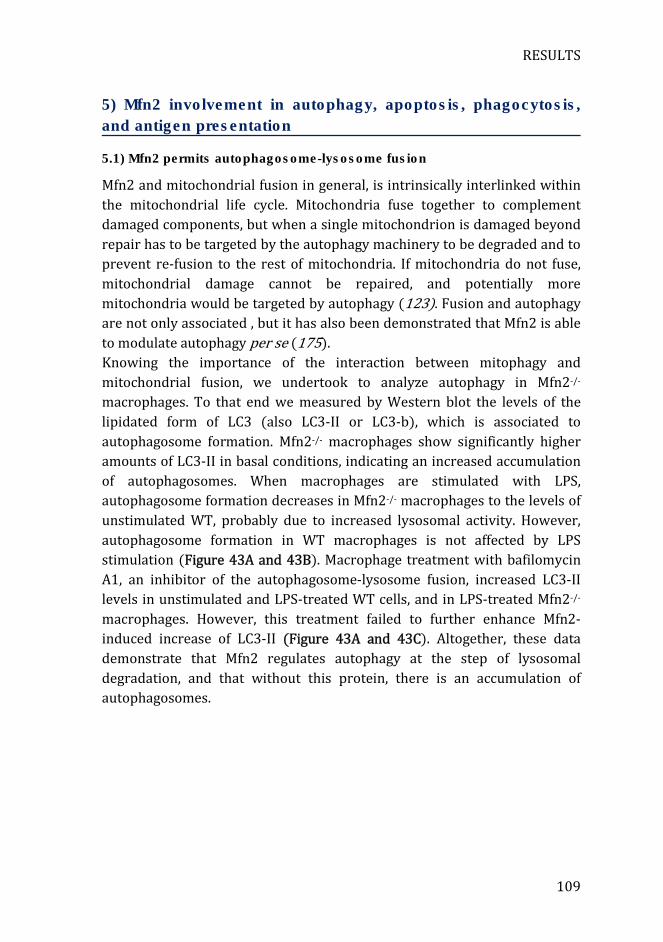
RESULTS
109
5) Mfn2 involvement in autophagy, apoptosis, phagocytosis,
and antigen presentation
5.1) Mfn2 permits autophagosome-lysosome fusion
Mfn2 and mitochondrial fusion in general, is intrinsically interlinked within the mitochondrial life cycle. Mitochondria fuse together to complement damaged components, but when a single mitochondrion is damaged beyond repair has to be targeted by the autophagy machinery to be degraded and to prevent re-fusion to the rest of mitochondria. If mitochondria do not fuse, mitochondrial damage cannot be repaired, and potentially more mitochondria would be targeted by autophagy (123). Fusion and autophagy are not only associated , but it has also been demonstrated that Mfn2 is able to modulate autophagy per se (175). Knowing the importance of the interaction between mitophagy and mitochondrial fusion, we undertook to analyze autophagy in Mfn2-/- macrophages. To that end we measured by Western blot the levels of the lipidated form of LC3 (also LC3-II or LC3-b), which is associated to autophagosome formation. Mfn2-/- macrophages show significantly higher amounts of LC3-II in basal conditions, indicating an increased accumulation of autophagosomes. When macrophages are stimulated with LPS, autophagosome formation decreases in Mfn2-/- macrophages to the levels of unstimulated WT, probably due to increased lysosomal activity. However, autophagosome formation in WT macrophages is not affected by LPS stimulation (Figure 43A and 43B). Macrophage treatment with bafilomycin A1, an inhibitor of the autophagosome-lysosome fusion, increased LC3-II levels in unstimulated and LPS-treated WT cells, and in LPS-treated Mfn2-/- macrophages. However, this treatment failed to further enhance Mfn2-induced increase of LC3-II (Figure 43A and 43C). Altogether, these data demonstrate that Mfn2 regulates autophagy at the step of lysosomal degradation, and that without this protein, there is an accumulation of autophagosomes.
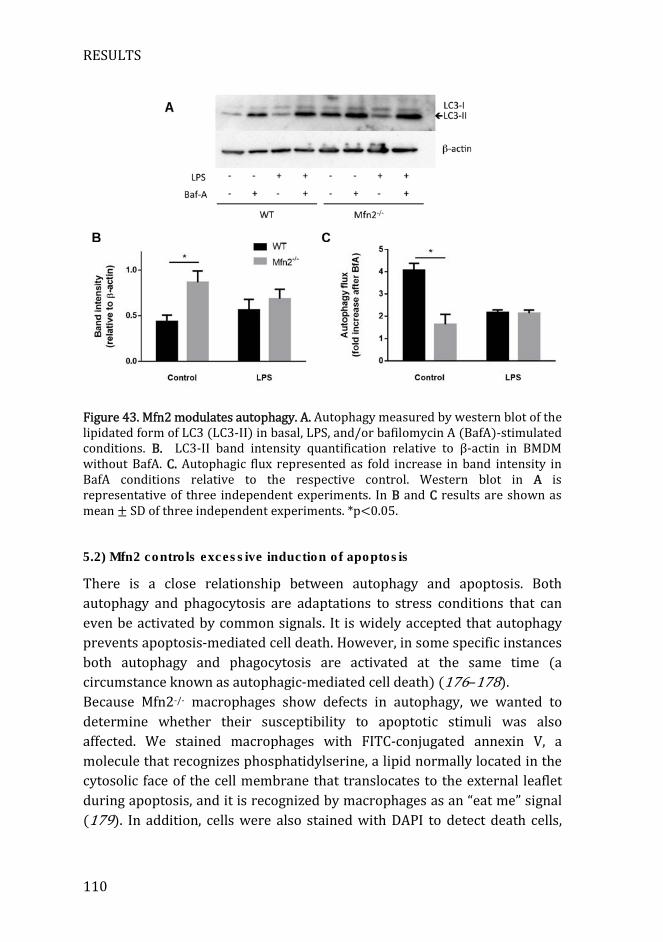
RESULTS
110
Figure 43. Mfn2 modulates autophagy. A. Autophagy measured by western blot of the lipidated form of LC3 (LC3-II) in basal, LPS, and/or bafilomycin A (BafA)-stimulated conditions. B. LC3-II band intensity quantification relative to β-actin in BMDM without BafA. C. Autophagic flux represented as fold increase in band intensity in BafA conditions relative to the respective control. Western blot in A is representative of three independent experiments. In B and C results are shown as mean ± SD of three independent experiments. *p<0.05.
5.2) Mfn2 controls excessive induction of apoptosis
There is a close relationship between autophagy and apoptosis. Both autophagy and phagocytosis are adaptations to stress conditions that can even be activated by common signals. It is widely accepted that autophagy prevents apoptosis-mediated cell death. However, in some specific instances both autophagy and phagocytosis are activated at the same time (a circumstance known as autophagic-mediated cell death) (176–178). Because Mfn2-/- macrophages show defects in autophagy, we wanted to determine whether their susceptibility to apoptotic stimuli was also affected. We stained macrophages with FITC-conjugated annexin V, a molecule that recognizes phosphatidylserine, a lipid normally located in the cytosolic face of the cell membrane that translocates to the external leaflet during apoptosis, and it is recognized by macrophages as an “eat me” signal (179). In addition, cells were also stained with DAPI to detect death cells,
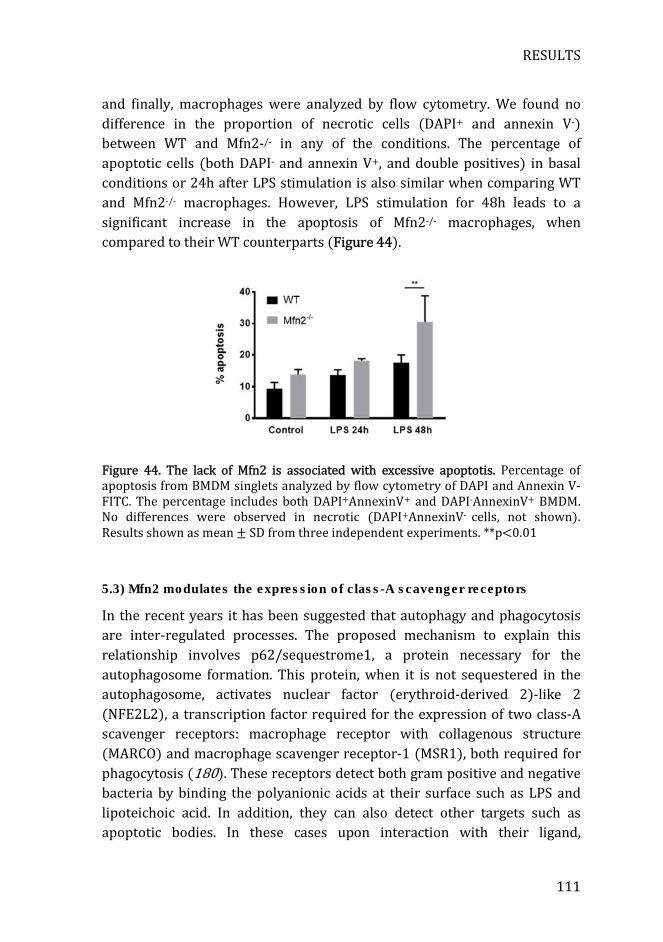
RESULTS
111
and finally, macrophages were analyzed by flow cytometry. We found no difference in the proportion of necrotic cells (DAPI+ and annexin V-) between WT and Mfn2-/- in any of the conditions. The percentage of apoptotic cells (both DAPI- and annexin V+, and double positives) in basal conditions or 24h after LPS stimulation is also similar when comparing WT and Mfn2-/- macrophages. However, LPS stimulation for 48h leads to a significant increase in the apoptosis of Mfn2-/- macrophages, when compared to their WT counterparts (Figure 44).
Figure 44. The lack of Mfn2 is associated with excessive apoptotis. Percentage of apoptosis from BMDM singlets analyzed by flow cytometry of DAPI and Annexin V-FITC. The percentage includes both DAPI+AnnexinV+ and DAPI-AnnexinV+ BMDM. No differences were observed in necrotic (DAPI+AnnexinV- cells, not shown). Results shown as mean ± SD from three independent experiments. **p<0.01
5.3) Mfn2 modulates the expression of class-A scavenger receptors
In the recent years it has been suggested that autophagy and phagocytosis are inter-regulated processes. The proposed mechanism to explain this relationship involves p62/sequestrome1, a protein necessary for the autophagosome formation. This protein, when it is not sequestered in the autophagosome, activates nuclear factor (erythroid-derived 2)-like 2 (NFE2L2), a transcription factor required for the expression of two class-A scavenger receptors: macrophage receptor with collagenous structure (MARCO) and macrophage scavenger receptor-1 (MSR1), both required for phagocytosis (180). These receptors detect both gram positive and negative bacteria by binding the polyanionic acids at their surface such as LPS and lipoteichoic acid. In addition, they can also detect other targets such as apoptotic bodies. In these cases upon interaction with their ligand,
RESULTS
112
phagocytosis of bound target is induced (181). Furthermore, in addition to being regulated by autophagy, type-A scavenger receptors expression is also regulated by TLR signaling in a p38-dependent way (182). Knowing that Mfn2 modulates autophagy and p38 activation in macrophages, we hypothesized that the expression of class-A scavenger receptors could be altered in Mfn2-/- macrophages. We quantified by qPCR the mRNA expression of Marco and Msr1 in both unstimulated and LPS-activated macrophages. In WT macrophages, the expression of both genes is increased upon LPS stimulation, confirming the findings exposed above describing that these genes can be induced by TLR ligands (182). However, Mfn2-/- macrophages show a much lower expression of both genes at both basal and LPS-stimulated conditions (Figure 45), suggesting that these cells may exhibit a dysfunctional phagocytic activity.
Figure 45. Mfn2 enhances the expression of class-A scavenger receptors. Relative mRNA expression of Marco and Msr1 in BMDM stimulated with or without LPS. The results are shown as mean ± SD from three independent experiments. *p<0.05, **p<0.01, ***p<0.001.
5.4) Mfn2 deficiency impairs bacterial phagocytosis
Because Marco and Msr1 are necessary for a proper phagocytosis, we evaluated the ability of these Mfn2-/- macrophages to phagocyte bacteria. For this purpose, we used pHrodo-conjugated Staphylococcus aureus (a gram-positive bacterium) or Escherichia coli (gram-negative bacteria). pHrodo fluorochromes only emit fluorescence in conditions of very acidic pH such as inside the lysosomes. Therefore, non-phagocyted bacteria can be discriminated from phagocyted bacteria, as only the later emit fluorescence.
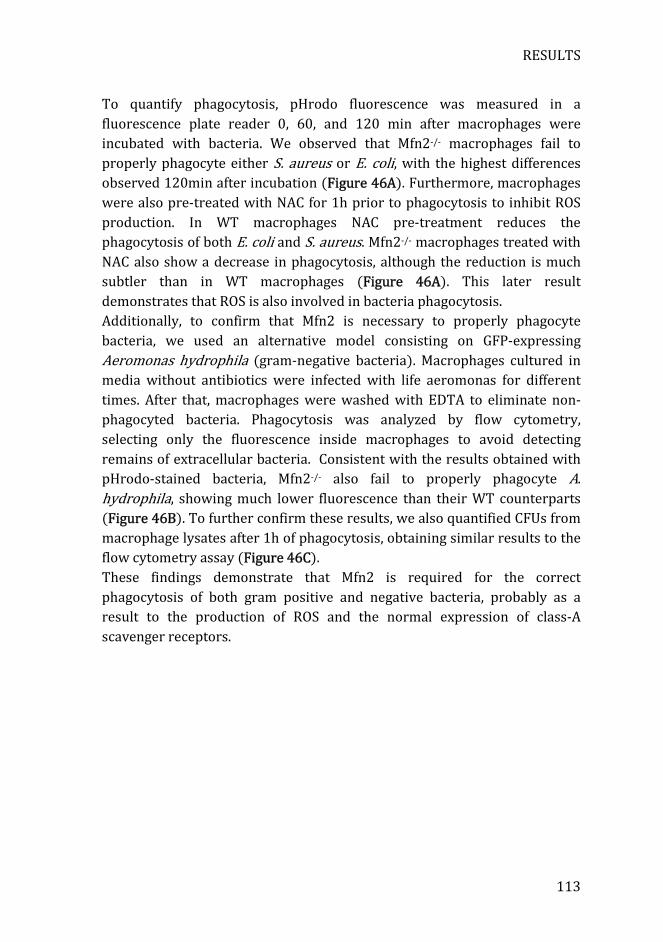
RESULTS
113
To quantify phagocytosis, pHrodo fluorescence was measured in a fluorescence plate reader 0, 60, and 120 min after macrophages were incubated with bacteria. We observed that Mfn2-/- macrophages fail to properly phagocyte either S. aureus or E. coli, with the highest differences observed 120min after incubation (Figure 46A). Furthermore, macrophages were also pre-treated with NAC for 1h prior to phagocytosis to inhibit ROS production. In WT macrophages NAC pre-treatment reduces the phagocytosis of both E. coli and S. aureus. Mfn2-/- macrophages treated with NAC also show a decrease in phagocytosis, although the reduction is much subtler than in WT macrophages (Figure 46A). This later result demonstrates that ROS is also involved in bacteria phagocytosis. Additionally, to confirm that Mfn2 is necessary to properly phagocyte bacteria, we used an alternative model consisting on GFP-expressing Aeromonas hydrophila (gram-negative bacteria). Macrophages cultured in media without antibiotics were infected with life aeromonas for different times. After that, macrophages were washed with EDTA to eliminate non-phagocyted bacteria. Phagocytosis was analyzed by flow cytometry, selecting only the fluorescence inside macrophages to avoid detecting remains of extracellular bacteria. Consistent with the results obtained with pHrodo-stained bacteria, Mfn2-/- also fail to properly phagocyte A. hydrophila, showing much lower fluorescence than their WT counterparts (Figure 46B). To further confirm these results, we also quantified CFUs from macrophage lysates after 1h of phagocytosis, obtaining similar results to the flow cytometry assay (Figure 46C). These findings demonstrate that Mfn2 is required for the correct phagocytosis of both gram positive and negative bacteria, probably as a result to the production of ROS and the normal expression of class-A scavenger receptors.
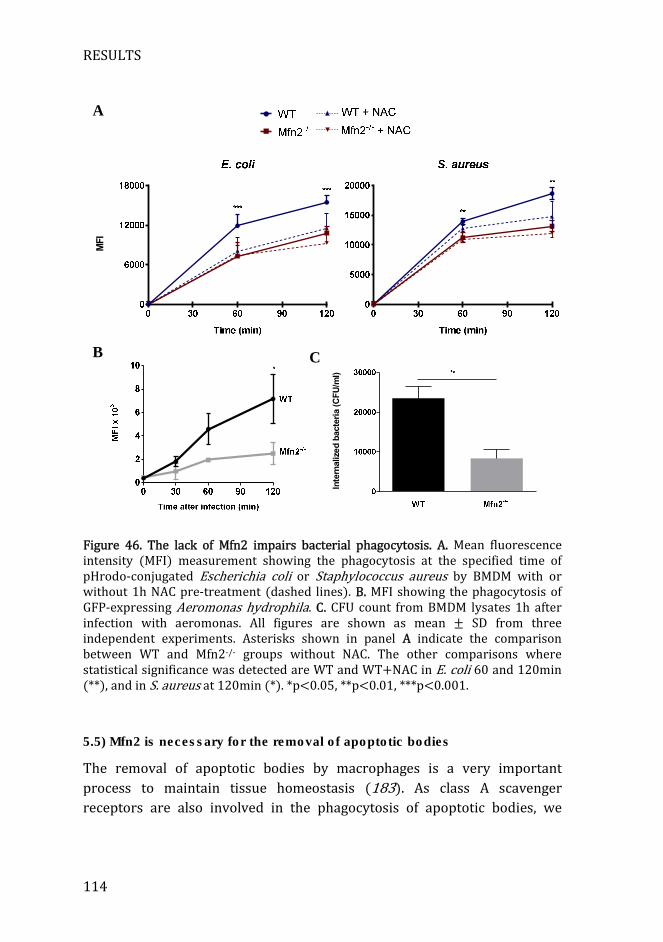
RESULTS
114
Figure 46. The lack of Mfn2 impairs bacterial phagocytosis. A. Mean fluorescence intensity (MFI) measurement showing the phagocytosis at the specified time of pHrodo-conjugated Escherichia coli or Staphylococcus aureus by BMDM with or without 1h NAC pre-treatment (dashed lines). B. MFI showing the phagocytosis of GFP-expressing Aeromonas hydrophila. C. CFU count from BMDM lysates 1h after infection with aeromonas. All figures are shown as mean ± SD from three independent experiments. Asterisks shown in panel A indicate the comparison between WT and Mfn2-/- groups without NAC. The other comparisons where statistical significance was detected are WT and WT+NAC in E. coli 60 and 120min (**), and in S. aureus at 120min (*). *p<0.05, **p<0.01, ***p<0.001.
5.5) Mfn2 is necessary for the removal of apoptotic bodies
The removal of apoptotic bodies by macrophages is a very important process to maintain tissue homeostasis (183). As class A scavenger receptors are also involved in the phagocytosis of apoptotic bodies, we
MFI
Inte
rnalize
d b
acte
ria (
CF
U/m
l)
A
B C
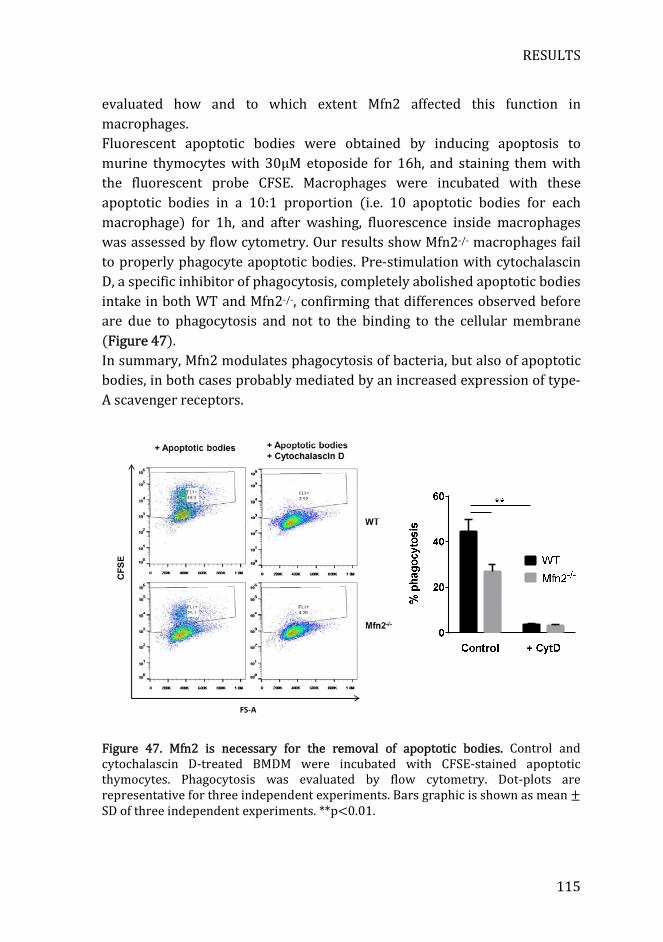
RESULTS
115
evaluated how and to which extent Mfn2 affected this function in macrophages. Fluorescent apoptotic bodies were obtained by inducing apoptosis to murine thymocytes with 30μM etoposide for 16h, and staining them with the fluorescent probe CFSE. Macrophages were incubated with these apoptotic bodies in a 10:1 proportion (i.e. 10 apoptotic bodies for each macrophage) for 1h, and after washing, fluorescence inside macrophages was assessed by flow cytometry. Our results show Mfn2-/- macrophages fail to properly phagocyte apoptotic bodies. Pre-stimulation with cytochalascin D, a specific inhibitor of phagocytosis, completely abolished apoptotic bodies intake in both WT and Mfn2-/-, confirming that differences observed before are due to phagocytosis and not to the binding to the cellular membrane (Figure 47). In summary, Mfn2 modulates phagocytosis of bacteria, but also of apoptotic bodies, in both cases probably mediated by an increased expression of type-A scavenger receptors.
Figure 47. Mfn2 is necessary for the removal of apoptotic bodies. Control and cytochalascin D-treated BMDM were incubated with CFSE-stained apoptotic thymocytes. Phagocytosis was evaluated by flow cytometry. Dot-plots are representative for three independent experiments. Bars graphic is shown as mean ± SD of three independent experiments. **p<0.01.
RESULTS
116
5.6) The lack of Mfn2 is associated with defective bactericidal activity and
protein processing
So far, we have shown that Mfn2 plays a major role in the phagocytosis of both bacteria and apoptotic bodies. Then, we investigated whether Mfn2 was also involved in the degradation of phagocyted bacteria. To measure macrophage’s bactericidal activity, we infected macrophages in vitro with a MOI 25 of Aeromonas hydrophila. After 60min of phagocytosis, 300μg/ml gentamycin was added for 1h to eliminate the non-phagocyted bacteria. Then, media was replaced with 100μg/ml gentamycin, and cells were incubated for different time points. At specific times, macrophages were lysed and CFUs were quantified. As expected, confirming the results obtained before (see Figure 46C), Mfn2-/- macrophages show an impairment in phagocytosis at time 0 (i.e. 1h of phagocytosis plus 1h of gentamycin treatment) when compared to their WT counterparts (Figure 48A). After 24h of phagocytosis, a drastic reduction in the number of CFUs was observed in both WT and Mfn2-/- macrophages, indicating degradation of the phagocyted bacteria (Figure 48A). In addition, the bactericidal activity was calculated as the % of initial bacteria that survived 24h after phagocytosis. Bacteria phagocyted by WT macrophages show an important decrease in survival compared to the ones phagocyted by Mfn2-/- macrophages (Figure 48B), showing an impairment in the bactericidal activity in conditions of Mfn2 deficiency.
Figure 48. Loss of Mfn2 is associated with reduced bactericidal activity. A. BMDM phagocyted Aeromonas hydrophila for 1h. Then, non-phagocyted bacteria were removed with a gentamycin treatment for 1h. BMDM were incubated, and lysed at the specified time points. B. Percent of the surviving bacteria at 24h relative to the initial CFU count. The results are shown as mean ± SD from three independent experiments. *p<0.05, **p<0.01, ***p<0.001.
CF
U/m
l
A B
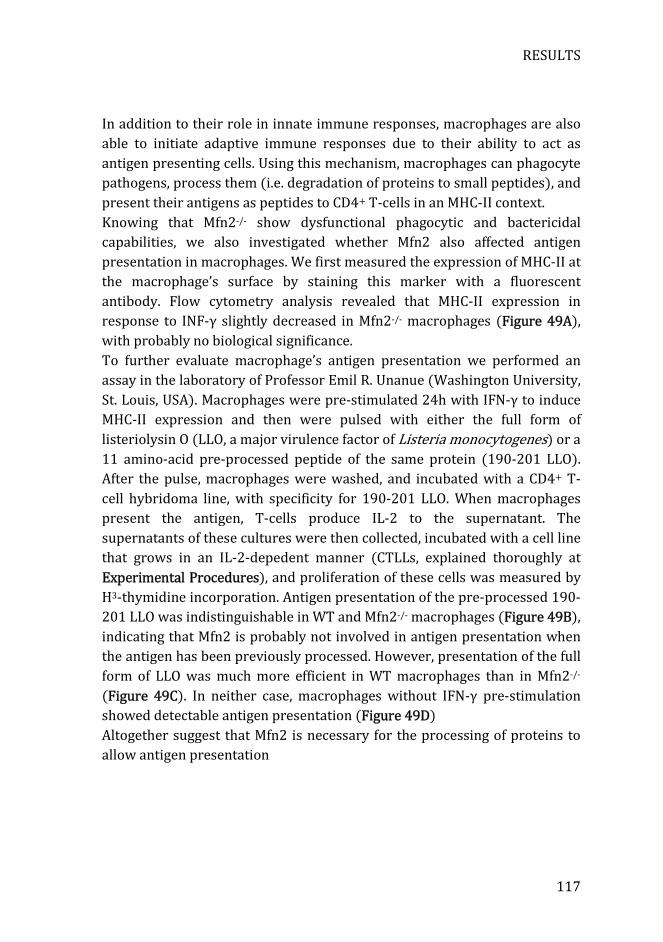
RESULTS
117
In addition to their role in innate immune responses, macrophages are also able to initiate adaptive immune responses due to their ability to act as antigen presenting cells. Using this mechanism, macrophages can phagocyte pathogens, process them (i.e. degradation of proteins to small peptides), and present their antigens as peptides to CD4+ T-cells in an MHC-II context. Knowing that Mfn2-/- show dysfunctional phagocytic and bactericidal capabilities, we also investigated whether Mfn2 also affected antigen presentation in macrophages. We first measured the expression of MHC-II at the macrophage’s surface by staining this marker with a fluorescent antibody. Flow cytometry analysis revealed that MHC-II expression in response to INF-γ slightly decreased in Mfn2-/- macrophages (Figure 49A), with probably no biological significance. To further evaluate macrophage’s antigen presentation we performed an assay in the laboratory of Professor Emil R. Unanue (Washington University, St. Louis, USA). Macrophages were pre-stimulated 24h with IFN-γ to induce MHC-II expression and then were pulsed with either the full form of listeriolysin O (LLO, a major virulence factor of Listeria monocytogenes) or a 11 amino-acid pre-processed peptide of the same protein (190-201 LLO). After the pulse, macrophages were washed, and incubated with a CD4+ T-cell hybridoma line, with specificity for 190-201 LLO. When macrophages present the antigen, T-cells produce IL-2 to the supernatant. The supernatants of these cultures were then collected, incubated with a cell line that grows in an IL-2-depedent manner (CTLLs, explained thoroughly at Experimental Procedures), and proliferation of these cells was measured by H3-thymidine incorporation. Antigen presentation of the pre-processed 190-201 LLO was indistinguishable in WT and Mfn2-/- macrophages (Figure 49B), indicating that Mfn2 is probably not involved in antigen presentation when the antigen has been previously processed. However, presentation of the full form of LLO was much more efficient in WT macrophages than in Mfn2-/- (Figure 49C). In neither case, macrophages without IFN-γ pre-stimulation showed detectable antigen presentation (Figure 49D) Altogether suggest that Mfn2 is necessary for the processing of proteins to allow antigen presentation
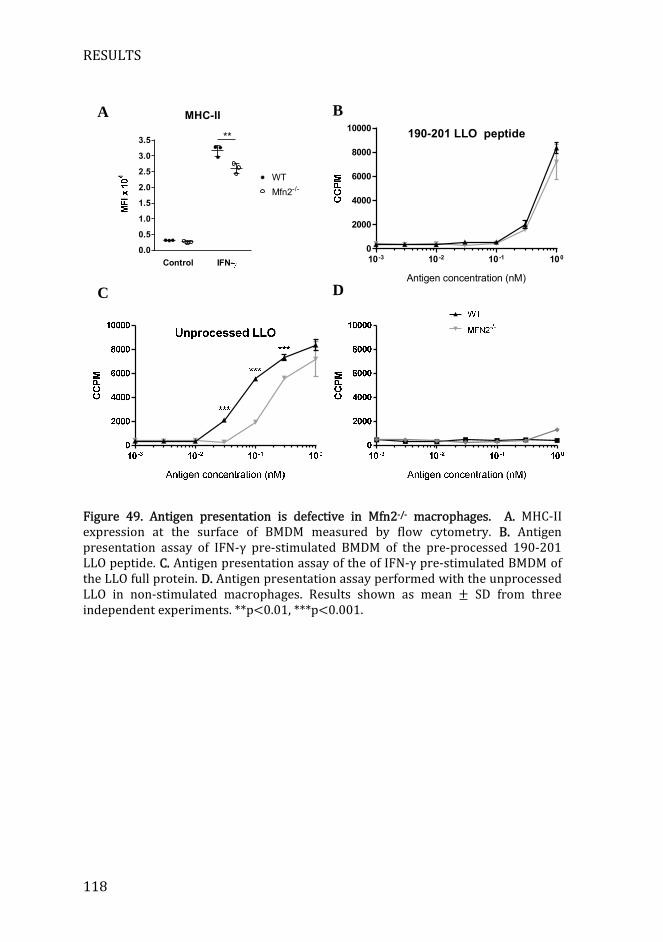
RESULTS
118
Figure 49. Antigen presentation is defective in Mfn2-/- macrophages. A. MHC-II expression at the surface of BMDM measured by flow cytometry. B. Antigen presentation assay of IFN-γ pre-stimulated BMDM of the pre-processed 190-201 LLO peptide. C. Antigen presentation assay of the of IFN-γ pre-stimulated BMDM of the LLO full protein. D. Antigen presentation assay performed with the unprocessed LLO in non-stimulated macrophages. Results shown as mean ± SD from three independent experiments. **p<0.01, ***p<0.001.
MHC-II
Control IFN-
0.0
0.5
1.0
1.5
2.0
2.5
3.0
3.5
WT
Mfn2-/-
**
A B
C D
10 -3 10 -2 10 -1 100
0
2000
4000
6000
8000
10000190-201 LLO peptide
Antigen concentration (nM)
RESULTS
119
6) In vivo models
6.1) Listeria monocytogenes
To evaluate how and at which extent Mfn2 controls immune responses in vivo, we first used several functional models. we started with the murine infection with Listeria monocytogenes. Listeria is a gram-positive facultative intracellular bacterium, normally associated with foodborne diseases. In experimental conditions, after intraperitoneal inoculation, Listeria shows a preference to infect macrophages, growing preferentially in spleen and liver. The majority of bacteria are killed inside these macrophages, but the surviving ones grow inside and spread to other cells. Mice that survive the infection acquire adaptive immunity against Listeria, and become resistant to subsequent challenges. The critical features of this experimental model are the macrophage specificity and that it is a rapid and quantitative assay, either by enumeration of liver and spleen CFUs or by monitoring the survival of infected animals (184). In our experiment, we infected intraperitoneally WT and Mfn2-/- mice with 2x10⁴CFU/Kg of Listeria monocytogenes. Mice survival was monitored until all the surviving mice started to recover weight. We observed that the time course of the disease is similar in the two groups of animals: both start dying at day 4, with the highest mortality observed at day 5 post-inoculation. At day 11, the remaining mice from both groups stopped dying and started recovering weight. However, the survival of Mfn2-/- infected mice was severely reduced compared to their WT counterparts, reaching a significant decrease of more than 40% (Figure 50A). To further evaluate at which extent the loss of Mfn2 in macrophages affects immune responses against listeria, we infected an additional group of WT and Mfn2-/- mice with this bacterium. This time, mice were sacrificed 48h after inoculation to obtain spleen and liver. Lysates from these organs were serially diluted and cultured in brain-heart infusion media to quantify CFUs. Consistent with their decreased survival, Mfn2-/- mice show a significantly higher CFU count at both liver and spleen (Figure 50B), demonstrating that these mice are unable to control the infection. To understand the molecular mechanisms involved in the dysfunctional immune responses against listeria, we infected BMDM in vitro with a MOI 5 of Listeria monocytogenes for 30min. Then, bacteria were removed and RNA extracted 6h later. qPCR analysis shows that the expression of Tnf-α and Il-1β is reduced in Mfn2-/- macrophages compared to their WT counterparts
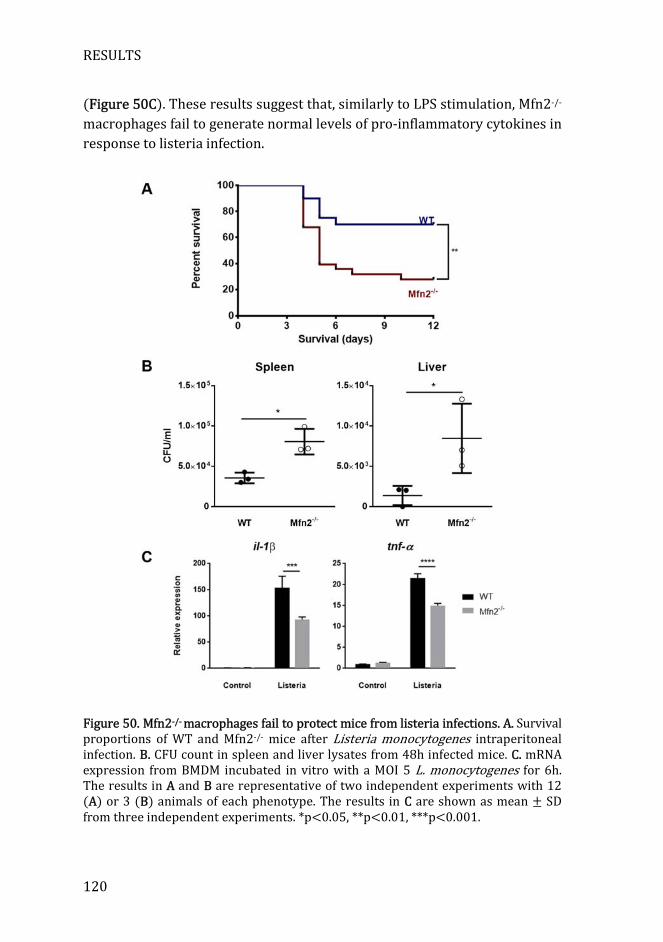
RESULTS
120
(Figure 50C). These results suggest that, similarly to LPS stimulation, Mfn2-/- macrophages fail to generate normal levels of pro-inflammatory cytokines in response to listeria infection.
Figure 50. Mfn2-/- macrophages fail to protect mice from listeria infections. A. Survival proportions of WT and Mfn2-/- mice after Listeria monocytogenes intraperitoneal infection. B. CFU count in spleen and liver lysates from 48h infected mice. C. mRNA expression from BMDM incubated in vitro with a MOI 5 L. monocytogenes for 6h. The results in A and B are representative of two independent experiments with 12 (A) or 3 (B) animals of each phenotype. The results in C are shown as mean ± SD from three independent experiments. *p<0.05, **p<0.01, ***p<0.001.
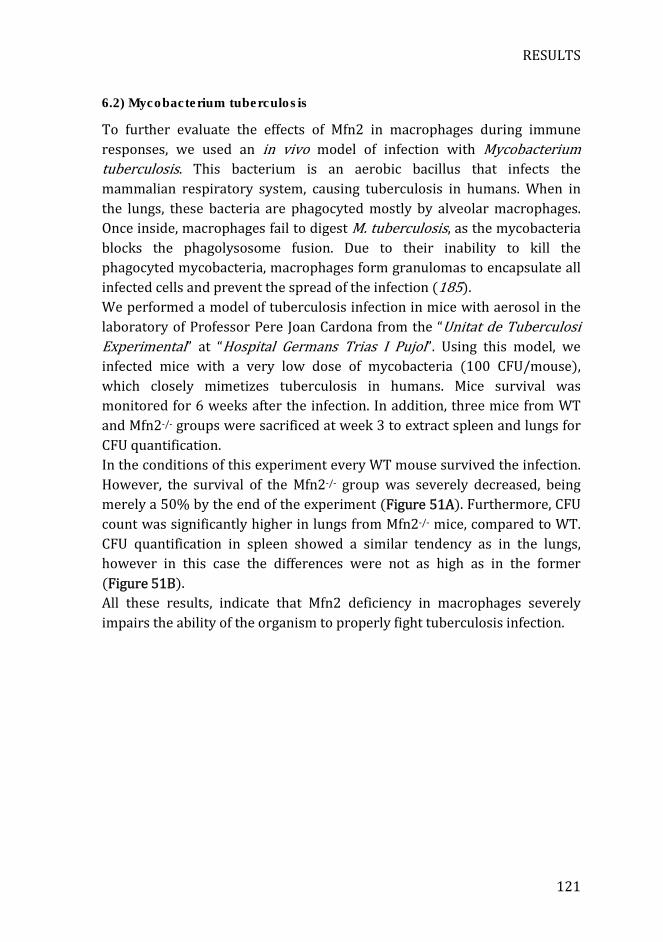
RESULTS
121
6.2) Mycobacterium tuberculosis
To further evaluate the effects of Mfn2 in macrophages during immune responses, we used an in vivo model of infection with Mycobacterium tuberculosis. This bacterium is an aerobic bacillus that infects the mammalian respiratory system, causing tuberculosis in humans. When in the lungs, these bacteria are phagocyted mostly by alveolar macrophages. Once inside, macrophages fail to digest M. tuberculosis, as the mycobacteria blocks the phagolysosome fusion. Due to their inability to kill the phagocyted mycobacteria, macrophages form granulomas to encapsulate all infected cells and prevent the spread of the infection (185). We performed a model of tuberculosis infection in mice with aerosol in the laboratory of Professor Pere Joan Cardona from the “Unitat de Tuberculosi Experimental” at “Hospital Germans Trias I Pujol”. Using this model, we infected mice with a very low dose of mycobacteria (100 CFU/mouse), which closely mimetizes tuberculosis in humans. Mice survival was monitored for 6 weeks after the infection. In addition, three mice from WT and Mfn2-/- groups were sacrificed at week 3 to extract spleen and lungs for CFU quantification. In the conditions of this experiment every WT mouse survived the infection. However, the survival of the Mfn2-/- group was severely decreased, being merely a 50% by the end of the experiment (Figure 51A). Furthermore, CFU count was significantly higher in lungs from Mfn2-/- mice, compared to WT. CFU quantification in spleen showed a similar tendency as in the lungs, however in this case the differences were not as high as in the former (Figure 51B). All these results, indicate that Mfn2 deficiency in macrophages severely impairs the ability of the organism to properly fight tuberculosis infection.
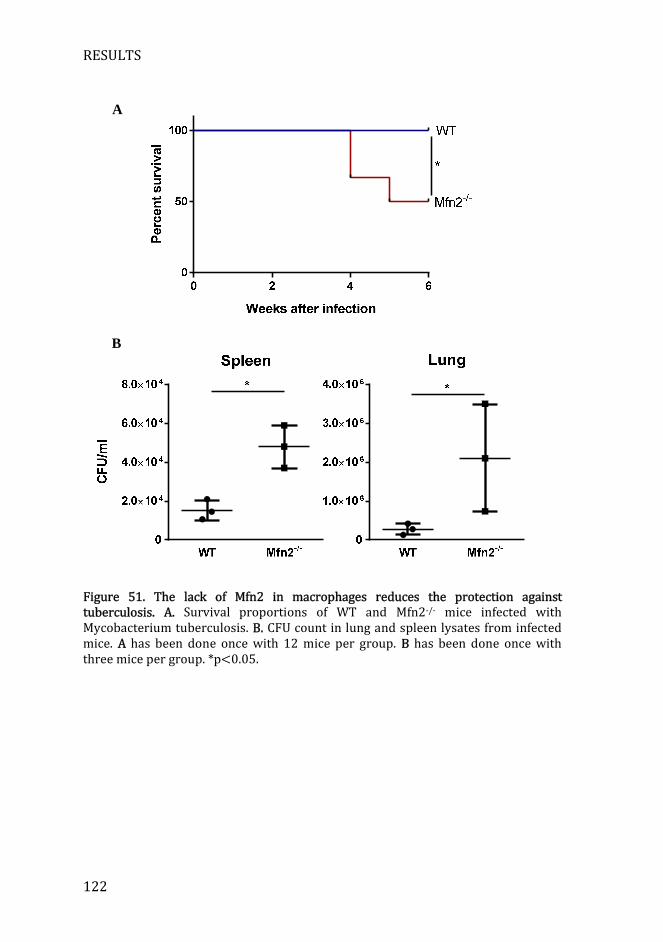
RESULTS
122
Figure 51. The lack of Mfn2 in macrophages reduces the protection against tuberculosis. A. Survival proportions of WT and Mfn2-/- mice infected with Mycobacterium tuberculosis. B. CFU count in lung and spleen lysates from infected mice. A has been done once with 12 mice per group. B has been done once with three mice per group. *p<0.05.
A
B
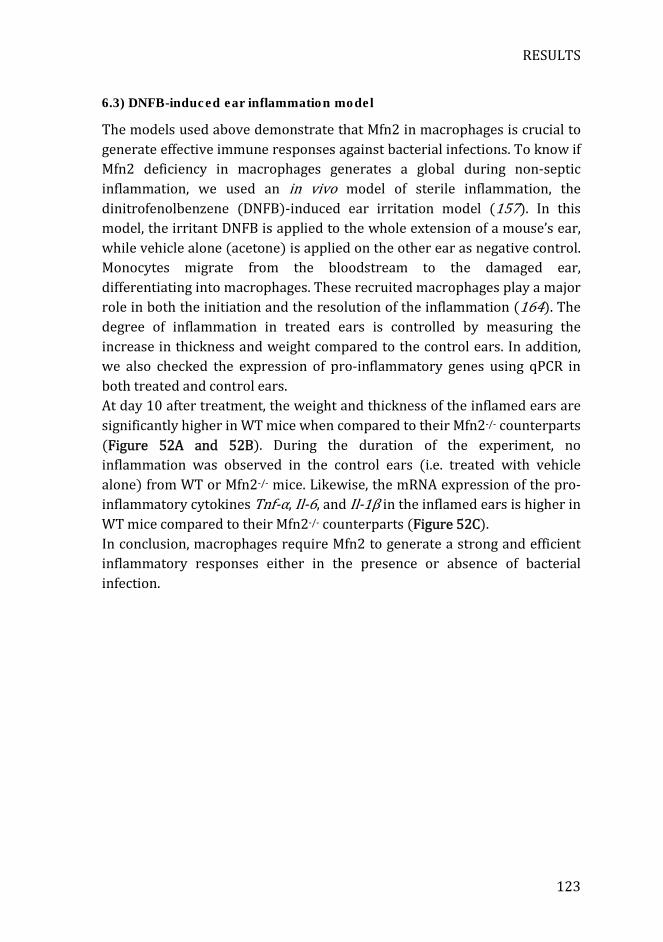
RESULTS
123
6.3) DNFB-induced ear inflammation model
The models used above demonstrate that Mfn2 in macrophages is crucial to generate effective immune responses against bacterial infections. To know if Mfn2 deficiency in macrophages generates a global during non-septic inflammation, we used an in vivo model of sterile inflammation, the dinitrofenolbenzene (DNFB)-induced ear irritation model (157). In this model, the irritant DNFB is applied to the whole extension of a mouse’s ear, while vehicle alone (acetone) is applied on the other ear as negative control. Monocytes migrate from the bloodstream to the damaged ear, differentiating into macrophages. These recruited macrophages play a major role in both the initiation and the resolution of the inflammation (164). The degree of inflammation in treated ears is controlled by measuring the increase in thickness and weight compared to the control ears. In addition, we also checked the expression of pro-inflammatory genes using qPCR in both treated and control ears. At day 10 after treatment, the weight and thickness of the inflamed ears are significantly higher in WT mice when compared to their Mfn2-/- counterparts (Figure 52A and 52B). During the duration of the experiment, no inflammation was observed in the control ears (i.e. treated with vehicle alone) from WT or Mfn2-/- mice. Likewise, the mRNA expression of the pro-inflammatory cytokines Tnf-α, Il-6, and Il-1β in the inflamed ears is higher in WT mice compared to their Mfn2-/- counterparts (Figure 52C). In conclusion, macrophages require Mfn2 to generate a strong and efficient inflammatory responses either in the presence or absence of bacterial infection.
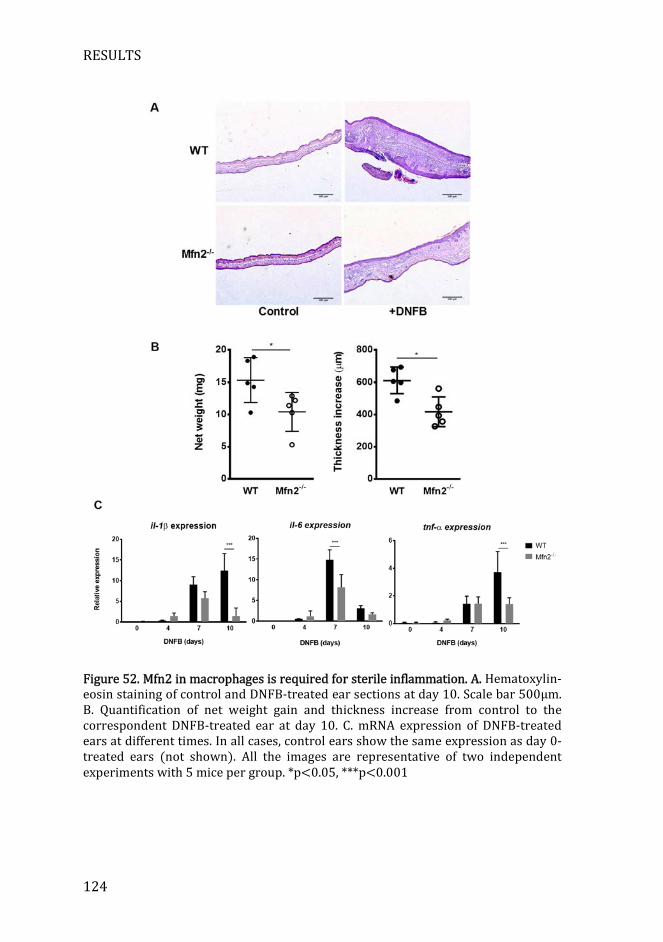
RESULTS
124
Figure 52. Mfn2 in macrophages is required for sterile inflammation. A. Hematoxylin-eosin staining of control and DNFB-treated ear sections at day 10. Scale bar 500μm. B. Quantification of net weight gain and thickness increase from control to the correspondent DNFB-treated ear at day 10. C. mRNA expression of DNFB-treated ears at different times. In all cases, control ears show the same expression as day 0-treated ears (not shown). All the images are representative of two independent experiments with 5 mice per group. *p<0.05, ***p<0.001

DISCUSSION

DISCUSSION
127
Discussion
Macrophages are crucial regulators and effectors of immune responses, actively contributing to both initiation and resolution of inflammation. In the recent years, mitochondria are increasingly being considered master regulators of innate immune responses (42–44). In this thesis, we have extended these observations by focusing on the role of Mfn2, one of the proteins required for mitochondrial fusion. These findings bring a further understanding on the mitochondrial modulation of macrophage-mediated immune responses. There are several reasons that can explain the relevance of mitochondria in macrophages: First, mitochondria control metabolism in macrophages, providing energy and the intermediate metabolites necessary to perform the appropriate functions in response to the ever-changing conditions (40, 42). Second, mitochondria serve as a physical platform that regulates signaling in RLR-mediated anti-viral signaling. Third, mitochondria are also platforms for NLRP3 inflammasome assembly, being also the main source of inflammasome-activating DAMPs. Finally, mitochondria are major sources of ROS, which are necessary to both kill intracellular bacteria and provide a correct activation of several pro-inflammatory signaling pathways (42–44). Due to the importance of mitochondria in macrophage-mediated immune responses, we focused on the study of mitochondrial dynamics, a crucial process for the correct performance of mitochondria. Apart from controlling mitochondrial morphology, mitochondrial dynamics are of paramount importance in the regulation of multiple cellular functions, potentially modulating the interactions between mitochondria and immune responses. Specifically, it has been described in other non-immune cells that mitochondrial dynamics regulates mitochondrial respiration, mΔψ, ROS production, ATP synthesis, cell differentiation, apoptosis, proliferation, and ER-mitochondria interaction (102, 103, 105–107, 137), being all these factors able to potentially affect the outcome of immune responses. Many studies have focused the importance of mitochondrial fusion in anti-viral responses and in the inflammasome activation (147, 148, 152, 153). However, very little was known on how and to which extent mitochondrial dynamics affect other types of immune responses. In this dissertation we demonstrated that in macrophages the mitochondrial protein Mfn2 regulate inflammatory and immune responses at multiple levels.
DISCUSSION
128
It has been reported that Mfn2 is a ubiquitous protein, with particularly high expression in brain, heart, and skeletal muscle (132). Here, we described that this protein is also highly expressed in macrophages, with levels as high as the ones found in brain or heart. These high levels of expression are the first evidence suggesting that Mfn2 may be playing an important role in macrophage-mediated responses. Most of this work has been performed using BMDM as a cellular model. BMDM are non-transformed cells that have the advantage to be easily obtainable in high numbers, while being highly similar to natural recruited macrophage populations. These cells show the same ability to respond to activation, proliferation, and apoptosis stimuli as these natural populations (186). In this specific case, we described that Mfn2 expression levels in BMDM are similar to the ones found in peritoneal macrophages. To perform their multiple functions, macrophages need to be activated. In response to a combination of signals from the local environment, these cells fine-tune their differentiation program, acquiring a specific phenotype from a wide range activation states (14). In this regard we showed that Mfn2 expression in macrophages is induced upon PAMP stimulation, but not by the cytokines IFN-γ or IL-4. From here we can extract three main conclusions: First, due to its overexpression, Mfn2 is probably relevant for the function of macrophages during PAMP activation. This PAMP detection is the basis of innate immune responses, playing a major role in pathogen recognition and initiation of inflammatory and immune responses (187). Second, while for a very long time it was considered that PAMPs and IFN-γ induced pro-inflammatory activation in macrophages (i.e. M1-like activation), the differences in Mfn2 expression reveal that the phenotypes produced by each stimulus are not the same. This finding confirms the current concept, developed in the last years, that macrophage polarization is far more complex than the M1/M2 duality, and that IFN- γ-stimulation may result in a different activation profile than LPS (14). Lastly, Mfn2 does not seem to be involved macrophage activation by IL-4, as it is not induced by this stimulus. This observation may suggest that Mfn2 is not important for anti-inflammatory activation, but as explained above, macrophage activation is far more complex than stimulation with a single cytokine. IL-4 or IL-13 initiate a transcriptional program that differ from the one activated by IL-10 or TGF-β, even though all four were considered to induce anti-inflammatory activation in macrophages (188, 189). Furthermore, it is accepted that during the normal course of inflammation, macrophages acquire an anti-
DISCUSSION
129
inflammatory phenotype upon phagocytosis of apoptotic cells (190, 191). Taken together, anti-inflammatory activation can be induced by a wide range of stimuli, which in turn span different transcriptional programs. Thus, the possibility than Mfn2 is involved in other types of anti-inflammatory activation (i.e. not mediated by IL-4) cannot be discarded. To further investigate the role of Mfn2 in macrophages, we used mice with this gene disrupted. Total Mfn2 KO is not viable due to an embryonic defect in the formation of the giant cell trophoblast layer in the placenta (129). To solve this problem, we used a myeloid-conditional KO mice colony, based on the LysM-Cre/Mfn2-LoxP system. LysM is one of the most used promoters for targeted gene deletion of macrophages/monocytes (192). In the LysM-Cre mouse, recombination rates between 83% and 95% are normally achieved in myeloid cells, including F4/80+ macrophages (154). The degree of recombination also depends on the specific myeloid population. While alveolar, peritoneal, and BMDM show the maximum recombination rates, microglia (193) and splenic macrophages (red pulp and marginal zone macrophages) present recombination rates as low as 40% (194). In our case, we achieved a 90-95% inhibition of Mfn2 in both peritoneal and BMDM, which is the interval expected accounting the aforementioned studies. Even though this inhibition is enough for the in vitro studies, the fact that Mfn2 is not depleted in some macrophage populations has to be considered during the in vivo experiments. Furthermore, we found that the expression of the pro-fusion proteins Mfn1 and Opa-1 is not upregulated in Mfn2-/- macrophages. This result indicates that there is no other fusion protein that increase its expression to compensate Mfn2 deficiency, and thus our results will not be masked by this compensatory mechanism. Another characteristic of the LysM-Cre model is that the recombinase activity also depends on the maturation level of macrophages, with mature macrophages showing more Cre activation than immature macrophages (195). This last feature is highly useful, as Mfn2 depletion will only occur during the last stages of differentiation. If this were not the case, and Cre was activated before a complete maturation, the lack of Mfn2 could potentially disrupt macrophage differentiation, as occurs in some other cell types such as cortical neurons (196) or cardiomyocytes (197). In this regard, we demonstrated Mfn2 depletion does not affect in vitro macrophage differentiation from their bone marrow precursors. Furthermore, the proportions of blood and splenic monocytes/macrophages were unaltered,
DISCUSSION
130
demonstrating that in vivo, these mice generate normal levels of fully differentiated monocytes/macrophages. This lack of effect on macrophage differentiation could be explained by the late activation of LysM promoter, albeit the possibility that Mfn2 takes no part in macrophage differentiation, should not be overlook. Another characteristic of the LysM-Cre mouse is that gene recombination also occurs in neutrophils and certain dendritic cells populations (CD11c+ splenic dendritic cells). However, other immune cells including T-cells, B-cells, NK-cells, mastocytes, eosinophils, basophils, plasmacytoid dendritic cells, and classical dendritic cells do not show LysM-Cre-mediated recombination (154, 194). This characteristic is irrelevant for the in vitro assays, where we use pure populations of BMDM, but its importance is revealed in the in vivo studies, mostly due to the importance of neutrophils in infections and inflammatory responses. The role of these cells cannot be neglected, even though in the in vivo models we used (listeriosis, tuberculosis, and DNFB inflammation) macrophages play a major role. Having demonstrated that completely mature macrophages can be obtained from Mfn2-/- bone marrow cells, we analyzed thoroughly the phenotype of these macrophages. Even though Mfn2 has been demonstrated to be involved in cellular senescence and proliferation, we found no differences in either parameter. First, we demonstrated that Mfn2 plays no role in M-CSF-mediated macrophage proliferation, confirming it by both directly measuring proliferation with BrdU, or by checking the cell cycle distributions. The fact that the number of circulating monocytes and splenic macrophages is not decreased by Mfn2 deficiency also supports this conclusion. This result however, contrasts with some previous reports indicating that Mfn2 plays a role in inhibiting cell proliferation in a variety of cell types (141, 142). In our specific case, we induced proliferation with the macrophage-specific growth factor M-CSF, therefore an explanation for the lack of effect of Mfn2 in proliferation is that the inhibition may depend on the growth factor used. Another explanation would be that this effect on proliferation was cell lineage-dependent (the studies mentioned above were performed on vascular smooth muscle cells, MEFs, or tumor cell lines), and therefore is possible that this mechanism is not relevant in macrophages. We have also demonstrated that the absence of Mfn2 in macrophages result in aberrant mitochondrial morphology, including increased fragmentation
DISCUSSION
131
and decreased mitochondrial volume. These findings support previous observations made in other cellular models of Mfn2 deficiency: Mfn2-mutant MEFs present drastically fragmented mitochondria, forming spheres of variable size (113), Mfn2-deficient skeletal muscle cells and hepatocytes show fragmented mitochondria forming big clusters instead of an organized network (139), and cardiac Mfn2-/- cells present fragmented reticular mitochondria with altered cristae structure (167) . However, despite the morphological abnormalities we observed in Mfn2-/- macrophages, their total mitochondrial mass was not altered. This result also corroborates the findings of other authors on other different cell types (134, 198). These data confirm that Mfn2 controls mitochondrial morphology without affecting total mitochondrial mass, and that this function is conserved among the different cell lineages. In addition to maintain a properly structured mitochondrial network, Mfn2 is crucial to control the mΔψ and mitochondrial respiration in macrophages. The observation that Mfn2 controls the mΔψ confirms other studies in a number of cells including myocytes (198), cortical neurons (196), fertilized eggs (199), MEFs (113, 127, 200), and skeletal muscle cells (133, 135). This parameter is an indicator of the mitochondrial fitness. The mΔψ is generated when protons are pumped from the matrix to the inner membrane space as a consequence of the electron flow through the electron transport chain. Therefore, a low mΔψ indicates an impaired respiratory capacity, which is what we observed in Mfn2-/- macrophages. Regarding mitochondrial respiration, our results confirm other studies describing that the lack of Mfn2 leads to a marked decrease in the expression of respiratory complexes I, II, III, and V, as well as in their activity, resulting in an overall defect in the OXPHOS system (133, 135, 200). This functional activity of Mfn2 would be independent on the ability of this protein to promote mitochondrial fusion, as demonstrated by using cells expressing a truncated form of Mfn2 without pro-fusion activity (133, 135, 200). In addition, a recent study demonstrated that Mfn2 maintains normal levels of mitochondrial coenzyme Q10. This coenzyme Q is the responsible for the optimal function of the respiratory chain, as supplementation with coenzyme Q10 restores normal mitochondrial respiration in Mfn2-null cells (134). An interesting point also regarding mitochondrial respiration, is the fact that we have found no differences in coupled respiration (i.e. respiration
DISCUSSION
132
associated with ATP production by complex V). A similar result has also been observed in muscle and non-muscle cells confirming our results (200). Because ATP generation by OXPHOS is not affected, Mfn2-/- macrophages do not need to further activate glycolysis as an alternative mechanism to obtain energy, thus these macrophages present exactly the same levels of glycolysis as their WT counterparts. As a result to the changes in the mΔψ and mitochondrial respiration, the production of mROS can be altered. These highly reactive molecules are generated due to a leakage of electrons from the respiratory chain resulting in a partial reduction of molecular oxygen. Therefore, increased mitochondrial respiration and mΔψ imply a higher flow of electrons through the electron transport chain, with potentially more leaking electrons that generate superoxide (201–203) This affirmation is supported by experiments performed using chemical uncouplers such as CCCP or FCCP, or by overexpressing UCP2. Under these conditions, the mΔψ is dissipated and mROS production decreased (95, 204–206). However, it has been shown that in some cases a decrease in mΔψ leads to increased ROS accumulation. The hypothesis proposed to reconcile this discrepancy, is that physiological ROS levels are only found within an optimized mΔψ range. When the mΔψ is too low, mitochondria sometimes switch from NADH to NADPH as electron donor. NADPH is also involved in the antioxidant defense, and therefore their consumption compromises the antioxidant activity of the cell and results in increased ROS accumulation (203, 207). Therefore, it is logical that Mfn2-/- macrophages, which show decreased mΔψ and mitochondrial respiration, also produce less ROS. We confirmed this hypothesis demonstrating that Mfn2 is necessary to produce normal levels of ROS (both cellular ROS and mROS). Interestingly, Mfn2 is not only necessary to generate ROS during LPS activation, but also in baseline conditions. This observation suggests that the defect in ROS production of Mfn2-/- macrophages is probably the result of widespread dysfunctional mitochondrial activity instead of just a failure to increase ROS production in a TLR-TRAF6-ECSIT-dependent manner (85). We also described that ROS induction with antimycin A, which directly induces mROS at the respiratory complexes, also depends on Mfn2, confirming the aforementioned hypothesis that these differences are caused by a mitochondrial defect. A major question here is whether the reduction in total cellular ROS is a consequence of the decrease in mROS. While ROS detected by MitoSox (i.e.
DISCUSSION
133
mROS) is unequivocally produced in the mitochondria, ROS detected by DCF-DA (i.e. total cellular ROS) have different origins. Even though mROS contribute to cellular ROS levels, in macrophages the phagosomal NADPH oxidase is also a major contributor (208). However, a crosstalk exists between the ROS produced in the mitochondria and the ROS produced by NADPH oxidases (209). On one hand, mitochondria are recruited to the phagosomes upon bacterial infection, releasing mROS. These mROS can directly kill phagocyted bacteria, but also activate the NADPH oxidase, inducing it to produce more ROS. On the other hand, ROS produced by the NADPH oxidases can in turn upregulate the production of mROS by either opening the mitochondrial ATP-sensitive potassium channels (209) or by disruption of the respiratory chain complexes (210). The fact that activation of NADPH oxidases increase mROS and vice versa, suggest that these two sources of ROS work as a feed-forward loop, heavily increasing the production of ROS when is required. Consequently, the decrease in total cellular ROS observed in Mfn2-/- macrophages is likely a consequence of a decreased production of mROS. However, we cannot discard that Mfn2 could also be affecting the production of ROS by other means, such as modulating NADPH levels to induce NADPH oxidase-mediated ROS production. Regarding the effects of Mfn2 on ROS production in macrophages, there is some controversy when we compare our results with the different cellular models. First, two studies using neurons (the first one, primary cortical neurons, and the other a cell line) confirmed our findings, as they described that Mfn2 deficiency decreases ROS production, whereas Mfn2 overexpression increases it. However, they do not provide any mechanistic explanation for their results (196, 211). By contrast, two studies using primary cardiomyocytes described that Mfn2 ablation results instead in increased ROS production. They postulate that this effect could be the result of a dysfunctional interaction between mitochondria and the sarcoplasmic reticulum, which is mediated by Mfn2. This defect would lead to a decrease in the transfer of Ca2+ between the two organelles, resulting in increased mROS production (212, 213). Finally, liver and muscle cell deficient for Mfn2 also show increased concentrations of hydrogen peroxide. These Mfn2-deficient cells also show increased ER stress and defective calcium homeostasis, leading to an increase in ROS levels as a secondary effect, thus suggesting a crosstalk between these two phenomena and the increased ROS production (139). Taken all these studies together, we can conclude that
DISCUSSION
134
Mfn2 effect on ROS production depends on the cell type, and it is also probably controlled by the ER function. This hypothesis is consistent with our results, as we have not observed any difference in ER-stress responses between WT and Mfn2-/- macrophages. Thus, the decrease in ROS levels in Mfn2-/- macrophages can be explained, on one hand because ER stress is not affected, and so it does not increase ROS in these conditions, and on the other hand, because mitochondrial respiration is severely decreased, leading to a reduced mROS generation. Due to its role in producing normal levels of ROS in macrophages, Mfn2 becomes very good candidate in the regulation of inflammatory responses. At to date, Mfn2 has been only involved in RIG-1-mediated antiviral signaling and in the inflammasome activation. The mechanisms involved in this modulation include: the maintenance of a high mΔψ to allow MAVS signaling in the mitochondria (150, 151), mediating ER-mitochondria contacts to permit MAVS-STING interaction, distribution of mitochondria around the focus of viral infection(149), and inhibition of MAVS by direct interaction (147). Regarding inflammasome activation, Mfn2 is required to maintain a high mΔψ that allows NLRP3 location at the mitochondrial surface and its subsequent activation (152, 153). As far as we know, we are the first group to describe that Mfn2 is required for the pro-inflammatory activation of macrophages in response to LPS. This effect involves several activities that can be classified as follows: production of pro-inflammatory cytokines, phagocytosis, and protein processing. The dysfunction in the generation of an inflammatory response observed in Mfn2-/- macrophages severely compromises their efficiency in controlling infections. Furthermore, a reduced production of pro-inflammatory mediators by macrophages, also diminishes the activity of other immune cells, compromising the whole immune response. A plausible explanation for the inability of Mfn2-/- macrophages to undergo pro-inflammatory activation is the disruption in ROS production observed in these cells. An important variable to take into account is the specificity of ROS targets. ROS react covalently targeting a subset of atoms found in specific molecular contexts, such as the sulfhydryl groups in cysteines. Consequently, ROS can potentially oxidize a wide range of molecules, modulating lots of signaling pathways at once, and therefore having a very low specificity. However, ROS biological effects are actually highly specific as aconsequence of the
DISCUSSION
135
restricted production of ROS in discrete subcellular locations, such as mitochondria or NADPH oxidases (87). Therefore, because Mfn2-/- macrophages produce less ROS in the mitochondria, proteins located in the vicinity of this organelle would be potentially more affected by mROS oxidation. In this regard, there are evidences indicating that a subset of ERK is associated to mitochondria. First, Baines and colleagues (214) described that in cardiomyocytes, ERK locates to mitochondria where it interacts with protein kinase C. In another study, Alonso et al. (215) showed that in neuronal cells, ERK localized to the outer membrane and intermembrane space of mitochondria. Also using neurons, Zhu and colleagues (216) demonstrated that activated ERK can show mitochondrial location. Finally, a more recent study showed that in alveolar macrophages, activated ERK can also be found associated to mitochondria (217). Likewise, it has been described that JNK and p38 can also be translocated to the mitochondrial fraction (214, 218, 219). In relation to pro-inflammatory cytokine production, we and others (101, 220) have demonstrated that treatment of WT macrophages with the ROS scavenger NAC abolishes the LPS-mediated phosphorylation of ERK and p38, and consequently the expression of pro-inflammatory genes. The precise mechanism for these activations has been extensively discussed thorough the literature, although it still remains elusive. ROS oxidizes cysteine and methionine residues in a reversible way. These oxidations can modulate a number of signaling pathways, including NF-κB and MAPKs, by using different mechanisms. One mechanism involves the oxidation of MAPK kinase kinases (MAPKKK or MAP3K). In low-ROS conditions members of the MAPKKK family are bound to reduced thioredoxin. In conditions of higher ROS levels, thioredoxin is oxidized, dissociating from MAPKKK. Once dissociated, MAPKKK initiate a series of sequential phosphorylations leading to the activation of the MAPK pathways (221). In this regard, oxidations are required to activate the cascade Ras, Raf, Mek1/2, that ends in ERK phosphorylation (222). A second mechanism involves the inhibition and degradation of the targeted proteins. This is the case of MKP1, the major MKP in dephosphorylating ERK, p38, and JNK. This inhibition may act as fine regulator tunneling not only the activity of MKP1, but also the amount of this labile protein, which has a very short half-life (44, 222). However, we didn’t find differences in MKP1 levels between WT and Mfn2-/- macrophages. Thus we can discard that the
DISCUSSION
136
mechanism depends on ROS-mediated degradation of MKP1 and the possibility that ROS modulates the expression of MKP1 itself. However, we cannot exclude the possibility that the absence of ROS increased the activity of this protein without affecting its levels. In addition to MAPKs, it has been described that ROS also modulates NF-κB activation. The majority of the studies agree that ROS activate NF-κB pathway, however the mechanisms are different depending on the cell type. For example, in T-cells ROS induce the phosphorylation and dissociation of I-κBα, while in epithelial cells ROS trigger IKK activation (223). Here, we reported a decrease in the activation of NF-κB in LPS-treated Mfn2-/- macrophages, which further support with the hypothesis that the inflammatory defects of these cells are a consequence of their inability to produce normal quantities of ROS. Interestingly, while pro-inflammatory activation is severely disrupted in Mfn2-/- macrophages, anti-inflammatory activation does not seem to be affected. These findings, together with the fact that Mfn2 expression does not change after IL-4 stimulation, add up to the hypothesis that while Mfn2 is crucial for the macrophage pro-inflammatory activation, it is not relevant during the anti-inflammatory activation. Another mechanism by which mitochondrial dynamics can modulate immune responses is by regulation of the mitophagy. Mitophagy is the specific autophagic degradation of mitochondria, and occurs when a mitochondrion is too damaged to maintain the mΔψ (82). Mitochondrial fusion is very important in this process as it allows the complementation of damaged components amongst the mitochondrial network. In physiological conditions, Mfn1 and Mfn2 are degraded in a mΔΨ-dependent way when a mitochondrion is damaged beyond repair to prevent re-fusion with the remaining healthy mitochondrial population. However, if the fusion machinery is depleted, even a slightly damaged mitochondrion would not be able to exchange components with other mitochondria and therefore, it would accumulate damage faster. (125). Therefore, as expected, Mfn2-/- macrophages present more autophagy than their WT counterparts. However, when analyzing the autophagic flux, we found that Mfn2 is also crucial for the lysosomal degradation of the autophagosomes. Due to the increased autophagy and the decreased autophagic flux, Mfn2-/- macrophages present an extensive accumulation of autophagosomes. This same phenotype has also been described in cardiomyocytes. In this case, the
DISCUSSION
137
suggested mechanism involves Mfn2 recruiting RAB7, a protein involved in the autophagosome-lysosome fusion (224). This increase in autophagy and autophagosome accumulation have potentially severe consequences for the correct function of macrophages, including alterations in phagocytosis and apoptosis. Both autophagy and apoptosis are activated in response to similar stimuli or stress conditions. It is generally accepted that autophagy and apoptotis exhibit mutual inhibition, possibly due to the fact that a cell first tries adapt by removing damaged organelles, and only if the damage is too high, they would start apoptosis (176–178). In this regard, Mfn2-/- macrophages, which show an extensive accumulation of autophagosomes, also present increased apoptosis susceptibility to LPS stimulation. This result is highly relevant for the correct macrophage function, as it shows that Mfn2 is not only necessary for the normal production of inflammatory mediators, but in addition promotes the survival of macrophages at the inflammatory loci. This is a critical phenomenon, because if macrophages disappear during the early steps of inflammation, there will be no remaining cells for the resolution of the inflammatory process that could become chronic (225). In addition to their multiple roles in inflammation and tissue repair, macrophages also contribute to immune responses by phagocyting microorganisms, dead cells, and other particulate targets. In this thesis we report that Mfn2 mediates macrophage phagocytosis of bacteria and apoptotic bodies by regulating the expression of type-A scavenger receptors MARCO and MSR1. These receptors recognize a wide variety of ligands, including LPS, lipoteichoic acid, mycobacterial components, and modified LDL (226). Additionally, these receptors can also detect and remove apoptotic bodies, thus contributing to the prevention of autoimmune diseases such lupus (227). A possible link between mitochondria and phagocytosis was described several years ago, and involves a negative regulation of phagocytosis by autophagy. The mechanism involves the degradation of p62 in the autophagosome. If autophagy is prevented, p62 activates NFE2L, a transcription factor that induces the expression of MARCO and MSR1, increasing phagocytosis (180). In this regard, we described that Mfn2-/- macrophages show reduced levels of both MSR1 and MARCO, which is consistent with the aforementioned hypothesis, as these cells show increased autophagy. Furthermore, the expression of these receptors can be regulated by TLR in a p38-dependent way (182). Because Mfn2-/- macrophages also show decreased p38 signaling in response to LPS,
DISCUSSION
138
this mechanism could be also contributing to the decreased phagocytosis in these cells. Here, we propose a model in which Mfn2 prevents excessive mitophagy, allowing p62 to induce a normal expression of class-A scavenger receptors. In addition, the increased Mfn2-mediated mROS generation could contribute to increase the expression of these receptors in response to LPS in a p38-dependent way. In addition to the modulation of phagocytosis, here we also demonstrate that Mfn2 is necessary for the degradation of phagocyted bacteria, and for the processing of proteins. This functional activity is crucial to present antigens to CD4+ cells, and initiate adaptive immune responses (228). While Mfn2-/- showed an impaired presentation of the entire LLO protein to T-cells, the defect was corrected if the protein to present had been previously processed. A possible explanation for both effects (i.e. peptide processing and bactericidal activity of phagocyted bacteria) can be found in the aforementioned effect of Mfn2 on the phagosome-lysosome fusion (224). There is the possibility that, analogously to the autophagosome, the endosome also needs Mfn2 to fuse with the lysosome. However, the mechanism is not as clear as in the case of autophagy, because in autophagy the membrane’s origin is in the ER, where Mfn2 can be found. Conversely, Mfn2 has not been described to be in the phagosome or the lysosome membranes, thus more research needs to be done to further elucidate this mechanism. Finally, another possibility is that ROS could be involved in peptide processing, and therefore, it could explain the deficiencies in presentation found in Mfn2-/- macrophages. This involvement of ROS is more clear in the case of the bactericidal activity, as it has been extensively described that mROS are crucial contributors in the degradation of phagocyted bacteria (85). Finally, to confirm the relevance of macrophage’s Mfn2 in inflammatory and immune responses we generated three in vivo models: two involving bacterial infection, and one based on sterile inflammation. The first one was an intraperitoneal infection with Listeria monocytogenes. In this case we demonstrate that Mfn2 in macrophages is required to perform effective immune responses against listeria infection. Myeloid-conditional Mfn2-/- mice show increased mortality, being unable to properly control the infection, as demonstrated by the increased colony counts in spleen and liver. One of the advantages of this model is that with the
DISCUSSION
139
intraperitoneal injection, where listeria infects preferentially liver and spleen macrophages (184), and thus becomes a good model to study the role of Mfn2 in macrophage-mediated immune responses. In some conditions, listeria can avoid macrophage-mediated degradation by escaping the phagosome into the cytosol. However, if macrophages become activated, they produce ROS early after bacterial uptake, effectively killing the bacteria before it can scape to the cytosol (229). In fact, experiments performed using antioxidants demonstrated that macrophages need ROS to produce pro-inflammatory cytokines and to prevent the invasiveness of listeria (230). These evidences, together with our in vivo results, strongly support the mechanism we have previously demonstrated in vitro, in which Mfn2 deficiency in macrophages reduces ROS and produces a decline in inflammatory cytokine production. The second model consisted on an aerosol infection with Mycobacterium tuberculosis. The use of the aerosol route allowed us to use a very low dose of the mycobacteria, resulting in a pathology that closely mimetizes human tuberculosis (231). Here, we demonstrated that Mfn2 deficiency in macrophages prevents them from controlling an otherwise sublethal tuberculosis infection. This model is not only interesting because macrophages are preferentially infected, but also because both mROS and TNF-α production are involved in the control of the infection (232). Specifically, a correct balance of mROS is required to effectively eliminate the pathogen. Low mROS levels are associated with uncontrolled bacterial growth, followed by macrophage death by necrosis, and dissemination of the pathogen. Alternatively, very high mROS levels are associated with an initial control of the bacterial growth, but rapidly macrophages die due to the excessive oxidative stress, allowing the dissemination of the surviving mycobacteria. Thus, only balanced mROS levels allow for the elimination of the internalized mycobacteria without compromising macrophage survival (232). In this regard, Mfn2 deficiency in macrophages result in both a decrease in mROS and TNF- α levels, as well as in an increase in cell death. Altogether, these data confirm the hypothesis that Mfn2 in macrophages is required to generate effective immune response against bacterial pathogens. In both models of infection, we cannot disregard the role of other myeloid cells, such as neutrophils, where Mfn2 has also been eliminated. However, due to the nature of these infections (i.e. both are intracellular bacteria that preferably target macrophages) macrophages are the primary cells involved. The phenotype observed in these models is probably a combination of the
DISCUSSION
140
effects of Mfn2 deficiency in macrophages (i.e. these macrophages show decreased inflammatory activation, combined with a decreased survival at the inflammatory loci, diminished phagocytosis, and impaired antigen presentation capabilities). Finally, the third model consisted on a cutaneous sterile inflammation using the irritant DNFB. In this model, both pro-inflammatory activity and the subsequent repair are regulated by recruited monocytes that differentiate to macrophages (164). Here we demonstrate that macrophage’s Mfn2 is not only crucial for the responses against bacteria, but also during sterile inflammation. However, we cannot reject the possibility of an impairment in inflammasome activation, which can be activated by DNFB (233), because Mfn2 is also required for the NLRP3 inflammasome activation (152). Even that, in activated Mfn2-/- macrophages the production of IL-1β mRNA is already defective, and therefore if the inflammasome was affected it would have a minor effect in this in vivo assay. The fact that Mfn2 is not associated with human immune-related conditions, do not undervalue the role of Mfn2 in the regulation of inflammatory responses. We have demonstrated that this protein is crucial for the normal activity of macrophages: from inducing pro-inflammatory activation, to the modulation of phagocytosis and antigen presentation. Furthermore, the functional in vivo models confirmed that Mfn2 is necessary to produce the strong pro-inflammatory responses that are required to efficiently fight infections.

CONCLUSIONS

CONCLUSIONS
Conclusions
1) Mfn2 is highly expressed in macrophages, and its expression is further
induced upon pro-inflammatory stimuli. 2) Mfn2 controls mitochondrial morphology and function, being crucial for
mitochondrial respiration, the maintenance of the mΔψ, and the production of ROS.
3) Mfn2 is crucial for macrophage pro-inflammatory activation. 4) Mfn2 is critical for phagocytosis and antigen presentation. 5) The absence of Mfn2 in macrophages leads to a defective pro-
inflammatory response.


REFERENCES

REFERENCES
147
References:
1. M. D. Cooper, M. N. Alder, The Evolution of Adaptive Immune Systems. Cell. 124, 815–822 (2006).
2. J. Parkin, B. Cohen, An overview of the immune system. The Lancet. 357, 1777–1789 (2001).
3. G. Dranoff, Cytokines in cancer pathogenesis and cancer therapy. Nat. Rev. Cancer. 4, 11–22 (2004).
4. A. F. Valledor, F. E. Borràs, M. Cullell-Young, A. Celada, Transcription factors that regulate monocyte/macrophage differentiation. J. Leukoc. Biol. 63, 405–417 (1998).
5. J. Lloberas, C. Soler, A. Celada, The key role of PU.1/SPI-1 in B cells, myeloid cells and macrophages. Immunol. Today. 20, 184–189 (1999).
6. L. M. Carlin et al., Nr4a1-dependent Ly6C(low) monocytes monitor endothelial cells and orchestrate their disposal. Cell. 153, 362–375 (2013).
7. F. Ginhoux, S. Jung, Monocytes and macrophages: developmental pathways and tissue homeostasis. Nat. Rev. Immunol. 14, 392–404 (2014).
8. F. Ginhoux, M. Guilliams, Tissue-Resident Macrophage Ontogeny and Homeostasis. Immunity. 44, 439–449 (2016).
9. S. Epelman, K. J. Lavine, G. J. Randolph, Origin and Functions of Tissue Macrophages. Immunity. 41, 21–35 (2014).
10. C. L. Scott, S. Henri, M. Guilliams, Mononuclear phagocytes of the intestine, the skin, and the lung. Immunol. Rev. 262, 9–24 (2014).
11. L. C. Davies, S. J. Jenkins, J. E. Allen, P. R. Taylor, Tissue-resident macrophages. Nat. Immunol. 14, 986–995 (2013).
12. T. Yu et al., The pivotal role of TBK1 in inflammatory responses mediated by macrophages. Mediators Inflamm. 2012, 979105 (2012).
13. D. M. Mosser, J. P. Edwards, Exploring the full spectrum of macrophage activation. Nat. Rev. Immunol. 8, 958–969 (2008).
14. M. Guilliams, L. van de Laar, A hitchhiker’s guide to myeloid cell subsets: practical implementation of a novel mononuclear phagocyte classification system. Antigen Present. Cell Biol., 406 (2015).
15. O. Takeuchi, S. Akira, Pattern Recognition Receptors and Inflammation. Cell. 140, 805–820 (2010).
REFERENCES
148
16. V. Pétrilli, C. Dostert, D. A. Muruve, J. Tschopp, The inflammasome: a danger sensing complex triggering innate immunity. Curr. Opin. Immunol. 19, 615–622 (2007).
17. E. Latz, T. S. Xiao, A. Stutz, Activation and regulation of the inflammasomes. Nat. Rev. Immunol. 13, 397–411 (2013).
18. S. I. Miller, R. K. Ernst, M. W. Bader, LPS, TLR4 and infectious disease diversity. Nat. Rev. Microbiol. 3, 36–46 (2005).
19. Y.-C. Lu, W.-C. Yeh, P. S. Ohashi, LPS/TLR4 signal transduction pathway. Cytokine. 42, 145–151 (2008).
20. T. H. Mogensen, Pathogen Recognition and Inflammatory Signaling in Innate Immune Defenses. Clin. Microbiol. Rev. 22, 240–273 (2009).
21. S. Akira, S. Uematsu, O. Takeuchi, Pathogen Recognition and Innate Immunity. Cell. 124, 783–801 (2006).
22. M. Yoneyama et al., Shared and Unique Functions of the DExD/H-Box Helicases RIG-I, MDA5, and LGP2 in Antiviral Innate Immunity. J. Immunol. 175, 2851–2858 (2005).
23. E. Dixit, J. C. Kagan, Intracellular pathogen detection by RIG-I-like receptors. Adv. Immunol. 117, 99–125 (2013).
24. S. Rothenfusser et al., The RNA Helicase Lgp2 Inhibits TLR-Independent Sensing of Viral Replication by Retinoic Acid-Inducible Gene-I. J. Immunol. 175, 5260–5268 (2005).
25. T. Venkataraman et al., Loss of DExD/H box RNA helicase LGP2 manifests disparate antiviral responses. J. Immunol. Baltim. Md 1950. 178, 6444–6455 (2007).
26. T. Satoh et al., LGP2 is a positive regulator of RIG-I– and MDA5-mediated antiviral responses. Proc. Natl. Acad. Sci. 107, 1512–1517 (2010).
27. K. Takahasi et al., Solution structures of cytosolic RNA sensor MDA5 and LGP2 C-terminal domains: identification of the RNA recognition loop in RIG-I-like receptors. J. Biol. Chem. 284, 17465–17474 (2009).
28. I. C. Berke, Y. Modis, MDA5 cooperatively forms dimers and ATP-sensitive filaments upon binding double-stranded RNA. EMBO J. 31, 1714–1726 (2012).
29. X. Jiang et al., Ubiquitin-Induced Oligomerization of the RNA Sensors RIG-I and MDA5 Activates Antiviral Innate Immune Response. Immunity. 36, 959–973 (2012).
30. T. Kawai et al., IPS-1, an adaptor triggering RIG-I- and Mda5-mediated type I interferon induction. Nat. Immunol. 6, 981–988 (2005).
REFERENCES
149
31. E. Meylan et al., Cardif is an adaptor protein in the RIG-I antiviral pathway and is targeted by hepatitis C virus. Nature. 437, 1167–1172 (2005).
32. L.-G. Xu et al., VISA is an adapter protein required for virus-triggered IFN-beta signaling. Mol. Cell. 19, 727–740 (2005).
33. S. Furr, I. Marriott, Viral CNS infections: role of glial pattern recognition receptors in neuroinflammation. Microb. Immunol. 3, 201 (2012).
34. F. Hou et al., MAVS Forms Functional Prion-like Aggregates to Activate and Propagate Antiviral Innate Immune Response. Cell. 146, 448–461 (2011).
35. J. Wu, Z. J. Chen, Innate Immune Sensing and Signaling of Cytosolic Nucleic Acids. Annu. Rev. Immunol. 32, 461–488 (2014).
36. M.-C. Michallet et al., TRADD protein is an essential component of the RIG-like helicase antiviral pathway. Immunity. 28, 651–661 (2008).
37. S. Liu et al., MAVS recruits multiple ubiquitin E3 ligases to activate antiviral signaling cascades. eLife. 2, e00785 (2013).
38. K. Schroder, J. Tschopp, The Inflammasomes. Cell. 140, 821–832 (2010).
39. L. Franchi, R. Muñoz-Planillo, G. Núñez, Sensing and reacting to microbes through the inflammasomes. Nat. Immunol. 13, 325–332 (2012).
40. E. L. Mills, L. A. O’Neill, Reprogramming mitochondrial metabolism in macrophages as an anti-inflammatory signal. Eur. J. Immunol. 46, 13–21 (2016).
41. K. Ganeshan, A. Chawla, Metabolic Regulation of Immune Responses. Annu. Rev. Immunol. 32, 609–634 (2014).
42. S. E. Weinberg, L. A. Sena, N. S. Chandel, Mitochondria in the Regulation of Innate and Adaptive Immunity. Immunity. 42, 406–417 (2015).
43. A. P. West, G. S. Shadel, S. Ghosh, Mitochondria in innate immune responses. Nat. Rev. Immunol. 11, 389–402 (2011).
44. S. M. Cloonan, A. M. Choi, Mitochondria: sensors and mediators of innate immune receptor signaling. Curr. Opin. Microbiol. 16, 327–338 (2013).
45. L. A. J. O’Neill, E. J. Pearce, Immunometabolism governs dendritic cell and macrophage function. J. Exp. Med. 213, 15–23 (2016).
REFERENCES
150
46. A. Haschemi et al., The Sedoheptulose Kinase CARKL Directs Macrophage Polarization through Control of Glucose Metabolism. Cell Metab. 15, 813–826 (2012).
47. S. C.-C. Huang et al., Cell-intrinsic lysosomal lipolysis is essential for alternative activation of macrophages. Nat. Immunol. 15, 846–855 (2014).
48. B. Kelly, L. A. O’Neill, Metabolic reprogramming in macrophages and dendritic cells in innate immunity. Cell Res. 25, 771–784 (2015).
49. J.-C. Rodríguez-Prados et al., Substrate Fate in Activated Macrophages: A Comparison between Innate, Classic, and Alternative Activation. J. Immunol. 185, 605–614 (2010).
50. T. Cramer et al., HIF-1alpha is essential for myeloid cell-mediated inflammation. Cell. 112, 645–657 (2003).
51. C. Peyssonnaux et al., HIF-1alpha expression regulates the bactericidal capacity of phagocytes. J. Clin. Invest. 115, 1806–1815 (2005).
52. A. K. Jha et al., Network Integration of Parallel Metabolic and Transcriptional Data Reveals Metabolic Modules that Regulate Macrophage Polarization. Immunity. 42, 419–430 (2015).
53. A. Michelucci et al., Immune-responsive gene 1 protein links metabolism to immunity by catalyzing itaconic acid production. Proc. Natl. Acad. Sci. 110, 7820–7825 (2013).
54. G. M. Tannahill et al., Succinate is an inflammatory signal that induces IL-1β through HIF-1α. Nature. 496, 238–242 (2013).
55. C. J. Lelliott et al., Ablation of PGC-1beta results in defective mitochondrial activity, thermogenesis, hepatic function, and cardiac performance. PLoS Biol. 4, e369 (2006).
56. D. Vats et al., Oxidative metabolism and PGC-1β attenuate macrophage-mediated inflammation. Cell Metab. 4, 13–24 (2006).
57. K. C. Carroll, B. Viollet, J. Suttles, AMPKα1 deficiency amplifies proinflammatory myeloid APC activity and CD40 signaling. J. Leukoc. Biol. 94, 1113–1121 (2013).
58. R. Mounier et al., AMPKα1 Regulates Macrophage Skewing at the Time of Resolution of Inflammation during Skeletal Muscle Regeneration. Cell Metab. 18, 251–264 (2013).
59. H. Ishikawa, G. N. Barber, STING is an endoplasmic reticulum adaptor that facilitates innate immune signalling. Nature. 455, 674–678 (2008).
REFERENCES
151
60. W. Sun et al., ERIS, an endoplasmic reticulum IFN stimulator, activates innate immune signaling through dimerization. Proc. Natl. Acad. Sci. U. S. A. 106, 8653–8658 (2009).
61. B. Zhong et al., The adaptor protein MITA links virus-sensing receptors to IRF3 transcription factor activation. Immunity. 29, 538–550 (2008).
62. O. Schmidt, N. Pfanner, C. Meisinger, Mitochondrial protein import: from proteomics to functional mechanisms. Nat. Rev. Mol. Cell Biol. 11, 655–667 (2010).
63. X.-Y. Liu, B. Wei, H.-X. Shi, Y.-F. Shan, C. Wang, Tom70 mediates activation of interferon regulatory factor 3 on mitochondria. Cell Res. 20, 994–1011 (2010).
64. C. B. Moore et al., NLRX1 is a regulator of mitochondrial antiviral immunity. Nature. 451, 573–577 (2008).
65. L. Xu, N. Xiao, F. Liu, H. Ren, J. Gu, Inhibition of RIG-I and MDA5-dependent antiviral response by gC1qR at mitochondria. Proc. Natl. Acad. Sci. U. S. A. 106, 1530–1535 (2009).
66. Y. Zhao et al., COX5B Regulates MAVS-mediated Antiviral Signaling through Interaction with ATG5 and Repressing ROS Production. PLOS Pathog. 8, e1003086 (2012).
67. M. C. Tal et al., Absence of autophagy results in reactive oxygen species-dependent amplification of RLR signaling. Proc. Natl. Acad. Sci. 106, 2770–2775 (2009).
68. A. Soucy-Faulkner et al., Requirement of NOX2 and Reactive Oxygen Species for Efficient RIG-I-Mediated Antiviral Response through Regulation of MAVS Expression. PLOS Pathog. 6, e1000930 (2010).
69. R. Zhou, A. S. Yazdi, P. Menu, J. Tschopp, A role for mitochondria in NLRP3 inflammasome activation. Nature. 469, 221–225 (2010).
70. T. Misawa et al., Microtubule-driven spatial arrangement of mitochondria promotes activation of the NLRP3 inflammasome. Nat. Immunol. 14, 454–460 (2013).
71. N. Subramanian, K. Natarajan, M. R. Clatworthy, Z. Wang, R. N. Germain, The Adaptor MAVS Promotes NLRP3 Mitochondrial Localization and Inflammasome Activation. Cell. 153, 348–361 (2013).
72. C. M. Cruz et al., ATP activates a reactive oxygen species-dependent oxidative stress response and secretion of proinflammatory cytokines in macrophages. J. Biol. Chem. 282, 2871–2879 (2007).
REFERENCES
152
73. R. Zhou, A. Tardivel, B. Thorens, I. Choi, J. Tschopp, Thioredoxin-interacting protein links oxidative stress to inflammasome activation. Nat. Immunol. 11, 136–140 (2010).
74. E. I. Elliott, F. S. Sutterwala, Initiation and perpetuation of NLRP3 inflammasome activation and assembly. Immunol. Rev. 265, 35–52 (2015).
75. S. S. Iyer et al., Mitochondrial Cardiolipin Is Required for Nlrp3 Inflammasome Activation. Immunity. 39, 311–323 (2013).
76. K. Nakahira et al., Autophagy proteins regulate innate immune responses by inhibiting the release of mitochondrial DNA mediated by the NALP3 inflammasome. Nat. Immunol. 12, 222–230 (2011).
77. K. Shimada et al., Oxidized mitochondrial DNA activates the NLRP3 inflammasome during apoptosis. Immunity. 36, 401–414 (2012).
78. T. Horng, Calcium signaling and mitochondrial destabilization in the triggering of the NLRP3 inflammasome. Trends Immunol., doi:10.1016/j.it.2014.02.007.
79. J. Yu et al., Inflammasome activation leads to Caspase-1-dependent mitochondrial damage and block of mitophagy. Proc. Natl. Acad. Sci. U. S. A. 111, 15514–15519 (2014).
80. Z. Zhong et al., NF-κB Restricts Inflammasome Activation via Elimination of Damaged Mitochondria. Cell. 164, 896–910 (2016).
81. D. N. Bronner et al., Endoplasmic Reticulum Stress Activates the Inflammasome via NLRP3- and Caspase-2-Driven Mitochondrial Damage. Immunity. 43, 451–462 (2015).
82. M. Lazarou, Keeping the immune system in check: a role for mitophagy. Immunol. Cell Biol. 93, 3–10 (2015).
83. A. Lepelley, S. Ghosh, Clean Up after Yourself. Mol. Cell. 61, 644–645 (2016).
84. M. Pelletier, T. S. Lepow, L. K. Billingham, M. P. Murphy, R. M. Siegel, New tricks from an old dog: Mitochondrial redox signaling in cellular inflammation. Semin. Immunol. 24, 384–392 (2012).
85. A. P. West et al., TLR signalling augments macrophage bactericidal activity through mitochondrial ROS. Nature. 472, 476–480 (2011).
86. R. O. Vogel et al., Cytosolic signaling protein Ecsit also localizes to mitochondria where it interacts with chaperone NDUFAF1 and functions in complex I assembly. Genes Dev. 21, 615–624 (2007).
REFERENCES
153
87. C. Nathan, A. Cunningham-Bussel, Beyond oxidative stress: an immunologist’s guide to reactive oxygen species. Nat. Rev. Immunol. 13, 349–361 (2013).
88. R. B. Hamanaka, N. S. Chandel, Mitochondrial reactive oxygen species regulate cellular signaling and dictate biological outcomes. Trends Biochem. Sci. 35, 505–513 (2010).
89. H. Kamata et al., Reactive Oxygen Species Promote TNFα-Induced Death and Sustained JNK Activation by Inhibiting MAP Kinase Phosphatases. Cell. 120, 649–661 (2005).
90. D. J. Levinthal, D. B. DeFranco, Reversible Oxidation of ERK-directed Protein Phosphatases Drives Oxidative Toxicity in Neurons. J. Biol. Chem. 280, 5875–5883 (2005).
91. H. S. Kim, S. L. Ullevig, D. Zamora, C. F. Lee, R. Asmis, Redox regulation of MAPK phosphatase 1 controls monocyte migration and macrophage recruitment. Proc. Natl. Acad. Sci. 109, E2803–E2812 (2012).
92. A. C. Bulua et al., Mitochondrial reactive oxygen species promote production of proinflammatory cytokines and are elevated in TNFR1-associated periodic syndrome (TRAPS). J. Exp. Med. 208, 519–533 (2011).
93. Z. Jin, W. Wei, M. Yang, Y. Du, Y. Wan, Mitochondrial Complex I Activity Suppresses Inflammation and Enhances Bone Resorption by Shifting Macrophage-Osteoclast Polarization. Cell Metab. 20, 483–498 (2014).
94. B. Kelly, G. M. Tannahill, M. P. Murphy, L. A. J. O’Neill, Metformin Inhibits the Production of Reactive Oxygen Species from NADH:Ubiquinone Oxidoreductase to Limit Induction of Interleukin-1β (IL-1β) and Boosts Interleukin-10 (IL-10) in Lipopolysaccharide (LPS)-activated Macrophages. J. Biol. Chem. 290, 20348–20359 (2015).
95. Y. Emre, T. Nübel, Uncoupling protein UCP2: when mitochondrial activity meets immunity. FEBS Lett. 584, 1437–1442 (2010).
96. T. Kizaki et al., Uncoupling protein 2 plays an important role in nitric oxide production of lipopolysaccharide-stimulated macrophages. Proc. Natl. Acad. Sci. 99, 9392–9397 (2002).
97. Y. Bai et al., Persistent Nuclear Factor-κB Activation in Ucp2-/- Mice Leads to Enhanced Nitric Oxide and Inflammatory Cytokine Production. J. Biol. Chem. 280, 19062–19069 (2005).
REFERENCES
154
98. S. Rousset et al., The uncoupling protein 2 modulates the cytokine balance in innate immunity. Cytokine. 35, 135–142 (2006).
99. D. Arsenijevic et al., Disruption of the uncoupling protein-2 gene in mice reveals a role in immunity and reactive oxygen species production. Nat. Genet. 26, 435–439 (2000).
100. W. B. Ball et al., Uncoupling Protein 2 Negatively Regulates Mitochondrial Reactive Oxygen Species Generation and Induces Phosphatase-Mediated Anti-Inflammatory Response in Experimental Visceral Leishmaniasis. J. Immunol. 187, 1322–1332 (2011).
101. Y. Emre et al., Mitochondria contribute to LPS-induced MAPK activation via uncoupling protein UCP2 in macrophages. Biochem. J. 402, 271–278 (2007).
102. D. C. Chan, Mitochondrial fusion and fission in mammals. Annu. Rev. Cell Dev. Biol. 22, 79–99 (2006).
103. S. A. Detmer, D. C. Chan, Functions and dysfunctions of mitochondrial dynamics. Nat. Rev. Mol. Cell Biol. 8, 870–879 (2007).
104. O. M. de Brito, L. Scorrano, Mitofusin 2: a mitochondria-shaping protein with signaling roles beyond fusion. Antioxid. Redox Signal. 10, 621–633 (2008).
105. A. Zorzano, M. Liesa, D. Sebastián, J. Segalés, M. Palacín, Mitochondrial fusion proteins: Dual regulators of morphology and metabolism. Semin. Cell Dev. Biol. 21, 566–574 (2010).
106. A. Zorzano, M. I. Hernández-Alvarez, D. Sebastián, J. P. Muñoz, Mitofusin 2 as a Driver That Controls Energy Metabolism and Insulin Signaling. Antioxid. Redox Signal. 22, 1020–1031 (2015).
107. M. Liesa, M. Palacín, A. Zorzano, Mitochondrial Dynamics in Mammalian Health and Disease. Physiol. Rev. 89, 799–845 (2009).
108. B. Westermann, Mitochondrial fusion and fission in cell life and death. Nat. Rev. Mol. Cell Biol. 11, 872–884 (2010).
109. T. Wai, T. Langer, Mitochondrial Dynamics and Metabolic Regulation. Trends Endocrinol. Metab. 27, 105–117 (2016).
110. E. Schrepfer, L. Scorrano, Mitofusins, from Mitochondria to Metabolism. Mol. Cell. 61, 683–694 (2016).
111. A. B. Knott, G. Perkins, R. Schwarzenbacher, E. Bossy-Wetzel, Mitochondrial fragmentation in neurodegeneration. Nat. Rev. Neurosci. 9, 505–518 (2008).
112. H. Chen, D. C. Chan, Mitochondrial dynamics in mammals. Curr. Top. Dev. Biol. 59, 119–144 (2004).
REFERENCES
155
113. H. Chen et al., Mitofusins Mfn1 and Mfn2 coordinately regulate mitochondrial fusion and are essential for embryonic development. J. Cell Biol. 160, 189–200 (2003).
114. D. C. Chan, Annu. Rev. Genet., in press, doi:10.1146/annurev-genet-110410-132529.
115. C. Delettre et al., Nuclear gene OPA1, encoding a mitochondrial dynamin-related protein, is mutated in dominant optic atrophy. Nat. Genet. 26, 207–210 (2000).
116. C. Alexander et al., OPA1, encoding a dynamin-related GTPase, is mutated in autosomal dominant optic atrophy linked to chromosome 3q28. Nat. Genet. 26, 211–215 (2000).
117. S. Meeusen, J. M. McCaffery, J. Nunnari, Mitochondrial Fusion Intermediates Revealed in Vitro. Science. 305, 1747–1752 (2004).
118. F. Malka et al., Separate fusion of outer and inner mitochondrial membranes. EMBO Rep. 6, 853–859 (2005).
119. H. Otera, K. Mihara, Molecular Mechanisms and Physiologic Functions of Mitochondrial Dynamics. J. Biochem. (Tokyo) (2011), doi:10.1093/jb/mvr002.
120. P. Mishra, D. C. Chan, Mitochondrial dynamics and inheritance during cell division, development and disease. Nat. Rev. Mol. Cell Biol. 15, 634–646 (2014).
121. T. Klecker, S. Böckler, B. Westermann, Making connections: interorganelle contacts orchestrate mitochondrial behavior. Trends Cell Biol. 24, 537–545 (2014).
122. K. Mitra, C. Wunder, B. Roysam, G. Lin, J. Lippincott-Schwartz, A Hyperfused Mitochondrial State Achieved at G1–S Regulates Cyclin E Buildup and Entry into S Phase. Proc. Natl. Acad. Sci. (2009), doi:10.1073/pnas.0904875106.
123. R. J. Youle, A. M. van der Bliek, Mitochondrial Fission, Fusion, and Stress. Science. 337, 1062–1065 (2012).
124. Y. Kim et al., PINK1 controls mitochondrial localization of Parkin through direct phosphorylation. Biochem. Biophys. Res. Commun. 377, 975–980 (2008).
125. A. Tanaka et al., Proteasome and p97 mediate mitophagy and degradation of mitofusins induced by Parkin. J. Cell Biol. 191, 1367–1380 (2010).
126. M. A. Kluge, J. L. Fetterman, J. A. Vita, Mitochondria and Endothelial Function. Circ. Res. 112, 1171–1188 (2013).
REFERENCES
156
127. H. Chen, A. Chomyn, D. C. Chan, Disruption of Fusion Results in Mitochondrial Heterogeneity and Dysfunction. J. Biol. Chem. 280, 26185–26192 (2005).
128. N. Ishihara, Y. Eura, K. Mihara, Mitofusin 1 and 2 play distinct roles in mitochondrial fusion reactions via GTPase activity. J. Cell Sci. 117, 6535–6546 (2004).
129. M. Ranieri et al., Mitochondrial Fusion Proteins and Human Diseases. Neurol. Res. Int. 2013, e293893 (2013).
130. S. Cipolat, O. Martins de Brito, B. Dal Zilio, L. Scorrano, OPA1 requires mitofusin 1 to promote mitochondrial fusion. Proc. Natl. Acad. Sci. U. S. A. 101, 15927–15932 (2004).
131. A. Zorzano, S. Pich, What is the biological significance of the two mitofusin proteins present in the outer mitochondrial membrane of mammalian cells? IUBMB Life. 58, 441–443 (2006).
132. D. Bach et al., Mitofusin-2 Determines Mitochondrial Network Architecture and Mitochondrial Metabolism A NOVEL REGULATORY MECHANISM ALTERED IN OBESITY. J. Biol. Chem. 278, 17190–17197 (2003).
133. S. Pich et al., The Charcot-Marie-Tooth type 2A gene product, Mfn2, up-regulates fuel oxidation through expression of OXPHOS system. Hum. Mol. Genet. 14, 1405–1415 (2005).
134. A. Mourier et al., Mitofusin 2 is required to maintain mitochondrial coenzyme Q levels. J. Cell Biol. 208, 429–442 (2015).
135. D. Bach et al., Expression of Mfn2, the Charcot-Marie-Tooth neuropathy type 2A gene, in human skeletal muscle: effects of type 2 diabetes, obesity, weight loss, and the regulatory role of tumor necrosis factor alpha and interleukin-6. Diabetes. 54, 2685–2693 (2005).
136. R. Cartoni et al., Mitofusins 1/2 and ERRalpha expression are increased in human skeletal muscle after physical exercise. J. Physiol. 567, 349–358 (2005).
137. O. M. de Brito, L. Scorrano, Mitofusin 2 tethers endoplasmic reticulum to mitochondria. Nature. 456, 605–610 (2008).
138. J. P. Muñoz et al., Mfn2 modulates the UPR and mitochondrial function via repression of PERK. EMBO J. 32, 2348–2361 (2013).
139. D. Sebastián et al., Mitofusin 2 (Mfn2) links mitochondrial and endoplasmic reticulum function with insulin signaling and is essential
REFERENCES
157
for normal glucose homeostasis. Proc. Natl. Acad. Sci. 109, 5523–5528 (2012).
140. K.-H. Chen et al., FASEB J., in press, doi:10.1096/fj.13-230037. 141. X. Cheng, D. Zhou, J. Wei, J. Lin, Cell-cycle arrest at G2/M and
proliferation inhibition by adenovirus-expressed mitofusin-2 gene in human colorectal cancer cell lines. Neoplasma. 60, 620–626 (2013).
142. K.-H. Chen et al., Dysregulation of HSG triggers vascular proliferative disorders. Nat. Cell Biol. 6, 872–883 (2004).
143. S. Lee et al., Mitochondrial fission and fusion mediators, hFis1 and OPA1, modulate cellular senescence. J. Biol. Chem. 282, 22977–22983 (2007).
144. C. Peng et al., Mitofusin 2 ameliorates hypoxia-induced apoptosis via mitochondrial function and signaling pathways. Int. J. Biochem. Cell Biol. 69, 29–40 (2015).
145. W. Zhang, C. Shu, Q. Li, M. Li, X. Li, Adiponectin affects vascular smooth muscle cell proliferation and apoptosis through modulation of the mitofusin-2-mediated Ras-Raf-Erk1/2 signaling pathway. Mol. Med. Rep. 12, 4703–4707 (2015).
146. M. Karbowski, K. L. Norris, M. M. Cleland, S.-Y. Jeong, R. J. Youle, Role of Bax and Bak in mitochondrial morphogenesis. Nature. 443, 658–662 (2006).
147. K. Yasukawa et al., Sci Signal, in press, doi:10.1126/scisignal.2000287. 148. C. Castanier, D. Garcin, A. Vazquez, D. Arnoult, Mitochondrial
dynamics regulate the RIG-I-like receptor antiviral pathway. EMBO Rep. 11, 133–138 (2010).
149. K. Onoguchi et al., Virus-Infection or 5′ppp-RNA Activates Antiviral Signal through Redistribution of IPS-1 Mediated by MFN1. PLoS Pathog. 6, e1001012 (2010).
150. T. Koshiba, K. Yasukawa, Y. Yanagi, S. Kawabata, Sci Signal, in press, doi:10.1126/scisignal.2001147.
151. C.-Y. Yu et al., Dengue Virus Impairs Mitochondrial Fusion by Cleaving Mitofusins. PLOS Pathog. 11, e1005350 (2015).
152. T. Ichinohe, T. Yamazaki, T. Koshiba, Y. Yanagi, Mitochondrial protein mitofusin 2 is required for NLRP3 inflammasome activation after RNA virus infection. Proc. Natl. Acad. Sci., 201312571 (2013).
153. S. Park et al., Defective mitochondrial fission augments NLRP3 inflammasome activation. Sci. Rep. 5, 15489 (2015).
REFERENCES
158
154. B. E. Clausen, C. Burkhardt, W. Reith, R. Renkawitz, I. Förster, Conditional gene targeting in macrophages and granulocytes using LysMcre mice. Transgenic Res. 8, 265–277 (1999).
155. A. Celada et al., The transcription factor PU.1 is involved in macrophage proliferation. J. Exp. Med. 184, 61–69 (1996).
156. A. Ray, B. N. Dittel, Isolation of Mouse Peritoneal Cavity Cells. JoVE J. Vis. Exp., e1488–e1488 (2010).
157. S. Pereira-Lopes et al., NBS1 is required for macrophage homeostasis and functional activity in mice. Blood. 126, 2502–2510 (2015).
158. A. Classen, J. Lloberas, A. Celada, Macrophage activation: classical versus alternative. Methods Mol. Biol. Clifton NJ. 531, 29–43 (2009).
159. S. A. Bustin et al., The MIQE guidelines: minimum information for publication of quantitative real-time PCR experiments. Clin. Chem. 55, 611–622 (2009).
160. J. Hellemans, G. Mortier, A. De Paepe, F. Speleman, J. Vandesompele, qBase relative quantification framework and software for management and automated analysis of real-time quantitative PCR data. Genome Biol. 8, R19 (2007).
161. R. J. Callicott, J. E. Womack, Real-time PCR Assay for Measurement of Mouse Telomeres. Comp. Med. 56, 17–22 (2006).
162. J. Schindelin et al., Fiji: an open-source platform for biological-image analysis. Nat. Methods. 9, 676–682 (2012).
163. J. A. Carrero, H. Vivanco-Cid, E. R. Unanue, Listeriolysin O Is Strongly Immunogenic Independently of Its Cytotoxic Activity. PLOS ONE. 7, e32310 (2012).
164. M. Bonneville et al., Skin contact irritation conditions the development and severity of allergic contact dermatitis. J. Invest. Dermatol. 127, 1430–1435 (2007).
165. A. Bernadotte, V. M. Mikhelson, I. M. Spivak, Markers of cellular senescence. Telomere shortening as a marker of cellular senescence. Aging. 8, 3–11 (2016).
166. E. Sahin, R. A. DePinho, Axis of ageing: telomeres, p53 and mitochondria. Nat. Rev. Mol. Cell Biol. 13, 397–404 (2012).
167. A. R. Hall et al., Hearts deficient in both Mfn1 and Mfn2 are protected against acute myocardial infarction. Cell Death Dis. 7, e2238 (2016).
168. H. Chen et al., Mitochondrial Fusion Is Required for mtDNA Stability in Skeletal Muscle and Tolerance of mtDNA Mutations. Cell. 141, 280–289 (2010).
REFERENCES
159
169. S. W. Perry, J. P. Norman, J. Barbieri, E. B. Brown, H. A. Gelbard, Mitochondrial membrane potential probes and the proton gradient: a practical usage guide. BioTechniques. 50, 98–115 (2011).
170. J. P. Muñoz, A. Zorzano, Mfn2 modulates the unfolded protein response. Cell Cycle Georget. Tex. 13, 491–492 (2014).
171. G. A. Ngoh, K. N. Papanicolaou, K. Walsh, Loss of Mitofusin 2 Promotes Endoplasmic Reticulum Stress. J. Biol. Chem. 287, 20321–20332 (2012).
172. S. E. Bettigole, L. H. Glimcher, Endoplasmic Reticulum Stress in Immunity. Annu. Rev. Immunol. 33, 107–138 (2015).
173. G. S. Hotamisligil, Endoplasmic Reticulum Stress and the Inflammatory Basis of Metabolic Disease. Cell. 140, 900–917 (2010).
174. M. Rath, I. Müller, P. Kropf, E. I. Closs, M. Munder, Metabolism via Arginase or Nitric Oxide Synthase: Two Competing Arginine Pathways in Macrophages. Front. Immunol. 5, 532 (2014).
175. Y. Ding, H. Gao, L. Zhao, X. Wang, M. Zheng, Mitofusin 2-Deficiency Suppresses Cell Proliferation through Disturbance of Autophagy. PLOS ONE. 10, e0121328 (2015).
176. G. Mariño, M. Niso-Santano, E. H. Baehrecke, G. Kroemer, Self-consumption: the interplay of autophagy and apoptosis. Nat. Rev. Mol. Cell Biol. 15, 81–94 (2014).
177. J. M. Gump, A. Thorburn, Autophagy and apoptosis- what’s the connection? Trends Cell Biol. 21, 387–392 (2011).
178. M. C. Maiuri, E. Zalckvar, A. Kimchi, G. Kroemer, Self-eating and self-killing: crosstalk between autophagy and apoptosis. Nat. Rev. Mol. Cell Biol. 8, 741–752 (2007).
179. S.-H. Lee, X. W. Meng, K. S. Flatten, D. A. Loegering, S. H. Kaufmann, Phosphatidylserine exposure during apoptosis reflects bidirectional trafficking between plasma membrane and cytoplasm. Cell Death Differ. 20, 64–76 (2013).
180. D. L. Bonilla et al., Autophagy Regulates Phagocytosis by Modulating the Expression of Scavenger Receptors. Immunity. 39, 537–547 (2013).
181. L. Peiser, P. J. Gough, T. Kodama, S. Gordon, Macrophage Class A Scavenger Receptor-Mediated Phagocytosis of Escherichia coli: Role of Cell Heterogeneity, Microbial Strain, and Culture Conditions In Vitro. Infect. Immun. 68, 1953–1963 (2000).
REFERENCES
160
182. S. E. Doyle et al., Toll-like Receptors Induce a Phagocytic Gene Program through p38. J. Exp. Med. 199, 81–90 (2004).
183. I. K. H. Poon, C. D. Lucas, A. G. Rossi, K. S. Ravichandran, Apoptotic cell clearance: basic biology and therapeutic potential. Nat. Rev. Immunol. 14, 166–180 (2014).
184. D. A. Portnoy, V. Auerbuch, I. J. Glomski, The cell biology of Listeria monocytogenes infection. J. Cell Biol. 158, 409–414 (2002).
185. A. O’Garra et al., The Immune Response in Tuberculosis. Annu. Rev. Immunol. 31, 475–527 (2013).
186. J. Weischenfeldt, B. Porse, Cold Spring Harb. Protoc., in press, doi:10.1101/pdb.prot5080.
187. C. A. Janeway, R. Medzhitov, Innate immune recognition. Annu. Rev. Immunol. 20, 197–216 (2002).
188. F. O. Martinez, S. Gordon, The M1 and M2 paradigm of macrophage activation: time for reassessment. F1000Prime Rep. 6 (2014), doi:10.12703/P6-13.
189. N. Makita, Y. Hizukuri, K. Yamashiro, M. Murakawa, Y. Hayashi, IL-10 enhances the phenotype of M2 macrophages induced by IL-4 and confers the ability to increase eosinophil migration. Int. Immunol. 27, 131–141 (2015).
190. P. Maderna, C. Godson, Phagocytosis of apoptotic cells and the resolution of inflammation. Biochim. Biophys. Acta BBA - Mol. Basis Dis. 1639, 141–151 (2003).
191. J. Li et al., Anti-inflammatory response following uptake of apoptotic bodies by meningothelial cells. J. Neuroinflammation. 11, 35 (2014).
192. S. N. Greenhalgh, K. P. Conroy, N. C. Henderson, Cre-ativity in the liver: Transgenic approaches to targeting hepatic nonparenchymal cells. Hepatol. Baltim. Md. 61, 2091–2099 (2015).
193. T. Goldmann et al., A new type of microglia gene targeting shows TAK1 to be pivotal in CNS autoimmune inflammation. Nat. Neurosci. 16, 1618–1626 (2013).
194. C. L. Abram, G. L. Roberge, Y. Hu, C. A. Lowell, Comparative analysis of the efficiency and specificity of myeloid-Cre deleting strains using ROSA-EYFP reporter mice. J. Immunol. Methods. 408, 89–100 (2014).
195. H. Iwasaki, K. Akashi, Myeloid Lineage Commitment from the Hematopoietic Stem Cell. Immunity. 26, 726–740 (2007).
196. D. Fang, S. Yan, Q. Yu, D. Chen, S. S. Yan, Mfn2 is Required for Mitochondrial Development and Synapse Formation in Human
REFERENCES
161
Induced Pluripotent Stem Cells/hiPSC Derived Cortical Neurons. Sci. Rep. 6, 31462 (2016).
197. A. Kasahara, S. Cipolat, Y. Chen, G. W. Dorn, L. Scorrano, Mitochondrial fusion directs cardiomyocyte differentiation via calcineurin and Notch signaling. Science. 342, 734–737 (2013).
198. K. N. Papanicolaou et al., Mitofusin-2 Maintains Mitochondrial Structure and Contributes to Stress-Induced Permeability Transition in Cardiac Myocytes. Mol. Cell. Biol. 31, 1309–1328 (2011).
199. N. Zhao, Y. Zhang, Q. Liu, W. Xiang, Mfn2 Affects Embryo Development via Mitochondrial Dysfunction and Apoptosis. PLOS ONE. 10, e0125680 (2015).
200. F. X. Soriano et al., Evidence for a Mitochondrial Regulatory Pathway Defined by Peroxisome Proliferator–Activated Receptor-γ Coactivator-1α, Estrogen-Related Receptor-α, and Mitofusin 2. Diabetes. 55, 1783–1791 (2006).
201. N. R. Madamanchi, M. S. Runge, Mitochondrial Dysfunction in Atherosclerosis. Circ. Res. 100, 460–473 (2007).
202. M. Ohashi, M. S. Runge, F. M. Faraci, D. D. Heistad, MnSOD deficiency increases endothelial dysfunction in ApoE-deficient mice. Arterioscler. Thromb. Vasc. Biol. 26, 2331–2336 (2006).
203. X. Li et al., Targeting mitochondrial reactive oxygen species as novel therapy for inflammatory diseases and cancers. J. Hematol. Oncol.J Hematol Oncol. 6, 19 (2013).
204. L. J. Toime, M. D. Brand, Uncoupling protein-3 lowers reactive oxygen species production in isolated mitochondria. Free Radic. Biol. Med. 49, 606–611 (2010).
205. J. P. Brennan et al., Mitochondrial uncoupling, with low concentration FCCP, induces ROS-dependent cardioprotection independent of KATP channel activation. Cardiovasc. Res. 72, 313–321 (2006).
206. K.-U. Lee et al., Effects of recombinant adenovirus-mediated uncoupling protein 2 overexpression on endothelial function and apoptosis. Circ. Res. 96, 1200–1207 (2005).
207. M. A. Aon, S. Cortassa, B. O’Rourke, Redox-optimized ROS balance: a unifying hypothesis. Biochim. Biophys. Acta. 1797, 865–877 (2010).
208. E. A. Bordt, B. M. Polster, NADPH oxidase- and mitochondria-derived reactive oxygen species in proinflammatory microglial activation: a bipartisan affair? Free Radic. Biol. Med. 76, 34–46 (2014).
REFERENCES
162
209. S. Dikalov, Crosstalk between mitochondria and NADPH oxidases. Free Radic. Biol. Med. 51, 1289–1301 (2011).
210. J. Garaude et al., Mitochondrial respiratory-chain adaptations in macrophages contribute to antibacterial host defense. Nat. Immunol. advance online publication (2016), doi:10.1038/ni.3509.
211. X. Gan et al., Oxidative stress-mediated activation of extracellular signal-regulated kinase contributes to mild cognitive impairment-related mitochondrial dysfunction. Free Radic. Biol. Med. 75, 230–240 (2014).
212. M. Song et al., Super-Suppression of Mitochondrial ROS Signaling Impairs Compensatory Autophagy in Primary Mitophagic Cardiomyopathy. Circ. Res. 115, 348–353 (2014).
213. Y. Chen et al., Mitofusin 2-Containing Mitochondrial-Reticular Microdomains Direct Rapid Cardiomyocyte Bioenergetic Responses Via Interorganelle Ca2+ CrosstalkNovelty and Significance. Circ. Res. 111, 863–875 (2012).
214. C. P. Baines et al., Mitochondrial PKCepsilon and MAPK form signaling modules in the murine heart: enhanced mitochondrial PKCepsilon-MAPK interactions and differential MAPK activation in PKCepsilon-induced cardioprotection. Circ. Res. 90, 390–397 (2002).
215. M. Alonso et al., Mitochondrial extracellular signal-regulated kinases 1/2 (ERK1/2) are modulated during brain development. J. Neurochem. 89, 248–256 (2004).
216. J.-H. Zhu, F. Guo, J. Shelburne, S. Watkins, C. T. Chu, Localization of Phosphorylated ERK/MAP Kinases to Mitochondria and Autophagosomes in Lewy Body Diseases. Brain Pathol. Zurich Switz. 13, 473–481 (2003).
217. M. M. Monick et al., Constitutive ERK MAPK activity regulates macrophage ATP production and mitochondrial integrity. J. Immunol. Baltim. Md 1950. 180, 7485–7496 (2008).
218. C. Horbinski, C. T. Chu, Kinase signaling cascades in the mitochondrion: a matter of life or death. Free Radic. Biol. Med. 38, 2–11 (2005).
219. M. W. Epperly et al., Manganese superoxide dismutase (SOD2) inhibits radiation-induced apoptosis by stabilization of the mitochondrial membrane. Radiat. Res. 157, 568–577 (2002).
REFERENCES
163
220. J. Park et al., Mitochondrial ROS govern the LPS-induced pro-inflammatory response in microglia cells by regulating MAPK and NF-κB pathways. Neurosci. Lett. 584, 191–196 (2015).
221. Y. Son et al., Mitogen-Activated Protein Kinases and Reactive Oxygen Species: How Can ROS Activate MAPK Pathways? J. Signal Transduct. 2011, e792639 (2011).
222. M. Comalada, J. Lloberas, A. Celada, MKP-1: A critical phosphatase in the biology of macrophages controlling the switch between proliferation and activation. Eur. J. Immunol. 42, 1938–1948 (2012).
223. G. Gloire, S. Legrand-Poels, J. Piette, NF-κB activation by reactive oxygen species: Fifteen years later. Biochem. Pharmacol. 72, 1493–1505 (2006).
224. T. Zhao et al., Central Role of Mitofusin 2 in Autophagosome-Lysosome Fusion in Cardiomyocytes. J. Biol. Chem. 287, 23615–23625 (2012).
225. A. F. Valledor, M. Comalada, L. F. Santamaría-Babi, J. Lloberas, A. Celada, Macrophage proinflammatory activation and deactivation: a question of balance. Adv. Immunol. 108, 1–20 (2010).
226. D. M. E. Bowdish, S. Gordon, Conserved domains of the class A scavenger receptors: evolution and function. Immunol. Rev. 227, 19–31 (2009).
227. F. Wermeling et al., Class A scavenger receptors regulate tolerance against apoptotic cells, and autoantibodies against these receptors are predictive of systemic lupus. J. Exp. Med. 204, 2259–2265 (2007).
228. S. Gordon, Phagocytosis: An Immunobiologic Process. Immunity. 44, 463–475 (2016).
229. L. M. Shaughnessy, J. A. Swanson, THE ROLE OF THE ACTIVATED MACROPHAGE IN CLEARING LISTERIA MONOCYTOGENES INFECTION. Front. Biosci. J. Virtual Libr. 12, 2683–2692 (2007).
230. S. Li, G. Chen, M. Wu, J. Zhang, S. Wu, FEMS Microbiol. Lett., in press, doi:10.1093/femsle/fnv228.
231. D. Saini et al., Ultra-low Dose of Mycobacterium tuberculosis Aerosol Creates Partial Infection in Mice. Tuberc. Edinb. Scotl. 92, 160–165 (2012).
232. F. J. Roca, L. Ramakrishnan, TNF Dually Mediates Resistance and Susceptibility to Mycobacteria via Mitochondrial Reactive Oxygen Species. Cell. 153, 521–534 (2013).

REFERENCES
164
233. H. Watanabe et al., Danger Signaling through the Inflammasome Acts as a Master Switch between Tolerance and Sensitization. J. Immunol. 180, 5826–5832 (2008).

ANNEXES

ANNEXES
167
Annex 1. Scientific Publications
Publications
• Lloberas, J., Valverde-Estrella, L., Tur, J., Vico, T., and Celada, A. (2016). Mitogen-Activated Protein Kinases and Mitogen Kinase Phosphatase 1: A Critical Interplay in Macrophage Biology. Front. Mol. Biosci. 3. (Impact factor: 3.523).
• Pereira-Lopes, S., Tur, J., Calatayud-Subias, J.A., Lloberas, J., Stracker, T.H., and Celada, A. (2015). NBS1 is required for macrophage homeostasis and functional activity in mice. Blood 126, 2502–2510. (Impact factor: 11.841)
Publications in preparation or in press
• Lloberas, J., Tur, J., Vico, T., and Celada, A. (2016). Molecular and cellular aspects of macrophage aging. Handbook of Immunosenescence: Basic Understanding and Clinical Applications (In press).
• Tur, J., Vico, T., Lloberas, J., Zorzano, A., and Celada, A. (2016). Macrophages and mitochondria: a critical relationship between metabolism, signaling, and the functional activity. Advances in Immunology (In press)
• Tur, J., Pereira-Lopes, S., Vico, T., Muñoz, J.P., Zorzano, A., Lloberas, J., and Celada, A. (2016). The mitochondrial protein Mfn2 is crucial for ROS production and inflammation. (Manuscript in preparation)

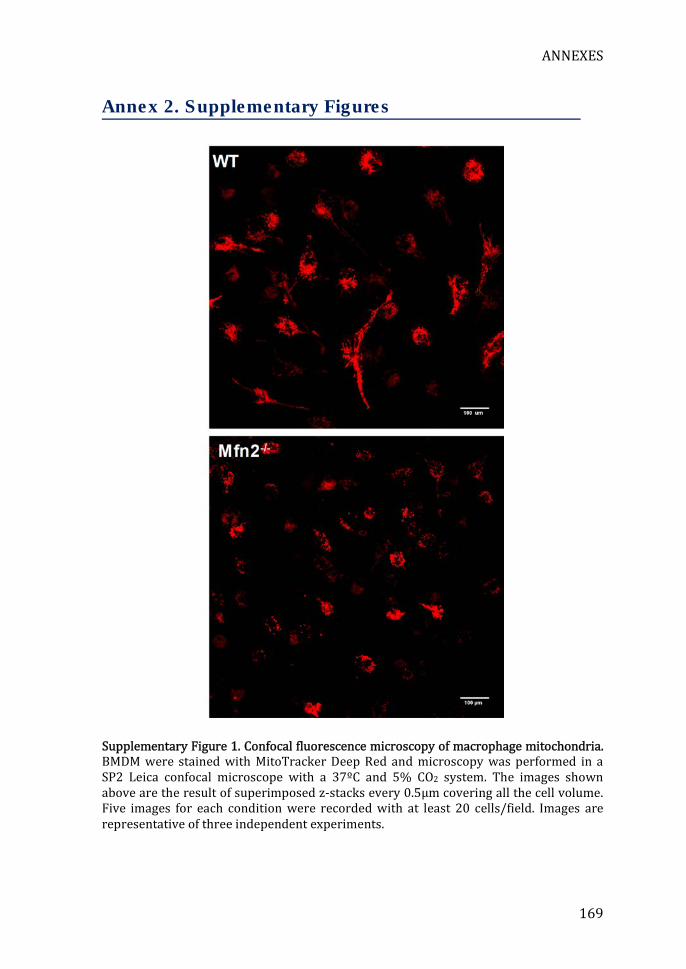
ANNEXES
169
Annex 2. Supplementary Figures
Supplementary Figure 1. Confocal fluorescence microscopy of macrophage mitochondria. BMDM were stained with MitoTracker Deep Red and microscopy was performed in a SP2 Leica confocal microscope with a 37ºC and 5% CO2 system. The images shown above are the result of superimposed z-stacks every 0.5µm covering all the cell volume. Five images for each condition were recorded with at least 20 cells/field. Images are representative of three independent experiments.