Synthesis and Characterization of Anticorrosive Coatings ...
14
Int. J. Electrochem. Sci., 9 (2014) 4144 - 4157 International Journal of ELECTROCHEMICAL SCIENCE www.electrochemsci.org Synthesis and Characterization of Anticorrosive Coatings of SiO 2 -TiO 2 - ZrO 2 Obtained from Sol-Gel Suspensions J. Bautista-Ruiz 1 , W. Aperador 2,* , A. Delgado 2 , M. Díaz – Lagos 3 1 Facultad de Ciencias. Universidad Francisco de Paula Santander, San José de Cúcuta, Colombia. 2 Facultad de Ingeniería. Universidad Militar Nueva Granada, Carrera 11 No. 101-80, Fax:+57(1) 6343200, Bogotá, Colombia. 3 Facultad Seccional Sogamoso- Ingeniería Geológica, Universidad Pedagógica y Tecnológica de Colombia, Calle 4 Sur No.15 -134 Sogamoso-Boyacá-Colombia. * E-mail: [email protected] Received: 13 February 2014 / Accepted: 3 April 2014 / Published: 19 May 2014 The work presented is concerned with the synthesis and characterization ofSiO 2 -TiO 2 -ZrO 2 stable soles synthesized via sol-gel chemistry. The ternary system were formed in concentrations Si/Ti/Zr: 10/70/20 and Si/Ti/Zr: 10/20/70 using as precursors tetraethyl orthosilicate Si (OC 2 H 5 ) 4 , titanium tetrabutoxide Ti(OBu) 4 and zirconium tetrabutoxide Zr (OC 3 H 7 ) 4 , ethanol (EtOH) and water as solvents, and as complexing 2,4-pentanedione. Characterization of the product was carried out by means of Fourier transform infrared (FT-IR).To investigate the influence of the titanium precursor concentration and determined functional groups presented in the resultant composites. Techniques of Electrochemical Impedance Spectroscopy (EIS) and Tafel curves have been applied with the aim to identify the possibleinfluence of the coatings on the anticorrosive behavior of the steel substrates AISI/SAE 304 in a solution of Hydrocloric Acid-HCl to a concentration of 3%. In particular, we found that for high concentrations of titanium, and low of zirconium, it catalyzes the condensation of silanols. This warrants an adequate mixture of the cations and excludes phase separation in the system. The obtained composites showed that the values of the electrochemical parameters changed substantially with the number of layers deposited on the substrate. Additionally, analysis with complementary techniques to evaluate the micro-hardness of these anticorrosive coatings, have showed that these present variations in their values depending on the concentration and the number of layers applied to the substrate. Keywords: sol-gel, FTIR analysis, chemical analysis, electrochemical techniques, microhardness. 1. INTRODUCTION The sol-gel method is a process of synthesis of materials currently of great interest [1-5]. This procedure consists of three main parts: a) the preparation of the sol, b) gelation of the same, and c)
Transcript of Synthesis and Characterization of Anticorrosive Coatings ...
Int. J. Electrochem. Sci., 9 (2014) 4144 - 4157
International Journal of
ELECTROCHEMICAL SCIENCE
www.electrochemsci.org
Synthesis and Characterization of Anticorrosive Coatings of
SiO2 -TiO2 - ZrO2 Obtained from Sol-Gel Suspensions
J. Bautista-Ruiz1, W. Aperador
2,*, A. Delgado
2, M. Díaz – Lagos
3
1 Facultad de Ciencias. Universidad Francisco de Paula Santander, San José de Cúcuta, Colombia.
2 Facultad de Ingeniería. Universidad Militar Nueva Granada, Carrera 11 No. 101-80, Fax:+57(1)
6343200, Bogotá, Colombia. 3Facultad Seccional Sogamoso- Ingeniería Geológica, Universidad Pedagógica y Tecnológica de
Colombia, Calle 4 Sur No.15 -134 Sogamoso-Boyacá-Colombia. *E-mail: [email protected]
Received: 13 February 2014 / Accepted: 3 April 2014 / Published: 19 May 2014
The work presented is concerned with the synthesis and characterization ofSiO2-TiO2-ZrO2 stable
soles synthesized via sol-gel chemistry. The ternary system were formed in concentrations Si/Ti/Zr:
10/70/20 and Si/Ti/Zr: 10/20/70 using as precursors tetraethyl orthosilicate Si (OC2H5)4, titanium
tetrabutoxide Ti(OBu)4 and zirconium tetrabutoxide Zr (OC3H7)4, ethanol (EtOH) and water as
solvents, and as complexing 2,4-pentanedione. Characterization of the product was carried out by
means of Fourier transform infrared (FT-IR).To investigate the influence of the titanium precursor
concentration and determined functional groups presented in the resultant composites. Techniques of
Electrochemical Impedance Spectroscopy (EIS) and Tafel curves have been applied with the aim to
identify the possibleinfluence of the coatings on the anticorrosive behavior of the steel substrates
AISI/SAE 304 in a solution of Hydrocloric Acid-HCl to a concentration of 3%. In particular, we found
that for high concentrations of titanium, and low of zirconium, it catalyzes the condensation of
silanols. This warrants an adequate mixture of the cations and excludes phase separation in the system.
The obtained composites showed that the values of the electrochemical parameters changed
substantially with the number of layers deposited on the substrate. Additionally, analysis with
complementary techniques to evaluate the micro-hardness of these anticorrosive coatings, have
showed that these present variations in their values depending on the concentration and the number of
layers applied to the substrate.
Keywords: sol-gel, FTIR analysis, chemical analysis, electrochemical techniques, microhardness.
1. INTRODUCTION
The sol-gel method is a process of synthesis of materials currently of great interest [1-5]. This
procedure consists of three main parts: a) the preparation of the sol, b) gelation of the same, and c)
Int. J. Electrochem. Sci., Vol. 9, 2014
4145
removing the solvents [2,5]. Sols can be made from inorganic salts or molecular precursors known as
metal alkoxides. In the system, they form a molecular network due to condensation reactions of mainly
hydrolyzed, and the microstructure, which is strongly formed depending on the experimental
conditions. Molecular precursor hydrolysis and reaction with water are usually performed in the
presence of an acidic or basic catalyst which allows control of the rate and extent of the hydrolysis
reaction [5,6].
This technology has been widely applied in different fields of materials science, from purely
inorganic materials to organic and biological systems allowing the development of biosensors [7], bulk
insulators [8], superconductors [9], fuel cells [10], ceramic composites [11], and other materials, under
a wide range of compositions.
In the present study, ternary system SiO2-TiO2-ZrO2 was synthesized via sol-gel method at
room temperature. These stable soles were formed in concentrations Si/Ti/Zr: 10/70/20 and Si/Ti/Zr:
10/20/70 using as precursors tetraethyl orthosilicate Si (OC2H5)4, titanium tetrabutoxide Ti (OBu)4 and
zirconium tetrabutoxide Zr (OC3H7)4, ethanol (EtOH) and water as solvents, and as complexing 2,4-
pentanedione. Here, we will focus on the structural changes caused by the sols formed with three
different concentrations of the precursors and identified functional groups ternary systems using
Fourier transform infrared spectroscopy (FT-IR). This technique has become an essential tool for
obtaining structural information of organic substances, in addition, it provide qualitative and
quantitative information. At the qualitative level it would identify the presence of specific functional
groups that would be difficult to find using other conventional tests. The spectra are formed, in most
cases, by broad bands generated by a possible overlap of different vibrational modes. Interpreting such
spectra is carried out by determining certain parameters of the bands which determine the actual
experimental profile shape. These parameters are mainly: the frequency of the maximum, the
maximum and the average width of the band.
In addition, the main characteristic of stainless steel is its high resistance to corrosion [12], but
when getting in contact with Cl- and Br
-, they undergo of corrosion because of pitting [1]. The
procedure Sol-gel is one of the methods of synthesis of materials that presents great interest at the
present time [12, 13]; by means of this method, it is possible to obtain ceramic coatings that act as an
anticorrosive barrier. Research projects carried out on this topic have indicated that Sol-gel method has
allowed applying binary systems (SiO2-TiO2 y SiO2-ZrO2) on stainless steel substrates AISI/SAE 304
and has allowed to diminish the attack of corrosive agents. This research paper shows the testing of the
anticorrosive characteristics of the ceramic coatings at level of mono-layers, bi-layers and tri-layers, by
means of the conformation of a ternary system SiO2-TiO2-ZrO2.
Has been chosen to work on stainless steel AISI / SAE 304 presents problems because pitting.
This is a type of localized corrosion depth. In general, the application of the coating SiO2-TiO2-ZrO2
allowed to extend the useful life of steel 304 under operating conditions in the presence of Cl- ions.
Int. J. Electrochem. Sci., Vol. 9, 2014
4146
2. EXPERIMENTAL SECTION
2.1 Materials and Reagents.
The chemicals used in this study were tetraethyl orthosilicate Si (OC2H5)4 98%, (TEOS) were
purchased from Aldrich, titanium tetrabutoxide, Ti(OBu)4, 97%, (TBT) was obtained from Aldrich,
and zirconium tetrabutoxide, Zr (OC3H7)4- 80 wt. % in 1-butanol(TBZ) was purchased from Aldrich,
EtOH from Merk and water as solvents, and as complexing 2,4-pentanedionewas obtained from
Aldrich.
2.2. Preparation of SiO2-TiO2 -ZrO2Composite
In the forming process, the sols are kept fixed in the following relationships:
n1(Zr+Ti)/n2complexing=1, where n1 and n2 represent the number of corresponding
moles
n3(H2O)/n4Zr+Si+Ti=1,5where n3 and n4 is the number of corresponding moles.
Total volume of 100 ml solution.
Total concentration sol prepared: 50g/l.
Solution temperature: environment, although in reality this is not constant because of
the reactions that occur within the system [14].
Sols synthesis was established in the following sequence: solution A containing half the
volume of the solvent (EtOH), the total volume of complexing -Acac (2,4 Pentanedione), the total
volume of titanium-precursor TBT-(Ti (OBu)4) and the total volume of the precursor of TBZ-
zirconium (Zr (OC3H7)4), they were mixed in the order indicated above considering that alcohol is the
solvent of the precursor and the complexing agent is the substance that will decrease the rate of
hydrolysis and condensation of TBZ and TBT. Solution B contained half volume of ethanol, the total
volume of silicon precursor TEOS (Si (OC2H5)4) and half the volume of water, they were mixed in the
order listed above such that the Alcohol plays the role of solvent and start the process water
prehydrolysis of TEOS. Subsequently the solutions were mixed and added the remaining volume of
water to promote hydrolysis this system.
Previous studies using the methodology sol-gel indicate the need of the use of complexing
agents in forming multi-component materials [15], since the rate of hydrolysis and condensation of the
precursors used are different causing the formation of a precipitate in the sol. In accordance with the
above mentioned, it should be noted that the reaction rate of the silicon precursor, TEOS, is slower
than of zirconium and titanium reagents, and TBT TBZ, respectively. This condition should be taken
into account when forming the soles which can easily create intermediate complexes of Zr and Ti
cations that favor their precipitation [15].
Once a sol is obtained, the films were deposited directly on steel substrates AISI/SAE 304 of
size 3.5 cm x 2.5 cm x 0.32 cm in this case by Dip- Coating. Before deposition, the substrates were
polished to metallographic brightness and were cleaned off unwanted residue (oil, dust, and residual
metals) with acetone in ultrasonic bath for 20 minutes and then dried using a hot air blower for 3 min
Int. J. Electrochem. Sci., Vol. 9, 2014
4147
before the deposition of coating on the substrate. All the depositions were performed keeping the
substrates at room temperature.
To form the films by dip-coating, it has been used a speed of extraction of 3.67 cm/min. The
sols in the concentrations of the precursors Si/Ti/Zr: 10/70/20 and Si/Ti/Zr: 10/20/70 were conformed
with a time of aging of 280 hours, approximately. The sintering of the films was carried out at a speed
of heating of 2 ºC/min, in the following stages:
For monolayers: the temperature rises from 20 ºC to 300 ºC staying constant during one hour,
soon it is taken to 400 ºC and it is stabilized by half an hour and finally, it is cooled until getting room
temperature at the speed of cooling of the furnace.
For bilayers: the temperature rises from 20 ºC to 100 ºC staying constant during one hour, soon
it is taken to 200 ºC and it is stabilized by half an hour and finally, it is cooled until getting to room
temperature.
For trilayers: the temperature rises from 20ºC to 50ºC staying constant during one hour, soon it
is taken to 100 ºC again and it is stabilized by half an hour and finally it is cooled until getting room
temperature.
2.3. Characterization
Spectroscopic analysis of the compounds was performed using a Fourier transform infrared
(FT-IR) spectrometer (Termo Nicolet Electron Corporation IR200 Spectrometer F.T.), with a
resolution of 2 cm-1
between a range of wave numbers 4000 and 400 cm-1
, on coatings deposited on
steel substrates AISI/SAE 304.
The Electrochemical Impedance Spectroscopy (EIS) was done with equipment by Gamry
Instruments; this device consisted of three electrodes, an electrode of reference (Ag/AgCl), a counter-
electrode of platinum and an electrode of work that was the piece to be tested. The sweeping frequency
included a rank between 0,1 Hz and 105
Hz. The amplitude of the used sinusoidal signal is of 10mV, in
an area of exhibition of ,2 cm2 using sodium chloride as work solution to 3% with pH = 2,83. The
diagrams of Tafel were obtained in a rank of potential of – 0,2 V to 0,2V with a sweeping of 0,5 mV/s.
Micro-hardness testers with knop identer were used to measure the coated surface hardness.
Load of 98 mN were employed at a dwell time of 20 seconds using the System equipped with the HVS
1000 model. At this load 5 identations were made on the sample surface. Three samples were collected
for each measurement and the results are presented as average values + standard deviation.
3. RESULTS AND DISCUSSION
3.1. FT-IR Spectroscopy
FT-IR spectroscopy is a spectroscopic technique used to identify functional groups within a
sample where infrared light of different frequencies is beamed through a sample and to a detector. The
detector measures the absorption of the original infrared radiation by the sample as a function of
Int. J. Electrochem. Sci., Vol. 9, 2014
4148
frequency, or wavenumber. Sample characterization is possible as specific chemical bonds will absorb
in varying intensities and at varying frequencies.
FT-IR was used to characterize the composition and structure of the sol corresponding to the
ternary system consisting of Si/Ti/Zr for concentrations 10/20/70 and 10/70/20 respectively.
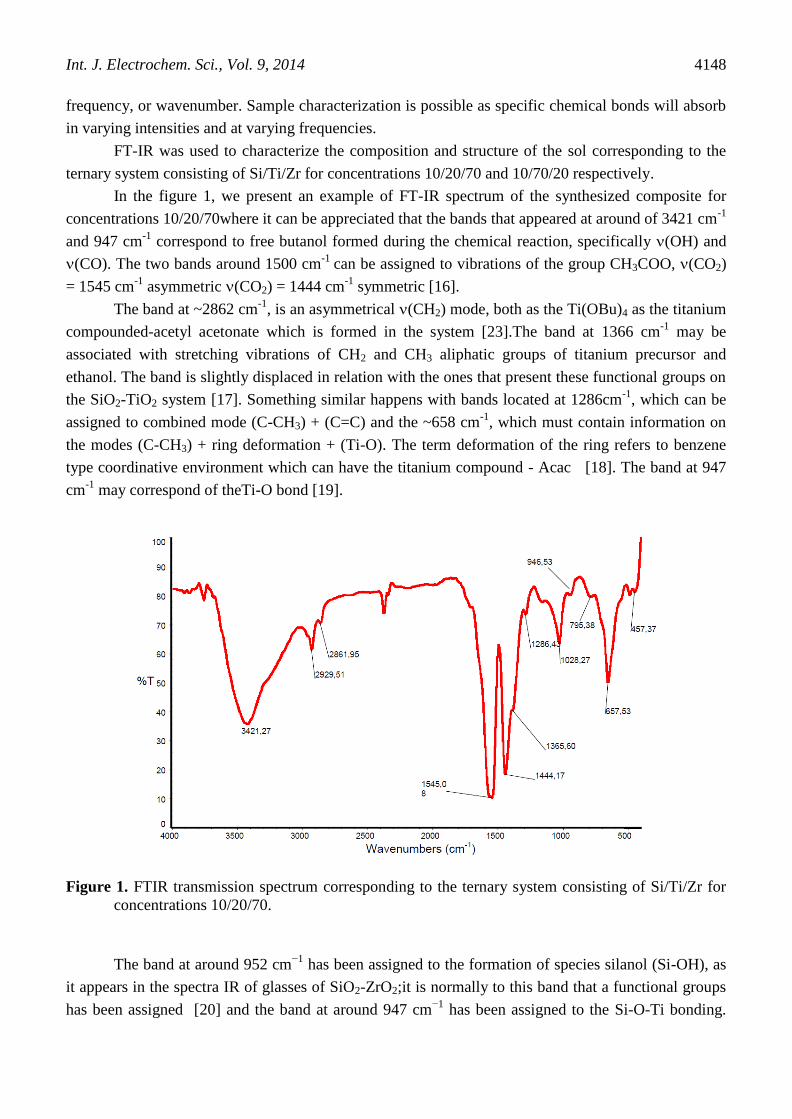
In the figure 1, we present an example of FT-IR spectrum of the synthesized composite for
concentrations 10/20/70where it can be appreciated that the bands that appeared at around of 3421 cm-1
and 947 cm-1
correspond to free butanol formed during the chemical reaction, specifically (OH) and
(CO). The two bands around 1500 cm-1
can be assigned to vibrations of the group CH3COO, (CO2)
= 1545 cm-1
asymmetric (CO2) = 1444 cm-1
symmetric [16].
The band at ~2862 cm-1
, is an asymmetrical (CH2) mode, both as the Ti(OBu)4 as the titanium
compounded-acetyl acetonate which is formed in the system [23].The band at 1366 cm-1
may be
associated with stretching vibrations of CH2 and CH3 aliphatic groups of titanium precursor and
ethanol. The band is slightly displaced in relation with the ones that present these functional groups on
the SiO2-TiO2 system [17]. Something similar happens with bands located at 1286cm-1
, which can be
assigned to combined mode (C-CH3) + (C=C) and the ~658 cm-1
, which must contain information on
the modes (C-CH3) + ring deformation + (Ti-O). The term deformation of the ring refers to benzene
type coordinative environment which can have the titanium compound - Acac [18]. The band at 947
cm-1
may correspond of theTi-O bond [19].
Figure 1. FTIR transmission spectrum corresponding to the ternary system consisting of Si/Ti/Zr for
concentrations 10/20/70.
The band at around 952 cm−1
has been assigned to the formation of species silanol (Si-OH), as
it appears in the spectra IR of glasses of SiO2-ZrO2;it is normally to this band that a functional groups
has been assigned [20] and the band at around 947 cm−1
has been assigned to the Si-O-Ti bonding.
Int. J. Electrochem. Sci., Vol. 9, 2014
4149
This indicates that both the zirconium and titanium are joined to the network forming structures of the
following type: -(-O-Si-)m-O-Zr-O-Si-O-Ti-O-(-Si-O)n-. The appearance of the band at around 460 cm-
1may have resulted from the formation of the O-Si-O bond. The band at around 795 cm
-1 and 658 cm
-
1corresponds to the asymmetric stretching vibration of the silicon tetrahedrons (SiO4) [21].
In the table 1, the location of the bands and the assignment to functional groups of the spectrum
of the figure 2 are indicated.
Table 1. Infrared absorptions of the system Si/Ti/Zr: 10/20/70.
Assignment Frequency (cm-1
)
s C-H in CH3 2930
a C-H in CH2 2861
vibrational mode (C=C) 1545
(CH2) 1444
(CH3) 1366
Combined mode(C-CH3) + (C=C) 1286
Vibration Ti-O-C 1028
Bond Ti-O-Si 947
a(Si-O-Si) 775
Combined mode(C-CH3) + deformation of
the ring + (Ti-O)
658
Vibration of deformation O-Si-O 457
From the obtained information, it is possible to conclude that bonds Si-O-Zr y Si-O-Ti are
presented. These bonds can be explained by the existence of bands between 940 and 980 cm-1
; also in
this interval of frequencies a band appears around 952 cm-1
that evidences the presence of silanols in
the system. The above mentioned, justifies an appropriate mixture of the cations of interest, to avoid
the separation of phases, but it is not possible to conclude about the homogeneity and uniformity of the
mixture. Also, the previous results indicate that the hydrolysis and condensation reactions in the
system are being developed.
The spectrum represented in figure 2 for synthesized composite for concentrations 10/70/20
contains the following bands: at around 1070 cm-1
and 970 cm-1
which correspond to the formation of
Zr=O y Si-O-Zr bonds respectively. In this system, we can also observe that these bands reduce their
intensity, significantly, and practically they are not detected in the spectrum. This result is coherent
with the relationship in composition that was analyzed previously, where there was bigger
concentration of titanium that zirconium concentration and for this reason the presence of the Si-O-Ti
bond is evidenced in the band around 933 cm-1
compared with the band appears around 950 cm-1
that
corresponds to the silanols. Also, the bands to around 2955 cm-1
, 2930 cm-1
and 2880 cm-1
, have a
smaller intensity compared with the intensities of the bands that were presented in the spectra of the
figure 1 [21].
Int. J. Electrochem. Sci., Vol. 9, 2014
4150
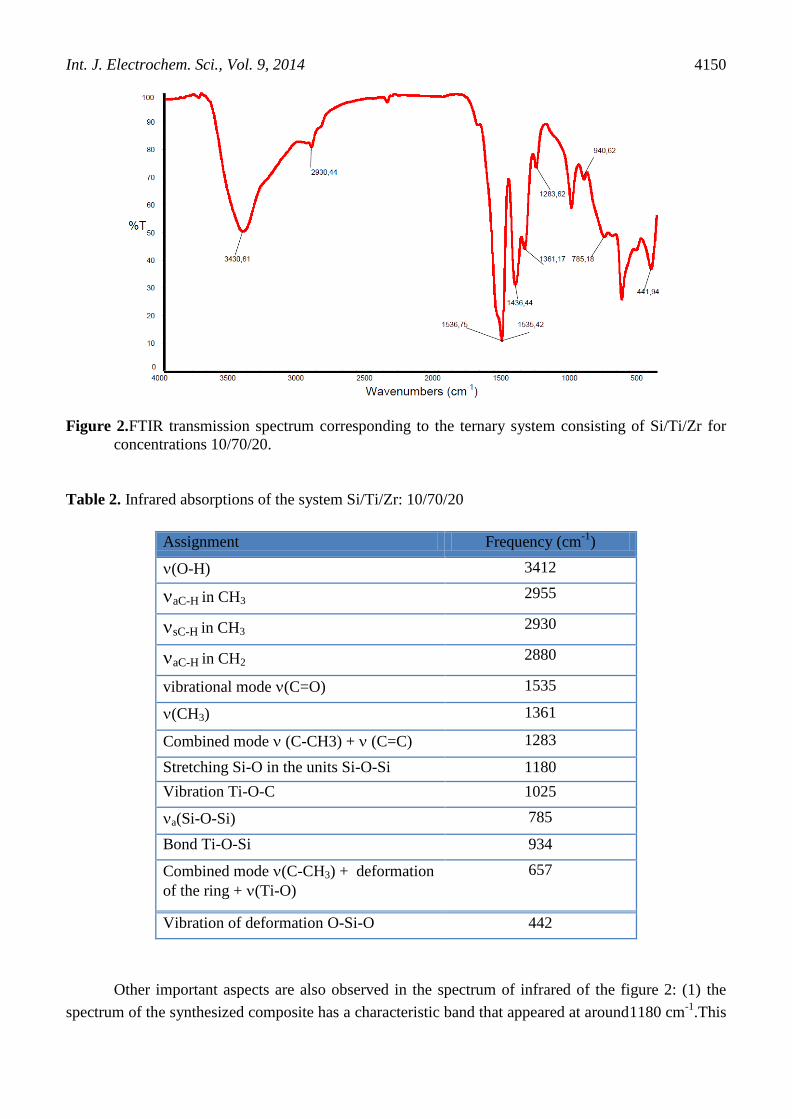
Figure 2.FTIR transmission spectrum corresponding to the ternary system consisting of Si/Ti/Zr for
concentrations 10/70/20.
Table 2. Infrared absorptions of the system Si/Ti/Zr: 10/70/20
Assignment Frequency (cm-1
)
(O-H) 3412
aC-H in CH3 2955
sC-H in CH3 2930
aC-H in CH2 2880
vibrational mode (C=O) 1535
(CH3) 1361
Combined mode (C-CH3) + (C=C) 1283
Stretching Si-O in the units Si-O-Si 1180
Vibration Ti-O-C 1025
a(Si-O-Si) 785
Bond Ti-O-Si 934
Combined mode (C-CH3) + deformation
of the ring + (Ti-O)
657
Vibration of deformation O-Si-O 442
Other important aspects are also observed in the spectrum of infrared of the figure 2: (1) the
spectrum of the synthesized composite has a characteristic band that appeared at around1180 cm-1
.This
Int. J. Electrochem. Sci., Vol. 9, 2014
4151
band has been assigned to the stretching of the Si-O species in the Si-O-Ti condensed units [22]. (2)
The band around 950 cm-1
presents a reduction in the intensity, which is reflected in the appearance of
a shoulder in the peak, indicating that the silanols presence in the system is low; and (3) the signal at
the wavenumber around 430 cm-1
corresponds to the deformation vibrations of O-Si-O that indicates a
high advance of the process of gelation of the TEOS in the system. With base in the mentioned above,
it is important to note that for high titanium concentrations and low of zirconium, the condensation of
the silanols would be catalyzed. On the other hand, it is evident the formation of bonds of titanium
with other groups of the system in study and the presence of the complex Acac - titanium in the same
for the presence of the characteristic band of the complex to ~663 cm-1
related in the system SiO2-TiO2
to the modes(C-CH3) + deformation of the ring + (Ti-O) [19]
In the table 2 the location of the bands and the assignment to functional groups of the spectrum
of the figure 2 are indicated.
3.2 Electrochemical Impedance Spectroscopy (EIS).
The EIS analysis was centered, mainly, in determining the values of resistance to the
polarization Rp. This parameter determined the resistance that the coating opposed to the ion passage
from the work solution to the substrate, preventing it from corrosion. In general terms, when a coating
registered a high value of resistance to polarization it was possible to conclude that it was a good
anticorrosive protector.
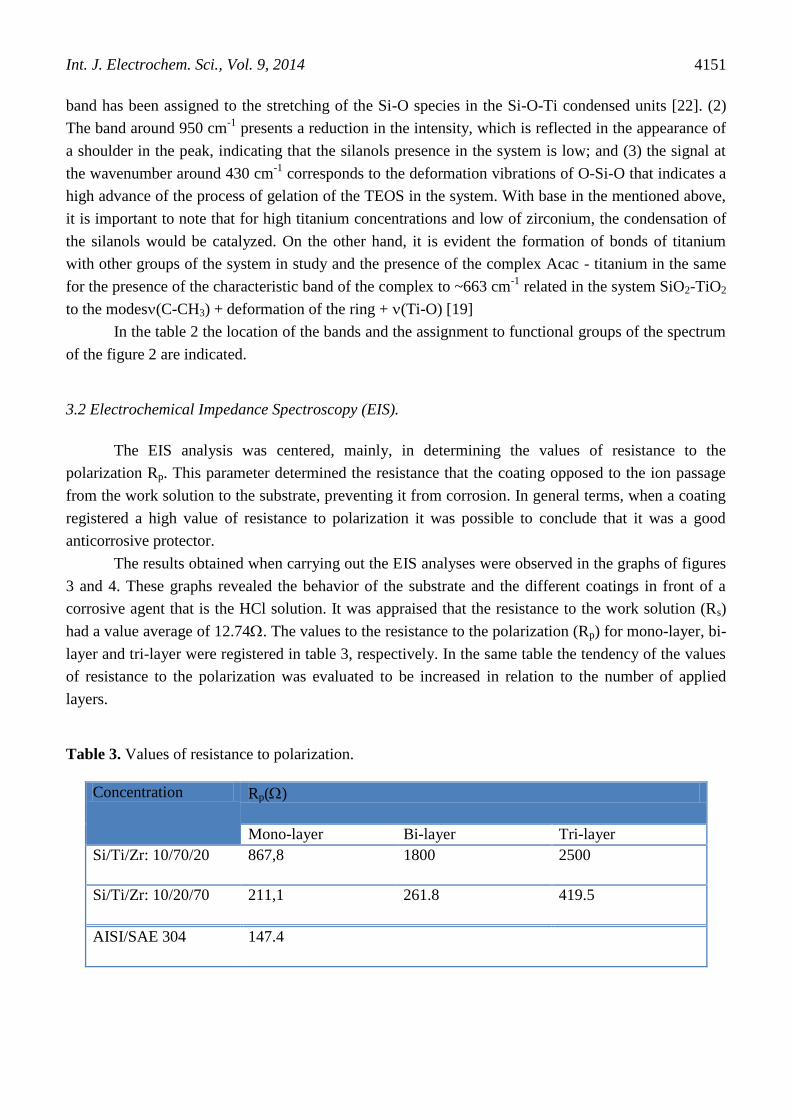
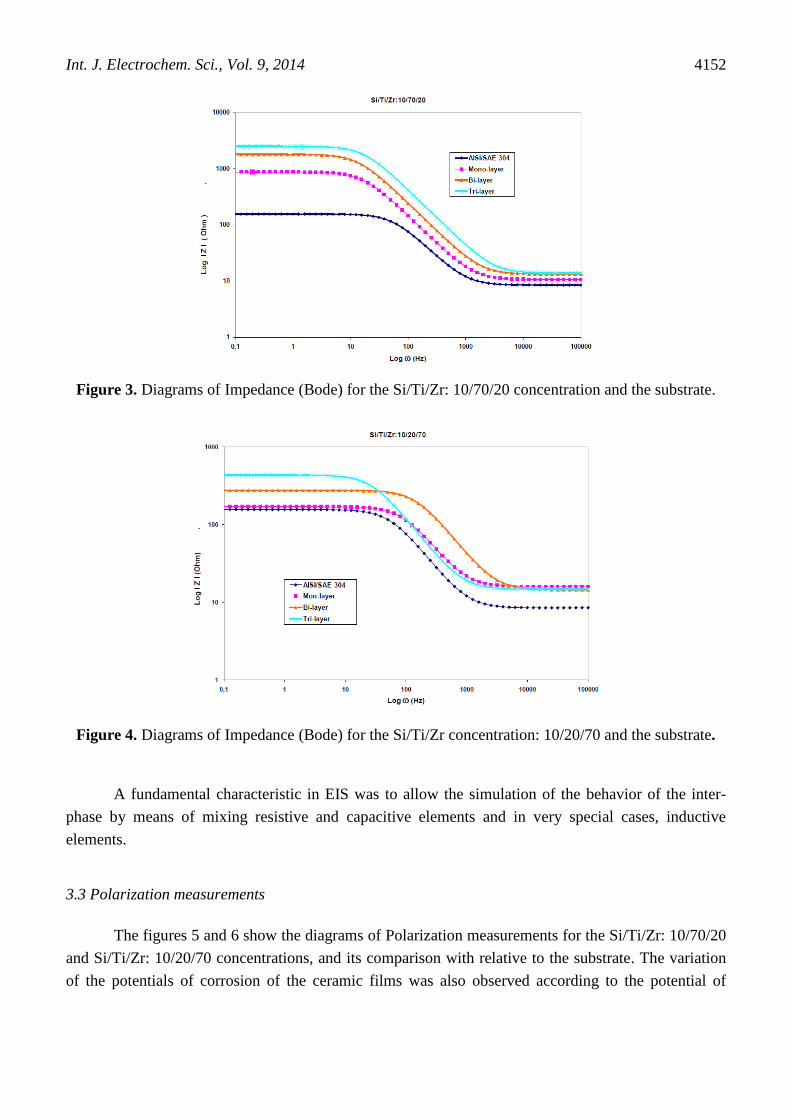
The results obtained when carrying out the EIS analyses were observed in the graphs of figures
3 and 4. These graphs revealed the behavior of the substrate and the different coatings in front of a
corrosive agent that is the HCl solution. It was appraised that the resistance to the work solution (Rs)
had a value average of 12.74. The values to the resistance to the polarization (Rp) for mono-layer, bi-
layer and tri-layer were registered in table 3, respectively. In the same table the tendency of the values
of resistance to the polarization was evaluated to be increased in relation to the number of applied
layers.
Table 3. Values of resistance to polarization.
Concentration Rp()
Mono-layer Bi-layer Tri-layer
Si/Ti/Zr: 10/70/20 867,8 1800 2500
Si/Ti/Zr: 10/20/70 211,1 261.8 419.5
AISI/SAE 304 147.4
Int. J. Electrochem. Sci., Vol. 9, 2014
4152
Figure 3. Diagrams of Impedance (Bode) for the Si/Ti/Zr: 10/70/20 concentration and the substrate.
Figure 4. Diagrams of Impedance (Bode) for the Si/Ti/Zr concentration: 10/20/70 and the substrate.
A fundamental characteristic in EIS was to allow the simulation of the behavior of the inter-
phase by means of mixing resistive and capacitive elements and in very special cases, inductive
elements.
3.3 Polarization measurements
The figures 5 and 6 show the diagrams of Polarization measurements for the Si/Ti/Zr: 10/70/20
and Si/Ti/Zr: 10/20/70 concentrations, and its comparison with relative to the substrate. The variation
of the potentials of corrosion of the ceramic films was also observed according to the potential of

Int. J. Electrochem. Sci., Vol. 9, 2014
4153
corrosion of the substrate. In general, the corrosion potential tended to take more positive values as it
increases to the number of ceramic films deposited on the substrate.
The values of potential of corrosion (Ecorr) for the substrate and the number of layers applied
according to the concentration were registered in table 4. Additionally, to complement the analyses, in
table 4 the values of current corrosion (Icorr) were transformed. When revising the tendency of the
given parameters previously mentioned the behavior interfacial it is evaluated for each stage.
Table 4. Values of corrosion potential.
Concentration - Ecorr(mV)
Mono-layer Bi-layer Tri-layer
Si/Ti/Zr: 10/70/20 194 182 179
Si/Ti/Zr: 10/20/70 262 254 235
AISI/SAE 304 278
Figure 5. Polarization measurements Si/Ti/Zr: 10/70/20 concentration
Int. J. Electrochem. Sci., Vol. 9, 2014
4154
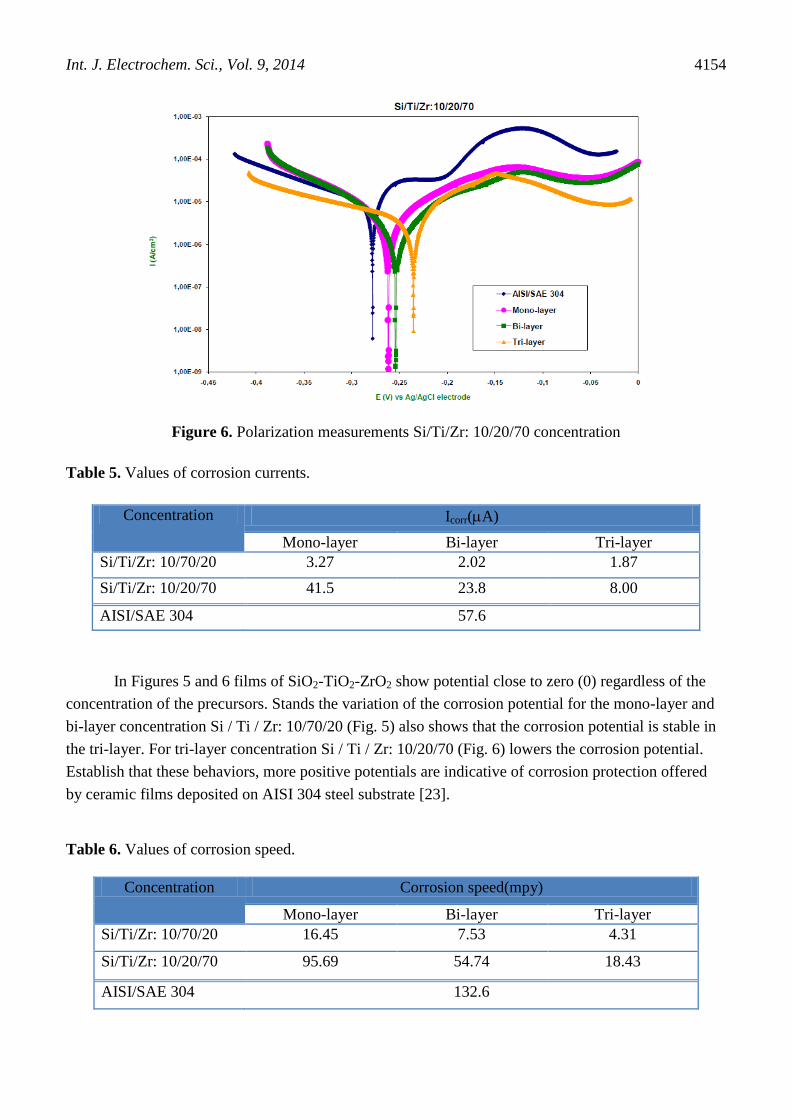
Figure 6. Polarization measurements Si/Ti/Zr: 10/20/70 concentration
Table 5. Values of corrosion currents.
Concentration Icorr(A)
Mono-layer Bi-layer Tri-layer
Si/Ti/Zr: 10/70/20 3.27 2.02 1.87
Si/Ti/Zr: 10/20/70 41.5 23.8 8.00
AISI/SAE 304 57.6
In Figures 5 and 6 films of SiO2-TiO2-ZrO2 show potential close to zero (0) regardless of the
concentration of the precursors. Stands the variation of the corrosion potential for the mono-layer and
bi-layer concentration Si / Ti / Zr: 10/70/20 (Fig. 5) also shows that the corrosion potential is stable in
the tri-layer. For tri-layer concentration Si / Ti / Zr: 10/20/70 (Fig. 6) lowers the corrosion potential.
Establish that these behaviors, more positive potentials are indicative of corrosion protection offered
by ceramic films deposited on AISI 304 steel substrate [23].
Table 6. Values of corrosion speed.
Concentration Corrosion speed(mpy)
Mono-layer Bi-layer Tri-layer
Si/Ti/Zr: 10/70/20 16.45 7.53 4.31
Si/Ti/Zr: 10/20/70 95.69 54.74 18.43
AISI/SAE 304 132.6
Int. J. Electrochem. Sci., Vol. 9, 2014
4155
When comparing tables 5 and 6, which were obtained from figures 6, revealed directly a
proportional behavior between the current of corrosion and the speed of corrosion. The greater
corrosion current is the greater corrosive attack undergoes in the substrate.
3.4 Hardness measurement
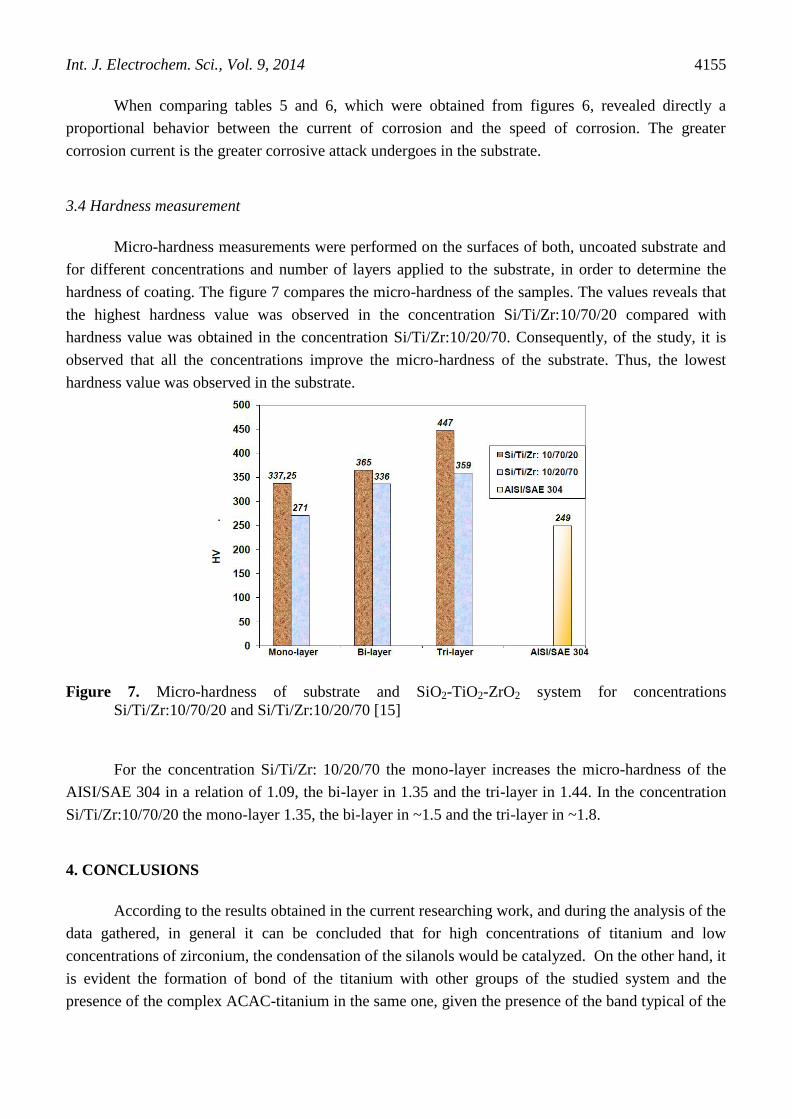
Micro-hardness measurements were performed on the surfaces of both, uncoated substrate and
for different concentrations and number of layers applied to the substrate, in order to determine the
hardness of coating. The figure 7 compares the micro-hardness of the samples. The values reveals that
the highest hardness value was observed in the concentration Si/Ti/Zr:10/70/20 compared with
hardness value was obtained in the concentration Si/Ti/Zr:10/20/70. Consequently, of the study, it is
observed that all the concentrations improve the micro-hardness of the substrate. Thus, the lowest
hardness value was observed in the substrate.
Figure 7. Micro-hardness of substrate and SiO2-TiO2-ZrO2 system for concentrations
Si/Ti/Zr:10/70/20 and Si/Ti/Zr:10/20/70 [15]
For the concentration Si/Ti/Zr: 10/20/70 the mono-layer increases the micro-hardness of the
AISI/SAE 304 in a relation of 1.09, the bi-layer in 1.35 and the tri-layer in 1.44. In the concentration
Si/Ti/Zr:10/70/20 the mono-layer 1.35, the bi-layer in ~1.5 and the tri-layer in ~1.8.
4. CONCLUSIONS
According to the results obtained in the current researching work, and during the analysis of the
data gathered, in general it can be concluded that for high concentrations of titanium and low
concentrations of zirconium, the condensation of the silanols would be catalyzed. On the other hand, it
is evident the formation of bond of the titanium with other groups of the studied system and the
presence of the complex ACAC-titanium in the same one, given the presence of the band typical of the
Int. J. Electrochem. Sci., Vol. 9, 2014
4156
complex around 663 cm-1
and that associates in the system SiO2-TiO2 to the mode (C-CH3) + (C-
CH3) + deformation of the ring + (Ti-O).
With the ceramic coatings obtained by the methodology Sol-gel, specially the one of Si/Ti/Zr:
10/70/20 concentration, it is searched to protect steel AISI/SAE 304 of attacks by corrosive agents that
contain Cl-ions. For the two studied concentrations it is observed that: the greater number of ceramic
layers deposited on the substrate the lesser the speed of corrosion. This allows improving the useful
life of steel AISI/SAE 304.According to the results of the coatings characterization, it is observed a
greater degree of the anticorrosive effectiveness in the Si/Ti/Zr: 10/70/20 concentration; this occurs
maybe because of the high concentration of the titanium precursor.
Among the specimens, the highest microhardness value was observed in the ceramic coating
with a concentration Si/Ti/Zr:10/70/20. The lowest hardness value was obtained from uncoated
substrate.
References
1. M. Castro, Recubrimientos protectores obtenidospordeposiciónelectroforética (EPD) a partir de
suspensiones sol-gel, Universidad Autónoma de Madrid, Madrid (2003)
2. C. Brinker and G. Scherer, Sol-Gel Science: the physics and chemistry of sol-gel processing,
Academic Press, New York (1990)
3. L. Hech and D. Ulrich, Science of Ceramic Chemical Processing, John Wiley & Sons, New York
(1986)
4. L. Klein, Sol-gel technology for thin films, fibers, performs, electronics and specialty shapes,
Noyes Publications, New Yersey (1988)
5. J. Bautista-Ruiz, C. Ortiz, E. Vera and J. Rodríguez-Páez, Rev. Acad. Colomb. Cienc., 31. 19 (2007)
235.
6. J. H. Bautista-Ruiz, J. Camargo, C. Ortiz, E. Vera and J. E. Rodríguez-Páez, Congreso
SAM/CONAMET, 7 (2007) 674.
7. T. Yao and K. Takashima, Biosens. Bioelectron, 13 (1998) 67.
8. H. Li, D. Jin, Q. Yu and H. Tu, , J. Power Sources, 196 (2011) 3836.
9. A. Zalga, J. Reklaitis, E. Norkus, A. Beganskiene and A. Kareiva, Chem.Phys., 327 (2006) 220.
10. S. Tao, Q. Wu, Z. Zhan and G. Meng, Solid State Ionics, 124 (1999) 53.
11. T. Olding, M. Sayer and D. Barrow, Thin Solid Films. 398 (2001) 581.
12. Y. Castro. Recubrimientos protectores por deposición electroforética (EPD) a partir de
suspensiones sol-gel. Instituto de Cerámica y Vidrio. Madrid (2003)
13. M. Ryan, D. Williams, R. Chater, B. Hutton, and D. McPhail, Nature, 415 (2002) 770.
14. A. Mafla. Conformación de recubrimientos cerámicos de sílice titanio por el método sol-gel.
Universidad del Cauca. Popayán (2003)
15. J. Bautista-Ruiz. Conformación de películas delgadas tipo sol-gel para aplicaciones
anticorrosivas; Universidad Pedagógica y Tecnológica de Colombia. Tunja (2008)
16. C. Sánchez, F. Babonneau, S. Doeuff. and A. Leaustic, J. Non-Cryst. Solids, (2002) 70.
17. K. Nakamoto. Infrared and Raman spectra of inorganic and coordination compounds. John Wiley
& Sons Inc. New Jersey (2009)
18. G. Socrates, G. Infrared Characteristic Group Frequencies, John Wiley & Sons, Inc. New Jersey
(1994)
19. J. E. Rodríguez, A. Mafla, G. Andrade and A. Durán, Bol. Soc. Esp. Ceram. V., (2004) 53.

Int. J. Electrochem. Sci., Vol. 9, 2014
4157
20. M. Nogami, J. Non – Cryst. Solids 69, (1985) 4
21. G. Andrade. Conformación de recubrimientos de silicio – circonio y silicio – circonio – titanio
utilizando la técnica sol – gel Universidad del Cauca. Popayán (2004).
22. M. Velasco, Síntesis y caracterización de ormolises obtenidos a partir del TEOS y PDMS,
Universidad Autónoma de Madrid. Madrid (1999).
23. J. Barranco, F. Barreras, A. Lozano, A. M. Lopez, V. Roda, J. M., Mario, G. G. Fuentes, E.
Almandoz, Int J Hydrogen Energ, 35, (2010) 11489
© 2014 The Authors. Published by ESG (www.electrochemsci.org). This article is an open access
article distributed under the terms and conditions of the Creative Commons Attribution license
(http://creativecommons.org/licenses/by/4.0/).


![Cerámica y Vidrioboletines.secv.es/upload/20070322111334.43[3]679-685.pdf679 BOLETIN DE LA SOCIEDAD ESPAÑOLA DE A R T I C U L O Cerámica y Vidrio Synthesis and characterization](https://static.fdocuments.es/doc/165x107/60cbef9e5714f4357a3b155e/cermica-y-3679-685pdf-679-boletin-de-la-sociedad-espaola-de-a-r-t-i-c-u-l.jpg)