
Thesis Presentation_Pulok_v1
70
Real-time Voltage Stability Monitoring Tool for Power System Transmission Network Using Synchrophasor Data. Master’s Thesis Defense Presentation by Md Kamrul Hasan Pulok MS degree candidate Advisor : Dr. Omar Faruque
-
Upload
md-kamrul-hasan-pulok -
Category
Documents
-
view
77 -
download
0
Transcript of Thesis Presentation_Pulok_v1

Real-time Voltage Stability Monitoring Tool for Power System Transmission Network Using Synchrophasor Data.
Master’s Thesis Defense Presentationby
Md Kamrul Hasan PulokMS degree candidate
Advisor : Dr. Omar Faruque

Slide 2
Research Objective
To Develop A Real-time Voltage Stability Analysis And Visualization Tool.
Slide 3
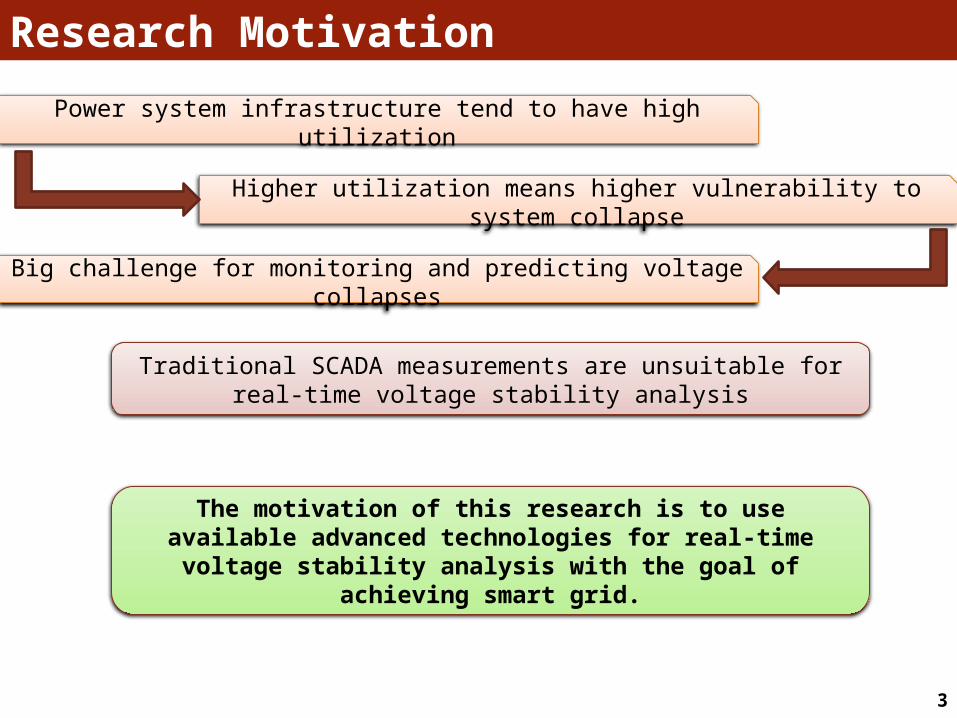
Research Motivation
Power system infrastructure tend to have high utilization
Higher utilization means higher vulnerability to system collapse
Big challenge for monitoring and predicting voltage collapses
Traditional SCADA measurements are unsuitable for real-time voltage stability analysis
The motivation of this research is to use available advanced technologies for real-time voltage stability analysis with the
goal of achieving smart grid.

Slide 4
Challenges and Solution
For real-time application, measurement device with high sampling rate required
PMU Devices are expensive
Real-time metered data storage and retrieval
Real-time dynamic state estimation
Real-time interfacing with developed GUI tool and database server
Synchrophasor Technology (PMU)
Optimal PMU Placement algorithm
OpenPDC (Phasor data concentrator)
Microsoft SQL Database server 2012
Linear state estimation method (LSE)
Challenges Solution

Slide 5
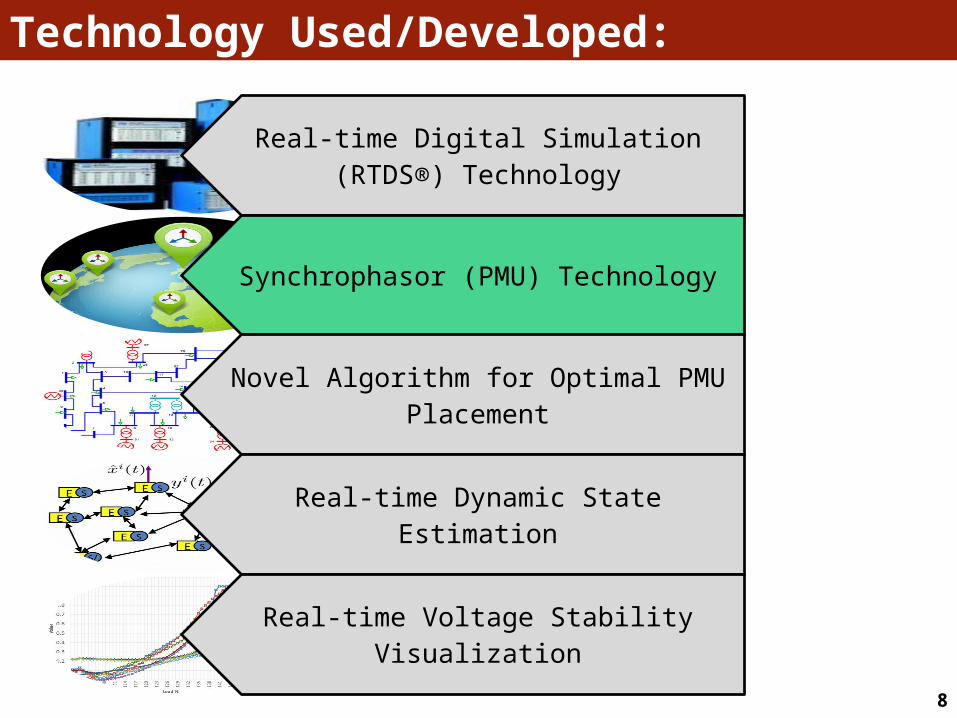
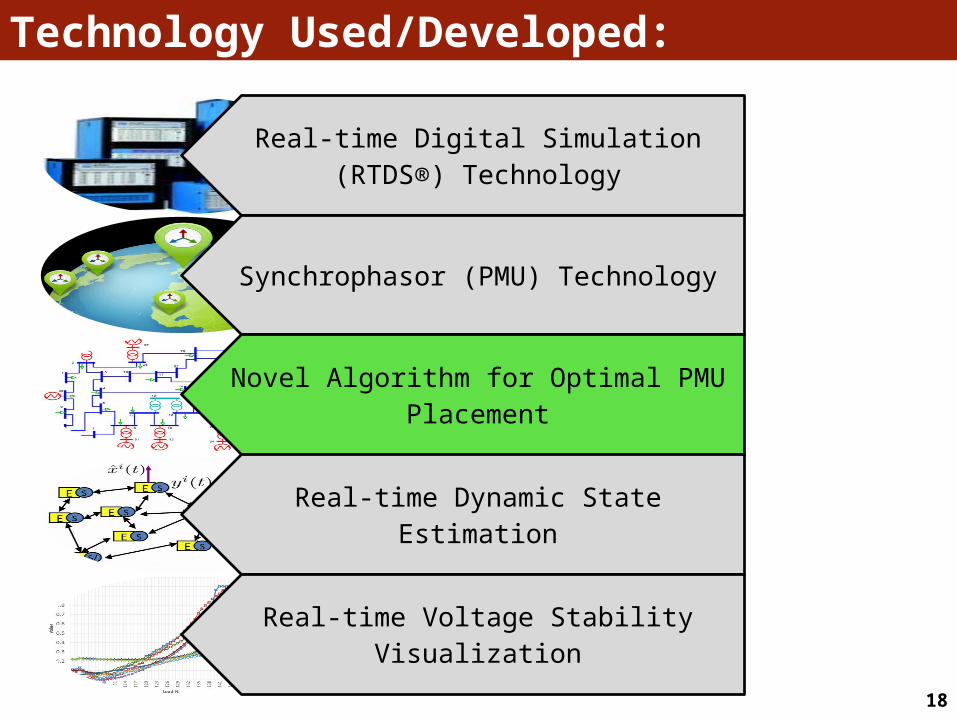
Technology Used/Developed:
Real-time Digital Simulation (RTDS®) Technology
Synchrophasor (PMU) Technology
Novel Algorithm for Optimal PMU Placement
Real-time Dynamic State Estimation
Real-time Voltage Stability Visualization
Slide 6
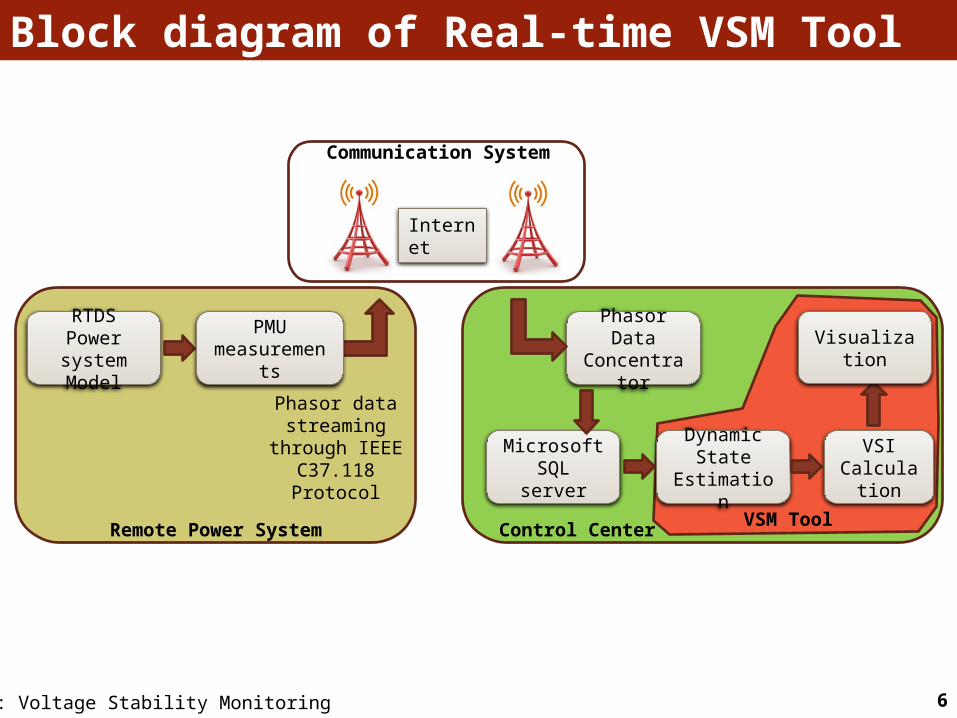
RTDS Power system Model
Phasor data streaming
through IEEE C37.118 Protocol
Internet
Phasor Data Concentrator
Microsoft SQL server
Control CenterRemote Power System
Communication System
Dynamic State
Estimation
VSI Calculatio
n
Visualization
VSM Tool
PMU measurements
Block diagram of Real-time VSM Tool
VSM : Voltage Stability Monitoring
Slide 7
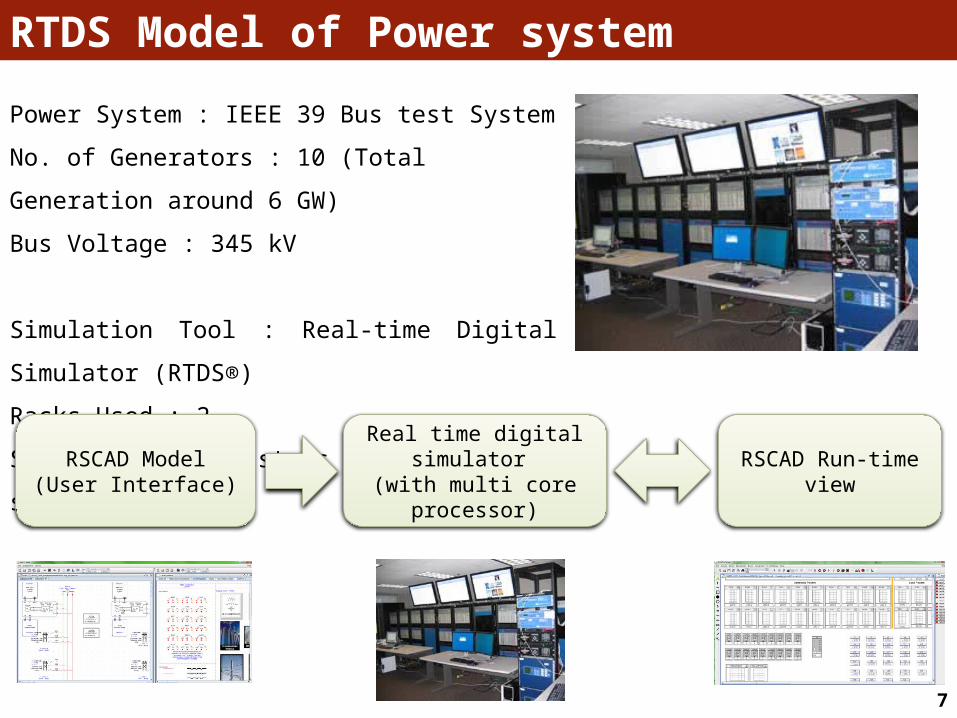
Power System : IEEE 39 Bus test System
No. of Generators : 10 (Total Generation around 6 GW)
Bus Voltage : 345 kV
Simulation Tool : Real-time Digital Simulator (RTDS®)
Racks Used : 2
Simulation time-steps : 50 micro-seconds
RSCAD Model(User Interface)
Real time digital simulator (with multi core processor) RSCAD Run-time view
RTDS Model of Power system
Slide 8
Technology Used/Developed:
Real-time Digital Simulation (RTDS®) Technology
Synchrophasor (PMU) Technology
Novel Algorithm for Optimal PMU Placement
Real-time Dynamic State Estimation
Real-time Voltage Stability Visualization

Slide 9
Synchronized Phasor Measurement Unit, also known as PMU.
Synchronized with common time source like GPS
Calculates voltage and current Phasors, frequency & Rate of change of frequency
Reports measurement over the Internet.
Ref: http://www.qualitrolcorp.com/Products/Fault_Recording_and_Fault_Location/Phasor_Measurement_Units/
Definition of Synchrophasor

Slide 10Ref: http://www.eia.gov/todayinenergy/detail.cfm?id=5630http://www.phasor-rtdms.com/phaserconcepts/phasor_adv_faq.html
Why Synchrophasor (PMU)?SCADA Measurements
• Slow (time resolution in the range of 2sec to 10sec)• Unsynchronized with other measurements• Considered as X-ray quality measurements
PMU Measurements• Fast (time resolution in the range of milliseconds)• Time Synchronized with other measurements.• Considered as MRI quality measurements

Slide 11
Application of PMUs
Power System Wide Area Monitoring Systems (WAMS)
Wide area control application
Power system protection
Intelligent Alarms

Slide 12
P-Class PMU:“P class is intended for applications requiring fast response and mandates no explicit filtering. The letter P is used since protection applications require fast response.”—IEEE Std.
Key Characteristics: Protection Class Gives fast response Used in protection applications.
Ref: IEEE Standard C37.118.1-2011
M-Class PMU:“M class is intended for applications that could be adversely effected by aliased signals and do not require the fastest reporting speed. The letter M is used since analytic measurements often require greater precision but do not require minimal reporting delay”---IEEE Std.
Key Characteristics: Measurement Class Gives precise response Used in measurement applications.
IEEE Std C37.118.1-2011 : IEEE Standard for Synchrophasor Measurements for Power Systems
P-class Used
IEEE Standard for PMU

Slide 13
RTDS PMU Model : Used GTNET Card
GTNET Card
PMU model Settings:• Protocol : IEEE C37.118.2011• PMU Class : P• Sampling Rate : 10Hz• Streaming phasor data through internet using TCP protocol.
RTDS Model of PMU
Slide 14
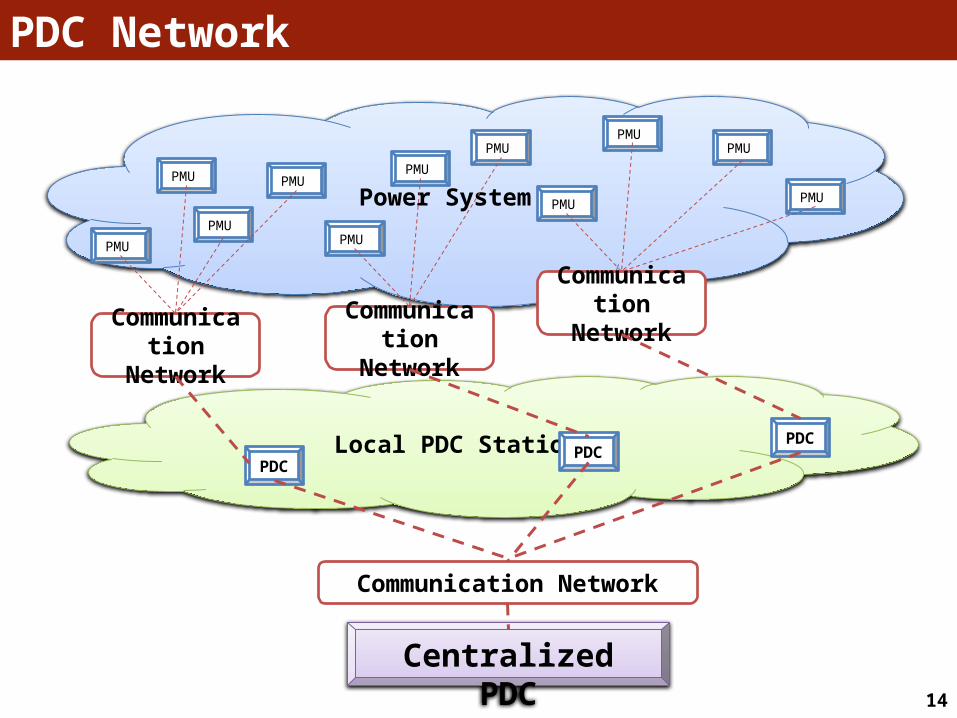
PDC Network
Power SystemPMU
PMU
PMU
PMU
Communication Network
Local PDC StationsPDC
PMU
PMU PMU
PMU
Communication Network
PDC
PMU
PMU
PMU
Communication Network
PDC
Communication Network
Centralized PDC

Slide 15
RTDS Power system Model
PMU measurements
Phasor data streaming through IEEE C37.118
Protocol
Internet
Phasor Data Concentrator
Microsoft SQL server
Control CenterRemote Power System
Communication System
Block Diagram of PDC Network
Slide 16
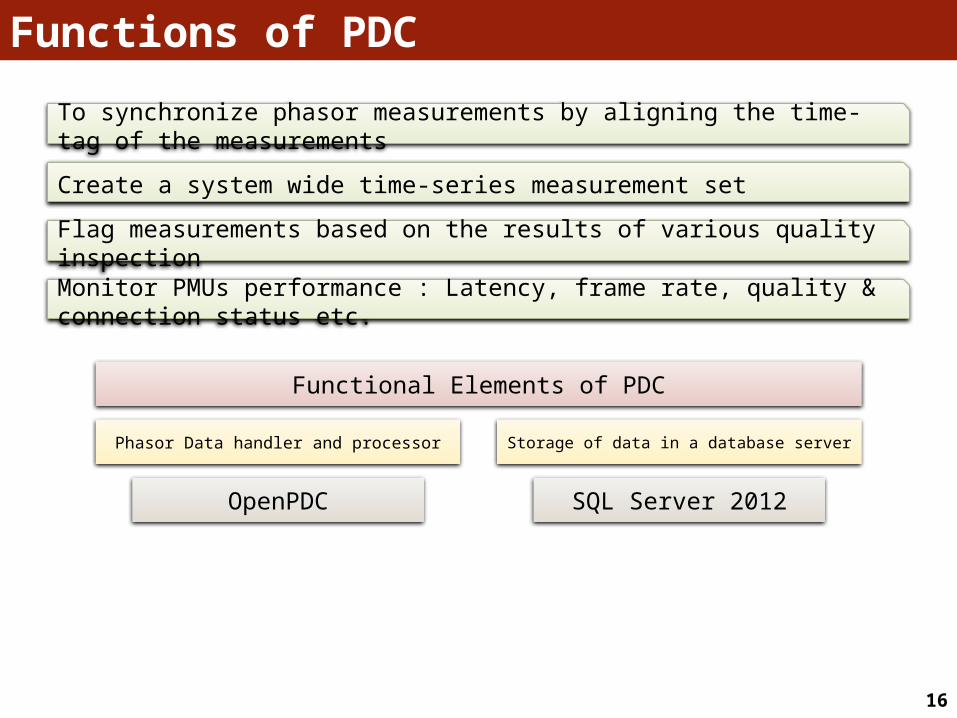
Functions of PDC
To synchronize phasor measurements by aligning the time- tag of the measurements
Create a system wide time-series measurement set
Flag measurements based on the results of various quality inspection
Monitor PMUs performance : Latency, frame rate, quality & connection status etc.
Functional Elements of PDC
Phasor Data handler and processor
OpenPDC
Storage of data in a database server
SQL Server 2012
Slide 17
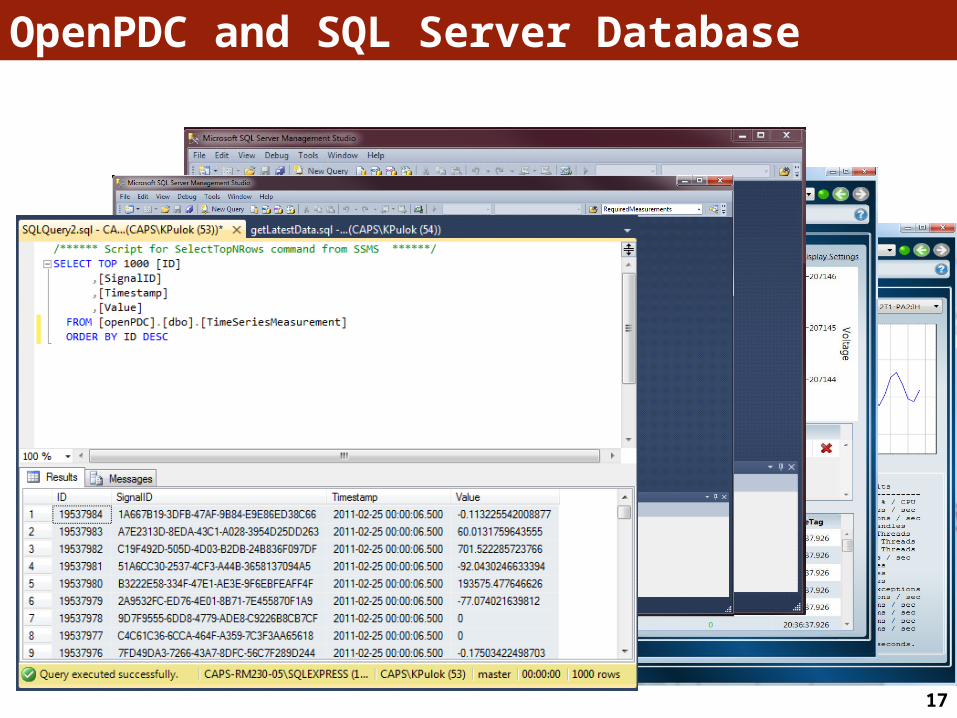
OpenPDC and SQL Server Database
Slide 18
Technology Used/Developed:
Real-time Digital Simulation (RTDS®) Technology
Synchrophasor (PMU) Technology
Novel Algorithm for Optimal PMU Placement
Real-time Dynamic State Estimation
Real-time Voltage Stability Visualization

Slide 19
Not Fully Observable
• PMU Devices are expensive. So we cannot use PMU devices at every bus for measurement.
• So we need to find out minimum number of PMU requirement and Bus locations.
• To do this, we need to perform observability analysis.
• Observability of Network: A network is fully observable if states of the bus can be either
measured or estimated.
G
m
mm
Fully Observable
Optimal PMU Placement

Slide 20
To identify minimum PMU bus locations, we need to perform observability analysis.
Observability analysis criteria:
1. For a bus selected for PMU placement, bus voltage phasor and current phasor of all incident
branches are known.
2. For known voltage phasor and current of an incident branch at a bus, voltage phasor at other
bus of this branch can be evaluated.
3. For known voltage phasor at both ends of a branch, current phasor of this branch can be
calculated.G
e
P
e
v
i i
GFully Observable
According to observability criteria, for same minimum number of PMU, PMU can be positioned at different bus locations maintaining full observability.
Network Observability

Slide 21
9 Bus System 1
9 Bus System 2
Total Bus 9 9
PMU Bus 3 2
PMU Channel 7 9
Total Branch 9 14
PMU Location % 33.3% 22.2%
Minimum Number of PMU depends on network structure
We need the help of computer to identify optimum PMU locations. So we developed our own.
Minimum PMU usage
7 6 5
8
1
9
2
4
3
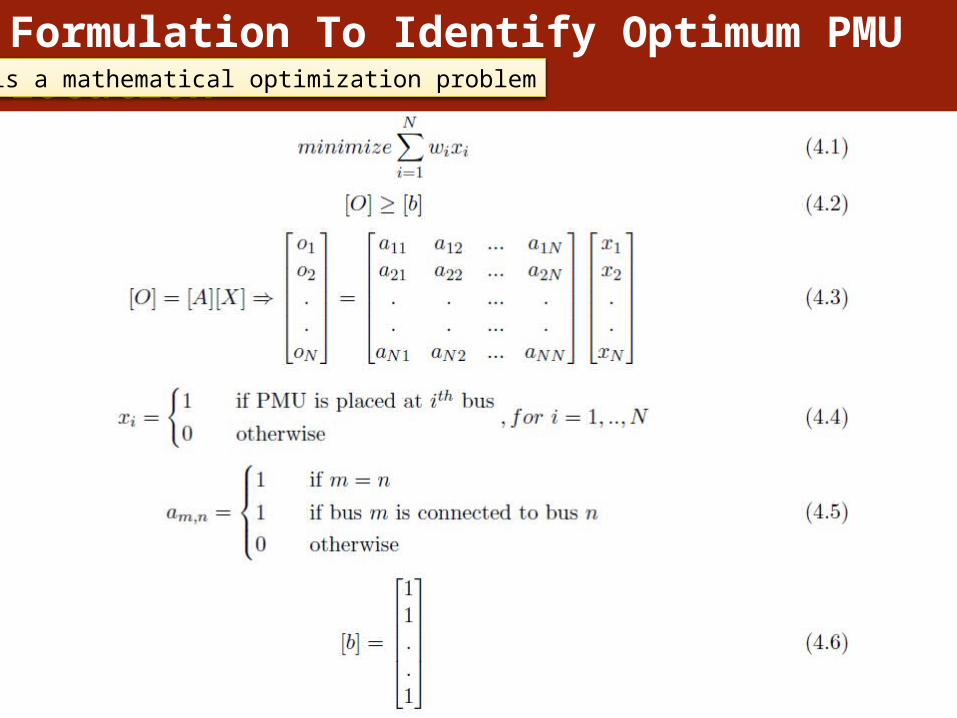
Formulation To Identify Optimum PMU LocationThis is a mathematical optimization problem
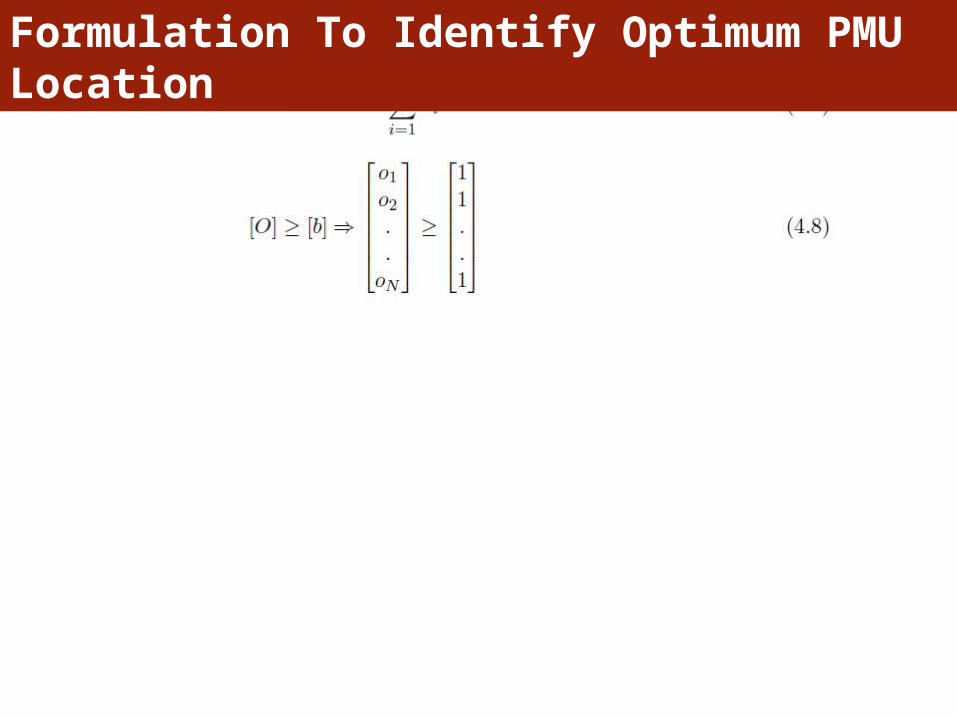
Formulation To Identify Optimum PMU Location
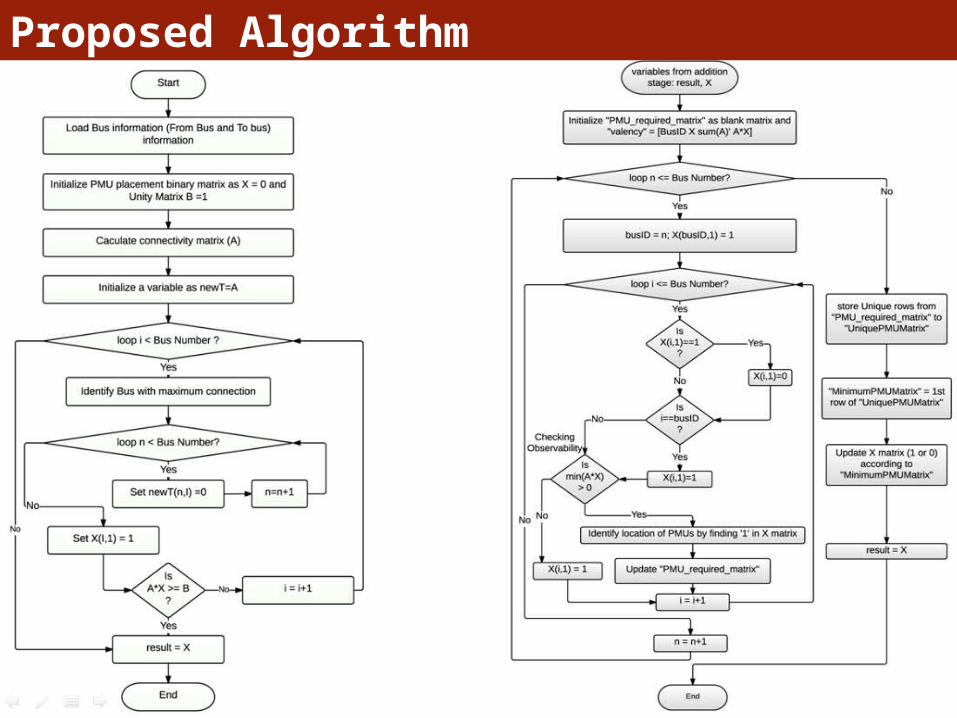
Proposed Algorithm
Slide 25
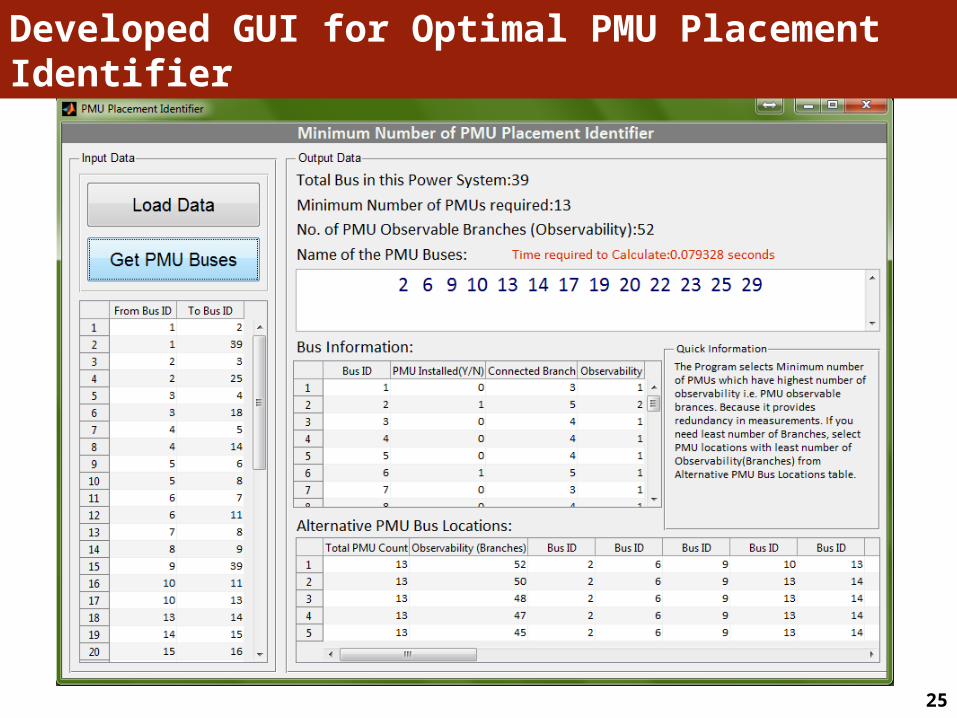
Developed GUI for Optimal PMU Placement Identifier
Slide 26
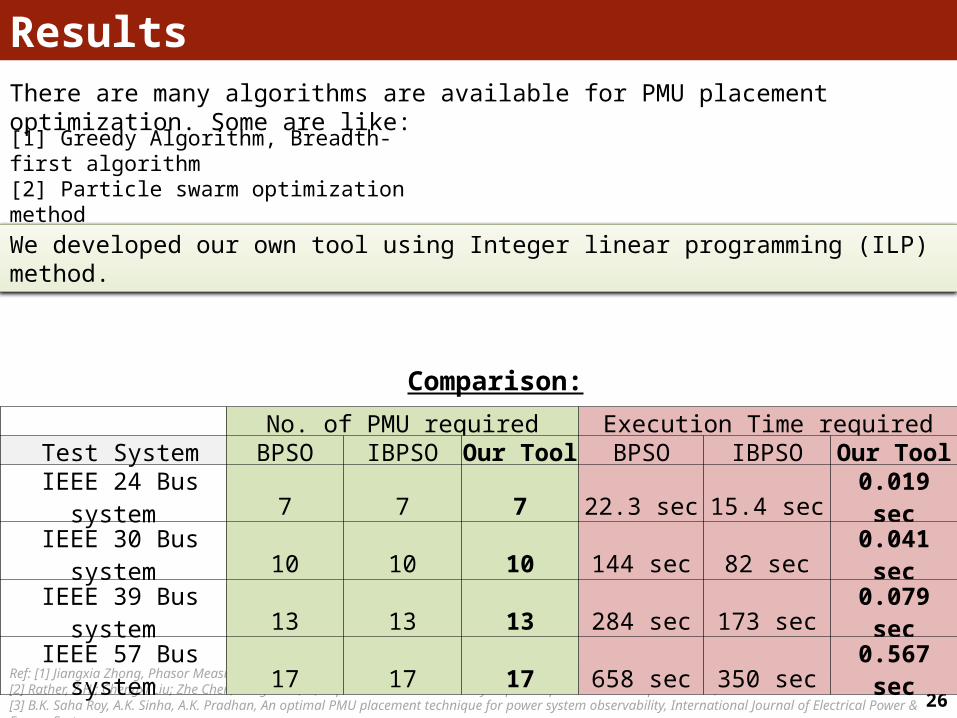
[1] Greedy Algorithm, Breadth-first algorithm[2] Particle swarm optimization method[3] 3 stage optimal PMU Placement
There are many algorithms are available for PMU placement optimization. Some are like:
Ref: [1] Jiangxia Zhong, Phasor Measurement Unit (PMU) Placement Optimisation in Power Transmission Network based on Hybrid Approach;[2] Rather, Z.H.; Chengxi Liu; Zhe Chen; Thogersen, P., ”Optimal PMU Placement by improved particle swarm optimization,”[3] B.K. Saha Roy, A.K. Sinha, A.K. Pradhan, An optimal PMU placement technique for power system observability, International Journal of Electrical Power & Energy Systems,
No. of PMU required Execution Time required Test System BPSO IBPSO Our Tool BPSO IBPSO Our Tool
IEEE 24 Bus system 7 7 7 22.3 sec 15.4 sec 0.019 sec IEEE 30 Bus system 10 10 10 144 sec 82 sec 0.041 sec IEEE 39 Bus system 13 13 13 284 sec 173 sec 0.079 sec IEEE 57 Bus system 17 17 17 658 sec 350 sec 0.567 sec
We developed our own tool using Integer linear programming (ILP) method.
Results
Comparison:
Slide 27
Results
Slide 28
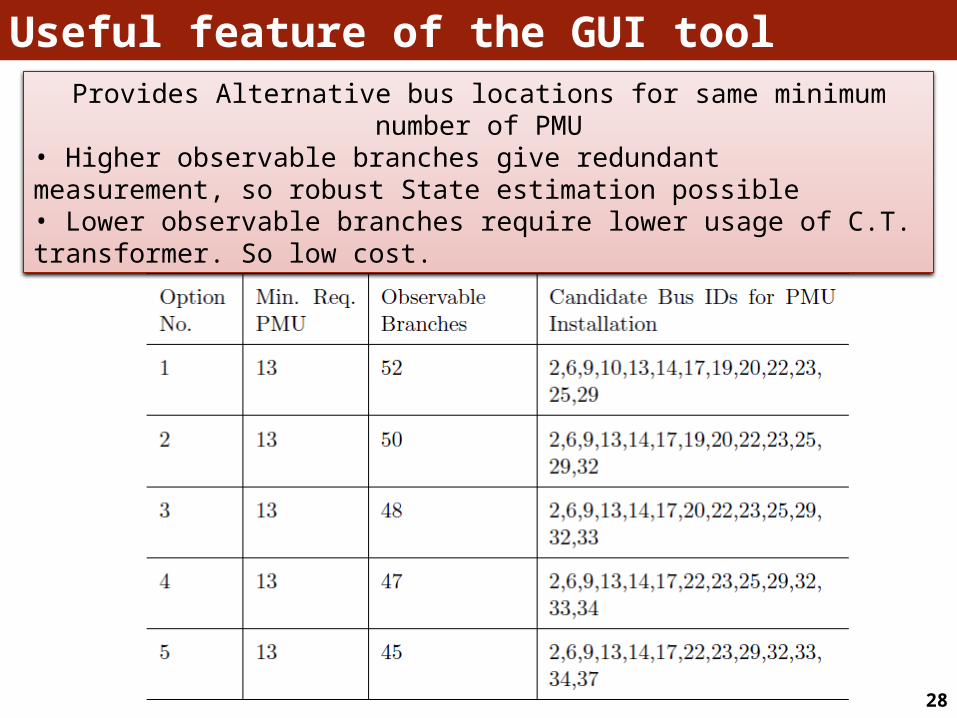
Useful feature of the GUI toolProvides Alternative bus locations for same minimum number of PMU
• Higher observable branches give redundant measurement, so robust State estimation possible• Lower observable branches require lower usage of C.T. transformer. So low cost.

Slide 29
13 PMUs are used with observable branches of 52
IEEE 39 Bus : Installed PMU locations

Slide 30
Technology Used/Developed:
Real-time Digital Simulation (RTDS®) Technology
Synchrophasor (PMU) Technology
Novel Algorithm for Optimal PMU Placement
Real-time Dynamic State Estimation
Real-time Voltage Stability Visualization

Slide 31
State Estimation (SE)
High Cost
of PMU
Limited
Number of PMU
Limited Number of direct measurement of bus
voltages
Need State
Estimation to get
indirect measurem
ent of remaining
buses
Traditional SCADA measurement based SE:• Based on P, Q, V and I measurements• Thus all SE algorithms are solution of non-linear equations in iterative process.• Unsuitable for real-time state estimation.
PMU based SE:• Based on V and I measurements• Thus linear state estimation (LSE) possible which can solve in one iteration.• Suitable for real-time state estimation.
Slide 32
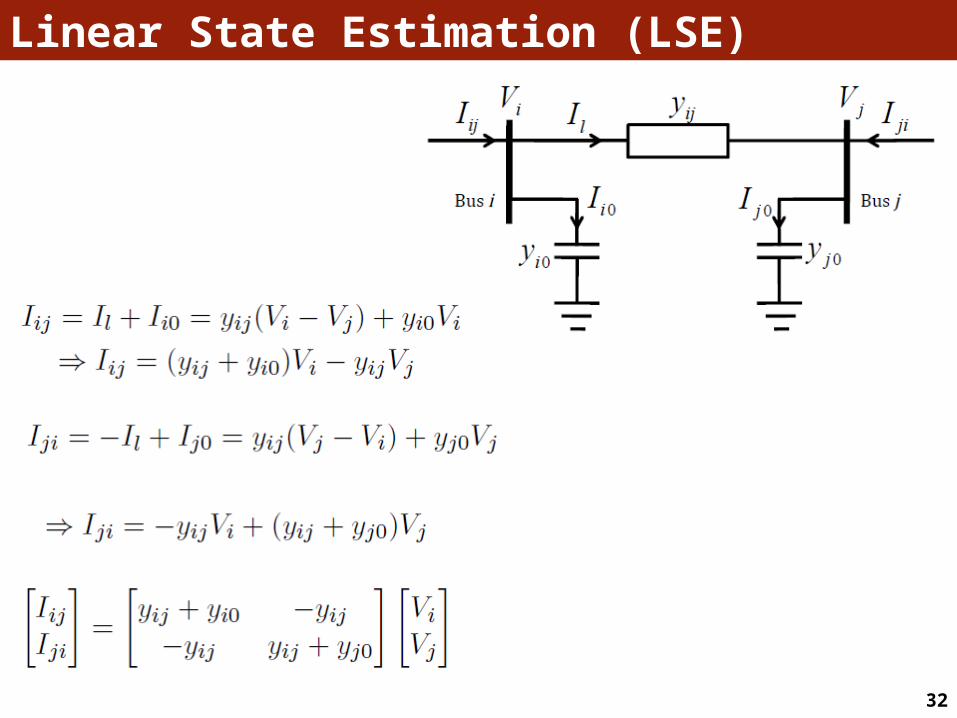
Linear State Estimation (LSE)
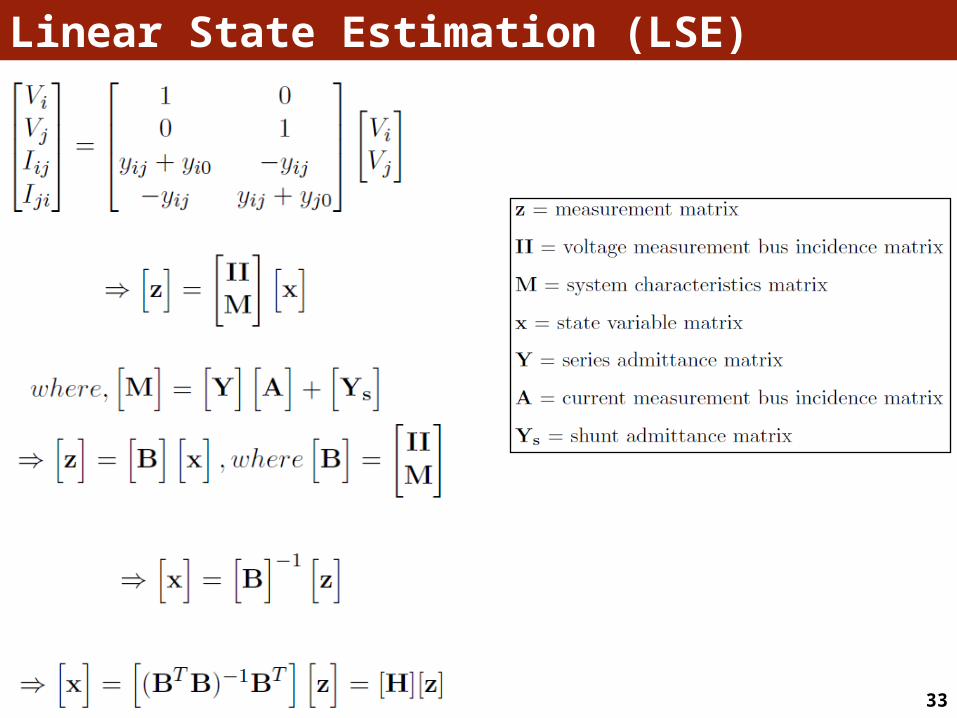
Slide 33
Linear State Estimation (LSE)
Slide 34
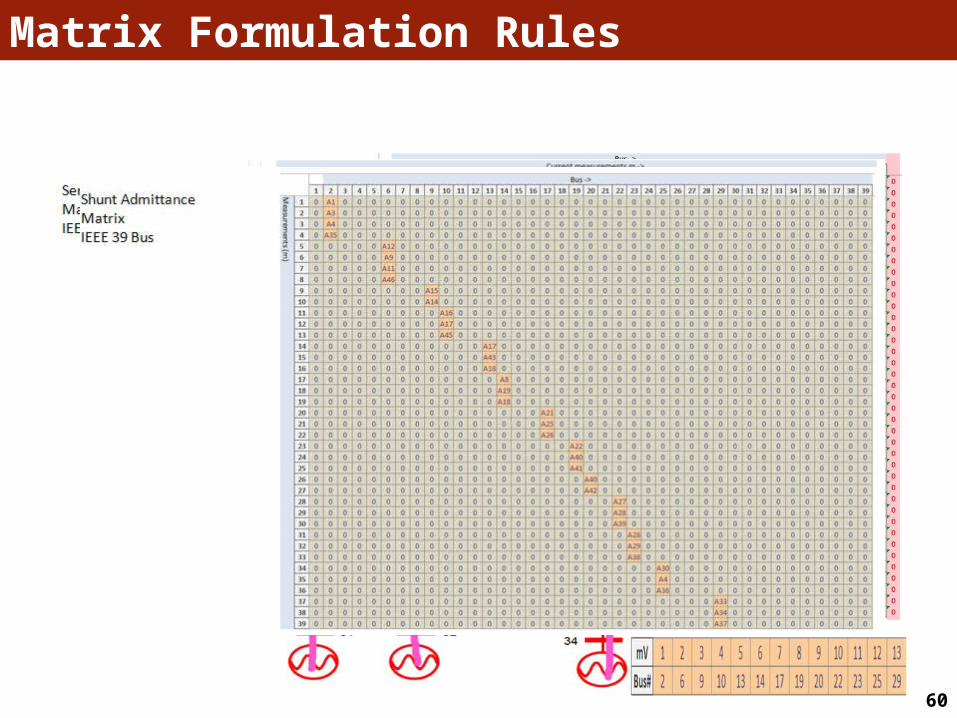
System Topology Matrix [H]
Voltage measurement bus incidence matrix
[II]
Current measurement bus incidence matrix
[A]
Series Admittance Matrix [Y]Shunt Admittance
Matrix [Ys]
Linear State Estimation (LSE)For big power system, robust algorithm required to update system topology matrix
PMU Measurement
matrix [z]LSE States
[x]
Slide 35
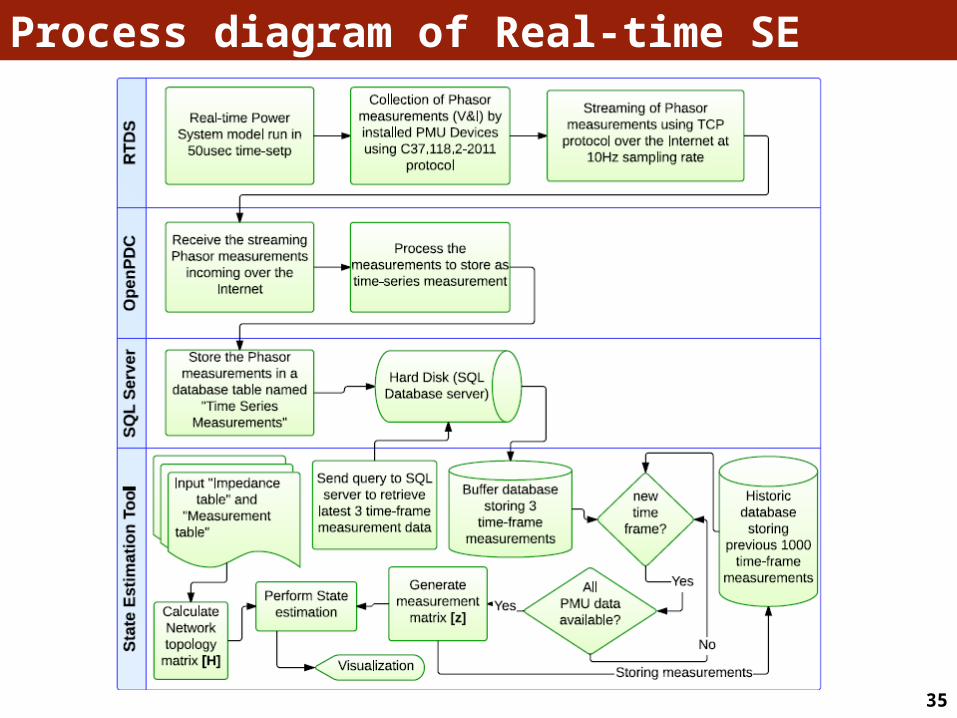
Process diagram of Real-time SE
Slide 36
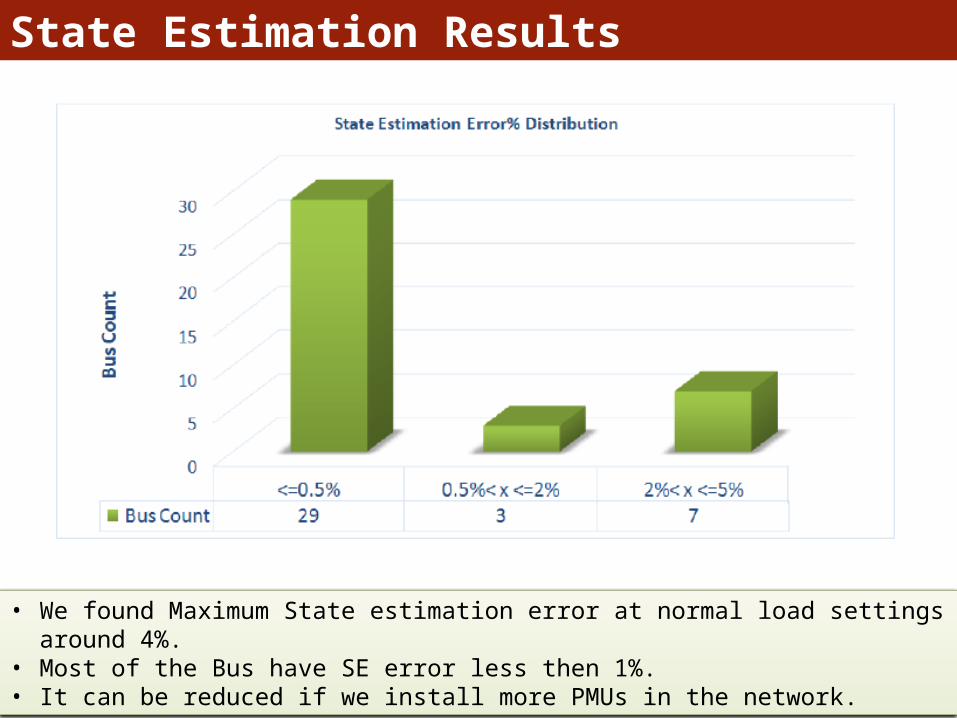
State Estimation Results
• We found Maximum State estimation error at normal load settings around 4%.• Most of the Bus have SE error less then 1%.• It can be reduced if we install more PMUs in the network.

Slide 37
Technology Used/Developed:
Real-time Digital Simulation (RTDS®) Technology
Synchrophasor (PMU) Technology
Novel Algorithm for Optimal PMU Placement
Real-time Dynamic State Estimation
Real-time Voltage Stability Visualization

Slide 38Ref: IEEE/CIGRE Joint Task Force on Stability Terms and Definitions; "Definition and Classification of Power System Stability".
“Power system stability is the ability of an electric power system, for a given initial
operating condition, to regain a state of operating equilibrium after being subjected
to a physical disturbance, with most system variables bounded so that practically the
entire system remains intact.” -- IEEE/CIGRE Joint Task Force
Voltage Stability:
• It refers to the ability of a power system to maintain steady voltages at all buses in
the system after being subjected to a disturbance.
• It depends on the ability to maintain equilibrium between load demand and load
supply from the power system.
Voltage Stability
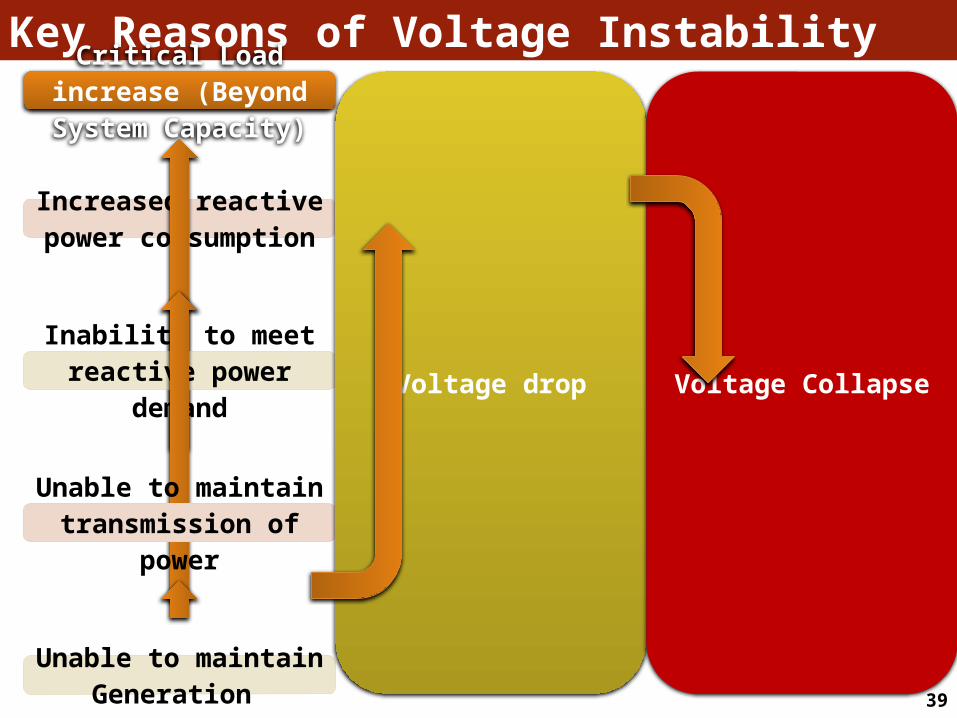
Slide 39
Key Reasons of Voltage InstabilityCritical Load increase
(Beyond System Capacity)
Increased reactive power consumption
Inability to meet reactive power demand
Unable to maintain transmission of power
Unable to maintain Generation
Voltage drop Voltage Collapse
Slide 40
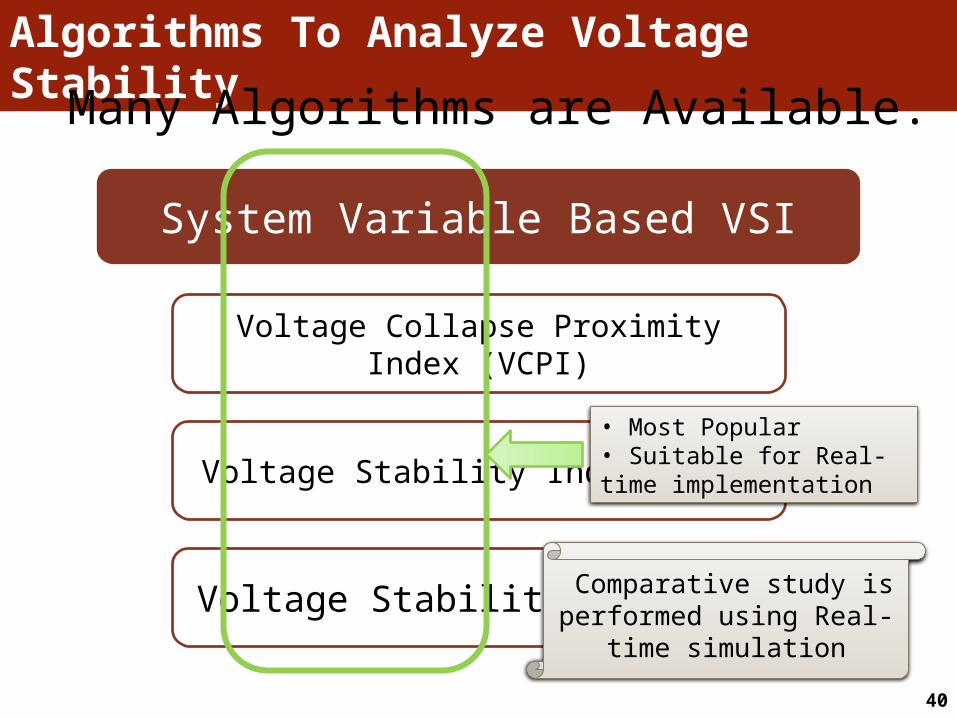
Algorithms To Analyze Voltage Stability
System Variable Based VSI
Voltage Collapse Proximity Index (VCPI)
Voltage Stability Index (VSI)
Voltage Stability Boundary
Many Algorithms are Available.
• Most Popular• Suitable for Real-time implementation
Comparative study is performed using Real-time
simulation

Slide 41
Voltage Collapse Proximity Indicator (VCPI)Based on maximum transferrable power through transmission line
Algorithms To Analyze Voltage Stability
• Index Range : 0 to 1• Higher means more vulnerable• 4 Separate Index.

Slide 42
Voltage Stability Index (VSI)Based on maximum transferrable power through transmission line
Algorithms To Analyze Voltage Stability
• Index Range : 0 to 1• Higher means more vulnerable• One Index.

Slide 43
The coefficients a, b, c are determined by points A, B and C in P-Q plane
Algorithms To Analyze Voltage Stability
Voltage Stability Boundary in P-Q Plane
Parabolic Equation:
• Stable Condition : Operating point inside Boundary• Unstable Condition : Outside boundary

Slide 44
Simulation
• Real-time simulations are performed to compare voltage stability analysis
algorithms.
• IEEE 39 Bus RTDS model with installed PMUS are USED.
• To simulate voltage instability condition, loads are increased by 1% after
each 10sec.
• Two case study:
• Case-1 with Infinite source representing strong grid
• Case-2 without Infinite source.
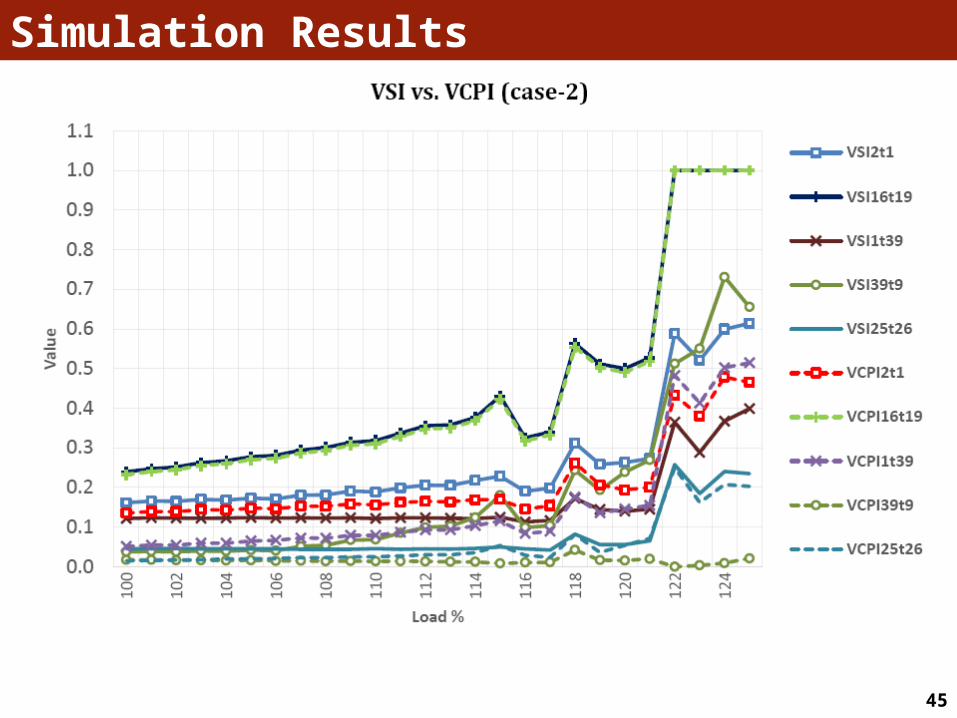
Slide 45
Simulation Results

Slide 46
Simulation ResultsVoltage Stability Boundary in P-Q Plane
Slide 47
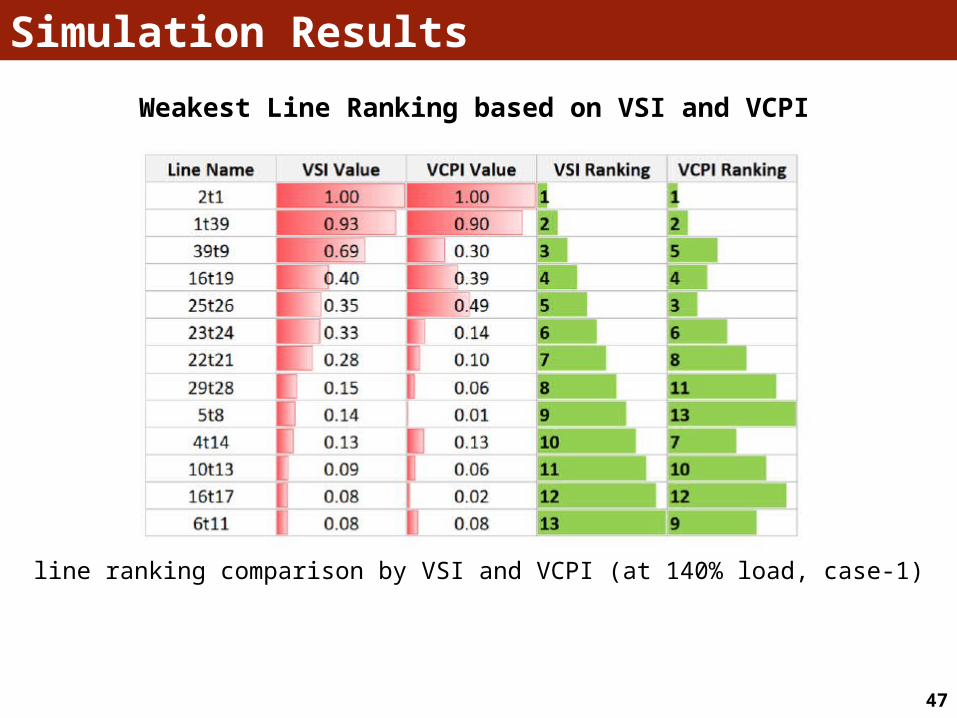
Simulation Results
line ranking comparison by VSI and VCPI (at 140% load, case-1)
Weakest Line Ranking based on VSI and VCPI
Slide 48
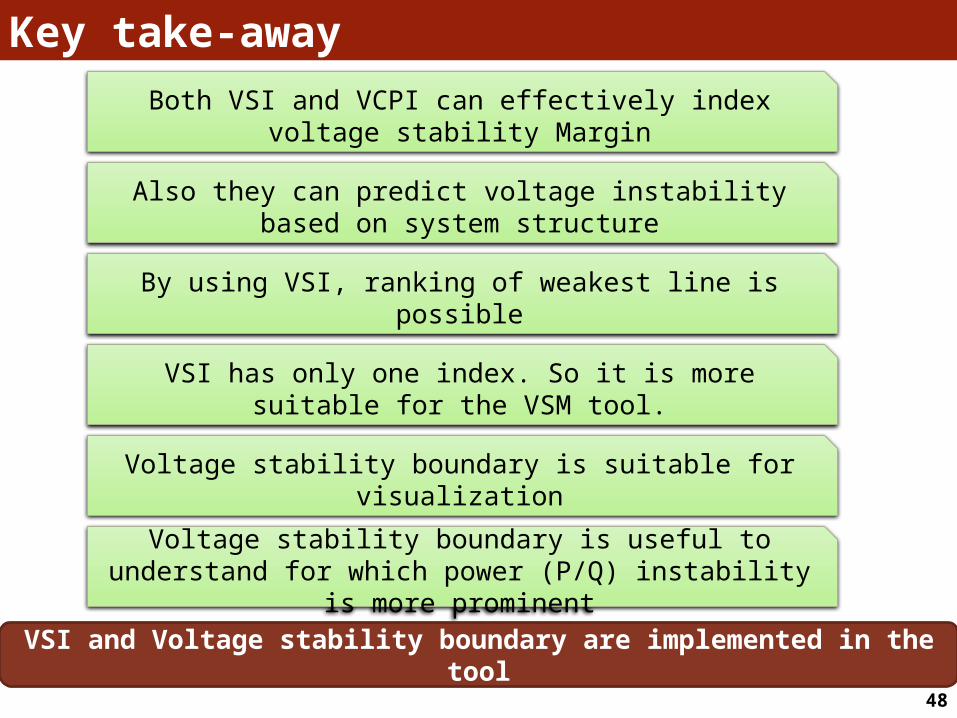
Key take-away
Both VSI and VCPI can effectively index voltage stability Margin
Also they can predict voltage instability based on system structure
By using VSI, ranking of weakest line is possible
VSI has only one index. So it is more suitable for the VSM tool.
Voltage stability boundary is suitable for visualization
Voltage stability boundary is useful to understand for which power (P/Q) instability is more prominent
VSI and Voltage stability boundary are implemented in the tool

Slide 49
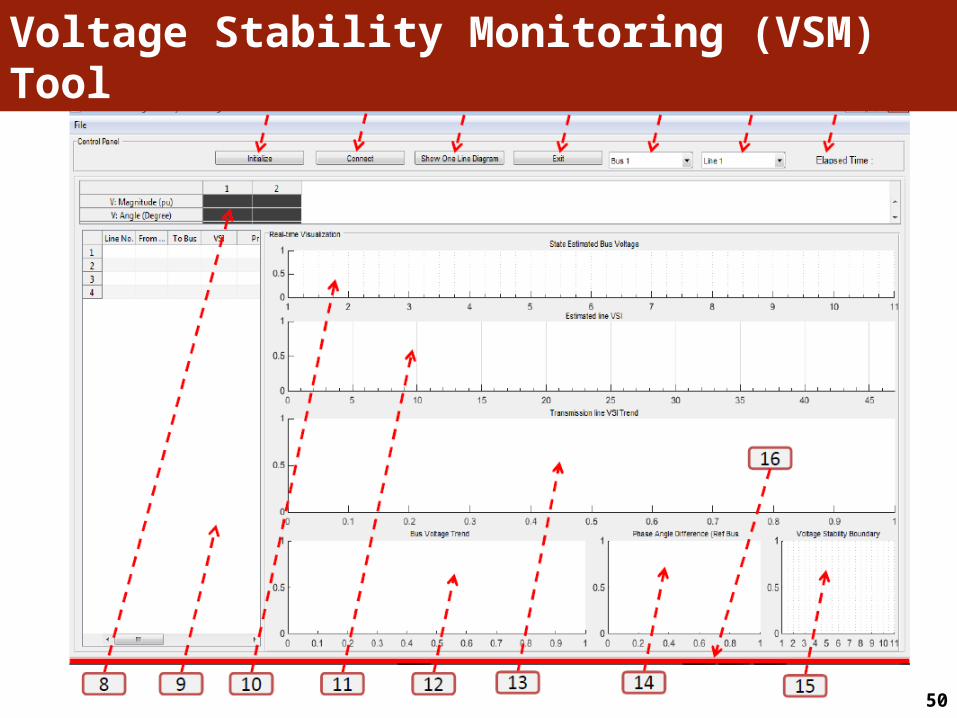
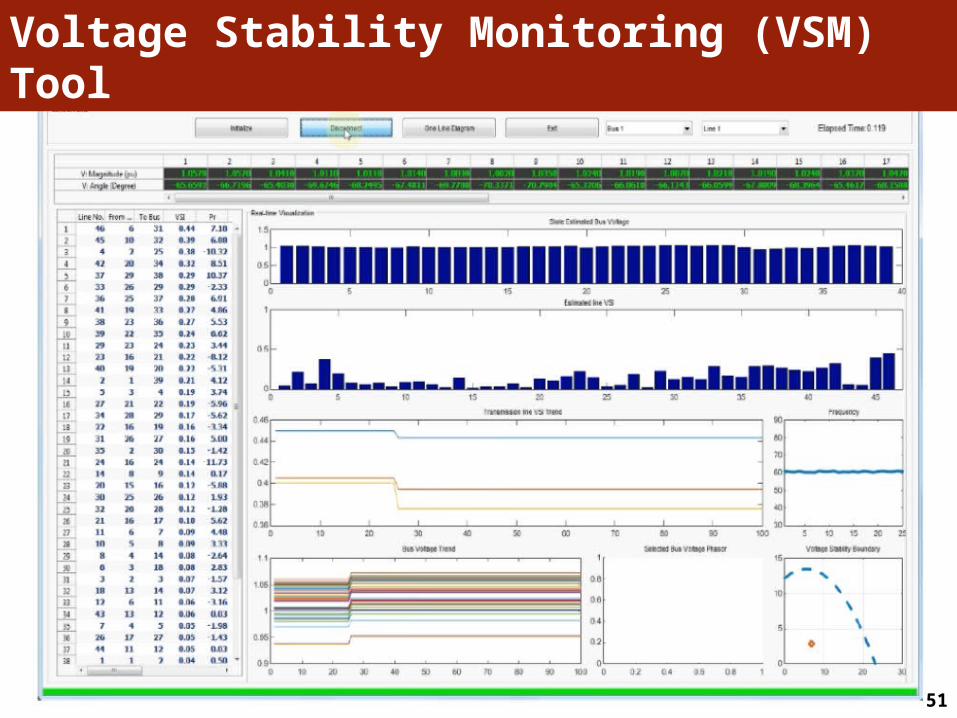
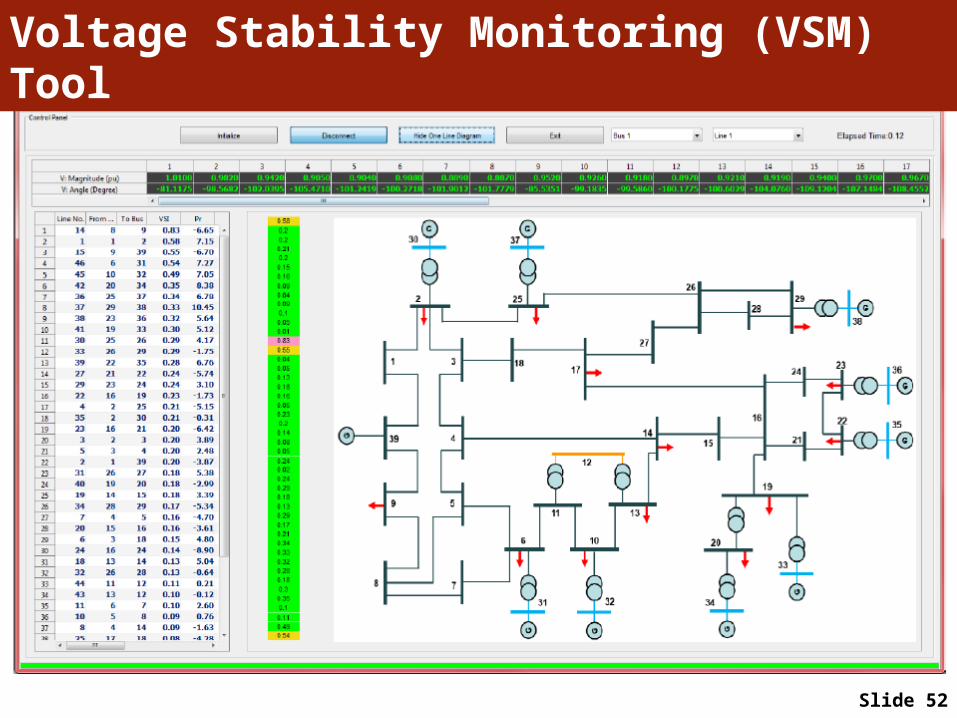
Voltage Stability Monitoring (VSM) Tool : Features
VSM
Ultra-fast data communication with SQL Sever
Real-time phasor data processor
Real-time dynamic estimator
Real-time VSI Calculation
Real-time weakest line ranking
Intuitive Visualization
Slide 50
Voltage Stability Monitoring (VSM) Tool
Slide 51
Voltage Stability Monitoring (VSM) Tool
Slide 52
Voltage Stability Monitoring (VSM) Tool

Slide 53
Key Contributions Of This Research
Developed real-time dynamic state estimator tool

Slide 54
Possible Future Work
Real-time application of PMU data can be explored and implemented
Power Oscillation Monitoring
Automatic Generator Shedding
Power Swing Detection and
Protection
Load Shedding under Remedial Action Schemes
(RAS)
Fault Location Identification

Slide 55
Conclusion
The research objective is accomplished by developing a real-time voltage stability analysis
and visualization tool.

Slide 56
Video Demonstration

Slide 57
Thanks Questions/ Comments/ Suggestions are most welcome.

Slide 58
Appendix
Slide 59
Slide 60
Matrix Formulation Rules
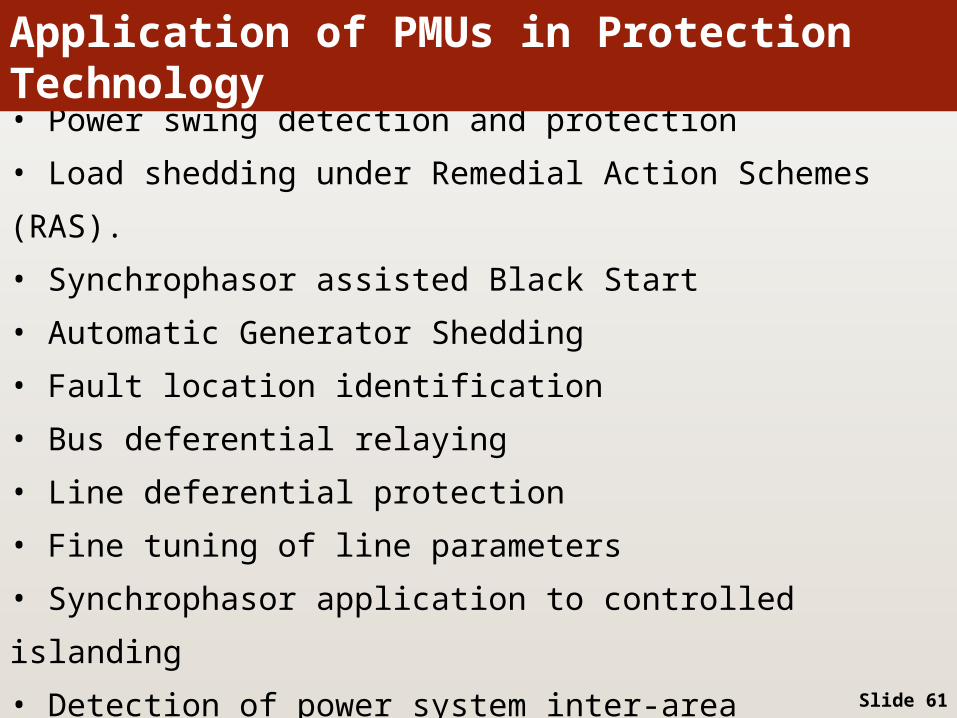
• Power swing detection and protection
• Load shedding under Remedial Action Schemes (RAS).
• Synchrophasor assisted Black Start
• Automatic Generator Shedding
• Fault location identification
• Bus deferential relaying
• Line deferential protection
• Fine tuning of line parameters
• Synchrophasor application to controlled islanding
• Detection of power system inter-area oscillations
• Synchrophasor-based Line Backup ProtectionSlide 61
Application of PMUs in Protection Technology

Slide 62
• Voltage stability index monitoring and prediction
• Line thermal monitoring
• Ambient and transient power oscillation monitoring
• Power oscillation monitoring
• Power damping monitoring
• Phase angle monitoring
• Wide area frequency monitoring
Application of PMUs in WAMS

Slide 63Ref: IEEE/CIGRE Joint Task Force on Stability Terms and Definitions; "Definition and Classification of Power System Stability“http://rochistory.com/blog/wp-content/uploads/2013/08/blackout2003.jpg.
• Possible outcomes of this instability :– Loss of load in an area – Tripping of lines and other elements leading to cascading outages– Loss of synchronism of some generators may result from these outages.– Voltage Collapse
– voltage instability leads to a blackout or abnormally low voltages in a significant part of the power system
Outcomes of Voltage Stability

Slide 64
Presentation Stage1 : Project Introduction : Real-time
“Real-time is a term often used to distinguish reporting or depicting events at the same rate and
sometimes at the same time as they unfold, rather than compressing a depiction or delaying a
report.”
- Wikipedia
“Real-time simulation refers to a computer model of a physical system that can execute at the
same rate as actual "wall clock" time. “
In other words, the computer model runs at the same rate as the actual physical system.
For example if a tank takes 10 minutes to fill in the real-world, the simulation would take 10
minutes as well.
- Wikipedia
Ref: http://en.wikipedia.org/wiki/Real-time
21Real-time
Slide 65
Presentation Stage1 : Project Introduction : Real-time
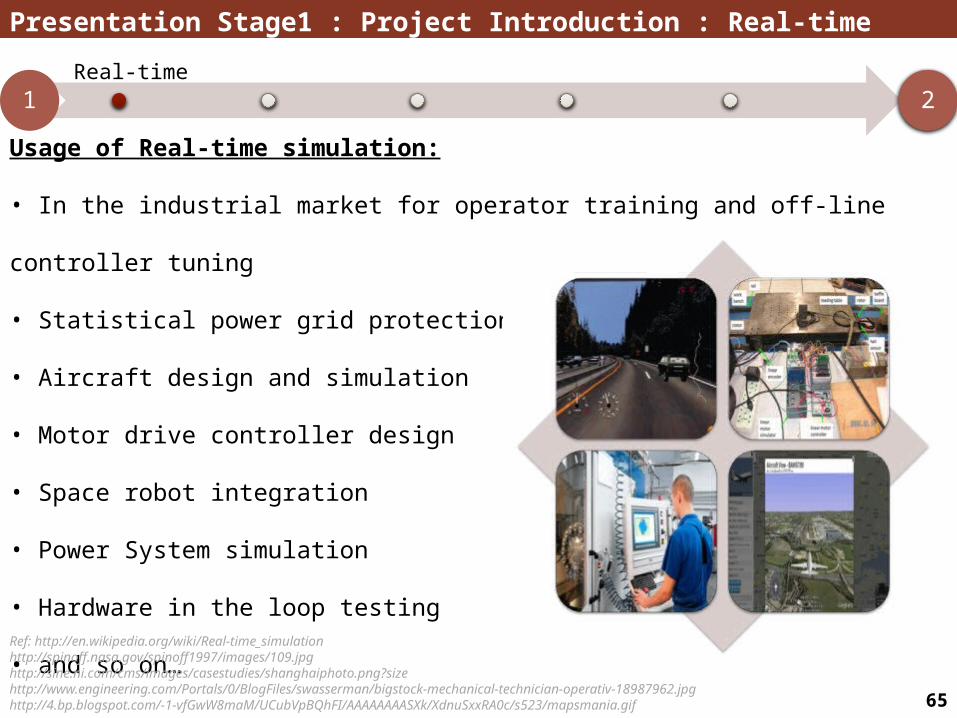
Usage of Real-time simulation:
• In the industrial market for operator training and off-line controller tuning
• Statistical power grid protection tests
• Aircraft design and simulation
• Motor drive controller design
• Space robot integration
• Power System simulation
• Hardware in the loop testing
• and so on…Ref: http://en.wikipedia.org/wiki/Real-time_simulationhttp://spinoff.nasa.gov/spinoff1997/images/109.jpghttp://sine.ni.com/cms/images/casestudies/shanghaiphoto.png?sizehttp://www.engineering.com/Portals/0/BlogFiles/swasserman/bigstock-mechanical-technician-operativ-18987962.jpghttp://4.bp.blogspot.com/-1-vfGwW8maM/UCubVpBQhFI/AAAAAAAASXk/XdnuSxxRA0c/s523/mapsmania.gif
21Real-time
Slide 66
21
Presentation Stage1 : Project Introduction : Power System Transmission Network
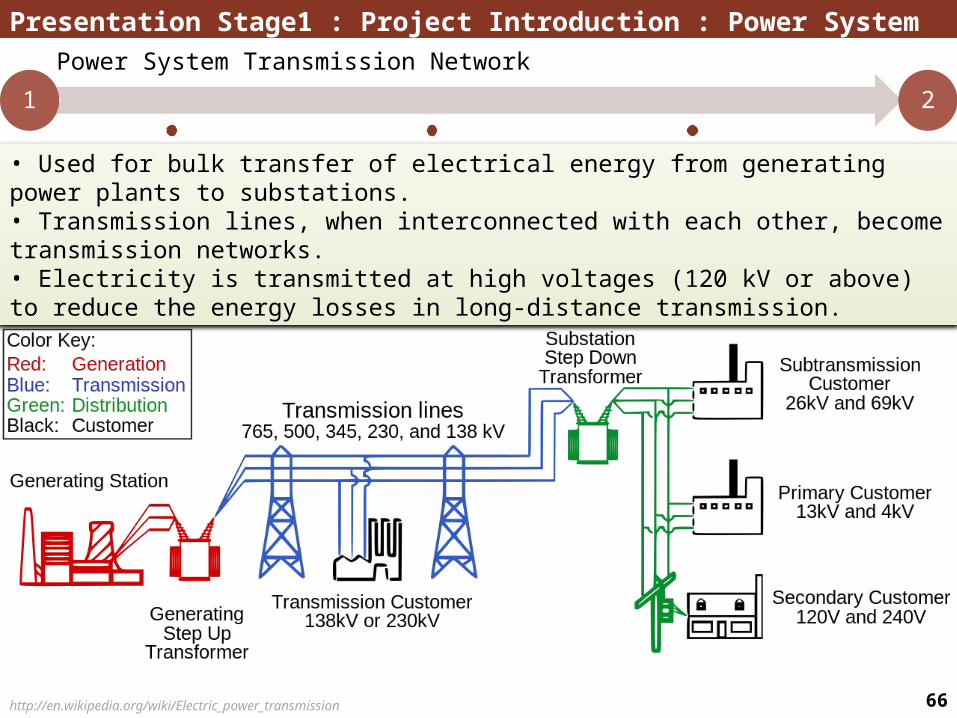
• Used for bulk transfer of electrical energy from generating power plants to substations.• Transmission lines, when interconnected with each other, become transmission networks.• Electricity is transmitted at high voltages (120 kV or above) to reduce the energy losses in long-distance transmission.
http://en.wikipedia.org/wiki/Electric_power_transmission
Power System Transmission Network
Slide 67
Presentation Stage1 : Project Introduction : Power System Transmission Network
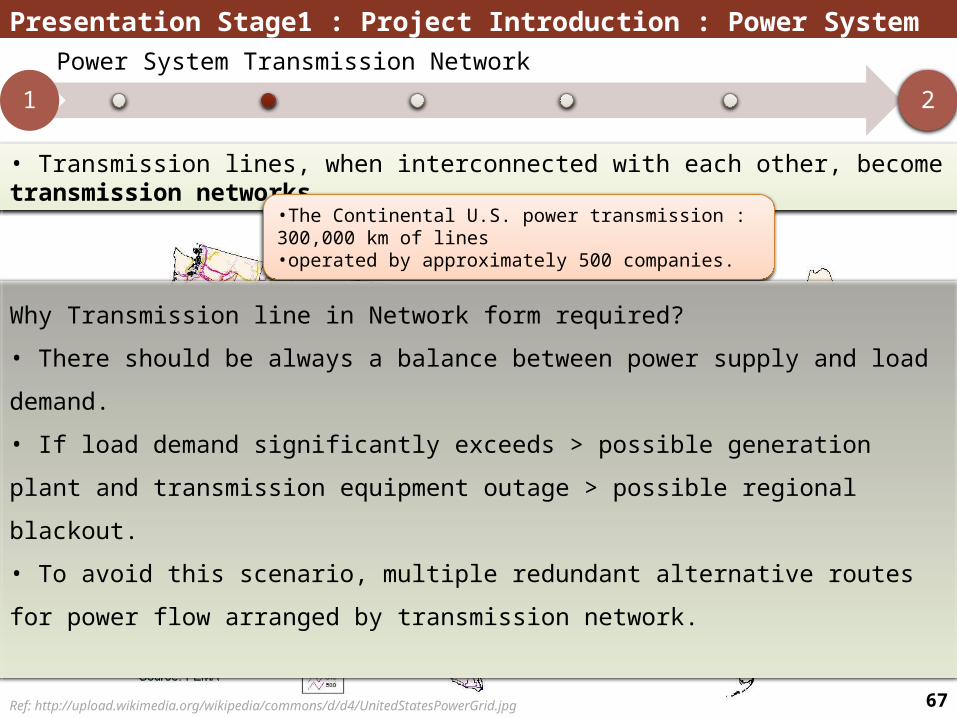
• Transmission lines, when interconnected with each other, become transmission networks.
•The Continental U.S. power transmission : 300,000 km of lines•operated by approximately 500 companies.
Ref: http://upload.wikimedia.org/wikipedia/commons/d/d4/UnitedStatesPowerGrid.jpg
Why Transmission line in Network form required?
• There should be always a balance between power supply and load demand.
• If load demand significantly exceeds > possible generation plant and transmission equipment
outage > possible regional blackout.
• To avoid this scenario, multiple redundant alternative routes for power flow arranged by
transmission network.
21
Power System Transmission Network
Slide 68
Appendix-1
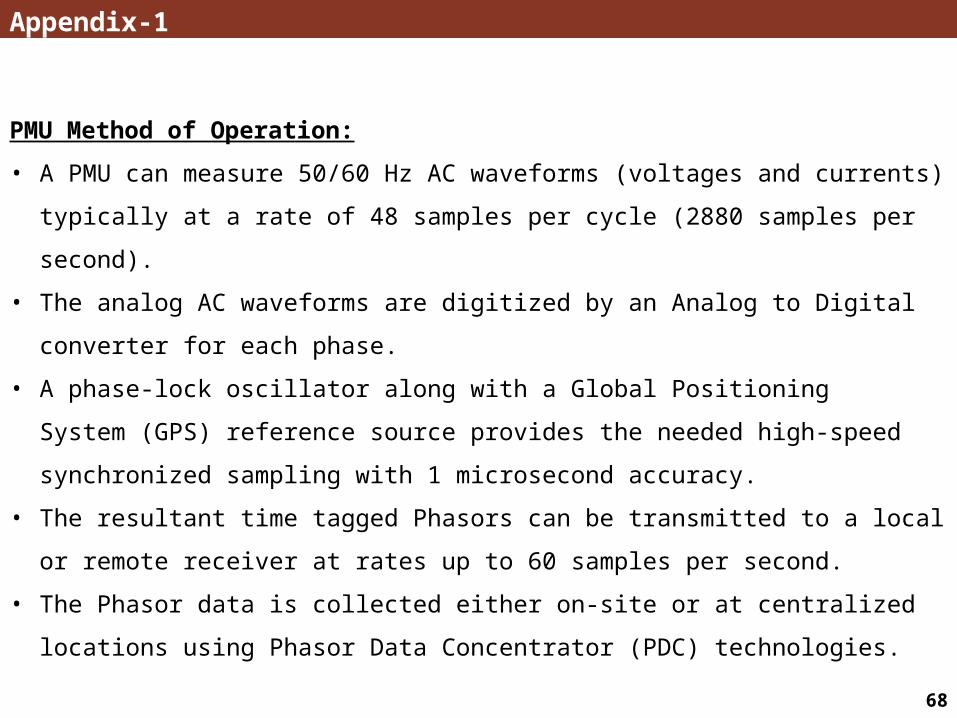
PMU Method of Operation:
• A PMU can measure 50/60 Hz AC waveforms (voltages and currents) typically at a rate of 48
samples per cycle (2880 samples per second).
• The analog AC waveforms are digitized by an Analog to Digital converter for each phase.
• A phase-lock oscillator along with a Global Positioning System (GPS) reference source
provides the needed high-speed synchronized sampling with 1 microsecond accuracy.
• The resultant time tagged Phasors can be transmitted to a local or remote receiver at rates up
to 60 samples per second.
• The Phasor data is collected either on-site or at centralized locations using Phasor Data
Concentrator (PDC) technologies.

Slide 69
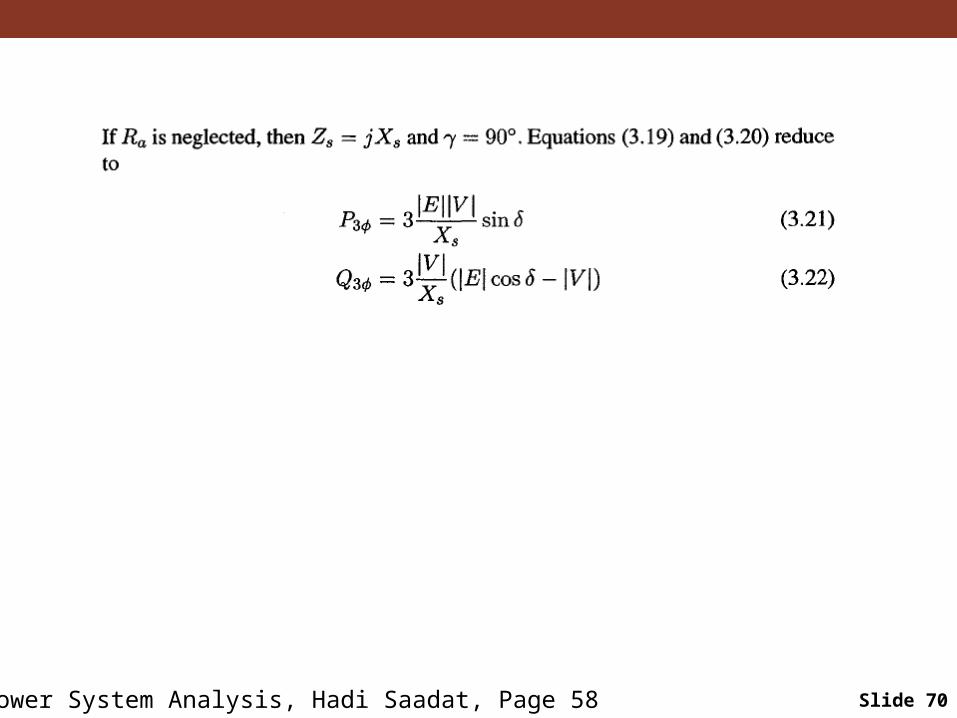
Research Phases:
Slide 70Ref: Power System Analysis, Hadi Saadat, Page 58