TRAFFIC and SAFETY - Michigan
45
'l N:5.4 2 ,, '_•" -- -- ' ) FREEWAY CURVE ANALYSIS TSD-G-102-69 TRAFFIC and SAFETY DIVISION DEPARTMENT OF STATE HIGHWAYS :. S'l' A 'l'E Of MICHIGAN
Transcript of TRAFFIC and SAFETY - Michigan
'l ~ N:5.4 19L.f:~,
C~ 2
,, ~'--'---- '_•" -- ~--- --' )
FREEWAY CURVE ANALYSIS
TSD-G-102-69
TRAFFIC and SAFETY
DIVISION
DEPARTMENT OF STATE HIGHWAYS :. S'l' A 'l'E Of MICHIGAN
FREEWAY CURVE ANALYSIS
TSD-G-102-69
by Donald J. Mercer, PE
Standards Unit
Traffic Geometries Section
Traffic and Solely Division
MICHIGAN DEPARTMENT OF STATE HIGHWAYS
State Highways Building
Post Office Drawer K
Lansing, Michigan 48904
August 1969 Second Printing June 1973

MICHIGAN STATE HIGHWAY COMMISSION
Charles H. Hewitt, Chairman Wallace D. Nunn, Vice Chairman
Louis A. Fisher Claude J. Tobin
MICHIGAN DEPARTMENT OF STATE HIGHWAYS
Henrik E. Stafseth John P. Woodford . Gerald J. McCarthy John G. Hautala Harold H. Cooper . Peter H. DeCamp John J. Kanillopoolos.
State Highway Director Deputy State Highway Dir~ctor Asst. Deputy State Highway Director Acting Chief, Bureau of Operations Engineer of Traffic and Safety Traffic Geometries Engineer Geometries Standards Engineer
MICHIGAN DEPARTMENT OF STATE HIGHWAYS State Highways Building
P. 0. Drawer K Lansing, Michigan 48904
----------------------- ----------------------------
THE STATE HIGHWAY COMMISSION
Charles H. Hewitt, Chairman
Wallace D. Nunn, Vice Chairman
Louis A. Fisher
Claude J. Tobin
MICHIGAN DEPARTMENT OF STATE HIGHWAYS
Henrik E. Stafseth, State Highway Director
John P. Woodford, Deputy State Highway Director
Gerald J. McCarthy, Asst. Deputy State Highway Director
John G. Hautala, Acting Chief, Bureau of Operations
Harold H. Cooper, Engineer of Traffic and Safety
Peter H. DeCamp, Traffic Geometries Engineer
John J. Kanillopoolos, Geometries Standards Engineer
August 1969

Freeway Curve Analysis
ABSTRACT
INTRODUCTION
purpose of the study approach used
CONCLUSION
summary recommendations
ACCIDENTS AT THE CURVES
sample of the whole description of the sample interpretation of the data accidents at curves accidents at interchanges accidents at eight curves
RANKINGS OF THE CURVES
method of evaluation limitations of the evaluation drivers' observations analysis of a sample of these curves rankings of I-94 rankings at interchanges curves ranked poor at 60 mph
ACCIDENTS COMPARED TO THE RANKINGS
agreement between accident rates and rankings high-accident curves
1
4
9
22
34
Figure
1
2
3
4
5
6
7
Figures
Actual Accident Rates for Each Class Interval Compared to 99 percent Confidence Interval
Map of the Analyzed Section of I-94
Relationship between Accident Rate and Degree of Curvature, 1964-66
Comparison between Interchange and Noninterchange Accident Rates
Daytime Passenger Car Speeds, Michigan Rural Freeways, July 1967
Diagrams of the Curves Ranked Poor at 60 mph
Comparison of Ratings with Accident History of I-94, 1964-66
4
10
18
20
23
32
35
Table
1
2
3
4
5
6
7
8
9
10
Tables
Accident Rates for Each Range of Degree of Curvature, 1964-66
Comparison of the Accident Rates between the Newer Portion of I-94 and the Detroit Industrial Expressway Portion, 1964-66
Superelevation on the Curves in the Entire Section of 1-94
Curve Rankings for Each Freeway, Entire System
Objections to the Fair and Poor Curves in the 465-Curve Sample
Superelevation on the Curves in the 465-Curve Sample
1-94 Curve Ranking by Degree of Curvature
Curve Rankings for Each Freeway, Curves within Interchange Areas; and Comparison with Non-interchange Curves
Comparison of I-94 Rankings to Accident Rates, 1964-66
The Curves Having an Accident Rate Greater than 200 Acc/100 MVM, 1964-66
16
18
19
26
28
29
30
31
34
36
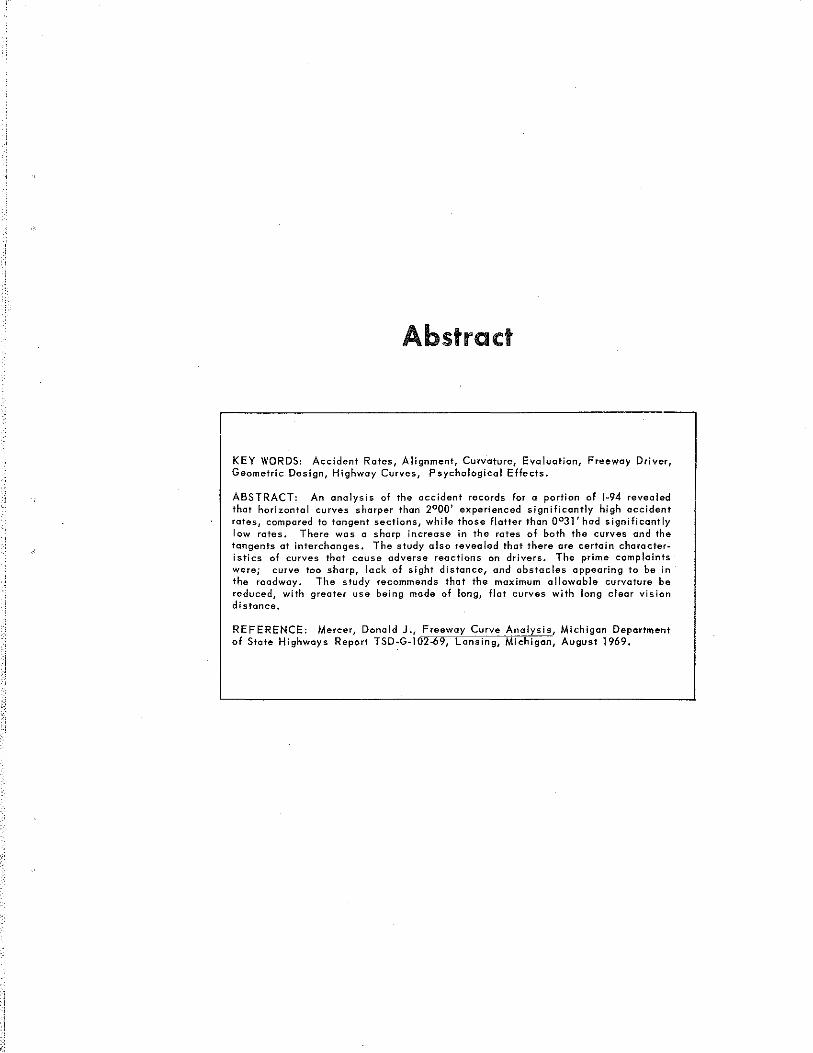
Abstract
KEY WORDS: Accident Rates, Alignment, Curvature, Evaluation, Freeway Driver, Geometric Design, Highway Curves, Psychological Effects.
ABSTRACT: An analysis of the accident records for a portion of 1~94 revealed that horizontal curves sharper than 2°00' experienced significantly high occident rates, compared to tangent sections, while those flatter than 0°3l'had significantly low rates, There was a sharp increase in the rates of both the curves and the tangents at interchanges, The study also revealed that there are certain characteristics of curves that cause adverse reactions on drivers. The prime complaints werej curve too sharp, lack of sight distance, and obstacles appearing to be in the roadway. The study recommends that the maximum allowable curvature be reduced, with greater use being mode of long, flat curves with long clear vision distance.
REFERENCE: Mercer, Donald J., Freeway Curve Analysis, Michigan Department of State Highways Report TSD~G-102-69, Lansing, Michigan, August 1969.
Introduction
PURPOSE OF THE STUDY
The driving public has complained that some of the
horizontal curves on Michigan's freeways are uncomfortable
and seem unsafe at freeway speeds.
This study investigates the accident history of one of
those freeways, I-94, to determine if the curves are more
hazardous than the tangents and evaluates the curves on all
of the freeways to determine if they do, in fact, cause driver
apprehension, all with the intention of improving design cri-
teria. Only the freeway lanes are considered; the interchange
ramp curves and ramp accidents are not included, since ramp
alignment is not typical of freeway lanes.
Design criteria is constantly being improved. For example,
during World War II the Michigan Department of State Highways
designed the Detroit Industrial Expressway at what was then
considered to be 100 mph standards; now this road is to be
virtually rebuilt to meet modern standards for 70 mph. Early
design features, such as narrow medians, at-grade railroad
crossings, at-grade intersections, barrier curb at underpasses,
and wing walls at the edge of the shoulder, are no longer ac-
cepted in rural freeway design. These improved standards re-
sulted from observing the effects that alignment, grade, and
geometries have on traffic flow and safety.
-1-
~!
About one-fourth of Michigan's freeway mileage involves a
change in horizontal alignment, using curves of some definite
degrees and lengths. By observing how successful the motorists
are at negotiating these curves, this study will suggest im-
provements in current design practices.
APPROACH USED
The data for this study was obtained from the three-year
(1964-66) accident records of 200 miles of I-94, stretching
across southern Michigan from the Indiana border to Detroit.
These records were investigated to determine which of the 4602
reported accidents occurred on the 229 curves and which occurred
on tangents. They were compared to the traffic volumes over
that same period to give the results in ''accidents per 100 mil-
lion vehicle miles'' (Acc/100 MVM).
The curves were grouped into seven Class Intervals of
curvature, each interval representing 1/2 degree. The accident
rate of each interval was computed and compared to the rate for
the tangent sections, using the null hypotheses: "There is no
difference between the accident rate for this class interval
and the tangent rate". Or, in other words, ''the accidents are
randomly distributed, independant of the alignment''.
This hypothesis was tested using the probability equation:*
CONFIDENCE INTERVAL (TR) ± (Z Iff- 2~) where TR = Tangent Rate
V Traffic Volume in the Class Interval
Z Factor (2.576 for this study) correspon-
ing to the degree of confidence desired
*Marin, Donald A., "Application of Statistical Concepts to Ac-· cident Data,'' Public Roads, Vol. 34, No. 7 (April 1967) pp.l35-138.
-2-

The degree of confidence desired in this study is 99 per
cent -- if the null hypothesis is true, the actual rate will
fall within the confidence interval in 99 percent of all
samples, above the interval in 0.5 percent of all samples,
and below the interval in 0.5 percent of all samples. Thus,
if the actual rate falls outside of the confidence interval,
there is only 1 chance in 100 that the null hypothesis is
true; in such a case the null hypothesis is rejected and this
study then concludes that there is a significant difference
between the two rates.
In this equation, the confidence interval increases as
the traffic volume decreases.
In addition, all the curves on Michigan's 1964 rural free
way system were driven and ranked good, fair, or poe~ depend
ing on the reactions of the driver and the front-seat passenger.
These rankings are similarly grouped by degree of curvature.
The tangent sections, however, were not ranked, so the observ
ers' opinion of the curves compared to tangents cannot be
determined.
-3-
.. ~
Conclusion
SUMMARY
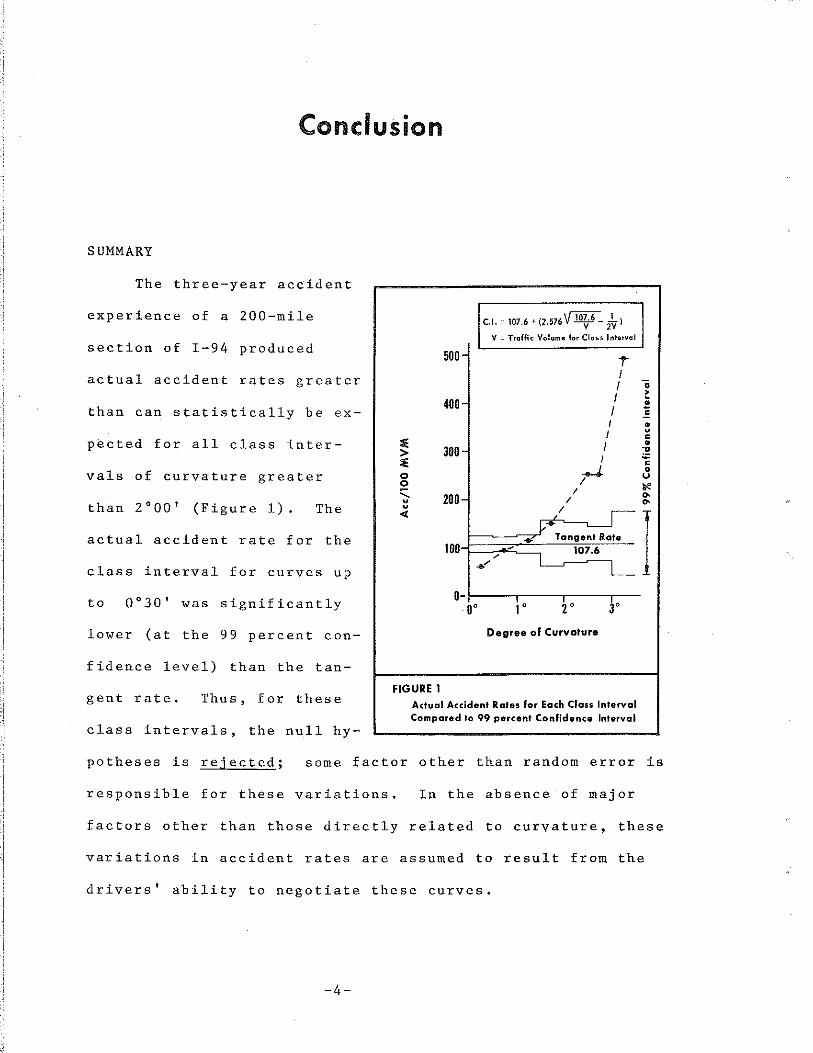
The three-year accident
experience of a 200-mile
section of I-94 produced
actual accident rates greater
than can statistically be ex-
pected for all class inter-
vals of curvature greater
than 2°00' (Figure 1). The
actual accident rate for the
class interval for curves up
to 0°30' was significantly
lower (at the 99 percent con-
fidence level) than the tan-
gent rate. Thus, for these
class intervals, the null hy-
.. • v 107.6- J... C.l.- 107.6- (2.576 V 2V)
V = Troffic Volume for Clot;s Interval
500 1" I I
400- I I
I I :e I > 300-
:e I
.....J. 0 0 I c:. 200-
I u I u I <I _y• I
..., Tangent Rate 100
/ l 107.6
..,-
0-, oo 1 0 20 30
Degree of Curvature
FIGURE 1
Actual Accident Rates for Each Class Interval Compared to 99 percent Confidence Interval
.. ~ • • • u c • ~ c 0 u !le
"' "'
I
potheses is rejected; some factor other than random error is
responsible for these variations. In the absence of major
factors other than those directly related to curvature, these
variations in accident rates are assumed to result from the
drivers' ability to negotiate these curves.
-4-
Horizontal curves help keep the driver alert by provid-
ing him with an ever-changing view of the scenery. They also
provide the driver with a side view of the traffic ahead, al
lowing him to observe the number, types, and the spacing be-
tween the vehicles ahead of him. But some drivers apparently
cannot cope with rapid changes of direction at freeway speeds.
The Department presently tends to use flat curves in
design. In the older portion of the route used in this study,
58 percent of the 33 curves are flatter than 1°31', while in
the new portion, 92 percent of the 196 curves are flatter than
1°31'.
Nearly every curve on the studied route is superelevated
at the rate now specified for its degree of curvature or at a
steeper rate. The crown was carried through the curve, how-
ever, so the lane on the outside of the curve was superelevated
at a lower rate.
Interchanges affect accident rates: the accident rate
for curved roadways in interchange areas increased faster than
did the accident rate for tangent roadways in interchange areas.
This study, however, did not obtain sufficient evidence based
on accidents to justify a disapproval of curves within an inter
change.
The results of the observer-ranking portion of the study
were not conclusive. The probability of a curve being ranked
fair or poor did increase as the degree of curvature increased,
similar to the results of the accident portion. Upon review,
however, it is felt that the testing method used did not give
-5-
truly objective results. So the data from this portion can
be used only to make general observations.
The most common complaint given by the observers (to ex
plain the fair and poor rankings) was that the curves were too
sharp --a complaint found only on curves 1°45' or sharper.
The observers also objected to obstructions that blocked their
view of the roadway ahead, though they did not indicate how
many feet ahead they wanted to see.
The starkness of a bridge pier or similar structure ap
pearing to be in the path of the car also caused observer ap-
prehension. As the car approached the structure and the road
curved away from the obstacle, the observer realized that his
apprehension was unwarranted. But for a short time his atten
tion was needlessly drawn away from other aspects of driving,
such as the unexpected moves of other motorists.
RECOMMENDATIONS
On the basis of what was learned, this study makes five
recommendations:
1. The design criteria for horizontal curves on
rural freeways should be changed to:
1°30' Desirable Maximum Curvature,
2°00' Absolute Maximum Curvature.
2. Long, flat curves, 0°30' or flatter, should
be used in place of short curves and long
tangents.
3. Enough sight distance should be provided to
permit drivers to see beyond the curve.
-6-
This could be done by removing trees, bill-
boards, and road signs that obstruct vision.
Caution is required to avoid a kink appear-
ance on those curves where the driver can
see both tangents without refocusing his
eyes.*
4. Future structures should be so designed
that the driver can instantly see the opening
through which the road travels. On existing
structures the visual impact of piers 30 ft
or more from the pavement should be softened
(with shrubbery or pastel paints), so that
the driver is inclined to direct his attention
to the roadway and not to the piers.
5. The Traffic and Safety Division should con-
duct a study of the causes of accidents at
curves. The purpose of the study would be
to determine if there are any accident patterns
developing at the curves that can be correlated
to any of the design elements of the curves.
The method of study would be to choose a small
number of curves in each class interval (the
curves being as identical as possible to reduce
variables) and to closely examine each accident
at these curves to determine not only what
happened, but also why it happened (why the
*Smith, Bob L., and Yotter, E.E., ''Computer Graphics and Visual Highway Design", Highway Research Record Number~~. Highway Research Board, Washington, D.C., p, 60.
-7-
driver took whatever actions he did that
resulted in the accident). The various
design elements of the different curves
would be compared to frequency, type, and
causes of accidents. Such a study would
continue for several years and would investi
gate the accidents when they occur. The
written reports of accidents do not have the
detail required for an in-depth analysis.
-8-
Accidents at the Curves
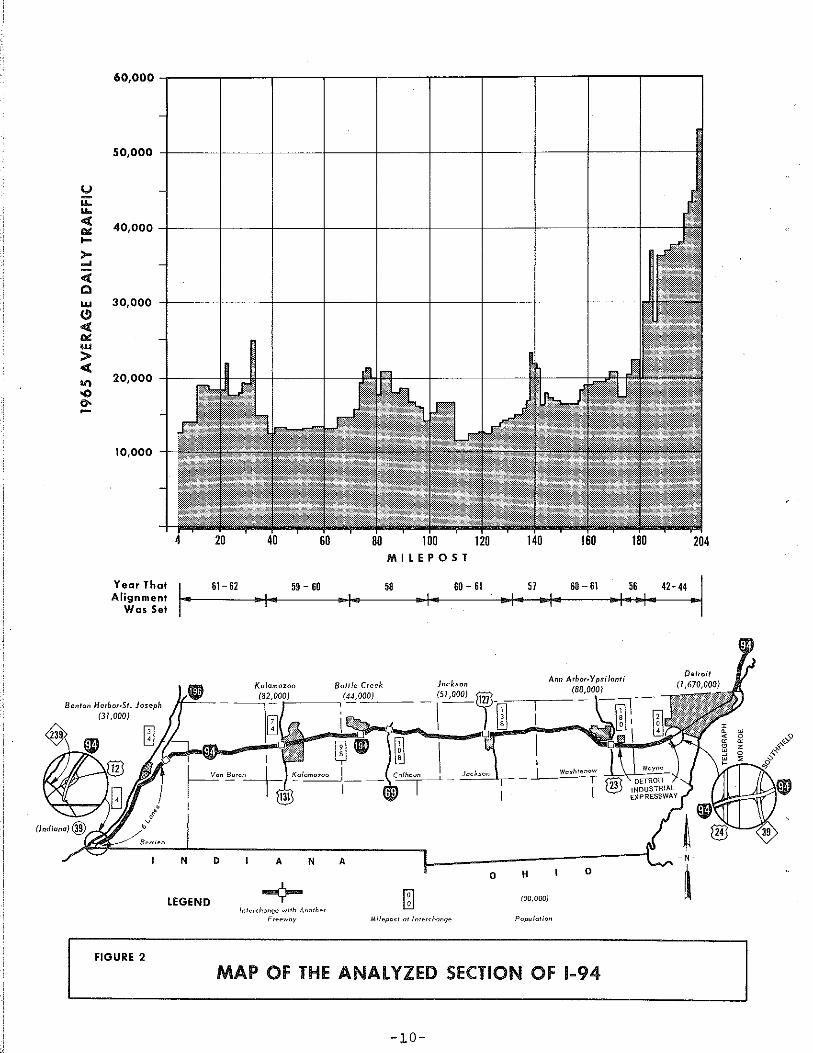
SAMPLE OF THE WHOLE
The three-year accident history of a 200-mile section of
I-94 was analyzed -- from the US-12 interchange at New Buffalo
(Milepost 4) to the Monroe Street structure (Milepost 204)
near Detroit, (Figure 2), Since the eastbound and westbound
lanes do not always follow the same alignment and since hazards
for one direction of travel might not affect traffic across
the median, each roadway was studied separately, yielding 399.4
miles of one-way roadway, with 98.4 of those miles (24.6 per
cent) contained in 229 horizontal curves.
This section constitutes 17 percent of Michigan's 1967
freeway mileage and is considered to be a representative
sample of the whole because:
1. Its traffic volumes reflect the wide range
found throughout the state. The 1965 average
daily traffic varied from 11,800 vehicles in
Calhoun County to 56,000 vehicles in Wayne
County.
2. It reflects the changes in design practices
over a 20-year span. Michigan's oldest free-
way, constructed in the early 1940's, is now
the eastern portion of the section; the western
portion was completed in 1963.
-9-
u ... .... <(
"' ,_ >-... <( Q .... (!) <(
"' w > <(
"' -o o--
50,000
40,000
30,000
20,000
10,000
MILEPOST
YearThat I 61-62 59-60 58 60-61 57 60-61 56 42·44 I Alignment r1----------~~·lr•--------~·~11·~------~·.ri••----------~~I~·.--~~I··~----~··I~··•+I··~--~~~
Was Set
Jackson (51 ,000)
Benton Harbor-St. Joseph (31,000)
Calhoun ______]__ IT -
D A N A
0 H
LEGEND Interchange with Another
Fre.,woy Milepo~l ot lntecchonge Population
FIGURE 2
MAP OF THE ANALYZED SECTION OF 1-94
-10-
DESCRI~TION OF THE SAM~LE
The limits of the analyzed section of I-94 were so
chosen because the roadway sections beyond those limits are
not typical rural freeways. The western limit is two miles
east of the temporary end of I-94. All traffic is either
entering or leaving a freeway at that point; the two-mile
buffer zone keeps the accompanying erratic movements from
influencing the study. The eastern limit is 1 1/2 miles west
of the Southfield Freeway (M-39), beyond that, I-94 becomes
an urban freeway into Detroit.
The section has whit~ 3-in. diameter shoulder delineators
spaced at 200 ft on the outside edge of the right-hand shoulder
along the mainline, double yellow delineators spaced at 50 ft
on the outside edge of both shoulders on interchange ramps,
and white edge line along the ramp pavement. There is no edge
marking on the freeway lanes. In 1968 obstruction panels were
installed on the piers of structures for overpassing cross
roads along I-94.
According to the Michigan Department of State Highways'
1967 Sufficiency Rating (a completely adequate section of
roadway rates 100), the analyzed section has a rating of 75
to 100 with two exceptions; one is the Detroit Industrial
Expressway (constructed in the 1940's to serve a bomber as
sembly plant, now Willow Run Airport) which is rated between
35 and 77; the other is the Jackson North Belt portion which
is rated between 58 and 78.
The design features of the Detroit Industr~al Expressway
included 11-ft lanes, a 14-ft median, a 31-ft clearance
-11-
between the freeway and service roads, close spacing of rel-
atively sharp curves, and at-grade intersections. Numerous
improvements have since been made on the roadway, such as
widening and capping the original unreinforced concrete pave
ment, installing median guardrail, and constructing grade
separations and interchanges. Yet the Department still plans
to do extensive work on the route to bring it up to current
standards.
INTERPRETATION OF THE DATA
If complete data on every accident were known, the con-
elusions would become obvious. As in most studies, on~y a
sample of the data is available for this study and this data
is not always fully objective.
No traffic accident can be charged to only one specific
cause, if a "cause" is considered to be i!..!!Y condition whose
correction would have prevented the accident. While there may
be an obvious major cause, such as a blown tire; there are also
other contributory causes, such as speed, soft shoulder, steep
sideslope, other vehicle nearby, or roadside obstacle which
had to be present in order for an accident to occur.
In investigating accidents, a major cause might never be
discovered. A car, for example, is found smashed into a center
bridge pier at a curve late one night. An investigation re-
veals the accident might be blamed on ''speeding'', or on ''driver
falling asleep" if no skid marks are found. With no witnesses
or survivors and with the front end of the vehicle demolished,
-12-
the fact that the steering and brake systems failed and caused
the car to travel only in a straight line might never be con
sidered.
A driver, in another example, is not likely to indict
himself on an accident report, even if he's told it cannot be
used against him. He might rightly point out that the other
vehicle pulled out of the entrance ramp at 30 mph right in
front of him and he couldn't slow down in time to avoid it.
Yet he withholds the fact that he had been looking for a
service station to match his credit card at the interchange
and didn't see the other car until he was too close to stop.
Normal effort to be accurate on the accident reports
does not prevent mistakes. In 1965 five accidents were re-
corded as occurring 0.2 mile west of the Cooper Street over-
pass in Jackson. Yet three of the accidents were also recorded
as occurring on a straight road, the other two on a curved road.
These accidents did not all happen in the same spot, although
the reports say that they did.
Any attempt, therefore, to isolate certain accidents as
being due solely to the fact that the road curves would be
inaccurate and meaningless. But a comparison of the overall
rates of the curves compared to the tangent rate can be used.
The accident history of I-94 showed a significantly high
accident rate for curves sharper than 2°00' and a significantly
low rate for curves flatter than 0°31'. If no factor other
than that the road turns at a specified rate can be found to
account for these differences in rates, then the responsibility
can be placed on the curves themselves.
-13-
Are there, then, any factors peculiar to the curves or
tangents to account for these differences?
There are two types of factors found on the highway; those
which are continuous over a portion of the highway and those
which are found in isolated conditions. Continuous factors
include such items a~ lighting, weather, pavement condition
and width, shoulder condition, median width, and shoulder
delineation. These factors exist on both the curves and the
tangents simultaneously and affect both the curves and the tan
gents simultaneously, although not necessarily to the same
degree. Consider, for example, natural lighting. The higher
curve accident rate cannot be blamed on the fact that it is
nighttime on the curves much of the time, since it is also
nighttime on the tangents. The combined effect of darkness and
a flat curve is different from the combined effect of darkness
and a sharp curve. But it is the alignment, not the lighting,
that is responsible for the difference.
Other factors are found in spots along the roadway, such
as median crossings, parked cars, railroad grade crossings,
structures and interchanges. All of these alter the accident
rates; if they were concentrated on either the curves or the
tangents, they would have biased the data.
Median crossover locations are determined by definite
specifications that make no reference to the alignment, so
it is assumed that the crossovers are randomly located relative
to the alignment. A similar assumption is made for parked
cars. Parking is illegal on the freeways, although there are
-14-
' f !
some violations, most vehicles parked along the freeway are
there due to mechanical failure. The occurrence of such
failures is independent of the alignment.
There are two railroad grade crossings on I-94, both on
tangents. Although there were no car-train collisions during
the three-year span, ten accidents* occurred at these cross-
ings. These accidents slightly bias the data; but they ac-
count for only 0.28 percent of the tangent accidents.
It is assumed that the horizontal alignment of the sec-
tion was not forced, in order to meet the structures on tan-
gent, and that the structures are randomly located relative to
the alignment.
Although interchanges might also be randomly located, the
effect that they have on the accident rates is given special
attention in this study.
* 1. One driver hit a railroad tie lying on the pavement 40 feet from the track.
2. Four drivers hit the crossing signal. Two fell asleep, one was forced off the road an~ the other was drunk.
3. Four drivers were hit when they slowed or stopped because the tracks were there. A salt truck was hit when it stopped to raise its blade before crossing the tracks (the only fatal accident involving the tracks) another vehicle was hit when it stopped because the warning lights were flashing (they were being tested) another was hit when it slowed because traffic was channeled to one lane due to work on the tracks; and the other was hit in the traffic buildup caused by a bus making its required full stop before crossing the tracks.
4. One driver claimed that he lost control while crossing the tracks.
-15-
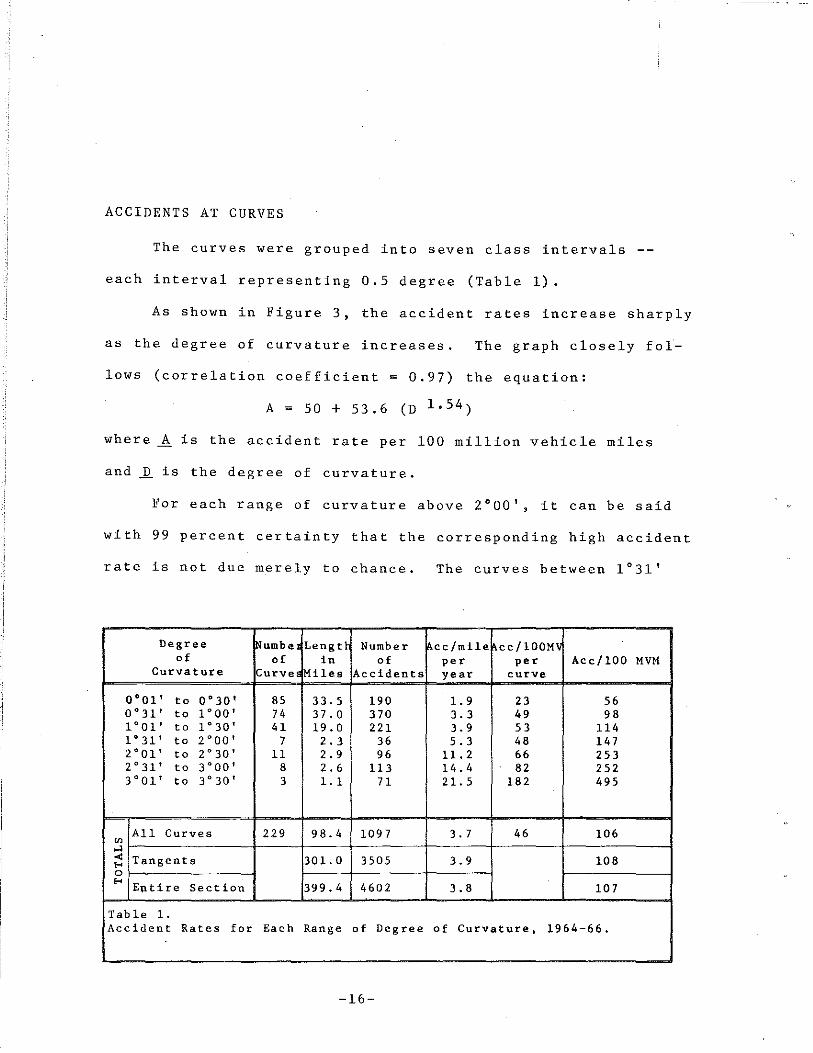
ACCIDENTS AT CURVES
The curves were grouped irtto seven class intervals
each interval representing 0.5 degree (Table 1).
As shown in Figure 3, the accident rates increase sharply
as the degree of curvature increases. The graph closely fol-
lows (correlation coefficient = 0.97) the equation:
A= 50+ 53.6 (D 1.54)
where A is the accident rate per 100 million vehicle miles
and J)_ is the degree of curvature.
For each range of curvature above 2°00', it can be said
with 99 percent certainty that the corresponding high accident
rate is not due merely to chance. The curves between 1°31'
Degree Numbe Lengtf Number !Ace/mile cc/100M' of of in of per per Acc/100 MVM
Curvature Curve Miles Accidents year curve
0°01' to 0°30~ 85 33.5 190 1.9 23 56 0°31' to 1°00' 74 37.0 370 3. 3 49 98 1° 0 1' to 1°30' 41 19.0 221 3. 9 53 114 1°31' to 2°00' 7 2. 3 36 5. 3 48 147 2°01' to 2°30' 11 2. 9 96 11.2 66 253 2°31' to 3°00' 8 2.6 113 14.4 82 252 )
0 Ql I to 3°30' 3 1.1 71 21.5 182 495
All Curves U)
229 98.4 1097 3.7 46 106 ... < Tangents 301.0 3505 3.9 108 ... 0 ...
Entire Section 399.4 4602 3. 8 107
Table 1. Accident Rates for Each Range of Degree of Curvature, 1964-66.
-16-
~~
and 2°00' had a combined rate 39 percent higher than the
tangent rate. But since the sample size of these curves is
small (2.27 miles), the confidence interval is large and the
sample did not fall outside the confidence limits (Figure 1).
The curves more gradual than 0°31' had a significantly lower
accident rate; about half the tangent rate.
Two other methods of computing the accident rates are
also given in Table 1. All three methods show the accident
rate increasing as the degree of curvature increases. How-
ever, it is felt that the two other methods do not present
an accurate picture. The 11 accidents per mile per year"
method ignores the volume. Since the sharper curves are con-
centrated on the high-volume portions of I-94, this method
tends to increase the relative value of the rates of the
sharper· curves. The ''Accidents per 100 million vehicles per
curve'' method ignores the length. Since flat curves are gen-
erally longer than sharp curves, this method tends to increase
the relative value of the rates of the flat curves. The
"Accidents per 100 million vehicle miles" method, which con
siders both length and volume, is therefore considered to be
the most representative method.
-17-
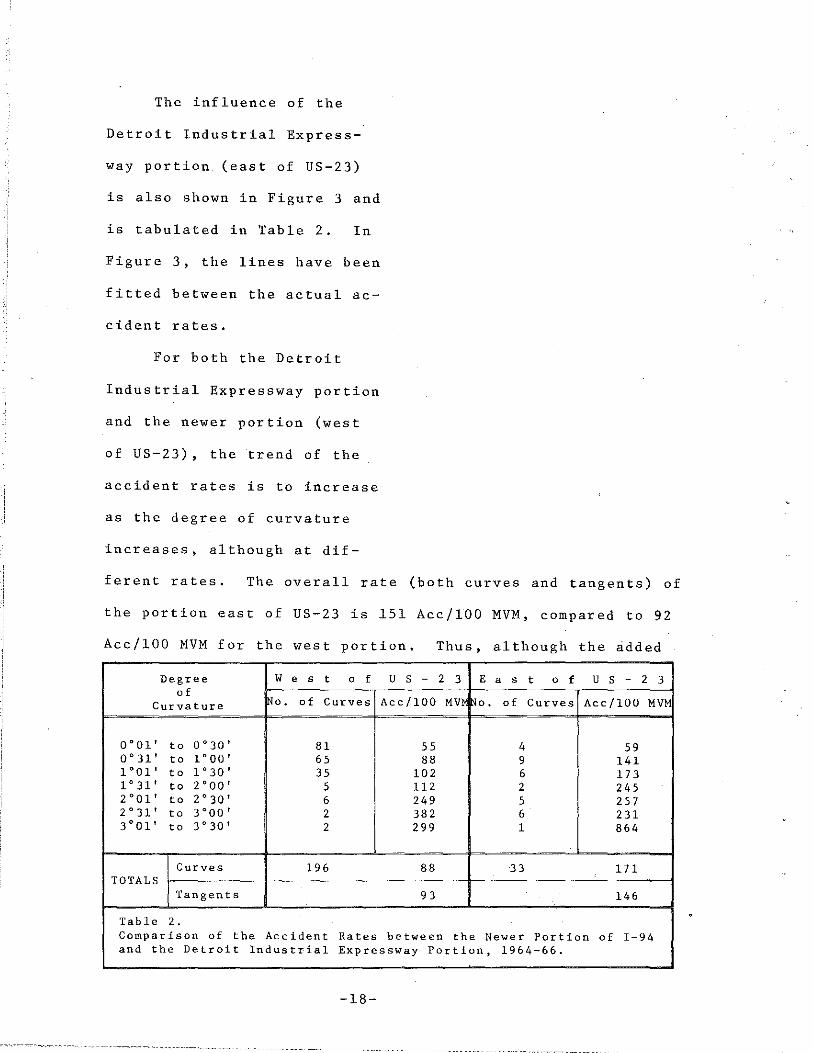
The influence of the
Detroit Industrial Express-
way portion (east of US-23)
is also shown in Figure 3 and
is tabulated in Table 2. In
Figure 3, the lines have been
fitted between the actual ac-
cident rates.
For both the Detroit
Industrial Expressway portion
and the newer portion (west
of US-23), the trend of the
accident rates is to increase
as the degree of curvature
increases, although at dif-
ferent rates. The overall rate (both curves and tangents) of
the portion east of US-23 is 151 Acc/100 MVM, compared to 92
Acc/100 MVM for the west portion. Thus, although the added
Degree w e s t 0 f u s - 2 3 E a s t 0 f u s - 2 3 of
Curvature No. of Curves Acc/100 MV~ No. of Curves Acc/100 MVM
0 ° 01' to 0°30' 81 55 4 59 0 ° 31' to 1°00 1 65 88 9 141 1°01' to 1°30' 35 102 6 173 1°31' to 2°00' 5 112 2 245 2°01' to 2°30' 6 249 5 257 2°31' to ) 0 00 I 2 38 2 6 231 3°01' to 3°30' 2 299 1 864
Curves 196 88 33 171 TOTALS
Tangents 93 146
Table 2. Comparison of the Accident Rates between the Newer Portion of I-94 and the Detroit Industrial Expressway Portion, 1964-66.
-18-
hazards of the older portion plus the higher concentration of
sharp curves and higher volumes did result in higher overall
accident rates, they did not combine to bias the general trend
of the rate curve.
A curve can be made easier to negotiate by: using a
spiral transition curve to introduce the curve, increasing
the superelevation rate for the curve, constructing a flatter
curve at the location, or some combination of these three.
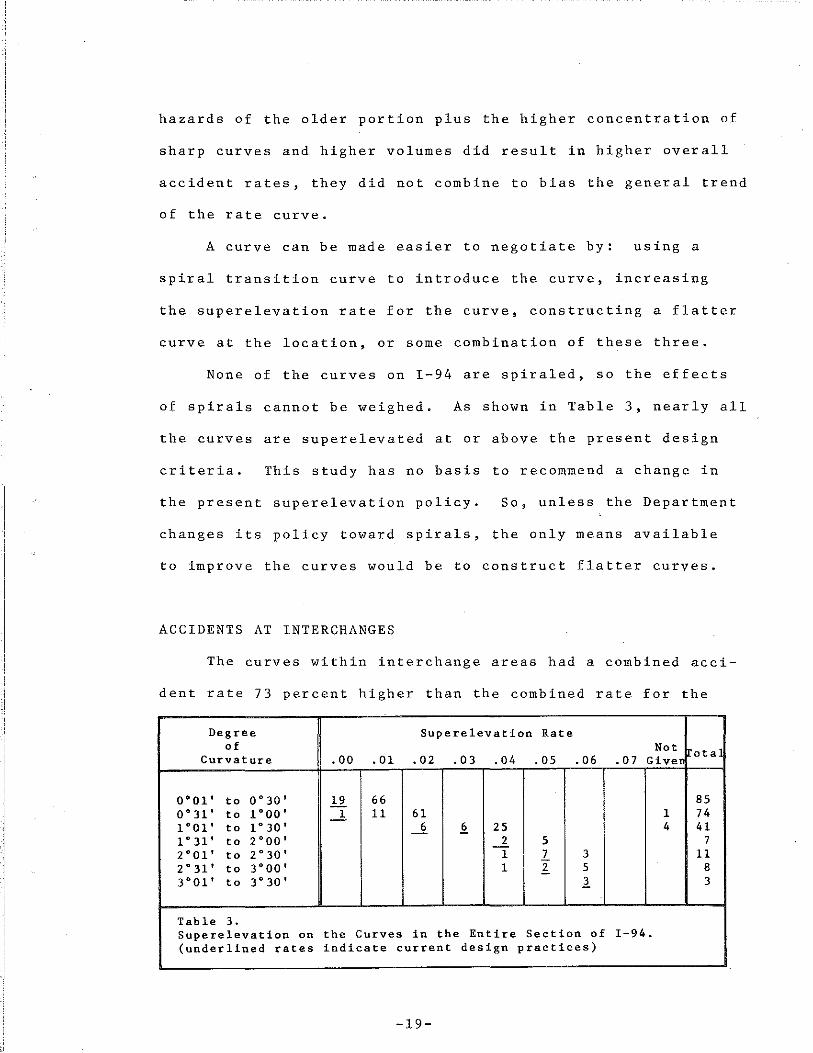
None of the curves on I-94 are spiraled, so the effects
of spirals cannot be weighed. As shown in Table 3, nearly all
the curves are superelevated at or above the present design
criteria. This study has no basis to recommend a change in
the present superelevation policy. So, unless the Department
changes its policy toward spirals, the only means available
to improve the curves would be to construct flatter curves.
ACCIDENTS AT INTERCHANGES
The curves within interchange areas had a combined acci-
dent rate 73 percent higher than the combined rate for the
Degree Superelevation Rate of Not rota
Curvature .00 .01 .02 .03 .04 .05 .06 .07 Give
o•o1' to 0°30' 1.2. 66 85 o•Jt' to 1•oo' __!_ 11 61 1 74 1°01' to 1° ]Q I ___&_ .2. 25 4 41 1° 31' to z•oo' 2 5 7 z•o1' to 2°30 1 1 l 3 11 2 ° 31 I to 3°00' 1 2 5 8 3°01' to 3°30' l 3
Table 3. Superelevation on the Curves in the Entire Section of I-94. (underlined rates indicate current design p rae t ices)
-19-
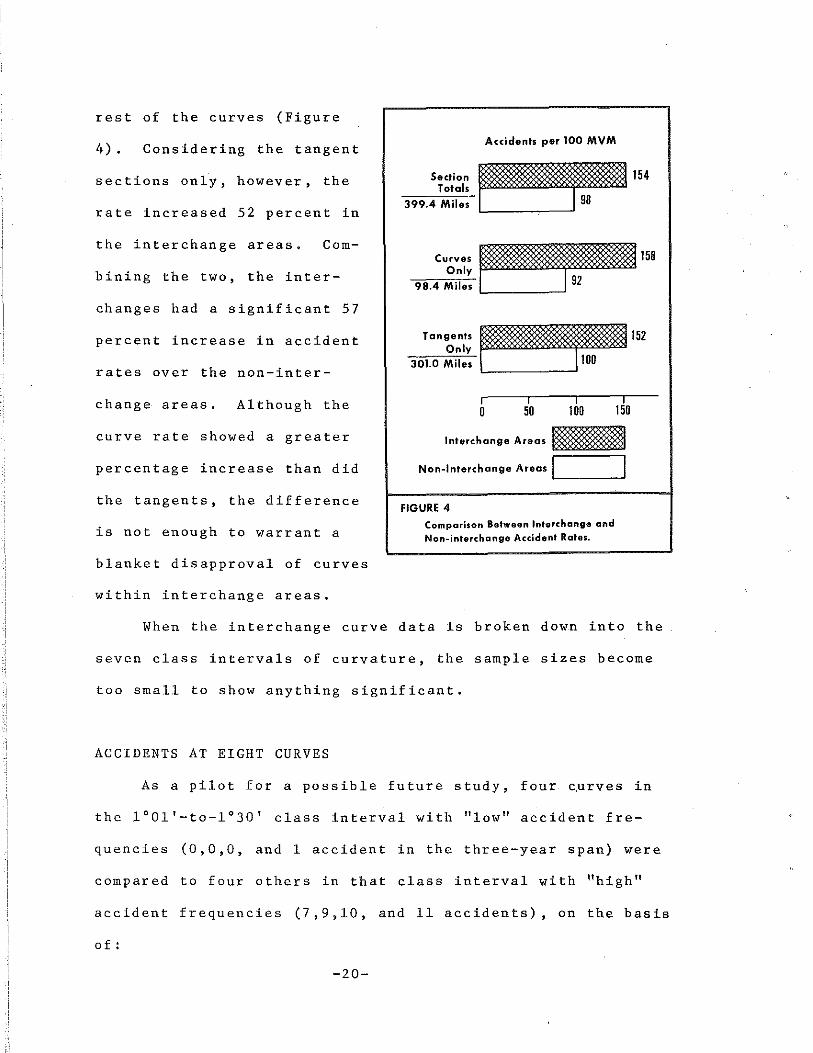
rest of the curves (Figure
4) • Considering the tangent
sections onlj, however, the
rate increased 52 percent in
the interchange areas. Com-
bining the two, the inter-
changes had a significant 57
percent increase in accident
rates over the non-inter-
change areas. Although the
curve rate showed a greater
percentage increase than did
the tangents, the difference
is not enough to warrant a
blanket disapproval of curves
within interchange areas.
Section Totals
399.4 Miles
Accidents per 100 MVM
154
.....-'."bC,:;-::~':-~ ~ 158 98.4 Miles
Tangents ~152 Only-·
-:3:::0""1."'0-cM~i 1-".,'- 1 00
0 50 100 150
Interchange Areas Bel Non-Interchange Areas L~-----'
FIGURE 4
Comparison Between Interchange and
Non-interchange Accident Rates.
When the interchange curve data is broken down into the
seven class intervals of curvature, the sample sizes become
too small to show anything significant.
ACCIDENTS AT EIGHT CURVES
As a pilot for a possible future study, four curves in
the 1°01'-to-1°30' class interval with "low" accident fre-
quencies (0,0,0, and 1 accident in the three-year span) were
compared to four others in that class interval with ''high''
accident frequencies (7 ,9,10, and 11 accidents), on the basis
of:
-20-
1. length of the curve
2. length of the tangent before the curve
3. superelevation on the curve
4. crown retained in superelevated section
5. direction of turn
6. degree of curvature on the curve immediately
preceding the subject curve
7. distance from previous interchange to the PC
of the curve
8. distance to next interchange from the PT of
the curve
9. traffic volume at the curve
10. vertical alignment of the curve
The three most common types of accidents at these curves
were loss of control due to slippery pavement, loss of control
due to tire failure, and sideswipe due to lane change.
In this small sample, no physical differences were seen
between the curves in the "low" group and those in the "high"
group, except that the "high" curves were generally closer to
the next interchange than were the "low" curves.
A more elaborate study conducted along these lines,
involving a larger number of curves and a closer investiga
tion of accidents at those curves might reveal some correla
tions between certain types of accidents and certain geometric
characteristics of the curves.
-21-
Ran kings. of the Curves
METHOD OF EVALUATION
Before the accident records were studied, the entire
1964 Michigan rural freeway system (containing 1197 curves)
was driven to determine drivers' reaction to the appearances
of the curves.
Each curve was driven at 60, 70, and 80 mph and ranked
as being either "good", "fair", or "poor" at each speed ac
cording to the impression it made on the driver and the front-
seat passenger. An exact dividing line between good, fair,
and poor could not be established since the criteria was in-
tangible. However, if the curve could be negotiated with
little or no effort it was obviously good; if the driver was
compelled to slow the vehicle as he entered or proceeded
along the curve, the curve was ranked poor. Most of the curves
fell between the two extremes and had to be weighed and ranked
under the criteria that most nearly applied. If any apprehen-
sian was felt, the curve was not given a good ranking and the
factor that the observers thought was causing the apprehension
was noted. The fair or poor ranking was determined on the
premise that if the test group of young men (age in the mid
twenties) experienced apprehension, then older drivers with
slower reflexes would experience more anxiety and difficulty.
-22-
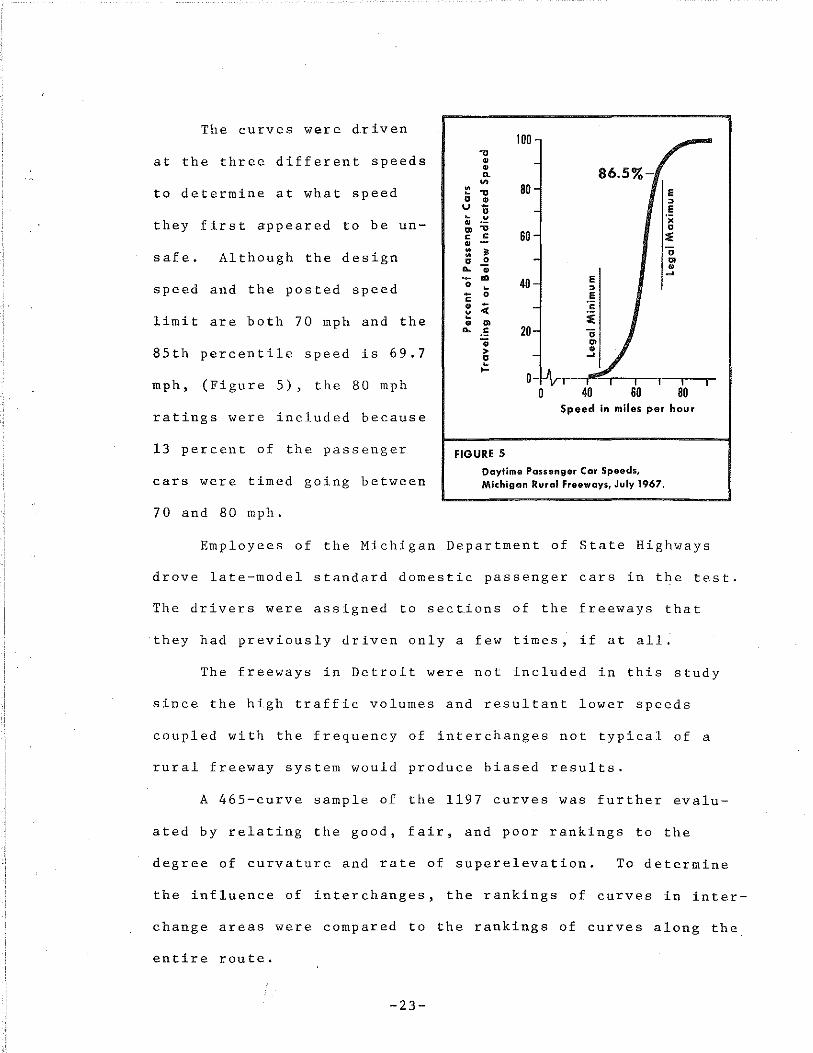
The curves were driven
at the three different speeds
to determine at what speed
they first appeared to be un-
safe. Although the design
speed and the posted speed
limit are both 70 mph and the
85th percentile speed is 69.7
mph, (Figure 5), the 80 mph
ratings were included because
13 percent of the passenger
cars were timed going between
70 and 80 mph.
FIGURE S
100
80
60-
40 E , E
:5
86.5%-r
": v 0-~lv,rr-,~T-,,,-.,-.,r-~1
0 40 60 80 Speed in miles per hour
Daytime Passenger Car Speeds, Michigan Rural Freeways, July 1967.
Employees of the Michigan Department of State Highways
drove late-model standard domestic passenger cars in the test.
The drivers were assigned to sections of the freeways that
they had previously driven only a few times, if at all.
The freeways in Detroit were not included in this study
since the high traffic volumes and resultant lower speeds
coupled with the frequency of interchanges not typical of a
rural freeway system would produce biased results.
A 465-curve sample of the 1197 curves was further evalu-
ated by relating the good, fair, and poor rankings to the
degree of curvature and rate of superelevation. To determine
the influence of interchanges, the rankings of curves in inter-
change areas were compared to the rankings of curves along the.
entire route.
-23-
Numerous trial runs of portions of the freBways were
driven prior to running the entire system to determine an
effective study method. The observers' comments were re-
corded and the curves were located in relation to some
prominent characteristic, such as a crossroad, structure,
or county line. This made it possible to locate curves on
plans and to determine which accidents occurred on each
specific curve.
To obtain more uniform rankings, the curves on the section
of I-94 discussed in the accident portion of the study were
driven a total of six times, with different observers for each
run.
LIMITATIONS OF THE EVALUATION
Obtaining a fully objective analysis of the curves would
have required a far more extensive test than was undertaken.
This analysis is limited in that (1) the observers were all
highway-oriented men who understood why they were running the
test and were therefore more alert to the curves than a typ
ical driver would be, (2) the freeways were driven only dur
ing the daytime, and (3) the test was conducted only in good
weather when the pavement was dry. The observers were alter-
nated as frequently as possible to avoid their becoming con
ditioned to the curves, and their reactions becoming neither
spontaneous or natural.
Since the test was subjective, the drivers ranked the
curves relative to the previous curves and to the same curve
at different speeds. A moderately sharp curve that would earn
-24-
a fair ranked by itself would likely be ranked good if it were
tested immediately after a series of poor curves. Also, a
curve negotiated at 80 mph with a little difficulty would appear
much better at 70 and receive a much more favorable ranking.
On the other hand, if a driver experienced some difficulty at
70 mph, he was likely to remember it and downgrade the curve
at 80 even before he drove it. Whether the traffic was heavier
or lighter than normal also affected the ranking. The same
curve, although driven at the same speed on the same day, will
likely receive different rankings if driven in the afternoon
when the sun is high, two hours later, when the sun is in the
driver's eyes, and again, sometime later, when it is dark.
The rankings were biased to some unknown degree by the
personal prejudices of the observers. For example, they con-
sistently ranked left-hand exits poor, not necessarily because
they had difficulty maneuvering thru the interchange but pos
sibly because they had the preconceived idea that left-hand
exits were poor design.
In short, then, a fully objective study of the curves
would involve a complete analysis of all characteristics of
the entire freeway system. Such an analysis would require a
large number of drivers, both male and female, of all ages and
driving experience and occupations, driving various sizes of
cars and trucks. These drivers would have to drive the entire
system, or at least a truly representative sample, in all weather
conditions a number of times, and each time start at a different
randomly-chosen point to avoid influence from a previous run.
-25-
This test, then, is not all-inclusive. It does, how-
ever, indicate a trend of the impressions that the various
curves created in male Department of State Highways' em-
ployees driving low-mileage, standard weight passenger cars
in good weather in daylight at three different speeds. Under
these conditions, the rankings were consistent; most curves
received a good ranking from each observer, while other curves
were always ranked poor. On a few curves, the rankings flue-
tuated between good and fair or between fair and poor.
Bearing in mind the limitations of the test, the rankings
are projected as being an indication of the impressions that
the curves make on the driving public.
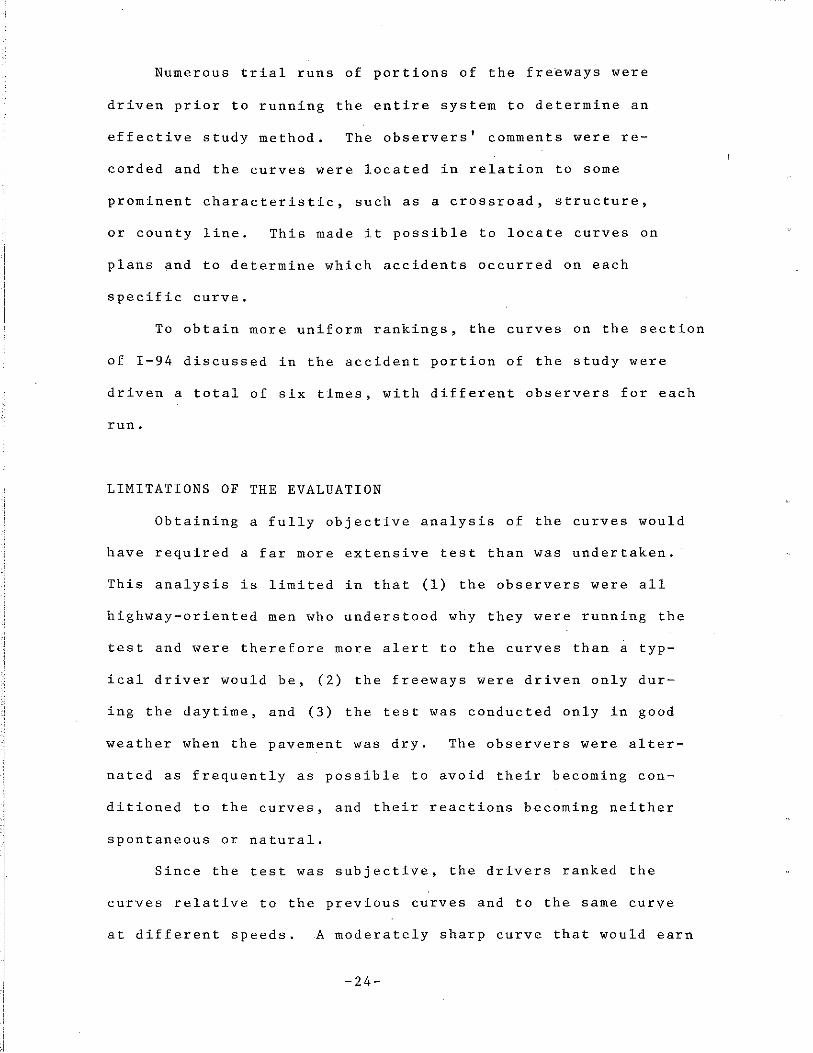
DRIVERS' OBSERVATIONS
Table 4 shows the breakdown of the rankings of the curves
according to the routes and to the speed of the ranking vehicle.
Number Soeed of Rankin• Vehicles
Freeway of 60 70 80 Curves GOOD FAIR POOR GOOD FATR POOR GCOD FATR POOR
I- 75 458 445 12 1 417 30 11 380 60 18 I- 94 229 227 1 1 215 12 2 196 22 11 I- 96 227 225 1 1 217 8 2 180 37 10 I-196 44 44 0 0 43 1 0 43 1 0
us- 23 157 155 1 1 142 13 2 125 25 7 US-127 26 26 0 0 26 0 6 26 0 ~ us 131 56 56 0 0 56 n 0 " 1
TOTAL 1197 1178 15 4 1116 64 17 1005 146 46
IPERCENT OF TOTA 98.4 1.3 0.3 93.3 5.3 1.4 84.0 12.2 3.8
Table 4. Curve Rankings for Each Freeway, Entire System.
-26-
At the design speed of 70 mph, 93 percent of the curves
were ranked good; at 80 mph, the observers found one out of
six curves defective.
The observers complained that 49 curves were too sharp
for 80 mph; either the driver was inclined to slow down or a
definite side thrust was felt. Sight distance was inadequate
on another 49 curves, caused by a side obstruction such as a
bridge pier or abutment, a crest vertical curve, or in some
cases, other vehicles that prevented the driver from adequately
seeing the downstream roadway. The observers wanted assurance
that there was a wide open highway ahead.
Another 34 curves caused uneasy feelings because they
appeared too sharp at first glimpse. Once the car was into
the curve, however, the feeling disappeared and no side-thrust
was felt.
The drivers were apprehensive about 15 of the curves at
80 mph when the guardrail or bridge railing appeared too con
fining and they felt an urge to decelerate. At thiee loca
tions, a steep downslope behind the guardrail on the right side
made the front-seat passenger uneasy. On another 39 curves
the observers had an apprehensive feeling that they could not
define.
ANALYSIS OF A SAMPLE OF THESE CURVES
Next, the degree of curvature and rate of superelevation
were taken from road plans for 465 (39 percent) of the curves.
In this sample, which included portions of all the freeways
-27-
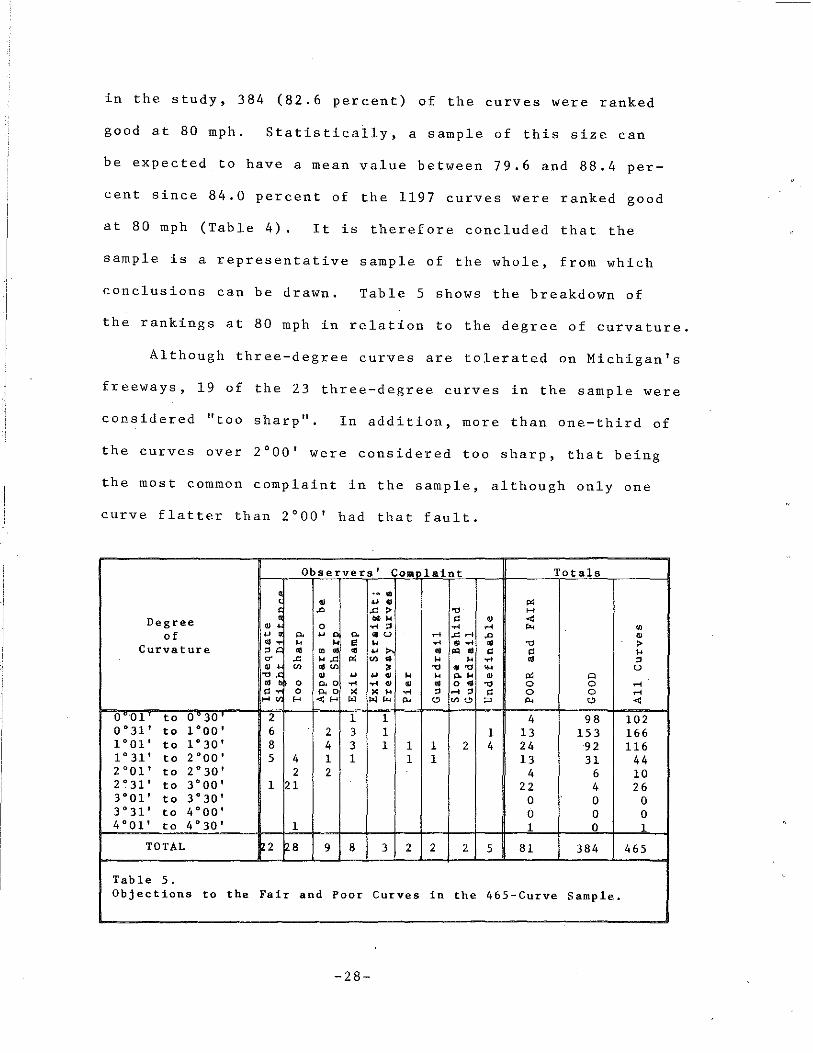
in the study, 384 (82.6 percent) of the curves were ranked
good at 80 mph. Statistically, a sample of this size can
be expected to have a mean value between 79.6 and 88.4 per-
cent since 84.0 percent of the 1197 curves were ranked good
at 80 mph (Table 4), It is therefore concluded that the
sample is a representative sample of the whole, from which
conclusions can be drawn. Table 5 shows the breakdown of
the rankings at 80 mph in relation to the degree of curvature.
Although three-degree curves are tolerated on Michigan's
freeways, 19 of the 23 three-degree curves in the sample were
considered "too sharp". In addition, more than one-third of
the curves over 2°00' were considered too sharp, that being
the most common complaint in the sample, although only one
curve flatter than 2°00 1 had that fault.
Observers' co .. laint Totals
.. . ~ ..... "' .0 -" > " >-<
Degree .. ~ " ~ < ~ ' 0 .... " .... .... ... I 00
of " "' : ~ "' .. u .... -""" .0 ~
~; " a " .... ..... .. " > Curvature .. .. ~~ .. "' .. " " " '" -" "-" "' " " .... .. " ~; "' ""' ~ " ~" ... u ~ ... ... ~ " " "'" ~ "' "' .. 0 P,O .... ...... .. .. 0 .. " 0 0 ....
~~ 0 P,O ~ ~ ... .... " .... " " 0 0 .... .... ...... "' "'"' p., "' "'"' "' "' "' < 0 01 to 0 30 2 1 1 4 98 102 0°31 1 to 1°00' 6 2 3 1 1 13 153 166 1° 0 1' to 1°30' 8 4 3 1 1 1 2 4 24 92 116 1°31' to 2°00' 5 4 1 1 1 1 13 31 44 2°01' to 2°30' 2 2 4 6 10 2~31 1 to 3°00' 1 21 22 4 26 3°01' to 3°30' 0 0 0 3°31' to 4°00' 0 0 0 4 ° 01 I to 4°30 1 1 1 0 1
TOTAL 2 8 9 8 3 2 2 2 5 81 384 465
Table 5. Objections to the Fair and Poor Curves in the 465-Curve Sample.
-28-
Degree Superelevation Rate of Not Tot a Curvature .00 .01 .02 .03 .04 .05 .06 .07 Give"
o•o1' to 0°30' i 69 2 25 102 0 ° 31 I to 1°00' ! 12 122 24 166 1°01' to 1° 30 t 4 _1 ]_ 64 40 116 1°31' to 2°00' 36 8 44 2°01' to 2°30' -
l 6 2 1 10 2 ° 31' to 3•oo• 16 10 26 -3°01' to 3•3o' -3°31' to 4•oo• -4°01' to 4°30' 1 1 -
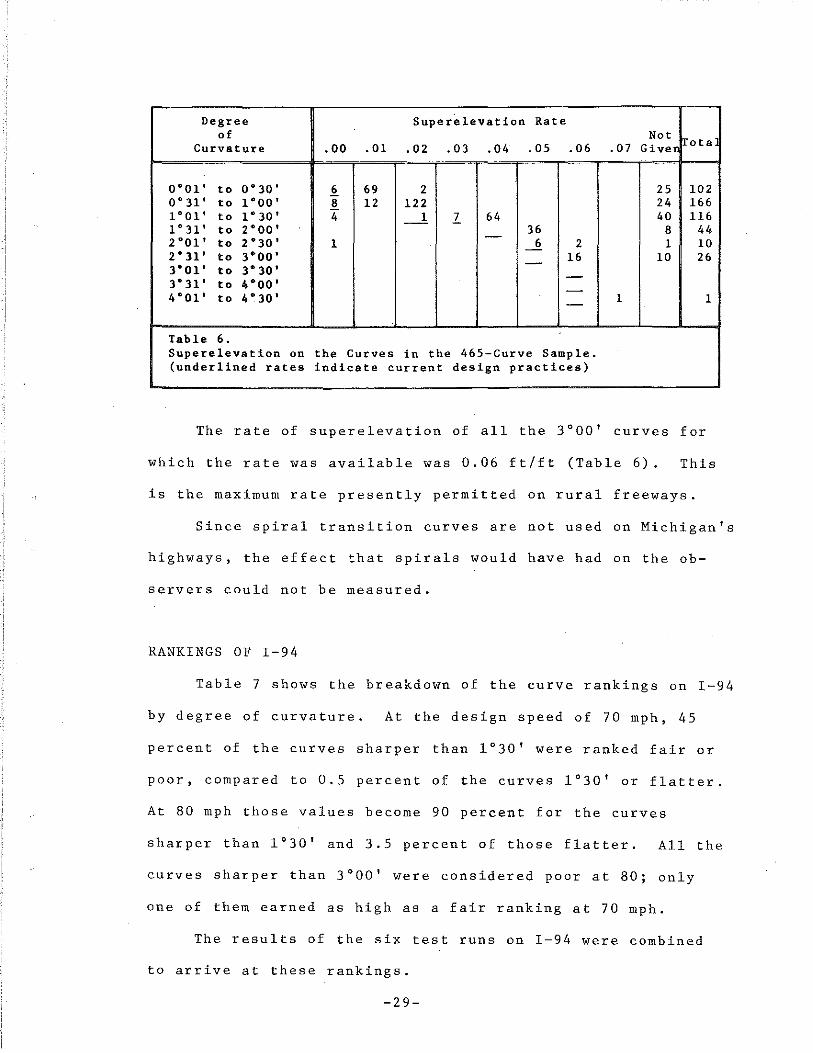
Table 6. Supere1evation on the Curves in the 465-Curve Sample. (underlined rates indicate current design practices)
The rate of superelevation of all the 3°00' curves for
which the rate was available was 0.06 ft/ft (Table 6). This
is the maximum rate presently permitted on rural freeways.
Since spiral transition curves are not used on Michigan's
highways, the effect that spirals would have had on the ob-
servers could not be measured.
RANKINGS OF I-94
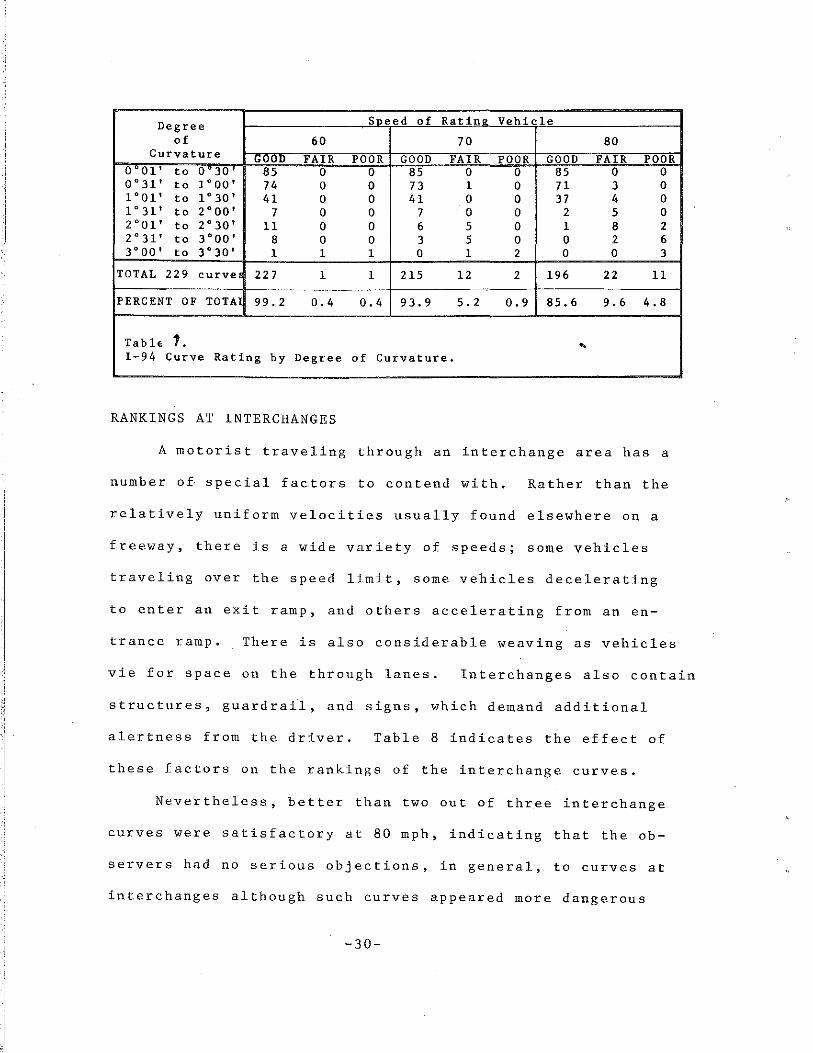
Table 7 shows the breakdown of the curve rankings on I-94
by degree of curvature. At the design speed of 70 mph, 45
percent of the curves sharper than 1°30' were ranked fair or
poor, compared to 0.5 percent of the curves 1°30' or flatter.
At 80 mph those values become 90 percent for the curves
sharper than 1°30' and 3.5 percent of those flatter. All the
curves sharper than 3°00' were considered poor at 80; only
one of them earned as high as a fair ranking at 70 mph.
The results of the six test runs on I-94 were combined
to arrive at these rankings.
-29-
Degree Sneed of Rat in• Vehicle
of 60 70 80 Curvature FAIR POOR GOOD FAIR POOR GOOD FAIR POOR
0 01' to 0 30 85 0 0 85 0 0 85 0 0 0°31' to 1°00' 74 0 0 73 1 0 71 3 0 1° 01 I to 1°30' 41 0 0 41 0 0 37 4 0 1° 31' to 2°00' 7 0 0 7 0 0 2 5 0 2°01 1 to 2°30' 11 0 0 6 5 0 1 8 2 2°31' to 3°00' 8 0 0 3 5 0 0 2 6 3°00' to 3°30 1 1 1 1 0 1 2 0 0 3
TOTAL 229 curve 22 7 1 1 215 12 2 196 22 11
PERCENT OF TOTAl 99.2 0.4 0.4 93.9 5.2 0.9 85.6 9.6 4.8
Tabh 1. " I-94 Curve Rating by Degree of Curvature.
RANKINGS AT INTERCHANGES
A motorist traveling through an interchange area has a
number of special factors to contend with. Rather than the
relatively uniform velocities usually found elsewhere on a
freeway, there is a wide variety of speeds; some vehicles
traveling over the speed limit, some vehicles decelerating
to enter an exit ramp, and others accelerating from an en-
trance ramp. There is also considerable weaving as vehicles
vie for space on the through lanes. Interchanges also contain
structures, guardrail, and signs, which demand additional
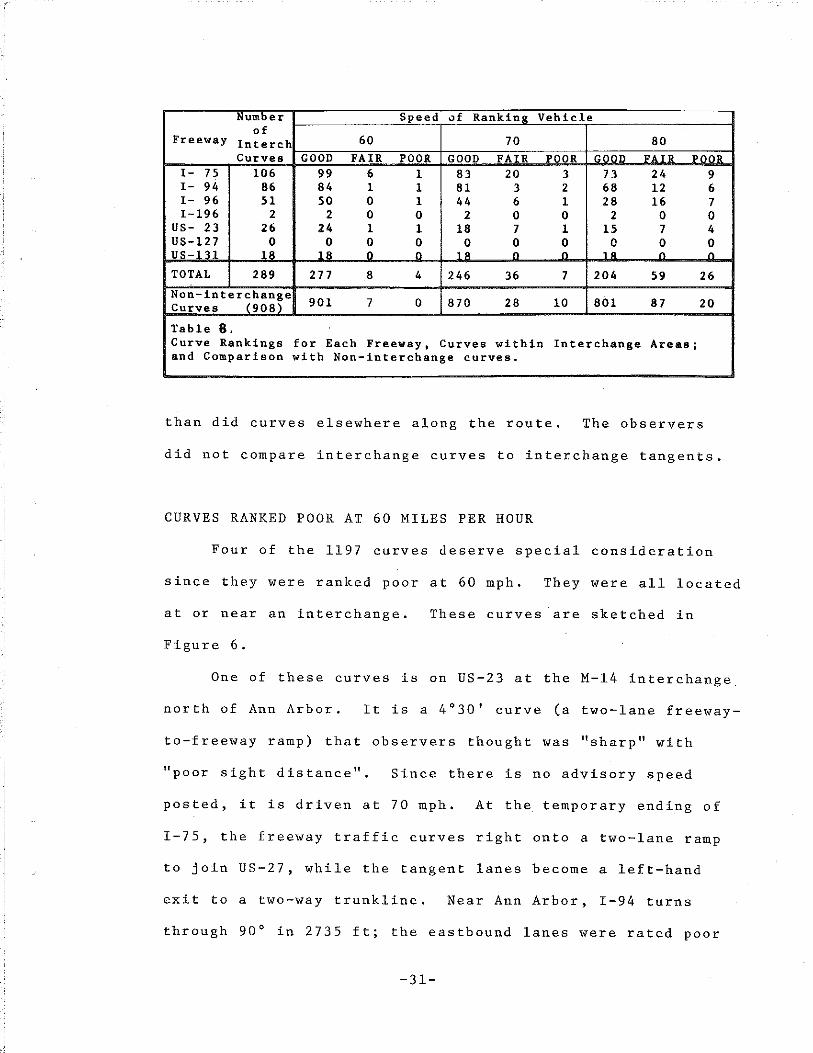
alertness from the driver. Table 8 indicates the effect of
these factors on the rankings of the interchange curves.
Nevertheless, better than two out of three interchange
curves were satisfactory at 80 mph, indicating that the ob-
servers had no serious objections, in general, to curves at
interchanges although such curves appeared more dangerous
-30-
Number Speed uf Ranki.;-J! Vehicle -
of Freeway Interch 60 70 80
Curves GOOD FAIR POOR GOOD FAIR POOR r.ron FATR POOR I- 75 106 99 6 1 83 20 3 73 24 9 I- 94 86 84 1 1 81 3 2 68 12 6 I- 96 51 50 0 1 44 6 1 28 16 7 I-196 2 2 0 0 2 0 0 2 0 0
us- 23 26 24 1 1 18 7 1 15 7 4 US-127 0 0 0 0 0 ~ ~ .~ ~· 0 US-"1 18 18 0 0 1 • n
TOTAL 289 277 8 4 246 36 7 204 59 26
Non-interchange Curves (908) 901 7 0 870 28 10 801 87 20
Table 8. Curve Rankings for Each Freeway, Curves within Interchange Areas; and Comparison with Non-interchange curves.
than did curves elsewhere along the route. The observers
did not compare interchange curves to interchange tangents.
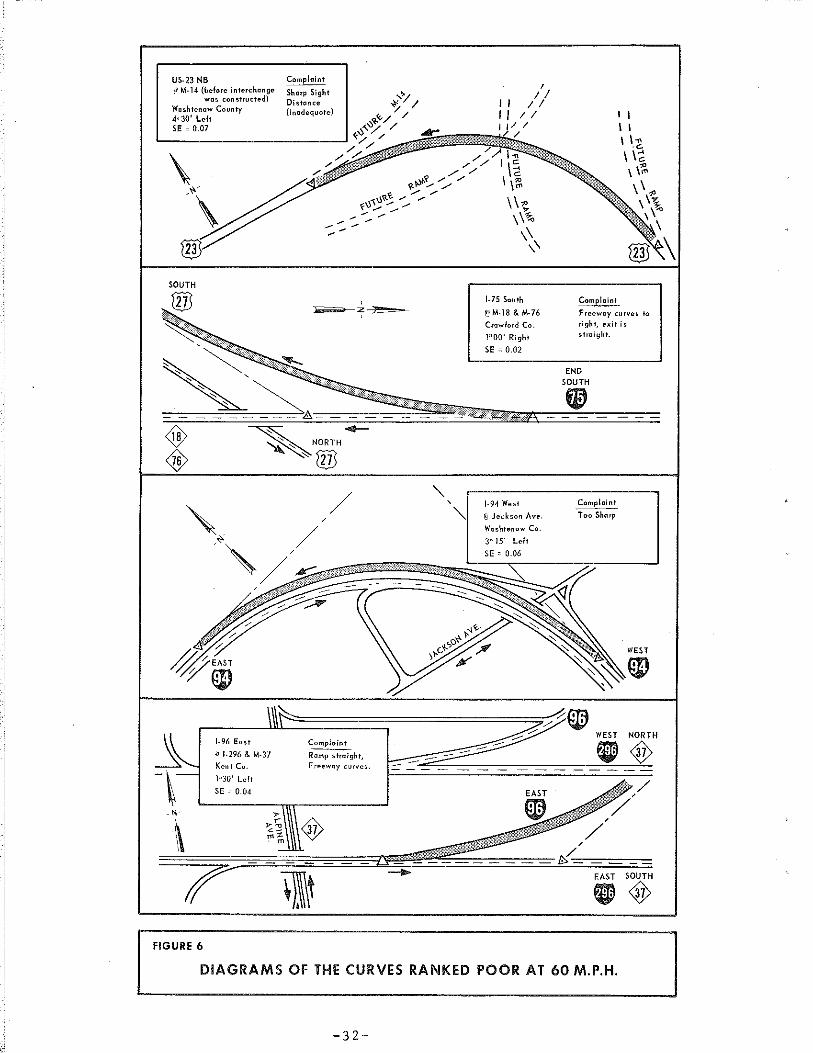
CURVES RANKED POOR AT 60 MILES PER HOUR
Four of the 1197 curves deserve special consideration
since they were ranked poor at 60 mph. They were all located
at or near an interchange. These curves are sketched in
Figure 6.
One of these curves is on US-23 at the M-14 interchange.
north of Ann Arbor. It is a 4°30' curve (a two-lane freeway-
to-freeway ramp) that observers thought was "sharp" with
"poor sight distance". Since there is no advisory speed
posted, it is driven at 70 mph. At the temporary ending of
I-75, the freeway traffic curves right onto a two-lane ramp
to join US-27, while the tangent lanes become a left-hand
exit to a two-way trunkline. Near Ann Arbor, I-94 turns
through 90° in 2735 ft; the eastbound lanes were rated poor
-31-
US-23 NB Comploint 1 ~' M-14 (before interchange Sharp Sight ,~./ J /
wos constructed) Distance -¥_.. / / J 1 / j Woshtenaw County (inadequate) / I / 1 / I I 4•30' Left ~~/ /
SE = 0.07 ~~'~"/~~/--~~,~~~~~~~~~~~~~~ L------------_J ~" / - I I // ,...... .... ......: I-n
.... "" //:/ I\~
I I 11~
·C
I 1'6 \ \~
FIGURE 6
\t~~~ ................ / \ \~ " / / 1),1)~/ / / \\1' '( ...... _ __... y --...... / \\~ --:.- ,, ,, 1-75 South
@'M-18 & M-76
Crawford Co.
1°00' Right
SE " 0.02
-----""---- -w-
1-96 East
"' 1-296 & M-31
Kent Co.
]oJQ' Left
SE - 0.04
'
-NORTH
®
/ /
Complaint
Romp straight, Freeway curves.
-
1-94 West
@Jackson Ave.
Washtenow Co.
3" 15' Left
SE = 0.06
EAST
~
\I" \\"' ,~
\ \
Complaint
Freeway curves to
right, exit is straight.
END SOUTH
Complninl
Too Sharp
EAST SOUTH
O<W
DIAGRAMS OF THE CURVES RANKED POOR AT 60 M.P.H.
-32-
\
at 80 and 70 mph and fair at 60 mph. North of Grand Rapids,
I-296 follows the tangent from I-96 just 700 ft downstream
from the addition of a third lane at an entrance ramp.
It should be remembered that although curves and inter
changes may appear simple to negotiate in a small-scale over
head view, 90° to the pavement, the driver sees the pavement
unrolling before him life-size at an angle of less than one
half degree, giving him a completely different perspective
of the situation.
-33-
Accidents Compared to the Rankings
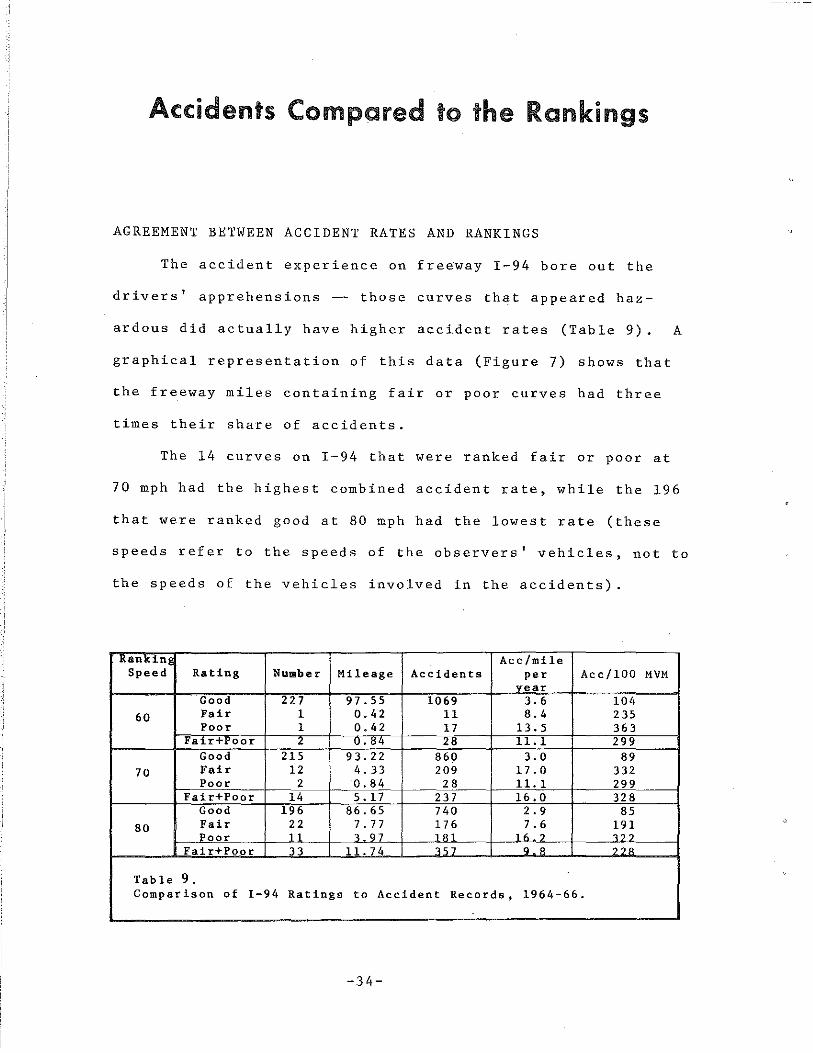
AGREEMENT BETWEEN ACCIDENT RATES AND RANKINGS
The accident experience on freeway I-94 bore out the
drivers' apprehensions -- those curves that appeared haz-
ardous did actually have higher accident rates (Table 9). A
graphical representation of this data (Figure 7) shows that
the freeway miles containing fair or poor curves had three
times their share of accidents.
The 14 curves on I-94 that were ranked fair or poor at
70 mph had the highest combined accident rate, while the 196
that were ranked good at 80 mph had the lowest rate (these
speeds refer to the speeds of the observers' vehicles, not to
the speeds of the vehicles involved in the accidents).
Ranl<i~g Ace/mile Speed Rating Number Mileage Accidents per Acc/100 MVM
vear Good 227 97.55 1069 3.6 104
60 Fair 1 0.42 11 8.4 235 Poor 1 0.42 17 13.5 363
Fair+Poor < 0.84 28 11.1 299 Good 215 93.22 860 3.0 89
70 Fair 12 4. 33 209 17.0 332 Poor 2 0.84 28 11. 1 299
Fair+Poor 14 5. 17 237 16.0 32 8 Good 196 86.65 740 2.9 85
80 Fair 22 7. 77 176 7. 6 191 Poor 11 1. 9 7 181 H? 1??
Fair+ Poor 13 11.74 1>7 Q • ??A
Table 9. Comparison of I-94 Ratings to Accident Records, 1964-66.
-34-
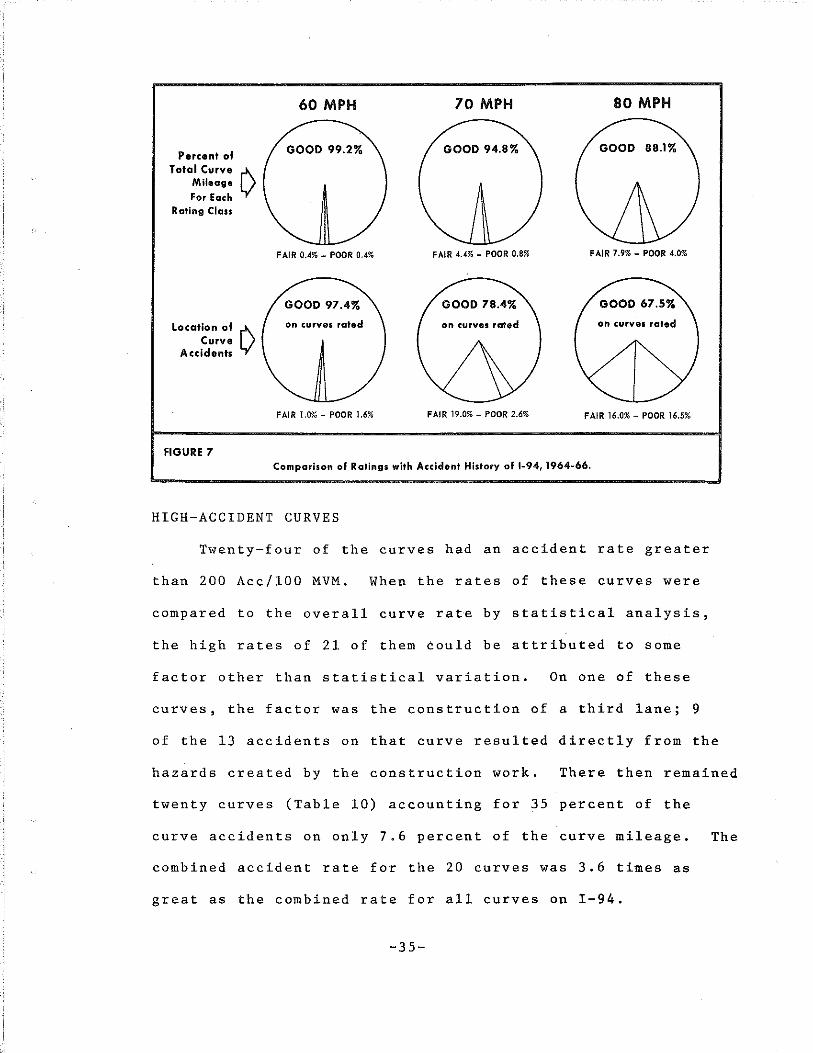
Percent of Total Curve
Mileage
For Each Rating Class
location of Curve
Accidents
FIGURE 7
Q
60 MPH
GOOD 99.2%
FAIR 0.4%- POOR 0.4%
GOOD 97.4%
on curves rated
FAIR 1.0%- POOR 1.6%
70 MPH 80 MPH
GOOD 88.1%
FAIR 4.4%- POOR 0.8% FAIR 7.9%- POOR 4.0%
FAIR 19.0%- POOR 2.6% FAIR 16.0%- POOR 16.5%
Comparison of Ratings with Accident History of 1-94, 1964-66.
HIGH-ACCIDENT CURVES
Twenty-four of the curves had an accident rate greater
than 200 Acc/100 MVM. When the rates of these curves were
compared to the overall curve rate by statistical analysis,
the high rates of 21 of them could be attributed to some
factor other than statistical variation. On one of these
curves, the factor was the construction of a third lane; 9
of the 13 accidents on that curve resulted directly from the
hazards created by the construction work. There then remained
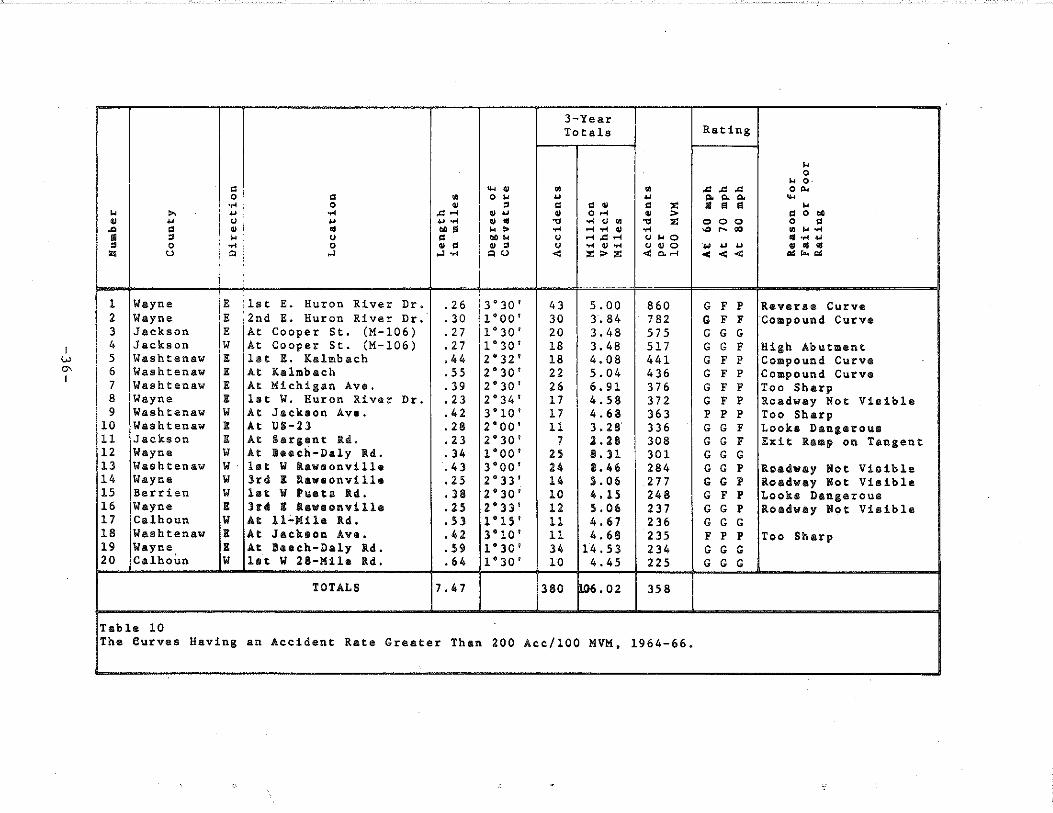
twenty curves (Table 10) accounting for 35 percent of the
curve accidents on only 7.6 percent of the curve mileage. The
combined accident rate for the 20 curves was 3.6 times as
great as the combined rate for all curves on I-94.
-35-
I w
"" I
d 0 ·~ ... ,., " * ... u
-" d ~ • • .. • 0 .... "' u "'
1 Wayne E 2 Wayne E 3 Jackson E 4 Jackson w 5 Washtenaw E 6 Washtenaw E 7 Washtenaw E 8 Wayne E 9 Washtenaw w
10 Washtenaw I 11 Jackson E 12 Wayne w 13 Waehtenaw w 14 Wayne w 15 Berrien w 16 Wayne E 17 Calhoun II 18 Washtenaw E 19 Wayne, E 20 Calhoun w
Table 10 The Curves Having
d ~ 0 ~ .... .., .....
" ....... • "" u d 0 ~ c ,., ,., ·~
1st E. Huron River Dr. . 2 6 2nd E. Huron River Dr. • 30 At Cooper st. (M-106) . 2 7 At Cooper St. (M-106) . 2 7 lot E. Kalmbach .44 At Kalmbach .55 At Michigan Ave. . 39 let w. Huron River Dr. • 2 3 At Jacka on Ava. .42 At US-23 .28 At Sar;ant ltd. .23 At hech-Da1y ltd. • 34 lot w laweonvilla .43 Jrd E i.awmonville .25 lot w .... t. u. .38 h4 I !l.awoonv!lle .25 At 11-lUh ltd. .53 At Jacltoon Ave. .42 At llaaeh-Do.ly ltd. .59 lot II 28-!Ula Rd. .64
TOTALS 7.47
an Accident Rate Greater Than
3-Year Totals Rating
~ 0
~ 0 ... ~ ~ m ..,..,.., 00. 0 ~ " " ... "' "' ...
• d d ~ d :£ II a a ~
~ " ~ 0 ..... ~ > d 0 " ~ .. " .... u ~ .., :£ 0 0 0 0 d ... > .... ......... ~ .... "' .... ., 0 ......
"'" u ..... .., .... u ~ 0 II •..4 4J
w " u .... ~ .... U4/0 .. " " " . .. "''-' .. :0:>:0: .. ,. .... .. .. .. "'"""'
3°30 1 43 5.00 860 G F p Reverse. Curve 1°00' 30 3.84 7 82 G F F Compound Curve 1°30' 20 3.48 575 G G G 1°30' 18 3.48 517 G G F High Abutment 2°32' 18 4.08 441 G F p Compound Curve 2°30' 22 5.04 436 G F p Compound Curve 2°30' 26 6.91 376 G F F Too Sharp 2°34' 17 4.58 372 G F p Roadway Not Visible 3°10 1 17 4.68 363 p p p Too Sharp 2°00' 11 3.28 336 G G F Looks Danaeroua 2°30' 7 2.28 308 G G F Exit R&IOp on Tangent 1•oo• 2S e. n 301 G G G 3°00' 24 8.46 284 G G p Roadway Not Visible 2°33' H S.06 277 G G p lloadway Not Visible 2°30' 10 4.15 248 G F p Lool<o Danaerous 2'33' 12 5. 06 237 G G p Roadway Not Visible 1'15' ll 4.67 236 G G G 3'10' 11 4.68 235 F p p Too Sharp 1•3o' 34 14.53 234 G G G 1°30' 10 4.45 225 G G G
380 106.02 358
200 Aec/100 IIVM, 1964-66.
Ten of the eleven curves ranked poor at 80 mph are in
cluded in these 20, including both curves ranked poor at 70.
Five of these 20 were ranked good at all speeds.
Among the ten curves having the highest rates, five were
ranked poor and four were ranked fair at 80 mph. The curve
ranked poor at 60 and two of the three curves sharper than
3°00' are included in these ten curves.
An eastbound motorist passing near Romulus, in Wayne
County, encounters a two-lane left-hand exit that follows the
tangent as the freeway curves 2°34' right. This is followed
by a 410-ft tangent, a 3°31' curve left, a 340-ft tangent, and
a 1°00' curve left. An at-grade intersection at this location
was closed in January 1965. This combination contains the
curves with the highest, the second highest, and the eighth
highest accident rates. Relief from this hazardous location
will be provided by the reconstruction of I-94 to interchange
with the I-275 freeway, now in the preliminary design stage.
-37-