Vertical Distribution of Micronutrient Cations in the ...
12
Int.J.Curr.Microbiol.App.Sci (2019) 8(7): 1166-1177 1166 Original Research Article https://doi.org/10.20546/ijcmas.2019.807.138 Vertical Distribution of Micronutrient Cations in the Orange (Citrus reticulata) Orchard, Tamenglong District, Manipur (India) Laikhuram Banarjee Singh, Herojit Singh Athokpam * , Rajkumar Kumarjit Singh, K. Nandini Devi, Edwin Luikham and N. Okendro Singh College of Agriculture, CAU, Imphal, Manipur, India *Corresponding author ABSTRACT Introduction The word “micronutrients” represents some essential nutrients (Fe, Mn, Zn, Cu, B, Mo, Ni and Cl) that are required in very small quantities for the growth and development of plants. Micronutrients are very important for maintaining soil health and also in increasing productivity of crops (Rattan et al., 2009). Through their involvement in various enzymes and other physiologically active molecules, these micronutrients are important for gene expression, biosynthesis of proteins, nucleic acids, growth substances, chlorophyll and secondary metabolites, metabolism of carbohydrates and lipids, stress tolerance, etc. (Singh, 2004, Rengel, 2007 and Gao et al., 2008). Less nutrient management practices contribute towards exhaustion of micronutrients from the soil and micronutrients are bound to become a limiting factor. The deficiency of micronutrients has become major constraint to productivity, stability and sustainability of soils (Bell and Dell, 2008). Deficiency of micronutrients may either be primary, due to their low total International Journal of Current Microbiology and Applied Sciences ISSN: 2319-7706 Volume 8 Number 07 (2019) Journal homepage: http://www.ijcmas.com Vertical distribution of DTPA-extractable micronutrient cations (Fe, Cu, Mn and Zn) and its correlation with several physico-chemical properties of soils in fifteen orange orchards of Tamenglong district, Manipur was studied. Most of the upper soil layer had higher DTPA-extractable micronutrient cations (Fe, Cu, Mn and Zn) content than the lower horizons. In the profiles, the value of DTPA- extractable micronutrients (Fe, Cu, Mn and Zn) ranged from 18.62 to 45.12 mg kg -1 , 0.12 to 1.26 mg kg -1 , 3.42 to 44.33 mg kg -1 and 0.16 to 1.36 mg kg -1 , respectively. The DTPA-extractable Fe and Mn were found to be sufficiently available in all the profiles whereas, Cu was found adequate in most of the surface horizon (0 - 20cm) in most of the soil samples. However, Zn deficiency occurred in 55.56 % of the soil sample. Multiple regression analysis showed that the DTPA- extractable micronutrient cations (Fe, Cu, Mn and Zn) content in the soils were influenced by pH, OC, EC, Mg, silt, K and clay to the degree of 50.1, 25.7 and 60.5 % in the surface horizon but their influenced were significant only by soil OC and silt. Keywords Micronutrients, Orange orchard, Profile, Multiple regression Accepted: 10 June 2019 Available Online: 10 July 2019 Article Info
Transcript of Vertical Distribution of Micronutrient Cations in the ...

Int.J.Curr.Microbiol.App.Sci (2019) 8(7): 1166-1177
1166
Original Research Article https://doi.org/10.20546/ijcmas.2019.807.138
Vertical Distribution of Micronutrient Cations in the Orange (Citrus
reticulata) Orchard, Tamenglong District, Manipur (India)
Laikhuram Banarjee Singh, Herojit Singh Athokpam*, Rajkumar Kumarjit Singh,
K. Nandini Devi, Edwin Luikham and N. Okendro Singh
College of Agriculture, CAU, Imphal, Manipur, India
*Corresponding author
A B S T R A C T
Introduction
The word “micronutrients” represents some
essential nutrients (Fe, Mn, Zn, Cu, B, Mo, Ni
and Cl) that are required in very small
quantities for the growth and development of
plants. Micronutrients are very important for
maintaining soil health and also in increasing
productivity of crops (Rattan et al., 2009).
Through their involvement in various
enzymes and other physiologically active
molecules, these micronutrients are important
for gene expression, biosynthesis of proteins,
nucleic acids, growth substances, chlorophyll
and secondary metabolites, metabolism of
carbohydrates and lipids, stress tolerance, etc.
(Singh, 2004, Rengel, 2007 and Gao et al.,
2008).
Less nutrient management practices
contribute towards exhaustion of
micronutrients from the soil and
micronutrients are bound to become a limiting
factor. The deficiency of micronutrients has
become major constraint to productivity,
stability and sustainability of soils (Bell and
Dell, 2008). Deficiency of micronutrients may
either be primary, due to their low total
International Journal of Current Microbiology and Applied Sciences ISSN: 2319-7706 Volume 8 Number 07 (2019) Journal homepage: http://www.ijcmas.com
Vertical distribution of DTPA-extractable micronutrient cations (Fe, Cu, Mn and Zn) and
its correlation with several physico-chemical properties of soils in fifteen orange orchards
of Tamenglong district, Manipur was studied. Most of the upper soil layer had higher
DTPA-extractable micronutrient cations (Fe, Cu, Mn and Zn) content than the lower
horizons. In the profiles, the value of DTPA- extractable micronutrients (Fe, Cu, Mn and
Zn) ranged from 18.62 to 45.12 mg kg-1
, 0.12 to 1.26 mg kg-1
, 3.42 to 44.33 mg kg-1
and
0.16 to 1.36 mg kg-1
, respectively. The DTPA-extractable Fe and Mn were found to be
sufficiently available in all the profiles whereas, Cu was found adequate in most of the
surface horizon (0 - 20cm) in most of the soil samples. However, Zn deficiency occurred
in 55.56 % of the soil sample. Multiple regression analysis showed that the DTPA-
extractable micronutrient cations (Fe, Cu, Mn and Zn) content in the soils were influenced
by pH, OC, EC, Mg, silt, K and clay to the degree of 50.1, 25.7 and 60.5 % in the surface
horizon but their influenced were significant only by soil OC and silt.
K e y w o r d s
Micronutrients,
Orange orchard,
Profile, Multiple
regression
Accepted:
10 June 2019
Available Online:
10 July 2019
Article Info

Int.J.Curr.Microbiol.App.Sci (2019) 8(7): 1166-1177
1167
contents or secondary, caused by soil factors
reducing their availability to plants. Improper
nutrient management has led to the
emergence of multi-nutrient deficiencies in
Indian soils (Sharma, 2008). Moreover,
continuous negligence of micronutrient
application and avoidance of organic manures
are the major causes of deficiency of
micronutrients (Srivastava et al., 2017).
Citrus is claimed to have originated in south
China and Cathaysian ancient continent
including Sichuan, Kangdian, South of
Yangtze river and Indo-China peninsula, then
dispersed into India, Africa and Australia
according to the theories of continental drift,
the ecological and geological vicissitude.
Agro-meteorologically, citrus is observed
more comfortable under tropical and sub-
tropical and climate representing 24 – 380 at
either side of equator with hot days/cool
nights and less exposed to prolonged freezing
temperature. The highest quantum of
production harvested globally is represented
by soil orders viz. Alfisol, Oxisol, Ultisol,
Entisol and Inceptisol (Srivastava and Singh,
2002b). The current average productivity of
citrus orchards in India is 8.9 tons ha-1
compared to 4.52 tons ha-1
obtained in North-
East India (Srivastava and Singh, 2002a), the
region historically believed to have witnessed
the dissemination of citrus to other parts of
the world. Cultivation of Khasi mandarin
(Citrus reticulata Blanco.) in North-East
India is mainly confined to mid-hills up to an
elevation of 1200 m above mean sea level
under humid tropical climate. Manipur has a
geographical area of 22,327 sq. km. which
constitutes 0.7 % of the total land surface of
India. Ninety per cent of the total
geographical area of the state i.e. 20,097 sq.
km. is covered by hills. Around 3,838
hectares of land are under orange cultivation
in Manipur. Khasi Mandarin is a variety of
orange produced in Tamenglong, a district
located 140 kms from Imphal and lies at
coordinates bearing 24°59′ N 93°29′ E
Tamenglong district is known as the “Orange
Bowl” of the state. The district contributes
over 50 % of the state’s annual total orange
production of nearly 10,000 to 11,000 metric
tons. The total geographical area of
Tamenglong is 4391 km2. The climate here is
humid and sub-tropical type. The climate and
soil here are well suited for the production of
orange. The knowledge of pedogenic
distribution of micronutrients is, therefore,
important as many plant roots penetrate to the
sub-surface layers and draw a part of the
nutrient requirement from the sub-surface
layers. However, there is little or no
information regarding status and distribution
of micronutrients in soils under orange
cultivation in the district. Keeping in view of
the close relationship between soil properties
and micronutrient availability, the present
study was undertaken to analyze the depth-
wise distribution of micronutrients (Fe, Cu,
Mn and Zn) in the soil and to study the
relationship of the micronutrients (Fe, Cu, Mn
and Zn) with the physico-chemical properties
of soil.
Materials and Methods
The experimental location is in Tamenglong
district of Manipur which has an area of 4391
km2 which constitutes 19.66 % of the total
geographical area of the state. It is located in
the north-western part of Manipur and lies at
coordinates bearing 24°59′ N 93°29′E. The
altitude is 1260 m above MSL. It has
humidity range of 76 to 96 % and temperature
of 4°C at minimum and 31°C at maximum.
The climate here is humid and sub-tropical
type. The climate and soil here are well suited
for the production of orange. In Tamenglong,
the average annual temperature is 18.5°C and
about 3336 mm of precipitation falls annually.
Generally, the main soils found in the district
are red loamy soil, red sandy soil and red
gravelly soil. The experimental sites under
Int.J.Curr.Microbiol.App.Sci (2019) 8(7): 1166-1177
1168
study were mainly dominated by orange
orchards. Soil samples were collected from
fifteen different orange orchards of
Tamenglong district. From each site, three
samples were collected depth wise up to 60
cm at an interval of 20 cm from the surface
i.e. 0-20, 20-40 and 40-60, respectively.
Totally, 45 soil samples were collected for
study. The collected soil samples were
thoroughly air dried in shade and ground with
a wooden mortar and pestle and passed
through 2 mm sieve for analysis. The
collected samples were processed and
analyzed following standard procedures for
mechanical analysis using Bouyoucos
hydrometer method (Bouyoucos, 1951); soil
pH and EC using (1: 2.5) soil: water
suspension (Jackson 1973); organic carbon by
the Walkley and Black rapid titration method
(Walkley and Black 1934); CEC by leaching
with 1N ammonium acetate (Borah et al.,
1987). The soil sample were determined for
available N (Subbiah and Asija, 1956);
available P (Bray and Kurtz 1945); available
K, Ca and Mg of soil were extracted with
neutral normal ammonium acetate as outlined
by Chopra and Kanwar (1976) and DTPA-
extractable Zn, Cu, Mn and Fe following
standard procedures as outlined by (Lindsay
and Norvell, 1978). The relationship between
various soil physico-chemical properties and
micronutrients distribution were established
by using simple correlation coefficient.
Multiple regression equations were computed
between DTPA- extractable micronutrients
and soil properties by adopting statistical
procedures (Panse and Sukhatme, 1985).
Results and Discussion
The physico-chemical properties as well as
DTPA-extractable Fe, Cu, Mn and Zn are
presented in table 1 and 2. There was no exact
pattern in the distribution of clay, silt and
sand with the depth of soil profiles. Clay, silt
and sand fractions in the soils ranged from
37.6 to 53.1, 13.4 to 26.0 and 26.3 to 44.6 per
cent, respectively. The samples were very
strongly acidic (pH 4.68) to slightly acidic
(pH 6.10) in reaction. EC values ranging from
0.02 to 0.27 dSm-1
. Organic carbon content
ranged from 0.46 to 1.58 per cent. Cation
exchange capacity (CEC) varied from 10.60
to 20.00 [cmol (p+) kg
-1] soil.
The available nitrogen, phosphorus and
potassium content in the soil profiles varied
from 138.9 to 536.5 kg ha-1
, 10.2 to 25.4 kg
P2O5 ha-1
and 81.4 to 242.5 kg K2O ha-1
,
respectively. Exchangeable Ca++
content
ranged from 0.3 to 0.9 and Mg++
from 0.3 to
1.4 [cmol(p+)kg-1
]. The region is high rainfall
area which might be due to intense the
leaching action of the bases from the surface
layers. The content of these nutrients
decreased with increase in depth in most of
the studied profiles. Similar results were also
reported by Athokpam et al., (2016) and
Athokpam et al., (2018) in the soils of Ukhrul
and Tamenglong districts of Manipur,
respectively.
Iron (Fe)
The DTPA-extractable Fe content of the soil
samples was fairly high with a value ranging
from 18.62 to 45.12 mg kg-1
soil in the orange
orchard soils of Tamenglong district of
Manipur. The iron content of these soils is
high because, the solubility of ferric and
ferrous iron is much lower at high pH than at
low pH and leaching of exchangeable bases.
In view of critical limit of 4.5 mg Fe kg-1
soil
(Lindsay and Norvell, 1978), all the samples
were highly sufficient in available Fe. DTPA-
Fe content in the profile showed significant
positive coefficient with OC (r=0.531*) and
(r=0.523*) in the 1st and 2
nd layer,
respectively and negatively significantly
correlated with pH (r= -0.626**) and EC (r= -
0.527**) in the 1st layer as well as with pH
(r= -0.513*) in the 2nd
layer. It showed
Int.J.Curr.Microbiol.App.Sci (2019) 8(7): 1166-1177
1169
significant regression coefficient with OC
(20.028*) at 2nd
(20-40 cm) layer. Multiple
correlation and regression analyses indicated
that 50.1, 37.1 and 29.3 per cent variability in
the profile was due to the simultaneous effect
of pH, EC, OC and Mg in the soil. The
surface layer soil contained more available Fe
than those in lower depth and showed a
decreasing pattern along with depth except for
few samples. These findings are in agreement
with the works of Sen et al., (1997), Gupta et
al., (2003), Sharma et al., (2003), Pati and
Mukhopadhyay (2011), Athokpam et al.,
(2013), Athokpam et al., (2016), Athokpam et
al., (2018) and Singh et al., (2018).
Copper (Cu)
The DTPA-Cu content varied from 0.12 to
1.26 mg kg-1
soils. Considering 0.20 mg Cu
kg-1
soil as critical limit (Lindsay and Norvell,
1978), most of the samples, except a few in
the sub-surface horizons, were well supplied
with available Cu. Similar findings were also
reported by Sen et al., (1997). Higher DTPA-
extractable Cu content was observed in
surface soil than those of lower layers. This
might be due to higher biological activity and
organic carbon content in the surface layers
(Murthy et al., 1997). Available Cu content
decreased with increase in depth in most
profiles. These results were also conveyed by
Gupta et al., (2003), Verma et al., (2007b),
Athokpam, et al., (2016), Singh and
Athokpam (2018) and Athokpam et al.,
(2018). Nevertheless, the study observed that
there was an irregular distribution of DTPA-
extractable Cu with depth in a few soil
samples. This finding is in accordance with
the work of Kumar et al., (1996) and
Satyavathi and Reddy (2004). The present
study revealed that there was no significant
multiple correlation and regression analyses
which indicated no per cent variability of
available soil Cu content in each layer could
be attributed to the effect of soil properties.
Manganese (Mn)
The range of Mn availability varied from 3.42
to 44.33 mg kg-1
soil. Considering critical
value of 1.0 mg Mn kg-1
soil (Lindsay and
Norvell, 1978), all the samples were well
distributed with DTPA-extractable Mn. Sen et
al., (1997), Sarkar et al., (2002), Athokpam et
al., (2013), Athokpam et al., (2016),
Athokpam et al., (2018) reported the
abundance of DTPA – Mn in soils of
Manipur. The high amount of Mn in the soil
might be due to the solubility of this cation is
higher at low pH. The distribution did not trail
any regular trend in the entire sample.
Irregular distribution of DTPA-extractable
Mn with depth was observed. There is a
similar finding as compared to Rajkumar et
al., (1990), Athokpam et al., (2013),
Athokpam et al., (2016), Athokpam et al.,
(2018) and Singh and Athokpam (2018).
DTPA-extractable Mn content in the soil
profile showed positive and significant
correlated with soil OC (r=0.507*) and
(r=0.569*) in the 1st layer and 2
nd layer,
respectively. Only OC (19.400* and 18.707*)
content in the soils significantly correlated
with Mn content in the 2nd
and 3rd
layers.
Multiple correlation and regression analyses
indicated that 25.7, 32.4 and 24.9 per cent
variability in available Mn content were due
to the effect of OC content in the soils (Table
3).
Zinc (Zn)
DTPA-extractable Zn in the soil profile varied
from 0.24 to 1.36 mg kg-1
soil. DTPA-
extractable Zn, like other soil nutrients,
accumulates more in surface layers than sub-
surface layers and goes on decreasing with the
increase in depth. This might be due to the Zn
interacts with organic matter in the soils, thus
formed both soluble and insoluble Zn-organic
complexes, as studied soils are high organic
matter content in the surface soils. Pati and

Int.J.Curr.Microbiol.App.Sci (2019) 8(7): 1166-1177
1170
Mukhopadhyay, (2011), Athokpam et al.,
(2013), Athokpam et al., (2016), Athokpam et
al., (2018) and Singh and Athokpam (2018)
reported similar findings. In view of the
critical limit of 0.6 mg Zn kg-1
soil (Lindsay
and Norvell, 1978), Zn which deficiency
occurred in 55.56 % soils and required Zn
fertilization for better yield of orange. Sen et
al., (1997) and Sarkar et al., (2002) also
observed inadequate or marginal adequate in
available Zn in soils of Manipur. DTPA-Zn
content in the soil showed positive and
significantly related with clay (r=0.494*) and
K (r=0.501*) in the 1st and 3
rd layer,
respectively and negatively significantly
related with silt content (r= -0.709**).
Multiple correlation and regression analyses
revealed that 60.5 and 24.8 per cent
variability in available Zn content may be due
to the simultaneous effect of the various soil
properties such as silt and clay and K
included in the1st
and 3rd
profiles,
respectively. Only silt content in the soils
significantly correlated with Mn content in
the surface layer (0.076*) (Table 4–6).
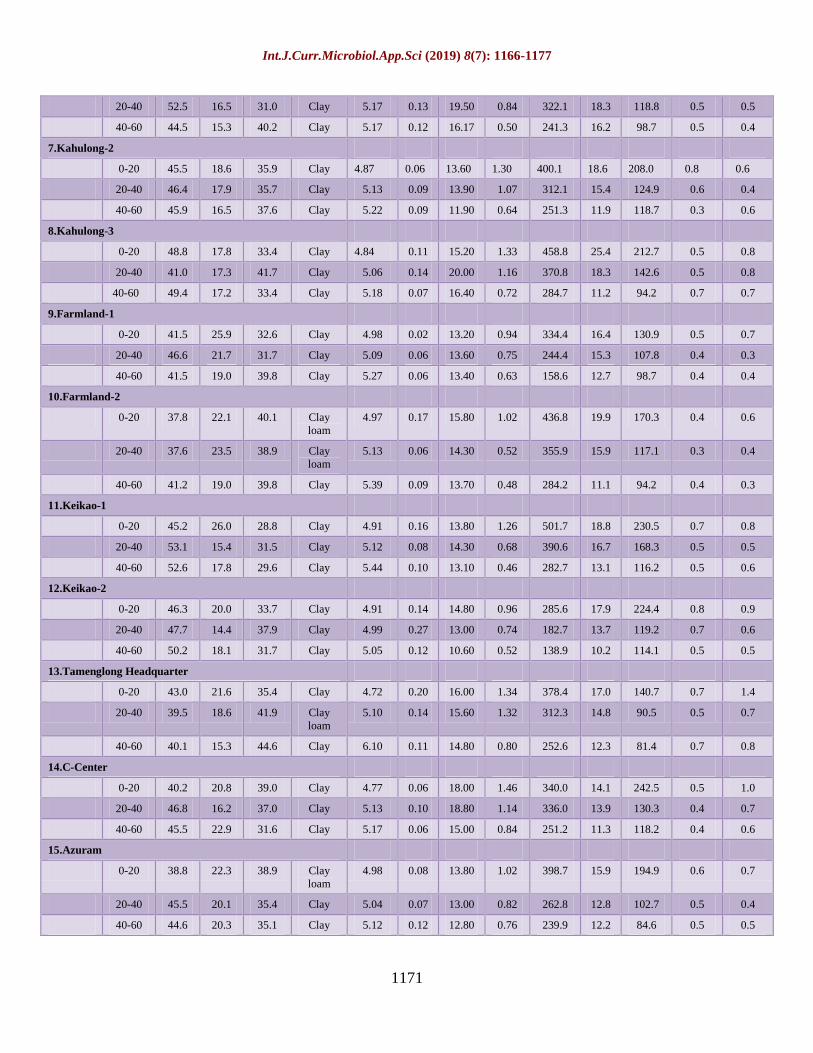
Table.1 Physico-chemical properties of soil profiles
Sample Depth
(cm)
Clay
%
Silt
%
Sand
%
Texture
pH
(1:2.5)
E.C
(dSm-1
)
CEC
[Cmol
(p+)
kg-1
]
OC
(%)
N
Kg/ha
P2O5
Kg/h
a
K2O
Kg/ha
Ca++
[Cmol
(p+)
kg-1
]
Mg++
[Cmol
(p+)
kg-1
]
1.Taningjam
0-20 47.1 22.2 30.7 Clay 4.90 0.08 14.60 1.36 512.7 21.3 198.3 0.9 0.5
20-40 51.0 21.9 27.1 Clay 5.04 0.04 14.90 0.98 430.5 18.1 118.1 0.7 0.5
40-60 46.8 19.0 34.2 Clay 5.13 0.06 12.50 0.72 352.5 15.5 106.0 0.5 0.5
2.Dailong-1
0-20 44.8 19.0 36.2 Clay 4.95 0.22 12.40 1.38 338.9 16.2 196.3 0.8 0.6
20-40 43.1 13.4 43.5 Clay 5.16 0.15 11.00 1.10 286.6 14.0 142.2 0.6 0.8
40-60 40.8 17.5 41.7 Clay 5.27 0.11 10.80 0.86 225.9 12.8 106.1 0.4 0.6
3.Dailong-2
0-20 39.1 24.2 36.7 Clay
loam
4.92 0.12 16.40 1.08 348.2 17.3 206.3 0.6 1.1
20-40 49.9 16.7 33.4 Clay 5.08 0.05 17.20 1.02 262.4 15.1 136.1 0.4 1.2
40-60 47.5 22.3 30.2 Clay 5.22 0.08 16.80 0.78 236.6 13.6 116.9 0.4 1.0
4.Bhalok
0-20 41.2 22.2 36.6 Clay 4.68 0.10 19.34 1.58 536.5 23.8 186.3 0.6 0.9
20-40 38.9 21.6 39.5 Clay
loam
4.90 0.11 18.30 1.02 404.6 19.6 108.1 0.5 0.8
40-60 38.7 24.8 36.5 Clay
loam
5.39 0.08 16.70 0.94 346.7 16.1 96.0 0.4 0.9
5.Tamei Road
0-20 42.6 22.5 34.9 Clay 4.92 0.11 16.80 1.29 452.8 19.0 144.8 0.4 0.6
20-40 48.0 22.7 29.3 Clay 5.16 0.10 17.40 1.04 344.9 16.8 133.2 0.4 0.5
40-60 51.8 19.3 28.9 Clay 5.28 0.06 16.20 0.78 264.4 15.2 92.1 0.4 0.3
6.Kahulong-1
0-20 49.4 24.3 26.3 Clay 4.90 0.17 17.30 0.94 415.1 20.5 194.9 0.6 0.8
Int.J.Curr.Microbiol.App.Sci (2019) 8(7): 1166-1177
1171
20-40 52.5 16.5 31.0 Clay 5.17 0.13 19.50 0.84 322.1 18.3 118.8 0.5 0.5
40-60 44.5 15.3 40.2 Clay 5.17 0.12 16.17 0.50 241.3 16.2 98.7 0.5 0.4
7.Kahulong-2
0-20 45.5 18.6 35.9 Clay 4.87 0.06 13.60 1.30 400.1 18.6 208.0 0.8 0.6
20-40 46.4 17.9 35.7 Clay 5.13 0.09 13.90 1.07 312.1 15.4 124.9 0.6 0.4
40-60 45.9 16.5 37.6 Clay 5.22 0.09 11.90 0.64 251.3 11.9 118.7 0.3 0.6
8.Kahulong-3
0-20 48.8 17.8 33.4 Clay 4.84 0.11 15.20 1.33 458.8 25.4 212.7 0.5 0.8
20-40 41.0 17.3 41.7 Clay 5.06 0.14 20.00 1.16 370.8 18.3 142.6 0.5 0.8
40-60 49.4 17.2 33.4 Clay 5.18 0.07 16.40 0.72 284.7 11.2 94.2 0.7 0.7
9.Farmland-1
0-20 41.5 25.9 32.6 Clay 4.98 0.02 13.20 0.94 334.4 16.4 130.9 0.5 0.7
20-40 46.6 21.7 31.7 Clay 5.09 0.06 13.60 0.75 244.4 15.3 107.8 0.4 0.3
40-60 41.5 19.0 39.8 Clay 5.27 0.06 13.40 0.63 158.6 12.7 98.7 0.4 0.4
10.Farmland-2
0-20 37.8 22.1 40.1 Clay
loam
4.97 0.17 15.80 1.02 436.8 19.9 170.3 0.4 0.6
20-40 37.6 23.5 38.9 Clay
loam
5.13 0.06 14.30 0.52 355.9 15.9 117.1 0.3 0.4
40-60 41.2 19.0 39.8 Clay 5.39 0.09 13.70 0.48 284.2 11.1 94.2 0.4 0.3
11.Keikao-1
0-20 45.2 26.0 28.8 Clay 4.91 0.16 13.80 1.26 501.7 18.8 230.5 0.7 0.8
20-40 53.1 15.4 31.5 Clay 5.12 0.08 14.30 0.68 390.6 16.7 168.3 0.5 0.5
40-60 52.6 17.8 29.6 Clay 5.44 0.10 13.10 0.46 282.7 13.1 116.2 0.5 0.6
12.Keikao-2
0-20 46.3 20.0 33.7 Clay 4.91 0.14 14.80 0.96 285.6 17.9 224.4 0.8 0.9
20-40 47.7 14.4 37.9 Clay 4.99 0.27 13.00 0.74 182.7 13.7 119.2 0.7 0.6
40-60 50.2 18.1 31.7 Clay 5.05 0.12 10.60 0.52 138.9 10.2 114.1 0.5 0.5
13.Tamenglong Headquarter
0-20 43.0 21.6 35.4 Clay 4.72 0.20 16.00 1.34 378.4 17.0 140.7 0.7 1.4
20-40 39.5 18.6 41.9 Clay
loam
5.10 0.14 15.60 1.32 312.3 14.8 90.5 0.5 0.7
40-60 40.1 15.3 44.6 Clay 6.10 0.11 14.80 0.80 252.6 12.3 81.4 0.7 0.8
14.C-Center
0-20 40.2 20.8 39.0 Clay 4.77 0.06 18.00 1.46 340.0 14.1 242.5 0.5 1.0
20-40 46.8 16.2 37.0 Clay 5.13 0.10 18.80 1.14 336.0 13.9 130.3 0.4 0.7
40-60 45.5 22.9 31.6 Clay 5.17 0.06 15.00 0.84 251.2 11.3 118.2 0.4 0.6
15.Azuram
0-20 38.8 22.3 38.9 Clay
loam
4.98 0.08 13.80 1.02 398.7 15.9 194.9 0.6 0.7
20-40 45.5 20.1 35.4 Clay 5.04 0.07 13.00 0.82 262.8 12.8 102.7 0.5 0.4
40-60 44.6 20.3 35.1 Clay 5.12 0.12 12.80 0.76 239.9 12.2 84.6 0.5 0.5

Int.J.Curr.Microbiol.App.Sci (2019) 8(7): 1166-1177
1172
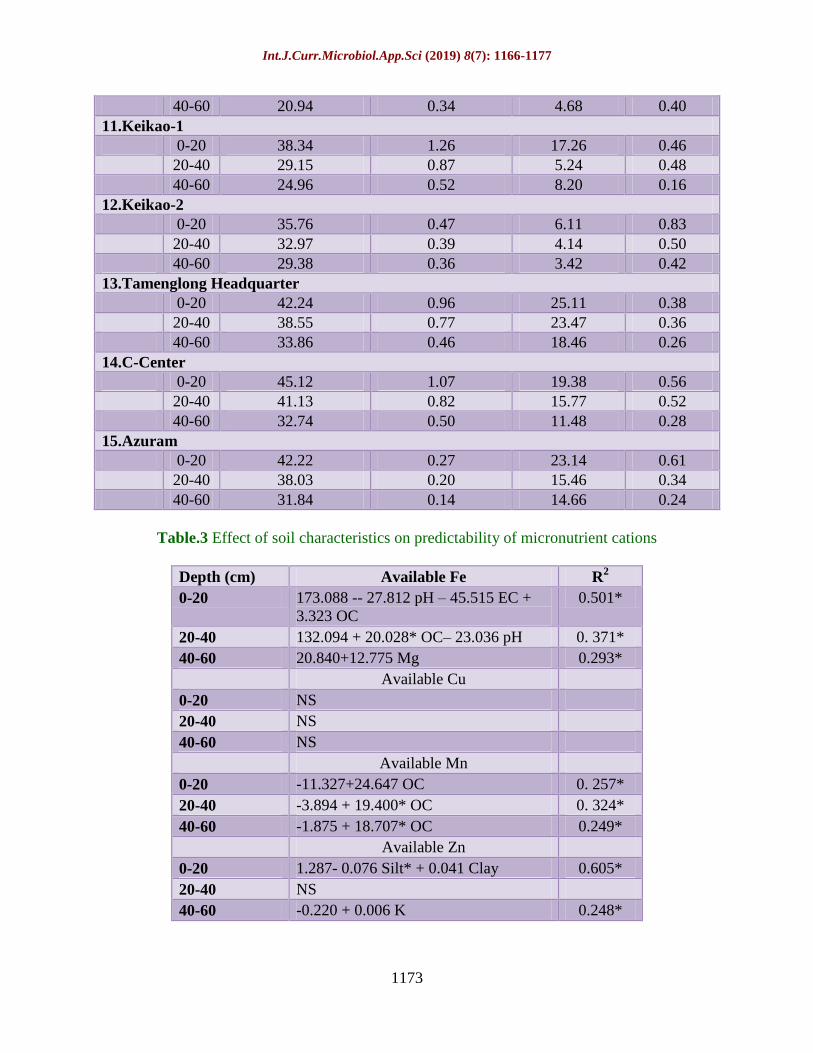
Table.2 Distribution of available DTPA-extractable micronutrients of soil profile
Sample Depth
(cm)
DTPA – Extractable micronutrients (mg kg-1
)
Fe Cu Mn Zn
1.Taningjam
0-20 37.26 0.43 17.66 0.71
20-40 34.47 0.37 13.12 0.58
40-60 29.88 0.22 8.24 0.44
2.Dailong-1
0-20 34.10 0.43 44.33 1.22
20-40 26.31 0.31 32.01 0.68
40-60 21.72 0.24 21.16 0.54
3.Dailong-2
0-20 33.12 0.53 21.16 0.67
20-40 32.33 0.46 20.17 0.62
40-60 27.74 0.28 18.00 0.41
4.Bhalok
0-20 42.44 0.51 29.80 0.74
20-40 37.65 0.41 13.14 0.40
40-60 33.06 0.26 10.24 0.30
5.Tamei Road
0-20 25.00 0.39 17.84 0.79
20-40 23.21 0.29 14.75 0.68
40-60 18.62 0.12 12.24 0.50
6.Kahulong-1
0-20 29.24 0.25 21.35 0.95
20-40 27.05 0.25 19.19 0.65
40-60 26.86 0.16 16.50 0.64
7.Kahulong-2
0-20 37.32 0.48 13.12 1.32
20-40 35.53 0.36 12.24 0.68
40-60 32.94 0.20 9.72 0.54
8.Kahulong-3
0-20 40.68 0.41 11.14 1.36
20-40 39.89 0.35 9.19 1.24
40-60 31.30 0.18 6.42 0.88
9.Farmland-1
0-20 31.28 1.04 6.62 0.54
20-40 30.49 0.87 5.24 0.48
40-60 27.90 0.48 3.56 0.26
10.Farmland-2
0-20 27.32 0.68 6.13 0.82
20-40 24.13 0.42 5.97 0.52
Int.J.Curr.Microbiol.App.Sci (2019) 8(7): 1166-1177
1173
40-60 20.94 0.34 4.68 0.40
11.Keikao-1
0-20 38.34 1.26 17.26 0.46
20-40 29.15 0.87 5.24 0.48
40-60 24.96 0.52 8.20 0.16
12.Keikao-2
0-20 35.76 0.47 6.11 0.83
20-40 32.97 0.39 4.14 0.50
40-60 29.38 0.36 3.42 0.42
13.Tamenglong Headquarter
0-20 42.24 0.96 25.11 0.38
20-40 38.55 0.77 23.47 0.36
40-60 33.86 0.46 18.46 0.26
14.C-Center
0-20 45.12 1.07 19.38 0.56
20-40 41.13 0.82 15.77 0.52
40-60 32.74 0.50 11.48 0.28
15.Azuram
0-20 42.22 0.27 23.14 0.61
20-40 38.03 0.20 15.46 0.34
40-60 31.84 0.14 14.66 0.24
Table.3 Effect of soil characteristics on predictability of micronutrient cations
Depth (cm) Available Fe R2
0-20 173.088 -- 27.812 pH – 45.515 EC +
3.323 OC
0.501*
20-40 132.094 + 20.028* OC– 23.036 pH 0. 371*
40-60 20.840+12.775 Mg 0.293*
Available Cu
0-20 NS
20-40 NS
40-60 NS
Available Mn
0-20 -11.327+24.647 OC 0. 257*
20-40 -3.894 + 19.400* OC 0. 324*
40-60 -1.875 + 18.707* OC 0.249*
Available Zn
0-20 1.287- 0.076 Silt* + 0.041 Clay 0.605*
20-40 NS
40-60 -0.220 + 0.006 K 0.248*
Int.J.Curr.Microbiol.App.Sci (2019) 8(7): 1166-1177
1174
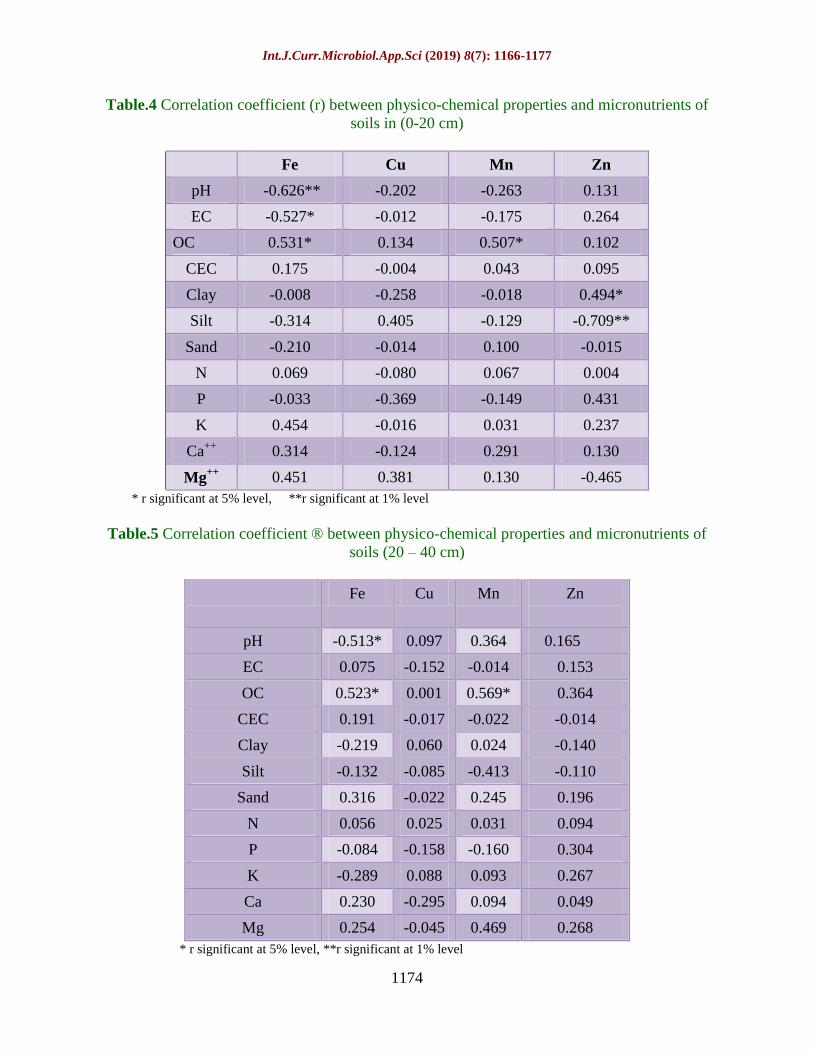
Table.4 Correlation coefficient (r) between physico-chemical properties and micronutrients of
soils in (0-20 cm)
Fe Cu Mn Zn
pH -0.626** -0.202 -0.263 0.131
EC -0.527* -0.012 -0.175 0.264
OC 0.531* 0.134 0.507* 0.102
CEC 0.175 -0.004 0.043 0.095
Clay -0.008 -0.258 -0.018 0.494*
Silt -0.314 0.405 -0.129 -0.709**
Sand -0.210 -0.014 0.100 -0.015
N 0.069 -0.080 0.067 0.004
P -0.033 -0.369 -0.149 0.431
K 0.454 -0.016 0.031 0.237
Ca++
0.314 -0.124 0.291 0.130
Mg++ 0.451 0.381 0.130 -0.465
* r significant at 5% level, **r significant at 1% level
Table.5 Correlation coefficient ® between physico-chemical properties and micronutrients of
soils (20 – 40 cm)
Fe Cu Mn Zn
pH -0.513* 0.097 0.364 0.165
EC 0.075 -0.152 -0.014 0.153
OC 0.523* 0.001 0.569* 0.364
CEC 0.191 -0.017 -0.022 -0.014
Clay -0.219 0.060 0.024 -0.140
Silt -0.132 -0.085 -0.413 -0.110
Sand 0.316 -0.022 0.245 0.196
N 0.056 0.025 0.031 0.094
P -0.084 -0.158 -0.160 0.304
K -0.289 0.088 0.093 0.267
Ca 0.230 -0.295 0.094 0.049
Mg 0.254 -0.045 0.469 0.268
* r significant at 5% level, **r significant at 1% level

Int.J.Curr.Microbiol.App.Sci (2019) 8(7): 1166-1177
1175
Table.6 Correlation coefficient ® between physico-chemical properties and micronutrients of
soils (40 – 60 cm)
Fe Cu Mn Zn
pH 0.113 0.424 0.300 -0.346
EC 0.038 -0.077 0.354 -0.067
OC 0.297 -0.193 0.499* -0.039
CEC 0.090 -0.086 0.130 0.106
Clay -0.221 -0.103 -0.261 0.203
Silt 0.134 0.121 -0.123 -0.413
Sand 0.126 0.025 0.311 0.051
N 0.082 -0.262 0.068 0.064
P -0.139 -0.460 0.286 0.170
K 0.149 0.046 -0.294 0.501*
Ca++
0.306 0.068 0.053 0.210
Mg++
0.542* 0.131 0.386 -0.076
*r significant at 5% level, ** r significant at 1% level
It can be concluded that there exists variation
in soil properties with respect to depth in soil
profiles. The surface layer soils were fairly
high in organic carbon and adequate in all the
micronutrients content. But the content of all
the nutrients were low in the sub-surface
layers especially from 40 cm to 60 cm depth
as compared to the surface layers in all the
studied areas. As compared to other
micronutrients, the Zn content of the lower
layers was found to be more deficient in many
samples. The macronutrient content of most
the sample varies from low to medium in all
the profile. This may be an important reason
for decreasing production potential of orange
in Tamenglong district of Manipur. Moreover,
the lack of fertilization practice results in soil
fertility depletion in the long run as well as
the demand cannot be supplied. It is of great
importance to replenish the nutrient content of
the soil and to maintain balanced fertilization
for proper crop production. Therefore, it is
advisable to apply Cu and Zn along with
macronutrients to sustain the fertility of the
soils as well as productivity of crop to
increase the income of the farming
community.
References
Athokpam, H., Wani, S.H., Kamei, D.,
Athokpam, H.S., Nongmaithem, J.,
Kumar, D., Singh, Y.K., Naorem, B.S.,
Devi, T.R. and Devi, L. (2013). Soil
macro- and micro-nutrient status of
Senapati district, Manipur (India).
African Journal of Agricultural
Research. 8(39): 4932-4936.
Athokpam, H.S., Singh, K.S., Chongtham, N.,
Devi, K.N., Singh, N.B., Sanatomba, A.
and Sharma, P.T. (2018). Vertical
distribution of micronutrient cations in
Imphal east and west district, Manipur
(India). International Journal of Current
Microbiology and Applied Sciences.
7(8): 4222-4227.
Athokpam, H.S., Vikramjit, K., Chongtham, N.,
Int.J.Curr.Microbiol.App.Sci (2019) 8(7): 1166-1177
1176
Devi, K.N., Singh, N.B., Singh, N.G.,
Sharma, P.T. and Heisnam, P. (2018).
Micronutrient cations distribution in the
soil profile of orange (Citrus reticulata)
orchard of Tamenglong district,
Manipur (India). Journal of
Experimental Biology and Agricultural
Sciences. 6(1): 108-115.
Athokpam, H.S., Zimik, V.S., Chongtham, N.,
Devi, K.N., Singh, N.B., Watham, L.,
Sharma, P.T. and Athokpam, H. (2016).
Profile distribution of micronutrient
cations in citrus orchard of Ukhrul
district, Manipur (India). International
Journal of Agriculture, Environment
and Biotechnology. 9(4): 691-697.
Bell, R.W. and Dell, B. (2008). Micronutrients
for sustainable food, feed, fibre and
bioenergy production. 1st edn. IFA,
Paris, France.
Borah, D.K., Bordoloi, P.K., Karmakar, R.M.,
Baruah, N.G. and Das, M. (1987).
Practical Manual for Fundamental of
Soil Science (Part-III), Jorhat, Assam.
Bouyoucos, G.J. (1951). Soil Science. 23: 319-
343.
Bray, R.H. and Kurtz, L.T. (1945).
Determination of total, organic and
available forms of phosphorus in soils.
Soil Sci., 59: 39-45.
Chopra, S.L. and Kanwar, J. 1976. Analytical
Agricultural Chemistry. Kalyani
Publishers, Ludhiana, Punjab, India.
Gao, S., Yan, R., Cao, M., Yang, W., Wang, S.
and Chen, F. (2008). Effect of on
growth, antioxidant enzymes and
phenylalanine ammonia-lyase activities
in Jatropha curcas L. seedling. Plant
Soil and Environment. 54(3): 117-122.
Gupta, N., Trivedi, S.K., Bansal, K.N. and
Kaul, R.K. (2003). Vertical distribution
of micronutrient cations in some soil
series of northern Madhya Pradesh.
Journal of the Indian Society of Soil
Science. 51(4): 517-522.
Jackson, M.L. (1973). Soil Chemical Analysis.
Prentice-Hall of India Pvt. Ltd. New
Delhi.
Kumar, T.V., Reddy, M.S., and Krishna, V.G.
(1996). Vertical distribution of
micronutrient cations in some soil
profiles of Northern Telangana of
Andhra Pradesh. Journal of the Indian
Society of Soil Science. 44(2): 328-330.
Lindsay, W.L. and Norvell, W.A. (1978).
Development of DTPA soil test for zinc,
iron, manganese and copper. American
Journal of Soil Science. 42: 421-428.
Murthy, I.Y.L.N., Sastry, T.G., Dutta, S.C.,
Narayanasamy, G. and Rattan, R.K.
(1997). Distribution of micronutrient
cations in vertisols derived from
different parent material. J. Journal of
the Indian Society of Soil Science.
45(3): 577-580.
Panse, V.G. and Sukhatme, P.V. (1985).
Statistical Methods for Agricultural
Workers. ICAR, New Delhi.
Pati, R. and Mukhopadhyay, D. (2011).
Distribution of cationic micronutrients
in some acid soils of West Bengal.
Journal of the Indian Society of Soil
Science. 59(2): 125-133.
Rajkumar, Nayyar, V. K., Sidhu, G. S. and
Deshmukh, S. N. (1990). Distribution of
available micronutrient cations in some
dominant soil series in different
physiographic units of Bundelkhand
region of Madhya Pradesh. Journal of
the Indian Society of Soil Science. 38:
410-415.
Rattan, R.K., Patel, K.P., Manjaiah, K.M. and
Datta, S.P. (2009). Micronutrients in
soil, plant, animal and human health.
Journal of the Indian Society of Soil
Science. 57(4): 546-558.
Rengel, Z. (2007). Cycling of micronutrients in
terrestrial ecosystems. In: Marschner, P.
and Rengel, Z. (Eds.) Nutrient Cycling
in Terrestrial Ecosystem. Springer-
Verlag, Berlin, Heidelberg, pp. 93-121.
Sakar, D., Baruah, U., Gangpadhyay, S.K.,
Sahoo, A.K. and Velayutham, M
(2002). Characteristics and
classification of soils of Lotak
catchment area of Manipur for
sustainable land use planning. Journal of
the Indian Society of Soil Science.

Int.J.Curr.Microbiol.App.Sci (2019) 8(7): 1166-1177
1177
50(2): 196-204.
Satyavathi, P.L.A. and Reddy, M.S. (2004).
Distribution of DTPA extractable
micronutrient in soils of Telengana,
Andhra Pradesh, Agropedology. 14(1):
32-37.
Sen, T.K., Dubey, P.N., Maji, A.K. and
Chamuah, G.S. (1997). Status of
micronutrients in some dominant soils
of Manipur. Journal of the Indian
Society of soil Science. 45(2): 388-390.
Sharma, P.D. (2008). Nutrient management –
challenges and options. Journal of the
Indian Society of Soil Science. 55: 395-
403.
Sharma, R.P., Singh, M. and Sharma, J.P.
(2003). Correlation studies on
micronutrients vis-à-vis soil properties
in some soils of Nagaur district in semi-
arid region of Rajasthan. Journal of the
Indian Society of Soil Science. 51(4):
522-527
Singh, K.S. and Athokpam, H. (2018). Physico-
chemical characterization of farmland
soil in some villages of Chandel hill
district, Manipur (India). International
Journal of Current Microbiology and
Applied Sciences. 7(2): 417-425.
Singh, L.P., Athokpam, H.S., Chongtham, N.,
Devi, K.N., Singh, N.B., Sanatomba, A.,
Singh, N.G. and Sharma, P.T. (2018).
Vertical distribution of micronutrient
cations in Thoubal and Bishnupur
district, Manipur (India). International
Journal of Current Microbiology and
Applied Sciences. 7(9): 2178-2183.
Singh, M.V. (2004). Micronutrient deficiencies
in Indian soils and field usable practices
for their correction. IFA International
Conference on Micronutrients, New
Delhi.
Srivastava, A. K. and S. Singh, (2002a). World
citrus: Climate and soil analysis. In
Citrus: Climate and soil. Eds.1-2902.
International Book Distributing Co.,
Lucknow, Uttar Pradesh, India.
Srivastava, A. K. and S. Singh, (2002b). Soil
analysis based diagnostic norms for
Indian citrus cultivar. Communication
in Soil Science and Plant Analysis. 33:
1689-1706.
Srivastava, P.P, Pandiaraj, T., Das, S. and
Sinha, A.K. (2017). Assessment of
micronutrient status of soil under Tasar
host plant growing regions in Jashpur
district, Chhattisgarh State. Imperial
Journal Interdisciplinary Research. 3:
1080-1083.
Subbiah, B.V. and Asija, G.L. (1956). A rapid
procedure for estimation of available N
in soils. Current Sciences. 25: 259-260
Verma, V.K., Setia, R.K., Sharma, P.K.
(2007b). Distribution of micronutrient
cations in different physiographic units
of semi-arid region of Punjab.
Agropedology. 18: 58-65.
Walkley, A. and Black, C.A. (1934). An
examination of the method for
determining soil organic matter and a
proposed modification of the chromic
acid titration method. Soil Science.
37(16): 29-39.
How to cite this article:
Laikhuram Banarjee Singh, Herojit Singh Athokpam, Rajkumar Kumarjit Singh, K. Nandini
Devi, Edwin Luikham and Okendro Singh, N. 2019. Vertical Distribution of Micronutrient
Cations in the Orange (Citrus reticulata) Orchard, Tamenglong District, Manipur (India).
Int.J.Curr.Microbiol.App.Sci. 8(07): 1166-1177. doi: https://doi.org/10.20546/ijcmas.2019.807.138