


Idiomas
Páginas
Jurídico


7/27/2019 Animaciones Con Matlab
http://slidepdf.com/reader/full/animaciones-con-matlab 1/28
Animations in MATLAB
Daniel Lab Hallway Salon
02-11-2011
https://courses.washington.edu/danielab/labwiki/index.php?title=Making_animations_in_MATLAB
Friday, February 11, 2011

7/27/2019 Animaciones Con Matlab
http://slidepdf.com/reader/full/animaciones-con-matlab 2/28
From Mathworks docs:
You can create animated sequences with MATLAB graphics in three differentways:
■ Save a number of different pictures and play them back as a movie.
■ Continually erase and redraw the objects on the screen, makingincremental changes with each redraw.
■ Redefine the XData, YData, ZData, and/or CData plot object properties,
optionally linking them to data sources (workspace variables) and updatingthe properties via calls to refreshdata.
Easiest implementation:
FOR - loop creates updated figuresfor each frame of the final movie
I’ll show you the recipe that works for me, but
there are many ways to achieve animated bliss
Friday, February 11, 2011

7/27/2019 Animaciones Con Matlab
http://slidepdf.com/reader/full/animaciones-con-matlab 3/28
Example movie:
Friday, February 11, 2011
7/27/2019 Animaciones Con Matlab
http://slidepdf.com/reader/full/animaciones-con-matlab 4/28
Friday, February 11, 2011
7/27/2019 Animaciones Con Matlab
http://slidepdf.com/reader/full/animaciones-con-matlab 5/28
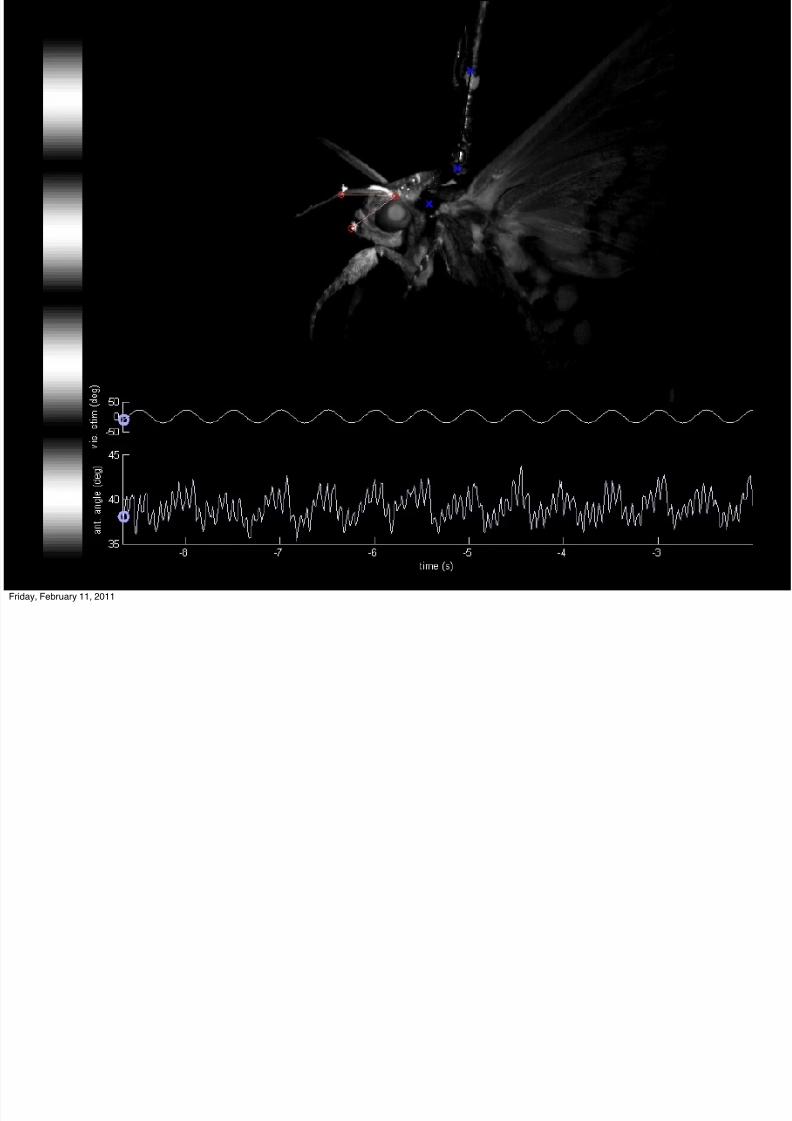
Digitized points (3D) of a hovering moth
Friday, February 11, 2011

7/27/2019 Animaciones Con Matlab
http://slidepdf.com/reader/full/animaciones-con-matlab 6/28
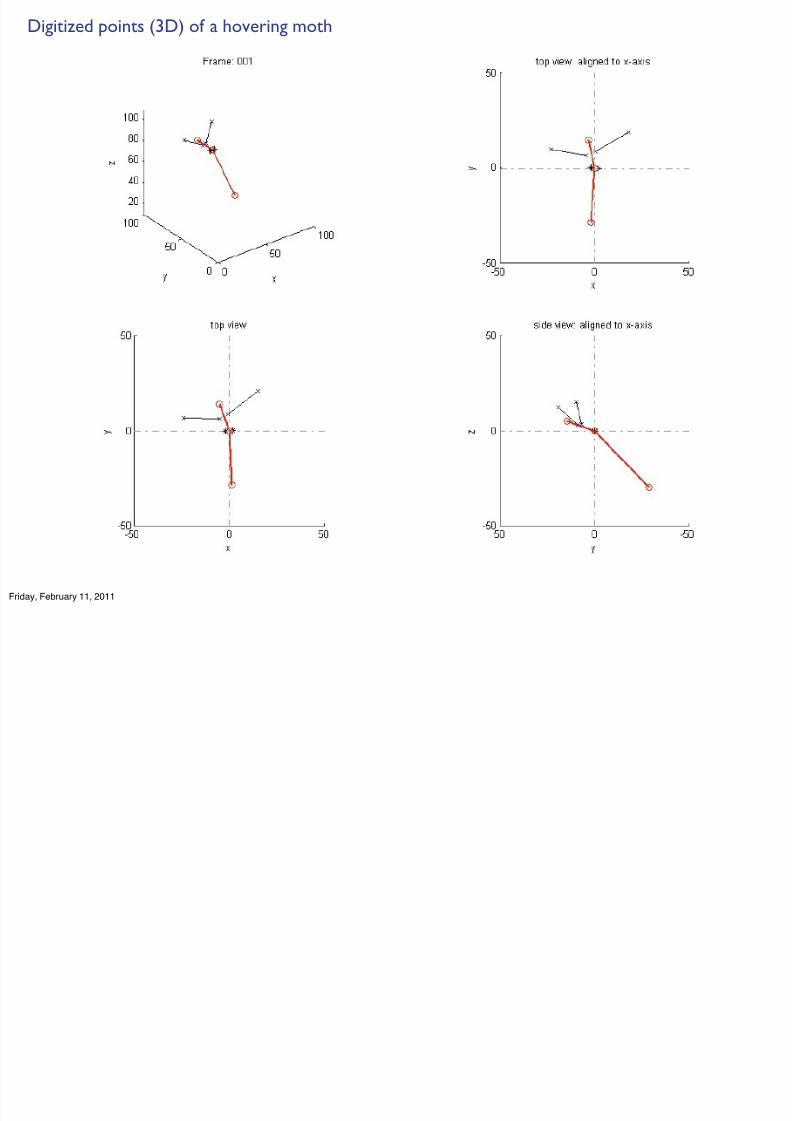
Step-by-step example of how to create a multi-axes animation
Topic covered:
creating an animation from a parametric equation
saving the animation as an image sequence (TIFF stack)
planning and creating a multi-axes figure
load sequential images from TIFF stack
draw axes for images and data graphs
update information for each frame
set up the FOR loop
save figure content into AVI movie file
Friday, February 11, 2011
7/27/2019 Animaciones Con Matlab
http://slidepdf.com/reader/full/animaciones-con-matlab 7/28
Step-by-step example of how to create a multi-axes animation
Topic covered:
creating an animation from a parametric equation
saving the animation as an image sequence (TIFF stack)
planning and creating a multi-axes figure
load sequential images from TIFF stack
draw axes for images and data graphs
update information for each frame
set up the FOR loop
save figure content into AVI movie file
Friday, February 11, 2011

7/27/2019 Animaciones Con Matlab
http://slidepdf.com/reader/full/animaciones-con-matlab 8/28
Creating an animation from a parametric equation: setting up the patha dot should move along
%% create data for our animation: a dot moving along a path
% Our aim is to make a circle move around an image along a specified path.
% First, we'll create that path (xpos and ypos)
revolution_no = 5; % how often around the circle
ang_resolution = 40; % how many points (i.e. frames) per circle
da = 2*pi/ang_resolution; % delta angle
t = 0:da:revolution_no*2*pi; % time steps
% why not a spiral:
pathradius = linspace(0,10,length(t)); % path radius increases each dt
xpos = pathradius.*cos(t);ypos = pathradius.*sin(t);
% show what we have so far:
figure(1);
subplot(1,3,1:2)
plot(t,xpos, '-k'); hold on;
plot(t,ypos, '-r');
set(gca, 'XLim', [0 max(t)]); box off;
xlabel('time steps'); ylabel('x (black) and y (red) pos')
subplot(1,3,3)
plot(xpos,ypos,'k'); axis equal; axis off;
title('The path our circle will move along');
% We now want to use these x-y coordinates to place a cirle on an image.
% Each iteration, we want the position to be updated so that it appears as
% if the circle moved around the specified path.
% In addition, we want the circle diameter to change as it goes along.
circlesize = linspace(0.2,2, length(t)); % circle size increases linearly
Friday, February 11, 2011

7/27/2019 Animaciones Con Matlab
http://slidepdf.com/reader/full/animaciones-con-matlab 9/28
%% Test the moving circle% We'll now plot a circle for each time steps, according to the path and
% size specifications above. I created a separate function to create the
% circle, called 'plotfilledcircle'.
axlim = 15;
figure;
for c = 1:length(t)
ph=plotfilledcircle(circlesize(c), [xpos(c) ypos(c)]);
% we need to set the axes to an appropriate limit, otherwise they'll
% resize to always show the full circle:
axis([-axlim axlim -axlim axlim]);
axis square;
% create a counter that updates each iteration:
titlestr = sprintf('Frame: %03d', c);
title(titlestr);
pause(0.05); % pause a bit to see animationend
Plotting a circle that follows our path equation
helper
function
Friday, February 11, 2011

7/27/2019 Animaciones Con Matlab
http://slidepdf.com/reader/full/animaciones-con-matlab 10/28
Function to draw a circle
function ph = plotfilledcircle(circle_radius,circlecenter, fcol)
%
% plotfilledcircle(circle_radius,circlecenter, fcol)
%% Function to plot a filled circle with radius 'circle_radius'
% 'circlecenter' ... center location [0 0] is default
% 'fcol' is optional and defines the face color (black default)
%
% Armin H 2011
if nargin < 2
circlecenter = [0 0];end
if nargin < 3
fcol = [0 0 0];
end
theta = linspace(0,2*pi,100); % 100 points between 0 and 2pi
x = circle_radius*cos(theta) + circlecenter(1);
y = circle_radius*sin(theta) + circlecenter(2);
ph = fill(x, y, 'k');
set(ph, 'FaceColor', fcol);
box off; axis equal;
end
helper
function
Friday, February 11, 2011

7/27/2019 Animaciones Con Matlab
http://slidepdf.com/reader/full/animaciones-con-matlab 11/28
Step-by-step example of how to create a multi-axes animation
Topic covered:
creating an animation from a parametric equation
saving the animation as an image sequence (TIFF stack)
planning and creating a multi-axes figure
load sequential images from TIFF stack
draw axes for images and data graphs
update information for each frame
set up the FOR loop
save figure content into AVI movie file
Friday, February 11, 2011
7/27/2019 Animaciones Con Matlab
http://slidepdf.com/reader/full/animaciones-con-matlab 12/28
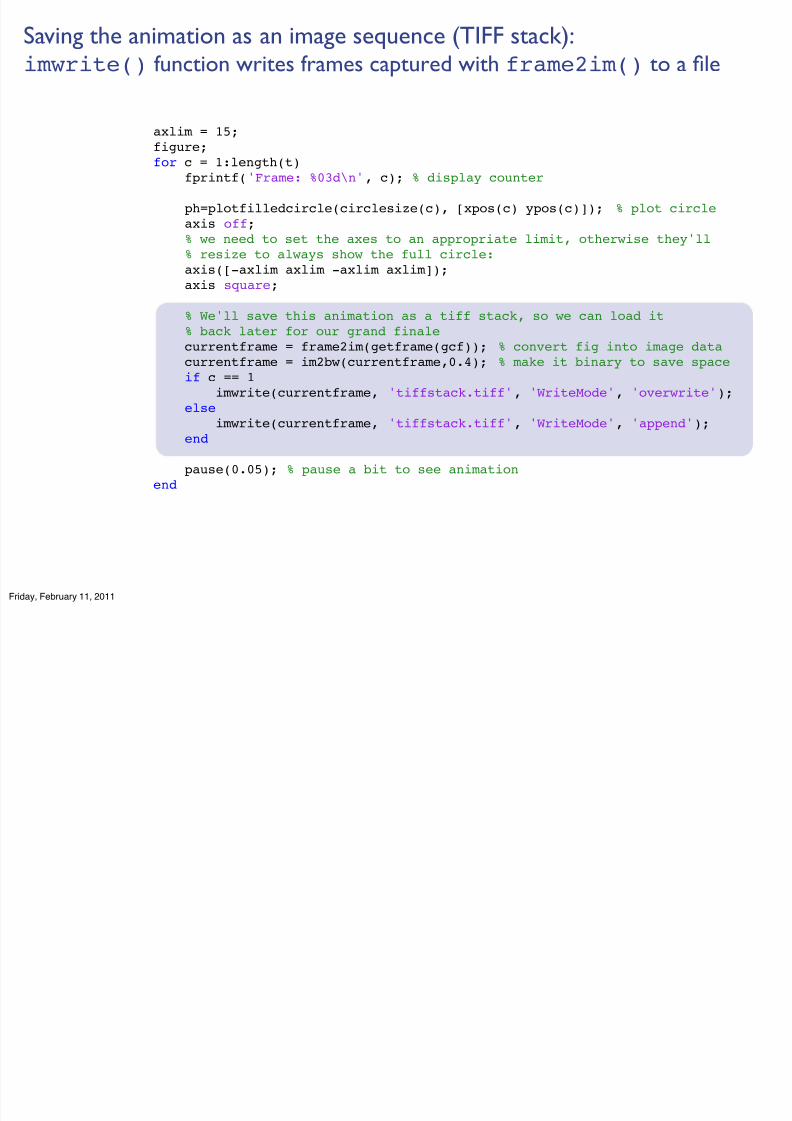
Saving the animation as an image sequence (TIFF stack):imwrite() function writes frames captured with frame2im() to a file
axlim = 15;figure;for c = 1:length(t)
fprintf('Frame: %03d\n', c); % display counter
ph=plotfilledcircle(circlesize(c), [xpos(c) ypos(c)]); % plot circleaxis off;
% we need to set the axes to an appropriate limit, otherwise they'll % resize to always show the full circle:
axis([-axlim axlim -axlim axlim]);axis square;
% We'll save this animation as a tiff stack, so we can load it % back later for our grand finale
currentframe = frame2im(getframe(gcf)); % convert fig into image datacurrentframe = im2bw(currentframe,0.4); % make it binary to save space
if c == 1imwrite(currentframe, 'tiffstack.tiff', 'WriteMode', 'overwrite');
elseimwrite(currentframe, 'tiffstack.tiff', 'WriteMode', 'append');
end
pause(0.05); % pause a bit to see animationend
Friday, February 11, 2011

7/27/2019 Animaciones Con Matlab
http://slidepdf.com/reader/full/animaciones-con-matlab 13/28
Step-by-step example of how to create a multi-axes animation
Topic covered:
creating an animation from a parametric equation
saving the animation as an image sequence (TIFF stack)
planning and creating a multi-axes figure
load sequential images from TIFF stack
draw axes for images and data graphs
update information for each frame
set up the FOR loop
save figure content into AVI movie file
Friday, February 11, 2011

7/27/2019 Animaciones Con Matlab
http://slidepdf.com/reader/full/animaciones-con-matlab 14/28
Planning and creating a multi-axes figure
x
y
width
height
ax_pos = [x y width height];
ax_handle = axes;
set(ax_handle, 'Units', 'pixels', 'Position', ax_pos);
set(ax_handle, 'Units', 'normalized', 'Position', ax_pos);or relative sizing:
fill plot of circle display framefrom TIFFstack
evolving graph of circle size
evolving graph of circle position
Friday, February 11, 2011

7/27/2019 Animaciones Con Matlab
http://slidepdf.com/reader/full/animaciones-con-matlab 15/28
Planning and creating a multi-axes figure: collect positions in matrices
I like to set up
position variablesbefore entering theloop.
Axes in the loop will
use these variables
to position
themselves on the
figure
It’s also useful to
declare often-used
colors at the onset
fig_pos = [100 10 1024 768]; % position and size of the figure window
fillplot_ax_pos = [80 320 400 400]; % position and size of fill plotimage_ax_pos = [580 320 400 400]; % image plot
sizedata_ax_pos = [50 170 1024-60 70]; % circle size graph
posdata_ax_pos = [50 50 1024-60 100]; % circle position graph
fig_col = [1 1 1]; % figure background color
text_col = [0 0 0]; % text color
light_grey = [.4 .4 .4];
dark_grey = [.2 .2 .2];
nice_blue = [51/255 51/255 102/255];light_red = [.6 .4 .4];
All this makes it easier to change the appearance of various elements
Friday, February 11, 2011

7/27/2019 Animaciones Con Matlab
http://slidepdf.com/reader/full/animaciones-con-matlab 16/28
Step-by-step example of how to create a multi-axes animation
Topic covered:
creating an animation from a parametric equation
saving the animation as an image sequence (TIFF stack)
planning and creating a multi-axes figure
load sequential images from TIFF stack
create axes for images and data graphs
update information for each frame
set up the FOR loop
save figure content into AVI movie file
Friday, February 11, 2011
7/27/2019 Animaciones Con Matlab
http://slidepdf.com/reader/full/animaciones-con-matlab 17/28
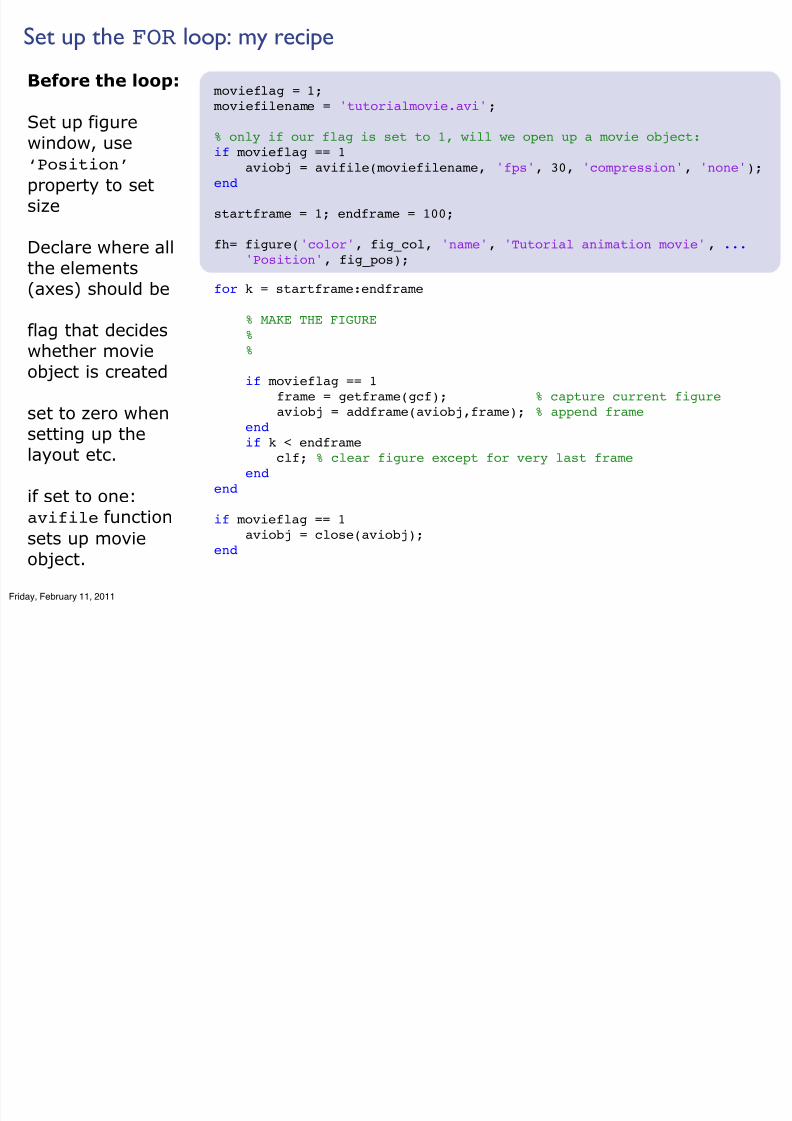
Set up the FOR loop: my recipe
Before the loop:
Set up figure
window, use‘Position’
property to set
size
Declare where all
the elements
(axes) should be
flag that decides
whether movie
object is created
set to zero whensetting up the
layout etc.
if set to one:avifile function
sets up movie
object.
movieflag = 1; moviefilename = 'tutorialmovie.avi';
% only if our flag is set to 1, will we open up a movie object:if movieflag == 1
aviobj = avifile(moviefilename, 'fps', 30, 'compression', 'none');end startframe = 1; endframe = 100; fh= figure('color', fig_col, 'name', 'Tutorial animation movie', ... 'Position', fig_pos);
for k = startframe:endframe
% MAKE THE FIGURE % %
if movieflag == 1frame = getframe(gcf); % capture current figure
aviobj = addframe(aviobj,frame); % append frame end if k < endframe
clf; % clear figure except for very last frame end
end if movieflag == 1
aviobj = close(aviobj);
end
Friday, February 11, 2011

7/27/2019 Animaciones Con Matlab
http://slidepdf.com/reader/full/animaciones-con-matlab 18/28
Set up the FOR loop: my recipe
In the loop:
Draw your axes in
the figure window
with data from
time step k
if movieflag equalsone, capture the
current figure withgetframe()
use addframe() to
append frame to
the movie object
clear the figurewith clf if you’re
not at the last
frame (seems to
make stuff faster)
movieflag = 1; moviefilename = 'tutorialmovie.avi';
% only if our flag is set to 1, will we open up a movie object:if movieflag == 1
aviobj = avifile(moviefilename, 'fps', 30, 'compression', 'none');end startframe = 1; endframe = 100; fh= figure('color', fig_col, 'name', 'Tutorial animation movie', ... 'Position', fig_pos);
for k = startframe:endframe
% MAKE THE FIGURE % %
if movieflag == 1frame = getframe(gcf); % capture current figure
aviobj = addframe(aviobj,frame); % append frame end if k < endframe
clf; % clear figure except for very last frame end
end if movieflag == 1
aviobj = close(aviobj);
end
Friday, February 11, 2011

7/27/2019 Animaciones Con Matlab
http://slidepdf.com/reader/full/animaciones-con-matlab 19/28
Set up the FOR loop: my recipe
Out of the loop:
Close the movie
object withclose(), if the flag
was set
movieflag = 1; moviefilename = 'tutorialmovie.avi';
% only if our flag is set to 1, will we open up a movie object:if movieflag == 1
aviobj = avifile(moviefilename, 'fps', 30, 'compression', 'none');end startframe = 1; endframe = 100; fh= figure('color', fig_col, 'name', 'Tutorial animation movie', ... 'Position', fig_pos);
for k = startframe:endframe
% MAKE THE FIGURE % %
if movieflag == 1frame = getframe(gcf); % capture current figure
aviobj = addframe(aviobj,frame); % append frame end if k < endframe
clf; % clear figure except for very last frame end
end if movieflag == 1
aviobj = close(aviobj);
end
Friday, February 11, 2011

7/27/2019 Animaciones Con Matlab
http://slidepdf.com/reader/full/animaciones-con-matlab 20/28
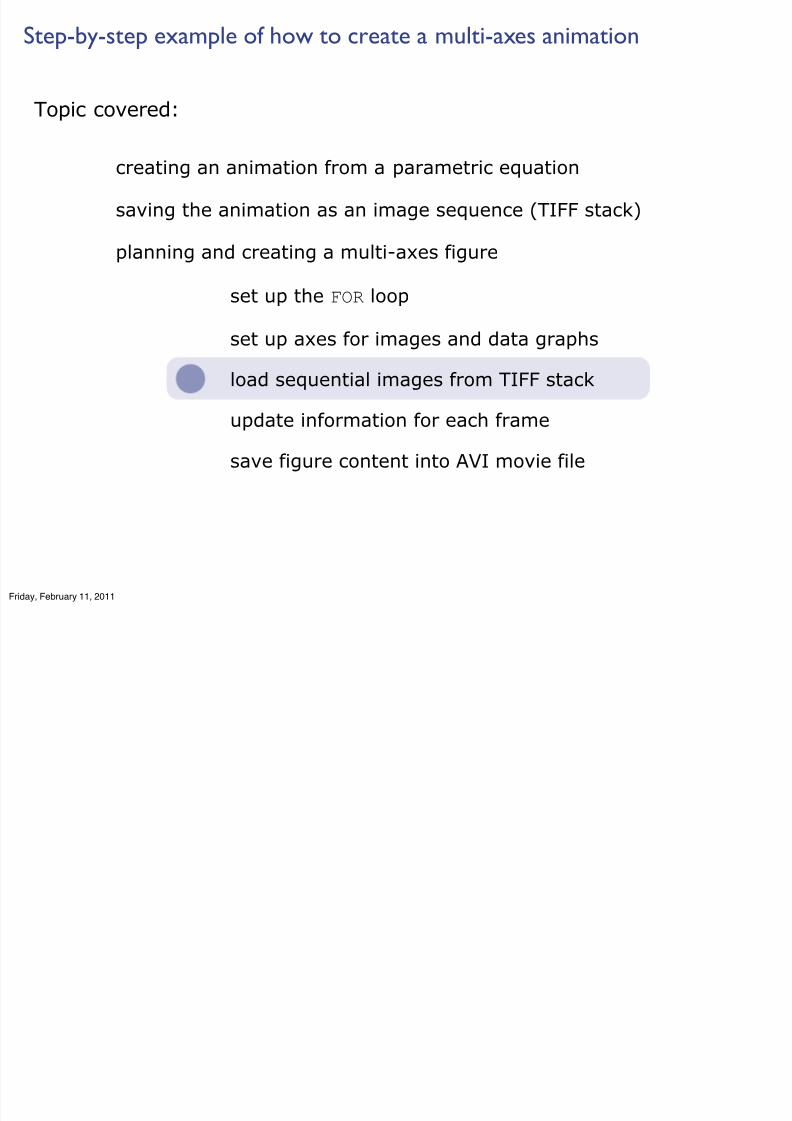
Step-by-step example of how to create a multi-axes animation
Topic covered:
creating an animation from a parametric equation
saving the animation as an image sequence (TIFF stack)
planning and creating a multi-axes figure
load sequential images from TIFF stack
draw axes for images and data graphs
update information for each frame
set up the FOR loop
save figure content into AVI movie file
Friday, February 11, 2011

7/27/2019 Animaciones Con Matlab
http://slidepdf.com/reader/full/animaciones-con-matlab 21/28
Set up axes for images and data graphs
As mentioned, I like to set up position and color variable at the onset
handle_ax = axes;
set(handle_ax, 'Units', 'pixels', 'Position', handle_ax_pos);
p1h(1)=plot(xpos,ypos, '-.');set(p1h(1), 'Color', light_grey, 'LineWidth', 2);
hold on;
p1h(2) = plot(.....
set(p1h(2), 'Color', light_red, 'LineWidth', 1);
hold off;
axes() command uses position information to place axes accordingly
graphics handles allow fine-grained control over each element
Friday, February 11, 2011
7/27/2019 Animaciones Con Matlab
http://slidepdf.com/reader/full/animaciones-con-matlab 22/28
Step-by-step example of how to create a multi-axes animation
Topic covered:
creating an animation from a parametric equation
saving the animation as an image sequence (TIFF stack)
planning and creating a multi-axes figure
load sequential images from TIFF stack
set up axes for images and data graphs
update information for each frame
set up the FOR loop
save figure content into AVI movie file
Friday, February 11, 2011
7/27/2019 Animaciones Con Matlab
http://slidepdf.com/reader/full/animaciones-con-matlab 23/28
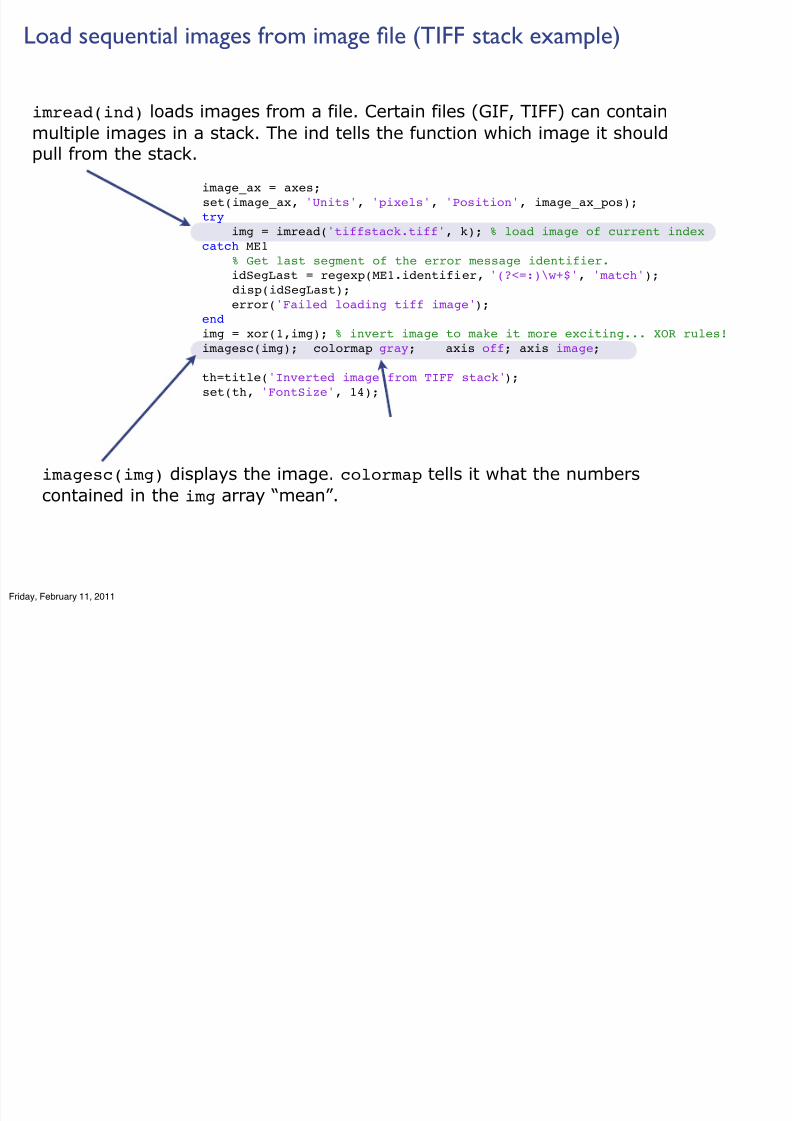
Load sequential images from image file (TIFF stack example)
imread(ind) loads images from a file. Certain files (GIF, TIFF) can contain
multiple images in a stack. The ind tells the function which image it shouldpull from the stack.
imagesc(img) displays the image. colormap tells it what the numbers
contained in the img array “mean”.
image_ax = axes;
set(image_ax, 'Units', 'pixels', 'Position', image_ax_pos);
try
img = imread('tiffstack.tiff', k); % load image of current index
catch ME1
% Get last segment of the error message identifier.
idSegLast = regexp(ME1.identifier, '(?<=:)\w+$', 'match');disp(idSegLast);
error('Failed loading tiff image');
end
img = xor(1,img); % invert image to make it more exciting... XOR rules!
imagesc(img); colormap gray; axis off; axis image;
th=title('Inverted image from TIFF stack');
set(th, 'FontSize', 14);
Friday, February 11, 2011

7/27/2019 Animaciones Con Matlab
http://slidepdf.com/reader/full/animaciones-con-matlab 24/28
Step-by-step example of how to create a multi-axes animation
Topic covered:
creating an animation from a parametric equation
saving the animation as an image sequence (TIFF stack)
planning and creating a multi-axes figure
load sequential images from TIFF stack
set up axes for images and data graphs
update information for each frame
set up the FOR loop
save figure content into AVI movie file
long and tedious code, see code listing
Friday, February 11, 2011

7/27/2019 Animaciones Con Matlab
http://slidepdf.com/reader/full/animaciones-con-matlab 25/28
Step-by-step example of how to create a multi-axes animation
Topic covered:
creating an animation from a parametric equation
saving the animation as an image sequence (TIFF stack)
planning and creating a multi-axes figure
load sequential images from TIFF stack
set up axes for images and data graphs
update information for each frame
set up the FOR loop
save figure content into AVI movie file
Friday, February 11, 2011
7/27/2019 Animaciones Con Matlab
http://slidepdf.com/reader/full/animaciones-con-matlab 26/28
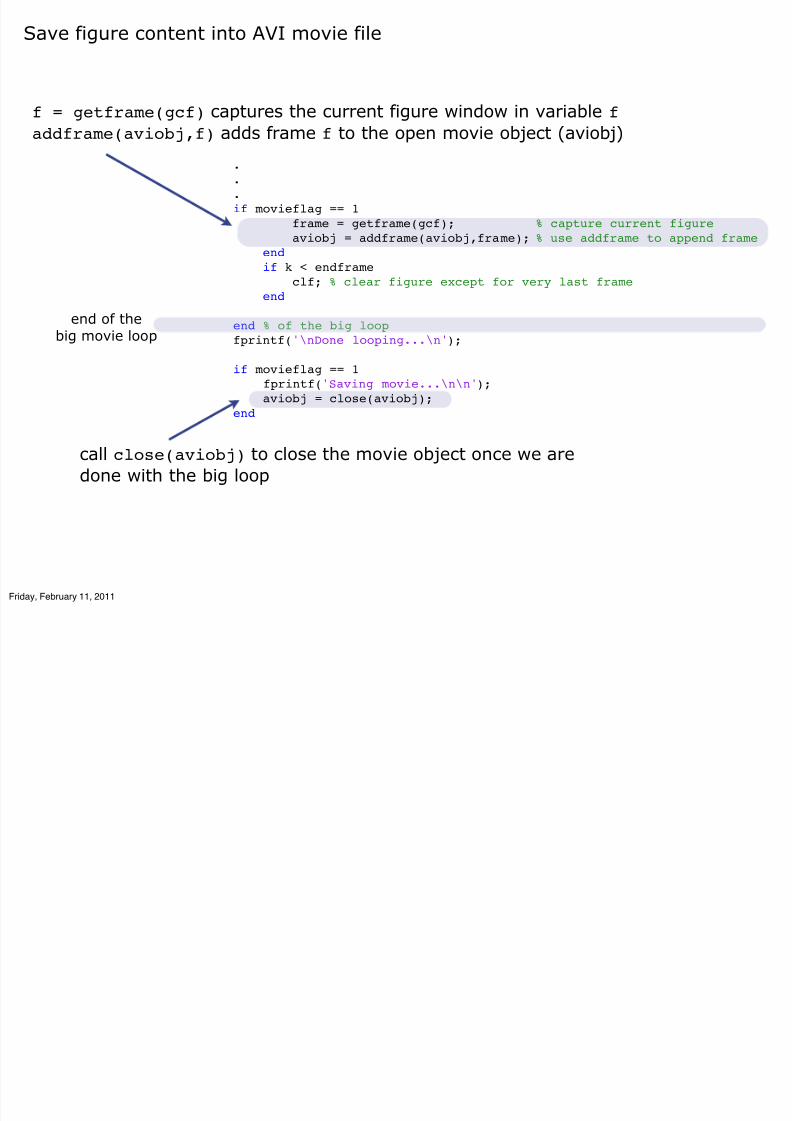
Save figure content into AVI movie file
f = getframe(gcf) captures the current figure window in variable f
addframe(aviobj,f) adds frame f to the open movie object (aviobj).
.
.
if movieflag == 1
frame = getframe(gcf); % capture current figure
aviobj = addframe(aviobj,frame); % use addframe to append frame
end
if k < endframe
clf; % clear figure except for very last frame end
end % of the big loop
fprintf('\nDone looping...\n');
if movieflag == 1
fprintf('Saving movie...\n\n');
aviobj = close(aviobj);
end
call close(aviobj) to close the movie object once we are
done with the big loop
end of the
big movie loop
Friday, February 11, 2011
7/27/2019 Animaciones Con Matlab
http://slidepdf.com/reader/full/animaciones-con-matlab 27/28
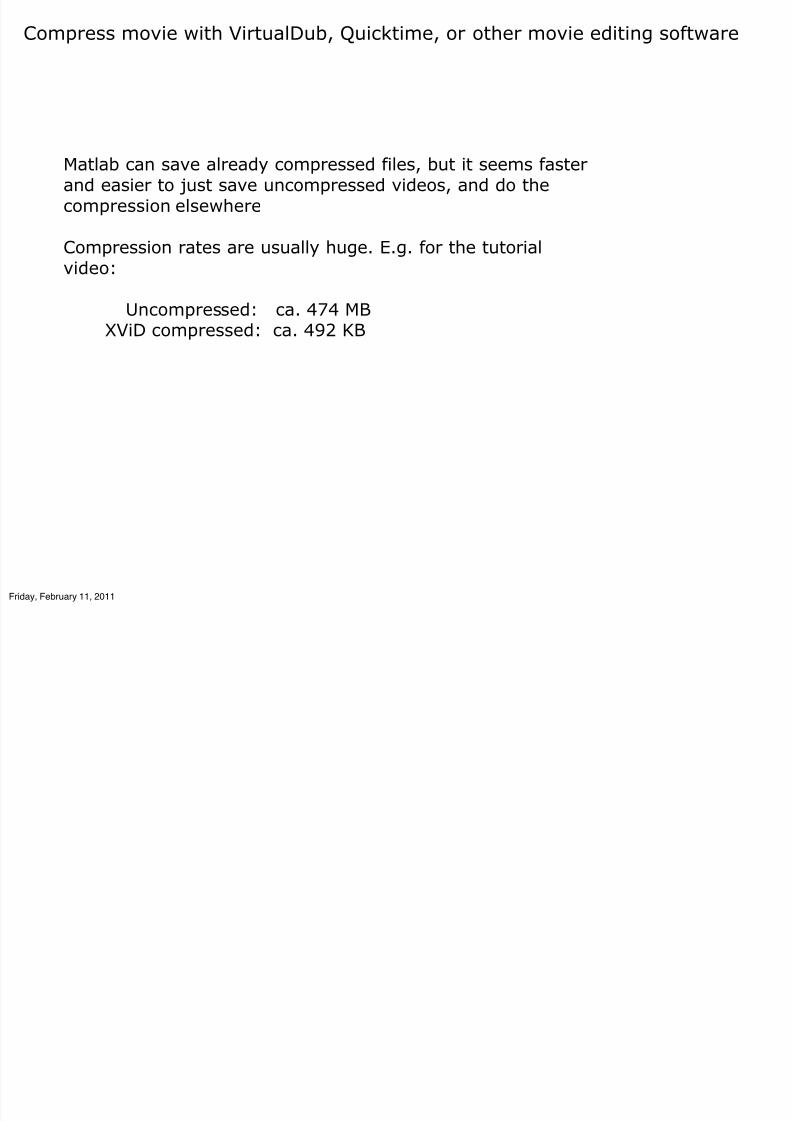
Compress movie with VirtualDub, Quicktime, or other movie editing software
Matlab can save already compressed files, but it seems faster
and easier to just save uncompressed videos, and do the
compression elsewhere
Compression rates are usually huge. E.g. for the tutorial
video:
Uncompressed: ca. 474 MBXViD compressed: ca. 492 KB
Friday, February 11, 2011

7/27/2019 Animaciones Con Matlab
http://slidepdf.com/reader/full/animaciones-con-matlab 28/28
Top Related