


Idiomas
Páginas
Jurídico


Efectos del enriquecimiento ambiental en el desarrollo del SNC
Una aproximación a estrategias neuroprotectoras y neurorescatadoras
Laboratorio de Neurociencia Clínica y Experimental (LaNCE)Euskal Herriko Unibertsitatea
http://www.ehu.es/ehusfera/lance
viernes 12 de noviembre de 2010

Efectos del enriquecimiento ambiental en el desarrollo del SNC
Una aproximación a estrategias neuroprotectoras y neurorescatadoras
Laboratorio de Neurociencia Clínica y Experimental (LaNCE)Euskal Herriko Unibertsitatea
http://www.ehu.es/ehusfera/lance
Enrike G. Argandoña
viernes 12 de noviembre de 2010

Desarrollo cortical
Predeterminado genéticamente
Mediado por experiencia
viernes 12 de noviembre de 2010
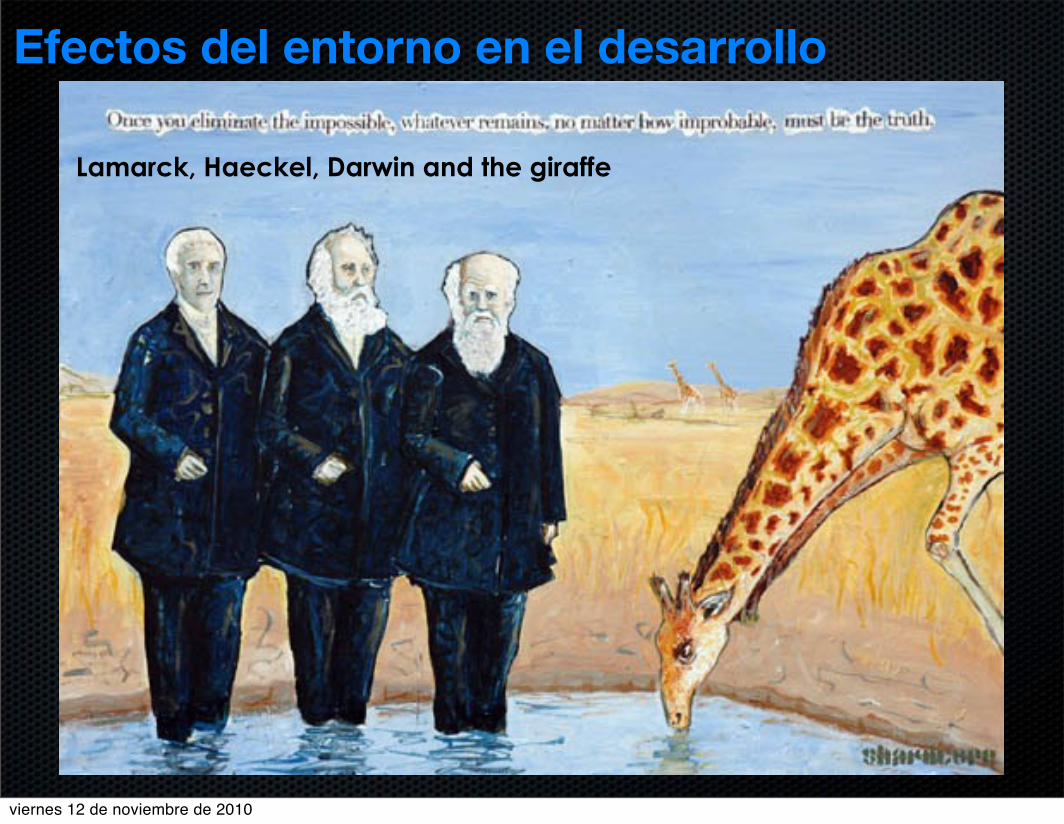
Efectos del entorno en el desarrollo
Lamarck, Haeckel, Darwin and the giraffe
viernes 12 de noviembre de 2010

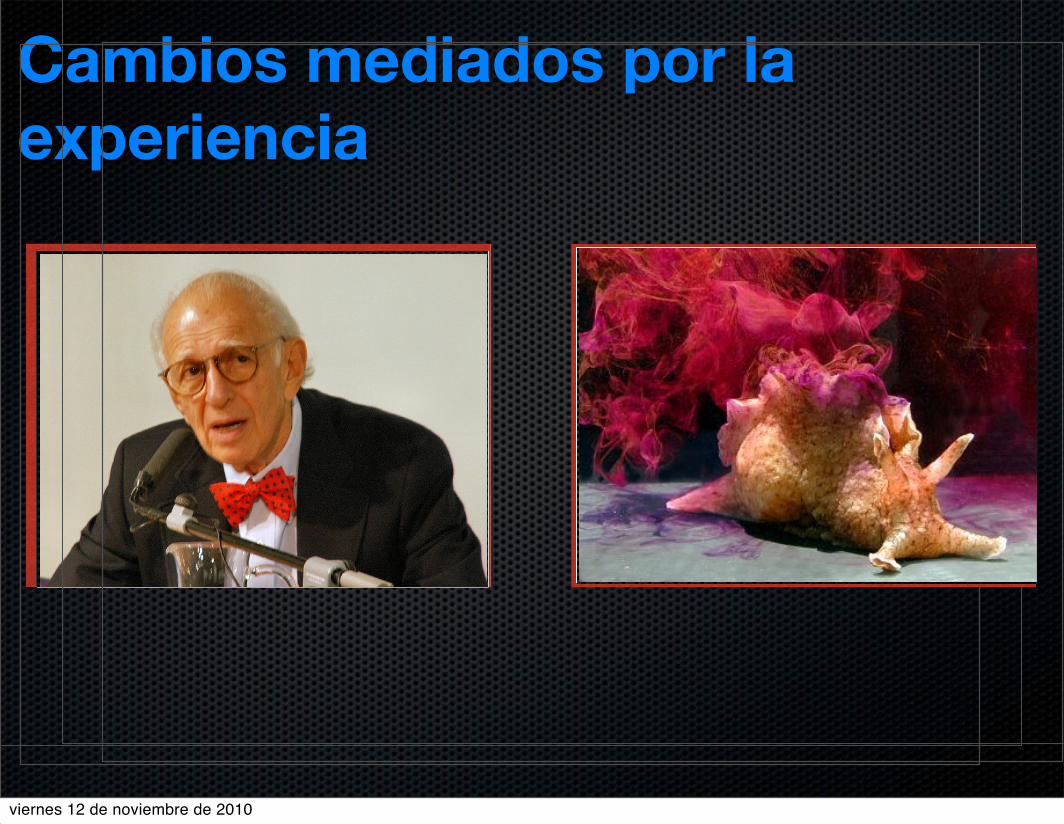
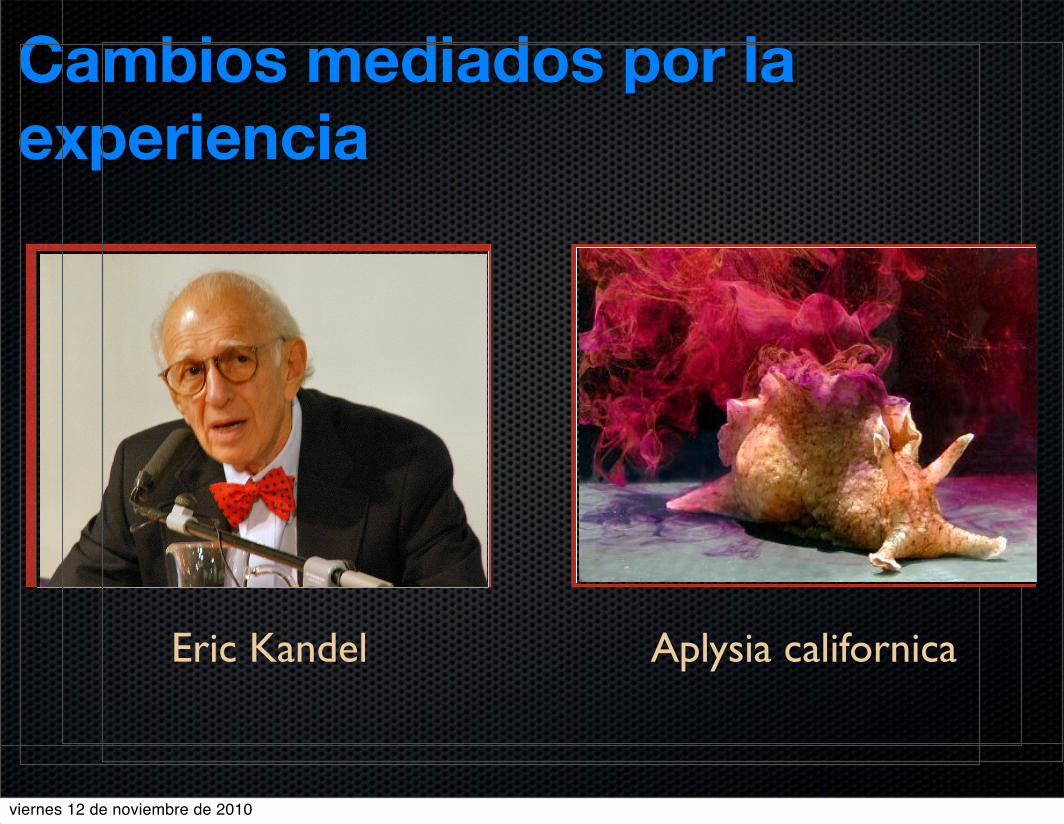
Cambios mediados por la experiencia
Ramon y Cajal Sherrington
viernes 12 de noviembre de 2010

Cambios mediados por la experiencia
viernes 12 de noviembre de 2010

Cambios mediados por la experiencia
APRENDIZAJE SIMPLEAprendizaje simple
Eric Kandel Aplysia californica
martes 16 de junio de 2009
Aprendizaje simple
Eric Kandel Aplysia californica
martes 16 de junio de 2009
Eric Kandel Aplysia californica
jueves 18 de junio de 2009
viernes 12 de noviembre de 2010
Cambios mediados por la experiencia
APRENDIZAJE SIMPLEAprendizaje simple
Eric Kandel Aplysia californica
martes 16 de junio de 2009
Aprendizaje simple
Eric Kandel Aplysia californica
martes 16 de junio de 2009
Eric Kandel Aplysia californica
jueves 18 de junio de 2009
APRENDIZAJE SIMPLEAprendizaje simple
Eric Kandel Aplysia californica
martes 16 de junio de 2009
Aprendizaje simple
Eric Kandel Aplysia californica
martes 16 de junio de 2009
Eric Kandel Aplysia californica
jueves 18 de junio de 2009
viernes 12 de noviembre de 2010

Cambios mediados por la experiencia
APRENDIZAJE SIMPLEAprendizaje simple
Eric Kandel Aplysia californica
martes 16 de junio de 2009
Aprendizaje simple
Eric Kandel Aplysia californica
martes 16 de junio de 2009
Eric Kandel Aplysia californica
jueves 18 de junio de 2009
APRENDIZAJE SIMPLEAprendizaje simple
Eric Kandel Aplysia californica
martes 16 de junio de 2009
Aprendizaje simple
Eric Kandel Aplysia californica
martes 16 de junio de 2009
Eric Kandel Aplysia californica
jueves 18 de junio de 2009
Eric Kandel
viernes 12 de noviembre de 2010
Cambios mediados por la experiencia
APRENDIZAJE SIMPLEAprendizaje simple
Eric Kandel Aplysia californica
martes 16 de junio de 2009
Aprendizaje simple
Eric Kandel Aplysia californica
martes 16 de junio de 2009
Eric Kandel Aplysia californica
jueves 18 de junio de 2009
APRENDIZAJE SIMPLEAprendizaje simple
Eric Kandel Aplysia californica
martes 16 de junio de 2009
Aprendizaje simple
Eric Kandel Aplysia californica
martes 16 de junio de 2009
Eric Kandel Aplysia californica
jueves 18 de junio de 2009
Eric Kandel Aplysia californica
viernes 12 de noviembre de 2010

Plasticidad sinápticaTEMA IVMECANISMOS SINÁPTICOS DE PLASTICIDAD
Previo a la experiencia, se forman las vías mediante:
Axones alcanzan la estación relay
Axones alcanzan capa IV cortical
Se forman conexiones aleatorias
Posteriormente se produce el desarrollo influido por la experiencia
Muerte celular programada (neurotrofinas)
Cambios en capacidad sináptica
martes 16 de junio de 2009viernes 12 de noviembre de 2010

Plasticidad sinápticaTEMA IVMECANISMOS SINÁPTICOS DE PLASTICIDAD
Cambios en capacidad sináptica
Reducción 50%
Reasignación sináptica
Convergencia sináptica
Competencia sináptica
Influencias modulatorias
martes 16 de junio de 2009viernes 12 de noviembre de 2010

TEMA IV MECANISMOS SINÁPTICOS DE PLASTICIDAD
Cambios en capacidad sináptica
Reducción 50%
Reasignación sináptica
Convergencia sináptica
Competencia sináptica
Influencias modulatorias
Locus ceruleus (NA)
Nucleos basales (ACh)
martes 16 de junio de 2009
viernes 12 de noviembre de 2010

TEMA IVMECANISMOS SINÁPTICOS DE
PLASTICIDAD
La plasticidad sináptica es un fenómeno excitatorio (Glutamato)
NMDA (bloqueado por Mg++ y ligado a canal Ca++)
AMPA Na+
martes 16 de junio de 2009viernes 12 de noviembre de 2010

Cambios mediados por la experiencia
Incremento sinapsis/neurona
Incremento actividad neuronal
Incremento demanda metabólica
Modificaciones arquitectura vascular
viernes 12 de noviembre de 2010

Age
Exp
erie
nce
med
iate
d c
hang
es
4. week
1., 2. and 3. weeks 4., 5. and 6. weeks 7. and 8. weeks
Precritical period Critical period Postcritical period
Periodo crítico
viernes 12 de noviembre de 2010
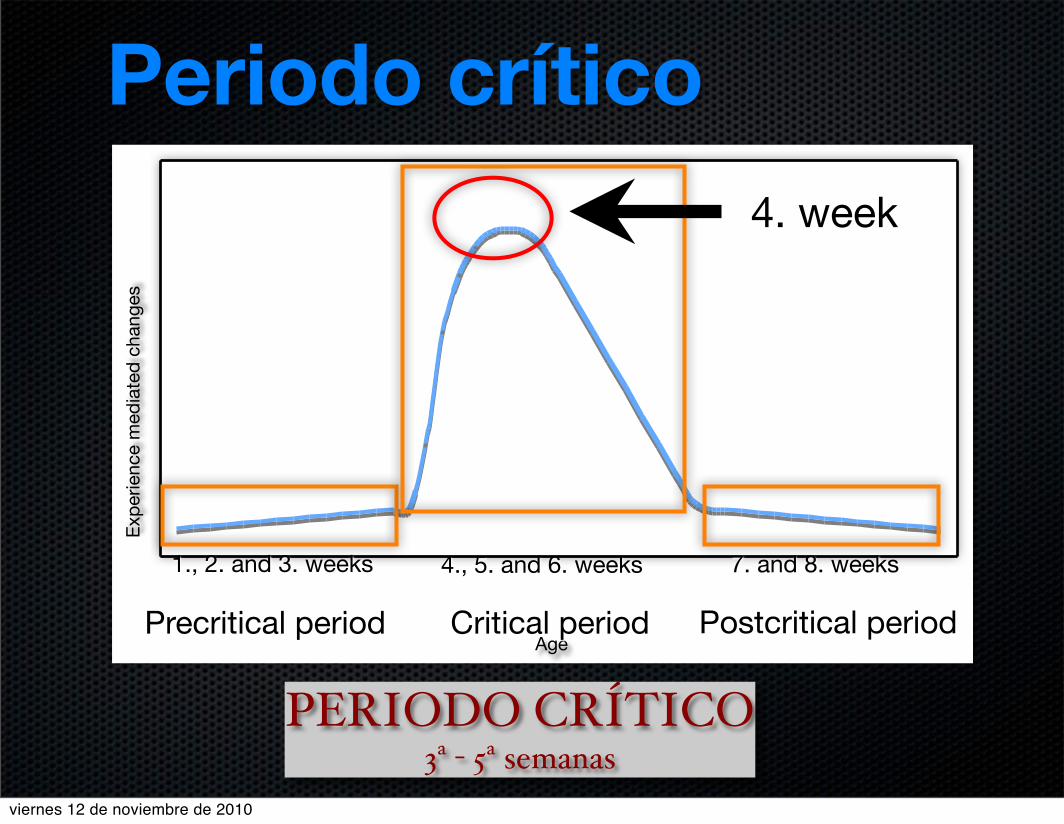
PERIODO CRÍTICO3ª - 5ª semanas
Age
Exp
erie
nce
med
iate
d c
hang
es
4. week
1., 2. and 3. weeks 4., 5. and 6. weeks 7. and 8. weeks
Precritical period Critical period Postcritical period
Periodo crítico
viernes 12 de noviembre de 2010

Periodo crítico
viernes 12 de noviembre de 2010

Sistema visualEstudio efectos de la experiencia
viernes 12 de noviembre de 2010

Estudio efectos de la experiencia
Modificaciones sobre las condiciones standard
* Enriquecimiento ambiental
* Empobrecimiento ambiental
viernes 12 de noviembre de 2010

Privación visual
Métodos invasivos
Inyección TTX
Sutura párpados
Enucleación mono o bilateral
Extirpación retina
viernes 12 de noviembre de 2010
Privación visual
Métodos no invasivos
Cría en oscuridad
Implantación lentillas opacas
viernes 12 de noviembre de 2010

Descenso densidad celular
Retraso maduración
Anulación cierre periodo crítico
Privación visual
viernes 12 de noviembre de 2010

Cortical parameters
viernes 12 de noviembre de 2010

Cortical parameters
viernes 12 de noviembre de 2010

Cortical parameters
viernes 12 de noviembre de 2010

Vascular density
viernes 12 de noviembre de 2010

Vascular density
viernes 12 de noviembre de 2010
48 E.G. ArgandoZa, J.V, Lafaente/Brain Research 732 (1996) 43-51
3.1. Cortical thickness
3.1.1. Control rats
The thickness of the cortex increased from birth up to
14 dpn when it reached a maximum in control rats; after
14 dpn, this parameter decreased slightly.
Cortical thickness in control rats increased from 300
p,m at birth to 500 pm at 7 dpn, or 70% with very high
statistical significance. The second postnatal week, from 7
to 14 dpn, an increase of 587 pm, or 18’ZO,was registered,
but the difference was not statistically significant. At the
third week there was a slight decrease (3%), from 587 to
568 p,m with no significance. Cortical thickness at 60 dpn
was similar to that of 14 dpn, increasing 3Y0from 21 dpn
to reach 587 pm, but without statistical significance (see
Tables 1 and 2).
3.1.2. Dark-reared rats
This behavior was similar in dark-reared rats, but there
was a quantitative difference at each age, with dark-reared
rats scoring lower at all the considered ages, except at 14
dpn.
From birth to 7 dpn there was a statistically significant
50% increase in cortical thickness in dark-reared rats, from
300 to 443 pm. From 7 to 14 dpn the increase was 56Y0,
from 443 to 691 pm, and was highly significant. From 14
to 21 dpn there was a drop from 691 to 525 (25%), which
was very significant. From 21 dpn to 60 dpn there was an
increase of 3%, similar to the one in controls, which was
not significant and reached 543 pm (see Tables 1 and 2).
At 7 dpn cortical thickness was 12% higher in controls,
at 14 dpn it was 1870higher in dark-reared rats, at 21 dpn
it was 13Y0higher in controls and at 60 dpn it was 870
lower in dark-reared rats. The difference was statistically
significant at all ages except at 14 dpn, being very high at
21 and 60 dpn (see Table 1 and Fig. 4).
3.2. Vascular densi~
3.2.1. Controls
The density of vessels increased massively up to 21 dpn
in controls; at this age it reached the maximum level with
a very weak increase from 21 to 60 dpn.
Vascular density increased 12% at the first week, from
44 to 50 vessels per 40000 kmz. From 7 to 14 dpn there
was almost a 50Y0increase, from 50 to 73 vessels. At 21
dpn vascular density increased 54%, from 73 to 112
vessels. At 60 dpn vascular density was similar to that at
21 dpn (113 vessels) with an imperceptible increase. The
increases from 7 to 14 dpn and from 14 to 21 dpn were
highly significant (see Tables 1 and 2).
3.2.2. Dark-reared rats
The changes in this parameter throughout postnatal
development were similar to the changes in controls, but
there were quantitative differences between the two situa-
tions. Vascular density was higher in controls at all ages
p = o , 0 4 p=o,l p=o,oo2 p=o,ol
0 dpn 7 dpn 14 dpn 21 dpn 60 dpn
Fg.
; ’401 p=o,9 p=o,5 p=o,19 p=o,oo12
1204 T-r T
100
80
160
40
200 0 dpn 7 dpn 14 dpn 21 dpn 60 dpn‘c
~
; 30
z I T T p=o,13 P=0,16 p = o . o o l p = o , o o l
Odpn 7 dpn 14 dpn 21 dpn 60 dpn
! Darkreared
! Controls
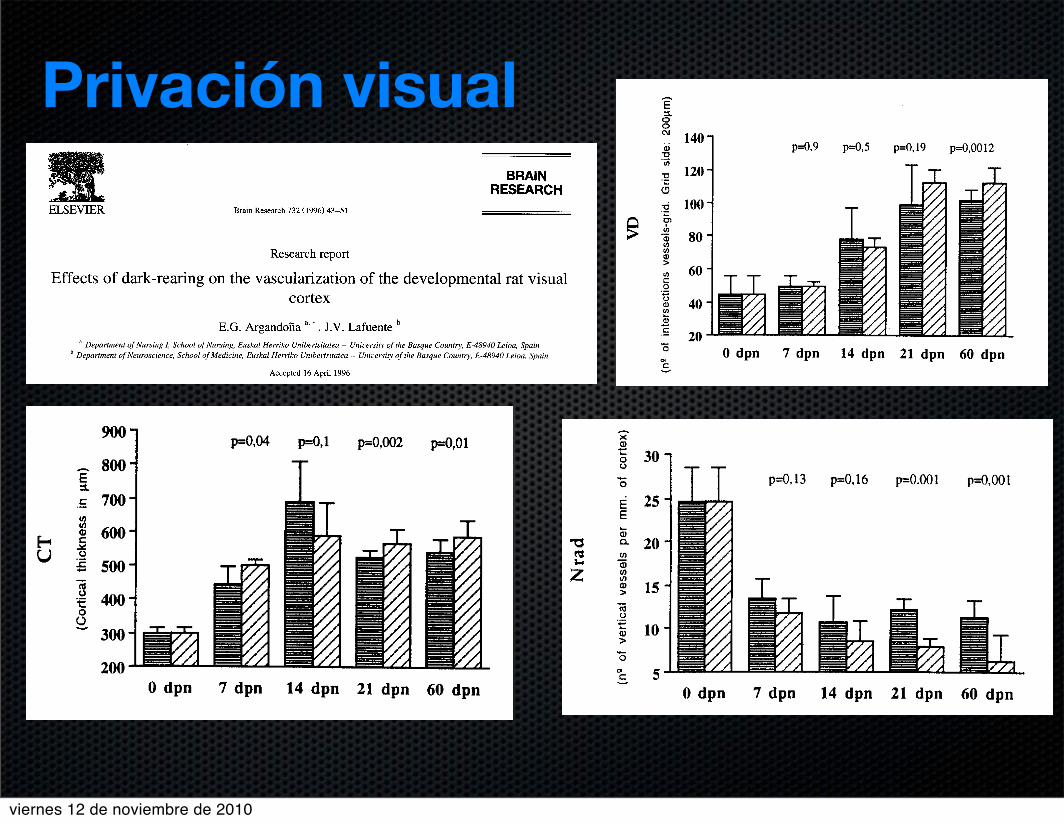
Fig. 4. Comparison of average measurements between dark-reared and
control groups at each of the ages considered. Horizontal axes show the
age of the animals, Vertical axes show: CT, cortical thickness in pm;
VD, number of intersections between vessels and the overlying grid per
40000 pmz of visual cortex. Nrad, number of vertically oriented intra-
cortical vascular trunks per mm of cortex.
with the exception of 14 dpn, when it was slightly higher
in dark-reared rats.
At the O to 7 dpn period vascular density increased
11%, from 44 to 49 vessels per measured surface. From 7
to 14 dpn there was a 60Y0increase from 49 to 80 vessels.
At 21 dpn the increase in vascular density slowed to 27%,
from 80 to 100 vessels reaching almost the maximum
48 E.G. ArgandoZa, J.V, Lafaente/Brain Research 732 (1996) 43-51
3.1. Cortical thickness
3.1.1. Control rats
The thickness of the cortex increased from birth up to
14 dpn when it reached a maximum in control rats; after
14 dpn, this parameter decreased slightly.
Cortical thickness in control rats increased from 300
p,m at birth to 500 pm at 7 dpn, or 70% with very high
statistical significance. The second postnatal week, from 7
to 14 dpn, an increase of 587 pm, or 18’ZO,was registered,
but the difference was not statistically significant. At the
third week there was a slight decrease (3%), from 587 to
568 p,m with no significance. Cortical thickness at 60 dpn
was similar to that of 14 dpn, increasing 3Y0from 21 dpn
to reach 587 pm, but without statistical significance (see
Tables 1 and 2).
3.1.2. Dark-reared rats
This behavior was similar in dark-reared rats, but there
was a quantitative difference at each age, with dark-reared
rats scoring lower at all the considered ages, except at 14
dpn.
From birth to 7 dpn there was a statistically significant
50% increase in cortical thickness in dark-reared rats, from
300 to 443 pm. From 7 to 14 dpn the increase was 56Y0,
from 443 to 691 pm, and was highly significant. From 14
to 21 dpn there was a drop from 691 to 525 (25%), which
was very significant. From 21 dpn to 60 dpn there was an
increase of 3%, similar to the one in controls, which was
not significant and reached 543 pm (see Tables 1 and 2).
At 7 dpn cortical thickness was 12% higher in controls,
at 14 dpn it was 1870higher in dark-reared rats, at 21 dpn
it was 13Y0higher in controls and at 60 dpn it was 870
lower in dark-reared rats. The difference was statistically
significant at all ages except at 14 dpn, being very high at
21 and 60 dpn (see Table 1 and Fig. 4).
3.2. Vascular densi~
3.2.1. Controls
The density of vessels increased massively up to 21 dpn
in controls; at this age it reached the maximum level with
a very weak increase from 21 to 60 dpn.
Vascular density increased 12% at the first week, from
44 to 50 vessels per 40000 kmz. From 7 to 14 dpn there
was almost a 50Y0increase, from 50 to 73 vessels. At 21
dpn vascular density increased 54%, from 73 to 112
vessels. At 60 dpn vascular density was similar to that at
21 dpn (113 vessels) with an imperceptible increase. The
increases from 7 to 14 dpn and from 14 to 21 dpn were
highly significant (see Tables 1 and 2).
3.2.2. Dark-reared rats
The changes in this parameter throughout postnatal
development were similar to the changes in controls, but
there were quantitative differences between the two situa-
tions. Vascular density was higher in controls at all ages
p = o , 0 4 p=o,l p=o,oo2 p=o,ol
0 dpn 7 dpn 14 dpn 21 dpn 60 dpn
Fg.
; ’401 p=o,9 p=o,5 p=o,19 p=o,oo12
1204 T-r T
100
80
160
40
200 0 dpn 7 dpn 14 dpn 21 dpn 60 dpn‘c
~
; 30
z I T T p=o,13 P=0,16 p = o . o o l p = o , o o l
Odpn 7 dpn 14 dpn 21 dpn 60 dpn
! Darkreared
! Controls
Fig. 4. Comparison of average measurements between dark-reared and
control groups at each of the ages considered. Horizontal axes show the
age of the animals, Vertical axes show: CT, cortical thickness in pm;
VD, number of intersections between vessels and the overlying grid per
40000 pmz of visual cortex. Nrad, number of vertically oriented intra-
cortical vascular trunks per mm of cortex.
with the exception of 14 dpn, when it was slightly higher
in dark-reared rats.
At the O to 7 dpn period vascular density increased
11%, from 44 to 49 vessels per measured surface. From 7
to 14 dpn there was a 60Y0increase from 49 to 80 vessels.
At 21 dpn the increase in vascular density slowed to 27%,
from 80 to 100 vessels reaching almost the maximum
BRAIN
RESEARCH
ELSEVIER Brain Research 732 (1996) 43-51
Research report
Effects of dark-rearing on the vascularization of the developmental rat visual
cortex
E.G. Argandoiia a’*,J.V. Lafuente b
aDepartment of Nursing I, School of Nursing, Euskal Herriko Unibertsitatea – University of the Basque Country, E-48940 Leioa, Spain
b Department of Neuroscience, School of Medicine, Euskal Herriko Unibertsitatea – University of the Basque Country, E-48940 Leioa, Spain
Accepted 16 April 1996
Abstract
Cerebral vascular density corresponds to metabolic demand, which increases in highly active areas. External inputs play an important
role in the modeling and development of the visual cortex. Experience-mediated development is very active during the first postnatal
month, when accurate simultaneous blood supply is needed to satisfy increased demand. We studied the development of visuaf cortex
vascularization in relation to experience, comparing rats raised in darkness with rats raised in standard conditions. The parameters
measured were cortical thickness, vascular density and number of perpendicular vessels, constituting the first stage of cortical vascular
development. Vessels were stained using butyryl cholinesterase histochemis~, which labels some neurons and microvascularization
(vesselsfrom5 to 50 km). Animalsfromboth groupswere sampledat O,7, 14, 21 and 60 days postnatal. Vascularization of the brainstarts with vertically oriented intracortical vascular trunks whose density decreases notably after birth in rats reared in standard laboratory
conditions. The most striking finding of our work is the significantly lower decrease in the number of these vessels in dark-reared rats.
Our results also show that cortex thickness and vessel density are significantly lower in dark-reared rats. These results suggest that the
absence of visual stimuli retards the maturation of the visuaf cortex including its vascular bed.
Keywords: Striate cortex; Microvascularization; Development; Butyryl cholinesterase; Histochemistry
1. Introduction
The density of the vascular network corresponds to the
metabolic demand in different brain territories, with the
demand increasing in areas with higher synaptic activity.
Thus vascular density, and especially microvascular den-
sity, becomes higher in these areas [6,7,23,34].
After birth, the neonate is exposed to external stimuli
which modulate cortical development, inducing changes
such as the increase of the dendritic tree, the rise of the
ratio of synapses per neuron and the subsequent increase
of the vascular network. All these changes involve the
thickening of the cortex [14,34,35], Most of the cortical
changes induced by experience occur in what is known as
the critical period [16], which takes place around the 3rd
‘ Corresponding author. Department of Neuroscience, University of the
Basque Country, Apartado 699, E-48080 Bilbao, Spain. Fax: +34 (4)
464-9511; E-mail: [email protected]
postnatal week [1,24,30]. In this period, the higher
metabolic demand due to neuronal plasticity mechanisms
gives art extremely important role to adaptive vascular
changes [34]. That is, the external environment induces
vascular changes by an indirect mechanism: cortical devel-
opment brought about by experience induces vascular plas-
ticity to support the increased metabolism. Under standard
rearing conditions blood vessels are essentially completely
developed by the critical period [30].
Although this kind of change takes place all over the
CNS, most studies of the effects of external inputs have
been performed on the striate cortex. The visual system
has a well-defined hierarchical organization which facili-
tates the study of its structures through the interruption of
pathways at different stages or the deprivation of inputs
using either invasive techniques – tetrodotoxin injection
[29]; surgery, such as eyelid suturing [16,17], bilateral or
unilateral enucleation [3], retina removal [12] – or non-in-
vasive ones, such as dark-rearing [8,10,11], or the use of
opaque contact lenses [24]. While all these methods de-
0006-8993/96/$15.00 Copyright 01996 Elsevier Science B.V. All rights reserved.
PII S0006- 8993(96)00485 -4
Privación visual
viernes 12 de noviembre de 2010

Privación visual
� .Brain Research 855 2000 137–142
www.elsevier.comrlocaterbres
Research report
Influence of visual experience deprivation on the postnatal development of
the microvascular bed in layer IV of the rat visual cortex
Enrike G. Argandona a,) , Jose V. Lafuente b˜aDepartment of Nursing I, School of Nursing, Euskal Herriko UnibertsitatearUniÕersity of the Basque Country, Leioa, E-48940, Spain
bDepartment of Neuroscience, School of Medicine, Euskal Herriko UnibertsitatearUniÕersity of the Basque Country, Leioa, E-48940, Spain
Accepted 16 November 1999
Abstract
Cerebral vascular density is correlated with metabolic demands, which increase in highly active brain areas. External inputs are an
essential requirement in the modeling of the visual cortex. Experience-mediated development is very active during the first postnatal
month, when congruous blood supply is needed. We studied the development of visual cortex vascularization in relation to experience,
comparing rats raised in darkness with rats reared in normal conditions. Vascular density, vascular area and their ratio vs. neuronal
density were calculated. Conventionally stained semi-thin sections were used to measure the vascular area by computer assisted� .morphometry. Animals from both groups were sampled at 14, 21, and 60 days postnatal dpn . We found a significantly lower density of
vessels and neurons as well as a smaller vascular area in dark-reared adult rats while no differences were founded at the other ages. Our
results also show no differences between the ratio of vesselsrneuron, and vascular arearneuron, between both groups. The absence ofvisual experience causes decrease of cortical activity which correlates with lower vessels density and vascular area, without their
ratiorneuron being affected. q 2000 Elsevier Science B.V. All rights reserved.
Keywords: Dark-rearing; Microvascularization; Blood vessel; Striatal cortex; Computer assisted morphometry; Synaptic activity
1. Introduction
There is a close relationship between metabolic activityw xand vascular network in cerebral cortex 3,9,24 . The
metabolic demand, which increases in areas with higher
synaptic activity is matched by the density of blood vesselsw xin these areas 5,6,16,21 . As we have previously reported,
development of vascularization parallels cortical develop-
ment. Our results showed a decrease in vascular density
and a delay in the maturation of the microvascular patternw xin dark-reared rats 1 .
Some authors have studied the effects of visual experi-
ence on the relationship between neuronal density andw xvascularization 7,21 . When animals are reared under
complex visual experience, there is an increase in the
vascular supply, morphologically detectable as increase in
blood vessels diameter, branching of vessels and increase
in vascular area. There are, however, only a few studies onw xanimals under visual deprivation 1,24 .
)Corresponding author. Fax: q34-94-4649-511; e-mail:
Changes in vascular density are related to the different
stages of development. Most of the changes induced by
experience occur during a defined time-window of postna-
tal life called critical period. In this period, there is reorga-
nization of the cortex correlated with experience, whenw xnon-functioning neurons disappear 12,25 . Studies of neu-
ronal density in animals reared in darkness have found a
relative increase due to a decrease in the neuropil; how-
ever, putative changes in neuronal population have notw xbeen addressed 2,10,23 .
Quantification of neurons and vessels has been
performed exclusively on cortical layer IV, where experi-
ence-induced changes occur as this layer is the terminationw xsite of visual afferents coming from the thalamus 2,18,26 .
In this layer, neurons are smaller and more crowded and
there is a higher density of neuronal somata compared to
the other layers. It can thus be inferred that experience-in-
duced changes in neuronal density should be maximal in
layer IV.
We have studied the relationship between visual experi-
ence and vascularization by measuring vascular density
and vascular area in developing normal, and dark-reared
rats. The purpose was to correlate vascular changes with
0006-8993r00r$ - see front matter q 2000 Elsevier Science B.V. All rights reserved.� .PII: S0006-8993 99 02361-6
( )E.G. Argandona, J.V. LafuenterBrain Research 855 2000 137–142˜ 139
Table 1
Increases and decreases in the measured parameters during the periods
!studied for both dark-reared and control groups percentage of
.increaserdecrease and statistical significance, p value! . ! . ! .Age period dpn Darkness % p Controls % p
Increase of Õascular density14–21 51 -0.001 36.4 0.07
21–60 y21.1 -0.001 20 0.001
Increase of neuronal density
14–21 y9.9 0.02 14.3 0.29
21–60 y21.9 -0.001 y13 -0.001
Increase of Õascular area14–21 y20.6 0.3 28.7 0.2
21–60 25.9 0.01 10.7 0.2
Increase of number of Õessels per neuron14–21 66.7 -0.001 0 0.4
21–60 0 0.9 66.7 -0.001
Decrease of Õascular area per neuron14–21 y27.8 0.08 37.7 0.04
21–60 4.3 0.6 y2.6 0.67
Decrease of aÕerage Õascular area14–21 23.7 0.03 45.8 0.05
21–60 2.1 0.8 26.6 0.03
60 days, there was an increase of 20% which was not
statistically significant.
In dark-reared rats, the number of vessels increased by
51% between 14 and 21 dpn and decreased by 21% from
the 21 to 60 dpn period. Both variations were significant.
Comparing both groups, at 14 dpn, vascular density in
dark-reared rats was 7% higher and at 21 dpn it was 18%
higher. On the other hand, at 60 dpn, vascular density was
22% higher in controls. Differences were statistically sig-! .nificant at 21 and 60 dpn. Fig. 1 .
3.2. Neuronal density
The number of neurons per 2500 mm2 was similar in
all ages in normal rats, being maximal at 21 dpn. Between
14 and 21 dpn, neuronal density increased by 14% but
decreased between 21 and 60 dpn by 13%.
As it happened with the vascular density, the second
increase from 21 to 60 dpn was significant but not the
former from 14 to 21 dpn.
The changes in this parameter throughout postnatal
development in the dark-reared group were the opposite of
controls as there was a progressive decrease from 14 to 60
dpn. From 14 to 21 dpn, this parameter decreased by 10%,
from 16 to 15 neurons per 2500 mm2. The decrease was! .more noticeable from 21 to 60 dpn 22% , diminishing
from 15 to 11 neurons. Both differences were statistically
significant.
Comparison between both groups showed a lower neu-
ronal density in dark-reared rats, with the exception of 14
Fig. 1. Comparison of average measurements between dark-reared and
control groups at each of the ages considered. Horizontal axes show the
age of the animals. Vertical axes show: Vd, number of vessels per 2500
mm2 of visual cortex; Nd, number of neurons per 2500 mm2 of visual
cortex; Vs, area occupied by vessels per 2500 mm2 of visual cortex.
! ! !
viernes 12 de noviembre de 2010

Privación visualDevelopmental Brain Research 141 (2003) 63–69
www.elsevier.com/ locate /devbrainres
Research report
V isual deprivation effects on the s100b positive astrocytic populationin the developing rat visual cortex: a quantitative study
a , b c*˜Enrike G. Argandona , Marco L. Rossi , Jose V. LafuenteaDepartment of Nursing I, School of Nursing, Euskal Herriko Unibertsitatea /University of the Basque Country, Leioako Campusa, Leioa E-48940,
SpainbDepartment of Neuropathology, Walton Centre for Neurology and Neurosurgery, Liverpool L9 7LJ, UK
cDepartment of Neuroscience, School of Medicine, Euskal Herriko Unibertsitatea /University of the Basque Country, Leioa, E-48940 Spain
Accepted 11 December 2002
Abstract
After birth, exposure to visual inputs modulates cortical development, inducing numerous changes of all components of the visual
cortex. Most of the cortical changes thus induced occur during what is called the critical period. Astrocytes play an important role in the
development, maintenance and plasticity of the cortex, as well as in the structure and function of the vascular network. Dark-reared
Sprague–Dawley rats and age-matched controls sampled at 14, 21, 28, 35, 42, 49, 56 and 63 days postnatal (dpn) were studied in order to
elucidate quantitative differences in the number of positive cells in the striate cortex. The astrocytic population was estimated by
immunohistochemistry for S-100b protein. The same quantification was also performed in a nonsensory area, the retrosplenial granular
cortex. S-100b positive cells had adult morphology in the visual cortex at 14 dpn and their numbers were not significantly different in
light-exposed and nonexposed rats up to 35 dpn, and were even higher in dark-reared rats at 21 dpn. However, significant quantitative
changes were recorded after the beginning of the critical period. The main finding of the present study was the significantly lower
astroglial density estimated in the visual cortex of dark-reared rats over 35 dpn as well as the lack of difference at previous ages. Our
results also showed that there were no differences when comparing the measurements from a nonsensory area between both groups. This
led us to postulate that the astrocytic population in the visual cortex is downregulated by the lack of visual experience.
! 2002 Elsevier Science B.V. All rights reserved.
Keywords: Dark-rearing; Immunohistochemistry; Astroglia; Retrosplenial cortex; RSG
1 . Introduction vascular density as well as a delay in the development of
the microvascular pattern [2,3].
Postnatal development of the visual cortex is modulated Astrocytes play an important role in the maintenance of
by experience. Extrinsic cues act as epigenetic factors in the structure and function of the endothelium of the
concert with intrinsic developmental programmes to shape cortex’s microvascular network, including the blood–brain
functional and structural cortical architecture [29]. Ex- barrier [8,20]. Astrocytes are also involved in the develop-
perience-mediated changes induce an increase in neuronal ment, plasticity and maintenance of the cerebral cortical
activity, which leads to increased metabolic demands architecture [10,23,24,27]. Therefore, a crucial role in
[6,40], involving the establishment of adaptive changes to coupling neuronal activity to energy metabolism has been
accomplish new requirements such as changes of the proposed [13]. Inversely, both neuronal activity and vas-
vascular network [5,7]. In previous works, we reported the culature influence glial development in a bidirectional
development of vascularisation of the visual cortex in manner [1,18,22,41].
normal and dark-reared rats showing a decrease in the During development, astrocytes guide cortical organisa-
tion by performing different functions, which are reflected
in morphological, electrophysiological and antigenic dif-
ferences [22]. The behaviour of the glia throughout the*Corresponding author. Tel.: 134-94-601-5595; fax: 134-94-464-
postnatal development of the cerebral cortex can be studied9511.
˜E-mail address: [email protected] (E.G. Argandona). using several antigenic markers. The most frequently used
0165-3806/02/$ – see front matter ! 2002 Elsevier Science B.V. All rights reserved.
doi:10.1016/S0165-3806(02)00643-0
˜E.G. Argandona et al. / Developmental Brain Research 141 (2003) 63–69 65
2formed in a smaller grid (10 000 mm placed exclusively density was higher in dark-reared animals in both visual
on layer IV). For both cases, three horizontally contiguous and retrosplenial cortexes. Furthermore, no differences
measurements were taken from each hemisphere, always were found in the retrosplenial cortex at any of the ages.
on the same layer. Similar results were obtained from areas exclusively
Astrocytes were recognised by their morphological placed on layer IV, with similar differences between both
characteristics, i.e. S100 positive cell bodies with short groups, with the same significance.
positive cytoplasmic processes, and by their nuclear mor- Immunoreactivity for the S-100b antibody had adult
phology. We did not count positive cells that did not fit the morphology at 14 dpn, with strongly stained cell bodies
morphology of astrocytes. and star shaped processes. S-100b positive cells were
Measurements of each slice of the cortex were made in widely present on all cortical layers in opposition to GFAP,
both hemispheres, for each of the ten slices taken per which was almost absent in middle areas while only some
animal (i.e. 60 fields per animal) and the mean value per isolated astrocytes were present in lower and upper areas.
animal was calculated. The average values per group (eight Outside the cortex, both GFAP and S-100b were present,
animals) were compared at each age by statistical analysis especially in regions such as the hippocampus (Figs. 1 and
(ANOVA) on STATVIEW II! Abacus Concepts. 2).
All animal experiments were performed in accordance Comparing both experimental groups at all ages, no
with the European Community Council Directive of 24 morphological differences were found. Thus, we per-
November 1986 (86/609/EEC). formed a quantitative analysis in order to study the
possible differences in the number of astrocytes per area.
The results are shown in Table 1. Quantifying the number
3 . Results of positive cells per cortical surface, the following results
were obtained.
We found a significantly lower number of cells per unit
area in the visual cortex of dark-reared rats at 35 dpn, 3 .1. Visual cortex
whereas no differences were found between both groups in
younger animals, with the exception of 21 dpn, when The density of S-100b positive cells suffered slight
Fig. 1. (a) S100b positivity throughout the visual cortex at 5 weeks postnatal in dark-reared rats. (b) S100b positivity throughout the visual cortex at 5
weeks postnatal in control rats. (c) GFAP positivity throughout the visual cortex at 5 weeks postnatal in dark-reared rats. Positive cells appear mostly in
lower and upper layers being almost absent in middle layers. Scale line is 150 mm.
˜66
E.G
.Argandonaetal.
/DevelopmentalBrainResearch
141 (
2003)
63–69
Fig
.2.
S-1
00b
posi
tive
cell
sin
layer
IVof
dar
kre
ared
vis
ual
cort
ex.
Sca
leli
ne
is75m
m.
incr
ease
san
dd
ecre
ases
bet
wee
nal
lth
eag
esst
ud
ied
,b
ut
dec
reas
esw
ere
qu
anti
tati
vel
ylo
wer
inre
sult
sta
ken
fro
m
wh
enw
eco
mp
ared
the
last
of
the
stu
die
dag
es—
63
dp
n—
lay
erIV
,sh
ow
ing
ah
igh
erle
vel
of
ho
mo
gen
eity
.C
om
par
-
wh
ile
den
sity
inco
ntr
ols
was
sim
ilar
tod
ensi
tyat
14
dp
n,
ing
bo
thg
rou
ps,
den
sity
was
slig
htl
yh
igh
erin
dar
k-r
eare
d
itw
as2
5%
low
erin
dar
k-r
eare
dra
ts.
Incr
ease
san
dra
tsu
pto
28
dp
n,
and
was
sig
nifi
can
to
nly
at2
1d
pn
.F
rom
Tab
le1
Ast
rogli
alden
sity
atvar
ious
ages
of
dev
elopm
ent
for
both
dar
k-r
eare
dan
dco
ntr
ol
gro
ups
inth
evis
ual
and
retr
osp
lenia
lco
rtex
(mea
nnum
ber
of
S-1
00b
2posi
tive
bodie
sper
250
000
or
10
000m
m6
stan
dar
ddev
iati
on
and
stat
isti
cal
signifi
cance
,P
val
ue)
22
Age
Ast
rocy
tes
per
250
000m
m(m
iddle
layer
s)A
stro
cyte
sper
10
000m
m(l
ayer
IV)
(day
s)D
ark
rear
ing
Contr
ols
Dif
f.(%
)P
Dar
kre
arin
gC
ontr
ols
Dif
f.(%
)P
Vis
ual
cort
ex
14
46.26
9.4
45.96
81.9
0.6
216.06
4.1
16.26
3.8
1.8
0.8
6
21
58.26
9.9
52.56
10.2
10.9
0.0
122.06
6.1
17.46
3.7
26.4
0.0
001
28
47.16
8.5
43.26
8.1
90.0
617.96
4.3
16.76
4.8
7.2
0.2
3
35
36.06
8.3
506
7.1
228
0.0
001
13.26
3.8
16.86
2.6
221.4
0.0
001
42
31.86
6.8
39.96
7.4
220.3
0.0
001
11.86
3.3
15.36
4.8
222.9
0.0
001
49
33.96
9.6
48.16
13.4
229.5
0.0
001
12.26
3.9
16.96
5.4
227.8
0.0
001
56
37.36
942.16
9.7
211.4
0.0
09
13.96
415.46
3.6
29.7
40.0
3
63
34.46
7.8
45.36
7.7
224
0.0
001
12.66
3.3
16.96
4.9
227.8
0.0
001
Ret
rosp
lenia
lco
rtex
14
41.86
10.4
48.66
8.4
14
0.0
413.46
2.8
17.26
3.6
22.2
0.0
02
21
60.96
9.2
48.86
14.4
24.8
0.0
05
21.56
615.86
3.8
36
0.0
005
28
44.66
10.7
39.86
8.7
12
0.1
416.96
4.5
15.56
49
0.1
4
35
43.56
745.66
8.2
24.6
0.3
915.26
4.4
17.66
3.6
13.6
0.0
5
42
37.16
7.3
38.46
5.3
23.4
0.5
914.76
3.6
12.96
2.9
14
0.1
1
49
46.56
12.3
51.46
12.4
29.5
0.0
916.36
5.8
18.26
710.4
0.1
7
56
40.46
7.7
436
10.3
26.7
0.3
15.46
3.4
15.96
3.4
3.1
%0.5
9
63
45.56
7.5
49.96
9.9
28.8
0.1
16.06
4.3
16.16
3.6
20.1
0.9
3
viernes 12 de noviembre de 2010

20
30
40
50
60
p14 p21 p28 p35 p42 p49 p56 p63
Oscuridad Control
densidad astroglialas
tr./2
5000
0µm
2
viernes 12 de noviembre de 2010

Empobrecimiento ambiental
Corteza somatosensorialCorteza barrel ratas. Afeitado vibrisas produce alteraciones morfologicas y fisiologicas
viernes 12 de noviembre de 2010

Empobrecimiento ambiental
* Privación olfativa
* Privación auditivaSimilares efectos al resto de sentidos, pero de mayor intensidad
Un elemento común es la plasticidad compensatoria en los sentidos no empobrecidos
Neuron, Vol. 46, 103–116, April 7, 2005, Copyright ©2005 by Elsevier Inc. DOI 10.1016/j.neuron.2005.02.016
Activity-Dependent Adjustmentsof the Inhibitory Network in the Olfactory Bulbfollowing Early Postnatal Deprivation
Armen Saghatelyan,1 Pascal Roux,2 environmental conditions. The continuous postnatal sup-ply of newborn inhibitory interneurons to the main olfac-Michele Migliore,3,5 Christelle Rochefort,1,6
tory bulb (MOB) offers an ideal system to study neu-David Desmaisons,1 Pierre Charneau,4ronal adjustment regulated by sensory experiences.Gordon M. Shepherd,3 and Pierre-Marie Lledo1,*Progenitor cells originating from the subventricular zone1Laboratory of Perception and Memory(SVZ) of the lateral ventricle first migrate tangentially toPasteur Institutethe MOB, by way of the rostral migratory stream (RMS),Centre National de la Rechercheand then migrate radially within MOB before they dif-Scientifique (URA 2182)ferentiate into local interneurons (Luskin, 1993; Lois and75015 Paris CedexAlvarez-Buylla, 1994). It has been hypothesized that post-Francenatal neurogenesis is controlled by levels of sensory2Platform of Dynamic Imagingactivity (Frazier-Cierpial and Brunjes, 1989; Corotto etPasteur Instituteal., 1994; Kirschenbaum et al., 1999; Saghatelyan et al.,25 rue du Dr. Roux2003; Lledo et al., 2004). Hence, although proliferation75015 Paris Cedexand tangential migration of neuroblasts are not affectedFranceby bulbar removal (Kirschenbaum et al., 1999) or nostril3Department of Neurobiologyocclusion (Frazier-Cierpial and Brunjes, 1989; but seeYale Medical Schoolalso Corotto et al., 1994), decreased radial migration333 Cedar Street(Saghatelyan et al., 2004) and increased neuronal deathNew Haven, Connecticut 06510(Frazier-Cierpial and Brunjes, 1989; Najbauer and Leon,4Laboratory of Molecular Virology and Vectorology1995; Fiske and Brunjes, 2001) have been both re-Pasteur Instituteported in deprived bulbs. In contrast, odor enrichment28 rue du Dr. Rouxincreases the number of newborn granule cells and im-75724 Parisproves olfactory memory (Rochefort et al., 2002). It isFrancenoteworthy that granule cells provide inhibition ontooutput bulbar neurons (i.e., mitral/tufted cells) that isresponsible for their oscillatory synchronization (Fried-
Summary man and Strowbridge, 2003; Lagier et al., 2004), andthus for information processing (Laurent et al., 2001;
The first-order sensory relay for olfactory processing, Lledo and Gheusi, 2003). Yet, it is unknown whether thethe main olfactory bulb (MOB), retains the ability to newborn interneurons actively participate in the oscilla-acquire new interneurons throughout life. It is there- tory synchronization of principal cells, or what theirfore a particularly appropriate region for studying the functional implications are for overall bulbar activity. Inrole of experience in sculpting neuronal networks. We principle, any variation in the number and/or the mor-found that nostril closure decreased the number of phology of newborn neurons might disrupt the activitynewborn granule cells in the MOB, the complexity of of bulbar output neurons and thus information process-their dendritic arborization, and their spine density, ing. A small number of studies have attempted to ad-without affecting the preexisting population of gran- dress these issues with unexpected results. For in-ule cells. Accordingly, the frequency of miniature syn- stance, measurements of the paired-pulse inhibition ofaptic inhibitory events received by mitral cells was evoked potentials following stimulation of lateral olfac-reduced. However, due to a compensatory increase tory tract in control and odor-deprived bulbs demon-in newborn granule cell excitability, action potential- strated that a reduced number of newborn interneuronsdependent GABA release was dramatically enhanced, surprisingly increased the level of inhibition received bythus counteracting the reduction in spine density and mitral cells (Wilson et al., 1990; Wilson and Wood, 1992;leading to an unaltered synchronization of mitral cell Wilson, 1995).firing activity. Together, this study reveals a unique Here, using unilateral odor deprivation in combina-form of adaptive response brought about exclusively tion with quantitative immunohistological, biphoton,by the cohort of newborn cells and used to maintain and electrophysiological analyses, we explore the func-normal functioning of the MOB. tional consequences of reduced neurogenesis on the
activity of the bulbar network. We show that sensorydeprivation specifically reduces the dendritic length,Introductionspine density, and total number of newborn but not ofpreexisting granule cells. As a consequence, action po-The functional properties of networks in the brain cantential- and glutamate-independent GABA release isbe adjusted to constantly changing developmental andimpaired. Interestingly, however, sensory deprivationalso strengthens action potential-dependent GABA re-
*Correspondence: [email protected] lease, since newborn granule cells were more excit-5 Permanent address: Institute of Biophysics, National Researchable. Such a compensatory effect preserves the overallCouncil, Palermo, Italy.inhibition and thus the spatiotemporal synchronization6 Present address: Max-Planck Institute for Molecular Genetics,
14195 Berlin, Germany. of output neurons. Together, this study demonstrates
viernes 12 de noviembre de 2010

Enriquecimiento ambiental
Donald Hebb (1949)
Kresh, Bennett, Rosenzweig, Diamond (60s)
Combinación de complejidad de objetos
inanimados y estimulación social.
viernes 12 de noviembre de 2010

Enriquecimiento ambiental
viernes 12 de noviembre de 2010

Enriquecimiento ambiental
* Necesidad de estandarizar
* Super-enriquecimiento
* Rol del ejercicio
viernes 12 de noviembre de 2010

Enriquecimiento ambiental
viernes 12 de noviembre de 2010

Enriquecimiento ambiental
viernes 12 de noviembre de 2010

Enriquecimiento ambiental
viernes 12 de noviembre de 2010
Enriquecimiento ambiental
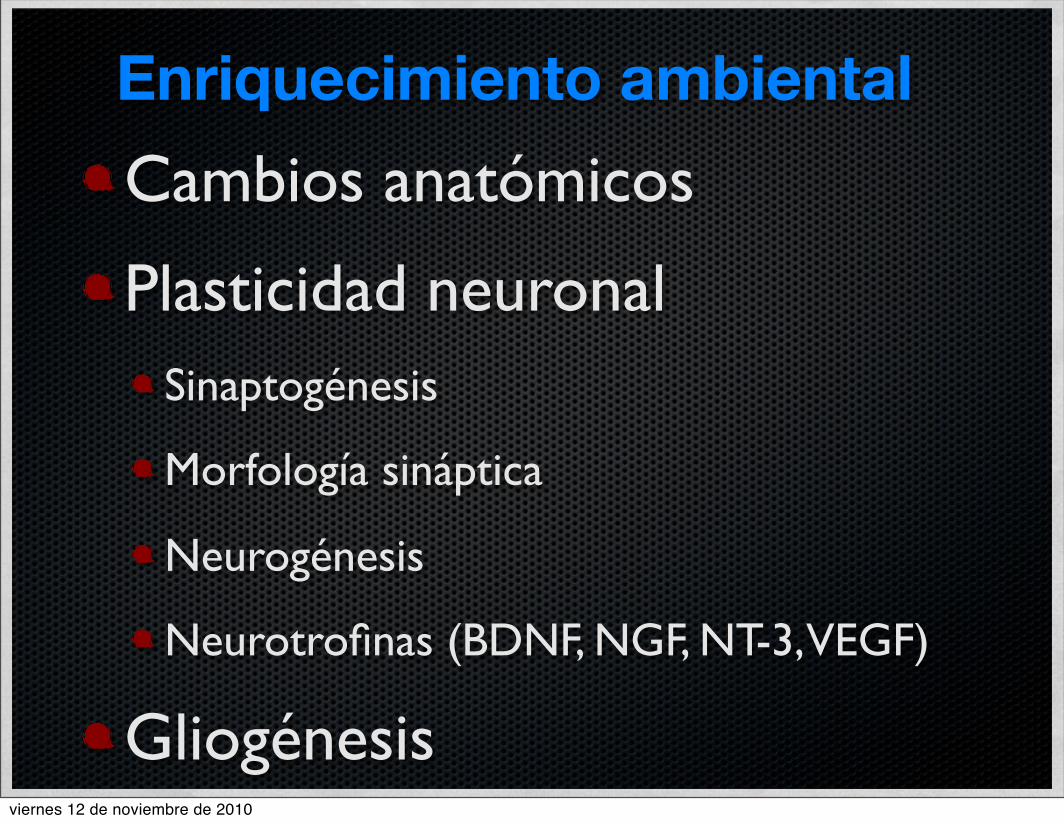
Cambios anatómicos
Plasticidad neuronal
Sinaptogénesis
Morfología sináptica
Neurogénesis
Neurotrofinas (BDNF, NGF, NT-3, VEGF)
Gliogénesisviernes 12 de noviembre de 2010

Enriquecimiento ambiental
* Corteza auditiva (Greenough, 1973)
* Corteza olfatoria (Roselli-Austin, 1990)
* Corteza somatosensorial (Coq, 1998)
* Hipocampo (Rampon, 2000)
* Amigdala (Nikolaev. 2002)
* Ganglios basales (Comery, 1996)
* Cerebelo (Greenough, 1986)
viernes 12 de noviembre de 2010

Enriquecimiento ambiental
Mejora aprendizaje y memoria (Dash, 2009)
Reduce deterioro cognitivo fisiologico (Segovia, 2009)
Reduce ansiedad e incrementa actividad exploratoria (Benaroya, 204)
Induce neurogenesis en hipocampo (Kempermann 1997)
Reduce comportamientos adictivos a drogas (Solinas 2010)
Madura y consolida la corteza visual en ratas privadas de luz (Bertoletti 2004)
Acelera el desarrollo de la corteza visual (Cancedda 2004)
viernes 12 de noviembre de 2010

viernes 12 de noviembre de 2010

Qua
litat
ive
stud
yLEA
EBA
GluT-1
His
toch
emis
try
Imm
unoh
isto
chem
istr
y
viernes 12 de noviembre de 2010

LEA EBAQ
ualit
ativ
e st
udy
viernes 12 de noviembre de 2010

Qua
litat
ive
stud
yEBA GluT-1
EBA + GluT-1
viernes 12 de noviembre de 2010
Enriquecimiento ambiental
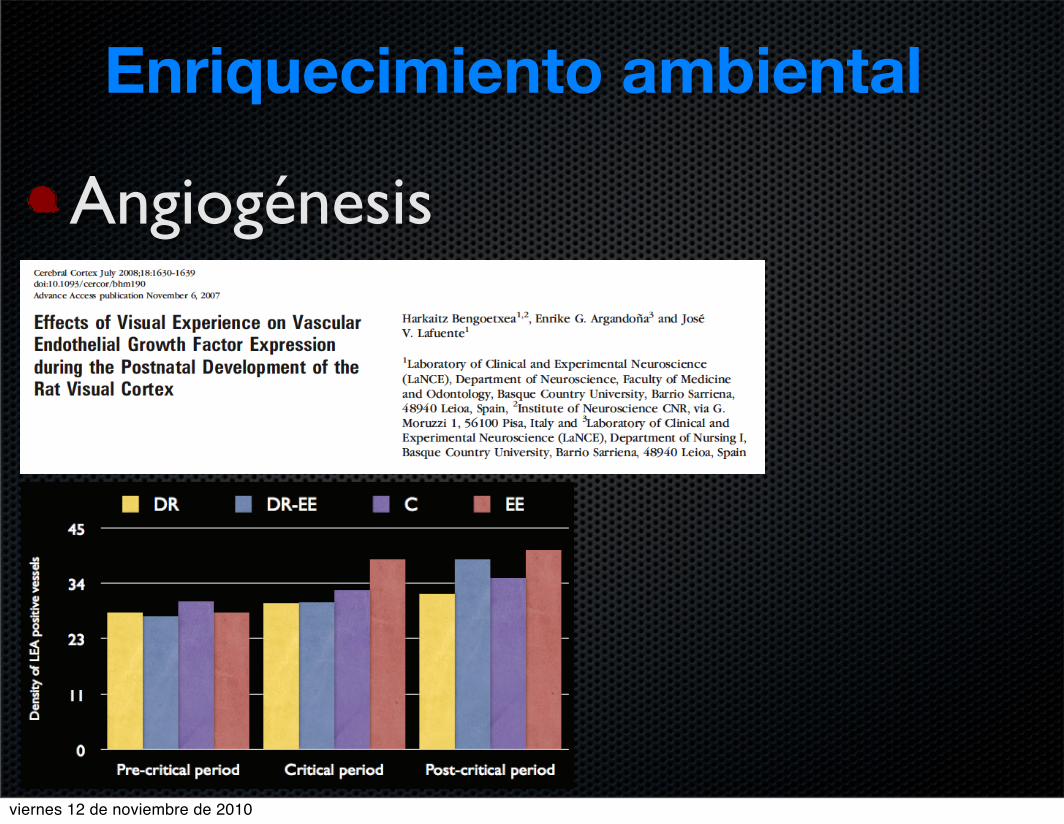
Angiogénesis
viernes 12 de noviembre de 2010

Qua
ntita
tive
stud
y
viernes 12 de noviembre de 2010

Qua
ntita
tive
stud
y
viernes 12 de noviembre de 2010

VE
GF
leve
ls
WESTERN BLOT
ELISA
viernes 12 de noviembre de 2010

Western blot
viernes 12 de noviembre de 2010

Western blot
viernes 12 de noviembre de 2010
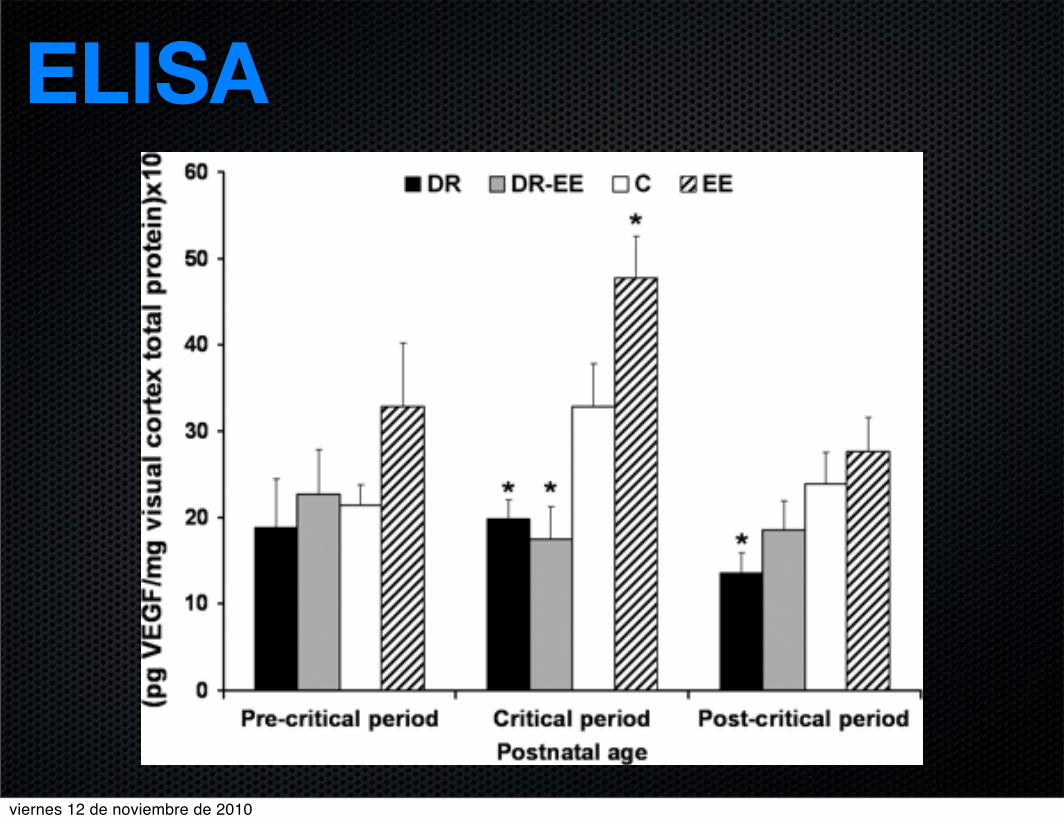
ELISA
viernes 12 de noviembre de 2010

VEGF levels
0
1,5
3,0
4,5
6,0
14 dpn 21 dpn 28 dpn 35 dpn 42 dpn 49 dpn 56 dpn 63 dpn
CEControlDRDR-CE
viernes 12 de noviembre de 2010

!"#$%&'"!"#$$%& '()*!+$,++++-.,+/0%1234$,#$$%,$++$5,6
7!#$$%!89:!;<=9(>?!@(<>ABC!D(EF)CB=)(A!7!#$$%!;AB=(E)DBC!G(D):=H!(I!J>:B=!K>)=B)A!BA'!L>:CBA'
Blackwell Publishing Ltd
!"#$%&'()*+*,&%$*)%$),*-.%,*/)01,)*23%,124*25'()*2,%&"4*25)51)100$*5)5"*)-.'25%5'5%3*)*00*&5$)10)/',67,*',%28)12)5"*)97:;;!!!!)'$5,1%&)/*2$%5#)%2)5"*),'5)3%$.'()&1,5*+MA>)N:!J,!;>OBA'(PBQ+Q#QR!SB>NB)=T!K:AO(:=6:B#QR!BA'!@(?U!V,!WBI<:A=:#QR
+()*&+',)%'#-.#/0+12%3#4#&%5##6&7-+&'-+8#-.#9:2%2;&:#&%5#<=*)+2,)%'&:#/)0+-1;2)%;)#>6&/9<?@#()*&+',)%'#-.#/)0+-1;2)%;)@#
A&;0:'8#-.#B)52;2%)#&%5#C5-%'-:-38@#D&1E0)#9-0%'+8#F%2G)+12'8@#D&++2-#H&++2)%&@#IJKIL#6)2-&@#H*&2%
<=$5,'&5
;I=:>!X)>=9Q!:6F(?<>:!=(!Y)?<BC!)AF<=?!E('<CB=:?!D(>=)DBC!':Y:C(FE:A=Q!)A'<D)AO!A<E:>(<?!D9BAO:?!)A!BCC!(I!=9:
D(EF(A:A=?!(I!=9:!Y)?<BC!D(>=:6,!Z(?=!(I!=9:!D(>=)DBC!D9BAO:?!=9<?!)A'<D:'!(DD<>!'<>)AO![9B=!)?!DBCC:'!=9:!D>)=)DBC
F:>)(',!;?=>(DH=:?!FCBH!BA!)EF(>=BA=!>(C:!)A!=9:!':Y:C(FE:A=Q!EB)A=:ABAD:!BA'!FCB?=)D)=H!(I!=9:!D(>=:6!B?![:CC!B?
)A!=9:!?=><D=<>:!BA'!I<AD=)(A!(I!=9:!YB?D<CB>!A:=[(>N,!V)?<BC!':F>)YB=)(A!)A'<D:?!B!':D>:B?:!)A!=9:!B?=>(OC)BC
F(F<CB=)(AQ![9:>:B?!:A9BAD:'!:6F:>):AD:!)AD>:B?:?!)=,!M6F(?<>:!=(!BA!:A>)D9:'!:AY)>(AE:A=!9B?!X::A!?9([A
=(!F>:Y:A=!=9:!:II:D=?!(I!'B>N1>:B>)AO!)A!=9:!Y)?<BC!D(>=:6,!\<>!F<>F(?:![B?!=(!?=<'H!=9:!:II:D=?!(I!BA!:A>)D9:'
:AY)>(AE:A=!(A!=9:!':A?)=H!(I!B?=>(DH=:?!F:>!>:I:>:AD:!?<>IBD:!B=!=9:!Y)?<BC!D(>=:6!(I!'B>N1>:B>:'!>B=?Q!)A!(>':>!=(
':=:>E)A:!)I!:A9BAD:'!:6F:>):AD:!)?!BXC:!=(!D(EF:A?B=:!=9:!]<BA=)=B=)Y:!:II:D=?!(I!Y)?<BC!':F>)YB=)(A!BA'!=9:!>(C:
(I!F9H?)DBC!:6:>D)?:!(A!=9:!:A>)D9E:A=!FB>B')OE,!^>:OABA=!GF>BO<:1_B[C:H!>B=?
10
12
14
16
18
20
22
24
P21 P28 P35 P42 P49 P56 P63
Pri
ma
ry v
isu
al
co
rte
x
(S-1
00
B p
os
itiv
e a
str
oc
yte
de
ns
ity
)
Postnatal Age
C DR DR-EE DR-EE-Ex DR-Ex
viernes 12 de noviembre de 2010

9
12
15
18
21
24
P21 P28 P35 P42 P49 P56 P63
Pri
ma
ry s
om
ato
se
ns
ory
co
rte
x
(S1
00
- B
po
sit
ive
as
tro
cy
te d
en
sit
y)
Postnatal Age
C DR DR-EE DR-EE-Ex DR-Ex
viernes 12 de noviembre de 2010

Patología SNC
TCE
Ictus
Tumores
Patologías neurodegenerativas
viernes 12 de noviembre de 2010

Patología SNC
TCE
Ictus
Tumores
Patologías neurodegenerativas
Vascularización
viernes 12 de noviembre de 2010

Objetivos terapeúticos
Neuroprotección/neurorescate
Incremento vascularización
viernes 12 de noviembre de 2010
TCE en Desarrollo
Mayor capacidad de plasticidad
Interferencia en los mecanismos fisiológicos
Apoptosis
Plasticidad sináptica (NMDA)
viernes 12 de noviembre de 2010

Reserva Cerebral Cognitiva (Nithianantharajah, 2006)
viernes 12 de noviembre de 2010

Reserva Cerebral Cognitiva (Nithianantharajah, 2006)
viernes 12 de noviembre de 2010

Reserva Cerebral Cognitiva (Nithianantharajah, 2006)
viernes 12 de noviembre de 2010
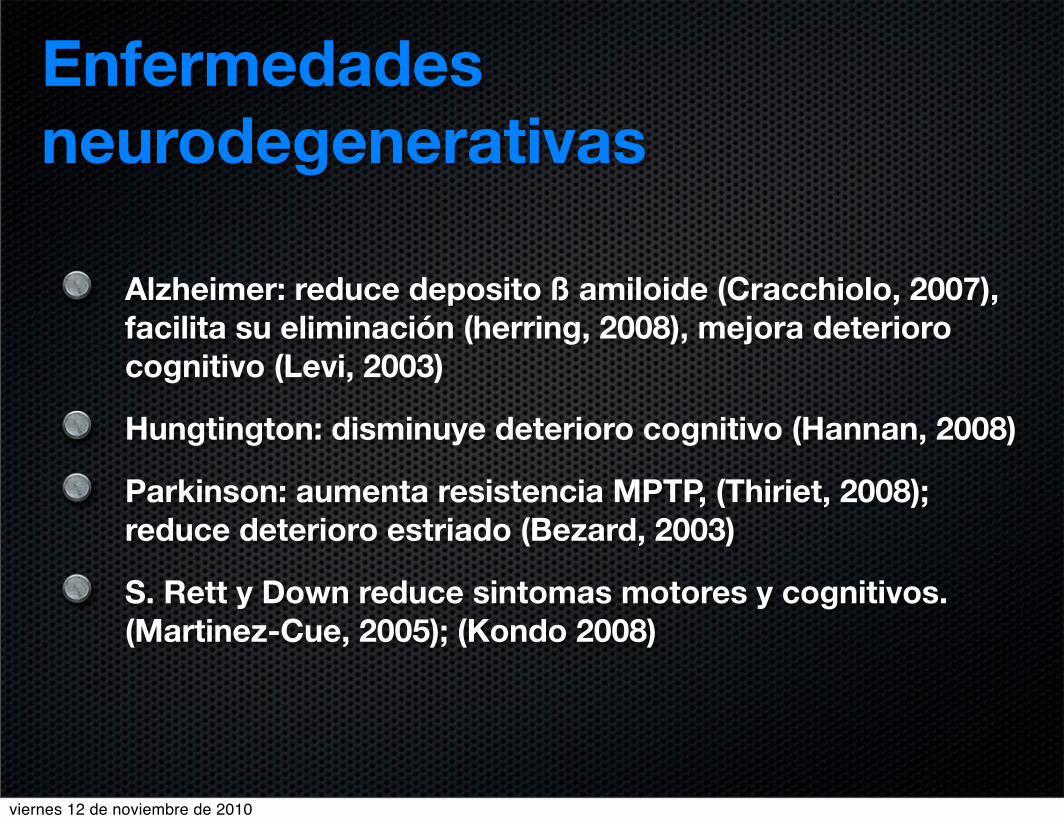
Enfermedades neurodegenerativas
Alzheimer: reduce deposito ß amiloide (Cracchiolo, 2007), facilita su eliminación (herring, 2008), mejora deterioro cognitivo (Levi, 2003)
Hungtington: disminuye deterioro cognitivo (Hannan, 2008)
Parkinson: aumenta resistencia MPTP, (Thiriet, 2008); reduce deterioro estriado (Bezard, 2003)
S. Rett y Down reduce sintomas motores y cognitivos. (Martinez-Cue, 2005); (Kondo 2008)
viernes 12 de noviembre de 2010

Isquemia
Disminuye secuelas (Saucier, 2010)
Facilita migracion celulas SVZ (Hicks, 2007)
Mejora recuperación funcional (Briones, 2009)
Disminuye amiloidogenesis (Briones, 2009)
viernes 12 de noviembre de 2010

TCE
Promueve recuperacion funcion cognitiva (Hamm, 1996)
Reduce daño BHE (Ortuzar, 2010)
Disminuye muerte neuronal y mejora angiogenesis (Ortuzar, 2010)
Recuperacion en rehabilitacion postraumática (Penn, 2009)
viernes 12 de noviembre de 2010

Tumores
Volume 142, Issue 1, 9 July 2010, Pages 52-64
Article
Environmental and Genetic Activation of a Brain-Adipocyte BDNF/Leptin Axis Causes Cancer Remission and Inhibition
viernes 12 de noviembre de 2010

Figure 3
!"#$%&'()(&*+&,+-."+/,&'#0'&)(1+"2*#+./0(Rearing schedule
viernes 12 de noviembre de 2010

viernes 12 de noviembre de 2010

VEGF infusion
18 dpn Long Evans rats
Alzet minipumps for 1 week at a 1 µl /h rate.VEGF. 25 ng/ml.
anti-VEGF. 25 µg/ml.
PBS.
Untreated rats.
viernes 12 de noviembre de 2010

BASIC NEUROSCIENCES, GENETICS AND IMMUNOLOGY - ORIGINAL ARTICLE
Combination of intracortically administered VEGFand environmental enrichment enhances brain protectionin developing rats
Naiara Ortuzar • Enrike G. Argandona •
Harkaitz Bengoetxea • Jose V. Lafuente
Received: 8 September 2010 / Accepted: 24 September 2010! Springer-Verlag 2010
Abstract Postnatal development of the visual cortex ismodulated by experience, especially during the critical
period. In rats, a stable neuronal population is only
acquired after this relatively prolonged period. Vascularendothelial growth factor (VEGF) is the most important
angiogenic factor and also has strong neuroprotective,
neurotrophic and neurogenic properties. Similar effectshave been described for rearing in enriched environments.
Our aim is to investigate the vascular and neuronal effects
of combining VEGF infusion and environmental enrich-ment on the visual cortex during the initial days of the
critical period. Results showed that a small percentage of
Cleaved Caspase-3 positive cells colocalized with neuronalmarkers. The lesion produced by the cannula implantation
resulted in decreased vascular, neuronal and Caspase-3
positive cell densities. Rearing under enriched environmentwas unable to reverse these effects in any group, whereas
VEGF infusion alone partially corrected those effects. A
higher effectiveness was reached by combining both theprocedures, the most effective combination being when
enriched-environment rearing was introduced only afterminipump implantation. In addition to the angiogenic
effect of VEGF, applied strategies also had synergic neu-roprotective effects, and the combination of the two strat-
egies had more remarkable effects than those achieved by
each strategy applied individually.
Keywords Critical period ! Enriched environment !Neuroprotection ! Neurovascular unit ! VEGF !Visual system
Introduction
The development of the central nervous system (CNS), and
more specifically of the sensory systems, is modulated by
experience. This leads to an increase in metabolic demand(Black et al. 1990) that is satisfied by the adaptive
remodelling of the vascular network (Argandona and
Lafuente 1996, 2000). Postnatal development of the visualcortex occurs in two stages. The first is genetically pre-
determined and the second modulated by experience. Most
of the cortical changes induced by experience occur duringthe critical period (Hensch 2005). This time window is
specific for each sensory cortex and when experience-mediated reorganization finishes, sensory functions reach
maturity (Bengoetxea et al. 2008). In rats, the critical
period for the visual system is located between the thirdand the fifth postnatal weeks and the maximum peak of
experience-induced changes occurs during the fourth and
the fifth weeks (Fagiolini et al. 1994; Fagiolini and Hensch2000).
During development, more than half of the initially
formed neurons die by programmed cell death (PCD),which is of fundamental importance for the correct devel-
opment of the CNS (Finlay 1992). PCD is highly regulated
during development and is maintained under strict control
N. Ortuzar (&) ! E. G. Argandona ! H. Bengoetxea !J. V. LafuenteDepartment of Neuroscience, Laboratory of Clinical andExperimental Neuroscience (LaNCE), Faculty of Medicine andOdontology, University of the Basque Country UPV/EHU,Barrio Sarriena s/n, E48940 Leioa, Spaine-mail: [email protected]
E. G. ArgandonaDepartment of Nursing I, University of the Basque CountryUPV/EHU, Barrio Sarriena, E48940 Leioa, Spain
123
J Neural Transm
DOI 10.1007/s00702-010-0496-2
Quantitative results
Control group
Vascular density Groups including enriched environment(EE–SC, SC–EE and EE-EE) showed a statistically sig-
nificant difference when compared to the SC–SC group.
Observed differences were 28, 35 and 19% higher,respectively (P = 0.000 for all groups) when an enriched
environment was applied (Fig. 5a).
Neuronal density Only the EE–SC group presented astatistically significant difference when compared to SC–
SC. Neuronal density was 16% (P = 0.011) higher when
the enriched environment was applied. Neither the SC–EEnor the EE–EE group showed significant differences when
compared to SC–SC and the densities obtained were 1%
(P = 1.000) and 10% (P = 0.203) higher, respectively,than in the group reared in standard conditions (Fig. 5b).
Cleaved Caspase-3 density The density of the EE–SC
group was 22% lower than that of the SC–SC group, whichis a statistically significant difference (P = 0.000). The
SC–EE and EE–EE groups also showed lower density but
these differences were not significant (10%, P = 0.184;7%, P = 0.880, respectively) (Fig. 5c).
PBS group
Vascular density Vascular density was 18% (P = 0.091),
9% (P = 1.000) and 8% (P = 1.000) higher in the EE–SC,SC–EE and EE–EE groups, respectively, when compared
to the SC–SC group. None of these differences were sta-
tistically significant (Fig. 5a).
Neuronal density No significant differences were found
between studied groups. Neuronal density was 9%(P = 0.972) lower in the EE–SC group when compared to
SC–SC. A similar tendency was observed in both the SC–
EE and the EE–EE groups where the density was 11%(P = 0.902) and 6% (P = 0.983) lower, respectively
(Fig. 5b).
Cleaved Caspase-3 density Cleaved Caspase-3 densityincreased by about 16% (P = 1.000) in the EE–SC group
and 30% (P = 0.225) in the SC–EE group when compared
to SC–SC, with no statistically significant differences. Onlythe EE–EE group resulted in a statistically demonstrated
change (40%, P= 0.040) (Fig. 5c).
VEGF Group
Vascular density Only the SC–EE group resulted in astatistically significant difference (P = 0.019) when com-
pared to SC–SC. Observed density was 16% higher when
the enriched environment was applied. Not only did the EE–SC and EE–EE groups show any statistically significant
differences (10%, P = 0.724 and 1%, P = 1.000, respec-
tively), but they also showed a lower density when com-pared to rats reared under standard conditions (Fig. 5a). The
SC–EE group had the highest vascular density.
Neuronal density No significant differences wereobserved. Both the EE–SC and the SC–EE groups showed
lower neuronal density than the SC–SC group, with results
that were 15% (P = 0.064) and 7% (P = 0.861) lower,respectively. The EE–EE group showed an 18%
(P = 0.499) higher density when compared to the group
reared in standard conditions (Fig. 5b).
Fig. 4 Primary visual cortex images for quantified vascular, neuronaland Caspase-3 positive cell densities. Sections were stained bybutyryl cholinesterase histochemistry (a, b), NeuN (c, d) and Cleaved
Caspase-3 (e, f) immunohistochemistry. Densities were estimated bythe optical dissector method. Scale bar = 100 lm (a, c, e) and 20 lm(b, d, f)
VEGF and EE enhances brain protection in rats
123
in adulthood. The rat visual system is characterized by
postnatal modulation, and a stable neuronal population isonly acquired after a relatively prolonged postnatal period
(Papadopoulos and Michaloudi 1999). Caspases and their
substrates are essential in the implementation of PCD, asCaspase-3 is the most abundant cysteine protease in the
brain (McLaughlin 2004). Apart from during development,
it has been demonstrated that Caspase-3 is also activatedduring apoptotic cellular death induced by pathological
processes such as neurodegenerative diseases (Mellioset al. 2009), and, to a lesser extent, by traumatic brain
injuries or stroke (Lafuente et al. 2007). One of the most
important mechanisms of neuronal survival consists of themetabolic chains induced by neurotrophins. Recent studies
have shown that both neurotrophins and VEGF play key
roles as antiapoptotic agents (Storkebaum et al. 2004).Vascular endothelial growth factor (VEGF) is the major
angiogenic factor in developmental (Ferrara et al. 2003)
and pathological angiogeneses, and also in pathologicalvascular permeability (Dvorak 2000). The role of VEGF in
nervous tissue is even more extensive. Previous studies
show that VEGF also has strong neuroprotective, neuro-trophic, and neurogenic properties (Jin et al. 2002;
Rosenstein and Krum 2004; Storkebaum et al. 2004). The
neuroprotective function of VEGF includes direct andindirect actions, and appears to be due to a combination of
direct neuroprotective effects and the stimulation of
angiogenesis.Molecules that affect both the neural and the vascular
cell processes have recently been termed angioneurins
(Zacchigna et al. 2008). Although the archetypal angio-neurin is VEGF, neurotrophins like brain-derived neuro-
trophic factor (BDNF) also belong to this family.
Similar effects have been described for enrichedenvironments (EE). Countless studies have reported
changes induced by this paradigm during CNS develop-
ment, not only in standard conditions but also in patho-logical conditions (Nithianantharajah and Hannan 2009).
EE has strong effects on the plasticity of neural con-
nections, especially in the visual cortex, where it hasbeen demonstrated that rearing from birth in an enriched
environment leads to an acceleration of visual develop-
ment (Cancedda et al. 2004). In addition, EE increasesthe expression of some factors referred to above that play
an important role in neuronal trophism, such as VEGF or
BDNF (Bengoetxea et al. 2008; Ickes et al. 2000; Phamet al. 2002).
The aim of this study is to investigate the vascular and
neuronal effects of combined VEGF infusion and envi-ronmental enrichment in the visual cortex during the initial
days of the critical period.
Materials and methods
Animals and housing
5 Long-Evans rats (Harlan, Barcelona, Spain) were used
for each experimental group with different rearing condi-
tions (Fig. 1):
1. Standard condition (SC) rats raised in standard labo-
ratory cages (500 mm 9 280 mm 9 140 mm) with a12-h light/dark cycle.
2. Enriched environment (EE) rats raised in large cages
(720 mm 9 550 mm 9 330 mm) furnished with col-ourful toys and differently shaped objects (shelters,
tunnels) that were changed every 2 days (with a 12-h
light/dark cycle).
All animals had access to food and water ad libitum.
Minipump implantation
Experiments were performed on Long-Evans rats shortly
before the beginning of the critical period (P18). Animalswere anaesthetized with Avertin (1 ml/100 g) and after-
wards underwent a sagittal incision midway on the scalp.
Skin and periosteum were retracted. A subcutaneouspocket was opened in the back for the osmotic minipump
placement (Mod. 1007 D, Alzet, Cupertino, CA, USA).
The brain infusion kit (Mod. Alzet Brain Infusion Kit III,Alzet) was fixed to the skull with cyanoacrylate and the
Fig. 1 Rearing conditions.a Standard condition andb enriched environment
N. Ortuzar et al.
123
Quantitative results
Control group
Vascular density Groups including enriched environment(EE–SC, SC–EE and EE-EE) showed a statistically sig-
nificant difference when compared to the SC–SC group.
Observed differences were 28, 35 and 19% higher,respectively (P = 0.000 for all groups) when an enriched
environment was applied (Fig. 5a).
Neuronal density Only the EE–SC group presented astatistically significant difference when compared to SC–
SC. Neuronal density was 16% (P = 0.011) higher when
the enriched environment was applied. Neither the SC–EEnor the EE–EE group showed significant differences when
compared to SC–SC and the densities obtained were 1%
(P = 1.000) and 10% (P = 0.203) higher, respectively,than in the group reared in standard conditions (Fig. 5b).
Cleaved Caspase-3 density The density of the EE–SC
group was 22% lower than that of the SC–SC group, whichis a statistically significant difference (P = 0.000). The
SC–EE and EE–EE groups also showed lower density but
these differences were not significant (10%, P = 0.184;7%, P = 0.880, respectively) (Fig. 5c).
PBS group
Vascular density Vascular density was 18% (P = 0.091),
9% (P = 1.000) and 8% (P = 1.000) higher in the EE–SC,SC–EE and EE–EE groups, respectively, when compared
to the SC–SC group. None of these differences were sta-
tistically significant (Fig. 5a).
Neuronal density No significant differences were found
between studied groups. Neuronal density was 9%(P = 0.972) lower in the EE–SC group when compared to
SC–SC. A similar tendency was observed in both the SC–
EE and the EE–EE groups where the density was 11%(P = 0.902) and 6% (P = 0.983) lower, respectively
(Fig. 5b).
Cleaved Caspase-3 density Cleaved Caspase-3 densityincreased by about 16% (P = 1.000) in the EE–SC group
and 30% (P = 0.225) in the SC–EE group when compared
to SC–SC, with no statistically significant differences. Onlythe EE–EE group resulted in a statistically demonstrated
change (40%, P= 0.040) (Fig. 5c).
VEGF Group
Vascular density Only the SC–EE group resulted in astatistically significant difference (P = 0.019) when com-
pared to SC–SC. Observed density was 16% higher when
the enriched environment was applied. Not only did the EE–SC and EE–EE groups show any statistically significant
differences (10%, P = 0.724 and 1%, P = 1.000, respec-
tively), but they also showed a lower density when com-pared to rats reared under standard conditions (Fig. 5a). The
SC–EE group had the highest vascular density.
Neuronal density No significant differences wereobserved. Both the EE–SC and the SC–EE groups showed
lower neuronal density than the SC–SC group, with results
that were 15% (P = 0.064) and 7% (P = 0.861) lower,respectively. The EE–EE group showed an 18%
(P = 0.499) higher density when compared to the group
reared in standard conditions (Fig. 5b).
Fig. 4 Primary visual cortex images for quantified vascular, neuronaland Caspase-3 positive cell densities. Sections were stained bybutyryl cholinesterase histochemistry (a, b), NeuN (c, d) and Cleaved
Caspase-3 (e, f) immunohistochemistry. Densities were estimated bythe optical dissector method. Scale bar = 100 lm (a, c, e) and 20 lm(b, d, f)
VEGF and EE enhances brain protection in rats
123
viernes 12 de noviembre de 2010

Neuronal density
viernes 12 de noviembre de 2010

Neu
rona
l Den
sity
(Op
tica
l dis
sect
or)
viernes 12 de noviembre de 2010

Neu
rona
l Den
sity
(Op
tica
l dis
sect
or)
viernes 12 de noviembre de 2010

Densidad vascular
0
5.500
11.000
16.500
22.000
SC EA Lesion Lesion EA Lesion SC-EA Lesion EA-SC
20061
1844918.344
16.935
21.694
18.149
viernes 12 de noviembre de 2010

Densidad neuronal
0
25.000
50.000
75.000
100.000
SC EA Lesion Lesion EA Lesion SC-EA Lesion EA-SC
626426110162.64267.016
90.813
82.161
viernes 12 de noviembre de 2010

Densidad Caspasa3
0
5.500
11.000
16.500
22.000
SC EA Lesion Lesion EA Lesion SC-EA Lesion EA-SC
16738
18802
20.254
14.459
19.680
21.110
viernes 12 de noviembre de 2010

www.slideshare.net/nfpguare
www.ehu.es/ehusfera/lance
Contacto
viernes 12 de noviembre de 2010