
Comparate enomcs o two ute speces an nst nto re …...o ed. Comparate enomcs o two ute speces an nst...
38
In the format provided by the authors and unedited. Comparative genomics of two jute species and insight into fibre biogenesis Md Shahidul Islam 1,2,3 * , Jennifer A. Saito 1,4 , Emdadul Mannan Emdad 1 , Borhan Ahmed 1,2,3 , Mohammad Moinul Islam 1,2,3 , Abdul Halim 1,2,3 , Quazi Md Mosaddeque Hossen 1,2,3 , Md Zakir Hossain 1,2,3 , Rasel Ahmed 1 , Md Sabbir Hossain 1 , Shah Md Tamim Kabir 1 , Md Sarwar Alam Khan 1 , Md Mursalin Khan 1 , Rajnee Hasan 1 , Nasima Aktar 1 , Ummay Honi 1 , Rahin Islam 1 , Md Mamunur Rashid 1 , Xuehua Wan 1,4 , Shaobin Hou 1,4 , Taslima Haque 3 , Muhammad Shafiul Azam 3 , Mahdi Muhammad Moosa 3 , Sabrina M. Elias 3 , A. M. Mahedi Hasan 3 , Niaz Mahmood 3 , Md Shafiuddin 3 , Saima Shahid 3 , Nusrat Sharmeen Shommu 3 , Sharmin Jahan 3 , Saroj Roy 3,5 , Amlan Chowdhury 3,5 , Ashikul Islam Akhand 3,5 , Golam Morshad Nisho 3,5 , Khaled Salah Uddin 3,5 , Taposhi Rabeya 3,5 , S. M. Ekramul Hoque 3,5 , Afsana Rahman Snigdha 3,5 , Sarowar Mortoza 3,5 , Syed Abdul Matin 3,5 , Md Kamrul Islam 3,5 , M. Z. H. Lashkar 3,5 , Mahboob Zaman 3,5 , Anton Yuryev 1,6 , Md Kamal Uddin 1,2 , Md Sharifur Rahman 1,7 , Md Samiul Haque 1,2,3 , Md Monjurul Alam 1,2,3 , Haseena Khan 3,8 and Maqsudul Alam 1,3,4† 1 Basic and Applied Research on Jute Project, Bangladesh Jute Research Institute, Dhaka, Bangladesh. 2 Bangladesh Jute Research Institute, Dhaka, Bangladesh. 3 Jute Genome Project, Bangladesh Jute Research Institute, Dhaka, Bangladesh. 4 Advanced Studies in Genomics, Proteomics and Bioinformatics, University of Hawaii, Honolulu, Hawaii, USA. 5 DataSoft Systems Bangladesh Limited, Dhaka, Bangladesh. 6 Elsevier, Rockville, Maryland, USA. 7 Department of Telecommunications, Dhaka, Bangladesh. 8 Department of Biochemistry and Molecular Biology, University of Dhaka, Dhaka, Bangladesh. † Deceased 20 December 2014. *e-mail: [email protected]; [email protected] © 2017 Macmillan Publishers Limited, part of Springer Nature. All rights reserved. SUPPLEMENTARY INFORMATION VOLUME: 3 | ARTICLE NUMBER: 16223 NATURE PLANTS | DOI: 10.1038/nplants.2016.223 | www.nature.com/natureplants
Transcript of Comparate enomcs o two ute speces an nst nto re …...o ed. Comparate enomcs o two ute speces an nst...
In the format provided by the authors and unedited.
Comparative genomics of two jute species andinsight into fibre biogenesisMd Shahidul Islam1,2,3*, Jennifer A. Saito1,4, Emdadul Mannan Emdad1, Borhan Ahmed1,2,3,Mohammad Moinul Islam1,2,3, Abdul Halim1,2,3, Quazi Md Mosaddeque Hossen1,2,3,Md Zakir Hossain1,2,3, Rasel Ahmed1, Md Sabbir Hossain1, Shah Md Tamim Kabir1,Md Sarwar Alam Khan1, Md Mursalin Khan1, Rajnee Hasan1, Nasima Aktar1, Ummay Honi1,Rahin Islam1, Md Mamunur Rashid1, Xuehua Wan1,4, Shaobin Hou1,4, Taslima Haque3,Muhammad Shafiul Azam3, Mahdi Muhammad Moosa3, Sabrina M. Elias3, A. M. Mahedi Hasan3,Niaz Mahmood3, Md Shafiuddin3, Saima Shahid3, Nusrat Sharmeen Shommu3, Sharmin Jahan3,Saroj Roy3,5, Amlan Chowdhury3,5, Ashikul Islam Akhand3,5, Golam Morshad Nisho3,5,Khaled Salah Uddin3,5, Taposhi Rabeya3,5, S. M. Ekramul Hoque3,5, Afsana Rahman Snigdha3,5,Sarowar Mortoza3,5, Syed Abdul Matin3,5, Md Kamrul Islam3,5, M. Z. H. Lashkar3,5, Mahboob Zaman3,5,Anton Yuryev1,6, Md Kamal Uddin1,2, Md Sharifur Rahman1,7, Md Samiul Haque1,2,3,Md Monjurul Alam1,2,3, Haseena Khan3,8 and Maqsudul Alam1,3,4†
Jute (Corchorus sp.) is one of the most important sources ofnatural fibre covering ∼80% of global bast fibre production1.Only Corchorus olitorius and Corchorus capsularis are commer-cially cultivated among more than 100 Corchorus species2 inthe Malvaceae family. Here we describe high-quality draftgenomes of these two species and their comparisons at thefunctional genomics level to support tailor-designed breeding.The assemblies cover 91.6% and 82.2% of the estimatedgenome sizes for C. olitorius and C. capsularis, respectively. Intotal, 37,031 C. olitorius and 30,096 C. capsularis genes are ident-ified andmost of them are validated by cDNA and RNA-seq data.Analyses of clustered gene families and gene collinearity showthat jute underwent shared whole-genome duplication ∼18.66million years (Myr) ago prior to speciation. RNA expressionanalysis from isolated fibre cells reveals the key regulatory andstructural genes involved in fibre formation. This work expandsour understanding of the molecular basis of fibre formationlaying the foundation for the genetic improvement of jute.
Bast (phloem) fibres are obtained from the stem of the plantssuch as jute, flax, hemp, ramie and kenaf. The annual globalproduction of jute generates a farm value of ∼US$2.3 billion1.The cultivated species of jute, C. olitorius and C. capsularis, aremorphologically and physiologically distinct (SupplementaryFig. 1), and a combination of useful traits from these species intoa single genotype is highly desirable3. However, interspecific hybrid-ization is limited because of their cross-incompatibility4,5. To facili-tate comparative functional genomics and to understand themolecular basis of bast fibre biogenesis, genomes of two popularjute cultivars C. olitorius var. O-4 and C. capsularis var. CVL-1are sequenced and analysed.
We performed whole-genome shotgun (WGS) sequencing withthe Roche/454 platform (Supplementary Table 1) and assembledthe genomes using CABOG6. The resulting assemblies were 445Mb (scaffold N50 length, 3.3 Mb; longest scaffold, 45.5 Mb) forC. olitorius and 338 Mb (scaffold N50 length, 4.1 Mb; longestscaffold, 28.5 Mb) for C. capsularis (Table 1 and SupplementaryTable 2). Eighty per cent of the C. olitorius and C. capsularis assem-blies were covered with 415 scaffolds (minimum length 76 kb) and231 scaffolds (minimum length 120 kb), respectively. We estimatedthe genome sizes for C. olitorius and C. capsularis to be ∼448and ∼404 Mb (Supplementary Information and SupplementaryFig. 2), respectively, which were consistent with reported estimates7.Whole-genome optical mapping was used to improve the assemblies,resulting increase in N50 of the scaffolds to 4.0 Mb for C. olitoriusand 8.5 Mb for C. capsularis (Supplementary Information andSupplementary Tables 3–6). We anchored ∼60% of each assemblyto seven genetic linkage groups using a set of 1,389 molecularmarkers from a consensus genetic linkage map8–12
(Supplementary Fig. 3 and Supplementary Table 7). More than99% (C. olitorius) and 97% (C. capsularis) of the isotigs generatedfrom transcriptome sequencing of jute seedlings aligned to therespective genomes indicate comprehensive coverage of the gene-rich regions (Supplementary Tables 8 and 9). In addition, morethan 97% of the conserved core eukaryotic genes13 were present ineach of the draft genomes (Supplementary Table 10). Moreover,the single-base accuracy of the de novo assembled genomes was eval-uated by mapping all reads onto the scaffolds using a CLC mapper(CLC bio, Aarhus, Denmark). It was observed that 82.29% and78.28% of the reads are uniquely mapped to C. olitorius andC. capsularis, respectively (Supplementary Table 11). We predicted
1Basic and Applied Research on Jute Project, Bangladesh Jute Research Institute, Dhaka, Bangladesh. 2Bangladesh Jute Research Institute, Dhaka,Bangladesh. 3Jute Genome Project, Bangladesh Jute Research Institute, Dhaka, Bangladesh. 4Advanced Studies in Genomics, Proteomics and Bioinformatics,University of Hawaii, Honolulu, Hawaii, USA. 5DataSoft Systems Bangladesh Limited, Dhaka, Bangladesh. 6Elsevier, Rockville, Maryland, USA. 7Departmentof Telecommunications, Dhaka, Bangladesh. 8Department of Biochemistry and Molecular Biology, University of Dhaka, Dhaka, Bangladesh.†Deceased 20 December 2014. *e-mail: [email protected]; [email protected]
LETTERSPUBLISHED: XX XX 2017 | VOLUME: 3 | ARTICLE NUMBER: 16223
NATURE PLANTS 3, 16223 (2017) | DOI: 10.1038/nplants.2016.223 | www.nature.com/natureplants 1
© 2017 Macmillan Publishers Limited, part of Springer Nature. All rights reserved.
SUPPLEMENTARY INFORMATIONVOLUME: 3 | ARTICLE NUMBER: 16223
NATURE PLANTS | DOI: 10.1038/nplants.2016.223 | www.nature.com/natureplants
1
Contents
Supplementary Note ................................................................................................................ 2
1. Genome sequencing and assembly ................................................................................... 2
1.1 Plant sample ................................................................................................................. 2
1.2 Nucleic DNA extraction ............................................................................................... 2
1.3 454 sequencing .............................................................................................................. 2
1.4 Genome assembly ......................................................................................................... 3
1.5 Whole-genome mapping and construction of super-scaffolds ................................. 4
1.6 Anchoring genome assembly to linkage map ............................................................ 5
1.7 Genome size estimation, coverage and repeat analysis ............................................ 6
1.8 Assessing genome assembly ......................................................................................... 7
2. Gene annotation ................................................................................................................. 7
2.1 Masking of the genomic sequences ............................................................................. 7
2.2 Identification of repetitive elements ........................................................................... 8
2.3 Transcriptome sequencing .......................................................................................... 8
2.4 De novo gene prediction ............................................................................................... 9
2.5 Functional annotation of protein coding genes ....................................................... 11
3. Genome comparison and evolution ................................................................................ 11
3.1 Comparison of gene families ..................................................................................... 11
3.2 Phylogenetic analysis ................................................................................................. 12
3.3 Genome synteny and gene duplication analysis ...................................................... 12
3.4 Genome speciation event deduced from orthologous pairs.................................... 13
4. Metabolic pathway reconstruction ................................................................................. 13
5. Fibre cell transcriptome sequencing .............................................................................. 14
5.1 Sample preparation ................................................................................................... 14
5.2 Illumina sequencing ................................................................................................... 15
5.3 Mapping and differentially expressed genes (DEGs) analysis ............................... 15
5.4 Real-time RT–PCR experiment and analysis .......................................................... 16
References ............................................................................................................................... 17
Supplementary Figures ......................................................................................................... 21
2
SUPPLEMENTARY NOTE
1. Genome sequencing and assembly
1.1 Plant sample
The seeds of Corchorus olitorius var. O-4 and Corchorus capsularis var. CVL-1 were
collected from the Breeding Division of Bangladesh Jute Research Institute, Dhaka,
Bangladesh. Both varieties were developed through pure line selection1. A single plant from
each variety was selected based on their identifying characters. They were vegetatively
propagated from the cuttings of the top of plants that were 100 days old (before flowering).
Seeds were produced from the selected plants by selfing under controlled conditions to avoid
cross pollination for maintaining genetic purity.
Seeds were surface-sterilized, plated on wet blotting paper, and transferred to a dark
growth chamber to discourage mucilage formation for smooth isolation of quality DNA and
RNA. Mucilage, characteristic of malvaceous plants, is a highly viscous secondary metabolite
and its production is low in the absence of light. It often binds to other secondary metabolites
and co-precipitates with nucleic acids during extraction, thereby hindering further
downstream applications. Four days old axenically grown, etiolated seedlings were harvested
and directly used to isolate nuclear DNA or RNA.
1.2 Nucleic DNA extraction
High molecular weight genomic DNA was prepared following isolation of nuclei
from 4 days old seedlings using a sucrose gradient protocol2. DNA was extracted from nuclei
using extraction buffer (100 mM Tris-Cl, pH 8.0; 20 mM EDTA, pH 8.0; 500 mM NaCl; 1%
SDS; 100 µg/ml Proteinase K; and 0.1% β-mercaptoethanol). The DNA was treated with
RNase A and subsequently a phenol/chloroform/isoamyl alchohol (25:24:1) extraction was
performed to remove impurities. DNA was precipitated with 0.1 volumes of 3 M NaOAc and
0.6 volumes of isopropanol, washed in 70% EtOH, and resuspended in Tris-buffer (10 mM
Tris-Cl).
1.3 454 sequencing
DNA sample preparation for sequencing on the 454/Roche GS FLX was performed as
described by the manufacturer3 with modifications to improve the overall yields
4. Briefly, this
3
procedure entailed shearing the DNA and subsequent end repair, as described5, followed by
ligation of adapter sequences and a second round of end repair to yield a blunt ended DNA
library that was then quantified and diluted prior to amplification via emPCR3. Shotgun
libraries and 3-kb, 8-kb, and 20-kb paired-end libraries were constructed for whole genome
shotgun sequencing. Amplification and sequencing of these libraries were performed using
GS FLX Titanium Sequencing Kits and 454 Genome Sequencer FLX Instruments following
the manufacturer’s protocols (Roche Applied Science, Mannheim, Germany). A total 13.04
Gb of sequence data was generated from the C. olitorius genome, consisting of 5.65 Gb of
shotgun sequences, 2.56 Gb of 3-kb paired-end sequences, 2.47 Gb of 8-kb paired-end
sequences and 2.36 Gb of 20-kb paired-end sequences. For the C. capsularis genome, 13.69
Gb of sequence data was generated, consisting of 7.87 Gb of shotgun sequences, 2.04 Gb of
3-kb paired-end sequences, 2.26 Gb of 8-kb paired-end sequences, and 1.51 Gb of 20-kb
paired-end sequences (Supplementary Table 1). The raw reads have been deposited in the
NCBI Sequence Read Archive (SRA) under SRP049494 and SRP053213 for C. olitorius and
C. capsularis, respectively.
1.4 Genome assembly
We used different de novo assembly software to assess and assemble the jute genome
sequences. CLC Assembly Cell v3.2.2 (http://www.clcbio.com/products/clc-assembly-cell/)
was initially used to get an overview of the whole genome and assessment of the assembly to
control the quality and contamination of the raw data set. We used the entire Roche/454 data
with Newbler GS de novo assembler version 2.6.0 (http://my454.com/products/analysis-
software/index.asp) to construct an intermediate assembly. The data were then filtered against
the plastid genome of 179 plant species available in the NCBI organelle genome database
(ftp://ftp.ncbi.nlm.nih.gov/genomes/Chloroplasts/plastids/). Finally, we used CABOG version
7.0 (http://sourceforge.net/apps/mediawiki/wgs-assembler/index.php?title=Main_Page) to
construct the frozen assembly with the filtered Roche/454 sequencing reads.
All 454 data were converted from the native .sff' file format to CA.frg file format. We
used the CABOG tool sffToFrg to identify mated reads and remove duplicate mate pairs. The
remaining read sequence data were converted to fastq format, trimmed to a length of 65 bases
and used in the assembly. The CABOG pipeline was then run with default parameters using a
kmer value of 22, which was selected after testing a range of kmer settings. CABOG
overcomes the homopolymer-length uncertainty that is inherent 454 data and collapses
4
homopolymer repeats to single bases6.
The C. olitorius genome assembled into 22,944 scaffolds (N50 = 31, 3.29 Mb)
containing 47,661 contigs with a total size of 410.19 Mb, which covers about 91.57% of the
genome. The C. capsularis genome assembled into 6,125 scaffolds (N50 = 14, 4.13 Mb)
containing 19,261 contigs with a total size of 331.96 Mb, which covers about 82.15% of the
genome (Supplementary Table 2). Lower ratio of estimated and assembled genome for C.
capsularis was obtained compared to C. olitorius even though higher volume of data was
generated. The limitation of next-generation de novo sequencing and assembly of a complex
genome with high repeat contents may reduce assembly coverage7. Presence of 2.45% higher
repetitive elements in C. capsularis than C. olitorius is possibly accountable for lower
genome coverage.
1.5 Optical mapping and construction of super-scaffolds
Optical mapping is a single molecule system for the construction of ordered restriction
maps of whole genomes8 and is used to guide and validate sequence assemblies
9. Optical
mapping approach was used to generate KpnI restriction maps of the jute genomes (C.
olitorius and C. capsularis) and then assembled scaffolds into super-scaffolds.
High-quality DNA (high molecular weight, >200 kb) was prepared from fresh 4 days
old jute seedlings using the nuclei method10
. In this method, nuclei were first isolated by
physically grinding the tissues. The debris (other than nuclei) were removed by centrifugation
and washing. The purified nuclei were then embedded in an agarose matrix and DNA was
extracted from the agarose plug through lysis.
The Argus System and Whole Genome Mapping (WGM) software package (Genome-
Builder) was used to produce and process whole-genome shotgun single-molecule restriction
maps and to extend the scaffolds (OpGen Inc., MD, USA). DNA molecules were deposited
onto silane-derivatized glass surfaces in MapCards and digested with KpnI for 20 minutes
and subsequently stained with JOJO fluorescent dye (Invitrogen). Individual DNA molecules
and corresponding restriction fragments were imaged by laser-illuminated fluorescent
microscopy using the Argus Mapper. The restriction enzyme cut sites were detected as gaps
in DNA images, and the size of each restriction fragment between adjacent cut sites was
determined. The Mapper analyses the images channel by channel, filters out nonlinear
distorted fragments and small molecules, identifies gaps between fragments, and measures
5
size of retained high-quality fragments. In total, 11 and 9 high-density (HD) MapCards were
selected from all Argus generated MapCards for C. olitorius and C. capsularis, respectively
(Supplementary Table 3). For C. olitorius 360,906 single-molecule restriction maps (longer
than 250 kb) were generated using the KpnI restriction enzyme with an average size 356.37
kb whereas for C. capsularis it was 260,615 with an average size 356.99 kb (Supplementary
Table 4). The total size of the restriction map data was ~129 Gb for C. olitorius and ~93 Gb
for C. capsularis. These restriction maps cover about 97.21% and 82.13% of assembled
genome of C. olitorius and C. capsularis, respectively. Super-scaffolding with optical map
data was performed using Genome-Builder software (OpGen). It uses single-molecule maps
generated in Argus for extending sequence scaffolds, creating overlapping regions between
adjacent scaffolds and connecting the scaffolds based on pair-wise alignments between them.
The original scaffold sequences were first digested in silico to generate corresponding
restriction maps for each scaffold. Then, the in silico restriction maps were used as seeds to
identify single molecules by length-based alignment. These single-molecule maps were
assembled together to extend the scaffolds with consensus restriction maps. Meanwhile, the
scaffolds with low-coverage regions at both ends were trimmed, and only the high-quality
extensions remain.
To extend sufficient scaffolds, this alignment–assembly process was iterated four
times. All pairwise alignments were considered initial candidates for scaffold connections.
Super-scaffolds were constructed using the adjacent overlapping relationships between
scaffolds. Simultaneously, the orientations between each pair of scaffolds were determined.
In this way 134 scaffolds were joined into 100 super-scaffolds for C. olitorius resulted an
increase in average length form 2.42 Mb to 3.37 Mb. Similarly, for C. capsularis 114
scaffolds were joined into 63 super-scaffolds and the average length was increased from 2.22
Mb to 4.97 Mb (Supplementary Tables 5 and 6).
1.6 Anchoring genome assembly to linkage map
To anchor the scaffolds on linkage groups, the information from several linkage maps
published on Corchorus sp. were integrated11-15
by using ALLMAPS software16
. A total of
1,389 publicly available markers and optical map data were used for this analysis. The BLAT
software was used to align the markers of genetic map against the scaffolds with default
parameter. The markers were considered as anchored if they were uniquely aligned with
≥98% identity and ≥80% coverage.
6
All physical map data were converted to ‘bed’ file format and the optical map data
were also converted from the native XML file format to ‘bed’ format using ALLMAPS
converter. Then these two ‘bed’ files were merged. The ALLMAPS pipeline was run with
default parameter using merged ‘bed’ file and original scaffolds to order and orient the
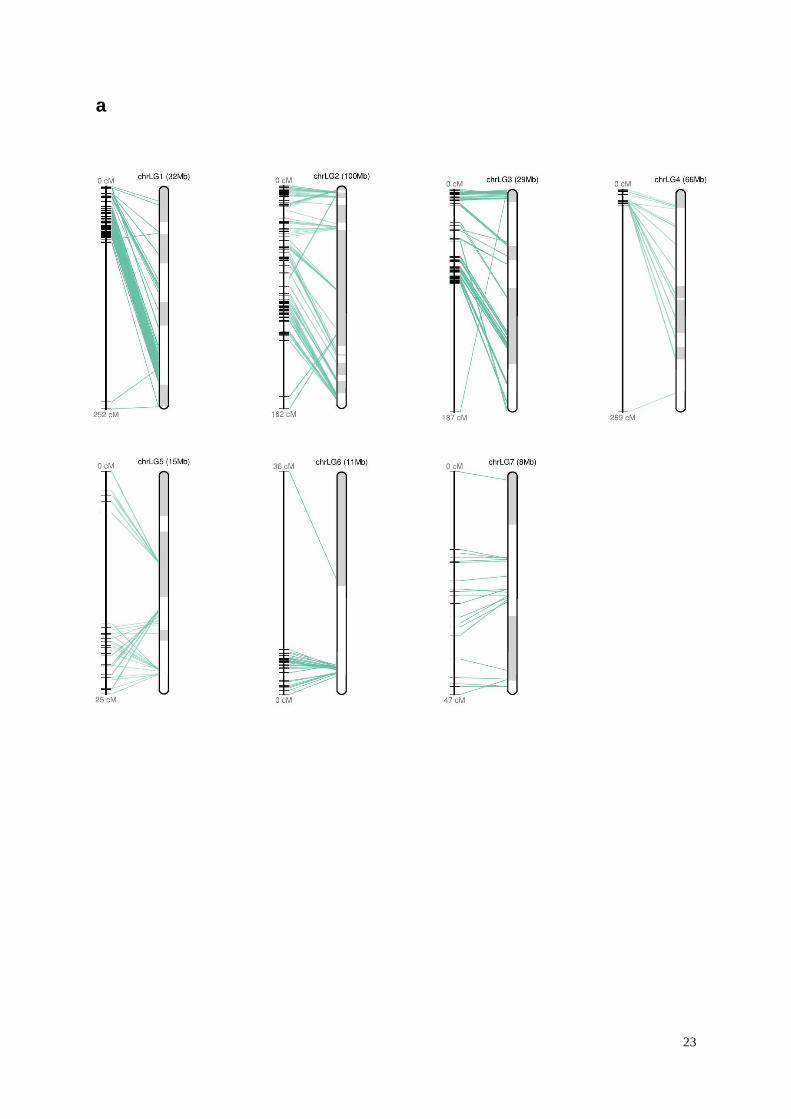
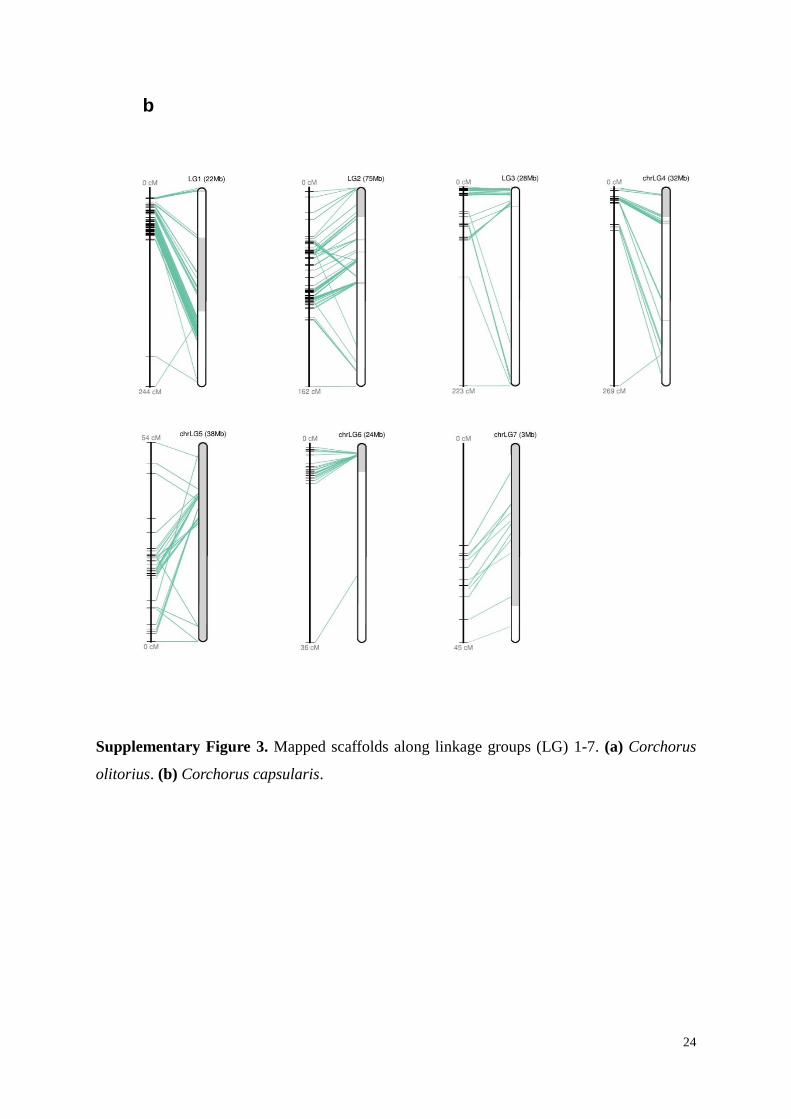
genomic scaffolds into chromosomes. In total, 86 and 79 scaffolds were anchored to the
genetic map through these markers for C. capsularis and C. olitorius, respectively
(Supplementary Fig. 3 and Supplementary Table 7). The resulting pseudo-chromosomes
representing seven linkage groups covered 221 Mb (65%) and 261 Mb (59%) of the total
assembled sequences for C. capsularis and C. olitorius, respectively.
1.7 Genome size estimation, coverage, and repeat analysis
The genome size was calculated using the total length of sequence reads divided by
sequencing depth as described17
. For C. olitorius, the raw reads were mapped onto the
410,194,799 bp assembled genome using 'clc_mapper' tool from CLC Assembly Cell package
v4.0.12. A total of 9,406,983,107 bases were mapped at different positions of the assembly
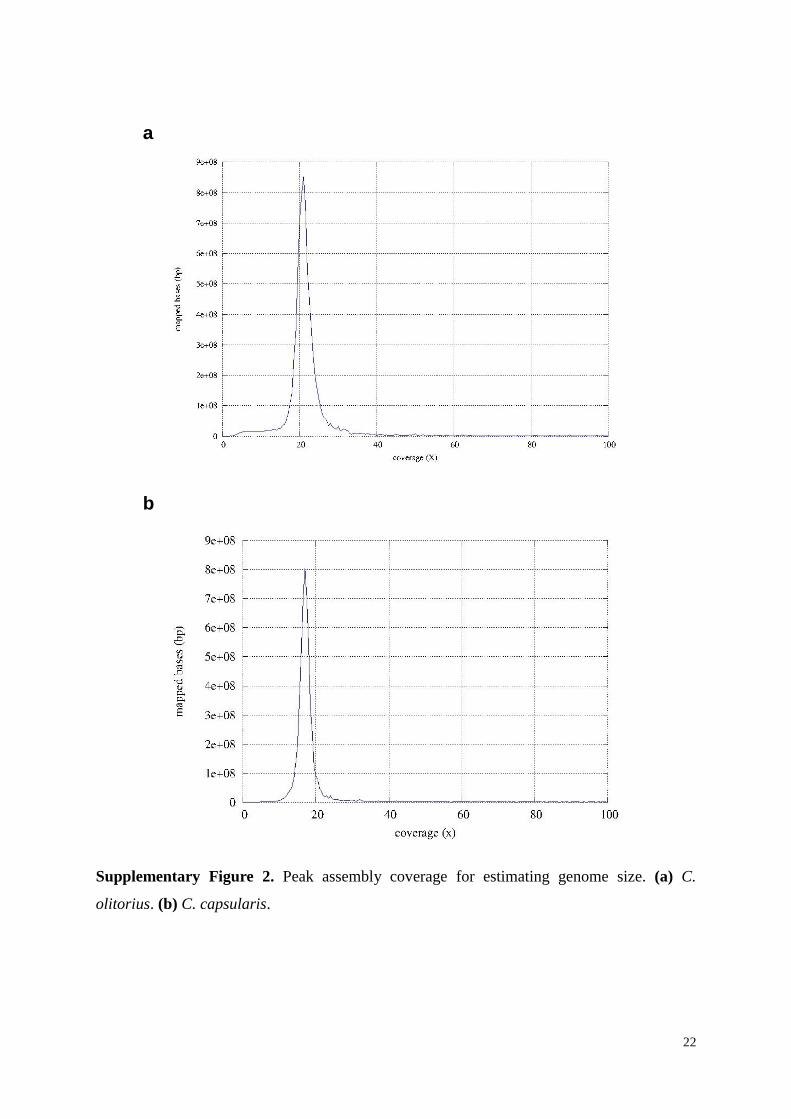
with a peak coverage of 21× (Supplementary Fig. 2a). The total mapped bases were divided
by this peak coverage of 21 (i.e., Genome size = Total Mapped Bases/Peak Coverage) to get a
genome size of 447,951,576 bp. The final assembly describes 91.57% of the C. olitorius
genome. The size of genomic repeats12
were estimated by only considering the bases that
mapped to the assembly at least more than one times than the peak coverage (21×). A total of
5,052,696,236 bases were mapped at this stringency. Dividing the mapped bases with the
peak coverage resulted to a repeat region of 240,604,583 bp (53.72%) of which, 205,057,356
bp (85.22%) were assembled and classified (Supplementary Tables 18 and 19). Therefore,
C. olitorius genome assembly describes 205,137,243 bp (45.79%) genic and 205,057,356 bp
(45.78%) non-genic/repeat region and the remaining 37,756,778 bp (8.43%) of unassembled
region contains 35,547,227 bp (7.94%) repeat and 2,209,602 bp (0.49%) genic region.
Similarly, for C. capsularis, the raw reads were mapped onto the 331,961,198 bp
assembled genome. A total of 6,869,513,473 bases were mapped at different positions of the
assembly with a peak coverage of 17× (Supplementary Fig. 2b). The total mapped bases
were divided by this peak coverage of 17 (i. e. Genome size = Total Mapped Bases/Peak
Coverage) to get a genome size of 404,089,641 bp. The final assembly describes 82.15% of
the C. capsularis genome. The size of genomic repeats12
were estimated by only considering
the bases that mapped to the assembly at least more than one times than the peak coverage
7
(17×). A total of 3,858,315,572 bases were mapped at this stringency. Dividing the mapped
bases with the peak coverage resulted to a repeat region of 226,959,740 bp (56.17%) of
which, 175,677,344 bp (77.40%) were assembled and classified (Supplementary Tables 18
and 19). Therefore, C. capsularis genome assembly describes 155,205,737 bp (38.41%) genic
and 175,677,344 bp (43.74%) non-genic/repeat region and the remaining 72,128,442 bp
(17.85%) of unassembled region contains 50,204,279 bp (12.42%) repeat and 21,924,163 bp
(5.43%) genic region.
1.8 Assessing genome assembly
The accuracy and completeness of the assemblies were assessed by independent
methods. By transcriptome sequences 43,420 C. olitorius isotigs and 36,023 C. capsularis
isotigs (see 2.3 Transcriptome sequencing) were obtained. Using BLAT software18
, we
found that 43,195 of the 43,420 isotigs (99.48%) from C. olitorius and 35,281 of the 36,023
isotigs (97.94%) from C. capsularis aligned to at least one WGS scaffold with 90% sequence
identity. When the isotigs were filtered by length, we observed that at least 90.52% and
85.56% of the isotigs with a minimum length of 100 bp aligned to the WGS scaffolds for C.
olitorius and C. capsularis, respectively, with 95% coverage of the isotigs length and 95%
sequence identity (Supplementary Tables 8 and 9). These results indicate an extremely low
proportion of misassemblies, at least in the gene-rich regions.
We also checked the relative completeness of the C. olitorius and C. capsularis
genome assemblies by performing core gene annotation using the CEGMA version 2.5
pipeline19
. The contigs as well as scaffolds from the assemblies were independently analysed
through this pipeline. In both of the cases we found that 242 (97.58%) and 243 (97.98%)
complete gene models out of the 248 ultra-conserved core eukaryotic genes (CEGs) are present
in the C. olitorius and C. capsularis genomes, respectively (Supplementary Table 10).
2. Gene annotation
2.1 Masking of the genomic sequences
Prior to gene prediction, special attention was given to annotate all transposable
element-related repeats that could give rise to gene models being purely transposable element
or gene structures erroneously joined with remnants of those transposable elements.
RepeatMasker was used for masking the pseudomolecules with the custom library (see 2.2
Identification of repetitive elements) of jute repeats. This masked genome sequence was
8
used for the annotation. No simple repeats, rRNA, tRNA, or microsatellites were masked.
The engine used for masking with RepeatMasker was WU-BLAST.
2.2 Identification of repetitive elements
A combination of homology-based and de novo methods were used to identify and
classify transposable elements20
in the C. olitorius and C. capsularis genomes. Homology-
based repetitive elements were predicted by using RepeatMasker Open-3.0
(http://www.repeatmasker.org/) with default parameters. De novo repeat families were
identified by RepeatModeler v1.0.7 (http://www.repeatmasker.org/), a program that performs
complementary computational methods for identifying repeat element boundaries and family
relationships to build, refine, and classify consensus models of putative interspersed repeats.
For C. olitorius, we estimated 240.61 Mb of repeat sequences, of which 205.06 Mb were
assembled and 35.55 Mb were un-assembled in the current assembly version. Similarly, for
C. capsularis, we estimated 226.96 Mb of repeat sequences, of which 175.68 Mb were
assembled and 51.28 Mb were un-assembled in the current assembly version.
Members of each type were searched (BLASTN and BLASTX) against RepBase14.01
(http://www.girinst.org), the NCBI and the Uniprot database to identify their class, order and
superfamily assignments20
. Retrotransposons represented one-fourth (25.96% in C. olitorius
and 26.32% in C. capsularis) of the genomes, of which long terminal repeats (LTR) were the
most abundant transposable element class (23.08% in C. olitorius and 22.78% in C.
capsularis) followed by long interspersed elements (LINEs) (2.81% in C. olitorius and 3.46%
in C. capsularis). Among the LTR, Gypsy-type elements were the highest in both genomes
(5.79% in C. olitorius and 5.64% in C. capsularis) followed by Copia-type elements. DNA
transposable elements comprise 3.06% of C. olitorius and 4.01% of C. capsularis genome.
About 40% of the predicted repetitive elements could not be associated with any known
families.
2.3 Transcriptome sequencing
In order to provide extrinsic evidence for the identification of genes, we sequenced the
transcriptomes of C. olitorius and C. capsularis seedlings. The seedlings were prepared as
described in section 1.1 Plant Sample. Total RNA was extracted from the seedlings as
previously described21
. Briefly, 1 gm of seedling was ground to powder with liquid nitrogen
and added to 10 ml guanidine thiocyanate (GNTC) buffer (4 M guanidine thiocyanate, 25
9
mM sodium citrate, 0.5% sodium lauryl sarcosinate pH 7.0 and volumed with DEPC treated
water) with subsequent addition of 0.1 vol. of 2 M sodium acetate, pH 4.0; 1 vol. of DEPC-
phenol; and 0.3 vol. of chloroform: iso-amyl alcohol (24:1). The mixture was incubated for
20 minutes on ice and centrifuged at 10,000 rpm for 30 minutes at 4°C. The supernatant was
collected from the upper aqueous phase and RNA was precipitated with 1 vol. of isopropanol
and 0.1 vol. 3 M sodium acetate (pH-5.2). RNA was pelleted at 10,000 rpm for 30 minutes at
4°C, washed twice with 75% ethanol, and resuspended in DEPC water.
cDNA was produced according to the SMART cDNA PCR synthesis kit (Clontech).
Library normalization was performed to increase rare gene discovery. The cDNA library was
normalized according to the protocol described in the Trimmer Direct Kit (Evrogen, Russia).
In brief, 300 ng of cDNA were incubated at 95°C for 5 minutes followed by incubation at
68°C for 4 hours in the hybridization buffer included in the kit (50 mM HEPES, pH 7.5 and
0.5 M NaCl). After the incubation, the reaction was treated with ¼ units of duplex specific
nuclease (DSN). The normalized cDNA was then amplified from 1 µl of DSN-treated cDNA
by PCR reactions (12 cycles) described above and gel purified for the fragment size of 400-
1,000 bp on a 2% agarose Ex-GEL (Invitrogen, CA). Normalized cDNA was quantitated on a
Qubit (Invitrogen) and the average size was determined on a Bioanalyzer chip (Agilent).
Sequencing libraries were produced following the 454 Titanium Rapid Library
Preparation protocol instructions. Sequencing resulted in 1.81 Gb and 1.86 Gb of data
generated from C. olitorius and C. capsularis seedlings, respectively (Supplementary Table
1). The genomic and transcriptomic raw data have been deposited in the NCBI Sequence
Read Archive (SRA) under SRP049494 and SRP053213 for C. olitorius and C. capsularis,
respectively.
Raw reads were assembled using Newbler GS de novo assembler version 2.6.0
(http://my454.com/products/analysis-software/index.asp) with the default parameters. This
resulted in 43,420 isotigs for C. olitorius and 36,023 isotigs for C. capsularis
(Supplementary Table 8).
2.4 De novo gene prediction
Gene prediction was performed using a combination of three approaches, homology,
de novo, and transcript-based. We used PASA2 r2013060522
(Program to Assemble Spliced
Alignments, a eukaryotic genome annotation pipeline) with our assembled genome and
10
transcriptome to generate potential training candidate gene sets that were used to train ab
initio gene prediction software Augustus v2.5.523
for predicting C. olitorius and C. capsularis
genes. A total of 19,849 gene assemblies under 14,391 gene clusters for C. olitorius and
15,391 gene assemblies under 12,446 gene clusters for C. capsularis were predicted by
PASA. We also used Geneid v1.224
(Vitis as reference genome) for gene prediction.
Independently predicted ORFs by Augustus (49,507 for C. olitorius and 44,294 for C.
capsularis) and Geneid (77,426 for C. olitorius and 39,115 for C. capsularis), were finalised
through gene structure annotation by EVidenceModeler Version r2012-06-25 (EVM)25
. EVM,
when combined with PASA, yields a comprehensive, configurable annotation system that
predicts protein-coding genes and alternatively spliced isoforms.We also used Analysis and
Annotation Tool (AAT) r0305201126
as a pipeline for transcript and protein alignments. For
transcript alignment we used the C. olitorius and C. capsularis cDNA data and for protein
alignment we used NCBI reference sequence plant proteins data. The AAT alignments along
with the PASA transcript alignments were used as transcript and protein evidences for EVM.
Finally, a total of 37,031 genes were predicted for C. olitorius, of which 21,706 gene
structures were finalised by EVM and 15,325 genes were predicted by Augustus and Geneid
underlying the intergenic region of EVM predictions. Similarly, for C. capsularis, 30,096
genes were predicted, of which 18,463 gene structures were finalised by EVM and 11,633
genes were predicted by Augustus and Geneid underlying the intergenic region of EVM
predictions (Supplementary Table 12).
Among the predicted genes, 75% were supported by all of the de novo, homology, and
transcriptome-based approaches; whereas 13% genes were supported by any two and 12%
genes were supported by at least one of the three approaches for both the genomes. Though
gene density is similar for both the genomes, the difference between the numbers of predicted
genes for the two species is 6,935. Difference in genome size (~44Mb) and assembled
genome (9.4%) are possibly accountable for gene number difference.
Transfer RNA-coding regions were predicted using tRNAscan-SE v1.2327
and rRNAs
were predicted using RNAmmer v1.228
. MicroRNAs (miRNAs) were predicted by
performing a BLAST of plant miRNA sequences from the miRNA database (miRBase release
13.0) against the C. olitorius and C. capsularis genomes. Hits with no more than one
mismatch from a query were expanded to 150 nt upstream and 150 nt downstream and
examined by MIRcheck29
.
11
2.5 Functional annotation of protein coding genes
InterProScan30
and BLAST against the NCBI nr database (threshold value of E < 10-
5)31
were used for searching functional domains and homologies from the predicted genes.
InterProScan determined motifs and domains of genes against protein databases including
Pfam, PRINTS, PROSITE, ProDom, and SMART. The predicted sequences were searched
against TrEMBL and SwissProt32
, protein domain databanks and specific plant protein
databases annotated with GO terms33
, using BLAST. Most of the predicted genes (86.83% for
C. olitorius and 82.06% for C. capsularis) have hits in Swiss-Prot databases which is
annotated subset of UniProt. Approximately three-fourth of the predicted genes (78.19% from
C. olitorius and 76.83% from C. capsularis) has a homologous sequence in the InterPro
Knowledgebase. Similarly, 82.61% and 78.64% genes from C. olitorius and C. capsularis,
respectively, have homology with the TrEMBL database. In summary, 90.72% and 83.88%
genes from C. olitorius and C. capsularis, respectively, have either known homologs or can
be functionally classified with the TreEMBL, SwissProt, and InterPro databases. Overall,
84.31% (31,232 of 37,031) and 86.91% (26,157 of 30,096) of predicted protein coding genes
from the C. olitorius and C. capsularis, respectively, were supported by transcriptome
sequencing data, which showed the high accuracy of gene predictions in both genomes.
3. Genome comparison and evolution
3.1 Comparison of gene families
We used OrthoMCL v2.0.534
to define gene family clusters among representatives
from the Malvids (C. olitorius, C. capsularis, Theobroma cacao, Gossypium raimondii, and
Arabidopsis thaliana), Fabids (Ricinus communis, Linum usitatissimum, Medicago
truncatula, Glycine max, Fragaria vesca, and Populus trichocarpa), Asterids (Solanum
lycopersicum and Solanum tuberosum), Vitales (Vitis vinifera), and Monocots (Oryza sativa).
The input datasets from these plant species are listed in Supplementary Table 20. Pairwise
sequence similarities between all input protein sequences were calculated using BLASTP
with an e-value cut-off of 1e-05. On the resulting similarity matrix, OrthoMCL performed a
Markov clustering algorithm to define the cluster structure. Splice variants were removed
from the data set (the longest protein sequence prediction was kept) and data sets were
filtered for internal stop codons and incompatible reading frames.
We found that a core gene set of 8,177 clusters with 225,005 genes were common to
12
all five groups, while 8,816 clusters with 29,029 genes were unique to the Malvids. Among
the Malvid-specific gene families, 2,393 (~80%) for C. olitorius and 2,247 (~94%) for C.
capsularis were shared with at least one other Malvid species and 613 (~20%) and 152 (~6%)
gene families appear to be unique to C. olitorius and C. capsularis, respectively. The 613 C.
olitorius -specific gene families comprise 2,078 genes. Of these, 1,194 genes had InterPro
domains (Supplementary Table 21), and 831 genes were hypothetical proteins. The 152 C.
capsularis-specific gene families comprise 395 genes. Of these, 191 genes had InterPro
domains (Supplementary Table 22), and 186 genes were hypothetical proteins.
3.2 Phylogenetic analysis
Orthologous relationships were determined for a 15-way clustering from the complete
genomes of Arabidopsis thaliana, Theobroma cacao, Gossypium raimondii, Corchorus
olitorius, Corchorus capsularis, Glycine max, Populus trichocarpa, Ricinus communis,
Fragaria vesca, Linum usitatissimum, Medicago truncatula, Vitis vinifera, Solanum
lycopersicum, Solanum tuberosum, and Oryza sativa. All predicted protein sequences for the
genomes of these plants were searched against each other using BLASTP and clustered into
orthologous groups using MCL-10-201. Single-copy orthologs were identified as the clusters
with exactly one member per species. Phylogenetic relationships were determined from 13
single-copy orthologs and were aligned with MAFFT v6.87535
. Alignments were pruned with
Gblocks 0.91b36
. The evolutionary history was inferred by using the Maximum Likelihood
method based on the JTT matrix based model37
and bootstrap value was 1,000. Evolutionary
analyses were conducted in MEGA538
.
3.3 Genome synteny and gene duplication analysis
For each species, all-against-all protein sequence similarity searches using BLASTP
(e value ≤ 10−5) were performed to detect paralogous genes in C. olitorius and C. capsularis.
Sequences aligned with at least 100 amino acids having at least 40% identity were defined as
pairs of paralogs. We identified 16,716 and 12,909 paralogous genes for C. olitorius and C.
capsularis, respectively. For each paralogous gene family, the Ks of each pair were calculated
using the PAML package39
. We used average substitution rate (r) of 1.5 × 10⁻⁸
substitutions/synonymous site/year for all dicots40
. The time (T) since gene insertion was then
estimated using the formula T = Ks /r.41
Paralogous genes were determined to be tandem
13
duplicates if they were located within five genes from each other42
. The genomes of C.
olitorius and C. capsularis were compared (intra and inter-genomic comparisons) using
SyMAP v4.043
tools to identify and visualize the regions of synteny.
3.4 Genome speciation event deduced from orthologous pairs
To identify putative orthologs between C. capsularis and C. olitorius, the genes from
C. capsularis and C. olitorius were aligned using the reciprocal best hit method (BLASTP)
with an e-value ≤ 10−5. Two genes were defined as orthologs if each of them was the best hit
of the other and if the sequences were aligned over 100 amino acids. We identified 14,465
orthologous gene pairs. We used OrthoMCL to detect gene families and for each orthologous
gene family, the Ks of each pair were calculated using the PAML package. Orthologs with Ks
> 0.1 were excluded to avoid paralogs44
.
4. Metabolic pathway reconstruction
Metabolic pathways of jute were reconstructed with Pathway Studio software based
on the Resnet-Plant 4.0 database and Metabolic Pathway Databases (MPW)45
. The Resnet-
Plant 4.0 database (Ariadne Genomics) contains a group of pathway analysis databases that
represent different sets of pre-compiled information on biological relationships and
associations extracted by MedScan from the literature. Resnet-Plant 4.0 database also
contains a collection of 540 metabolic pathways imported from AraCyc 10.0. Proteins in the
Resnet-Plant 4.0 database are annotated with Entrez Gene and GenBank identifiers from 10
plant genomes: Arabidopsis thaliana, Oryza sativa, Zea mays, Solanum tuberosum, Sorghum
bicolor, Glycine max, Solanum lycopersicum, Triticum aestivum, Nicotiana tabacum, and
Hordeum vulgare. To facilitate analysis of the jute genome, we added annotated proteins from
the sequenced genomes of Ricinus communis46
and Populus trichocarpa47
to the Resnet-Plant
4.0 database.
The database of jute interologs (predicted interactions) was created and pathways
were reconstructed by annotating proteins in the Resnet-Plant 4.0 database with jute ortholog
identifiers. Orthologs for jute proteins in other plant species were identified using the best
reciprocal hit method from full length protein sequence similarities as described previously48
.
Pathways containing jute orthologs were extracted from Resnet-Plant 4.0 database and
imported into a new database for manual pathway reconstruction and genome analysis.
14
Pathways that contained at least one functional class with no jute orthologs were manually
curated to achieve one of the following three outcomes: a) close the gap by finding members
in the jute genome and adding them to empty functional classes, b) dismiss entire pathway if
gap cannot be closed, or c) remove enzymatic step if empty functional class represents
redundant path in the pathway.
5. Fibre cell transcriptome sequencing
5.1 Sample preparation
Seeds of C. olitorius var. O-4 and C. capsularis var. CVL-1 were sown in the field
(Jute Agricultural Experiment Station, Manikganj, Bangladesh). To investigate the genes that
contribute to the unique properties of jute bast fibres, we extracted RNA from ultimate fibres
(i.e., individual cells) dissected from 45 days old plants (average height 110 cm). A 10 cm
section of the stem, located 5 to 7 cm below the top of the plant, was collected
(Supplementary Fig. 9). This section is the stem region in which secondary wall deposition
begins49
. The bark was mechanically separated from the stem. Green epidermal layers were
removed from the bark by gentle rubbing with a spatula. Immediately after rubbing, the fibre
strip was fixed in liquid nitrogen. Fixed fibre strips were lyophilized for 2 hours. After
lyophilization, the fibre strip was washed in 80% ethanol then it was pressed by pestle in
mortar at least 3-4 times until the individual fibre threads were separated. The mass of
individual fibre threads were again washed in 80% ethanol with vigorous shaking in a glass
bottle. Finally, the fibre threads were washed and examined under light microscope to ensure
the isolated fibre cells were free from other cells.
Preparations of seedlings for RNA isolation are described in section 1.1 Plant
sample.
Total RNA was extracted as previously described21
. Briefly, 1 gm of fibre cells or
seedlings was ground to powder with liquid nitrogen and added to 10 ml guanidine
thiocyanate (GNTC) buffer (4 M guanidine thiocyanate, 25 mM sodium citrate, 0.5% sodium
lauryl sarcosinate pH 7.0 and volumed with DEPC treated water) with subsequent addition of
0.1 vol. of 2 M sodium acetate, pH 4.0; 1 vol. of DEPC-phenol, and 0.3 vol. of chloroform:
iso-amyl alcohol (24:1). The mixture was incubated for 20 minutes on ice and centrifuged at
10,000 rpm for 30 minutes at 4°C. The supernatant was collected from the upper aqueous
phase and RNA was precipitated with 1 vol. of isopropanol and 0.1 vol. 3 M sodium acetate
15
(pH 5.2). RNA was pelleted at 10,000 rpm for 30 minutes at 4°C, washed twice with 75%
ethanol, and resuspended in DEPC water.
5.2 Illumina sequencing
Total RNA were subjected to library preparation using the TruSeq Stranded mRNA
LT - Set A kit (Illumina RS-122-2101) following the manufacturer’s instructions. After
library construction, libraries were QCed for concentration and library size using Invitrogen’s
QuBit assay and Agilent’s bioanalyzer. Optimal loading concentration was then determined
by qPCR using KAPA reagents. Libraries were normalized for concentration, pooled, and
run on an Illumina HiSeq 2500 instrument. Three independent biological replica samples
from seedlings and pooled fibre cells of the same age and stage were sequenced.
Additionally, three independent biological replica samples from seedlings before bolting and
young stem were also sequenced to verify the expression pattern of cellulose and lignin
biosynthesis related genes (Supplementary Table 28a and 28b). The number of replicates
and high sequence depth were sufficient to account for sample variations and detect a large
proportion of genes50
. RNA-seq data were deposited in the NCBI Sequence Read Archive
(SRA) under SRP049494 and SRP053213 for C. olitorius and C. capsularis, respectively.
5.3 Mapping and differentially expressed genes (DEGs) analysis
The raw reads obtained from the Illumina HiSeq 2500 were filtered with fastq-mcf v.
1.04.803 (https://code.google.com/p/ea-utils/wiki/FastqMcf) and further checked for
sequence contaminants with the fastQC v0.11.2 application. Filtered RNA-seq reads were
mapped to the jute genome sequences using TopHat v2.0.8b51
(Supplementary Table 29a
and 29b). After mapping, for each gene model (C. olitorius and C. capsularis) in jute
annotation, Cufflinks v2.2.1 assembled transcripts and quantified transcript abundance in
terms of fragments per kilobase of exon per million mapped fragments (FPKM)52
. Both
TopHat and Cufflinks analyses were carried out in default modes. The Cuffdiff v2.2.152
program within Cufflinks was used to test for statistically significant differences in transcript
expression between the fibre cells and seedlings. Differentially expressed genes (DEGs) were
identified using the following two criteria: (i) absolute fold-change >2 and (ii) q-value (false
discovery rate (FDR)) < 0.05. Heatmaps of DEGs were generated and visualized by R
libraries. CummeRbund v2.7.2 was used for Volcano plots. The variability between the
16
biological replicates was assessed by CummeRbund, which indicated a higher degree of
variation among the fibre cell samples than the seedlings. Gene ontology (GO) annotations of
reference jute genes were performed to retrieve molecular function, biological process, and
cellular component terms using Blast2GO 3.3 (http://www.blast2go.org/)53
. KOBAS54
was
used to identify the pathways in C. olitorius and C. capsularis genome using model organism
Arabidopsis thaliana. KEGG (Release 74.0) and Biocyc version 19.0 pathways were used to
run R package piano v1.8.0 GSA55
. Pathways in distinct-direction were selected for
subsequent analysis based on adjusted p value < 0.05.
5.4 Real-time RT–PCR experiment and analysis
The differential gene expression from the in silico analysis were validated by RT-qPCR with
several fibre biosynthesis pathway genes. The gene-specific primers were designed using
Primer3 (v4.0.0) software (Supplementary Table 42). First-strand cDNA was synthesised
from 1 μg of total RNA isolated from the fibre cell and seedlings RNA, using RevertAid First
Strand cDNA Synthesis kit (Thermo FisherScientific, USA) according to manufacturer's
protocol. qPCR was carried out in 96-well plates with a LightCycler®480 II, Roche,
Germany. Each reaction contained cDNA (2 μL), gene-specific primers (0.5 μL, 10 μmol
L−1) and 2× SYBR Green Master Mix (10 μL) in a final volume of 20 μL. Amplification
conditions were as follows: 95 °C for 5 min, followed by 45 cycles of 95 °C for 10 s, primer-
specefic temperature (see Supplementary Table 42) for 20s and 72 °C for 20s. All
experiments were performed for three times for each sample and relative gene expression
levels were calculated using the 2−ΔΔCT method56
. Jute actin gene was used as reference
genes to normalize the total amount of cDNA in each reaction.
17
References
1. Mahtabuddin, M. Jute breeding in Bangladesh. Proceedings of the First National Symposium on
Plant Breeding in Bangladesh, Plant Breeding and Genetics Society of Bangladesh, Dhaka p. 97-
107 (1990).
2. Liu, Y.G. & Whittier, R.F. Rapid preparation of megabase plant DNA from nuclei in agarose
plugs and microbeads. Nucleic Acids Res. 22, 2168-2169 (1994).
3. Margulies, M. et al. Genome sequencing in microfabricated high-density picolitre reactors.
Nature 437, 376-380 (2005).
4. Wiley, G. et al. Methods for generating shotgun and mixed shotgun/paired-end libraries for the
454 DNA sequencer. Curr. Protoc. Hum. Genet. Chapter 18, Unit 18.1 (2009).
5. Roe, B.A. Shotgun library construction for DNA sequencing. Methods Mol Biol 255, 171-187
(2004).
6. Miller, J.R. et al. Aggressive assembly of pyrosequencing reads with mates. Bioinformatics 24,
2818-2824 (2008).
7. Treangen, T.J. & Salzberg, S.L. Repetitive DNA and next-generation sequencing: computational
challenges and solutions. Nat Rev Genet 13, 36-46 (2012).
8. Lin, J. et al. Whole-genome shotgun optical mapping of Deinococcus radiodurans. Science 285,
1558-1562 (1999).
9. Zhou, S. et al. Validation of rice genome sequence by optical mapping. BMC Genomics 8, 278
(2007).
10. Zhang, M. et al. Preparation of megabase-sized DNA from a variety of organisms using the nuclei
method for advanced genomics research. Nat. Protoc. 7, 467-478 (2012).
11. Joshi, A. et al. Chromosome-specific physical localisation of expressed sequence tag loci in
Corchorus olitorius L. Plant Biol. 16, 1133-1139 (2014).
12. Topdar, N. et al. A complete genetic linkage map and QTL analyses for bast fibre quality traits,
yield and yield components in jute (Corchorus olitorius L.). Cytol. Genet. 47, 129-137 (2013).
13. Das, M. et al. Development of SSR markers and construction of a linkage map in jute. J. Genet.
91, 21-31 (2012).
14. Biswas, C., Dey, P., Karmakar, P.G. & Satpathy S. Discovery of large-scale SNP markers and
construction of linkage map in a RIL population of jute (Corchorus capsularis). Mol Breed. 35,
119 (2015).
15. Kundu A. et al. A restriction-site-associated DNA (RAD) linkage map, comparative genomics and
identification of QTL for histological fibre content coincident with those for retted bast fibre yield
and its major components in jute (Corchorus olitorius L., Malvaceae s. l.). Mol Breed. 35, 119
(2015).
16. Tang, H. et al. ALLMAPS: robust scaffold ordering based on multiple maps. Genome Biol 16,
(2015).
18
17. Velasco, R. et al. The genome of the domesticated apple (Malus x domestica Borkh.). Nat. Genet.
42, 833-841 (2010).
18. Kent, W.J. BLAT-the BLAST-like alignment tool. Genome Res. 12, 656-664 (2002).
19. Parra, G., Bradnam, K. & Korf, I. CEGMA: a pipeline to accurately annotate core genes in
eukaryotic genomes. Bioinformatics 23, 1061-1067 (2007).
20. Wicker, T. et al. A unified classification system for eukaryotic transposable elements. Nat. Rev.
Genet. 8, 973-982 (2007).
21. Chomczynski, P. & Sacchi, N. The single-step method of RNA isolation by acid guanidinium
thiocyanate-phenol-chloroform extraction: twenty-something years on. Nat. Protoc. 1, 581-585
(2006).
22. Haas, B.J. et al. Improving the Arabidopsis genome annotation using maximal transcript
alignment assemblies. Nucleic Acids Res. 31, 5654-5666 (2003).
23. Stanke, M. & Waack, S. Gene prediction with a hidden Markov model and a new intron
submodel. Bioinformatics 19, 215-225 (2003).
24. Blanco, E., Parra, G. & Guigó, R. Using geneid to identify genes. Curr. Protoc. Bioinformatics
Chapter 4, Unit 4.3 (2007).
25. Haas, B.J et al. Automated eukaryotic gene structure annotation using EVidenceModeler and the
Program to Assemble Spliced Alignments. Genome Biol. 9, R7 (2008).
26. Huang, X., Adams, M.D., Zhou, H. & Kerlavage, A.R. A tool for analyzing and annotating
genomic sequences. Genomics 46, 37-45 (1997).
27. Lowe, T.M. & Eddy, S.R. tRNAscan-SE: a program for improved detection of transfer RNA
genes in genomic sequence. Nucleic Acids Res. 25, 955-964 (1997).
28. Lagesen, K. et al. RNAmmer: consistent and rapid annotation of ribosomal RNA genes. Nucleic
Acids Res. 35, 3100-3108 (2007).
29. Jones-Rhoades, M.W. & Bartel, D.P. Computational identification of plant microRNAs and their
targets, including a stress-induced miRNA. Mol. Cell 14, 787-799 (2004).
30. Zdobnov, E.M. & Apweiler, R. InterProScan - an integration platform for the signature-
recognition methods in InterPro. Bioinformatics 17, 847-848 (2001).
31. Altschul, S.F., Gish, W., Miller, W., Myers, E.W. & Lipman, D.J. Basic local alignment search
tool. J. Mol. Biol. 215, 403-410 (1990).
32. Bairoch, A. & Apweiler, R. The SWISS-PROT protein sequence database and its supplement
TrEMBL in 2000. Nucleic Acids Res. 28, 45-48 (2000).
33. Ashburner, M. et al. Gene Ontology: tool for the unification of biology. Nat. Genet. 25, 25-29
(2000).
34. Li, L., Stoeckert, C.J. & Roos, D.S. OrthoMCL: identification of ortholog groups for eukaryotic
genomes. Genome Res. 13, 2178-2189 (2003).
19
35. Katoh, K. & Toh, H. Improved accuracy of multiple ncRNA alignment by incorporating structural
information into a MAFFT-based framework. BMC Bioinformatics 9, 212 (2008).
36. Castresana, J. Selection of conserved blocks from multiple alignments for their use in
phylogenetic analysis. Mol. Biol. Evol. 17, 540-552 (2010).
37. Jones, D.T., Taylor, W.R. & Thornton, J.M. The rapid generation of mutation data matrices from
protein sequences. Comput. Appl. Biosci. 8, 275-282 (1992).
38. Tamura, K. et al. MEGA5: molecular evolutionary genetics analysis using maximum likelihood,
evolutionary distance, and maximum parsimony methods. Mol. Biol. Evol. 28, 2731-2739 (2011).
39. Yang, Z. PAML 4: phylogenetic analysis by maximum likelihood. Mol. Biol. Evol. 24, 1586-1591
(2007).
40. Koch, M.A., Haubold., B. & Mitchell-Olds, T. Comparative evolutionary analysis of chalcone
synthase and alcohol dehydrogenase loci in Arabidopsis, Arabis, and related genera
(Brassicaceae). Mol. Biol. Evol. 17, 1483-1498 (2000).
41. Argout, X. et al. The genome of Theobroma cacao. Nat. Genet. 43, 101-108 (2011).
42. Myburg, A.A. et al. The genome of Eucalyptus grandis. Nature 510, 356-362 (2014).
43. Soderlund, C., Bomhoff, M. & Nelson, W. SyMAP v3.4: a turnkey synteny system with
application to plant genomes. Nucleic Acids Res. 39, e68 (2011).
44. Bustamante, C.D. et al. Natural selection on protein-coding genes in the human genome. Nature
437, 1153-1157 (2005).
45. Selkov, E.Jr., Grechkin, Y., Mikhailova, N. & Selkov, E. MPW: the metabolic pathways database.
Nucleic Acids Res. 26, 43-45 (1998).
46. Chan, AP. et al. Draft genome sequence of the oilseed species Ricinus communis. Nature
Biotechnol. 28, 951-959 (2010).
47. Tuskan, G.A. et al. The genome of black cottonwood, Populus trichocarpa (Torr. & Gray).
Science 313, 1596-1604 (2006).
48. Ispolatov, I, Yuryev, A., Mazo, I. & Maslov, S. Binding properties and evolution of homodimers in
protein–protein interaction networks. Nucleic Acid Res. 33, 3629-3635 (2005).
49. Gorshkova, T.A. et al. The snap point: a transition point in Linum usitatissimum bast fiber
development. Ind. Crop. Prod. 18, 213-221 (2003).
50. Liu, Y., Zhou, J. & White, K.P. RNA-seq differential expression studies: more sequence or more
replication? Bioinformatics 30, 301-304 (2014).
51. Trapnell, C., Pachter, L. & Salzberg, S. L. TopHat: discovering splice junctions with RNA-Seq.
Bioinformatics 25, 1105-1111 (2009).
52. Trapnell, C. et al. Differential gene and transcript expression analysis of RNA-seq experiments
with TopHat and Cufflinks. Nat. Protoc. 7, 562-578 (2012).
53. Conesa, A. et al. Blast2GO: a universal tool for annotation, visualization and analysis in
functional genomics research. Bioinformatics 21, 3674-3676 (2005).

20
54. Xie, C. et al. KOBAS 2.0: a web server for annotation and identification of enriched pathways
and diseases. Nucleic Acids Res. 39, W316-W322 (2011).
55. Väremo, L., Nielsen, J. & Nookaew, I. Enriching the gene set analysis of genome-wide data by
incorporating directionality of gene expression and combining statistical hypotheses and methods.
Nucleic Acids Res. 41, 4378-4391 (2013).
56. Livak, K. J. & Schmittgen, T. D. Analysis of relative gene expression data using real-time
quantitative PCR and the 2(-Delta Delta C(T)) Method. Methods 25, 402-408 (2001).
21
SUPPLEMENTARY FIGURES
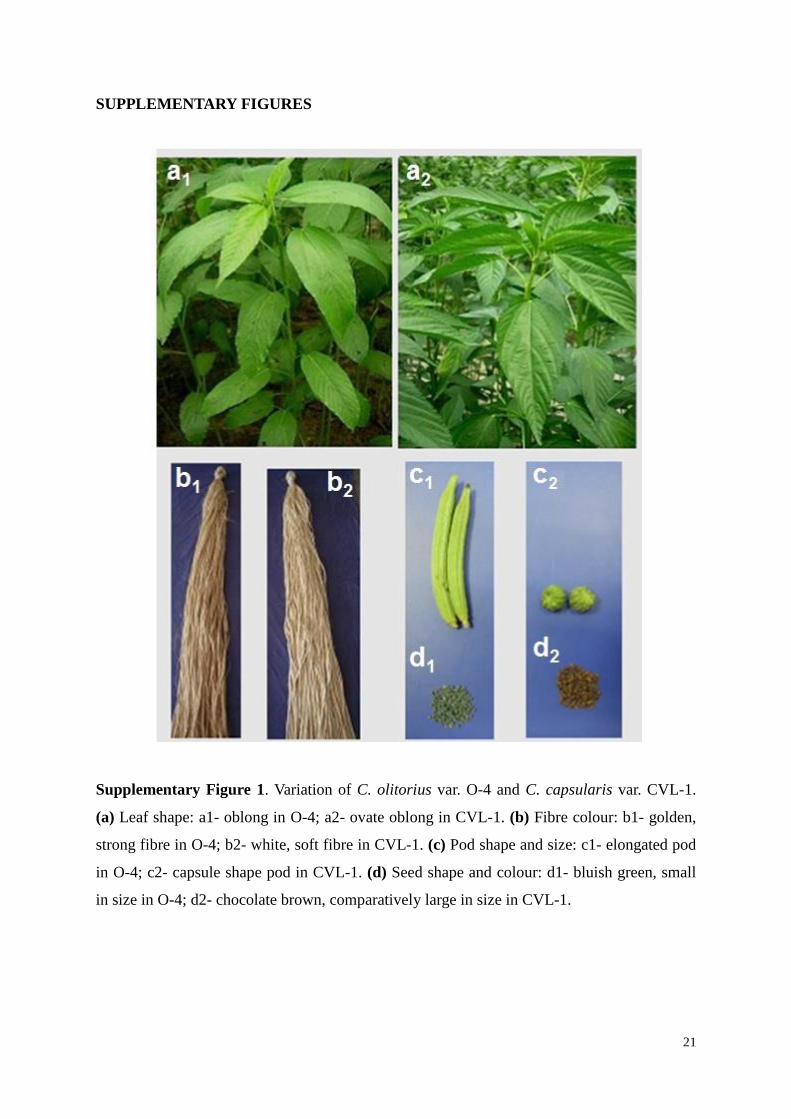
Supplementary Figure 1. Variation of C. olitorius var. O-4 and C. capsularis var. CVL-1.
(a) Leaf shape: a1- oblong in O-4; a2- ovate oblong in CVL-1. (b) Fibre colour: b1- golden,
strong fibre in O-4; b2- white, soft fibre in CVL-1. (c) Pod shape and size: c1- elongated pod
in O-4; c2- capsule shape pod in CVL-1. (d) Seed shape and colour: d1- bluish green, small
in size in O-4; d2- chocolate brown, comparatively large in size in CVL-1.
22
a
b
Supplementary Figure 2. Peak assembly coverage for estimating genome size. (a) C.
olitorius. (b) C. capsularis.
23
a
24
b
Supplementary Figure 3. Mapped scaffolds along linkage groups (LG) 1-7. (a) Corchorus
olitorius. (b) Corchorus capsularis.
25
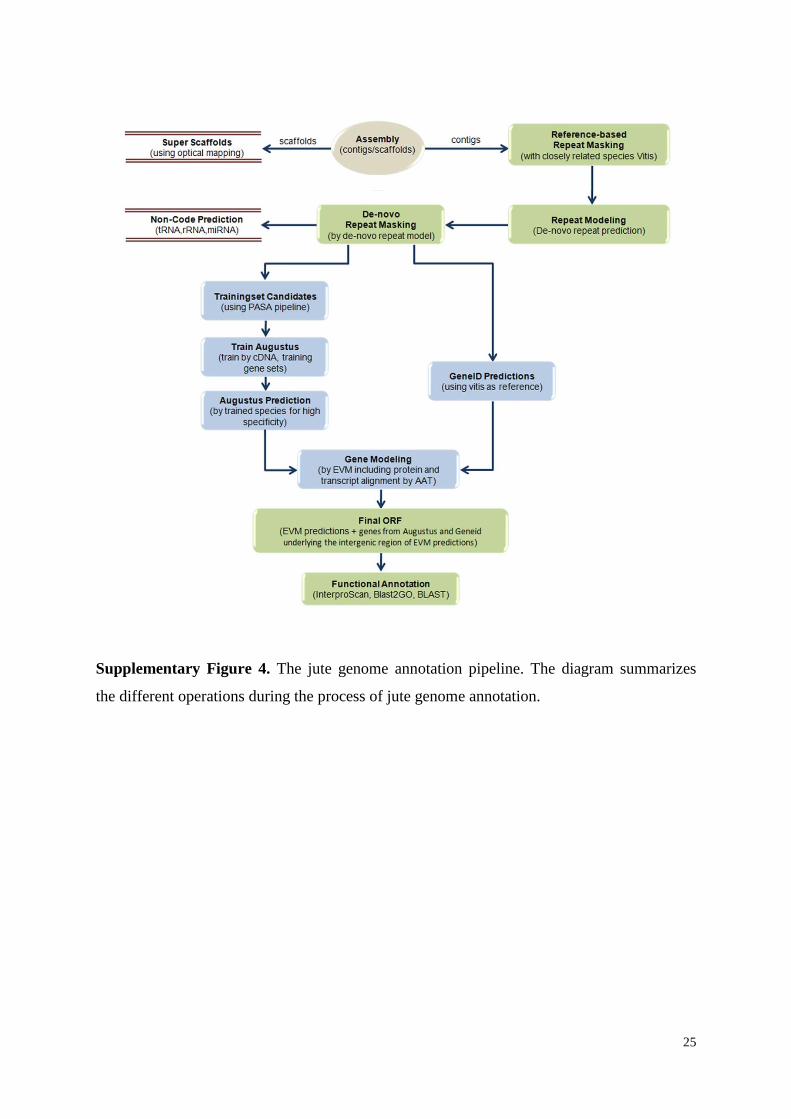
Supplementary Figure 4. The jute genome annotation pipeline. The diagram summarizes
the different operations during the process of jute genome annotation.

26
Supplementary Figure 5. Venn diagram showing the distribution of unique and shared gene
families among the Malvids, Fabids, Asterids, Vitales, and Monocot genomes. OrthoMCL
was used to identify gene clusters across the 15 plant species. The gene family number is
listed in each component. The number of genes within the families is noted in parentheses.
27
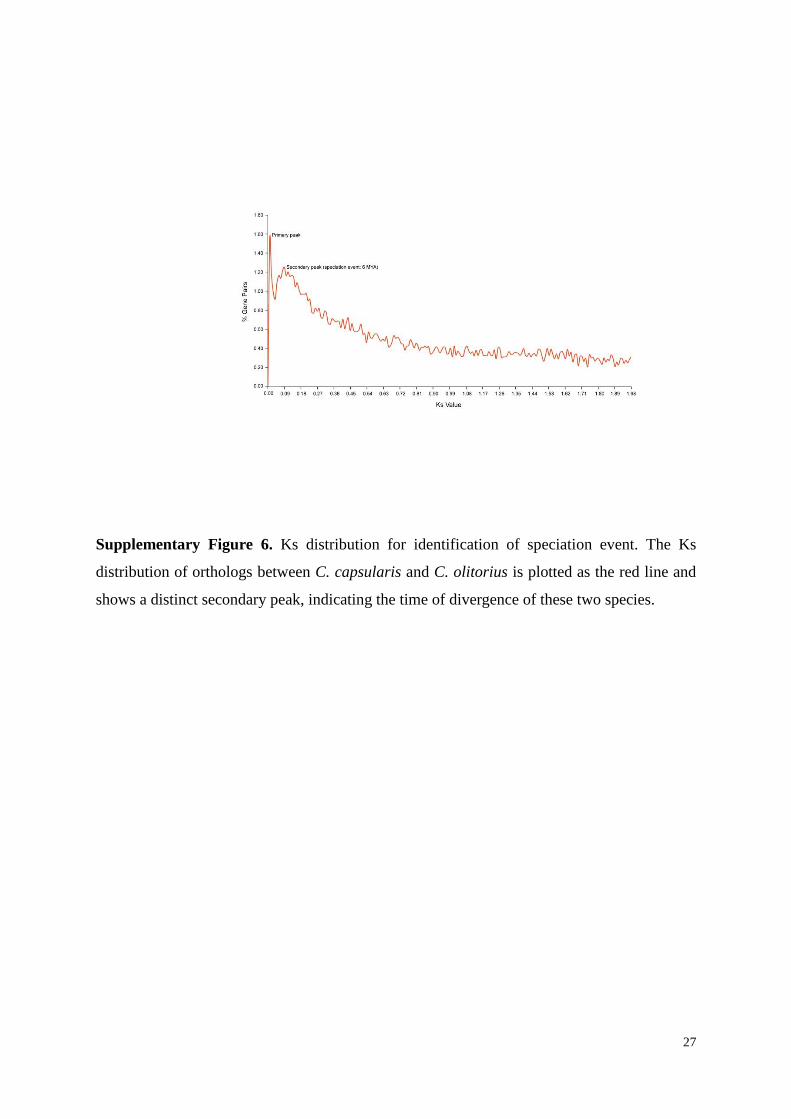
Supplementary Figure 6. Ks distribution for identification of speciation event. The Ks
distribution of orthologs between C. capsularis and C. olitorius is plotted as the red line and
shows a distinct secondary peak, indicating the time of divergence of these two species.
28
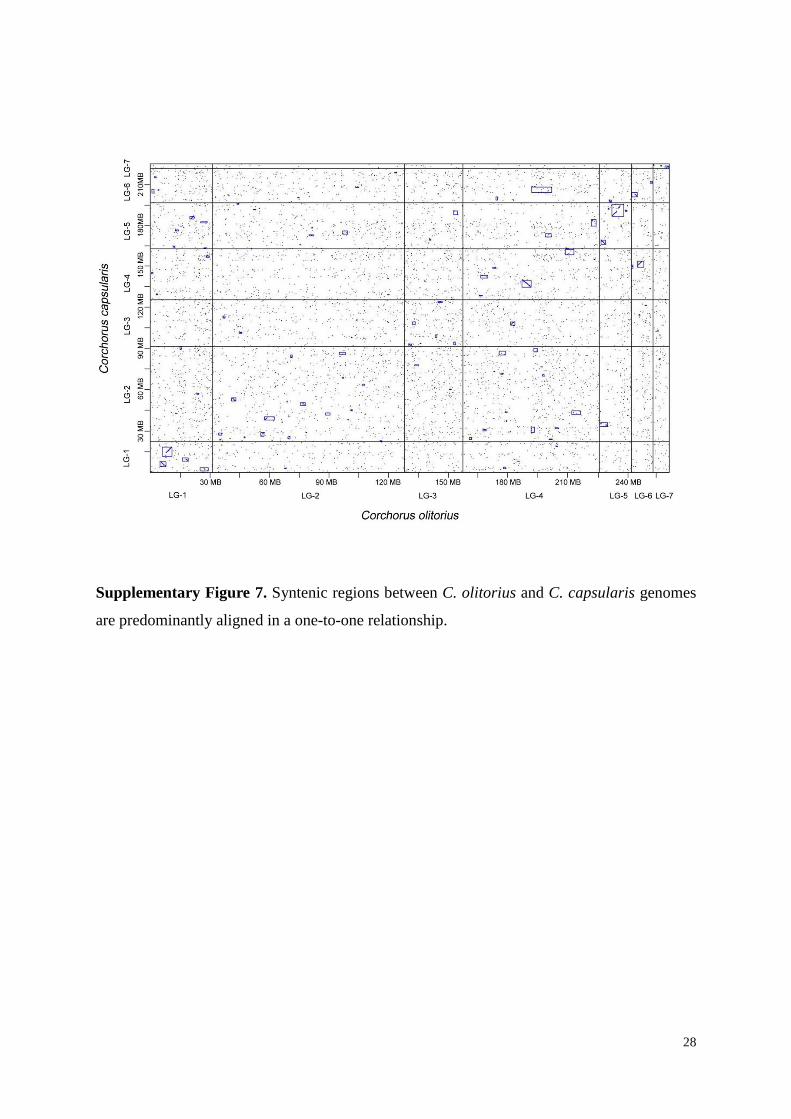
Supplementary Figure 7. Syntenic regions between C. olitorius and C. capsularis genomes
are predominantly aligned in a one-to-one relationship.
29
a
b
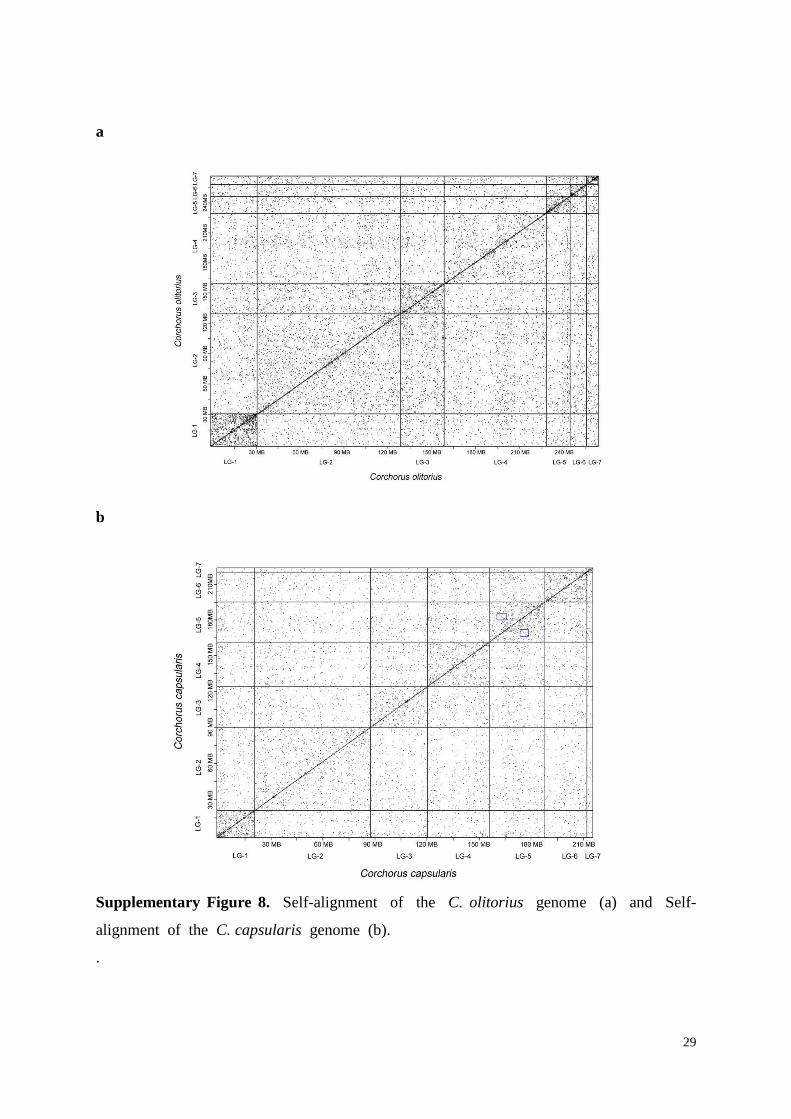
Supplementary Figure 8. Self-alignment of the C. olitorius genome (a) and Self-
alignment of the C. capsularis genome (b).
.
30
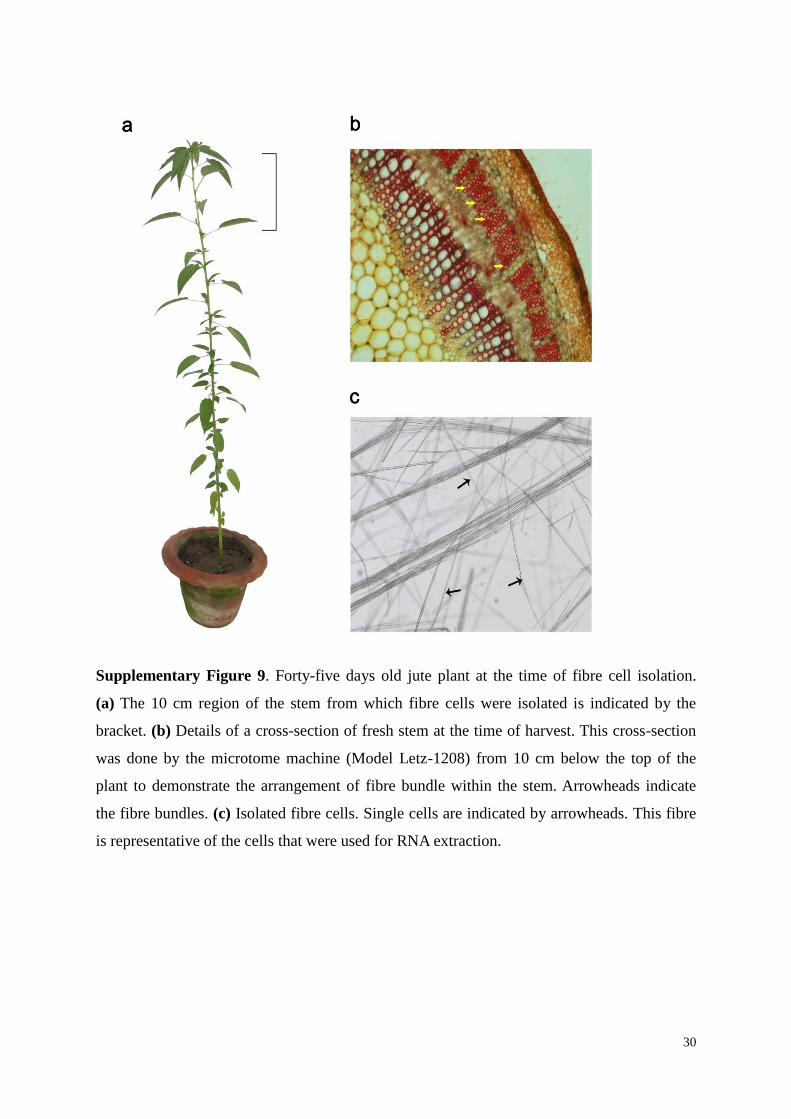
Supplementary Figure 9. Forty-five days old jute plant at the time of fibre cell isolation.
(a) The 10 cm region of the stem from which fibre cells were isolated is indicated by the
bracket. (b) Details of a cross-section of fresh stem at the time of harvest. This cross-section
was done by the microtome machine (Model Letz-1208) from 10 cm below the top of the
plant to demonstrate the arrangement of fibre bundle within the stem. Arrowheads indicate
the fibre bundles. (c) Isolated fibre cells. Single cells are indicated by arrowheads. This fibre
is representative of the cells that were used for RNA extraction.
31
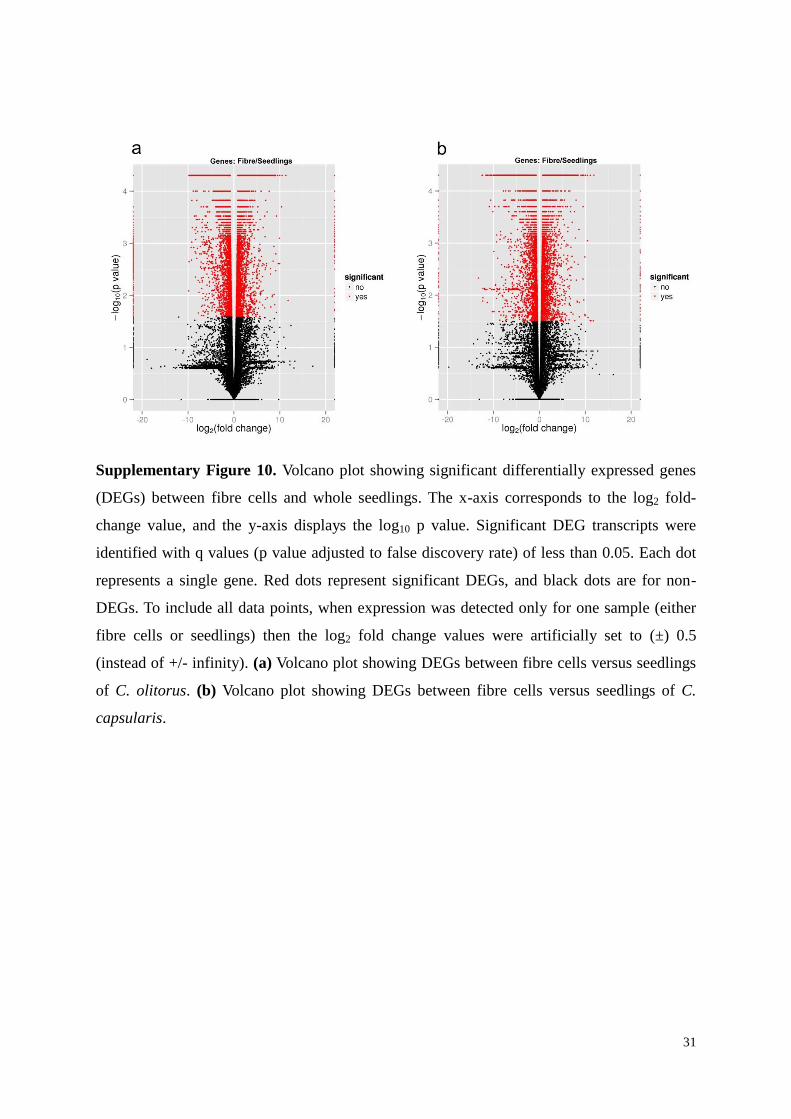
Supplementary Figure 10. Volcano plot showing significant differentially expressed genes
(DEGs) between fibre cells and whole seedlings. The x-axis corresponds to the log2 fold-
change value, and the y-axis displays the log10 p value. Significant DEG transcripts were
identified with q values (p value adjusted to false discovery rate) of less than 0.05. Each dot
represents a single gene. Red dots represent significant DEGs, and black dots are for non-
DEGs. To include all data points, when expression was detected only for one sample (either
fibre cells or seedlings) then the log2 fold change values were artificially set to (±) 0.5
(instead of +/- infinity). (a) Volcano plot showing DEGs between fibre cells versus seedlings
of C. olitorus. (b) Volcano plot showing DEGs between fibre cells versus seedlings of C.
capsularis.
32
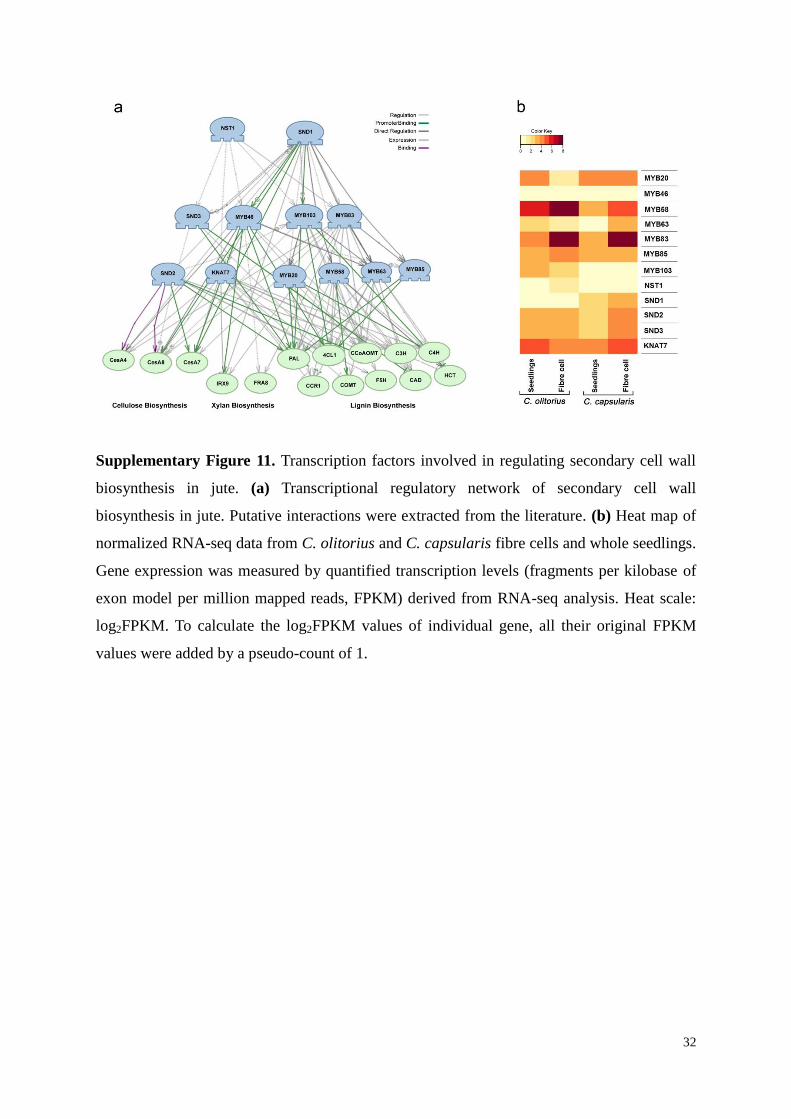
Supplementary Figure 11. Transcription factors involved in regulating secondary cell wall
biosynthesis in jute. (a) Transcriptional regulatory network of secondary cell wall
biosynthesis in jute. Putative interactions were extracted from the literature. (b) Heat map of
normalized RNA-seq data from C. olitorius and C. capsularis fibre cells and whole seedlings.
Gene expression was measured by quantified transcription levels (fragments per kilobase of
exon model per million mapped reads, FPKM) derived from RNA-seq analysis. Heat scale:
log2FPKM. To calculate the log2FPKM values of individual gene, all their original FPKM
values were added by a pseudo-count of 1.
33
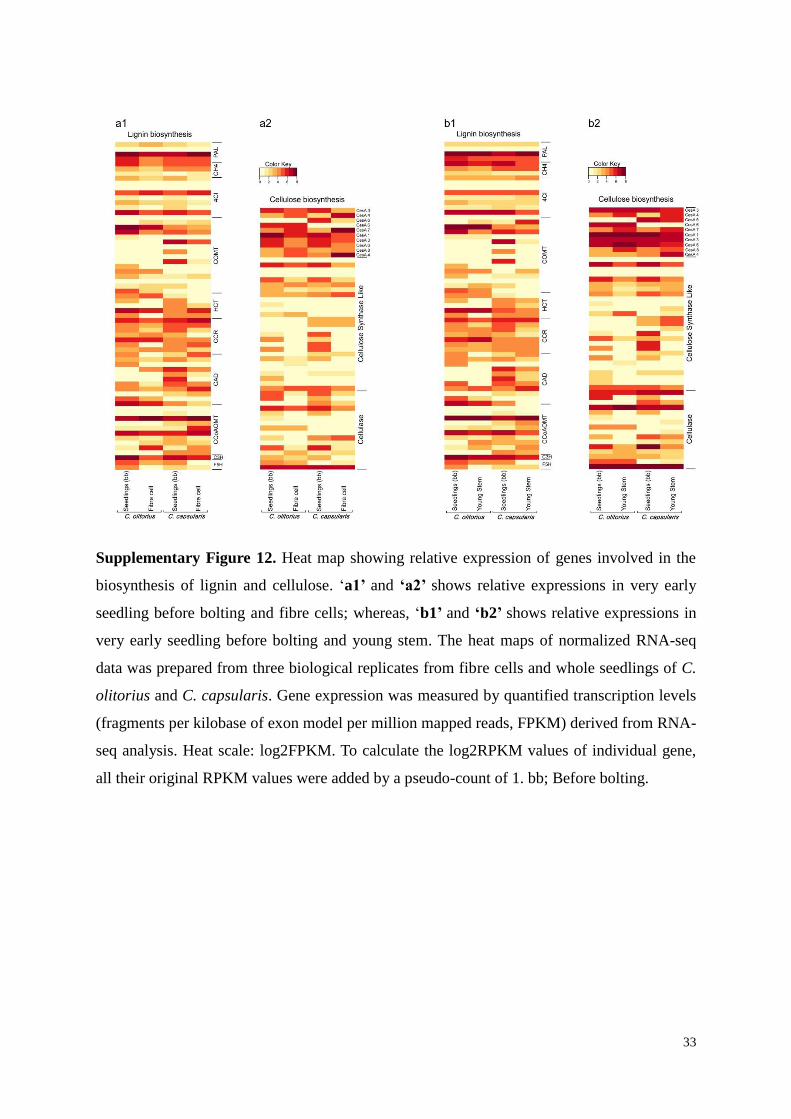
Supplementary Figure 12. Heat map showing relative expression of genes involved in the
biosynthesis of lignin and cellulose. ‘a1’ and ‘a2’ shows relative expressions in very early
seedling before bolting and fibre cells; whereas, ‘b1’ and ‘b2’ shows relative expressions in
very early seedling before bolting and young stem. The heat maps of normalized RNA-seq
data was prepared from three biological replicates from fibre cells and whole seedlings of C.
olitorius and C. capsularis. Gene expression was measured by quantified transcription levels
(fragments per kilobase of exon model per million mapped reads, FPKM) derived from RNA-
seq analysis. Heat scale: log2FPKM. To calculate the log2RPKM values of individual gene,
all their original RPKM values were added by a pseudo-count of 1. bb; Before bolting.
34
a
b
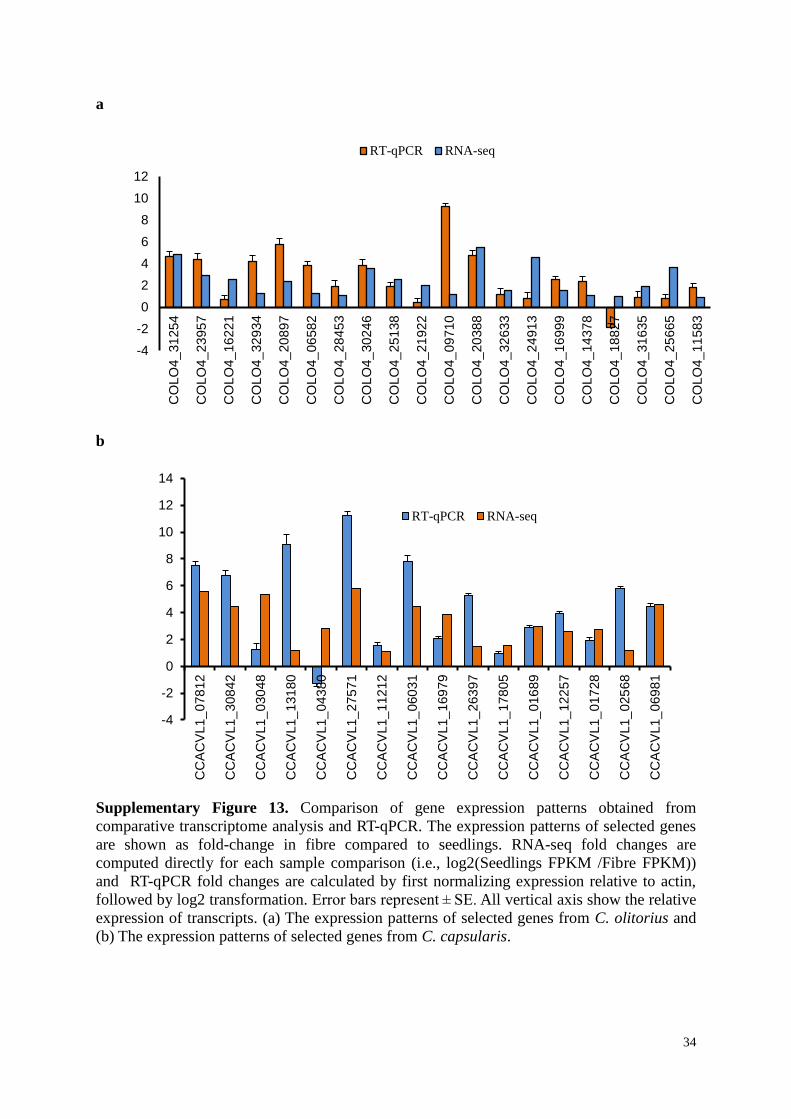
Supplementary Figure 13. Comparison of gene expression patterns obtained from
comparative transcriptome analysis and RT-qPCR. The expression patterns of selected genes
are shown as fold-change in fibre compared to seedlings. RNA-seq fold changes are
computed directly for each sample comparison (i.e., log2(Seedlings FPKM /Fibre FPKM))
and RT-qPCR fold changes are calculated by first normalizing expression relative to actin,
followed by log2 transformation. Error bars represent ± SE. All vertical axis show the relative
expression of transcripts. (a) The expression patterns of selected genes from C. olitorius and
(b) The expression patterns of selected genes from C. capsularis.
-4
-2
0
2
4
6
8
10
12C
OLO
4_31
254
CO
LO
4_23
957
CO
LO
4_16
221
CO
LO
4_32
934
CO
LO
4_20
897
CO
LO
4_06
582
CO
LO
4_28
453
CO
LO
4_30
246
CO
LO
4_25
138
CO
LO
4_21
922
CO
LO
4_09
710
CO
LO
4_20
388
CO
LO
4_32
633
CO
LO
4_24
913
CO
LO
4_16
999
CO
LO
4_14
378
CO
LO
4_18
827
CO
LO
4_31
635
CO
LO
4_25
665
CO
LO
4_11
583
RT-qPCR RNA-seq
-4
-2
0
2
4
6
8
10
12
14
CC
AC
VL1_
078
12
CC
AC
VL1_
308
42
CC
AC
VL1_
030
48
CC
AC
VL1_
131
80
CC
AC
VL1_
043
80
CC
AC
VL1_
275
71
CC
AC
VL1_
112
12
CC
AC
VL1_
060
31
CC
AC
VL1_
169
79
CC
AC
VL1_
263
97
CC
AC
VL1_
178
05
CC
AC
VL1_
016
89
CC
AC
VL1_
122
57
CC
AC
VL1_
017
28
CC
AC
VL1_
025
68
CC
AC
VL1_
069
81
RT-qPCR RNA-seq
35
a
36
b
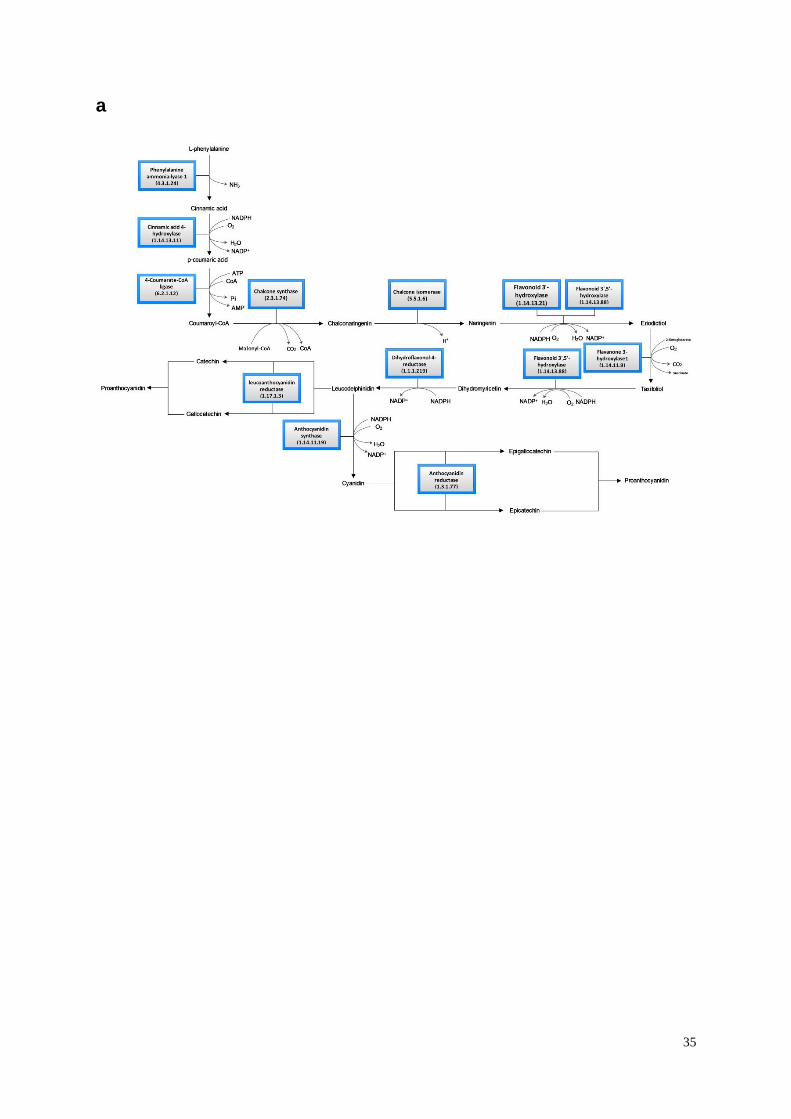
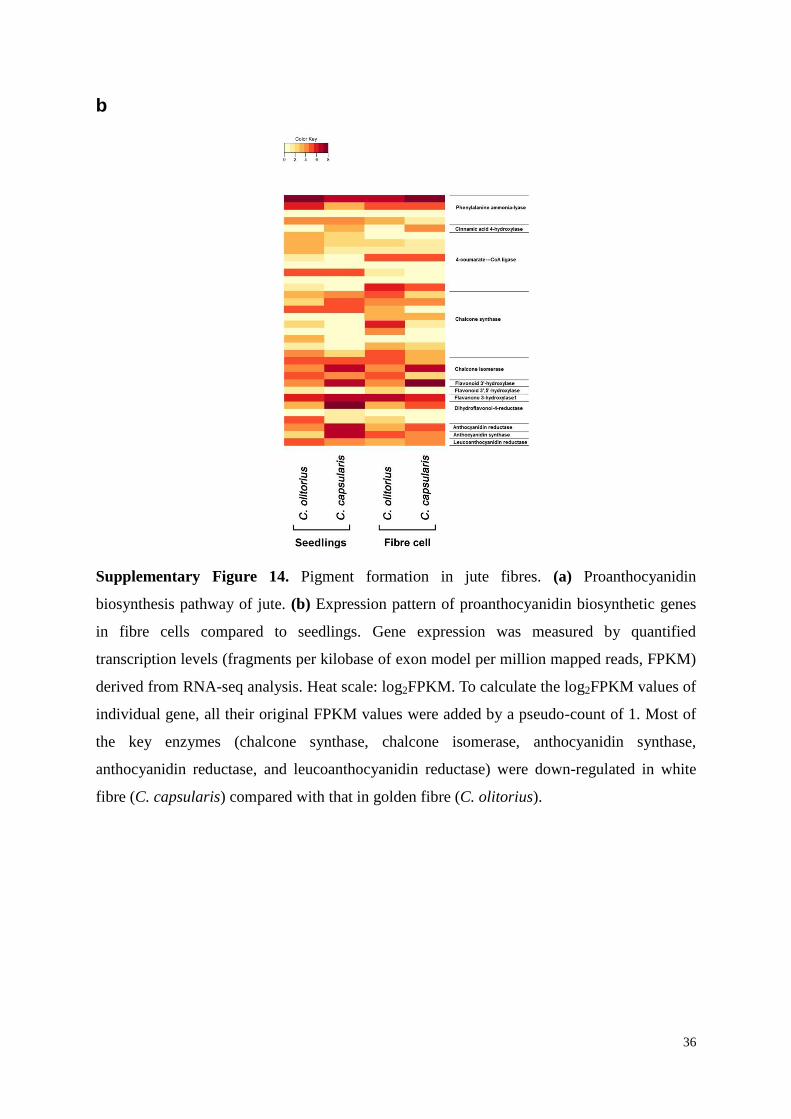
Supplementary Figure 14. Pigment formation in jute fibres. (a) Proanthocyanidin
biosynthesis pathway of jute. (b) Expression pattern of proanthocyanidin biosynthetic genes
in fibre cells compared to seedlings. Gene expression was measured by quantified
transcription levels (fragments per kilobase of exon model per million mapped reads, FPKM)
derived from RNA-seq analysis. Heat scale: log2FPKM. To calculate the log2FPKM values of
individual gene, all their original FPKM values were added by a pseudo-count of 1. Most of
the key enzymes (chalcone synthase, chalcone isomerase, anthocyanidin synthase,
anthocyanidin reductase, and leucoanthocyanidin reductase) were down-regulated in white
fibre (C. capsularis) compared with that in golden fibre (C. olitorius).
37
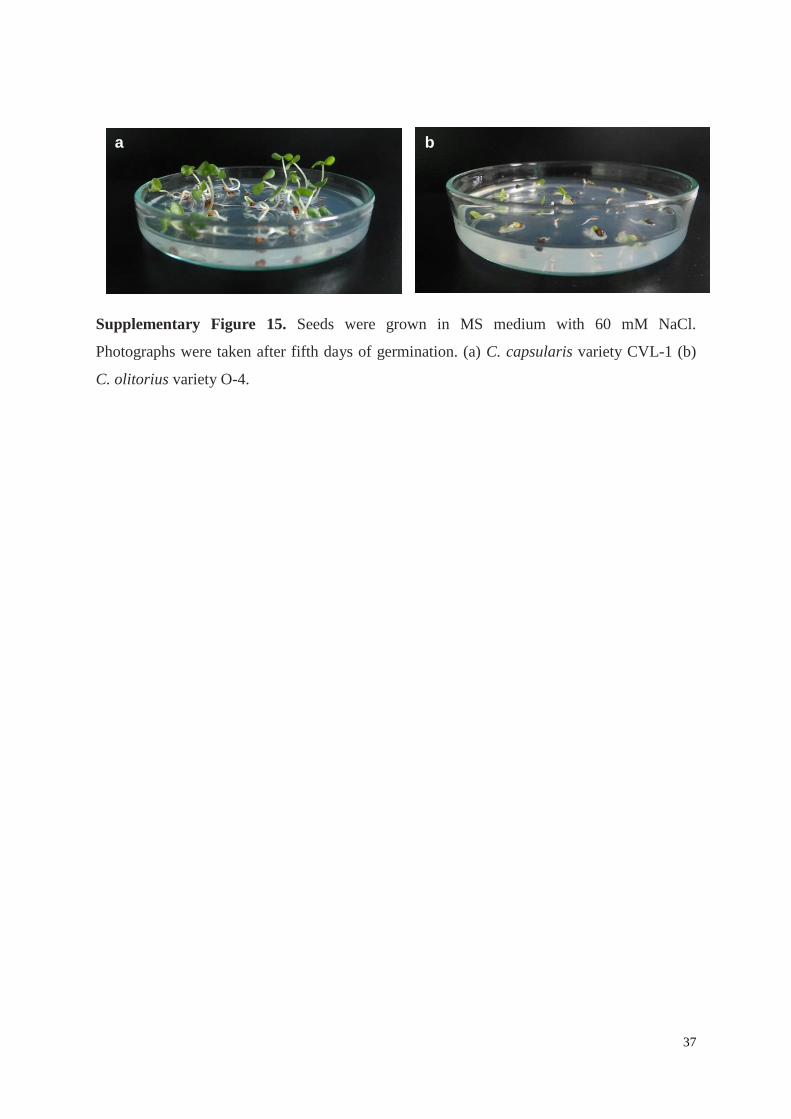
Supplementary Figure 15. Seeds were grown in MS medium with 60 mM NaCl.
Photographs were taken after fifth days of germination. (a) C. capsularis variety CVL-1 (b)
C. olitorius variety O-4.
b a