
An Active-Passive Measurement Study of TCP Performance ...
16
An Active-Passive Measurement Study of TCP Performance over LTE on High-speed Rails ∗ Jing Wang † , Yufan Zheng † , Yunzhe Ni † , Chenren Xu † , Feng Qian ♯ , Wangyang Li † , Wantong Jiang † Yihua Cheng † , Zhuo Cheng † , Yuanjie Li § , Xiufeng Xie § , Yi Sun ♭ , Zhongfeng Wang ♮ † † Peking University, China ♯ University of Minnesota – Twin Cities, USA § Hewlett Packard Labs, USA ♭ Institute of Computing Technology, University of Chinese Academy of Sciences ♮ China Academy of Railway Sciences ABSTRACT High-speed rail (HSR) systems potentially provide a more efficient way of door-to-door transportation than airplane. However, they also pose unprecedented challenges in deliver- ing seamless Internet service for on-board passengers. In this paper, we conduct a large-scale active-passive measurement study of TCP performance over LTE on HSR. Our measure- ment targets the HSR routes in China operating at above 300 km/h. We performed extensive data collection through both controlled setting and passive monitoring, obtaining 1732.9 GB data collected over 135719 km of trips. Leveraging such a unique dataset, we measure important performance metrics such as TCP goodput, latency, loss rate, as well as key char- acteristics of TCP flows, application breakdown, and users’ behaviors. We further quantitatively study the impact of fre- quent cellular handover on HSR networking performance, and conduct in-depth examination of the performance of two widely deployed transport-layer protocols: TCP CUBIC and TCP BBR. Our findings reveal the performance of to- day’s commercial HSR networks “in the wild”, as well as identify several performance inefficiencies, which motivate us to design a simple yet effective congestion control algo- rithm based on BBR to further boost the throughput by up to 36.5%. They together highlight the need to develop dedicated protocol mechanisms that are friendly to extreme mobility. ∗ This work is a pre-print version to appear at MobiCom 2019. † J.Wang, Y.Zheng and Y. Ni are the co-primary student authors. CCS CONCEPTS • Networks → Network measurement; KEYWORDS Measurement, High-speed Rails, TCP, LTE, High Mobility, Handover, CUBIC, BBR 1 INTRODUCTION Recently, the rapid development of high-speed rails (HSRs) has dramatically changed the way people commute for medium- to-long distance travel. For instance, a train traveling above 300 km/h potentially provides a more efficient way of door- to-door transportation than airplane. To date, 18 countries have developed HSR to connect major cities. In China, the HSR network exceeds 22,000 km in length; in Europe, HSR even travels across international borders [1]; in USA, the HSR projects in Texas and California are under construction and expected to finish in the near future [2]. While such high mobility brings great transportation ef- ficiency, it also poses unprecedented challenges in deliver- ing seamless Internet service for on-board passengers from the trackside broadband radio (e.g., LTE) connectivity in a bottom-up fashion – from error-prone L1/L2 connectivity to misguided TCP. Specifically, as will be shown, the increasing mobility level poses several new challenges: it degrades the link quality as the Doppler spread increases, increase the BER and reduces the PHY data rate, and hence throttles TCP throughput; from the handover perspective, handover not only become more frequent, but also are more likely to fail because of the unreliable handover control signal transmis- sion and the tighter timing budget for handover completion due to the train’s ultra-high mobility. Given HSR’s short history, its networking is still a rel- atively new topic. Existing experimental studies on HSR networking [3, 4] focus on measuring TCP performance in a controlled setting, and thus lack in-depth cross-layer insights and an understanding of HSR networking performance “in the wild”. To bridge such a gap, in this paper, we conduct a cross-layer and large-scale measurement study of TCP per- formance on HSR. Our measurement targets consist of three 1 arXiv:1812.04823v1 [cs.NI] 12 Dec 2018
Transcript of An Active-Passive Measurement Study of TCP Performance ...

An Active-Passive Measurement Study of TCPPerformance over LTE on High-speed Rails∗
Jing Wang†, Yufan Zheng†, Yunzhe Ni†, Chenren Xu†, Feng Qian♯, Wangyang Li†, Wantong Jiang†
Yihua Cheng†, Zhuo Cheng†, Yuanjie Li§, Xiufeng Xie§, Yi Sun♭, Zhongfeng Wang♮†
†Peking University, China ♯University of Minnesota – Twin Cities, USA §Hewlett Packard Labs, USA♭Institute of Computing Technology, University of Chinese Academy of Sciences ♮China Academy of Railway Sciences
ABSTRACTHigh-speed rail (HSR) systems potentially provide a moreefficient way of door-to-door transportation than airplane.However, they also pose unprecedented challenges in deliver-ing seamless Internet service for on-board passengers. In thispaper, we conduct a large-scale active-passive measurementstudy of TCP performance over LTE on HSR. Our measure-ment targets the HSR routes in China operating at above 300km/h. We performed extensive data collection through bothcontrolled setting and passive monitoring, obtaining 1732.9GB data collected over 135719 km of trips. Leveraging such aunique dataset, we measure important performance metricssuch as TCP goodput, latency, loss rate, as well as key char-acteristics of TCP flows, application breakdown, and users’behaviors. We further quantitatively study the impact of fre-quent cellular handover on HSR networking performance,and conduct in-depth examination of the performance oftwo widely deployed transport-layer protocols: TCP CUBICand TCP BBR. Our findings reveal the performance of to-day’s commercial HSR networks “in the wild”, as well asidentify several performance inefficiencies, which motivateus to design a simple yet effective congestion control algo-rithm based on BBR to further boost the throughput by up to36.5%. They together highlight the need to develop dedicatedprotocol mechanisms that are friendly to extreme mobility.
∗This work is a pre-print version to appear at MobiCom 2019.†J.Wang, Y.Zheng and Y. Ni are the co-primary student authors.
CCS CONCEPTS• Networks→ Network measurement;
KEYWORDSMeasurement, High-speed Rails, TCP, LTE, High Mobility,Handover, CUBIC, BBR
1 INTRODUCTIONRecently, the rapid development of high-speed rails (HSRs)has dramatically changed theway people commute formedium-to-long distance travel. For instance, a train traveling above300 km/h potentially provides a more efficient way of door-to-door transportation than airplane. To date, 18 countrieshave developed HSR to connect major cities. In China, theHSR network exceeds 22,000 km in length; in Europe, HSReven travels across international borders [1]; in USA, theHSR projects in Texas and California are under constructionand expected to finish in the near future [2].While such high mobility brings great transportation ef-
ficiency, it also poses unprecedented challenges in deliver-ing seamless Internet service for on-board passengers fromthe trackside broadband radio (e.g., LTE) connectivity in abottom-up fashion – from error-prone L1/L2 connectivity tomisguided TCP. Specifically, as will be shown, the increasingmobility level poses several new challenges: it degrades thelink quality as the Doppler spread increases, increase theBER and reduces the PHY data rate, and hence throttles TCPthroughput; from the handover perspective, handover notonly become more frequent, but also are more likely to failbecause of the unreliable handover control signal transmis-sion and the tighter timing budget for handover completiondue to the train’s ultra-high mobility.Given HSR’s short history, its networking is still a rel-
atively new topic. Existing experimental studies on HSRnetworking [3, 4] focus on measuring TCP performance in acontrolled setting, and thus lack in-depth cross-layer insightsand an understanding of HSR networking performance “inthe wild”. To bridge such a gap, in this paper, we conduct across-layer and large-scale measurement study of TCP per-formance on HSR. Our measurement targets consist of three
1
arX
iv:1
812.
0482
3v1
[cs
.NI]
12
Dec
201
8
popular HSR routes in China operating at above 300 km/h.More than 150 million passengers travel on these routesannually. The onboard Internet connectivity is provided bymulti-carrier LTE, the main-streammobile access technologyfor HSR [5]. Through a period of 10 months, we performedextensive data collection through both passive monitoring(at the LTE gateway whose access was provided by ChinaAcademy of Railway Sciences) and controlled experiments.To our best knowledge, this is the largest HSR network tracedataset – 1732.9 GB data collected over 135719 km of trips.Our measurement consists of four parts as detailed below.• (§4.1) Leveraging such a unique dataset, we begin with mea-suring important performance metrics for two TCP variants:CUBIC [6] and BBR [7], which are state-of-the-art transportlayer solutions that have registered real-world deployment.We found that the extreme mobility of HSR effectively de-grades the performance of these protocols, across all metrics.For instance, when the train speed increases from 300 km/hto 350 km/h, the average goodput of CUBIC and BBR de-creases by 47.5% and 40.1%, respectively, due to frequenthandover as well as lower PHY rate. Meanwhile, BBR stillholds its native property of low(er) RTT, loss rate and bytes-in-flight (when in comparison to CUBIC) in such extrememobility environment.• (§4.2)We thenmeasure key characteristics of TCP flows, ap-plication breakdown, and users’ behaviors from the on-boardpassengers’ WiFi traffic data. We found that HTTP(S) stilldominates the application protocol usage (94.13%). Amongthem, more than 95% of the flows are composed of text, im-age and application data (rather than audio and video), andthey are slow (less than 1 Mbps), short (less than 100 KB)and unlikely to finish when its size is above 1 MB. Anotherinteresting observation is that in HSR networks, the usagepatterns are quite distinct (e.g., weekends do not necessar-ily generate more data traffic, and the diurnal patterns areless prominent) as attributed to the unique context of pas-senger traveling by train. The above findings shed light onimproving traffic classification, resource allocation, and cel-lular infrastructure planning for HSR networking.• (§5) Given the importance of handover in high-mobilitycellular access [4], we next conduct a quantitative in-depthstudy of the handover impact on HSR networking perfor-mance. Specifically, we first develop appropriate taxonomyof handover (§2.2), and then correlate the lower-layer LTEmessages (e.g., PHY rate, handover) with TCP’s behavior. Wemake four key findings. First, handover occur frequently inHSR – every 13.7/8.6 seconds on average at 300/350 km/h.Second, depending on a handover’s type, its performance im-pact on TCP varies; despite most handovers being successful,as the mobility level increases, more and longer unsuccess-ful handovers will appear, leading to more negative impact.
Third, for successful handover, it is typically too short (i.e.,tens ofms) for TCP to react over its normal RTT of hundredsofms . The fourth finding is what we call the “near effect”: anunsuccessful handover (typically more than 1 second) cannegatively affect data rate over a much longer window (e.g.,more than 8 seconds) after its actual occurrence.• (§6) We next conduct more in-depth exploration of com-parative TCP performance. Our key findings include thefollowing. First, we find that BBR recovers more smoothlyand slower than CUBIC after all type of handover because ithas a intrinsically less radical strategy in expanding conges-tion window and thus more handover-agnostic. Specifically,it performs slightly better after Radio Link Failure (RLF) han-dover, but much worse after Non-Access Stratum (NAS) re-covery than CUBIC. Even though, BBR achieves comparablethroughput with CUBIC, but with a much shorter RTT andpacket loss rate. Second, we find that BBR outperforms CU-BIC over the connection with higher random loss and thusmore carrier-agnostic in our measurement setting. Third,BBR is still suboptimal in HSR with high variant RTT due toits excessively conservativeness in RTprop estimation, a crit-ical parameter controlling its sending window. We managedto achieve 1.36x throughput improvement by simply tuningthe strategy of bandwidth probing and adding a stochasticcompensation term in RTprop estimation of BBR (§7).Contribution. This work represents the first large scalein-depth HSR networking measurement study covering thefollowing aspects: 1 user/traffic behavior in the wild, 2TCP-LTE interactions, 3 comparative TCP variants behav-ior, and 4 handover-centric. Here are the key findings:• HTTP(S) flows dominate on-board Internet traffic, while
the QoE (e.g., throughput, time to first byte and comple-tion percentage) has huge room for improvement.
• Higher train speed not only causes more (unsuccessful)handovers, but also degrades PHY (and TCP) data ratein a non-linear fashion during periods out of handover.
• While most handover happen successfully (i.e., finishwithin 100ms) and cause negligible impact on TCP, theunsuccessful handover disrupt TCP in a complicatedman-ner which depends on the congestion control algorithm.
• BBR is more handover and carrier agnostic than CUBIC,but recovers much slower after a long disconnection.We demonstrate there is still great potential for furtherimprovement with a simple end-to-end solution.As a remark, we believe our study provides key insights
for (cross-layer) protocol design dedicated for high mobilitydata networking in general, and even future standards suchas LTE-railway (LTE-R) [8], a new standard being discussedfor the next-generation private HSR communication systemfor mission-critical services.
2
Data
1. Measurement Report
Data4. Access + UL Grant + HO Confirm
3. HO Command
2. HO Preparation
Data forwarding
Source TargetUE context transferred
(a) Successful (Type I)
Data
1. Measurement Report
2. HO Preparation
Data4. Access + UL Grant + Connection
Re-establishment
Data forwarding
UE context transferred
3. HO Command
RLF timer expires and UE performs
cell selection
✕
UE context located
Source Target
(b) RLF (Type II)
1. Measurement Report
Data3. Access + UL Grant + Connection
Setup
UE context not located
✕
2. Access + UL Grant + Connection
Re-establishmentReject
UE context created
No data forwarding
UE context not
transferred
Source Target
RLF timer expires and UE performs
cell selection
(c) NAS Recovery (Type III)
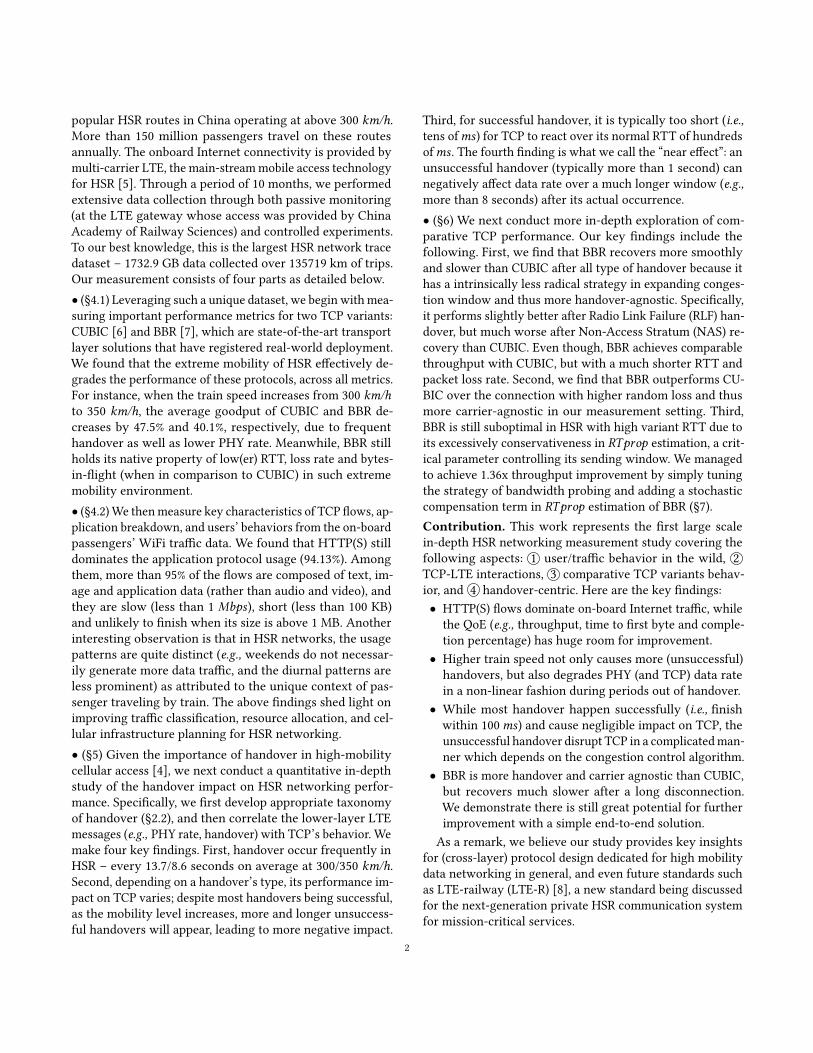
Figure 1: Different LTE Handover Scenarios.
2 BACKGROUND2.1 Why LTE is not good enough for HSR
LTE is a 3GPP standard for broadband wireless communica-tion for mobile devices. While it typically provides seamlessmobile networking performance for clients on highways orregional trains (of low speed, i.e., below 200 km/h), it runsinto severe performance issues when the client mobility israised to a higher level. According to 3GPP TR 25.913 [9],“Mobility across the cellular network shall be maintained atspeeds up 350 km/h, yet the performance is not guaranteed.”There are two major reasons behind it – poor link qualityand frequent handover.Link quality on HSRs becomes poorer than usual mainlybecause of the large Doppler spread, which is proportionalto relative motion between the train and base station. Asthe mobility level increases, the varying Doppler spread andchannel coherence time will incur higher channel estimationerrors because of the carrier frequency offset and intercarrierinterference [10, 11]. As a result, it not only causes higher de-coding errors, but also makes a cell choose lower modulationand coding rate, which together lower the PHY data rate andthrottle TCP throughput during the periods even withouthandover. Another side effect of weak signal is that it reducesthe actual on-track LTE coverage, increases the packet lossrate, and hence imposes extra challenges for handover tofinish within the overlap zone.Handover on HSRs becomes the main root cause for dis-rupting a TCP flow – the increasing mobility level can makeit more likely to fail because of the following reasons. First,as the link quality degrades, the handover control signalmight get lost and incur high overhead to recover. Second,the handover procedure is more likely to fail to finish giventhe shorter time window within the overlap zone due tohigh mobility. Third, the “tidal effect” can easily overload thebasestation, in both control and data channels. Upon failure,it needs to spend extra time in discovering and reconnectingto the cell, and thus keeps TCP disconnected.
2.2 LTE Handover PremierHandover [12–14] is a key function for realizing seamlessuser experience in mobile networking – from a source cellto target cell. In general, a handover can be described as anetwork-controlled and user equipment (UE)-assisted proce-dure. According to the 3GPP standard, a handover procedurecan be described as follows: UE sends theMeasurement Report(e.g., signal strength from all the perceived cells) to the sourcecell. When the source cell decides to perform a handover, itcommunicates with the target cell for radio resource prepa-ration, informs the UE of the handover action by sendinga Handover Command (RRC Connection Reconfiguration)after forwarding UE’s buffered downlink (and optionallyuplink) user plane data to the target cell for lossless deliv-ery. Upon receiving this message, UE synchronizes with andgains access to the target cell, and sends aHandover Confirm(RRCConnection Reconfiguration Complete) message to con-tinue the session. In real environment, however, the handoverprocedure can end up with three different scenarios:• Successful handover (Fig. 1(a)). It happens when all thecontrolling signals are received, and the buffered data arelosslessly forwarded to target cell and delivered to UE forminimizing the flow disruption.• Radio Link Failure (RLF) handover (Fig. 1(b)). It happenswhen radio conditions not good enough for the UE to beable to decode the Handover Command from the source cell.When the UE detects radio link problems, it starts the RLFtimer. Upon expiration of the RLF timer, the UE searches fora suitable target cell and re-establishes its connection withit (performing the RRC Connection Reestablishment proce-dure) if it (the target cell) happens to have been prepared bythe source cell. RLF handover incurs additional delay, but nodata buffered in cell is lost.• Non-Access Stratum (NAS) recovery (Fig. 1(c)): It happenswhen the target cell is not prepared for handover. In suchcase, the UE attempts to establish a new connection – theUE context needs to be created, and all the buffered data islost and needs upper-layer (TCP) retransmission.
3
2.3 TCP PrimerWe briefly introduce the necessary background on how CU-BIC and BBR deals with the network dynamics.CUBICmodifies the linear window growth function of exist-ing TCP standards to be a cubic function. When a loss eventhappens, CUBIC registers the current congestion window(cwnd) as Wmax and performs a multiplicative decrease ofcwnd by a scaling factor. The cubic function is set to haveits plateau at Wmax and its increasing is based on elapsedtime instead of reception of ACK – thus the window growthis independent of RTT and flows grow their cwnd at thesame rate. After CUBIC enters into congestion avoidancefrom fast recovery, it starts to increase the window usingthe concave profile of the cubic function until cwnd becomesWmax . After that, the cubic function turns into a convex pro-file to ensure that the window increases very slowly at thebeginning and gradually increases its growth rate to probeaggressively for additional capacity. This style of windowadjustment (i.e., concave and then convex) makes the cwndremain almost constant around Wmax , improves networkutilization and scalability of TCP over fast and long distance(i.e., large bandwidth-delay product) networks, and mean-while treats other TCP connections fairly. However, the factthat it treats packet loss over a lossy wireless link as thesignal of network congestion will still throttle its cwnd bymistake thus leads to low bandwidth utilization.BBR employs two parameters, namely RTprop (i.e., roundtrip propagation time (estimated by taking the minimumRTT over the last 10 seconds) and BtlBw (i.e., bottleneckbandwidth estimated by taking the maximum throughputover the last 10 RTprop), to model the end-to-end capac-ity and determine its congestion control window. Specifi-cally, BBR first uses the slow-start akin to CUBIC’s onlywhen the flow is initially launched and then soon reach itsbandwidth probing phase after the throughput converges. Inthis phase, it takes a period-8 cycling pacing_gain sequence(1, 1, 1, 1, 1, 1, 5/4, 3/4, . . . ) in turn as a multiplier to BtlBwto determine its sending rate for RTprop (not RTT) time –while pacing_gain = 1 at most of the time, a pacing_gain > 1means BBR is in the phase of exploring more bandwidth, af-ter which a pacing_gain < 1 is necessary to guarantee thatthe queue at the bottleneck will be drained in case thereis no more bandwidth to utilize. The take away messageis that, BBR is robust to random packet loss, but will takelong time (in comparison to CUBIC) to recover after a longdisconnection, e.g., after 10 · RTprop or longer.
3 MEASUREMENT METHODOLOGY3.1 Factors to ExamineIn order to demystify the performance issues and optimiza-tion opportunities in HSR networking, we use real-world
RAN
EPC andInternet
High-speed Train ClientCUBIC BBR
CERNET
CDN servers
20 ~ 35 dB extra
loss
Controlledclient device
Passengersclient device
Train-mounted server and LTE gateway
…
…
802.11n WLAN
LTE Gateway with Multi-carrier Air Interface
USB tethering
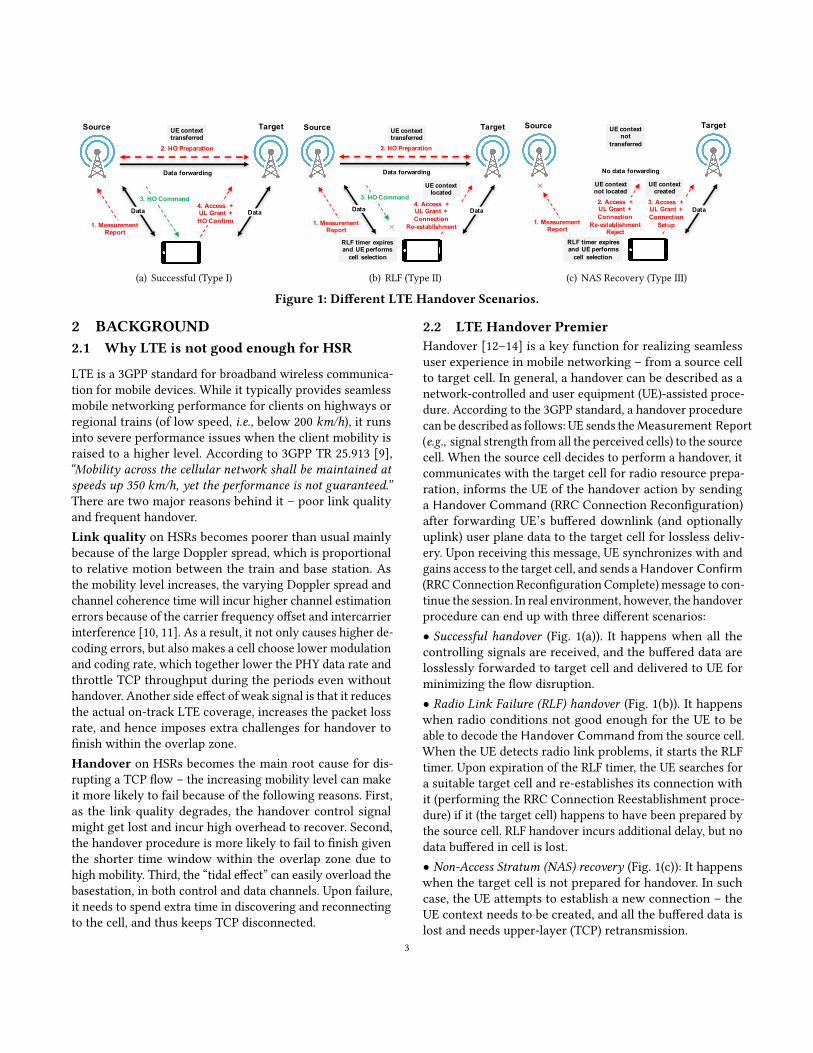
Figure 2: Our experimental testbed collects data fromboth a dedicated laptop-phone suite and a LTE gate-way in active and passive manners respectively.
data complemented with on-board controlled experiments togain insights in the following dimensions: 1 What is uniqueabout the interaction between TCP and LTE in high mobilityenvironment? 2 How do different TCP congestion controlalgorithms behave? 3 How do the on-board passengers useInternet? While TCP performance, cross-layer interaction,and user behaviors under stationary or low/moderate mo-bility have been extensively studied in the literature, thereare much fewer studies of them under extreme mobility. Wesummarize the high-level experimental design in Tab. 1 andexperimental setup for data collection in Fig. 2, which willbe further explained in the rest of this section.
3.2 Active Measurements in Controlled SettingWe begin with describing controlled experiments conductedon HSR. They allow us to capture and analyze a wide rangeof information in a cross-layer manner.3.2.1 Experimental setup
Server. We deploy two powerful co-located servers (IntelNUC6i7KYK with i7-6770HQ, 32 GB DDR4 and Samsung 950pro 512 GB) in CERNET [15], the nationwide education andresearch computer network in China.Client. We tether two Android phones (Xiaomi 5s) to onelaptop (Dell XPS 13-9360) via USB 3.0. This tethered setupallows us to programmatically run two experiments simul-taneously on the two phones, which appear as network in-terfaces on the laptop and function as link-layer devices. Wemodified the tethering code in Android OS to provide suchmultihoming support. The phones are equipped with SIMcards of two mobile carriers in China, denoted as Carrier Aand Carrier B. Note that in China there are three mainstreamcarriers and we cover two of them; the third carrier uses thesame technology (FDD) and exhibits similar performance asCarrier B based on our pilot on-board tests.3.2.2 Experimental designOur high-level experimental methodology is to perform bulkdata download over TCP. We next detail several importantdesign aspects in terms of what and how to measure.Flow size. We measure two types of TCP downlink flows,including long flows (i.e., fixed duration of 150 seconds) and
4
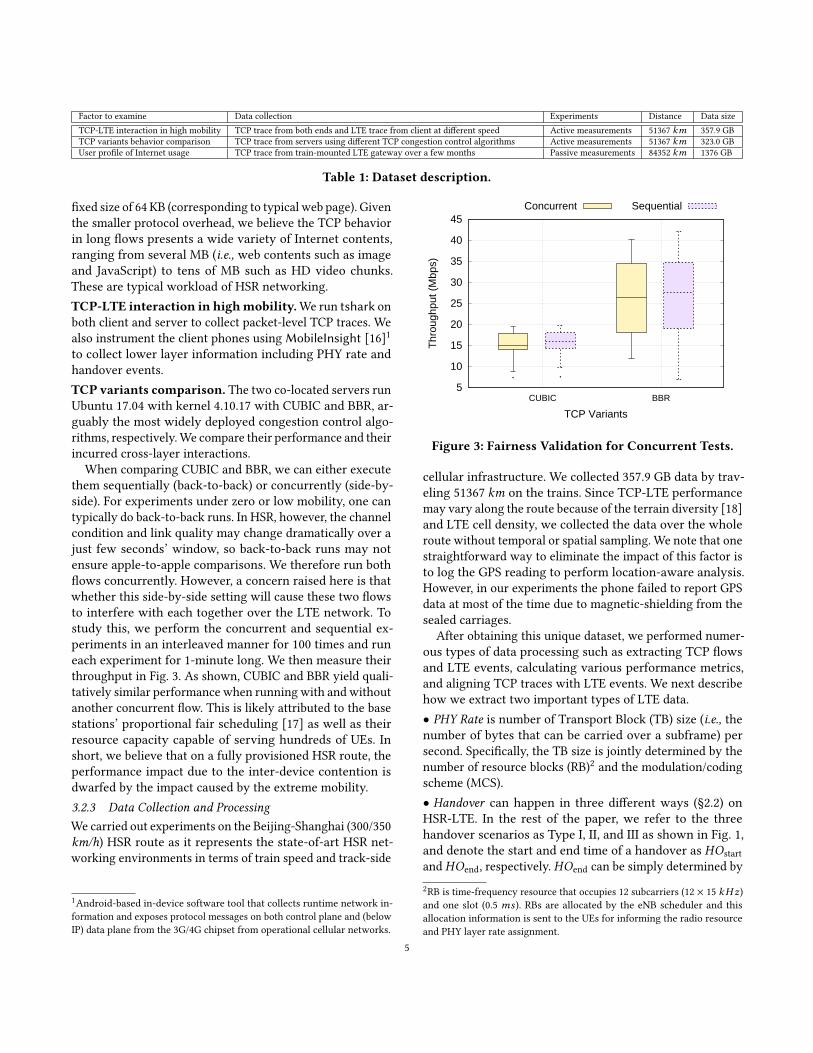
Factor to examine Data collection Experiments Distance Data sizeTCP-LTE interaction in high mobility TCP trace from both ends and LTE trace from client at different speed Active measurements 51367 km 357.9 GBTCP variants behavior comparison TCP trace from servers using different TCP congestion control algorithms Active measurements 51367 km 323.0 GBUser profile of Internet usage TCP trace from train-mounted LTE gateway over a few months Passive measurements 84352 km 1376 GB
Table 1: Dataset description.
fixed size of 64 KB (corresponding to typical web page). Giventhe smaller protocol overhead, we believe the TCP behaviorin long flows presents a wide variety of Internet contents,ranging from several MB (i.e., web contents such as imageand JavaScript) to tens of MB such as HD video chunks.These are typical workload of HSR networking.TCP-LTE interaction in highmobility.We run tshark onboth client and server to collect packet-level TCP traces. Wealso instrument the client phones using MobileInsight [16]1to collect lower layer information including PHY rate andhandover events.TCP variants comparison. The two co-located servers runUbuntu 17.04 with kernel 4.10.17 with CUBIC and BBR, ar-guably the most widely deployed congestion control algo-rithms, respectively.We compare their performance and theirincurred cross-layer interactions.
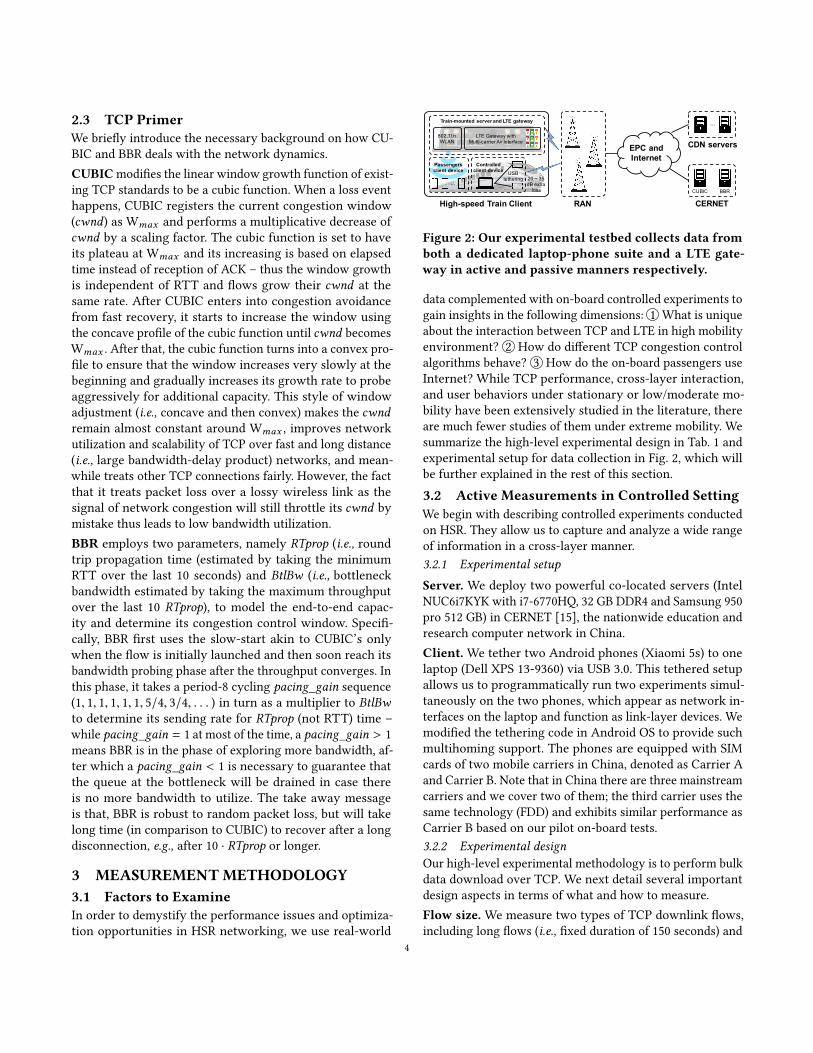
When comparing CUBIC and BBR, we can either executethem sequentially (back-to-back) or concurrently (side-by-side). For experiments under zero or low mobility, one cantypically do back-to-back runs. In HSR, however, the channelcondition and link quality may change dramatically over ajust few seconds’ window, so back-to-back runs may notensure apple-to-apple comparisons. We therefore run bothflows concurrently. However, a concern raised here is thatwhether this side-by-side setting will cause these two flowsto interfere with each together over the LTE network. Tostudy this, we perform the concurrent and sequential ex-periments in an interleaved manner for 100 times and runeach experiment for 1-minute long. We then measure theirthroughput in Fig. 3. As shown, CUBIC and BBR yield quali-tatively similar performance when running with and withoutanother concurrent flow. This is likely attributed to the basestations’ proportional fair scheduling [17] as well as theirresource capacity capable of serving hundreds of UEs. Inshort, we believe that on a fully provisioned HSR route, theperformance impact due to the inter-device contention isdwarfed by the impact caused by the extreme mobility.3.2.3 Data Collection and ProcessingWe carried out experiments on the Beijing-Shanghai (300/350km/h) HSR route as it represents the state-of-art HSR net-working environments in terms of train speed and track-side
1Android-based in-device software tool that collects runtime network in-formation and exposes protocol messages on both control plane and (belowIP) data plane from the 3G/4G chipset from operational cellular networks.
5
10
15
20
25
30
35
40
45
CUBIC BBR
Thr
ough
put (
Mbp
s)
TCP Variants
Concurrent Sequential
Figure 3: Fairness Validation for Concurrent Tests.
cellular infrastructure. We collected 357.9 GB data by trav-eling 51367 km on the trains. Since TCP-LTE performancemay vary along the route because of the terrain diversity [18]and LTE cell density, we collected the data over the wholeroute without temporal or spatial sampling. We note that onestraightforward way to eliminate the impact of this factor isto log the GPS reading to perform location-aware analysis.However, in our experiments the phone failed to report GPSdata at most of the time due to magnetic-shielding from thesealed carriages.
After obtaining this unique dataset, we performed numer-ous types of data processing such as extracting TCP flowsand LTE events, calculating various performance metrics,and aligning TCP traces with LTE events. We next describehow we extract two important types of LTE data.• PHY Rate is number of Transport Block (TB) size (i.e., thenumber of bytes that can be carried over a subframe) persecond. Specifically, the TB size is jointly determined by thenumber of resource blocks (RB)2 and the modulation/codingscheme (MCS).• Handover can happen in three different ways (§2.2) onHSR-LTE. In the rest of the paper, we refer to the threehandover scenarios as Type I, II, and III as shown in Fig. 1,and denote the start and end time of a handover as HOstartandHOend, respectively.HOend can be simply determined by2RB is time-frequency resource that occupies 12 subcarriers (12 × 15 kHz)and one slot (0.5 ms ). RBs are allocated by the eNB scheduler and thisallocation information is sent to the UEs for informing the radio resourceand PHY layer rate assignment.
5
the time when Reconfiguration Connection ReconfigurationComplete message is sent (and logged). However, it is morecomplicated to determine HOstart, especially for unsuccess-ful handover – in practice we don’t have the access to theinformation of RLF timer, which is triggered by radio linkfailure and leads to cell selection (and handover). Given thestreaming nature of our controlled experiment, we hence setthe timestamp of the last LTE downlink packet was perceivedbefore the nearest HOend as HOstart.
We release the dataset used for this study in [19].
3.3 Passive Measurements in the Wild
We complement controlled experiments with passive mea-surements that collect TCP flows from on-board passengers,in order to study the passengers’ network usage and theirflow characteristics “in the wild”. We are unaware of anyprior passive measurement of HSR networking.Since 9/2017, China Railway Corporation launched the
new “Fuxing Hao” trains for the Beijing-Shanghai HSR route.They bring two notable features: cruising at the speed upto 350 km/h [20] that is faster than any other HSR route inChina, and providing free WiFi service via an on-board LTEgateway [21]. Hence, the LTE gateway becomes an idealpoint for our passive data collection in the wild.
The LTE gateway is deployed in a on-train server room byChina Academy of Railway Sciences (CARS). It runs Open-WRT 3.9, and is equipped with 9 SIM cards of three majorChinese mobile carriers for data relay between LTE RAN andon-board WiFi users. It also deploys a 2 × 2 MIMO antennamounted on the top of the carriage. Each new TCP flow isassigned to a SIM card in a round-robin manner.We obtained permission from CARS to run instrumenta-
tion software on the LTE gateway for passive data collection.We deployed tshark to collect packet-level TCP traces (head-ers only) from the LAN port of the gateway. Note that wecannot run MobileInsight or other PC-based cellular perfor-mance monitoring tool such as QXDM [22] because of theOS incompatibility. But we were able to distinguish differentpassengers’ TCP flows from their assigned WLAN IP ad-dresses appearing in the PCAP traces. Overall, we collected1376 GB data covering 84352 km.Ethical Considerations. We take measures as much as wecan to protect users’ privacy. First, all passengers who par-ticipated in our study were presented with informed consentstatement before connecting to the on-board WiFi servicemanaged by the HSR operator. Second, when collecting thetraffic trace, only TCP/IP headers were examined, and theclients’ IPs are private addresses from which no personalidentifiable information could be inferred. Third, this studyhas been approved by the Institutional Review Board at theprimary authors’ institution.
4 BASIC PERFORMANCE STATISTICS4.1 Performance of TCP VariantsWe first utilize the controlled measurement data to studykey network-level performance metrics including goodput,bytes-in-flight (BiF), round trip time, packet loss rate, andout-of-order delay. In particular, we investigate how TCPcongestion control algorithm (CCA) affects the abovemetrics.
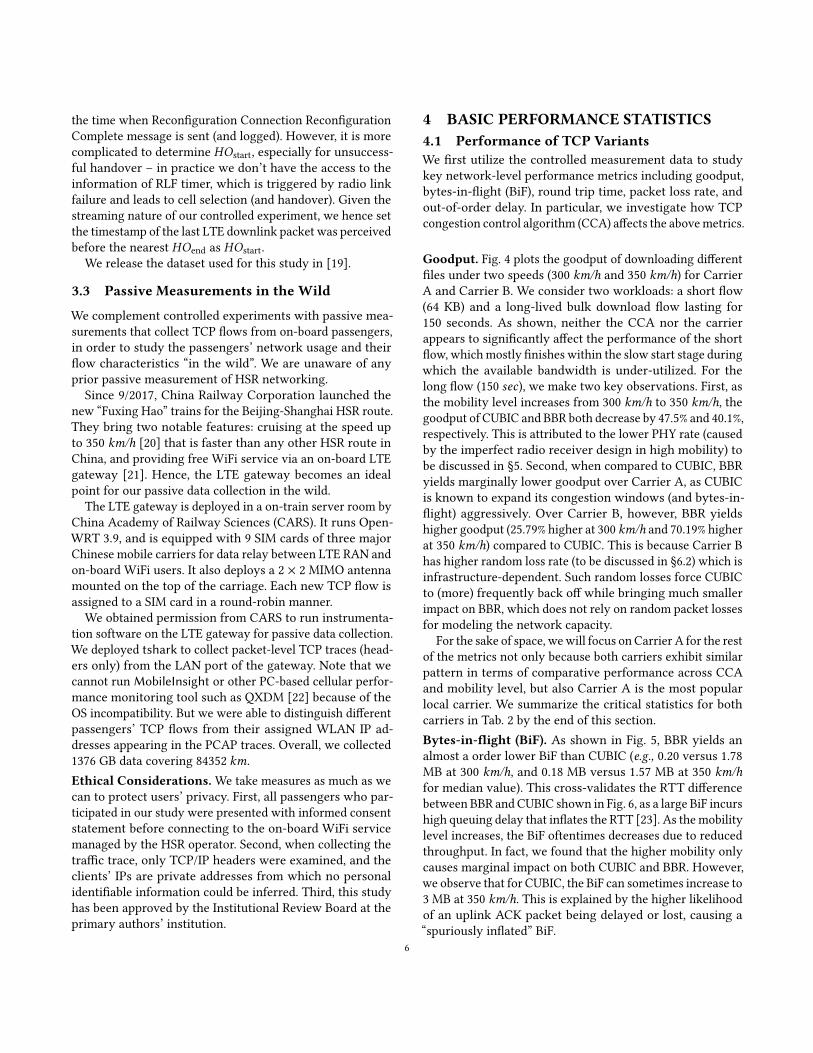
Goodput. Fig. 4 plots the goodput of downloading differentfiles under two speeds (300 km/h and 350 km/h) for CarrierA and Carrier B. We consider two workloads: a short flow(64 KB) and a long-lived bulk download flow lasting for150 seconds. As shown, neither the CCA nor the carrierappears to significantly affect the performance of the shortflow, whichmostly finishes within the slow start stage duringwhich the available bandwidth is under-utilized. For thelong flow (150 sec), we make two key observations. First, asthe mobility level increases from 300 km/h to 350 km/h, thegoodput of CUBIC and BBR both decrease by 47.5% and 40.1%,respectively. This is attributed to the lower PHY rate (causedby the imperfect radio receiver design in high mobility) tobe discussed in §5. Second, when compared to CUBIC, BBRyields marginally lower goodput over Carrier A, as CUBICis known to expand its congestion windows (and bytes-in-flight) aggressively. Over Carrier B, however, BBR yieldshigher goodput (25.79% higher at 300 km/h and 70.19% higherat 350 km/h) compared to CUBIC. This is because Carrier Bhas higher random loss rate (to be discussed in §6.2) which isinfrastructure-dependent. Such random losses force CUBICto (more) frequently back off while bringing much smallerimpact on BBR, which does not rely on random packet lossesfor modeling the network capacity.
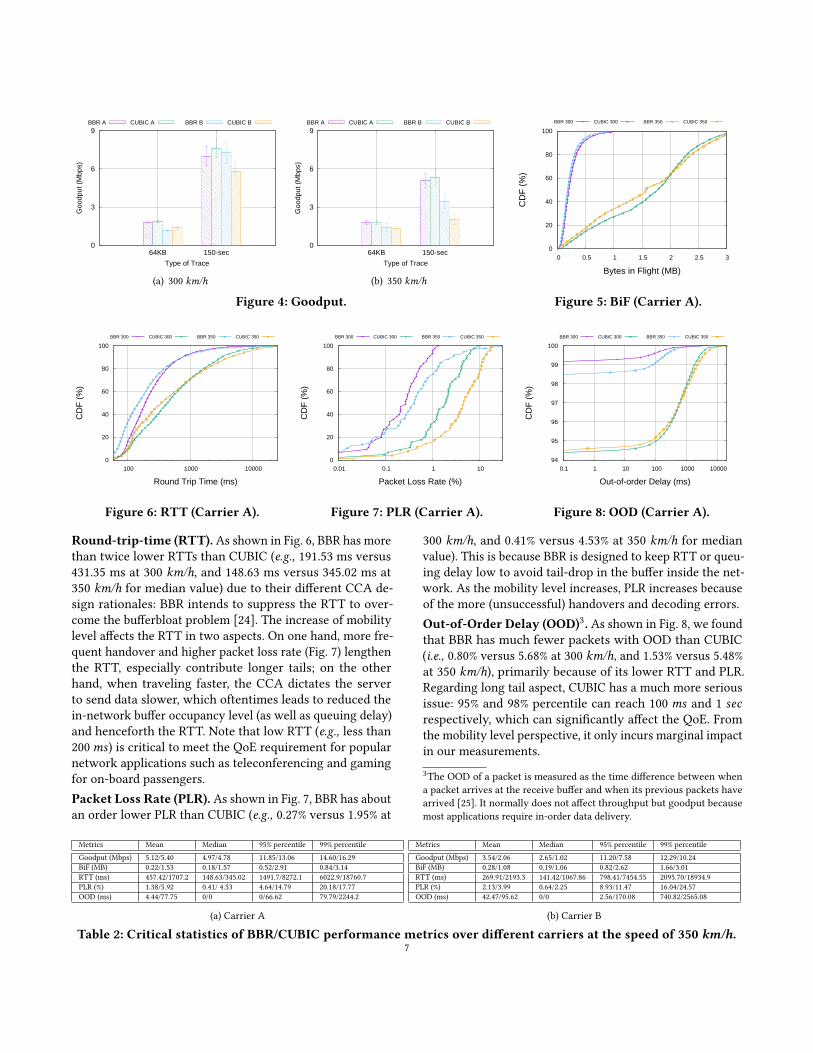
For the sake of space, wewill focus on Carrier A for the restof the metrics not only because both carriers exhibit similarpattern in terms of comparative performance across CCAand mobility level, but also Carrier A is the most popularlocal carrier. We summarize the critical statistics for bothcarriers in Tab. 2 by the end of this section.Bytes-in-flight (BiF). As shown in Fig. 5, BBR yields analmost a order lower BiF than CUBIC (e.g., 0.20 versus 1.78MB at 300 km/h, and 0.18 MB versus 1.57 MB at 350 km/hfor median value). This cross-validates the RTT differencebetween BBR and CUBIC shown in Fig. 6, as a large BiF incurshigh queuing delay that inflates the RTT [23]. As the mobilitylevel increases, the BiF oftentimes decreases due to reducedthroughput. In fact, we found that the higher mobility onlycauses marginal impact on both CUBIC and BBR. However,we observe that for CUBIC, the BiF can sometimes increase to3 MB at 350 km/h. This is explained by the higher likelihoodof an uplink ACK packet being delayed or lost, causing a“spuriously inflated” BiF.
6
0
3
6
9
64KB 150-sec
Goo
dput
(M
bps)
Type of Trace
BBR A CUBIC A BBR B CUBIC B
(a) 300 km/h
0
3
6
9
64KB 150-sec
Goo
dput
(M
bps)
Type of Trace
BBR A CUBIC A BBR B CUBIC B
(b) 350 km/h
Figure 4: Goodput.
0
20
40
60
80
100
0 0.5 1 1.5 2 2.5 3
CD
F (
%)
Bytes in Flight (MB)
BBR 300 CUBIC 300 BBR 350 CUBIC 350
Figure 5: BiF (Carrier A).
0
20
40
60
80
100
100 1000 10000
CD
F (
%)
Round Trip Time (ms)
BBR 300 CUBIC 300 BBR 350 CUBIC 350
Figure 6: RTT (Carrier A).
0
20
40
60
80
100
0.01 0.1 1 10
CD
F (
%)
Packet Loss Rate (%)
BBR 300 CUBIC 300 BBR 350 CUBIC 350
Figure 7: PLR (Carrier A).
94
95
96
97
98
99
100
0.1 1 10 100 1000 10000
CD
F (
%)
Out-of-order Delay (ms)
BBR 300 CUBIC 300 BBR 350 CUBIC 350
Figure 8: OOD (Carrier A).
Round-trip-time (RTT). As shown in Fig. 6, BBR has morethan twice lower RTTs than CUBIC (e.g., 191.53 ms versus431.35 ms at 300 km/h, and 148.63 ms versus 345.02 ms at350 km/h for median value) due to their different CCA de-sign rationales: BBR intends to suppress the RTT to over-come the bufferbloat problem [24]. The increase of mobilitylevel affects the RTT in two aspects. On one hand, more fre-quent handover and higher packet loss rate (Fig. 7) lengthenthe RTT, especially contribute longer tails; on the otherhand, when traveling faster, the CCA dictates the serverto send data slower, which oftentimes leads to reduced thein-network buffer occupancy level (as well as queuing delay)and henceforth the RTT. Note that low RTT (e.g., less than200ms) is critical to meet the QoE requirement for popularnetwork applications such as teleconferencing and gamingfor on-board passengers.Packet Loss Rate (PLR). As shown in Fig. 7, BBR has aboutan order lower PLR than CUBIC (e.g., 0.27% versus 1.95% at
300 km/h, and 0.41% versus 4.53% at 350 km/h for medianvalue). This is because BBR is designed to keep RTT or queu-ing delay low to avoid tail-drop in the buffer inside the net-work. As the mobility level increases, PLR increases becauseof the more (unsuccessful) handovers and decoding errors.Out-of-Order Delay (OOD)3. As shown in Fig. 8, we foundthat BBR has much fewer packets with OOD than CUBIC(i.e., 0.80% versus 5.68% at 300 km/h, and 1.53% versus 5.48%at 350 km/h), primarily because of its lower RTT and PLR.Regarding long tail aspect, CUBIC has a much more seriousissue: 95% and 98% percentile can reach 100 ms and 1 secrespectively, which can significantly affect the QoE. Fromthe mobility level perspective, it only incurs marginal impactin our measurements.3The OOD of a packet is measured as the time difference between whena packet arrives at the receive buffer and when its previous packets havearrived [25]. It normally does not affect throughput but goodput becausemost applications require in-order data delivery.
Metrics Mean Median 95% percentile 99% percentileGoodput (Mbps) 5.12/5.40 4.97/4.78 11.85/13.06 14.60/16.29BiF (MB) 0.22/1.53 0.18/1.57 0.52/2.91 0.84/3.14RTT (ms) 457.42/1707.2 148.63/345.02 1491.7/8272.1 6022.9/18760.7PLR (%) 1.38/5.92 0.41/ 4.53 4.64/14.79 20.18/17.77OOD (ms) 4.44/77.75 0/0 0/66.62 79.79/2244.2
(a) Carrier A
Metrics Mean Median 95% percentile 99% percentileGoodput (Mbps) 3.54/2.06 2.65/1.02 11.20/7.58 12.29/10.24BiF (MB) 0.28/1.08 0.19/1.06 0.82/2.62 1.66/3.01RTT (ms) 269.91/2193.3 141.42/1067.86 798.41/7454.55 2095.70/18934.9PLR (%) 2.13/3.99 0.64/2.25 8.93/11.47 16.04/24.57OOD (ms) 42.47/95.62 0/0 2.56/170.08 740.82/2565.08
(b) Carrier B
Table 2: Critical statistics of BBR/CUBIC performance metrics over different carriers at the speed of 350 km/h.7
0
25
50
75
100
Image Audio Video Application Text
Per
cent
age
(%)
Type
Overall Flow SizeNumber of Flow
(a) Content-type
0
20
40
60
80
100
1 10 100 1000 10000 100000 1x10⁶ 1x10⁷ 1x10⁸ 1x10⁹
CD
F (
%)
Size (Bytes)
ApplicationAudioImage
TextVideo
(b) Object Size
0
20
40
60
80
100
0 0.2 0.4 0.6 0.8 1
CD
F (
%)
Throughput (Mbps)
ApplicationAudioImage
TextVideo
(c) Object Data Rate for Objects ≥ 16 KB
Figure 9: Web Content Profile.
Summary of Key Findings. Our study show that increas-ing the speed from 300 km/h to 350 km/h reduces the TCPgoodput by above 40% and increases the loss rate by up to92.97%, while does not significantly affect the RTT; in a high-mobility environment, BBR performs reasonably well by pre-serving its key advantages (compared to CUBIC) such as be-ing robust to random losses and incurring a smaller amountof bytes-in-flight to potentially mitigate the bufferbloat issue,and thus more efficient in network utilization.
4.2 User, Flow and Traffic Characteristics
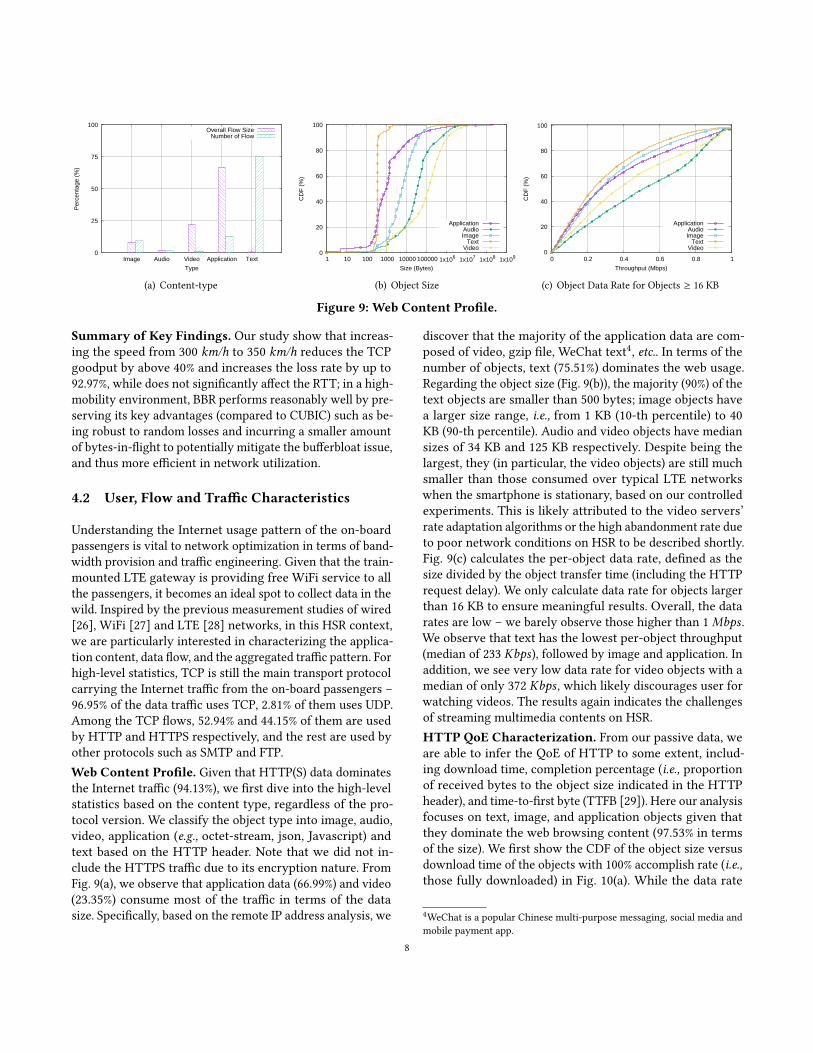
Understanding the Internet usage pattern of the on-boardpassengers is vital to network optimization in terms of band-width provision and traffic engineering. Given that the train-mounted LTE gateway is providing free WiFi service to allthe passengers, it becomes an ideal spot to collect data in thewild. Inspired by the previous measurement studies of wired[26], WiFi [27] and LTE [28] networks, in this HSR context,we are particularly interested in characterizing the applica-tion content, data flow, and the aggregated traffic pattern. Forhigh-level statistics, TCP is still the main transport protocolcarrying the Internet traffic from the on-board passengers –96.95% of the data traffic uses TCP, 2.81% of them uses UDP.Among the TCP flows, 52.94% and 44.15% of them are usedby HTTP and HTTPS respectively, and the rest are used byother protocols such as SMTP and FTP.Web Content Profile. Given that HTTP(S) data dominatesthe Internet traffic (94.13%), we first dive into the high-levelstatistics based on the content type, regardless of the pro-tocol version. We classify the object type into image, audio,video, application (e.g., octet-stream, json, Javascript) andtext based on the HTTP header. Note that we did not in-clude the HTTPS traffic due to its encryption nature. FromFig. 9(a), we observe that application data (66.99%) and video(23.35%) consume most of the traffic in terms of the datasize. Specifically, based on the remote IP address analysis, we
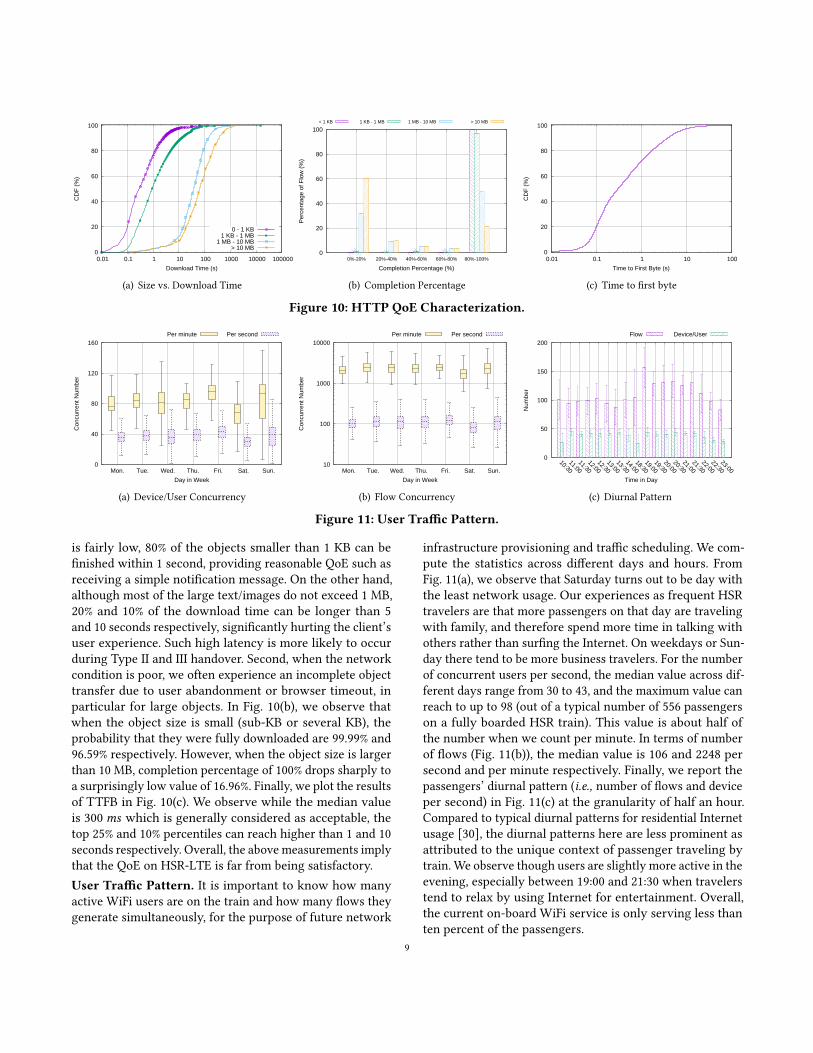
discover that the majority of the application data are com-posed of video, gzip file, WeChat text4, etc.. In terms of thenumber of objects, text (75.51%) dominates the web usage.Regarding the object size (Fig. 9(b)), the majority (90%) of thetext objects are smaller than 500 bytes; image objects havea larger size range, i.e., from 1 KB (10-th percentile) to 40KB (90-th percentile). Audio and video objects have mediansizes of 34 KB and 125 KB respectively. Despite being thelargest, they (in particular, the video objects) are still muchsmaller than those consumed over typical LTE networkswhen the smartphone is stationary, based on our controlledexperiments. This is likely attributed to the video servers’rate adaptation algorithms or the high abandonment rate dueto poor network conditions on HSR to be described shortly.Fig. 9(c) calculates the per-object data rate, defined as thesize divided by the object transfer time (including the HTTPrequest delay). We only calculate data rate for objects largerthan 16 KB to ensure meaningful results. Overall, the datarates are low – we barely observe those higher than 1Mbps .We observe that text has the lowest per-object throughput(median of 233 Kbps), followed by image and application. Inaddition, we see very low data rate for video objects with amedian of only 372 Kbps , which likely discourages user forwatching videos. The results again indicates the challengesof streaming multimedia contents on HSR.HTTP QoE Characterization. From our passive data, weare able to infer the QoE of HTTP to some extent, includ-ing download time, completion percentage (i.e., proportionof received bytes to the object size indicated in the HTTPheader), and time-to-first byte (TTFB [29]). Here our analysisfocuses on text, image, and application objects given thatthey dominate the web browsing content (97.53% in termsof the size). We first show the CDF of the object size versusdownload time of the objects with 100% accomplish rate (i.e.,those fully downloaded) in Fig. 10(a). While the data rate
4WeChat is a popular Chinese multi-purpose messaging, social media andmobile payment app.
8
0
20
40
60
80
100
0.01 0.1 1 10 100 1000 10000 100000
CD
F (
%)
Download Time (s)
0 - 1 KB1 KB - 1 MB
1 MB - 10 MB> 10 MB
(a) Size vs. Download Time
0
20
40
60
80
100
0%-20% 20%-40% 40%-60% 60%-80% 80%-100%
Per
cent
age
of F
low
(%
)
Completion Percentage (%)
< 1 KB 1 KB - 1 MB 1 MB - 10 MB > 10 MB
(b) Completion Percentage
0
20
40
60
80
100
0.01 0.1 1 10 100
CD
F (
%)
Time to First Byte (s)
(c) Time to first byte
Figure 10: HTTP QoE Characterization.
0
40
80
120
160
Mon. Tue. Wed. Thu. Fri. Sat. Sun.
Con
curr
ent N
umbe
r
Day in Week
Per minute Per second
(a) Device/User Concurrency
10
100
1000
10000
Mon. Tue. Wed. Thu. Fri. Sat. Sun.
Con
curr
ent N
umbe
r
Day in Week
Per minute Per second
(b) Flow Concurrency
0
50
100
150
200
10:3011:00
11:3012:00
12:3013:00
13:3014:00
18:3019:00
19:3020:00
20:3021:00
21:3022:00
22:3023:00
Num
ber
Time in Day
Flow Device/User
(c) Diurnal Pattern
Figure 11: User Traffic Pattern.
is fairly low, 80% of the objects smaller than 1 KB can befinished within 1 second, providing reasonable QoE such asreceiving a simple notification message. On the other hand,although most of the large text/images do not exceed 1 MB,20% and 10% of the download time can be longer than 5and 10 seconds respectively, significantly hurting the client’suser experience. Such high latency is more likely to occurduring Type II and III handover. Second, when the networkcondition is poor, we often experience an incomplete objecttransfer due to user abandonment or browser timeout, inparticular for large objects. In Fig. 10(b), we observe thatwhen the object size is small (sub-KB or several KB), theprobability that they were fully downloaded are 99.99% and96.59% respectively. However, when the object size is largerthan 10 MB, completion percentage of 100% drops sharply toa surprisingly low value of 16.96%. Finally, we plot the resultsof TTFB in Fig. 10(c). We observe while the median valueis 300ms which is generally considered as acceptable, thetop 25% and 10% percentiles can reach higher than 1 and 10seconds respectively. Overall, the above measurements implythat the QoE on HSR-LTE is far from being satisfactory.User Traffic Pattern. It is important to know how manyactive WiFi users are on the train and how many flows theygenerate simultaneously, for the purpose of future network
infrastructure provisioning and traffic scheduling. We com-pute the statistics across different days and hours. FromFig. 11(a), we observe that Saturday turns out to be day withthe least network usage. Our experiences as frequent HSRtravelers are that more passengers on that day are travelingwith family, and therefore spend more time in talking withothers rather than surfing the Internet. On weekdays or Sun-day there tend to be more business travelers. For the numberof concurrent users per second, the median value across dif-ferent days range from 30 to 43, and the maximum value canreach to up to 98 (out of a typical number of 556 passengerson a fully boarded HSR train). This value is about half ofthe number when we count per minute. In terms of numberof flows (Fig. 11(b)), the median value is 106 and 2248 persecond and per minute respectively. Finally, we report thepassengers’ diurnal pattern (i.e., number of flows and deviceper second) in Fig. 11(c) at the granularity of half an hour.Compared to typical diurnal patterns for residential Internetusage [30], the diurnal patterns here are less prominent asattributed to the unique context of passenger traveling bytrain. We observe though users are slightly more active in theevening, especially between 19:00 and 21:30 when travelerstend to relax by using Internet for entertainment. Overall,the current on-board WiFi service is only serving less thanten percent of the passengers.
9
4.3 Remarks on Active-Passive MeasurementsWhile we take both active and passive measurements fromthe same series of high-speed trains, it is difficult to performthe direct comparison between them. For instance, we ob-serve much lower throughput in passive measurements thanactive ones (300 Kbps vs. 5Mbps), which can be attributed tothe large (HTTP/TCP) protocol overhead for short flows andpotential performance bottleneck on either WiFi links, orthe inherently deficient design of the multi-tenant antennasystem (shared by 9 SIM cards) and the flow-level round-robin flow scheduling mechanism. The high-level statisticalresults from the active measurements will shed light on thechoice of TCP variants and even multi-path transmissionmechanism development atop for application-specific serverdeployment for high mobility data networking in general.
5 TCP-LTE ANALYSIS IN HIGHMOBILITYFrom this section, we start to examine the interaction ofTCP-LTE performance from a handover-centric view underdifferent mobility level in a finer-grained manner. Specifi-cally, we use CUBIC as a case study in this section, and deferits comparative performance study with BBR in §6.
5.1 A Mobility-level ViewIn our study, mobility level is categorized as stationary, lowmobility (200 km/h) and high mobility (300 and 350 km/h).Regarding the dataset, it is worthwhile to note that: 1 Thespeed of choice is at which train maintains in most of thedata collection time during the whole journey; 2 The lowmobility (i.e., 200 km/h) data was not common and it wascollected over the same route (i.e., Beijing-Shanghai) on thedate when train happens to travel at that speed after snow-ing for safety reasons; 3 We collect the data in stationarycase because its signal has experienced the same path loss(including the carriage penetration loss) and thus it servesas a more appropriate baseline. From Tab. 3, we make twokey observations as the mobility level increases: First, duringthe period without handover, TCP throughput (Mbps) dropsfrom 13.25 to 8.44 (36.3%), 6.95 (47.6%) and 2.22 (83.2%) asthe mobility increases from static to low (200 km/h), high(300 km/h) and even higher (350 km/h) respectively in a non-linear fashion, which is also reflected in the PHY rate. Infact, they are logically correlated – the increasing mobility
Speed Throughput PHY rate HO Duration (s) HO count per 150s-trace(km/h) All w/o HO w/o HO I II III I II III
0 13.25 13.25 14.68 — — — — — —200 8.44 8.63 10.19 0.35 3.13 4.03 4.41 0.18 0.18300 6.95 7.21 8.89 0.16 2.09 3.98 9.36 0.96 0.84350 2.22 2.35 3.00 0.21 1.91 5.49 14.70 2.00 1.49
Table 3: TCP-LTE performance and handover statis-tics under different mobility level regarding to no(w/o), successful (I), RLF (II) and NAS (III) handover.
brings severer Doppler spread and channel estimation error,and thus cause higher BER and makes the basestation moreconservative in assigning MCS, reducing the number of TBand thus TCP throughput. We note that UDP will be a betterchoice because it excludes the impact of congestion controlbehavior. However, in our experiments we found the carrierwill limit the UDP traffic rate (to 1Mbps) from time to time.Second, there are more and longer periods of (unsuccessful)handover in the 150-sec traces. Their impact on throughputwill be further analyzed later in this section.
In the rest of the paper, we focus on analyzing the 350km/h traces as they represent the most challenging HSRnetworking scenario for today.
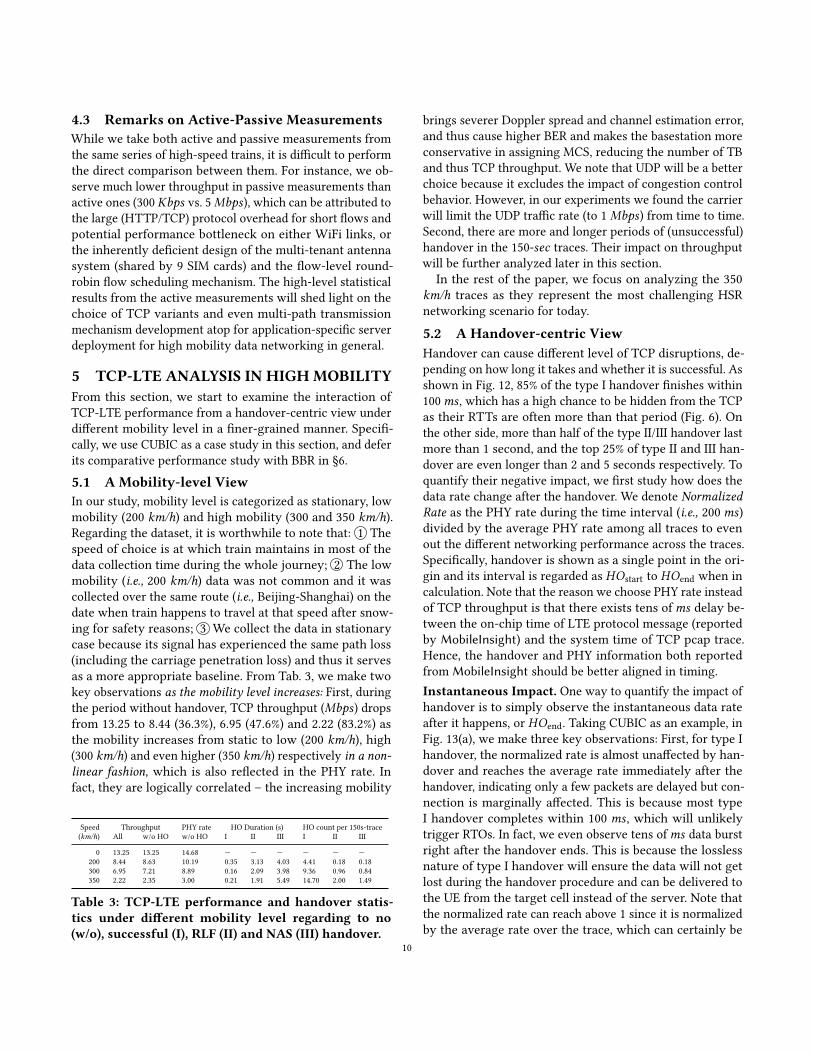
5.2 A Handover-centric ViewHandover can cause different level of TCP disruptions, de-pending on how long it takes and whether it is successful. Asshown in Fig. 12, 85% of the type I handover finishes within100ms , which has a high chance to be hidden from the TCPas their RTTs are often more than that period (Fig. 6). Onthe other side, more than half of the type II/III handover lastmore than 1 second, and the top 25% of type II and III han-dover are even longer than 2 and 5 seconds respectively. Toquantify their negative impact, we first study how does thedata rate change after the handover. We denote NormalizedRate as the PHY rate during the time interval (i.e., 200ms)divided by the average PHY rate among all traces to evenout the different networking performance across the traces.Specifically, handover is shown as a single point in the ori-gin and its interval is regarded as HOstart to HOend when incalculation. Note that the reason we choose PHY rate insteadof TCP throughput is that there exists tens ofms delay be-tween the on-chip time of LTE protocol message (reportedby MobileInsight) and the system time of TCP pcap trace.Hence, the handover and PHY information both reportedfromMobileInsight should be better aligned in timing.Instantaneous Impact. One way to quantify the impact ofhandover is to simply observe the instantaneous data rateafter it happens, or HOend. Taking CUBIC as an example, inFig. 13(a), we make three key observations: First, for type Ihandover, the normalized rate is almost unaffected by han-dover and reaches the average rate immediately after thehandover, indicating only a few packets are delayed but con-nection is marginally affected. This is because most typeI handover completes within 100 ms , which will unlikelytrigger RTOs. In fact, we even observe tens ofms data burstright after the handover ends. This is because the losslessnature of type I handover will ensure the data will not getlost during the handover procedure and can be delivered tothe UE from the target cell instead of the server. Note thatthe normalized rate can reach above 1 since it is normalizedby the average rate over the trace, which can certainly be
10
0
20
40
60
80
100
1 10 100 1000 10000
CD
F (
%)
Handover Duration (ms)
Type I Type II Type III
Figure 12: Handover Duration.
0
0.2
0.4
0.6
0.8
1
1.2
1.4
0 1 2 3 4 5 6 7 8
Nor
mal
ized
Rat
e
Time (s)
Type I Type II Type III
(a) Instantaneous impact
0
0.2
0.4
0.6
0.8
1
1.2
1.4
0 1 2 3 4 5 6 7 8
Nor
mal
ized
Rat
e
Window (s)
Type I Type II Type III
(b) Near effect
Figure 13: Handover-centric Analysis of CUBIC.
0
0.2
0.4
0.6
0.8
1
1.2
1.4
0 1 2 3 4 5 6 7 8
Nor
mal
ized
Rat
e
Time (s)
Type I Type II Type III
(a) Instantaneous Impact
0
0.2
0.4
0.6
0.8
1
1.2
1.4
0 1 2 3 4 5 6 7 8
Nor
mal
ized
Rat
e
Window (s)
Type I Type II Type III
(b) Near effect
Figure 14: Handover-centric Analysis of BBR.
0
0.5
1
1.5
2
2.5
3
3.5
4
0 1 2 3 4 5 6 7 8
PH
Y R
ate
(Mbp
s)
Time (s)
CUBIC Type ICUBIC Type II
CUBIC Type IIIBBR Type I
BBR Type IIBBR Type III
Figure 15: Comparative Performance.
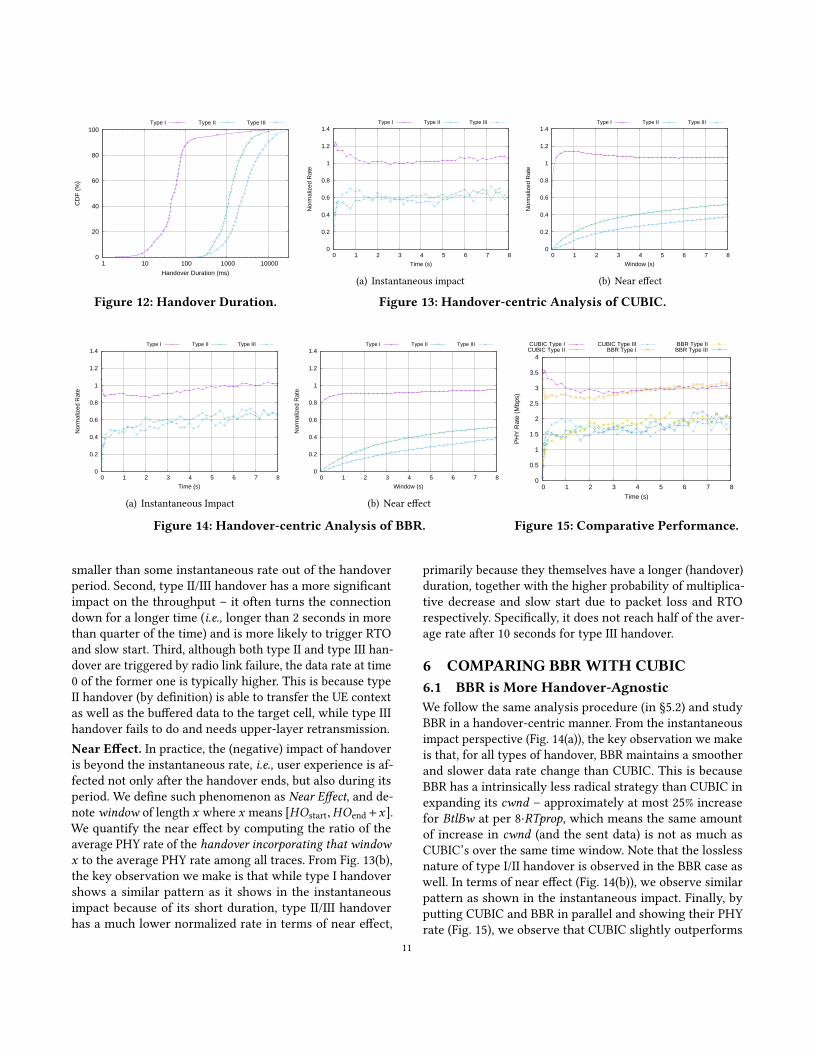
smaller than some instantaneous rate out of the handoverperiod. Second, type II/III handover has a more significantimpact on the throughput – it often turns the connectiondown for a longer time (i.e., longer than 2 seconds in morethan quarter of the time) and is more likely to trigger RTOand slow start. Third, although both type II and type III han-dover are triggered by radio link failure, the data rate at time0 of the former one is typically higher. This is because typeII handover (by definition) is able to transfer the UE contextas well as the buffered data to the target cell, while type IIIhandover fails to do and needs upper-layer retransmission.Near Effect. In practice, the (negative) impact of handoveris beyond the instantaneous rate, i.e., user experience is af-fected not only after the handover ends, but also during itsperiod. We define such phenomenon as Near Effect, and de-note window of length x where x means [HOstart,HOend+x].We quantify the near effect by computing the ratio of theaverage PHY rate of the handover incorporating that windowx to the average PHY rate among all traces. From Fig. 13(b),the key observation we make is that while type I handovershows a similar pattern as it shows in the instantaneousimpact because of its short duration, type II/III handoverhas a much lower normalized rate in terms of near effect,
primarily because they themselves have a longer (handover)duration, together with the higher probability of multiplica-tive decrease and slow start due to packet loss and RTOrespectively. Specifically, it does not reach half of the aver-age rate after 10 seconds for type III handover.
6 COMPARING BBRWITH CUBIC6.1 BBR is More Handover-AgnosticWe follow the same analysis procedure (in §5.2) and studyBBR in a handover-centric manner. From the instantaneousimpact perspective (Fig. 14(a)), the key observation we makeis that, for all types of handover, BBR maintains a smootherand slower data rate change than CUBIC. This is becauseBBR has a intrinsically less radical strategy than CUBIC inexpanding its cwnd – approximately at most 25% increasefor BtlBw at per 8·RTprop, which means the same amountof increase in cwnd (and the sent data) is not as much asCUBIC’s over the same time window. Note that the losslessnature of type I/II handover is observed in the BBR case aswell. In terms of near effect (Fig. 14(b)), we observe similarpattern as shown in the instantaneous impact. Finally, byputting CUBIC and BBR in parallel and showing their PHYrate (Fig. 15), we observe that CUBIC slightly outperforms
11
0
1000
2000
3000
4000
5000
0 20 40 60 80 100 120 140
Late
ncy
(mse
c)
Time (sec)
BBR RTpropRound trip time
(a) Round-trip propagation time
0
10
20
30
40
50
0 20 40 60 80 100 120 140
Dat
a R
ate
(Mbp
s)
Time (s)
BBR BtlBwThroughput
(b) Bottleneck bandwidth
Figure 16: BBR’s Parameter Trace.
0
20
40
60
80
100
0 0.2 0.4 0.6 0.8 1 1.2 1.4 1.6
CD
F (
%)
RTT (s)
Trace 1Gamma (0.6,2.5) fitted to Trace 1
Trace 2Gamma (0.35,2.0) fitted to Trace 2
Trace 3Gamma (0.7,7.0) fitted to Trace 3
Figure 17: RTT Distribution.
BBR for all type of handover in the early stage. However, BBRstarts to surpass CUBIC after 3 seconds in all cases becauseit paces smoothly regardless of (random) packet loss.Remarks.We would like to point out that type III handoverfor BBR could potentially represent the worst situation inour study: after the long network disconnection (i.e., exceeds10 ·RTprop with certain probability), BBR has to recover fromthe BtlBw of nearly 0, which is a much smaller basis thantype I/II in expanding its cwnd . We observe such phenom-enon (e.g., the normalized instantaneous rate after type IIIhandover cannot even recover to 0.25 after 8 seconds) ina few collected traces, which is however not reflected instatistics (Fig. 14(a)) due to their relatively small proportion.
6.2 BBR is More Carrier-AgnosticRecall that in 150-sec trace of 350 km/h (Fig. 4(b)), BBR hascomparable goodput (Mbps) with CUBIC over Carrier A (5.12vs. 5.40), but outperforms around 70% than CUBIC (3.54 vs.2.06) over Carrier B. Intuitively, CUBIC could suffer over alossy connection, while BBR is insensitive to packet loss. Toverify the fact that BBR outperforms CUBIC in Carrier B isbecause the cellular infrastructure causes higher random loss,we carry a concurrent test in both static and 350 km/h usingthe same setup as the controlled experiment described in§3.2, except that each TCP packet only carries 1 byte of dataand sends at a stable rate of 20 packets per second to avoidself-inflicted congestion. The results summarized in Tab. 4show that while Carrier B does cause higher packet lossin non-congestion conditions, potentially due to its poorermobility support, less network coverage, etc., which explainsthe relatively poor CUBIC performance over Carrier B.
Flow setup Static A HSR A Static B HSR BLoss rate 0.008% 0.21% 0.008% 1.35%
Table 4: Random loss rate for concurrent flows.
6.3 BBR is Suboptimal on High-speed Rails
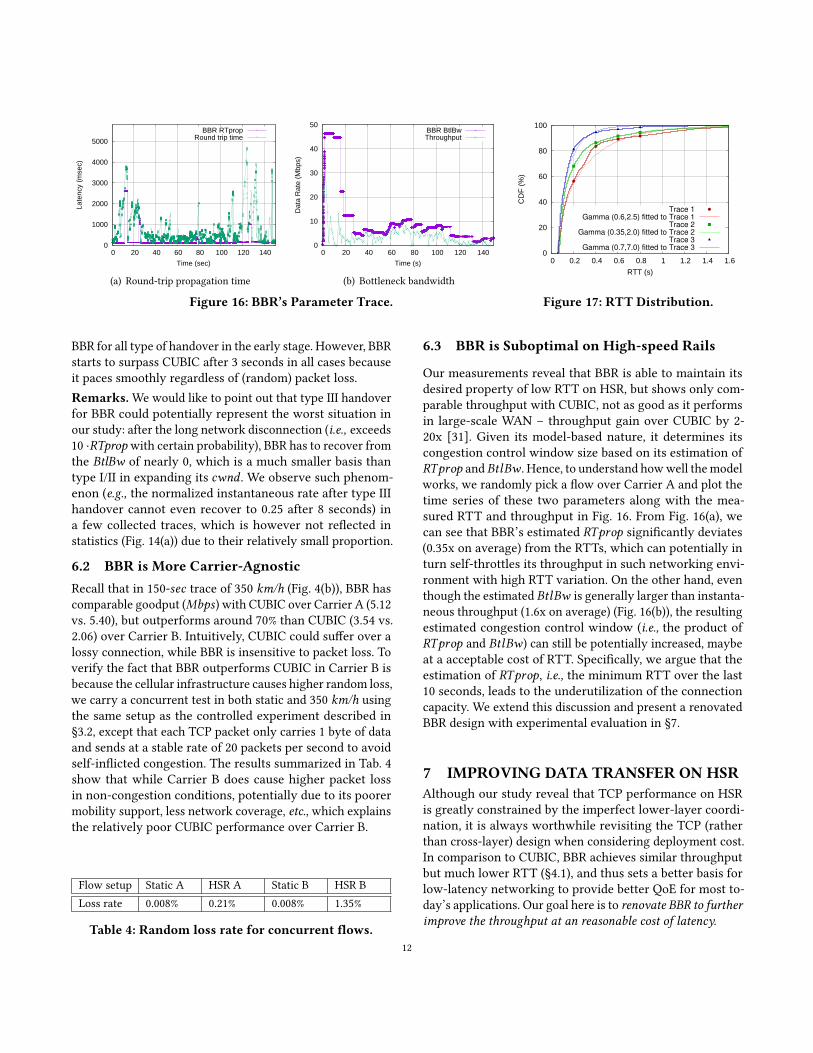
Our measurements reveal that BBR is able to maintain itsdesired property of low RTT on HSR, but shows only com-parable throughput with CUBIC, not as good as it performsin large-scale WAN – throughput gain over CUBIC by 2-20x [31]. Given its model-based nature, it determines itscongestion control window size based on its estimation ofRTprop andBtlBw . Hence, to understand howwell themodelworks, we randomly pick a flow over Carrier A and plot thetime series of these two parameters along with the mea-sured RTT and throughput in Fig. 16. From Fig. 16(a), wecan see that BBR’s estimated RTprop significantly deviates(0.35x on average) from the RTTs, which can potentially inturn self-throttles its throughput in such networking envi-ronment with high RTT variation. On the other hand, eventhough the estimated BtlBw is generally larger than instanta-neous throughput (1.6x on average) (Fig. 16(b)), the resultingestimated congestion control window (i.e., the product ofRTprop and BtlBw) can still be potentially increased, maybeat a acceptable cost of RTT. Specifically, we argue that theestimation of RTprop, i.e., the minimum RTT over the last10 seconds, leads to the underutilization of the connectioncapacity. We extend this discussion and present a renovatedBBR design with experimental evaluation in §7.
7 IMPROVING DATA TRANSFER ON HSRAlthough our study reveal that TCP performance on HSRis greatly constrained by the imperfect lower-layer coordi-nation, it is always worthwhile revisiting the TCP (ratherthan cross-layer) design when considering deployment cost.In comparison to CUBIC, BBR achieves similar throughputbut much lower RTT (§4.1), and thus sets a better basis forlow-latency networking to provide better QoE for most to-day’s applications. Our goal here is to renovate BBR to furtherimprove the throughput at an reasonable cost of latency.
12
7.1 BBR+ DesignThe design of BBR is intrinsically suboptimal in networkingenvironment where both bandwidth and RTT change rapidly,e.g., HSR in our study, because both its bandwidth probingstrategy and round-trip propagation time estimation do notadapt to the network dynamics in a agile way. Herein, weimprove the BBR design in the following two aspects.Cycling pacinд_дain. Recall that in §2.3, default cyclingpacing_gain sequence makes BBR pace the sending rate ac-cording to the drain rate (i.e., BtlBw) to keep the bottleneckbuffer nearly empty in most of the time. This mechanism isdesigned for a connection with relatively stable BtlBw, notthe case in our scenario. Therefore, we adjust the sequenceto be more radical to adapt to the HSR environment:
3/2, 1/2, 3/2, 1/2, . . .
RTprop. As discussed in §6.3, the RTprop BBR estimates istoo conservative in HSR scenario when it has to be regardedas a constant over the last 10 seconds since the theoreticalfoundation of BBR is the local stability of RTprop and BtlBw.Our intuition is that RTprop needs a compensation termaccounting for the network dynamics and we observe thatthe RTTs in each trace approximately follow a shifted gammadistribution (shifted byminRTT ) with a fat tail. In Fig. 17, weshow the randomly chosen three BBR traces (with disparatemean and variance of RTTs) along with their correspondingfitted shifted gamma distributions with different parameters,denoted by Gamma(α , β). For a random variable following ashifted gamma distribution, we have:
E(X ) = minX +√αVar(X ),
whereα is the shape parameter of gamma distribution. There-fore,
√αVar(RTT ) becomes the natural compensation term
to let us get closer to the expectation of actual RTprop. Hence,we have:
RTprop = minRTT + λ√Var(RTT )
Here, Var(X ) = E(X 2) − E(X )2, and λ =√α is a tunable
parameter which allows us to trade off between bandwidthand RTT. Specifically, we estimate E(X ) by using EWMA(i.e., Exponentially Weighted Moving Average) with time-based weight decay instead of classical EWMA so that theassigned exponentially decayed weights are irrelevant to thesending rate but determined by the time elapsed:
E(X ) ≈ 1c
∫ t0
−∞e−c(t0−t )X (t)dt
Note that the two terms in the new RTprop estimation arecomplementary to some extent: the former term monitorsthe long-term bottleneck buffer occupancy, while the com-pensation term captures the short-term network dynamics.
Congestion Control BBR BBR+(λ=1/8) BBR+(λ=1/2)Goodput (Mean ± Std inMbps) 4.44 ± 3.09 5.49 ± 3.26 6.06 ± 3.25RTT (25/50/75th percentile in ms) 76/149/311 80/242/694 98/333/1090
Table 5: Performance Comparison of BBR and BBR+.
7.2 EvaluationWe evaluate BBR+ in the same experimental setting in §3.2,except that the servers run BBR, BBR+(λ=1/8) and BBR+(λ=1/2)respectively, where λ is the constant used for calculation ofRTprop. The experimental results summarized in Tab. 5 showthat λ is effectively controlling the amount of packets to befilled into the (bottleneck) buffers for throughput gain at thecost of RTT – as λ increase from 1/8 to 1/2, its throughputgain over BBR also increases from 24% to 36%, with increasedmedian RTT of 93ms and 184ms respectively, which is stillmuch less than CUBIC.Remarks. The efforts in this pilot study mean to be inspi-rational rather than comprehensive. We demonstrate thatBBR+ can potentially achieve throughput gain in the appli-cations with a tolerable latency bound. Although the choiceof pacinд_дain and λ in our experiments shows its efficacy,we note that they do not prove to be optimal either theoreti-cally or experimentally. However, we believe there is greatpotential in the design space of HSR networking.
8 DISCUSSIONTCP Variants.We note there are many alternative (singlepath) end-to-end TCP variants in the wild, which can becategorized into loss-based [32, 33] and delay-based [34–36]congestion control algorithm in general. We choose CUBICand BBR in our study because they both not only have large-scale real world deployments, but also represent the state-of-art solution in each category – CUBIC provides the bestgoodput over high-BDP networks [37], and BBR in a sensecan be regarded as a delay-based approach as it also aims tokeep the delay short and even outperforms CUBIC by 2 to25x in WAN environments [31]. Meanwhile, we are awarethat there are recent designs dedicated for cellular access[23, 38–43]. We leave a comprehensive study for future work.Railway Route. HSR networking performance may be dra-matically different on different routes. Our analysis so far isbased on the data collected from Beijing-Shanghai HSR route,which has the best (LTE) coverage among all the routes inChina. For other routes with poorer LTE coverage in termsof weaker signal strength and higher packet loss rate, weexpect BBR will outperform CUBIC in such cases.Beyond 350 km/h. Recent studies [44, 45] have started tolook into the networking performance on airplanes (i.e., 800+km/h). We believe these two extreme mobility use cases to-gether will call for attention on making best use of cellularand satellite links for improving efficiency and robustness.
13
9 RELATEDWORKTCP Measurement Study on HSRs (300+ km/h). Mostprior measurement work on HSR only focuses on the TCPlevel. The study in [46] shown that ACK compression is com-mon and that spurious retransmission represent more than50% retransmission. The work [3] presented the first publiclarge-scale empirical study on TCP performance in HSR sce-narios. The main observation is that the TCP throughput ismuch worse (3x and 2x) than static and driving scenarios,primarily because of the larger RTT jitter and variance, in-duced by the channel loss and handover. Most recently, Liet al. [4] quantify TCP’s poor adaptation to high mobilityenvironments, such as high spurious RTO rate, aggressivecongestion window reduction, a long delay of connectionestablishment and closure, and transmission interruption. In[47], they further discovered a MPTCP with coupled con-gestion control over multiple cellular carrier setup providesbetter performance than TCP in the poorer of the two paths,while performs worse than TCP in the better path most of thetime. Our work differ from them in that we not only look intothe LTE protocol message including L1/2 for investigatingthe root cause of TCP (abnormal) behavior, but also extendit to a comparative study on TCP variants (i.e., CUBIC andBBR) to shed light on rethinking the protocol design for datanetworking in such challenging environments.Cross-layer Measurement Study on Mobile Networks.This type of work typically requires access to the low level(L1/2) information. As studied in [48], TCP performance isnot significantly influenced by wireless channel data rate butrather the queuing effect primarily due to the presence oflarge buffers in 3G networks. The work [49] presents the firstpublic report on a large-scale empirical study on the perfor-mance of commercial mobile HSPA (3.5G) networks. The keyrelevant finding is that the throughput performance does notmonotonically decrease with increased mobility level whenbelow 100 km/h. The study [50] shown that the performanceof LTE remains robust up to 200 km/h and the SNR is themost important factor to ensure reliable operation in termsof higher order of modulation and coding schemes (MCS)and rank (number of streams). The authors in [28] foundthat the high queuing delay (and its variance) in LTE net-works often cause TCP congestion window to collapse upona single packet loss, or fail to adapt fast enough and thusunder-utilize the bandwidth. The work [51] reveal burstinesspattern of packets arrival due to the polling duty cycle ofthe radio driver in mobile devices. Our work extends thesefindings by conducting a in-depth handover-centric studyand quantifying its impact at different mobility level up to350 km/h on high-speed rails.
Large-scale Mobile Network Usage and PerformanceCharacterization. The study [52] characterizes applicationusage and network traffic based on user demographics from255 users. The work [53] reveals that the application perfor-mance difference can be attributed to device type, operatingsystem and web software (compression modes, concurrency).The authors in [54] collected one-week’s data from a tier-1network’s UMTS core network to characterize their genre,geographic, popularity, co-occurrence, diurnal and mobilitypatterns. It was discovered [27] that the mobile applicationperformance can be enhanced by CDN-optimized initial con-gestion window, but may also be degraded due to the sub-optimal design of application-level protocol. The first largereal-world LTE packet trace was collected in [28] via a mon-itor point between eNB and EPC to analyze the flow profile(e.g., size, duration, rate and concurrency) as well as the seg-mented network latency. The analysis [55] demonstrates thatthere is significant variance in key performance both withinand across carrier at different location and time-of-day.
10 CONCLUSIONWe perform an in-depth measurement study of HSR net-working performance by examining a wide range of fac-tors including TCP performance metrics, flow characteris-tics, application breakdown, and network usage patterns.In particular, we quantitatively investigate the impact ofhandovers on HSR networking performance, and comparetwo representative TCP variants: CUBIC and BBR. Our iden-tified performance issues are often times attributed to theupper-layer protocol design (e.g., BBR’s underestimation ofRTprop), and how they interact with lower-layer character-istics (e.g., TCP’s unawareness of high-frequency handoversand their “near effect”). Our insights gained from the studyguides us to design a simple yet effective BBR-based conges-tion control solution to improve the data transfer over HSR.In our future work, we plan to utilize our measurement find-ings to design transport protocol mechanisms that are morefriendly to extreme mobility. We will also develop mecha-nisms that leverage the path diversity of multiple carriers toboost the robustness of HSR connectivity.
ACKNOWLEDGMENTSWe are grateful to the reviewers and our shepherd, Dr. MattWelsh in particular, for their constructive critique and com-ments, all of which have helped us greatly improve this paper.This work is supported in part by National Key Researchand Development Plan, China (Grant No. 2016YFB1001200),National Natural Science Foundation of China (Grant No.61802007 and 61672499) and Science and Technology Innova-tion Project of Foshan City, China (Grant No. 2015IT100095).
14
REFERENCES[1] High-speed rail. https://en.wikipedia.org/wiki/High-speed_rail.[2] High-speed rail in the united states. https://en.wikipedia.org/wiki/Hi
gh-speed_rail_in_the_United_States.[3] Qingyang Xiao, Ke Xu, Dan Wang, Li Li, and Yifeng Zhong. Tcp
performance over mobile networks in high-speed mobility scenarios.In IEEE ICNP, 2014.
[4] Li Li, Ke Xu, DanWang, Chunyi Peng, Kai Zheng, Rashid Mijumbi, andQingyang Xiao. A longitudinal measurement study of tcp performanceand behavior in 3g/4g networks over high speed rails. IEEE/ACMTransactions on Networking, 2017.
[5] China launches upgraded high-speed trains, with wi-fi. https://gbtimes.com/china-launches-upgraded-high-speed-trains-wi-fi.
[6] Sangtae Ha, Injong Rhee, and Lisong Xu. Cubic: a new tcp-friendlyhigh-speed tcp variant. ACM SIGOPS Operating Systems Review, 42(5),2008.
[7] Bbr congestion control algorithm. https://github.com/google/bbr.[8] Ruisi He, Bo Ai, Gongpu Wang, Ke Guan, Zhangdui Zhong, Andreas F
Molisch, Cesar Briso-Rodriguez, and Claude P Oestges. High-speedrailway communications: From gsm-r to lte-r. IEEE Vehicular Technol-ogy Magazine, 11(3), 2016.
[9] Universal mobile telecommunications system (umts); lte; requirementsfor evolved utra (e-utra) and evolved utran (e-utran). http://www.3gpp.org/DynaReport/25913.htm. 3GPP TR 25.913 version 8.0.0 Release8 (2009-01-02).
[10] Mark Russell and Gordon L Stuber. Interchannel interference analysisof ofdm in a mobile environment. In IEEE VTC, 1995.
[11] Yaoqing Yang, Pingyi Fan, and Yongming Huang. Doppler frequencyoffsets estimation and diversity reception scheme of high speed railwaywith multiple antennas on separated carriages. In IEEE WCSP, 2012.
[12] Sudeep Palat and Ph Godin. The lte network architecture: a com-prehensive tutorial. The UMTS Long Term Evolution: From Theory toPractice. John Wiley & Sons, 2009.
[13] Konstantinos Dimou, Min Wang, Yu Yang, Muhammmad Kazmi, AnnaLarmo, Jonas Pettersson, Walter Muller, and Ylva Timner. Handoverwithin 3gpp lte: design principles and performance. In IEEE VTC Fall,2009.
[14] Lte; evolved universal terrestrial radio access (e-utra) and evolveduniversal terrestrial radio access network (e-utran); overall description;stage 2. http://www.3gpp.org/dynareport/36300.htm. 3GPP TS 36.300version 8.12.0 Release 8 (2010-04-28).
[15] Xing Li, Congxiao Bao, Maoke Chen, Hong Zhang, and Jianping Wu.The china education and research network (cernet) ivi translationdesign and deployment for the ipv4/ipv6 coexistence and transition.Technical report, 2011.
[16] Yuanjie Li, Chunyi Peng, Zengwen Yuan, Jiayao Li, Haotian Deng, andTao Wang. Mobileinsight: Extracting and analyzing cellular networkinformation on smartphones. In ACM MobiCom, 2016.
[17] Raymond Kwan, Cyril Leung, and Jie Zhang. Proportional fair mul-tiuser scheduling in lte. IEEE Signal Processing Letters, 16(6), 2009.
[18] Fengyu Luan, Yan Zhang, Limin Xiao, Chunhui Zhou, and ShidongZhou. Fading characteristics of wireless channel on high-speed rail-way in hilly terrain scenario. International Journal of Antennas andPropagation, 2013.
[19] http://soar.group/projects/hsrnet.[20] Meet china’s newest high-speed train – the fuxing hao.
http://www.atimes.com/article/meet-chinas-newest-high-speed-train-fuxing-hao/.
[21] Speed limit rockets to 350 km/h. http://www.chinadaily.com.cn/business/2017-09/22/content_32327165.htm.
[22] Qxdm professional™ qualcomm extensible diagnostic monitor.https://www.qualcomm.com/documents/qxdm-professional-qualc
omm-extensible-diagnostic-monitor.[23] Haiqing Jiang, Yaogong Wang, Kyunghan Lee, and Injong Rhee. Tack-
ling bufferbloat in 3g/4g networks. In ACM IMC, 2012.[24] Jim Gettys and Kathleen Nichols. Bufferbloat: Dark buffers in the
internet. ACM Queue, 9(11), 2011.[25] Yung-Chih Chen, Yeon-sup Lim, Richard J Gibbens, Erich M Nahum,
Ramin Khalili, and Don Towsley. A measurement-based study ofmultipath tcp performance over wireless networks. In ACM IMC, 2013.
[26] Yin Zhang, Lee Breslau, Vern Paxson, and Scott Shenker. On thecharacteristics and origins of internet flow rates. In ACM SIGCOMM,2002.
[27] Xian Chen, Ruofan Jin, Kyoungwon Suh, BingWang, andWeiWei. Net-work performance of smart mobile handhelds in a university campuswifi network. In ACM IMC, 2012.
[28] Junxian Huang, Feng Qian, Yihua Guo, Yuanyuan Zhou, Qiang Xu,Z Morley Mao, Subhabrata Sen, and Oliver Spatscheck. An in-depthstudy of lte: effect of network protocol and application behavior onperformance. In ACM SIGCOMM, 2013.
[29] Emir Halepovic, Jeffrey Pang, and Oliver Spatscheck. Can you getme now?: estimating the time-to-first-byte of http transactions withpassive measurements. In Proceedings of the 2012 Internet MeasurementConference, pages 115–122. ACM, 2012.
[30] Wolfgang John, Sven Tafvelin, and Tomas Olovsson. Trends anddifferences in connection-behavior within classes of internet backbonetraffic. In International Conference on Passive and Active NetworkMeasurement, pages 192–201. Springer, 2008.
[31] Neal Cardwell, Yuchung Cheng, C Stephen Gunn, Soheil HassasYeganeh, et al. Bbr: congestion-based congestion control. Communi-cations of the ACM, 60(2), 2017.
[32] Van Jacobson. Congestion avoidance and control. In ACM SIGCOMM,1988.
[33] Lisong Xu, Khaled Harfoush, and Injong Rhee. Binary increase conges-tion control (bic) for fast long-distance networks. In IEEE INFOCOM,2004.
[34] Lawrence S. Brakmo and Larry L. Peterson. Tcp vegas: End to endcongestion avoidance on a global internet. IEEE Journal on selectedAreas in communications, 13(8), 1995.
[35] Saverio Mascolo, Claudio Casetti, Mario Gerla, Medy Y Sanadidi, andRen Wang. Tcp westwood: Bandwidth estimation for enhanced trans-port over wireless links. In ACM MobiCom, 2001.
[36] Kun Tan, Jingmin Song, Qian Zhang, and Murad Sridharan. A com-pound tcp approach for high-speed and long distance networks. InIEEE INFOCOM, 2006.
[37] Mohamed A Alrshah, Mohamed Othman, Borhanuddin Ali, and Zu-rina Mohd Hanapi. Comparative study of high-speed linux tcp variantsover high-bdp networks. Journal of Network and Computer Applications,43, 2014.
[38] Keith Winstein, Anirudh Sivaraman, Hari Balakrishnan, et al. Sto-chastic forecasts achieve high throughput and low delay over cellularnetworks. In USENIX NSDI, 2013.
[39] Yasir Zaki, Thomas Pötsch, Jay Chen, Lakshminarayanan Subramanian,and Carmelita Görg. Adaptive congestion control for unpredictablecellular networks. In ACM SIGCOMM, 2015.
[40] Feng Lu, Hao Du, Ankur Jain, Geoffrey M Voelker, Alex C Snoeren,and Andreas Terzis. Cqic: Revisiting cross-layer congestion controlfor cellular networks. In ACM HotMobile, 2015.
[41] Xiufeng Xie, Xinyu Zhang, and Shilin Zhu. Accelerating mobile webloading using cellular link information. In ACM MobiSys, 2017.
[42] Wai Kay Leong, Zixiao Wang, and Ben Leong. Tcp congestion controlbeyond bandwidth-delay product for mobile cellular networks. InACM CoNEXT, 2017.
15
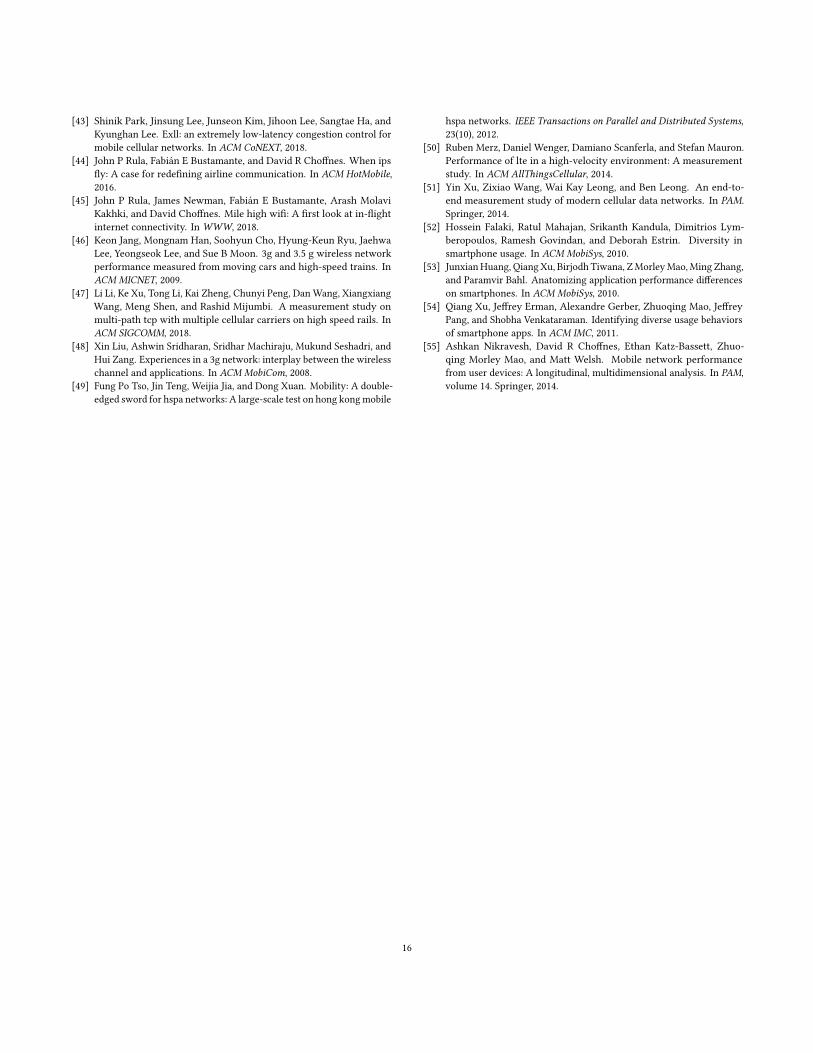
[43] Shinik Park, Jinsung Lee, Junseon Kim, Jihoon Lee, Sangtae Ha, andKyunghan Lee. Exll: an extremely low-latency congestion control formobile cellular networks. In ACM CoNEXT, 2018.
[44] John P Rula, Fabián E Bustamante, and David R Choffnes. When ipsfly: A case for redefining airline communication. In ACM HotMobile,2016.
[45] John P Rula, James Newman, Fabián E Bustamante, Arash MolaviKakhki, and David Choffnes. Mile high wifi: A first look at in-flightinternet connectivity. InWWW, 2018.
[46] Keon Jang, Mongnam Han, Soohyun Cho, Hyung-Keun Ryu, JaehwaLee, Yeongseok Lee, and Sue B Moon. 3g and 3.5 g wireless networkperformance measured from moving cars and high-speed trains. InACM MICNET, 2009.
[47] Li Li, Ke Xu, Tong Li, Kai Zheng, Chunyi Peng, Dan Wang, XiangxiangWang, Meng Shen, and Rashid Mijumbi. A measurement study onmulti-path tcp with multiple cellular carriers on high speed rails. InACM SIGCOMM, 2018.
[48] Xin Liu, Ashwin Sridharan, Sridhar Machiraju, Mukund Seshadri, andHui Zang. Experiences in a 3g network: interplay between the wirelesschannel and applications. In ACM MobiCom, 2008.
[49] Fung Po Tso, Jin Teng, Weijia Jia, and Dong Xuan. Mobility: A double-edged sword for hspa networks: A large-scale test on hong kongmobile
hspa networks. IEEE Transactions on Parallel and Distributed Systems,23(10), 2012.
[50] Ruben Merz, Daniel Wenger, Damiano Scanferla, and Stefan Mauron.Performance of lte in a high-velocity environment: A measurementstudy. In ACM AllThingsCellular, 2014.
[51] Yin Xu, Zixiao Wang, Wai Kay Leong, and Ben Leong. An end-to-end measurement study of modern cellular data networks. In PAM.Springer, 2014.
[52] Hossein Falaki, Ratul Mahajan, Srikanth Kandula, Dimitrios Lym-beropoulos, Ramesh Govindan, and Deborah Estrin. Diversity insmartphone usage. In ACM MobiSys, 2010.
[53] JunxianHuang, Qiang Xu, Birjodh Tiwana, ZMorleyMao,Ming Zhang,and Paramvir Bahl. Anatomizing application performance differenceson smartphones. In ACM MobiSys, 2010.
[54] Qiang Xu, Jeffrey Erman, Alexandre Gerber, Zhuoqing Mao, JeffreyPang, and Shobha Venkataraman. Identifying diverse usage behaviorsof smartphone apps. In ACM IMC, 2011.
[55] Ashkan Nikravesh, David R Choffnes, Ethan Katz-Bassett, Zhuo-qing Morley Mao, and Matt Welsh. Mobile network performancefrom user devices: A longitudinal, multidimensional analysis. In PAM,volume 14. Springer, 2014.
16


![An Active-Passive Measurement Study of TCP Performance ...soar.group/pubs/HSRNet.MobiCom19.pdfas LTE-railway (LTE-R) [8], a new standard being discussed for the next-generation private](https://static.fdocuments.es/doc/165x107/5f07f0507e708231d41f841c/an-active-passive-measurement-study-of-tcp-performance-soargrouppubs-as-lte-railway.jpg)