
Benajes Calvo, JV.; Molina Alcaide, SA.; García Martínez ...
34
Document downloaded from: This paper must be cited as: The final publication is available at Copyright http://dx.doi.org/10.1016/j.apenergy.2014.08.008 http://hdl.handle.net/10251/49296 Elsevier Benajes Calvo, JV.; Molina Alcaide, SA.; García Martínez, A.; Monsalve Serrano, J.; Durrett, R. (2014). Performance and engine-out emissions evaluation of the double injection strategy applied to the gasoline partially premixed compression ignition spark assisted combustion concept. Applied Energy. 134:90-101. doi:10.1016/j.apenergy.2014.08.008.
Transcript of Benajes Calvo, JV.; Molina Alcaide, SA.; García Martínez ...

Document downloaded from:
This paper must be cited as:
The final publication is available at
Copyright
http://dx.doi.org/10.1016/j.apenergy.2014.08.008
http://hdl.handle.net/10251/49296
Elsevier
Benajes Calvo, JV.; Molina Alcaide, SA.; García Martínez, A.; Monsalve Serrano, J.;Durrett, R. (2014). Performance and engine-out emissions evaluation of the doubleinjection strategy applied to the gasoline partially premixed compression ignition sparkassisted combustion concept. Applied Energy. 134:90-101.doi:10.1016/j.apenergy.2014.08.008.

PERFORMANCE AND ENGINE-OUT EMISSIONS EVALUATION OF THE DOUBLE 1
INJECTION STRATEGY APPLIED TO THE GASOLINE PARTIALLY PREMIXED 2
COMPRESSION IGNITION SPARK ASSISTED COMBUSTION CONCEPT 3
Jesús Benajesa, Santiago Molinaa, Antonio Garcíaa, Javier Monsalve-Serranoa and Russell 4
Durrettb 5
a - CMT - Motores Térmicos, Universitat Politècnica de València, Camino de Vera s/n, 46022 Valencia, 6
Spain 7
b - Diesel Engine Systems Group, Propulsion Systems Research Lab GM R&D Center, MC 480-106-252, 8
30500 Mound Rd., Warren, MI 48090-905, USA 9
10
(*) CORRESPONDING AUTHOR: 11
Dr. Antonio Garcia: [email protected] 12
Telephone: +34 963879659 13
Fax: +34 963877659 14
15
16
17
18
19
20
1 / 26

ABSTRACT 21
Spark assistance has been found to improve combustion control when combined with both single and 22
double injection operation applied to compression ignition (CI) engines using gasoline as the fuel. 23
Previous work has verified the potential of a double injection strategy when applied to the gasoline 24
spark assisted partially premixed compression ignition combustion (PPC) concept. The current research 25
presents performance and engine-out emissions results using a double injection strategy with the spark 26
assisted PPC concept and shows its benefits compared to a single injection strategy. For this purpose, a 27
parametric study was carried out using gasoline in a high-speed single-cylinder diesel engine equipped 28
with a modified cylinder head, which included a spark plug. The parameters that were varied during the 29
double injection testing included: injection timing, dwell, fuel mass split between the injections and 30
intake oxygen concentration. A detailed analysis of the air/fuel mixing process was also conducted by 31
means of a 1-D in-house spray model (DICOM). 32
33
34
KEYWORDS 35
Partially premixed combustion 36
Spark assistance 37
High octane number gasoline 38
Double injection 39
Performance and engine-out emissions 40
41
42
43
2 / 26

1. INTRODUCTION 44
Along the last years, engine researchers are more and more focusing their efforts on the advanced low 45
temperature combustion (LTC) concepts with the aim of achieving the stringent limits of the current 46
emission legislations. In this regard, strategies based on highly premixed combustion such as the well-47
known Homogeneous Charge Compression Ignition (HCCI) have been confirmed as a promising way to 48
decrease drastically the most relevant CI diesel engine-out emissions, NOx and soot [1]. However, the 49
major HCCI drawbacks are the narrow load range, bounded by either misfiring (low load, low speed) or 50
hardware limitations (higher load, higher speeds) and the combustion control (cycle-to-cylce control and 51
combustion phasing). Although several techniques such as EGR [2], variable valve timing [3][4], variable 52
compression ratio [5] and intake air temperature control [6] have been widely investigated in order to 53
overcome these drawbacks, the high chemical reactivity of the diesel fuel remains as the main limitation 54
for the combustion control. 55
The attempts of the researchers to overcome these disadvantages are shifting to the use of fuels with 56
different reactivity [7]-[9]. Specifically, the use of gasoline-like fuels with high autoignition resistance in 57
compression ignition engines has been widely investigated at Shell [10]-[13], Lund [14]-[17], UW-58
Madison [18]-[22] and Argonne [23]-[25]. In this sense, the concept of gasoline Partially Premixed 59
Combustion has been able to reduce emissions and improve efficiency simultaneously, but some 60
drawbacks still need solution. Since a low reactive fuel is required to extend the ignition delay 61
sufficiently at high loads, controllability and stability issues appear at the low load end. Thus, with the 62
aim of improving the PPC controllability and stability at low load, the PPC concept with spark assistance 63
fuelled with gasoline has been studied [26][27]. This combustion concept has been evaluated in terms of 64
performance and engine-out emissions using a single injection strategy by studying the effect of 65
injection pressure variations and intake oxygen concentration. Under these conditions, the concept has 66
been found as a suitable technique for improving combustion control, providing both temporal and 67
3 / 26

spatial control over the combustion process [28]. In spite of its benefits, some drawbacks related to 68
unappropriated mixture distribution and combustion temperatures were observed. Single injection 69
provides excessive rich zones near the spark plug and too lean regions close to the in-cylinder walls 70
resulting in high emission levels as well as deteriorated Fuel energy Conversion Efficiency (FeCE). 71
Another strategy widely investigated by several researchers with the aim of solving the gasoline PPC 72
controllability and stability issues encountered when using single injection strategies at low load is the 73
use of multiple injection strategies, which improve the control over the fuel/air mixture preparation 74
before SOC. Thus, some level of mixture stratification in the chamber has been shown necessary to 75
improve low load operation. The double injection strategy provides sufficient mixing time before the 76
SOC to achieve a homogeneous charge as well as the reactive conditions required to trigger the 77
combustion process, improving the combustion stability. However, to achieve auto-ignition time scales 78
small enough for combustion in the engine, an increase in the intake pressure and temperature is 79
required [29]. In addition, recent studies with multiple injections have shown that fuels with octane 80
number greater than 90 do not allow to run below 5 bar BMEP load [30] due to the auto-ignition 81
characteristics of these fuels. In this regard, previous work from the authors [28] showed the capability 82
of the spark plug to provide combustion control in engine loads below this limit even using 98 octane 83
number gasoline. Thus, the main objective of the present work is to couple the control capability of the 84
spark assistance together with an appropriate mixture distribution by using double injection strategies 85
with the aim of evaluating performance and engine-out emissions at low load PPC range using a high 86
octane number gasoline. For this purpose different parameters have been varied during the double 87
injection testing, specifically: injection timing, dwell time between injections, fuel mass repartition 88
between injections and intake oxygen concentration. The investigation has been performed in a 89
compression ignition single-cylinder engine to allow high compression ratio fuelled with 98 octane 90
number gasoline. A common rail injection system enabling high injection pressures has been used during 91
4 / 26

the research. An analysis of the in-cylinder pressure signal derived parameters as well as a detailed 92
analysis of the air/fuel mixing process by means of a 1-D in-house spray model (DICOM) has been 93
conducted [31]. 94
The outline of this paper is as follows: in the next section, the experimental facilities used to carry out 95
this research are presented. Specifically, this section describes briefly the methodology, hardware and 96
processing tools. In section 3, an overview of the double injection strategy is given by presenting a 97
comparison of the single and double injection strategies using different operating conditions. In section 98
4, the results of the double injection strategy tests are presented. These tests consist of sweeps of the 99
pilot injection timing and the intake oxygen concentration. Then, the effects of the mass repartition 100
between the pilot and main injection are studied. Finally, in section 5, the main conclusions of this 101
research are summarized. 102
2. MATERIAL AND METHODS 103
This section describes the methodology used to acquire the experimental data and provides a 104
description of the experimental facility, the different devices and systems that were specifically adapted 105
for the study of this combustion mode. 106
2.1. Single cylinder engine 107
The engine used in the present study is a 4-valve, 0.545 l displacement single cylinder engine with a 108
modified cylinder head for the study of this combustion mode. The bowl dimensions are 45x18 mm 109
(diameter x depth). Table 1 presents the main characteristics of the engine. 110
A spark plug is required to implement the partially premixed compression ignition with spark assistance 111
combustion mode. As Figure 1 shows, the cylinder head has been modified by removing an exhaust 112
valve and thus enabling the insertion of the spark plug in the combustion chamber. A standard spark 113
plug (Veru Platinum) with a 1 mm gap is used along with a custom electronic control system. In the 114
5 / 26
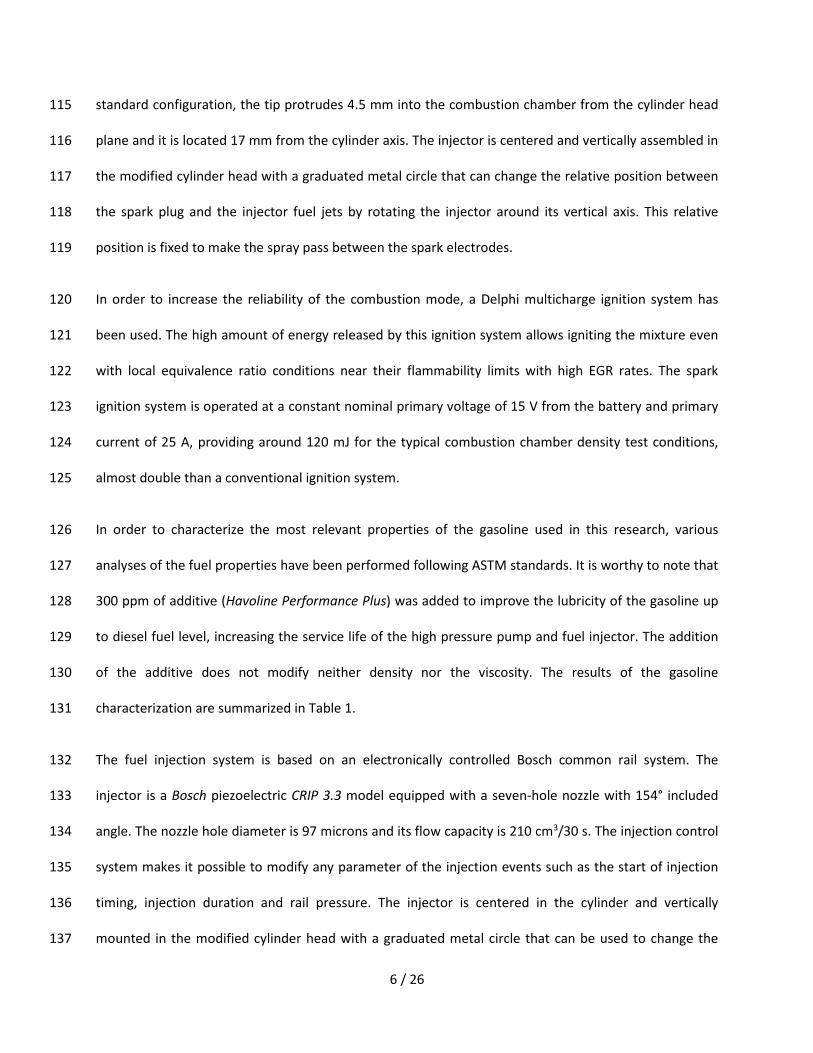
standard configuration, the tip protrudes 4.5 mm into the combustion chamber from the cylinder head 115
plane and it is located 17 mm from the cylinder axis. The injector is centered and vertically assembled in 116
the modified cylinder head with a graduated metal circle that can change the relative position between 117
the spark plug and the injector fuel jets by rotating the injector around its vertical axis. This relative 118
position is fixed to make the spray pass between the spark electrodes. 119
In order to increase the reliability of the combustion mode, a Delphi multicharge ignition system has 120
been used. The high amount of energy released by this ignition system allows igniting the mixture even 121
with local equivalence ratio conditions near their flammability limits with high EGR rates. The spark 122
ignition system is operated at a constant nominal primary voltage of 15 V from the battery and primary 123
current of 25 A, providing around 120 mJ for the typical combustion chamber density test conditions, 124
almost double than a conventional ignition system. 125
In order to characterize the most relevant properties of the gasoline used in this research, various 126
analyses of the fuel properties have been performed following ASTM standards. It is worthy to note that 127
300 ppm of additive (Havoline Performance Plus) was added to improve the lubricity of the gasoline up 128
to diesel fuel level, increasing the service life of the high pressure pump and fuel injector. The addition 129
of the additive does not modify neither density nor the viscosity. The results of the gasoline 130
characterization are summarized in Table 1. 131
The fuel injection system is based on an electronically controlled Bosch common rail system. The 132
injector is a Bosch piezoelectric CRIP 3.3 model equipped with a seven-hole nozzle with 154° included 133
angle. The nozzle hole diameter is 97 microns and its flow capacity is 210 cm3/30 s. The injection control 134
system makes it possible to modify any parameter of the injection events such as the start of injection 135
timing, injection duration and rail pressure. The injector is centered in the cylinder and vertically 136
mounted in the modified cylinder head with a graduated metal circle that can be used to change the 137
6 / 26

relative position between the spark plug and the injector by rotating the latter around its vertical axis. 138
The fuel injection hardware characteristics are sumarized in Table 1. 139
2.2. Test cell 140
This section presents the experimental configuration of the test cell and the main subsystems used in 141
this study. As Figure 2 shows, the single cylinder engine is installed in a fully instrumented test cell, with 142
all the auxiliary facilities required for operation and control. 143
The intake air is supplied by a roots compressor with an upper pressure limit of 3 bar. Then, the air flows 144
through a filter to remove possible impurities. The heat exchanger and the air dryer allow controlling the 145
temperature and humidity of the intake air independently of the ambient conditions. The temperature 146
in the inlet settling chamber is maintained constant by using a heater in the intake line. The oxygen 147
concentration variation is performed using a synthetic EGR system. EGR is substituted by nitrogen gas, 148
which greatly simplifies the system ensuring a controllable gas composition without an excessive time to 149
adjust the facility. Despite the limited practical application, it was decided to use this method to have a 150
better control of the variables, which allows studying the underlying phenomena more carefully. The 151
concept is based on decreasing the O2 concentration at the inlet manifold by increasing the flow of N2 152
and keeping constant the total intake mass flow rate (substitution EGR). For this purpose a PID 153
controller is equipped to operate the N2 valve governed by the intake O2 meter. With this system, the in-154
cylinder thermodynamic conditions can be reproduced systematically. To ensure a homogeneous 155
mixture of N2 and O2 and to attenuate pressure pulses in the intake manifold, a settling chamber of 500 156
liters volume is used in the installation. 157
The exhaust gases were analysed by a Horiba MEXA 7100 D. In order to increase the robustness of these 158
measurements, the different pollutant volume fractions were sampled and averaged over an 80 second 159
time period. Smoke emissions were measured with an AVL 415 variable sampling smoke meter, 160
7 / 26

providing results directly in FSN. The FSN values used in this research are the average of three 161
consecutive measurements at the same operating condition. These measurements were transformed 162
into mg/m3 by means of the correlation proposed in the user manual of the device: 163
�𝐦𝐦𝐦𝐦/𝐦𝐦𝟑𝟑� = 𝟏𝟏𝟎𝟎.𝟒𝟒𝟎𝟎𝟓𝟓
∙ 𝟒𝟒.𝟗𝟗𝟓𝟓 ∙ 𝐅𝐅𝐅𝐅𝐅𝐅 ∙ 𝐞𝐞𝟎𝟎.𝟑𝟑𝟑𝟑∙𝐅𝐅𝐅𝐅𝐅𝐅 (1) 164
In the exhaust line, after the exhaust analyzer sample probe, a catalyst is mounted to prevent the 165
accumulation of unburned hydrocarbons in the installation. Due to the low temperatures achieved 166
during the combustion event and therefore in the exhaust line, the catalyst is often operating with low 167
efficiency and a cyclone is needed to remove the rest of the hydrocarbons. In the same way as in the 168
intake line, a settling chamber is mounted in order to attenuate pressure pulses. Finally, an exhaust 169
backpressure valve is equipped to maintain a relative pressure of 0.2 bar to the intake pressure, in order 170
to simulate more realistic conditions. 171
The in-cylinder pressure traces from a piezo-electric transducer (Kistler 6067C1) were recorded during 172
200 engine cycles in order to compensate the cycle-to-cycle variation during the engine operation. The 173
recorded values of in-cylinder pressure were processed by means of an in-house one-zone combustion 174
diagnosis code (CALMEC) [32], which provides valuable information such as the rate of heat release 175
(RoHR) and the unburned gases temperature. To obtain these results, the first law of thermodynamics is 176
applied between IVC and EVO, considering the combustion chamber as an open system because of 177
blow-by and fuel injection. The ideal gas equation of state is used to calculate the mean gas 178
temperature in the chamber. Along with these two basic equations, several sub-models are used to 179
calculate instantaneous volume and heat transfer [33], among other things. The main result of the 180
model is the Rate of Heat Release (RoHR), which is obtained from a filtered and averaged in-cylinder 181
pressure signal. Information related to each cycle can be obtained, such as the IMEP and SoC. Start of 182
Combustion (SoC) is defined as the crank angle position in RoHR where the beginning of the slope rise 183
8 / 26

due to combustion is detected. Additionally, the knocking level is calculated by using the Integrate 184
Modulus of Pressure Gradient (IMPG) method [34]-[37]. This method was selected considering that the 185
combustion mode presented in the current paper is a transition between a spark ignition and 186
compression ignition engine. The IMPG knocking level is proportional to the ringing intensity estimator 187
which is more commonly used in CI combustion under fully or partially premixed combustion modes. 188
The IMPG method applies a FFT and a band pass filter in the range of 5 to 20 kHz in order to determine 189
fluctuations in the cylinder pressure signal over a certain crank angle degree range. Once the crank angle 190
interval is defined, the knocking level is calculated as: 191
IMPG = 1N∑ ∫ �dp
dα�α1
α0N1 dα = 1
N∑ ∑ |∆pi|
α1α0
N1 (2) 192
Values of IMPG over 50 imply an excessive knocking level. 193
194
2.3 1-D Spray model 195
A 1-D in-house spray model DICOM is used to estimate equivalence ratio distributions in the fuel jet in 196
order to get better insight into the variations in mixture distribution associated with the variations in the 197
parameters studied in the experimental tests. The start of combustion and the combustion development 198
have an extreme dependency on the local mixture conditions at Start of Spark (SoS) timing. The inputs 199
of the DICOM model are the in-cylinder thermodynamic conditions (pressure, temperature and density), 200
the spray cone angle, the fuel mass flow rate and the spray momentum. The model solves the general 201
conservation equations either in a transient or steady state formulation for axial momentum and fuel 202
mass along the center line. The results can be used to calculate values of spray velocity, species mass 203
fractions and other values of the mixing process [38]. Finally, with some other assumptions described in 204
[31], the model is used to obtain different temporal evolutions such as the spray liquid and vapor 205
penetration, maximum spray velocity, equivalence ratio along the center line of the spray and the fuel 206
9 / 26

mass fraction which has mixed to different equivalences ratios. The fuel mass fraction is the main 207
variable used in this research. 208
209
3. PRELIMINARY RESULTS: EMISSIONS AND PERFORMANCE 210
In this section, preliminary results of tests using the single and double injection strategies will be 211
presented. Table 2 shows the different operating conditions that were tested in order to have an 212
overview of the double injection strategy’s potential. In order to comprehend the PPC with spark 213
assistance combustion development, previous work using the transparent engine version [26] has been 214
carried out. The PPC with spark assistance combustion process sequence can be summarized as follows: 215
Once the injection event has finished, the spark plug discharge takes place initiating the combustion 216
process. The kernel growth generates a partially premixed flame propagation guided by the swirl motion 217
which energy release causes an increase in the unburned gas pressure and temperature, leading finally 218
to a second phase of combustion governed by the autoignition of the rest of the mixture. In addition, 219
the effect of the injection pressure and the intake XO2 variation on the combustion mode as well as the 220
performance and engine-out emissions using single injection strategies has been studied in [28]. 221
Figure 3 shows some of the previous results in terms of soot, CO, HC and ISFC versus NOx for SoI=-24 222
CAD aTDC using single injection and also for the double injection strategy tests depicted in Table 2. For 223
each single injection strategy operating condition, the global equivalence ratio is increased from the left 224
to the right with the extremes points corresponding to the maximum and minimum values depicted in 225
Table 2. 226
It is noticeable that for all the points presented in Figure 3, regardless of the engine settings, the engine- 227
out NOx levels are unacceptable taking into account the current regulations. In this combustion mode, 228
one of the main sources of NOx formation is tied to the way in which the mixture ignition and the initial 229
10 / 26

premixed flame phase propagation is achieved. The initial kernel ignition must take place in a mixture 230
that is near stoichiometric conditions in order to allow the flame to grow. As the premixed flame 231
propagates through this region it promotes high temperature combustion products which are 232
significantly above the mean temperature. The high temperature in these products of the initial flame 233
propagation causes significant NOx production. 234
The double injection strategy seems to be a good strategy to reduce the NOx levels. Since the pilot is 235
injected earlier in the cycle (SoIpilot= -16 CAD aTDC), an extra mixing time is available for the pilot 236
injected fuel (from -16 to -3 CAD aTDC) which provides a better fuel/air mixture stratification at the start 237
of spark in comparison with the single injection strategy, whose mixing time available corresponds with 238
the injection duration (4 CAD). Once the spark has ignited the mixture, the flame front propagates 239
through a region with a leaner local equivalence ratio. Figure 4 shows the fuel mass distribution at the 240
time of the spark for a single and double injection strategy. It is possible to identify two zones for the 241
double injection strategy at the time of SOC (dashed blue trace). The first zone containing the mixture 242
below stoichiometric equivalence ratio (0.2<φ<0.5) is attributed to the pilot injection, which has had 243
enough mixing time to reach a leaner mixture distribution. The second zone, with equivalence ratio 244
(φ>0.5) is attributed to the extra fuel mass provided by the main injection. As it is possible to appreciate, 245
the local conditions near stoichiometric needed to ignite the mixture with the spark plug are achieved 246
by the fuel mass injected in the main injection. If there is not a main injection, no ignition is achieved 247
due to the excessively lean mixture created by the pilot injection. 248
Looking at the NOx-Soot trade-off in Figure 3, it can be seen that higher levels of soot are obtained in 249
the cases using the single injection strategy. The start of combustion, provided by the spark plug 250
discharge, occurs at the end of the injection event providing a short mixing time. The flame front 251
propagates in a region of rich equivalence ratios with a high quantity of the mass mixed above 252
11 / 26

stoichiometric conditions, promoting increased soot formation. On the other hand, Figure 4 shows how 253
the extra mixing time achieved with the double injection strategy results in a regions in the chamber 254
with local leaner equivalence ratios. This reduces soot formation and lowers the soot values as shown in 255
Figure 3. 256
Depending on the global equivalence ratio used, the extra mixing time from the pilot to the main 257
injection can promote an over-mixing condition which generates high levels of CO and HC. In this case is 258
it possible to reduce the over-mixing effect by increasing the fuel mass amount in the main injection in 259
order to promote the flame growth. Another possible solution to reduce the over-mixing effect is to 260
increase the global equivalence ratio, limited by the knocking level. When a reactive enough conditions 261
are set, the knocking level is increased as the fuel mass in the pilot injection increases due to the larger 262
and faster heat release rate in the autoignition phase. 263
The NOx-ISFC trade off is clearly improved with the use of the double injection strategy. As it will be 264
described in the next section, the double injection strategy enhances both phases of the combustion 265
allowing an improvement in the Fuel energy Conversion Efficiency (FeCE). The FeCE, or combustion 266
efficiency, estimates the quantity of fuel burned during the combustion process and it is calculated by 267
means of the engine-out emissions measurements, in particular: 268
𝐅𝐅𝐞𝐞𝐅𝐅𝐅𝐅 = �𝟏𝟏 − �𝐮𝐮𝐮𝐮𝐅𝐅𝐦𝐦𝐦𝐦� − � 𝐅𝐅𝐂𝐂
𝟒𝟒∙𝐦𝐦𝐦𝐦�� ∙ 𝟏𝟏𝟎𝟎𝟎𝟎 (3) 269
4. EVALUATION OF THE COMBUSTION CONCEPT USING A DOUBLE INJECTION 270
STRATEGY 271
A general overview of the double injection strategy’s potential was presented in the preliminary results. 272
In this section, a deeper analysis of the effects of this injection strategy will be presented. For this 273
purpose, a different set of experimental results are shown and discussed. In a first step, the effects of 274
12 / 26
the dwell between the pilot and main injection in a split injection strategy (50% fuel mass amount in 275
each injection) as well as the effects of the XO2 variation are analysed. In a second step, the effects of 276
the fuel mass distribution between the pilot and main injection are studied. 277
278
4.1 Effect of dwell variation and oxygen concentration 279
The mixing process prior to the start of combustion has a strong effect on the combustion development. 280
In order to quantify these effects in terms of performance and emissions, different tests were 281
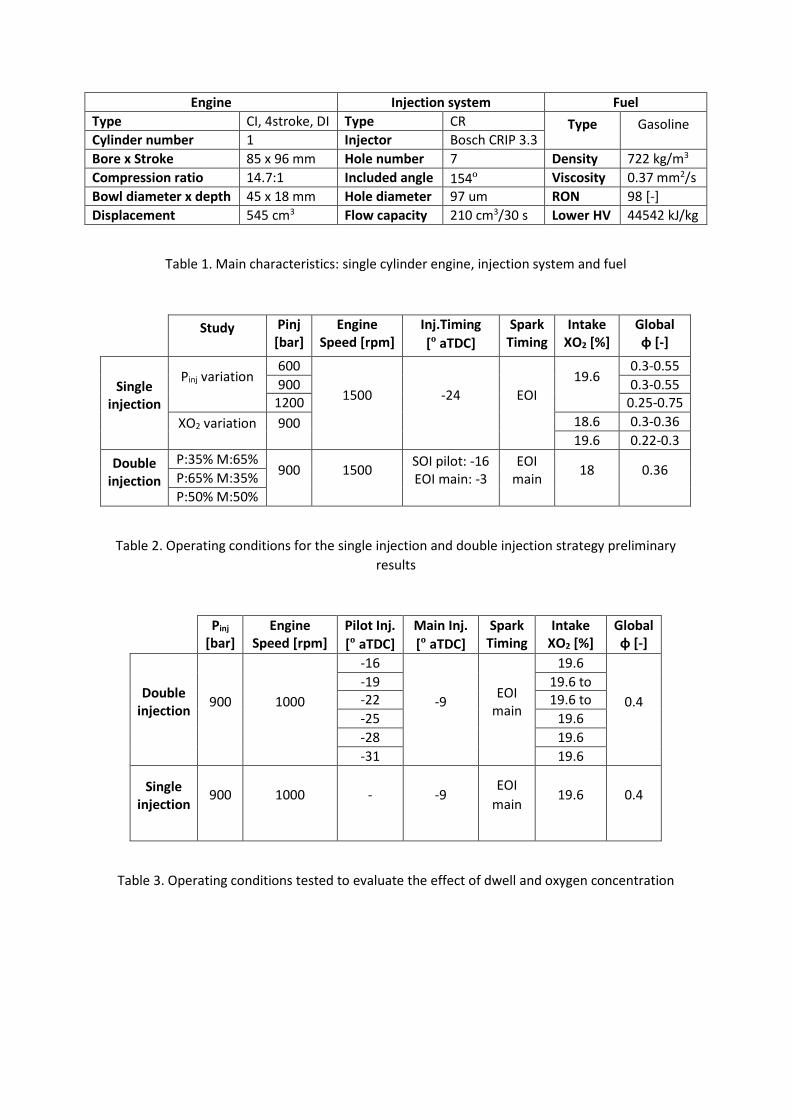
performed. As depicted in Table 3, the pilot injection was swept from -31 to -16 CAD aTDC, while 282
maintaining constant injection pressure at 900 bar (to ensure a combustion development during the 283
expansion stroke minimizing NOx emissions), global equivalence ratio (φg=0.4) and start of the main 284
injection (-9 CAD). Considering the gasoline direct injection literature and author’s experience, the spark 285
discharge is set at the end of the main injection in all cases in order operate within the “ignitability 286
window” range. That is, if start of spark is located before the end of injection, excessive rich equivalence 287
ratio are attained in the gap of the spark electrodes. By contrast, if the start of spark is set after the end 288
of injection, excessive lean equivalence ratios are achieved. In both cases the combustion development 289
is worsened leading a misfiring. Finally, a sweep of the intake XO2 was performed for the three 290
conditions with higher FeCE to determine its effect on the FeCE and ISFC. 291
Figure 5 shows the FeCE, IMPG, IMEP and ISFC versus the pilot injection timing. The black trace depicts 292
the cases with an intake XO2 of 19.6%. For the cases where the pilot timing is -16, -19 and -22 CAD, a 293
sweep of the intake XO2 from 19.6% down to 17.2% in steps of 0.4% is presented. The red horizontal 294
dashed trace across the figure denotes the reference results for the single injection strategy with the 295
same engine operating conditions and with the start of injection fixed at -9 CAD aTDC. Taking into 296
account the high NOx levels presented in the preliminary results for the single injection strategy, the 297
injection timing has been located (at -9 CAD aTDC) looking for a combustion development close to the 298
13 / 26
expansion stroke, which imply a combustion development under lower combustion temperatures 299
minimizing the NOx emission levels. Figure 6a shows the crank angle evolution of different variables. 300
From the top to the bottom, the figure shows the mass flow rate, the mean unburned gas temperature, 301
the in-cylinder pressure and the rate of heat released. In all cases, the spark plug discharge was set at 302
EoI and it determines the SoC. Figure 6b displays the mixture distribution for three different pilot 303
injection cases. Additionally, Figure 7 presents the results in terms of soot, CO, HC and NOx as a function 304
of the pilot injection timing. 305
The FeCE trend in Figure 5 reveals that the maximum FeCE value is obtained for the case in which the 306
pilot injection is set at -22 CAD. At this point, the optimum conditions in terms of FeCE are achieved for 307
this injection strategy and the range of injection timings tested. The resulting mixture conditions allows 308
a powerful autoignition after the flame propagation phase which leads to higher in-cylinder pressure 309
and temperature as Figure 6a shows. Taking into account the evolution of the FeCE it is possible to note 310
that, for the global equivalence ratio tested (φg=0.4), the over-mixing effect is magnified as the pilot 311
injection is advanced from -22 CAD to -31 CAD. It results in a 20% reduction in the FeCE for that case. 312
The over-mixing effect promotes a retarded location of the combustion event in the cycle (Figure 6a) 313
which causes a halving in the IMEP value compared with the single injection case. The combination of 314
the lower combustion efficiency and the retarded combustion timing results in a value of the ISFC which 315
is almost double than the one obtained with the single injection case. 316
Focusing on Figure 5, it is interesting to note that the double injection strategy provides a higher FeCE 317
than the reference case of the single injection strategy for all the points except for the case of SoIpilot= -318
28 CAD aTDC and SoIpilot= -31 CAD aTDC. In that case (SoIpilot= -31 CAD aTDC) the mixture conditions in 319
the surrounding areas at SoC (Figure 6b) have become too lean, hinder the flame propagation and 320
avoiding the autoignition of the rest of the mixture. Thus, a soft combustion development shifted to the 321
14 / 26

expansion stroke is attained in this case, which results in a rapid decay in the FeCE due to the 322
incomplete combustion (Figure 5). For all the other cases, the main injection event provides the 323
necessary conditions to start the combustion event after the spark plug has discharged. 324
As a general trend, the IMEP and ISFC values correlate well with the FeCE values. As Figure 6a shows, the 325
combustion phasing is similar for SoIpilot= -22 CAD aTDC (8.9 CAD) and SoIpilot= -16 CAD aTDC (9.9 CAD), 326
but the slightly higher FeCE value for SoIpilot= -22 CAD aTDC provides a slight value of IMEP. For the 327
advanced Start of pilot Injection cases (-31, -28 and -25 CAD), the retarded phasing of the RoHR causes a 328
strong reduction in the IMEP values and a consequent increase in the specific fuel consumption. 329
Regarding the knocking level, the IMPG level is negligible for the advanced SoI pilot cases due to the 330
poor combustion attained, which can be appreciated in the high HC and CO emissions showed in Figure 331
7. As the pilot injection is moved closer to the main injection (retarded), the higher reactivity allows an 332
improvement in the combustion process resulting in a stronger autoignition, which provokes higher 333
knock values. The SoIpilot= -22 CAD aTDC presents the best combustion efficiency and also gives the 334
highest IMPG or knock value due to the high pressure rise rate created by the strong autoignition. 335
In terms of engine-out emissions (Figure 7), for the early pilot injection cases (-31, -28 and -25 CAD), the 336
poor FeCE values cause high CO and HC levels as well as low soot and NOx emissions. The trend 337
obtained for the more delayed pilot injection cases is consistent with the values obtained for the FeCE 338
and IMEP. 339
Focusing on the XO2 effect it is possible to state that as the intake XO2 is decreased the combustion 340
process is worsened and the FeCE values decrease, as the individual symbols in Figure 5 show. For the 341
SoIpilot= -22 CAD aTDC, the FeCE with the double injection strategy is higher than the one obtained in the 342
single injection strategy for intake XO2 values above 18.4% (3rd XO2 reduction step). For the SoIpilot= -19 343
15 / 26

CAD aTDC and SoIpilot= -16 CAD aTDC the FeCE drops below the single injection strategy level for the first 344
reduction step in the XO2 (19.2%). It is worthy to note that it is possible to move the engine-out 345
emissions values for the double injection case near the emissions for the single injection case by 346
reducing the intake oxygen concentration. 347
4.2 Effect of mass distribution 348
With the aim studying further the effect of the mass distribution between the main and pilot injection 349
on the combustion development and on the performance and pollutant emissions, different tests were 350
performed using the operating conditions shown in Table 4. The single injection strategy reference case 351
depicted in Table 4 was compared with five different mass distributions for the double injection strategy 352
(%pilot/%main: 40%/60%, 45%/55%, 50%/50%, 55%/45% and 60%/40%). As it is possible to appreciate 353
by observing the fuel mass flow traces in Figure 8a, which represents the data for three mass 354
distributions and the single injection strategy in the same manner as in Figure 6, the SoI timing of the 355
pilot injection and the EoI timing of the main injection was held constant for all the cases. In addition, 356
the unburned gas temperature, in-cylinder pressure, and rate of heat released for three of the double 357
injection cases are shown in Figure 8a. It should be noted here that the RoHR in Figure 8a is different 358
than the RoHR in Figure 6a because the operating conditions have changed. For the cases in Figure 8a 359
the engine speed is increased and the XO2 concentration is lowered. Both of these changes contribute to 360
lengthening the duration of the heat release. 361
Figure 8b shows a distribution of fuel mass fraction versus φ calculated using the 1-D mixing model 362
described above at the experimental SoC time (up) and at the autoignition time (down) for the same 363
engine settings shown in Figure 8a. Figures 9 and 10 show the performance and engine-out emissions 364
obtained from the five cases as well as the results obtained from the single injection reference case (red 365
horizontal dashed trace) using the conditions shown in Table 4. 366
16 / 26

It is worthy to note that, in this study, the baseline operating conditions for the single injection strategy 367
are notably different from the baseline operating conditions used in subsection 4.1 (Table 3). In this 368
case, the in-cylinder conditions are set in order to deteriorate the combustion process. These conditions 369
allow to magnify both, the double injection potential in comparison with the single injection strategy as 370
well as the influence of the mass distribution on the combustion development. Thus, the global 371
equivalence ratio as well as the intake XO2 are fixed in a lower value (φg=0.36 instead of φg=0.4, and 372
XO2=18% instead of XO2=19.6%). In addition engine speed was set at 1500 rpm. These have a strong 373
effect on the combustion development as it can be seen by comparing both RoHR profiles (Figure 6a 374
versus Figure 8a). 375
As Figure 8a shows, the SoC is slightly advanced as the amount of fuel injected in the main injection is 376
increased (CA1040/60= 5 CAD < CA1050/50= 6 CAD < CA1060/40= 7.2 CAD) due to the higher amount of fuel 377
mass mixed under reactive conditions, as it is stated in the mixture mass fraction histograms in Figure 8b 378
(up and down). The rise in the RoHR during the flame propagation phase (from 0 to +10 CAD aTDC) is 379
quite similar independent on the fuel mass distribution. Moreover, the location of the RoHR peak in the 380
flame propagation phase is achieved between +8 to +10 CAD aTDC for the three cases presented. This 381
maximum level of the RoHR is higher for the case with lower fuel mass amount injected in the pilot 382
injection. It can be noted that for the double injection cases studied, in which a lean global equivalence 383
ratio is used, the flame propagation is enhanced as the amount of fuel/air mixture near reactive 384
equivalences ratios at SoC (Figure 8b up) is increased, preventing the over-mixing. 385
It is possible to observe that two combustion phases are achieved only in the case in which the lower 386
amount of fuel mass is injected in the pilot event (green traces). The higher in-cylinder pressure and 387
unburned temperature in the combustion chamber at the end of the first combustion phase combined 388
with the higher fuel mass injected in the main injection results in a more energetic autoignition (51 389
17 / 26

J/CAD versus 32 J/CAD and 31 J/CAD). In the 50%/50% case a soft change in the RoHR profile is observed 390
at +15 CAD aTDC, being this change in the RoHR slope negligible in the case of 60%/40%. 391
Regarding the air/fuel mixing process shown in Figure 8b, two zones can be identified at the time of SOC 392
(Figure 8b up). The first zone containing the mixture below stoichiometric equivalence ratio (φ<1) is 393
attributed to the pilot injection, which has had enough mixing time to reach a leaner mixture 394
distribution. The second zone, with equivalence ratio higher than stoichiometric (φ>1) is attributed to 395
the extra fuel mass provided by the main injection. The fuel mass amount mixed in the high reactivity 396
zone (1<φ<2) increases as the percentage of fuel injected in the main injection increases. This enhances 397
the first reactions after the spark discharge leading to development of the premixed flame and 398
consequently causes a faster start of combustion. As the mass distribution at the autoignition time 399
(Figure 8b down) shows, a lower mass percentage in the main injection provides additional leaner 400
mixture, and as a consequence a smoother autoignition phase is obtained. In summary, the case with 401
the lowest percentage in the main (red trace) has a very poor autoignition phase, the case with 50% in 402
the main (blue trace) shows a soft autoignition, and the case with 60% in the main (green trace) shows 403
the strongest autoignition. 404
Figure 9 shows the benefit obtained in the case of the double injection strategy by varying the fuel mass 405
amount injected in each injection event in comparison with the single injection strategy at the same 406
operating condition. The FeCE was similar for the single injection and the double injection cases with all 407
of the values between 84% and 90%. As the RoHR profiles in Figure 8a point out, an improvement in the 408
combustion development is attained by using the double injection strategy in comparison with the 409
single injection strategy. Thus, higher IMEP values were obtained, allowing a reduction in the ISFC by 410
approximately 150 g/kWh. 411
18 / 26

Comparing the performance and engine-out emissions for the double injection strategies in Figures 9 412
and 10, there is an improvement in the efficiency as the pilot injected mass decreases. For the cases 413
studied, in which a lean global equivalence ratio is used (φg=0.36), the larger amount of fuel injected in 414
the main event enhances the flame propagation once the combustion has started. The benefit obtained 415
in the mixing process is reflected in a better combustion process as the FeCE and IMEP values show and 416
therefore lower ISFC values are obtained. Regarding the knock level, IMPG is lower in the case with the 417
larger amount of fuel injected in the pilot injection. In this case, a soft autoignition shifted to the 418
expansion stroke is obtained as a consequence of the over-mixing effect. 419
Comparing single and double injection strategies in terms of engine-out emissions, it is demonstrated 420
that depending on the mass distribution selected for the double injection, the improvement obtained in 421
comparison with the single injection strategy can be more or less noticeable. More improvement in 422
terms of HC, CO and ISFC in comparison to the single injection strategy is obtained in the case with the 423
lower fuel amount injected in the pilot injection. Higher FeCE implies higher temperatures and therefore 424
higher NOx as well as lower CO and HC levels. This enhancement in the combustion development is 425
allowed by the more reactive ambient provided by the fuel stratification due to the pilot injection 426
(Figure 8b) in which the main injection takes place. By contrast, in the case of the larger fuel amount 427
injected in the pilot injection (60% pilot/40% main) a leaner mixture is obtained and the flame front 428
propagation is slowed down causing high CO and HC values. Regarding soot emissions, quite similar 429
levels for all five fuel distributions studied has been obtained. 430
431
5. CONCLUSIONS 432
The analysis of the parameters derived from the in-cylinder pressure and the engine-out emissions 433
measurements shows the usefulness of the double injection strategy applied to the Spark Assisted 434
19 / 26

Partially Premixed Compression Ignition combustion mode fuelled with high ON gasoline under light 435
load operating conditions. A 1-D jet mixture distribution model calculation was used to explain some 436
trends that were observed. 437
Two studies were performed to assess the potential of the double injection strategy. First, a sweep of 438
the pilot injection timing was done while fixing the main injection timing. As part of this study, a sweep 439
of the intake XO2 concentration has been done at several points. Taking into account the global lean 440
equivalence ratio used during the tests, two different scenarios has been found: 441
- On the one hand, when advanced pilot injection timings are set, too lean mixture conditions at 442
SoC are obtained. These conditions hind the flame propagation and avoid the autoignition of the 443
rest of the mixture leading a deteriorated combustion development shifted to the expansion 444
stroke. A rapid decay in the FeCE due to the incomplete combustion is obtained increasing the 445
CO and HC emission levels. In this case, double injection do not provide better results than the 446
single injection strategy. Due to the poor combustion development, lower NOx and soot 447
emission levels are obtained. 448
- On the other hand, the use of more delayed pilot injection timings provides the necessary 449
conditions at the start of combustion, preventing the over-mixing. The better air/fuel mixture 450
distribution enhances the combustion development improving the IMEP and and lowering the 451
CO and HC emissions (higher FeCE) in comparison with the single injection strategy. Higher NOx 452
and soot emission levels are obtained too. 453
In a second study, five different mass distributions between the pilot and main injection were evaluated. 454
Having in mind the lean global equivalence ratio used (φg=0.36), it is possible to state that: 455
20 / 26
- By increasing the mass percentage in the main injection the over-mixing effect is avoided. The 456
more reactive conditions at SoC improve significantly the combustion process, providing higher 457
IMEP values and consequently reducing the ISFC. Therefore, higher NOx and lower CO and UHC 458
emissions were obtained. 459
- In terms of IMEP and ISFC, all the five mass distributions tested with the double injection 460
strategy improved the results in comparison with the single injection strategy. 461
As a general conclusion, it has been demonstrated that the better air/fuel mixture distribution obtained 462
using double injection strategies, in comparison with the single injection strategy, enhances the 463
combustion development improving the Fuel energy Conversion Efficiency. Thus, the use of the double 464
injection strategy allows to widen the PPC with spark assistance operating range in low load conditions. 465
It is worthy to note that in this light load operating conditions no autoignition is achieved without the 466
use of the spark assistance. Finally, it is important to remark that the present work was carried out 467
without any optimization in terms of engine hardware settings and consequently more research is 468
needed to found the optimum conditions. 469
470
ACKNOWLEDGMENTS 471
The authors would like to thank General Motors for supporting this research. 472
473
474
475
476
REFERENCES 477
21 / 26
[1] Kimura S, Aoki S, Kitahara Y, Aiyoshizawa E. Ultra-clean Combustion Technology Combining a Low-478
temperature and Premixed Combustion Concept for Meeting Future Emission Standards, SAE 479
International, SAE 2001-01-0200, 2001. 480
[2] Singh AP, Agarwal AK. Combustion characteristics of diesel HCCI engine: an experimental 481
investigation using external mixture formation technique. Appl Energy 2012. 482
[3] Law D, Kemp D, Allen J, Kirkpatrick G, Copland T. Controlled combustion in an IC-engine with a fully 483
variable valve train. SAE paper 2001-01-0251; 2001. 484
[4] Agrell F, Ångström H-E, Eriksson B, Wikander J, Linderyd J. Integrated simulation and engine test of 485
closed loop HCCI control by aid of variable valve timings. SAE paper 2003-01-0748; 2003. 486
[5] Haraldsson G, Tunestål P, Johansson B, Hyvönen J. HCCI combustion phasing in a multi cylinder 487
engine using variable compression ratio. SAE paper 2002-01-2858; 2002. 488
[6] Maurya R K, Agarwal A K. Experimental investigation on the effect of intake air temperature and air–489
fuel ratio on cycle-to-cycle variations of HCCI combustion and performance parameters. Applied 490
Energy, Vol. 88, pp 1153-1163, 2011. 491
[7] Yang J, Culp T, Kenney T. Development of a Gasoline Engine System Using HCCI Technology e the 492
Concept and the Test Results, SAE paper 2002-1-2832. 493
[8] Kalghatgi G, Kumara Gurubaran R, Davenport A, Harrison AJ, Hardalupas Y, Taylor AMKP. Some 494
advantages and challenges of running a Euro IV, V6 diesel engine on a gasoline fuel. Fuel, Vol. 108, 495
pp 197-207, 2013. 496
[9] Yu C, Wang J, Wang Z, Shuai S. Comparative study on Gasoline Homogeneous Charge Induced 497
Ignition (HCII) by diesel and Gasoline/Diesel Blend Fuels (GDBF) combustion. Fuel, Vol. 106, pp 470-498
447, 2013. 499
[10] Risberg P, Kalghatgi G, Ångstrom H, Wåhlin F. Auto-ignition quality of Diesel-like fuels in HCCI 500
engines. SAE Technical Paper 2005-01-2127, 2005. 501
22 / 26

[11] Kalghatgi G, Risberg P, Ångström H. Advantages of Fuels with High Resistance to Auto-ignition in 502
Lateinjection, Low-temperature, Compression Ignition Combustion. SAE Technical Paper 2006-01-503
3385, 2006. 504
[12] Kalghatgi G, Risberg P, Ångström H. Partially Pre-Mixed Auto-Ignition of Gasoline to Attain Low 505
Smoke and Low NOx at High Load in a Compression Ignition Engine and Comparison with a Diesel 506
Fuel. SAE Technical Paper 2007-01-0006, 2007. 507
[13] Kalghatgi G. Low NOx and Low Smoke Operation of a Diesel Engine using Gasoline-Like Fuels. ASME 508
International Combustion Engine Division 2009 Spring Technical Conference, ICES2009-76034, 2009. 509
[14] Manente V, Johansson B, Tunestal P. Partially Premixed Combustion at High Load using Gasoline and 510
Ethanol, a Comparison with Diesel. SAE Technical Paper 2009-01-0944, 2009. 511
[15] Manente V, Johansson B, Tunestal P. Half Load Partially Premixed Combustion, PPC, with High 512
Octane Number Fuels. Gasoline and Ethanol Compared with Diesel. SIAT 2009 295, 2009. 513
[16] Manente V, Johansson B, Tunestal P. Characterization of Partially Premixed Combustion with 514
Ethanol: EGR Sweeps, Low and Maximum Loads. ASME International Combustion Engine Division 515
2009 Technical Conference, ICES2009-76165, 2009. 516
[17] Manente V, Tunestal P, Johansson B, Cannella W. Effects of Ethanol and Different Type of Gasoline 517
Fuels on Partially Premixed Combustion from Low to High Load. SAE Technical Paper 2010-01-0871, 518
2010. 519
[18] Ra Y, Yun J E, Reitz R. Numerical Simulation of Diesel and Gasoline-fueled Compression Ignition 520
Combustion with High-Pressure Late Direct Injection. Int. J. Vehicle Design, Vol. 50, Nos. 1,2,3,4. 521
pp.3-34, 2009. 522
[19] Ra Y, Yun J E, Reitz R. Numerical Parametric Study of Diesel Engine Operation with Gasoline. Comb. 523
Sci. and Tech., 181:350-378, 2009. 524
23 / 26
[20] Dempsey A, Reitz R. Computational Optimization of a Heavy-Duty Compression Ignition Engine 525
Fueled with Conventional Gasoline. SAE Int. J. Engines 4(1):338-359, 2011, doi:10.4271/2011-01-526
0356. 527
[21] Ra Y, Loeper P, Reitz R, Andrie M, et al. Study of High Speed Gasoline Direct Injection Compression 528
Ignition (GDICI) Engine Operation in the LTC Regime. SAE Int. J. Engines (1):1412-1430, 2011. 529
[22] Ra Y, Loeper P, Andrie M, Krieger R, et al. Gasoline DICI Engine Operation in the LTC Regime Using 530
Triple- Pulse Injection. SAE Int. J. Engines 5(3):1109-1132, 2012. 531
[23] Ciatti S, Subramanian S. An Experimental Investigation of Low Octane Gasoline in Diesel Engines. 532
ASME International Combustion Engine Division 2010 Technical Conference, ICEF2010-35056, 2010. 533
[24] Das Adhikary B, Ra Y, Reitz R, Ciatti S. Numerical Optimization of a Light-Duty Compression Ignition 534
Engine Fuelled With Low-Octane Gasoline. SAE Technical Paper 2012-01-1336, 2012. 535
[25] Ciatti S, Johnson M, Das Adhikary B, Reitz R, et al. Efficiency and Emissions performance of 536
Multizone Stratified Compression Ignition Using Different Octane Fuels. SAE Technical Paper 2013-537
01-0263, 2013. 538
[26] Benajes J, García A, Domenech V, Durrett R. An investigation of partially premixed compression 539
ignition combustion using gasoline and spark assistance. Applied Thermal Engineering Vol 52 p. 468–540
477; 2013. 541
[27] Pastor JV, García-Oliver JM, García A, Micó C, Durrett R. A spectroscopy study of gasoline partially 542
365 premixed compression ignition spark assisted combustion. Applied Energy, Vol. 104, pp 568-543
575, 366 2013. 544
[28] Desantes JM, Payri R, García A, Monsalve-Serrano J. Evaluation of Emissions and Performances from 545
Partially Premixed Compression Ignition Combustion using Gasoline and Spark Assistance. SAE paper 546
2013-01-1664; 2013. 547
24 / 26

[29] Weall A, Collings, N. Gasoline Fuelled Partially Premixed Compression Ignition in a Light Duty Multi 548
Cylinder Engine: A Study of Low Load and Low Speed Operation. SAE Int. J. Engines 2(1):1574-1586, 549
2009. 550
[30] Das Adhikary B, Reitz R, Ciatti S. Study of In-Cylinder Combustion and Multi-Cylinder Light Duty 551
Compression Ignition Engine Performance Using Different RON Fuels at Light Load Conditions. SAE 552
Technical Paper 2013-01-0900, 2013. 553
[31] Desantes JM, Pastor JV, García-Oliver JM, Pastor JM. A 1D model for the description of mixing-554
controlled reacting diesel sprays. Combustion and Flame 2009; 156:234–49. 555
[32] Lapuerta M, Armas O, Hernández JJ. Diagnostic of D.I. Diesel Combustion from In-Cylinder Pressure 556
Signal by Estimation of Mean Thermodynamic Properties of the Gas. Applied Thermal Engineering. 557
Vol 19 Nº 5 p. 513–529; 1999. 558
[33] Payri F, Molina S, Martín J, Armas O. Influence of measurement errors and estimated parameters on 559
combustion diagnosis. Applied Thermal Engineering Vol 26 Nº 2-3 p. 226–236; 2006. 560
[34] Brecq G, Le Corre O. Modeling of In-cylinder Pressure Oscillations under Knocking Conditions: 561
Introduction to Pressure Envelope Curve. SAE paper 2005-01-1126; 2005. 562
[35] Borg JM, Alkidas AC. Characterization of Autoignition in a Knocking SI Engine Using Heat Release 563
Analysis. SAE paper 2006-01-3341; 2006. 564
[36] Eng JA. Characterization of Pressure Waves in HCCI Combustion. SAE paper 2002-01-2859; 2002. 565
[37] Sjöberg M, Dec JE. Effects of Engine Speed, Fueling Rate, and Combustion Phasing on the Thermal 566
Stratification Required to Limit HCCI Knocking Intensity. SAE paper 2005-01-2125; 2005. 567
[38] Pastor JV, López JJ, García JM, Pastor JM. A 1D model for the description of mixing-controlled inert 568
diesel sprays. SAE paper 2005-01-1126; 2005. 569
570
571 ABBREVIATIONS 572
25 / 26
bTDC: before Top Dead Center 573
CAD: Crank Angle Degree 574
CA10: Cranck Angle at 10% mass fraction burned 575
CI: Compression Ignition 576
DI: Direct Injection 577
EI: Emission Index 578
EOImain: End of main injection 579
EOIpilot: End of pilot injection 580
FeCE: Fuel energy Conversion Efficiency 581
FFT: Fast Fourier Transform 582
FSN: Filter Smoke Number 583
HCCI: Homogeneous Charge Compression Ignition 584
IMPG: Integrate Modulus of Pressure Gradient 585
ISFC: Indicates Specific Fuel Consumption 586
LTC: Low Temperature Combustion 587
PCCI: Premixed Charge Compression Ignition 588
PPC: Partially Premixed Charge 589
SoC: Start of Combustion 590
SOImain: Start of main injection 591
SOIpilot: Start of pilot injection 592
SoS: Start of Spark 593
TDC: Top Dead Center 594
26 / 26

Figure 1. Image of the modified cylinder head with spark plug and injector hole (left). Diagram of the relative position between the injector and spark plug (right)
Figure 2. Complete test cell setup
Figure 3. NOx vs HC, SOOT, CO and ISFC trade-off for the injection timing SoI=-24 CAD

Figure 4. Fuel mass Distribution vs. φ at the spark discharge time. Pilot injection: -25 CAD, Main injection: -9 CAD
Figure 5. FeCE, IMPG, IMEP and ISFC results for the double injection strategy and the single injection strategy reference case (dashed line). Main injection timing fixed at -9 CAD and pilot
injection timing swept from -31 to -16 CAD in steps of 3 CAD
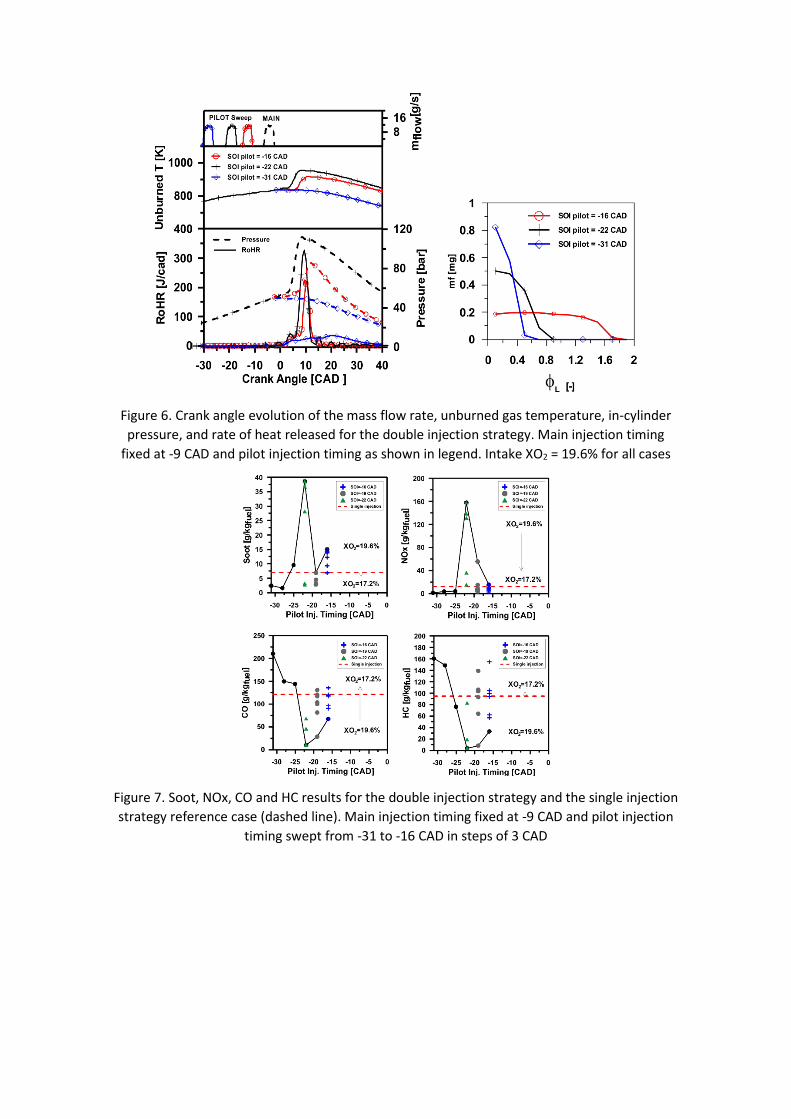
Figure 6. Crank angle evolution of the mass flow rate, unburned gas temperature, in-cylinder pressure, and rate of heat released for the double injection strategy. Main injection timing
fixed at -9 CAD and pilot injection timing as shown in legend. Intake XO2 = 19.6% for all cases
Figure 7. Soot, NOx, CO and HC results for the double injection strategy and the single injection strategy reference case (dashed line). Main injection timing fixed at -9 CAD and pilot injection
timing swept from -31 to -16 CAD in steps of 3 CAD

Figure 8. Crank angle evolution of fuel mass flow rate, unburned gas temperature, in-cylinder pressure, and rate of heat released for 40/60, 50/50 and 60/40 fuel mass distribution (7a).
Distribution of fuel mass vs. φ in experimental SoC (up) and autoignition time (down) for the same fuel mass distributions (7b)
Figure 9. FeCE, IMPG, IMEP and ISFC results for the double injection strategy and the single injection strategy reference case (dashed line). 40/60, 45/55, 50/50, 55/45, 60/40 fuel mass
distribution between the main and pilot injection

Figure 10. Soot, NOx, CO and HC results for the double injection strategy. 40/60, 45/55, 50/50, 55/45, 60/40 fuel mass distribution between the main and pilot injection
Engine Injection system Fuel Type CI, 4stroke, DI Type CR Type Gasoline Cylinder number 1 Injector Bosch CRIP 3.3 Bore x Stroke 85 x 96 mm Hole number 7 Density 722 kg/m3 Compression ratio 14.7:1 Included angle 154º Viscosity 0.37 mm2/s Bowl diameter x depth 45 x 18 mm Hole diameter 97 um RON 98 [-] Displacement 545 cm3 Flow capacity 210 cm3/30 s Lower HV 44542 kJ/kg
Table 1. Main characteristics: single cylinder engine, injection system and fuel
Study Pinj [bar]
Engine Speed [rpm]
Inj.Timing [º aTDC]
Spark Timing
Intake XO2 [%]
Global φ [-]
Single injection
Pinj variation 600
1500 -24 EOI 19.6
0.3-0.55 900 0.3-0.55
1200 0.25-0.75 XO2 variation 900 18.6 0.3-0.36
19.6 0.22-0.3
Double
injection P:35% M:65%
900 1500 SOI pilot: -16 EOI main: -3
EOI main 18 0.36 P:65% M:35%
P:50% M:50%
Table 2. Operating conditions for the single injection and double injection strategy preliminary results
Pinj [bar]
Engine Speed [rpm]
Pilot Inj. [º aTDC]
Main Inj. [º aTDC]
Spark Timing
Intake XO2 [%]
Global φ [-]
Double injection 900 1000
-16
-9 EOI main
19.6
0.4 -19 19.6 to
-22 19.6 to -25 19.6
-28 19.6 -31 19.6
Single injection
900 1000 - -9 EOI
main 19.6 0.4
Table 3. Operating conditions tested to evaluate the effect of dwell and oxygen concentration

Pinj [bar]
Engine Speed [rpm]
Inj.Timing [º aTDC]
Spark Timing
Intake XO2 [%]
Global φ [-]
Double
P:40% M:60%
900 1500
SOI pilot: -16 EOI main: -3
EOI main 18 0.36
P:45% M:55% P:50% M:50% P:55% M:45% P:60% M:40%
Single -9 EOI
Table 4. Operating conditions for the mass distribution sweep using the double injection strategy