Biomarcadores de respuesta inmune - GEM · Biomarcadores de respuesta inmune Simposio GEM´13...
44
Biomarcadores de respuesta inmune Simposio GEM´13 Miguel F de Sanmamed Clínica Universidad de Navarra
Transcript of Biomarcadores de respuesta inmune - GEM · Biomarcadores de respuesta inmune Simposio GEM´13...

Biomarcadores de respuesta inmune
Simposio GEM´13Miguel F de SanmamedClínica Universidad de Navarra
Tumor
Ganglio drenaje
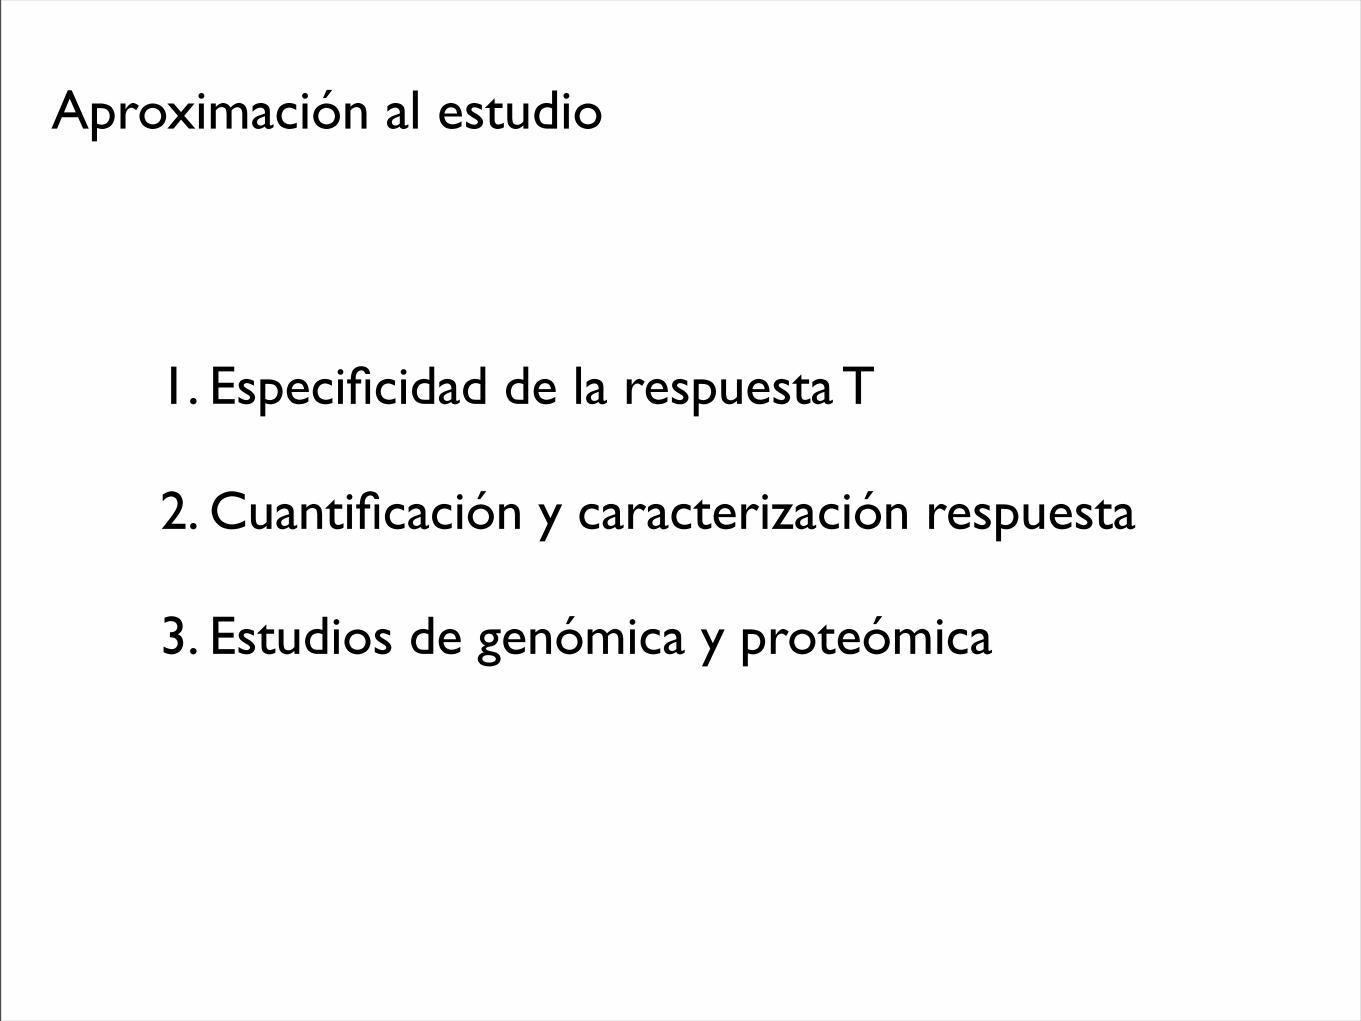
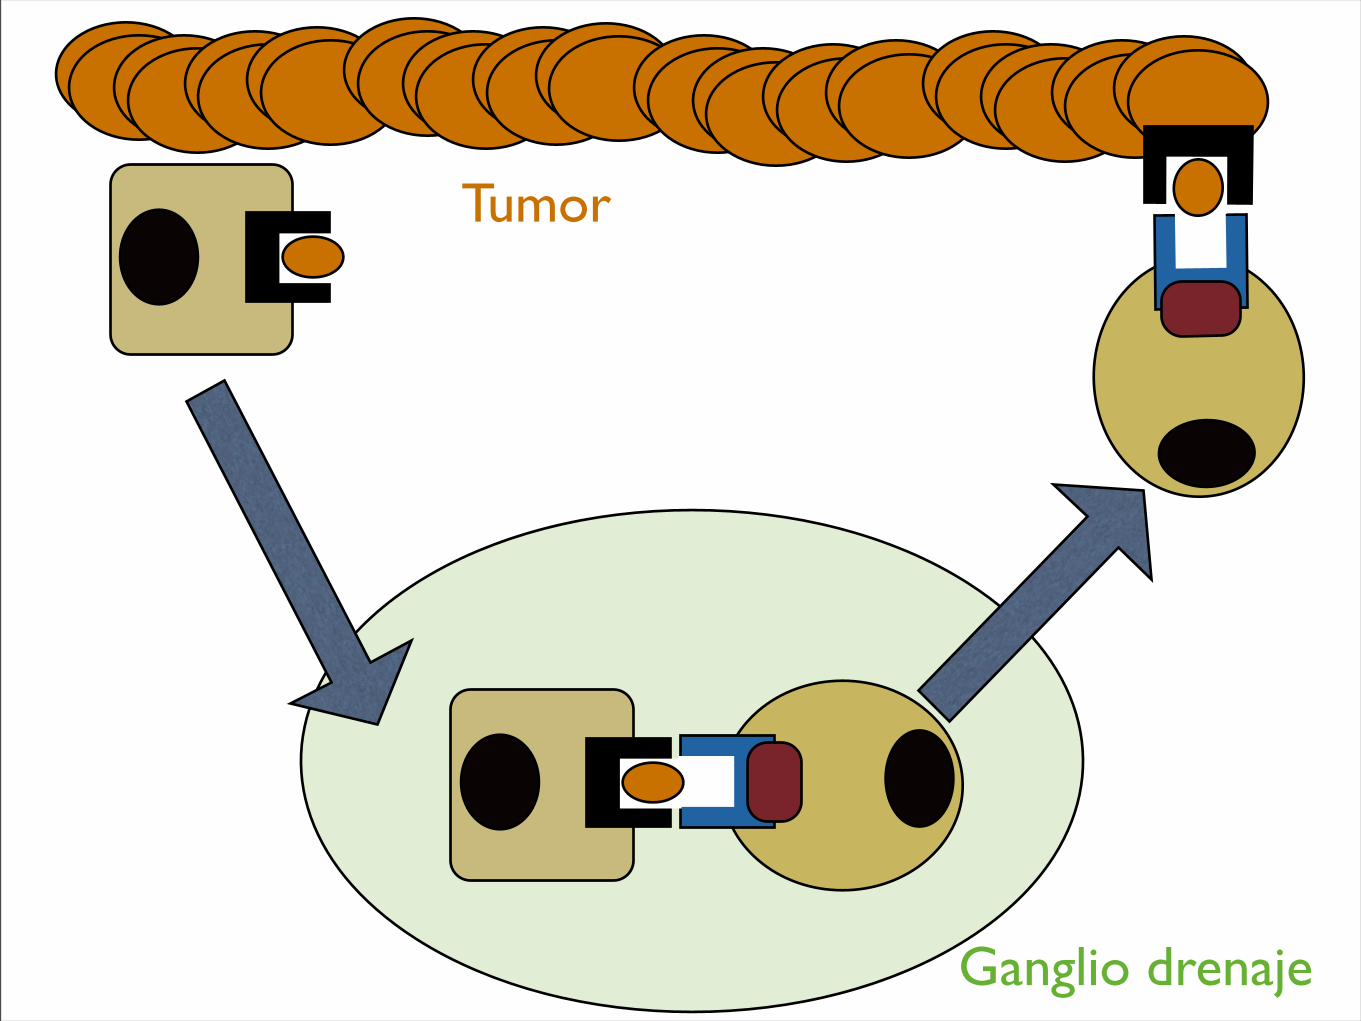
Aproximación al estudio
1. Especificidad de la respuesta T
2. Cuantificación y caracterización respuesta
3. Estudios de genómica y proteómica

1. Especificidad de la respuesta
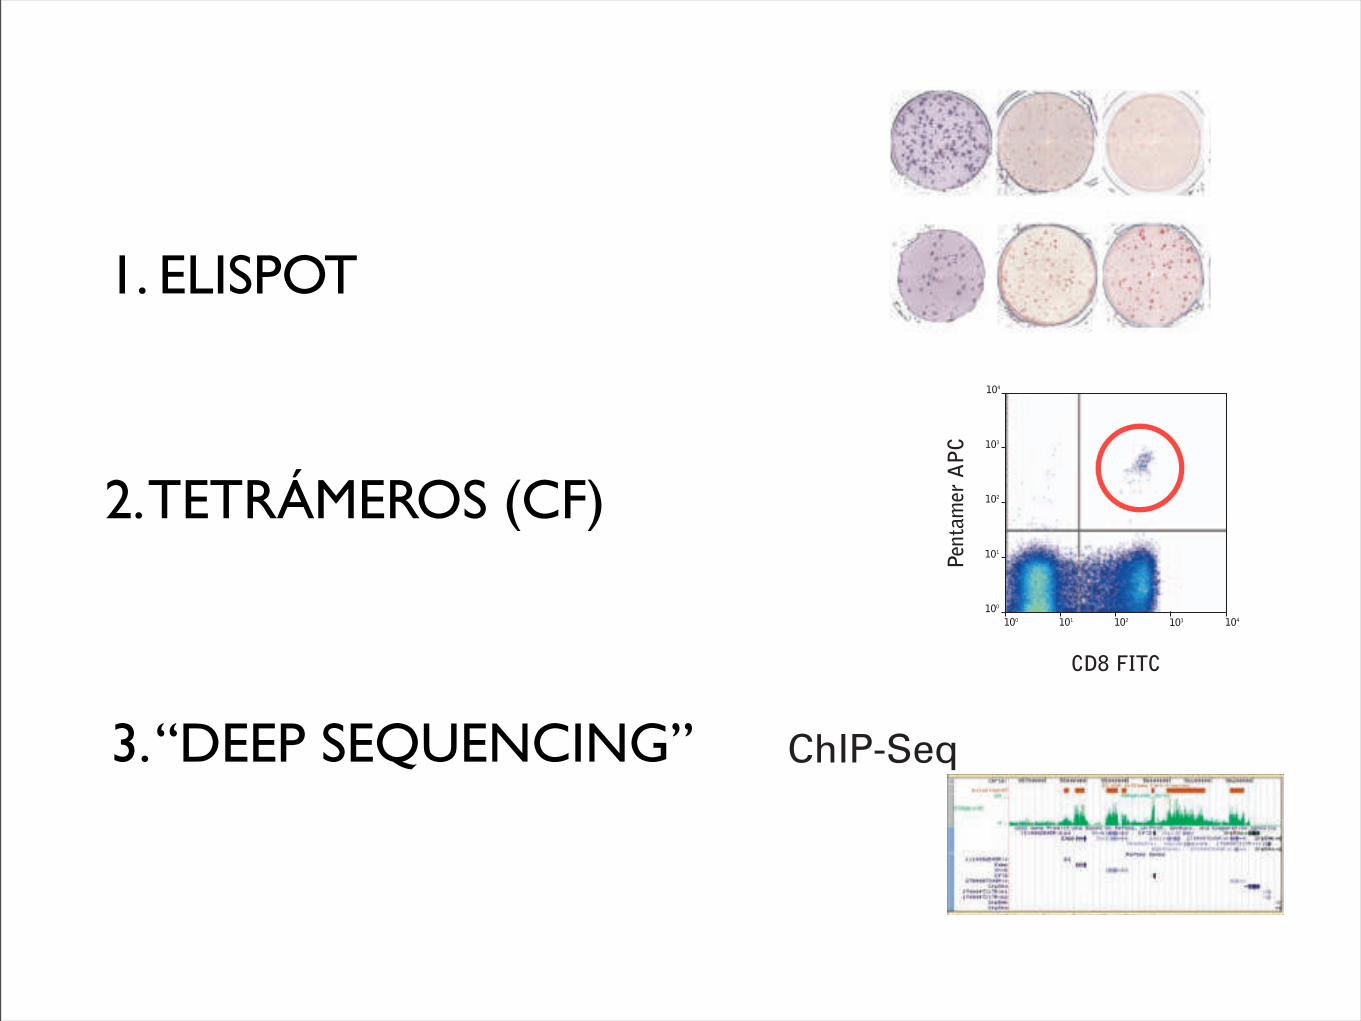
1. ELISPOT
2. TETRÁMEROS (CF)
3. “DEEP SEQUENCING”
1390 Review | JNCI Vol. 102, Issue 18 | September 22, 2010
combined panel results led to initial ELISPOT harmonization guidelines (Table 2) (20), which synchronize key variables across laboratories and substantially influence assay outcome but do not impose standardization of assays on individual laboratories. The introduction of these guidelines is central to this harmonization to provide general assistance for the conduct of the individual assay protocol in the context of standard operating procedures (eg, exclusion of apoptotic cells, use of pretested serum for background reduction, and quality control during the computerized spot evaluation) (Table 2) (20). Confirmatory findings from a parallel experiment were published by the C-IMT proficiency panels (21). As the use of serum is a crucial variable for ELISPOT assays, a separate ELISPOT proficiency panel focused on serum use and showed that serum-free medium for incubation of cells can be as effective as qualified serum-supplemented medium, thus address-ing this crucial variable for assay protocols as part of the harmoni-zation guidelines (33).
The first round of the HLA-peptide multimer-staining panel of CIC-CRI allowed the formulation of initial harmonization guide-lines (22), which will likely reduce assay variability. These recom-mendations are 1) the use of more than two colors for staining, 2)
protocol details are reported back for central analysis. Since 2005, more than 80 laboratories from 14 countries have participated, encompassing the academic, nonprofit, biotech, and pharma-ceutical sectors, and the United States Department of Defense (20,22).
The ELISPOT panel is the longest running program and pro-vides the most mature results. The objective of the first ELISPOT panel was to identify sources of variability among assay procedures. The second panel adjusted these sources of variability while keeping the respective laboratory protocols intact. This adjust-ment led to a substantial reduction in variability: The percentage of participants unable to detect all responders (six responders among eight samples) was reduced from 47% to 14%, and the percentage of participants unable to detect 50% or more of all responders (“outliers”) dropped from 11% to 0% (Figure 2). The
Figure 1. High variability of results for the enzyme-linked immunosorbent spot (ELISPOT) immune response assay. Identical peripheral blood mononuclear cell samples from the same patient were sent to 36 different laboratories experienced with ELISPOT methodology. The image shows the spot count results in microtiter plates in which each
well represents the result of one laboratory. Some wells show high numbers of spots, whereas others are low or negative. Each spot in this assay represents a single T-cell capable of reacting against a defined target antigen. These results reflect the outcome of the first ELISPOT profi-ciency panel, which identified sources of variability among laboratories.
Table 2. Initial harmonization guidelines for the enzyme-linked immunosorbent spot (ELISPOT) immune response assay*
A Use only pretested and optimized serum allowing for low background : high signal ratio
B Establish laboratory SOP for ELISPOT testing procedures, including:
B1 Counting method for apoptotic cells for determining adequate cell dilution for plating
B2 Overnight rest of cells before plating and incubationC Establish SOP for plate reading, including: C1 Human auditing during reading process C2 Adequate adjustments for technical artifactsD Only allow trained personnel, certified per laboratory SOP,
to conduct assays
* Harmonization guidelines can be used by each individual laboratory performing an immune response assay in the context of Standard Operating Procedures (SOPs) and without adopting a standard assay protocol. Through general steps such as use of pretested serum [or serum-free media (33)], exclusion of apoptotic cells from the analysis, human auditing of the computerized assay read out procedure, and training of operators on the laboratory SOPs, quality of assays can be substantially improved. Courtesy of Janetzki et al. (20).
Figure 2. Effect of assay harmonization on data variability of the enzyme-linked immunosorbent spot (ELISPOT) assay. In the Cancer Immunotherapy Consortium of the Cancer Research Institute ELISPOT proficiency panel, participating laboratories reported the response status from eight different donor–antigen combinations. Grey bars rep-resent the first panel round and stippled bars the second panel round. In the first panel round, 47% of panelists missed detection of at least one response correctly, and 11% of panelists failed to detect at least three responses correctly (characterized as an “outlier” because of high variability). Based on the first panel results, harmonization criteria were given to panelists, and the testing was repeated in the second panel (stippled bars). ELISPOT performance improved, with only 14% of pan-elists missing at least one responder and zero outliers.
at Universidad de N
avarra on June 10, 2013http://jnci.oxfordjournals.org/
Dow
nloaded from
Examples
Typical analysis of PBMCs stained withPentamer (APC-labeled) vs. CD8 (FITC)
Create a 2D density plot showing FSC vs. SSC. Draw a tightregion around the lymphocyte population (R1), figure 18a.
Create a second density plot, gated only on events encircledwithin R1, showing Pentamer-stained cells on the y-axis andCD8-stained cells on the x-axis. Draw a quadrant that clearlyseparates positive cells from negative cells on both axes, anduse quadrant statistics to obtain quantitative informationabout the frequency of antigen-specific CD8-positive T lymphocytes, figure 18b.
Figure 18
(a) (b)
0 10230
1023
100 101 102 103 104
100
101
102
103
104
R1
FSC-H
SSC-
H
Pent
amer
APC
CD8 FITC
Quadrant Statistics Gate: R1Gated Events: 86686Total Events: 186186
Quad Events %Gated Y MeanUL 28 0.03 91.0UR 134 0.15 453.1LL 61078 70.46 2.0UL 25446 29.35 2.7
1
2
68
Section 6
J4971 ProImmune Pentimer Handbook amends V2_0971-PR Handbook 06.3 10/05/2012 16:43 Page 68
technology widely accessible to many investigators. For example, in2007, a personal genome sequenced by using the Sanger method costUS$70 million36; by 2010, the cost for sequencing a genome by usingMPS had dropped to approximately US$50,000, and in 2013, genome
sequencing can be performed in a commercial or research setting forunder US$5,000 (Fig 2). Second, the development of MPS conferredsubstantial increases in both the sensitivity (by sequencing to a highredundancy) and the scalability of sequencing, thus allowing a deep
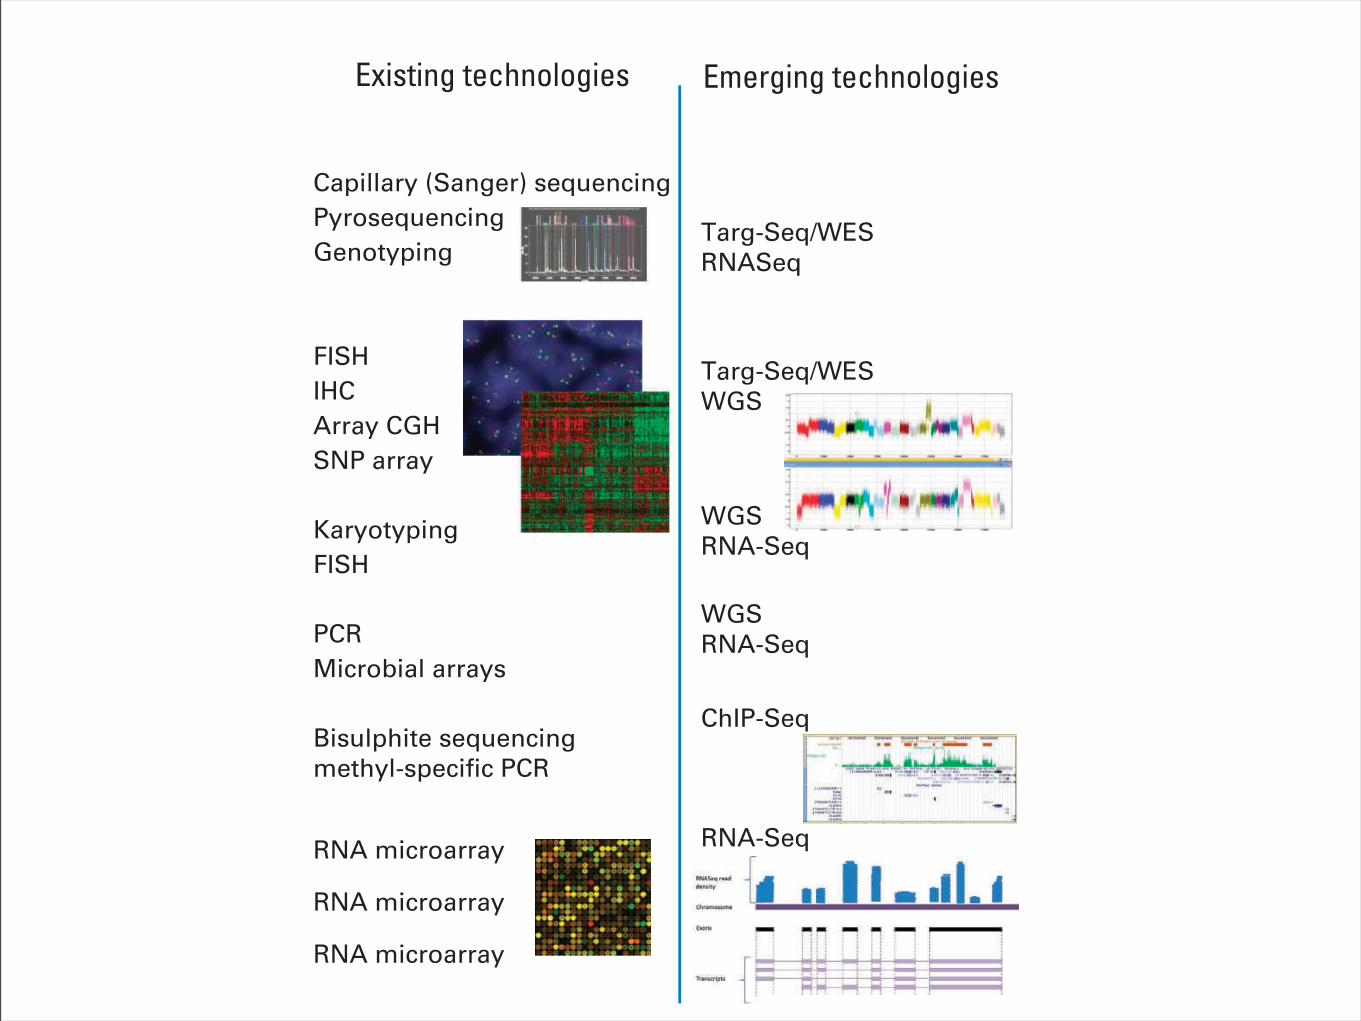
Molecular alterations in cancer
DNA
RNA
• Point mutations (substitutions/indels)
Tumor tissue
Existing technologies Emerging technologies
Capillary (Sanger) sequencingPyrosequencingGenotyping
FISHIHCArray CGHSNP array
KaryotypingFISH
PCRMicrobial arrays
Bisulphite sequencingmethyl-specific PCR
Targ-Seq/WESRNASeq
Targ-Seq/WESWGS
WGSRNA-Seq
WGSRNA-Seq
ChIP-Seq
RNA-SeqRNA microarray
RNA microarray
RNA microarray
• Copy number gains or losses
• Rearrangements, fusion genes
• Pathogenic sequences
• Epigenetic modifications
• Altered transcript expression levels
• Altered allele-specific expression
• Differential alternative splicing
cm 2
Fig 1. Categories of genomic alterationsand technologies for detection. Many of thehallmark alterations in cancer are currentlydetected by using a multitude of existingtechnologies, often in a serial fashion, eachusing an appreciable amount of nucleic acid.Newer sequencing-based methodologies arecapable of interrogating many types of canceralterations in one composite, sensitive test.CGH, comparative genomic hybridization;ChIP-Seq, chromatin immunoprecipitation fol-lowed by massively parallel sequencing; FISH,fluorescent in situ hybridization; IHC, immuno-histochemistry; PCR, polymerase chain reac-tion; RNA-Seq, RNA sequencing, also knownas transcriptome sequencing; SNP, single nu-cleotide polymorphism; Targ-Seq, targeted se-quencing; WES, whole-exome sequencing;WGS, whole-genome sequencing.
Cost
per
Raw
Meg
abas
eof
DN
A Se
quen
ce ($
)
10,000
1,000
100
10
1
0.01
0.10
2000
2001
2002
2003
2004
2005
2006
2007
2008
2009
2010
2011
2012
2013
2014
2015
Sanger sequencing Massively parallelsequencing
Moore’s Law
Emerging sequencingtechnologies
2005454 pyrosequencingGS-20
2008First tumor: normalgenome sequenced
2001IHGSC report the sequence of the first human genome
$1,000 genome?
$10K genome
$1M genome
2007ABI/SOLiDsequencer
2009Illumina GAIIX, SOLiD 3.0
2011Ion Torrent PGMPacBio RSIllumina MiSeq
2006Solexa/Illuminasequencer
2008Helicos BioSciences
2010Illumina HiSeq 2000Oxford Nanopore
2012Intelligent BioSystems
Fig 2. The decrease in cost of genomesequencing facilitated by massively parallelsequencing technologies. The cost of se-quencing has decreased at a rate faster thanMoore’s law in the past 10 years. The datafrom 2001 through 2007 represent the costsof generating DNA sequences by usingSanger-based chemistries and capillary-basedinstruments (first-generation sequencing plat-forms). Starting in 2008, the data representthe costs of generating DNA sequences byusing second-generation sequencing technol-ogies. The change in instruments representsthe rapid evolution of DNA sequencing tech-nologies that has occurred in recent years.Landmark events are also indicated on thetimeline. The release of various second- andthird-generation technologies is indicated inblue boxes. IHGSC, International Human Ge-nome Sequencing Consortium. Data adaptedfrom the National Human Genome ResearchInstitute Web site.35
Technologies for Tumor Genomic Profiling
www.jco.org © 2013 by American Society of Clinical Oncology 1817
159.237.12.82Information downloaded from jco.ascopubs.org and provided by at Universidad de Navarra on June 7, 2013 from
Copyright © 2013 American Society of Clinical Oncology. All rights reserved.

2. Cuantificación y caracterización respuesta
Articles
www.thelancet.com/oncology Vol 11 February 2010 163
from both these trials are especially noteworthy in view of the poor outlook of the patients (eg, >50% had M1c stage disease) and since a raised lactate dehydrogenase concentration at baseline was not an exclusion criterion, as it is in many other studies. As a benchmark for ongoing and future studies, a meta-analysis of 42 phase 2 trials (which included 2100 untreated and pretreated patients with stage IV melanoma) recorded a median overall survival of 6·2 months and a 1-year survival of 25·5%;30 multivariate analyses showed that Eastern Cooperative Oncology Group performance status, presence of visceral disease, sex, and brain metastases were signifi cant prognostic factors for overall survival.30 Our study excluded individuals with brain metastases, and all patients in the 10 mg/kg group had a performance status of 0 or 1; however, more than 60% were men and many had visceral disease, both of which are associated with short overall survival.30 Overall, the results of our study support further investigations to establish if ipilimumab can extend survival in patients with advanced melanoma, both in those with good and poor prognostic factors.
New response patterns have been noted consistently in clinical studies with ipilimumab, which are captured by the immune-related response criteria, as shown by exploratory analyses of data from study CA184-008 and this current study.24 These patterns include a response in the presence of new lesions and a decline in total tumour burden after progressive disease, as characterised by modifi ed WHO criteria.24 Stable disease is also commonly observed with ipilimumab therapy, which in some patients is followed by a slow, steady decline in total tumour burden.13,20,24 Most importantly, patients who achieve stable disease have a favourable survival outcome similar to individuals who achieve an objective response.24 Stable disease was recorded in all three treatment groups in the current study, although the number of patients achieving clinical activity per immune-related response criteria were few. Capturing such responses might have been limited by the small size of the study and incomplete follow-up after progressive disease.
The overall adverse event profi le of ipilimumab in this study is consistent with previous fi ndings and with the drug’s immune-based mechanism of action.13 Immune-related adverse events diff er from adverse events typically reported with cytotoxic agents, and grade 3–4 immune-related events need swift medical attention to prevent life-threatening outcomes. A dose-dependent increase in immune-related adverse events of any grade was seen with increasing dose of ipilimumab; grade 3–4 events aff ected a quarter of patients in the 10 mg/kg group. Although no grade 3–4 immune-related adverse events were reported in the 0·3 mg/kg group, the appearance of mild-to-moderate immune-related events suggests a biological eff ect of ipilimumab that was suffi cient to cause mild eff ects but insuffi cient to translate into an objective response.
Most high-grade events could be managed medically with treatment guidelines included in the trial protocol, and they resolved or improved within about 4 weeks.31
Our results indicate that treatment with ipilimumab monotherapy at 10 mg/kg showed activity in heavily pretreated patients with advanced melanoma, with high-grade immune-related adverse events well managed with specifi c treatment guidelines. Further investigations of ipilimumab effi cacy and safety at 10 mg/kg in patients with advanced melanoma are warranted. Ongoing studies include a phase 3 trial of ipilimumab (at 10 mg/kg) in combination with dacarbazine (at standard dosing) in treatment-naive patients with unresectable stage III or IV melanoma.ContributorsJDW, AH, and SO’D designed the study. BN, GL, JL, DS, MS, JC, KChin, KChen, AH, SO’D, and CL contributed to either analysis or inter pretation of data, or both. All authors collected data and helped to write the report.
Confl icts of interest All study sites and institutions received funding from Bristol-Myers Squibb to cover the expenses of the investigators for undertaking this trial. KChin, KChen, and AH are employed by Bristol-Myers Squibb and declare stock ownership in the company. JDW, JL, DS, MS, J-JG, SO’D, and CL have served as consultants for, acted on advisory boards, served on speakers bureau, or received honoraria from Bristol-Myers Squibb. JDW has acted as a consultant for Medarex. All other authors declared no confl icts of interest.
AcknowledgmentsWe thank Amit Roy (Bristol-Myers Squibb) for providing the pharmacokinetic analyses and Scott D Chasalow (Bristol-Myers Squibb) for undertaking analyses of absolute lymphocyte counts. Editorial and writing assistance was provided by StemScientifi c, funded by Bristol-Myers Squibb.
–3
1·0
0
Fitt
ed m
ean
abso
lute
lym
phoc
yte c
ount
(!10
00 ce
lls p
er µ
L)
1·2
1·4
1·6
1·8
2·0
2·2
2·4
2·60·3 mg per kg 3 mg per kg 10 mg per kg
0 3 6 9 12 3Weeks since first dose
6 9 12 3 6 9 120 0–3 –3
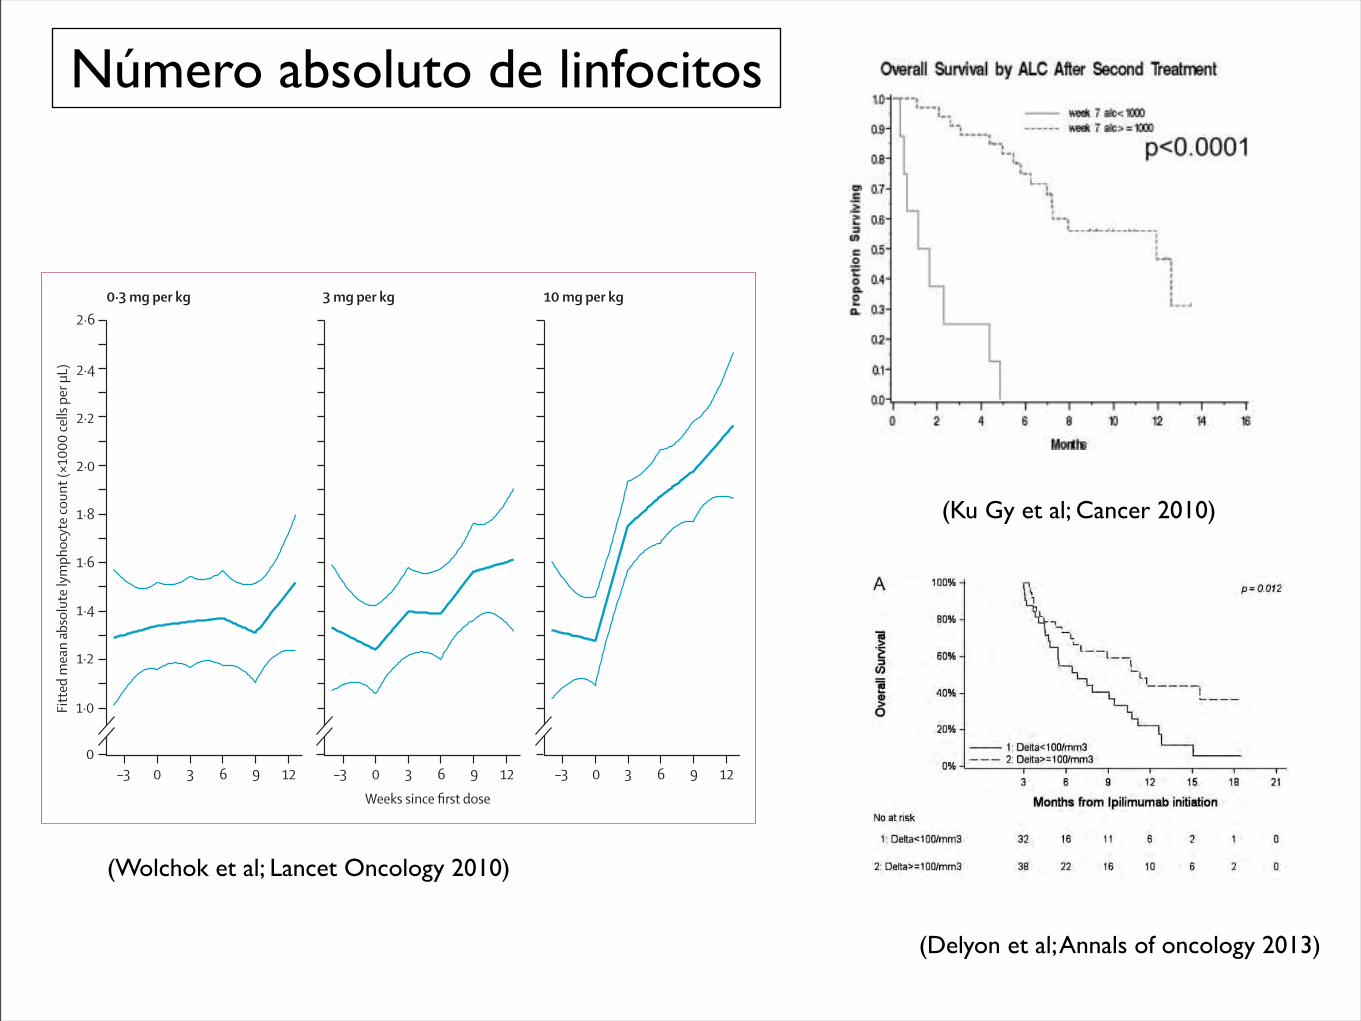
Figure !: Fitted mean absolute lymphocyte count versus weeks since fi rst dose, by treatment groupDatapoints include 4 weeks before baseline to the end of the induction dosing period. Thick curves=fi tted means. Thin curves=pointwise two-sided 95% CI.
CTLA-4 antibody, were recently published.23 This trialreported an objective RR of 9% by Response EvaluationCriteria in Solid Tumors criteria, a CR ! PR ! SD rateof 39% to 41%, and a grade 3 to 4 toxicity rate of 13% to27%. Median time to progression was about 1.9 months,with median OS of 9.97 to 11.53 months. With theexception of the longer OS reported in this trial, whichwas likely because of the enrollment of only treatment-na-ive patients with relatively low LDH, and despite the cav-eats of comparing different phase 2 trials, these results areotherwise strikingly similar to ours. Certainly, the medianOS of 7.2 months that we report in our heavily pretreatedpatients also compares favorably to standard first-linetherapies for melanoma, such as temozolomide ordacarbazine.24
In this study, results were reported according toimmune-related response criteria because these were usedfor clinical decision making. When we also evaluatedresponses using traditional modified WHO criteria, wenoted strong agreement between both criteria. As mightbe expected, the only discrepancies occurred when 2patients who were adjudicated to have immune-relatedSD would have experienced PD by the modified WHOcriteria because of the development of new metastaticlesions (which increased the total tumor burden used inthe immune-related criteria by<25%). As such, there wasno change in the objective RR or best response rate of SDor PD. There was a slight difference in theWeek 24 CR!PR! SD rate of 30% (15 of 51 patients) versus the Week24 immune-related CR ! immune-related PR !immune-related SD rate of 33% (17 of 51 patients), aswell as a small change in the median PFS by modifiedWHO versus immune-related criteria (2.5 vs 2.6 months,respectively).
Our results suggest that patients who develop grade3 to 4 immune-related adverse events are more likely toexperience clinical benefit at Week 24 compared withthose with no or mild immune-mediated toxicity. Theseresults are consistent with prior reports25-27 and are alsobiologically consistent with the belief that CTLA-4 block-ade acts in a nonspecific fashion to de-repress the immunesystem, resulting in the frequent but not absolute co-occurrence of antitumor effect and autoimmune-like tox-icity. Of note, the median number of ipilimumab treat-ments that patients with grade 3 to 4 immune-relatedadverse events received (which was 4) was identical to themedian number of treatments patients with grade "2immune-related adverse events received. The comparableduration of therapy suggests that the increased grade 3 to
Figure 3. Kaplan-Meier survival curves are shown stratified bythe absolute lymphocyte count (ALC) at (A) baseline and af-ter (B) the first and (C) second ipilimumab doses.
Compassionate Use Ipilimumab in Melanoma/Ku et al
Cancer April 1, 2010 1773
Número absoluto de linfocitos
(Ku Gy et al; Cancer 2010)
Hypereosinophilia, defined as an AEC >400/mm3, wasobserved in 22 cases (30%). Seventy-seven percent of them hadassociated irAEs, involving mostly the gastrointestinal tract:seven patients experienced diarrhea and four had colitis.Cutaneous adverse events were reported in four cases. Onecase of hepatitis and one case of hypothyroidism wereassociated with hypereosinophilia. Five patients hadhypereosinophilia with no other side-effects.An increase >100/mm3 in the AEC was associated with
longer survival (median OS of 11.3 months versus 6.8 months,P = 0.012, Figure 4A) as well as an increase >100% in the AECbetween the first two ipilimumab courses (P = 0.062,Figure 4B).In the multivariate analysis, the number of ipilimumab
courses and the ALC at the start of the second course wereindependently associated with OS: patients with fewer thanfour courses of ipilimumab were at higher risk of death thanpatients with four or more courses of ipilimumab (hazard ratio2.0; 95% CI 1.1–3.9), and patients with an ALC <1000/mm3 atthe start of the second course were at higher risk of death than
patients with an ALC >1000/mm3 (hazard ratio 3.7; 95% CI2.0–6.8).All irAEs occurring during the first 12 weeks following the
first infusion were defined as early toxic effect and were notcorrelated with OS (data not shown).
discussionWe present here the largest study describing the effects ofipilimumab in a real-life setting and the only one using thisdrug at the recommended dose of 3 mg/kg. The weakness ofour study, as in every observational study, is the difficulty ofcontrolling for potential selection bias. Our goal was to evaluatethe effect of ipilimumab in a more homogeneous population ofpatients to conduct analyses in patients who may benefit fromipilimumab therapy. To this end, we excluded from our studythe patients who died during the three first months ofipilimumab therapy. This concerned 23 patients who had very
Figure 3. Kaplan–Meier survival curves stratified by the absolutelymphocyte count at the time of the second course of ipilimumab (A) andby the differential of lymphocyte count between the first 2 courses (B). (A)Curve 1: median OS: 4.8 (95% CI 3.8–6.3). Curve 2: median OS: 11.1 (95%CI 9.1–NR). (B) Curve 1: median OS: 7.5 (95% CI 5.4–10.7). Curve 2:median OS: 15.5 (95% CI 7.1–NR). (Median OS is expressed in monthsfrom the date of ipilimumab introduction.)
Figure 4. Kaplan–Meier survival curves stratified by the differential ofeosinophil count between the first 2 courses of ipilimumab (A) and by theevolution of AEC between the first 2 courses (in patients with not-nullvalue of eosinophils at the time of the first infusion, n = 53) (B). (A) Curve1: median OS: 6.8 (95% CI 4.8–10.4). Curve 2: median OS: 11.3 (95% CI6.5–NR). (B) Curve 1: median OS: 10.6 (95% CI 5.4–15.1). Curve 2:median OS: 7.9 (95% CI 3.7–12.6). Curve 3: median OS: NR (95% CI 7.1–NR). (Median OS is expressed in months from the date of ipilimumabintroduction.)
Annals of Oncology original articles
Volume 24 | No. 6 | June 2013 doi:10.1093/annonc/mdt027 |
at Universidad de N
avarra. Servicio de Bibliotecas on June 13, 2013
http://annonc.oxfordjournals.org/D
ownloaded from
(Delyon et al; Annals of oncology 2013)
(Wolchok et al; Lancet Oncology 2010)
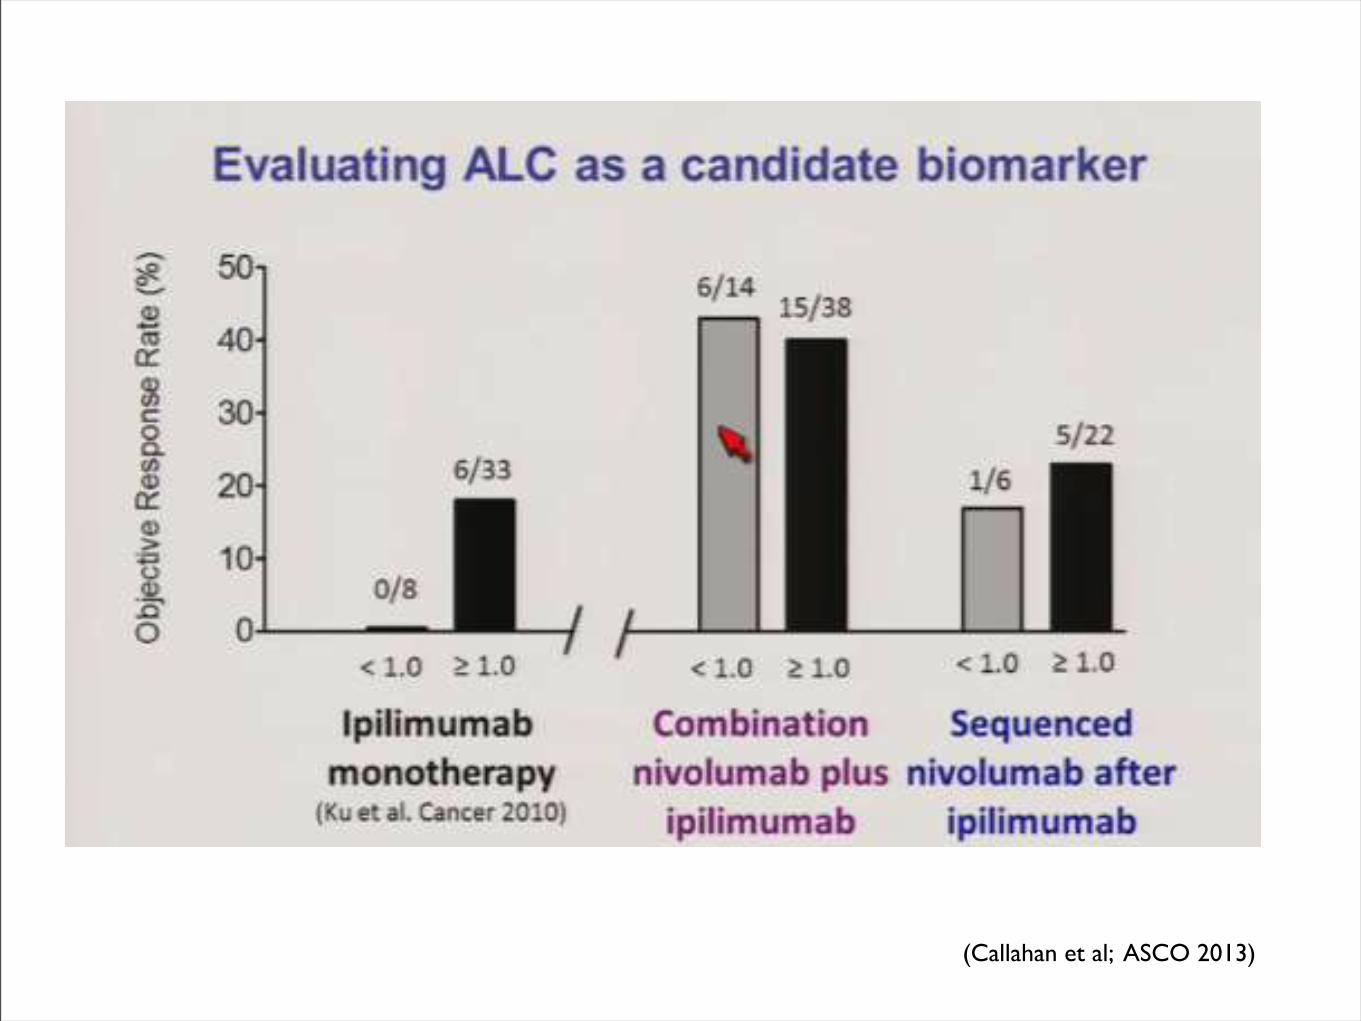
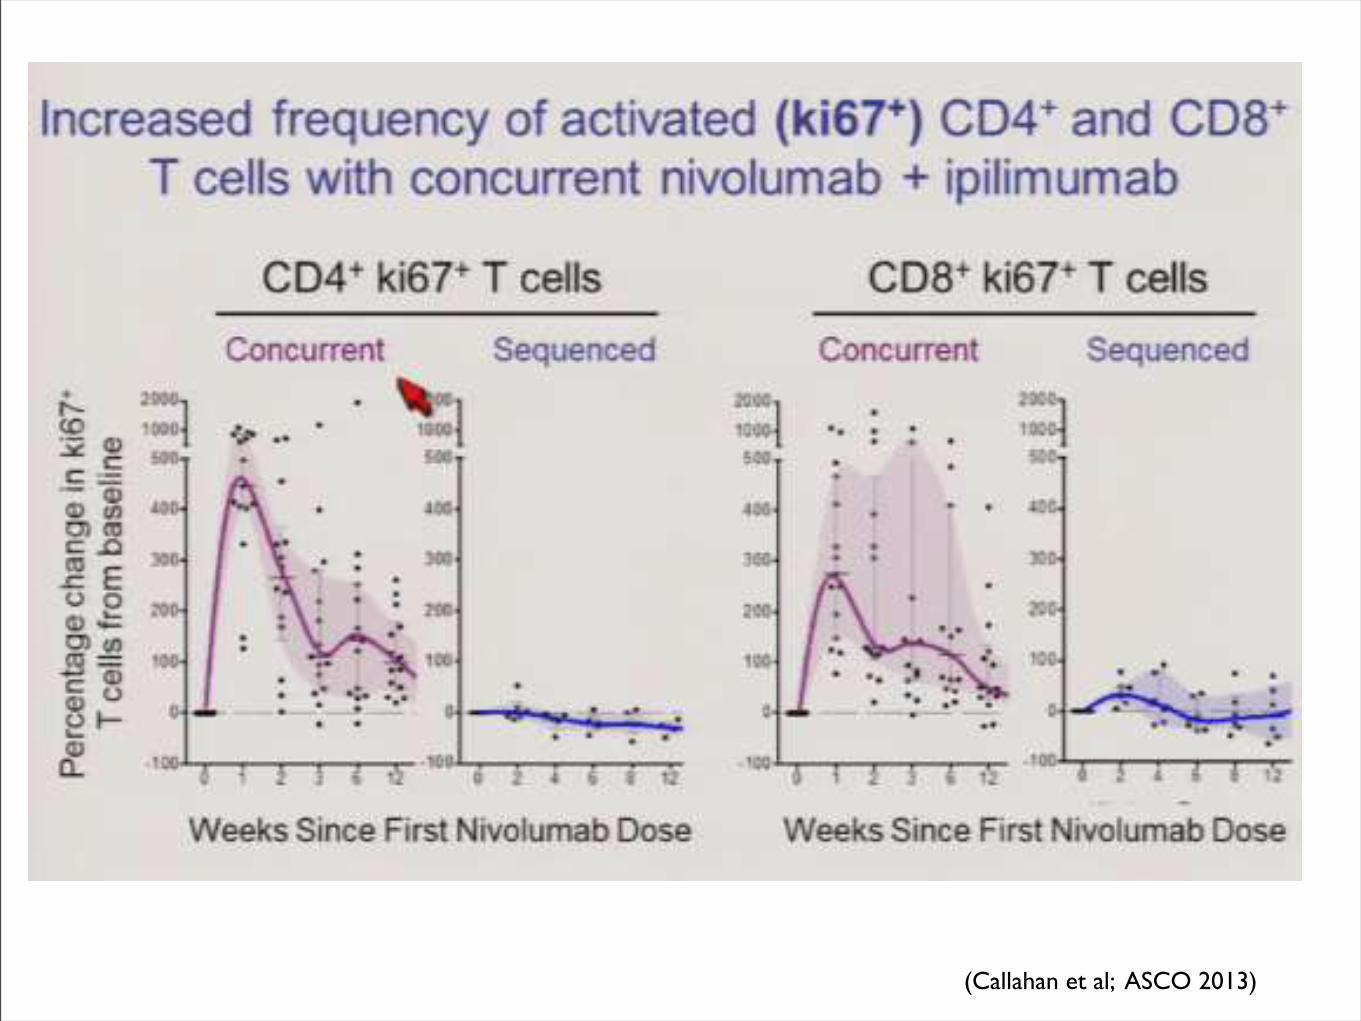
(Callahan et al; ASCO 2013)
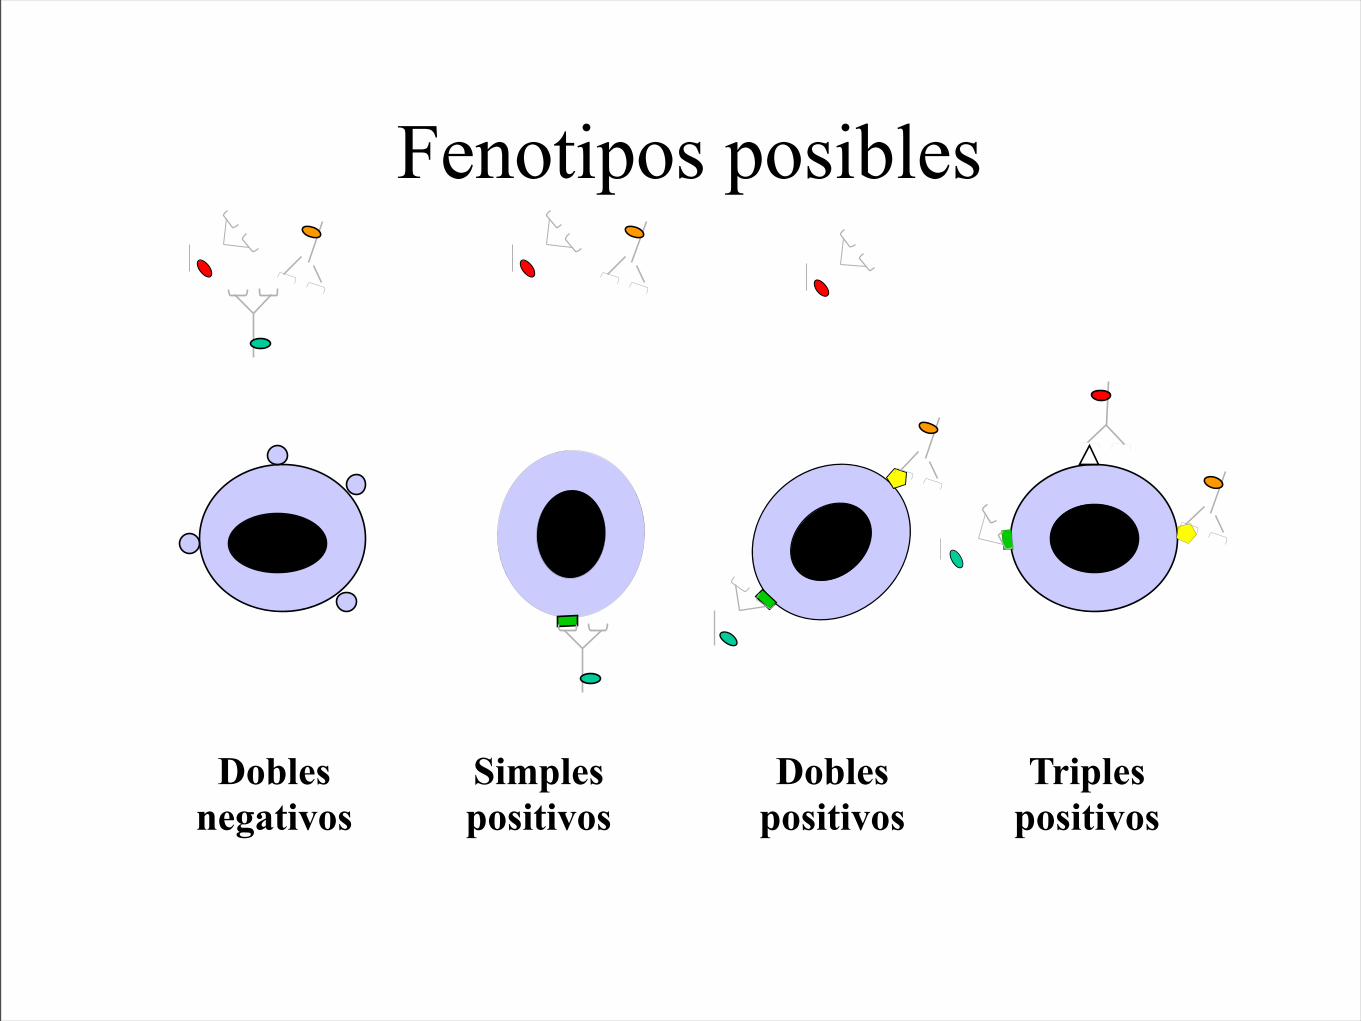
Dobles negativos
Simples positivos
Dobles positivos
Triples positivos
Fenotipos posibles
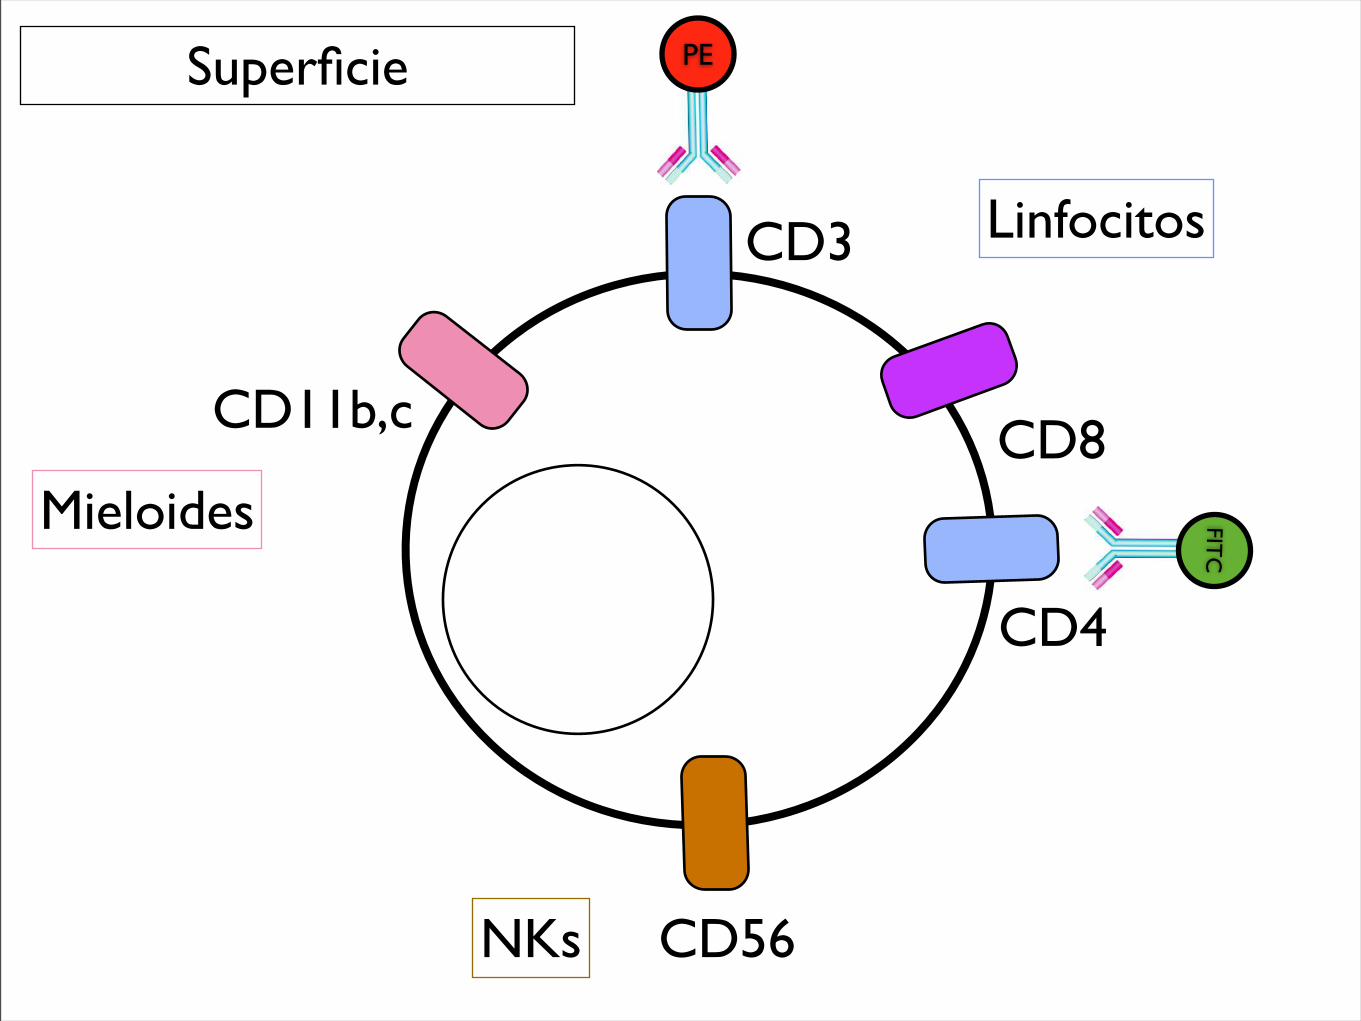
Superficie
CD3
CD4
CD56
CD11b,c
PE
CD8
FITC
NKs
Mieloides
Linfocitos
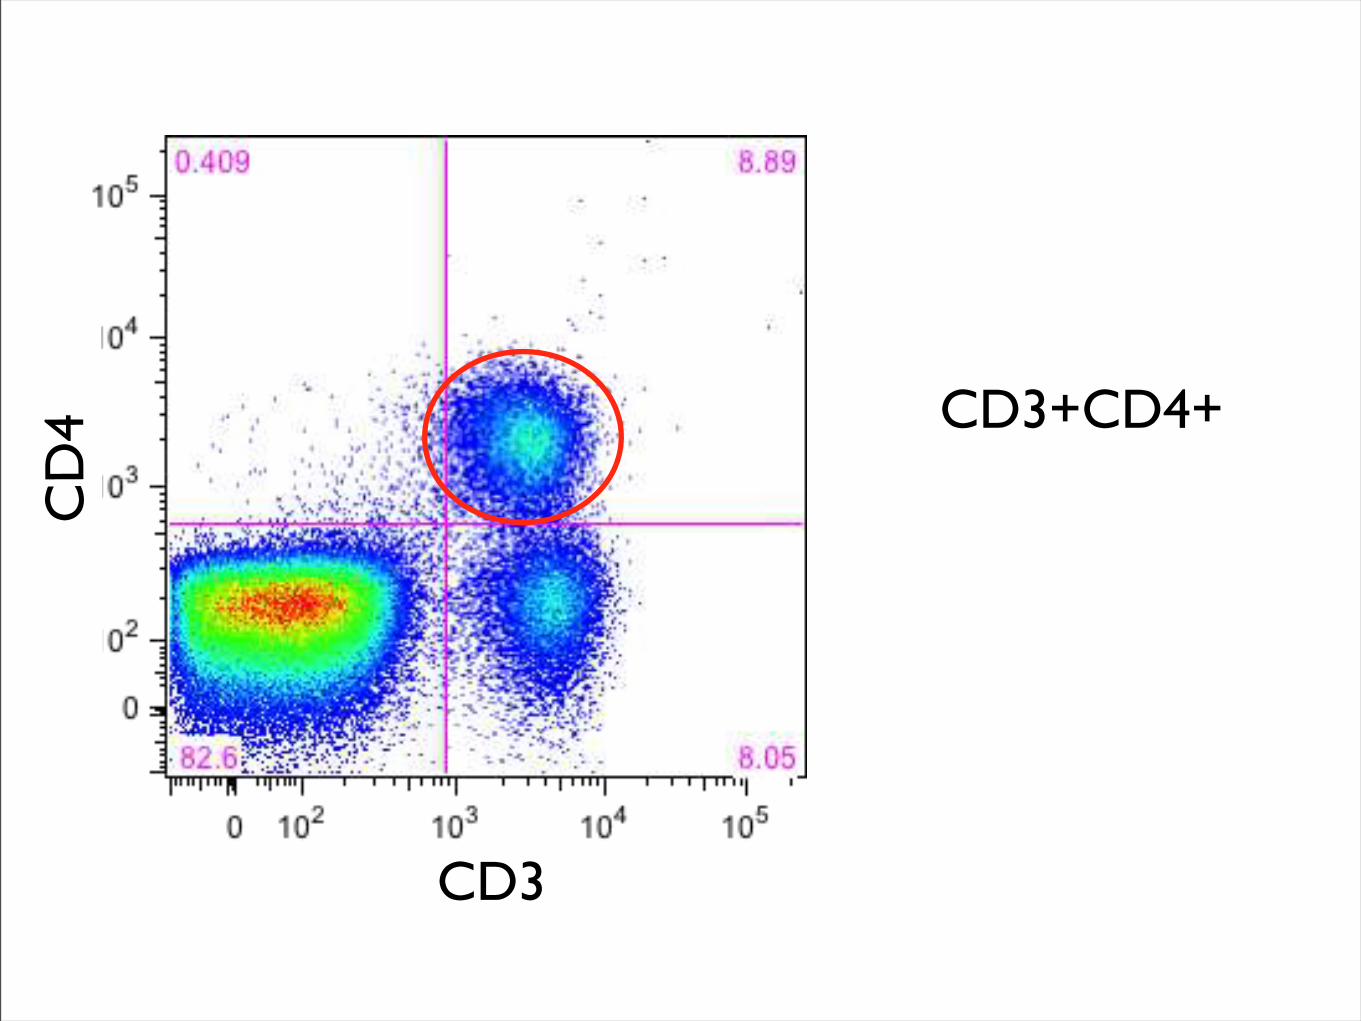
CD3
CD
4 CD3+CD4+

Citometría de Mieloides supresoras
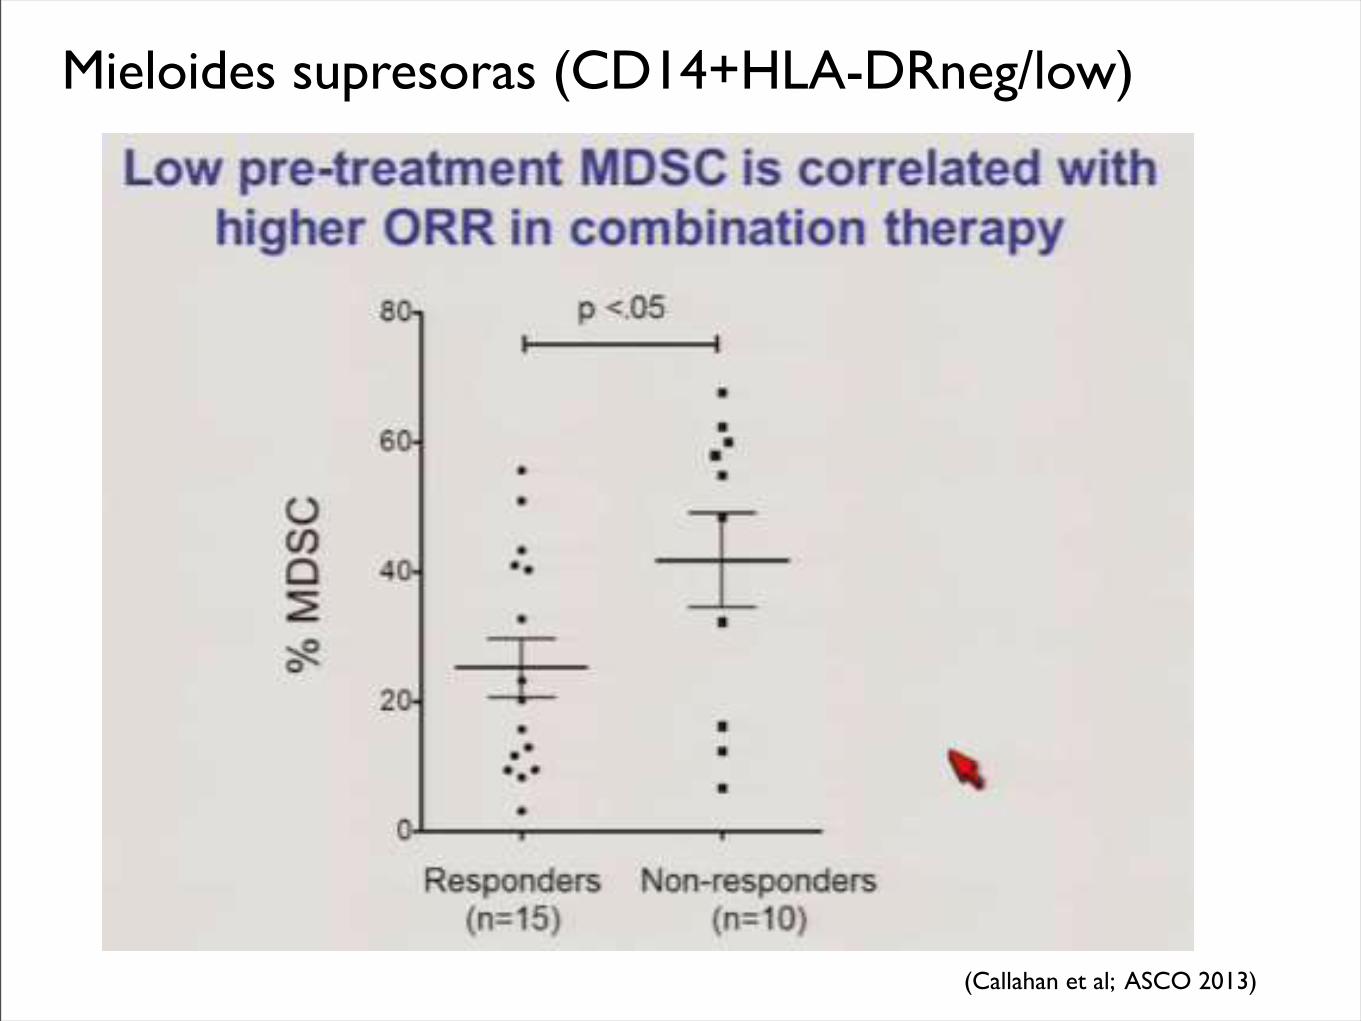
Mieloides supresoras (CD14+HLA-DRneg/low)
(Callahan et al; ASCO 2013)
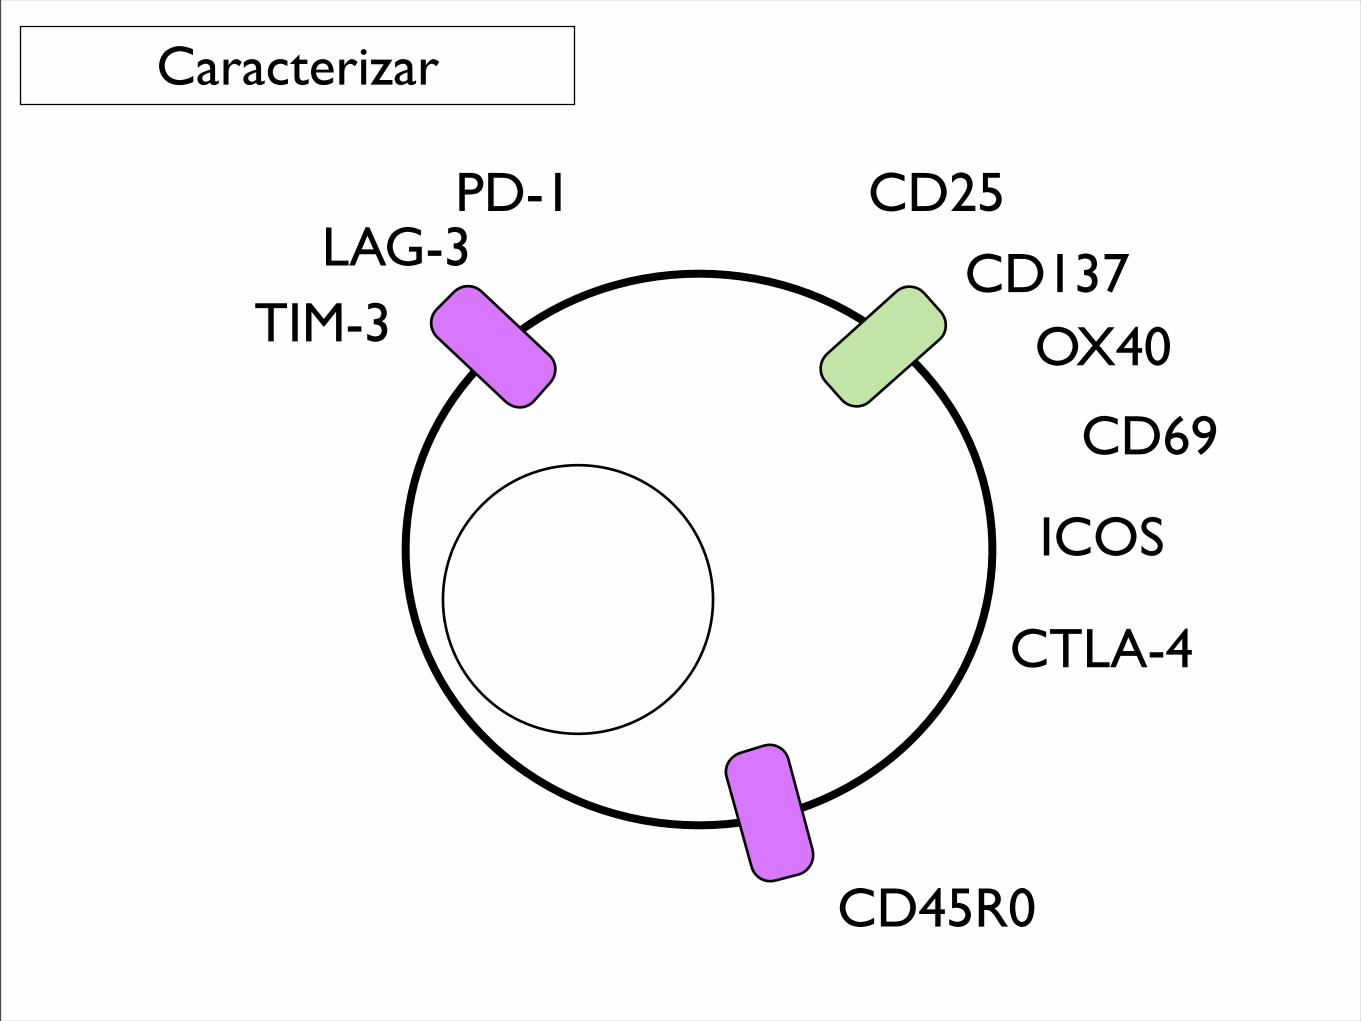
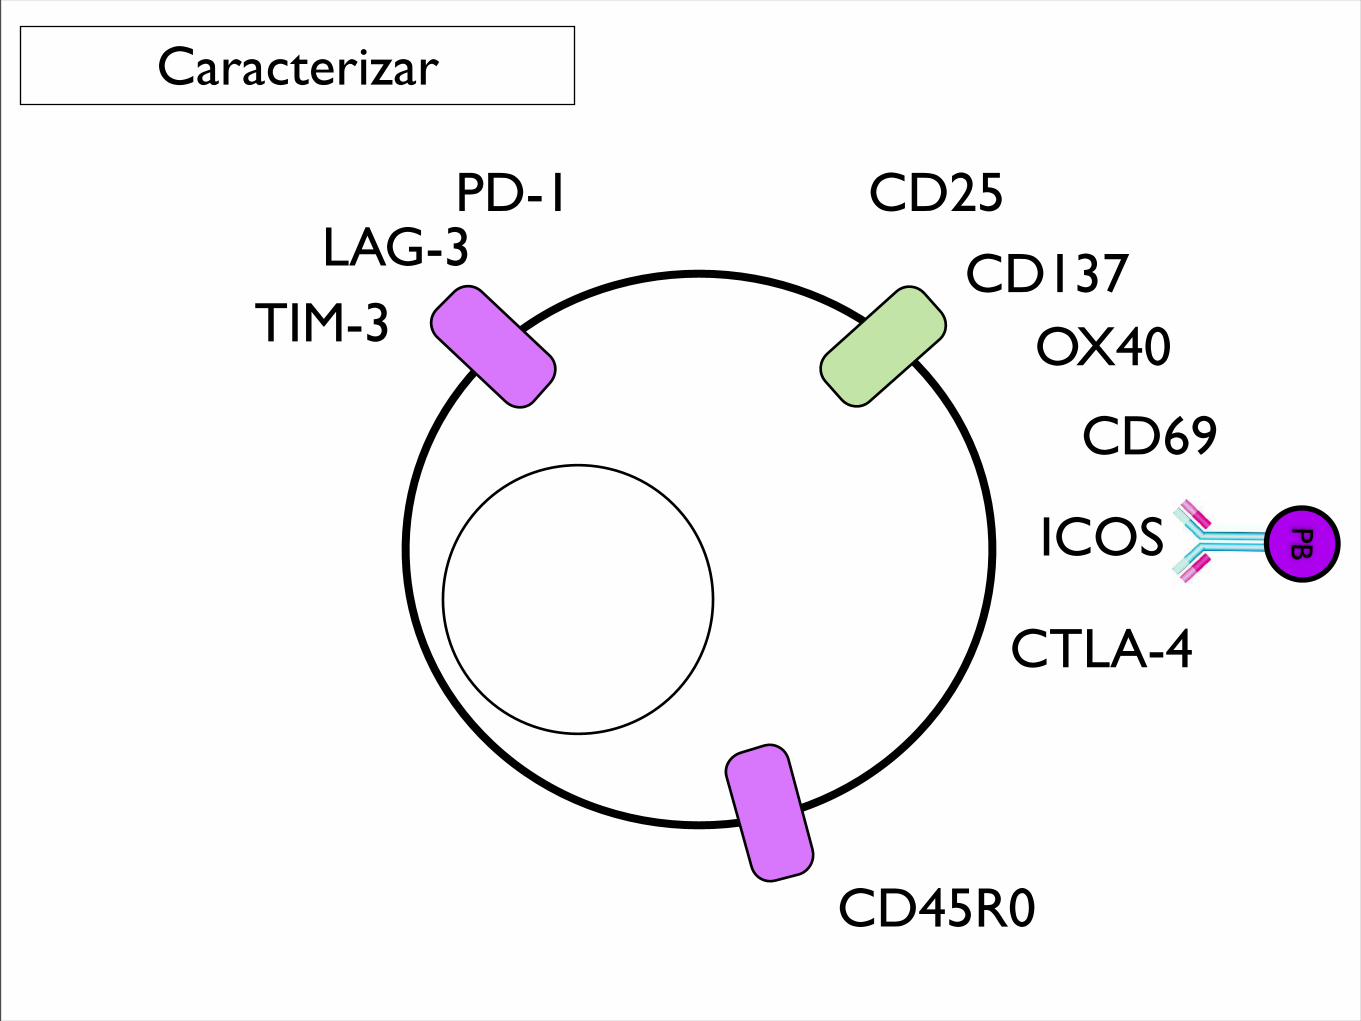
CD25
CD137
PD-1LAG-3
TIM-3 OX40
CD69
Caracterizar
CTLA-4
ICOS
CD45R0
CD25
CD137
PD-1LAG-3
TIM-3 OX40
CD69
Caracterizar
CTLA-4
ICOS PB
CD45R0
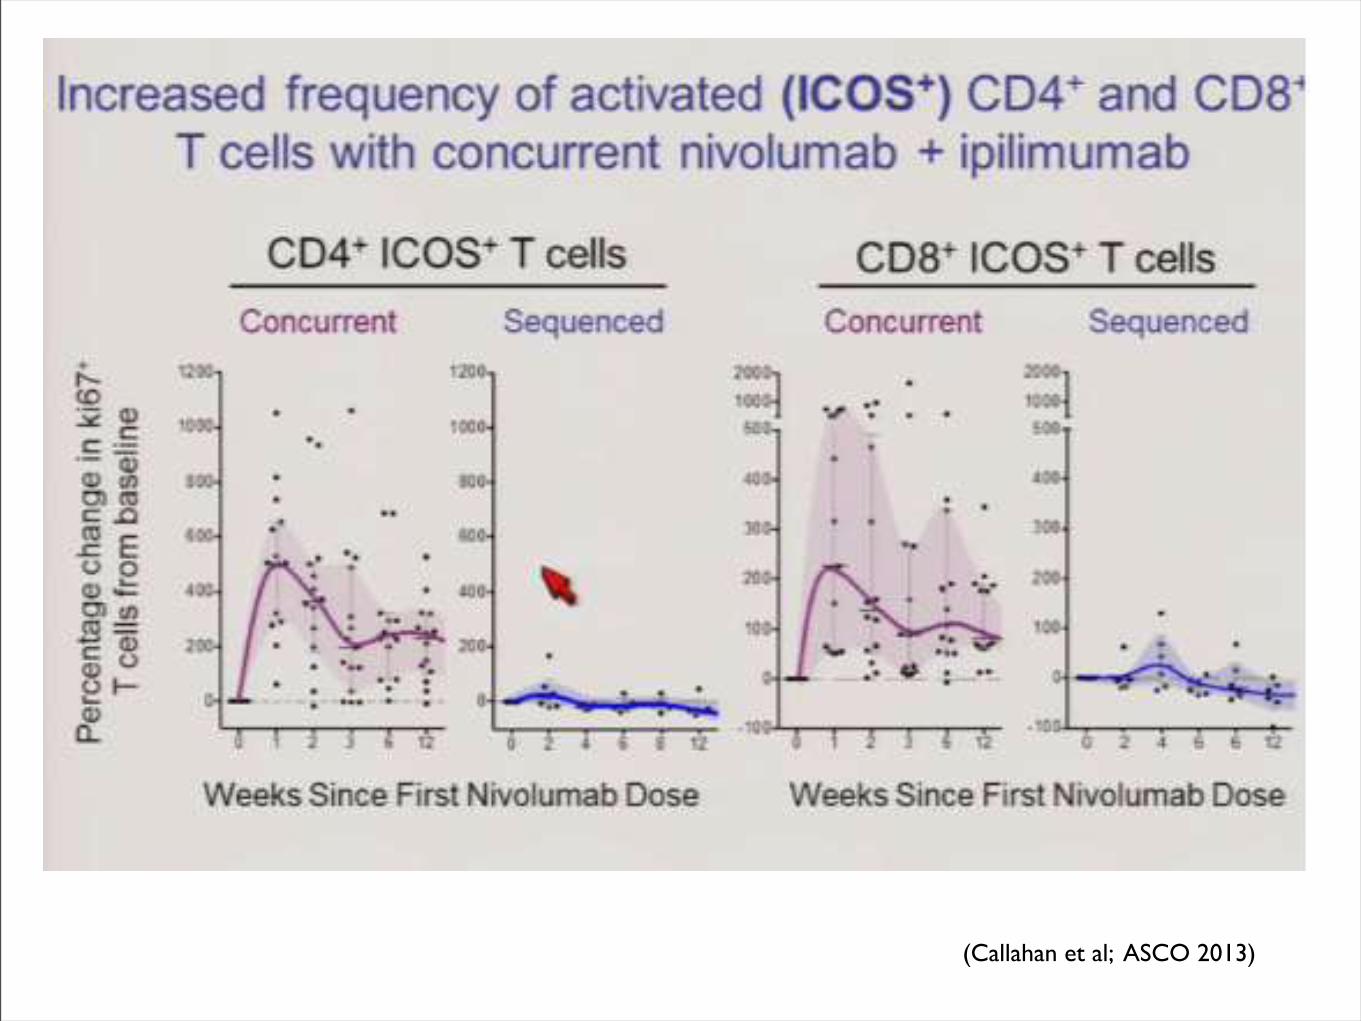
(Callahan et al; ASCO 2013)
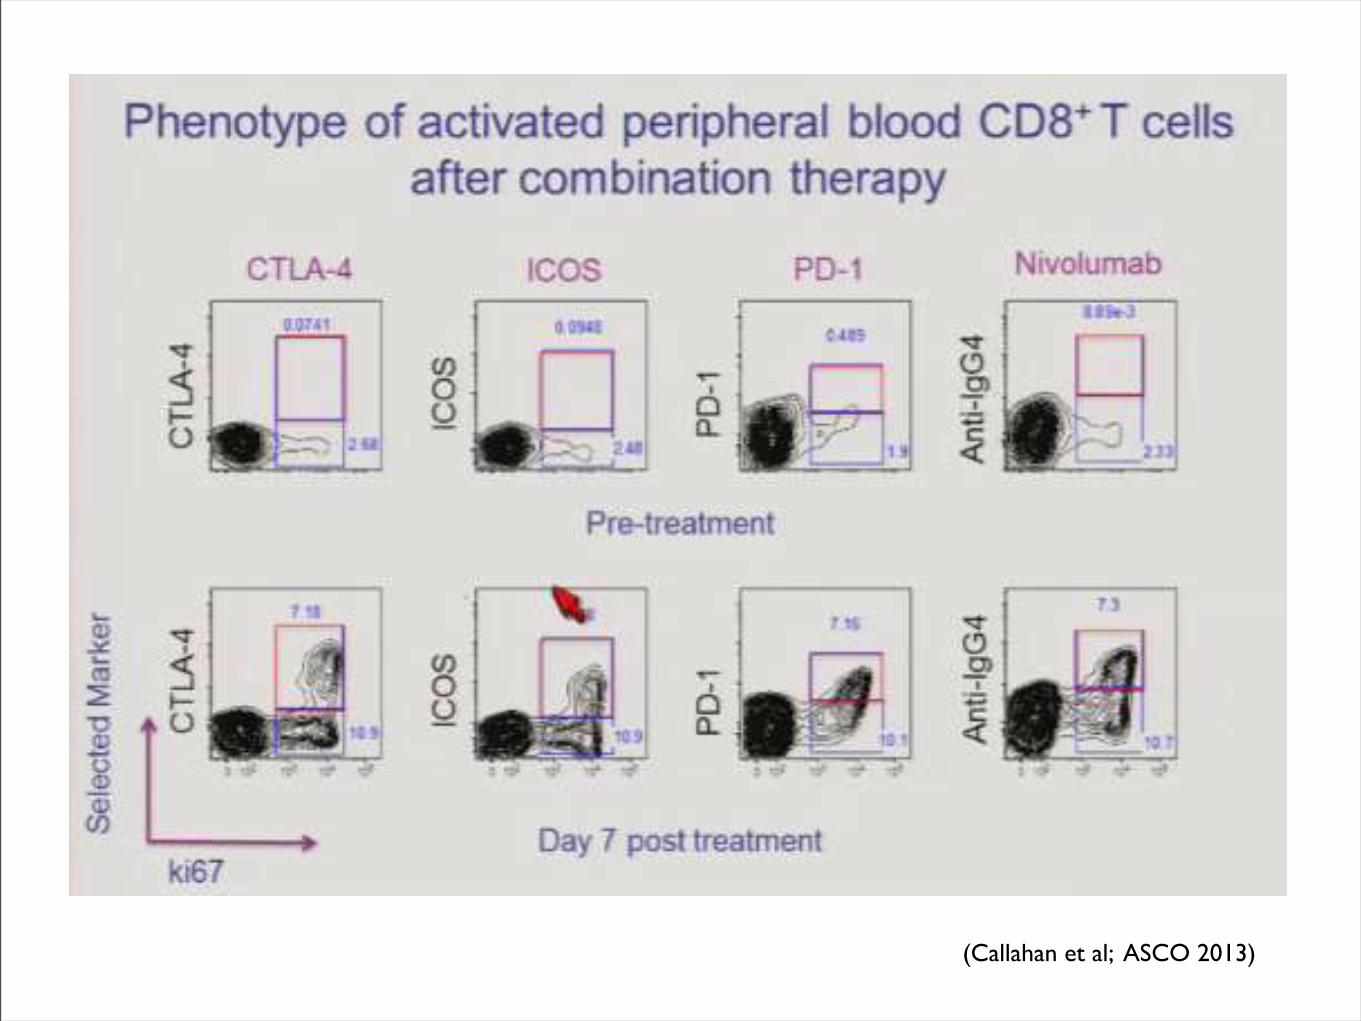
(Callahan et al; ASCO 2013)
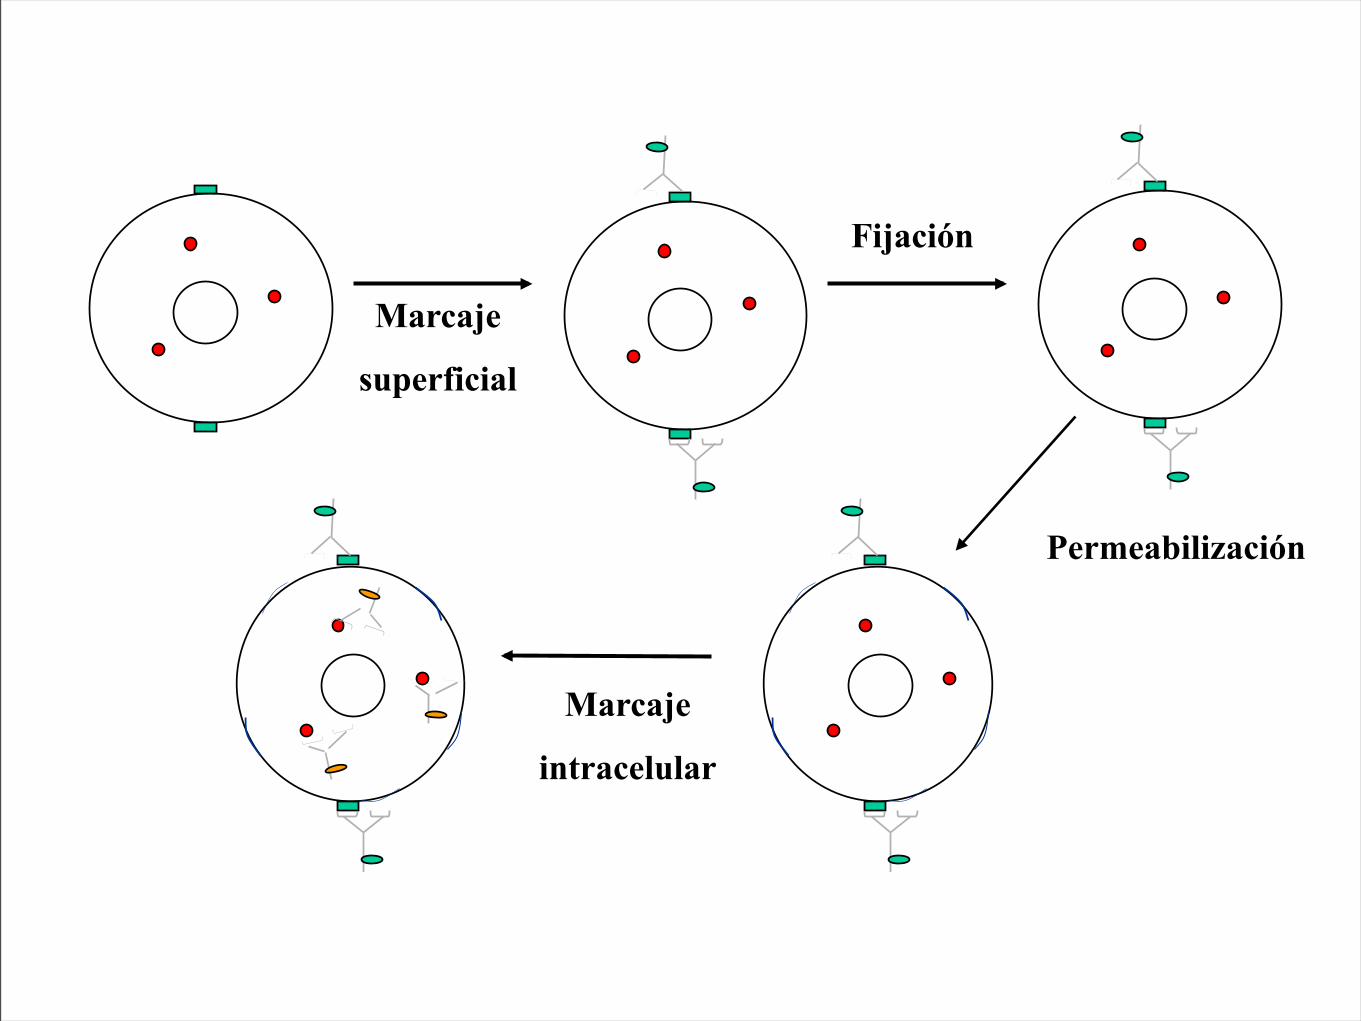
Marcaje
superficial
Fijación
Permeabilización
Marcaje
intracelular
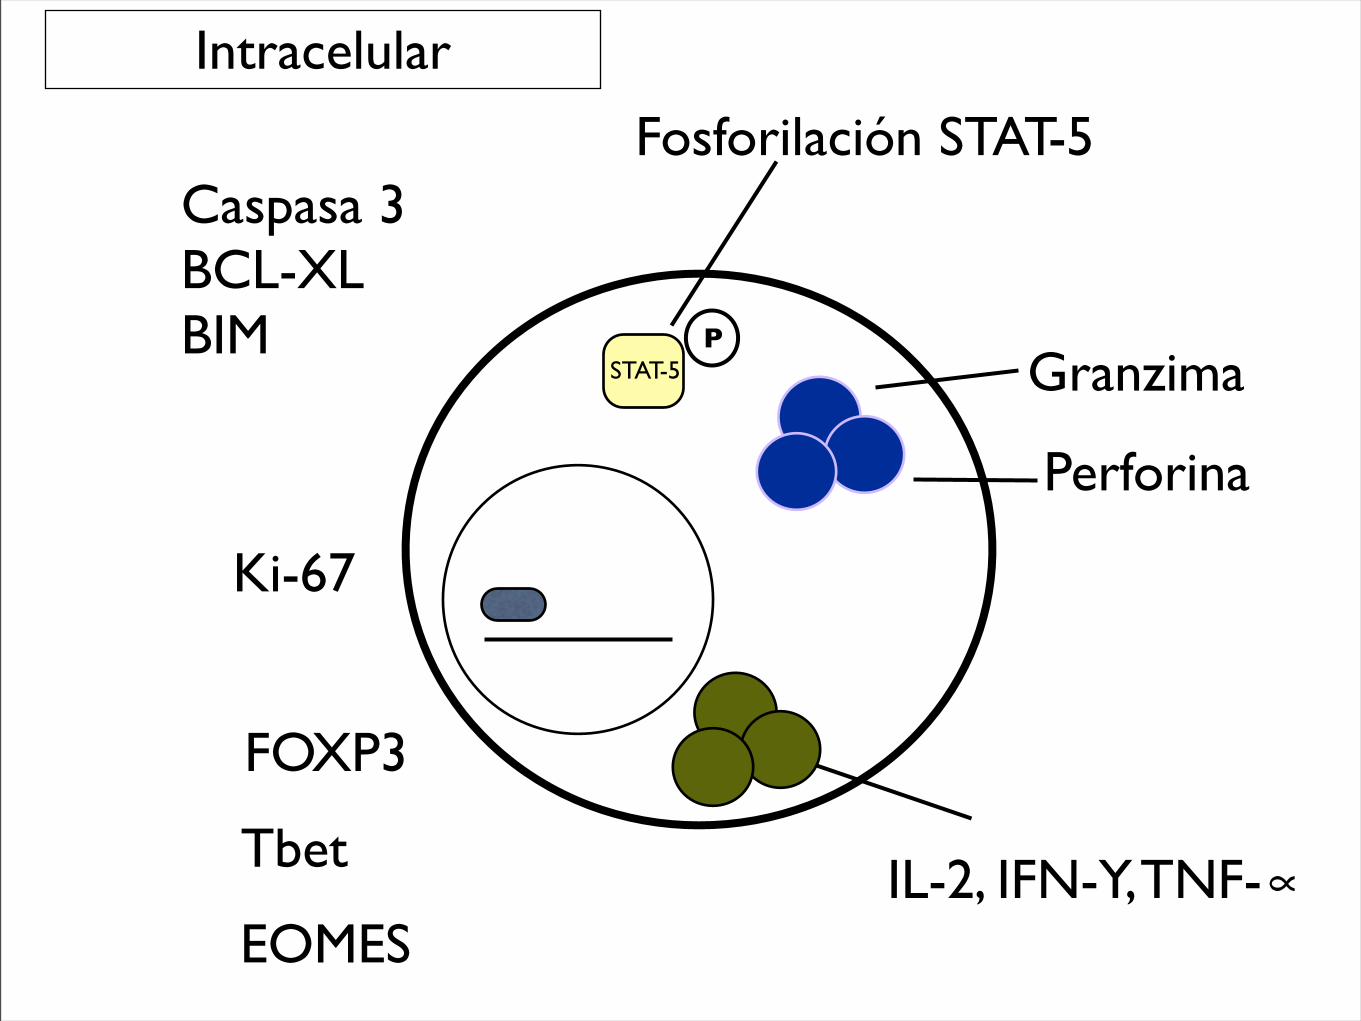
Granzima
Perforina
FOXP3
Tbet
EOMESIL-2, IFN-Y, TNF-∝
Ki-67
Caspasa 3BCL-XLBIM
Intracelular
Fosforilación STAT-5
PSTAT-5
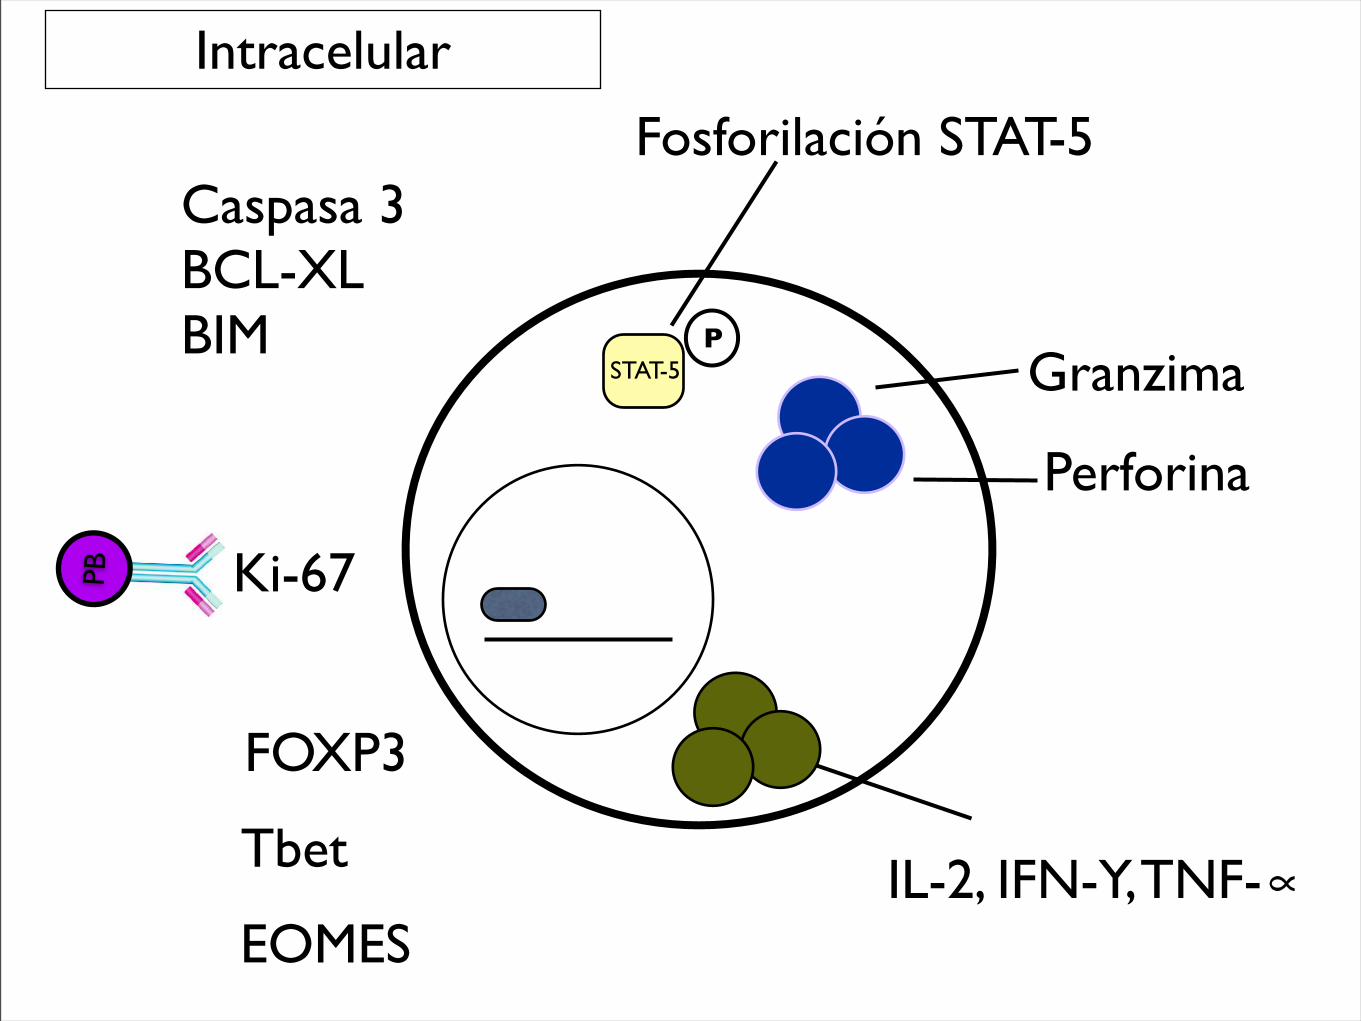
Granzima
Perforina
FOXP3
Tbet
EOMESIL-2, IFN-Y, TNF-∝
Ki-67
Caspasa 3BCL-XLBIM
Intracelular
Fosforilación STAT-5
PSTAT-5
PB
(Callahan et al; ASCO 2013)
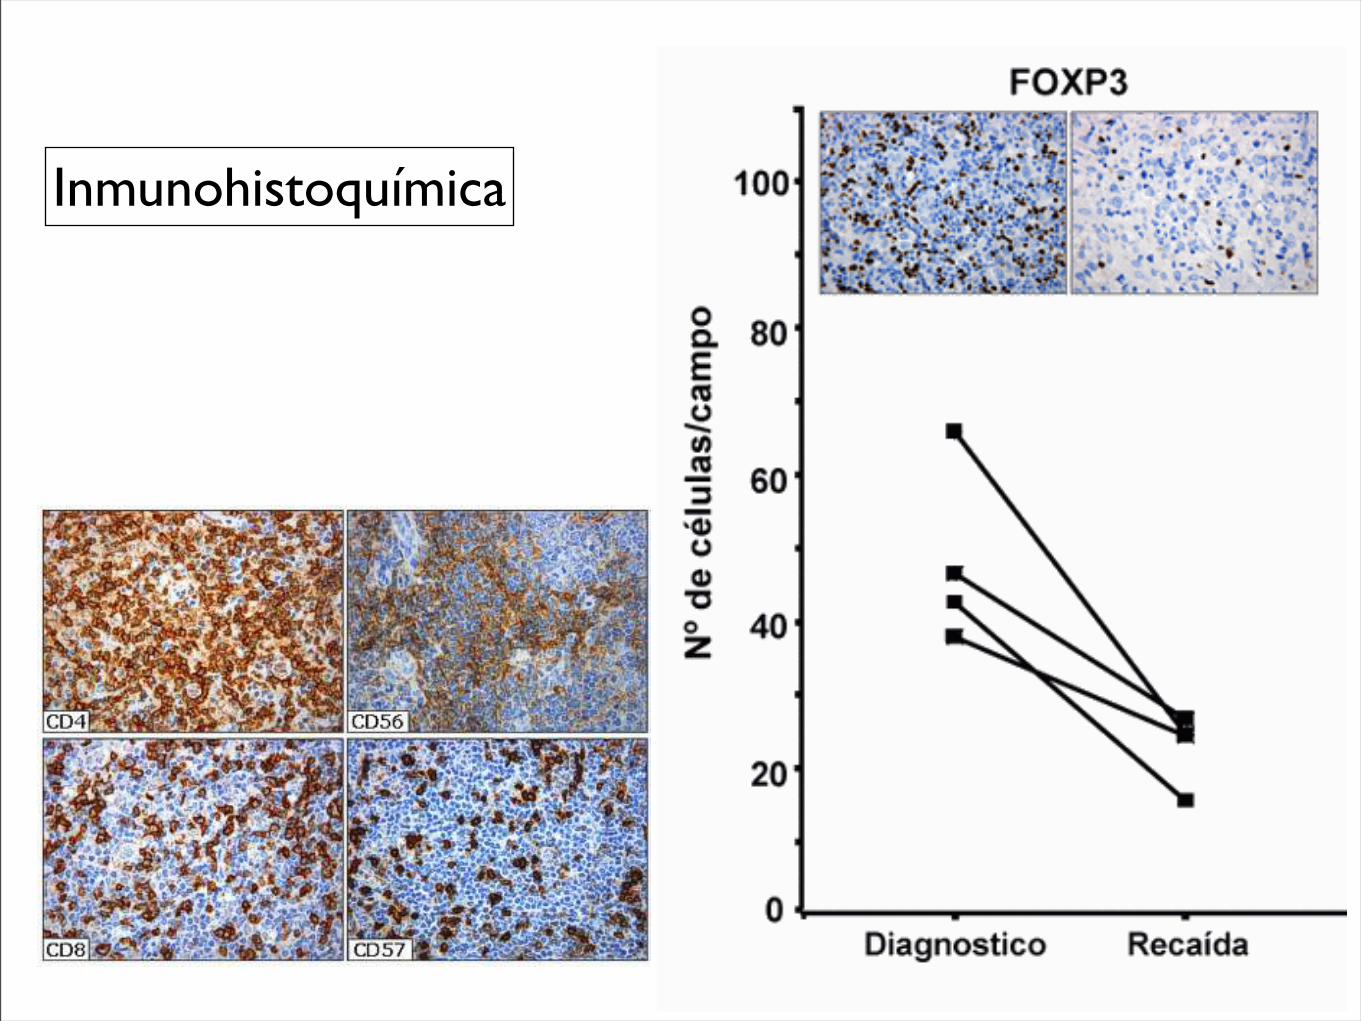
Figura 10. Tinción inmunohistoquímica del fondo inflamatorio en linfoma de Hodgkin: linfocitos T (CD4 y CD8), células NK (CD56 y CD57) y células citotóxicas (GrB y TIA-1). Paradójicamente, un numero elevado de CTL anuncia un curso cl ínico adverso en LH.
Figura 11. Evolución dinámica de células citotóxicas TIA-1+ y células T reguladoras FOXP3+ en pacientes con linfoma de Hodgkin al momento del diagnostico y durante la recaída. Se puede apreciar los cambios a la inversa por parte de estos marcadores.
Figura 12. Tinción inmunohistoquímica para las células T CD4+ y CD8+, células NK CD57+ y células citotóxicas en linfoma de Hodgkin no-infectados (A) e infectados (B) por el VIH. Obsérvese la disminuci ón generalizada del infiltrado en los pacientes infectados por el VIH, incluyendo los CTL activados (CD57 y GrB+), pero no los CTL inactivados (TIA-1).
Regulaci ón de la respuesta inmune
Página 9 de 147º Congreso Virtual Hispanoamericano de Anatomía Patológica
14/10/2005http://www.conganat.org/7congreso/vistaImpresion.asp?id_trabajo=515
Inmunohistoquímica
Lambrolizumab in Melanoma
n engl j med nejm.org 9
Max
imum
Per
cent
Cha
nge
from
Bas
elin
ein
the
Sum
of D
iam
eter
s of
Tar
get L
esio
ns
100
50
!100
50
0
0 10 20 30 40 50 60
Week since Treatment Initiation
D
C
A B
First occurrence of new lesion Patient not receiving study drug
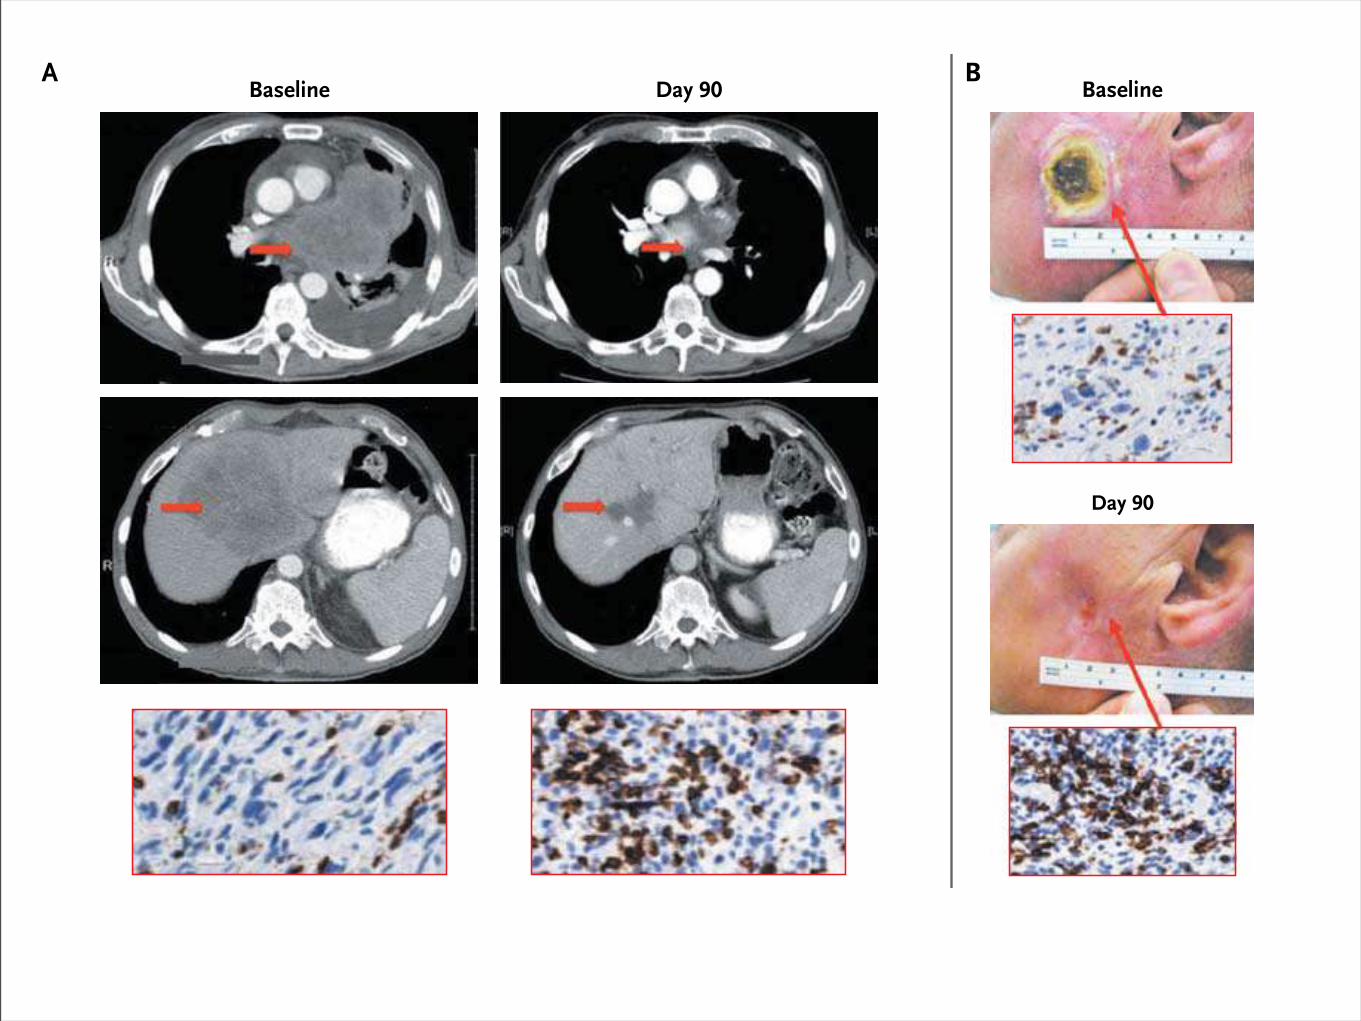
Baseline
Day 90
Baseline Day 322Day 90
Baseline Day 90
The New England Journal of Medicine Downloaded from nejm.org on June 2, 2013. For personal use only. No other uses without permission.
Copyright © 2013 Massachusetts Medical Society. All rights reserved.
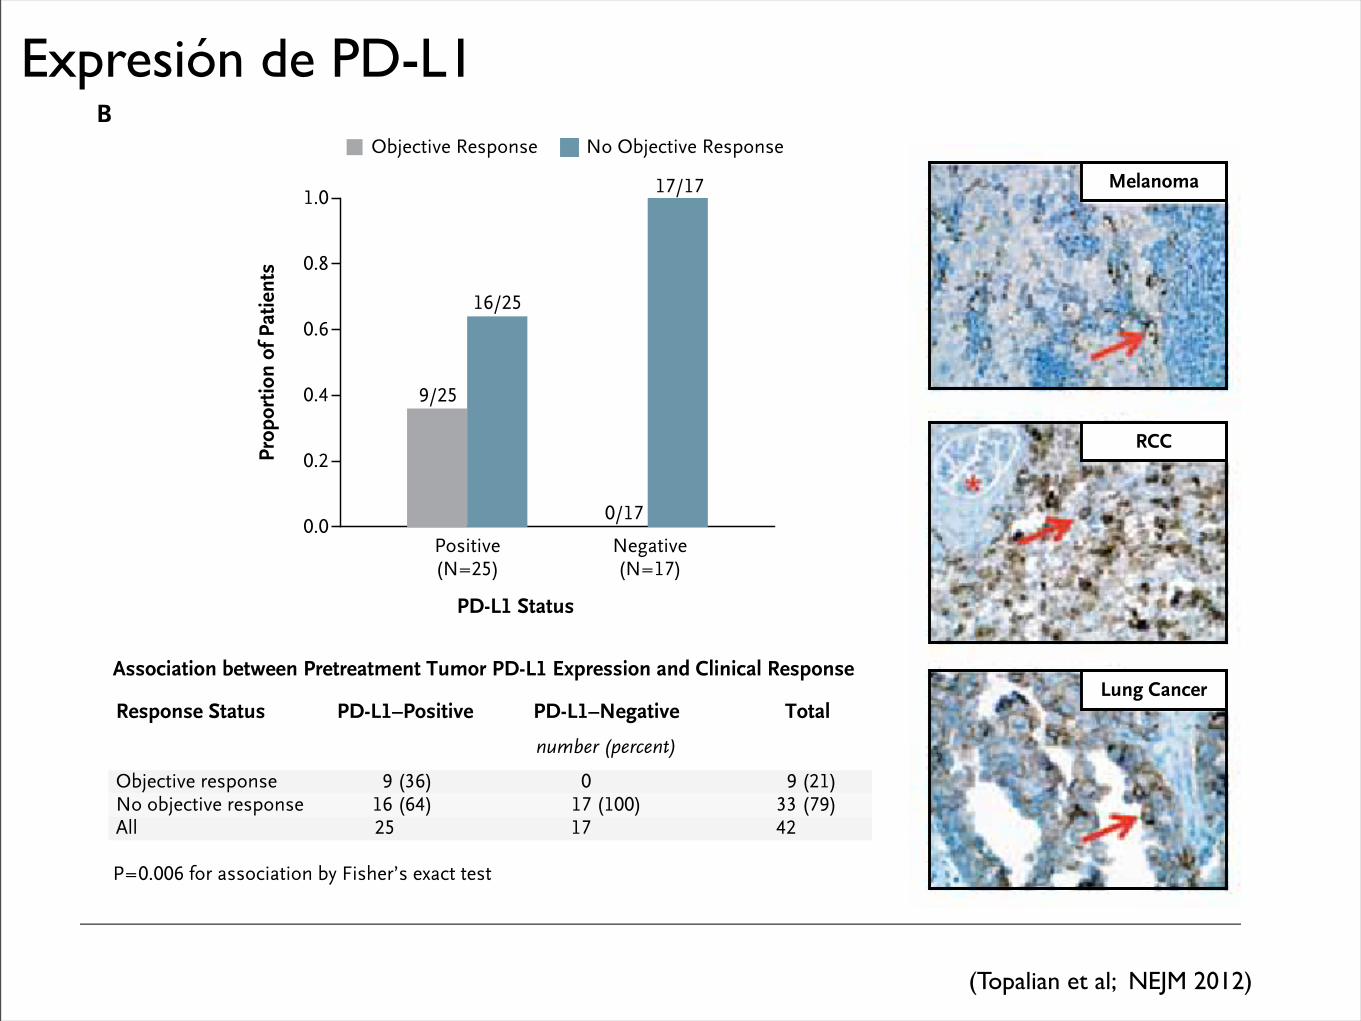
Expresión de PD-L1
T h e n e w e ngl a nd j o u r na l o f m e dic i n e
n engl j med 366;26 nejm.org june 28, 20122452
therapy has been the identification of mechanism-based predictive biomarkers that could be used to identify candidates for such treatment and guide disease-management decisions. Our findings sug-gest that PD-L1 expression in tumors is a candidate molecular marker that warrants further explora-tion for use in selecting patients for immuno-therapy with anti–PD-1 antibody. Our observa-tion of an objective response in 36% of the
patients with PD-L1–positive tumors and in none of those with PD-L1–negative tumors suggests that PD-L1 expression on the surface of tumor cells in pretreatment tumor specimens may be associated with an objective response. Although tumor-cell expression of PD-L1 may be driven by constitutive oncogenic pathways, recent research suggests that it may also reflect adaptive im-mune resistance in response to an endogenous
PD-1
–Rec
epto
r Occ
upan
cy (%
)
100
80
90
70
60
40
30
10
50
20
00.1 mg/kg
(N=11)0.3 mg/kg
(N=12)1.0 mg/kg
(N=20)3.0 mg/kg
(N=12)10.0 mg/kg
(N=10)
Dose of Anti–PD-1 Antibody
Rela
tive
No.
of C
ells
(% o
f max
imum
)
100
80
60
40
20
0100 101 102 103
100
80
60
40
20
0100 101 102 103
Antihuman IgG4
B
A
Before Treatment
After Cycle 1
Prop
ortio
n of
Pat
ient
s
1.0
0.8
0.4
0.2
0.6
0.0Negative(N=17)
Positive(N=25)
PD-L1 Status
Objective Response No Objective Response
Melanoma
RCC
Lung CancerAssociation between Pretreatment Tumor PD-L1 Expression and Clinical Response
Objective responseNo objective responseAll
9 (36)16 (64)25
0 17 (100)17
9 (21)33 (79)42
Response Status PD-L1–Positive PD-L1–Negative
number (percent)
Total
P=0.006 for association by Fisher’s exact test
17/17
0/17
16/25
9/25
The New England Journal of Medicine Downloaded from nejm.org at UNA BIBLIOTECA HUMANIDADES on June 9, 2013. For personal use only. No other uses without permission.
Copyright © 2012 Massachusetts Medical Society. All rights reserved.
(Topalian et al; NEJM 2012)
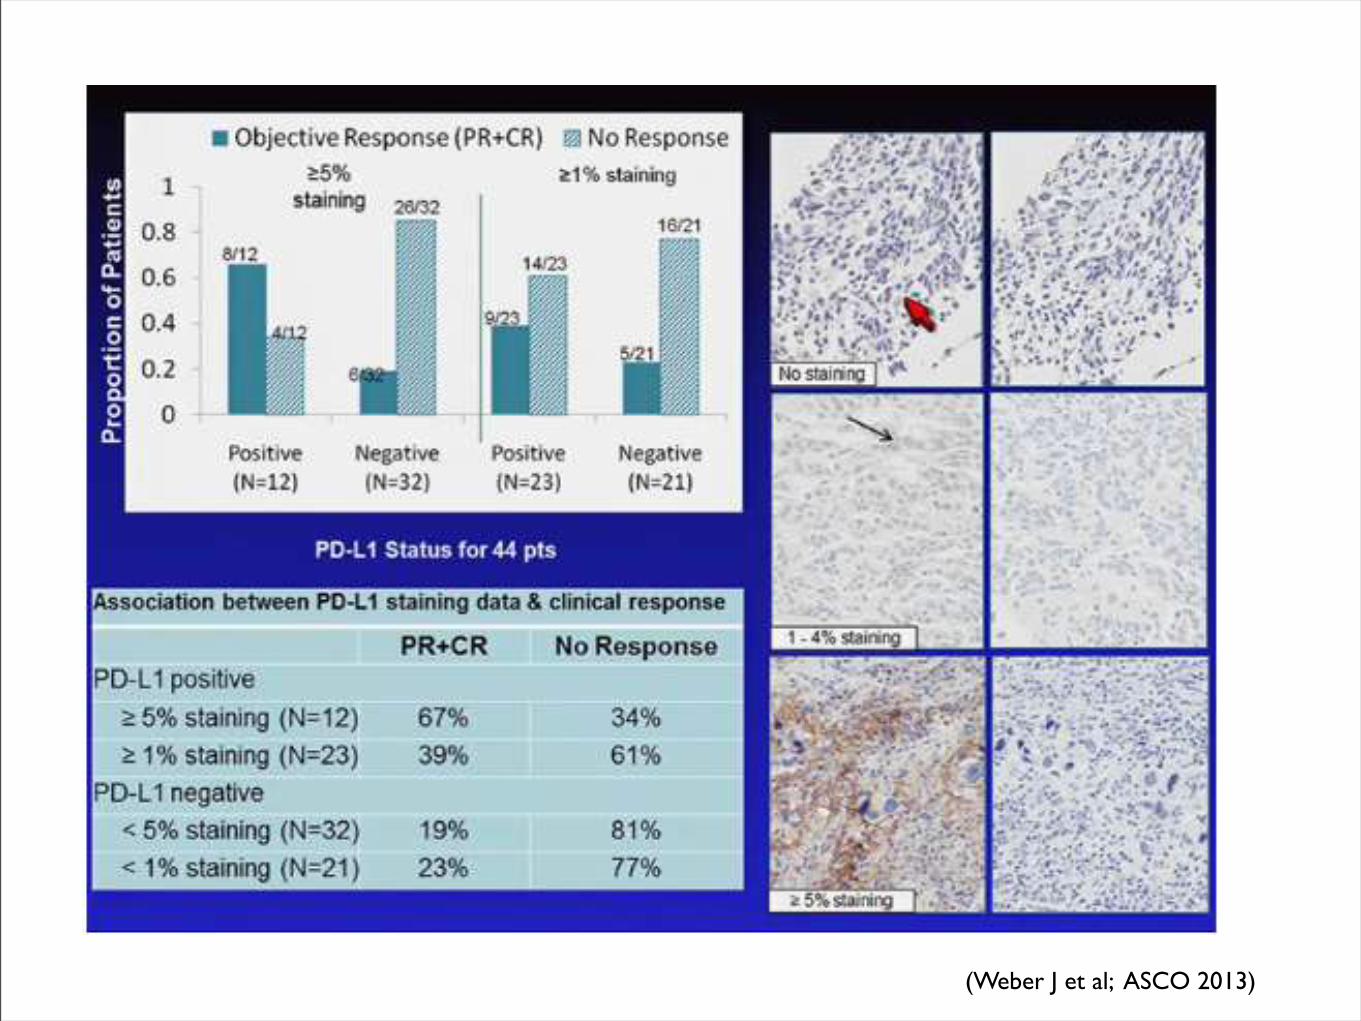
(Weber J et al; ASCO 2013)
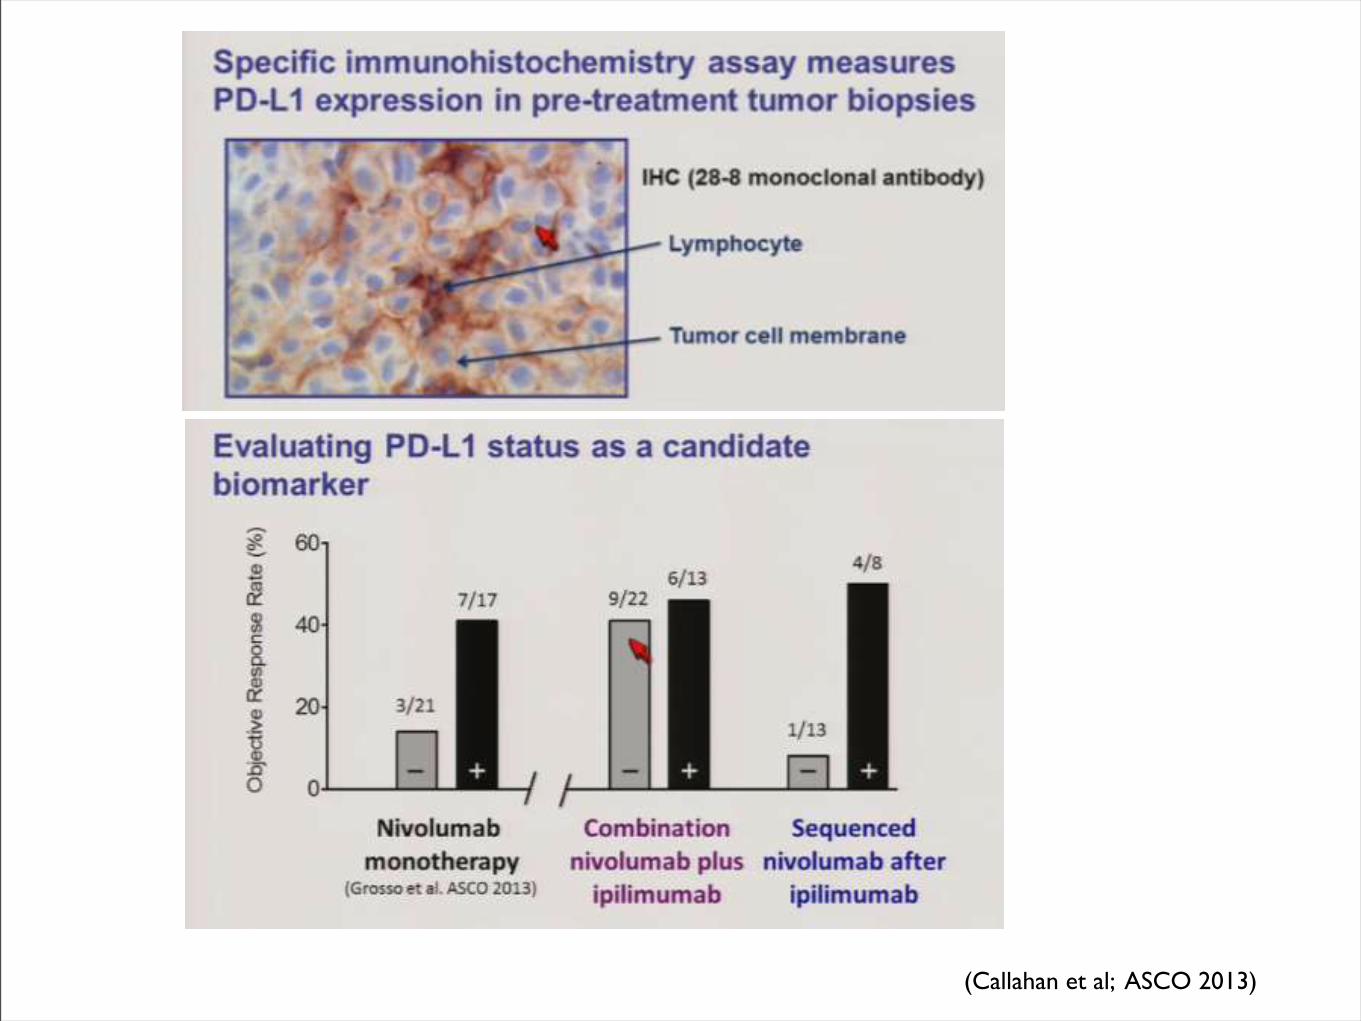
(Callahan et al; ASCO 2013)
indicators of clinical outcome, may help to better identifythe high-risk patients who would benefit from adjuvanttherapy.The immunoscore and associated gene signatures
represent a new challenge and opportunity in the fieldof immunotherapy biomarkers. As discussed earlier,several findings support the hypothesis that cancer devel-opment is influenced by the host–immune system. Theevaluation of systemic and local immunologic bio-markers could offer useful prognostic information andfacilitate clinical decisions about the need for systemictreatment (78).
ConclusionsImmunotherapies are now showing the ability to medi-
ate durable remissions in a variety of cancers and havebeen proven to extend OS in melanoma. Despite muchenthusiasm for the approach, only a subset of patientsbenefit from the most advanced therapies and potentiallyserious side effects can sometimes accompany therapy.Predictive and pharmacodynamics biomarkers are there-fore vital to further efforts by not only informing clinicaldecision-making but also by identifying new targets forimmunomodulation. Careful histologic and genomicanalysis of the tumor and microenvironment are
Figure 3. The immune-contexture. The concept of"immune contexture" isrepresented by the presence, intothe tumor microenvironment, ofdifferent immune variablesassociating the type, density, anddistribution of immune cells. FDC,follicular dendritic cell; TLS, tertiarylymphoid structures; TFH, Tfollicular helper cell. Adapted bypermission from MacmillanPublishers Ltd. (81), copyright2012.
CCR Focus
DC
MDSC
Immature DCTumor bed
Stroma
FDC
TLS
TFH cell
NK cell
B cell
CTL
Mast cell Macrophage
Invasive margin
Tumor core
© 2013 American Association for Cancer Research
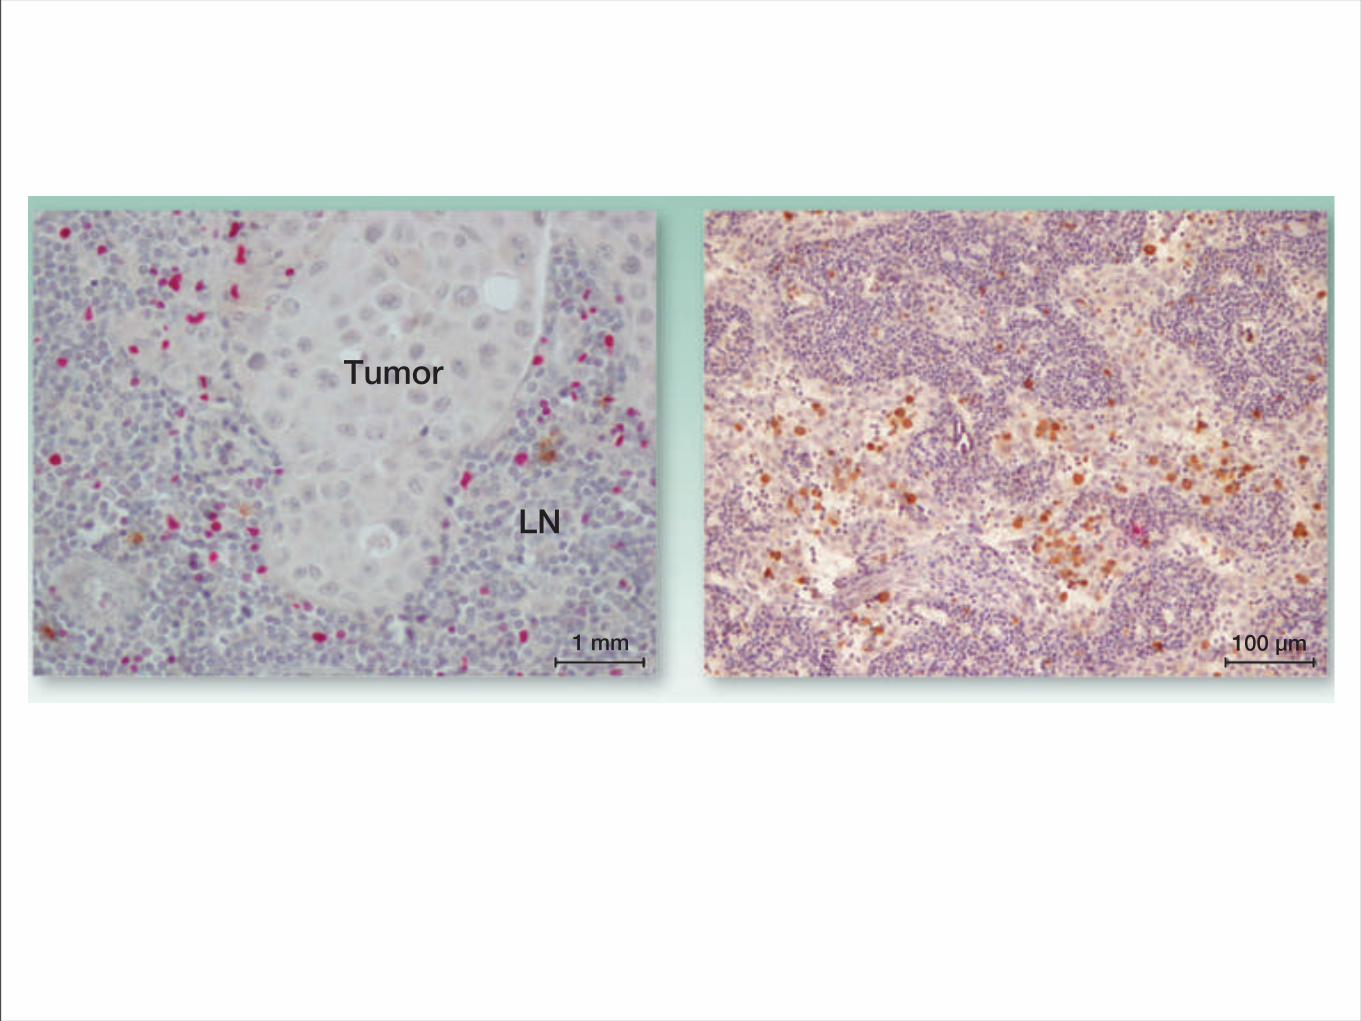
Tumor
LN
1 mm 100 µm
Figure 2. IHC staining with anti-FoxP3 and anti-granzyme B. Two opposite cases of lymph node (LN) in different patients with melanoma. Left, a metastaticlymph nodewith an high expression of FoxP3! cells (red) atmargin ofmelanomaand very low expression ofGB! cells (brown). GranzymeB is specific for CTLand NK cells. Right, a nonpathologic lymph node with high expression of granzyme B and low expression of FoxP3. The metastatic lymph node showed anincrease of the immunosuppressive cells compared with the negative lymph node.
Biomarkers in Immunostimulatory Combination Strategies
www.aacrjournals.org Clin Cancer Res; 19(5) March 1, 2013 1017
on June 10, 2013. © 2013 American Association for Cancer Research. clincancerres.aacrjournals.org Downloaded from
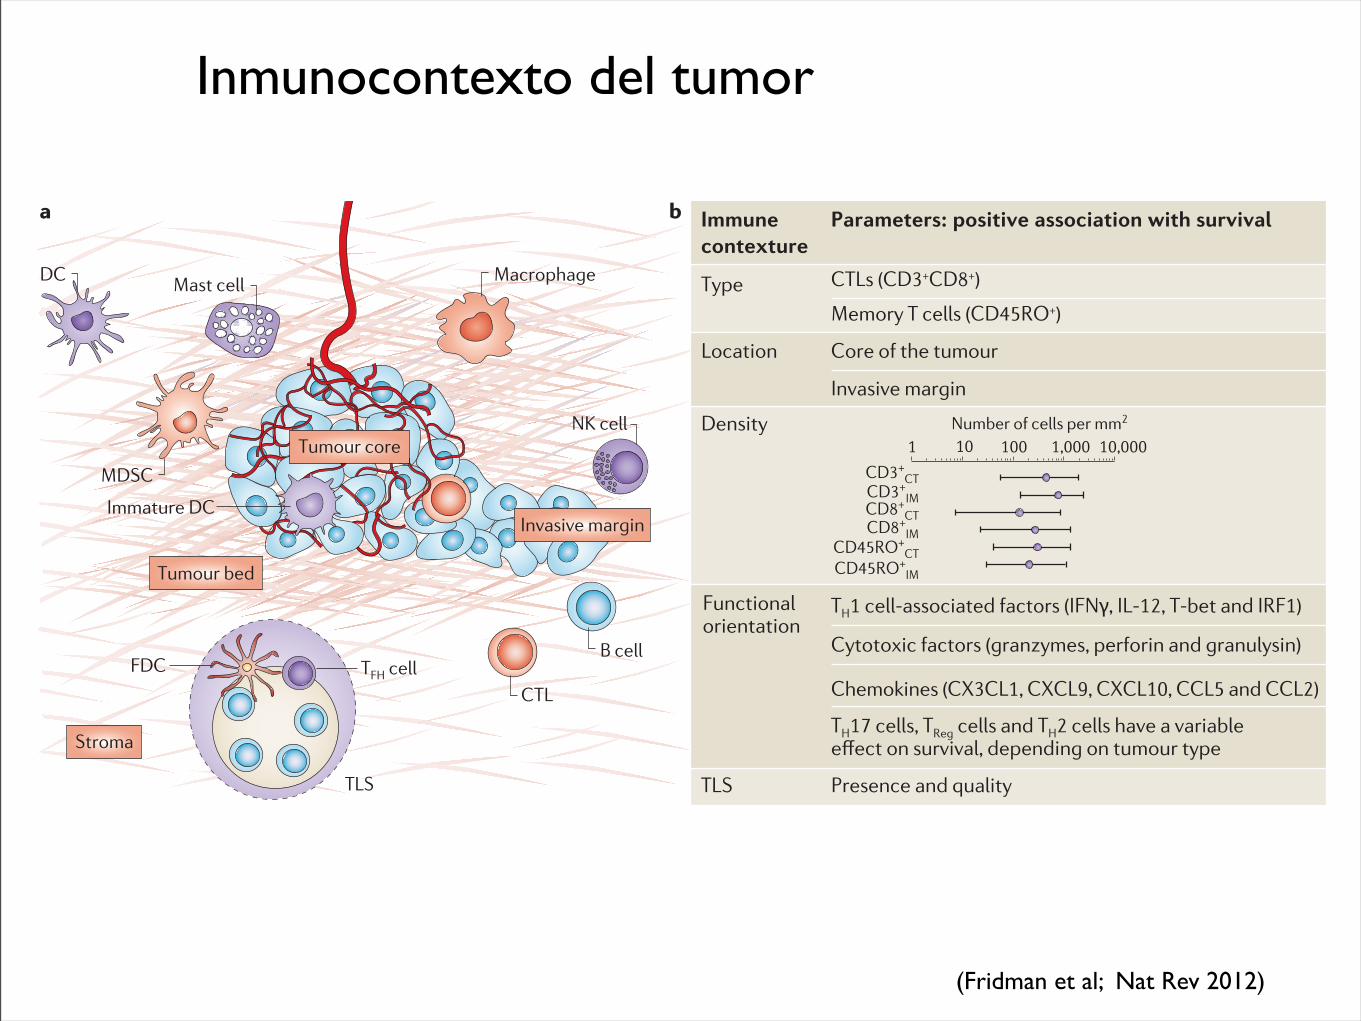
Inmunocontexto del tumor
Nature Reviews | Cancer
CTL
NK cell
Immune contexture
Parameters: positive association with survival
Location
Type
Core of the tumour
Invasive margin
Density
TLS Presence and quality
Functional orientation
CTLs (CD3+CD8+)
Memory T cells (CD45RO+)
TH1 cell-associated factors (IFN!, IL-12, T-bet and IRF1)
Cytotoxic factors (granzymes, perforin and granulysin)
Chemokines (CX3CL1, CXCL9, CXCL10, CCL5 and CCL2)
TH17 cells, TReg cells and TH2 cells have a variable GȭGEV�QP�UWTXKXCN��FGRGPFKPI�QP�VWOQWT�V[RG
Number of cells per mm2
1 10 100 1,000 10,000
CD3+CT
CD3+IM
CD8+CT
CD8+IM
CD45RO+IM
CD45RO+CT
Tumour bed
Stroma
Mast cell
Immature DC
DC Macrophage
Invasive margin
B cell
MDSC
TLS
FDC TFH cell
Tumour core
a b
cells are distributed in the tumour core, in contact with tumour cells or in the surround-ing stroma. Mature dendritic cells concentrate in TLS, in close contact with naive T cells13. TLS may be sites in which tumour-controlling primary and/or secondary immune responses are generated.
The distribution of immune cells also varies between tumour types. All subsets of T cells are present at the core and at the inva-sive margin of the tumour in colorectal can-cer, non-small-cell lung cancer, melanoma, and head and neck cancers. In colorectal cancer, the proportion of tumours with high densities of CD4+ memory T cells and CD8+ memory T cells decreases with local tumour invasion, as assessed by the T stage of the TNM classification (that is, the density is lower in T4-stage tumours than in T1-stage tumours). Conversely, the proportion of pri-mary tumours with high infiltrates of CD4+ memory T cells and CD8+ memory T cells, particularly in the core, is lower in patients with tumours that recur. It has also been reported that T cells are found only in the invasive margin in liver metastases of colon cancer14.
The fact that functional populations of immune cells are located in different areas of a tumour and that this varies between cancer types suggests that different immune cell populations may have different roles
in tumour control. Moreover, the variable density and location of these immune cells between tumours in different individuals with the same cancer type prompted the investigation of whether the immune contexture might affect clinical outcome.
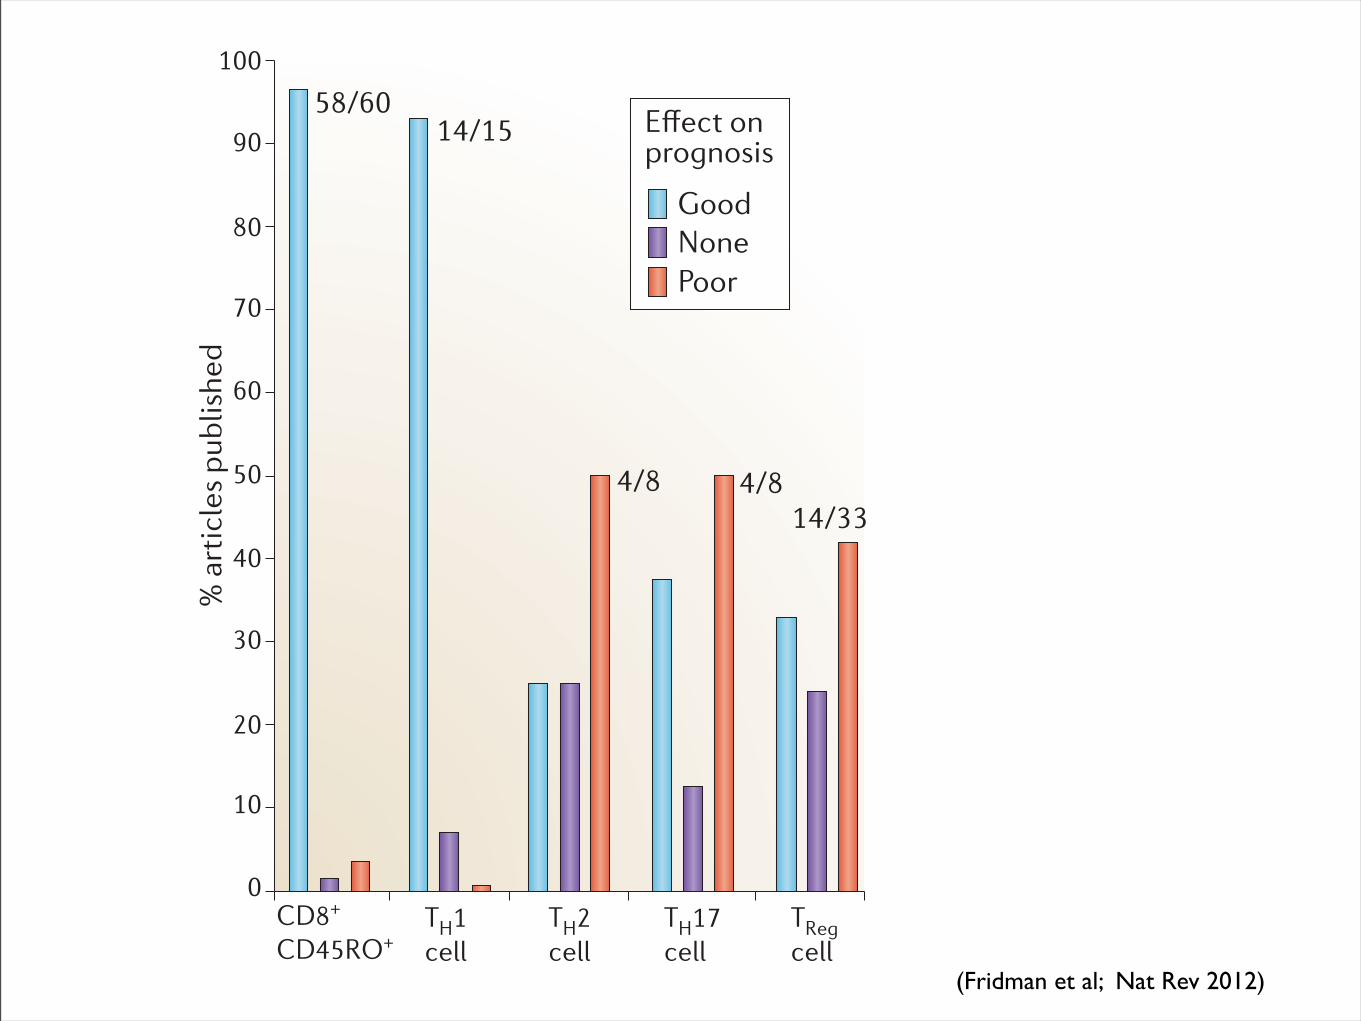
Clinical impact of the immune contextureThe effect on disease-free survival and overall survival. Correlations between the levels of immune cell infiltration of tumours and clinical outcome have been investigated in many cancers. TABLE 1 and FIG. 2 summarize the effect of T cells on clinical outcome from 124 published arti-cles. A strong lymphocytic infiltration has been reported to be associated with good clinical outcome in many different tumour types, including melanoma, and head and neck, breast, bladder, urothelial, ovarian, colorectal, renal, prostatic and lung cancer. Therefore, high densities of CD3+ T cells, CD8+ cytotoxic T cells and CD45RO+ memory T cells were clearly associated with a longer disease-free survival (after surgical resection of the primary tumour) and/or overall survival (FIG. 2). The fact that the density of CD8+ T cells seems to correlate with poor prognosis in renal cell cancer, except when these T cells are proliferat-ing15, is an intriguing result that deserves further analysis.
In contrast to the effects of cytotoxic T cells and memory T cells, analysis of the effect of CD4+ T cell populations on clinical outcome has resulted in apparent contradic-tory results, and so their effects have been a matter of debate for the past decade. The case of TReg cells is a striking example of conflict-ing data that lead to difficult interpretation. There are different subpopulations of TReg cells (including, natural TReg cells, induced TReg cells and so on) but in most studies they are detected as a population of CD4+ T cells that express phenotypic markers such as high levels of CD25 (also known as interleukin-2 receptor subunit-α (IL-2Rα), which is a subunit of the receptor for the T cell-stimulating cytokine IL-2) and the transcription factor forkhead box protein P3 (FOXP3). In fact, none of these markers is fully restricted to TReg cells; CD25 and FOXP3 are also expressed by activated effector T cells, and there are also FOXP3– suppressor cells. Nevertheless, the pioneering report by Curiel et al.16, which demonstrated a cor-relation of intratumoural TReg cells and poor survival in ovarian cancer, was intuitively adopted as proving the deleterious effect of suppressor T cells on clinical outcome. Indeed, several reports support this concept, and the high infiltration of TReg cells has been correlated with poor overall survival in breast cancer17,18 and in hepatocellular
Figure 1 | The immune contexture. a | Tumour anatomy showing the fea-tures of the immune contexture, including the tumour core, the invasive margin, tertiary lymphoid structures (TLS) and the tumour microenviron-ment. The distribution of different immune cells is also shown. b | Table depicting the parameters of the immune contexture that predict a good
prognosis. CT, core of the tumour; CTL, cytotoxic T lymphocyte; DC, dendritic cell; FDC, follicular dendritic cell; IFNγ, interferon-γ; IL-12, interleukin-12; IM, invasive margin; IRF1, interferon regulatory factor 1; MDSC, myeloid-derived suppressor cell; NK cell, natural killer cell; T
H,
T helper; TReg�EGNN��TGIWNCVQT[�6|EGNN�
P E R S P E C T I V E S
NATURE REVIEWS | CANCER VOLUME 12 | APRIL 2012 | 299
F O C U S O N T U m O U R I m m U N O lO g y & I m m U N OT h E R a P y
© 2012 Macmillan Publishers Limited. All rights reserved
(Fridman et al; Nat Rev 2012)
Nature Reviews | Cancer
% a
rtic
les
publ
ishe
d
CD8+
CD45RO+
Good
0
10
20
30
40
50
60
70
80
90
100
NonePoor
58/6014/15
4/8 4/814/33
'ȭGEV�QP�prognosis
TH1 cell
TH2 cell
TH17 cell
TRegcell
In many studies, NK cells have been detected using CD57 as a phenotypic marker. Tumour infiltration by CD57+ cells predicts a good prognosis in colorectal44, gastric45, lung46, renal47 and liver48 cancers. However, the expression of CD57 is not restricted to NK cells, and it is also expressed by activated cytotoxic T cells. Using the NKp46 (also known as NCR1) marker it was shown that a high density of NK cells does not correlate with clinical outcome in non-small-cell lung cancer49, although it seems to be associated with clinical outcome in the early stages of breast cancer50. In addition, recent reports have underlined that intratumoural NK cells have an anergic pheno type in lung cancers, which means that they are unable to secrete IFNγ and to kill tumour cells, even after activation with IL-2. The anergic NK cells exhibited downregulated expres-sion of the cell surface molecules NKp30 (also known as NCR3), NKp80 (also known as KLRF1), DNAX accessory molecule 1 (DNAM1; also known as CD226), CD16 and immunoglobulin-like transcript 2 (ILT2; also known as LIR1) in lung cancer49; downregu-lated expression of NKp30 and NKp46 in cervical cancer51; downregulated expression of DNAM1, 2B4 (also known as CD244) and CD16 expression in ovarian carcinoma52; and upregulated expression of co-inhibitory receptors in tongue cancer53 and renal cell carcinoma54. Tumour cells release suppressor factors, such as transforming growth factor-β (TGFβ), which maintain infiltrating NK cells in an anergic state. Therefore, it is likely that, if NK cells have a protective role in the very early stages of tumour development, then they will have little effect once a cancer is clinically detectable.
The effect of intratumoural B cells in can-cer is far from clear. Mouse models of spon-taneous cancers suggest a deleterious role of B cells, possibly through the production of IL-10 (REF. 55) or through the produc-tion of IgG, forming antigen–IgG antibody complexes56. This may activate an M2 pro-tumour phenotype in macrophages and might promote the early stages of carcino-genesis57. B cells may also promote metastasis by converting resting CD4+ T cells into TReg cells58. Histopathological analyses provide evidence for the presence of intratumoural B cells in human cancers. Infiltrating B cells are the dominant component of inflam-mation in some cancers, such as ductal carcinoma in situ and 20% of invasive breast tumours. They represent clonally expanded populations, express somatic hypermutated antibodies and recognize tumour-associated antigens such as ganglioside D3 (REF. 59). The
associated prognosis of infiltrating B cells is good in some histological subtypes of breast and epithelial ovarian cancers60,61, but cor-relations remain to be determined in many cancers. Indeed, B cells can act as antigen-presenting cells and, therefore, may be impor-tant for inducing CD4+ T cell-dependent CD8+ memory T cells that help to control tumour invasion and metastasis62.
An important clinical translation of this body of observations is the establishment of an immune score to determine the prog-nosis of clinical outcome in patients when there is no cancer-associated prognostic marker63. The immune score is based on the numeration of two lymphocyte popula-tions: CD45RO+ memory cells and cytotoxic memory (CD8+) T cells, both in the core and in the invasive margin of tumours. For example, patients with colorectal cancer who have a local primary tumour and no detectable lymph node or distant metasta-ses are usually treated with surgery alone. However, 20–25% of these patients will have recurrence of their disease, indicating that occult metastases are already present at the time of surgery. No tumour-associated marker predicts disease recurrence in these patients. The immune score was applied to two large independent cohorts (n = 602). In patients with a high immune score (IS4; which means that high densities of these two cell populations are found in both regions), only 4.8% had relapsed and 86.2% were alive after 5 years; whereas, 72% of patients with a low immune score (IS0 and IS1) had disease recurrence, and only 27.5% were alive at 5 years. These patients could possibly ben-efit from adjuvant therapy, and no criterion other than the immune score could have predicted which patients relapsed63.
The effect on response to cancer therapies. Whether the immune contexture of the primary tumour predicts therapeutic responses is of paramount importance in patient clinical management. Data based on immune signatures have established that a strong immune cell component is predic-tive of a good response to chemotherapy in breast cancer64–66, a cancer type in which a high lymphocyte infiltrate is associated with a higher response rate to neoadjuvant therapy67,68. In hepatic metastases of colorec-tal cancer, high infiltration of CD8+ T cells in the invasive margin predicts a better response to chemotherapy and prolonged survival14. In melanoma, the expression of an immune signature (that is, high expres-sion of TH1 cells and cytotoxicity-associated genes) correlates with good clinical
response to a therapeutic vaccine using the melanoma-associated antigen 3 (MAGEA3) antigen69. However, the high TH1 cell and cytotoxic immune response that is associated with prolonged survival in patients receiving adjuvant therapies might not be a predic-tion of response to the therapy, but might rather reflect the fact that the host immune response within the tumour protects the patient and thereby prolongs life.
The cytokine and chemokine milieuUnderstanding the mechanisms by which a favourable immune contexture might be created and maintained is essential for guiding innovative therapies. Fundamental issues to address include the determination of which factors are associated with tumour cells, what factors are dependent on the host, and how the immune contexture evolves during disease progression and therapy. These issues are far from being completely answered, but analyses of the cytokine and chemokine milieu that is associated with an anti-tumour immune contexture are accumulating (FIG. 3; TABLE 2).
Figure 2 | The association of immune cell infiltrates with prognosis in various types of cancer. The analysis of 124 published articles UVWF[KPI�VJG�KORCEV�QH�E[VQVQZKE�6|EGNNU��OGOQT[�6|EGNNU��TGIWNCVQT[�6�6
Reg) cells and T helper (T
H)
cell subpopulations with regard to prognosis of cancer patients (20 different cancer types were analysed) is represented. ‘Good’ means that the cell type is associated with a good prognosis, ‘none’ means that there was no correlation and ‘poor’ means that the cells are associated with a poor prognosis. Please also refer to TABLE 1 for references.
P E R S P E C T I V E S
NATURE REVIEWS | CANCER VOLUME 12 | APRIL 2012 | 301
F O C U S O N T U m O U R I m m U N O lO g y & I m m U N OT h E R a P y
© 2012 Macmillan Publishers Limited. All rights reserved
(Fridman et al; Nat Rev 2012)

3. Estudios masivos
technology widely accessible to many investigators. For example, in2007, a personal genome sequenced by using the Sanger method costUS$70 million36; by 2010, the cost for sequencing a genome by usingMPS had dropped to approximately US$50,000, and in 2013, genome
sequencing can be performed in a commercial or research setting forunder US$5,000 (Fig 2). Second, the development of MPS conferredsubstantial increases in both the sensitivity (by sequencing to a highredundancy) and the scalability of sequencing, thus allowing a deep
Molecular alterations in cancer
DNA
RNA
• Point mutations (substitutions/indels)
Tumor tissue
Existing technologies Emerging technologies
Capillary (Sanger) sequencingPyrosequencingGenotyping
FISHIHCArray CGHSNP array
KaryotypingFISH
PCRMicrobial arrays
Bisulphite sequencingmethyl-specific PCR
Targ-Seq/WESRNASeq
Targ-Seq/WESWGS
WGSRNA-Seq
WGSRNA-Seq
ChIP-Seq
RNA-SeqRNA microarray
RNA microarray
RNA microarray
• Copy number gains or losses
• Rearrangements, fusion genes
• Pathogenic sequences
• Epigenetic modifications
• Altered transcript expression levels
• Altered allele-specific expression
• Differential alternative splicing
cm 2
Fig 1. Categories of genomic alterationsand technologies for detection. Many of thehallmark alterations in cancer are currentlydetected by using a multitude of existingtechnologies, often in a serial fashion, eachusing an appreciable amount of nucleic acid.Newer sequencing-based methodologies arecapable of interrogating many types of canceralterations in one composite, sensitive test.CGH, comparative genomic hybridization;ChIP-Seq, chromatin immunoprecipitation fol-lowed by massively parallel sequencing; FISH,fluorescent in situ hybridization; IHC, immuno-histochemistry; PCR, polymerase chain reac-tion; RNA-Seq, RNA sequencing, also knownas transcriptome sequencing; SNP, single nu-cleotide polymorphism; Targ-Seq, targeted se-quencing; WES, whole-exome sequencing;WGS, whole-genome sequencing.
Cost
per
Raw
Meg
abas
eof
DN
A Se
quen
ce ($
)
10,000
1,000
100
10
1
0.01
0.10
2000
2001
2002
2003
2004
2005
2006
2007
2008
2009
2010
2011
2012
2013
2014
2015
Sanger sequencing Massively parallelsequencing
Moore’s Law
Emerging sequencingtechnologies
2005454 pyrosequencingGS-20
2008First tumor: normalgenome sequenced
2001IHGSC report the sequence of the first human genome
$1,000 genome?
$10K genome
$1M genome
2007ABI/SOLiDsequencer
2009Illumina GAIIX, SOLiD 3.0
2011Ion Torrent PGMPacBio RSIllumina MiSeq
2006Solexa/Illuminasequencer
2008Helicos BioSciences
2010Illumina HiSeq 2000Oxford Nanopore
2012Intelligent BioSystems
Fig 2. The decrease in cost of genomesequencing facilitated by massively parallelsequencing technologies. The cost of se-quencing has decreased at a rate faster thanMoore’s law in the past 10 years. The datafrom 2001 through 2007 represent the costsof generating DNA sequences by usingSanger-based chemistries and capillary-basedinstruments (first-generation sequencing plat-forms). Starting in 2008, the data representthe costs of generating DNA sequences byusing second-generation sequencing technol-ogies. The change in instruments representsthe rapid evolution of DNA sequencing tech-nologies that has occurred in recent years.Landmark events are also indicated on thetimeline. The release of various second- andthird-generation technologies is indicated inblue boxes. IHGSC, International Human Ge-nome Sequencing Consortium. Data adaptedfrom the National Human Genome ResearchInstitute Web site.35
Technologies for Tumor Genomic Profiling
www.jco.org © 2013 by American Society of Clinical Oncology 1817
159.237.12.82Information downloaded from jco.ascopubs.org and provided by at Universidad de Navarra on June 7, 2013 from
Copyright © 2013 American Society of Clinical Oncology. All rights reserved.
-2 -1 0 1 2
PD PD PD PD PD PDM
xR PD PD PD PD PD PD PD PD PD PD SD
SD
MxR PD PD
MxR PD PD PD PD SD
PD PDM
xR PD SD
PD SD
CR
PD PD PD CR
PD PR CR
SD
PD PD SD
MxR PD
MxR SD
PRM
xR PD SD
MxR
Clinical benefitNo clinical benefit
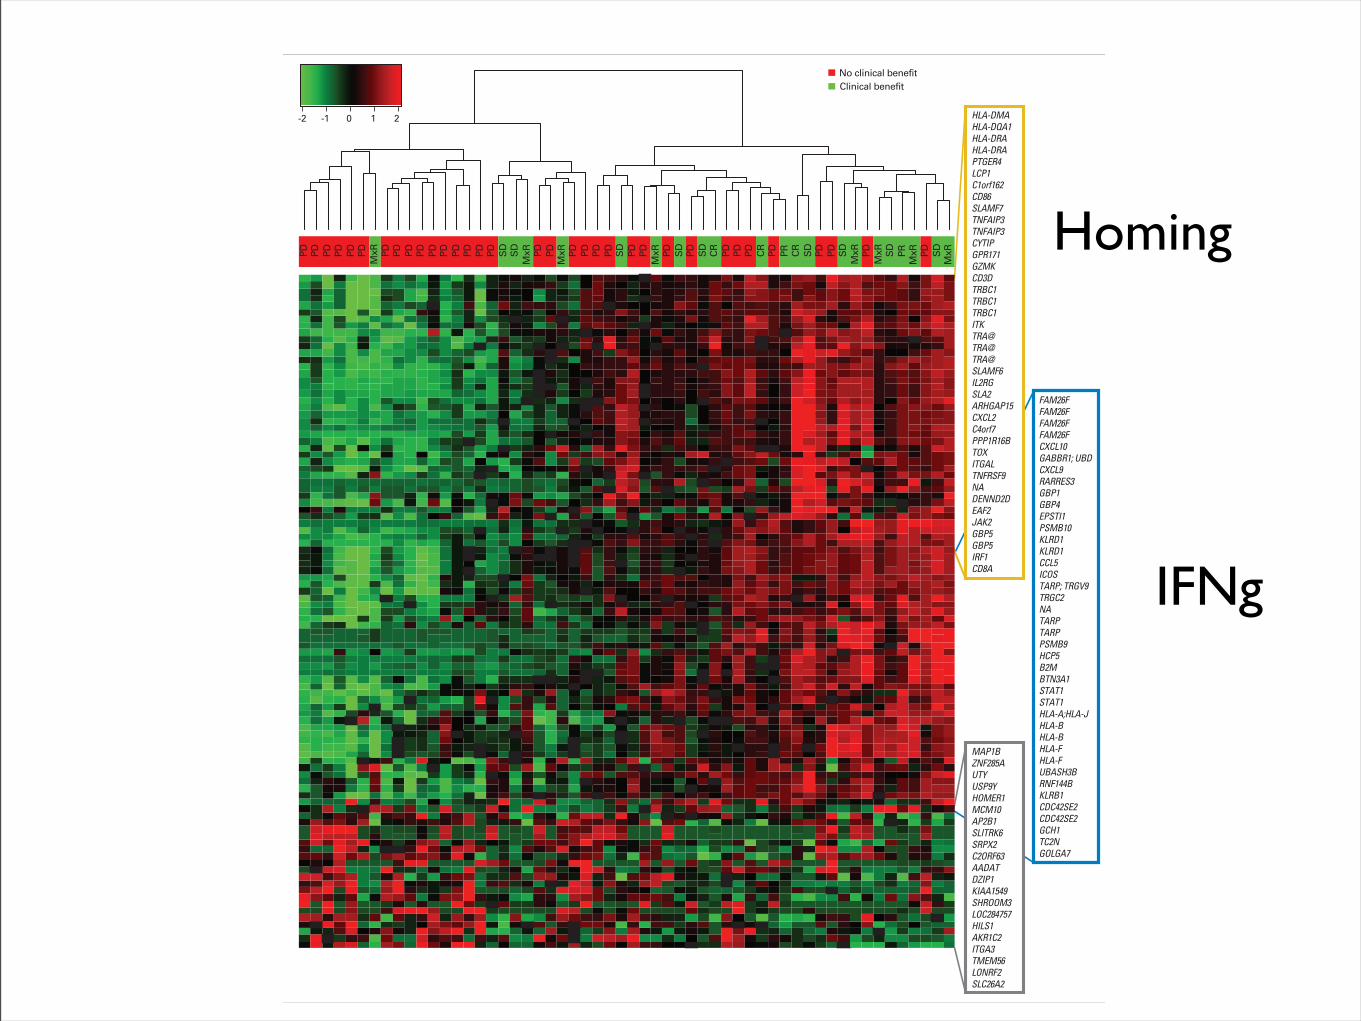
FAM26FFAM26FFAM26FFAM26FCXCL10GABBR1; UBDCXCL9RARRES3GBP1GBP4EPSTI1PSMB10KLRD1KLRD1CCL5ICOSTARP; TRGV9TRGC2NATARPTARPPSMB9HCP5B2MBTN3A1STAT1STAT1HLA-A;HLA-JHLA-BHLA-BHLA-FHLA-FUBASH3BRNF144BKLRB1CDC42SE2CDC42SE2GCH1TC2NGOLGA7
HLA-DMAHLA-DQA1HLA-DRAHLA-DRAPTGER4LCP1C1orf162CD86SLAMF7TNFAIP3TNFAIP3CYTIPGPR171GZMKCD3DTRBC1TRBC1TRBC1ITKTRA@TRA@TRA@SLAMF6IL2RGSLA2ARHGAP15CXCL2C4orf7PPP1R16BTOXITGALTNFRSF9NADENND2DEAF2JAK2GBP5GBP5IRF1CD8A
MAP1BZNF285AUTYUSP9YHOMER1MCM10AP2B1SLITRK6SRPX2C2ORF63AADATDZIP1KIAA1549SHROOM3LOC284757HILS1AKR1C2ITGA3TMEM56LONRF2SLC26A2
Fig 1. Hierarchical clustering with top 100 discriminant probe sets (rows) in 56 patients with melanoma (columns) treated with MAGE-A3 plus AS15 or MAGE-A3plus AS02B. Red, black, and green colors show high, medium, and low expression of the probe set, respectively. Clinical benefit (CB) and no CB are shown inthe column dendrogram. CB definition is provided in the Data Supplement. CR, complete response; MxR, mixed response; PD, progressive disease; PR, partialresponse; SD, stable disease.
Predictive Gene Signature for MAGE-A3 Cancer Immunotherapy
www.jco.org © 2013 by American Society of Clinical Oncology 3
159.237.12.65Information downloaded from jco.ascopubs.org and provided by at Universidad de Navarra on June 11, 2013 from
Copyright © 2013 American Society of Clinical Oncology. All rights reserved.
IFNg
Homing
OS was notably greater in the population of patients whose tumorpresented the GS; median OS was 16.2 months (95% CI, 9.0 to 20.0months) in the GS-negative population and 29.0 months (95% CI,20.5 to 40.2 months) in the GS-positive population. However, theseparation by immunostimulant showed a more than three-fold dif-ference (OS: 16.2 months; 95% CI, 4.5 months to not reached [NR]for GS-negative patients and 53.7 months; 95% CI, 29.0 months to NRfor GS-positive patients among the AS15-treated patients; Fig 4A). Asmaller difference was seen in the AS02B arm (OS: 15.3 months; 95%CI, 4.2 months to NR for GS-negative patients and 21.1 months; 95%CI, 14.5 to 25.5 months for GS-positive patients), although the GS-negative curves from both arms were superimposed.
These differences were not attributable to differences in baselinecharacteristics; the GS was evenly distributed between the two study
arms, and the treatment groups and other important potential prog-nostic factors were well balanced across profiles, except that the GS-positive group contained more women and more patients with stageIV disease (Data Supplement).
Genes Selected As Classifier Features RevealAssociation With the Tumor’s Microenvironment
Most of the classifier genes have a higher expression level inpatients benefiting from the treatment. Analysis of biologic functionsrevealed over-representation of immune-related genes in the GS (Ta-ble 1; Data Supplement), indicating a strong Th1 adaptive immunity,and interferon gamma (IFNG) pathway (CD8, granzymes, CD3D,IRF1) in the tumors of CB patients. In addition, overexpression ofgenes coding for specific chemokines (CCL5, CXCL2, CXCL9, and
No. at riskMAGE-A3 + AS15 – GS+MAGE-A3 + AS15 – GS-MAGE-A3 +AS02B – GS+MAGE-A3 +AS02B – GS-
15121712
136
147
12363
9332
5201
0100
MAGE-A3 + AS15 – GS+MAGE-A3 + AS15 – GS-MAGE-A3 +AS02B – GS+MAGE-A3 +AS02B – GS-
0
Over
all S
urvi
val (
%)
Time Since Random Assignment (months)
100
80
60
40
20
24 48 72
A
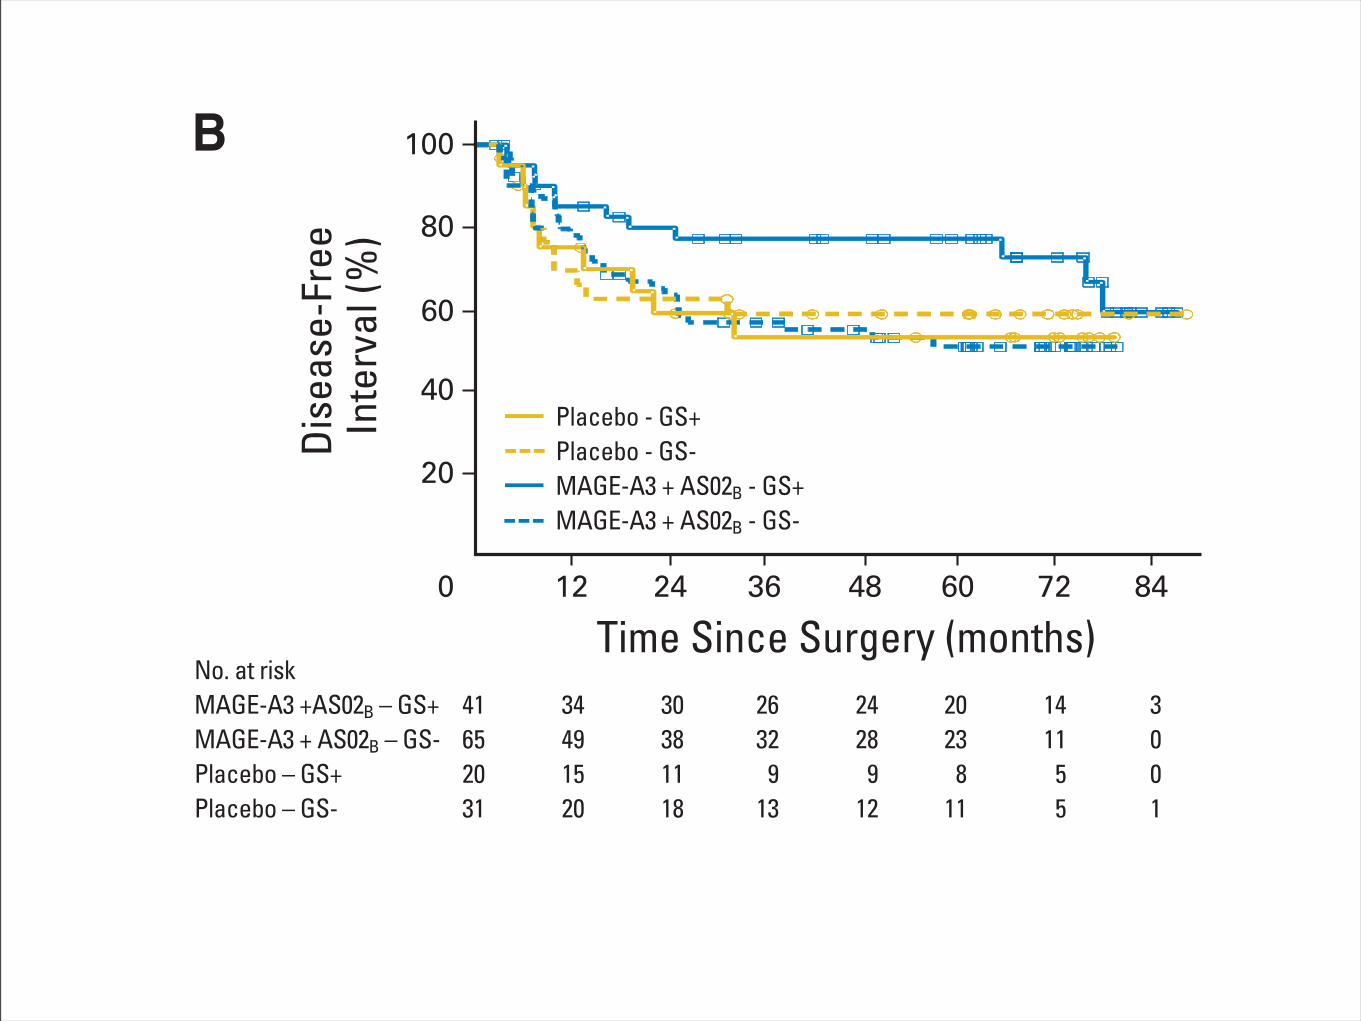
No. at riskMAGE-A3 +AS02B – GS+MAGE-A3 + AS02B – GS-Placebo – GS+Placebo – GS-
41652031
34491520
30381118
26329
13
24289
12
20238
11
141155
3001
Placebo - GS+Placebo - GS-MAGE-A3 + AS02B - GS+MAGE-A3 + AS02B - GS-
0
Dise
ase-
Free
In
terv
al (%
)
Time Since Surgery (months)
100
80
60
40
20
12 48 8472603624
B
No. at riskMAGE-A3 +AS02B – GS+MAGE-A3 + AS02B – GS-Placebo – GS+Placebo – GS-
41652031
39601925
34501623
32391318
26321214
22261012
151366
3001
Placebo - GS+Placebo - GS-MAGE-A3 + AS02B - GS+MAGE-A3 + AS02B - GS-
Over
all S
urvi
val (
%)
0
Time Since Surgery (months)
100
80
60
40
20
12 48 8472603624
C
Fig 4. (A) Overall survival (OS) for patients with metastatic melanoma according to treatment (MAGE-A3 plus AS15 or AS02B) and gene expression signature(GS) status (GS positive [GS!] or GS negative [GS–]). The hazard ratios (HRs) between the GS! and GS– populations were 0.37 (95% CI, 0.13 to 1.05; P " .06)in the AS15 arm and 0.84 (95% CI, 0.36 to 1.97; P " .70) in AS02B arm. Results are from a 4-year median observation period. As a reference, HRs betweenthe AS15 and AS02B arms were 0.48 (95% CI, 0.24 to 0.94) in the population analyzed for GS and 0.56 (95% CI, 0.31 to 0.98) in the entire study population.(B) Disease-free interval for patients with non–small-cell lung cancer (NSCLC; adjuvant setting) according to treatment (MAGE-A3 ! AS02B or placebo) and GSstatus (GS! or GS–). HRs between the actively treated and placebo-treated groups were 0.42 (95% CI, 0.17 to 1.03; P " .06) for the 61 GS! patients and 1.17(95% CI, 0.59 to 2.31; P " .65) for the 96 GS– patients. As a reference, the HRs were 0.85 (95% CI, 0.50 to 1.43) in the 157 patients analyzed for GS and 0.78(95% CI, 0.49 to 1.24) in the entire study population (including 182 patients). HRs between the GS! and GS# populations were 1.23 (95% CI, 0.51 to 2.98; P ".65) for the 51 patients in the placebo arm and 0.44 (95% CI, 0.22 to 0.88; P " .02) for the 106 patients in the actively treated arm. Results are from a median70-month observation period; results from an early (44-month) analysis were qualitatively similar. (C) OS (median 70-month observation period) for patients withNSCLC (adjuvant setting) according to treatment (MAGE-A3 ! AS02B or placebo) and GS status (GS! or GS–). HRs between the actively treated andplacebo-treated groups were 0.63 (95% CI, 0.22 to 1.78; P " .38) for the 61 GS! patients and 1.09 (95% CI, 0.56 to 2.11; P " .81) for the 96 GS– patients.As a reference, HRs were 0.93 (95% CI, 0.54 to 1.61) in the 157 patients analyzed for GS and 0.99 (95% CI, 0.60 to 1.64) in the entire study population (including182 patients). HRs between the GS! and GS# populations were 0.69 (95% CI, 0.25 to 1.86; P " .46) for the 51 patients in the placebo arm and 0.39 (95% CI,0.19 to 0.81; P " .01) for the 106 patients in the actively treated arm. In (B) and (C), open circles and open squares indicate censored patients.
Predictive Gene Signature for MAGE-A3 Cancer Immunotherapy
www.jco.org © 2013 by American Society of Clinical Oncology 5
159.237.12.32Information downloaded from jco.ascopubs.org and provided by at Universidad de Navarra on June 9, 2013 from
Copyright © 2013 American Society of Clinical Oncology. All rights reserved.
RESEARCH Open Access
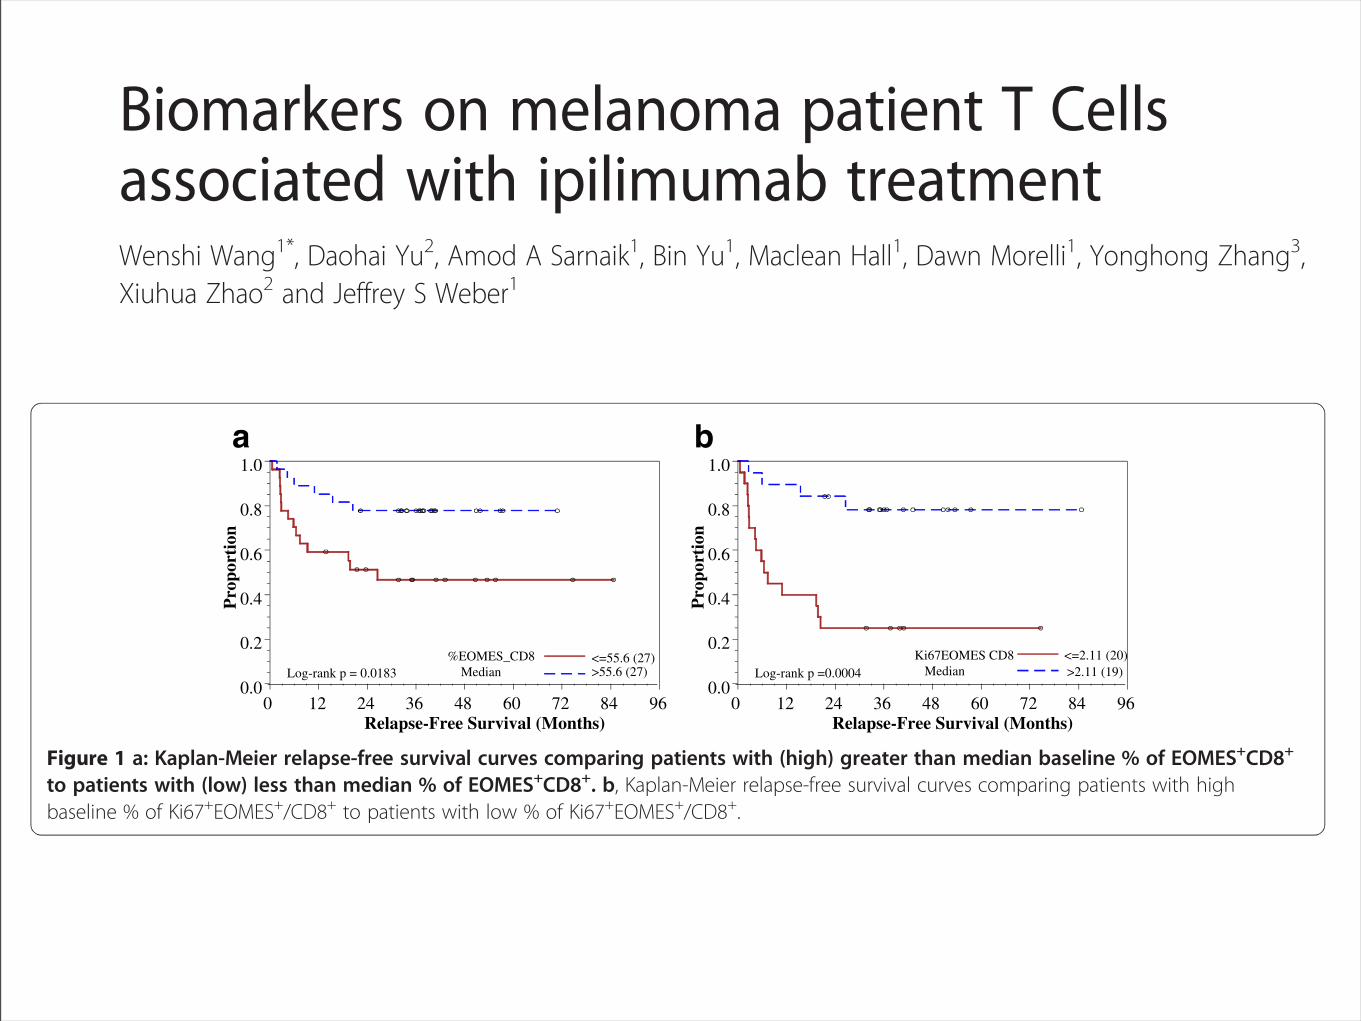
Biomarkers on melanoma patient T Cellsassociated with ipilimumab treatmentWenshi Wang1*, Daohai Yu2, Amod A Sarnaik1, Bin Yu1, Maclean Hall1, Dawn Morelli1, Yonghong Zhang3,Xiuhua Zhao2 and Jeffrey S Weber1
Abstract
Background: Ipilimumab induces long-lasting clinical responses in a minority of patients with metastaticmelanoma. To better understand the mechanism(s) of action and to identify novel biomarkers associatedwith the clinical benefit and toxicity of ipilimumab, baseline characteristics and changes in CD4+ and CD8+
T cells from melanoma patients receiving ipilimumab were characterized by gene profiling and flowcytometry.
Methods: Microarray analysis of flow-cytometry purified CD4+ and CD8+ T cells was employed to assessgene profiling changes induced by ipilimumab. Selected molecules were further investigated by flowcytometry on pre, 3-month and 6-month post-treatment specimens.
Results: Ipilimumab up-regulated Ki67 and ICOS on CD4+ and CD8+ cells at both 3- and 6-month post ipilimumab(p! 0.001), decreased CCR7 and CD25 on CD8+ at 3-month post ipilimumab (p! 0.02), and increased Gata3 in CD4+
and CD8+ cells at 6-month post ipilimumab (p! 0.001). Increased EOMES+CD8+, GranzymeB+EOMES+CD8+ and decreasedKi67+EOMES+CD4+ T cells at 6 months were significantly associated with relapse (all p! 0.03). Decreased Ki67+CD8+ Tcells were significantly associated with the development of irAE (p = 0.02). At baseline, low Ki67+EOMES+CD8+ T cells wereassociated with relapse (p! 0.001), and low Ki67+EOMES+CD4+ T cells were associated with irAE (p! 0.008).
Conclusions: Up-regulation of proliferation and activation signals in CD4+ and CD8+ T cells were pharmacodynamicmarkers for ipilimumab. Ki67+EOMES+CD8+ and Ki67+EOMES+CD4+T cells at baseline merit further testing as biomarkersassociated with outcome and irAEs, respectively.
Keywords: CTLA-4, Antibody, Biomarker, Melanoma
BackgroundT cells play a pivotal role in the development of immunetolerance to self, autoimmunity, and anti-tumorresponses. Cytotoxic T Lymphocyte-Associated antigen4 (CTLA-4) is a surface receptor on T lymphocytes thatdown-regulates pathways of T-cell activation [1], servingas an immune check point molecule. It is expressedintracellularly in resting T cells, and is transported to theT cell surface after activation of the T cell receptor(TCR). TCR engagement leads to tyrosine phosphoryl-ation of CTLA-4 at position 164 (164Y) via the SRC kin-ase and releases it from AP50, resulting in its surface
expression within 48 hours of T cell activation, leadingto T cell tolerance and anergy. CTLA-4 expression isassociated with decreased proliferation with cell cyclearrest at the G1-S interface and diminished cytokinesecretion [2, 3]. It decreases cell proliferation throughthe inhibition of mitogen-activated (MAP) kinases butpromotes T cell survival through the binding ofphosphoinositol-3 kinase and activating protein kinaseB (PKB/AKT) resulting in T cell anergy and tolerancewithout the death of T cells [4]. CTLA-4 signals sup-press both CD4+ and CD8+ T cell responses via atyrosine-based inhibitory motif [5, 6].CTLA-4 blockade has antitumor activity in mice, and
important effects on the breaking of tolerance [6-10]. Inexperiments with B16 melanoma, a therapeutic effectinduced by CTLA-4 blockade with a vaccine was
* Correspondence: [email protected] of Cutaneous Oncology and the Donald A. AdamComprehensive Melanoma Research Center, H. Lee Moffitt Cancer Center,Tampa, FL, USAFull list of author information is available at the end of the article
© 2012 Wang et al.; licensee BioMed Central Ltd. This is an Open Access article distributed under the terms of the CreativeCommons Attribution License (http://creativecommons.org/licenses/by/2.0), which permits unrestricted use, distribution, andreproduction in any medium, provided the original work is properly cited.
Wang et al. Journal of Translational Medicine 2012, 10:146http://www.translational-medicine.com/content/10/1/146
Pre-treatment biomarkers on/in T cells associated withoutcome and irAEAn analysis of biomarkers at baseline dichotomized bytheir medians revealed that a low % of Ki67+EOMES+
CD8+ T cells, and a low % of EOMES+CD8+ T cells weresignificantly associated with relapse (p =0.001, and 0.047with OR = 11.25, and 3.77, respectively; Table 5a). Thesepre-treatment biomarkers were also confirmed in a uni-variate logistic regression analysis to be associated with re-lapse (data not shown). A similar analysis of dichotomizedbaseline biomarkers by their medians showed that a low %of Ki67+EOMES+CD4+ T cells was associated with occur-rence of irAE (p =0.008 with OR = 8.00, Table 5b).
Pre-treatment biomarkers on/in T cells associated withRFSOur analysis highlighted the potential importance ofEOMES, a transcription factor in the T-box family andinvolved in the regulation of INF-!, granzyme B and per-forin production by CD8+ T cells [43]. To better under-stand the potential role of EOMES+CD8+ T cells inipilimumab treatment, we stratified pre-treatment speci-mens by the median % of EOMES+CD8+ T cells. Patientswith higher baseline % of EOMES+CD8+ T cells had a sig-nificantly improved relapse-free survival (RFS) comparedto those with a lower basal level of EOMES+CD8+ T cells(p = 0.02 by log-rank test, Figure 1a). The patients were also
Table 5 a, Association between outcome (Relapse vs. NED) and dichotomized biomarkers at baseline. b, Association ofbaseline dichotomized biomarkers with irAE (Yes vs. No) for a total 55 patientsBiomarker Outcome n (%) Odds Ratio Fisher
(95% CI) p-value
a. Association between outcome (Relapse/NED) and dichotomized baseline biomarkers by median
%-Ki67 + EOMES + CD8+ (n = 39) 11.25 ( 2.52, 50.27) 0.0012
<=2.11 Relapse 15 ( 75.0)
<=2.11 NED 5 ( 25.0)
>2.11 Relapse 4 ( 21.1)
>2.11 NED 15 ( 78.9)
%-EOMES + CD8+ (n = 54) 3.77 ( 1.16, 12.27) 0.0473
<=55.6 Relapse 14 ( 51.9)
<=55.6 NED 13 ( 48.1)
>55.6 Relapse 6 ( 22.2)
>55.6 NED 21 ( 77.8)
b. Association between irAE (Yes/No) and dichotomized baseline biomarkers by median
%-Ki67 + EOMES + CD4+ (n = 39) 8.00 ( 1.74, 36.70) 0.0079
<=0.446 Yes 12 ( 60.0)
<=0.446 No 8 ( 40.0)
>0.446 Yes 3 ( 15.8)
>0.446 No 16 ( 84.2)
Ki67 and EOMES that was stained intracellularly in a total of 36 paired specimens of PBMC prior to and after four doses of ipilimumab was analyzed by flowcytometry.
Pro
port
ion
0.0
0.2
0.4
0.6
0.8
1.0
Relapse-Free Survival (Months)0 12 24 36 48 60 72 84 96
Log-rank p = 0.0183%EOMES_CD8
Median<=55.6 (27)>55.6 (27)
Pro
port
ion
0.0
0.2
0.4
0.6
0.8
1.0
Relapse-Free Survival (Months)0 12 24 36 48 60 72 84 96
Log-rank p =0.0004Ki67EOMES CD8
Median<=2.11 (20)>2.11 (19)
a b
Figure 1 a: Kaplan-Meier relapse-free survival curves comparing patients with (high) greater than median baseline % of EOMES+CD8+
to patients with (low) less than median % of EOMES+CD8+. b, Kaplan-Meier relapse-free survival curves comparing patients with highbaseline % of Ki67+EOMES+/CD8+ to patients with low % of Ki67+EOMES+/CD8+.
Wang et al. Journal of Translational Medicine 2012, 10:146 Page 8 of 12http://www.translational-medicine.com/content/10/1/146

Limitaciones y dificultades

Hence, the measurement of the immune response (T-cell orantibody response) is an attractive ‘proof of principle’ biomarkerthat could be assessed before clinical end points are reached.Immunological biomarkers have broad applications, fromdetermining whether an immune intervention has achieved itsbiological effect to predicting clinical outcomes as surrogates forclinical benefit. The prerequisite for effective biomarkermeasurement through immune monitoring assays is the use ofreliable and reproducible assays. T-cell immune response assaysare notorious for their high degree of variability. As a result,they are often nonreproducible, which has implications forclinical trials in which assays must be used across multiplecentres [3]. Unfortunately, this has contributed to the field’sfailure to accurately correlate immunological biomarker findingswith clinical end points such as survival or response [4].Therefore, harmonisation of assays is critical to reduce thisvariability and support the investigation of cellular immuneresponses as both a clinical biomarker and for clinical surrogacy.Numerous T-cell immune response assays exist; the most
commonly used are the enzyme-linked immunosorbent spot(ELISPOT), intracellular cytokine staining (ICS) and humanleukocyte antigen (HLA)-peptide multimer staining assays[5–7]. Although they are often described as classical assays,existing data clearly indicate that to maintain consistency, theyneed to be performed by specially trained laboratory staff [6–8]. The extent of assay variability was highlighted in a reportby Janetzki et al. [8]. For all three immune-assays, the degreeof variability between laboratories was striking (Figure 1).Overcoming the technical hurdle of inter-laboratory assay
variability would improve the accuracy of the results obtained,thereby adding value to their use within clinical trials [8, 9]. Inresponse to this predicament, a series of internationalproficiency panels (quality control experiments across multiplecenters) were initiated by CIC and CIMT in 2005 [10–12].Over 100 participating laboratories from 14 countries, the USDepartment of Defense and the German regulatory agencyPaul-Ehrlich-Institute (Langen, Germany) assessed theELISPOT, ICS and HLA-multimer staining assays. The goals ofthis assessment were to provide an external quality assurance
process for laboratories conducting immune monitoring inclinical trials, and to harmonise assay performance.The reduction of variability observed when assay
harmonisation criteria were applied demonstrates therequirement for consistency between laboratories whenperforming the same assay [11, 12]. In the case of ELISPOT,assay harmonisation reduced variability from 50% to <10%,which is within the realm of acceptability required for assaysused in clinical trials. This important finding led to thepreparation of preliminary ELISPOT harmonisation guidelines,which were published in 2008 [12]. The application ofharmonisation does not require the standardisation of assayprotocols, which could adversely affect the scientific creativityneeded for new assay development. Instead, the processinvolves standard operating procedure-based improvements toidentify and remove factors that can introduce major assayvariability between laboratories.
Figure 1. Challenges of immune monitoring: inter-laboratory variabilityin immune response measurements [8]. Reprinted from Janetzki et al. [8],with permission from Elsevier.
Table 1. Challenges and recommendations for assessment of cancer immunotherapy [4]
Cellular immune response Antitumour response Survival
Challenges Complex assays exist Conventional and novel responsepatterns are observed
Translation of immune andantitumour response into asurvival effect takes time
Results are highly variable and notreproducible across trials
Translation of the immune responseinto an antitumour response takestime
Proportional hazards assumptionsare not applicable
Assay procedures are notharmonised
No systematic criteria exist tocapture new response patterns
Conventional statistical models donot account for nonproportionalhazards and delayed separation ofcurves
Recommendations Harmonise assay use throughstandard operating procedures thataccompany individual assayprotocols
Identify relevant response patterns Employ statistical models thataccount for the delayed effect
Use systematic immune-relatedresponse criteria to reproduciblycapture new patterns
Consider use of early interim andfutility analyses
symposium article Annals of Oncology
viii | Hoos Volume 23 | Supplement 8 | September 2012
at Universidad de N
avarra on June 10, 2013http://annonc.oxfordjournals.org/
Dow
nloaded from

1390 Review | JNCI Vol. 102, Issue 18 | September 22, 2010
combined panel results led to initial ELISPOT harmonization guidelines (Table 2) (20), which synchronize key variables across laboratories and substantially influence assay outcome but do not impose standardization of assays on individual laboratories. The introduction of these guidelines is central to this harmonization to provide general assistance for the conduct of the individual assay protocol in the context of standard operating procedures (eg, exclusion of apoptotic cells, use of pretested serum for background reduction, and quality control during the computerized spot evaluation) (Table 2) (20). Confirmatory findings from a parallel experiment were published by the C-IMT proficiency panels (21). As the use of serum is a crucial variable for ELISPOT assays, a separate ELISPOT proficiency panel focused on serum use and showed that serum-free medium for incubation of cells can be as effective as qualified serum-supplemented medium, thus address-ing this crucial variable for assay protocols as part of the harmoni-zation guidelines (33).
The first round of the HLA-peptide multimer-staining panel of CIC-CRI allowed the formulation of initial harmonization guide-lines (22), which will likely reduce assay variability. These recom-mendations are 1) the use of more than two colors for staining, 2)
protocol details are reported back for central analysis. Since 2005, more than 80 laboratories from 14 countries have participated, encompassing the academic, nonprofit, biotech, and pharma-ceutical sectors, and the United States Department of Defense (20,22).
The ELISPOT panel is the longest running program and pro-vides the most mature results. The objective of the first ELISPOT panel was to identify sources of variability among assay procedures. The second panel adjusted these sources of variability while keeping the respective laboratory protocols intact. This adjust-ment led to a substantial reduction in variability: The percentage of participants unable to detect all responders (six responders among eight samples) was reduced from 47% to 14%, and the percentage of participants unable to detect 50% or more of all responders (“outliers”) dropped from 11% to 0% (Figure 2). The
Figure 1. High variability of results for the enzyme-linked immunosorbent spot (ELISPOT) immune response assay. Identical peripheral blood mononuclear cell samples from the same patient were sent to 36 different laboratories experienced with ELISPOT methodology. The image shows the spot count results in microtiter plates in which each
well represents the result of one laboratory. Some wells show high numbers of spots, whereas others are low or negative. Each spot in this assay represents a single T-cell capable of reacting against a defined target antigen. These results reflect the outcome of the first ELISPOT profi-ciency panel, which identified sources of variability among laboratories.
Table 2. Initial harmonization guidelines for the enzyme-linked immunosorbent spot (ELISPOT) immune response assay*
A Use only pretested and optimized serum allowing for low background : high signal ratio
B Establish laboratory SOP for ELISPOT testing procedures, including:
B1 Counting method for apoptotic cells for determining adequate cell dilution for plating
B2 Overnight rest of cells before plating and incubationC Establish SOP for plate reading, including: C1 Human auditing during reading process C2 Adequate adjustments for technical artifactsD Only allow trained personnel, certified per laboratory SOP,
to conduct assays
* Harmonization guidelines can be used by each individual laboratory performing an immune response assay in the context of Standard Operating Procedures (SOPs) and without adopting a standard assay protocol. Through general steps such as use of pretested serum [or serum-free media (33)], exclusion of apoptotic cells from the analysis, human auditing of the computerized assay read out procedure, and training of operators on the laboratory SOPs, quality of assays can be substantially improved. Courtesy of Janetzki et al. (20).
Figure 2. Effect of assay harmonization on data variability of the enzyme-linked immunosorbent spot (ELISPOT) assay. In the Cancer Immunotherapy Consortium of the Cancer Research Institute ELISPOT proficiency panel, participating laboratories reported the response status from eight different donor–antigen combinations. Grey bars rep-resent the first panel round and stippled bars the second panel round. In the first panel round, 47% of panelists missed detection of at least one response correctly, and 11% of panelists failed to detect at least three responses correctly (characterized as an “outlier” because of high variability). Based on the first panel results, harmonization criteria were given to panelists, and the testing was repeated in the second panel (stippled bars). ELISPOT performance improved, with only 14% of pan-elists missing at least one responder and zero outliers.
at Universidad de N
avarra on June 10, 2013http://jnci.oxfordjournals.org/
Dow
nloaded from

Conclusiones

compared with 11.0% in the gp100 group. In addition, a higherbest overall response (BOR) rate was observed in the twoipilimumab-based treatment groups compared with the gp100group (5.7% and 10.9% versus 1.5%).Over 95% of patients in each treatment group experienced at
least one adverse event (AE) during the trial. As expected, theincidence of grade 3 or 4 drug-related AEs was higher in thetwo ipilimumab-based treatment groups (17.4% and 22.9%)than in the gp100 group (11.4%). Drug-related deaths occurredin 2.1%, 3.1% and 1.5% of patients in the combination therapy,ipilimumab-alone and gp100-alone treatment groups,respectively. The most common immune-related adverse events(irAEs) were tissue-specific inflammation, and these were mostfrequently reported in the ipilimumab-based treatment groups.The majority of irAEs were dermatological and gastrointestinal.With regard to severity, most grade 3 and 4 irAEs werereported in the ipilimumab-based treatment groups. Deathsassociated with irAEs were reported in 1.3%, 1.5% and 0% of
patients in the combination therapy, ipilimumab-alone andgp100 treatment groups, respectively [3].
CA184-024Trial CA184-024 evaluated the efficacy and safety of ipilimumabplus DTIC 850 mg/m2 compared with the DTIC alone group in502 patients with previously untreated stage IIIC or stage IVmelanoma [5]. The primary end point of the trial was OS, withresponse-based and safety secondary end points. The mean agesof patients were similar between the two treatment groups (57.5years and 56.4 years, respectively) and the majority of patientshad a poor prognosis, with over 50% of patients in both thetreatment groups having stage M1c disease.OS (Figure 4B) in the ipilimumab plus DTIC group was
significantly longer than in the DTIC alone group: 11.2 monthsversus 9.1 months, P = 0.00009, with a 28% reduction in the riskof death. The estimated 1-year, 2-year and 3-year survival rateswere 47.3%, 28.5% and 20.8% in the ipilimumab plus DTICgroup compared with 36.3%, 17.9% and 12.2% in the DTICalone group. PFS was also statistically significantly improved bythe addition of ipilimumab to DTIC, with a 24% reduction inthe risk of disease progression (P = 0.006). The disease controlrates were similar across both the treatment groups (33.2% and30.2%). The rates of CR and partial responses (PR) were higherin the ipilimumab plus DTIC group than in the DTIC group,while the rates of stable and progressive disease were lower. Thedurability of response was higher in the ipilimumab plus DTICgroup than in the DTIC group (duration of response: 19.3months versus 8.1 months, respectively).The overall AE rates in this trial were similar across both the
treatment groups, although the rate of grade 3 or 4 AEs andgrade 3 or 4 irAEs was higher in the ipilimumab plus DTICgroup. There were no deaths reported in the combinationgroup and one death in the DTIC group (due togastrointestinal haemorrhage). In terms of body systemsaffected, the rate of dermatological and gastrointestinal irAEswas higher in the ipilimumab plus DTIC group than in theDTIC alone group, although these were mainly low-grade inseverity. The incidence of grade 3 or 4 diarrhoea and colitiswas lower than expected in the ipilimumab plus DTICtreatment group. However, the incidence of hepatic events, i.e.increased alanine aminotransferase and aspartateaminotransferase, was higher than anticipated; this may havebeen due to the addition of DTIC to ipilimumab, which hasbeen associated with hepatotoxic effects [19–21].
using ipilimumab in the clinicWhen using ipilimumab in the clinic, some importantconsiderations include the early diagnosis and management ofirAEs and the accurate assessment of response to treatment.
IrAEsGuidelines for the management of common AEs wereestablished during the clinical development of ipilimumab[22–24]. Because the irAEs associated with ipilimumab are
Figure 4. Kaplan–Meier analysis of overall survival (OS) from (A)MDX010-20 and (B) CA184-024. Reprinted in part from Hodi et al. [3]©2010 and Robert et al. [5] ©2011 with permission from The PublishingDivision of the Massachusetts Medical Society; publishers of The NewEngland Journal of Medicine.
symposium article Annals of Oncology
viii | Wolchok Volume 23 | Supplement 8 | September 2012
at Universidad de N
avarra on October 25, 2012
http://annonc.oxfordjournals.org/D
ownloaded from
Personalizar-inmunoterapia
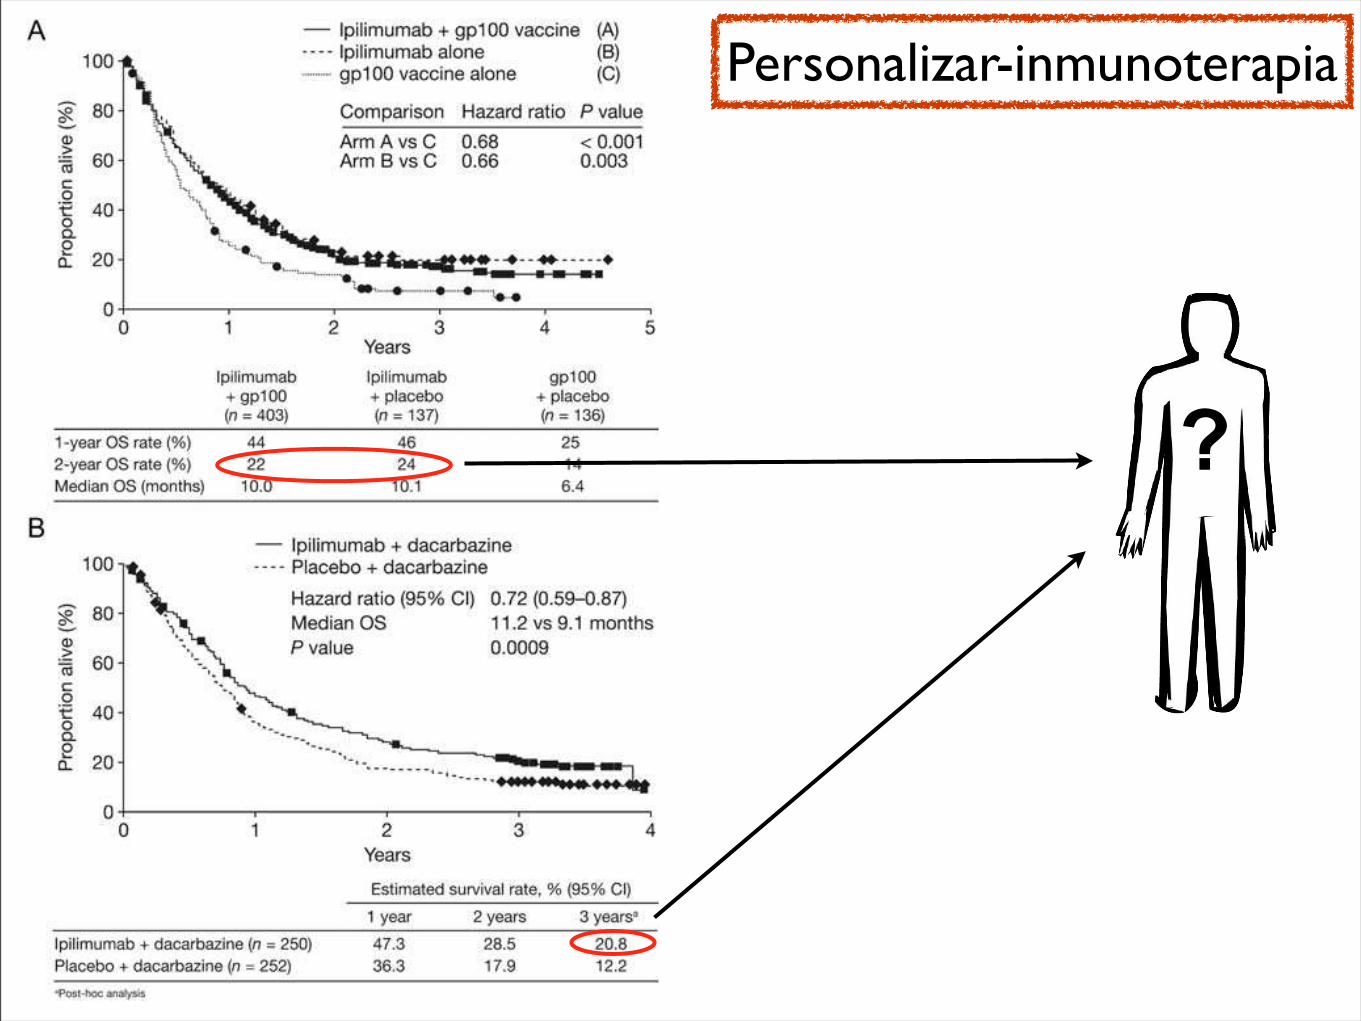
compared with 11.0% in the gp100 group. In addition, a higherbest overall response (BOR) rate was observed in the twoipilimumab-based treatment groups compared with the gp100group (5.7% and 10.9% versus 1.5%).Over 95% of patients in each treatment group experienced at
least one adverse event (AE) during the trial. As expected, theincidence of grade 3 or 4 drug-related AEs was higher in thetwo ipilimumab-based treatment groups (17.4% and 22.9%)than in the gp100 group (11.4%). Drug-related deaths occurredin 2.1%, 3.1% and 1.5% of patients in the combination therapy,ipilimumab-alone and gp100-alone treatment groups,respectively. The most common immune-related adverse events(irAEs) were tissue-specific inflammation, and these were mostfrequently reported in the ipilimumab-based treatment groups.The majority of irAEs were dermatological and gastrointestinal.With regard to severity, most grade 3 and 4 irAEs werereported in the ipilimumab-based treatment groups. Deathsassociated with irAEs were reported in 1.3%, 1.5% and 0% of
patients in the combination therapy, ipilimumab-alone andgp100 treatment groups, respectively [3].
CA184-024Trial CA184-024 evaluated the efficacy and safety of ipilimumabplus DTIC 850 mg/m2 compared with the DTIC alone group in502 patients with previously untreated stage IIIC or stage IVmelanoma [5]. The primary end point of the trial was OS, withresponse-based and safety secondary end points. The mean agesof patients were similar between the two treatment groups (57.5years and 56.4 years, respectively) and the majority of patientshad a poor prognosis, with over 50% of patients in both thetreatment groups having stage M1c disease.OS (Figure 4B) in the ipilimumab plus DTIC group was
significantly longer than in the DTIC alone group: 11.2 monthsversus 9.1 months, P = 0.00009, with a 28% reduction in the riskof death. The estimated 1-year, 2-year and 3-year survival rateswere 47.3%, 28.5% and 20.8% in the ipilimumab plus DTICgroup compared with 36.3%, 17.9% and 12.2% in the DTICalone group. PFS was also statistically significantly improved bythe addition of ipilimumab to DTIC, with a 24% reduction inthe risk of disease progression (P = 0.006). The disease controlrates were similar across both the treatment groups (33.2% and30.2%). The rates of CR and partial responses (PR) were higherin the ipilimumab plus DTIC group than in the DTIC group,while the rates of stable and progressive disease were lower. Thedurability of response was higher in the ipilimumab plus DTICgroup than in the DTIC group (duration of response: 19.3months versus 8.1 months, respectively).The overall AE rates in this trial were similar across both the
treatment groups, although the rate of grade 3 or 4 AEs andgrade 3 or 4 irAEs was higher in the ipilimumab plus DTICgroup. There were no deaths reported in the combinationgroup and one death in the DTIC group (due togastrointestinal haemorrhage). In terms of body systemsaffected, the rate of dermatological and gastrointestinal irAEswas higher in the ipilimumab plus DTIC group than in theDTIC alone group, although these were mainly low-grade inseverity. The incidence of grade 3 or 4 diarrhoea and colitiswas lower than expected in the ipilimumab plus DTICtreatment group. However, the incidence of hepatic events, i.e.increased alanine aminotransferase and aspartateaminotransferase, was higher than anticipated; this may havebeen due to the addition of DTIC to ipilimumab, which hasbeen associated with hepatotoxic effects [19–21].
using ipilimumab in the clinicWhen using ipilimumab in the clinic, some importantconsiderations include the early diagnosis and management ofirAEs and the accurate assessment of response to treatment.
IrAEsGuidelines for the management of common AEs wereestablished during the clinical development of ipilimumab[22–24]. Because the irAEs associated with ipilimumab are
Figure 4. Kaplan–Meier analysis of overall survival (OS) from (A)MDX010-20 and (B) CA184-024. Reprinted in part from Hodi et al. [3]©2010 and Robert et al. [5] ©2011 with permission from The PublishingDivision of the Massachusetts Medical Society; publishers of The NewEngland Journal of Medicine.
symposium article Annals of Oncology
viii | Wolchok Volume 23 | Supplement 8 | September 2012
at Universidad de N
avarra on October 25, 2012
http://annonc.oxfordjournals.org/D
ownloaded from
?
Personalizar-inmunoterapia
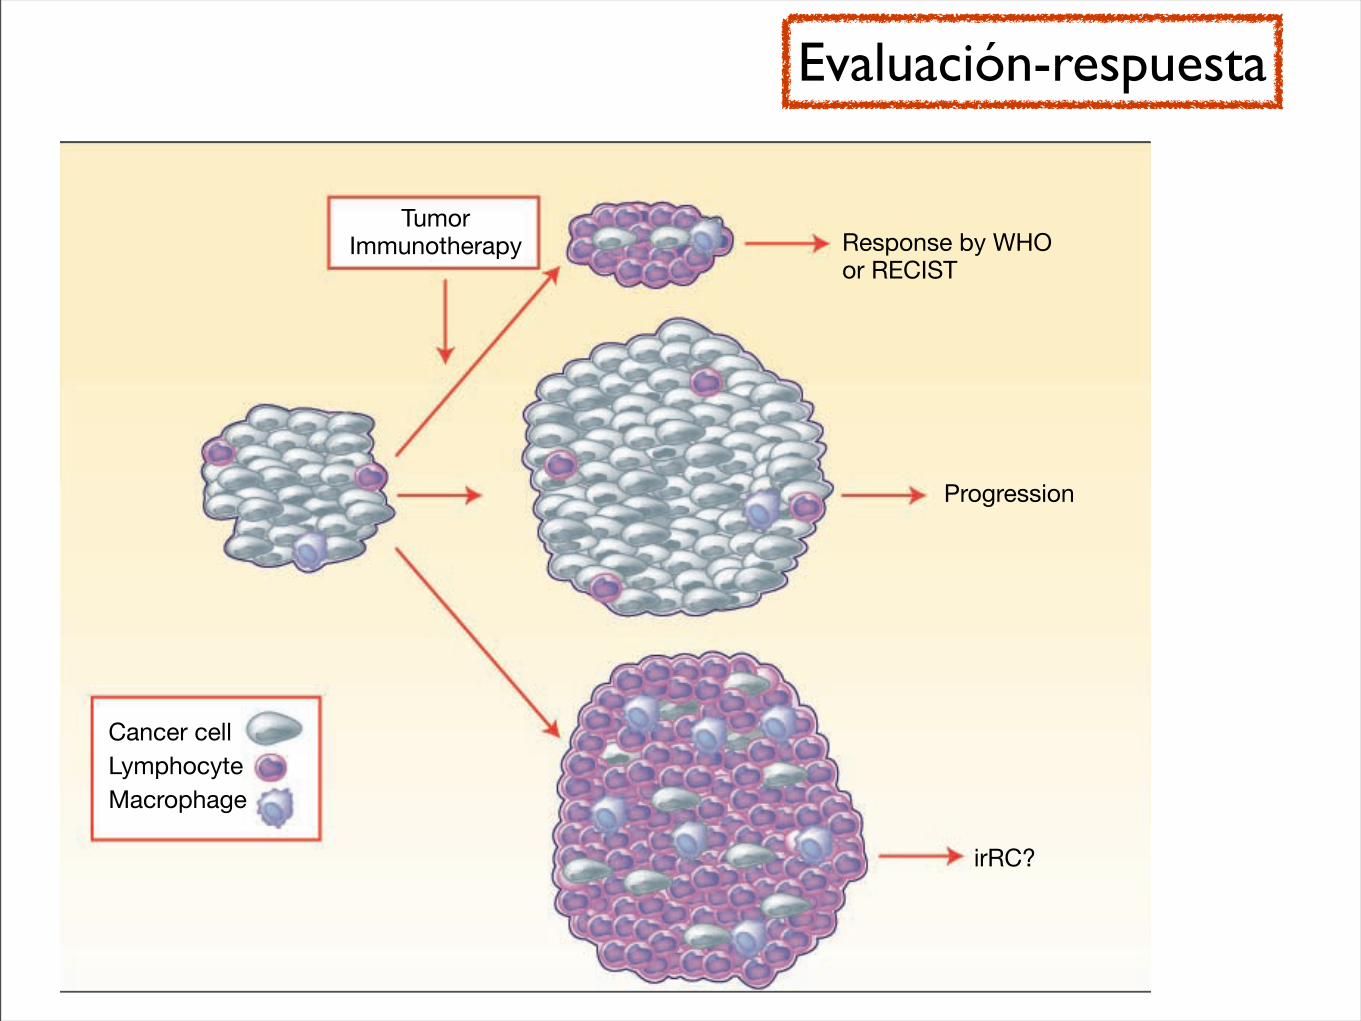
category, although the experimental drug had no effect on thetrajectory of their cancer.The benefit of using a response assessment that correctly
captures patients who benefit from tumor immunotherapythat are missed with RECIST or WHO measurements is im-portant to avoid underestimating the antitumor activity of tu-mor immunotherapy agents, and it would allow patients whobenefit from the intervention to continue on it and not beshifted to another form of therapy. However, this view needsto be counterbalanced by the opposing scenario, where a newset of response criteria wrongly applied to patients receivingtumor immunotherapy may overestimate its benefits andkeep patients in futile (or even worse potentially toxic) ther-apy and withhold the possibility of starting another activetherapy.What would other options be? Some studies have added du-
rable stable disease to partial response and complete responseto define a clinical benefit rate, but in single-arm studies it isdifficult to conclusively determine that disease stabilization isa direct effect of the experimental agent. Defining the best over-all response on study attempts to avoid labeling prematurely theoutcome as progressive disease in patients whose tumors initial-ly grew but eventually decreased in size. It would be the bestoption to perform histological examination of lesions that qual-ify as progressive disease and see if the increase in size is causedby an inflammatory infiltrate (Fig. 1). However, this is unlikelyto be feasible outside pilot experiences. A major hallmark of tu-mor immunotherapy is a reproducible rate of long-term remis-sions, which led to the Food and Drug Administration approvalof high-dose interleukin-2 for renal cell carcinoma and melano-ma based on single-arm studies even though the frequency ofthis event is very low (8). Therefore, an option would be to pro-
spectively define a delayed time point for objective response cri-tieria that would go beyond the poorly characterized earlydisease progression or appearance of new lesions of unknownsignificance. Using this approach, a landmark analysis of re-sponses by RECIST or WHO at 6 or 12 months for patientswho continue on therapy may allow bypassing the need for aseparate set of response criteria for tumor immunotherapy.However, this approach would leave patients and physicianswith little guidance for a significant amount of time and maynot be feasible for application in cancers with median survivalof months.In conclusion, the definition proposed by Wolchok et al. of
the irRC is a step in the right direction to evaluate the benefitof tumor immunotherapy strategies. The value of irRC canonly be fully assessed when it is prospectively validated in arandomized clinical trial including the application of the sameresponse definitions to an adequately sized concurrent controlarm. As discussed by the authors, an ongoing randomizedclinical trial comparing an experimental arm of the anti-CTLA4 antibody ipilimumab given together with dacarbazineto a control arm of dacarbazine alone may provide the pro-spective validation for the proposed irRC. Until then, investi-gators conducting single-arm tumor immunotherapy clinicaltrials will have a hard time convincing the scientific commu-nity that tumor immunotherapy can use a separate set of tu-mor response criteria.
Disclosure of Potential Conflicts of Interest
A. Ribas, commercial research grants and honoraria, Pfizer, Inc. J.A.Glaspy, speaker's bureau/honoraria, Pfizer, Inc.
Fig. 1. Metastatic cancer lesions aremade up mainly of cancer cells andstromal cells, with a very limitedimmune and inflammatory infiltrate bylymphocytes and macrophages. Afterreceiving tumor immunotherapy, thesize of metastatic lesions may decreasein the few patients that have anobjective response, with the tumorbeing invaded by lymphocytes andlater by macrophages; these tumorresponses are well captured by theWHO and RECIST criteria. Metastatictumor lesions will increase in size incases where the tumor growsprogressively, leading to diseaseprogression. However, in some cases,the tumor lesions may becomeheavily infiltrated by immune andinflammatory cells resulting in anapparent increase in size of lesions, butthis is due to infiltration by tumorimmunotherapy–recruited cells asopposed to a progressive growth ofcancer cells. In this case, the lesionwould qualify as progressive disease byWHO or RECIST criteria, but as aresponder following the newlyproposed irRC.
7117 Clin Cancer Res 2009;15(23) December 1, 2009www.aacrjournals.org
Immune Response Criteria for Tumor Immunotherapy?
American Association for Cancer Research Copyright © 2009 on May 1, 2012clincancerres.aacrjournals.orgDownloaded from
Published OnlineFirst November 24, 2009; DOI:10.1158/1078-0432.CCR-09-2376
Evaluación-respuesta
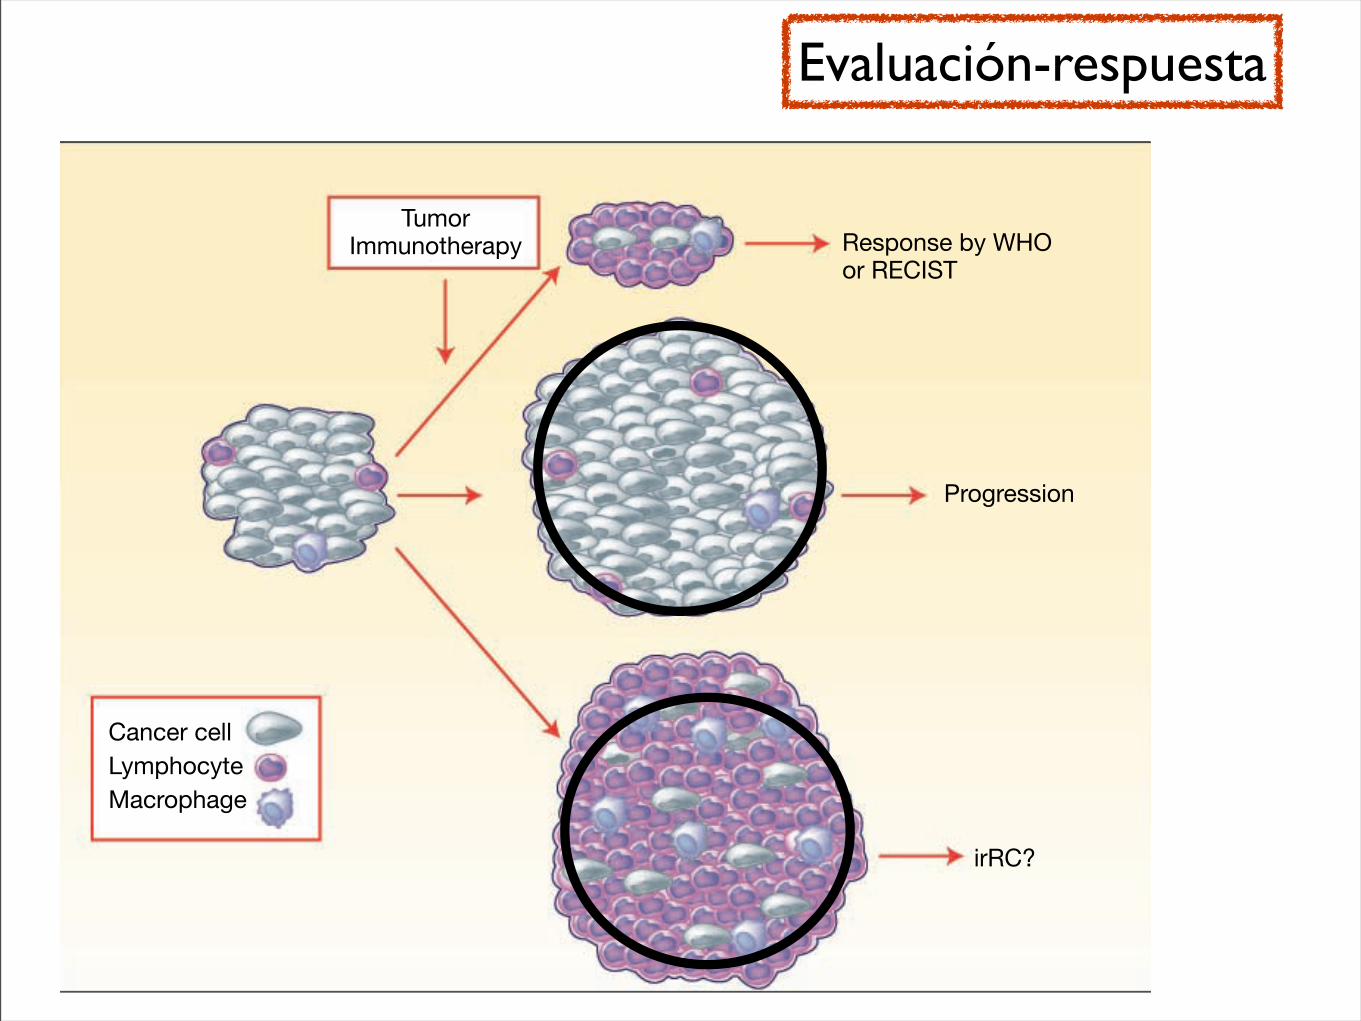
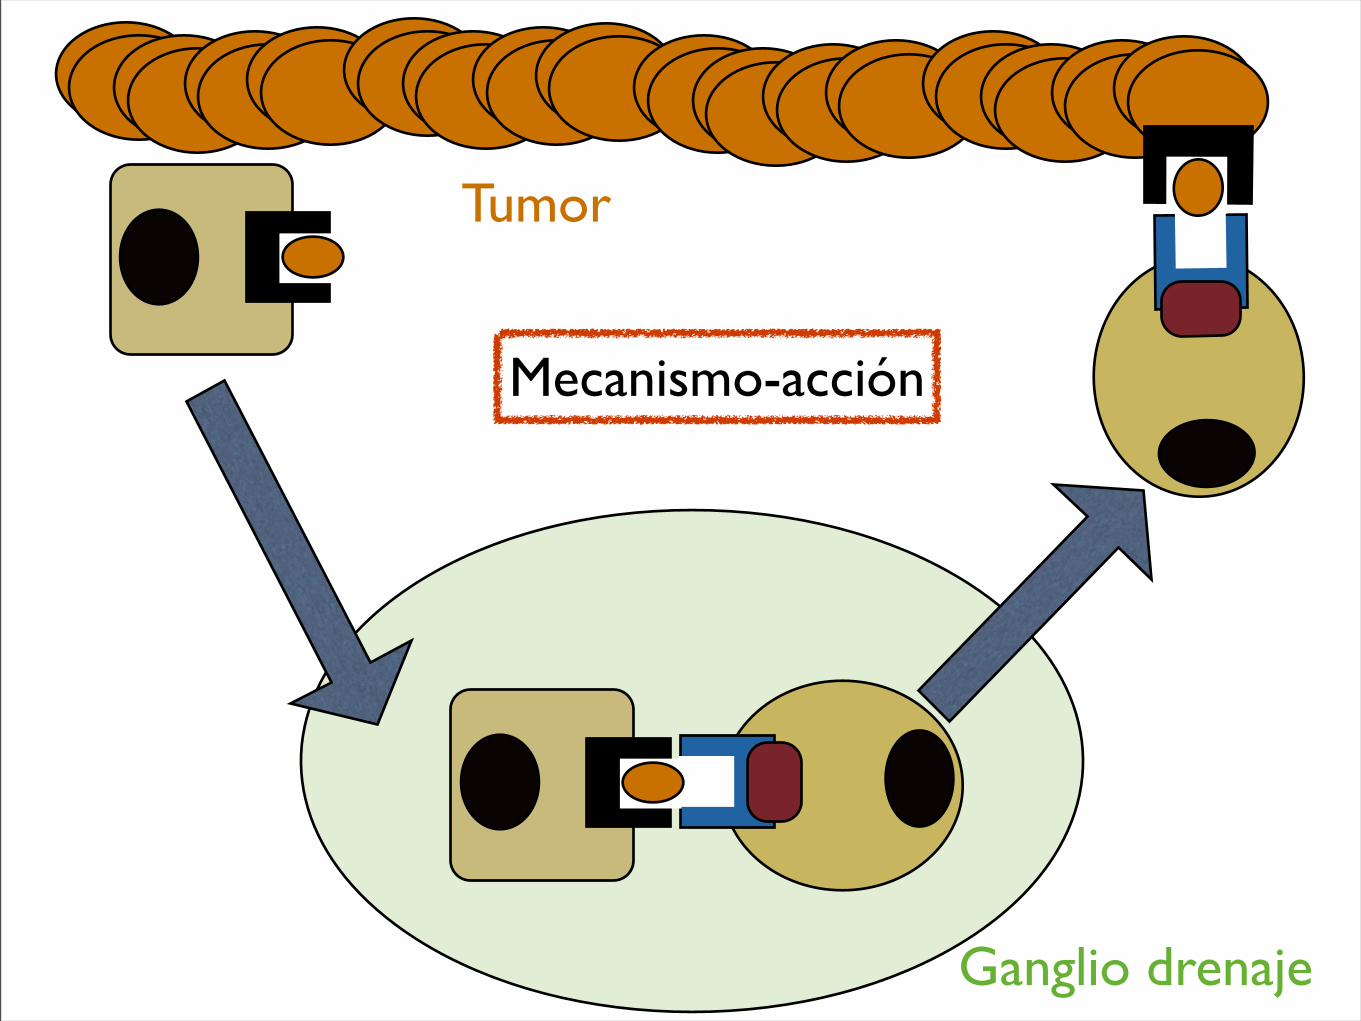
Tumor
Ganglio drenaje
Mecanismo-acción

Muchas gracias