clase 1 pnb2
85
PROCEDIMIENTOS BIOTECNOLÓGICOS AVANZADOS II Unidad 1: Introducción . Metabolómica Dr Marcelo Garcés Cea
Transcript of clase 1 pnb2

PROCEDIMIENTOS BIOTECNOLÓGICOS AVANZADOS II
Unidad 1: Introducción . Metabolómica
Dr Marcelo Garcés Cea

1. Organización del curso
2. Introducción a PBAII
3. Metabolómica

Organización del curso
• Programa
• Calendario de actividades

Evaluaciones
• 1 seminario básico
• 1 seminario paper
• 1 proyecto de investigación
• 2 pruebas
• Test de laboratorio


Dogma central de la Biología Molecular
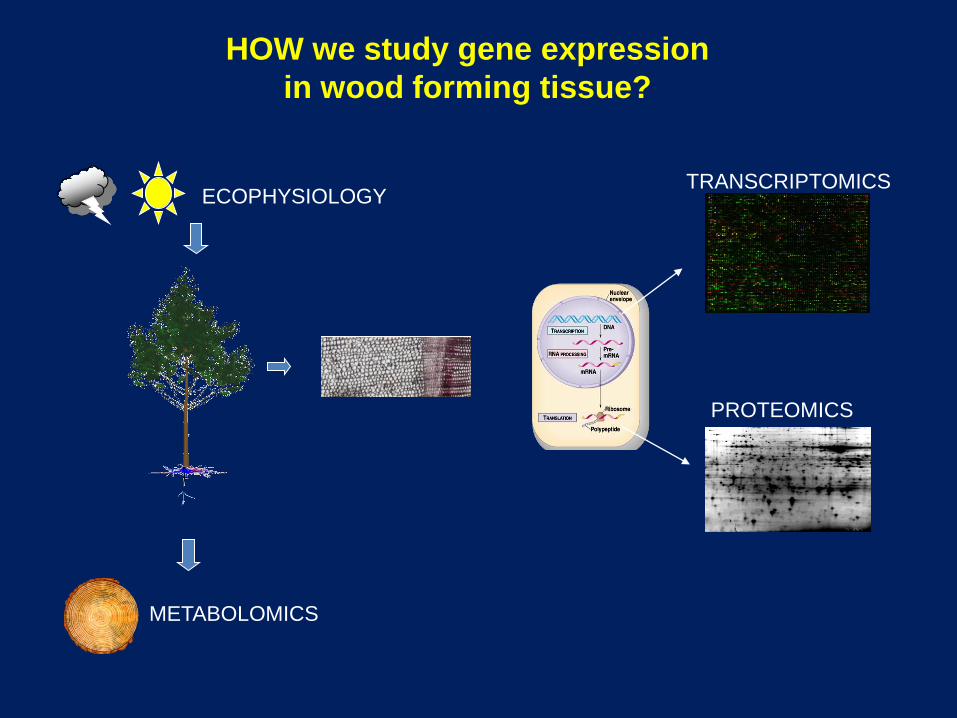
ECOPHYSIOLOGY
METABOLOMICS
TRANSCRIPTOMICS
PROTEOMICS
HOW we study gene expression
in wood forming tissue?
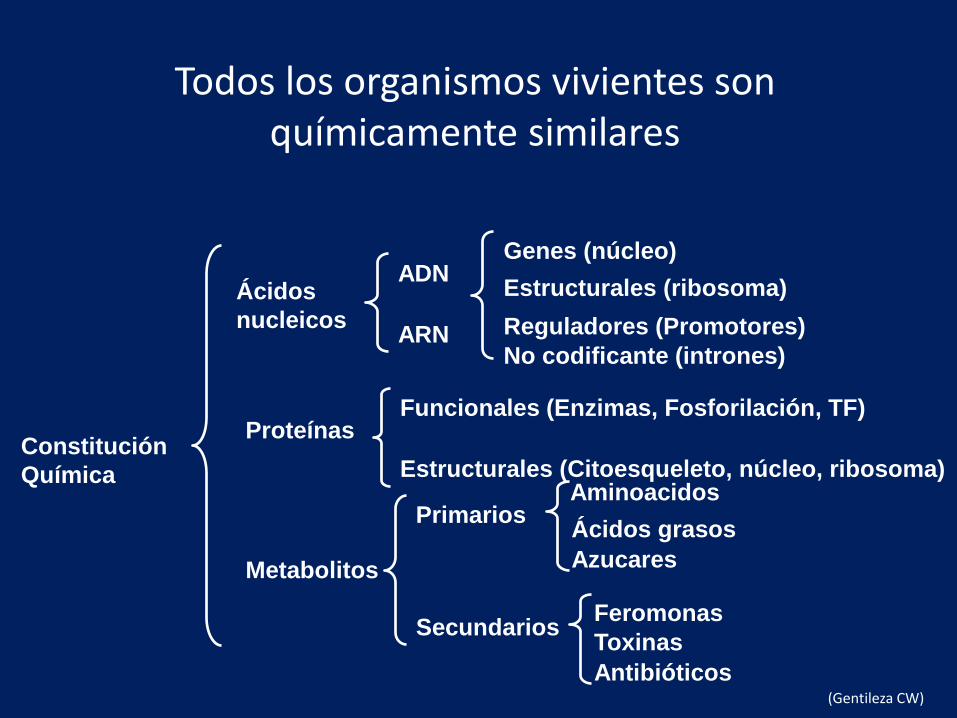
Constitución
Química
Ácidos
nucleicos
Proteínas
Metabolitos
ADN
ARN
Funcionales (Enzimas, Fosforilación, TF)
Estructurales (Citoesqueleto, núcleo, ribosoma)
Primarios
Secundarios
Genes (núcleo)
Estructurales (ribosoma)
Reguladores (Promotores)
No codificante (intrones)
Aminoacidos
Ácidos grasos
Azucares
Toxinas
Antibióticos
Feromonas
(Gentileza CW)
Todos los organismos vivientes son químicamente similares

Unidad 1. Metabolómica
Unidad 2 : Transcriptómica
Unidad 3: Proteómica
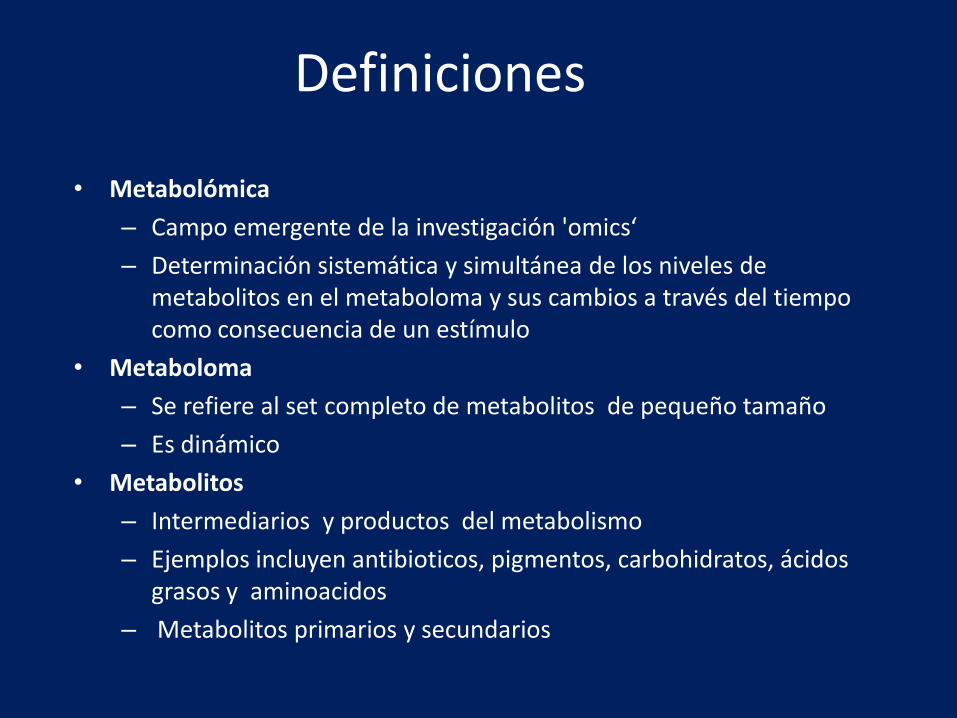
Definiciones
• Metabolómica
– Campo emergente de la investigación 'omics‘
– Determinación sistemática y simultánea de los niveles de metabolitos en el metaboloma y sus cambios a través del tiempocomo consecuencia de un estímulo
• Metaboloma
– Se refiere al set completo de metabolitos de pequeño tamaño
– Es dinámico
• Metabolitos
– Intermediarios y productos del metabolismo
– Ejemplos incluyen antibioticos, pigmentos, carbohidratos, ácidosgrasos y aminoacidos
– Metabolitos primarios y secundarios

• Metabolito primario:
Esta directamente involucrado en crecimiento normal, desarrollo y reproducción
• Metabolito secundario
Compuestos orgánicos no involucrados en los procesos anteriormente descritos, su ausencia no significa la inmediata muerte celular, pero si una disminución de la sobrevivencia, fecundidad, estética o quizás no surta ningún efecto. Frecuentemente los metabolitos secundarios tienen un rol en defensa de las plantas en contra de herbívoros y otras defensas interespecies

Categorías de los metabolitos secundarios
• Alcaloides
• Terpenoides
• Glucósidos
• Fenólicos
• Fenazinas
• Péptidos no ribosomales

Historia de la metabolómica
• El primer paper se tituló, “Quantitative Analysis of Urine Vapor and Breath by Gas-Liquid Partition Chromatography”, by Robinson and Pauling in 1971.
• El nombre metabolómica fue utilizado por primera vez en : Oliver, S. G., Winson, M. K., Kell, D. B. & Baganz, F. (1998). Systematic functionalanalysis of the yeast genome.
• Muchos de los métodos bioanalíticos utilizados en metabolomica han sido adaptados (o en algunos casos simplemente aplicados) desde métodos bioquímicos existentes.
• El proyecto del Metaboloma Humano – originó el primer borrador en el 2007.

Criterios de selección de método de análisis de metabolitos
• Analito (metabolito)
- Estabilidad a temperaturas
- Volatilidad (sublimación)
- Peso molecular del compuesto
- Polaridad del compuesto
- Derivatización para detección

Recolección de datos
• Cuatro puntos principales en el análisis de datos metabolómicos:
– Eficiente y exacto
– Separación de analitos
– Detección
– Identificación y cuantificación

Colección y tratamiento de tejido
• Se debe realizar en condiciones que aseguren la estabilidad de los metabolitos
• Muestras , liquidas, solidas, gaseosas
• Guardadas en condiciones de temperatura,luz, humedad
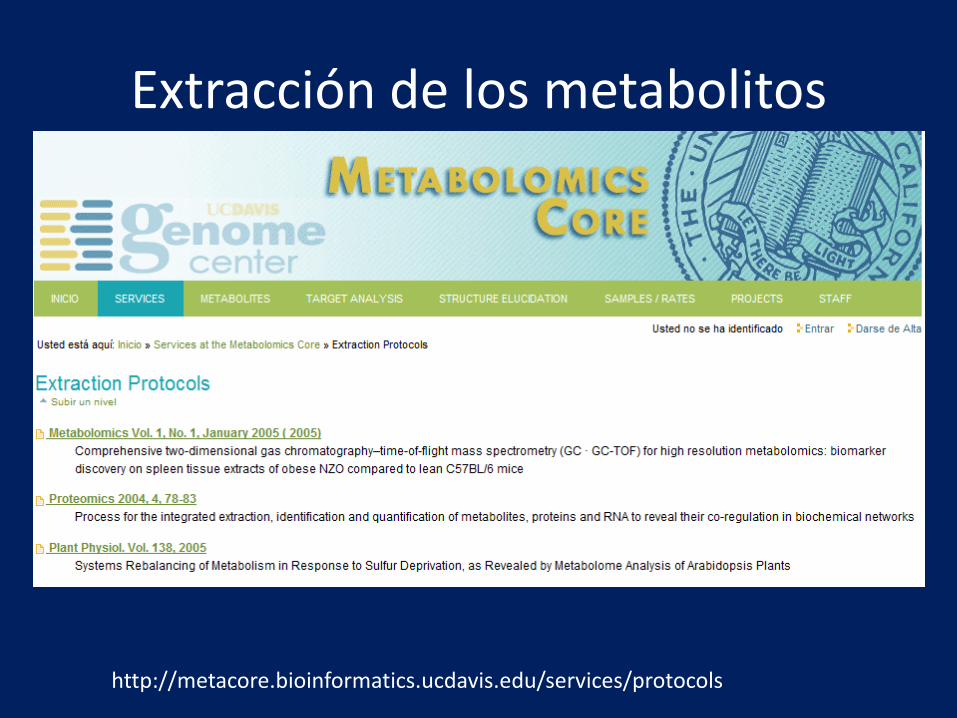
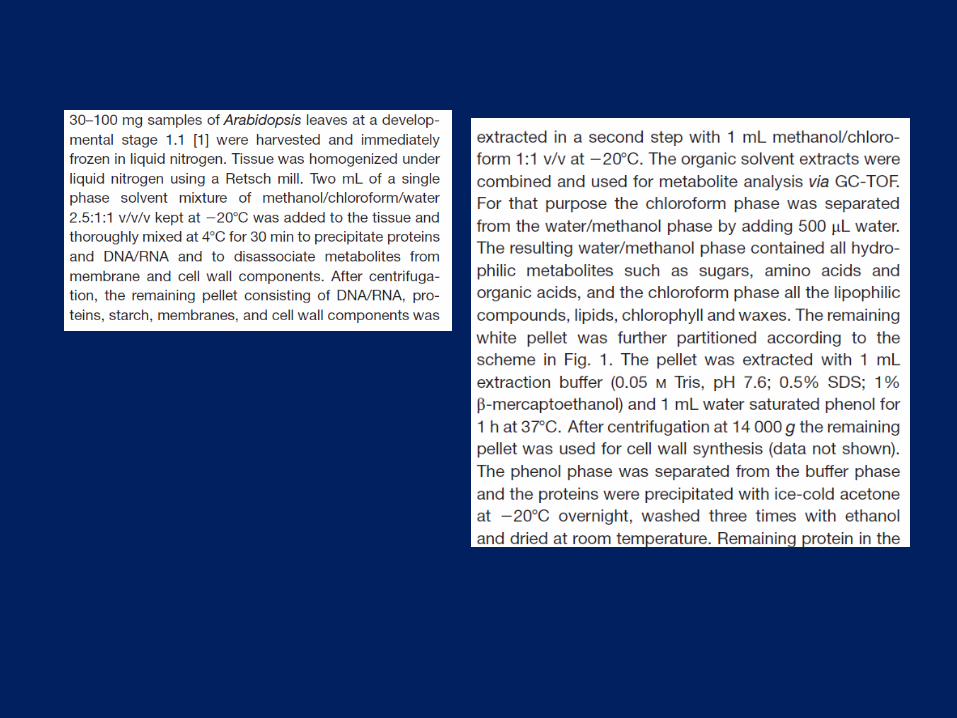
Extracción de los metabolitos
http://metacore.bioinformatics.ucdavis.edu/services/protocols


Recolección de datos
• Técnicas de Separación– Cromatografia de Gas (GC)
– Electroforesis Capilar (CE)
– High Performance Liquid Chromatography (HPLC)
– Ultra Performance Liquid Chromatography (UPLC)
• Combinación de Técnicas– GC-MS
– HPLC-MS
• Técnicas de Detección– Nuclear Magnetic Resonance Spectroscopy (NMR)
– Mass Spectrometry (MS)
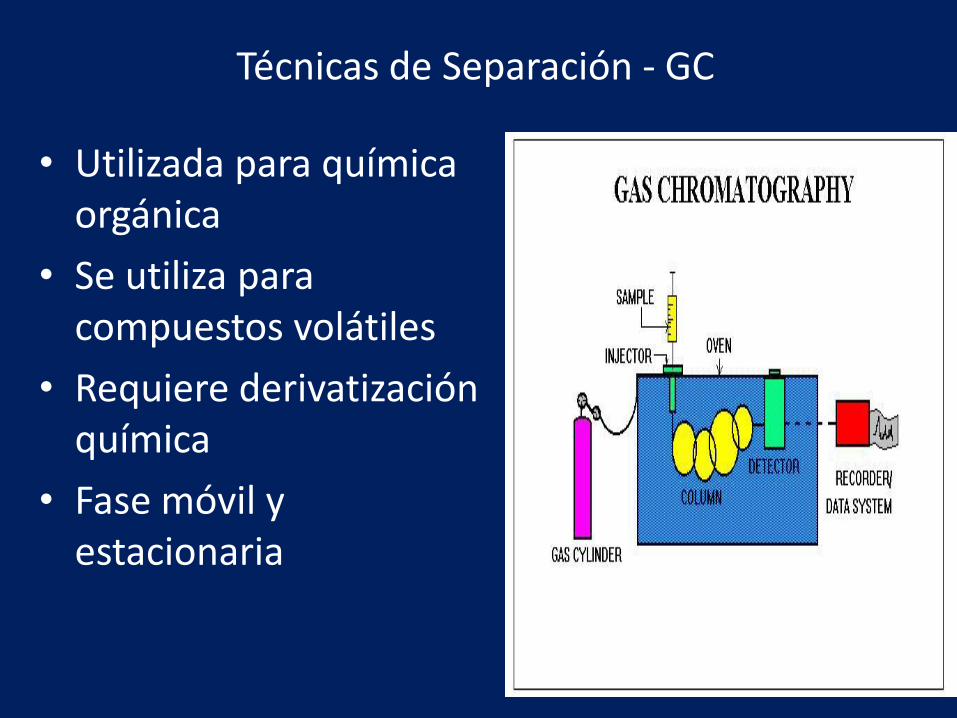
Técnicas de Separación - GC
• Utilizada para química orgánica
• Se utiliza para compuestos volátiles
• Requiere derivatizaciónquímica
• Fase móvil y estacionaria
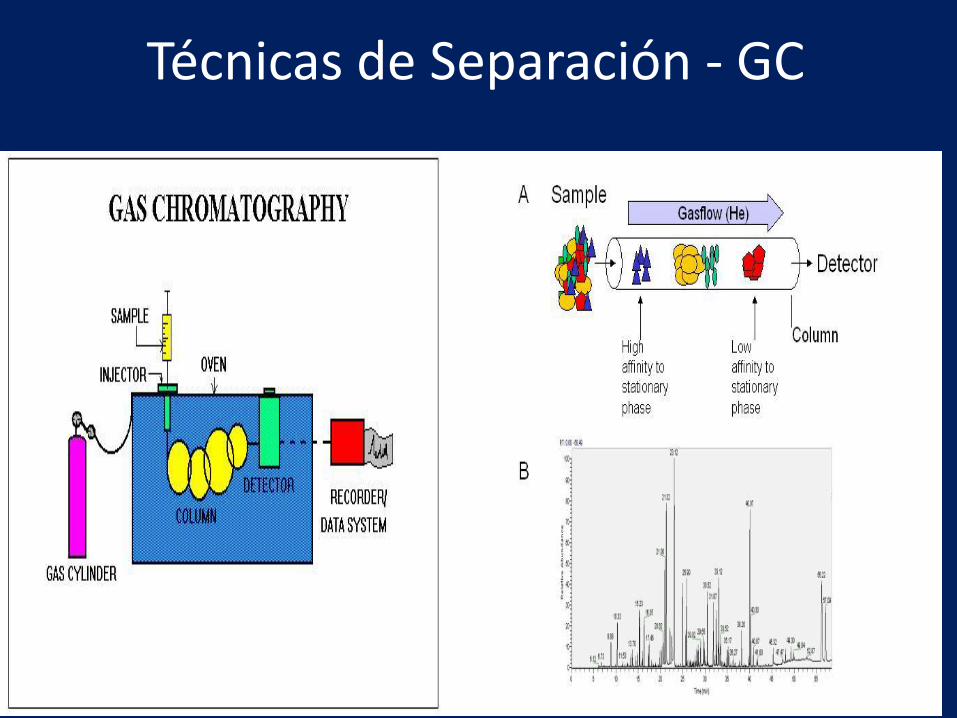
Técnicas de Separación - GC

Técnicas de Separación - HPLC• Bioquímica y química analítica
• Se utiliza para compuestos no volátiles
• Amplio rango de analitos
•Fase mobil y estacionaria•Tiempo de retención

HPLC comparado con UPLC
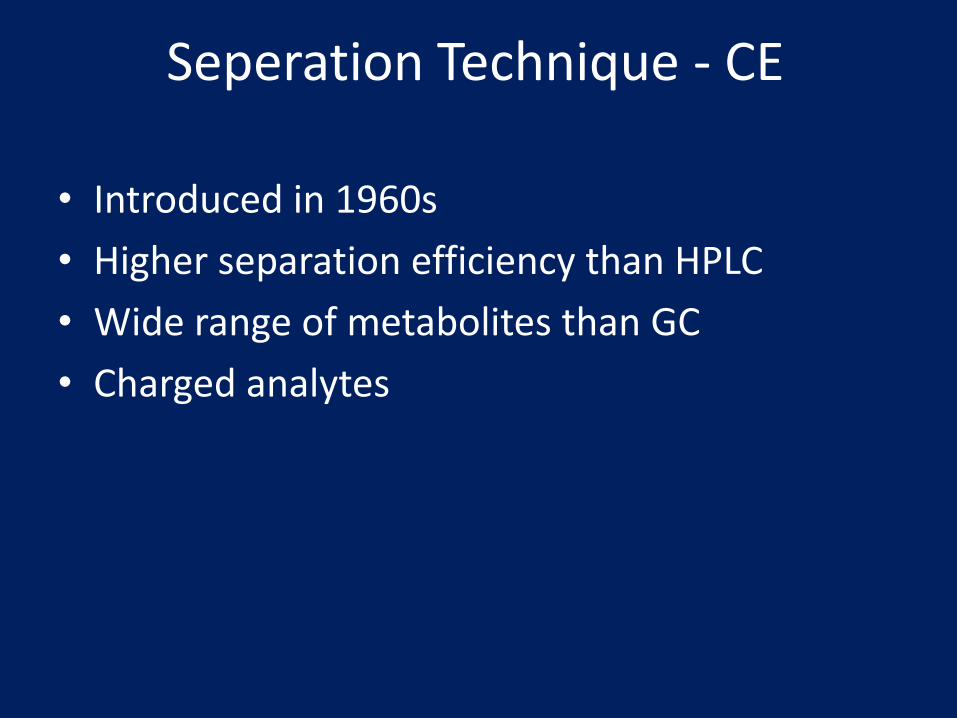
Seperation Technique - CE
• Introduced in 1960s
• Higher separation efficiency than HPLC
• Wide range of metabolites than GC
• Charged analytes

Detection Technique - NMRS
• Doesn't depend on separation
• Relatively insensitive
• NMR spectra difficult for interpretation
• Applicable in MRI

NMR Experiment
• A current through (green)
• generates a strong magnetic field
• polarizes the nuclei in the sample material (red).
• It is surrounded by the r.f. coil (black)
• delivers the computer generated r.f. tunes that initiate the nuclear quantum dance.
• At some point in time, the switch is turned and now the dance is recorded through the voltage it induces.
• the NMR signal, in the r.f. coil.
• The signals Fourier transform (FT) shows "lines" for different nuclei in different electronic environments.
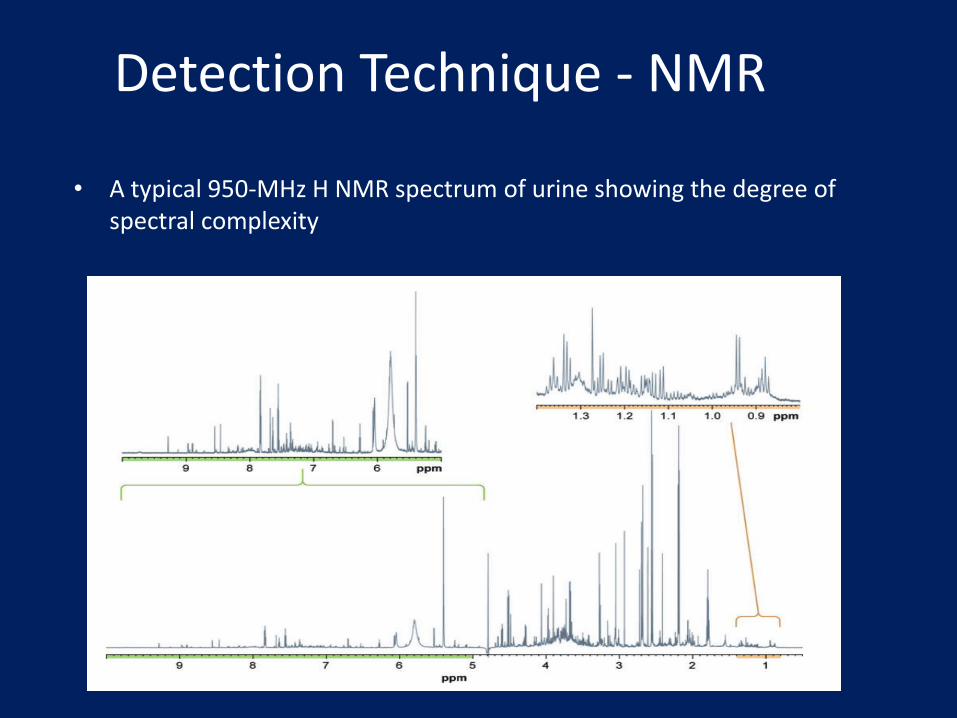
Detection Technique - NMR
• A typical 950-MHz H NMR spectrum of urine showing the degree of spectral complexity

Detection Technique - MS
• To identify and to quantify metabolites
• Serves to both separate and to detect
• Mass to charge ratios
• Using electron beam
• Ion source, mass analyzer and detector


Separación cromatogría en dos dimensiones de péptidos

3) Biochemical analysis
- Samples : leaves ( Control and -S plants under low and high light conditions)- Time periods: 0, 1, 2, 3, 4, 6 days
- Strategy
Harvest of leaf samples
+S/-S conditions
GC/MSHPLC
aminoacidsGSHCys Chlorophyll
quantification
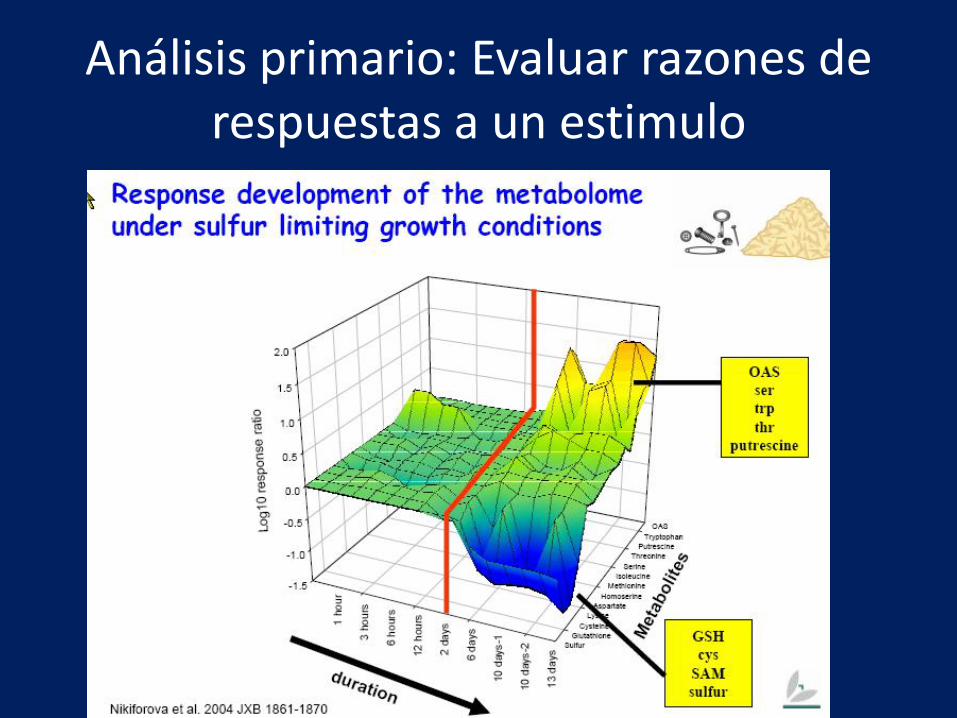
Changes in the metabolic composition in early timesof sulfur deficiency under low and high light conditions
Comparative metabolite analysis obtained in sink or source leaves in C. sativus under sulfur deficiency

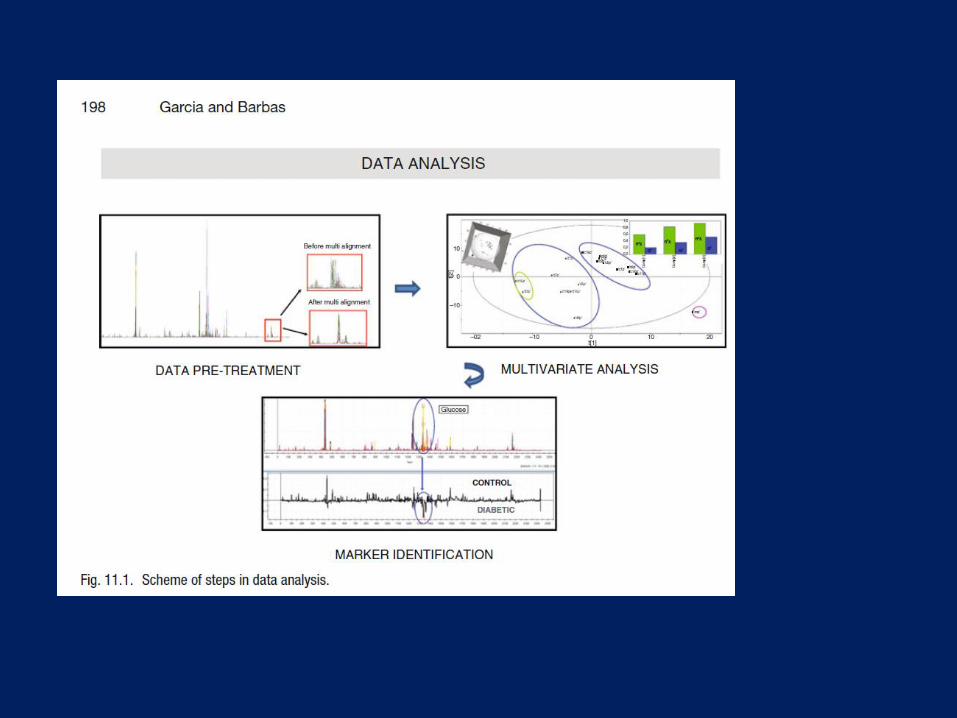
Evaluación de datos
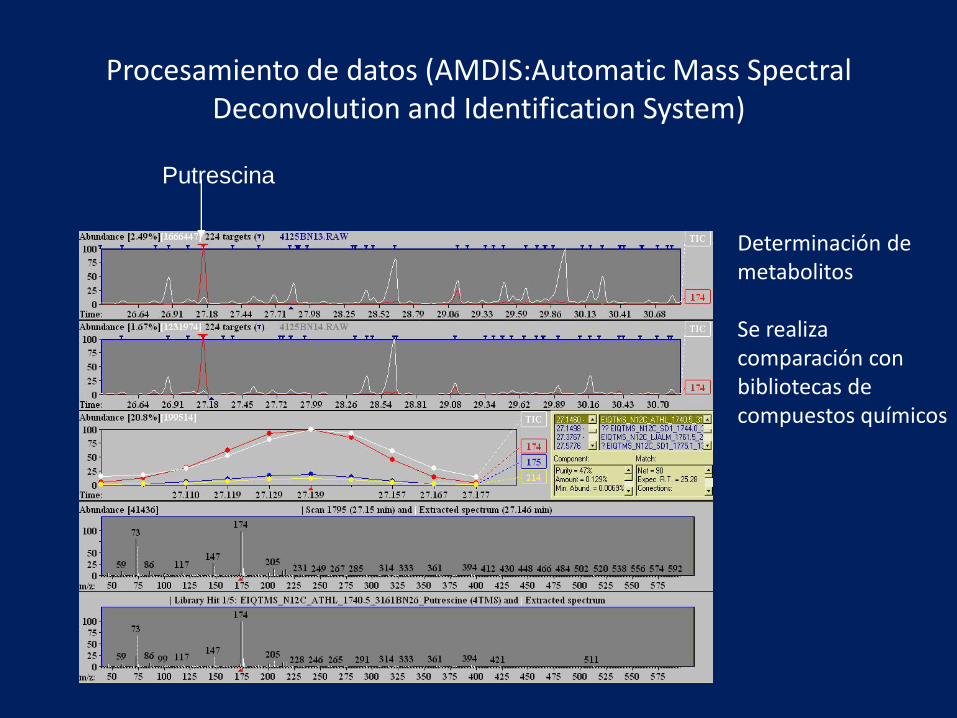
Putrescina
Procesamiento de datos (AMDIS:Automatic Mass Spectral Deconvolution and Identification System)
Determinación de metabolitos
Se realiza comparación con bibliotecas de compuestos químicos
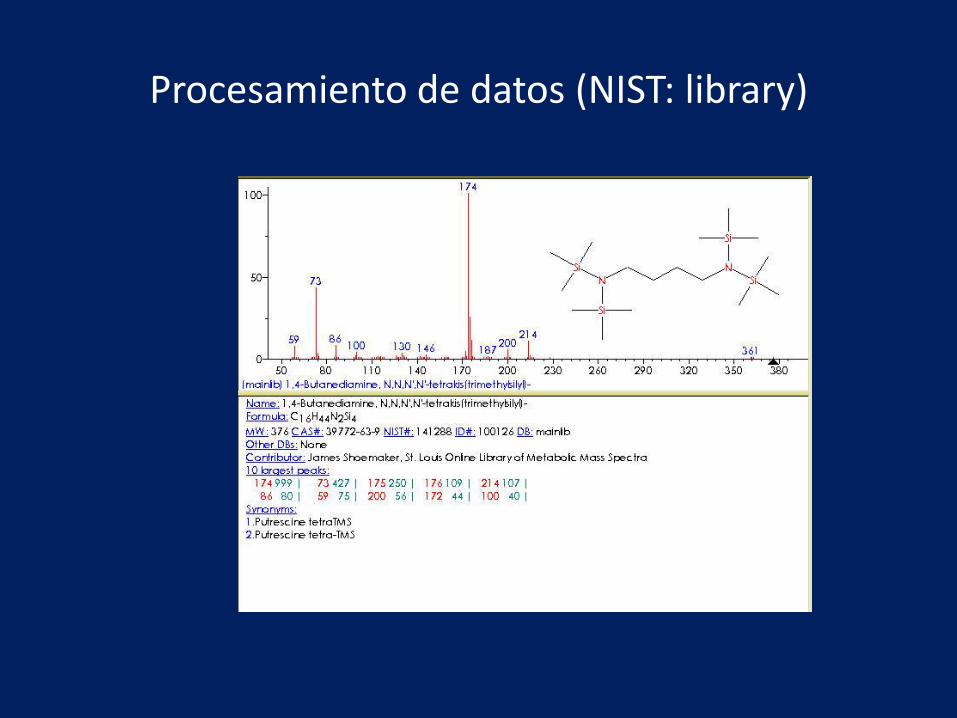
Procesamiento de datos (NIST: library)

Putrescina (M/Z=174)
Control
Deficiencia
Nutricional
Control
Deficiencia
Nutricional

Procesamiento de datos
Evaluación cuantitativaDe datos observados en cromatogramas.
Se realiza deconvolución de los cromatogramas para establecer el área debajo de los picos
Evaluación cuantitativa
Interpretación fisiológica
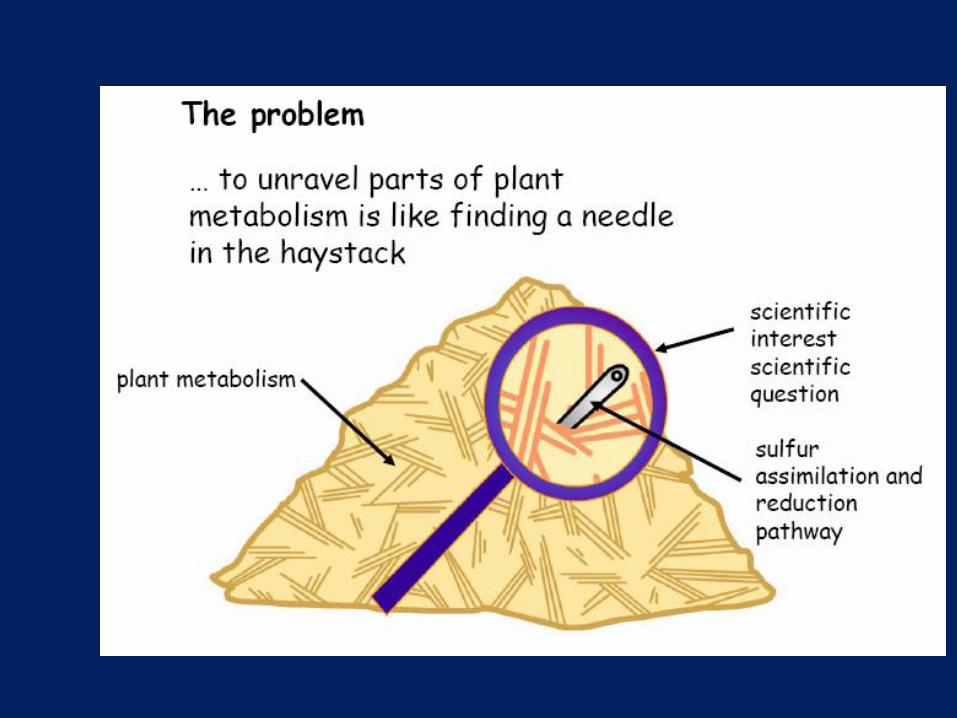
Problema:
Se deben evaluar cerca de 10.000 datos por muestra

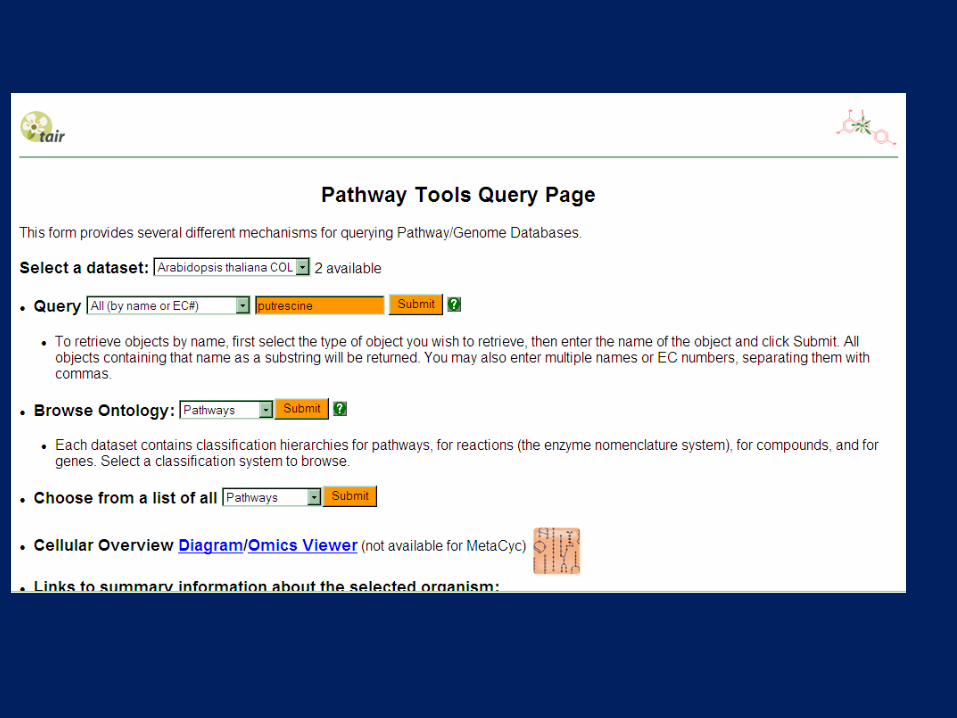
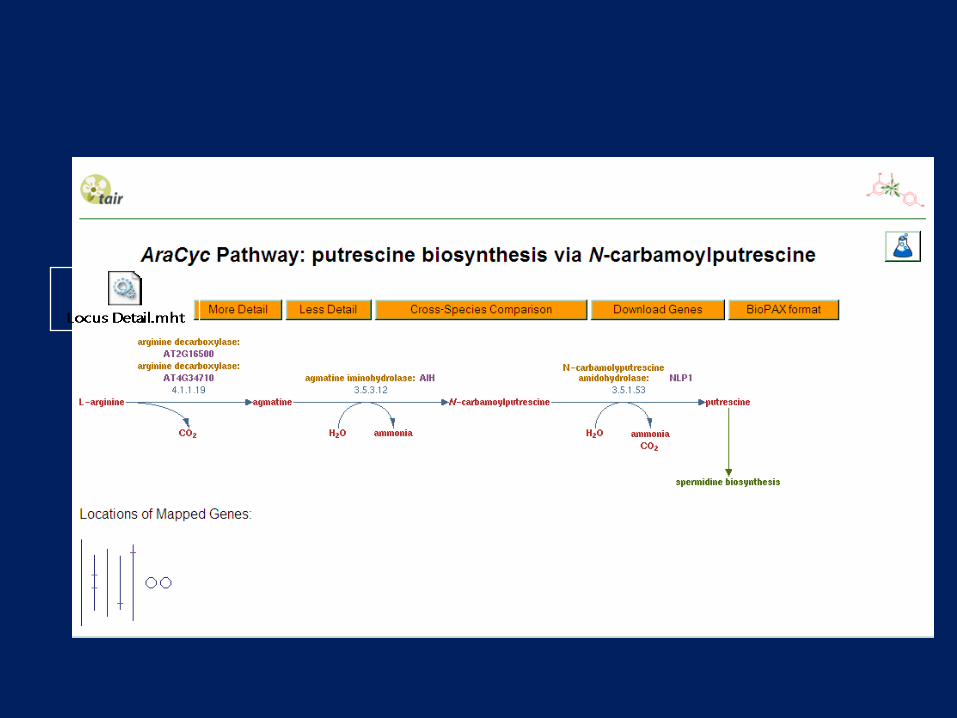
Análisis informático (Ara cyc)


Determinación de fenotipos metabólicos

¡Cómo interpretamos los datos!
Los resultados de microarre-glos,
proteomica y metabolo-mica permiten tener un gran pool de datos
Microarreglos= cerca de 22.000
Proteomica= cerca de 5.000
Metabolomica= 20.000
El gran problema es cómo organizamos estos datos

Tenemos un nuevo desafío
Establecer las interacciones de genes, proteínas y metabolitos en la célula.
¿Pero cómo?

Tipos de genómica
Genómica
Estructural
Funcional
Secuenciación (DNA fragmentado y cDNA)
Comparativa
Transcriptomica (RNA)
Proteómica (Proteínas)
Metabolómica (metabolitos)
Funciones de los genes
A nivel fisiológico celular
En distintas especies
Construcción de mapas genéticos
Informática (Recopilación de información y organización)


Análisis primario: Evaluar razones de respuestas a un estimulo
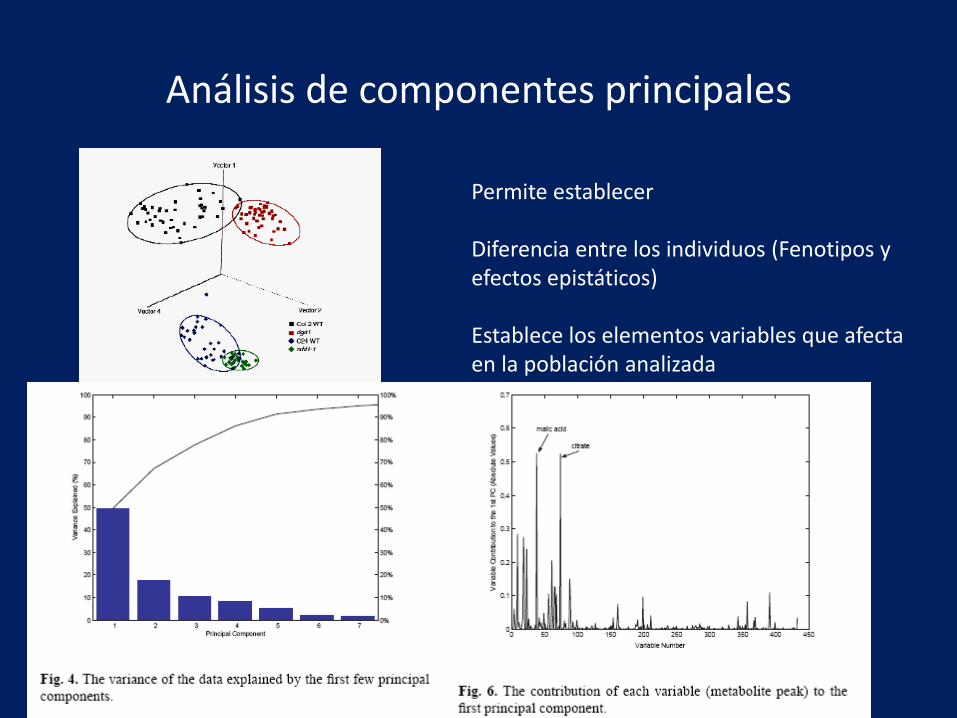
Análisis de componentes principales
Permite establecer
Diferencia entre los individuos (Fenotipos y efectos epistáticos)
Establece los elementos variables que afecta en la población analizada

HCA otra forma de clasificar los individuos

Análisis de redes (¿Sociología en la bioquímica?)
La base de este tipo de análisis consiste en evaluar la diferentes correlaciones que existen entre las variables estudiadas

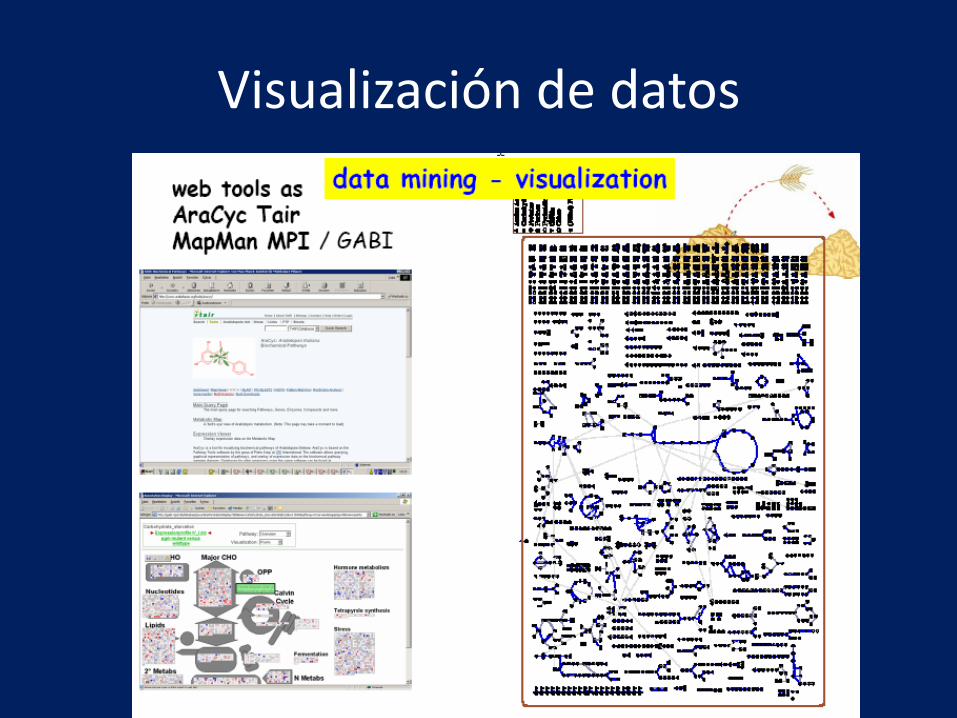
Visualización de datos

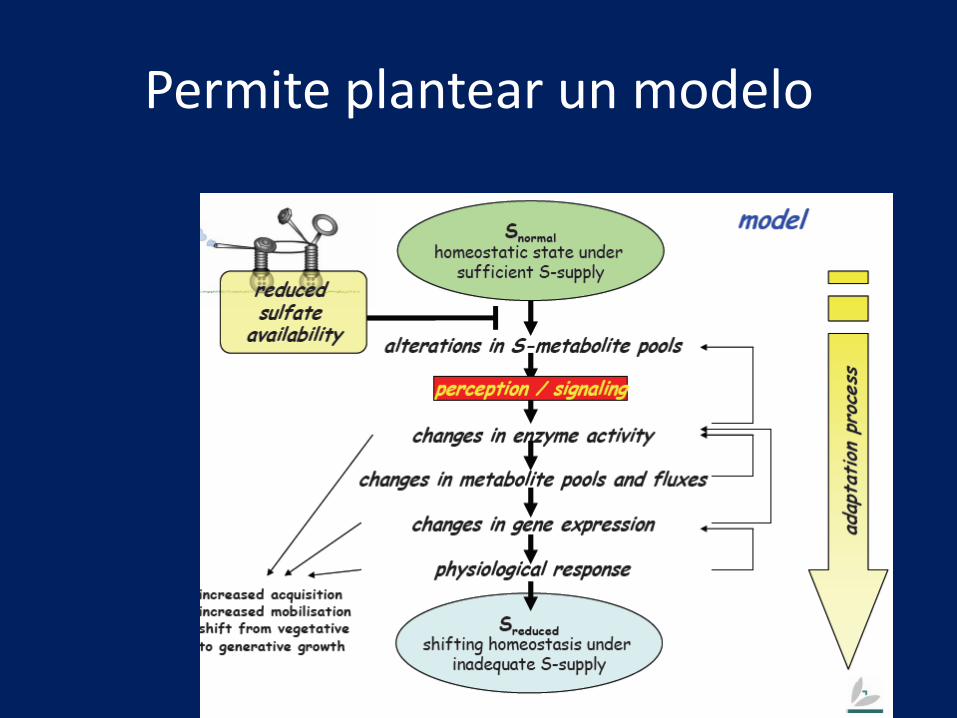
Permite plantear un modelo

Data analysis and interpretation
• Data collected represented in a matrix
• Chemometric Approach
– Principle Component Analysis (PCA)
– Soft Independent Modeling of Class Analogy (SIMCA)
– Partial Least-Squares (PLS)Method by Projections to Latent Structures
– Orthogonal PLS (OPLS)
• Targeted Profiling

PCA• Unsupervised
• Multivariate analysis based on projection methods
• Main tool used in chemometrics
• Extract and display the systematic variation in the data
• Each Principle Component (PC) is a linear combination of theoriginal data parameters
• Each successive PC explains the maximum amount of variancepossible, not accounted for by the previous PCs
• PCs Orthogonal to each other
• Conversion of original data leads to two matrices, known asscores and loadings
• The scores(T) represent a low-dimensional plane that closelyapproximates X. Linear combinations of the original variables.Each point represents a single sample spectrum.
• A loading plot/scatter plot(P) shows the influence (weight) of theindividual X-variables in the model. Each point represents adifferent spectral intensity.
• The part of X that is not explained by the model forms theresiduals(E)
• X = TPT = t1p1T + t2p2
T + ... + E
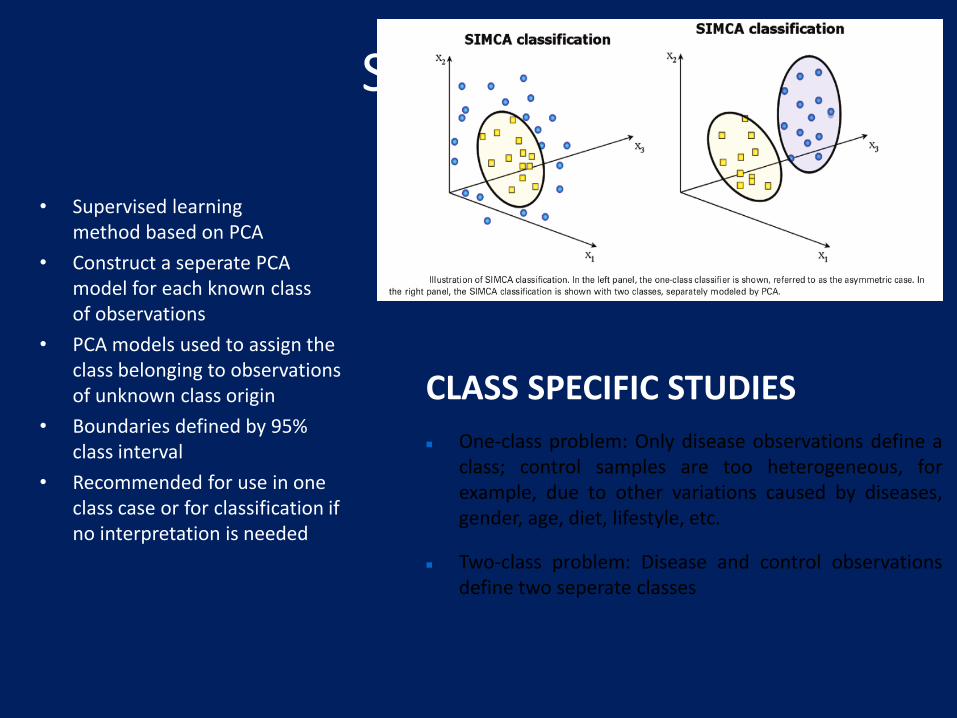
SIMCA
• Supervised learning method based on PCA
• Construct a seperate PCA model for each known class of observations
• PCA models used to assign the class belonging to observations of unknown class origin
• Boundaries defined by 95% class interval
• Recommended for use in one class case or for classification if no interpretation is needed
CLASS SPECIFIC STUDIES
One-class problem: Only disease observations define aclass; control samples are too heterogeneous, forexample, due to other variations caused by diseases,gender, age, diet, lifestyle, etc.
Two-class problem: Disease and control observationsdefine two seperate classes
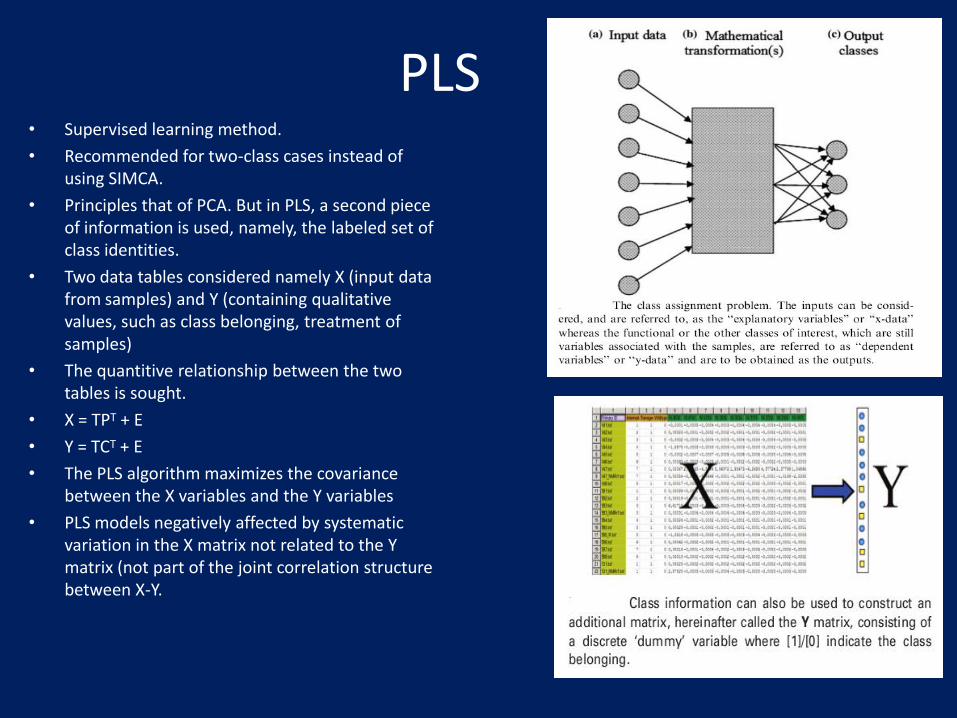
PLS• Supervised learning method.
• Recommended for two-class cases instead of using SIMCA.
• Principles that of PCA. But in PLS, a second piece of information is used, namely, the labeled set of class identities.
• Two data tables considered namely X (input data from samples) and Y (containing qualitative values, such as class belonging, treatment of samples)
• The quantitive relationship between the two tables is sought.
• X = TPT + E
• Y = TCT + E
• The PLS algorithm maximizes the covariance between the X variables and the Y variables
• PLS models negatively affected by systematic variation in the X matrix not related to the Y matrix (not part of the joint correlation structure between X-Y.

OPLS
• OPLS method is a recent modification of the PLS method to help overcome pitfalls
• Main idea to seperate systematic variation in X into two parts, one linearly related to Y and one unrelated (orthogonal).
• Comprises two modeled variations, the Y-predictive (TpP
pT) and the Y-orthogonal (T
oP
oT) compononents.
• Only Y-predictive variation used for modeling of Y.
• X = TpP
pT + T
oP
oT + E
• Y = TpC
pT + F
• E and F are the residual matrices of X and Y
• OPLS-DA compared to PLS-DA

Remarks on pattern classification
• Intent in using these classification techniques not to identify specific compound
• Classify in specific categories, conditions or disease status
• Traditional clinical chemistry depended on identifying and quantifying specific compounds
• Chemometric profiling interested in looking at all metabolites at once and making a phenotypic classification of diagnosis

Targeted profiling
• Targeted metabolomic profiling is fundamentally different than most chemometric approaches.
• In targeted metabolomic profiling the compounds in a given biofluid or tissue extract identified and quantified by comparing the spectrum of interest to a library of reference spectra of pure compounds.
• Key advantage: Does not require collection of identical sets = More amenable to human studies or studies that require less day-to-day monitoring.
• Disadvantage: Relatively limited size of most current spectral libraries = bias metabolite identification and interpretation.
• A growing trend towards combining the best features of both chemometric and targeted methods.

Databases
• Large amount of data
• Need for databases that can be easily searched
• Better databases will help in combining chemometric and targeted profiling methods
• Newly emerging databases
• HMDB good model for other databases
• Challenge of standardisation

Databases


Integration of metabolomics with other ‘omics’ fields
• Integrating genomics and metabolomics for engineering plant
metabolic pathways - Kirsi-Marja Oksman-Caldentey and Kazuki
Saito (2005)
• Proteomic and metabolomic analysis of cardioprotection:
Interplay between protein kinase C epsilon and delta in regulating
glucose metabolism of murine hearts
• Recent studies (2005) to integrate transcriptomics, proteomics
and metabolomics in an effort to enhance production efficiency
under stressful conditions of grapes.
• Nutrigenomics is a generalised term which links genomics,
transcriptomics, proteomics and metabolomics to human nutrition.

Main Applications
• Drug assessment
• Clinical toxicology
• Nutrigenomics
• Functional genomics

Examples of interesting research projects
• Metabolomics and its Application for non-invasive embryo assessment
• Nonivasive metabolomic profiling of embryo culture media using proton nuclear magnetic resonance correlates with reproductive potential of embryos in women undergoing in vitro fertilization
• Nonivasive metabolomic profiling of human embryo culture media using Raman spectroscopy predicts embryonic reproductive potential: a prospective blinded pilot study
• Metabolomic profiles delineate potential role for sarcosine in prostate cancer progression
• A Multivariate Screening Strategy for Investigating Metabolic Effects of Strenuous Physical Exercise in Human Serum

IVF

IVF
• Viability score calculated using (A) NIR and (B) Raman spectra of culture media are shown for embryos that implanted and lead to delivery (empty) and those that did not implant (shaded).

IVF• Result:
– Glutanate concentrations
– Viability indices
• Conclusion
• Correlation of metabolic profile of spent embryo culture media with reproductive potential of embryos
Future challenges and development
• Database
• Standardisation
• Diversity/variation of metabolomic data
– More efficient ways of identification
• Better models for interpretation of data
• Integration with other 'OMICS'

Bibliography
• Current Progress in computational metabolomics – David S.Wishart, 2007
• Metabonomics in pharmaceutical R & D – John C.Lindon, Elaine Holmes and Jeremy K.Nicholson
• Wikipedia – search on “Metabolomics”
• Metabolomics Basics : What is Metabolomics? - Thermo Scientific, www.thermo.com
• A metabolome pipeline : from concept to data to knowledge – Marie Brown, Warwick B.Dunn, David I.Ellis, Roystone Goodacre, Julia Handl, Joshua D.Knowles, Steve O'Hagan, Irena Spasic and Douglas B.Kell, 2004
• Integrative Genomics and Functional Explanation – Jo Davies, Thorunn Rafner, Garrett Hellenthal and Jotun Hein, 2009
• Chemometrics in Metabonomics – Johan Trygg, Elaine Holmes and Torbjorn Lundstedt
• Wikipedia – search on “Chromatography”
• Spectroscopic and Statistical Techniques for Information Recovery in Metabonomics and Metabolomics – John C.Lindon and Jeremy K.Nicholson
• Wikipedia – search on “NMR”
• Wikipedia – search on “Spectroscopy”
• SetupX: A public study design database for metabolomic projects – Scholz M, Fiehn O, 2007
• New bioinformatics resources for metabolomics – Markley JL, Anderson ME, Cui Q
• Non-Invasive Metabolic profiling of embryo culture media using proton nuclear magnetic resonance correlates with reproductive potential of embryos in women undergoing in vitro fertilization. - E. Seli, L.Botros, D.Sakkas, D. Burns
• Non-Invasive Metabolomic profiling of human embryo culture media using Raman spectroscopy predicts embryonic reproductive potential: a proospective blinded pilot study.- Scott R., et al.2008
• Metabolomic profiling by near -infrared spectroscopy as a tool to assess embryo viability: a novel, non-invasive method for embryo selection-Vergouw CG, Botros LL, Roos P, Lens JW, Schats R, Hompes PG, Burns DH, Lambalk CB