DESCONTAMINACIÓN DE MICOTOXINAS … · Micotoxinas emergentes de Fusarium ... humana y animal. El...
193
Departament de Medicina Preventiva i Salut Pública, Ciències de la Alimentació, Toxicología i Medicina Legal Programa de doctorado con mención hacia la excelencia en Ciencias de la Alimentación DESCONTAMINACIÓN DE MICOTOXINAS EMERGENTES MEDIANTE EL PROCESADO DE ALIMENTOS Tesis Doctoral Presentada por: María Roig Pérez Dirigida por: Dr. Jordi Mañes Vinuesa Dra. Emilia Ferrer García
Transcript of DESCONTAMINACIÓN DE MICOTOXINAS … · Micotoxinas emergentes de Fusarium ... humana y animal. El...

�
������� ��
Departament�de�Medicina�Preventiva�i�Salut�Pública,�Ciències�de�la�Alimentació,�Toxicología�i�Medicina�Legal�
�Programa�de�doctorado�con�mención�hacia�la�excelencia�en�Ciencias�de�la�
Alimentación����
DESCONTAMINACIÓN�DE�MICOTOXINAS�
EMERGENTES�MEDIANTE�EL�PROCESADO�DE�
ALIMENTOS�
��
Tesis�Doctoral���
Presentada�por:�María�Roig�Pérez�
��
Dirigida�por:�Dr.�Jordi�Mañes�Vinuesa�Dra.�Emilia�Ferrer�García�
� �
��
�

�
��
� �

! 1
Dra. Emilia Ferrer García, professora Titular de l’Àrea de
Toxicologia i Dr. Jordi Mañes Vinuesa, Catedràtic de l’Àrea de
Nutrició i Bromatologia del Departament de Medicina Preventiva i
Salut Pública, Ciències de l’Alimentació, Toxicologia i Medicina
Legal,
INFORMEN QUE:
Maria Roig Pérez, llicenciada en Veterinaria, ha realitzat baix la
nostra direcció el treball “DESCONTAMINACIÓ DE
MICOTOXINES EMERGENTS PER MITJÀ DEL PROCESSAT D’
ALIMENTS”, i autoritzem la seua presentació per optar al títol de
Doctor.
Perquè així conste, expedim i signem el present certificat en
Burjassot, València, a Octubre 2013
Dr. Jordi Mañes Vinuesa Dra. Emilia Ferrer García

! 2

! 3
La investigación realizada ha sido financiada por el Ministerio de
Ciencia e Innovación (AGL2010-17024).

! 4

! 5
ÍNDICE
RESUMEN 3 I . INTRODUCCIÓN 1. Introducción sobre micotoxinas 11 2. Micotoxinas emergentes de Fusarium 2.1. Definición 16 2.2. Toxicidad de BEA y ENs 19 2.3. Presencia de BEA y ENs en alimentos 21 3. Descontaminación de micotoxinas 25 3.1. Procesado y tratamientos térmicos 27 3.2. Tratamientos químicos 31 3.3. Descontaminación biológica 3.3.1. Degradación por agentes biológicos 32 3.3.2. Adsorción por agentes biológicos 38 4. Legislación 4.1. Límites máximos permitidos 41 4.2. Muestreo y análisis de micotoxinas 46 4.3. Descontaminación de las micotoxinas 47 I I . OBJETIVOS 53 I I I . PLAN DE TRABAJO 57 IV. MATERIAL, MÉTODOS, RESULTADOS Y DISCUSIÓN

! 6
1. Thermal processing effect on emerging Fusarium mycotoxins present in naturally contaminated rice samples of Spain. 1.1. Introduction 61 1.2. Materials and methods 1.2.1. Chemicals and agents 64 1.2.2. Sampling procedure 65 1.2.3. Thermic treatment of rice 66 1.2.4. Mycotoxin Extraction 66 1.2.5. Analysis 67 1.2.6. Approximation to the dietary exposure of BEA and ENs in rice 69 1.3. Results and discussion 1.3.1. Method validation 70 1.3.2. Occurrence of BEA and ENs in raw samples 73 1.3.3. Reduction of emerging mycotoxins in cooked samples 80 1.3.4. Approximation to the dietary exposure of ENS and BEA in rice 86
2. Reduction of the enniatins A, A1, B, B1 by an in vitro degradation employing different Saccharomyces and acid lactic bacteria strains: identification of degradation products by LC-MS/MS-LIT 2.1. Introduction 89 2.2. Materials and methods 2.2.1. Chemicals 91 2.2.2. Strains and methodology 2.2.3. ENs extraction from fermented mediums 94 2.2.4. ENs degradation in food system composed

! 7
by wheat flour 95 2.2.5. ENs extraction by wheat flour 95 2.2.6. LC-MS/MS analysis of ENs 96 2.2.7. Method performance 98 2.2.8. Determination of the ENs degradation products with LC-MS/MS-LIT 100 2.3. Results and discussion 2.3.1. ENs degradation by acid lactic bacteria and Saccharomyces strains in liquid medium 101 2.3.2.ENs degradation by probiotic strains in wheat flour 106 2.3.3. LC-MS/MS-LIT identification of the ENs degradation products 111 3. Detoxification of the bioactive compounds enniatins A, A1, B, B1 employing different strains of Bacil lus subtil is 3.1. Introduction 120 3.2. Material and methods 3.2.1. Chemicals 122 3.2.2. Strains and methodology 122 3.2.3. ENs and degradation products extraction from fermented mediums 123 123 3.2.4. LC-MS/MS analysis of ENs 124 3.2.5 Method performance 126 3.2.6. Determination of the ENs degradation products with LC-MS-LIT 128 128 3.3. Results and discussion 3.3.1 ENs degradation by Bacillus subtilis strains in NB medium 129 129 3.3.2. LC-MS-LIT characterization of the ENs degradation products 133 133

! 8
4. Antibacterial activity of the emerging Fusarium mycotoxins enniatins A, A1, A2, B, B1, and B4 on probiotic microorganisms 4.1. Introduction 142 4.2. Materials and methods 4.2.1. Chemicals 143 4.2.2. Strains and culture conditions 144 4.2.3 Antimicrobial activity of the ENs 145 4.3. Results and discussion 147 V. CONCLUSIONES 155 155
VI. BIBLIOGRAFÍA 163 163

! 9
LISTA DE ABREVIATURAS ACAT: Acyl-CoA:colesterol acyltransferasa AFs: Aflatoxinas BEA: Beauvericina Caco-2: Células humanas de adenocarcinoma de colon CECT: Colección Española de Cultivos tipo DON: Deoxynivalenol EFSA: European Food Safety Authority ISPA: Istituto Delle Scienze delle Produzioni Alimentari EDI: Ingesta diaria estimada EN: Eniatinas ENA: Eniatina A ENA1:Eniatina A1 ENB: Eniatina B ENB1: Eniatina B1
FB: Fumonisinas FB1: Fumonisina B1 FB2: Fumonisina B2 GT: tracto gastrointestinal IDT: Ingesta diaria tolerable JECFA: Joint FAO/WHO Expert Committee on Food Additives HSCAS: aluminosilicatos hidratados de calcio y sodio LC-MS/MS: Cromatografía Líquida acoplada a Espectrometría de masas LIT: Trampa lineal de iones LOD: Límite de detección LOQ: Límite de cuantificación MRS: DeMan- Rogosa-Sharpe MSB: Mineral salt broth NB: Nutrient broth

! 10
NIV: Nivalenol OTA: Ocratoxina A PAT: Patulina QqQ: Triple cuadrupolo ROS: Especies reactivas de oxigeno SB: Sabouraud broth ZEA: Zearalenol

! 11
RESUMEN

! 12

Resumen
! 13
Los hongos filamentosos de los géneros Aspergillus,
Penicillium y Fusarium son responsables de producir metabolitos
tóxicos denominados micotoxinas: sustancias contaminantes de
alimentos y piensos que suponen un grave perjuicio para la salud
humana y animal. El género micotoxigénico Fusarium es el más
importante en las regiones de clima templado y países nórdicos.
En los últimos años existe un interés creciente por las
denominadas micotoxinas emergentes, particulamente la
beauvericina (BEA), las eniatinas (ENs) y la fusaproliferina. Estos
compuestos se han detectado a elevadas concentraciones en
alimentos presentes en el mercado europeo en general y
mediterraneo en particular. Numerosos estudios evidencian, por
un lado, su capacidad citotóxica sobre células de mamíferos, y
por otro , los elevados niveles de exposición a los que se enfrenta
la población.
Como parte de las estrategias de prevención frente a las
micotoxinas, existen tratamientos físicos, biológicos y químicos
que reducen su presencia en alimentos o que las transforman en
metabolitos menos tóxicos. Estas estrategias se han evaluado con
el objetivo de controlar las micotoxinas consideradas tradicionales

Resumen
! 14
y pueden aplicarse a las micotoxinas emergentes de Fusarium
para reducir su concentración y/o inactivarlas.
En primer lugar, se ha evidenciado la presencia de estas
micotoxinas emergentes en arroz, un cereal básico en la
alimentación de la población española y especialmente de la
Comunidad Valenciana. Este cereal se consume tras la cocción,
por lo tanto es interesante evaluar el efecto de este tipo de
procesado para conocer la exposición real a ENs y BEA. En el
presente estudio, diversas muestras de arroz del mercado
nacional se analizarion para investigar y determinar la presencia
de las fusariotoxinas emergentes eniatina A, eniatina B, eniatina
A1, eniatina B1 y BEA, con el fin de realizar una estimación del
riesgo. Se utilizó un método analítico rápido, sensible,
reproducible y fiable para la extracción de las muestras por Ultra
Turrax, y su posterior determinación por cromatografía líquida
acoplada a espectrometría de masas (LC-MS/MS) con triple
cuadrupolo (QqQ). Las muestras de arroz se analizaron en crudo,
y tras practicarse la cocción, en condiciones similares a la del
tratamiento doméstico y en exceso de agua.

Resumen
! 15
En el 100% de las muestras analizadas se detectaron
eniatinas. Al realizar la cocción en condiciones análogas a las del
tratamiento doméstico, el comportamiento de la mayoría de las
muestras tiende a la reducción de la concentración, pero no se
produce una eliminación total en todos los casos. No obstante, la
tasa de reducción de micotoxinas suele aumentar si la cocción se
práctica en exceso de agua, y es mucho mayor si se realiza en
medio básico o ácido. En consecuencia, la ingesta de micotoxinas
emergentes estimada solo en arroz, es del mismo orden que la
Ingesta Diaria Tolerable (IDT) de las micotoxinas producidas por
el género Fusarium que representan un mayor riesgo para la
salud.
Por otro lado, los tratamientos biológicos se basan en la
acción de microorganismos que actúan biotransformando las
micotoxinas o bien reduciendo su absorción. Se emplean como
cultivos iniciadores en alimentos fermentados, o se consumen
como suplementos probióticos que tienen efectos beneficiosos
para la salud del hospedador. Se ha evaluado la degradación
mediante el empleo de distintos microorganismos. De las 37
cepas estudiadas, 9 son bacterias ácido lácticas características del

Resumen
! 16
tracto intestinal, 22 son cepas de Saccharomyces cerevisiae, y 6
son cepas de Bacillus subtilis. Las fermentaciones se llevaron a
cabo el medio de cultivo específico de cada una de las cepas
durante 48 h.
La determinación de las ENs se realizó por cromatografía
líquida acoplada a espectrometría de masas (LC-MS/MS) con
triple cuadrupolo (QqQ), mientras que la identificación de los
productos de degradación producidos tras la fermentación se
llevó a cabo mediante la técnica de cromatografía líquida
acoplada a trampa lineal de iones (LC-MS/MS-LIT).
Todas las cepas estudiadas produjeron una reducción
significativa de las ENs tras la fermentación, con una disminución
de la concentración de micotoxinas en el medio de cultivo del 5 al
99%. En la matriz alimentaria, los datos de degradación oscilaron
entre el 1,7 al 49%. Además se detectaron 5 productos de
biodegradación de la ENs.
Según la bibliografía disponible, las ENs presentan
actividad antifungica, insecticida, fitotóxica y bactericida. Por lo

Resumen
! 17
que, se realizó un bioensayo para estudiar su efecto antibiótico
sobre cepas potencialmente útiles en estrategias de prevención,
como cultivos iniciadores de la fermentación, o bien consumirse
como suplementos probióticos, y conseguir así evaluar su
robustez y viabilidad frente a estos compuestos bioactivos.

! 18

! 19
I.INTRODUCCIÓN

! 20

Introducción
! 21
1. Introducción sobre micotoxinas
Las micotoxinas son metabolitos secundarios producidos
por hongos filamentosos, principalmente de los géneros
Aspergillus, Penicillium, Alternaria y Fusarium. Son contaminantes
habituales de cereales como el trigo, cebada, maíz, avena y
arroz, y pueden provocar un amplio rango de efectos tóxicos,
como carcinogénesis, neurotoxicidad, y toxicidad reproductiva y
en el desarrollo (Martínez-Larrañaga y Anadón, 2006). Se
desconoce el número total de estos metabolitos potencialmente
tóxicos de los hongos. La micotoxicosis más antigua de la que se
tiene datos es el ergotismo, una patología descrita en la Edad
Media y causada por las alcaloides ergóticos producidos por el
hongo Claviceps Purpurea. El brote de la denominada
enfermedad X del pavo en Inglaterra en los años 60, marcó el
descubrimiento de la familia de las aflatoxinas (AFs) y el inicio de
la micotoxicología moderna.
Actualmente, se han detectado más de 300 micotoxinas en
productos de uso en alimentación humana y animal. Estos

Introducción
! 22
compuestos bioactivos son metabolizados por los animales de
producción que ingieren piensos contaminados, de forma que se
aíslan metabolitos tóxicos en productos de origen animal y
destinados a la alimentación humana. La estructura química de las
micotoxinas varía en gran medida, y por lo tanto sus propiedades
tóxicas también, por lo que no se les puede asignar un único
mecanismo o modo de acción en las células, los tejidos o los
organismos (Santini et al., 2009). En Estados Unidos de América y
Canadá, las pérdidas anuales debidas a los efectos de las
micotoxinas en las industrias forrajeras y ganaderas, son del orden
de 5000 millones de dólares/año. En los países en desarrollo,
donde los alimentos básicos son susceptibles de contaminación,
la población sufre morbilidad y muertes prematuras relacionadas
con la presencia de micotoxinas (FAO,2001).
Los géneros fúngicos Aspergillus y Penicillium, son capaces
de producir las micotoxinas pertenecientes a la familia de las AFs,
además de patulina (PAT) y ocratoxina A (OTA). El género
Fusarium, el prevalente en regiones europeas, produce
fumonisinas (FBs), zearalenona (ZEA), tricotecenos, como

Introducción
! 23
deoxynivalenol (DON) , el nivalenol (NIV), y la toxinas HT-2 y T-2,
así como las denominadas micotoxinas emergentes de Fusarium.
Las AFs son un grupo de micotoxinas cuyos compuestos
principales son la aflatoxina B1 (AFB1) , la aflatoxina B2 (AFB2), la
aflatoxina G1 (AFG1) y la aflatoxina G2 (AFG2). Las cepas
toxigénicas de Aspergillus flavus producen las de tipo B y las de
Aspergillus parasiticus las de tipo B y G (Zinedine y Mañes, 2009).
Se encuentran frecuentemente en alimentos vegetales con
apreciable contenido proteico, cultivados en regiones húmedas y
cálidas, como los cereales, frutos secos, frutas secas y especias
(Raters et al., 2008; Rojas-Durán et al., 2007). La AFB1 es el más
potente agente hepatocarcinogénico conocido en humanos y
está clasificado como agente carcinogénico de clase 1 (IARC,
2002). La aflatoxina M1 (AFM1) se encuentra en leche de vacas de
producción que han consumido piensos contaminados por AFB1.
La PAT es una lactona insaturada producida por algunas
cepas de Aspergillus, Penicillium y Byssochlamys, se encuentra en
frutas y vegetales, especialmente en manzanas y productos
derivados y produce disfunción renal, estrés oxidativo, e

Introducción
! 24
interferencia en la reproducción (Fuchs et al,. 2008; Topcu et al.,
2010).
La OTA es producida principalmente por Aspergillus y
Penicillium, y tiene efectos nefrotóxicos, hepatocarcinogénicos y
genotóxicos al interaccionar con ácidos nucleicos e interferir con
la síntesis proteica. Está clasificada como 2B o posible
carcinogénico para la especie humana (IARC, 2002). Se encuentra
principalmente en uva, vinos, cereales, cacao y café (La Pera et
al., 2008). Se ha asociado a la nefropatía endémica de los
Balcanes en Yugoslavia y tumores en riñon (Bryden et al., 2012).
Las FBs son un grupo de micotoxinas producidas por
Fusarium verticilliodes y Fusarium Proliferatum, y son
contaminantes frecuentes en maíz y productos derivados. Se han
descrito 28 FBs, que se clasifican en 4 series: A, B, C y D, siendo
FB1 y FB2 las que principalmente contaminan alimentos. Se
asocian a enfermedades de animales domésticos como la
leucoencefalomalacia equina, y el síndrome de edema pulmonar.
En humanos se ha relacionado con el incremento de cáncer de
esófago en ciertas regiones de Africa del Sur y de China. Están

Introducción
! 25
consideradas como posibles agentes carcinogénicos 2B (IARC,
2002) (Hartinger and Woll, 2011).
La ZEA se asocia a desordenes reproductivos en animales
de producción y síndromes hiperestrogénico en humanos.
También tiene efectos hepatotóxico, immunotóxico y genotóxico
(Zinedine et al., 2007).
Los Tricotecenos son una familia de compuestos
químicamente relacionados producidos por varias especies de los
géneros Fusarium, Myrothecium, Trichoderma, Trichothecium,
Cephalosporium, Vertinimonosporium y Stachybotrys. Son
moléculas de peso molecular medio, y tienen en común un
esqueleto tetracíclico y un grupo 12,13-epóxido en su estructura;
este radical juega un papel importante en su toxicidad. Se
clasifican en varios grupos en función de su estructura química,
DON y NIV pertenecen al grupo B y las toxinas HT-2 y T-2 al
grupo A. Estos compuestos presentan actividad citotóxica e
inmunodepresiva. Sus fuentes principales son el trigo, la cebada y
el maíz (He et al., 2010).
Introducción
! 26
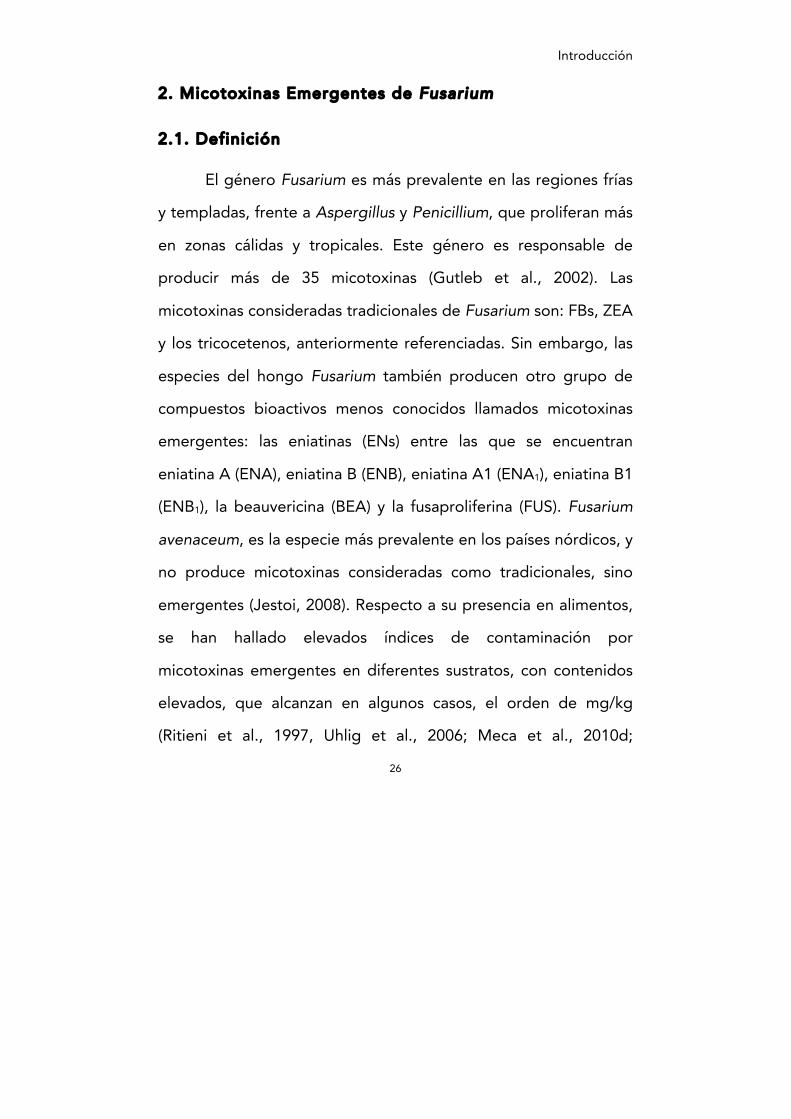
2. Micotoxinas Emergentes de Fusarium
2.1. Definición !
El género Fusarium es más prevalente en las regiones frías
y templadas, frente a Aspergillus y Penicillium, que proliferan más
en zonas cálidas y tropicales. Este género es responsable de
producir más de 35 micotoxinas (Gutleb et al., 2002). Las
micotoxinas consideradas tradicionales de Fusarium son: FBs, ZEA
y los tricocetenos, anteriormente referenciadas. Sin embargo, las
especies del hongo Fusarium también producen otro grupo de
compuestos bioactivos menos conocidos llamados micotoxinas
emergentes: las eniatinas (ENs) entre las que se encuentran
eniatina A (ENA), eniatina B (ENB), eniatina A1 (ENA1), eniatina B1
(ENB1), la beauvericina (BEA) y la fusaproliferina (FUS). Fusarium
avenaceum, es la especie más prevalente en los países nórdicos, y
no produce micotoxinas consideradas como tradicionales, sino
emergentes (Jestoi, 2008). Respecto a su presencia en alimentos,
se han hallado elevados índices de contaminación por
micotoxinas emergentes en diferentes sustratos, con contenidos
elevados, que alcanzan en algunos casos, el orden de mg/kg
(Ritieni et al., 1997, Uhlig et al., 2006; Meca et al., 2010d;

Introducción
! 27
Mahnine et al., 2011; Sifou et al. 2011; Serrano et al., 2012c;
Tolosa et al., 2013).
El compuesto bioactivo BEA fue aislado por primera vez en
1969 a partir del hongo entomopatogénico Beauverina bassiana.
Las ENs se descubrieron en el año 1947, en cultivos de Fusarium
orthoceras Appl. Wr Var. Enniantum que luego se denominó
Fusarium oxysporum. Estas micotoxinas son depsipéptidos
cíclicos. Consisten en aminoácidos alternos con ácido 2-hidroxi-3-
metilbutanoico. En la BEA, los tres aminoácidos son N-metil-
fenilalaninas (Hamill et al. 1969), mientras que en el caso de las
ENs de tipo A y B, los residuos de aminoácidos son N-metil-
valinas o isoleucinas, o bien mezclas de éstas. Las distintas
subunidades están unidas por enlaces peptídicos y enlaces éster
intramoleculares (lactonas), formando un depsipéptido. Su
estructura molecular es muy similar, lo que indica que los
mecanismos de toxicidad serán también comunes. Las estructuras
de estas fusariotoxinas están recogidas en la figura 1 (Jestoi,
2008). BEA y ENs son compuestos lipofílicos con baja solubilidad
en agua. En su estructura presentan grupos hidrofílicos (amidas y
carbonil éster) e hidrofóbicos (fenil, isopropil, sec-butil y metil),

Introducción
! 28
que hacen la posible la extracción con varios disolventes con
distinta polaridad y les confiere características particulares. Al ser
hidrofóbicos, se incorporan fácilmente a las membranas
biológicas, creando canales selectivos que permiten el transporte
de cationes mono y divalentes a través de la membrana
plasmática, lo que desencadena cambios en la homeostasis de la
célula (Tedjiotsop et al., 2010).
Figura 1. Estructura de las micotoxinas BEA y ENA, ENA1, ENB,
ENB1

Introducción
! 29
2.2. Toxicidad de BEA y ENs
En las últimas décadas, se han publicado numerosos
estudios in vitro acerca del potencial citotóxico de BEA, FUS y
ENs. Existen pocos ensayos de toxicidad in vivo de fusariotoxinas
emergentes. BEA y ENs tienen acción citotóxica frente a
numerosas líneas celulares de mamíferos, interaccionando con la
membrana plasmática, incrementando el calcio intracelular, e
induciendo apoptosis (Lin et al., 2005; Ferrer et al., 2009; Hyun et
al, 2009). Estas fusariotoxinas inhiben la acyl-CoA:colesterol
acyltransferasa (ACAT) y, afectan al metabolismo mitocondrial.
BEA tiene efecto inotropo y cronotropo negativo en corazones
aislados de cobaya (Lee et al. 2010). Esta toxina provoca muerte
celular en líneas de células cancerígenas humanas; pues al
estimular el flujo de calcio extracelular hacia la célula, destruye las
células de leucemia humana CCRF CEM (Chen et al, 2006).
Prosperini (et al.,2013a) ha descrito el efecto de esta micotoxina
en células humanas de adenocarcinoma de colon (Caco-2) en las
que se observan producción de especies reactivas de oxígeno
(ROS) de forma dosis dependiente, así como inducción de la
apoptosis e disminución del potencial de membrana mitocondrial.

Introducción
! 30
Además, la BEA tiene efecto antibiótico frente a varias especies
patógenas de tracto gastrointestinal como Escherichia coli,
Salmonella entérica, Shygella dysenteriae, Listeria
monocytogenes, Yersinia enterocolitica, Clostridium perfringens,
Pseudomona aeruginosa y Staphylococcus aereus (Meca et al.,
2010c).
Las ENs forman canales que permiten el flujo de calcio
hacia la célula, presentan actividad antibiótica e insecticida.
Además, se asocian a enfermedades de las plantas que cursan
con necrosis. La citotoxicidad frente a hepatocitos de carcinoma
humano HepG2 y células de fibroblasto de pulmón MRC-5 de las
ENs es comparable a la del deoxinivalenol (DON) en el ensayo
BrdU, basado en medir la síntesis de DNA (Ivanova et al. 2006).
Las ENs actúan como ionóforos altamente selectivos para el
potasio, aumentando la captación de potasio en la mitocondria y
alterando su homeostasis (Tonshin et al., 2010). Estudios
comparativos de las distintas ENs: A, A1, B, B1, B4 y J3, han
demostrado de la EN A1 es la más citotóxica frente a células
hepáticas e intestinales Caco2, Hep G2 y HT 29 (Meca et al.
2011). La citotoxicidad de las ENs se debe a que generan ROS,

Introducción
! 31
daño oxidativo, apoptosis y necrosis. Además, ENA, ENA1 y ENB1
producen daños a nivel de ADN celular (Prosperini et al., 2013b).
Los ensayos para evaluar la bioaccesibilidad a partir de la
digestión in vitro de muestras contaminadas con ENs, han
demostrado que, tras la digestión en el tubo digestivo, casi el 50
% de la concentración inicial está disponible para interactuar con
los tejidos humanos (Prosperini et al., 2013c).
2.3. Presencia de BEA y ENs en alimentos
De acuerdo a los estudios realizados por Serrano et al.,
(2012a, 2012b, 2013) la población española está expuesta a la
contaminación por ENs, BEA y FUS, debido a la presencia de
estos contaminantes en alimentos, como alimentos infantiles y
pasta. En este sentido, los resultados obtenidos muestran que de
las 45 formulas infantiles analizadas, 47 y 20 % resultaron estar
contaminadas por ENs y FUS respectivamente, siendo ENB1 la
micotoxina presente en un mayor número de muestras con
valores de hasta 42 mg/kg. En el caso de las muestras de pasta,
se detectó la presencia simultánea de dos o más micotoxinas en
el 65 % de las muestras. Los resultados mostraron altas
frecuencias de contaminación en pasta. Los valores de BEA

Introducción
! 32
oscilaron entre 0.10 y 21 µg/kg, FUS desde 0.05 a 8 µg/kg. Los
valores de ENs oscilaron entre 0.25 y 979 µg/kg. En otro estudio
realizado en frutos secos y de cáscara, 49 de las 74 muestras
analizadas resultaron estar contaminadas por ENs y BEA, siendo
el valor más elevado 1,4 mg/Kg de ENA (Tolosa et al., 2013). En
muestras de cereales del mercado español en el que se analizaron
6 fusariotoxinas emergentes ENs A, A1, B, B1 y BEA, la más
frecuentemente hallada fue ENA1, en el 73 % de las muestras, con
un valor máximo de 814 mg/kg en una muestra de arroz. El resto
de ENS presentaron un prevalencia muy inferior, por debajo del
10 % de las muestras. BEA se halló en el 32 % de las muestras,
con un valor máximo de 9,3 mg/kg (Meca et al., 2010d).
La presencia de estos contaminantes en muestras crudas
de cereales también se ha evaluado en otras zonas del arco
mediterráneo como Marruecos y Túnez. En un estudio a partir de
maíz, trigo y cebada marroquí se ha visto que el cereal más
frecuentemente contaminado por ENs es la cebada con un 87,5 %
de muestras positivas. El nivel más elevado de ENs totales se
encontró en una muestra de maíz con un valor de 445 mg/Kg,
que correspondió su totalidad a EN A1. Del mismo modo que en

Introducción
! 33
el estudio de Meca et al., (2010d), EN A1 fue la más frecuente,
detectándose en el 39 % de las muestras. En arroz procedente de
Marruecos, la contaminación más elevada fue hallada en una
muestra de la región de Kenitra con 449 mg/Kg de ENA1 y 465
mg/kg para el valor total de ENs. La ENB fue la más
frecuentemente encontrada, (30 % del total de las muestras) con
niveles que variaron de 4,4 a 26 mg/kg. Los porcentajes de
contaminación del total de las muestras con ENs totales, BEA y
FUS fueron 50%, 75,7% y 4,3% respectivamente. En relación a la
concurrencia de estas fusariotoxinas, los resultados han indicado
que el 54 % de las muestras estaban contaminadas con al menos
dos tipos de micotoxinas objeto de estudio y que el 30 %
contenían tres tipos (Sifou et al., 2011). En este estudio se ha
comprobado que el arroz es un buen sustrato para el crecimiento
de Fusarium y la producción de micotoxinas. En el caso de 51
muestras de comerciales de cereales crudos (trigo, cebada, maíz y
sorgo) y productos derivados (cuscus y pasta) procedentes de
supermercados tunecinos, el 96 % de las muestras estaban
contaminadas por ENS. En cuanto a la distribución de las
muestras positivas, la ENA1 fue la más frecuente, en el 92 % de
los casos, con niveles que variaron desde 11 a 480 mg/kg. La

Introducción
! 34
concentración máxima de ENs totales fue 683 mg/kg en una
muestra de sorgo. Los resultados analíticos mostraron además
que ninguna muestra estaba contaminada por BEA y FUS
(Oueslati et al., 2011).
En un estudio de fusariotoxinas en derivados de cereales
(harina, cereales para el desayuno y snacks) de la República
Checa, se detectaron ENs en el 97 % de las muestras, con valores
que oscilan de 20-2532 µg/kg, seguidas de ENB con una
incidencia del 91% (concentraciones entre 13 y 941 µg/kg) y
ENB1, con una incidencia del 80% (valores de 8 a 785 µg/kg).
ENA1 fue hallada solamente en el 44% de los casos con
concentraciones que oscilaron de 8 a 851 µg/kg (Malachova et al.,
2011).
Por otro lado, la presencia de estas fusariotoxinas
emergentes también se ha estudiado en cereales (avena, cebada
y trigo) de países del Norte de Europa como Noruega o
Finlandia. El ratio de concentración generalmente encontrado fue
ENB > ENB1 > ENA1 > ENA. En Noruega, la concentración más
elevada de ENB hallada en trigo fue de 5,8 mg/Kg, con valores

Introducción
! 35
de BEA aproximadamente 50 veces inferiores. En Finlandia los
cereales alcanzaron valores de EN B de hasta 18 mg/Kg, junto a
trazas de BEA (Uhlig et al. 2007).
3. Descontaminación de micotoxinas
Para prevenir y controlar los efectos nocivos de las
micotoxinas sobre la salud humana y animal podemos emplear
distintas estrategias:
! Evitar la contaminación en el campo, en la cosecha y
durante el posterior almacenamiento
! Descontaminar los alimentos o piensos mediante
procesado, tratamientos físicos, agentes biológicos o
químicos.
! Inhibir la absorción de las micotoxinas presentes a través
del tracto gastrointestinal, (Halász et al., 2009)
La primera estrategia para la prevención de las micotoxicosis
es actuar en las fases iniciales de la contaminación. La rotación de
cultivos es un método eficaz para reducir la contaminación de los
cereales en invierno por cepas de Fusarium.
Introducción
! 36
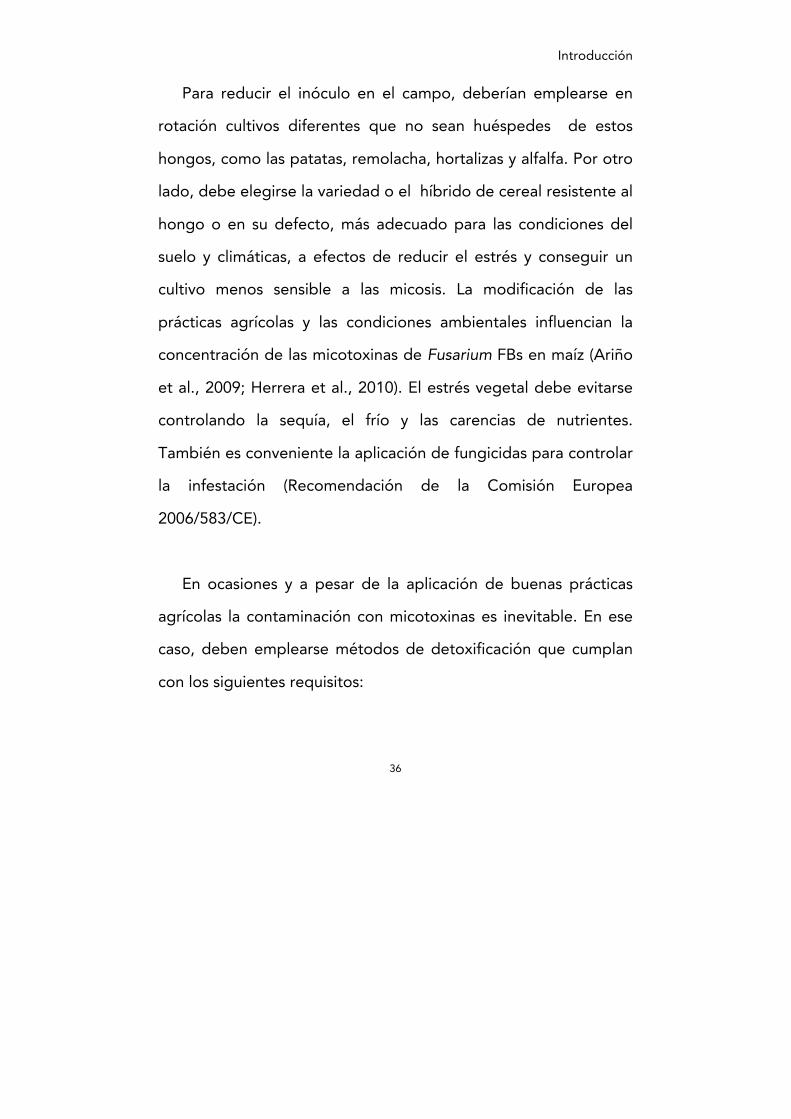
Para reducir el inóculo en el campo, deberían emplearse en
rotación cultivos diferentes que no sean huéspedes de estos
hongos, como las patatas, remolacha, hortalizas y alfalfa. Por otro
lado, debe elegirse la variedad o el híbrido de cereal resistente al
hongo o en su defecto, más adecuado para las condiciones del
suelo y climáticas, a efectos de reducir el estrés y conseguir un
cultivo menos sensible a las micosis. La modificación de las
prácticas agrícolas y las condiciones ambientales influencian la
concentración de las micotoxinas de Fusarium FBs en maíz (Ariño
et al., 2009; Herrera et al., 2010). El estrés vegetal debe evitarse
controlando la sequía, el frío y las carencias de nutrientes.
También es conveniente la aplicación de fungicidas para controlar
la infestación (Recomendación de la Comisión Europea
2006/583/CE).
En ocasiones y a pesar de la aplicación de buenas prácticas
agrícolas la contaminación con micotoxinas es inevitable. En ese
caso, deben emplearse métodos de detoxificación que cumplan
con los siguientes requisitos:

Introducción
! 37
1. Tener capacidad para destruir, inactivar o eliminar la
micotoxina sin producir o generar residuos tóxicos,
carcinogénicos o mutagénicos.
2. Mantener el valor nutritivo, la aceptabilidad y las
propiedades físicas del alimento o pienso.
3. Las esporas y micelios de los hongos, deben destruirse de
forma que no produzcan nuevas toxinas.
4. Debe ser económicamente viable (Haláz et al., 2009; Awad
et al., 2010).
!3.1. Procesado y tratamientos térmicos
El procesado y los tratamientos térmicos de los alimentos
aumentan la palatabilidad de los mismos y la digestibilidad de los
nutrientes, al tiempo que reducen la carga microbiana, haciendo
su consumo más seguro. Diversas técnicas de procesado son
capaces modificar la cantidad de micotoxinas en una matriz
alimentaria mediante la selección y limpieza, troceado, molido,
macerado, fermentación, horneado, fritura, asado, nixtamalización
y extrusión. En general, estos procedimientos reducen
significativamente la concentración de las micotoxinas, pero no
las eliminan completamente (Bullerman y Bianchini, 2007). En

Introducción
! 38
general, el molido de los cereales produce una dilución y una
distribución de las micotoxinas a las fracciones menos consumidas
por humanos y comúnmente empleadas en alimentación animal.
Los tratamientos térmicos causan distintos grados de reducción,
pero la mayoría de las micotoxinas son moderadamente
termoestables (Kabak et al., 2009; Voss et al., 2010).
Vaclavikova et al., (2012) ha descrito el efecto de la
fabricación del pan y de la cerveza en la concentración de ENs
presentes en cereales. En panificación, al moler los granos para la
fabricación de harina refinada, se redujo la concentración de ENB
y ENB1 en un 75 %, debido a que la mayor contaminación se
concentra en las capas exteriores del grano y el salvado. El
proceso de amasado, fermentación y horneado de estas harinas
se tradujo en una reducción del 60 % y del 50 % de ENB y ENB1
respectivamente, pero no las destruyó totalmente. La fabricación
de cerveza a partir de granos de cebada contaminados dio como
lugar a un producto final libre de ENs, a diferencia de lo
observado para los tricotecenos DON y DON-3-Glc ya que
durante la infusión del grano, estas micotoxinas no son
transferidas al producto final.

Introducción
! 39
El efecto del horneado sobre la BEA ha sido evaluado en
varias matrices (Meca et al., 2012b). Una solución con 5 mg/kg de
este compuesto bioactivo, fue sometida a tratamientos térmicos
en horno a 160, 180 y 200ºC durante 3, 6, 10, 15 y 20 min. A
temperaturas de 160ºC aplicadas durante 3 min, la concentración
de BEA se redujo hasta 2.8 mg/kg, y la degradación fue total a
200ºC durante 20 min. En harinas contaminadas, el horneado se
tradujo en una reducción del 20 al 90% de la contaminación
inicial.
El efecto del procesado en las micotoxinas tradicionales de
Fusarium está ampliamente documentado. Se han comparado
distintos tratamientos en arroz contaminado por FB1. El cocinado
doméstico produce una reducción de hasta el 80 % y este
porcentaje se ve incrementado al aplicar calor seco a
temperaturas entre 150 y 200ºC (Becker Algeri et al., 2013). DON
es una molécula termoestable, puesto que no se observa
reducción en su concentración tras el horneado a 170ºC durante
30 minutos. Sin embargo, debido a su solubilidad en agua, el
tratamiento hidrotérmico descontamina significativamente la

Introducción
! 40
matriz alimentaria (Kushiro, 2008). El cocinado en pH alcalino da
como resultado la aparición de compuestos de degradación de
DON menos citotóxicos, como norDON A, norDON B y norDON
C (Bretz et al., 2006).
AFB1, OTA, ZEN, DON, FB1 y FB2 se pueden transferir
desde los granos de cereal a la cerveza durante su proceso de
elaboración. AFB1 y OTA presentan un patrón de disminución
similar, se mantienen relativamente estables frente al tratamiento
térmico, pero son más sensibles al proceso de malteado o
hidrólisis proteolítica (Bullerman y Bianchini, 2007).
Se ha estudiado la detoxificación de la PAT durante la
fabricación de compota de manzana. Con el lavado con cepillo de
los frutos, los niveles de PAT pueden descender más del 50 %.
Para la elaboración industrial de la compota, la manzana triturada
se cuela, de forma que se eliminan la piel, el pedúnculo y el
corazón. Este paso del procesado es el más eficiente en cuanto a
la reducción de la micotoxina, puesto que supone la eliminación
de las partes más infectadas. El tratamiento térmico de la
compota durante 10 minutos, produce una reducción de hasta el

Introducción
! 41
17,9 %. La reducción durante el calentamiento se produce por
una reacción de la PAT con sulfitos, tioles, y otros compuestos de
la matriz (Janotová et al., 2011).
El tratamiento industrial del grano de café conlleva en
reducción de los niveles de OTA según el estudio de La Pera (et
al., 2008). Tras el tostado de 14 muestras de café (3 minutos a
200ºC) se observa una degradación de entre 65-100 %. El
método de preparación de la infusión de café afecta el contenido
de OTA. En el método de preparación italiano o “Moka Express”,
los granos contaminados con OTA estuvieron poco tiempo en
contacto con el agua, y muy poca cantidad de toxina se solubiliza
en agua. Por el contario, en el método de preparación turco, el
café se mantiene en infusión durante 10 minutos y los niveles de
OTA en la bebida de café fueron superiores.
3.2. Tratamientos químicos
En ámbito europeo, el proceso de descontaminación
mediante agentes químicos está muy extenido en productos
destinados para alimentación animal. El proceso de amoniación
se usa a escala industrial para detoxificar las AFs presentes en

Introducción
! 42
harina de cacahuete destinada al vacuno lechero. El anillo
lactonico de la AFB1 es hidrolizado de forma irreversible, dando
lugar a un compuesto carente de toxicidad (EFSA, 2009). Por
otro lado, el empleo de agentes oxidantes como el ozono
degrada la AFB1, ZEA, y tricotecenos como el DON (Young et al.,
2006). Tanto la amoniación como el uso de agentes oxidantes,
reducen la contaminación, pero su uso presenta una desventaja,
puesto que también reduce de forma significativa el valor
nutritivo del pienso (Jard et al., 2011).
3.3. Descontaminación biológica
3.3.1. Degradación por agentes biológicos
Una estrategia para la descontaminación de las
micotoxinas es su degradación biológica en metabolitos no
tóxicos mediante microorganismos detoxificantes como bacterias,
levaduras, enzimas y hongos.
La fermentación es uno de los métodos de conservación
más antiguos y ampliamente empleados en alimentación humana.
El aislamiento de microorganismos capaces de degradar
enzimáticamente una determinada micotoxina, y emplearlos en

Introducción
! 43
un proceso de fermentación del alimento o del pienso podría dar
como resultado un producto carente del contaminante. Otra
estrategia para encontrar microorganismos detoxificantes, se
basa en aislar aquellas bacterias del tracto gastrointestinal que
sean capaces de transformar las micotoxinas, de forma que
pueden utilizarse tanto en procesos de fermentación industriales
o como probióticos, es decir, suplementos alimenticios formados
por microorganismos que tiene efectos beneficiosos para el
organismo que los consume (Haláz et al., 2009). En este sentido,
es necesario evaluar la toxicidad de los productos de
degradación, así como los efectos indeseables en la fermentación
o calidad del alimento o pienso producto (Shetty y Jespersen,
2006).
La actividad de enzimas intracelulares de Saccharomyces
cerevisiae para degradar el compuesto bioactivo BEA ha sido
descrita por Meca et al., (2013a). Las protesasas de 4 cepas de
esta levadura de uso común en la industria alimentaria, redujeron
la concentración del compuesto bioactivo BEA en harina de maíz
en un rango de 66 % a 91 % en función de la cepa. Además se
identificó la presencia de un producto de degradación mediante

Introducción
! 44
cromatografía líquida acoplada a espectrometría de masas (LC-
MS/MS-LIT). En otro estudio, se ha evaluado la reducción durante
la fabricación de pan y cerveza a partir de harinas contaminadas,
de forma que la fermentación con Saccharomyces cerevisiae se
tradujo en una reducción significativa de la contaminación por
BEA (Meca et al., (2013b). Ensayos con bacterias lácticas han
demostrado la reducción in vitro que la fusariotoxina BEA durante
la fermentación en medio de cultivo contaminado (Meca et al.,
2012a).
No se han publicado estudios de detoxificación biológica
de las ENs, a pesar de que los estudios de monitorización han
demostrado que son las fusariotoxinas emergentes encontradas a
concentraciones más elevadas en países europeos, en
comparación con BEA y FUS.
La capacidad de los microorganismos para degradar otras
micotoxinas ha sido descrita en numerosas publicaciones. El
primer microorganismo autorizado como aditivo detoxificante de
micotoxinas es Eubacterium BBSH 797, una bacteria Gram
positiva aislada en fluido ruminal de bovino que ha demostrado

Introducción
! 45
tener capacidad detoxificante frente a varios tricotecenos
mediante reacción de deepoxidación, de forma que el DON se
transforma en un metabolito el deepoxy-deoxynivalenol (de-
DON), 500 veces menos tóxico (He et al., 2010). También
degrada otros 6 tricotecenos de tipo A, como las toxinas HT-2 y
T-2, T-2 triol, T-2 tetraol, scirpentriol and diacetoxiscirpenol
(Fuchs et al., 2002).
En cuanto a las bacterias lácticas, Lactobacillus acidophilus
VM20 y Bifidobacterium animalis V12, dos cepas de uso en
alimentos fermentados, degradan OTA en un 95 % y PAT en un
80 % respectivamente. Además, estos microorganismos son
detoxificantes, ya que la preincubación de estas bacterias lácticas
y las micotoxina redujeron sus efectos tóxicos sobre células
hepáticas HepG2 (Fuchs et al., 2008).
La cepa Bacillus subtilis UTBSP1 reduce la concentración
de AFB1 en una matriz alimentaria y en caldo de cultivo en un 95 y
86 % respectivamente. La capacidad de biodegradación de esta
bacteria probiótica de debe a enzimas extracelulares, ya que el
sobrenadante del medio de cultivo libre de células, redujo la

Introducción
! 46
presencia de AFB1 en un 78 %. En ensayos in vivo en pollos
expuestos a AFB1, la adición de la cepa Bacillus subtilis ANSB060
al pienso mejora el índice de conversión, la calidad de la carne y
reduce la presencia de residuos tóxicos en hígado debido a la
biodegradación de la micotoxina (Fan et al., 2013).
Guan et al., (2009) realizó un screening para evaluar la
capacidad detoxificante de la microbiota de varias especies de
peces frente a DON, y comprobó que la cepa C133 aislada a
partir del pez gato Ameirus nebolusus produce la deepoxidación
de los tricotecenos DON, NIV y verrucanol tras 96 h de
incubación a 15ºC mediante deacetilación y deepoxidación.
Young et al., (2007) ha evaluado la capacidad de la microbiota
intestinal del pollo para degradar los tricotecenos mediante dos
rutas: la deepoxidación y deacetilación. La AFB1 es degradada
por la bacteria Gram negativa Strenotromorphas maltophilia 35-3,
aislada en heces de tapir, siendo la degradación del medio de
cultivo libre de bacterias es más efectiva que en presencia del
microorganismo vivo, lo que sugiere que las encimas producidas
por la bacteria y presentes en el medio de cultivo son las
responsables de la degradación (Guan et al. 2008). El medio de

Introducción
! 47
cultivo libre de bacterias en el que han crecido los
microorganismos Rhodocococcus erythropolis, Mycobacterium
fluoranthenivorans también degradan la AFB1 (Teniola et al, 2005;
Alberts et al., 2006).
La bacteria Rhodocococcus tiene un elevado potencial
como agente detoxificante. La capacidad de 32 cepas de este
microorganismo para biotransformar las micotoxinas AFB1, OTA,
ZEN, T-2 y FB1 ha sido estudiada recientemente por Cserháti et
al., (2013), observándose importantes ratios de biodegradación
de AFB1, ZEN y T-2, así como un descenso en la genotoxicidad y
estrogenicidad de AFB1 y ZEA respectivamente, mediante
ensayos de SOS-Chromotest y BLYES. La levadura Trichosporon
mycotoxinivorans degrada las micotoxinas ZEA y OTA
transformándolas derivados no tóxicos, tras incubación del
microorganismo durante 24 y 48 h, respectivamente. Tras la
biodegradación se encontró el producto de degradación no
tóxico OTα, y no se hallaron metabolitos tóxicos de ZEA, como el
α-zearalenol o β-zearalenol (Molnar et al., 2004). La capacidad de
esta levadura de detoxificar la OTA ha sido estudiada mediante
ensayos in vivo con pollos alimentados con piensos

Introducción
! 48
contaminados, en los que la adición del microorganismo al pienso
produjo una reducción significativa de los residuos de OTA en
suero, hígado y riñones respecto al grupo control (Hanif et al.,
2012).
Heinl et al., (2010) ha aislado dos genes de la bacteria
Sphingopyxis MTA144 responsables de la producción de enzimas
capaces de degradar la FB1 por deesterificación y deaminación.
3.3.2. Adsorción por agentes biológicos
Los agentes adsorbentes son compuestos de elevado peso
molecular que reducen la exposición a micotoxinas. Actúan
disminuyendo su bioaccesibilidad y su absorción mediante la
formación complejos estables con estas micotoxinas, que son
eliminados por heces tras transitar por el tracto gastro intestinal.
(EFSA, 2009).
Se han estudiado distintos microorganismos reductores de
la concentración de micotoxinas en medio de cultivo o en
matrices alimentarias, ya que tienen capacidad de fijarse a estos
contaminantes, lo que indica que tienen un uso potencial como

Introducción
! 49
agentes detoxificantes. Dentro del grupo de microorganismos
potencialmente útiles para ser empleados como agente
adsorbentes, hay que destacar las bacterias ácido lácticas y las
cepas de la levadura Saccharomyces cerevisiae, que se emplean
como cultivo iniciador en una matriz alimentaria en
fermentaciones industriales, beneficiar la salubridad del producto
final por su capacidad para fijar contaminantes y disminuir su
absorción intestinal.
Las bacterias ácido lácticas, son microorganismos
probióticos cuyo crecimiento se asocia al tracto gastrointestinal
humano, y son de uso extendido en la industria alimentaria.
Diferentes cepas han sido estudiadas con el objeto de evaluar su
capacidad para fijar aflatoxinas. Lactobacillus ramnhosus GG y LC
705 demostraron capacidad de reducir las aflatoxinas, y junto
con Propionibacterium freudenreichii son efectivas fijando las
toxinas de Fusarium DON, NIV, T-2 y HT-2 (El-Nezami et al.,
2002). Los peptidoglicanos de la pared celular y los polisacáridos
son los elementos responsables de la capacidad de adsorción de
las bacterias ácido lácticas (Kabak et al., 2006).

Introducción
! 50
Enterococcus faecium es una bacteria láctica ampliamente
utilizada en la industria láctea, en concreto en la fabricación del
queso. Las cepas M74 y EF 031 han demostrado capacidad de
reducir AFB1 y PAT en una solución acuosa tras un periodo de
incubación de 48 h (Topcu et al., 2010). En este ensayo la
disminución de AFB1 en el medio de cultivo no se vio afectada en
las muestras incubadas con bacterias inactivadas. Puesto que la
viabilidad del microorganismo no afectó a la reducción, se
entiende que esta reducción no se produce por degradación
biológica, sino por existir fijación a los compuestos de la pared
celular. En cambio, el ratio de detoxificación de PAT disminuyó en
el caso de inactivación, lo que se interpreta como que parte de la
micotoxina desaparece por conversión metabólica de los enzimas.
Planococcus spp. S118 reduce significativamente los
niveles de ZEA en medio de cultivo con bacterias viables e
inviables, en un 21,82% y 47,82% respectivamente. La
inactivación aumenta significativamente la reducción de la
micotoxina, lo que indica la detoxificación se produce por
adsorción del contaminante en los polisacáridos y
peptidoglicanos de la pared celular (Lu et al., 2011).

Introducción
! 51
También se ha descrito la utilidad de las levaduras como
agentes adsorbentes de las micotoxinas. Los distintos
componentes de la pared celular tienen capacidad para fijar las
toxinas AFB1, ZEA, FB1 y reducción in vivo de los efectos tóxicos
OTA, HT2 en pollos (Shetty and Jespersen 2006). Las cepas
enológicas de Saccharomyces cerevisiae pueden usarse para
descontaminar la OTA en zumos de uvas (Bejaouii et al., 2004) y
durante la fabricación del vino moscato mediante adsorción en la
parte externa e interna de la pared celular (Meca et al., 2010a).
4. Legislación
4.1. Límites máximos permitidos
La Autoridad Europea de Seguridad Alimentaria (EFSA), es
el organismo encargado de emitir dictámenes científicos y realizar
de la evaluación del riesgo de los contaminantes a partir de
estudios toxicológicos relevantes y los datos de monitoreo
llevados a cabo por los Estados Miembros. Sobre la base
científica de los informes y publicaciones de la EFSA, la Comisión
Europea, como organismo encargado de gestión del riesgo,
establece los límites máximos de micotoxinas y las clausulas de

Introducción
! 52
salvaguarda que protejan la salud de la población. Actualmente la
EFSA ha establecido la Ingesta Diaria Tolerable (IDT) para OTA,
ZEA, HT-2 y T-2, NIV, PAT y FBs. AFB1 y ZEA. En la tabla 1 se
muestran las IDT establecidas.
Micotoxina
OTA
PAT
DON
ZEA
FBs
HT2
+ T2
NIV
IDT ng/Kg pc
17,14
400
1000
250
2000
100
1200
Tabla 1. Ingestas diarias tolerables (IDT) de micotoxinas (EFSA, 2013, 2011a, 2011b, 2006, 2003, 2002, 1999).
Los principios básicos que rigen la legislación europea
sobre contaminantes están regulados en el Reglamento (UE) Nº
315/93 del Parlamento Europeo y del Consejo, por el que se
establecen procedimientos comunitarios en relación con los
contaminantes presentes en los productos alimenticios. Esta
norma prohíbe la puesta en el mercado de productos alimenticios
que contengan contaminantes en proporciones inaceptables
respecto de la salud pública y en particular desde el punto de

Introducción
! 53
vista toxicológico. Además, los contaminantes deberán
mantenerse al mínimo nivel posible mediante prácticas correctas.
Para proteger la salud, la Comisión Europea, estableció las
tolerancias máximas las micotoxinas mediante el Reglamento
(UE) Nº 1881/2006 de la Comisión, por el que se fija el contenido
máximo de determinados contaminantes en los productos
alimenticios, que especifica las tolerancias máximas para AFs,
OTA, PAT, DON, ZEA y las FBs en productos alimenticios. Esta
norma ha sido modificada en base a sucesivas evaluaciones de
riesgo y dictámenes de la Autoridad Europea de Seguridad
Alimentaria, mediante el Reglamento (UE) Nº 1126/2007, que
establece limites para las micotoxinas de Fusarium en maíz y
derivados, el Reglamento (UE) Nº 165/2010 que incrementó el
contenido máximo permitido para AFs, y el Reglamento (UE) Nº
105/2010 por el que se estableció un contenido máximo de OTA
para las especias y el regaliz. Por último, el Reglamento (UE) Nº
1058/2012 fija un contenido máximo de AFs en higos secos.
La selección u otros tratamientos físicos permiten reducir
el contenido de AF, DON, ZEA en las partidas de cacahuetes,

Introducción
! 54
frutos de cáscara, frutos secos y maíz. Con el fin de minimizar las
repercusiones sobre el comercio, estos reglamentos permiten
contenidos de estas micotoxinas más elevados en los productos
que no se destinan al consumo humano directo o como
ingrediente de productos alimenticios. En estos casos, los
contenidos máximos se han fijado teniendo en cuenta la
efectividad de los tratamientos mencionados a fin de reducir el
contenido de estas micotoxinas en cacahuetes, frutos de cáscara,
frutos secos y maíz, a niveles inferiores a los contenidos máximos
establecidos para al consumo humano directo o a ser utilizados
como ingrediente de productos alimenticios.
En alimentación animal, a nivel europeo se ha fijado
legalmente el contenido máximo para la AFB1 en 20 µg/Kg para
materias primas. En piensos completos destinados al ganado
lechero y a animales jóvenes contenido máximo de AFB1 es 5
µg/Kg (Directiva 2002/32/CE sobre sustancias indeseables en la
alimentación animal).
En cuanto a la presencia de DON, ZEA, OTA, Toxina T-2 y
HT-2 y FBs en productos destinados a la alimentación animal, no

Introducción
! 55
existe un límite máximo a nivel europeo, sino unas
Recomendaciones de la Comisión. Se establecen valores
orientativos y se insta a los operadores económicos a aplicar
estos límites en su sistema de análisis de peligros y de puntos
críticos de control (APPCC), valores críticos que separen lo
aceptable de lo inaceptable para la prevención, eliminación y la
reducción de los peligros determinados (Recomendación de la
Comisión 2006/576/UE; Recomendación de la Comisión
2013/165/UE).
Las micotoxinas emergentes de Fusarium ENs y BEA
actualmente no están legisladas a nivel europeo, sin embargo, la
EFSA está recabando datos sobre toxicidad y exposición de la
población, con el objetivo de fijar la IDT. Este organismo
científico es el encargado de realizar la determinación del riesgo
de los contaminantes emergentes, con arreglo al Reglamento
(UE) Nº 178/2002 del Parlamento y del Consejo, sobre principios
y requisitos de la legislación alimentaria, que consta de cuatro
etapas:
1. Identificación del factor de peligro

Introducción
! 56
2. Caracterización del factor de peligro es decir, la
relación dosis/respuesta
3. Determinación de la exposición a partir de
monitorización en alimentos
4. Caracterización del riesgo
4.2. Muestreo y análisis de micotoxinas
Con el objetivo de que los controles oficiales sean
homogéneos y fiables, se han establecido normas europeas para
la toma de muestras y análisis de las micotoxinas en alimentos en
piensos.
El Reglamento (UE) Nº 401/2006 por el que se establecen
los métodos de muestreo y de análisis para el control oficial del
contenido de micotoxinas en los productos alimenticios. El
reglamento establece un método específico en función de la
matriz que se vaya muestrear, así como el número de lotes en los
que se deben dividir las partidas grandes en función de su peso.
La distribución de las aflatoxinas en un lote es muy heterogénea,
sobre todo en los lotes de productos alimenticios con tamaño
grande de partícula, tales como los higos secos o los cacahuetes.

Introducción
! 57
A fin de obtener la misma representatividad, en el caso de los
lotes de productos alimenticios con tamaño grande de partícula,
el peso de la muestra global es ser superior al peso de la muestra
global de los lotes de productos alimenticios con tamaño más
pequeño de partícula. Por último, esta norma fija los criterios
aplicables a la preparación de la muestra en laboratorio, así como
los criterios de funcionamiento del método analítico para cada
micotoxina. En el caso del control oficial de productos destinados
a la alimentación animal, los métodos de muestreo y análisis de
las matrices están regulados por el Reglamento (UE) Nº 152/2009
del Parlamento Europeo y del Consejo, sobre control oficial en
piensos.
4.3. Descontaminación de las micotoxinas
Por otro lado, El Reglamento (UE) Nº 882/2004, sobre los
controles oficiales efectuados para garantizar el cumplimiento de
la legislación en materia de piensos y alimentos, establece que si
las autoridades de control oficial observan un incumplimiento en
la legislación de piensos y alimentos, podrán someterlos a un
tratamiento a fin de que se ajusten a los requisitos de la

Introducción
! 58
legislación, incluida, en su caso, la descontaminación química o
biológica, pero con exclusión de la dilución.
En cuanto a los compuestos que actúan reduciendo la
bioaccesibilidad y la toxicidad de las micotoxinas, su uso está
ampliamente extendido en el caso de la alimentación de los
animales de granja. El Reglamento (UE) Nº 386/2009, que
modifica al Reglamento (UE) Nº 1831/2003 sobre aditivos en la
alimentación animal, establece una nueva categoría de aditivos
para piensos los denominados reductores de la contaminación de
los piensos por micotoxinas. Se definen como sustancias que
pueden suprimir o reducir la absorción, promover la excreción o
modificar el modo de acción de estos contaminantes.
Los estudios de monitorización revelan que existen
elevados índices de contaminación por ENs y BEA en muestras de
cereales en distintas regiones europeas. Además se han
detectado efectos adversos toxicológicos, lo que supone un
riesgo emergente para la población española debido a la
ingestión de alimentos contaminados. Las autoridades sanitarias
son las encargadas de evaluar la exposición y fijar ingesta diaria
Introducción
! 59
estimada a partir de los datos sobre contaminación en muestras
de alimentos. Los cereales se van a consumir tras el cocinado, y
puesto que este proceso afecta a la cantidad de BEA y ENs, se
hace necesario evaluar la degradación por tratamiento
hidrotérmico para conocer la exposición real al contaminante.
Por otro lado, la detoxificación biológica de las micotoxinas
a partir de bacterias y levaduras probióticas es un campo muy
prometedor para conseguir alimentos más seguros. Actualmente
no existen estudios acerca de la interacción de las micotoxinas
ENs con estos microorganismos potencialmente detoxificantes.

Introducción
! 60

! 61
II.OBJETIVOS

! 62

Objetivos
! 63
El objetivo general del presente trabajo, es aplicar
distintos métodos de descontaminación tanto de tipo físico, como
biológico a las micotoxinas emergentes de Fusarium de forma
que se reduzca su efecto perjudicial para la salud.
Para conseguir este objetivo general se plantean los
siguientes objetivos específicos:
1. Analizar los contenidos de ENA, ENA1, ENB y ENB1 y
BEA en diferentes muestras de arroz y cuantificar el
efecto del cocinado en muestras de arroz contaminadas
por ENA, ENA1, ENB y ENB1 y BEA.
2. Evaluar la reducción de ENA, ENA1, ENB y ENB1 debido
a la acción de distintos microorganismos: levaduras del
género Saccharomyces spp., bacterias lácticas y
bacterias de la especie Bacillus subtilis.
3. Detectar la presencia de productos de degradación de
ENA, ENA1, ENB y ENB1 tras la descontaminación con
microorganismos.
4. Evaluar la capacidad bactericida de las ENs a elevadas
concentraciones sobre microorganismos probióticos
que se puedan emplear en estrategias de
descontaminación biológica.

! 64

! 65
III.PLAN DE TRABAJO

! 66

Plan de trabajo
! 67
Para alcanzar los objetivos propuestos, se ha diseñado un plan de
trabajo con las etapas siguientes:
1. Determinar la presencia de ENA, ENA1, ENB, ENB1 y BEA
en muestras de arroz recogidas en distintos supermercados
de la Comunidad Valenciana, mediante extracción con
Ultra-Turrax y posterior determinación de Cromatografía
Líquida acoplada a Espectrometría de masas (LC-MS/MS)
con triple cuadrupolo (QqQ).
2. Evaluar la reducción de ENA, ENA1, ENB, ENB1 y BEA el
procesado con tratamiento térmico de las muestras
contaminadas: cocción normal, cocción con exceso de
agua, en pH ácido y básico.
3. Evaluar la reducción in vitro de ENA, ENA1, ENB, ENB1
mediante la acción fermentativa de 37 cepas de levaduras
y bacterias probióticas tanto en medio de cultivo como en
una matriz alimentaria mediante LC-MS/MS-QqQ
4. Determinar la presencia de productos de biodegradación
tras la fermentación de levaduras y bacterias probióticas en
medio de cultivo, y en harina contaminada con ENA, ENA1,
Plan de trabajo
! 68
ENB, ENB1 mediante la técnica de cromatografía líquida
acoplada con trampa lineal de iones (LC-MS-LIT).
5. Evaluar la capacidad bactericida de ENA, ENA1, ENA2,
ENB, ENB1 y ENB4 sobre microorganismos probióticos
mediante bioensayo con antibiograma.

! 69
IV.MATERIAL, MÉTODOS,
RESULTADOS Y DISCUSIÓN

! 70

Material, métodos, resultados y discusión
! 71
1. Thermal processing effect on emerging Fusarium
mycotoxins present in naturally contaminated rice
samples of Spain.
1.1. Introduction
BEA and ENs are bioactive compounds that produce a
wide range of biological activities, including antibacterial,
insecticidal, phytotoxic and cytotoxic effects (Tedjiotsop et al.,
2010).
Rice (Orya sativaL.) is the second cereal most produced in
the world, wheat being the first (Hussain et al, 2009). This grain is
an essential source of carbohydrates and the principal source of
these macronutrients in Asiatic countries; it is also growth with
high humidity, so it is considerably susceptible of being
contaminated with mycotoxins (Serrano et al.,2012b). When
calculating human exposure to the emerging mycotoxins, we have
to consider that grains are consumed after a thermal food
processing, so it is important to assess how the cooking process
affects the levels of BEA and ENs.

Material, métodos, resultados y discusión
! 72
Usually, risk assessment studies are carried out by
comparison of the mycotoxin levels from the monitoring studies
with the corresponding provisional maximum tolerable daily
intake (PMTDI) established by the Joint FAO/WHO Expert
Committee on Food Additives (JECFA) and the European
Authority of Food Safety (EFSA). At the moment, studies of this
type have not been carried out for emerging Fusarium mycotoxins
in previous works. However, it is possible to perform an approach
to the risk assessment comparing the levels of emerging Fusarium
mycotoxins with the TDIs established for other Fusarium
mycotoxins, such as T-2 toxin and HT-2 toxin or deoxynivalenol
(EFSA, 2011; Serrano et al., 2012c).
Treatments of raw materials reduce the concentration the
mycotoxins but the majority of these bioactive compounds
tolerate the range of domestic temperatures (80-120ºC) (Kabak et
al., 2009). The emerging fusariotoxins BEA and ENs are affected
the baking and brewing process of wheat samples (Meca et
al.,2012b; Vaclavikova et al., 2012). The effect of food processing
on other mycotoxins has been extensively described by many
authors. Kushiro (2008), reviewed the effect of processing on the

Material, métodos, resultados y discusión
! 73
Fusarium mycotoxin DON present on wheat samples. The highest
contamination being located in the outer skin of the kernel, germ
and bran fraction, the process of cleaning and milling leads to a
fractionation of the contamination with DON reduction in the
flour fraction. The effect of different cooking methods on AFB1
and OTA on rice samples has been assessed in Pakistan by
Hussain and Lutfullah (2009), the study revealed high reduction
rates from 75,9% to 87,5%. In rice samples from Korea, the
thermal treatment produced a reduction on the AFB1
contamination and its mutagenic potential (Park et al., 2006). On
the other hand, some authors indicate that detoxification of
cereals depends on the pH of the liquid medium of processing. In
Central America, maize is submitted to an alkaline cooking
process called nixtamalization, which reduces AFB1 content up to
92 % (Mendez Albores et al., 2004). Studies performed in AFB1
contaminated sorghum samples treated with heat and pressure in
an extruder, employing different concentrations of citric acid and
temperatures, revealed that those factors affected significantly
the detoxification process, as the citric acid concentration
increased, the amount of aflatoxins decreased.

Material, métodos, resultados y discusión
! 74
In this context, the aim of this study was to assess the following
objectives: (1) providing data on the natural occurrence of ENs
and BEA in different types of rice from the Spanish market by
liquid chromatography coupled to triple quadrupole mass
spectrometer detector (MS/MS QqQ) determination, (2) evaluate
the effect of different cooking methods in the emerging
mycotoxin content and (3) the approach to the risk assessment of
ENs and BEA by evaluation of the dietary exposure.
1.2. Materials and methods
1.2.1. Chemicals and agents
Acetonitrile and methanol, all of HPLC grade, were
purchased from Merck (Damstadt, Germany). Deionized water
was obtained from a Milli-Q water purification system (Millipore,
Bedford, MA, USA). The stock standard solutions of BEA and
ENA, ENA1, ENB and ENB1 were purchased from SigmaeAldrich
(St. Louis, MO, U.S.A.). All stock solutions were prepared by
dissolving 1 mg of the mycotoxin (BEA, FUS or ENs) in 1 mL of
pure methanol, obtaining a 1mg/ml solution. These stocks
solutions were then diluted with pure methanol in order to obtain

Material, métodos, resultados y discusión
! 75
the appropriated work solutions. All solutions were stored in
darkness at -20ºC until the LC.
1.2.2. Sampling procedure
Twenty samples of rice were collected from different
supermarkets of Valencia (Spain) (n=20). Some samples are
collected from white rice (n=12). According to de Codex
Standard of Rice (CODEX STAN 198-1995) white rice or milled
rice is husked rice from which all or part of the bran and germ
have been removed by milling. According to the national quality
standard, white rice grain’s, must be lacking in pericarp cuticle
and have a uniform white colour. Other samples came from
ecological or organic production harvested is Spain (n=8).
Organic samples presented the following characteristics: white
rice (n=2), whole rice (n=2) and paddy rice (n=4), which have
retained its husk after threshing, and presented black (n=2) and
red husk (n=2). Raw samples were stored in sealed plastic bags
under refrigeration (4ºC).

Material, métodos, resultados y discusión
! 76
1.2.3. Thermic treatment of rice
Collected samples were submitted to two types of cooking
with a commercial electric cooker. Ordinary cooking reproduces
the traditional recipe in Spain: 20 g of rice was cooked in 100 ml
of distilled water. Twenty minutes were required to cook the rice
after the water stats to boil at 100ºC. The same procedure was
carried out employing an excess of water (400ml). After cooking,
the excess of water was drained off. Two samples of white were
rice were also submitted to alkaline and acid cooking, with
calcium carbonate (pH 9,2) and citric acid (pH 3,5). To obtain an
acid medium, we added 25ml of lemon juice to 1 L of distilled
water. A solution with 750 mg of calcium carbonate for 1 L was
prepared for the alkaline cooking. The pH of both medium was
measured by a calibrated pH-meter.
1.2.4. Mycotoxin Extraction
Before extraction, raw samples were blended. The method
used for the analysis of the mycotoxins (BEA and ENs) was
reported by Jestoi (2008). Briefly, 5 g of rice was extracted with
50 ml of acetonitrile using an Ultra Ika T18 basic Ultra-turrax
(Staufen, Germany) for 5 min. The extract was centrifuged at

Material, métodos, resultados y discusión
! 77
4500g for 15 min and then the supernatant evaporated to dryness
with a Büchi Rotavapor R-200 (Postfach, Switzerland). The extract
was dissolved with 5 mL of AcN, and was evaporated to dryness
by nitrogen gas at 35ºC using a multi-sample Turbovap LV
Evaporator (Zymark, Hoptikinton, USA). After solvent evaporation,
the extract was reconstituted with 1000 lL of AcN/MeOH (50/50
v/v), and was filtered through 13 mm/0.20 lm nylon filter
(Membrane Solutions, Texas, USA) prior the injection in the LC–
MS/MS system.
1.2.5. Analysis
A Quattro LC triple quadrupole mass spectrometer from
Micromass (Manchester, UK), equipped with an LC Alliance 2695
system (Waters, Milford, MA, USA) consisting of an autosampler,
a quaternary pump, a pneumatically assisted electrospray probe,
a Z-spray interface and a Mass Lynx NT software version 4.1 were
used for the MS/MS analyses. The separation was achieved by a
Gemini-NX C18 (150 x 2 mm I.D., 3 µm particle size) analytical
column supplied by Phenomenex (Barcelona, Spain), preceded by
a security guard cartridge C18 (4 x 2 mm I.D.), using gradient
elution that started at 90% of A (AcN) and 10% of B (20 mM

Material, métodos, resultados y discusión
! 78
ammonium formate in MeOH), increased linearly to 50% B in 10
min. After, it was decreased linearly to 10% of B in 3 min.
Afterwards, the initial conditions were maintained for 2 min. Flow
rate was maintained at 0.2 mL min-1. The analysis was performed
in positive ion mode. The electrospray ionization source values
were as follows: capillary voltage, 3.50 kV; extractor, 5 V; RF lens
0,5 V; source temperature, 100ºC; desolvation temperature,
300ºC; desolvation gas (nitrogen 99.99% purity) flow, 800 L h-1;
cone gas 50 L h-1 (nitrogen 99.99% purity). Ideal fragmentation
conditions were accomplished varying the cone voltage and
collision energies for each compound. The cone voltage selected
was 40 V for the fragmentation of ENA, ENA1, ENB, ENB1 and
BEA. The collision energy selected was 35 Ev for ENA, ENA1,
ENB and ENB1 and 40 Ev for BEA. The analyser settings were as
follows ones: resolution 12.0 (unit resolution) for the first and third
quadrupoles; ion energy, 0.5; entrance and exit energies, -3 and
1; multiplier, 650; collision gas (argon 99.995% purity) pressure,
3.83 x 10⁻³ mbar; interchanel delay, 0.02 s; total scan time, 1.0 s;
dwell time 0.1 ms. The mass spectrometer was operated in
Multiple Reaction Monitoring (MRM) mode. According to the
European Union criteria (Commission Decision, 2002), which

Material, métodos, resultados y discusión
! 79
establishes that a substance can be identified using LC–MS/MS in
MRM mode by at least two transitions, the follow precursor ion
and product ions was selected for each mycotoxin: the precursor
ion m/z 681.9 [M + H]+ and the product ions m/z 228.2 and 210.0
for ENA, the precursor ion m/z 667.9 [M + H]+ and the product
ions m/z 228.2 and 210.0 for ENA1, the precursor ion m/z 639.8
[M + H]+ and the product ions m/z 214.2 and 196.2 for ENB, the
precursor ion m/z 654.9 [M + H]+ and the product ions m/z 214.2
and 196.2 for ENB1, the precursor ion m/z 784.4 [M + H]+ and
the product ions m/z 244.0 and 262.0 for BEA.
1.2.6. Approximation to the dietary exposure of BEA and ENs in
rice
The approximation of the dietary exposure to BEA and ENs
present rice in the Spanish population was carried out by
calculation of the the Estimated Daily Intakes (EDIs) as follows:
EDI (μg/Kg bw/day)= concentration μg/Kg x consumption (Kg/Kg
bw/day).

Material, métodos, resultados y discusión
! 80
The EDI was calculated in different cases: considering the
mean concentration of ENS and BEA, and also in the most
unfavourable situation, that is that a sample was contaminated
with the maximum amount reported for each mycotoxin. The
calculation was performed considering the contamination in raw
rice samples, and after the regular hydro-thermal treatment. Rice
consumption data are available in the database of the Spanish
Ministry of Agriculture, Food and Environment (MAGRAMA,
2013). The Spanish consumption of rice is 4,40 kg/person/year,
considering the data avalaible from June 2012 to June 2013. In
the Valencian region, the consumption of rice is more important
due to the specific traditional dishes prepared there, so the EDI
was calculated also for the Valencia population, where the rice
intake is 6,32 kg/person/year. Assuming 70 kg as the mean of
body weight (bw) for the Spanish and Valencian population, the
daily consumption per kg of bw was calculated.
1.3. Results and discussion
1.3.1. Method validation
The analytical method was validated in-house for rice
samples. The evaluation of the matrix effects for each mycotoxin

Material, métodos, resultados y discusión
! 81
was performed by the use of matrix-assisted calibration curves. A
mixture of extracts of dry rice, where none of the studied
mycotoxins was detected, was used as a blank sample in order to
ensure results representatively. Calibration curves were
constructed for each studied mycotoxin from the standards
prepared in methanol and from the standards prepared in extract
of blank sample. The standards were prepared at six
concentration levels: 0.025–25 µg kg-1 for ENA and 0.05–50 µg kg-
1 for ENA1, ENB, ENB1 and BEA. Suppression of the signal (SS)
was obtained for all mycotoxins (between 53.0% and 78.6%). For
more certain results, matrix effects were evaluated using blank
extracts of rice. The evaluation of the linearity, limits of detection
and quantification, accuracy and precision was performed using
matrix assisted calibration curves from a mixture of blank samples
(mixture of different rice). For the evaluation of the linearity,
calibration curves were constructed at six concentration levels:
0.025–25 µg kg-1 for ENA, and 0.05–50 µg kg-1 for ENA1, ENB,
ENB1 and BEA. The results showed good linearity with good
correlation coefficients (r2 > 0.992). The detection limits (LODs)
were calculated using a signal-to-noise ratio of 3. The limits of
quantification (LOQs) were calculated using a signal-to-noise ratio

Material, métodos, resultados y discusión
! 82
of 10. The LOQs and LODs obtained for ENs, BEA and FUS are
presented in the Table 2. The accuracy was evaluated through
recovery studies at two concentration levels, LOQ (low level) and
100 LOQ (high level). Intra-day precision was assessed by five
determinations at each addition level in the same day, while inter-
day precision was assessed by one determination at each addition
level during five days. The mean recoveries and the
corresponding relative standard deviations (RSDs) are presented
in Table 2. RSD values ranged between 4% and 11% for intra-day
precision, and between 5% and 15% for inter-day precision.
Recovery ranges for the low spiked level (LOQ) and the high
spiked level (100 xLOQ) were 85–110% and 86–112%,
respectively. Therefore, the results were in accordance to the
limits set in Commission Decision, 2002 /657/EC: a mean recovery
(n = 5) between 70% and 120%, and a RSD lower than 20%.

Material, métodos, resultados y discusión
! 83
Mycotoxin Recovery ± RSD (intra-day precision)a
Recovery ± RSD (inter-day precision)b
LOQ (µg/kg)
LOD (µg/kg)
Low level
(LOQ)
High level (100
xLOQ
Low level
(LOQ)
High level (100
xLOQ) ENA 92 ± 5 91 ± 4 93 ± 8 90 ± 6 0.50 0.15
ENA1 88 ± 7 86 ± 9 85 ± 11 88 ± 8 0.25 0.08 ENB 109 ± 8 112 ± 6 110 ± 8 109 ± 9 0.50 0.15
ENB1 99 ± 10 97 ± 11 97 ± 13 95 ± 15 0.50 0.15 BEA 93 ± 6 94 ± 4 96 ± 7 94 ± 5 0.10 0.02
aNumber of replicates, 5.bDifferent days, 5. Table 2. Analytical parameters: recoveries (%), relative standard deviations (%) and limits of detection and quantification (µg/kg)
1.3.2. Occurrence of BEA and ENs in raw samples
All the market rice samples studied were contaminated
with emerging fusariotoxins. The 4 ENs analysed were present in
100% of the samples. Regarding BEA, this compound was
detected in 17% of the rice samples produced by conventional
practices, and in 100% of the organic rice. The concentracions of
ENA, ENA1, ENB, ENB1 and BEA evidended in organic and
conventional rice samples are represented in table 3.

Material, métodos, resultados y discusión
! 84
Mean concentration
( µg/kg )
Positive samples
(%)
Mínimum Concentration
( µg/kg )
Máximum concentration
( µg/kg ) ENA Conventional
rice n=12 129,34 100,00 70,9 268,85
Organic rice n=8
320,34 100,00 52,81 617,5
ENA1 Conventional rice n=12
16,43 100,00 5,78 32,10
Organic rice n=8
18,94 100,00 7,86 41,08
EN B Conventional rice n=12
12,77 100,00 4,83 29,46
Organic rice n=8
21,91 100,00 6,35 42,27
EN B1
Conventional rice n=12
13,90 100,00 7,25 28,48
Organic rice n=8
13,37 100,00 6,89 26,36
BEA Conventional rice n=12
127,58 17,00 - 765,51
Organic rice n=8
298,74 100,00 74,6 839,96
Table 3. ENs and BEA concentrations in ecological and conventional rice samples
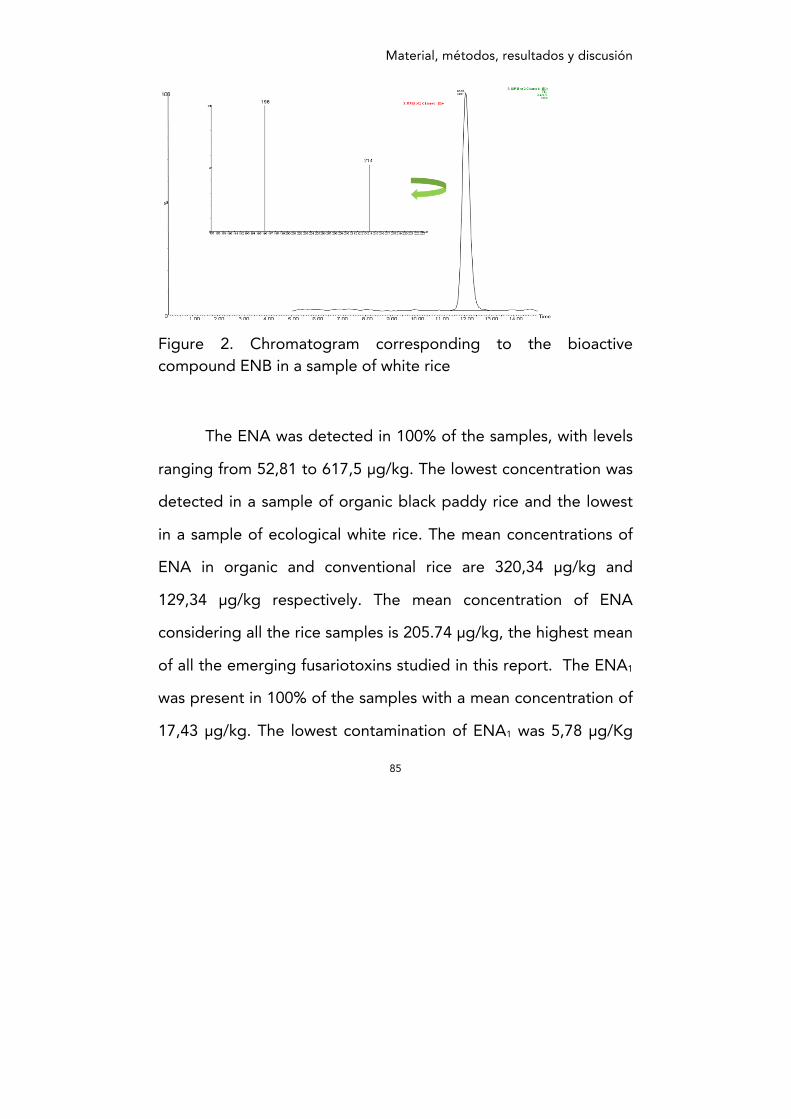
Material, métodos, resultados y discusión
! 85
Figure 2. Chromatogram corresponding to the bioactive compound ENB in a sample of white rice
The ENA was detected in 100% of the samples, with levels
ranging from 52,81 to 617,5 µg/kg. The lowest concentration was
detected in a sample of organic black paddy rice and the lowest
in a sample of ecological white rice. The mean concentrations of
ENA in organic and conventional rice are 320,34 µg/kg and
129,34 µg/kg respectively. The mean concentration of ENA
considering all the rice samples is 205.74 µg/kg, the highest mean
of all the emerging fusariotoxins studied in this report. The ENA1
was present in 100% of the samples with a mean concentration of
17,43 μg/kg. The lowest contamination of ENA1 was 5,78 µg/Kg

Material, métodos, resultados y discusión
! 86
and the highest contamination was of ENA1 41,08 µg/kg reported
in a sample of organic red paddy rice. The mean concentrations
of organic and conventional samples are 18,94 µg/kg and 16,43
µg/kg. Considering ENA1, no significant difference is detected in
both groups. ENB was present in 100% of the samples studied,
with concentrations ranging from 4,83 µg/kg in a sample of
conventional white rice, to 42,27 µg/kg. The highest
contamination of ENB was detected in the same sample with
highest ENA1 concentration. The mean concentration of ENB in
the samples analysed is 16,42 µg/kg. Comparing the results in
two groups, the mean concentration of this compound in organic
rice is the double than in conventional rice, 21.91 µg/kg and 12.77
µg/kg respectively. The mean concentration of ENB1 is 13,73
µg/kg. No difference was signalled between the mean
contaminations of ENB1 in organic o conventional rice. ENB1 was
detected in all the samples studied. The lowest concentration of
this mycotoxin corresponds to a sample of organic red rice.
BEA was found in 100% of the ecological samples studied.
The highest level of mycotoxins of this study corresponds to
839,96 µg/kg of BEA in a sample of organic black paddy rice that

Material, métodos, resultados y discusión
! 87
was also contaminated with ENs. Regarding the ratio between
ENs concentrations, the results is as follows:
ENA>ENA1>ENB>ENB1. The means of the contaminations in all
the samples of ENA and BEA are 205,74 µg/kg and 196,05 µg/kg
respectively. These levels are 10 times higher than the
contamination of the rest of the mycotoxins studied. The samples
that presented the highest levels of ENA, ENA1, ENB and BEA
corresponded to paddy rice, which has retained the husk. These
results agree with the works of Bullerman and Bianchini, (2007)
and Lancova (et al., 2008), who affirmed that the most mycotoxin
contaminated parts of the cereals are the husk and the bran
fraction.
The prevalence of emerging mycotoxins in cereals in the
Spanish Market has been recently assessed in different food
matrices such as grains, nuts, and cereal-based foods. Serrano et
al., (2012a) reported the results of ENs, BEA and FUS presence in
forty-five samples of infant formula collected in the Spanish
market. The frequencies of contamination were 46.6 and 20.0%
respectively with ENs and FUS, whereas all analyzed samples
were free of BEA. The ENB1 was the more detected mycotoxin

Material, métodos, resultados y discusión
! 88
with levels ranging from 11.4 to 41.9 mg/kg. Tolosa et al., (2013)
has evidenced the presence of BEA and ENs in dried fruits and
nuts available in supermarkets of Valencia (Spain). The presence
of emerging Fusarium mycotoxins (ENs and BEA) was determined
in samples of nuts and dried fruits commercialized in Valencia.
The results obtained showed high levels of contamination
(mg/kg). The percentage of the total contamination of samples
analysed with ENs was 50% for fruit nuts, 80% for shell nuts,
35.7% for dried fruits and 83.3% for dates.
According to the study Meca et al, (2010b) where the
compounds ENA, ENA1, ENB, ENB1, BEA and FUS were analysed
in cereal samples of Spain, ENA1 was the most prevalent
mycotoxin. The highest contamination was 814,42 mg/kg in a
sample of rice. The prevalence of the other ENs was under 10%.
BEA was detected in 32 % of the samples, with a maximum
concentration of 9,31 mg/kg. Sifou et al., (2011) evidenced the
presence of the minor fusariotoxins BEA and ENs in rice samples
of Morocco, ENB was the ENS most frequently isolated: 30% of
the samples with levels ranging 4,4 to 26, 2 mg/kg. Oueslati et
al., (2011), reported high prevalence of ENS in cereals of Tunisia.

Material, métodos, resultados y discusión
! 89
ENs, BEA and FUS were analysed in 51 samples of cereals and
cereals based products, and the results showed that 96% of the
samples were contaminated with ENS. The most frequently found
was ENA1 in 92,1% of the samples, with levels ranging from 11,1
to 480 mg/kg.
The prevalence of ENS and BEA in grains of Northern
European Countries has been reviewed by Uhlig (et al., 2007). The
relative concentration ratio was ENB>ENB1>ENA1<ENA<BEA. In
Norway, the highest contamination corresponds to 5800 µg/kg of
ENB in wheat. In Finnish grains, the highest contamination was
18300 µg/kg of ENB in spring wheat. Malachova (et al., 2011)
assessed the occurrence of the fusariotoxins in cereal-based foods
from the Czech Market. ENA was the most prevalent ENS,
isolated in 97% of the samples with concentrations ranging from
20 to 2532 µg/kg, followed by ENB in 91% of the samples and
levels from 13 to 941 µg/kg. High levels of BEA had been
detected in maize samples from Italy by Ritieni (et al., 1997) with
contamination of BEA up to 520 mg/kg, and co-occurrence with
the compounds FUS and FB1.

Material, métodos, resultados y discusión
! 90
1.3.3. Reduction of emerging mycotoxins in cooked samples
Rice samples (n=20) naturally contaminated with ENs and
BEA were submitted to ordinary cooking and cooking with excess
water. For both processes, the cooking time was 20 minutes, the
time necessary for the final product to present an adequate
texture.
The results can be seen in Figure 3. For all the mycotoxins,
it is evidenced a significant loss of mycotoxins after hydrothermal
treatment, nevertheless regular domestic cooking process didn’t
result in a complete degradation of the ENs and BEA. The loss of
mycotoxins by regular cooking ranged from 29% to 63% in the
case of ENB1 and BEA respectively, and when the excess of water
was employed, the reduction ranged from 32% for the ENA1 to
100% in the case of the BEA. These results agree with the reviews
on the effect of processing on mycotoxins published by Bullerman
and Bianchini (2007), and Kabak (2009), who affirmed that
mycotoxins are thermo tolerant in the range of domestic
temperatures (80-120ºC).

Material, métodos, resultados y discusión
! 91
Figure 3. Percentage of reduction of ENS and BEA in naturally contaminated rice samples (n=20) by normal cooking and cooking in excess of water (%)
In the case of ENA, ENB1 and BEA, cooking in excess water
improved de contamination rates, (61%, 48%, 100%) compared to
the regular cooking method (43%, 29% and 63%). The use of
additional water led to the complete loss of BEA. Reduction of
mycotoxins during processing might occur because they are
washed away, destroyed, bound to a food matrix or transformed
in unknown decomposed products. In the latter two cases, it
cannot be assumed that the reduction means decreased toxicity.
0!
20!
40!
60!
80!
100!
120!
ENA! ENA1! ENB! ENB1! BEA!
%"ENs"reduction"
regular water
excess of water

Material, métodos, resultados y discusión
! 92
Meca et al., (2012b) assessed the influence of heat
treatment on the minor Fusarium mycotoxin BEA at 160, 180 and
200ºC a range o temperatures higher than in our study. In a
model solution, the application of 200ºC for 20 min produced the
total degradation of BEA, in a food system (crispy breads) the
percentage of BEA degradation, resulted variable from 20 to
90%, and proportional to the temperatures and the incubation
times employed. Particularly at the temperature of 160º C during
20 minutes, BEA decreases from 5 mg/kg 2.8 mg/kg, evidencing
a percentage of degradation of 43%. Also a metabolite of the
thermic degradation of BEA was identified using the LC-MS in the
full scan mode.
The effect of baking and brewing procedures has been
monitored by Meca et al., (2013b), significant reduction on the
contamination of raw wheat was evidenced during bread making,
with BEA loss ranging from 75 to 95%, and during beer making
from 23 to 82%. The highest degradation activity of BEA for both
beer and bread was evidenced during the heat and fermentation
processes. Regarding the effect of baking and brewing
technologies on ENs, Vaclavikova et al., (2012) concluded that

Material, métodos, resultados y discusión
! 93
significant decline of ENs occurred within both processes, with
the largest drop in their concentrations observed in the brewing
process. Regarding bread baking, levels of ENs decreased down
to 30% of their concentration in the initial flour used for baking.
The fate of other mycotoxins during thermic treatment of
rice has been described by other authors. Hussain and Luttfullah
(2009) described the reduction of the carcinogenic mycotoxins
AFB1 and OTA in basmati rice samples of Pakistan. The results
were in accordance with ours, since the highest reduction rates
were reported in rice samples cooked in excess water (87,5 % and
83%), followed by that cooked by normal cooking (82,5% and
76,6%) and finally by the microwave oven cooked rice (77,6% and
75,9%).
Park et al., (2006) determined the loss of AFB1 by HPLC in
naturally contaminated rice samples by pressure-cooking and the
reduction of aflatoxin mutagenic potential by the Ames test with
Salmonella typhimurium. Cereal samples were cooked in an
ordinary cooker and in a pressure cooker for 20 min at 160ºC.
Traditional cooking produced a loss of 31-36% of the initial

Material, métodos, resultados y discusión
! 94
concentration, and the pressure-cooking induced a loss of 78-
88%. The reduction of the aflatoxin- induced mutagenic potential
was in agreement with the HLPC results, with an important
reduction for the pressure-cooked rice (71-68%) and a lower
reduction on the ordinary cooked rice (23-19%).
The reduction on the concentration of ENs and BEA of two
conventional samples of white rice in acid and alkaline medium,
by adding citric acid or calcium carbonate to the cooking water is
represented in Figure 4.
Figure 4. Effect of hydro-thermic treatment of white rice (n=2) in acid and alkaline medium
0!10!20!30!40!50!60!70!80!90!100!
ENA! EN!A1! EN!B! EN!B1! BEA!
% E
Ns r
educ
tion
Regular water
Acid water
Alkaline water

Material, métodos, resultados y discusión
! 95
When the pH was acidic, the loss of ENs ranged from 86
and 91%, and BEA degradation was 89%. Alkaline cooking led to
ENs decrease from 88 to 94% and BEA reduction of 89%.
Mycotoxin detoxification of many cereals and cereals-based foods
depends on the pH of the processing medium. Detoxification of
DON in Canadian barley by sodium carbonate (Na2CO3) and heat
had been described by Abramson et al., (2005). The treatments
were performed at different concentrations of Na2CO3 and
temperatures during 0,1,3,5 and 8 days. With 20% 1M Na2 CO3,
DON was reduced from 18,4 µg/Kg to 0,14 µg/Kg after one day
of treatment. After 8 days DON was undetectable by enzyme-
immune analysis. Traditional tortilla making with corn in Central
America is carried out in alkaline medium; the process is called
nixtamalization. During this process, the grains are cooked in
abundant water (2-3 L of water/ corn Kg) with 1-3% of calcium
hydroxide during 35-70 min. Traditional nixtamalization reduces
92% of the contamination of AFB1 (Méndez-Albores et al., 2004).
This treatment causes an important environmental damage,
because an important amount of water organic materials and high
pH is generated. Alternative methods employing less water (0,8
L/corn Kg) are studied, but the percentage of AFB1 reduction

Material, métodos, resultados y discusión
! 96
decreases to 61-78 %. In sorghum samples contaminated with
AFB1, Méndez-Albores et al., (2009) studied the effect of heat,
pressure, and different citric acid concentration. The highest
reduction (92%) was observed in the case of products treated at
pH 3,7. In vivo assays shown that the addition of 1N aqueous
citric acid to duck feed contaminated with AFB1 reduced its
carcinogenicity and mutagenesis (Méndez-Albores et al, 2007).
1.3.4. Approximation to the dietary exposure of ENS and BEA in
rice
The EDI of emerging mycotoxins in rice is based in the
analytical data obtained and the reports of rice consumption of
the Spanish and also the Valencian population available in the
database Ministry of Agriculture, Food and Environment of Spain.
Calculation data were performed considering the sum of the
mean concentration of the ENs + BEA and also in the most
unfavourable case, considering the maximum concentrations
reported for each compound. Reduced levels after regular
cooking were also used in the approximation to the dietary
exposure.

Material, métodos, resultados y discusión
! 97
The EDIs of emerging fusariotoxins in Spain and in the
Valencian Region are 0,08 µg/Kg bw/day and 0,11 µg/Kg bw/day
respectively, considering the occurrence of ENs and BEA in raw
rice. Considering the loss mycotoxins in cooked samples, the EDI
of the Spanish population is 0,06 µg/Kg bw/day and 0,08 µg/Kg
bw/day in the specific case of Valencia.
With the data available at the moment, it is not possible to
confirm that ENs and BEA represent a risk for Spanish rice
consumers, since European Food Safety Authority (EFSA) has not
established a tolerable daily intake for group of mycotoxins.
However, it is possible to achieve an approximation with the TDIs
established for other Fusarium mycotoxins, DON, NIV, toxins T-2
and HT-2, FBs fixed in the EFSA scientific publications (1; 1,2; 0.1
and 2 µg/Kg bw/day, respectively) (EFSA, 2013, 2011, 2003,
1999). The minimum TDI corresponds to the HT-2 and T-2 toxins,
with 0,1 µg/Kg bw/day. The EDI calculated are in the same order
than the TDI of the most toxics fusariotoxins HT-2 and T-2.
According to the calculation in the most unfavourable case, the
EDI in cooked rice sample is higher than the TDI of HT-2 and T-2
for both Valencian and Spanish populations.

Material, métodos, resultados y discusión
! 98
ENs+BEA (µg/kg)
EDI in Spain (μg/Kg bw/day)
EDI in the Valencian Region (μg/Kg bw/day)
Raw rice mean concentration
449,39 0,08 0,11
Raw rice maximum concentration
1569,29 0,27 0,39
Cooked rice mean concentration
337,34 0,06 0,08
Cooked rice maximum concentration
731,42 0,12 0,18
Table 4. Estimated daily intake (EDI) of ENs and BEA of present in rice in the Spanish and Valencian population

Material, métodos, resultados y discusión
! 99
2. Reduction of the enniatins A, A1, B, B1 by an in vitro
degradation employing different Saccharomyces and
acid lactic bacteria strains: identification of
degradation products by LC-MS-LIT
2.1. Introduction
In the scientific literature there is a lack of data related to
the degradation of ENs, whereas the degradation of other
fusarotoxins had been studied by other authors. Related to the
methodologies employed for the reduction BEA in the scientific
literature a US patent (Duvick and Rod, 1998) is the first report on
the biological detoxification this coumpound is available. Meca et
al. (2012a) evaluated the interaction between the minor Fusarium
mycotoxin 13 bacterial strains characteristic of the gastrointestinal
tract. The fermentations were carried out in the liquid medium of
MRS during 4, 12, 16, 24 and 48 h at 37ºC, under anaerobic
conditions. All the bacteria studied showed a significant BEA
reduction during the fermentation process, in particular the mean
diminution resulted variable from 66 to the 83%.

Material, métodos, resultados y discusión
! 100
Poppenberger et al. (2003) demonstrated that the enzymes
purified by several plants, employing chromatographic
techniques, detoxify completely the Fusarium mycotoxins
deoxinivalenol (DON) and 15-acetyl-deoxynivalenol (15-Ac-DON).
The degradation of trichothecenes mycotoxins by several
microbes has been investigated by Young et al. (2007) and Guan
et al. (2009). The two principally degradation pathways evidenced
by the authors were: deacylation and deepoxydation. The
degradation of the FB1 by microbial enzymes was studied by Heinl
et al. (2010). The authors using chromatographic techniques
isolated two enzymes by liquid culture of the bacterium
Sphingopyxis MTA144, responsible of the detoxification of the
FB1. Islam et al. (2012), isolated several microorganisms from soil
samples with the capacity to degrade the mycotoxin DON to de-
DON in vitro, employing the mineral salt broth as growth medium
(MSB).
Considering the lack of data related to the biological
degradation of the minor Fusarium mycotoxins ENs, the aims of
this study were: a) to evaluate the reduction in vitro of the ENs
employing different probiotic and Saccharomyces cerevisiae
Material, métodos, resultados y discusión
! 101
strains; b) to study the ENs reduction in food system composed
by wheat flour through microbial fermentations carried out by the
probiotic strains and c) to study the ENs degradation products
formed during the fermentation processes employing the
technique of the liquid chromatography coupled to the linear ion
trap (LC-MS-LIT).
2.2. Materials and methods
2.2.1. Chemicals
A stock standard solution of ENs A, A1, B, B1 (98% of purity)
(Sigma-Aldrich, St. Luis, USA) was prepared by dissolving 1 mg of
standard in 1 mL of pure methanol, obtaining a 1 mg ENs/ml
(1000 µg/mL) solution. This stock solution was then diluted with
methanol in order to obtain the appropriated work solutions with
concentrations of 1, 10 and 100 mg/L. All the ENs solutions were
stored in darkness at 4ºC until the LC-MS/MS analysis.
Acetonitrile, methanol, water, ethyl acetate, sodium chloride
(NaCl) (all of LC grade) and acetic acid were purchased from
Merck (Whitehouse Station, NJ, USA).

Material, métodos, resultados y discusión
! 102
2.2.2. Strains and methodology
The study was carried out using nine strains probiotic
bacteria, named Bifidobacterium longum, Bifidobacterium
bifidum, Bifidobacterium breve, Bifidobacterium adolescentes,
Lactobacillus rhamnosus, Lactobacillus casei-casei, Streptococcus
thermofilus, Lactobacillus ruminis, Lactobacillus casei and twenty
two strains of Saccharomyces cerevisiae. The strains were
obtained by the Spanish Type Culture Collection (CECT Valencia,
Spain) and the Istituto Delle Scienze delle Produzioni Alimentari
(Bari), in sterile 18% glycerol.
For longer survival and higher quantitative retrieval of the
cultures, they were stored at –80 ºC. When needed, recovery of
strains was undertaken by two consecutive subcultures in
appropriate media prior to use. The microbes were cultured in
15mL sterile plastic centrifuge tubes utilizing as growth medium
10 mL of DeMan-Rogosa-Sharpe (MRS broth, Oxoid Madrid,
Spain) for Bifidobacteria, Streptococcus, and Lactobacillus, and
Sabouraud Broth for yeast strains. (SB broth, Oxoid Madrid,
Spain). For the bacteria, the tubes were incubated at 37ºC, in an
anaerobic atmosphere with 95% CO2 and 5% H2 during 48h. For

Material, métodos, resultados y discusión
! 103
the yeasts, tubes were incubated at 30ºC in an aerobic milieu.
Then, the suspensions of each strain at concentrations of 108
CFU/ml were added to a fresh 10 mL of MRS or SB contaminated
with 5mg/L of the mycotoxins ENs A, A1, B, and B1, and incubated
at 37ºC in an anaerobic atmosphere with 95% CO2 and 5% H2
during 48h for the bacteria, at 30ºC and aerobic atmosphere for
the yeasts.
The mediums were analyzed in order to determinate the
residual concentrations of ENs present in the growth medium and
also to identify the possible degradation products.
The strain of Fusarium tricinctum CECT 1036 was obtained
by the Spanish Type Culture Collection (CECT Valencia, Spain), in
sterile 18% glycerol. A solid medium of wheat was used for the
production of the ENs. Briefly, one hundred grams of solid wheat
was weighted in a 2 L Erlenmeyer flask, and a suspension of 106
conidia mL of Fusarium tricinctum CECT1036 growth during three
days in a Potato Dextrose Broth (PDB) preinoculum, was used for
inoculation of the medium. Conidial concentration was measured
by optical density at 600 nm and adjusted to 106 conidia mL in the

Material, métodos, resultados y discusión
! 104
Erlenmeyer flasks (Kelly et al., 2006). The fermentations were
carried out at 25ºC on an orbital shaker (IKA Ks 260 basic,
Stanfen, Germany) in batch culture during 30 days. After that, the
wheat was grounded to obtain a finely flour used for the ENs
reduction experiments in the food system.
2.2.3. ENs extraction from fermented mediums
The fermentation tubes were centrifuged at 4000 rpm
(Centrifuge 5810R, Eppendorf, Germany) during 5 min at 4ºC in
order to separate the fermented medium from the cells. ENs
contained in fermented mediums were extracted as follows
(Jestoi, 2008). Five mL of fermented MRS were introduced in a 20
mL plastic tube, and extracted three times with 5 mL of ethyl
acetate using a vortex VWR international (Barcelona, Spain)
during 1 min. After that the mixtures were centrifuged (Centrifuge
5810R, Eppendorf, Germany) at 4000 rpm for 10 min at 4ºC. The
organic phases were completely evaporated by a rotary
evaporator (Buchi, Switzerland) operating at 30ºC and 30 mbar
pressure, resuspended in 1 mL of methanol, filtered with 0.22 µM
filters (Pheomenex, Madrid, Spain) and analyzed by LC-MS/MS
(Meca et al., 2010d).

Material, métodos, resultados y discusión
! 105
2.2.4. ENs degradation in food system composed by wheat flour
Two grams of wheat flour naturally contaminated by ENs
through a microbial fermentation with a strain of Fusarium
tricinctum CECT 1036 were introduced in 14 mL plastic tubes.
Two milliliters of sterile water containing 1x10⁸ of microbial cells
were introduced. The tubes were incubated during 2 days at
room temperature.
2.2.5. ENs extraction by wheat flour
ENs were extracted according to the procedures described
by Jestoi (2008). Briefly, 2 g of wheat flour samples were
extracted with 20 mL methanol using an Ultra Ika T18 basic
Ultraturrax (Staufen, Germany) for 3 min. The mixture was
centrifuged at 4500g for 5 min and then the supernatant was
evaporated to dryness with a Büchi Rotavapor R-200 (Postfach,
Switzerland). The residue was re-dissolved in 2 mL of extraction
solvent. The extract was cleaned up using a Strata C18-E
cartridge (6 mL, 1 g). The cartridge was first activated with 2x2 mL
of methanol and conditioned with 2x2 mL of water before the
extract was loaded. The cartridge was then washed with 2x2 mL
of water at a flow rate of 0.5 mL/min till all water was out. ENs

Material, métodos, resultados y discusión
! 106
were eluted using 1 mL of methanol. Both the methanol eluate
and the water washing were filtered through 0.22 µM nylon filters
purchased from AnálisisVínicos (Tomelloso, Spain) before LC and
LC-MS analyses.
2.2.6. LC-MS/MS analysis of ENs
The method of analysis by MS/MS was optimized according
to the guidelines established by the European Commission
(Commission Decision, 2002), which establishes that a substance
can be identified using LC-MS/MS in MRM mode by at least two
transitions. The most abundant product ions were selected for
quantification and the second one for confirmation.
The optimization of MS/MS conditions was performed by
direct injection of individual standards at 100 μg/mL in “full
SCAN”, both positive and negative ESI mode. The most abundant
mass to-charge ratio (m/z) was selected for each compound of
interest. The mycotoxins exhibited precursor ions and product
ions with reasonably high signal intensities in positive ESI mode
(ESI+), being found protonated molecules [M+H]+, sodium adduct
ions [M+Na]+ and potassium adduct ions [M+K]+. [M+Na]+ and

Material, métodos, resultados y discusión
! 107
[M+K]+ adducts were removed with the addition of ammonium
formate at a concentration of 10 mM to the mobile phase and
with the increase cone voltage at 40 eV.
A Quattro LC triple quadrupole mass spectrometer from
Micromass (Manchester, UK), equipped with an LC Alliance 2695
system (Waters, Milford, MA) consisting of an autosampler, a
quaternary pump, and a pneumatically assisted electrospray
probe, a Z-spray interface and Mass Lynx NT software Version 4.1,
were used for the MS/MS analyses. The separation was achieved
by a Gemini-NX C18 (150 mm x 4.6 mm I.D., 5 μm particle size)
analytical column supplied by Phenomenex (Barcelona, Spain),
preceded by a guard column C18 (4 mm x 2 mm I.D.). The
analytical separation for LC-MS/MS was performed using gradient
elution with 90% of methanol (with 10 mM of formate ammonium)
as mobile phase A, and 10% of acetonitrile as mobile phase B,
increasing linearly to 50% B for 10 min; then, decreasing linearly
to 40% B for 3 min, and then gradually up to 10% B for 5 min.
Finally, initial conditions were maintained for 3 min. Flow rate was
maintained at 0.2 ml min. Analysis was performed in positive ion
mode (ESI+). The ESI source values were as follows: capillary

Material, métodos, resultados y discusión
! 108
voltage, 3.50 kV; source temperature, 100 ºC; desolvation
temperature, 300 ºC; cone gas 50l/h; desolvation gas (nitrogen
99.99% purity) flow, 800 l/h.
The analyzer settings were as follows: resolution 12.0 (unit
resolution) for the first and third quadrupoles; ion energy, 0.5;
entrance and exit energies, -3 and 1; multiplier, 650; collision gas
(argon 99.99% purity) pressure, 3.83 x 10⁻³ mbar; interchannel
delay, 0.02 s; total scan time, 1.0s; dwell time 0.1 ms. The mass
spectrometer was operated in multiple reaction monitoring
(MRM) mode. All time measurements were carried out in
triplicate. The MRM optimized parameters cone voltages and
collision energies were: 35 eV, 40V for ENs. The precursor and
product-ions selected were 681.9 [M+H]+, 228.2 and 210.0 for
ENA; 667.9 [M+H]+, 228.2 and 210.0 for ENA1; 639.8 [M+H]+,
214.2 and 196.2 for ENB; 654.9 [M+H]+, 214.2 and 196.2 for
ENB1.
2.2.7. Method performance
Method validation was carried out according to the
guidelines established by the European Commission (Commission

Material, métodos, resultados y discusión
! 109
Decision, 2002; Commission Regulation, 2006). The method
validation included the determination of linearity, limits of
detection (LODs), limits of quantification (LOQs), recoveries;
repeatability (intra-day precision) and reproducibility (inter day
precision).
In order to determine the linearity, calibration curves for
each studied mycotoxin were constructed from the standards
prepared in methanol and from the standards prepared in extract
of blank sample. All mycotoxins exhibited good linearity over the
working range (low concentration level at LOQ), and the
regression coefficient of calibration curves was higher than 0.992.
The LODs and LOQs were estimated from an extract of a
blank sample, fortified with decreasing concentrations of the
analytes. For 6 days additions were performed from three
different blank samples (n=18), to the estimated concentrations
for each mycotoxin. The LODs and LOQs were calculated using
the criterion of S/N ≥ 3 and S/N ≥ 10 for LOD and LOQ,
respectively. LODs for ENA, ENA1, ENB and ENB1 were 0.15,

Material, métodos, resultados y discusión
! 110
0.08, 0.15 and 0.15 μg/ kg. LOQs for ENA, ENA1, ENB and ENB1
were 0.5, 0.25, 0.5 and 0.5 μg /kg.
The recoveries, intra-day precision and inter-day precision
were evaluated by spiking different levels of standard analyte to
samples at two spiked levels (LOQ and 100 times LOQ). Relative
standard deviation (RSD) values ranged between 4 and 11% for
the intra-day precision, and between 5 and 15% for the inter-day
precision. Recovery ranges for the low spiked level (LOQ) and the
high spiked level (100 x LOQ) were 85-110% and 86-112%,
respectively. These values agree with EU criteria (European
Commission Decision, 2002).
2.2.8. Determination of the ENs degradation products with LC-
MS-LIT
The separation of ENs was achieved by LC Agilent 1100
(Agilent Technologies, Santa Clara, California) coupled to a mass
spectrometer, Applied Biosystems/MDS SCIEX Q TRAP TM linear
ion trap mass spectrometer (Concord, Ontario, Canada). A
Gemini (150 x 2.0 mm, 5 µm) Phenomenex (Torrance, California)
column was used. LC conditions were set up using a constant flow

Material, métodos, resultados y discusión
! 111
at 0.3 ml/min and acetonitrile/water (80:30, v/v with 0.1 % of
HCOOH) as mobile phases in isocratic condition were used. The
instrument was configured in the positive ion electrospray mode
using the following parameters: cone voltage 40 V, capillary
voltage 3.80 kV, source temperature 350ºC, desolvation
temperature 270ºC and collision gas energy 5 eV.
The analysis of the ENs degradation products employing
the technique of the liquid chromatography coupled to the ion
trap was carried out using the following procedure:
Characterization of the compound isolated with the modality of
ER scan, using the m/z range from 200 to 900 Da to obtain the
general spectra of the degradation compound. The utilization of
the mass spectrometry associated at the detection with the linear
ion trap, utilized in this modality permitted us to obtain a total
characterization of the compound isolated (Meca et al., 2012a).
2.3. Results and discussion
2.3.1. ENs degradation by acid lactic bacteria and Saccharomyces
strains in liquid medium.

Material, métodos, resultados y discusión
! 112
All the microbial strains tested showed a degradation
activities on the minor Fusarium mycotoxins ENs A, A1, B and B1 in
MRS and SB culture medium as is possible to observe in table 5.
In figure 5 are evidenced the LC-MS/MS chromatograms of the
ENs present in growth medium after the fermentation with
Saccharomyces cerevisiae ISPA10 and also the MS spectra that
confirms the presence of the bioactive compounds studied in the
fermentation extract.
Figure 5. LC-MS/MS chromatograms and daughter ion spectra of the ENs A, A1, B, and B1 present in the sample fermented by the strain of Saccharomyces cerevisiae ISPA10.

Material, métodos, resultados y discusión
! 113
% of Reduction
Strains A A1 B B1
Bb.longum CECT4551 97.9±2.3 94.0±2.2 34.1±1.1 69.2±1.1
Bb.bifidum CECT870 98.3±2.6 95.0±2.3 54.2±1.5 76.3±1.5
Bb.breve CECT4839 95.1±2.1 86.9±3.1 5.2±2.5 40.3±2.1
Bb.Adolescentis CECT4839
99.2±3.1 96.8±3.3 77.8±1.6 86.2±2.0
Lb.rhamnosus CECT278 99.2±3.6 98.4±2.5 72.1±2.3 91.1±3.2
Lb.casei-casei CECT4180
97.8±3.8 89.8±3.6 36.6±3.3 73.1±2.3
Lb.ruminis CECT 4061 98.2±2.4 92.0±2.3 45.5±2.0 69.9±2.5
Lb.casei-casei CECT 277
96.7±2.6 91.4±2.1 38.7±2.6 67.8±2.3
S.thermofilus CECT 986 99.5±2.0 98.7±2.0 76.7±1.5 91.9±2.8
S.cerevisiae ISPA13757 97.7±3.6 97.8±3.0 97.6±1.9 97.0±3.5
S.cerevisiae ISPA13751 98.0±3.4 94.7±3.3 96.3±2.4 94.0±3.7
S.cerevisiae ISPA13754 94.6±2.0 94.3±3.5 87.5±4.3 87.0±1.8
S.cerevisiae ISPA13758 94.3±2.1 85.7±2.3 93.4±2.3 81.0±2.9
S.cerevisiae ISPA13755 96,7±3.5 94.5±3.4 96.2±2.6 94.9±2.2
S.cerevisiae ISPA13749 93.7±3.4 92.6±3.3 77.9±3.6 81.9±3.6

Material, métodos, resultados y discusión
! 114
S.cerevisiae ISPA13756 98.4±3.5 98.4±2.3 97.7±3.3 97.5±3.1
S.cerevisae ISPA13750 93.2±1.2 90.5±2.5 83.2±3.1 82.9±1.3
S.cerevisiae ISPA13752 88.5±2.3 92.9±2.5 83.8±2.6 82.7±2.5
S.cerevisiae ISPA2 94.8±2.0 95.3±3.1 92.1±1.6 93.9±2.9
S.cerevisiae ISPA4 78.0±3.6 80.9±3.1 79.1±1.4 83.7±3.0
S.cerevisiae ISPA5 88.0±3.2 90.7±1.5 96.5±2.3 88.5±2.2
S.cerevisiae ISPA6 90.8±3.4 91.9±2.2 87.9±3.3 84.9±1.6
S.cerevisiae ISPA7 95.8±3.1 96.7±2.9 39.5±2.4 92.5±1.8
S.cerevisiae ISPA8 86.8±3.2 87.9±2.5 94.7±2.5 86.9±3.1
S.cerevisiae ISPA9 77.7±2.5 80.4±2.2 86.4±2.4 78.8±3.3
S.cerevisiae ISPA10 50.5±2.2 64.9±3.1 61.6±2.2 45.3±2.5
S.cerevisiae ISPA11 85.9±2.6 93.2±3.5 91.1±2.5 87.3±3.6
S.cerevisae ISPA12 62.2±2.2 81.2±2.3 78.0±1.6 80.5±2.4
S. cerevisae ISPA13 80.9±2.3 83.7±3.6 82.4±1.0 73.5±1.5
S.cerevisiae ISPA14 73.5±2.1 67.1±3.5 86.9±2.2 57.3±1.6
S.cerevisae ISPA15 90.7±2.3 84.5±3.3 93.3±1.3 94.1±2.2
Table 5. Degradation of the ENs A, A1, B and B1 produced by acid lactic bacteria and Saccharomyces strains in SB and MRSB medium at 48h of incubation.

Material, métodos, resultados y discusión
! 115
As is possible to observe in table 5, the mean percentage
of degradation of the EN A was 90.1±2.2%. The highest
degradation data was evidenced by Streptococcus thermofilus
CECT986 with 99.5±2.0% whereas the lowest was detected in the
sample fermented by Saccharomyces cerevisiae ISPA10 with
50.5±2.2%. The mean percentage of reduction considering the
EN A1 was 89.8±2.3%, 1.1 fold lowest than the data evidenced for
the EN A. The highest reduction in that series of experiments was
performed by Streptococcus thermofilus CECT986 with
98.7±2.2%, whereas the lowest reduction was obtained by
Saccharomyces cerevisiae ISPA1O with 64.9±3.1%. The ENs of
the B group presented a mean degradation data lower than the
values evidenced for the ENs A and A1. In particular the mean
degradation value evidenced for the EN B was of 75.0±2.0%, 1.2
folds lowest than the data evidenced for the other two ENs. The
highest reduction was evidenced in the medium fermented by
Saccharomyces cerevisiae ISPA13756 with 97.7±3.3% whereas the
lowest by the probiotic strain Bifidobacterium breve CECT4839
with 5.2±2.5%, that can be considered the lowest degradation
data evidenced in this study. The EN B1 evidenced a reduction

Material, métodos, resultados y discusión
! 116
rate similar to the values reported for the EN B, and in particular
the mean degradation evidenced was of 81.0±2.4%, similar to the
mean data evidenced for the EN B. The highest and lowest
degradation activities were performed by Saccharomyces
cerevisiae ISPA13756 and Bifidobacterium breve CECT4839 with
97.5±3.1 and 40.3±2.1 respectively.
2.3.2. ENs degradation by probiotic strains in wheat flour
The nine strains that showed the highest activity on the
degradation of the mycotoxins ENs in liquid medium were
employed for the degradation of the ENs presents in a food
system composed by wheat flour naturally contaminated with the
ENs A, A1, B, B1 through microbial fermentation by a strain of
Fusarium tricinctum CECT1036. The concentrations of the
bioactive compounds presents in the wheat flour before the
degradation experiments with the probiotic strains were
112.4±3.6 mg/Kg of EN A, 487.7±2.5 mg/Kg of EN A1, 575.9±5.4
mg/Kg of EN B and 805.0±6.3 mg/Kg EN B1. As evidenced in
figure 6, the mean reduction of EN A produced by the strains
employed was 22.5±1.6%. The highest reduction of this bioactive
compound was produced by Lactobacilus rhamnosus 278T with a

Material, métodos, resultados y discusión
! 117
49.2±3.6%, whereas the lowest degradation activity was detected
in the fermentation carried out by Saccharomyces cerevisiae
13757 with 3.4±0.3%. The mean reduction of EN A1 evidenced in
the fermentations performed in the food system was 17.0±2.3%.
The highest and the lowest degradation activity of EN A1 were
evidenced by the strains of Lactobacillus rhamnosus 278T and
Saccharomyces cerevisiae 13757 with 40.6±3.9% and 2.0±0.3%
respectively. EN B presented a mean degradation data of
14.6±2.0%. The highest reduction data of EN B was evidenced by
Streptococcus thermofilus 986 with a decrease of 32.4±4.0%,
whereas Saccharomyces cerevisiae 13751 presented the lowest
degradation data with 2.3±0.3%. EN B1 degradation data were
comparable with the values produced for the EN B. In particular,
the mean degradation evidenced for this bioactive compound
was of 12.6±1.0%, Lactobacillus rhamnosus 278T evidenced the
highest EN B1 reduction data with 28.9±3.2%, whereas
Saccharomyces cerevisiae 13751 presented the lowest reduction
with 1.7±0.4%.

Material, métodos, resultados y discusión
! 118
Figure 6. Degradation of the ENs A, A1, B and B1 produced by lactic acid bacteria and Saccharomyces strains in wheat flour at room temperature and 48h incubation.
Comparing the ENs degradation rate obtained in the food
system, with the reduction values obtained in the liquid medium,
the reduction evidenced in wheat flour is generically lower than
the reduction evidenced in the model system. This phenomenon
can be related to the composition of the samples and also to the
physical constitution of the mediums. The fermentations on solid
samples are much more complex respect to the degradations in
liquid medium due to the matrix effect generated by the solid
0!10!20!30!40!50!60!
ENs r
educ
tion
%
ENA
ENA1
ENB
ENB1

Material, métodos, resultados y discusión
! 119
samples and also to the different water activity (aw) data of the
liquid and solid samples.
The degradation activity of Fusarium mycotoxins by
bacteria has been studied by many authors. In particular
Poppenberger et al. (2003) reported the isolation and
characterization of a gene from Arabidopsis thaliana encoding a
UDP-glycosyltransferase that is able to detoxify DON. The
enzyme, previously assigned the identifier UGT73C5, catalyzes
the transfer of glucose from UDP-glucose to the hydroxyl group
at carbon 3 of deoxynivalenol. This deoxynivalenol-
glucosyltransferase (DOGT1) was also found to detoxify the
acetylated derivative 15-Ac-DON, whereas no protective activity
was observed against the structurally similar NIV. The degradation
of 12 trichothecenes mycotoxins by chicken intestinal microbes
was monitored by Young et al. (2007). The two principally
degradation pathways evidenced were: deacylation and
deepoxydation. The authors evidenced also that the
deepoxydation was the prevalent reaction in HT-2 toxin and T-2
triol, whereas T-2 toxin showed only deacetylation. The percent of
reduction was variable from 40 to 95 %. Guan et al. (2009)

Material, métodos, resultados y discusión
! 120
evaluated the degradation of the Fusarium mycotoxin DON,
employing microorganisms of fish digesta. The authors evidenced
that the microbial pathway related to the fish Ameiurusnebulosus,
transformed DON to de-DON at 15 °C in full medium after 96 h
incubation.
The interaction between the minor Fusarium mycotoxins
BEA and thirteen bacterial strains characteristic of the
gastrointestinal tract was studied by Meca et al. (2012a). Levels of
BEA in the fermentation liquid, on the cell walls and on the
internal part of the cells were determined using liquid
chromatography coupled to the mass spectrometry detector (LC-
MS/MS). Results showed that the bacteria reduced the
concentration of the BEA present in the medium, part of the
mycotoxin was adsorbed by cell wall and part internalized by the
bacteria. All the bacteria analyzed in this study showed a
significant BEA reduction during the fermentation process, in
particular the mean diminution resulted variable from 66 to the
83%.

Material, métodos, resultados y discusión
! 121
Considering that the mycotoxins BEA and ENs are
characterized by similar chemical structures (cyclic compounds
composed by three aminoacids and three HyLv units), this study
confirms that these compounds can be degraded by bacteria of
different species.
2.3.3. LC-MS-LIT identification of the ENs degradation products
The samples positive to the ENs degradation were also
injected in the LC-MS-LIT in the modality enhanced resolution
(ER) scan (m/z=200-900) to determine the ENs degradation
products produced through the microbial fermentations. In the
figure 7 is evidenced the LC-MS-LIT chromatogram of the ENs
presents in the fermentation extract produced by the strain of
Saccharomyces cerevisiae ISPA10.

Material, métodos, resultados y discusión
! 122
Figure 7. LC-MS-LIT chromatogram of the ENs and related degradation products presents in the in the growth medium fermented by the strain Saccharomyces cerevisiae ISPA10
In the chromatograms in possible to observe the presence
of the ENs A, A1, B and B1 with the retention time of 16.7, 19.4,
22.9 and 27.5 min, and also some other peaks corresponding to
the ENs degradation products. In particular close to the peak of
TIC of +EMS: from Sample 19 (31) of pepe.wiff (Turbo Spray), Smoothed, Smoothed, Smoothed, Smoothed, Smoothed Max. 8.0e8 cps.
2 4 6 8 10 12 14 16 18 20 22 24 26 28 30 32 34 36 38 40 42 44 46 48 50Time, min
0.0
5.0e7
1.0e8
1.5e8
2.0e8
2.5e8
3.0e8
3.5e8
4.0e8
4.5e8
5.0e8
5.5e8
6.0e8
6.5e8
7.0e8
7.5e8
8.0e8
Inte
ns
ity
, c
ps
16.76
19.48
22.935.45
3.87 6.29
13.82
27.25
3.52
35.80
25.2711.132.47 7.381.65 32.9732.34 48.0830.50 40.6237.13 47.4340.06 43.65
EN B EN B1
EN A1
EN A
EN B degradation product
EN B1 degradation product
EN A1 degradation product

Material, métodos, resultados y discusión
! 123
the EN B and with the retention time of 13.8 minutes is possible
to evidence the degradation product of the EN B. The formation
of this degradation product is confirmed by the fragment of this
new compound presents in the ER mass spectra showed in the
figure 8.a)
+EMS: 13.695 min from Sample 14 (4) of pepe.wiff (Turbo Spray) Max. 1.9e7 cps.
200 250 300 350 400 450 500 550 600 650 700 750 800 850 900m/z, Da
0.0
1.0e6
2.0e6
3.0e6
4.0e6
5.0e6
6.0e6
7.0e6
8.0e6
9.0e6
1.0e7
1.1e7
1.2e7
1.3e7
1.4e7
1.5e7
1.6e7
1.7e7
1.8e7
1.9e7
Inte
nsi
ty,
cps
489.1
445.2
533.2573.1
540.4 679.2447.2 505.1 661.2427.3256.2 311.3 457.1 562.3401.3 603.2264.4
(EN B+Na)+ (EN B+K)+
(EN B-HyLv)+
(540.4-2H2O-CH3)+
(679.2-HyLv-Val)+
a)

Material, métodos, resultados y discusión
! 124
Figure 8. MS-LIT spectra obtained in ER scan mode (m/z 200-900) of the degradation products of the a) EN B and b) EN B1.
In the mass spectra are evidenced two fragments that
testify the origin of this product by the ENs B that are the EN B
sodium and potassium adducts (m/z=661.2 and 679.2), and also
three important diagnostic fragment like the m/z=540.4, 489.1
and 445.2. The fragment with an m/z of 540.4 corresponds to the
molecular weight (MW) of the EN B degradation product and is
represented by the EN B with the loss of a structural component
+EMS: 18.567 min from Sample 19 (31) of pepe.wiff (Turbo Spray) Max. 5.6e6 cps.
200 250 300 350 400 450 500 550 600 650 700 750 800 850 900m/z, Da
0.0
2.0e5
4.0e5
6.0e5
8.0e5
1.0e6
1.2e6
1.4e6
1.6e6
1.8e6
2.0e6
2.2e6
2.4e6
2.6e6
2.8e6
3.0e6
3.2e6
3.4e6
3.6e6
3.8e6
4.0e6
4.2e6
4.4e6
4.6e6
4.8e6
5.0e6
5.2e6
5.4e65.6e6
Inte
ns
ity
, c
ps
473.2
517.2
573.0
676.3561.2
443.2
531.2487.2457.2 619.2605.2545.3508.4413.2 645.1532.2 662.4494.3264.3210.2 620.3427.1282.2 406.3 541.1311.3 591.3335.0 707.4250.3
(EN B1+Na)+
(EN B1+K-Val)+
(573.0-H2O-2CH3)+
(573.0-HyLv+H2O)+ b)

Material, métodos, resultados y discusión
! 125
represented by the hydroxyvaleric acid (HyLv). The presence of
this new degradation product is also confirmed by the fragment
with the pseudomolecular ion of 445.2 (m/z) that represents the
potassium adduct of the EN B with the loss of two structural
component of the ENs represented by the HyLv and also by a
valine (Val) unit. The fragment with an m/z of 489.1 represents the
EN B degradation product with the loss of two molecules of water
and also of a methyl group.
In the figure 8.b) is evidenced the MS-LIT mass spectra of
the EN B1 degradation product. This compound is composed by
the EN B1 potassium adduct with the loss of a structural
component of this compound as the Val unit as evidenced by the
fragment with am/z of 573.0. The formation of this compound is
also confirmed by the fragment with am/z of 473.2 that
represents the fragment with m/z of 573.0 with the loss of
another important structural component characteristic of the ENs
structure and represented by the HyLv. The origin of this
degradation product from the EN B1 is confirmed by the presence
of the fragment with m/z of 676.3 that represent the EN B1
sodium adduct. In the figure 5 is evidenced the MS-LIT spectra of

Material, métodos, resultados y discusión
! 126
the degradation product of the EN A1. In the spectra are
evidenced several diagnostic fragments that testify the formation
of this product like the signals with m/z of 573.1, 457.2 and 443.3
respectively. In particular the fragment with m/z of 573.1
represents the EN A1 potassium adduct with the loss of a
structural component of the ENs like the isoleucine (Ile). The
formation of this EN A1 degradation product is confirmed by
presence of the signal with m/z of 457.2 that represents the
fragment with m/z of 573.1 with a loss of HyLv, and also by the
fragment with m/z 443.3 derivated from the fragment with m/z of
573.1, with the loss of a second Ile unit. The presence of these
three ENs degradation products was evidenced in all the
fermentations carried out with the microbial strains tested.

Material, métodos, resultados y discusión
! 127
Figure 9. Mean data of the ENs A1, B and B1 degradation products a) formed in the liquid medium and b) in the food system composed by wheat flour contaminated by ENs, through a fermentation operated by probiotic microorganisms at 48h incubation.
The ENs reduction products identified were quantified
using the calibration curve of the corresponding EN at 48h
incubation in liquid medium and in food product. In particular as

Material, métodos, resultados y discusión
! 128
evidenced in figure 9.a), in liquid medium, the mean data of the
ENs degradation products detected was of 3.8±0.5 mg/L. The
concentration of EN A1 degradation product was of 3.9±0.4 mg/L
(77.4% of the total EN A1) whereas the concentration of ENs B
and B1 newly formed products detected was of 4.6±0.9 (92.0% of
the total EN B) and 3.1±0.6 (62% of the total EN B1) mg/L
respectively. The degradation products of the bioactive
compounds ENs were also identified in the experiments carried
out with the food system composed by wheat flours
contaminated with ENs and treated with the probiotic
microorganisms. In particular as evidenced in figure 9.b), the
mean data of newly formed compounds evidenced was of
54.0±3.1 mg/Kg. EN A1 degradation product evidenced a
concentration of 38.4±3.5 (7.8% of the total EN A1) whereas ENs
B and B1 reduction compounds evidenced data of 50.2±2.9 and
73.4±3.6 mg/Kg respectively (8.7 and 9.11 of the total EN B and
B1). The concentration of the degradation products detected in
food system compared with the quantity detected in the liquid
medium was 10 fold lowest. This phenomenon can be related
with the composition of the solid matrix used for the experiments
in food system. In fermentation on solid medium, the

Material, métodos, resultados y discusión
! 129
fermentation of the macro and micronutrients is generally slower
compared with the fermentation on liquid mediums due to the
different concentration of water, which permits a more rapid
fermentation of the components, including the bioactive
compounds ENs, in liquid medium.

Material, métodos, resultados y discusión
! 130
3. Detoxification of the bioactive compounds enniatins
A, A1, B, B1 employing different strains of Bacil lus
subtil is
3.1. Introduction
Bacillus subtilis is a Gram positive, spore former bacteria
considered a soil microorganism that can also inhabit the
gastrointestinal tract of animals and insects. The robustness of the
spore formers enables them to survive, transit through the
stomach, after which they germinate, proliferate and then re-
sporulate before the excretion in faeces. Bacillus subtilis strains
are isolated in ileum biopsies and human faecal samples, so they
are adapted to the human gastro intestinal tract and should be
considered as gut commensals (Hong et al., 2009).
Bacterial spore formers of the genus Bacillus are widely
used as probiotic preparations that can benefit the host
improving intestinal balance and health. Their use as probiotic
dietary supplements is expanding rapidly, since more than 15
Bacillus probiotics products are authorized for human
consumption (Hong et al., 2005). Spores being heat-stable have a

Material, métodos, resultados y discusión
! 131
number of advantages over other probiotics non-spore formers
such as Lactobacillus spp., that the product can be stored at room
temperature in a desiccated form without any deleterious effect
on viability. A second advantage is that the spore is capable of
surviving the low pH of the gastric barrier (Cutting et al., 2011).
The mechanisms of their probiotic effect are mainly
immune stimulation, synthesis of antimicrobials, but also its
hability to detoxify mycotoxins is remarkable. Bacillus subtilis has
demonstrated capability to reduce in vitro the amount of AFB1
and DON (Cheng et al., 2011; Farzaneh et al, 2012; Gao et al.,
2011). Fan et al., (2013) evidenced the hability of Bacillus subtilis
ANSB060 to reduce the concentration of aflatoxin residues in
livers of chicken fed naturally with moldy peanut meal.
In the scientific literature there is not any report on the
reduction of the bioactive compounds ENs by Bacillus subtilis.
Considering the lack of data related to the biological degradation
of the minor Fusarium mycotoxins ENs by Bacillus strains, the
aims of this study were: a) to evaluate the reduction in vitro of the
ENs employing different Bacillus subtilis strains and b) to

Material, métodos, resultados y discusión
! 132
investigate the degradation products of ENs employing the
technique of the liquid chromatography coupled to the mass
spectrometry linear ion trap (LC-MS-LIT).
3.2. Material and methods
3.2.1. Chemicals
A stock standard solution of ENs A, A1, B, B1 (98% of purity)
(Sigma-Aldrich, St. Luis, USA) were prepared by dissolving 1 mg
of standard in 1 mL of pure methanol. This stock solution was
then diluted with methanol in order to obtain the appropriated
work solutions with concentrations of 1, 10 and 100 mg/L. All ENs
solutions were stored in darkness at 4ºC until the LC-MS/MS
analysis. Acetonitrile, methanol, water, ethyl acetate, sodium
chloride (all of LC grade) and acetic acid were purchased from
Merck (Whitehouse Station, NJ, USA).
3.2.2. Strains and methodology
The study was carried out using six strains of Bacillus
subtilis obtained by the Spanish Type Culture Collection (CECT
Valencia, Spain), in sterile 18% glycerol. For longer survival and
higher quantitative retrieval of the cultures, they were stored at –

Material, métodos, resultados y discusión
! 133
80ºC. When needed, recovery of strains was undertaken by two
consecutive subcultures in appropriate media prior to use. The
microbes were cultured in 15mL sterile plastic centrifuge tubes
utilizing as growth medium 10 mL of Nutrient Broth (NB, Oxoid
Madrid, Spain) and incubated at 37ºC in aerobic atmosphere
during 48h. After that each bacterial suspension at concentrations
of 108 CFU/ml were added to a fresh 10 mL of NB contaminated
with 5mg/L of the mycotoxins ENs A, A1, B, and B1, incubated at
37ºC in during 48h. The mediums were analyzed in order to
determinate the residual concentration of ENs present in the
growth medium and also to identify the possible degradation
products.
3.2.3. ENs and degradation products extraction from fermented
mediums
The fermentation tubes were centrifuged at 4000 rpm
(Centrifuge 5810R, Eppendorf, Germany) during 5 min at 4ºC in
order to separate the fermented medium from the cells. ENs
contained in fermented medium were extracted as follows (Jestoi
2008): five mL of fermented NB were introduced in a 20 mL
plastic tube, and extracted three times with 5 mL of ethyl acetate

Material, métodos, resultados y discusión
! 134
using a vortex VWR international (Barcelona, Spain) during 1 min.
After that the mixtures were centrifuged (Centrifuge 5810R,
Eppendorf, Germany) at 4000 rpm for 10 min at 4ºC.The organic
phases were completely evaporated by a rotary evaporator
(Buchi, Switzerland) operating at 30ºC and 30 mbar pressure,
resuspended in 1 mL of methanol, filtered with 0.22 µM filters
(Pheomenex, Madrid, Spain) and analyzed by LC-MS/MS or by
LC-MS-LIT.
3.2.4. LC-MS/MS analysis of ENs
The optimization of MS/MS conditions was performed by
direct injection of individual standards at 100 μg/mL in “full
SCAN”,. The most abundant mass to-charge ratio (m/z) was
selected for each compound of interest. The mycotoxins
exhibited precursor ions and product ions with reasonably high
signal intensities in positive ESI mode (ESI+), being found
protonated molecules [M+H]+, sodium adduct ions [M+Na]+ and
potassium adduct ions [M+K]+. A Quattro LC triple quadrupole
mass spectrometer from Micromass (Manchester, UK), equipped
with an LC Alliance 2695 system (Waters, Milford, MA) consisting
of an autosampler, a quaternary pump, and a pneumatically

Material, métodos, resultados y discusión
! 135
assisted electrospray probe, a Z-spray interface and Mass Lynx NT
software Version 4.1, were used for the MS/MS analyses. The
separation was achieved by a Gemini-NX C18 (150 mm x 4.6 mm
I.D., 5 μm particle size) analytical column supplied by
Phenomenex (Barcelona, Spain), preceded by a guard column C18
(4 mm x 2 mm I.D.). The analytical separation for LC-MS/MS was
performed using gradient elution with 90% of methanol (with
5mM of formate ammonium) as mobile phase A, and 10% of
acetonitrile as mobile phase B, increasing linearly to 50% B for 10
min; then, decreasing linearly to 40% B for 3 min, and then
gradually up to 10% B for 5 min. Finally, initial conditions were
maintained for 3 min. Flow rate was maintained at 0.2 ml/min. The
ESI source values were as follows: capillary voltage, 3.50 kV;
source temperature, 100ºC; desolvation temperature, 300ºC;
cone gas 50l/h; desolvation gas (nitrogen 99.95% purity) flow, 800
l/h.
The analyser settings were as follows: resolution 12.0 (unit
resolution) for the first and third quadrupoles; ion energy, 0.5;
entrance and exit energies, -3 and 1; multiplier, 650; collision gas
(argon 99.99% purity) pressure, 3.83 x 10⁻³ mbar; interchanel

Material, métodos, resultados y discusión
! 136
delay, 0.02 s; total scan time, 1.0s; dwell time 0.1 ms. The mass
spectrometer was operated in Multiple Reaction Monitoring
(MRM) mode. All time measurements were carried out in
triplicate. The MRM optimized parameters cone voltages and
collision energies were: 35 Ev and 40V, respectively. The
precursor and product-ions selected were 681.9 [M+H]+, 228.2
and 210.0 for ENA; 667.9 [M+H]+, 228.2 and 210.0 for ENA1;
639.8 [M+H]+, 214.2 and 196.2 for ENB; 654.9 [M+H]+, 214.2 and
196.2 for ENB1. The most abundant product ions were selected
for quantification and the second one for confirmation.
3.2.5 Method performance
Method validation was carried out according to the
guidelines established by the European Commission (Commission
Decision, 2002; Commission Regulation, 2006). The method
validation included the determination of linearity, limits of LODs,
LOQs, recoveries; repeatability (intra-day precision) and
reproducibility (inter day precision). In order to determine the
linearity, calibration curves for each studied mycotoxin were
constructed from the standards prepared in methanol and from
the standards prepared in extract of blank sample. All mycotoxins

Material, métodos, resultados y discusión
! 137
exhibited good linearity over the working range, and the
regression coefficient of calibration curves was higher than 0.992.
The LODs and LOQs were estimated from an extract of a blank
sample, fortified with decreasing concentrations of the analytes.
For 6 days additions were performed from three different blank
samples (n=18), to the estimated concentrations for each
mycotoxin. The LODs and LOQs were calculated using the
criterion of S/N ≥ 3 and S/N ≥ 10 for LOD and LOQ, respectively.
LODs for ENA, ENA1, ENB and ENB1 were 0.15, 0.08, 0.15 and
0.15 μg/ kg, respectively. LOQs for ENA, ENA1, ENB and ENB1
were 0.5, 0.25, 0.5 and 0.5 μg/kg respectively. The recoveries,
intra-day precision and inter-day precision were evaluated by
spiking different levels of standard analyte to samples at two
spiked levels (LOQ and 100 times LOQ). Recovery ranges for the
low spiked level (LOQ) and the high spiked level (100 x LOQ)
were 85-110% and 86-112%, respectively. RSD values ranged
between 4 and 11% for the intra-day precision, and between 5
and 15% for the inter-day precision. These values agree with EU
criteria (Commission Decision, 2002).

Material, métodos, resultados y discusión
! 138
3.2.6. Determination of the ENs degradation products with LC-
MS-LIT
The separation of ENs was achieved by LC Agilent 1100
(Agilent Technologies, Santa Clara, California) coupled to a mass
spectrometer, Applied Biosystems/MDS SCIEX Q TRAP TM linear
ion trap mass spectrometer (Concord, Ontario, Canada).A Gemini
(150 x 2.0 mm, 5 µm) Phenomenex (Torrance, California) column
was used. LC conditions were set up using a constant flow at 0.3
ml/min and acetonitrile/water (80:30, v/v with 0.1 % of HCOOH)
as mobile phases in isocratic condition were used. The instrument
was configured in the positive ion electrospray mode using the
following parameters: cone voltage 40 V, capillary voltage 3.80
kV, source temperature 350ºC, desolvation temperature 270ºC
and collision gas energy 5 eV. The analyses of the ENs
degradation products employing the technique of the liquid
chromatography coupled to the ion trap was carried out using the
following procedure:
(1) Characterization of the compound isolated with the modality
of ER scan, using the m/z range from 200 to 900 Da to obtain the
general spectra of the degradation compound;

Material, métodos, resultados y discusión
! 139
(2) Characterization of the fragments obtained in the ER scan with
the modality EPI scan to obtain a MS2 scan of a fragment of the
degradation product.
The utilization of the mass spectrometry associated at the
detection with the linear ion trap, utilized in these two modalities
permitted us to obtain a total characterization of the compound
isolated (Meca et al., 2012a).
3.3 Results and discussions
3.3.1 ENs degradation by Bacillus subtilis strains in NB medium
All the Bacillus subtilis strains showed a degradation
activity on the minor Fusarium mycotoxins ENs A, A1, B and B1 in
NB medium as is possible to observe in the data (each EN
degradation experiment was repeated five times) shown in table
6. In figure 10 is evidenced the LC-MS/MS chromatograms of the
ENs present in growth mediums after the fermentation with
Bacillus subtilis CECT4522.

Material, métodos, resultados y discusión
! 140
Figure 10. LC-MS/MS chromatogram of the ENs A, A1, B, B1, present in NB medium before fermentation by the strain Bacillus subtilis CECT 4522.
TIC of +EMS: from Sample 174 (EN A1 pH ac 15) of pepe.wiff (Turbo Spray), Smoothed, Smoothed Max. 4.9e8 cps.
5 10 15 20 25 30 35 40 45 50 55 60 65Time, min
0.0
2.0e7
4.0e7
6.0e7
8.0e7
1.0e8
1.2e8
1.4e8
1.6e8
1.8e8
2.0e8
2.2e8
2.4e8
2.6e8
2.8e8
3.0e8
3.2e8
3.4e8
3.6e8
3.8e8
4.0e8
4.2e8
4.4e8
4.6e8
4.8e8
Inte
ns
ity
, c
ps
24.20
20.503.92
22.54
26.923.42
17.496.060.21 7.87 8.96 13.9814.61 28.27 30.84 33.14 36.42 38.98 41.42 43.65 48.22 49.47 53.15 53.92 59.7856.20 61.66
EN B EN B1
EN A1
EN A

Material, métodos, resultados y discusión
! 141
% of Reduction Strains A A1 B B1 Bacillus subtilis CECT 35 77.7±1.2 67.1±3.1 64.7±3.6 79.7±3.2 Bacillus subtilis CECT 39 87.7±1.5 83.0±2.6 85.3±3.8 90.0±2.0 Bacillus subtilis CECT 371 96.2±2.2 94.2±2.9 96.7±4.1 96.7±1.9 Bacillus subtilis CECT 497 95.1±2.4 95.4±3.0 98.0±2.6 99.0±3.6 Bacillus subtilis CECT 498 90.6±2.6 86.4±2.9 86.2±2.9 92.8±3.3 Bacillus subtilis CECT 4522 81.7±2.4 72.9±3.5 76.5±3.3 84.0±2.7
Table 6. Degradation of the ENs A, A1, B, B1 in NB medium through a fermentation in submerged culture by different strains of Bacillus subtilis
The mean percentage of degradation of the EN A was
88.1%. The highest degradation data was evidenced by the strain
of Bacillus subtilis CECT371 with 96.2%, whereas the lowest was
detected in the sample fermented by Bacillus subtilis CECT35

Material, métodos, resultados y discusión
! 142
with 77.7%. The mean percentage of reduction considering the
EN A1 was 83.1%. The highest reduction was performed by the
strain of Bacillus subtilis CECT497 with 95.4%, whereas the lowest
reduction was obtained by Bacillus subtilis CECT 35 with 67.1%.
The ENs of the B group presented mean degradations data
similar to the values evidenced for the ENs A and A1. In particular
the mean degradation evidenced for the EN B was of 84.5%; the
highest reduction was evidenced in the medium fermented by the
strain of Bacillus subtilis CECT497 with 98.0, whereas the lowest
degradation was observed by Bacillus subtilis CECT35 with
64.7%, that can be considered the lowest degradation data
evidenced in this study. The EN B1 evidenced a mean reduction
data of 92.0 %, and the highest and lowest degradation activity
were performed by the strains Bacillus subtilis CECT497 and
Bacillus subtilis CECT35 with 99.0 and 79.7 respectively.
The hability of Bacillus subtilis to detoxify mycotoxins has
been studied by different authors. The Fusarium bioactive
compound DON is degraded by two Bacillus subtilis strains
according to the results of Cheng et al., (2011). Incubation at
37ºC, for 12 h, reduced DON >98% and 71.4%, respectively. The

Material, métodos, resultados y discusión
! 143
degradation presented a sharp decrease when the heating
temperature changed from 65–75ºC. These compounds could be
applied in the fermentation process of feedstuffs and fermented
food. Farzaneh et al., (2012) demonstrated that Bacillus subtilis
UTBSP1, a strain isolated in Iranian pistachio nuts, degrades AFB1
in different matrices. The reductions evidenced in NB culture,
pistachio nut, and cell free supernatant were 85.66%, 95%,
78,39% respectively. The results demostrate that the mechanism
for its degradation activity was likely due to the extracellular
nature of the produced enzyme in the media which could remove
AFB1. In vitro detoxification of AFs by Bacillus subtilis ANSB060
has been evidenced by Gao et al., (2011), with reductions of
81,5% and 80,7% for AFB1 and AFG1 respectively.
3.3.2. LC-MS-LIT characterization of the ENs degradation
products
The samples positive to the ENs degradation, by microbial
fermentation, were also injected in the LC-MS-LIT in the modality
ER scan (m/z=200-900). In figure 11 is shown the chromatogram
of the ENs presents in the fermentation extract produced by the
strain of Bacilllus subtilis CECT4522, where is possible to evidence

Material, métodos, resultados y discusión
! 144
the presence of the ENs A, A1, B and B1 with the retention time
(RT) of 16.4, 19.2, 22.4 and 26.5 min.
Figure 11. LC-MS-LIT chromatogram in ER mode of the ENs and its degradation products present in NB medium after the fermentation by of Bacillus subtilis CECT 4522.
In the chromatogram are also present some other peaks
corresponding to the ENs degradation products. In particular
close to the peak of the EN B and with the retention time of 14.9
minutes is possible to evidence the degradation product of this
compound, whereas the EN B1 degradation product presents a
RT of 18.0 min.

Material, métodos, resultados y discusión
! 145
The formation of the EN B degradation product is
confirmed by the fragments related to the structure of this new
compound presents in the ER mass spectra showed in the figure
12. In particular in the figure is shown the mass spectrum related
to the EN B degradation product identified as the potassium
adduct of the EN B, with the loss of a ENs structural component
as the HyLv.
Figure 12. LC-MS-LITmass spectra obtained in ER mode (MS1) of the degradation products of the EN B .
(EN B+K-HyLv)+
(EN B+K-Val-H2O)+
(EN B+K-Val-COOH)+
(EN B-2HyLv-H2O)+

Material, métodos, resultados y discusión
! 146
The formation of this degradation product is confirmed by
the fragment with a pseudomolecular weight of 561.2, and also
by other important diagnostic signals as the fragments with a m/z
of 547.1 and 503.2, that represent the potassium adduct of the
EN B with the loss of the amino acid valine (Val) associated also
with the loss of a molecule of water and of a carboxylic group,
respectively. The fragment with am/z of 459.2 confirms the
presence in the structure of the EN B degradation product of the
HyLv with the loss of two units. To obtain more information and
also to confirm the structure of the EN B degradation product
formed, the sample was also injected in the modality EPI scan to
obtain the MS2 scan of the degradation product isolated using as
fragmenting signal, the ion with a m/z of 561.2.
In figure 13.a), is possible to observe the LC-MS-LIT
chromatogram of the degradation product identified, and in
figure 13.b) the EPI-LIT spectrum with the presence of two
important fragments that confirm the structure of the reduction
product isolated that are the signals with m/z of 563.5 and 350.3.
These signals confirmed the presence in the degradation

Material, métodos, resultados y discusión
! 147
products structure of the two basic components of the ENs
structure as the Val and HyLv.
EN B degradation product
MS2
] a)

Material, métodos, resultados y discusión
! 148
Figure 13. a)LC-MS-LITchromatogram obtained in EPI mode (MS2) using as fragmenting ion the signal with a m/z of 561.2 of the EN B degradation product and b) EPI mass spectrum obtained in MS2 of the degradation products of the EN B.
In figure 14 is shown the ER-LIT spectrum related to the
degradation product of the EN B1, and identified as the
potassium adduct of the EN B1 with the loss of a structural
component as the HyLv.
b)
(EN B+K-Val)+
(2Val-HyLv)+

Material, métodos, resultados y discusión
! 149
Figure 14. LC-MS-LITmass spectra obtained in ER mode (MS1) of the degradation products of EN B1.
In the spectra there are some important diagnostic signals
that confirm the formation of this degradation product. The
fragment with a m/z of 573.1 represent the MW of the EN B1
degradation product, whereas the fragments with m/z of 517 and
473.2 represent the EN B with the loss of other important
structural components as the amino acid Val for the signals with
m/z of 517.2 and of the contemporary loss of the amino acids Ile
(EN B1+Na)+
(EN B1+K-HyLv)+
(EN B1+K-Ile)+
(EN B1-2Val)+
(EN B1+K-Ile-Val-H2O)+

Material, métodos, resultados y discusión
! 150
and Val for the signal with m/z of 473.2. To confirm the formation
of these new degradation product the ion corresponding to its
MW was fragmented in the modality EPI (MS2) scan with a mass
range variable from 200 to 540 Da. In figure 15.a) is evidenced
the EPI-LIT chromatogram of the EN B1 degradation product and
in figure 15.b) the MS2 spectrum that confirm, with the presence
of two diagnostic signals, the structure of the degradation
product detected.
MS2
[573.1] EN B1 degradation product
a)

Material, métodos, resultados y discusión
! 151
Figure 15. Chromatogram obtained in EPI mode (MS2) using as fragmenting ion the signal with a m/z of 573.10of the EN B1 degradation product a) and b) EPI mass spectrum b.
In particular, the fragment with a m/z of 415.4 was
identified as the EN B1 degradation products with the loss of
another HyLv unit, whereas the signal with a m/z of 309.2
represents the degradation compound formed with the loss of
the structural amino acids that compose the EN B1 as the Val and
Ile. The utilization of the LC-MS-LIT in the ER and EPI modalities
permitted to characterize completely the two degradation
products formed.
((EN B1+K-HyLv)-HyLv-H2O))+
((EN B1+K-HyLv)-Val-Ile-H2O))+
b)

Material, métodos, resultados y discusión
! 152
4. Antibacterial activity of the emerging Fusarium
mycotoxins enniatins A, A1, A2, B, B1, and B4 on
probiotic microorganisms
4.1. Introduction
ENs are known as antifungal compounds against
Aspergillus flavus, Aspergillus parasiticus, Aspergillus fumigatus,
Asepergillus ochraceus, Beauveria bassiana, Fusarium
verticilloides, Fusarium sporotrichioides, Fusarium tricinctum,
Fusarium poae, Fusarium oxysporum, Fusarium proliferatum,
Penicillium expansum and Trichoderma harzianum (Meca et al.,
2010c), as antiyeast against Candida albicans, Trichosporum
cutaneum and Cryptococcus neoformans (Firáková et al., 2008)
and as antibacterial agents against pathogenic bacteria Sebastia
(et al. 2011). It has also been reported that these mycotoxins have
insecticidal and phytototoxic properties (Grove and Pople, 1980).
Intestinal microflora has an essential role in nutrition, physiology
and prevention of the infection caused by pathogenic bacteria
and for this reason is important to assess the antimicrobial activity
of the bioactive compounds ENs naturally presents in several kind
of food, to understand if this antibacterial activity can alternate

Material, métodos, resultados y discusión
! 153
the probiotic microbiota characteristic of the gastrointestinal tract
(GT) (Tedjiotstop et al. 2010). Also the biological decontamination
of mycotoxins by microorganisms is one strategy widely used for
the control and management of mycotoxins in foods and feeds.
Among the different potential decontaminating microorganisms,
Saccharomyces cerevisiae and lactic acid bacteria represent two
important groups, which are widely used in food fermentation
and preservation (Shetty and Serpersen, 2006). The aim of this
study was to evaluate, the antimicrobial effects of the ENs A, A1,
A2, B, B1, and B4 on several microorganisms characteristics of the
gastrointestinal tract or that could be potentially used in
detoxification strategies of these bioactive compounds.
4.2. Materials and methods
4.2.1. Chemicals
DeMan Rogosa Sharp Agar (MRSA) and Broth (MRSB) and
Sabouroud agar (SA) and broth (SB) were obtained from Oxoid
(Basingstoke, UK). EN A (purity: 98% molecular weight: 682.92
g/mol), EN A1 (purity: 98% molecular weight: 668.89 g/mol), EN
A2 (purity: % molecular weight: 681.91 g/mol), EN B (purity: 97%
molecular weight: 640.84 g/mol), ENB1 (purity: 98% molecular

Material, métodos, resultados y discusión
! 154
weight: 654.87 g/mol) and ENB4 (purity: 98 molecular weight:
653.36 g/mol) were produced in our laboratory according to
Cuomo et al. (2012). Stock solutions of ENs were prepared in
methanol (LC grade), and stored in darkness at 4ºC until the
inoculation. Methanol was purchased from Merck (Whitehouse
Station, NJ, USA). Deionized water (<18 MΩ cm resistivity) was
obtained from a Milli-Q water purification system (Millipore,
Bedford, MA, USA).
4.2.2. Strains and culture conditions
The antimicrobial activity of the minor Fusarium mycotoxins
ENs was carried out employing nine strains of different probiotic
lactic acid bacteria, particularly Bifidobacterium longum,
Bifidobacterium bifidum, Bifidobacterium breve, Bifidobacterium
adolescentis, Lactobacillus rhamnosus, Lactobacillus casei-casei,
Lactobacillus plantarum, Lactobacillus paracasei, Lactobacillus
ruminis, Streptococcus termofilus; and twenty two strains of
Saccharomyces cerevisiae. The microorganisms tested in this
study were obtained by the Spanish Type Culture Collection
(CECT Valencia, Spain) and by Istituto delle Scienze delle
Produzioni Alimentari (Bari) preserved in sterile 18% glycerol and

Material, métodos, resultados y discusión
! 155
stored at -80°C before use. Before antimicrobial assays the
microorganisms were reconstituted by two consecutive
subcultures in appropriate media prior to use, and were
recovered in appropriate media, DeMan-Rogosa-Sharpe broth
(MRS) for lactic acid bacteria, Sabouraud broth (SB) for
Saccharomyces cerevisiae, respectively.
4.2.3 Antimicrobial activity of the ENs
The microbial bioassay technique used in this study was
according with the method of Madhyastha et al. (1994). The
antimicrobial activity of the bioactive compounds ENs was carried
out on sterile disks (6-mm) obtained from Whatman No. 1
(Whatman, Madrid Spain). Sterilized solutions containing ENs A,
A1, A2, B, B1, and B4, separately, in 10µL methanol were added
aseptically to each disk. The microorganisms used for the
inoculums were cultured on 9-com Petri dishes with 20 mL of
MRSA, and SA depending of the bacteria typology and incubated
24 h at 37ºC. Lactic acid bacteria were expressly incubated in
anaerobic conditions using an anaerobic jar (Deltalab, Spain).
After that one ml of distilled water was added on the agar
surface, the microorganisms were scraped with a sterile loop and

Material, métodos, resultados y discusión
! 156
0.1 ml of the inoculums were introduced in another plate
containing only 10 ml of growth medium. The treated disks were
placed on the agar surface just after inoculation. After
refrigeration at 4ºC for 6 h to allow the mycotoxin to diffuse into
the agar, the plates were incubated 24 h at 37ºC in aerobiosis for
Saccharomyces cerevisiae strains and in anaerobiosis for probiotic
strains. According to Castlebury et al. (1999) plates were positive
to the antimicrobial activity of the ENs if an inhibition zone at
least of 2 mm wide was observed around the disk.
Figure 16. Schematic representation of the microbial bioassay tecnique

Material, métodos, resultados y discusión
! 157
4.3. Results and discussion
The results related to the antimicrobial activity of the
bioactive compounds ENs are evidenced in the table 7.
Strains
Inhibition ENs (positive inhibition/mm inhibition zone)b
ENA
ENA1
ENA2
ENB1 20000 2000 20000 20000 2000 20000 2000 200 20 Bf. longum 4551
- - +/9 - - +/10 - - -
Bf. bifidum 870T - - +/9 - - +/8 - - -
Bf. breve 4839T - - +/12 - - - - - -
Bf.adolescentis 5871 - - - - - +/9 +/7 +/5 +/3
Lc. rhamnosus 278T - - +/9 - - - - - -
Lc. casei- casei 4180 - - +/8 - - +/8 - - -
Lc. casei 4180 - - +/12 - - - - - - Lc. ruminis 4061 T - - +/10 - - +/8 - - -
St. thermofilus 986 - - +/10 - - +/10 +/9 - -
S.cerevisiae 4 - - - - - - - - - S.cerevisiae 7 +/8 +/6 - - - - - - - S.cerevisiae 15
- - - +/9 +/5 - - - -
a Each strain was tested with five replicate disks for each concentration of ENs. b In each positive test we specified the millimeters (mm) of the inhibition zone.
Table 7. Positive microorganism sensible to different quantities (20000-20 ng) of the bioactive compounds ENsa

Material, métodos, resultados y discusión
! 158
In particular as is possible to observe the EN A was active
against one strains of Saccharomyces cerevisiae at 20000 and
2000 ng evidenced inhibition spots of 8 and 6 mm respectively.
The EN A1 produced antimicrobial activity on several strains
tested at 20000 ng and in particular on three Bifidobacteria and
four Lactobacillus strains with inhibition spots ranging from 8 to
12 mm. The EN A2 produced antibiotic activity on Saccharomyces
cerevisiae 15 at 20000 and 2000 ng evidencing inhibition spots of
9 and 5 mm respectively. The EN B1 can be considered one of the
most active compounds tested, and in particular at 20000 ng
produced the inhibition growth of several strains with spots that
ranged from 8 to 10 mm. This compound was active against
Bifidobacterium adolescentis 5871, from 20 to 20000 ng with
inhibition spots ranging from 3 to 9 mm. Also on Streptococcus
thermofilus the EN B1 reduced the microorganism growth when
was used at 20000 and 2000 ng with inhibition spots of 9 and 10
mm respectively.

Material, métodos, resultados y discusión
! 159
Figure 17. Antibacterial activity expressed by EN B1 on Bf. adolescentis CECT 5871 (c=control, 20000, 2000, 200, 20 ng).
This study can be considered the first where the bioactivity
of ENs A, A1, A2, B, B1, and B4 has been studied on probiotic
microorganisms, whereas the antimicrobial activity of the
bioactive compounds ENs and BEA on other microorganisms has
been studied by several authors. As regards the antimicrobial
action, Gaumann et al. (1947) studied the decrease of the viability
of Mycobacterium tuberculosis, Mycobacterium phlei, Bacillus
subtilis, and Staphylococcus aureus, exposed at different
concentration of EN mixtures. Gaumann et al. (1947) also
c"
c"
20000"
2000"
200"
20"

Material, métodos, resultados y discusión
! 160
demonstrated that the same ENs mixture was active against
Mycobacterium spp., Staphylococcus spp., Bacillus spp.,
Pseudomonas aeruginosa, Serratia marcenscen, Salmonella
pseudoasiatica, and several different fungi.
Castlebury et al. (1999), evaluated the bioactivity of the
emerging micotoxin BEA on several microorganism using the disk
diffusion assay. The bacteria inhibited by the lowest dose (0.1 µg)
was Bacillus pumilus. Several species of Bacillus and Paenibacillus
were inhibited by 1µg of BEA per disk. P. validus, Bifidobacterium
adolescentis, Clostridium perfringens, Eubacterium biforme,
Peptostreptococus anaerobius and Paenibacillus productus were
sensible to a dose of 25 µg of BEA. On the other hand,
Clostridium clostridioforme, Peptostreptococcus magnus,
Bacteriodes fragilis, Bacillus thetaitaomicron and Fusobacterium
prausnitzii were not inhibited by the highest dose of the study
that was of 25 µg. Fotso and Smith (2003) studied the toxicity of
BEA by bacterial bioluminescence assay on several bacteria
strains evidenced a mean data of the effective concentration
(EC50) of 94 µ/mL. Pohanka et al. (2004) evidenced an inhibitory
activity of ENs B, B1, B2, B4, and J1, J2, J3, and K3 isolated from

Material, métodos, resultados y discusión
! 161
Fusarium F31 against Botrytis cinerea at 75mg/ mL concentration.
Moderate antimicrobial activity was observed with, EN A, A1, and
B1 against Candida albicans, Cryptococcus neoformans, and
Mycobacterium intracellulare (Jayasinghe et al., 2006). ENs B, B4,
C, G, H, I isolated from Verticillium hemipterigenum BCC1449
were active against Micobacterium tuberculosis (H37Ra strain);
growth of mentioned microorganism was inhibited by EN B4 and
EN H with an IC50 value of 0.20 mg/mL. The mixture of ENs O1,
O2, and O3 showed biological activities similar to those of EN B,
with an IC50 of 3.2 mg/mL (Firáková et al., 2007). Meca et al.
(2010c) studied the antibiotic effect of BEA on several pathogenic
bacteria: Escherichia coli, Enterococcus faecium, Salmonella
enteric, Shygella dysenteriae, Listeria monocytogenes, Yersinia
enterocolictica, Clostridium perfringens, Pseudomonas
aeruginosa and Staphylococcus aureus. This compound presented
no antibiotic effect on the two strains of Staphylococcus aureus
tested. Clostridium perfringens suffered the highest susceptibility
in this study with inhibition with doses between 1 and 1000 ng.
80% of the bacteria tested were inhibited by the dose of 1000 ng.
The antibacterial effect of ENs J1 and J3 on pathogenic and lactic
acid bacteria has been described by Sebastià et al., (2011). ENs J1

Material, métodos, resultados y discusión
! 162
and J3 presented antibiotic effect on Clostridium perfringens,
Enterococcus faecium, Escherichia coli, Shygella dysenteriae,
Staphylococcus aureus and Yersinia enterocolitica. 90% strains of
lactic acid bacteria tested were inhibited by a dose of 1000 ng of
ENJ1 and 100% by 1000 ng of the ENJ3.

! 163
V.CONCLUSIONES

Conclusiones
! 164

Conclusiones
! 165
1. Presencia de micotoxinas emergentes de Fusarium en
muestras de arroz:
El 50% de las muestras procedentes de distintos mercados
de la Comunidad Valenciana, resultaron positivas a BEA y el 100%
estaban contaminadas por ENs. Las concentraciones medias de
las BEA, ENA y ENB fueron superiores en el caso de muestras de
arroz ecológico, respecto a las de cultivo tradicional.
2. Descontaminación por cocinado de las muestras de
arroz:
La cocción del arroz utilizando la cantidad de agua
recomendada por el fabricante produce una reducción de las
micotoxinas que oscila entre el 30 y el 60%. Si bien en exceso de
agua la reducción oscila entre el 30 y el 100%.

Conclusiones
! 166
3. Reducción de ENs por degradación in vitro por
bacterias probióticas y levaduras en medio de cultivo:
Todos los microorganismos estudiados presentaron
actividad reductora de las ENs, si bien 8 de ellos con actividad
superior al 90%. Los porcentajes de reducción oscilan entre 99 %
por acción Streptococcus thermophilus CECT986 sobre ENA, y el
5 % por acción de Bifidobacterium breve CECT4839 sobre ENB.
En el caso de ENA y ENA1 Streptococcus thermophilus CECT986
fue el microorganismo que produjo una mayor reducción. En el
caso de ENB y ENB1, Saccharomyces cerevisisae ISPA13756 fue el
microorganismo más descontaminante.
4. Reducción de ENs por degradación mediante
bacterias probióticas y levaduras en harina de trigo
contaminada:
Los porcentajes de reducción están comprendidos entre el
1,7 y el 49%. La mayor reducción se obtiene con Lactobacillus
rhamnosus CECT278T y en concreto sobre la ENA. Las tasas de

Conclusiones
! 167
reducción fueron inferiores en el caso de la matriz alimentaria
respecto a las observadas en medio de cultivo.
5. Identificación de los productos de degradación.
Empleando la técnica de LC-MS-LIT se han caracterizado
productos de degradación procedentes de ENA, ENB y ENB1
producidos por la fermentación con bacterias lácticas,
Saccharomyces cerevisiae y de Bacillus subtilis en medios de
cultivo específicos y en la harina de trigo. La concentración de los
productos de degradación es inferior en el caso de la matriz
alimentaria en comparación con el medio específico.
6. Capacidad bactericida de ENs sobre
microorganismos probióticos.
Las ENs A, A1, A2, y B1 son bioactivas frente a
microorganismos probióticos. El compuesto más bioactivo fue EN
A1 que produjo halos de inhibición de 8 a 12 mm a dosis de 20

Conclusiones
! 168
µg. Bifidobacterium adolescentis 5871T fue la bacteria inhibida
por la concentración más baja de micotoxina.

! 169
VI.BIBLIOGRAFÍA

! 170

! 171
Abramson, D., House, J. D., & Nyachoti, C. M. (2005). Reduction of deoxynivalenol in barley by treatment with aqueous sodium carbonate and heat. Mycopathologia, 160(4), 297-301.
Alberts, J. F., Engelbrecht, Y., Steyn, P. S., Holzapfel, W. H., & van
Zyl, W. H. (2006). Biological degradation of aflatoxin B1 by Rhodococcus erythropolis cultures. International journal of food microbiology, 109(1–2), 121-126.
Ariño, A., Herrera, M., Juan, T., Estopañan, G., Carramiñana, J.,
Rota, C., & Herrera, A. (2009). Influence of agricultural practices on the contamination of maize by fumonisin mycotoxins. Journal of Food Protection, 72(4), 898-902.
Awad, W. A., Ghareeb, K., Böhm, J., & Zentek, J. (2010).
Decontamination and detoxification strategies for the Fusarium mycotoxin deoxynivalenol in animal feed and the effectiveness of microbial biodegradation. Food additives and contaminants, 27(4), 510-520.
Becker-Algeri, T. A., Heidtmann-Bemvenuti, R., dos Santos
Hackbart, Helen Cristina, & Badiale-Furlong, E. (2013). Thermal treatments and their effects on the Fumonisin B1 level in rice. Food Control. 488-493
Bejaoui, H., Mathieu, F., Taillandier, P., & Lebrihi, A. (2004).
Ochratoxin A removal in synthetic and natural grape juices by selected oenological Saccharomyces strains. Journal of applied microbiology, 97(5), 1038-1044.

! 172
Bretz, M., Beyer, M., Cramer, B., Knecht, A., & Humpf, H. -. (2006). Thermal degradation of the Fusarium mycotoxin deoxynivalenol. Journal of Agricultural and Food Chemistry, 54(17), 6445-6451.
Bryden, W. L. (2012). Mycotoxin contamination of the feed supply
chain: Implications for animal productivity and feed security. Animal Feed Science and Technology, 173(1), 134-158.
Bullerman, L. B., & Bianchini, A. (2007). Stability of mycotoxins
during food processing. International journal of food microbiology, 119(1-2), 140-146.
Castlebury, L. A., Sutherland, J. B., Tanner, L. A., Henderson, A. L.,
& Cerniglia, C. E. (1999). Use of a bioassay to evaluate the toxicity of beauvericin to bacteria. World Journal of Microbiology and Biotechnology, 15(1), 131-133.
Chen, B. -., Tsai, M. -., & Jow, G. -. (2006). Induction of calcium
influx from extracellular fluid by beauvericin in human leukemia cells. Biochemical and biophysical research communications, 340(1), 134-139.
Cheng, B., Wan, C., Yang, S., Xu, H., Wei, H., Liu, J., Tian, W., &
Zeng, M. (2010). Detoxification of deoxynivalenol by Bacillus strains. Journal of Food Safety, 30(3), 599-614.
Cserháti, M., Kriszt, B., Krifaton, C., Szoboszlay, S., Háhn, J., Tóth,
S., Nagy, I., & Kukolya, J. (2013). Mycotoxin-degradation profile of Rhodoccocus strains. International journal of food microbiology. 176-185

! 173
Cuomo, V., Randazzo, A., Meca, G., Moretti, A., Cascone, A.,
Eriksson, O., Novellino, E., & Ritieni, A. (2012) Production of enniatins A, A1, B, B1, B4, J1 by Fusarium tricinctum in solid corn culture: Structural analysis and effects on mitochondrial respiration. Food Chemistry. 784-793
Cutting, S. M. (2011). Bacillus probiotics. Food Microbiology, 28(2),
214-220. Duvick, J., & Rod, T. A. (1998). Beauvericin detoxification
compositions and methods, United States Patents, patent number 5.798.255, date of patent Aug. 25, 1998.
EFSA (2013). Scientific Opinion on risks for animal and public
health related to the presence of nivalenol in food and feed. EFSA Journal 2013;11(6):3262.
EFSA (2011a). Scientific Opinion on the risks for public health
related to the presence of zearalenone in food. EFSA Journal 2011;9 (6):2197.
EFSA (2011b). Scientific Opinion on the risks for animal and public
health related to the presence of T-2 and HT-2 toxin in food and feed EFSA Journal 2011;9(12):2481.
EFSA (2009). Review of mycotoxin-detoxifying agents used as feed
additives: mode of action, efficacy and feed/food safety. http://www.efsa.europa.eu/en/supporting/doc/22e.pdf

! 174
EFSA (2006). Opinion of the Scientific Panel on contaminants in the food chain [CONTAM] related to ochratoxin A in food doi:10.2903/j.efsa.2006.365.
EFSA (2003). Updated opinion of the Scientific Committee on
Food on Fumonisin B1, B2 and B3 (expressed on 4 April 2003) http://ec.europa.eu/food/fs/sc/scf/out185_en.pdf EFSA (2002). Tarea 3.2.8 «Assessment of dietary intake of Patulin
by the population of EU Member States». http:// ec.europa.eu/food/food/chemicalsafety/contaminants/3.2.8_en.pdf.
EFSA (1999). Dictamen del Comité científico de la alimentación
humana sobre las toxinas de Fusarium (DON), http://ec.europa.eu/food/fs/sc/scf/out44_en.pdf.
European Commission (2013): Commission Recommendation
2013/165/EU of 27 March 2013 on the presence of T-2 and HT-2 toxin in cereals and cereal products. Official Journal of the European Union. L 91 de 3.4.2013, p. 12/15
European Commission (2012). Regulation (EU) No 1058/2012 of
12 November 2012 amending Regulation (EC) No 1881/2006 as regards maximum levels for aflatoxins in dried figs. Official Journal of the European Union. L 313 de 13.11.2012, p. 14/15.
European Commission (2010). Regulation (EU) No 165/2010 of 26
February 2010 amending Regulation (EC) No 1881/2006 setting maximum levels for certain contaminants in foodstuffs

! 175
as regards aflatoxins. Official Journal of the European Union. L 50, 27.2.2010, p. 8–12.
European Commission (2010). Regulation (EU) No 105/2010 of 5
February 2010 amending Regulation (EC) No 1881/2006 setting maximum levels for certain contaminants in foodstuffs as regards ochratoxin A. Official Journal of the European Union. L 35, 6.2.2010.
European Commission (2009): Regulation (EC) No 386/2009 of 12
May 2009 amending Regulation (EC) No 1831/2003 of the European Parliament and of the Council as regards the establishment of a new functional group of feed additives. Official Journal of the European Union. L 118, 13.5.2009, p. 66–66.
European Commission (2009). Regulation (EU) No 152/2009 of 27
January 2009 laying down the methods of sampling and analysis for the official control of feed. Official Journal of the European Union. L 54, 26.2.2009, p. 1–130
European Commission (2007). Regulation (EC) No 1126/2007 of 28
September 2007 amending Regulation (EC) No 1881/2006 setting maximum levels for certain contaminants in foodstuffs as regards Fusarium toxins in maize and maize products. Official Journal of the European Union. L 255, 29.9.2007, p. 14–17
European Commission (2006). Regulation (EC) No 1881/2006 of 19
December 2006 setting maximum levels for certain

! 176
contaminants in foodstuffs. Official Journal the European Union. L 364, 20.12.2006
European Commission (2006): Commission Recommendation of
17 August 2006 on the presence of deoxynivalenol, zearalenone, ochratoxin A, T-2 and HT-2 and fumonisins in products intended for animal feeding. Official Journal of the European Union. L 229, 23.8.2006, p. 7–9.
European Commission (2006): Commission Recommendation of 17
August 2006 on the prevention and reduction of Fusarium toxins in cereals and cereal products. Official Journal of the European Union. L 234, 29.8.2006, p. 35–40.
European Commission (2006). Regulation (EC) No 401/2006 of 23
February 2006 laying down the methods of sampling and analysis for the official control of the levels of mycotoxins in foodstuffs. Official Journal of the European Union. L 70, 9.3.2006, p. 12–34.
European Commission (2004) Regulation (EC) No 882/2004 of the
European Parliament and of the Council of 29 April 2004 on official controls performed to ensure the verification of compliance with feed and food law, animal health and animal welfare rules. Official Journal of the European Union. L 165, 30.4.2004, p. 1–141
European Parliament and Council (2002) Directive 2002/32/EC on
undesirable substances in animal feed - Council statement Official Journal of European Communities. L 140, 30.5.2002, p. 10–22.

! 177
European Commission (2002). Regulation (EC) No 2002/657 of 12
August 2002 implementing Council Directive 96/23/EC concerning the per-formance of analytical methods and the interpretation of results. Official Journal of the European Communities. L 221, 17.8.2002, p. 8–36.
European Council (1993). (EEC) No 315/93 of 8 February 1993
laying down Community procedures for contaminants in food. Official Journal of European Communities. L 37, 13.2.1993, p. 1–3.
FAO (2001). Manual on the application of the HACCP system in
mycotoxin prevention and control. FAO/IAEA Training and Reference Centre for Food and Pesticide Control. ISBN 92-5-104611-5.
Fan, Y., Zhao, L., Ma, Q., Li, X., Shi, H., Zhou, T., Zhang, J., & Ji, C.
(2013). Effects of Bacillus subtilis ANSB060 on growth performance, meat quality and aflatoxin residues in broilers fed moldy peanut meal naturally contaminated with aflatoxins. Food and Chemical Toxicology.
Farzaneh, M., Shi, Z., Ghassempour, A., Sedaghat, N.,
Ahmadzadeh, M., Mirabolfathy, M., & Javan-Nikkhah, M. (2012). Aflatoxin B1 degradation by Bacillus subtilis UTBSP1 isolated from pistachio nuts of Iran. Food Control, 23(1), 100-106.
Ferrer, E., Juan-García, A., Font, G., & Ruiz, M. J. (2009). Reactive
oxygen species induced by beauvericin, patulin and

! 178
zearalenone in CHO-K1 cells. Toxicology in Vitro, 23(8), 1504-1509.
Firáková, S., Sturdikova, M., Liptaj, T., Pronayova, N., Bezakova, L.,
& Proksa, B. (2008). Enniatins produced by Fusarium dimerum, an endophytic fungal strain. Die Pharmazie-An International Journal of Pharmaceutical Sciences, 63(7), 539-541.
Firáková, S., Proksa, B., & Sturdikova, M. (2007). Biosynthesis and
biological activity of enniatins. Die Pharmazie-An International Journal of Pharmaceutical Sciences, 62(8), 563-568.
Fotso, J., & Smith, J. S. (2003). Evaluation of beauvericin toxicity
with the bacterial bioluminescence assay and the Ames mutagenicity bioassay. Journal of Food Science, 68(6), 1938-1941.
Fuchs, S., Sontag, G., Stidl, R., Ehrlich, V., Kundi, M., & Knasmüller,
S. (2008). Detoxification of patulin and ochratoxin A, two abundant mycotoxins, by lactic acid bacteria. Food and Chemical Toxicology, 46(4), 1398-1407.
Fuchs, E., Binder, E. M., Heidler, D., & Krska, R. (2002). Structural
characterization of metabolites after the microbial degradation of type A trichothecenes by the bacterial strain BBSH 797. Food additives and contaminants, 19(4), 379-386.
Gao, X., Ma, Q., Zhao, L., Lei, Y., Shan, Y., & Ji, C. (2011). Isolation
of Bacillus subtilis: screening for aflatoxins B1, M1, and G1 detoxification. European Food Research and Technology, 232(6), 957-962.

! 179
Gäumann, E., Roth, S., Ettlinger, L., Plattner, P. A., & Nager, U.
(1947). Enniatin, ein neues, gegen Mykobakterien wirksames Antibiotikum. Experientia, 3(5), 202-203.
Grove, J. F., & Pople, M. (1980). The insecticidal activity of
beauvericin and the enniatin complex. Mycopathologia, 70(2), 103-105.
Guan, S., He, J., Young, J. C., Zhu, H., Li, X., Ji, C., & Zhou, T.
(2009). Transformation of trichothecene mycotoxins by microorganisms from fish digesta. Aquaculture, 290(3), 290-295.
Guan, S., Ji, C., Zhou, T., Li, J., Ma, Q., & Niu, T. (2008). Aflatoxin
B1 degradation by Stenotrophomonas maltophilia and other microbes selected using coumarin medium. International journal of molecular sciences, 9(8), 1489-1503.
Gutleb, A. C., Morrison, E., & Murk, A. J. (2002). Cytotoxicity
assays for mycotoxins produced by Fusarium strains: a review. Environmental toxicology and pharmacology, 11(3), 309-320.
Halász, A., Lásztity, R., Abonyi, T., & Bata, Á. (2009).
Decontamination of mycotoxin-containing food and feed by biodegradation. Food Reviews International, 25(4), 284-298.
Hamill, R. L., Higgens, C. E., Boaz, H. E., & Gorman, M. (1969). The
structure op beauvericin, a new depsipeptide antibiotic toxic to artemia salina. Tetrahedron letters, 10(49), 4255-4258.

! 180
Hanif, N. Q., Muhammad, G., Muhammad, K., Tahira, I., & Raja, G. K. (2012). Reduction of ochratoxin A in broiler serum and tissues by Trichosporon mycotoxinivorans. Research in veterinary science, 93(2), 795-797.
Hartinger, D., & Moll, W. -. (2011). Fumonisin elimination and
prospects for detoxification by enzymatic transformation. World Mycotoxin Journal, 4(3), 271-283.
He, J., Zhou, T., Young, J. C., Boland, G. J., & Scott, P. M. (2010).
Chemical and biological transformations for detoxification of trichothecene mycotoxins in human and animal food chains: a review. Trends in Food Science & Technology, 21(2), 67-76.
Heinl, S., Hartinger, D., Thamhesl, M., Vekiru, E., Krska, R.,
Schatzmayr, G., Moll, W., & Grabherr, R. (2010). Degradation of fumonisin B1 by the consecutive action of two bacterial enzymes. Journal of Biotechnology, 145(2), 120-129.
Herrera, M., Conchello Moreno, María del Pilar, Juan Esteban, T.,
Estopañán Muñoz, G., Herrera Marteache, A., & Ariño Moneva, A. A. (2010). Fumonisins concentrations in maize as affected by physico-chemical, environmental and agronomical conditions, 55(2), 121-126.
Hong, H. A., Khaneja, R., Tam, N. M., Cazzato, A., Tan, S., Urdaci,
M., Brisson, A., Gasbarrini, A., Barnes, I., & Cutting, S. M. (2009). Bacillus subtilis isolated from the human gastrointestinal tract. Research in microbiology, 160(2), 134-143.

! 181
Hong, H. A., Duc, L. H., & Cutting, S. M. (2005). The use of bacterial spore formers as probiotics. FEMS microbiology reviews, 29(4), 813-835.
Hussain, A., & Luttfullah, G. (2009). Reduction of aflatoxin-B1 and
ochratoxin-A levels in polished basmati rice (Oryza sativa linn.) by different cooking methods. Journal of the Chemical Society of Pakistan, 31(6), 911-915.
Hyun, U., Lee, D., Lee, C., & Shin, C. (2009). Apoptosis induced by
enniatins H and MK1688 isolated from Fusarium oxysporum FB1501. Toxicon, 53(7), 723-728.
IARC monographs on the evaluation of carcinogenic risks to
humans. (2002) Some traditional herbal medicines, some mycotox- ins, naphthalene and styrene: Summary of data reported and evaluation, vol. 82
Islam, R., Zhou, T., Young, J. C., Goodwin, P. H., & Pauls, K. P.
(2012). Aerobic and anaerobic de-epoxydation of mycotoxin deoxynivalenol by bacteria originating from agricultural soil. World Journal of Microbiology and Biotechnology, 28(1), 7-13.
Ivanova, L., Skjerve, E., Eriksen, G. S., & Uhlig, S. (2006).
Cytotoxicity of enniatins A, A1, B, B1, B2 and B3 from Fusarium avenaceum. Toxicon: official journal of the International Society on Toxicology, 47(8), 868-876.
Janotová, L., Čížková, H., Pivoňka, J., & Voldřich, M. (2011). Effect of processing of apple puree on patulin content. Food Control, 22(6), 977-981.

! 182
Jard, G., Liboz, T., Mathieu, F., Guyonvarc’h, A., & Lebrihi, A. (2011). Review of mycotoxin reduction in food and feed: from prevention in the field to detoxification by adsorption or transformation. Food Additives & Contaminants: Part A, 28(11), 1590-1609.
Jayasinghe, L., Abbas, H. K., Jacob, M. R., Herath, W. H., &
Nanayakkara, N. D. (2006). N-Methyl-4-hydroxy-2-pyridinone Analogues from Fusarium oxysporum�. Journal of natural products, 69(3), 439-442.
Jestoi, M. (2008). Emerging fusarium-mycotoxins fusaproliferin,
beauvericin, enniatins, and moniliformin - A review. Critical reviews in food science and nutrition, 48(1), 21-49.
Kabak, B. (2009). The fate of mycotoxins during thermal food
processing. Journal of the science of food and agriculture, 89(4), 549-554.
Kabak, B., Dobson, A. D. W., & Var, I. (2006). Strategies to prevent
mycotoxin contamination of food and animal feed: A review. Critical reviews in food science and nutrition, 46(8), 593-619.
Kelly, S., Grimm, L., Bendig, C., Hempel, D., & Krull, R. (2006).
Effects of fluid dynamic induced shear stress on fungal growth and morphology. Process Biochemistry, 41(10), 2113-2117.
Kushiro, M. (2008). Effects of milling and cooking processes on the deoxynivalenol content in wheat. International Journal of Molecular Sciences, 9(11), 2127-2145.

! 183
La Pera, L., Avellone, G., Lo Turco, V., Di Bella, G., Agozzino, P., & Dugo, G. (2008). Influence of roasting and different brewing processes on the ochratoxin A content in coffee determined by high-performance liquid chromatography-fluorescence detection (HPLC-FLD). Food Additives and Contaminants - Part A Chemistry, Analysis, Control, Exposure and Risk Assessment, 25(10), 1257-1263.
Lancova, K., Hajslova, J., Kostelanska, M., Kohoutkova, J.,
Nedelnik, J., Moravcova, H., & Vanova, M. (2008). Fate of trichothecene mycotoxins during the processing: Milling and baking. Food Additives and Contaminants - Part A Chemistry, Analysis, Control, Exposure and Risk Assessment, 25(5), 650-659.
Lee, K., Kim, B. H., & Lee, C. (2010). Occurrence of Fusarium
mycotoxin beauvericin in animal feeds in Korea. Animal Feed Science and Technology, 157(3-4), 190-194.
Lin, H., Lee, Y., Chen, B., Tsai, M., Lu, J., Chou, C., & Jow, G.
(2005). Involvement of Bcl-2 family, cytochrome c and caspase 3 in induction of apoptosis by beauvericin in human non-small cell lung cancer cells. Cancer letters, 230(2), 248-259.
Lu, Q., Liang, X., & Chen, F. (2011). Detoxification of Zearalenone
by viable and inactivated cells of Planococcus sp. Food Control, 22(2), 191-195.
Madhyastha, M., Marquardt, R., Masi, A., Borsa, J., & Frohllch, A. (1994). Comparison of toxicity of different mycotoxins to several species of bacteria and yeasts: use of Bacillus brevis in a disc diffusion assay. Journal of Food Protection, 57(1), 48-53.

! 184
MAGRAMA (2013). http://www.magrama.es: Food consumption,
marketing and distribution 2013. Mahnine, N., Meca, G., Elabidi, A., Fekhaoui, M., Saoiabi, A., Font,
G., Mañes, J., & Zinedine, A. (2011). Further data on the levels of emerging Fusarium mycotoxins enniatins (A, A1, B, B1), beauvericin and fusaproliferin in breakfast and infant cereals from Morocco. Food Chemistry, 124(2), 481-485.
Malachova, A., Dzuman, Z., Veprikova, Z., Vaclavikova, M.,
Zachariasova, M., & Hajslova, J. (2011). Deoxynivalenol, deoxynivalenol-3-glucoside, and enniatins: the major mycotoxins found in cereal-based products on the Czech market. Journal of Agricultural and Food Chemistry, 59(24), 12990-12997.
Martínez-Larrañaga, M.R. y Anadón, A, (2006). Micotoxinas. En
Cameán, A.M. & Repetto (Ed.), Toxicología alimentaria (2006) (pp. 289-305). ISBN: 84-7978-727-9. Díaz de Santos. Madrid-Buenos Aires.
Meca, G., Ritieni, A., Zhou, T., Li, X., & Mañes, J. (2013a).
Degradation of the minor Fusarium mycotoxin beauvericin by intracellular enzymes of Saccharomyces cerevisiae. Food Control.
Meca, G., Zhou, T., Li, X., & Mañes, J. (2013b). Beauvericin degradation during bread and beer making. Food Control.

! 185
Meca, G., Ritieni, A., & Mañes, J. (2012a). Reduction in vitro of the minor Fusarium mycotoxin beauvericin employing different strains of probiotic bacteria. Food Control, 28(2), 435-440.
Meca, G., Ritieni, A., & Mañes, J. (2012b). Influence of the heat
treatment on the degradation of the minor Fusarium mycotoxin beauvericin. Food Control, 28(1), 13-18.
Meca, G., Font, G., & Ruiz, M. (2011). Comparative cytotoxicity
study of enniatins A, A1, A2, B, B1, B4 and J3 on Caco-2 cells, Hep-G2 and HT-29. Food and Chemical Toxicology, 49(9), 2464-2469.
Meca, G., Blaiotta, G., & Ritieni, A. (2010a). Reduction of
ochratoxin A during the fermentation of Italian red wine Moscato. Food Control, 21(4), 579-583.
Meca, G., Soriano, J. M., Gaspari, A., Ritieni, A., Moretti, A., &
Mañes, J. (2010b). Antifungal effects of the bioactive compounds enniatins A, A1, B, B1. Toxicon, 56(3), 480-485.
Meca, G., Sospedra, I., Soriano, J. M., Ritieni, A., Moretti, A., &
Mañes, J. (2010c). Antibacterial effect of the bioactive compound beauvericin produced by Fusarium proliferatum on solid medium of wheat. Toxicon, 56(3), 349-354.
Meca, G., Zinedine, A., Blesa, J., Font, G., & Mañes, J. (2010d).
Further data on the presence of Fusarium emerging mycotoxins enniatins, fusaproliferin and beauvericin in cereals available on the Spanish markets. Food and Chemical Toxicology, 48(5), 1412-1416.

! 186
Meca, G., Sospedra, I., Soriano, J. M., Ritieni, A., Valero, M. A., &
Mañes, J. (2009). Isolation, purification and antibacterial effects of fusaproliferin produced by Fusarium subglutinans in submerged culture. Food and Chemical Toxicology, 47(10), 2539-2543.
Méndez-Albores, A., Veles-Medina, J., Urbina-Álvarez, E.,
Martínez-Bustos, F., & Moreno-Martínez, E. (2009). Effect of citric acid on aflatoxin degradation and on functional and textural properties of extruded sorghum. Animal Feed Science and Technology, 150(3), 316-329.
Méndez-Albores, A., Del Río-García, J., & Moreno-Martínez, E.
(2007). Decontamination of aflatoxin duckling feed with aqueous citric acid treatment. Animal Feed Science and Technology, 135(3), 249-262.
Méndez-Albores, J., Arámbula-Villa, G., Loarca-Piña, M., González-
Hernandez, J., Castaño-Tostado, E., & Moreno-Martı́nez, E. (2004). Aflatoxins’ fate during the nixtamalization of contaminated maize by two tortilla-making processes. Journal of stored products research, 40(1), 87-94.
Molnar, O., Schatzmayr, G., Fuchs, E., & Prillinger, H. (2004).
Trichosporon mycotoxinivorans sp. nov., A New Yeast Species Useful in Biological Detoxification of Various Mycotoxins. Systematic and applied microbiology, 27(6), 661-671.
Oueslati, S., Meca, G., Mliki, A., Ghorbel, A., & Mañes, J. (2011).
Determination of Fusarium mycotoxins enniatins, beauvericin

! 187
and fusaproliferin in cereals and derived products from Tunisia. Food Control, 22(8), 1373-1377.
Park, J. W., & Kim, Y. (2006). Effect of pressure cooking on
aflatoxin B1 in rice. Journal of Agricultural and Food Chemistry, 54(6), 2431-2435.
Pohanka, A., Capieau, K., Broberg, A., Stenlid, J., Stenström, E., &
Kenne, L. (2004). Enniatins of Fusarium sp. Strain F31 and Their Inhibition of Botrytis c inerea Spore Germination. Journal of natural products, 67(5), 851-857.
Poppenberger, B., Berthiller, F., Lucyshyn, D., Sieberer, T.,
Schuhmacher, R., Krska, R., Kuchler, K., Glössl, J., Luschnig, C., & Adam, G. (2003). Detoxification of the Fusarium mycotoxin deoxynivalenol by a UDP-glucosyltransferase from Arabidopsis thaliana. Journal of Biological Chemistry, 278(48), 47905-47914.
Prosperini, A., Juan-García, A., Font, G., & Ruiz, M. (2013a).
Beauvericin-induced cytotoxicity via ROS production and mitochondrial damage in Caco-2 cells. Toxicology letters. 204-211.
Prosperini, A., Meca, G., Font, G., & Ruiz, M. (2013b).
Bioaccessibility of Enniatins A, A1, B, and B1 in Different Commercial Breakfast Cereals, Cookies, and Breads of Spain. Journal of Agricultural and Food Chemistry, 61(2), 456-461.
Prosperini, A., Juan-García, A., Font, G., & Ruiz, M. (2013c).
Reactive oxygen species involvement in apoptosis and

! 188
mitochondrial damage in Caco-2 cells induced by enniatins A, A1, B and B1. Toxicology letters. 36-44
Raters, M., & Matissek, R. (2008). Thermal stability of aflatoxin B1
and ochratoxin A. Mycotoxin Research, 24(3), 130-134. Ritieni, A., Moretti, A., Logrieco, A., Bottalico, A., Randazzo, G.,
Monti, S. M., Ferracane, R., & Fogliano, V. (1997). Occurrence of Fusaproliferin, Fumonisin B1, and Beauvericin in Maize from Italy. Journal of Agricultural and Food Chemistry, 45(10), 4011-4016.
Rojas-Durán, T., Fente, C., Vázquez, B., Franco, C., Sanz-Medel, A.,
& Cepeda, A. (2007). Study of a room temperature phosphorescence phenomenon to allow the detection of aflatoxigenic strains in culture media. International journal of food microbiology, 115(2), 149-158.
Santini, A., Ferracane, R., Meca, G., & Ritieni, A. (2009). Overview
of analytical methods for beauvericin and fusaproliferin in food matrices. Analytical and Bioanalytical Chemistry, 395(5), 1253-1260.
Sebastià, N., Meca, G., Soriano, J. M., & Mañes, J. (2011).
Antibacterial effects of enniatins J1 and J3 on pathogenic and lactic acid bacteria. Food and Chemical Toxicology, 49(10), 2710-2717.
Serrano, A., Font, G., Mañes, J., & Ferrer, E. (2012a). Emerging
Fusarium mycotoxins in organic and conventional pasta

! 189
collected in Spain. Food and Chemical Toxicology. 51, 259-266.
Serrano, A.B., Font, G., Ruiz, M.J., Ferrer, E., (2012b). Co-
occurrence and risk assessment of mycotoxins in food and diet from Mediterranean area. Food Chemistry. 135 (2), 423–429
Serrano, A., Meca, G., Font, G., & Ferrer, E. (2012c). Risk
assessment associated to the intake of the emerging Fusarium mycotoxins BEA, ENs and FUS present in infant formula of Spanish origin. Food Control, 28(1), 178-183.
Shetty, P. H., & Jespersen, L. (2006). Saccharomyces cerevisiae and
lactic acid bacteria as potential mycotoxin decontaminating agents. Trends in Food Science and Technology , 17, 48-49-55.
Sifou, A., Meca, G., Serrano, A. B., Mahnine, N., El Abidi, A.,
Mañes, J., El Azzouzi, M., & Zinedine, A. (2011). First report on the presence of emerging Fusarium mycotoxins enniatins (A, A1, B, B1), beauvericin and fusaproliferin in rice on the Moroccan retail markets. Food Control, 22(12), 1826-1830.
Tedjiotsop Feudjio, F., Dornetshuber, R., Lemmens, M., Hoffmann,
O., Lemmens-Gruber, R., & Berger, W. (2010). Beauvericin and enniatin: Emerging toxins and/or remedies? World Mycotoxin Journal, 3(4), 415-430.
Teniola, O., Addo, P., Brost, I., Färber, P., Jany, K., Alberts, J., Van
Zyl, W., Steyn, P., & Holzapfel, W. (2005). Degradation of aflatoxin B1 by cell-free extracts of Rhodococcus erythropolis

! 190
and Mycobacterium fluoranthenivorans sp. nov. DSM44556 T. International journal of food microbiology, 105(2), 111-117.
Tolosa, J., Font, G., Mañes, J., & Ferrer, E. (2013). Nuts and dried
fruits: natural occurrence of emerging fusarium mycotoxins. Food Control.
Tonshin, A. A., Teplova, V. V., Andersson, M. A., & Salkinoja-
Salonen, M. S. (2010). The Fusarium mycotoxins enniatins and beauvericin cause mitochondrial dysfunction by affecting the mitochondrial volume regulation, oxidative phosphorylation and ion homeostasis. Toxicology, 276(1), 49-57.
Topcu, A., Bulat, T., Wishah, R., & Boyacı, I. H. (2010).
Detoxification of aflatoxin B1 and patulin by Enterococcus faecium strains. International journal of food microbiology, 139(3), 202-205.
Uhlig, S., Jestoi, M., & Parikka, P. (2007). Fusarium avenaceum -
The North European situation. International journal of food microbiology, 119(1-2), 17-24.
Uhlig, S., Torp, M., & Heier, B. T. (2006). Beauvericin and enniatins
A, A1, B and B1 in Norwegian grain: a survey. Food Chemistry, 94(2), 193-201.
Vaclavikova, M., Malachova, A., Veprikova, Z., Dzuman, Z.,
Zachariasova, M., & Hajslova, J. (2012). ´ Emerging´ mycotoxins in cereals processing chains: changes of enniatins during beer and bread making. Food Chemistry. 136, 750-757.

! 191
Voss, K., & Snook, M. (2010). Stability of the mycotoxin deoxynivalenol (DON) during the production of flour-based foods and wheat flake cereal. Food Additives & Contaminants: Part A, 27(12), 1694-1700.
Young, J. C., Zhu, H., & Zhou, T. (2006). Degradation of
trichothecene mycotoxins by aqueous ozone. Food and chemical toxicology, 44(3), 417-424.
Young, J. C., Zhou, T., Yu, H., Zhu, H., & Gong, J. (2007).
Degradation of trichothecene mycotoxins by chicken intestinal microbes. Food and chemical toxicology, 45(1), 136-
Zinedine, A., & Mañes, J. (2009). Occurrence and legislation of
mycotoxins in food and feed from Morocco. Food Control, 20(4), 334-344.
Zinedine, A., Soriano, J. M., Molto, J. C., & Mañes, J. (2007).
Review on the toxicity, occurrence, metabolism, detoxification, regulations and intake of zearalenone: an oestrogenic mycotoxin. Food and Chemical Toxicology, 45(1), 1-18.