Ecosystem type shapes trophic position and omnivory in ...
39
1 Ecosystem type shapes trophic position and omnivory in 1 fishes 2 3 4 Javier Sánchez-Hernández 1 and Per-Arne Amundsen 2 5 6 7 1 Departamento de Zooloxía, Xenética e Antropoloxía Física, Facultade de Bioloxía, 8 Universidade de Santiago de Compostela, Santiago de Compostela, España 9 2 Department of Arctic and Marine Biology, Faculty of Biosciences, Fisheries and 10 Economics, UiT The Arctic University of Norway, Tromsø, Norway 11 12 13 14 15 Corresponding author: Javier Sánchez-Hernández ([email protected]) 16 17 18 19 20 Running title: Ecosystem type shapes trophic ecology 21 22 Page 1 of 39 Fish and Fisheries
Transcript of Ecosystem type shapes trophic position and omnivory in ...

1
Ecosystem type shapes trophic position and omnivory in 1
fishes 2
3
4
Javier Sánchez-Hernández1 and Per-Arne Amundsen
2 5
6
7
1Departamento de Zooloxía, Xenética e Antropoloxía Física, Facultade de Bioloxía, 8
Universidade de Santiago de Compostela, Santiago de Compostela, España 9
2Department of Arctic and Marine Biology, Faculty of Biosciences, Fisheries and 10
Economics, UiT The Arctic University of Norway, Tromsø, Norway 11
12
13
14
15
Corresponding author: Javier Sánchez-Hernández ([email protected]) 16
17
18
19
20
Running title: Ecosystem type shapes trophic ecology 21
22
Page 1 of 39 Fish and Fisheries

2
Abstract 23
The identification of patterns in ecological characteristics of organisms is a central 24
challenge in macroecology with a growing research interest. The goal of this study was 25
to establish whether patterns in trophic ecology (trophic position and omnivory) of 26
fishes can be extended to an ecosystem dimension (freshwater versus marine 27
environments), based on the premise that differences in environmental and ecological 28
conditions of aquatic ecosystems have a large influence on the feeding ecology of 29
fishes. To elucidate any relationship between trophic ecology and ecosystem type, we 30
compiled a database using a global dataset for fishes (http://www.fishbase.org). The 31
database included 5726 species distributed in 53 orders based on three common feeding 32
strategies (herbivory, filter-feeding and predatory). Trophic position and omnivory 33
increased from freshwater to marine ecosystems in filter-feeding and predatory species. 34
In herbivore species in contrast, omnivory decreased, whereas no statistically significant 35
trends were found for trophic position, which may reflect a similar diet specialisation on 36
primary producers regardless of ecosystem type. These findings suggest that ecosystem 37
type has a marked effect on trophic position and omnivory in fishes, but the impact 38
depends on the type of feeding strategy. Prey availability, inherent feeding traits linked 39
to the phylogenetic relatedness of species, ontogenetic effects, spatial variability 40
(habitat related factors) and body size are considered as responsible factors for the 41
observed patterns. Our findings demonstrate consistent patterns in trophic 42
characteristics of organisms linked to ecosystem type, and underline the usefulness of 43
fishes as model organisms to test macroecology hypotheses. 44
45
Keywords: aquatic systems, FishBase, global datasets, macroecology, trophic ecology 46
47
Page 2 of 39Fish and Fisheries
3
Table of contents: 48
Introduction 49
Methods 50
Ecosystem type 51
Feeding strategies 52
Main food type 53
Habitat 54
Geographic range 55
Phylogenetic-taxonomic classification 56
Trophic position and omnivory index 57
Body size 58
Compiled dataset 59
Statistics 60
Results 61
Discussion 62
Acknowledgements 63
Page 3 of 39 Fish and Fisheries

4
Introduction 64
The assessment of the trophic position of animals has been a keystone for the 65
understanding of food web complexity and functioning (Hussey et al., 2014). Shifts in 66
trophic position of animals have been associated with several abiotic and biotic factors 67
such as prey availability, diet composition, body size, hydrologic stability, ecosystem 68
area and environmental change (e.g., Stergiou & Karpouzi, 2002; Sabo, Finlay, 69
Kennedy, & Post, 2010; Romanuk, Hayward, & Hutchings, 2011; Eloranta et al., 2015). 70
A recent study focussed on an anadromous fish species Atlantic salmon (Salmo salar, 71
Salmonidae) revealed a clear increasing gradient in trophic position from freshwater to 72
marine ecosystems using stable isotopes (Dixon, Power, Dempson, Sheehan, & Chaput, 73
2012). The proposed mechanism driving this gradient is the distinct feeding shift from 74
the freshwater to the marine environment, which leads to a marked change in the range 75
of carbon and nitrogen sources utilised by the species with a concomitant increase in its 76
trophic position (Dixon et al., 2012). The diet composition determines the trophic 77
position of animals with primary and intermediate consumers being located at lower 78
trophic levels than top predators (DeNiro & Epstein, 1978; McCutchan, Lewis, Kendall, 79
& McGrath, 2003). Consequently, the trophic position of animals summarises their 80
functional role in the trophic network of the ecological community and their specific 81
contribution to the energy flow pathways of the ecosystem (Post, 2002; Hussey et al., 82
2014). 83
84
Past studies have connected trophic position of fishes with aspects of trophic ecology 85
theory such as for example ontogenetic trajectories and dietary habits, highlighting that 86
trophic position typically increases with body size (Romanuk et al., 2011; Sánchez-87
Hernández, Eloranta, Finstad, & Amundsen, 2017, but see Layman, Winemiller, 88
Page 4 of 39Fish and Fisheries

5
Arrington, & Jespen, 2005), and increases from herbivorous to carnivorous species 89
(Stergiou & Karpouzi, 2002). Additionally, species of the same order or family are 90
expected to have similar dietary habits compared to species that are phylogenetically 91
more distant (German & Horn, 2006). Thus, the exploration of patterns in trophic 92
ecology across ecosystem type should include a framework that includes the interplay 93
among dietary habits, body size and phylogeny. Yet, variations in trophic position of 94
animals among different types of ecosystems are poorly explored, although some 95
notable exceptions exist (Carscallen et al., 2012; Dixon et al., 2012). Understanding the 96
ecological principles behind differences in feeding of animals among various types of 97
ecosystems is a basis for understanding food web dynamics and ecosystem functioning, 98
and thereby instrumental in the development of ecological theory (e.g., Shurin et al., 99
2002; Shurin, Gruner, & Hillebrand, 2006; Elser et al., 2007). Comparisons between 100
aquatic and terrestrial ecosystems have demonstrated unambiguous differences in their 101
food-web structure (see Shurin et al., 2006). Within aquatic systems, marine ecosystems 102
have traditionally been considered more productive than freshwater ecosystems (Shurin 103
et al., 2006), but freshwater and marine ecosystems are surprisingly similar in terms of 104
N and P limitations (Elser et al., 2007 and references therein). 105
106
The commonness and importance of omnivory have drawn attention of many scientists, 107
especially in relation to aspects of ecosystem stability (Long, Bruno, & Duffy, 2011; 108
Kratina, LeCraw, Ingram, & Anholt, 2012; Wootton, 2017). Omnivores are 109
polyphagous, consuming many types of prey from more than one trophic level, and thus 110
having an important impact on energy flows, nutrient cycling and ecosystem 111
functioning as promoters of stability (Fagan, 1997; Covich, Palmer, & Crowl, 1999; 112
Kratina et al., 2012). However, contemporary studies have come to differing 113
Page 5 of 39 Fish and Fisheries

6
conclusions in respect to the commonness of omnivory among ecosystem types. 114
Omnivory has traditionally been considered more common in marine systems compared 115
to both terrestrial and freshwater ecosystems (Chase, 2000; Shurin et al., 2006; 116
Thompson, Hemberg, Starzomski, & Shurin, 2007). On the other hand, González-117
Bergonzoni et al. (2012) concluded that the prevalence of omnivorous fish species is 118
higher in freshwater than in marine ecosystems, but with a consistent decreasing trend 119
with latitude regardless of type of ecosystem. Likewise, other researchers noted that 120
omnivory within the family Terapontidae is less frequent (in terms of number of 121
species) in marine and euryhaline environments than in freshwater systems (Davis, 122
Unmack, Pusey, Johnson, & Pearson, 2012). Besides, omnivory in some freshwater 123
systems, such as alpine lakes, can be very high (above 80% of omnivore species), and 124
even higher or similar to marine food webs (Sánchez-Hernández, Cobo, & Amundsen, 125
2015 and references therein). However, differences in omnivory among ecosystems are 126
still under scientific debate and the factors responsible of such differences in omnivory 127
are currently unexplored, representing a topical subject for ecological research. 128
129
This paper explores possible differences in trophic position and omnivory of fish among 130
two main types of aquatic ecosystems (freshwater and marine environments), aiming to 131
disentangle the magnitude and direction of any ecosystem-level dissimilarities in 132
trophic ecology. Fish species represent suitable model organisms to face comparative 133
ecological studies as they are widely distributed among contrasting ecosystem 134
configurations (i.e., freshwater, brackish and marine ecosystems). Utilising data from 135
FishBase, we here present the first comprehensive study comparing trophic position and 136
omnivory of fishes among ecosystem types including a broad dataset (5726 fish species) 137
based on three common feeding strategies (herbivory, filter-feeding and predatory), 138
Page 6 of 39Fish and Fisheries

7
main food types (plants, zooplankton, zoobenthos and nekton), spatial variability 139
(habitat and geographic range) and phylogeny (orders and families). The aim of the 140
present study was to establish whether patterns in trophic ecology (trophic position and 141
omnivory) can be extended to an ecosystem dimension. We expected an increasing 142
trend in trophic position and omnivory from freshwater to marine ecosystems related to 143
differences in their prey communities (Emery, 1978; Shurin et al., 2006; Grosberg, 144
Vermeij, & Wainwright, 2012), testing the hypothesis that fish species having the same 145
dietary habits or phylogeny vary their trophic position and omnivory with ecosystem 146
dimension. As the marine environment could be dominated by larger-bodied fish 147
species compared to freshwater systems, we further explored whether patterns in trophic 148
ecology of fishes can be related to ecosystem-specific differences in body size. We 149
finally tested the hypothesis that changes in trophic position and omnivory across 150
ecosystems remain the same regardless of habitat and geographic range. 151
152
Methods 153
Data were retrieved from FishBase, a global database including more than 33000 fish 154
species inhabiting freshwater, brackish and marine ecosystems (Froese & Pauly, 2017), 155
using “rFishBase” package (Boettiger, Lang, & Wainwright, 2012). Our study addresses 156
relevant information about trophic position, omnivory, feeding habits and type of 157
ecosystem to provide comprehensive coverage of the relevant trophic and ecological 158
aspects of our analyses. Fish species were classified according to: (i) ecosystem type, 159
(ii) feeding strategies, (iii) main food type, (iv) habitat type, (v) geographic range, and 160
(vi) phylogeny (orders and families) based on the categorical typologies supplied in 161
FishBase. 162
163
Page 7 of 39 Fish and Fisheries

8
Ecosystem type 164
Concerning ecosystem types, the dataset retrieved from FishBase included fish species 165
strictly limited to freshwater, brackish and marine ecosystems. Species strictly limited 166
to brackish waters were only represented by 21 species of which just four had available 167
the complete information needed for the analyses (trophic position, omnivory and 168
feeding strategy). Hence, the low numbers of brackish water species prevented their 169
further use in this study. Species inhabiting freshwater or marine ecosystems in 170
combination to brackish ecosystems were assigned as freshwater or marine, 171
respectively. However, species inhabiting all three ecosystem types (n = 298) were not 172
included in the further analyses to avoid possible bias related to the nature of the data 173
uploaded to FishBase, and eliminate the risk of including biased information from only 174
one ecosystem type instead of information including all three environments. 175
176
Feeding strategies 177
FishBase includes three categories (herbivory, filter-feeding and predatory) to give a 178
general idea of the feeding strategy in fishes. Herbivorous species include different 179
species predominantly grazing on aquatic (i.e., benthic algae, macrophytes or 180
periphyton) and terrestrial plants (i.e., riparian fruits and leaves), whereas filter feeders 181
and predators typically feed on animal material. Predators hunt macrofauna (insects, 182
crustaceans, worms, cephalopods, fish, etc), whereas filter feeders forage on plankton at 183
different depths of the water column. Because diet composition of animals shapes their 184
trophic position (DeNiro & Epstein, 1978; McCutchan et al., 2003), the three selected 185
feeding strategies may cover functional roles of fish species in the ecosystem at three 186
different food web levels: lower, intermediate and top. Herbivorous species exploiting 187
benthic sources such as algae (i.e., lower trophic taxa) reflect the lower levels of the 188
Page 8 of 39Fish and Fisheries

9
food webs. Filter feeders are adapted to exploit particles, especially zooplankton, 189
suspended in the water column and they may reflect the intermediate levels of food 190
webs through the pelagic production pathways. Predators, which actively hunt, catch 191
and ingest animals, are typically at the top of the food web and they are commonly used 192
as sentinel species of ecosystems. 193
194
Main food type 195
Predators species were partitioned into two groups (zoobenthivore and nekton feeders) 196
according to which main food type (zoobenthos and nekton, respectively) that was 197
dominant (>50% contribution) in the diet of each species. Zoobenthos comprises a wide 198
variety of prey categories including many taxa of insects, crustaceans, molluscs, 199
sponges, ascidians and polychaetes. Nekton includes organisms of relatively large size 200
capable of swimming against currents (mainly fish and cephalopods). This allowed us to 201
compare two broad foraging modes (zoobenthivore and nekton feeders) between 202
ecosystem types to reveal more accurate differences in trophic ecology between 203
ecosystem configurations. In contrast, the lack of categorical breakdown of herbivory 204
(with plants as main food) and filter-feeding (with zooplankton as main food) restricted 205
the further exploration of underlying dietary patterns between ecosystem types to 206
predatory species only. 207
208
Habitat 209
Because both freshwater and marine systems encompass several habitats with 210
contrasting food availabilities and variable conditions, species were grouped in eight 211
habitat typologies: (i) bathydemersal (living and feeding on the bottom below 200 m), 212
(ii) bathypelagic (living or feeding in open waters at depths between 1,000 and 4,000 213
Page 9 of 39 Fish and Fisheries
10
m), (iii) benthopelagic (living and feeding near the bottom as well as in midwaters or 214
near the surface), (iv) demersal (living on or near the bottom and feeding on benthic 215
organisms), (v) pelagic (living and feeding in the open waters), (vi) pelagic-neritic 216
(living and feeding in nearshore areas of open waters), (vii) pelagic-oceanic (living and 217
feeding in open waters beyond the continental shelf) and (viii) reef-associated (living 218
and feeding on or near coral reefs). While marine species included all habitat types 219
except the demersal, freshwater species were restricted to five of these habitat types (see 220
Appendix 1). 221
222
Geographic range 223
To guarantee that both the freshwater and marine fishes analysed are evenly distributed 224
across environments of similar temperature and environmental conditions, geographic 225
range was taken into account. All fish species were sorted into four broad geographic 226
zones or climatic domains according to its distribution, including (i) tropical, (ii) 227
subtropical (broadly located between 23.5° and 35.0° north or south latitude), (iii) 228
temperate (middle latitudes, spanning between the tropics and the polar regions), and 229
(iv) polar (including north of the Arctic and south of the Antarctic Circles) species. 230
Many bathydemersal and bathypelagic species show a wide geographic range including 231
several geographic zones and were assigned as cosmopolitan species (see Appendix 1). 232
When geographic range was not provided in FishBase, the geographic range was 233
assigned based upon assessments of location information or maps provided in FishBase. 234
235
Phylogenetic-taxonomic classification 236
As indicated in the Introduction, key components of this study such as aspects of dietary 237
habits and covariates such as body size and habitat type may all have significant 238
Page 10 of 39Fish and Fisheries

11
associations with the phylogenetic relatedness of species (e.g., German & Horn, 2006; 239
Romanuk et al., 2011; Davis et al., 2012). Thus, we assigned phylogeny (order and 240
family) to each species to be more accurate in our analyses. However, many of the 241
orders belonged to only one type of ecosystem, and in other cases the low numbers (n < 242
10) of species belonging to the same order prevented its use (see Appendix 2). In this 243
regard, we performed a comparative study of five orders (Clupeiformes, Osmeriformes, 244
Perciformes, Scorpaeniformes and Siluriformes) based on the selection criteria of a 245
minimum number of ten species (i.e., n ≥ 10). Additionally, a good representation in 246
terms of species numbers of some families in both ecosystem types, allowed us also to 247
perform analyses at the family level for Clupeidae (Clupeiformes), Gobiidae 248
(Perciformes) and Ariidae (Siluriformes). 249
250
Trophic position and omnivory index 251
In FishBase, trophic position (Troph) is estimated according to Pauly & Christensen 252
(1995) by adding 1 to the mean trophic position of each prey species in the diet (DIET 253
Table in FishBase; Palomares & Sa-a, 2000) utilised by a species: 254
255
����ℎ = 1 +�� �
��× ����ℎ
256
where Trophj is the fractional trophic level of prey j, DCij represents the fraction of j in 257
the diet of the fish species i and G is the total number of prey species. Troph usually 258
vary around 2 and 5 in herbivorous and carnivorous organisms, respectively (Pauly, 259
Trites, Capuli, & Christensen, 1998; Froese & Pauly, 2017). For example, if the fish 260
species i shows a diet composed by, in terms of relative abundance, 50% phytoplankton 261
Page 11 of 39 Fish and Fisheries

12
(Troph = 1) and 50% zooplankton (Troph = 2); the fish species i would have Troph of 262
2.5. In this regard, there has been a continuous debate over the use of gut content 263
analysis versus stable isotopes methods for estimates of trophic position of animals 264
(e.g., Post, 2002; Rybczynski, Walters, Fritz, & Johnson, 2008; Carscallen et al., 2012). 265
Often, gut content analyses have been criticised as being less powerful and accurate 266
than stable-isotope-based estimates of trophic position (Post, 2002). However, several 267
studies have demonstrated that estimates of trophic position based on dietary 268
observations are straightforward and highly correlated to isotope-based methods (Kline 269
& Pauly, 1998; Carscallen et al., 2012). FishBase contains two trophic position metrics 270
(FoodTroph and DietTroph); here we relied on FoodTroph because of its higher 271
abundance of records compared to DietTroph. 272
273
The omnivory index (OI) is calculated from the variance of the Troph of the consumed 274
food resources: 275
276
�� =��� − ���� − 1���
��
2× ��
277
where n is the number of prey categories, TLj is the Troph of prey j, TLi is the trophic 278
level of predator i, and DCij is the fraction of prey j in the diet of predator i. The index 279
values vary from zero (when all feeding occurs at the same trophic level) to increasing 280
values with an increasing variety of Troph of the utilised prey categories. 281
282
Body size 283
Page 12 of 39Fish and Fisheries

13
Since fish size is an important factor, particularly in respect to trophic position 284
(Romanuk et al., 2011), we retrieved body size information (here maximum length) 285
from FishBase. This allowed us to test whether any differences observed between 286
ecosystem types in trophic position and omnivory can be related to ecosystem-specific 287
differences in body size. 288
289
Compiled dataset 290
The final dataset consisted of data for trophic position, omnivory index, body size, 291
dietary habits (feeding strategies and main food type), habitat type, geographic range 292
and ecosystem type in 5426 species distributed in 53 orders and 387 families (Appendix 293
2). Additionally, the nature of the compiled dataset comprising several categorical 294
covariates, allowed us to run two comparative approaches, including coarse and finer 295
scaled dietary habits. The coarse-scaled approach was covered by using a broad fish 296
classification into the above-described feeding strategies. On the other hand, the 297
categorical breakdown of predatory species into two dietary groups (i.e., zoobenthivore 298
and nekton feeders) together with the phylogenetic considerations and spatial variability 299
(habitat and geographic range) enabled a finer treatment of the dataset. The low 300
sampling size (n < 5; Appendix 1) in freshwater species inhabiting bathydemersal and 301
pelagic-neritic habitats prevented its use for the comparative approach. All data used in 302
this study are available from FishBase (see Data accessibility). 303
304
Statistics 305
Statistical analyses and graphical outputs were performed using R 3.4.2 (R Core Team, 306
2017). Shapiro–Wilk tests indicated non-normality in the data. To identify the possible 307
differences in trophic ecology (trophic position and omnivory) and body size of fishes 308
Page 13 of 39 Fish and Fisheries

14
between ecosystem types, we used the nonparametric Mann-Whitney-Wilcoxon test for 309
two independent groups of samples. This comparative approach was repeated for coarse 310
(feeding strategies) and finer (main food type, phylogeny, habitat and geographic range) 311
scale dietary habits. Significance levels were adjusted by applying the Bonferroni 312
method using the ‘‘dunn.test’’ package (Dinno, 2017). 313
314
Because the FishBase data relies on the original data uploaded and may be biased 315
towards frequently studied or economically important species, there is a need to control 316
possible data biases. Statistical procedures carried out in this study were aimed to 317
control these limitations by using finer scale dietary habits and mixed modelling with 318
random effects. If the outcomes remain similar across finer scale dietary habits and 319
spatial covariates, the robustness of our findings regardless of possible biases is 320
supported. In addition, random effects control for heterogeneity and variation 321
attributable to different studies being conducted by different researchers, and can reduce 322
publication bias (Zuur, Ieno, Walker, Saveliev, & Smith, 2009; Stanley, Doucouliagos, 323
& Ioannidis, 2017; Gurevitch, Koricheva, Nakagawa, & Stewart, 2018). Because our 324
data did not meet normality and hence the assumptions for linear regression models 325
(Zuur et al., 2009), we used generalised additive mixed models (GAMMs) to test 326
whether ecosystem type affects the trophic ecology of fishes using the “mgcv” package 327
(Wood, 2017). We modelled each dependent variable separately (i.e., one model for 328
trophic position and another for omnivory) with ecosystem type as smoothed term, and 329
adjusted for phylogenetic effects by adding order as a random intercept in the GAMMs. 330
Thus, by introducing order as a random factor, we model between-order variation in diet 331
composition resulting from variables not possible to consider in the current study such 332
as e.g. morphological constrains (gape size, gill raker length and interraker spacing) and 333
Page 14 of 39Fish and Fisheries

15
variation and potential biases attributable to a plausible non-random selection of species 334
uploaded to FishBase (e.g., frequently studied or economically important species are 335
more likely to be represented). Additionally, to account for dietary habits and spatial 336
effects in our models, feeding strategies, main food type, habitat type and geographic 337
range were also included as smoothed terms. Thus, the full model consisted of one 338
predictor variable and five smooth terms [~ body size + s(ecosystem) + s(feeding 339
strategies) + s(main food type) + s(habitat)+ s(geographic range)] with order as random 340
factor. The smooth terms represent categorical variables with data hierarchically 341
structured (i.e., data structure organised in several categories). GAMMs and model 342
selection was done by model comparison using the “MuMIn” package (Bartoń, 2017). 343
Using a model selection method (Burnham & Anderson, 2002), we ranked the candidate 344
models according to the Akaike information criterion (AIC, the best model being the 345
one with the lowest AIC values). Residuals of the final selected models were visually 346
inspected for deviations from normality and heteroscedasticity without finding evidence 347
for any violation of model assumptions (see Appendix 3). Analyses were considered 348
statistically significant at p<0.05. 349
350
Results 351
Overall, Troph tended to increase from freshwater to marine ecosystems (Figure 1), but 352
statistically significant differences were only found in eleven out of nineteen cases (see 353
Table 1). Specifically, ecosystem type shaped Troph in filter-feeding (W = 27039, p = 354
0.001), predatory (W = 1017400, p < 0.001) and zoobenthivore (W = 465690, p < 355
0.001) species, with higher values in marine than in freshwater ecosystems. Trophic 356
position was also significantly higher in marine species of Osmeriformes (W = 98, p = 357
0.022) and Scorpaneiformes (W = 523, p = 0.025), but higher in freshwater species of 358
Page 15 of 39 Fish and Fisheries

16
Gobiidae (W = 718.5, p = 0.006). Except for polar species (W = 155, p = 0.671), the 359
higher Troph values observed in marine species compared to freshwater species were 360
remained across habitat types and geographic range (Figure 2 and Table 1). All 361
statistically significant tests remained significant after Bonferroni correction. 362
363
Also omnivory increased from freshwater to marine ecosystems in filter-feeding (W = 364
28416, p = 0.012), predatory (W = 1183600, p < 0.001), zoobenthivore (W = 574290, p 365
< 0.001), benthopelagic (W = 61054, p < 0.001), demersal (W = 241040, p = 0.001), 366
subtropical (W = 27927, p < 0.001) and temperate (W = 44672, p < 0.001) species 367
(Figures 1 and 2), whereas the direction of increase was the inverse (i.e., from marine to 368
freshwater ecosystems) in herbivorous species (W = 39480, p = 0.036), nekton-feeders 369
(W = 128920, p < 0.001) and Perciformes (W = 717230, p < 0.001). All statistically 370
significant tests remained significant after Bonferroni correction (Table 1). 371
372
The best model configurations for Troph and omnivory highlighted the importance of 373
ecosystem type and dietary habits (i.e., feeding strategies and main food type) to 374
understand the observed patterns in ecological characteristics of fish species (Table 2). 375
Habitat type and body size (here maximum size) were influential variables of the most 376
satisfactory model for omnivory, whereas geographic range and body size had a 377
substantial influence on trophic position (see Appendix 4 for summary table of the 10 378
best model simulations). Thus, body size may be a contributing factor for the observed 379
patterns across the ecosystem dimension, but again this impact largely depended on the 380
dietary habits of species as Troph and omnivory seemed to be strongly linked to body 381
size only in predatory, zoobenthivore, benthopelagic, demersal, subtropical and 382
temperate species as well as in Scorpaneiformes (see Table 1). Moreover, despite the 383
Page 16 of 39Fish and Fisheries

17
higher Troph revealed in marine compared to freshwater species of Osmeriformes, the 384
species within this order tended to be larger in freshwater ecosystems (W = 61.5, p < 385
0.001). The model configurations showed the ubiquitous importance of ecosystem 386
differences in dietary habits (i.e., feeding strategy and main food type) to understand 387
differences in trophic characteristics of organisms across ecosystems (Table 2 and 388
Appendix 4). 389
390
Discussion 391
Ecosystem type had a marked effect on trophic position and omnivory in fishes, but the 392
impact depended on the type of feeding strategy and inherent food preferences linked to 393
the phylogenetic relatedness of species. More specifically, trophic position and 394
omnivory revealed an increasing trend from freshwater to marine ecosystems in both 395
filter-feeding and predatory species, as well as within some specific taxonomic groups 396
(Osmeriformes and Scorpaeniformes), whereas a decreasing trend was found for 397
herbivory species and Gobiidae. These trends seemed partly to be related to ecosystem-398
specific differences in body size. However, the impact largely depended on the type of 399
feeding strategy as body size was an important factor for ecosystem differences in the 400
trophic ecology of predatory species (especially those with zoobenthos as main food) 401
and Scorpaneiformes, whereas less effects of body size was seen in filter-feeding and 402
herbivory species and also within most orders as indicated in Table 1. The increasing 403
trend from freshwater to marine ecosystems in trophic position and omnivory remained 404
the same regardless of spatial variability (habitat and geographic range). In line with 405
macroecological theory, the revealed patterns in trophic position and omnivory of 406
aquatic animals between ecosystem type may in part also result from a greater 407
Page 17 of 39 Fish and Fisheries

18
production and biodiversity in marine compared to freshwater ecosystems (Shurin et al., 408
2006; Grosberg et al., 2012). 409
410
Our hypothesis that the trophic position of fishes would be associated with ecosystem 411
type was partially supported. Trophic position increased from freshwater to marine 412
ecosystems in filter-feeding, predatory (only statistically significant in those species 413
feeding mainly on zoobenthos), benthopelagic, demersal, tropical, subtropical and 414
temperate species, and in Osmeriformes and Scorpaneiformes, but not in herbivory 415
species and most other taxonomic classifications (i.e., six out of eight). This suggests 416
that species grazing on benthic resources, most typically algae, may have similar trophic 417
levels regardless of ecosystem type (France, 1996). We posit that the similarity in 418
trophic level of herbivore species between ecosystem types may be a result of these 419
species being highly specialised on consuming primary producers and thus having a 420
lower ability to utilise prey at other (i.e., higher) trophic levels. This is strongly 421
supported by their low degree of omnivory, which thus locates them at the lowest 422
consumer position in all ecosystem types. 423
424
Because energy transfer efficiencies can vary among ecosystems (see Pauly & 425
Christensen, 1992), the response to changes in prey availability among ecosystems and 426
geographic territories within the same ecosystem is central in many theories of aquatic 427
ecosystem functioning and dynamics (Ives, Cardinale, & Snyder, 2005; Dixon et al., 428
2012; Schmitz, Miller, Trainor, & Abrahms, 2017). Our findings corroborate this view 429
as a clear increasing gradient in trophic position was found between freshwater and 430
marine ecosystems in filter-feeding and predatory species. Our analyses also provide 431
solid evidence that the increasing gradient in trophic position between freshwater and 432
Page 18 of 39Fish and Fisheries
19
marine species is maintained at a more localised range (here habitat and geographic 433
range). It is reasonable to posit that this shift from low to high trophic positions between 434
aquatic ecosystems is a response to changes in prey availability, which is usually more 435
diverse, productive and abundant in the marine systems (Shurin et al., 2006; Grosberg et 436
al., 2012). Trophic position of fish species is very variable among species and 437
commonly range from 2.0 to 5.29 (Vander Zanden & Rasmussen, 1996; Vander 438
Zanden, Cabana, & Rasmussen, 1997; Stergiou & Karpouzi, 2002; Romanuk et al., 439
2011), being positively related to maximum body size of the species (Romanuk et al., 440
2011). Our results provide important advances on these previous studies by contributing 441
new evidence of the importance of ecosystem type and type of feeding strategy to 442
understand the variation in trophic position of fish species. Noteworthy, ecosystem-443
specific differences in body size, most likely associated with morphological constraints 444
(i.e., gape limitation), appear to play a key role in determining trends in trophic position 445
across ecosystems in predatory species, but not in filter-feeding and herbivory species. 446
An important mechanism driving this trend might be piscivorous behaviour. Piscivory 447
leads to increases in trophic position and typically a specialisation in resource use 448
(Sánchez-Hernández et al., 2017 and references therein). Additionally, it seems like the 449
proportion of piscivorous species is greater in marine than in freshwater systems 450
(Winemiller & Leslie, 1992). Opposite, cannibalism has been assumed to be more 451
common in freshwater than in marine systems (Pereira, Keppeler, Agostinho, & 452
Winemiller, 2017a), but a recent review suggests that the degree of cannibalism is 453
similar between marine and freshwater fishes (Pereira, Agostinho, & Winemiller, 454
2017b). Thus, our findings and those of other authors (e.g., Winemiller & Leslie, 1992), 455
indicate that the capacity to forage on fish and other nekton resources seems to be more 456
common in marine than in freshwater predators as indicated here by their higher trophic 457
Page 19 of 39 Fish and Fisheries

20
position. That said, we postulate that the positive trend in trophic position from 458
freshwater to marine ecosystems by predatory species, apparently shaped by body size, 459
is highly linked to piscivorous behaviour since piscivory drives an increase in trophic 460
position and increases over the ontogeny (e.g., Mittelbach & Persson, 1998; Sánchez-461
Hernández et al., 2017). Additionally, we posit that the unexpectedly higher trophic 462
position of Gobiidae in the freshwater environment is related to phylogenetic-related 463
differences in dietary habits across ecosystem, with nekton feeders in this taxon being 464
more prevalent in freshwater environments (15% and 1.6% in freshwater and marine, 465
respectively), and consequently responsible of its overall higher trophic position. This 466
underpins that differences in inherent dietary habits linked to the phylogenetic 467
relatedness of species across type of ecosystems may be a keystone for understanding 468
patterns in trophic position of fishes. Additional work will be needed to explore whether 469
or not similar patterns can be generalised to other aquatic consumers. 470
471
Previous studies have reached contrasting conclusions in respect to the prevalence of 472
omnivory in different aquatic ecosystems, but the present study confirms that the 473
importance of omnivory can be extended to an ecosystem dimension (i.e., higher in 474
marine environments) and our findings also provide novel insight to the causes that lead 475
to differences in omnivory levels across ecosystems. Hence, the revealed patterns in 476
omnivory of fishes corroborate the hypothesis that ecosystem dimension shape the 477
prevalence of omnivory in aquatic consumers. With a few exceptions (nekton-feeders, 478
herbivory species, tropical species, polar species and Perciformes), omnivory increased 479
from freshwater to marine ecosystem. Thus, our study largely supports previous 480
findings on the notion that omnivory is more prevalent in marine compared to both 481
terrestrial and freshwater ecosystems (Chase, 2000; Shurin et al., 2006; Thompson et 482
Page 20 of 39Fish and Fisheries

21
al., 2007). However, recent studies have shown that the prevalence of omnivorous 483
species seems to be higher in freshwater than in marine ecosystems (González-484
Bergonzoni et al., 2012; Sánchez-Hernández et al., 2015). These are seemingly 485
contradictory standpoints. The first consideration encapsulates that the variety of trophic 486
positions of prey categories consumed by fishes (henceforth “degree of omnivory”) is 487
higher in marine than in freshwater ecosystems, and the second that the relative 488
proportion of species that can exploit resources at multiple trophic levels is actually 489
greater in freshwater ecosystems. We suggest that these apparent contradictions can be 490
resolved if the nature of omnivory by fish species, the prey availability and the 491
ontogenetic dietary shifts of species are taken into account. That is, although the number 492
or prevalence of omnivore species can be higher in freshwater, the degree of omnivory 493
is higher in marine species, most likely because of a higher plasticity of marine species 494
to exploit available resources at a higher number of trophic levels compared to 495
freshwater species. This can clearly be illustrated through the example of filter-feeding 496
fish species. Although these species may select food particles suspended in the water 497
(seston) by size based on morphological constrains (gape size, gill raker length and 498
interraker spacing), they do usually not select by prey type (Gerking, 1994). It should be 499
kept in mind that in contrast to marine systems, freshwater systems contain 500
comparatively simple communities of organisms suspended in the water. More 501
precisely, food resources available for filter feeders are limited to zooplankton in 502
freshwater systems, whereas available resources are much wider in the marine systems, 503
including also taxa other than common zooplankton (i.e., copepods and cladocerans), 504
such as krill, worms, mollusks and fish larvae (Garrido et al., 2008; Costalago, Garrido, 505
& Palomera, 2015). It is possible that this broader variety of food resources available in 506
Page 21 of 39 Fish and Fisheries

22
the marine environment is connected to the observed positive trends in omnivory and 507
trophic position from freshwater to marine ecosystems by fishes. 508
509
On the other hand, the differences in ontogenetic dietary shifts between ecosystems can 510
be vital to understand the magnitude and direction of any ecosystem-level dissimilarities 511
in omnivory. Taking as example the nekton feeders, we accept the view that the nature 512
of the ontogenetic dietary shifts is responsible for their higher omnivory in freshwater 513
ecosystems. We posit that the occurrence of several distinct ontogenetic dietary shifts 514
might be less plausible in marine predator species because they usually switch to 515
piscivory very early in the ontogeny or undergo smooth dietary shifts, such as many 516
species of e.g. Squaliformes, tunas (Thunnus spp., Scombridae) or anglerfish (Lophius 517
spp., Lophiidae) (e.g., Preciado, Velasco, Olaso, & Landa, 2006; Reglero, Urtizberea, 518
Torres, Alemany, & Fiksen, 2011). In contrast, freshwater nekton feeders may appear to 519
undergo several steps before they become piscivorous, thereby consuming prey types 520
from more trophic levels than marine species. From the FishBase data, this is the case 521
for many freshwater predators such as pikeperch (Sander lucioperca, Percidae) and 522
some salmonids, who initially prey upon zooplankton and zoobenthos, but later switch 523
to fish. Similar as for trophic position, it is reasonable to posit that ecosystem type 524
impacts omnivory in fishes in response to changes in prey availability across 525
ecosystems. Factors other than prey availability, such as inherent food preferences and 526
ontogenetic dietary shifts may also have a major influence on omnivory in fishes, and 527
thus the differences that occur between ecosystems. 528
529
As already pointed out, a caveat should be exercised regarding conclusions from 530
analyses of dietary data uploaded to FishBase. These may suffer limitations from 531
Page 22 of 39Fish and Fisheries

23
heterogeneity and other data issues due to possible biases towards (i) frequently studied 532
or economically important species and (ii) uneven sampling effort across the different 533
dietary habits and spatial variability (e.g., habitat and geographic related factors), which 534
may hinder our ability to identify gradients across ecosystems. Here, these potential 535
biases were addressed by implementing analytical approaches using random effects 536
(Zuur et al., 2009; Stanley et al., 2016; Gurevitch et al., 2018; see the Statistics section). 537
In addition, the key conclusions of this study (i.e., trophic position and omnivory 538
increase from freshwater to marine species) broadly remained the same across habitat, 539
geographic range and finer scaled dietary habits (main food type and phylogeny), 540
suggesting a strong robustness of our findings regardless of any possible biases in the 541
data archive. Still, there are some limitations and considerations that need to be 542
acknowledged when using the available FishBase dataset as in the present study. In fact, 543
one of the main disadvantages of this approach could be the lack of a comprehensive 544
database covering ontogenetic and seasonal effects on dietary habits of fish species as 545
was thoroughly highlighted by Stergiou & Karpouzi (2002). It seems that in FishBase, 546
ontogenetic dietary shifts are well covered for some species, whereas information about 547
ontogenetic trajectories is limited for other species. A good representation of these 548
dietary shift in FishBase can e.g. be found in European perch (Perca fluviatilis, 549
Percidae), which is known for showing characteristic ontogenetic dietary shifts with 550
juveniles primarily feeding upon zooplankton before switching to benthic invertebrates 551
and later to small and subsequently to large fish prey (e.g., Amundsen et al., 2003). In 552
contrast, many omnivorous and herbivorous species undergo ontogenetic dietary shifts 553
from utilising animal resources to the comprehensive use of vegetal resources (plants 554
and detritus) (e.g., Drewe, Horn, Dickson, & Gawlicka, 2004; Reckendorfer et al., 2011; 555
Sánchez-Hernández & Cobo, 2012), which, in turn, might not be well covered in 556
Page 23 of 39 Fish and Fisheries

24
FishBase. For example, the Common nase (Chondrostoma nasus, Cyprinidae), is in 557
FishBase considered as a strict herbivore species, but studies have shown that this 558
species rather should be considered as a facultative herbivory species with ontogenetic 559
dietary shifts that also include animal resources in the diet early in the ontogeny 560
(Reckendorfer et al., 2011). Thus, while trophic position and omnivory seem to be 561
accurately estimated in FishBase for many species undergoing ontogenetic dietary 562
shifts, the generic lists of all dietary items included in FishBase may for many other 563
uncommon and unstudied species not fully cover the ontogenetic dietary effects. 564
Another limiting factor for the FishBase estimation of trophic ecology (trophic position 565
and omnivory) could be related to the indices used for the expression of diet 566
composition data (e.g., numeric, volumetric, gravimetric, frequency of occurrence, etc). 567
As previously highlighted by Stergiou & Karpouzi (2002), frequency of occurrence and 568
numerical data are not good indicators of diet because they provide little information 569
about the relative amount of each prey category present in the stomach or the 570
information may be biased according to the size of the prey items, respectively. 571
Although FishBase aims only to use quantitative reports of diet composition data 572
(percentage of volume or weight) (see The DIET Table in FishBase; Palomares & Sa-a, 573
2000), more effort needs to be paid to make such diet data of poorly studied species 574
available in order to provide more accurate measures of their trophic position and 575
degree of omnivory. Because the data used in this study depends on the original dietary 576
data uploaded to FishBase, the revealed patterns might potentially be biased from the 577
inclusion of estimates of trophic position and omnivory that are not covering seasonal 578
and ontogenetic effects for some fish species. Additionally, the dataset used in this 579
study was not equally represented across habitats and phylogeny, which may impose a 580
limitation to explore ecosystem changes in trophic position and omnivory. Yet, the 581
Page 24 of 39Fish and Fisheries
25
increasing trend from freshwater to marine ecosystems in trophic position and omnivory 582
was homogeneous regardless of habitat, geographic range and phylogeny, underlining 583
the replicability of our key findings and thus supporting their robustness regardless of 584
any possible biases that may occur in the used dataset. Hence, despite these potential 585
problems, the promising results of this study encourage the extension of this approach 586
by using data from different sources and combining stomach and isotope based methods 587
in order to improve the robustness and reliability of the used dataset and thereby 588
enhance the exploration of macroecological questions in trophic ecology. 589
590
In conclusion, ecosystem type evidently shapes trophic position and omnivory in fishes, 591
but the magnitudes of their effects are often quite variable depending on the type of 592
feeding strategy (here herbivory, filter-feeding and predatory) and the resource 593
preferences linked to the phylogenetic relatedness of species. Changes with ecosystem 594
type were less pronounced in herbivore species as they are specialised on primary 595
producers and thus to a small extent omnivorous, which, in turn, results in the same 596
basal trophic position among ecosystems. The study provides novel insight to 597
macroecological theory by demonstrating patterns in trophic characteristics of 598
organisms across ecosystems and identifying the most influential drivers for trophic 599
position and omnivory of fishes. 600
601
Acknowledgements 602
We appreciate the constructive comments from four anonymous reviewers, which 603
considerably improved the quality of the initial submission. Javier Sánchez-Hernández 604
was supported by a postdoctoral grant from the Galician Plan for Research, Innovation, 605
and Growth (Plan I2C, Xunta de Galicia). 606
Page 25 of 39 Fish and Fisheries

26
References 607
Amundsen, P.-A., Bøhn, T., Popova, O. A., Staldvik, F. J., Reshetnikov, Y. S., 608
Kashulin, N. A., & Lukin, A. (2003). Ontogenetic niche shifts and resource 609
partitioning in a subarctic piscivore fish guild. Hydrobiologia, 497, 109–119. 610
doi: 10.1023/A:1025465705717 611
Bartoń, K. (2017). MuMIn: Multi-Model Inference. R package version 1.40.0. 612
https://CRAN.R-project.org/package=MuMIn (accessed 25 May 2018). 613
Boettiger, C., Lang, D. T., & Wainwright, P. C. (2012). rfishbase: exploring, 614
manipulating and visualizing FishBase data from R. Journal of Fish Biology, 81, 615
2030–2039. doi: 10.1111/j.1095-8649.2012.03464.x 616
Burnham, K. P., & Anderson, D. R. (2002). Model Selection and Multimodel Inference: 617
A Practical Information-Theoretical Approach (2nd Edition). New York, 618
Springer-Verlag. 619
Carscallen, W. M. A., Vandenberg, K., Lawson, J. M., Martinez, N. D., & Romanuk, T. 620
N. (2012). Estimating trophic position in marine and estuarine food webs. 621
Ecosphere, 3, 25. doi: 10.1890/ES11-00224.1 622
Chase, J. M. (2000). Are there real differences among aquatic and terrestrial food webs? 623
Trends in Ecology & Evolution, 15, 408–412. doi: 10.1016/S0169-624
5347(00)01942-X 625
Costalago, D., Garrido, S., & Palomera, I. (2015). Comparison of the feeding apparatus 626
and diet of European sardines Sardina pilchardus of Atlantic and Mediterranean 627
waters: ecological implications. Journal of Fish Biology, 86, 1348–1362. doi: 628
10.1111/jfb.12645 629
Page 26 of 39Fish and Fisheries

27
Covich, A. P., Palmer, M. A., & Crowl, T. A. (1999). The role of benthic invertebrate 630
species in freshwater ecosystems. Bioscience, 49, 119–128. doi: 631
10.2307/1313537 632
Davis, A. M., Unmack, P. J., Pusey, B. J., Johnson, J. B., & Pearson, R. G. (2012). 633
Marine-freshwater transitions are associated with the evolution of dietary 634
diversification in terapontid grunters (Teleostei: Terapontidae). Journal of 635
Evolutionary Biology, 25, 1163–1179. doi: 10.1111/j.1420-9101.2012.02504.x 636
DeNiro, M. J., & Epstein, S. (1978). Influence of diet on the distribution of carbon 637
isotopes in animals. Geochimica et Cosmochimica Acta, 42, 495–506. doi: 638
10.1016/0016-7037(78)90199-0 639
Dinno, A. (2017). dunn.test: Dunn's Test of Multiple Comparisons Using Rank Sums. R 640
package version 1.3.5. https://CRAN.R-project.org/package=dunn.test (accessed 641
25 May 2018). 642
Dixon, H. J., Power, M., Dempson, J. B., Sheehan, T. F., & Chaput, G. (2012). 643
Characterizing the trophic position shift in Atlantic salmon (Salmo salar) from 644
freshwater to marine life-cycle phases using stable isotopes. ICES Journal of 645
Marine Science, 69, 1646–1655. doi: 10.1093/icesjms/fss122 646
Drewe, K. E., Horn, M. H., Dickson, K. A., & Gawlicka, A. (2004). Insectivore to 647
frugivore: ontogenetic changes in gut morphology and digestive enzyme activity 648
in the characid fish Brycon guatemalensis from Costa Rican rainforest streams. 649
Journal of Fish Biology, 64, 890–902. doi: 10.1111/j.1095-8649.2004.0357.x 650
Emery, A. R. (1978). The basis of fish community structure: marine and freshwater 651
comparisons. Environmental Biology of Fishes, 3, 33–47. doi: 652
10.1007/BF00006307 653
Page 27 of 39 Fish and Fisheries
28
Eloranta, A. P., Kahilainen, K. K., Amundsen, P.-A., Knudsen, R., Harrod, C., & Jones, 654
R. I. (2015). Lake size and fish diversity determine resource use and trophic 655
position of a top predator in high-latitude lakes. Ecology and Evolution, 5, 656
1664–1675. doi: 10.1002/ece3.1464 657
Elser, J. J., Bracken, M. E. S., Cleland, E. E., Gruner, D. S., Harpole, W. S., Hillebrand, 658
H., … Smith J. E. (2007). Global analysis of nitrogen and phosphorus limitation 659
of primary producers in freshwater, marine and terrestrial ecosystems. Ecology 660
Letters, 10, 1135-1142. doi: 10.1111/j.1461-0248.2007.01113.x 661
Fagan, W. F. (1997). Omnivory as a stabilizing feature in natural communities. The 662
American Naturalist, 150, 554–567. doi: 10.1086/286081. 663
France, R. L. (1996). Stable isotopic survey of the role of macrophytes in the carbon 664
flow of aquatic foodwebs. Vegetatio, 124, 67-72. doi: 10.1007/BF00045145 665
Froese, R., & Pauly, D. (2017). FishBase. World Wide Web electronic publication. 666
www.fishbase.org, version (10/2017). 667
Garrido, S., Ben-Hamadou, R., Oliveira, P. B., Cunha, M. E., Chícharo, M. A., & van 668
der Lingen, C.D. (2008). Diet and feeding intensity of sardine Sardina 669
pilchardus: correlation with satellite-derived chlorophyll data. Marine Ecology 670
Progress Series, 354, 245–256. doi: 10.3354/meps07201 671
Gerking, S. D. (1994). Feeding Ecology of Fish. San Diego, Academic Press. 672
German, D. P., & Horn, M. H. (2006). Gut length and mass in herbivorous and 673
carnivorous prickleback fishes (Teleostei: Stichaeidae): ontogenetic, dietary, and 674
phylogenetic effects. Marine Biology, 148, 1123–1134. doi: 10.1007/s00227-675
005-0149-4 676
González-Bergonzoni, I., Meerhoff, M., Davidson, T. A., Teixeira de Mello, F., 677
Baattrup-Pedersen, A., & Jeppesen, E. (2012). Meta-analysis shows a consistent 678
Page 28 of 39Fish and Fisheries

29
and strong latitudinal pattern in fish omnivory across ecosystems. Ecosystems, 679
15, 492–503. doi: 10.1007/s10021-012-9524-4 680
Grosberg, R. K., Vermeij, G. J., & Wainwright, P. C. (2012). Biodiversity in water and 681
on land. Current Biology, 22, R900–3. doi: 10.1016/j.cub.2012.09.050 682
Gurevitch, J., Koricheva, J., Nakagawa, S., & Stewart, G. (2018). Meta-analysis and the 683
science of research synthesis. Nature, 555, 175–182. doi: 10.1038/nature25753 684
Hussey, N. E., MacNeil, M. A., McMeans, B. C., Olin, J. A., Dudley, S. F. J., Cliff, G. 685
C., … Fisk, A. T. (2014). Rescaling the trophic structure of marine food webs. 686
Ecology Letters, 17, 239–250. doi: 10.1038/nature25753 687
Ives, A. R., Cardinale, B. J., & Snyder, W. E. (2005). A synthesis of subdisciplines: 688
predator–prey interactions, and biodiversity and ecosystem functioning. Ecology 689
Letters, 8, 102–116. doi: 10.1111/j.1461-0248.2004.00698.x 690
Kline, T. C., & Pauly, D. (1998). Cross-validation of trophic level estimates from a 691
mass-balance model of Prince William Sound using 15N/14N data. In T. J. 692
Quinn, F. Funk, J. Heifetz, J. N. Ianelli, J. E. Powers, J. F. Schweigert, P. J. 693
Sullivan & C. I. Zhang (Eds.), Fishery stock assessment models (pp. 693–702). 694
Alaska : University of Alaska Fairbanks. 695
Kratina, P., LeCraw, R. M., Ingram, T., & Anholt, B. R. (2012). Stability and 696
persistence of food webs with omnivory: Is there a general pattern? Ecosphere, 697
3, 50. doi: 10.1890/ES12-00121.1 698
Layman, C. A., Winemiller, K. O., Arrington, D. A., & Jespen, D. B. (2005). Body size 699
and trophic position in a diverse tropical food web. Ecology, 86, 2530–2535. 700
doi: 10.1890/04-1098 701
Page 29 of 39 Fish and Fisheries

30
Long, Z. T., Bruno, J. F., & Duffy, J. E. (2011). Food chain length and omnivory 702
determine the stability of a marine subtidal food web. Journal of Animal 703
Ecology, 80, 586–594. doi: 10.1111/j.1365-2656.2010.01800.x 704
McCutchan, J. H., Lewis, W. M., Kendall, C., & McGrath, C. C. (2003). Variation in 705
trophic shift for stable isotope ratios of carbon, nitrogen, and sulfur. Oikos, 102, 706
378–390. doi: 10.1034/j.1600-0706.2003.12098.x 707
Mittelbach, G. G., & Persson, L. (1998). The ontogeny of piscivory and its ecological 708
consequences. Canadian Journal of Fisheries and Aquatic Sciences, 55, 1454–709
1465. doi: 10.1139/f98-041 710
Palomares, M. L. D., & Sa-a, P. (2000). The DIET Table. In R. Froese & D. Pauly 711
(Eds.), FishBase 2000. Concepts, Design and Data Sources (pp. 193–196.). 712
Philippines: ICLARM. 713
Pauly, D., & Christensen, V. (1995). Primary production required to sustain global 714
fisheries. Nature, 374, 255–257. doi: 10.1038/374255a0 715
Pauly, D., Trites, A. W., Capuli, E. V., & Christensen, V. (1998). Diet composition and 716
trophic levels of marine mammals. ICES Journal of Marine Science, 55, 467–717
481. doi: 10.1006/jmsc.1997.0280 718
Pereira, L. S., Keppeler, F. W., Agostinho, A. A., & Winemiller, K. O. (2017a). Is there 719
a relationship between fish cannibalism and latitude or species richness? PLoS 720
One, 12, e0169813. doi: 10.1371/journal.pone.0169813 721
Pereira, L. S., Agostinho, A. A., & Winemiller, K. O. (2017b). Revisiting cannibalism 722
in fishes. Reviews in Fish Biology and Fisheries, 27, 499–513. doi: 723
10.1007/s11160-017-9469-y 724
Post, D. M. (2002). Using stable isotopes to estimate trophic position: models, methods, 725
and assumptions. Ecology, 83, 703–718. doi: 10.2307/3071875 726
Page 30 of 39Fish and Fisheries

31
Preciado, I., Velasco, F., Olaso, I., & Landa, J. (2006). Feeding ecology of black 727
anglerfish Lophius budegassa: seasonal, bathymetric and ontogenetic shifts. 728
Journal of the Marine Biological Association of the UK, 86, 877–884. doi: 729
10.1017/S0025315406013816 730
R Core Team, (2017). R: A Language and Environment for Statistical Computing. R 731
Foundation for Statistical Computing, Vienna, Austria. Available at: 732
http://www.R-project.org/ (accessed 25 May 2018). 733
Reckendorfer, W., Keckeis, H., Tiitu, V., Winkler, G., Zornig, H., & Schiemer, F. 734
(2001). Diet shifts in 0+ nase, Chondrostoma nasus: Size-specific differences 735
and the effect of food availability. Archiv für Hydrobiologie, 135, 425–440. doi: 736
10.1127/lr/12/2001/425 737
Reglero, P., Urtizberea, A., Torres, A. P., Alemany, F., & Fiksen, Ø. (2011). 738
Cannibalism among size classes of larvae may be a substantial mortality 739
component in tuna. Marine Ecology Progress Series, 433, 205–219. doi: 740
10.3354/meps09187 741
Romanuk, T. N., Hayward, A., & Hutchings, J. A. (2011). Trophic level scales 742
positively with body size in fishes. Global Ecology and Biogeography, 20, 231–743
240. doi: 10.1111/j.1466-8238.2010.00579.x 744
Rybczynski, S. M., Walters, D. M., Fritz, K. M., & Johnson, B. R. (2008). Comparing 745
trophic position of stream fishes using stable isotope and gut contents analyses. 746
Ecology of Freshwater Fish, 17, 199–206. doi: 10.1111/j.1600-747
0633.2007.00289.x 748
Sabo, J. L., Finlay, J. C., Kennedy, T., & Post, D. M. (2010). The role of discharge 749
variation in scaling of drainage area and food chain length in rivers. Science, 750
330, 965–967. doi: 10.1126/science.1196005 751
Page 31 of 39 Fish and Fisheries

32
Sánchez-Hernández, J., & Cobo, F. (2012). Ontogenetic dietary shifts and food 752
selection of endemic Squalius carolitertii (Actinopterygii: Cypriniformes: 753
Cyprinidae) in River Tormes, Central Spain, in summer. Acta Ichthyologica et 754
Piscatoria, 42, 101–111. doi: 10.3750/AIP2011.42.2.03 755
Sánchez-Hernández, J., Cobo F., & Amundsen, P.-A. (2015). Food web topology in 756
high mountain lakes. PLoS One, 10, e0143016. doi: 757
10.1371/journal.pone.0143016 758
Sánchez-Hernández, J., Eloranta, A. P., Finstad, A. G., & Amundsen, P.-A. (2017). 759
Community structure affects trophic ontogeny in a predatory fish. Ecology and 760
Evolution, 7, 358–367. doi: 10.1002/ece3.2600 761
Schmitz, O. J., Miller, J. R. B., Trainor, A. M., & Abrahms, B. (2017). Toward a 762
community ecology of landscapes: predicting multiple predator–prey 763
interactions across geographic space. Ecology, 98, 2281–2292. doi: 764
10.1002/ecy.1916 765
Shurin, J. B., Borer, E. T., Seabloom, E. W., Anderson, K., Blanchette, C. A., Broitman, 766
B., Cooper, S.D., & Halpern, B. S. (2002). A cross-ecosystem comparison of the 767
strength of trophic cascades. Ecology Letters, 5, 785–791. doi: 10.1046/j.1461-768
0248.2002.00381.x 769
Shurin, J. B., Gruner, D. S., & Hillebrand, H. (2006). All wet or dried up? Real 770
differences between aquatic and terrestrial food webs. Proceedings of the Royal 771
Society of London. Series B, 273, 1–9. doi: 10.1098/rspb.2005.3377 772
Stanley, T., Doucouliagos, H., & Ioannidis, J. (2017). Finding the power to reduce 773
publication bias. Statistics in Medicine, 36, 1580–1598. doi: 10.1002/sim.7228 774
Page 32 of 39Fish and Fisheries

33
Stergiou, K. I., & Karpouzi, V. S. (2002). Feeding habits and trophic levels of 775
Mediterranean fish. Reviews in Fish Biology and Fisheries, 11, 217–254. doi: 776
10.1023/A:1020556722822 777
Thompson, R. M., Hemberg, M., Starzomski, B. M., & Shurin, J. B. (2007). Trophic 778
levels and trophic tangles: the prevalence of omnivory in real food webs. 779
Ecology, 88, 612–617. doi: 10.1890/05-1454 780
Vander Zanden, J. M., Cabana, G., & Rasmussen, J. B. (1997). Comparing the trophic 781
position of freshwater fish calculated using stable nitrogen isotope ratios (d15N) 782
and literature dietary data. Canadian Journal of Fisheries and Aquatic Sciences, 783
54, 1142–1158. doi: 10.1139/cjfas-54-5-1142 784
Vander Zanden, M. J., & Rasmussen, J. B. (1996). A trophic position model of pelagic 785
food webs: impact on contaminant biomagnification in lake trout. Ecological 786
Monographs, 66, 451–477. doi: 10.2307/2963490 787
Winemiller, K. O., & Leslie, M. A. (1992). Fish assemblages across a complex 788
freshwater-marine ecotone. Environmental Biology of Fishes, 34, 29–50. doi: 789
10.1007/BF00004783 790
Wood, S. N. (2017). Generalized Additive Models: An Introduction with R (wnd 791
edition). London, Chapman and Hall/CRC. 792
Wootton, K. L. (2017). Omnivory and stability in freshwater habitats: Does theory 793
match reality? Freshwater Biology, 62, 821–832. doi: 10.1111/fwb.12908 794
Zuur, A. F., Ieno, E. N., Walker, N. J., Saveliev, A. A., & Smith, G. M. (2009). Mixed 795
effects models and extensions in ecology with R. New York, Springer Science & 796
Business Media. 797
798
Page 33 of 39 Fish and Fisheries

34
Table legends 799
Table 1. Mean values (± SE) of trophic position, omnivory and body size (maximum 800
length) with pairwise comparisons between systems according to feeding strategy, main 801
food type, habitat, geographic range and phylogeny. *Main food type is only shown for 802
predatory species and **habitat type is only shown for benthopelagic and demersal 803
species (see Methods). Significant values are marked in bold. 804
Mean ± SE Pairwise comparisons
Trophic position Omnivory Body size (cm)
Trophic position Omnivory Lmax
Mann-Whitney-Wilcoxon Bonferroni Mann-Whitney-Wilcoxon Bonferroni Mann-Whitney-Wilcoxon Bonferroni
Feeding strategies
Herbivory (n = 612)
Freshwater 2.27 ± 0.026 0.12 ± 0.011 28.45 ± 2.02
W = 38666, p = 0.116 p = 0.116 W = 39480, p = 0.036 p = 0.036
W = 48688, p < 0.001 p < 0.001
Marine 2.24 ± 0.018 0.09 ± 0.007 21.20 ± 0.92
Filter-feeding (n = 703)
Freshwater 3.05 ± 0.045 0.33 ± 0.015 22.21 ± 2.51
W = 27039, p = 0.001 p = 0.001 W = 28416, p = 0.012 p = 0.012
W = 32845, p = 0.491 p = 0.491 Marine 3.23 ± 0.013 0.37 ± 0.005 27.82 ± 3.97
Predators (n = 4111)
Freshwater 3.55 ± 0.014 0.51 ± 0.005 38.74 ± 1.55
W = 1017400, p < 0.001 p < 0.001 W = 1183600, p < 0.001 p < 0.001
W = 1077100, p < 0.001 p < 0.001
Marine 3.73 ± 0.008 0.54 ± 0.003 61.02 ± 1.24
Main food type*
Zoobenthos (n = 28969)
Freshwater 3.37 ± 0.011 0.45 ± 0.004 31.59 ± 1.41
W = 465690, p < 0.001 p < 0.001 W = 574290, p < 0.001 p < 0.001
W = 571980, p < 0.001 p < 0.001
Marine 3.53 ± 0.007 0.48 ± 0.003 42.49 ± 0.83
Nekton (n = 1226)
Freshwater 4.10 ± 0.019 0.70 ± 0.006 60.31 ± 4.29
W = 104470, p = 0.099 p = 0.099 W = 128920, p < 0.001 p < 0.001
W = 76337, p < 0.001 p < 0.001
Marine 4.16 ± 0.009 0.67 ± 0.004 101.20 ± 3.12
Habitat**
Benthopelagic (n = 1011)
Freshwater 3.26 ± 0.024 0.42 ± 0.008 30.61 ± 1.51
W = 53473, p < 0.001 p < 0.001
W = 61054, p < 0.001 p < 0.001
W = 41416, p < 0.001 p < 0.001
Marine 3.69 ± 0.031 0.52 ± 0.011 76.04 ± 5.24
Demersal (n = 1740)
Freshwater 3.37 ± 0.027 0.45 ± 0.009 43.98 ± 2.32
W = 211160, p < 0.001 p < 0.001
W = 241040, p = 0.001 p < 0.001
W = 266300, p < 0.001 p < 0.001 Marine 3.55 ± 0.014 0.49 ± 0.005 50.08 ± 1.35
Geographic range
Tropical (n = 3171)
Freshwater 3.31 ± 0.021 0.44 ± 0.007 32.74 ± 1.33
W = 880700, p < 0.001 p < 0.001
W = 972120, p = 0.804 p = 0.805
W = 934390, p < 0.001 p < 0.001
Marine 3.39 ± 0.015 0.44 ± 0.005 40.68 ± 1.02
Subtropical (n = 1061)
Freshwater 3.24 ± 0.053 0.41 ± 0.018 44.22 ± 5.25
W = 23750, p < 0.001 p < 0.001
W = 27927, p < 0.001 p < 0.001
W = 35454, p < 0.001 p < 0.001 Marine 3.66 ± 0.018 0.52 ± 0.006 75.17 ± 3.44
Temperate (n = 853) Freshwater 3.40 ± 0.031 0.46 ± 0.011 45.59 ± 3.61
W = 41498, p < 0.001 p < 0.001
W = 44672, p < 0.001 p < 0.001
W = 57051, p < 0.001 p < 0.001
Marine 3.61 ± 0.019 0.51 ± 0.007 59.58 ± 2.93
Polar (n = 100)
Freshwater 3.51 ± 0.232 0.50 ± 0.028 26.25 ± 6.58
W = 155, p = 0.671 p = 0.664
W = 171, p = 0.440 p = 0.433
W = 255, p = 0.164 p = 0.162
Marine 3.43 ± 0.032 0.47 ± 0.016 39.40 ± 3.09
Phylogeny
Clupeiformes (n = 121) Freshwater 3.31 ± 0.077 0.42 ± 0.028 21.66 ± 3.39
W = 1685.5, p = 0.251 p = 0.250
W = 1712.5, p = 0.191 p = 0.190
W = 1120.5, p = 0.028 p = 0.028
Marine 3.18 ± 0.055 0.37 ± 0.018 25.63 ± 1.97
Clupeidae (n = 80)
Freshwater 3.19 ± 0.084 0.39 ± 0.027 16.30 ± 2.73
W = 708.5, p = 0.725 p = 0.721
W = 739, p = 0.497 p = 0.494
W = 369.5, p = 0.001 p = 0.001
Marine 3.10 ± 0.060 0.35 ± 0.020 25.25 ± 1.58
Osmeriformes (n = 38)
Freshwater 3.31 ± 0.084 0.42 ± 0.037 40.11 ± 27.36
W = 98, p = 0.022 p = 0.021
W = 165.5, p = 0.767 p = 0.755
W = 59, p < 0.001 p < 0.001
Marine 3.41 ± 0.047 0.41 ± 0.026 35.87 ± 6.46
Perciformes (n = 3033)
Freshwater 3.41 ± 0.028 0.46 ± 0.009 24.31 ± 1.02
W = 686800, p = 0.056 p = 0.055
W = 717230, p < 0.001 p < 0.001
W = 551050, p < 0.001 p < 0.001
Marine 3.35 ± 0.014 0.43 ± 0.004 42.52 ± 0.99
Gobiidae (n = 81)
Freshwater 3.50 ± 0.072 0.46 ± 0.028 16.25 ± 4.04
W = 718.5, p = 0.006 p = 0.006
W = 609.5, p = 0.176 p = 0.174
W = 650, p = 0.665 p = 0.661 Marine 3.25 ± 0.045 0.38 ± 0.022 11.77 ± 1.28
Scorpaeniformes (n = 257) Freshwater 3.42 ± 0.096 0.49 ± 0.023 17.63 ± 0.98
W = 523, p = 0.025 p = 0.025
W = 607.5, p = 0.075 p = 0.075
W = 1029.5, p = 0.001 p < 0.001
Marine 3.67 ± 0.023 0.55 ± 0.009 35.97 ± 1.59
Siluriformes (n = 257)
Freshwater 3.42 ± 0.039 0.49 ± 0.013 55.27 ± 4.34
W = 1810, p = 0.081 p = 0.081
W = 2307.5, p = 0.887 p = 0.886
W = 1988, p = 0.410 p = 0.410
Marine 3.59 ± 0.095 0.51 ± 0.031 55.07 ± 7.51
Ariidae (n = 34)
Freshwater 3.50 ± 0.149 0.53 ± 0.039 58.43 ± 8.23
W = 99.5, p = 0.365 p = 0.355
W = 115, p = 0.758 p = 0.744
W = 162, p = 0.451 p = 0.440
Marine 3.68 ± 0.082 0.53 ± 0.032 53.53 ± 8.10
805
Page 34 of 39Fish and Fisheries

35
Table 2. Summary table of the best model simulations for trophic position (Troph) and 806
omnivory index (OI) according to AIC values (summary table for the 10 best model 807
simulations is shown in Appendix 4). The parametric coefficients with significance 808
values are given for each variable. ***p < 0.001, **p < 0.01 and *p < 0.05. 809
810
Variable Intercept
Predictor
variables Smooth terms
Model
statistics
Body size Ecosystem Feeding
strategies
Main food
type
Geographic
range Habitat R2
Troph 3.361*** — 5.340*** 1.999*** 1.997*** 1.000 — 0.76
OI 0.458*** 0.001** 5.292*** 1.997*** 1.992*** — 1.544* 0.65
811
812
Page 35 of 39 Fish and Fisheries

36
Figure legends: 813
Figure 1. Trophic position (Troph) and omnivory (omnivory index) of fishes according 814
to feeding strategies (Fil = filter-feeding, Her = herbivory, Pre = predatory), main food 815
type (Nek = nekton, Zoo = zoobenthos), phylogeny (Clu = Clupeiformes, Osm = 816
Osmeriformes, Per = Perciformes, Sco = Scorpaeniformes, Sil = Siluriformes), and 817
ecosystem type (F = freshwater, M = marine). Omnivory = 0 (all feeding occurs at the 818
same troph). 819
820
Figure 2. Trophic position (Troph) and omnivory (omnivory index) of fishes according 821
to habitat type (BD = bathydemersal, BP = bathypelagic, BeP = benthopelagic, D = 822
demersal, P = pelagic, PN = pelagic-neritic, PO = pelagic-oceanic, and R = reef-823
associated), geographic range (Tro = tropical, Sub = subtropical, Tem = temperate, Pol 824
= polar, and Cos = cosmopolitan), and ecosystem type (F = freshwater, M = marine). 825
Omnivory = 0 (all feeding occurs at the same troph). 826
827
Page 36 of 39Fish and Fisheries

37
Data accessibility 828
Data used in this study are available from FishBase (http://www.fishbase.org). Data 829
from the manuscript will be archived in the Figshare Digital Repository 830
(https://figshare.com/) on acceptance of the manuscript for publication. 831
832
Supporting information 833
List of items in the supporting information: 834
-Appendix 1. Information regarding how sample size varied between main food type, 835
habitat and geographic range. 836
-Appendix 2. List of orders and families incorporated into the study. Families are 837
grouped by type of ecosystem. The number of species per order or family is shown in 838
brackets. 839
-Appendix 3. Residual structure (GAMMs) of the best model simulations. 840
-Appendix 4. Summary table for the 10 best model simulations explaining the variation 841
of trophic position and omnivory in fishes. 842
843
Page 37 of 39 Fish and Fisheries
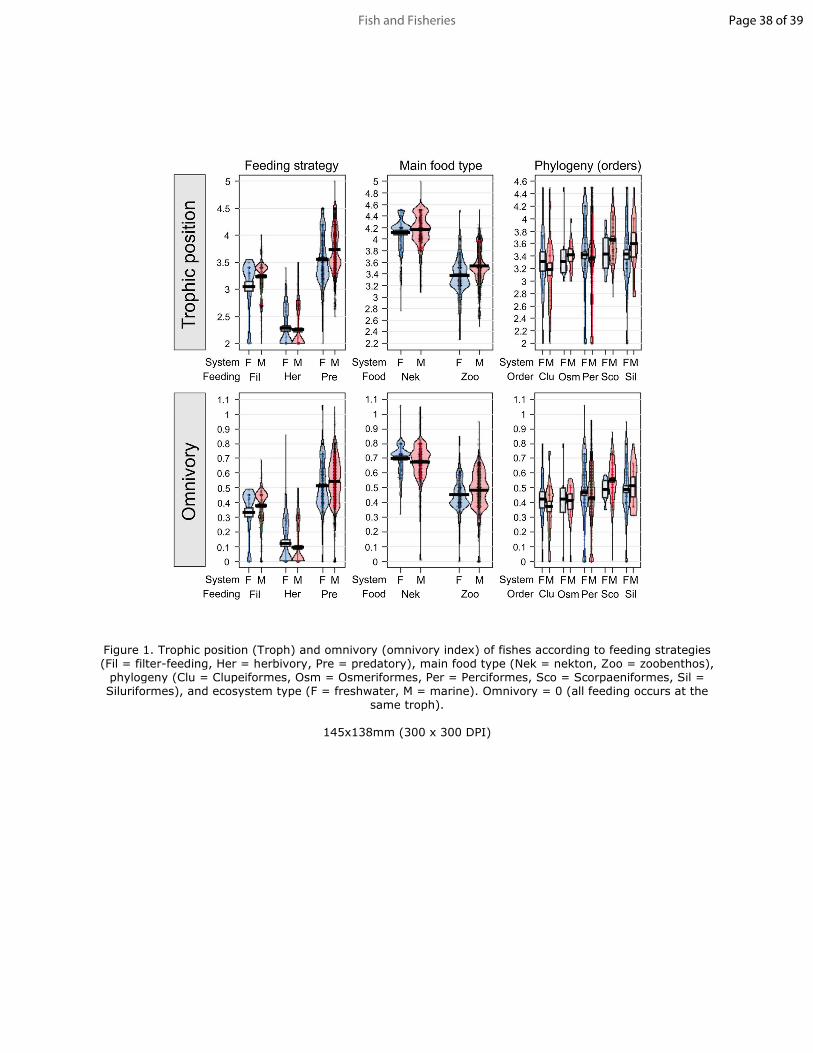
Figure 1. Trophic position (Troph) and omnivory (omnivory index) of fishes according to feeding strategies (Fil = filter-feeding, Her = herbivory, Pre = predatory), main food type (Nek = nekton, Zoo = zoobenthos), phylogeny (Clu = Clupeiformes, Osm = Osmeriformes, Per = Perciformes, Sco = Scorpaeniformes, Sil = Siluriformes), and ecosystem type (F = freshwater, M = marine). Omnivory = 0 (all feeding occurs at the
same troph).
145x138mm (300 x 300 DPI)
Page 38 of 39Fish and Fisheries

Figure 2. Trophic position (Troph) and omnivory (omnivory index) of fishes according to habitat type (BD = bathydemersal, BP = bathypelagic, BeP = benthopelagic, D = demersal, P = pelagic, PN = pelagic-neritic,
PO = pelagic-oceanic, and R = reef-associated), geographic range (Tro = tropical, Sub = subtropical, Tem =
temperate, Pol = polar, and Cos = cosmopolitan), and ecosystem type (F = freshwater, M = marine). Omnivory = 0 (all feeding occurs at the same troph).
128x124mm (300 x 300 DPI)
Page 39 of 39 Fish and Fisheries