Francisco Cervantes Curso de Citología de Sangre Periférica - Aula … · 2013-05-07 · LMC:...
39
Curso de Citología de Sangre Periférica Barcelona, Abril 2013 Leucemia mieloide crónica Francisco Cervantes
Transcript of Francisco Cervantes Curso de Citología de Sangre Periférica - Aula … · 2013-05-07 · LMC:...

Curso de Citología de Sangre Periférica
Barcelona, Abril 2013
Leucemia mieloide crónica
Francisco Cervantes
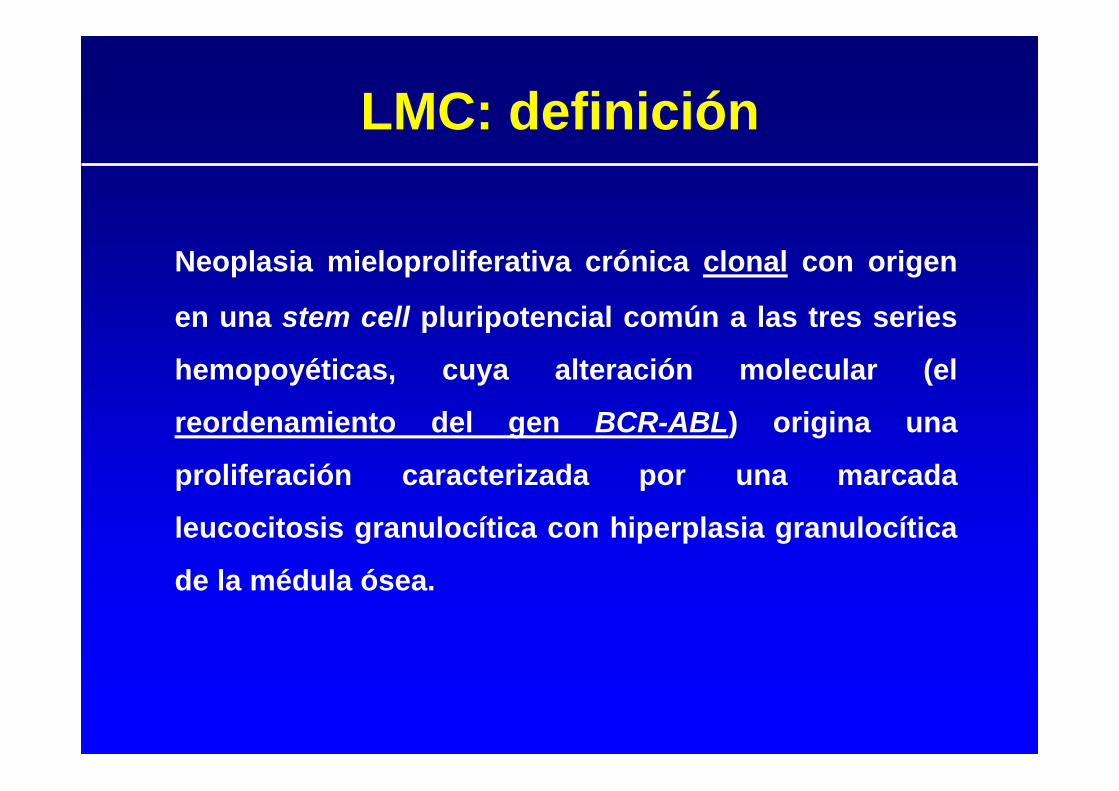
Neoplasia mieloproliferativa crónica clonal con origen
en una stem cell pluripotencial común a las tres series
hemopoyéticas, cuya alteración molecular (el
reordenamiento del gen BCR-ABL) origina una
proliferación caracterizada por una marcada
leucocitosis granulocítica con hiperplasia granulocítica
de la médula ósea.
LMC: definición

• Edad mediana al diagnóstico: 55 años
• Ligero predominio masculino
• Sintomatología inicial:Síntomas constitucionales 20%Molestias abdominales por esplenomegalia 20%Síndrome anémico 10%Otros (dolores óseos, gota, hemorragias) < 5%Ausencia de síntomas 55%
• Exploración física:Esplenomegalia 45%Hepatomegalia 10%
LMC: aspectos clínicos
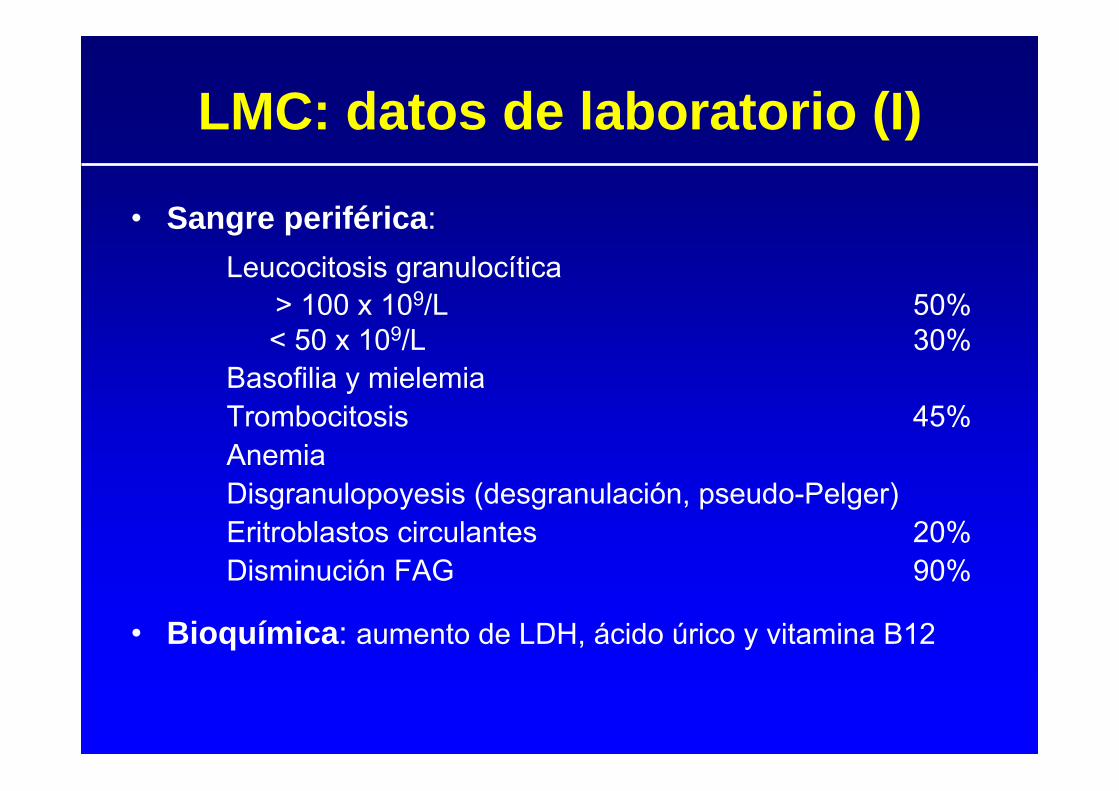
• Sangre periférica:Leucocitosis granulocítica
> 100 x 109/L 50%< 50 x 109/L 30%
Basofilia y mielemiaTrombocitosis 45%AnemiaDisgranulopoyesis (desgranulación, pseudo-Pelger)Eritroblastos circulantes 20%Disminución FAG 90%
• Bioquímica: aumento de LDH, ácido úrico y vitamina B12
LMC: datos de laboratorio (I)
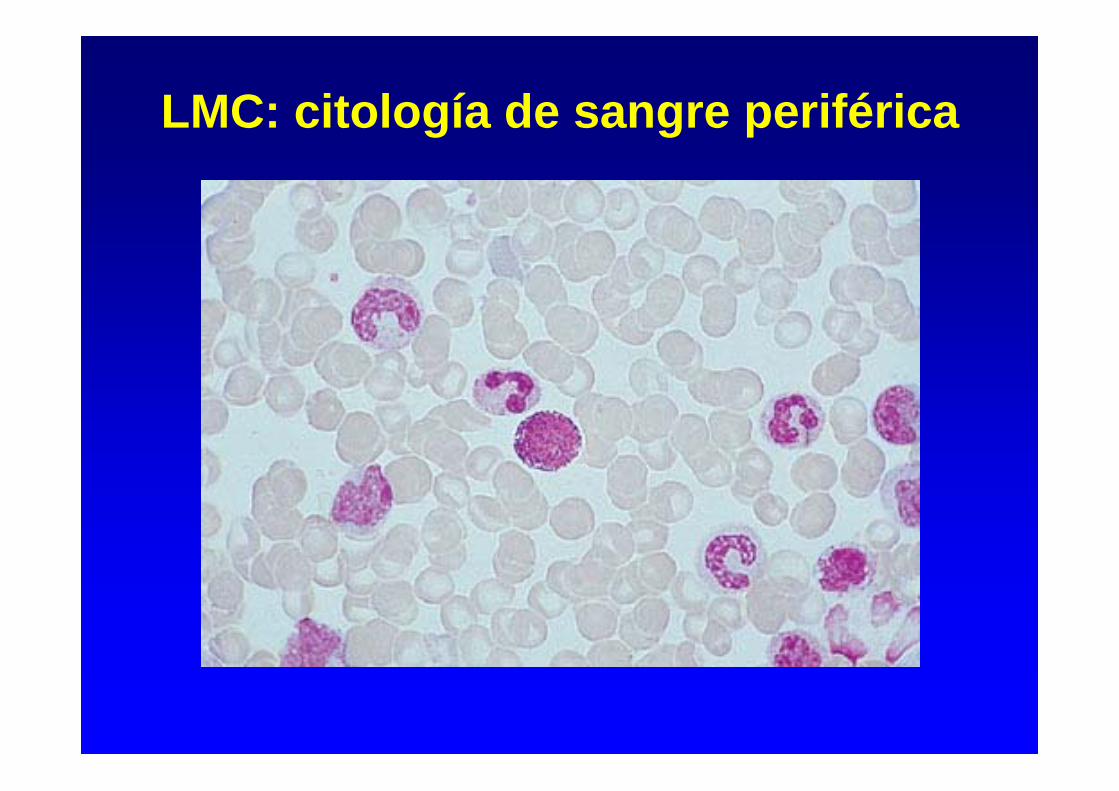
LMC: citología de sangre periférica

Fosfatasa alcalina granulocítica (FAG)
LMC PV

Mielograma:Aumento celularidad hemopoyética
Hiperplasia granulocítica
Hiperplasia megacariocítica
Células pseudo-Gaucher, histiocitos azul marino
Disminución hierro medular y sideroblastos: 80%
Biopsia medular:
Aumento de la celularidad y disminución de la grasa
Hiperplasia granulocítica
Hiperplasia megacariocítica
Fibrosis variable
LMC: médula ósea

LMC: citología de médula ósea (I)
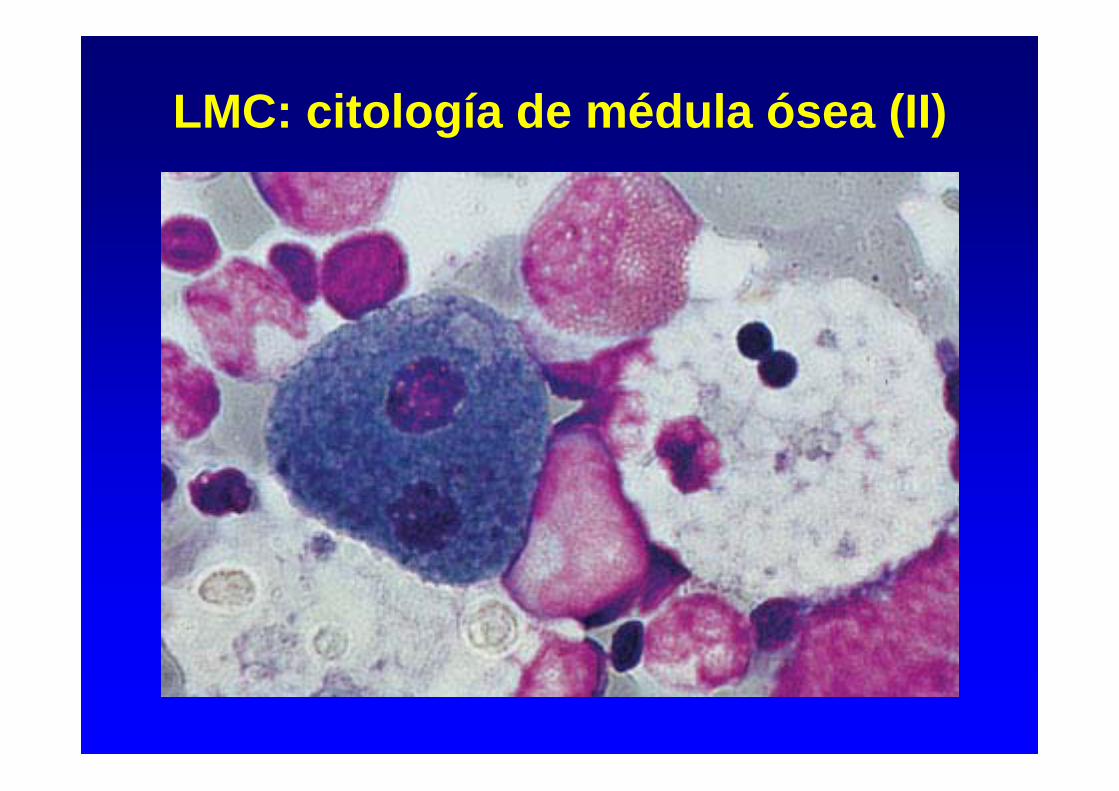
LMC: citología de médula ósea (II)

LMC: biopsia de médula ósea

– Citogenética (MO):
Cromosoma Filadelfia (Ph) = t(9;22) 95%
– Análisis molecular (SP): Southern blot, PCR
Reordenamiento del gen BCR-ABLTránscrito b3a2 60%
b2a2 40%
LMC: datos de laboratorio (III)


Cromosoma Filadelfia (Ph): translocación t(9;22)(q34;q11)
22
bcr
abl
Ph (22q-)
bcr-abl
PROTEÍNA BCR-ABL CON ACTIVIDAD
TIROSINOCINASA AUMENTADA (p210)
9 9q+

Reordenamiento BCR (Southern blot)

Tránscritos BCR/ABL (RT-PCR)

Efectos celulares BCR-ABL
INHIBICIÓNAPOPTOSISPROLIFERACIÓNDISMINUCIÓN
ADHESIÓN
FENOTIPOMALIGNO
BCR-ABL

55%
45%
FASE CRÓNICA
F. ACELERACIÓN
CRISIS BLÁSTICA

• LMC de inicio trombocitémico (5%)
- Leucocitosis moderada (~20 x 109/L)- Mielemia y basofilia- Trombocitosis > 1000 x 109/L- Cromosoma Ph + y/o reordenamiento del gen BCR/ABL
• LMC Ph-negativa (5%):
• BCR/ABL+ (+ 2-3%) = Igual que LMC Ph+• BCR/ABL-negativa (LMC atípica):
- Edad avanzada- Anemia intensa- Ausencia de basofilia- Visceromegalias progresivas - Menor frecuencia de evolución a crisis blástica- Supervivencia mediana: 1,5-2 años
LMC: formas especiales de presentación (I)

• Crisis blástica inicial (5%)- Blastos en SP/MO 20% y/o (blastos + promielocitos) 30% en SP
ó 50% en MO + perfil característico LMC - Infiltración blástica extramedular
• Variante neutrofílica de la LMC (<1%)- Leucocitosis neutrofílica sin mielemia- Cromosoma Ph +- Tránscrito e19a2 (c3a2) = proteína tirosinocinasa p230
LMC: formas especiales de presentación (II)
• Reacción leucemoide (infección, neoplasia)
• Mielofibrosis primaria (forma hiperproliferativa)
• Leucemia mielomonocítica crónica (variante mieloproliferativa)
• Síndrome hipereosinofílico idiopático
• Leucemia neutrofílica crónica
LMC: diagnóstico diferencial
LMC: fase de aceleración
(1) Definición:• Criterios diagnósticos:
- Blastosis SP ó MO 10 - 19%- Basofilia 20%- Leucocitosis progresiva refractaria al tto.- Anemia y/o plaquetopenia no atribuibles al tto.- Anomalías citogenéticas adicionales
• Datos clínicos:- Pérdida de peso- Fiebre y/o sudoración persistente- Dolores óseos- Esplenomegalia progresiva
(2) Pronóstico:- Supervivencia actual: 2-4 años
LMC: crisis blástica (I)(1) Definición:
• Blastos en SP/MO 20% • Blastos + promielocitos 30% en SP ó 50% en MO• Infiltración blástica extramedular
(2) Características clínicas:• Síntomas constitucionales• Dolores óseos• Infecciones, hemorragias• Esplenomegalia progresiva
(3) Laboratorio:• Blastosis• Citopenias (anemia, plaquetopenia)• Otras alteraciones citogenéticas (60-80%): +8, iso(17q), +Ph, otras• LDH

LMC: crisis blástica (II)Fenotipo:
• Mieloide (60%)• Precedido por fase de aceleración en 50% enfermos• No respuesta a QT tipo leucemia aguda• Mediana supervivencia: 4 - 8 meses
• Linfoide (25%)• Inicio brusco en la mayoría de casos• Menor frecuencia de visceromegalias y basofilia• Mayor infiltración MO• Fenotipo B habitualmente • Expresión frecuente de marcadores mieloides• Respuesta a quimioterapia tipo LAL en 60% de casos• Mediana supervivencia: 12 meses
• Megacarioblástico (10 - 15%)• Eritroide (1%)

LMC: crisis blástica mieloide
MPO

LMC: crisis blástica linfoide
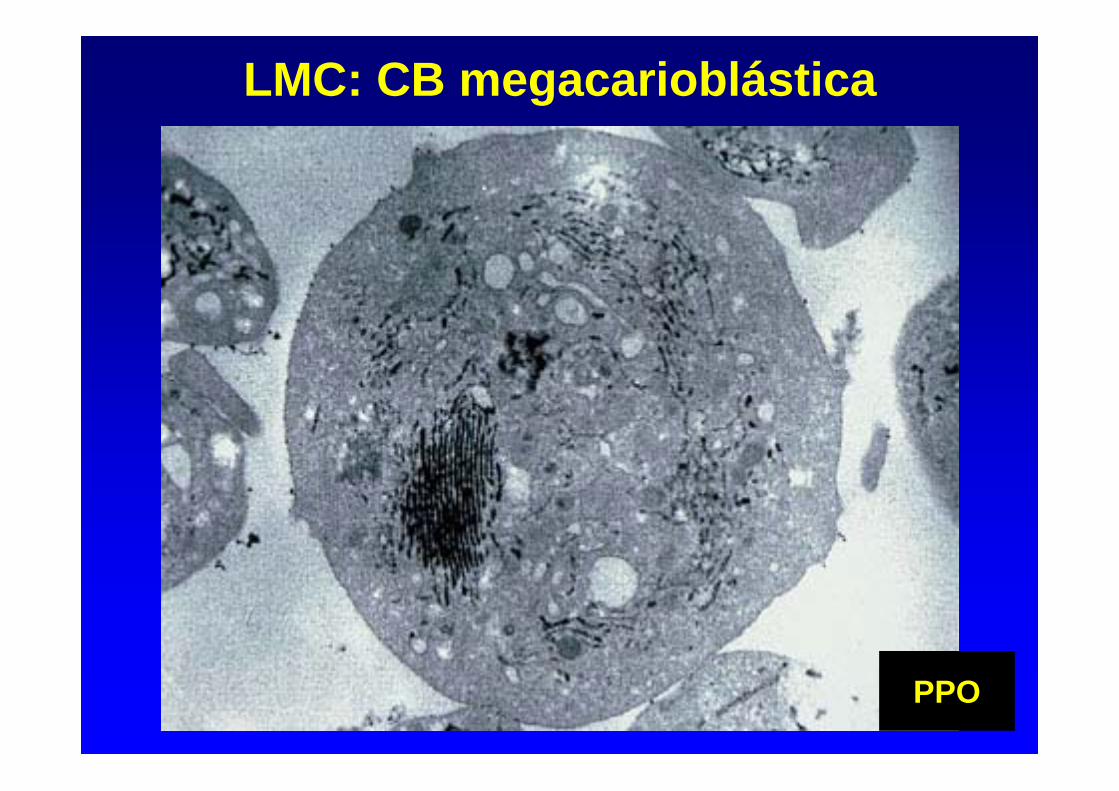
LMC: CB megacarioblástica
PPO

LMC: CB eritroide

LMC-CB: alteraciones citogenéticas adicionales
47, XX, t(9;22)(q34;q11),+8

LMC: supervivencia según tratamiento
Tratamiento Srv mediana*
Sin tratamiento 2,5
Busulfán 4
Hidroxiurea 5
Interferón 6
Imatinib 85% a los 8 años
* Años

Results of Allo-SCT in CML
2000–2003
1991–1999
1980–1990
Gratwohl et al., Haematologica 2006;91:513–521
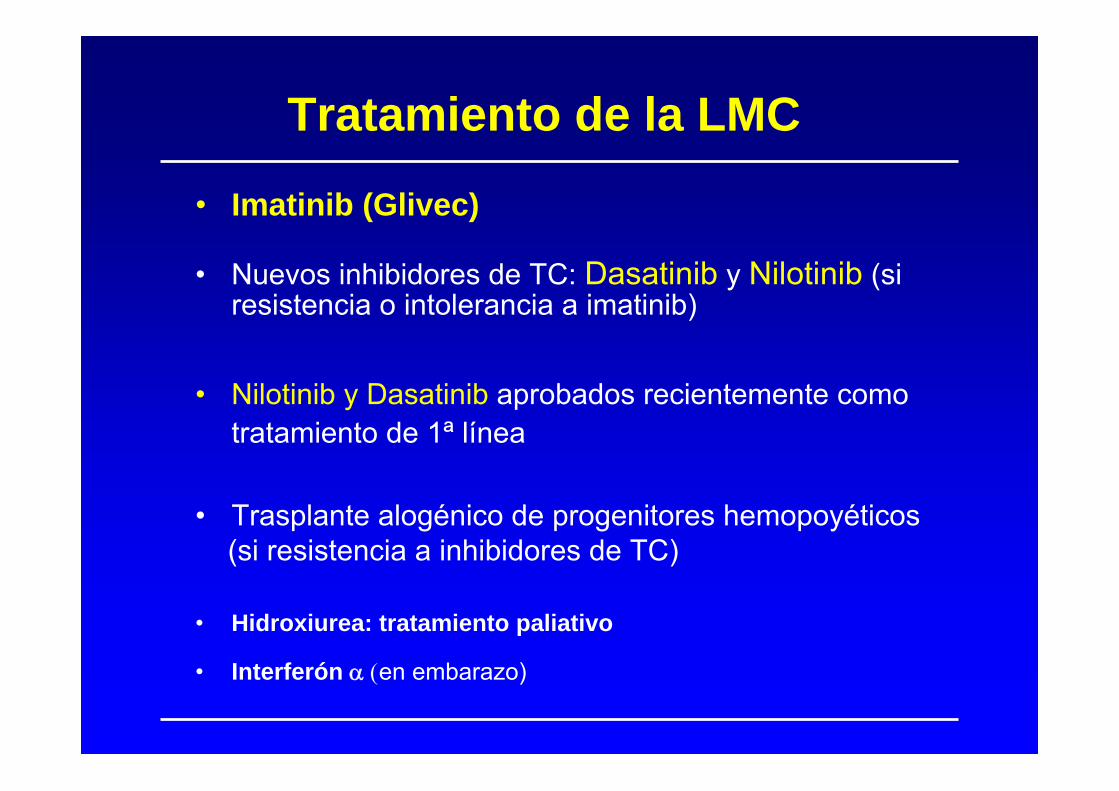
• Imatinib (Glivec)
• Nuevos inhibidores de TC: Dasatinib y Nilotinib (si resistencia o intolerancia a imatinib)
• Nilotinib y Dasatinib aprobados recientemente como tratamiento de 1ª línea
• Trasplante alogénico de progenitores hemopoyéticos(si resistencia a inhibidores de TC)
• Hidroxiurea: tratamiento paliativo
• Interferón en embarazo)
Tratamiento de la LMC

Mechanism of Action of Imatinib
Goldman JM & Melo J, Lancet. 2000;355:1031-1032.
Y = TyrosineP = Phosphate
Substrate
Bcr-AblBcr-Abl
ATPSubstrate
PPP
P
Imatinib
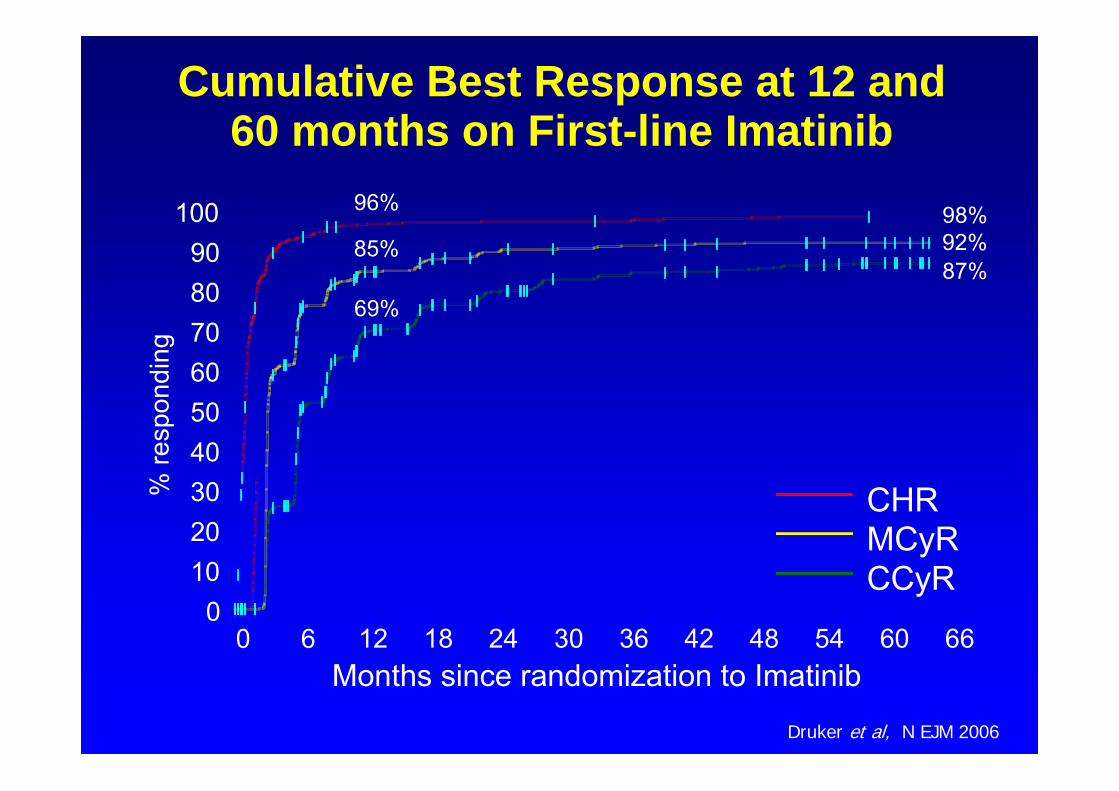
CHRMCyRCCyR
% re
spon
ding
0102030405060708090
100
Months since randomization to Imatinib0 6 12 18 24 30 36 42 48 54 60 66
Cumulative Best Response at 12 and 60 months on First-line Imatinib
96%
85%
69%
98%92%87%
Druker et al, N EJM 2006

1012
1011
1010
109
108
107
106
100 %
10 %
1 %
0.1 %
0.01 %
0.001 %
Mean value at diagnosis
Complete Hematologic Response
Complete Cytogenetic Response
Major Molecular Response
Undetectable transcripts
BC
R-A
BL %
(according to the International Scale)N
umbe
r of l
euke
mic
cel
ls
The BCR-ABL transcript levels mirror the number of residual leukemic cells
Adapted from G Saglio

EFS According to Molecular Response in IRIS Trial: 18-Month Landmark
AnalysisP = .01
BCR-ABL % (IS)<=0.01%>0.1-1%>1-10%
% W
ithou
t Eve
nt
0102030405060708090
100
Months Since Start of Treatment0 12 24 36 48 60 72 84
86%95%
62%58%
≤0.1% (n = 164)>0.1-1% (n = 47)>1-10% (n = 25)>10% (n = 13)
Hughes et al., ASH 2008
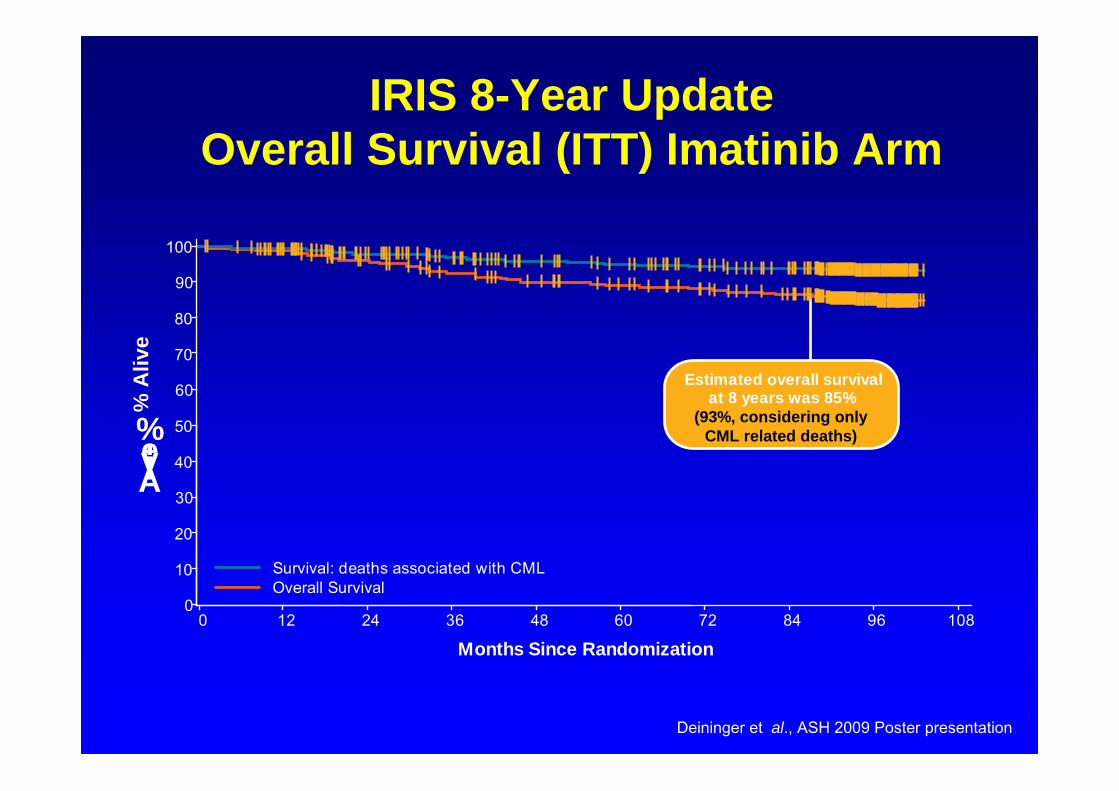
IRIS 8-Year UpdateOverall Survival (ITT) Imatinib Arm
Estimated overall survivalat 8 years was 85%
(93%, considering onlyCML related deaths)
0
10
20
30
40
50
60
70
80
90
100
Alive,%
0 12 24 36 48 60 72 84 96 108
Months Since Randomization
Survival: deaths associated with CMLOverall Survival
% A
live
Deininger et al., ASH 2009 Poster presentation

IRIS 8-Year Update
Annual Event Rates Imatinib Arm
• Estimated EFS at 8 years = 81%– 1 progression to AP/BC and 2 non-CML related deaths occurred in
year 8• Estimated rate of freedom from progression to AP/BC at 8 years = 92%
With
Even
t,%
3.3
7.5
4.8
1.7
0.80.3
1.4 1.31.5
2.8
1.8
0.90.5
0 00.4
0
1
2
3
4
5
6
7
8
1 2 3 4 5 6 7 8
Year
EventLoss of CHR,Loss of MCyR,AP/BC,Death during treatment
AP/BC
Deininger et al., ASH 2009 Poster presentation

ENESTnd: Nilotinib vs Imatinib in CML-CP
2 235
12
17
0
5
10
15
20
25
Nilotinib vs Imatinib Frontline: Progression to AP/BC on Core Treatment*†
Num
ber o
f Pat
ient
s
0.7% 0.7%
Nilotinib 300 mg BID Nilotinib 400 mg BID Imatinib 400 mg QD
P = .0059
P = .0196
P = .0003
P = .0089
Including Clonal Evolution
*ITT population†Progression to AP/BC or death due to CML while on core treatment
1.1% 4.2% 1.8% 6.0%
Data cut-off: 20Aug2010

5 patients who achieved a CCyR transformed to AP/BP CML (2 dasatinib, 3 imatinib) No patient who achieved a MMR transformed to AP/BP CML to date Patients were followed for transformation for up to 60 days after the last dose of
study drug; clonal evolution without additional criteria for AP CML was NOT counted as transformation
2,3
3,5
0
2
4
6100
n/N 6/259 9/260
Dasatinib vs. Imatinib Frontline: Transformation to Advanced Phase CML (ITT)
Dasatinib 100 mg QD
Imatinib 400 mg QD
%