Taller embarazo en la adolescencia/ Fundacion Educativa Teaching Across The Globe Intl, Inc.
ISSN 1989 - 9572
Lessons learned across a decade of knowledge modeling
Las lecciones aprendidas en una década elaborando modelos de conocimiento
Robert Hoffman Institute for Human & Machine Cognition, USA
Jameson Beach
Institute for Human & Machine Cognition, USA
Journal for Educators, Teachers and Trainers, Vol. 4 (1) http://www.ugr.es/~jett/index.php
Fecha de recepción: 18 de diciembre de 2012
Fecha de revisión: 20 de enero de 2012
Fecha de aceptación: 10 de febrero de 2013
Hoffman, R. y Beach, J. (2013). Lessons learned across a decade of knowledge modeling. Journal for Educators, Teachers and Trainers, Vol. 4 (1), pp. 85 – 95.
Journal for Educators, Teachers and Trainers JETT, Vol. 4 (1); ISSN: 1989-9572
86
Journal for Educators, Teachers and Trainers, Vol. 4 (1)
ISSN 1989 - 9572 http://www.ugr.es/~jett/index.php
Lessons learned across a decade of knowledge modeling
Las lecciones aprendidas en una década elaborando modelos de conocimiento Robert Hoffman, Institute for Human & Machine Cognition, USA [email protected] Jameson Beach, Institute for Human & Machine Cognition, USA [email protected] Abstract I review lessons learned in the creation of knowledge models composed of Concept Maps. The models were developed in studies of expertise in a variety of domains including weather forecasting, clinical oncology, and terrain analysis. Lessons learned pertain to a number of methodological issues, such as the measurement of the effectiveness of knowledge elicitation methods, issues in organizing, resourcing and navigating large sets of Concept Maps, and issues in comparing computer performance to that of humans. Resumen Se hace una revisión de las lecciones aprendidas en la creación de modelos de conocimiento compuestos de mapas conceptuales. Los modelos fueron desarrollados en estudios sobre el conocimiento experto en una amplia gama de dominios, incluidos los de pronóstico del tiempo, oncología clínica y análisis del terreno. Las lecciones aprendidas se refieren a una serie de cuestiones metodológicas tales como la medición de la eficacia de los métodos de elicitación del conocimiento, los problemas en la organización, los recursos y la navegación en grandes conjuntos de mapas conceptuales y los problemas en la comparación del rendimiento de los ordenadores en relación con el de los seres humanos. Keywords Concept mapping, expertise knowledge, knowledge modeling Palabras clave Mapas conceptuales, conocimiento experto, modelos de conocimiento
Journal for Educators, Teachers and Trainers JETT, Vol. 4 (1); ISSN: 1989-9572
87
1. Introduction
"Knowledge models" are integrated sets of Concept Maps of expert knowledge. NUCES modeled the knowledge of an expert at nuclear magnetic resonance imaging for ventricular function (Ford et al., 1991). The "Return to Mars" project integrated knowledge for the NASA Center for Mars Exploration (Briggs et al., 2004). El-Tech was a knowledge model for debugging and repair of a particular kind of electronic data recorder (Coffey et al., 2003). The Launch Vehicle Systems Integration Model was of the knowledge of a NASA specialist in the Centaur launch vehicle (Coffey, Moreman, & Dyer, 1999). A variety of additional topics have been the subject for modeling: the field of social network analysis, processes in organic chemistry, event logic and causation, engineering in the electric utilities, and the psychophysiology of balance. In this paper, I briefly describe a few projects that highlight some heuristics for model development that emerged during the research. 2. System To Organize Representations in Meteorology At the Naval Training Meteorology and Oceanographic Facility (Pensacola Naval Air Station) there were a number of senior civilian forecasters who were expert at predicting severe weather. Hundreds of CMaps were made, providing detail on such topics as the use of weather radar, forecasting for thunderstorms, hurricanes, fog and turbulence. (See http://hcs-metoc.apl.washington.edu/hsmetoc_library/pdfs/hoffman_paper.pdf).
The knowledge model STORM included the CMaps that referred to weather of significance for aviation in the Gulf Coast (i.e., turbulence, thunderstorms, etc). The CMaps were resourced with the material in the Local Forecasting Handbook. Trainee forecasters studied the model to prepare to qualify as forecasters. Shortly after STORM was finalized, the facility was downgraded to a detachment and the senior civilian forecasters took that opportunity to retire. Were it not for the Concept Maps we had made, all of the expertsʼ knowledge and heuristics would have been lost. The project involved comparing methods of knowledge elicitation for their effectiveness (see Hoffman et al., 1995; Shadbolt & Burton, 1990). Methods used in the STORM project included protocol analysis, workspace observations, the Critical Decision Method (CDM), the Knowledge Audit, CMapping, and the Cognitive Modeling Procedure. The methods were compared in terms of efficiency, gauged in terms of Total Task Minute (TTM; time to prepare to run a procedure, plus time to run the procedure, plus time to analyze the data) relative to the yield (number of propositions for use in a knowledge model). The methods also identified dozens of leverage points and also yielded behaviorally validated models of the reasoning of expert forecasters (see Hoffman, 2008). Knowledge modeling using CMapping resulted in thousands of propositions covering domain knowledge. The Critical Decision Method yielded a number of richly populated case studies with associated Decision Requirements Tables. Along with short video clips in which expert forecasters discussed forecasting procedures, all of these results from cognitive task analysis were hyperlinked into the knowledge model. We conducted over 60 hours of CMapping interviews. Full protocol analysis of a single knowledge modeling session took a total of 18 hours to collect and analyze the data. The results confirmed a finding from previous studies (Burton et al., 1990) that protocol analysis (i.e., transcription and functional coding of audiotaped protocol statements, with independent coders) is too time consuming and effortful to have an effective yield. Rather than doing a protocol analysis it would be far more efficient to simply go back and do more CMapping. The total effort taken to develop, refine, and validate knowledge models can vary by orders of magnitude depending on the knowledge elicitation method employed. A rule of thumb we developed is that CMapping can have a yield of 2.0 informative propositions per TTM. Any method having a yield of less than one proposition 1.0 TTM is arguably inefficient. Another lesson learned was that CMapping mates very well with the CDM. This structured interview method is highly effective as a method for generating rich case studies (Hoffman, Crandall, & Shadbolt, 1998). Previous studies had suggested that the CDM procedure takes about two hours, but those evaluations looked only at session time. The present study involved a more inclusive measure of effort, TTM. We found that for interviewing expert weather forecasters the CDM took about 10 hours per case. The cases are rich because weather phenomena can span days and usually involve dozens of data types and scores of data fields. More importantly, expert forecasters' memories of cases can be remarkably detailed.
Journal for Educators, Teachers and Trainers JETT, Vol. 4 (1); ISSN: 1989-9572
88
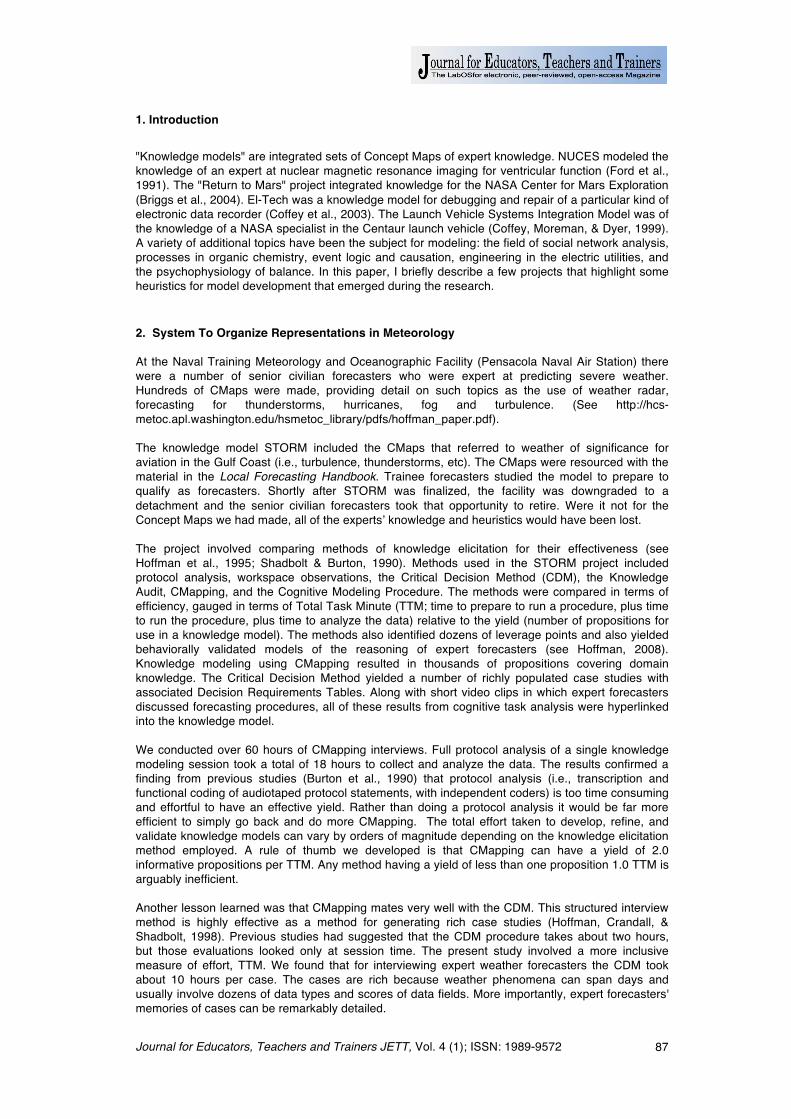
3. Thailand National Knowledge Base Demonstration Project This project demonstrated how the model development process might be conducted at a large scale. Thailand's long-term economic potential depends, in part, on its traditional crafts including silk manufacture. A slide set about Thai silk had been created by Thai field researchers who had interviewed village elders and photographed their activities. We relied on this resource set to create a small knowledge model. This had a CMap for each of a number of silk patterns. The CMaps were resourced with photographs (e.g., of the of weaving, dyeing and other processes) and with text pieces that had been created from the textual material in the original slide set. A lesson learned in this project had to do with the use of color and backgrounds. Our previous heuristic had been that backgrounds should not contain any high-frequency graphical elements or textures, since the CMap itself (nodes and linking lines) consists of high-frequency graphical elements. Furthermore, it was felt that background images could be distracting. In the Thai silk model, a photo of each silk pattern served as the background for the CMap that described it. The images were adapted graphically to make it look as if one were viewing bolts of cloth in a store display. Next, the concept nodes, text, and linking lines were set in highly contrasting colors. The effect of these graphical manipulations was that the CMap seemed to stand out from its silk pattern background. Furthermore, our use of contrast suited the Thai aesthetic, which includes the use of multiple contrasting patterns and sharply contrasting colors. A screen shot is presented in Figure 2.
Figure 2. A screen shot from the Thailand National Knowledge Base Demonstration Project.
We still acknowledge the heuristic that such flourishes as background and use of color (in nodes, text, linking lines, etc.) should be used with caution. It is tempting for individuals to use color, for instance, to code nodes according to certain categories. In our experience, once a person begins using color to represent categories, the encodings get too complex and a legend becomes necessary. 4. Representation of Conceptual Knowledge (ROCK) in Terrain Analysis Difficulty in coping with terrain is a major challenge for military planning and operations. Expert-level knowledge about terrain is presented in documents discussing landforms, soils, rock types, etc. (i.e., Hoffman, 1983; Mintzer & Messmore, 1984). These documents contain photo interpretation keys for landforms of all types, topographic maps, aerial photographs, and text that describes terrain and discusses implications (e.g., trafficability). As traditional documents, the material is neither useable nor useful to the warfighter. We dubbed the process of creating a knowledge model from archived material the process of "knowledge recovery." The Terrain Analysis Data Base (TADB; Hoffman, 1983) is a corpus of about 1500 proposition-like statements about terrain. These had been derived from documentation analysis and structured interviews with expert terrain analysts at the US Army Corps of Engineers. For example, some high-level information about Dunes was represented in the TADB as: Deserts: Sand and gravel soils; Usually arid climate; Desert varnish tones; Occasional silt soils; Usually with dunes. The knowledge model consisted of 150 CMaps, containing of 3,341 concepts, 1,634 linking phrases, and 3,352 propositions (e.g., “deserts usually include dunes”). The CMaps contained an average of about 22 propositions. ROCK was the largest knowledge we had made up to that time. There were
Journal for Educators, Teachers and Trainers JETT, Vol. 4 (1); ISSN: 1989-9572
89
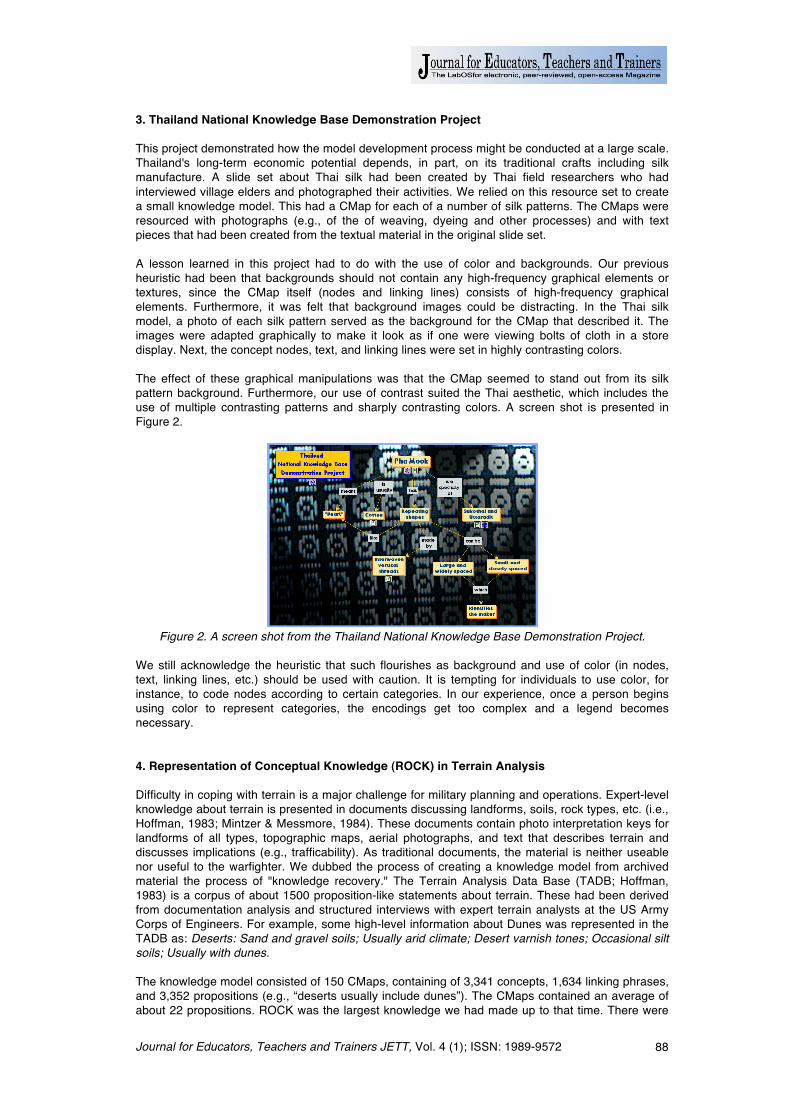
multiple CMaps about dunes, terrain over different types of bedrock, effects of climate, and so on. The model's sheer size raised issues about it usefulness. We applied a known principle in the field of psychology, that in information search and perception redundancy is helpful for (understanding, memory encoding). This idea was manifested in our adoption of redundant methods for navigating among the ROCK CMaps. We created a number of "Top Maps" that organized all the CMaps within terrain categories (e.g., climates, drainage patterns, soil types, rock types, etc.). We also created a number of "Maps of Maps" in which the nodes were all the top nodes in all the Concept Maps. In these Top Maps and Maps of Maps, all nodes that represented top nodes in other Concept Maps were colorized. A highest level CMap was created, called "The Representation of Concept Knowledge in Terrain Analysis." This provided high-level explanatory concepts and served as the user's gateway into the knowledge model. The top concept node in each Concept Map (i.e., its main topic) was hyperlinked to the "Representation of Knowledge" CMap and also to the Map of Maps and the Map of Top Maps. Finally, we created a "piece" of a Concept Map that we called a Navigator. This was added into every Concept Map in the upper left-hand side. This showed how the given Concept Map fit into its subordinating hierarchy of Top Maps. Using the Navigator Cmap Piece, users can navigate up to super-ordinate Top Maps. While this may all sound confusing, it approximated our goal, which was to enable the user to get from anywhere in the knowledge model to anywhere else in a maximum of two clicks, and never "get lost in hyperspace." An example ROCK Concept Map, bearing its Navigator, is shown in Figure 3.
Figure 3. A representative Concept Map from the terrain analysis knowledge model
"Representation of Conceptual Knowledge."
The Concept Maps were fully resourced with aerial photos, interpretation keys, text, all of the propositions from the Terrain Analysis Data Base, all of the declarative (versus procedural) knowledge from the Army Field Manual for Terrain Analysis, and all of the data elements tables and photos from the Procedural Guide for Surface Configuration. This process made it clear how resourcing is a non-trivial exercise (for some process recommendations, see Coffey & Hoffman, 2003). It is not solely a matter of combinatorics, because one needs to use each resource in more than one place, and for more than one reason, so each resource might exist under multiple labels or names. The purpose of the resourcing was to enhance the functionality of the model. Our vision for this was that the knowledge model could be used in two ways:
1) “Here is where I am going (e.g., as seen in topographic maps)—what will I see and find when I get there?” In one use context, the unit of action has been issued orders, and can use the model to get expert information about the terrain.
2) "Here is what I see from where I am—what are the implications of this terrain?” In this use context, the model is used to search and discover the rock type, soil type, and other terrain elements that would affect the operation.
What makes it possible to use the knowledge model in these two ways is the Navigator and search feature in CmapTools that relies on the propositional structure of the CMaps. Thus, for instance, if one searches the knowledge model for “dune and steep slope” the search engine will find and open
Journal for Educators, Teachers and Trainers JETT, Vol. 4 (1); ISSN: 1989-9572
90
the CMap about star dunes (which are a kind of dune that has steep slopes), permitting a comparison of the current view with example terrestrial and aerial photos. The ROCK Concept Maps were produced at a rate of between 0.25 and 0.22 propositions per TTM. This number falls considerably short of the benchmark for effective knowledge elicitation. Indeed, the yield of 0.2 propositions per task minute is roughly equivalent to that for protocol analysis. The meaning of this calculation should be considered in light of the fact that the participating local terrain analysis "expert" in the Concept Map Refinement stage happened to also be a proficient CMapper. No doubt, the refining a set of Concept Maps would have taken even longer had this not been the case, and the yield of propositions even lower than 0.2 per minute. In light of these considerations, the moral of our results is clear for any organization that in confronting issues involving the loss of expertise (see Hoffman & Hanes, 2003): Knowledge recovery is costly. One is better off capturing knowledge in a usable and useful form as a part of the organization's on-going knowledge management program, rather than finding oneself in a position of losing expertise because of retirement, and "wasting" knowledge because it is represented in older forms of media (i.e., hardcopy text) that are not easily compatible with newer hypermedia forms and formats. 5. The TNO Business Model
A number of people who apply Concept Mapping in business contexts have noted that group Concept Mapping often sets the stage for situations where people realize that they have been using the same words but not the same concepts (see Cañas & Novak, 2011). Insights invariably follow, at least in the cases that have been cited. Our experience in the TNO project fit this general description. TNO, the Netherlands Organization for Applied Scientific Research, conducts research in the public interest in areas including defense, security and safety, environmental and geosciences, and information technology. One of its business units is TNO Human Factors. Its staff includes about 150 researchers. In their periodic Technology Position Audit (TPA). personnel review their progress since the previous evaluation, taking into consideration such things as changes in funding mechanisms and priorities. They re-evaluate the unit's capabilities, competencies, ambitions, and goals. As the time for the 2009 TPA approached, an opportunity arose for conducting a process of knowledge elicitation to support the preparation of the self-evaluation report. Participants were seven senior researchers representing the Departments within the Human Factors business unit. Total time spent in Concept Mapping was 450 min. The Concept Maps included a total of 420 concepts formed into 440 propositions. Thus, the yield was 440/450 = 0.98 propositions per task minute. Much of the session time had been devoted to describing Cmapping and the CmapTools, explaining the process of hyperlinking Concept Maps and resources, and explaining the strategies used by the facilitator and the Cmapper to manage the sessions. Ordinarily, these activities are conducted in a workshop-like context and not in the knowledge elicitation sessions themselves. With this in mind, a yield of 0.98 is considered to be a reasonable yield. This determination should be taken in light of the fact that it was not the purpose of this activity to result in a complete set of refined Concept Maps. The intent was to delibertely leave some work unfinished so that TNO personnel might gain experience and practice at the process. In the opinion of TNO, the Concept Maps proved useful in the preparation for the TPA. Cmapping forced the departments to be explicit about their ambitions, plans, and product portfolio. Knowledge that had been tacit was made explicit. Differences among the departments could be harmonized by using a common framework provided by the Concept Maps. The Concept Mapping process allowed all of the departments, for the first time, to capture and share their understandings of their business models to achieve a common purpose. For example, the participants engaged in discussion of such concepts as "adaptation," "societal impact," and "short-term market potential." Pointers to a need for improved shared understanding of a business model included disagreements about what is important, subtle differences in the interpretations of key concepts, and even disagreement about what the key concepts are. A striking emergent was the lack of shared understanding of the meanings of such basic terms as “goal” and “ambition.” Considerable time was spent getting the CMaps right about these notions. This CMapping activity was suggestive of how this can be conducted to describe business models, and how those can be used as templates to support integration across business units. The use of
Journal for Educators, Teachers and Trainers JETT, Vol. 4 (1); ISSN: 1989-9572
91
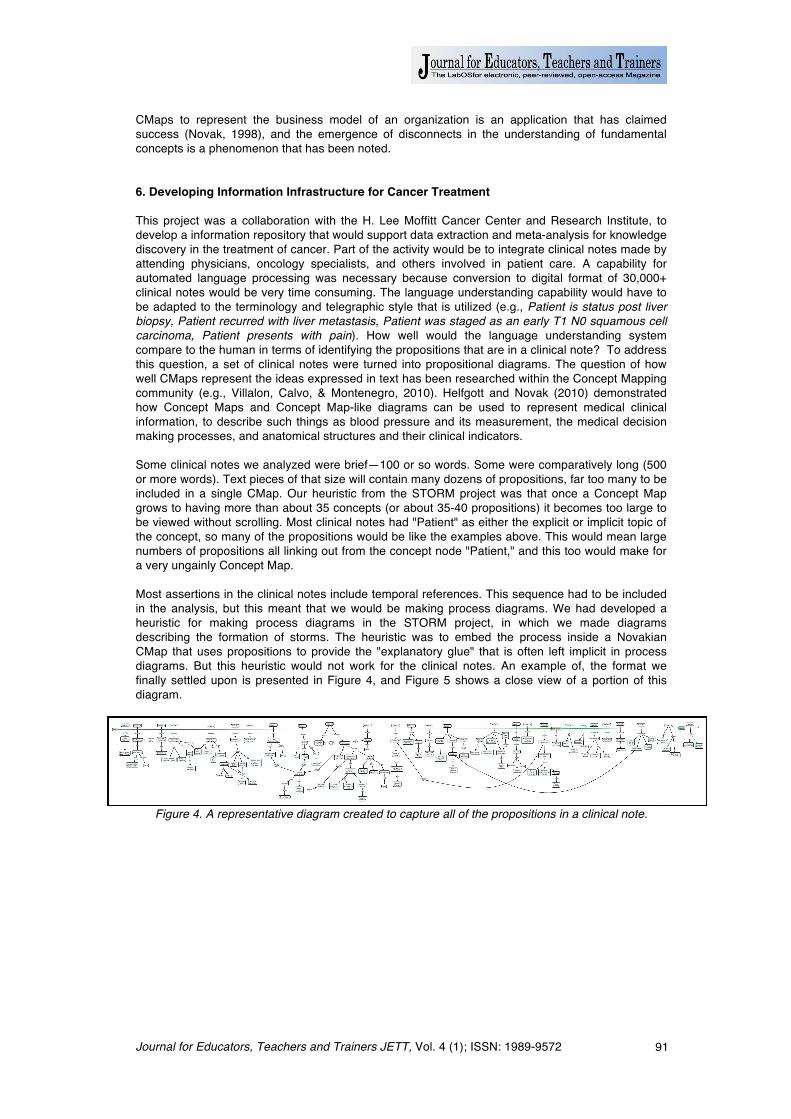
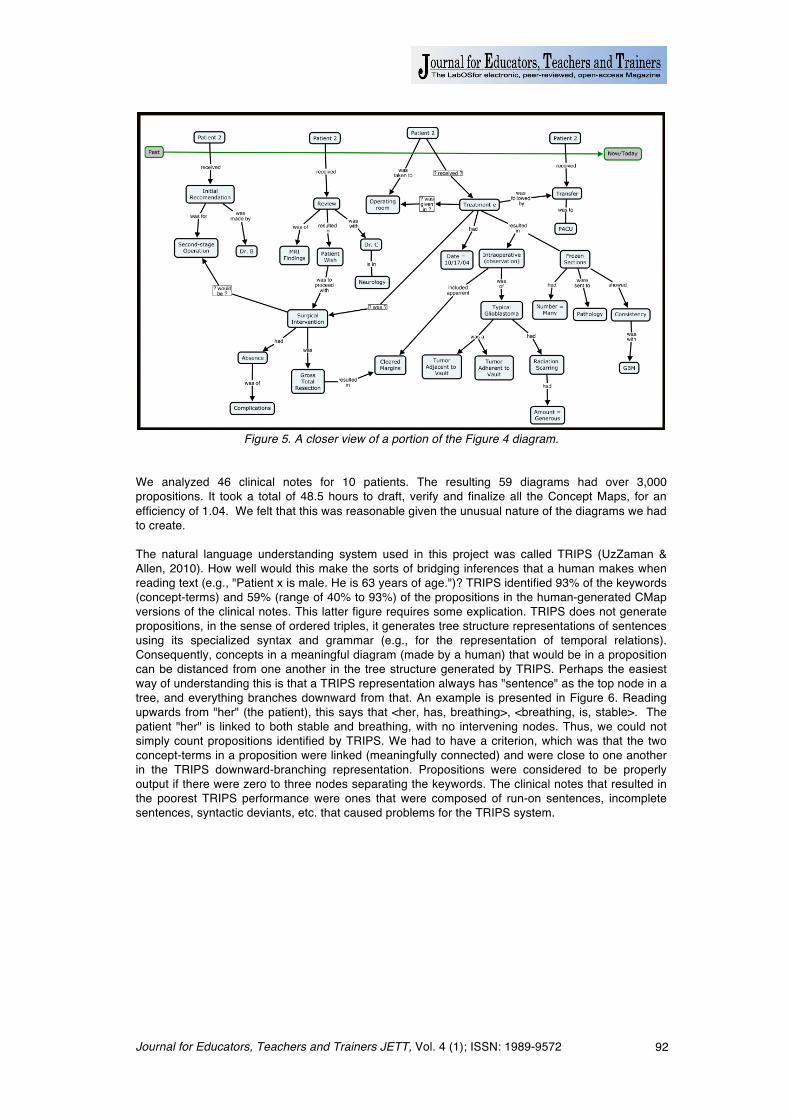
CMaps to represent the business model of an organization is an application that has claimed success (Novak, 1998), and the emergence of disconnects in the understanding of fundamental concepts is a phenomenon that has been noted. 6. Developing Information Infrastructure for Cancer Treatment This project was a collaboration with the H. Lee Moffitt Cancer Center and Research Institute, to develop a information repository that would support data extraction and meta-analysis for knowledge discovery in the treatment of cancer. Part of the activity would be to integrate clinical notes made by attending physicians, oncology specialists, and others involved in patient care. A capability for automated language processing was necessary because conversion to digital format of 30,000+ clinical notes would be very time consuming. The language understanding capability would have to be adapted to the terminology and telegraphic style that is utilized (e.g., Patient is status post liver biopsy, Patient recurred with liver metastasis, Patient was staged as an early T1 N0 squamous cell carcinoma, Patient presents with pain). How well would the language understanding system compare to the human in terms of identifying the propositions that are in a clinical note? To address this question, a set of clinical notes were turned into propositional diagrams. The question of how well CMaps represent the ideas expressed in text has been researched within the Concept Mapping community (e.g., Villalon, Calvo, & Montenegro, 2010). Helfgott and Novak (2010) demonstrated how Concept Maps and Concept Map-like diagrams can be used to represent medical clinical information, to describe such things as blood pressure and its measurement, the medical decision making processes, and anatomical structures and their clinical indicators. Some clinical notes we analyzed were brief—100 or so words. Some were comparatively long (500 or more words). Text pieces of that size will contain many dozens of propositions, far too many to be included in a single CMap. Our heuristic from the STORM project was that once a Concept Map grows to having more than about 35 concepts (or about 35-40 propositions) it becomes too large to be viewed without scrolling. Most clinical notes had "Patient" as either the explicit or implicit topic of the concept, so many of the propositions would be like the examples above. This would mean large numbers of propositions all linking out from the concept node "Patient," and this too would make for a very ungainly Concept Map. Most assertions in the clinical notes include temporal references. This sequence had to be included in the analysis, but this meant that we would be making process diagrams. We had developed a heuristic for making process diagrams in the STORM project, in which we made diagrams describing the formation of storms. The heuristic was to embed the process inside a Novakian CMap that uses propositions to provide the "explanatory glue" that is often left implicit in process diagrams. But this heuristic would not work for the clinical notes. An example of, the format we finally settled upon is presented in Figure 4, and Figure 5 shows a close view of a portion of this diagram.
Figure 4. A representative diagram created to capture all of the propositions in a clinical note.
Journal for Educators, Teachers and Trainers JETT, Vol. 4 (1); ISSN: 1989-9572
92
Figure 5. A closer view of a portion of the Figure 4 diagram.
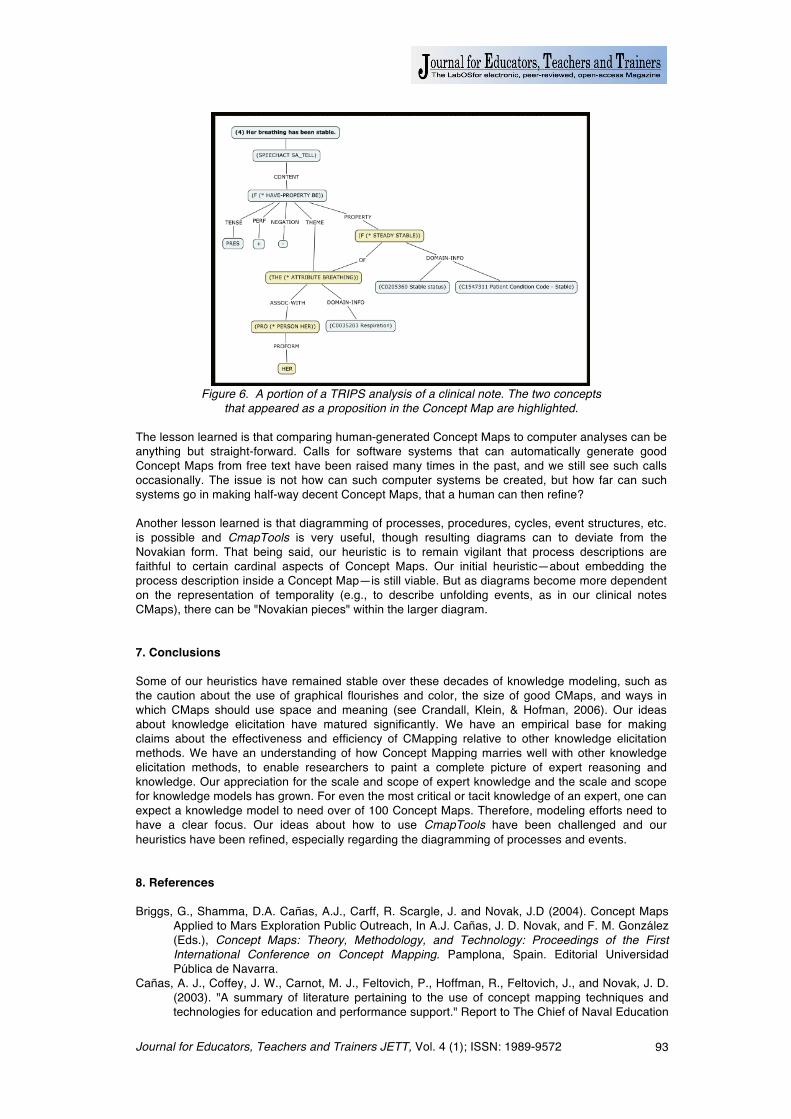
We analyzed 46 clinical notes for 10 patients. The resulting 59 diagrams had over 3,000 propositions. It took a total of 48.5 hours to draft, verify and finalize all the Concept Maps, for an efficiency of 1.04. We felt that this was reasonable given the unusual nature of the diagrams we had to create. The natural language understanding system used in this project was called TRIPS (UzZaman & Allen, 2010). How well would this make the sorts of bridging inferences that a human makes when reading text (e.g., "Patient x is male. He is 63 years of age.")? TRIPS identified 93% of the keywords (concept-terms) and 59% (range of 40% to 93%) of the propositions in the human-generated CMap versions of the clinical notes. This latter figure requires some explication. TRIPS does not generate propositions, in the sense of ordered triples, it generates tree structure representations of sentences using its specialized syntax and grammar (e.g., for the representation of temporal relations). Consequently, concepts in a meaningful diagram (made by a human) that would be in a proposition can be distanced from one another in the tree structure generated by TRIPS. Perhaps the easiest way of understanding this is that a TRIPS representation always has "sentence" as the top node in a tree, and everything branches downward from that. An example is presented in Figure 6. Reading upwards from "her" (the patient), this says that <her, has, breathing>, <breathing, is, stable>. The patient "her" is linked to both stable and breathing, with no intervening nodes. Thus, we could not simply count propositions identified by TRIPS. We had to have a criterion, which was that the two concept-terms in a proposition were linked (meaningfully connected) and were close to one another in the TRIPS downward-branching representation. Propositions were considered to be properly output if there were zero to three nodes separating the keywords. The clinical notes that resulted in the poorest TRIPS performance were ones that were composed of run-on sentences, incomplete sentences, syntactic deviants, etc. that caused problems for the TRIPS system.
Journal for Educators, Teachers and Trainers JETT, Vol. 4 (1); ISSN: 1989-9572
93
Figure 6. A portion of a TRIPS analysis of a clinical note. The two concepts
that appeared as a proposition in the Concept Map are highlighted. The lesson learned is that comparing human-generated Concept Maps to computer analyses can be anything but straight-forward. Calls for software systems that can automatically generate good Concept Maps from free text have been raised many times in the past, and we still see such calls occasionally. The issue is not how can such computer systems be created, but how far can such systems go in making half-way decent Concept Maps, that a human can then refine? Another lesson learned is that diagramming of processes, procedures, cycles, event structures, etc. is possible and CmapTools is very useful, though resulting diagrams can to deviate from the Novakian form. That being said, our heuristic is to remain vigilant that process descriptions are faithful to certain cardinal aspects of Concept Maps. Our initial heuristic—about embedding the process description inside a Concept Map—is still viable. But as diagrams become more dependent on the representation of temporality (e.g., to describe unfolding events, as in our clinical notes CMaps), there can be "Novakian pieces" within the larger diagram. 7. Conclusions Some of our heuristics have remained stable over these decades of knowledge modeling, such as the caution about the use of graphical flourishes and color, the size of good CMaps, and ways in which CMaps should use space and meaning (see Crandall, Klein, & Hofman, 2006). Our ideas about knowledge elicitation have matured significantly. We have an empirical base for making claims about the effectiveness and efficiency of CMapping relative to other knowledge elicitation methods. We have an understanding of how Concept Mapping marries well with other knowledge elicitation methods, to enable researchers to paint a complete picture of expert reasoning and knowledge. Our appreciation for the scale and scope of expert knowledge and the scale and scope for knowledge models has grown. For even the most critical or tacit knowledge of an expert, one can expect a knowledge model to need over of 100 Concept Maps. Therefore, modeling efforts need to have a clear focus. Our ideas about how to use CmapTools have been challenged and our heuristics have been refined, especially regarding the diagramming of processes and events. 8. References Briggs, G., Shamma, D.A. Cañas, A.J., Carff, R. Scargle, J. and Novak, J.D (2004). Concept Maps
Applied to Mars Exploration Public Outreach, In A.J. Cañas, J. D. Novak, and F. M. González (Eds.), Concept Maps: Theory, Methodology, and Technology: Proceedings of the First International Conference on Concept Mapping. Pamplona, Spain. Editorial Universidad Pública de Navarra.
Cañas, A. J., Coffey, J. W., Carnot, M. J., Feltovich, P., Hoffman, R., Feltovich, J., and Novak, J. D. (2003). "A summary of literature pertaining to the use of concept mapping techniques and technologies for education and performance support." Report to The Chief of Naval Education
Journal for Educators, Teachers and Trainers JETT, Vol. 4 (1); ISSN: 1989-9572
94
and Training, prepared by the Institute for Human and Machine Cognition, Pensacola FL. Cañas, A. J., Hill, G., Carff, R., Suri, N., Lott, J., Eskridge, T., Gómez, G., Arroyo, M., and Carvajal,
R. (2004). CmapTools: A Knowledge Modeling and Sharing Environment. In A. J. Cañas, J. D. Novak and F. M. González (Eds.), Concept Maps: Theory, Methodology, Technology: Proceedings of the 1st International Conference on Concept Mapping. Pamplona, Spain: Universidad Pública de Navarra.
Cañas, A., Novak, J. D. and González, F. M. (Eds.) (2004). Proceedings of the First International Conference on Concept Mapping: Concept Maps: Theory, Methodology, Technology. Navarra, Spain: Dirección de Publicaciones de la Universidad Pública de Navarra.
Coffey, J.W., Cañas, A.J., Reichherzer T., Hill G., Suri N., Carff R., Mitrovich T., & Eberle D. (2003). Knowledge modeling and the creation of El-Tech: A performance support and training system for electronic technicians. Expert Systems with Applications, 25, 483-492.
Coffey, J.W. and Hoffman, R.R. (2003). Knowledge modeling for the preservation of institutional memory. Journal of Knowledge Management. 7, 38-52.
Coffey, J.W., Hoffman, R.R., and Cañas, A.J. (2006). Concept Map-based knowledge modeling: Perspectives from information and knowledge visualization. Information Visualization, 5, 192-201.
Crandall, B., Klein, G., and Hoffman R. R. (2006). Working Minds: A Practitionerʼs Guide to Cognitive Task Analysis. Cambridge, MA: MIT Press.
Helfgott, M.A., Novak, J.D. (2010). The use of Cmaps in the description of clinical information structure and logic. In J. Sanchez, A.J. Cañas and J.D. Novak (Eds.), Concept Maps: Making Learning Meaningful: Proceedings of the Fourth International Conference on Concept Mapping (pp. 411-418). Viña del Mar, Chile.
Hoffman, R. R. (1983). "Methodological preliminaries to the development of an expert system for aerial photo interpretation." Technical report ETL-0342. Engineer Topographic Laboratories, Ft. Belvoir VA.
Hoffman, R.R. (2002, September). “An empirical comparison of methods for eliciting and modeling expert knowledge.” In Proceedings of the 46th Meeting of the Human Factors and Ergonomics Society. Santa Monica, CA: Human Factors and Ergonomics Society.
Hoffman, R.R. (2008, November/December). Influencing versus informing design, Part 2: Macrcognitive modeling. IEEE: Intelligent Systems, pp. 86-89.
Hoffman, R.R. and Coffey, J.W. (2004). Weather forecasting and the principles of complex cognitive systems. In Proceedings of the 48th Annual Meeting of the Human Factors and Ergonomics Society (pp. 315-319). Santa Monica, CA: Human Factors and Ergonomics Society.
Hoffman, R.R., Coffey, J.W., Carnot, M.J. and Novak, J.D. (2002, September). “An Empirical Comparison of Methods for Eliciting and Modeling Expert Knowledge.” In Proceedings of the 46th Meeting of the Human Factors and Ergonomics Society (pp. 482-486). Santa Monica, CA: Human Factors and Ergonomics Society.
Hoffman, R.R., Coffey, J.W., Ford, K.M., and Carnot, M.J. (2001, October) "STORM-LK: A Human-Centered Knowledge Model For Weather Forecasting." In Proceedings of the 45th Annual Meeting of the Human Factors and Ergonomics Society (p. 752). Santa Monica, CA: Human factors and Ergonomics Society.
Hoffman, R.R., Coffey, J.W., Ford, K.M. and Novak, J.D. (2006). A method for eliciting, preserving, and sharing the knowledge of forecasters. Weather and Forecasting, 21, 416–428.
Hoffman, R.R., Coffey, J. W., Hayes, P.J., Cañas, A.J., Ford, K.M., and Carnot, M.J. (2002, May). "One small step for a diagram, one giant leap for meaning." In M. Hegarty, B. Meyer, and N. H. Narayanan (Eds.), Diagrammatic Representation and Inference: Proceedings of Diagrams 2002: The Second International Conference on Theory and Application of Diagrams (pp. 344-346). Berlin: Springer.
Hoffman, R.R., Crandall, B. and Shadbolt, N. (1998). A case study in cognitive task analysis methodology: The Critical Decision Method for the elicitation of expert knowledge. Human Factors, 40, 254-276.
Hoffman, R.R., Feltovich, P. J. and Eccles, D. D. (2007). The cost of knowledge recovery. In Proceedings of the 51st Annual Meeting of the Human Factors and Ergonomics Society (pp. 328-332). Santa Monica, CA: Human Factors and Ergonomics Society.
Hoffman, R. R. and Hanes, L. F. (July-August 2003). The boiled frog problem. IEEE Intelligent Systems, pp. 68-71.
Hoffman, R.R., Neville, K. and Fowlkes, J. (2006). Using Concept Maps to integrate results from a cognitive task analysis of system development. In A. Cañas (Ed.), Proceedings of the Second International Conference on Concept Mapping, San Jose, Costa Rica.
Journal for Educators, Teachers and Trainers JETT, Vol. 4 (1); ISSN: 1989-9572
95
Hoffman, R.R., Shadbolt, N., Burton, A.M., and Klein, G. (1995). Eliciting knowledge from experts: A methodological analysis. Organizational Behavior and Human Decision Processes, 62, 129-158.
Mintzer, O. and Messmore, J.A. (1984). "Terrain analysis procedural guide for surface configuration. "Technical report ETL-0352. Engineer Topographic Laboratories, Ft. Belvoir, VA.
Novak, J. D. and Cañas, A.J. (2011). Applying educational tools and ideas in the corporate world. In B.M. Moon, R.R. Hoffman, J.D. Novak and A.J. Cañas (Eds.), Applied concept mapping (pp. 3-22). Boca Raton, FL: CRC PRess.
Schraagen, J.M., van de Ven, J., Hoffman, R. R., and Moon, B. M. (2009, October). Using a knowledge elicitation method to specify the business model of a human factors organization. In Proceedings of the Annual Meeting of the Human Factors and Ergonomics Society (pp. 309-313). Santa Monica, CA: Human Factors and Ergonomics Society.
Shadbolt, N.R., and Burton, A.M. (1990). Knowledge elicitation techniques: Some experimental results. In K.L. McGraw and C.R. Westphal (Eds.) Readings in knowledge acquisition (pp. 21-33). New York: Ellis Horwood.
UzZaman, N. and Allen, J. (2010). "TRIPS and TRIOS System for TempEval-2: Extracting Temporal Information from Text." In SemEval-2010: 5th International Workshop on Semantic Evaluations, Sweden.
Villalon, J., Calvo, R.A., and Montenegro, R. (2010). Analysis of a gold standard for concept mining: Huma humans summarize text using Concept Maps. In J. Sanchez, A.J. Cañas and J.D. Novak (Eds.), Concept Maps: Making Learning Meaningful: Proceedings of the Fourth International Conference on Concept Mapping (pp. 14-22). Viña del Mar, Chile.


![Estrategia y Gestión Estratégicak.b5z.net/i/u/6111265/i/Estrategia_y_Gestion__Estrategica.pdf · Fuente: Mintzberg et al., 1998. [Learned, Christensen, Andrews y Guth, 1965] Definición](https://static.fdocuments.es/doc/165x107/5e817559746032771b547e5a/estrategia-y-gestin-estratgicakb5znetiu6111265iestrategiaygestion.jpg)