Mehdi Mokhtarishirazabad - UMA · 2019-11-24 · y el estudio del comportamiento en condiciones de...
86
UNIVERSIDAD DE MALAGA Tesis Doctoral por Compendio de Publicaciones ESTUDIOS DE PROPAGACIÓN DE GRIETAS MEDIANTE CORRELACIÓN DE IMÁGENES Y MECÁNICA DE LA FRACTURA Mehdi Mokhtarishirazabad Málaga, Marzo 2019
Transcript of Mehdi Mokhtarishirazabad - UMA · 2019-11-24 · y el estudio del comportamiento en condiciones de...

UNIVERSIDAD DE MALAGA
Tesis Doctoral por Compendio de Publicaciones
ESTUDIOS DE PROPAGACIÓN DE GRIETAS
MEDIANTE CORRELACIÓN DE IMÁGENES Y
MECÁNICA DE LA FRACTURA
Mehdi Mokhtarishirazabad
Málaga, Marzo 2019
UNIVERSIDAD DE MALAGA
Departamento de Ingeniería Civil, de Materiales y Fabricación
Tesis Doctoral por Compendio de Publicaciones
ESTUDIOS DE PROPAGACIÓN DE GRIETAS
MEDIANTE CORRELACIÓN DE IMÁGENES Y
MECÁNICA DE LA FRACTURA
MULTI-PARAMETER FRACTURE MECHANICS
ANALYSIS OF FATIGUE CRACK PROPAGATION BY
DIGITAL IMAGE CORRELATION
Autor:
MEHDI MOKHTARISHIRAZABAD
Ingeniero de Materiales- Metalurgia Industrial por la Universidad Ferdowsi de
Mashhad, Irán
Director:
D. PABLO LÓPEZ CRESPO
Tesis doctoral presentada en la
ESCUELA DE INGENIERÍAS INDUSTRIALES de la UNIVERSIDAD DE
MÁLAGA
para la obtención del Grado de Doctor
Málaga, Marzo de 2019
D. Pablo López Crespo, Doctor del Área de Ciencia de Materiales e Ingeniería
Metalúrgica, de la Universidad de Málaga, como Director de la Tesis Doctoral.
“ESTUDIOS DE PROPAGACIÓN DE GRIETAS MEDIANTE
CORRELACIÓN DE IMÁGENES Y MECÁNICA DE LA FRACTURA”
Presentada por D. Mehdi Mokhtarishirazabad en la ESCUELA DE
INGENIERÍAS INDUSTRIALES de la UNIVERSIDAD DE MÁLAGA para la
obtención del Grado de Doctor.
Hace constar que dicha tesis queda avalada por los siguientes artículos de
investigación:
1. M. Mokhtarishirazabad, P. Lopez-Crespo, B. Moreno, A. Lopez-Moreno, M.
Zanganeh, Evaluation of crack-tip fields from DIC data: A parametric study,
International Journal of Fatigue, Volume 89, 2016, Pages 11-19.
2. M. Mokhtarishirazabad, P. Lopez-Crespo, B. Moreno, A. Lopez-Moreno, M.
Zanganeh, Optical and analytical investigation of overloads in biaxial fatigue cracks,
International Journal of Fatigue, Volume 100, Part 2, 2017, Pages 583-590.
3. Mokhtarishirazabad M, Lopez‐Crespo P, Zanganeh M. Stress intensity factor
monitoring under cyclic loading by digital image correlation, Fatigue & Fracture of
Engineering Materials and Structures, Volume 41, 2018; Pages 2162–2171.
En Málaga, a X de Marzo de 2018
Fdo: Pablo López Crespo
Director
Fdo: Belén Moreno
Morales
Tutora

To my parents, Mokhtar and Fatemeh

i
Resumen
La evaluación precisa de los parámetros de fractura es crucial para estimar el
comportamiento de los componentes mecánicos en condiciones de servicio. Las distintas
técnicas experimentales son de gran utilidad para mejorar las predicciones y los análisis de
integridad estructural en los materiales. El factor de intensidad de tensiones (SIF por sus siglas
en inglés) es un parámetro comúnmente usado para estudiar la propagación de grietas de fatiga
en órganos que trabajan en régimen eminentemente lineal elástico. Por esta razón, existen
numerosos grupos de investigación dedicados al desarrollo de métodos experimentales,
numéricos y analíticos para mejorar las estimaciones del SIF para distintas condiciones de
carga y distintas geometrías. Correlación de imágenes (DIC por sus siglas en inglés) es una
herramienta relativamente simple y de gran versatilidad que permite medir campos completos
de desplazamientos o deformaciones en objetos sometidos a cargas. La combinación de datos
obtenidos experimentalmente con soluciones analíticas como los modelos de Westergaard,
Muskhilishvili o Williams, permite la estimación de los valores del SIF en muy diversos casos.
Sin embargo, aspectos como la selección más idónea de parámetros experimentales o las
limitaciones de esta técnica siguen generando muchas dudas en la comunidad científica. Este
trabajo se centra principalmente en tres aspectos: la optimización de los parámetros
experimentales de DIC para la evaluación del SIF, la medición continua del SIF mediante DIC
y el estudio del comportamiento en condiciones de carga complejas (carga biaxial) con y sin la
presencia de cierre de grieta. A tal efecto se ha empleado un método multi-puntos
sobredeterminado que aúna la elegancia y simplicidad de los modelos elásticos con la
extracción de información real del comportamiento del material en su superficie. En este caso
hemos optado por el modelo elástico basado en el desarrollo en series de Williams y la medida
experimental de datos en torno al vértice de la grieta se ha realizado mediante DIC. En la etapa
de optimización se examinan diferentes parámetros, como el número de términos en la serie de
Williams, el tamaño del campo de visión y la ubicación óptima del área de interés. El efecto de
estos parámetros en la evaluación de SIF se examina y optimiza con el objetivo de mejorar la
precisión en los valores del SIF, así como mejorar la estabilidad de la metodología. Con los
parámetros obtenidos se observa una gran estabilidad para la evaluación continua del SIF tanto
para cargas estáticas como para cargas cíclicas. Se ha estudiado también un caso de mayor
complejidad pero a su vez mayor utilidad desde el punto de vista industrial como es la

ii
aplicación de cargas biaxiales. Los resultados mostraron una buena concordancia entre las
soluciones experimentales y las analíticas. Por último, en semejantes condiciones, se ha podido
detectar la presencia de fenómenos de cierre de grieta en fatiga, demostrando de este modo la
utilidad de estas investigaciones en condiciones de cargas variables.

iii
Abstract
Accurate evaluation of the fracture parameters is crucial for estimating the behaviour of
the mechanical components in service condition. Experimental observations are extremely
useful to provide accurate and reliable information for modern structural integrity analysis. The
stress intensity factor (SIF) is a key parameter for understanding the fatigue crack propagation
behaviour of structures prone to linear elastic failure. The SIF has been widely studied and a
number of experimental, numerical and analytical methods have been developed and continue
being developed to improve the estimation of the SIF for different loading conditions and
component geometries. Digital Image Correlation (DIC) is a simple and versatile method for
full-field quantification and can be used to measure experimentally the displacement data from
a surface of a component being strained. By combining the experimentally evaluated
displacement data with analytical solutions such as Westergard's, Muskhilishvili's and
Williams' series, one is able to evaluate the SIF in cracked components. However, the selection
of the experimental parameters and the limitations of the approach (e.g. the maximum
permitted plasticity at the crack tip) are still a controversial concept. This work concentrates
on three main topics: optimization the experimental DIC parameters for SIF evaluation,
continuous measurement of SIF by DIC and evaluation of crack tip field under complex loading
conditions (biaxial loading) with and without the presence of overloads. A multipoint over-
deterministic method is employed to combine an elastic model based on Williams' solution for
displacement distribution around the crack tip with the experimentally full field measurement
of displacement at the crack tip by DIC. Different parameters such as number of terms in
Williams' series, size of the field of view and the best location of the area of interest are
examined in the optimisation stage. The effect of these parameters on the SIF evaluation are
then tested for stable and accurate SIF estimation. The method showed a great stability for
continuous evaluation of SIF under static and cyclic loads. It also successfully applied on
cylindrical samples under biaxial loading and the results showed good agreement between
analytical and experimental evaluation of SIF. Finally, the methodology was also employed
successfully to detect crack closure effects.
iv
Acknowledgements
I would like to express my sincere gratitude to my supervisor Dr Pablo Lopez-Crespo for
all scientific and personal supports during my PhD studies. My sincere thanks to Professor
Belen Moreno for her invaluable advices in different parts of this scientific endeavour. I would
also like to thank Dr Mohammad Zanganeh, from NASA Johnson Space Centre, USA, for the
industrial support, Dr Kristin Hockauf from Chemnitz University of Technology, Germany and
Dr Mahmoud Mostafavi from the University of Bristol, UK, for hosting me during the scientific
visits that I conducted in their labs. Financial support from Junta de Andalucía through
Proyectos de Excelencia grant reference TEP-3244, the University of Malaga and Campus de
Excelencia Internacional del Mar (CEIMAR) through Lineas Emergentes program and for
providing PhD scholarship and Ministerio de Economia y Competitividad through grant
reference MAT2016‐76951‐C2‐2‐P is greatly acknowledged. Last but not least, I highly
appreciate the continuous support, encourage and understanding of my family, friends and
colleagues during the last four years.

v
Contents
1. Introduction ................................................................................................................. 1
2. Literature review ......................................................................................................... 3
2.1. Fatigue of materials.............................................................................................. 3
2.2. Fatigue crack closure ........................................................................................... 6
2.3. Digital Image Correlation .................................................................................... 7
2.4. Multi parameters fracture mechanics ................................................................... 9
2.5. DIC parameters affecting the estimation of K ................................................... 10
2.6. Continuous measurement of SIF under cyclic loading by DIC ......................... 12
2.7. Capturing complex load history by DIC ............................................................ 14
3. Methodology ............................................................................................................. 15
3.1. Optimizing DIC parameters for SIF measurement ............................................ 15
3.2. SIF monitoring by DIC ...................................................................................... 19
3.3. Biaxial experiment ............................................................................................. 20
4. Results and discussion ............................................................................................... 26
4.1. Optimizing DIC parameters for SIF measurement ............................................ 26
4.2. SIF monitoring by DIC ...................................................................................... 28
4.3. Biaxial experiment ............................................................................................. 30
5. Conclusions ............................................................................................................... 33
References ......................................................................................................................... 35

vi
List of Figures
Figure 1. different modes of loading, a) Mode I (Tensile opening), b) Mode II (in-plane sliding),
and c) Mode III (Anti-plain shear) [2]. ...................................................................................... 4
Figure 2. Definition of coordinate axis ahead of a sharp crack tip in linear elastic isotropic body
subjected to mode I of loading [12]. .......................................................................................... 5
Figure 3. evolution of plastic zone at crack wake by propagating a fatigue crack [2]. ............. 7
Figure 4. Schematic diagram of typical 2D DIC equipment [22] .............................................. 8
Figure 5. An example of a speckle pattern applied with spray paint on a CT sample. .............. 8
Figure 6. concept of digital image correlation [22] ................................................................... 9
Figure 7. Geometry of the CT specimen in accordance with ASTM standard [68]. ............... 16
Figure 8. Imaging configuration for DIC. ................................................................................ 16
Figure 9.The difference between FOV and AOI. The FOV is the size of the whole image. Six
different AOIs are defined within the FOV when λ = 50%.SIF monitoring: .......................... 19
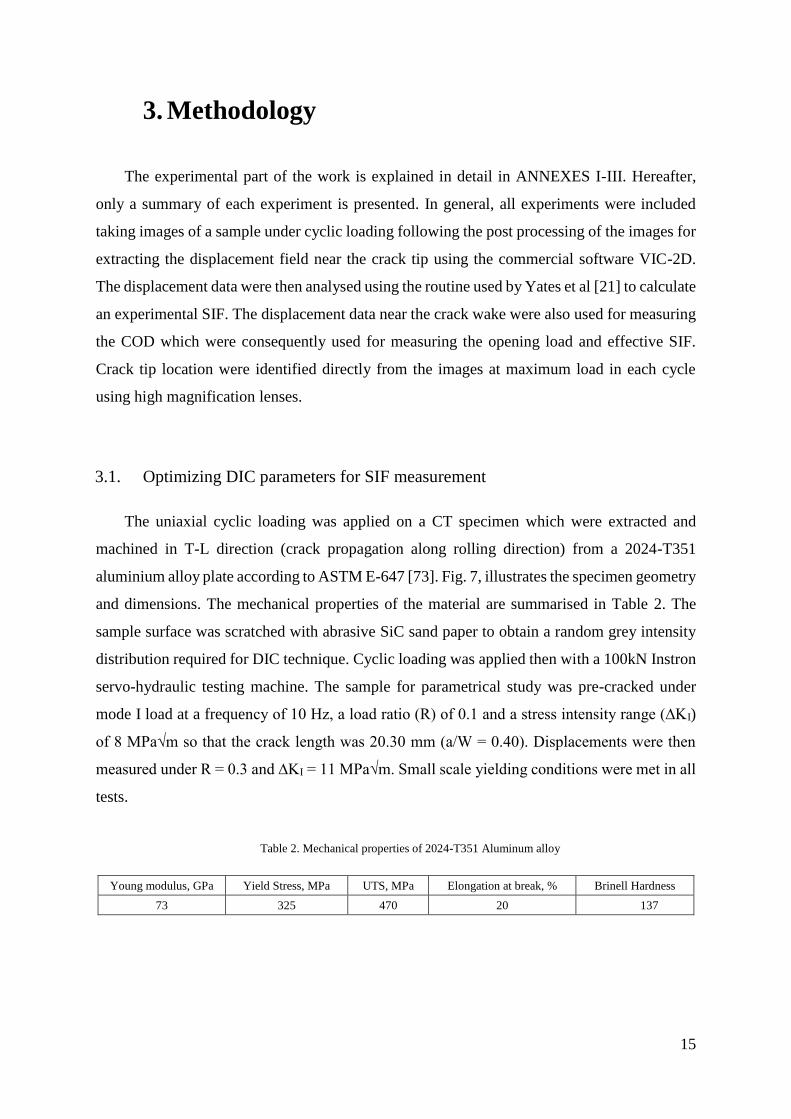
Figure 10. Schematic of loading sequences. ............................................................................ 20
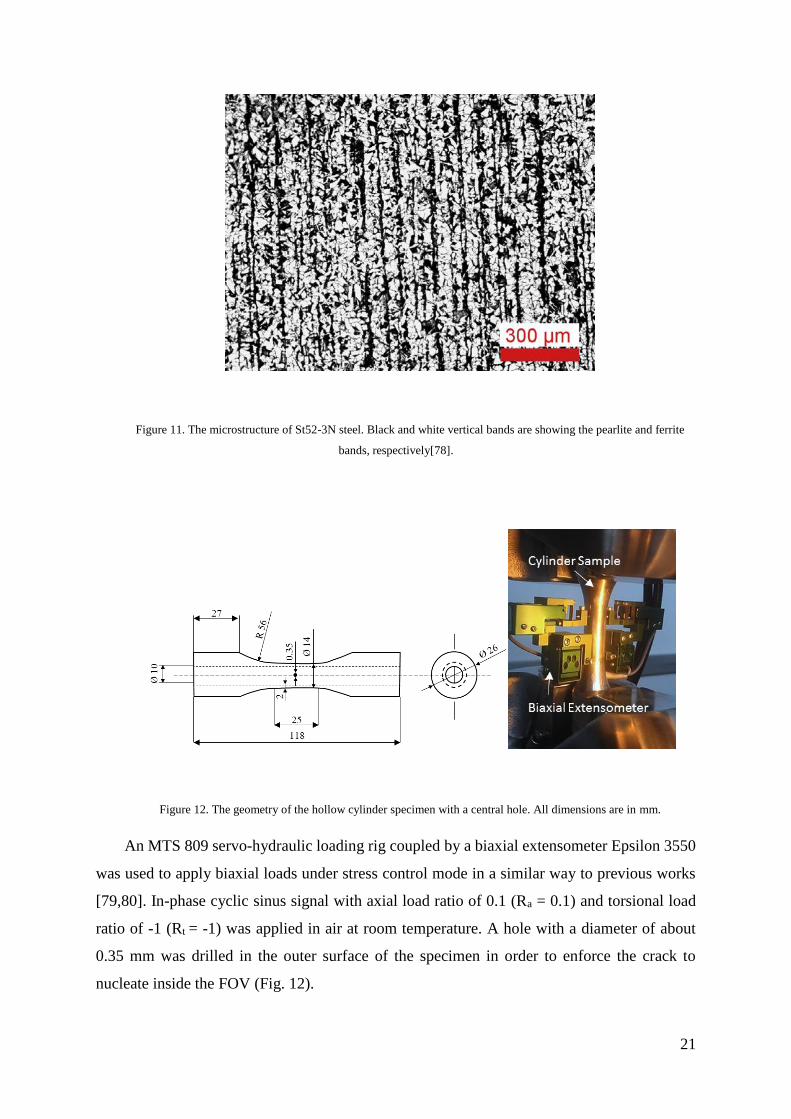
Figure 11. The microstructure of St52-3N steel. Black and white vertical bands are showing
the pearlite and ferrite bands, respectively[73]. ....................................................................... 21
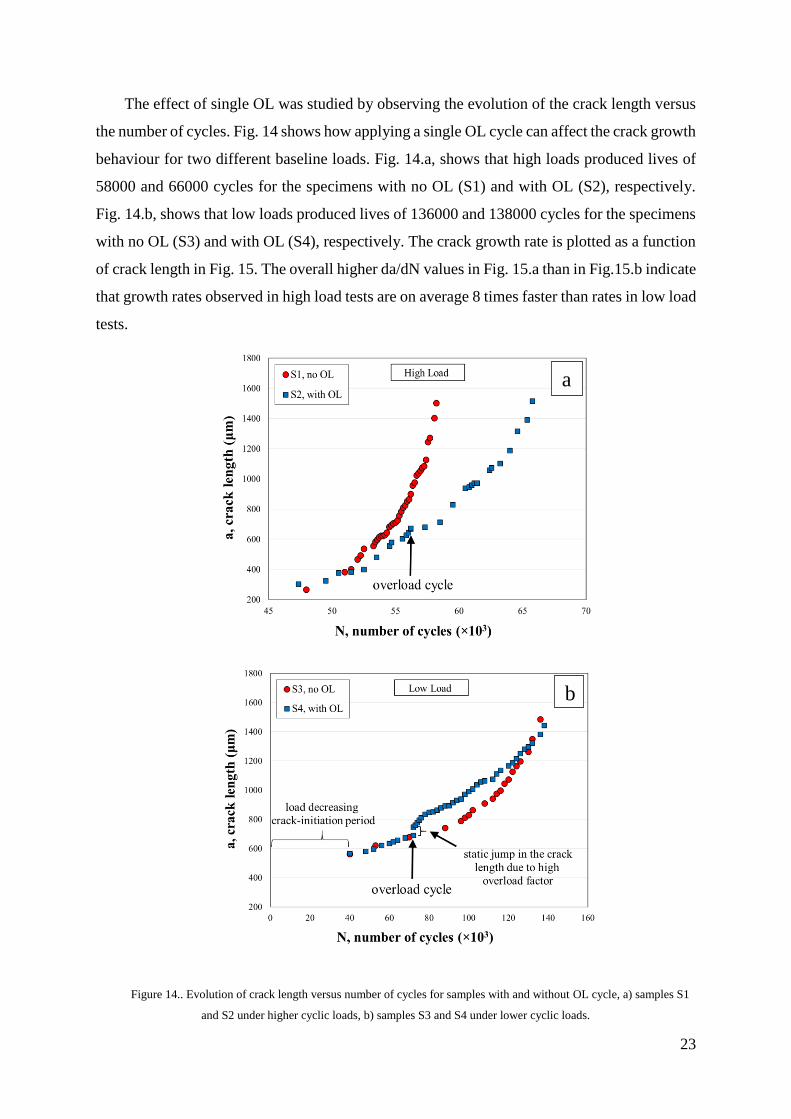
Figure 12. The geometry of the hollow cylinder specimen with a central hole. All dimensions
are in mm. ................................................................................................................................ 21
Figure 13. The position of virtual extensometers for COD examination. The white bold mark
shows the crack-tip position..................................................................................................... 22
Figure 14.. Evolution of crack length versus number of cycles for samples with and without
overload cycle, a) samples S1 and S2 under higher cyclic loads, b) samples S3 and S4 under
lower cyclic loads. ................................................................................................................... 23
Figure 15. Crack growth rate as a function of the crack length for high (a) and low (b) baseline
cyclic load. ............................................................................................................................... 24

vii
Figure 16. The position of the area of interest for deriving the displacement field ahead of a
crack with the length of 0.669 mm after 53500 cycles (sample S2). The image has been rotated,
so that the crack line becomes horizontal. ............................................................................... 25
Figure 17. The behaviour of δ as a function of λ for different FOVs. Nine terms in Williams'
expansion were used in all cases. ............................................................................................. 27
Figure 18. Effect of reducing data points in an AOI of 4 × 4 mm2 where λ = 25%. φ is defined
as the number of data points used in the analysis divided by the number of terms in the series.
Note the logarithmic scale in φ scale. ...................................................................................... 28
Figure 19. Evolution of δ by increasing ΔKnom for different sizes of AOI in mm. ................. 29
Figure 20. Continuous evaluation of ΔK as a function of applied load at the last loading
segment, leading to sudden fracture of the sample. ................................................................. 30
Figure 21. COD behaviour during loading and unloading cycle for different crack lengths of
specimens. The number of cycles before and after overload where overload cycle was
considered as 0 cycles, are shown in the graph b. ................................................................... 31
viii
List of Tables
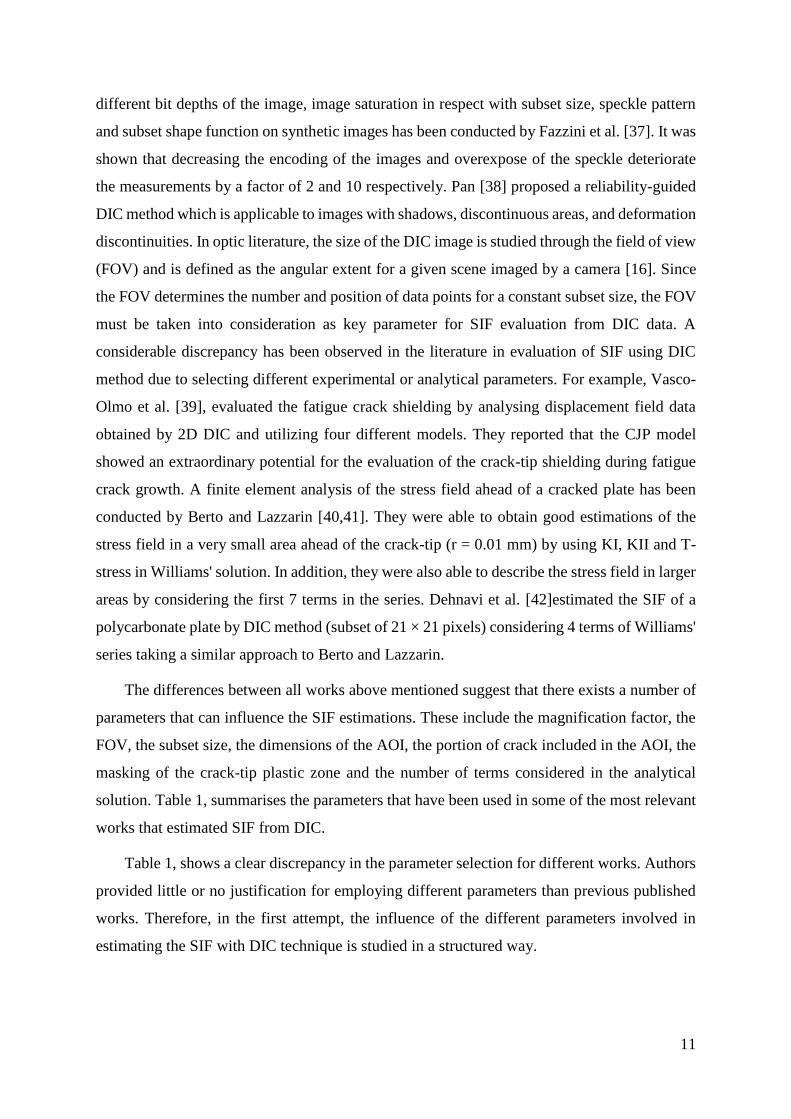
Table 1. Parameters used in previous works for estimating the SIF with DIC ................ 12
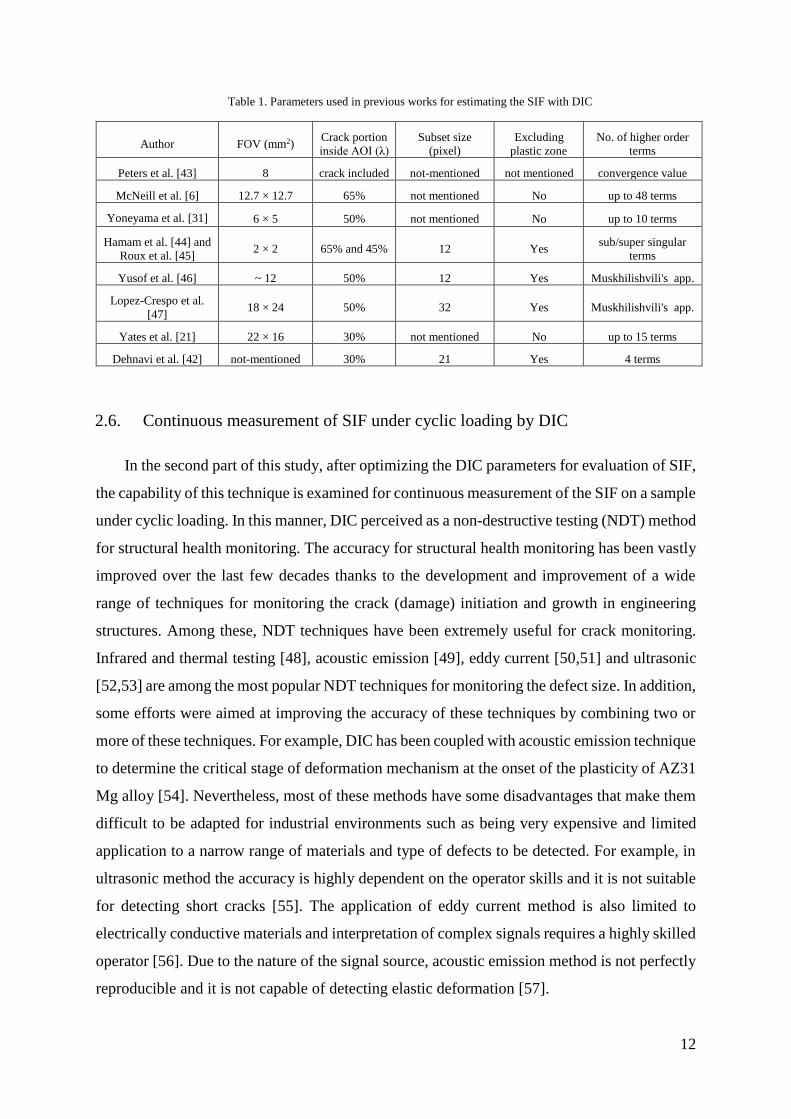
Table 2. Mechanical properties of 2024-T351 Aluminum alloy ...................................... 15
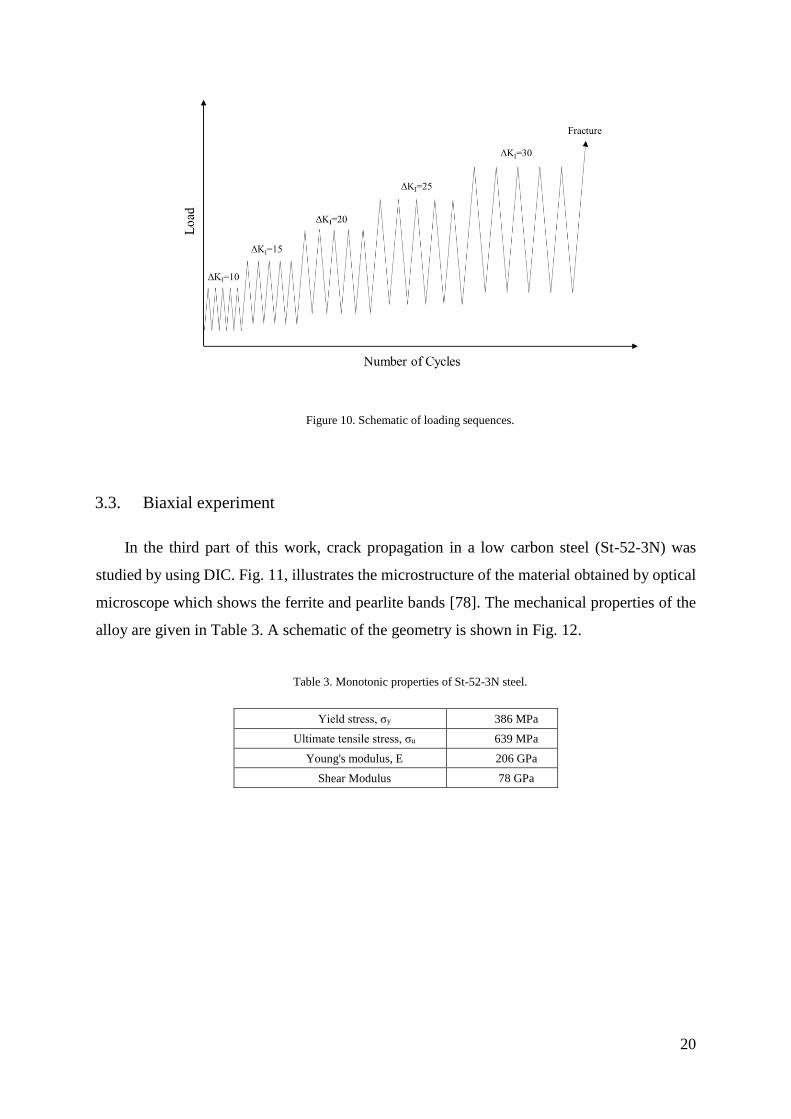
Table 3. Monotonic properties of St-52-3N steel. ............................................................ 20
Table 4. Axial and shear stress values for specimens with and without overload cycle. . 22
Table 5. Crack opening loads in a complete cycle. .......................................................... 32
Table 6. Summary of the SIFs estimated for different samples and different crack
lengths ............................................................................................................................... 32

1
1. Introduction
In modern designs, for the sake of structural integrity, accurate and reliable estimation of the
fatigue strength of the structural materials is essential. It is well recognized that materials and
structures contain cracks and flaws. Therefore, Fracture mechanic approaches should be used for
structural design and materials selections [1]. Although a number of parameters at a continuum
level have been examined to correlate the crack propagation of flawed component, the most widely
used fracture mechanics design parameter is the stress intensity factor (SIF). The SIF can
completely characterizes the crack tip fields (stress, strain and displacement) in an ideally elastic
material [1]. Apart from the conventional standard test methods for evaluating the SIF, it has been
shown that crack-tip fields (strain, stress and displacement field) include essential information for
accurate estimation of fracture parameters [2]. A number of different techniques are able to provide
both surface and bulk information. Surface techniques include photo-elasticity [3], thermo-
elasticity [4], Moiré interferometry [5] and digital image correlation (DIC) [6]. Bulk techniques
include neutron diffraction [7]and X-ray diffraction [8]. Significant development in optical
methodologies for evaluation of mechanical parameters from crack tip fields, has opened new doors
toward engineers to have a more accurate estimation of fracture parameters of engineering
component in service condition. Among full-field measurement techniques, DIC is widely used
due to several advantageous rather other methods. DIC is technically easy to implement, no
sophisticated sample preparation is needed, and it is basically a scale‐free method. In other words,
it can measure on the scale ranging from a few meters [9] to micro‐meters [10,11]. By fitting the
experimental extracted full field displacement data with available analytical solutions such as
Williams' solution for crack tip fields, an experimental stress intensity factor can be determined. It
should take into consideration that there are several factors which can affect the accuracy and
reliability of the estimated SIF. The first section of this study is allocated to optimization the
experimental DIC parameters for evaluating the SIF with high accuracy.
In the next section of the thesis, DIC is used as a robust non-destructive technique for structural
health monitoring. One of the main advantages of using DIC as an NDT method, is the capability
of the method to be combined with analytical solutions for monitoring the fracture parameters. That
is to say, while conventional NDT methods such as infrared and thermal testing, acoustic emission,
eddy current and ultrasonic have been successfully employed to monitor the defects size, DIC can
be used to monitor the changes in fracture parameters (such as SIF) without the knowledge of the

2
crack length or applied load. This is a great advantage studying complex geometries when there is
no available analytical solution and numerical solution is extremely time consuming. Therefore,
the hybrid method developed in the earlier sections is employed for continuous measurement of
stress intensity factor of a crack under cyclic loading.
To examine the capability of DIC for more complicated loading condition, crack tip field of a
sample under biaxial loading is studied in the final stage of this research. Cracks in structures are
generally subjected to mixed mode loading condition, while, for the sake of simplicity, most of
works tend to focus more on the simpler but less realistic case of uniaxial loading [2]. Therefore,
there are many uncertainties related to the load sequence effect that is now well-known and is not
normally incorporated into the crack growth models. DIC is employed as versatile full-field optical
technique in combination with analytical methodology to study overloads in fatigue cracks under
biaxial loading (tension-torsion).

3
2. Literature review
2.1. Fatigue of materials
Since the first half of nineteenth century when the first research on fatigue of materials
was published [2], a huge number of researches have been conducted to determine the different
types and mechanisms of fatigue of material. Nowadays, it is well-known that the majority of
the failure of engineering components (50%-90%) is due to fatigue fracture [2,12]. One of the
most common definition for the fatigue phenomenon in materials is determined by ASTM [13]
as follows:
“The process of progressive localized permanent structural change occurring in a material
subjected to conditions that produce fluctuating stresses and strains at some point or points and
that may culminate in cracks or complete fracture after a sufficient number of fluctuations”.
As it can be seen from the abovementioned definition of the fatigue process, it is a localized
process. That is to say, the fatigue damage occurs at local areas that experience high stress or
strain. Another important keyword in the fatigue process definition is the word crack. In many
safety critical parts in industry it is normally assumed that small crack-like defects (e.g.
impurity, porosity, etc.) exists prior to initial use of the component. Keeping in mind that
fatigue is a localized process and there is a crack which always lead to the final failure of the
component, the crack tip fields seem to provide invaluable information for predicting the
fatigue crack growth behaviour. To this end, Fracture Mechanics can be used as a tool to study
the fatigue process. Linear Elastic Fracture Mechanics (LEFM) is one of the most common
methods for analysing the fatigue process of materials provided that materials conditions
during the loading are predominantly linear elastic. [1,12].
Irwin extended the Griffith's theory of brittle fracture to metals with small plastic
deformation at the crack tip. To quantify the crack tip driving force, he employed the Stress
Intensity Factor (SIF). The SIF is known as one of the most important fracture parameters for
characterising the crack behaviour of the engineering components. Since 1957 when Irwin [14]
formulised the SIF a considerable work have been done to improve our understanding on its
importance in crack growth behaviour under static and cyclic loading [1,15]. Finite element
method had been employed widely during last decades for detailed analysis of the crack tip
fields (stress, strain, displacement) to evaluate the SIF and phenomenon such as crack closure

4
[16,17]. In addition, some mathematical models have been introduced describing the crack tip
field. Westergaard [18] came up with a stress function describing the elastic stress distribution
ahead of a crack. Williams then expanded his solution to take into account the yielding effect
at the crack tip [19]. The stress field in a linear elastic cracked body subjected to external forces
can be expressed as follows [1]:
𝜎𝑖𝑗 = (𝑘
√𝑟) 𝑓𝑖𝑗(𝜃) + ∑ 𝐴𝑚𝑟
𝑚2𝑔𝑖𝑗
(𝑚)(𝜃)
∞
𝑚=0
(1)
where σij is the stress tensor, r and θ represent polar coordinate system (Fig. 2), k is a constant,
and fij is a dimensionless function of θ in the first term. Am is the amplitude and gij is a
dimensionless function of the θ for the mth term. Since the leading term in the solution is
proportional with 1/√𝑟 , it approaches to infinity when r → 0, while higher order terms remains
finite or approach zero. That is, the stress near the crack tip is a function of 1/√𝑟. In Eq. 1, k
can be replaced by SIF, K, where 𝐾 = 𝑘√2𝜋. For the sake of simplicity, the higher order terms
are often ignored. However, it is essential to consider higher order terms to describe crack tip
stress state accurately. For example, Larsson et al. [20] has shown that considering second non-
singular term in Willimas' series expansion can improve the evaluation of stress state ahead of
a crack tip in plane strain conditions. Effect of considering higher order terms on the accuracy
of the SIF estimation is examined in section 2.1.
Figure 1. different modes of loading, a) Mode I (Tensile opening), b) Mode II (in-plane sliding), and c) Mode III
(Anti-plane shear) [2].
Fig. 1, shows three types of loading that can be applied to a crack including tensile opening
(mode I), in-plane sliding (mode II), and out of plane shear (mode III). Fig. 2, illustrates the
stress distribution ahead of a through-thickness sharp crack in linear elastic isotropic body
subjected to mode I loading [12].

5
Figure 2. Definition of coordinate axis ahead of a sharp crack tip in linear elastic isotropic body subjected to mode I of
loading [12].
The displacement field near the crack tip can also be described as follows [21]:
𝑢 = ∑𝑟𝑛2
2𝜇𝑎𝑛 {[𝜅 +
𝑛
2+ (−1)𝑛] 𝑐𝑜𝑠
𝑛𝜃
2−𝑛
2𝑐𝑜𝑠
(𝑛 − 4)𝜃
2}
∞
𝑛=1
𝑣 = ∑𝑟𝑛2
2𝜇𝑎𝑛 {[𝜅 −
𝑛
2− (−1)𝑛] 𝑠𝑖𝑛
𝑛𝜃
2+𝑛
2𝑠𝑖𝑛
(𝑛 − 4)𝜃
2}
∞
𝑛=1
(2)
where u and v are the horizontal and vertical displacement respectively. µ is the shear modus
and 𝜅 = (3 − 𝜈)/(1 + 𝜈) for plane stress and 𝜅 = 3 − 4𝜈 for plane strain condition, 𝜐 is the
Poisson's ratio, r and θ are radial and phase distance from the crack, a and b are constant. It can
be seen from Eq.2 that by using a reverse solution, one is able to quantify the SIF if the state
of crack tip field is known. For example, if by using an experimental method such as DIC, the
state of the displacement field around the crack tip is determined, an experimental evaluation
of SIF can be achieved.
Recently, Christopher et al. [22] introduced a new model for fatigue crack growth by
including the K, T-stress , interfacial shear stresses, and a “retarding stress”. They claim that
their model can identify the influence of stresses arising from plastic deformation [23] related
to crack growth. All of the proposed models have been validated by experimental full-field
data. Different techniques have been developed to obtain a full-field measurement of the crack
tip field, experimentally, such as Moiré interferometry [5], photo-elasticity [3], thermo-
elasticity [4], and DIC [6]. In section 3.3, DIC is introduced as a robust method for extracting
the experimental full-field displacement data and its application for evaluating the widely used
fracture parameters such as SIF is discussed.

6
2.2. Fatigue crack closure
The phenomenon in which the fatigue crack remains closed even after applying far-field
tensile load, was observed and rationalised by Elber in 1970 [2]. This behaviour was attributed
to elastic constraint of the material plasticly stretched along the crack flanks by growing the
crack. Plasticity-induced crack closure is the term coined for this type of the crack closure
[2,24,25]. Residual plastic stretch at the crack wake is not the only source of crack closure [26].
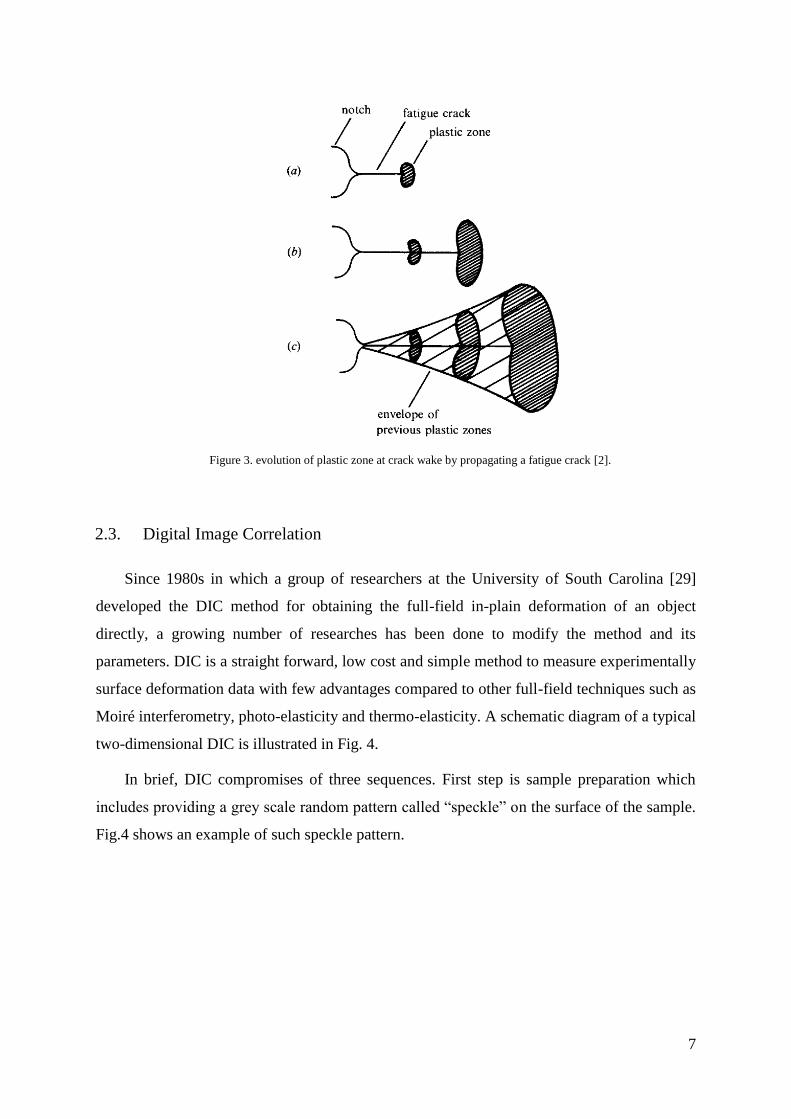
Oxide induced crack closure, microscopic crack closure, viscous fluid-induced crack closure
and transformation induced crack closure are the other types of crack closure. Elber's finding
suggests that fatigue crack growth rate is not depend on only the crack tip condition but also
depends on the state if the materials at the crack flanks behind the crack tip [27]. Therefore, for
predicting the fatigue crack growth, the load history, length of the crack and stress state are
playing important roles. Fig. 3, shows how the plastic wake develops for fatigue cracks with
different crack length propagating under constant amplitude of tensile stresses .The effect of
crack closure can lead a deviation from Paris' Law, which can be considered in the models by
introducing ΔKeff = Kmax-Kop, where Kop is the SIF when the crack is open fully [2,25]. A
number of different methods have been developed for evaluating the Kop. In general, they can
be divided in two main groups: direct methods such as optical and scanning electron
microscopy observations, replica, etc, and indirect methods, in which the compliance changes
during the loading cycles are measured, like back face strain and crack mouth opening
displacement (CMOD) [28]. The load-displacement/strain data are then used to determine the
opening load (Pop). Some of the most common methods are as follows:
• Deviation point from the linearity of the upper part of the load-displacement curve
• 1% offset slope method
• Deviation point from the linearity of the upper part of the load-differential displacement
curve
• The intersection point between two tangent lines, fitted to the upper and lower linear
part of the load-displacement curve
The advantages and disadvantages of each method is discussed in details by Stoychev and
Kujawski [28].
7
Figure 3. evolution of plastic zone at crack wake by propagating a fatigue crack [2].
2.3. Digital Image Correlation
Since 1980s in which a group of researchers at the University of South Carolina [29]
developed the DIC method for obtaining the full-field in-plain deformation of an object
directly, a growing number of researches has been done to modify the method and its
parameters. DIC is a straight forward, low cost and simple method to measure experimentally
surface deformation data with few advantages compared to other full-field techniques such as
Moiré interferometry, photo-elasticity and thermo-elasticity. A schematic diagram of a typical
two-dimensional DIC is illustrated in Fig. 4.
In brief, DIC compromises of three sequences. First step is sample preparation which
includes providing a grey scale random pattern called “speckle” on the surface of the sample.
Fig.4 shows an example of such speckle pattern.

8
Figure 4. Schematic diagram of typical 2D DIC equipment [21]
Figure 5. An example of a speckle pattern applied with spray paint on a CT sample.
This pattern can be achieved simply by spray painting the sample with white and black
colours to obtain a random pattern of high contrast markers (Fig.5). Next is taking digital
images before and after loading from the surface of the specimen. Each image is made of pixels
with distinct grey scale intensity. Finally, DIC uses correlation algorithm to track the markers
on the pattern by comparing the first image (reference image), when no load is applying to the
sample, with the deformed image taken during the loading. Since the intensity of a pixel in a
digital image is not unique, in the correlation method, the image is divided to smaller windows
called subset which is always made of an odd number of pixels. The pattern inside the subset
is then correlated with the same subset in the reference image to calculate the displacement in
the centre of the subset, point P. A Taylor expansion about the point P can be used to find the
displacement of P from (x0,y0) to (x1,y1), point P* as follows :
𝑥1 = 𝑥0 + 𝑢0 +𝑑𝑢
𝑑𝑥∆𝑥 +
𝑑𝑢
𝑑𝑦∆𝑦 +
1
2
𝑑2𝑢
𝑑𝑥2∆𝑥2 +
1
2
𝑑2𝑢
𝑑𝑦2∆𝑦2 +
𝑑2𝑢
𝑑𝑥𝑑𝑦∆𝑥∆𝑦 (3)
𝑦1 = 𝑦0 + 𝑣0 +𝑑𝑣
𝑑𝑥∆𝑥 +
𝑑𝑣
𝑑𝑦∆𝑦 +
1
2
𝑑2𝑣
𝑑𝑥2∆𝑥2 +
1
2
𝑑2𝑣
𝑑𝑦2∆𝑦2 +
𝑑2𝑣
𝑑𝑥𝑑𝑦∆𝑥∆𝑦 (4)

9
where u0 and v0 are the horizontal and vertical displacement of point P, respectively, Δx=x1-x0
and Δy=y1-y0.
Higher order terms in Eqs. 3, and 4 are used to consider the subset rotation and distortion
as shown in Fig. 6. The correlation between two subsets can be established in several methods
which have their own pros and cons. For example, the correlation between the two subsets
(before and after deformation) can be done by minimizing a correlation factor, C:
𝐶 =∑ [𝐺(𝑥0, 𝑦0) − 𝐻(𝑥1, 𝑦1]
2𝑠
∑ 𝐺2(𝑠 𝑥0, 𝑦0) (5)
where G and H are the grey scale light intensities corresponding to all points in the subset, S.
This process performs for all subsets in the image. An overlap between neighbour subsets is
set to have a sub-pixel accuracy. In this manner, a full field displacement of the area of interest
(AOI) can be obtained.
Figure 6. concept of DIC [21]
The details of the method and algorithms are comprehensively described by Sutton et al.
[16].
2.4. Multi parameters fracture mechanics
Based on classical fracture mechanics theories, a single parameter like KI or J can
characterise the stresses or strains near the crack tip under small scale yielding condition where
the size of plastic zone is negligible comparing the crack length and size of the body [1,30].

10
However, in the presence of excessive plasticity, single-parameter fracture mechanics is not
valid anymore and fracture toughness becomes dependent on size and geometry of the sample.
Higher order terms in Williams' infinite power series become more and more important at the
presence of considerable crack tip plasticity. For example, second term in the Williams' series,
known as T-stress, remains finite at the crack tip and it is independent of the distance from
crack tip. It has been shown that T-stress has a considerable effect on the state of stresses and
strains near the crack tip, as a result on the shape of plastic zone at the crack tip [1]. A number
of studies have been conducted to evaluate the effect of higher order term on stress or strain
state ahead of a crack tip. Utilising an over-deterministic least square method for evaluating
mixed mode stress field parameters by the technique of photoelasticity, Ramesh et al. [3]
showed the importance of using multi-parameter stress equations for solving real life problems
where displacement data are collecting from a large area. They used the fringe order
minimisation error as their convergence criteria. The method was tested in three different
geometries and for those data, a minimum of 6 parameters were required to obtain a
convergence error less than 0.1 in fringe order (N) in modes I and II.
Yoneyama et al. [31], suggested determining SIF by adopting the convergent values
(considering more than 7 terms). A nonlinear least square method was used in their research
for estimating SIF from displacement data provided by DIC from a FOV of 6 × 5 mm2.
Abovementioned studies show the importance of considering higher order terms in
determination of the state the crack tip fields. It is also true when the experimental displacement
field is used for evaluation of K ahead of a crack, especially when data are collecting from
larger area. Selecting a suitable number of terms for evaluation go SIF from experimental data
is one of the concerns of this study.
2.5. DIC parameters affecting the estimation of K
Experimentally, DIC measurement accuracy can be affected by several factors, such as
subpixel optimization algorithm, subset size, image quality, etc. [32]. It is evident that the more
accurate displacement data, the more reliable estimation of SIFs. While the random error in
any measurement is the inherent part of each measurement, systematic error is predictable and
is typically constant and proportional to the true value [33]. Systematic errors in DIC as a result
of intensity interpolation, overmatched and under-matched subset shape function has been
explored by Schreier et al. [34,35] and Yu et al. [36]. A thorough study on the errors caused by
11
different bit depths of the image, image saturation in respect with subset size, speckle pattern
and subset shape function on synthetic images has been conducted by Fazzini et al. [37]. It was
shown that decreasing the encoding of the images and overexpose of the speckle deteriorate
the measurements by a factor of 2 and 10 respectively. Pan [38] proposed a reliability-guided
DIC method which is applicable to images with shadows, discontinuous areas, and deformation
discontinuities. In optic literature, the size of the DIC image is studied through the field of view
(FOV) and is defined as the angular extent for a given scene imaged by a camera [16]. Since
the FOV determines the number and position of data points for a constant subset size, the FOV
must be taken into consideration as key parameter for SIF evaluation from DIC data. A
considerable discrepancy has been observed in the literature in evaluation of SIF using DIC
method due to selecting different experimental or analytical parameters. For example, Vasco-
Olmo et al. [39], evaluated the fatigue crack shielding by analysing displacement field data
obtained by 2D DIC and utilizing four different models. They reported that the CJP model
showed an extraordinary potential for the evaluation of the crack-tip shielding during fatigue
crack growth. A finite element analysis of the stress field ahead of a cracked plate has been
conducted by Berto and Lazzarin [40,41]. They were able to obtain good estimations of the
stress field in a very small area ahead of the crack-tip (r = 0.01 mm) by using KI, KII and T-
stress in Williams' solution. In addition, they were also able to describe the stress field in larger
areas by considering the first 7 terms in the series. Dehnavi et al. [42]estimated the SIF of a
polycarbonate plate by DIC method (subset of 21 × 21 pixels) considering 4 terms of Williams'
series taking a similar approach to Berto and Lazzarin.
The differences between all works above mentioned suggest that there exists a number of
parameters that can influence the SIF estimations. These include the magnification factor, the
FOV, the subset size, the dimensions of the AOI, the portion of crack included in the AOI, the
masking of the crack-tip plastic zone and the number of terms considered in the analytical
solution. Table 1, summarises the parameters that have been used in some of the most relevant
works that estimated SIF from DIC.
Table 1, shows a clear discrepancy in the parameter selection for different works. Authors
provided little or no justification for employing different parameters than previous published
works. Therefore, in the first attempt, the influence of the different parameters involved in
estimating the SIF with DIC technique is studied in a structured way.
12
Table 1. Parameters used in previous works for estimating the SIF with DIC
Author FOV (mm2) Crack portion
inside AOI (λ)
Subset size
(pixel)
Excluding
plastic zone
No. of higher order
terms
Peters et al. [43] 8 crack included not-mentioned not mentioned convergence value
McNeill et al. [6] 12.7 × 12.7 65% not mentioned No up to 48 terms
Yoneyama et al. [31] 6 × 5 50% not mentioned No up to 10 terms
Hamam et al. [44] and
Roux et al. [45] 2 × 2 65% and 45% 12 Yes
sub/super singular
terms
Yusof et al. [46] ~ 12 50% 12 Yes Muskhilishvili's app.
Lopez-Crespo et al.
[47] 18 × 24 50% 32 Yes Muskhilishvili's app.
Yates et al. [21] 22 × 16 30% not mentioned No up to 15 terms
Dehnavi et al. [42] not-mentioned 30% 21 Yes 4 terms
2.6. Continuous measurement of SIF under cyclic loading by DIC
In the second part of this study, after optimizing the DIC parameters for evaluation of SIF,
the capability of this technique is examined for continuous measurement of the SIF on a sample
under cyclic loading. In this manner, DIC perceived as a non-destructive testing (NDT) method
for structural health monitoring. The accuracy for structural health monitoring has been vastly
improved over the last few decades thanks to the development and improvement of a wide
range of techniques for monitoring the crack (damage) initiation and growth in engineering
structures. Among these, NDT techniques have been extremely useful for crack monitoring.
Infrared and thermal testing [48], acoustic emission [49], eddy current [50,51] and ultrasonic
[52,53] are among the most popular NDT techniques for monitoring the defect size. In addition,
some efforts were aimed at improving the accuracy of these techniques by combining two or
more of these techniques. For example, DIC has been coupled with acoustic emission technique
to determine the critical stage of deformation mechanism at the onset of the plasticity of AZ31
Mg alloy [54]. Nevertheless, most of these methods have some disadvantages that make them
difficult to be adapted for industrial environments such as being very expensive and limited
application to a narrow range of materials and type of defects to be detected. For example, in
ultrasonic method the accuracy is highly dependent on the operator skills and it is not suitable
for detecting short cracks [55]. The application of eddy current method is also limited to
electrically conductive materials and interpretation of complex signals requires a highly skilled
operator [56]. Due to the nature of the signal source, acoustic emission method is not perfectly
reproducible and it is not capable of detecting elastic deformation [57].

13
While the previously described methods are used to determine the crack geometry and
length, accurate damage assessment of engineering structures subjected to changing loads often
requires fracture parameters of the component to be evaluated. To this end, full field techniques
such as DIC [6] have been developed to characterise crack tip fields in terms of strain, stress
and displacement. As it was mentioned in the previous section, SIF is a key parameter for
fatigue life prediction of engineering components prone to linear elastic failure. The prominent
advantage of using the crack tip fields for evaluating SIF is that no previous knowledge of
crack length, applied force or specimen geometry is needed. This makes it very suitable for
characterisation of in-service engineering components [58]. DIC has been employed [47] to
study the effect of crack closure and crack tip plasticity in the evaluation of SIF for specimens
under different mixed-mode loads (I+II). Very promising results were obtained in early studies
while estimating the SIF with DIC on C-specimens and three-point-bend specimens [6].
Improvement in digital photography allowed higher resolution images that improved the
accuracy in estimating the SIF both under pure mode I and a range of mixed-mode conditions
[31]. Edge-finding routines for locating the crack tip were subsequently incorporated to the
program to automate the evaluation of SIF with DIC displacement data [59]. The crack-tip
location was also evaluated from displacement fields with a number of numerical procedures,
including reflective Newton method, Nelder-Mead Simplex method, genetic algorithm and
Pattern Search method [60]. DIC also allowed other forms of crack evaluation through different
parameters. For example, T-stress and crack tip opening angle were evaluated on double
cantilever specimens made of 7010 T7651 aluminium alloy [21]. Elastic plastic crack
assessment was achieved with different methodologies. The J-integral was estimated from a
combination of DIC and finite element method displacements by applying the path and domain
integral methods on annealed and unannealed pure aluminium A1050 [61]. crack opening
displacement (COD) measurements obtained with high magnification DIC were used to
evaluate crack growth and closure mechanisms for different thicknesses on 6082 T6 aluminium
alloy [62]. The plastic zone ahead of the crack [63] as a way to control the rate of crack growth
was assessed with DIC on specimens with artificial cracks [64] and on specimens with real
fatigue cracks [65]. To examine the capability of the proposed hybrid method, in the second
part of this study, for the first time, a DIC methodology is used for continuous monitoring of
the effective SIF under a range of different cyclic levels [66].

14
2.7. Capturing complex load history by DIC
While fracture problems can be simplified by considering mode I of loading, cracks in
structural materials are generally under mixed-mode loading condition [2]. Therefore,
estimation of the fracture parameters based on mixed-mode loading condition will be more
representative of the material fracture behaviour under the actual working condition. Different
optical methods have been used for obtaining full-field information required for mixed-mode
loading analysis previously. Sanford and Dally [67] have determined the mixed-mode SIFs by
utilising isochromatic fringes near the crack-tip. They have reported that employing an over-
deterministic approach on the data points provided by the full filed fringe patterns led to a
highly accurate SIF estimation. Displacement fields derived by DIC technique have been
utilised by Yoneyama et al. [31] to evaluate the mixed-mode SIFs of a polymer (polymethyl-
methacrylate). While they used a non-linear least square method for their solutions, Réthoré et
al. [68] have developed a method based on the Lagrangian conservation law for mixed-mode
SIFs estimations. A good agreement between analytical displacement fields generated based
on the Muskhilishvili's complex function approach and the experimentally measured
displacement fields (obtained by DIC) has been also reported by Lopez-Crespo et al [69]. The
combined effect of OL and biaxial loading has been studied by potential drop technique [70].
Full-field optical techniques are very advantageous compared to other more traditional
techniques. They are very versatile and can be used to study a wide range of aspects related to
the OL, including evaluation of the plastic region, changes in the stress field due to the OL or
experimental estimation of fracture mechanics parameters. Nevertheless, as it is described
previously, they have been mostly applied to the uniaxial problem. In reality, most mechanical
components are subjected to complex loading conditions with varying magnitude and direction.
Therefore, it is desirable to apply full-field optical techniques to more complex loading
conditions. In the last part of this work, a comprehensive optical and analytical methodology
is used to study overloads [71] in fatigue cracks under biaxial loading. Most experimental
information is extracted from full-field DIC data. Specimens with and without overloads are
compared in terms of crack growth rate, COD and SIF [72].
15
3. Methodology
The experimental part of the work is explained in detail in ANNEXES I-III. Hereafter,
only a summary of each experiment is presented. In general, all experiments were included
taking images of a sample under cyclic loading following the post processing of the images for
extracting the displacement field near the crack tip using the commercial software VIC-2D.
The displacement data were then analysed using the routine used by Yates et al [21] to calculate
an experimental SIF. The displacement data near the crack wake were also used for measuring
the COD which were consequently used for measuring the opening load and effective SIF.
Crack tip location were identified directly from the images at maximum load in each cycle
using high magnification lenses.
3.1. Optimizing DIC parameters for SIF measurement
The uniaxial cyclic loading was applied on a CT specimen which were extracted and
machined in T-L direction (crack propagation along rolling direction) from a 2024-T351
aluminium alloy plate according to ASTM E-647 [73]. Fig. 7, illustrates the specimen geometry
and dimensions. The mechanical properties of the material are summarised in Table 2. The
sample surface was scratched with abrasive SiC sand paper to obtain a random grey intensity
distribution required for DIC technique. Cyclic loading was applied then with a 100kN Instron
servo-hydraulic testing machine. The sample for parametrical study was pre-cracked under
mode I load at a frequency of 10 Hz, a load ratio (R) of 0.1 and a stress intensity range (∆KI)
of 8 MPa√m so that the crack length was 20.30 mm (a/W = 0.40). Displacements were then
measured under R = 0.3 and ∆KI = 11 MPa√m. Small scale yielding conditions were met in all
tests.
Table 2. Mechanical properties of 2024-T351 Aluminum alloy
Young modulus, GPa Yield Stress, MPa UTS, MPa Elongation at break, % Brinell Hardness
73 325 470 20 137

16
Figure 7. Geometry of the CT specimen in accordance with ASTM standard [73].
Figure 8. Imaging configuration for DIC.
An 8-bit 2452×2052 pixels CCD camera with the maximum frame rate at full resolution
of 12 was used for taking images. Fields of view between 0.98×0.82 mm2 and 13.5×11.3 mm2
were imaged with a combination of a macro Navitar lens and an adaptor tube (see Fig. 8). In
order to acquire a sufficient number of images (38 images per cycle), the loading rate was
reduced to 0.1 Hz while capturing the images. Vic-Snap software [74] has been utilised for
capturing the images and the corresponding applied load on the specimen for each image. Step
size (the distance between two consecutive displacement vectors) was set to 1/4 of the subset
size in order to achieve independent and non-repetitive data. A high-order interpolation scheme
of optimized 8-tap spline was used to achieve sub-pixel accuracy. The correlation criterion was
set to the zero-normalized sum of squared differences which is insensitive to offset and scale
in lighting [16].

17
DIC test was done in different subset sizes ranging from 13 to 199 pixels for two different
magnifications of 0.75× and 0.35×. The obtained displacement data was then fitted into
Williams' series [19]:
𝑀𝑜𝑑𝑒 𝐼
{
𝑢𝐼 =∑
𝑟𝑛2
2𝜇𝑎𝑛 {[𝜅 +
𝑛
2+ (−1)𝑛] 𝑐𝑜𝑠
𝑛𝜃
2−𝑛
2𝑐𝑜𝑠
(𝑛 − 4)𝜃
2}
∞
𝑛=1
𝑣𝐼 = ∑𝑟𝑛2
2𝜇𝑎𝑛 {[𝜅 −
𝑛
2− (−1)𝑛] 𝑠𝑖𝑛
𝑛𝜃
2+𝑛
2𝑠𝑖𝑛
(𝑛 − 4)𝜃
2}
∞
𝑛=1 }
(6)
𝑀𝑜𝑑𝑒 𝐼𝐼
{
𝑢𝐼𝐼 = −∑
𝑟𝑛2
2𝜇𝑏𝑛 {[𝜅 +
𝑛
2+ (−1)𝑛] 𝑠𝑖𝑛
𝑛𝜃
2−𝑛
2𝑠𝑖𝑛
(𝑛 − 4)𝜃
2}
∞
𝑛=1
𝑣𝐼𝐼 =∑𝑟𝑛2
2𝜇𝑏𝑛 {[𝜅 −
𝑛
2+ (−1)𝑛] 𝑐𝑜𝑠
𝑛𝜃
2+𝑛
2cos
(𝑛 − 4)𝜃
2}
∞
𝑛=1 }
(7)
where and are horizontal and vertical displacements in mode I and mode II, is the
shear modulus and for plane stress and for plane strain condition,
is the Poisson's ratio, r and θ are radial and phase distance from the crack, an is constant.
Displacement field can be written in a matrix form by defining fn,m(r,θ), gn,m(r,θ), hn,m(r,θ), and
ln,m(r,θ) as follows:
{
𝑢1⋮𝑢𝑚𝑣1⋮𝑣𝑚}
=
[ 𝑓1,1⋯𝑓𝑛,1
⋮𝑓1,𝑚…𝑓𝑛,𝑚ℎ1,1⋯ℎ𝑛,1
⋮ℎ1,𝑚…ℎ𝑛,𝑚
𝑔1,1⋯𝑔𝑛,1⋮
𝑔1,𝑚…𝑔𝑛,𝑚𝑙1,1⋯𝑙𝑛,1
⋮𝑙1,𝑚… 𝑙𝑛,𝑚 ]
{
𝑎1⋮𝑎𝑛𝑏1⋮𝑏𝑚}
(8)
𝑓𝑛,𝑚 =𝑟𝑚
𝑛2
2𝜇{[𝜅 +
𝑛
2+ (−1)𝑛] cos
𝑛θ𝑚2
−𝑛
2 𝑐𝑜𝑠
(𝑛 − 4)𝜃𝑚2
}
𝑔𝑛,𝑚 =−𝑟𝑚
𝑛2
2𝜇{[𝜅 +
𝑛
2− (−1)𝑛] sin
𝑛θ𝑚2
−𝑛
2 𝑠𝑖𝑛
(𝑛 − 4)𝜃𝑚2
}
ℎ𝑛,𝑚 =𝑟𝑚
𝑛2
2𝜇{[𝜅 −
𝑛
2− (−1)𝑛] sin
𝑛θ𝑚2
+𝑛
2 𝑠𝑖𝑛
(𝑛 − 4)𝜃𝑚2
}
𝑙𝑛,𝑚 =𝑟𝑚
𝑛2
2𝜇{[𝜅 −
𝑛
2+ (−1)𝑛] cos
𝑛θ𝑚2
+𝑛
2 𝑐𝑜𝑠
(𝑛 − 4)𝜃𝑚2
}
(9)
Iu Iv
)1/()3( vv +−= 43−=

18
Eqs. 6 and 7 can be written in terms of the SIF and T-stress as follows [21]:
𝑢 =𝐾𝐼2𝜇√𝑟
2𝜋𝑐𝑜𝑠
𝜃
2(𝜅 − 1 + 2 𝑠𝑖𝑛2
𝜃
2) +
𝐾𝐼𝐼2𝜇√𝑟
2𝜋𝑠𝑖𝑛
𝜃
2(𝜅 + 1 + 2 𝑐𝑜𝑠2
𝜃
2)
+𝑇
8𝜇𝑟(𝜅 + 1) 𝑐𝑜𝑠 𝜃
(10)
𝑣 =𝐾𝐼2𝜇√𝑟
2𝜋𝑠𝑖𝑛
𝜃
2(𝜅 + 1 − 2 𝑐𝑜𝑠2
𝜃
2) −
𝐾𝐼𝐼2𝜇√𝑟
2𝜋𝑐𝑜𝑠
𝜃
2(𝜅 − 1 − 2 𝑐𝑜𝑠2
𝜃
2)
+𝑇
8𝜇𝑟(𝜅 − 3) 𝑠𝑖𝑛 𝜃
(11)
It can be shown that
21aK I = , 21bK II −= , 24aT =
where KI and KII are the mode I and II of the SIF, respectively, and T represents T-stress. The
effects of adding non-singular terms [75] (up to 10 terms) in Williams' solution was also
explored.
The results were then validated by comparison with nominal SIF solution (KI nom) [76].
Since nominal values do not include any closure effect, care was taken to generate results with
as little influence as possible from closure-related mechanisms. To this end, ΔKI and load ratio
were higher during the cycles used for evaluating the SIF than during the pre-cracking process.
[77].
The accuracy of experimental results was then examined through the δ parameter defined
as follows:
(12)
where KI exp is evaluated with equation (1) and KI nom is computed from [76]. Low δ indicates
more accurate estimations of KI.
In order to evaluate the effect of the AOI position, λ is defined as:
(13)
100nom
nomexp
−=
I
II
K
KK
100=L
ain

19
where ain is the length of a part of the crack inside AOI and L represents the longitude length
of the AOI.
To study the effect of the size of the AOI on the estimation of SIFs, six different AOIs in
a constant FOV were analysed (Fig. 9). Minimum required data points in an AOI of 1 × 1 mm2
for an estimation error less than 10% (δ) is also examined.
Figure 9.The difference between FOV and AOI. The FOV is the size of the whole image. Six different AOIs are
defined within the FOV when λ = 50%.SIF monitoring:
3.2. SIF monitoring by DIC
The experiment of this part is similar to the previous part, except for the loading sequences
in which the cyclic loads were applied in a ramp wave form with load ratio of 0.3 with five
different applied nominal ΔKI of 10, 15, 20, 25 and 30 MPa√m. At the end of cyclic loads, the
load was increased constantly until the sudden fracture of the sample occurs under load control.
Fig. 10, shows the schematic of the loading sequences.
20
Figure 10. Schematic of loading sequences.
3.3. Biaxial experiment
In the third part of this work, crack propagation in a low carbon steel (St-52-3N) was
studied by using DIC. Fig. 11, illustrates the microstructure of the material obtained by optical
microscope which shows the ferrite and pearlite bands [78]. The mechanical properties of the
alloy are given in Table 3. A schematic of the geometry is shown in Fig. 12.
Table 3. Monotonic properties of St-52-3N steel.
Yield stress, σy 386 MPa
Ultimate tensile stress, σu 639 MPa
Young's modulus, E 206 GPa
Shear Modulus 78 GPa
21
Figure 11. The microstructure of St52-3N steel. Black and white vertical bands are showing the pearlite and ferrite
bands, respectively[78].
Figure 12. The geometry of the hollow cylinder specimen with a central hole. All dimensions are in mm.
An MTS 809 servo-hydraulic loading rig coupled by a biaxial extensometer Epsilon 3550
was used to apply biaxial loads under stress control mode in a similar way to previous works
[79,80]. In-phase cyclic sinus signal with axial load ratio of 0.1 (Ra = 0.1) and torsional load
ratio of -1 (Rt = -1) was applied in air at room temperature. A hole with a diameter of about
0.35 mm was drilled in the outer surface of the specimen in order to enforce the crack to
nucleate inside the FOV (Fig. 12).

22
In order to study the effect of the overload (OL) on the crack propagation behaviour, single
OL cycle (∆σOL, ∆τOL) was applied on specimens on the half of the final crack length with the
axial and torsional load ratio of 0.1 and -1, respectively. Tests were performed under two
different baseline loads. Single OL cycles of 40% and 100% were applied on S2 and S4 samples
respectively. The secant method recommended in ASTM standard [73] has been employed to
examine the rate of the fatigue crack growth. Table 4 shows the loading condition for samples
with and without OL.
Table 4. Axial and shear stress values for specimens with and without OL cycle.
Specimen Crack length at OL (μm) ∆σ (MPa) ∆τ (MPa) ∆σOL (MPa) ∆τOL (MPa)
S1 - 216 277 - -
S2 669 216 277 302.4 388
S3 - 162 230 - -
S4 689 162 230 324 460
In addition, to evaluate the closure level, near tip COD was measured by DIC [62,81]. Fig
13 shows the positions of the virtual extensometer and crack initiation angle for S2 sample as
an example.
Figure 13. The position of virtual extensometers for COD examination. The white bold mark shows the crack-tip
position.
23
The effect of single OL was studied by observing the evolution of the crack length versus
the number of cycles. Fig. 14 shows how applying a single OL cycle can affect the crack growth
behaviour for two different baseline loads. Fig. 14.a, shows that high loads produced lives of
58000 and 66000 cycles for the specimens with no OL (S1) and with OL (S2), respectively.
Fig. 14.b, shows that low loads produced lives of 136000 and 138000 cycles for the specimens
with no OL (S3) and with OL (S4), respectively. The crack growth rate is plotted as a function
of crack length in Fig. 15. The overall higher da/dN values in Fig. 15.a than in Fig.15.b indicate
that growth rates observed in high load tests are on average 8 times faster than rates in low load
tests.
Figure 14.. Evolution of crack length versus number of cycles for samples with and without OL cycle, a) samples S1
and S2 under higher cyclic loads, b) samples S3 and S4 under lower cyclic loads.
a
b

24
Figure 15. Crack growth rate as a function of the crack length for high (a) and low (b) baseline cyclic load.
The displacement field were extracted by DIC with the similar parameters as for previous
experiment. By taking to account the size of the AOI (0.4 ×0.4 mm2), two terms in the Williams'
solution were used as suggested in [82].
In order to extract the vertical and the horizontal displacements with respect the axial
loading axis, captured images have been rotated so that the crack appears horizontal in all
a
b

25
images. Fig. 16, illustrates the vertical displacement contour for an AOI around a crack with a
length of 0.689 mm (sample S2). The images were rotated 37° clockwise so that the crack line
was horizontal [59]. Displacement data points inside an area of 0.4×0.4 mm2 were extracted
and fitted to Williams' solution in order to calculate SIFs.
Figure 16. The position of the AOI for deriving the displacement field ahead of a crack with the length of 0.669 mm
after 53500 cycles (sample S2). The image has been rotated, so that the crack line becomes horizontal.
The COD was also evaluated from the DIC data. A post processing routine was developed
to measure the COD with a virtual extensometer as follows:
topbot vvxCOD −=)( (14)
where v is the vertical displacement and x is the distance of the extensometer behind the crack-
tip (here x = 60 μm). The subscripts “top” and “bot” refer to the position of the virtual
extensometer points relative to the crack line. The compliance based algorithm proposed by
Skorupa et al. [83] has been utilised to study the fatigue crack closure in this paper. This method
has been used by other authors for characterising fatigue crack closure using local compliance
measurements [84].

26
4. Results and discussion
4.1. Optimizing DIC parameters for SIF measurement
In the first part of the experiments, the experimental parameters of DIC method for
evaluation of the SIF were examined. It was observed that by increasing the subset size from
13 to 200 pixels (FOV = 6 × 6 mm2), the E (standard Deviation Confidence Interval) decreased
while the error of SIF estimation (δ) increased steadily. Increasing δ as a result of enlarging
the subset size is probably due to the low resolution in the displacement field in the crack-tip
region, where large gradients occur.
It was also observed that omitting or considering the crack tip plastic zone in the post-
processing step does not have a considerable effect on the estimation of SIF. This behaviour
can be explained by noting that, unlike with stress field, there is no singularity at the crack-tip
for displacement field [85].
To study the effect of the area where displacement data are collecting relative to the crack
tip position, the λ parameter was introduced in section 2. The results of estimating the SIF for
different λ parameters and different FOVs are summarised in Fig. 17. The curves corresponding
to different FOVs show a minimum in δ for λ parameter of 25%. That is, for all FOVs, the best
results are obtained when the crack-tip is included in the AOI and crack extends over one fourth
of the FOV.

27
Figure 17. The behaviour of δ as a function of λ for different FOVs. Nine terms in Williams' expansion were used in
all cases.
The next parameter that will be studied is the size of the FOV. It was observed that beyond
FOV larger than 4 mm, more terms of Williams expansion are required to obtain good
estimations. This behaviour is logical since higher order terms are required for describing
accurately large crack-tip fields.
The effect of selecting different sizes of AOI in a large FOV was also investigated and it
was observed that using a small AOI (even one-tenth of the FOV) will result in the same
accuracy as using small FOV by utilising high magnification lenses. One of the advantages of
using small AOI is the fewer number of data points required to be analysed.
This observation suggests that the system of equations solved to evaluate the SIF is
excessively and unnecessarily over-determined. The degree of over-determination in the multi-
point over-deterministic method can be studied through the parameter φ, defined as:
seriesintermsofnumber
pointsdataofnumber= (15)
Fig. 18 shows the accuracy of SIF estimation for different values of φ.

28
Figure 18. Effect of reducing data points in an AOI of 4 × 4 mm2 where λ = 25%. φ is defined as the number of data
points used in the analysis divided by the number of terms in the series. Note the logarithmic scale in φ scale.
It can be seen the value of δ remains stable as long as φ > 15. Fig. 18 also shows that
decreasing φ from 1.1 to 0.7 (or reducing the data points from 11 to 7) made a drastic increase
in δ from 3.74% to 400% for calculations based on 10 terms. Very similar trends were also
observed for other FOVs. This analysis suggests that in the optimum condition (λ = 25%, FOV
> 4 × 4 mm2), reliable SIF estimations (δ < 4%) can be obtained as long as φ > 15.
4.2. SIF monitoring by DIC
In this part of the experiment, the displacement field ahead of a fatigue crack was
monitored continuously by DIC method. Five terms in Williams' expansion were used to
describe the crack tip field because no further improvement in the fitting of experimental to
analytical displacement data observed by considering more than five terms.
In order to evaluate the ability of the proposed method to be used for in-service
applications, continuous monitoring of the SIF is studied. It was observed that by increasing
the applying load amplitude, the experimental ΔK always overestimates the nominal values
(ΔKnom). The difference becomes more significant for higher loads. This behaviour can be
attributed to the development of the plastically deformed zone at the crack tip. To compensate

29
the effect of plasticity at the nominally evaluated SIF, Irwin's approach [86] was used. To this
end, the crack tip was located at the centre of the plastic zone. In other words, the crack length
was computed as the sum of crack length (a) with the half of the plastic zone (ry):
𝑎𝑐𝑜𝑟𝑟 = 𝑎 + 𝑟𝑦 (16)
where
𝑟𝑦 = 1
2𝜋(𝐾𝐼𝜎𝑦𝑠)2 (17)
Accordingly, the nominal SIF was recalculated by replacing the crack length with the
corrected crack length (𝑎𝑐𝑜𝑟𝑟) [87,88]. Fig. 19, shows how crack length correction can
significantly improve the accuracy of the nominal SIF evaluation for higher loads, while it has
a negligible effect at low ΔK. For example, for ΔK = 30 MPa√m the value of δ is reduced by
24.6%, 23.6% and 23.2% for AOIs of 10×10, 15×15 and 20×20 mm2, respectively. The
plasticity correction has reduced the value of δ at AOI = 20 × 20 mm2 by 7.9%, 14.9% and
23.2% for applied ΔK of 20, 25 and 30 MPa√m, respectively. The higher value of δ at ΔK=10
MPa√m rather ΔK=15 MPa√m can be attributed to the poorer noise to signal ratio at lower
applied loads.
Figure 19. Evolution of δ by increasing ΔKnom for different sizes of AOI in mm.

30
Fig. 20, shows the evolution of SIFs as a function of the applied load during the last loading
segment, leading to the fracture of the sample. It can be observed that by increasing the load,
the difference between the experimental and nominal SIF becomes more significant. The graph
in Fig. 20 shows a very good fit between ΔKexp and ΔKcorr up to the ΔK≈42 MPa√m where
there is a linear relation between SIF and load range (ΔP). Thereafter, ΔKexp surges upward
while ΔKnom keeps increasing linearly. Sudden fracture happened just after the last
measurement point (top-right photograph in Fig. 20). Considering the load ratio of 0.3, at the
deviation point, the Kmax is about 55 MPa√m (ΔK≈42 MPa√m). It is interesting that this value
is in good agreement with the estimated Kc by Newman et al. [89] for a sample with similar
geometry and thickness. This suggests that the point at which ΔK deviates from the linear
behaviour can be used to estimate the critical SIF for this thickness. The higher value for
measured critical SIF rather the fracture toughness of this material can be attributed to thinner
thickness of the sample in comparison with standard sample for fracture toughness test [90].
Figure 20. Continuous evaluation of ΔK as a function of applied load at the last loading segment, leading to sudden
fracture of the sample.
4.3. Biaxial experiment
The capability of the proposed hybrid method for studying the crack state under complex
loading condition was evaluated by studying a crack under tension-torsion cyclic loads which
experienced an OL cycle.

31
The evolution of COD during a complete cycle (loading and unloading) at 60 μm behind
the crack-tip for different crack lengths in all samples is shown in Fig. 21. For the specimens
not subjected to OL, the maximum COD in a cycle increases steadily with the crack length
(Figs. 21.a and c). There is a more drastic increment as the crack grows in the COD for high
baseline load (Fig. 21.a) than for the low baseline load (Fig. 21.c), as one would expect.
The effect of applying an OL cycle on COD behaviour of samples can be seen in Fig. 21b
and d. It can be seen that 40% OL in sample S2, produced a reduction in the maximum COD
by the end of the test of 64% while 100 % OL cycle in fample S4 produced only 38% reduction
in COD.
Figure 21. COD behaviour during loading and unloading cycle for different crack lengths of specimens. The number of
cycles before and after OL where OL cycle was considered as 0 cycles, are shown in the graph b.
A summary of the opening load estimated following the procedure described in previous
section is shown in Table 5. It can be seen that Pop for S1 is 19% of the Pmax, whereas Pop for
S2 sample, which has experienced an OL cycle, is 27% of the Pmax. Regarding samples S3 and
S4 which were tested under a lower baseline load, the OL cycle only increased Pop slightly at
b a
d c

32
the longest crack length. The Pop increment induced by the OL is larger for low loads than for
high loads (Table 5). This agrees well with the change that the OL produces in the growth rate
(Fig. 14). The difference between the OL and the non-OL curves in crack growth rate is larger
for low loads (Fig. 15.a) than for high loads (Fig. 15.b). Thus, crack growth rate data correlate
satisfactorily with opening loads.
Table 5. Crack opening loads in a complete cycle.
Sample Pop/Pmax
S1 0.19
S2 0.27
S3 0.29
S4 0.31
Table 6 shows the evaluated SIFs and corresponding CODmax for two different crack
lengths on each sample. It can be seen that ∆KI and ∆KII increase as the crack grows from 0.682
mm to 1.053 mm for sample S1 and from 0.675 mm to 1.045 mm for sample S3. Figs. 21.b and
21.d show that applying an OL reduces the COD values, as long as the crack is within the
retardation stage. The small differences in the trend of ∆KI and ∆KII values are probably due
to the crack changing its orientation through the experiment [78] as a consequence of crack-tip
plasticity [91,92], loading direction and microstructure.
Table 6. Summary of the SIFs estimated for different samples and different crack lengths
Specimen Crack length (mm) CODmax (μm) ∆KI (MPa√m) ∆KII (MPa√m)
S1 0.682 2.1 13.2 24.5
1.053 6.3 36.8 40.0
S2 0.669 2.0 13.1 20.4
1.057 0.7 15.6 25.3
S3 0.678 1.9 11.8 0.2
1.045 2.4 19.7 0.3
S4 0.689 1.9 11.9 1.6
1.075 1.8 14.0 3.7

33
5. Conclusions
In this work, the efficacy of a proposed hybrid method for evaluation of SIF was examined
by performing different experiments. The proposed method is based on multi-parameter
fracture mechanics where full-field experimental displacement data are captured. The
experimental information is measured in the region surrounding the tip of a fatigue crack and
then fitted to an analytical displacement field (Williams' series). Finally, the SIFs were
estimated using a multipoint over deterministic method. In the first experiment, the effect of
some experimental variables on KI estimation using DIC was examined based on an elastic
mode I. It was shown that the accuracy of KI can be affected not only by the well-known
variables such as subset size in DIC and considered number of Williams' series but also by the
size and position of AOI. Experimental results indicate the significant effect of the position of
the AOI for accurate estimation of SIF with DIC technique. It was shown that including a part
of the crack length inside the AOI (crack extending to one-fourth of the AOI) provides the best
estimations for all FOVs. Finally, it was also shown that reliable estimations of the KI can be
achieved as long as the number of displacement vectors fitted to the model is 15 times larger
than the number of terms in the series.
In a similar manner, the evolution of SIF was monitored by DIC method in a separate
experiment. The results showed that the Irwin's approach that modifies the crack length to
account for crack tip plasticity improves noticeably the SIF estimations. Continuous
measurement of the SIF at the final loading stage to fracture of the sample showed a deviation
from the linear relation between the load and the experimental SIF. Based on a previous work,
this deviation might be related to the critical SIF for the thickness studied. Since either the
experimental method or corrected theoretical method are based on LEFM, the validity of the
results in this range should be assessed with a parameter like J-integral. Nevertheless, further
research is currently in progress to better understand the physics behind such deviation.
The capability of the proposed method for capturing the SIF of a crack under more
complex loading condition was also assessed. In addition, the effect of applying OL cycle on
the behaviour of a crack under cyclic biaxial loading is studied with DIC technique. It is
observed that applying 100% OL on a sample under low cyclic loads, delayed the appearance
of the retardation stage. COD examinations shows the classical sequences of OL, including
acceleration and retardation. The hybrid method was also used for studying the biaxial fatigue

34
cracks. This allowed the mixed-mode SIF (∆KI and ∆KII) to be estimated on samples under
different load levels, with and without applying OL. Results showed that a slower increment
in ∆KI as the crack grows for the OL case, compared to the non-OL case.
The results of three experiments proved the reliability and capability of the hybrid method
for evaluation of SIFs not only for simple uniaxial conditions, but also for more complex
biaxial loading conditions. The suggested recommendations for selecting the experimental DIC
parameters can be used by researchers and engineers for improving the accuracy and stability
of SIF measurement using DIC technique. The SIF monitoring experiment showed the
capability of the method for in-service application, when evolution of the SIF needs to be
measured continuously.

35
References
[1] T.L. Anderson, Fracture Mechanics, Fundamentals and Applications, 4th ed., CRC
Press, Boca Raton, FL, USA., 2017.
[2] S. Suresh, Fatigue of Materials, 2nd ed., Cambridge University Press, New York, 1998.
[3] K. Ramesh, S. Gupta, A.A. Kelkar, Evaluation of stress field parameters in fracture
mechanics by photoelasticity - revisited, Eng. Fract. Mech. 56 (1997) 25-41 and 43-45.
[4] F.A. Díaz, J.R. Yates, E.A. Patterson, Some improvements in the analysis of fatigue
cracks using thermoelasticity, Int. J. Fatigue. 26 (2004) 365–376.
doi:10.1016/j.ijfatigue.2003.08.018.
[5] D. Nowell, R.J.H. Paynter, P.F.P. De Matos, Optical methods for measurement of
fatigue crack closure: moiré interferometry and digital image correlation, Fatigue Fract.
Eng. Mater. Struct. 33 (2010) 778–790. doi:10.1111/j.1460-2695.2010.01447.x.
[6] S.R. McNeill, W.H. Peters, M.A. Sutton, Estimation of stress intensity factor by digital
image correlation, Eng. Fract. Mech. 28 (1987) 101–112. doi:10.1016/0013-
7944(87)90124-X.
[7] J. Smith, M.N. Bassim, C.D. Liu, T.M. Holden, Mesurement of crack tip strains using
neutron difraction, Eng. Fract. Mech. 52 (1995) 843–851.
[8] P. Lopez-Crespo, P.J. Withers, F. Yusof, H. Dai, a. Steuwer, J.F. Kelleher, T. Buslaps,
Overload effects on fatigue crack-tip fields under plane stress conditions: surface and
bulk analysis, Fatigue Fract. Eng. Mater. Struct. 36 (2013) 75–84. doi:10.1111/j.1460-
2695.2012.01670.x.
[9] S. Yoneyama, A. Kitagawa, S. Iwata, K. Tani, H. Kikuta, Bridge deflection
measurement using digital image correlation, Exp. Tech. 31 (2007) 34–40.
doi:10.1111/j.1747-1567.2007.00132.x.
[10] M.A. Sutton, N. Li, D.C. Joy, A.P. Reynolds, X. Li, Scanning electron microscopy for
quantitative small and large deformation measurements Part I: SEM imaging at
magnifications from 200 to 10,000, Exp. Mech. 47 (2007) 775–787.
doi:10.1007/s11340-007-9042-z.
[11] J.D. Carroll, W. Abuzaid, J. Lambros, H. Sehitoglu, High resolution digital image

36
correlation measurements of strain accumulation in fatigue crack growth, Int. J. Fatigue.
57 (2013) 140–150. doi:10.1016/j.ijfatigue.2012.06.010.
[12] R. Stephens, A. Fatemi, R.R. Stephens, H. Fuchs, Metal Fatigue in Engineering, 2nd ed.,
John Wily & Sons, Inc, New York, 2001.
[13] ASTM E1823-13 Standard Terminology Relating to Fatigue and Fracture Testing, West
Conshohocken, PA, 2013. doi:10.1520/E1823-13.2.
[14] G.R. Irwin, Analysis of stresses and strains near the end of a crack traversing a plate, J.
Appl. Mech. ASME. E24 (1957) 351–369.
[15] P.P. Paris, F.F. Erdogan, A critical analysis of crack propagation laws, ASME. J. Basic
Eng. 85 (1963) 528–533. doi:doi:10.1115/1.3656900.
[16] M.A. Sutton, J.-J. Orteu, H.W. Schreier, Image Correlation for Shape, Motion and
Deformation Measurements, Springer US, New York, 2009. doi:10.1007/978-0-387-
78747-3.
[17] P.F.P. de Matos, D. Nowell, Numerical simulation of plasticity-induced fatigue crack
closure with emphasis on the crack growth scheme: 2D and 3D analyses, Eng. Fract.
Mech. 75 (2008) 2087–2114. doi:10.1016/j.engfracmech.2007.10.017.
[18] H.M. Westergaard, Bearing pressures and cracks, J. Appl. Mech. 61 (1939) A49–A53.
[19] M.L. Williams, On the stress distribution at the base of a stationary crack, J. Appl. Mech.
24 (1957) 109–114. doi:10.1115/1.3640470.
[20] B.S.G. Larsson, A.J. Carlsson, Influence of non-singular stress terms and specimen
geometry on small-scale yielding at crack tips in elastic-plastic materials, J. Mech. Phys.
Solids. 21 (1973) 263–277.
[21] J.R. Yates, M. Zanganeh, Y.H. Tai, Quantifying crack tip displacement fields with DIC,
Eng. Fract. Mech. 77 (2010) 2063–2076. doi:10.1016/j.engfracmech.2010.03.025.
[22] C.J. Christopher, M.N. James, E.A. Patterson, K.F. Tee, Towards a new model of crack
tip stress fields, Int J Fract. 148 (2007) 361–371. doi:10.1007/s10704-008-9209-3.
[23] P. Lopez-Crespo, D. Camas, F.V. Antunes, J.R. Yates, A study of the evolution of crack
tip plasticity along a crack front, Theor. Appl. Fract. Mech. 98 (2018) 59–66.
doi:10.1016/J.TAFMEC.2018.09.012.
[24] R.O. Ritchie, Mechanisms of fatigue crack propagation in metals, ceramics and
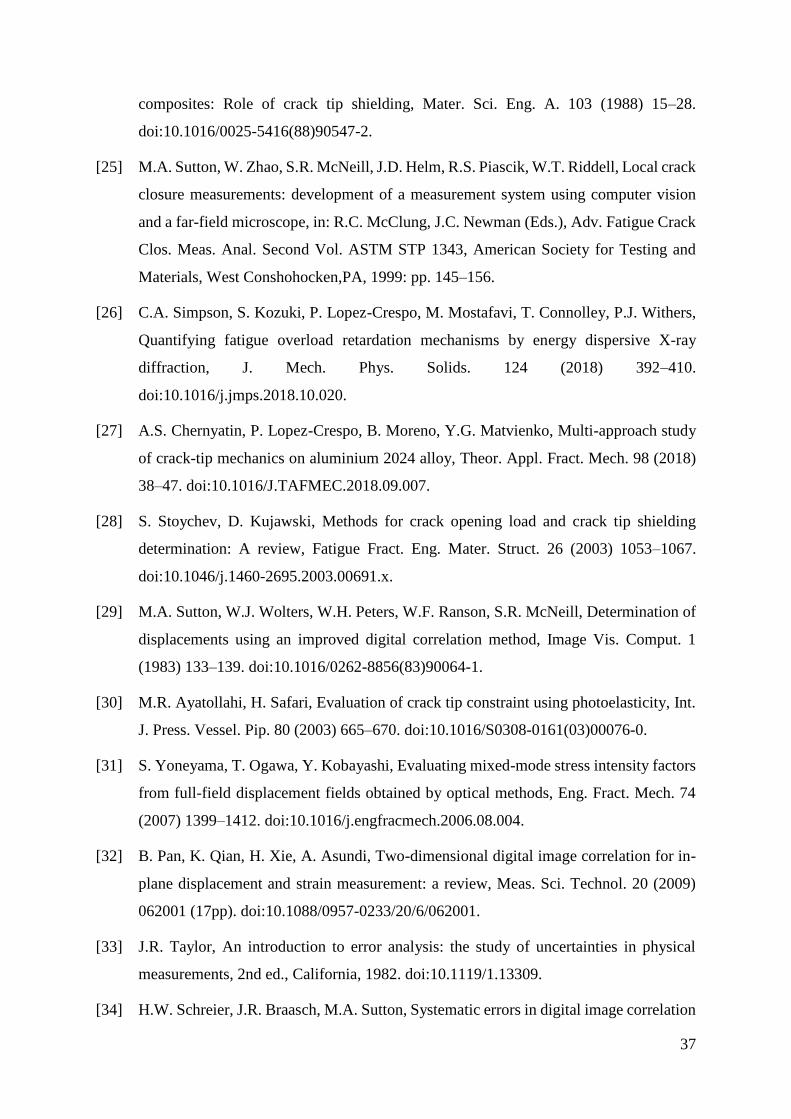
37
composites: Role of crack tip shielding, Mater. Sci. Eng. A. 103 (1988) 15–28.
doi:10.1016/0025-5416(88)90547-2.
[25] M.A. Sutton, W. Zhao, S.R. McNeill, J.D. Helm, R.S. Piascik, W.T. Riddell, Local crack
closure measurements: development of a measurement system using computer vision
and a far-field microscope, in: R.C. McClung, J.C. Newman (Eds.), Adv. Fatigue Crack
Clos. Meas. Anal. Second Vol. ASTM STP 1343, American Society for Testing and
Materials, West Conshohocken,PA, 1999: pp. 145–156.
[26] C.A. Simpson, S. Kozuki, P. Lopez-Crespo, M. Mostafavi, T. Connolley, P.J. Withers,
Quantifying fatigue overload retardation mechanisms by energy dispersive X-ray
diffraction, J. Mech. Phys. Solids. 124 (2018) 392–410.
doi:10.1016/j.jmps.2018.10.020.
[27] A.S. Chernyatin, P. Lopez-Crespo, B. Moreno, Y.G. Matvienko, Multi-approach study
of crack-tip mechanics on aluminium 2024 alloy, Theor. Appl. Fract. Mech. 98 (2018)
38–47. doi:10.1016/J.TAFMEC.2018.09.007.
[28] S. Stoychev, D. Kujawski, Methods for crack opening load and crack tip shielding
determination: A review, Fatigue Fract. Eng. Mater. Struct. 26 (2003) 1053–1067.
doi:10.1046/j.1460-2695.2003.00691.x.
[29] M.A. Sutton, W.J. Wolters, W.H. Peters, W.F. Ranson, S.R. McNeill, Determination of
displacements using an improved digital correlation method, Image Vis. Comput. 1
(1983) 133–139. doi:10.1016/0262-8856(83)90064-1.
[30] M.R. Ayatollahi, H. Safari, Evaluation of crack tip constraint using photoelasticity, Int.
J. Press. Vessel. Pip. 80 (2003) 665–670. doi:10.1016/S0308-0161(03)00076-0.
[31] S. Yoneyama, T. Ogawa, Y. Kobayashi, Evaluating mixed-mode stress intensity factors
from full-field displacement fields obtained by optical methods, Eng. Fract. Mech. 74
(2007) 1399–1412. doi:10.1016/j.engfracmech.2006.08.004.
[32] B. Pan, K. Qian, H. Xie, A. Asundi, Two-dimensional digital image correlation for in-
plane displacement and strain measurement: a review, Meas. Sci. Technol. 20 (2009)
062001 (17pp). doi:10.1088/0957-0233/20/6/062001.
[33] J.R. Taylor, An introduction to error analysis: the study of uncertainties in physical
measurements, 2nd ed., California, 1982. doi:10.1119/1.13309.
[34] H.W. Schreier, J.R. Braasch, M.A. Sutton, Systematic errors in digital image correlation

38
caused by intensity interpolation, Opt. Eng. 39 (2000) 2915–2921.
[35] H.W. Schreier, M.A. Sutton, Systematic errors in digital image correlation due to
undermatched subset shape functions, Exp. Mech. 42 (2002) 303–310.
doi:10.1177/001448502321548391.
[36] L. Yu, B. Pan, The errors in digital image correlation due to overmatched shape
functions, Meas. Sci. Technol. 26 (2015) 045202. doi:10.1088/0957-0233/26/4/045202.
[37] M. Fazzini, S. Mistou, O. Dalverny, L. Robert, Study of image characteristics on digital
image correlation error assessment, Opt. Lasers Eng. 48 (2010) 335–339.
doi:10.1016/j.optlaseng.2009.10.012.
[38] B. Pan, Reliability-guided digital image correlation for image deformation
measurement, Appl. Opt. 48 (2009) 1535–1542. doi:10.1364/AO.48.001535.
[39] J.M. Vasco-Olmo, F.A. Díaz, E.A. Patterson, Experimental evaluation of shielding
effect on growing fatigue cracks under overloads using ESPI, Int. J. Fatigue. 83 (2016)
117–126. doi:10.1016/j.ijfatigue.2015.10.003.
[40] F. Berto, P. Lazzarin, On higher order terms in the crack tip stress field, Int. J. Fract. 161
(2010) 221–226. doi:10.1007/s10704-010-9443-3.
[41] F. Berto, P. Lazzarin, Multiparametric full-field representations of the in-plane stress
fields ahead of cracked components under mixed mode loading, Int. J. Fatigue. 46 (2013)
16–26. doi:10.1016/j.ijfatigue.2011.12.004.
[42] M.Y. Dehnavi, S. Khaleghian, A. Emami, M. Tehrani, N. Soltani, Utilizing digital image
correlation to determine stress intensity factors, Polym. Test. 37 (2014) 28–35.
doi:10.1016/j.polymertesting.2014.04.005.
[43] W.H. Peters, W.F. Ranson, J.F. Kalthoff, S.R. Winkler, A study of dynamic near-crack-
tip fracture parameters by digital image analysis, J. Phys. Colloq. 46 (1985) C5-631-C5-
638. doi:10.1051/jphyscol:1985581.
[44] R. Hamam, F. Hild, S. Roux, Stress intensity factor gauging by digital image correlation:
Application in cyclic fatigue, Strain. 43 (2007) 181–192. doi:10.1111/j.1475-
1305.2007.00345.x.
[45] S. Roux, J. Réthoré, F. Hild, Recent progress in digital image correlation: from
measurement to mechanical identification, J. Phys. Conf. Ser. 135 (2008) 012002.

39
doi:10.1088/1742-6596/135/1/012002.
[46] F. Yusof, P.J. Withers, Real-time acquisition of fatigue crack images for monitoring
crack-tip stress intensity variations within fatigue cycles, J. Strain Anal. Eng. Des. 44
(2008) 149–158. doi:10.1243/03093247JSA440.
[47] P. Lopez-Crespo, A. Shterenlikht, J.R. Yates, E.A. Patterson, P.J. Withers, Some
experimental observations on crack closure and crack-tip plasticity, Fatigue Fract. Eng.
Mater. Struct. 32 (2009) 418–429. doi:10.1111/j.1460-2695.2009.01345.x.
[48] D. Wagner, N. Ranc, C. Bathias, P.C. Paris, Fatigue crack initiation detection by an
infrared thermography method, Fatigue Fract. Eng. Mater. Struct. 33 (2009) 12–21.
doi:10.1111/j.1460-2695.2009.01410.x.
[49] A. Maslouhi, Fatigue crack growth monitoring in aluminum using acoustic emission and
acousto‐ultrasonic methods, Struct. Control Heal. Monit. 18 (2011) 790–806.
doi:10.1002/stc.478.
[50] V. Zilberstein, D. Grundy, V. Weiss, N. Goldfine, E. Abramovici, J. Newman, T.
Yentzer, Early detection and monitoring of fatigue in high strength steels with MWM-
Arrays, Int. J. Fatigue. 27 (2005) 1644–1652. doi:10.1016/j.ijfatigue.2005.07.028.
[51] R. Hamia, C. Cordier, C. Dolabdjian, Eddy-current non-destructive testing system for
the determination of crack orientation, NDT&E Int. 61 (2014) 24–28.
doi:10.1016/j.ndteint.2013.09.005.
[52] H. Nakazawa, K. Hirano, Ultrasonic monitoring techniques of crack growth and fracture
mechanics evaluation of materials, Jpn. J. Appl. Phys. 23 (1984) 12–16.
[53] ASTM E1685-13, Standard practice for measuring the change in length of fasteners
using the ultrasonic pulse-echo technique, in: ASTM International, West Conshohocken,
PA, 2013. doi:https://doi.org/10.1520/E1685.
[54] J. Cuadra, P.A. Vanniamparambil, K. Hazeli, I. Bartoli, A. Kontsos, A hybrid optico-
acoustic NDE approach for deformation and damage monitoring, in: J. Kag, D.
Jablonski, D. Dudzinski (Eds.), Eval. Exist. New Sens. Technol. Fatigue, Fract. Mech.
Testing, STP 1584, ASTM International, West Conshohocken,PA, 2015: pp. 135–146.
doi:10.1520/STP158420140051.
[55] V.N. Whittaker, A review of non-destructive measurement of flaw size, Non-
Destructive Test. 5 (1972) 92–100. doi:10.1016/0029-1021(72)90101-6.

40
[56] P. Gao, C. Wang, Y. Li, Z. Cong, Electromagnetic and eddy current NDT in weld
inspection: A review, Insight Non-Destructive Test. Cond. Monit. 43 (2015) 337–345.
doi:10.1784/insi.2015.57.6.337.
[57] C.B. Scruby, An introduction to acoustic emission, J. Phys. E. 20 (1987) 946–953.
doi:10.1088/0022-3735/20/8/001.
[58] Y. Du, F. Díaz, R. Burguete, E.A. Patterson, Evaluation using digital image correlation
of stress intensity factors in an aerospace panel, Exp. Mech. 51 (2011) 45–57.
doi:10.1007/s11340-010-9335-5.
[59] P. Lopez-Crespo, A. Shterenlikht, E.A. Patterson, J.R. Yates, P.J. Withers, The stress
intensity of mixed mode cracks determined by digital image correlation, J. Strain Anal.
Eng. Des. 43 (2008) 769–780. doi:10.1243/03093247JSA419.
[60] M. Zanganeh, P. Lopez-Crespo, Y.H. Tai, J.R. Yates, Locating the crack tip using
displacement field data: a comparative study, Strain. 49 (2013) 102–115.
doi:10.1111/str.12017.
[61] S. Yoneyama, S. Arikawa, S. Kusayanagi, K. Hazumi, Evaluating J-integral from
displacement fields measured by digital image correlation, Strain. 50 (2014) 147–160.
doi:10.1111/str.12074.
[62] P.F.P. de Matos, D. Nowell, Experimental and numerical investigation of thickness
effects in plasticity-induced fatigue crack closure, Int. J. Fatigue. 31 (2009) 1795–1804.
doi:10.1016/j.ijfatigue.2008.12.003.
[63] D. Camas, P. Lopez-Crespo, A. Gonzalez-Herrera, B. Moreno, Numerical and
experimental study of the plastic zone in cracked specimens, Eng. Fract. Mech. (2017).
doi:10.1016/j.engfracmech.2017.02.016.
[64] F. V. Díaz, G.H. Kaufmann, A.F. Armas, G.E. Galizzi, Optical measurement of the
plastic zone size in a notched metal specimen subjected to low-cycle fatigue, Opt. Lasers
Eng. 35 (2001) 325–333. doi:10.1016/S0143-8166(01)00030-6.
[65] J.M. Vasco-Olmo, M.N. James, C.J. Christopher, E.A. Patterson, F.A. Díaz, Assessment
of crack tip plastic zone size and shape and its influence on crack tip shielding, Fatigue
Fract. Eng. Mater. Struct. 39 (2016) 969–981. doi:10.1111/ffe.12436.
[66] M. Mokhtarishirazabad, P. Lopez-Crespo, M. Zanganeh, Stress intensity factor
monitoring under cyclic loading by digital image correlation, Fatigue Fract. Eng. Mater.

41
Struct. (2018). doi:10.1111/ffe.12825.
[67] R.J. Sanford, J.W. Dally, A general method for determining mixed-mode stress intensity
factors from isochromatic fringe patterns, Eng. Fract. Mech. 11 (1979) 621–633.
doi:10.1016/0013-7944(79)90123-1.
[68] J. Réthoré, a. Gravouil, F. Morestin, a. Combescure, Estimation of mixed-mode stress
intensity factors using digital image correlation and an interaction integral, Int. J. Fract.
132 (2005) 65–79. doi:10.1007/s10704-004-8141-4.
[69] P. López-Crespo, R.L. Burguete, E.A. Patterson, A. Shterenlikht, P.J. Withers, J.R.
Yates, Study of a crack at a fastener hole by digital image correlation, Exp. Mech. 49
(2009) 551–559. doi:10.1007/s11340-008-9161-1.
[70] M. Sander, H. Richard, Experimental and numerical investigations on the influence of
the loading direction on the fatigue crack growth, Int. J. Fatigue. 28 (2006) 583–591.
doi:10.1016/j.ijfatigue.2005.05.012.
[71] P. Lopez-Crespo, M. Mostafavi, A. Steuwer, J.F. Kelleher, T. Buslaps, P.J. Withers,
Characterisation of overloads in fatigue by 2D strain mapping at the surface and in the
bulk, Fatigue Fract. Eng. Mater. Struct. 39 (2016) 1040–1048. doi:10.1111/ffe.12463.
[72] M. Mokhtarishirazabad, P. Lopez-Crespo, B. Moreno, A. Lopez-Moreno, M. Zanganeh,
Optical and analytical investigation of overloads in biaxial fatigue cracks, Int. J. Fatigue.
100 (2017) 583–590. doi:10.1016/j.ijfatigue.2016.12.035.
[73] ASTM E647-15e1 Standard Test Method for Measurement of Fatigue Crack Growth
Rates, ASTM International, West Conshohocken, PA, 2015. doi:10.1520/E0647-
15E01.2.
[74] Vic-2D software. Correlated Solutions Incorporated (C.S.Inc)
<http://www.correlatedsolutions.com>, (n.d.).
[75] S. Seitl, L. Malíková, V. Růžička, B. Moreno, P. Lopez-Crespo, Williams' expansion-
based approximation of the displacement field in an Al 2024 compact tension specimen
reconstructed from optical measurements, Fatigue Fract. Eng. Mater. Struct. 41 (2018)
2187–2196. doi:10.1111/ffe.12842.
[76] Y. Murakami, Stress Intensity Factors Handbook, Oxford: Pergamon Press, 1987.
[77] S. Beretta, S. Rabbolini, A.D. Bello, Multi-scale crack closure measurement with digital

42
image correlation on Haynes 230, Frat. Ed Integrità Strutt. 33 (2015) 174–182.
doi:10.3221/IGF-ESIS.33.22.
[78] P. Lopez-Crespo, B. Moreno, A. Lopez-Moreno, J. Zapatero, Study of crack orientation
and fatigue life prediction in biaxial fatigue with critical plane models, Eng. Fract. Mech.
136 (2015) 115–130. doi:10.1016/j.engfracmech.2015.01.020.
[79] P. Lopez-Crespo, A. Garcia-Gonzalez, B. Moreno, A. Lopez-Moreno, J. Zapatero, Some
observations on short fatigue cracks under biaxial fatigue, Theor. Appl. Fract. Mech. 80
(2015) 96–103. doi:10.1016/j.tafmec.2015.05.004.
[80] P. Lopez-Crespo, B. Moreno, A. Lopez-Moreno, J. Zapatero, Characterisation of crack-
tip fields in biaxial fatigue based on high-magnification image correlation and electro-
spray technique, Int. J. Fatigue. 71 (2015) 17–25. doi:10.1016/j.ijfatigue.2014.02.016.
[81] F. Yusof, P. Lopez-Crespo, P.J. Withers, Effect of overload on crack closure in thick
and thin specimens via digital image correlation, Int. J. Fatigue. 56 (2013) 17–24.
doi:10.1016/j.ijfatigue.2013.07.002.
[82] M. Mokhtarishirazabad, P. Lopez-Crespo, B. Moreno, A. Lopez-Moreno, M. Zanganeh,
Evaluation of crack-tip fields from DIC data: A parametric study, Int. J. Fatigue. 89
(2016) 11–19. doi:10.1016/j.ijfatigue.2016.03.006.
[83] M. Skorupa, S. Beretta, M. Carboni, T. Machniewicz, An algorithm for evaluating crack
closure from local compliance measurements, Fatigue Fract. Eng. Mater. Struct. 25
(2002) 261–273. doi:10.1046/j.1460-2695.2002.00444.x.
[84] J.M. Vasco-Olmo, F.A. Díaz, Experimental evaluation of the effect of overloads on
fatigue crack growth by analysing crack tip displacement fields, Eng. Fract. Mech. 166
(2016) 82–96. doi:10.1016/j.engfracmech.2016.08.026.
[85] H.L. Ewalds, R.J.H. Wanhill, Fracture Mechanics, Arnold, London, 1984.
[86] G.R. Irwin, Plastic zone near a crack and fracture toughness, in: Sagamore Ordnance
Mater. Conf., Syracuse University, 1961.
[87] R.H. Heyer, D.E. McCabe, Crack growth resistance in plane-stress fracture testing, Eng.
Fract. Mech. 4 (1972) 413–430. doi:10.1016/0013-7944(72)90054-9.
[88] G.R. Irwin, Linear fracture mechanics, fracture transition, and fracture control, Eng.
Fract. Mech. 1 (1968) 241–257. doi:10.1016/0013-7944(68)90001-5.

43
[89] J.C. Newman, Jr., An evaluation of fracture analysis methods, in: J.C. Newman, Jr., F.J.
Loss (Eds.), ASTM STP 896, American Society for Testing and Materials, Philadelphia,
1985: pp. 5–96.
[90] ASTM E1820-18 Standard Test Method for Measurement of Fracture Toughness, West
Conshohocken, PA, 2018. doi:10.1520/E1820-15A.
[91] P. Lopez-Crespo, S. Pommier, Numerical Analysis of Crack Tip Plasticity and History
Effects under Mixed Mode Conditions, J. Solid Mech. Mater. Eng. 2 (2008) 1567–1576.
doi:10.1299/jmmp.2.1567.
[92] S. Pommier, P. Lopez-Crespo, P.Y. Decreuse, A multi-scale approach to condense the
cyclic elastic-plastic behaviour of the crack tip region into an extended constitutive
model, Fatigue Fract. Eng. Mater. Struct. 32 (2009) 899–915. doi:10.1111/j.1460-
2695.2009.01392.x.

Appendix I:
Published Paper #1
Title: Evaluation of crack-tip fields from DIC data: A parametric study
Authors: M. Mokhtarishirazabad1, P. Lopez-Crespo1, B. Moreno1, A. Lopez-Moreno2, M.
Zanganeh3
1Department of Civil and Materials Engineering, University of Malaga, C/Dr Ortiz Ramos s/n, 29071, Malaga, Spain
2Department of Materials Science and Metallurgy Engineering, University of Jaen, Campus Las Lagunillas, 23071,
Jaen, Spain
3Jacobs Technology, NASA Johnson Space Center, Houston TX, USA
Journal: International Journal of Fatigue, Volume 89, August 2016, Pages 11-19
Impact Factor: 3.132 , Q1 in JCR

Evaluation of crack-tip fields from DIC data: A parametric study
M. Mokhtarishirazabad a, P. Lopez-Crespo a,⇑, B. Moreno a, A. Lopez-Moreno b, M. Zanganeh c
aDepartment of Civil and Materials Engineering, University of Malaga, C/Dr Ortiz Ramos s/n, 29071 Malaga, SpainbDepartment of Materials Science and Metallurgy Engineering, University of Jaen, Campus Las Lagunillas, 23071 Jaen, Spainc Jacobs Technology, NASA Johnson Space Center, Houston, TX, USA
a r t i c l e i n f o
Article history:Received 17 November 2015Received in revised form 27 February 2016Accepted 1 March 2016Available online 7 March 2016
Keywords:Linear elastic fracture mechanicsDigital image correlationStress intensity factorK-dominanceCrack-tip displacement field
a b s t r a c t
In the past two decades, crack-tip mechanics has been studied increasingly using full-field techniques.Within these techniques, Digital Image Correlation (DIC) has been most widely used due to its manyadvantages, to extract important crack-tip information, including Stress Intensity Factor (SIF), crackopening displacement, J-integral, T-stress, closure level, plastic zone size, etc. However, little informationis given in the literature about the experimental setup that provides best estimations for the differentparameters. The current work aims at understanding how the experimental conditions used in DIC influ-ence the crack-tip information extracted experimentally. The influence of parameters such as magnifica-tion factor, the position of the images with respect the crack-tip and size of the subset used in thecorrelation is studied. The influence is studied in terms of SIF by using Williams’ model. In this regard,cyclic loading on a fatigue crack in a compact tension (CT) specimen, made of aluminium 2024-T351alloy, has been applied and the surface deformation around the crack-tip has been examined. The com-parison between nominal and experimental values of KI showed that the effect of subset size on the mea-sured KI is negligible compared to the effect of the field of view and the position of the area of interest.
� 2016 Published by Elsevier Ltd.
1. Introduction
In recent years, there has been a steady increase in the use offull-field techniques to study crack-tip mechanics. Within thesetechniques, Digital Image Correlation (DIC) has been most widelyused due to its many advantages, to extract important crack-tipinformation, including Stress Intensity Factor (SIF) [1], Crack Open-ing Displacement (COD) [2], J-integral [3,4], T-stress [5–7], closurelevel [8–10], plastic zone size [11,12], etc. Due to its industrial rel-evance, a great effort has been put into improving and refining themethodology to extract the SIF from full-field DIC data [1,6,13–17].Experimentally, DIC measurement accuracy can be affected by sev-eral factors, such as subpixel optimization algorithm, subset sizeand image quality [18]. It is evident that the more accurate dis-placement data, the more reliable estimation of SIFs. While therandom error in any measurement is the inherent part of eachmeasurement, systematic error is predictable and is typically con-stant and proportional to the true value [19]. Systematic errors inDIC as a result of intensity interpolation, overmatched andunder-matched subset shape function has been explored by Schre-ier et al. [20,21] and Yu and Pan [22]. A thorough study on the
errors caused by different bit depths of the image, image saturationin respect with subset size, speckle pattern and subset shape func-tion on synthetic images has been conducted by Fazzini et al. [23].It was shown that decreasing the encoding of the images and over-expose of the speckle deteriorate the measurements by a factor of2 and 10 respectively. Pan [24] proposed a reliability-guided DICmethod which is applicable to images with shadows, discontinu-ous areas, and deformation discontinuities.
Crack-tip field information (stress, strain, displacement) can beexpressed in a series form [1]. Multi-point over-deterministicmethod [25] allows one to estimate the SIF by fitting analyticalsolutions such as Westergard’s [26] Williams’ [27], Muskhilishvili’s[28] or Christopher, James and Patterson (CJP) model [29] series tothe experimental data. This methodology has developed over theyears since the first attempt in 1980’s [1,5,15,16]. Early works thatused DIC to estimate the SIF used the least square error analysis toestimate KI for the dynamically impacted three-point specimenmade from Araldite B [30]. Displacement data were adapted froman area of 8 mm2, including crack-tip and region near the openingcrack surface. Higher order terms were included in their estimationuntil reach to the convergence value of KI. Utilising an over-deterministic least square method for evaluating mixed modestress field parameters by the technique of photoelasticity, Rameshet al. [31] showed the importance of using multi-parameter stress
http://dx.doi.org/10.1016/j.ijfatigue.2016.03.0060142-1123/� 2016 Published by Elsevier Ltd.
⇑ Corresponding author.E-mail address: [email protected] (P. Lopez-Crespo).
International Journal of Fatigue 89 (2016) 11–19
Contents lists available at ScienceDirect
International Journal of Fatigue
journal homepage: www.elsevier .com/locate / i j fa t igue
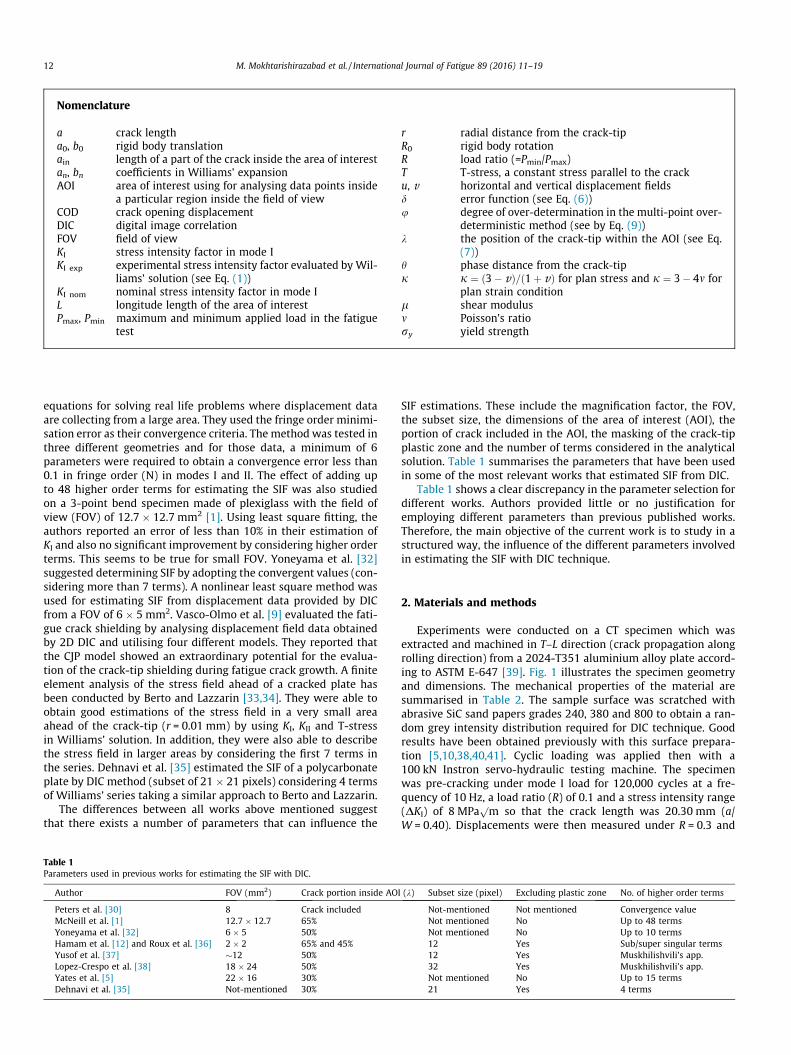
equations for solving real life problems where displacement dataare collecting from a large area. They used the fringe order minimi-sation error as their convergence criteria. The method was tested inthree different geometries and for those data, a minimum of 6parameters were required to obtain a convergence error less than0.1 in fringe order (N) in modes I and II. The effect of adding upto 48 higher order terms for estimating the SIF was also studiedon a 3-point bend specimen made of plexiglass with the field ofview (FOV) of 12.7 � 12.7 mm2 [1]. Using least square fitting, theauthors reported an error of less than 10% in their estimation ofKI and also no significant improvement by considering higher orderterms. This seems to be true for small FOV. Yoneyama et al. [32]suggested determining SIF by adopting the convergent values (con-sidering more than 7 terms). A nonlinear least square method wasused for estimating SIF from displacement data provided by DICfrom a FOV of 6 � 5 mm2. Vasco-Olmo et al. [9] evaluated the fati-gue crack shielding by analysing displacement field data obtainedby 2D DIC and utilising four different models. They reported thatthe CJP model showed an extraordinary potential for the evalua-tion of the crack-tip shielding during fatigue crack growth. A finiteelement analysis of the stress field ahead of a cracked plate hasbeen conducted by Berto and Lazzarin [33,34]. They were able toobtain good estimations of the stress field in a very small areaahead of the crack-tip (r = 0.01 mm) by using KI, KII and T-stressin Williams’ solution. In addition, they were also able to describethe stress field in larger areas by considering the first 7 terms inthe series. Dehnavi et al. [35] estimated the SIF of a polycarbonateplate by DIC method (subset of 21 � 21 pixels) considering 4 termsof Williams’ series taking a similar approach to Berto and Lazzarin.
The differences between all works above mentioned suggestthat there exists a number of parameters that can influence the
SIF estimations. These include the magnification factor, the FOV,the subset size, the dimensions of the area of interest (AOI), theportion of crack included in the AOI, the masking of the crack-tipplastic zone and the number of terms considered in the analyticalsolution. Table 1 summarises the parameters that have been usedin some of the most relevant works that estimated SIF from DIC.
Table 1 shows a clear discrepancy in the parameter selection fordifferent works. Authors provided little or no justification foremploying different parameters than previous published works.Therefore, the main objective of the current work is to study in astructured way, the influence of the different parameters involvedin estimating the SIF with DIC technique.
2. Materials and methods
Experiments were conducted on a CT specimen which wasextracted and machined in T–L direction (crack propagation alongrolling direction) from a 2024-T351 aluminium alloy plate accord-ing to ASTM E-647 [39]. Fig. 1 illustrates the specimen geometryand dimensions. The mechanical properties of the material aresummarised in Table 2. The sample surface was scratched withabrasive SiC sand papers grades 240, 380 and 800 to obtain a ran-dom grey intensity distribution required for DIC technique. Goodresults have been obtained previously with this surface prepara-tion [5,10,38,40,41]. Cyclic loading was applied then with a100 kN Instron servo-hydraulic testing machine. The specimenwas pre-cracking under mode I load for 120,000 cycles at a fre-quency of 10 Hz, a load ratio (R) of 0.1 and a stress intensity range(DKI) of 8 MPa
pm so that the crack length was 20.30 mm (a/
W = 0.40). Displacements were then measured under R = 0.3 and
Nomenclature
a crack lengtha0, b0 rigid body translationain length of a part of the crack inside the area of interestan, bn coefficients in Williams’ expansionAOI area of interest using for analysing data points inside
a particular region inside the field of viewCOD crack opening displacementDIC digital image correlationFOV field of viewKI stress intensity factor in mode IKI exp experimental stress intensity factor evaluated by Wil-
liams’ solution (see Eq. (1))KI nom nominal stress intensity factor in mode IL longitude length of the area of interestPmax, Pmin maximum and minimum applied load in the fatigue
test
r radial distance from the crack-tipR0 rigid body rotationR load ratio (=Pmin/Pmax)T T-stress, a constant stress parallel to the cracku, v horizontal and vertical displacement fieldsd error function (see Eq. (6))u degree of over-determination in the multi-point over-
deterministic method (see by Eq. (9))k the position of the crack-tip within the AOI (see Eq.
(7))h phase distance from the crack-tipj j ¼ ð3� vÞ=ð1þ vÞ for plan stress and j ¼ 3� 4m for
plan strain conditionl shear modulusm Poisson’s ratiory yield strength
Table 1Parameters used in previous works for estimating the SIF with DIC.
Author FOV (mm2) Crack portion inside AOI (k) Subset size (pixel) Excluding plastic zone No. of higher order terms
Peters et al. [30] 8 Crack included Not-mentioned Not mentioned Convergence valueMcNeill et al. [1] 12.7 � 12.7 65% Not mentioned No Up to 48 termsYoneyama et al. [32] 6 � 5 50% Not mentioned No Up to 10 termsHamam et al. [12] and Roux et al. [36] 2 � 2 65% and 45% 12 Yes Sub/super singular termsYusof et al. [37] �12 50% 12 Yes Muskhilishvili’s app.Lopez-Crespo et al. [38] 18 � 24 50% 32 Yes Muskhilishvili’s app.Yates et al. [5] 22 � 16 30% Not mentioned No Up to 15 termsDehnavi et al. [35] Not-mentioned 30% 21 Yes 4 terms
12 M. Mokhtarishirazabad et al. / International Journal of Fatigue 89 (2016) 11–19

DKI = 11 MPapm. Small scale yielding conditions were met in all
tests.An 8-bit 2452 � 2052 pixels CCD camera with the maximum
frame rate at full resolution of 12 was used for taking images.Fields of view between 0.98 � 0.82 mm2 and 13.5 � 11.3 mm2
were imaged with a combination of a macro Navitar lens and anadaptor tube (see Fig. 2). The resulting magnifications ranged from0.35� to 9� (resolution ranging from 10 to 0.4 micron per pixel).Increasing the magnification results in smaller FOV. A fibre opticring light (see Fig. 2) was used to achieve uniform illuminationon the surface of the specimen. In addition, a Questar 3-axis stagewas used to mount and adjust the camera position precisely. AllAOIs used in this work were squared. In order to acquire a suffi-cient number of images (38 images per cycle), the loading ratewas reduced to 0.1 Hz while capturing the images. Vic-Snap soft-ware [42] has been utilised for capturing the images and the corre-sponding applied load on the specimen for each image. Imageswere taken in six different magnifications. Subsequently, theimages were processed with Vic-2D software [42] to obtain thedisplacement fields. Each image was compared to the initial refer-ence image at the Pmin. Step size (the distance between two consec-utive displacement vectors) was set to 1/4 of the subset size inorder to achieve independent and non-repetitive data. A high-order interpolation scheme of optimized 8-tap spline was usedto achieve sub-pixel accuracy. The correlation criterion was set tothe zero-normalized sum of squared differences which isinsensitive to offset and scale in lighting [43]. Using the covariancematrix of the correlation equation, a statistical confidence regionhas been calculated in pixel for each match [43]. This confidence
interval is a measurement of the quality of matching the pointsin subsets [43]. Illumination, surface finish, magnification, subsetsize and step were set so that, the standard deviation confidenceinterval (E) was lower than 2 � 10�2 pixel (i.e. 2% of a pixel) inall analyses reported here.
In order to determine the effect of subset size on the accuracy ofthe displacement field measurement, DIC was done in differentsubset sizes ranging from 13 to 199 pixels for two different magni-fications of 0.75� and 0.35�. The crack-tip position was deter-mined optically from high magnification images at Pmax. Theobtained displacement data was then fitted into Williams’ series[27]:
Mode I
uI ¼X1n¼1
rn2
2l an jþ n2 þ ð�1Þn� �
cos nh2 � n
2 cos ðn�4Þh2
n o
v I ¼X1n¼1
rn2
2l an j� n2 � ð�1Þn� �
sin nh2 þ n
2 sin ðn�4Þh2
n o
8>>>><>>>>:
9>>>>=>>>>;
ð1Þ
and
Mode II
uII ¼ �X1n¼1
rn2
2lbn jþ n2 � ð�1Þn� �
sin nh2 � n
2 sin ðn�4Þh2
n o
v II ¼X1n¼1
rn2
2l bn j� n2 þ ð�1Þn� �
cos nh2 þ n
2 cos ðn�4Þh2
n o
8>>>><>>>>:
9>>>>=>>>>;
ð2Þwhere u and v are horizontal and vertical displacements, l is theshear modulus and j ¼ ð3� vÞ=ð1þ vÞ for plane stress and forplane strain condition, m is the Poisson’s ratio, r and h are radialand phase distance from the crack, an is constant.
Eq. (1) can be written in terms of the stress intensity factor andT-stress as follows [5]:
u¼ K I
2l
ffiffiffiffiffiffiffir2p
rcos
h2
j�1þ2sin2 h2
� �þ K II
2l
ffiffiffiffiffiffiffir2p
rsin
h2
jþ1þ2cos2h2
� �
þ T8lrðjþ1Þcoshþa0�RrsinðhÞ ð3Þ
v ¼ K I
2l
ffiffiffiffiffiffiffir2p
rsin
h2
jþ1�2cos2h2
� �þ K II
2l
ffiffiffiffiffiffiffir2p
rcos
h2
j�1�2cos2h2
� �
þ T8l
rðj�3Þsinhþb0þRrcosðhÞ ð4Þ
where a0 and b0 accounts for the rigid body translation and R0 isused to compensate for the rigid body rotation. It can be shown that
K I ¼ a1ffiffiffiffiffiffiffi2p
p; K II ¼ �b1
ffiffiffiffiffiffiffi2p
p; T ¼ 4a2 ð5Þ
where KI and KII are the mode I and II of stress intensity factor,respectively and T represents T-stress. Since CT can only be loadednominally to pure mode I loads, the results and the discussion willfocus on KI. The effects of adding non-singular terms (up to 10terms) in Williams’ solution was also explored. Fig. 3 shows anexample of the vertical displacement contour for a FOV of6 � 6 mm2 as well as the quality of fitting the experimental dataand the regression results by considering one, two and nine termsin Williams’ series. Fig. 3 illustrates the improvement in the fittingwhen increasing the number of terms in the series.
The results were then validated by comparison with nominalSIF solution (KI nom) [44]. Since nominal values do not includeany closure effect, care was taken to generate results with as littleinfluence as possible from closure-related mechanisms. To thisend,DKI and load ratio were higher during the cycles used for eval-uating the SIF than during the pre-cracking process. [45]. Following[46], COD was evaluated at several distances behind the crack-tip,from 50 to 400 lm. Fig. 4 shows the compliance curve (load versusCOD) measured 120 lm behind the crack-tip, in a similar way to[45]. The very low deviation from linearity of the curve in Fig. 4
Fig. 1. Geometry of the CT specimen in accordance with ASTM standard [39].
Fig. 2. Imaging configuration for DIC.
Table 2Mechanical properties of 2024-T351 aluminium alloy.
Youngmodulus
Yieldstress
UTS Elongation atbreak
Brinellhardness
73 GPa 325 MPa 470 MPa 20% 137
M. Mokhtarishirazabad et al. / International Journal of Fatigue 89 (2016) 11–19 13

indicates that closure mechanisms had little or no effect. Similarbehaviour was observed in the whole experiment.
The accuracy of experimental results was then examinedthrough the d parameter defined as follows:
d ¼ K I exp � K I nom
K I nom
��������� 100 ð6Þ
where KI exp is evaluated with Eq. (1) and KI nom is computed from[44]. Low d indicates more accurate estimations of KI.
In order to evaluate the effect of the AOI position, k is definedas:
k ¼ ainL
� 100 ð7Þ
where ain is the length of a part of the crack inside AOI and L repre-sents the longitude length of the AOI. For this experiment, four val-ues of k are selected, including 50%, 25%, 0%, and �25%. Negativevalues of k represent an AOI locating ahead of the crack-tip andnot including the crack-tip, that is collecting data only ahead ofthe crack-tip, in a similar way to [9]. Fig. 5a and b shows twoschematics of how k values of �25% and 50% could be achieved.
To study the effect of the size of the AOI on the estimation ofSIFs, six different AOIs in a constant FOV were analysed (Fig. 6).Minimum required data points in an AOI of 1 � 1 mm2 for an esti-mation error less than 10% (d) is also examined. It should be men-tioned that variables such as FOV and plastic zone size areinterrelated. In other words, by decreasing the FOV in order tostudy its effect on the estimation accuracy of the KI, the size ofthe plastic zone in proportion to the FOV will be reversiblyincreased simultaneously. In this way, a larger portion of the datapoints will be located inside the plastic zone. Load related effectssuch as different DK and Kmax values are not studied in this worknot because their effect is negligible but because they lie beyondthe scope of the current work.
3. Results and discussion
3.1. Effect of subset size
The first parameter that was studied was the subset size used inDIC technique. While small subset sizes are required to study
a b
c d
1 term
9 terms2 terms
Fig. 3. The vertical displacement contour for a FOV of 6 � 6 mm2 at the maximum load (a) and the quality of the fitting the experimental data and regression results byconsidering one (b), two (c) and nine (d) terms in Williams’ series.
Fig. 4. Measured COD for the sample.
14 M. Mokhtarishirazabad et al. / International Journal of Fatigue 89 (2016) 11–19

heterogeneous displacement fields [21], too small subsets canincrease the random errors of the technique [47]. Consequently,the subset size must be defined carefully [48]. Fig. 7 shows the evo-lution of the standard deviation confidence interval (E) and d withincreasing the subset size. It can be seen that E decreased as thesubset size increased. This is in agreement with the reverse powerlaw relation between E and the subset size observed by Hild et al.[15]. The largest drop in E was observed by increasing the subsetsize from 13 to 49 pixels. For subset sizes greater than 49 pixels(229 lm), a slight decrease in E was also observed.
Fig. 7 also shows that d increases steadily from 0.25% to 3.18%by increasing the subset size from 13 to 199 pixels. Increasing das a result of enlarging the subset size is probably due to the lowresolution in the displacement field in the crack-tip region, wherelarge gradients occur. It was also observed that for the studiedrange of subset sizes, quite good results were obtained both interms of SIF accuracy (d) and the quality of the correlation of theDIC technique (E). That is, a combination of a 5 mega-pixel cameraand scratched surface with sand paper make it possible to use awide range of subset sizes. The physical length of each pixel inhigh-resolution cameras is small enough to get sufficient numberof data points even if large subset sizes are used. Scratching thesurface with different grades of sandpaper provided sufficient
intensity gradients in each subset, even for the smallest one,13 � 13 pixels, for which the confidence interval is still acceptable(less than 5%). Subset sizes ranging from 13 to 199 pixels (61 to935 lm), in the FOV of 6 � 6 mm2 produced satisfactory resultsin terms of accurate estimation of SIF.
3.2. Effect of the plastic zone
The existence of a stress singularity at the crack-tip can bedescribed by an elastic stress field solution [27]. Since the analyti-cal models employed are based on LEFM, no points are normallycollected within the plastic zone [16,40]. The size of the cyclic plas-tic zone can be determined as follows [49]:
r ¼ 1p
DK I
2ry
� �2
ð8Þ
For the current experiment the size of the monotonic and cyclicplastic zone were 346 lm and 88 lm respectively. Fig. 8 shows theeffect of excluding monotonic and cyclic plastic zone on the resultsof estimating the SIF for different FOVs, employing 9 terms of Wil-liams’ series and k = 25%. It can be seen provided the FOV is largerthan 1 � 1 mm2, removing the plastic zone area has a negligibleeffect on the SIF estimation. The interesting point is that excludingmonotonic or cyclic plastic zone has worsened the evaluation
Fig. 7. Evolution of SIF accuracy (d) and standard deviation confidence interval (E)with the subset size in the magnification of 0.75� (FOV of 6 � 6 mm2).
Fig. 5. Schematics of AOI position (k parameter) with respect to the crack-tip. (a) shows the case where the crack-tip is located in the centre of the AOI (k = 50%). (b) shows anexample where all the DIC information is collected ahead of the crack-tip (k = �25%).
Fig. 6. The difference between FOV and AOI. The FOV is the size of the whole image.Six different AOIs are defined within the FOV when k = 50%.
M. Mokhtarishirazabad et al. / International Journal of Fatigue 89 (2016) 11–19 15

accuracy of KI. This behaviour can be explained by noting that,unlike with stress field, there is no singularity at the crack-tip fordisplacement field [50]. Accordingly, good fitting can be obtainedat the immediate vicinity of the crack-tip with displacement fields(Fig. 3b). In fact removing plastic zone not only has not improvedthe estimation of KI but it has also worsened the estimation as aresult of removing a number of data points near the crack-tip. Thiseffect is more significant in the smallest FOV, where monotonicplastic zone includes almost 40% of data points. It is worth notingthat the size of the plastic zone is smaller than the subset size(41 � 41 pixels) for FOVs larger than 4 � 4 mm2. Similar resultswere also obtained previously when estimating the SIF with theVon-Mises approach [10] and Williams’ approach [5].
3.3. Effect of area of interest (AOI) position
The current section aims at studying the influence of the crack-tip position within the AOI. Most authors use displacement datafrom the region ahead of the crack-tip (see Table 1). Nevertheless,the best signal to noise ratio and largest gradients take placebehind the crack-tip (i.e. in the crack flanks). The AOI position isstudied here through the k parameter defined in Section 2. Theresults of estimating the SIF for different k parameters and differ-ent FOVs are summarised in Fig. 9. The curves corresponding to dif-ferent FOVs show a minimum in d for k parameter of 25%. That is,for all FOVs, the best results are obtained when the crack-tip is
included in the AOI and crack extends over one fourth of theFOV. Fig. 9 also shows that the gap between different values of kparameter is larger for smaller FOVs. In other words, the AOI posi-tion has a large influence for high magnification DIC. The resultssuggest that AOI position is more important for FOV smaller than4 � 4 mm2. Fig. 10 investigates the combined effect of differentnumber of terms in the series and different AOI positions for theFOV of 4 � 4 mm2. Fig. 10a shows the results in terms of the errorin estimating the SIF (in %) and Fig. 10b shows the KI estimatedfrom the experimental DIC data.
Fig. 10a shows that the best predictions are obtained for k = 25%for all FOVs studied. Overall, k = �25% seems to produce the worstSIF predictions, thus indicating that the crack-tip should be at leastpartially contained within the AOI. Fig. 10a also shows that formore than 6 number of terms used in the series, k = 25% andk = 50% yield similar results, both of them being quite accurate(less than 4% error in SIF estimation). Fig. 10b shows that collectingdisplacement data only from the area ahead of the crack-tip, k = 0%or �25%, results in an underestimation of KI when the first twoterms are considered.
3.4. Effect of field of view (FOV)
The next parameter that will be studied is the size of the FOV.Fig. 11 illustrates the influence of the size of the FOV on d for dif-ferent number of terms when k was set to 25% and 0%.
Fig. 11 highlights the relation between the FOV, the position ofthe crack-tip within the AOI (k) and the number of terms for SIFestimation. It can be seen from Fig. 11a that good estimation ofthe K can be obtained for FOV between 4 and 10 mm, by taking intoaccount up to 10 terms in Williams’ series. Fig. 11b shows a betterestimation for 1–3 terms on small FOV (up to 2 mm). Beyond FOVlarger than 4 mm, more terms are required to obtain good estima-tions. Comparison between Fig. 11a and b suggests that including apart of the crack in the fitting process improves the SIF estimations.Fig. 11b indicates that unless part of the crack is imaged, large scat-tering is observed when considering few or more terms. The pre-dictions obtained with k = 0% and one term of the series(Fig. 11b) were satisfactory (less than 4%) for small FOV. This isprobably due to having all the data from within the K-dominatedzone. This is in agreement with previous literature that pointsout that sub-singular terms in the Williams’ series representation(K and T-stress) are sufficient to determine the field quantity ofinterest [50]. In addition, enlarging FOV from 2 � 2 mm2 to4 � 4 mm2 has resulted in considerable increase in the error of KI
estimation by only using the first term. This behaviour is logicalsince higher order terms are required for describing accuratelylarge crack-tip fields. Fig. 11b suggests that the boundary of K-dominance zone is at a distance of 2–4 mm from the crack-tip. Itshould be mentioned that according to small scale yielding condi-tion, process zone should be confined well inside the region of Kdominance [49].
Using FOVs larger than 4 � 4 mm2 did not have a significanteffect on KI estimation as long as higher order terms are consid-ered. Considering higher order terms is essential for high accuracyestimation in larger FOVs where K is no longer dominant [5]. It canbe seen that by selecting the optimum parameters(FOV = 6 � 6 mm2, k = 25%, subset = 41 � 41 pixels) the maximumvalue of d is 0.15%.
Another interesting question that an experimentalist mayencounter with is the possibility of using a small AOI in a largeFOV for KI estimation. Such an arrangement would enable one touse a lens with low magnification (e.g. 0.35�, i.e. 10 lm/pixel),for studying small AOIs. Fig. 12 compares using different AOIs inthe largest FOV and using different AOIs with magnificationsadjusted to each AOI.
Fig. 9. The behaviour of d as a function of k for different FOVs. Nine terms inWilliams’ expansion were used in all cases.
Fig. 8. Effect of including and excluding the monotonic and cyclic plastic zone inthe algorithm for estimating the SIF for different FOVs.
16 M. Mokhtarishirazabad et al. / International Journal of Fatigue 89 (2016) 11–19

Fig. 12 shows that using a small AOI (even one-tenth of the FOV)will result in the same accuracy as using small FOV by utilisinghigh magnification lenses. One of the advantages of using smallAOI is the fewer number of data points required to be analysed.For example, the number of data points in the FOV of 1 � 1 mm2
with the subset size of 41 � 41 pixels is equal to 24,364. For thecorresponding AIO (size of 1 � 1 mm2) in the FOV of10 � 10 mm2, just 64 data points are needed to be analysed.
This observation suggests that the system of equations solved toevaluate the SIF is excessively and unnecessarily over-determined.The degree of over-determination in the multi-point over-
deterministic method can be studied through the parameter u,defined as:
u ¼ number of data pointsnumber of terms in series
ð9Þ
Fig. 13 shows the accuracy of SIF estimation for different valuesof u. The horizontal axis is shown in logarithmic scale. Data are col-lected from the FOV of 4 � 4 mm2. It can be seen the value of dremains stable as long as u > 15. Fig. 13 also shows that decreasingu from 1.1 to 0.7 (or reducing the data points from 11 to 7) made a
Fig. 13. Effect of reducing data points in an AOI of 4 � 4 mm2 where k = 25%. u isdefined as the number of data points used in the analysis divided by the number ofterms in the series. Note the logarithmic scale in u scale.
Fig. 11. The accuracy of KI estimation (d) as a function of FOV for different number of terms. k is equal to 25% (a) and 0% (b).
Fig. 10. Effect of considering higher order terms on d (a) and the absolute value (b) of the estimated KI for different positions of AOI in the FOV of 4 � 4 mm2.
Fig. 12. KI estimation accuracy with respect to the different size of AOIs in the FOVequal to 10 � 10 mm2 and corresponding FOVs by considering 9 terms in Williams’series.
M. Mokhtarishirazabad et al. / International Journal of Fatigue 89 (2016) 11–19 17

drastic increase in d from 3.74% to 400% for calculations based on10 terms. Very similar trends were also observed for other FOVs.u = 0.7 is not strictly a multi-point over-deterministic methodsince the system is under-deterministic. Nevertheless, the resultsfor u = 0.7 are included for the sake of making the current analysismore comprehensive. The same trend is also observed for 6 num-ber of terms. For the first term, however, since the over-deterministic condition is still satisfied even by seven data points,d did not change significantly (less than 10%). Consequently, thisanalysis suggests that in the optimum condition (k = 25%,FOV > 4 � 4 mm2), reliable SIF estimations (d < 4%) can be obtainedas long as u > 15. By further increasing u parameter beyond 15, theeffect of experimental noise and the effect of the microstructurecan be reduced. Increasing u well beyond 15 can easily be doneusing current digital cameras. However, depending on the DICalgorithm in use, the computational cost of analysing 1000 timesmore data points will also increase.
4. Conclusions
A multi-parameter fracture mechanics study on the effect ofsome experimental variables on KI estimation using DIC was con-ducted based on an elastic model. It was shown that the accuracyof KI can be affected not only by the well-known variables such assubset size in DIC and considered number of Williams’ series butalso by the size and position of AOI. When using scratches at thesurface, good estimations can be obtained with subset sizesbetween 13 and 199. The absence of singularity in the displace-ment data at the crack tip region led to a reasonable fitting inthe experimental data and the regression results even quite closeto the crack-tip. Therefore, excluding the plastic zone (monotonicor cyclic) is not recommended as long as FOV is smaller than1 � 1 mm2. Experimental results indicate the significant effect ofthe position of the AOI for accurate estimation of SIF with DIC tech-nique. It was shown that including a part of the crack length insidethe AOI (crack extending to one-fourth of the AOI) provides thebest estimations for all FOVs. Accurate predictions can be obtainedimaging FOVs between 4 � 4 mm2 and 10 � 10 mm2, k = 25% andusing 1 to 10 terms in Williams’ expansion. Worse estimationswere obtained for FOVs smaller than 4 � 4 mm2. Finally, it was alsoshown that reliable estimations of the KI can be achieved as long asthe number of displacement vectors fitted to the model is 15 timeslarger than the number of terms in the series. Increasing the num-ber of displacement vectors beyond 15 can be useful to reducenoise effects, thus improving the quality of the estimation.
Acknowledgements
Financial support of Junta de Andalucía through Proyectos deExcelencia grant reference TEP-3244 and the University of Malagathrough Campus de Excelencia Internacional del Mar (CEIMAR) isgreatly acknowledged.
References
[1] McNeill SR, Peters WH, Sutton MA. Estimation of stress intensity factor bydigital image correlation. Eng Fract Mech 1987;28:101–12. http://dx.doi.org/10.1016/0013-7944(87)90124-X.
[2] Sutton MA, Zhao W, McNeill SR, Helm JD, Piascik RS, Riddell WT. Local crackclosure measurements: development of a measurement system usingcomputer vision and a far-field microscope. In: McClung RC, Newman JC,editors. Adv Fatigue Crack Clos Meas Anal, 2. West Conshohocken, PA: ASTMSTP 1343; 1999. p. 145–56.
[3] Yoneyama S, Arikawa S, Kusayanagi S, Hazumi K. Evaluating J-integral fromdisplacement fields measured by digital image correlation. Strain2014;50:147–60. http://dx.doi.org/10.1111/str.12074.
[4] Becker TH, Mostafavi M, Tait RB, Marrow TJ. An approach to calculate the J-integral by digital image correlation displacement field measurement. FatigueFract Eng Mater Struct 2012;35:971–84. http://dx.doi.org/10.1111/j.1460-2695.2012.01685.x.
[5] Yates JR, Zanganeh M, Tai YH. Quantifying crack tip displacement fields withDIC. Eng Fract Mech 2010;77:2063–76. http://dx.doi.org/10.1016/j.engfracmech.2010.03.025.
[6] Roux S, Hild F. Stress intensity factor measurements from digital imagecorrelation: post-processing and integrated approaches. Int J Fract2006;140:141–57. http://dx.doi.org/10.1007/s10704-006-6631-2.
[7] Zanganeh M, Tomlinson RA, Yates JR. T-stress determination using digitalimage correlation. In: XIth congrees expo exp appl mech Orlando, Florida, USA.
[8] Leser WP, Carolina N, Carolina N, Newman JA, Johnston WM. Fatigue crackclosure analysis using digital image correlation. NASA/TM-2010-216695;2010.
[9] Vasco-Olmo JM, Díaz FA, García-Collado A, Dorado-Vicente R. Experimentalevaluation of crack shielding during fatigue crack growth using digital imagecorrelation. Fatigue Fract Eng Mater Struct 2015;38:223–37. http://dx.doi.org/10.1111/ffe.12136.
[10] Carroll J, Efstathiou C, Lambros J, Sehitoglu H, Hauber B, Spottswood RC S.Investigation of fatigue crack closure using multiscale image correlationexperiments. Eng Fract Mech 2009;76:2384–98.
[11] Díaz FV, Kaufmann GH, Armas AF, Galizzi GE. Optical measurement of theplastic zone size in a notched metal specimen subjected to low-cycle fatigue.Opt Lasers Eng 2001;35:325–33. http://dx.doi.org/10.1016/S0143-8166(01)00030-6.
[12] Hamam R, Hild F, Roux S. Stress intensity factor gauging by digital imagecorrelation: application in cyclic fatigue. Strain 2007;43:181–92. http://dx.doi.org/10.1111/j.1475-1305.2007.00345.x.
[13] Roux-Langlois C, Gravouil A, Baietto M-C, Réthoré J, Mathieu F, Hild F, et al. DICidentification and X-FEM simulation of fatigue crack growth based on theWilliams’ series. Int J Solids Struct 2014;53:38–47. http://dx.doi.org/10.1016/j.ijsolstr.2014.10.026.
[14] Lopez-Crespo P, Shterenlikht A, Patterson EA, Yates JR, Withers PJ. The stressintensity of mixed mode cracks determined by digital image correlation. JStrain Anal Eng Des 2008;43:769–80. http://dx.doi.org/10.1243/03093247JSA419.
[15] Hild F, Roux S. Digital image correlation: from displacement measurement toidentification of elastic properties – a review. Strain 2006;42:69–80. http://dx.doi.org/10.1111/j.1475-1305.2006.00258.x.
[16] Hamam R, Hild F, Roux S. Stress intensity factor gauging by digital imagecorrelation: application in cyclic fatigue. Strain 2007;43:181–92. http://dx.doi.org/10.1111/j.1475-1305.2007.00345.x.
[17] Roux S, Réthoré J, Hild F. Digital image correlation and fracture: an advancedtechnique for estimating stress intensity factors of 2D and 3D cracks. J Phys DAppl Phys 2009;42:214004. http://dx.doi.org/10.1088/0022-3727/42/21/214004.
[18] Pan B, Qian K, Xie H, Asundi A. Two-dimensional digital image correlation forin-plane displacement and strain measurement: a review. Meas Sci Technol2009;20:062001. http://dx.doi.org/10.1088/0957-0233/20/6/062001 (17pp).
[19] Taylor JR. An introduction to error analysis: the study of uncertainties inphysical measurements, vol. 51, 2nd ed. Sausalito, California; 1983. http://dx.doi.org/10.1119/1.13309.
[20] Schreier HW, Braasch JR, Sutton MA. Systematic errors in digital imagecorrelation caused by intensity interpolation. Opt Eng 2000;39:2915–21.
[21] Schreier HW, Sutton MA. Systematic errors in digital image correlation due toundermatched subset shape functions. Exp Mech 2002;42:303–10. http://dx.doi.org/10.1177/001448502321548391.
[22] Yu L, Pan B. The errors in digital image correlation due to overmatched shapefunctions. Meas Sci Technol 2015;26:045202. http://dx.doi.org/10.1088/0957-0233/26/4/045202.
[23] Fazzini M, Mistou S, Dalverny O, Robert L. Study of image characteristics ondigital image correlation error assessment. Opt Lasers Eng 2010;48:335–9.http://dx.doi.org/10.1016/j.optlaseng.2009.10.012.
[24] Pan B. Reliability-guided digital image correlation for image deformationmeasurement. Appl Opt 2009;48:1535–42. http://dx.doi.org/10.1364/AO.48.001535.
[25] Sanford RJ, Dally JW. A general method for determining mixed-mode stressintensity factors from isochromatic fringe patterns. Eng Fract Mech1979;11:621–33. http://dx.doi.org/10.1016/0013-7944(79)90123-1.
[26] Westergaard HM. Bearing pressures and cracks. J Appl Mech 1939;61:A49–53.[27] Williams ML. On the stress distribution at the base of a stationary crack. J Appl
Mech 1957;24:109–14. http://dx.doi.org/10.1115/1.3640470.[28] Díaz FA, Yates JR, Patterson EA. Some improvements in the analysis of fatigue
cracks using thermoelasticity. Int J Fatigue 2004;26:365–76. http://dx.doi.org/10.1016/j.ijfatigue.2003.08.018.
[29] Christopher CJ, James MN, Patterson EA, Tee KF. Towards a new model of cracktip stress fields. Int J Fract 2007;148:361–71. http://dx.doi.org/10.1007/s10704-008-9209-3.
[30] Peters WH, RansonWF, Kalthoff JF, Winkler SR. A study of dynamic near-crack-tip fracture parameters by digital image analysis. J Phys Colloq 1985;46. http://dx.doi.org/10.1051/jphyscol:1985581. C5-631–C5-638.
[31] Ramesh K, Gupta S, Kelkar AA. Evaluation of stress field parameters in fracturemechanics by photoelasticity – revisited. Eng Fract Mech 1997;56:25–41.43–5.
18 M. Mokhtarishirazabad et al. / International Journal of Fatigue 89 (2016) 11–19

[32] Yoneyama S, Ogawa T, Kobayashi Y. Evaluating mixed-mode stress intensityfactors from full-field displacement fields obtained by optical methods. EngFract Mech 2007;74:1399–412. http://dx.doi.org/10.1016/j.engfracmech.2006.08.004.
[33] Berto F, Lazzarin P. On higher order terms in the crack tip stress field. Int J Fract2010;161:221–6. http://dx.doi.org/10.1007/s10704-010-9443-3.
[34] Berto F, Lazzarin P. Multiparametric full-field representations of the in-planestress fields ahead of cracked components under mixed mode loading. Int JFatigue 2013;46:16–26. http://dx.doi.org/10.1016/j.ijfatigue.2011.12.004.
[35] Dehnavi MY, Khaleghian S, Emami A, Tehrani M, Soltani N. Utilizing digitalimage correlation to determine stress intensity factors. Polym Test2014;37:28–35. http://dx.doi.org/10.1016/j.polymertesting.2014.04.005.
[36] Roux S, Réthoré J, Hild F. Recent progress in digital image correlation: frommeasurement to mechanical identification. J Phys: Conf Ser 2008;135:012002.http://dx.doi.org/10.1088/1742-6596/135/1/012002.
[37] Yusof F, Withers PJ. Real-time acquisition of fatigue crack images formonitoring crack-tip stress intensity variations within fatigue cycles. J StrainAnal Eng Des 2008;44:149–58. http://dx.doi.org/10.1243/03093247JSA440.
[38] Lopez-Crespo P, Shterenlikht A, Yates JR, Patterson EA, Withers PJ. Someexperimental observations on crack closure and crack-tip plasticity. FatigueFract Eng Mater Struct 2009;32:418–29. http://dx.doi.org/10.1111/j.1460-2695.2009.01345.x.
[39] ASTM E647-00. Standard test method for measurement of fatigue crackgrowth rates. Am Soc Test Mater Annu B Stand 1999.
[40] López-Crespo P, Burguete RL, Patterson EA, Shterenlikht A, Withers PJ, Yates JR.Study of a crack at a fastener hole by digital image correlation. Exp Mech2009;49:551–9. http://dx.doi.org/10.1007/s11340-008-9161-1.
[41] Zanganeh M, Lopez-Crespo P, Tai YH, Yates JR. Locating the crack tip usingdisplacement field data: a comparative study. Strain 2013;49:102–15. http://dx.doi.org/10.1111/str.12017.
[42] Vic-2D software. Correlated Solutions Incorporated (C.S.Inc) <http://www.correlatedsolutions.com>.
[43] Sutton MA, Orteu J-J, Schreier HW. Image correlation for shape, motion anddeformation measurements. New York: Springer; 2009. http://dx.doi.org/10.1007/978-0-387-78747-3.
[44] Murakami Y. Stress intensity factors handbook. Oxford: Pergamon Press; 1987.[45] Beretta S, Rabbolini S, Bello AD. Multi-scale crack closure measurement with
digital image correlation on Haynes 230. Frat Ed Integrità Strutt2015;33:174–82. http://dx.doi.org/10.3221/IGF-ESIS.33.22.
[46] Yusof F, Lopez-Crespo P, Withers PJ. Effect of overload on crack closure in thickand thin specimens via digital image correlation. Int J Fatigue 2013;56:17–24.http://dx.doi.org/10.1016/j.ijfatigue.2013.07.002.
[47] Pan B, Xie H, Wang Z, Qian K, Wang Z. Study on subset size selection in digitalimage correlation for speckle patterns. Opt Express 2008;16:7037–48. http://dx.doi.org/10.1364/OE.16.007037.
[48] Triconnet K, Derrien K, Hild F, Baptiste D. Parameter choice for optimizeddigital image correlation. Opt Lasers Eng 2009;47:728–37. http://dx.doi.org/10.1016/j.optlaseng.2008.10.015.
[49] Suresh S. Fatigue of materials. 2nd ed. New York: Cambridge University Press;1998.
[50] Ewalds HL, Wanhill RJH. Fracture mechanics. London: Arnold; 1984.
M. Mokhtarishirazabad et al. / International Journal of Fatigue 89 (2016) 11–19 19

Appendix II
Published Paper #2
Title: Stress intensity factor monitoring under cyclic loading by digital image correlation
Authors: M. Mokhtarishirazabad1, P. Lopez‐Crespo1, M. Zanganeh2
1Department of Civil and Materials Engineering, University of Malaga, C/Dr Ortiz Ramos s/n, 29071, Malaga, Spain
2Jacobs Technology, NASA Johnson Space Center, Houston TX, USA
Journal: Fatigue & Fracture of Engineering Materials & Structures, Volume 41, Issue 10, 2018, Pages
2162-2171
Impact Factor: 2.533, Q1 in JCR

S P E C I A L I S S U E ‐ CHARACTER I S A T I ON OF CRACK T I PF I E LD S 4
Stress intensity factor monitoring under cyclic loading bydigital image correlation
M. Mokhtarishirazabad1 | P. Lopez‐Crespo1 | M. Zanganeh2
1Department of Civil and MaterialsEngineering, University of Malaga, C/DrOrtiz Ramos s/n, 29071 Malaga, Spain2Jacobs Technology, NASA JohnsonSpace Center, Houston, TX, USA
CorrespondenceP. Lopez‐Crespo, Department of Civil andMaterials Engineering, University ofMalaga, C/Dr Ortiz Ramos s/n, 29071Malaga, Spain.Email: [email protected]
Funding informationUniversity of Malaga through Campus deExcelencia Internacional del Mar, Grant/Award Number: CEIMAR; Ministerio deEconomia y Competitividad, Grant/AwardNumber: MAT2016‐76951‐C2‐2‐P; Uni-versity of Malaga
Abstract
In the present work, a methodology for structural health monitoring based on
a combination of digital image correlation and an analytical elastic solution is
presented. To this end, full‐field displacement around a crack tip in a CT sam-
ple made of 2024‐T351 Al alloy under cyclic loading was monitored at different
load levels. An analytical solution based on Williams' model was used to eval-
uate the experimental value of the stress intensity factor (SIF) in a continuous
fashion during cyclic loads. It was observed that by increasing the loading
amplitude in the cyclic loading, the difference between nominal and experi-
mental estimation of SIF increased due to the crack tip plasticity effect, which
was not considered in the nominal evaluations. To consider the plasticity
effect, Irwin's approach was employed. The results showed that the proposed
method can successfully monitor the evolution of SIF of a sample under cyclic
loading until the sudden fracture of the sample.
KEYWORDS
2024‐T351, cyclic load, digital image correlation, stress intensity factor, structural health monitoring
1 | INTRODUCTION
The accuracy for structural health monitoring has beenvastly improved over the last few decades thanks to thedevelopment and improvement of a wide range of tech-niques for monitoring the crack (damage) initiation andgrowth in engineering structures. Among these, non‐destructive testing techniques have been extremely usefulfor crack monitoring. Non‐destructive testing techniques
can be divided into 2 main categories: direct and indirectcrack length measurement methods. Direct methods arebased on measuring the crack length visually, optically,or by employing X‐ray radiographic testing,1 while indi-rect crack length measurements are based on monitoringa change in a physical or mechanical property of thematerial due to the extension of the crack. For example,the change in the material electric resistance or materialstiffness, due to crack growth, has led to the development
Nomenclature: a, crack length; acorr, corrected crack length, sum of the crack length with first‐order plastic zone size (Irwin approach); an, bn,coefficients in Williams expansion; AOI, area of interest using for analysing data points inside a particular region inside the field of view; COD,crack opening displacement; CT, compact tension specimen; DIC, digital image correlation; FOV, field of view; KI, KII, stress intensity factor inmodes I and II; r, radial distance from the crack‐tip; ry, first‐order plastic zone size (Irwin approach); R, axial load ratio (=Pmin/Pmax); T, T stress, aconstant stress parallel to the crack; u, v, horizontal and vertical displacement fields; ΔKI, stress intensity factor range in mode I (=KI max −
KI min); ΔKII, stress intensity factor range in mode II (=KII max − KII min); ΔKexp, evaluated stress intensity factor range by mean ofdisplacement data around the crack tip; ΔKnom, nominal applied stress intensity factor range calculated by analytical solution; θ, angularcoordinate in the polar system; κ, κ = (3 − v)/(1 + v) for plan stress and κ = 3 − 4v for plan strain condition; μ, shear modulus; ν, Poisson ratio;σ, axial stress; σys, yielding stress; τ, shear stress; φ, angle between axial and shear stress amplitude (see Figure 3)
Received: 17 October 2017 Revised: 26 March 2018 Accepted: 29 March 2018
DOI: 10.1111/ffe.12825
2162 © 2018 Wiley Publishing Ltd. Fatigue Fract Eng Mater Struct. 2018;41:2162–2171.wileyonlinelibrary.com/journal/ffe
of electrical potential technique2,3 and the compliancemethods4 for crack growth measurement, respectively.In the same manner, other methods such as infraredand thermal testing,5 acoustic emission,6 eddy current,7,8
and ultrasonic9,10 have been successfully employed tomonitor the defect size. In addition, some efforts wereaimed at improving the accuracy of these techniques bycombining 2 or more of these techniques. For example,digital image correlation (DIC) has been coupled withacoustic emission technique to determine the criticalstage of deformation mechanism at the onset of the plas-ticity of AZ31 Mg alloy.11 Vannianparambil et al12 com-bined guided ultrasonic waves, acoustic emission, andDIC with real‐time and post‐mortem analysis, to developa precise structural health monitoring approach for dam-age detection and quantified crack length measurement.Nevertheless, most of these methods have some disadvan-tages that make them difficult to be adapted for industrialenvironments such as being very expensive and limitedapplication to a narrow range of materials and type ofdefects to be detected. For example, in ultrasonic method,the accuracy is highly dependent on the operator skills,and it is not suitable for detecting short cracks.13 Theapplication of eddy current method is also limited toelectrically conductive materials and interpretation ofcomplex signals requires a highly skilled operator.14 Dueto the nature of the signal source, acoustic emissionmethod is not perfectly reproducible, and it is not capableof detecting elastic deformation.15
While the previously described methods are used todetermine the crack geometry and length, accurate dam-age assessment of engineering structures subjected tochanging loads often requires fracture parameters of thecomponent to be evaluated. To this end, full field tech-niques such as photo‐elasticity,16 thermo‐elasticity,17
Moiré interferometry,18 DIC,19 and synchrotron x‐ray dif-fraction20 have been developed to characterise crack tipfields in terms of strain, stress, and displacement. Theapplication of DIC in fracture mechanics has increasedin the last decades because it is technically easy to imple-ment, no sophisticated sample preparation is needed, andit is basically a scale‐free method. In other words, it canmeasure on the scale ranging from a few meters21 tomicro‐meters.22,23This feature makes DIC very advanta-geous as compared with other crack tip monitoringmethods. The focus of researches in DIC has been onenhancing its accuracy24-27 and extending its applicationin different fields of science. Details about the principlesof the method and its applications are out of the scopeof this paper and are discussed elsewhere.28,29 The stressintensity factor (SIF) is a key parameter for fatigue lifeprediction of engineering components prone to linearelastic failure. A number of innovative methods has been
developed to evaluate SIF not only in mode I but alsomixed mode of loading.21,30,31 The prominent advantageof using the crack tip fields for evaluating SIF is that noprevious knowledge of crack length, applied force, orspecimen geometry is needed. This makes it very suitablefor characterisation of in‐service engineering compo-nents.32 DIC has been employed33 to study the effect ofcrack closure and crack tip plasticity in the evaluationof SIF for specimens under different mixed‐mode loads(I + II). The SIF is normally evaluated following amultipoint over‐deterministic method consisting of fittingthe experimental in fitting the experimental data to ananalytical model which describes the displacement fieldaround the crack tip. In this way, the evolution of theSIF was monitored during the loading sequences. Verypromising results were obtained in early studies whileestimating the SIF with DIC on C‐specimens and 3‐point‐bend specimens.19 Improvement in digital photog-raphy allowed higher resolution images that improvedthe accuracy in estimating the SIF both under pure modeI and a range of mixed‐mode conditions.34 Edge‐findingroutines for locating the crack tip were subsequentlyincorporated to the program to automate the evaluationof SIF with DIC displacement data.35 The crack‐tip loca-tion was also evaluated from displacement fields with anumber of numerical procedures, including reflectiveNewton method, Nelder‐Mead Simplex method, geneticalgorithm, and Pattern Search method.36 DIC alsoallowed other forms of crack evaluation through differentparameters. For example, T‐stress and Crack Tip OpeningAngle were evaluated on double cantilever specimensmade of 7010T7651 aluminium alloy.31 Elastic plasticcrack assessment was achieved with different methodolo-gies. The J‐integral was estimated from a combination ofDIC and finite element method displacements by apply-ing the path and domain integral methods on annealedand unannealed pure aluminium A1050.37 COD mea-surements obtained with high magnification DIC wereused to evaluate crack growth and closure mechanismsfor different thicknesses on 6082T6 aluminium alloy.38
The plastic zone ahead of the crack as a way to controlthe rate of crack growth was assessed with DIC on speci-mens with artificial cracks39 and on specimens with realfatigue cracks.40 In this work, we show for the first timea DIC methodology for continuous monitoring of theeffective SIF under a range of different cyclic loads.
2 | MATERIALS AND METHODS
Crack tip field was monitored by DIC method in a com-pact tension (CT) specimen. The specimen was machinedfrom a rolled 2024‐T351 aluminium alloy plate in the T‐L
MOKHTARISHIRAZABAD ET AL. 2163

direction according to ASTM standard41 and had a thick-ness of 12 mm. That is, the crack propagates parallel tothe rolling direction. The geometry and dimensions ofthe sample are shown in Figure 1. This alloy is widelyused in aircraft structures such as lower wings and fuse-lage/pressure cabin structures due to the high strengthto weight ratio and good fatigue resistance. In addition,it combines excellent fatigue properties with low environ-mental impact for transport applications.42 Table 1 showsthe mechanical properties of the alloy.
Following ASTM standard,41 the sample was fatiguepre‐cracked to achieve a crack length of 25.8 mm withload ratio of 0.1 (R = 0.1) under mode I loading. The
applied nominal ΔKI was less than 5 MPa√m duringpre‐cracking, and the loading frequency was 15 Hz. Then,the surface of the sample was scratched with a 320 gradeSiC sand paper to provide a random pattern required forDIC technique. Subsequent cyclic loads were applied ina ramp wave form with load ratio of 0.3 with 5 different
applied nominal ΔKI of 10, 15, 20, 25, and 30 MPa√m.Load ratio was chosen in a way to minimize the closurephenomenon43 and maximize the range of SIF to be stud-ied. At the end of cyclic loads, the load was increased con-stantly until the sudden fracture of the sample occursunder load control. Figure 2 shows the schematic of theloading sequences. Loads were applied by an Instron8085 fatigue loading rig. Crack tip displacement fieldswere captured during cyclic loading with a 5 MP CCDcamera coupled with a Schindler‐Kreuznach Xenon 50‐mm lens with a 170‐mm working distance, and the
resulting field of view (FOV) was 36 × 32 mm2. In thisway, a resolution of 15 microns per pixel was obtained.DIC was used to generate displacement fields. The strainfields were not used in this work to avoid the numericaldifferentiation that often increases largely the noise level.44
The ring light was employed to provide an even andbright illumination over the whole field and to minimisethe size of the dark region around the crack tip at highloads and the reflections (Figure 3). The position of thecrack tip can be determined by analysing the displacementfield with a number of numerical procedures that includereflective Newton method, Nelder‐Mead Simplex method,genetic algorithm, Pattern Search method,36 or by detect-ing the crack with edge‐finding routines also applied onthe displacement image.35,45 In this work, the position ofthe crack tip was determined by direct observation of thebare surface. The image of the surface was analysed here,rather than the image of the displacement field. This ispossible because the specimen surface is imaged directly,unlike other works where the actual specimen surface iscovered by paint that can be applied by spray,24 electro‐spray,46 toner,47 or others. The contrast required for theDIC algorithm to give satisfactory results is obtained byfinely abrading the surface and by arranging the illumina-tion sources in such way that reflections are minimised.Such procedure has been shown to be very useful for appli-cations where crack tip plasticity is studied.33
The loading frequency was decreased to 0.5 Hz whilecapturing the images. This allowed 54 images to be collectedduring each cycle. The images were then correlated withVic‐2D software to extract the displacement data aroundthe crack tip. The image taken at the minimum load wasselected as the reference image for correlation. In order toobtain sub‐pixel accuracy in the correlation, a high‐orderinterpolation scheme of optimized 8‐tap spline wasemployed.48 In addition, the correlation software used acovariance matrix of the correlation equations to calculatea statistical confidence region. The confidence margin wasset to 0.05 pixel, so that any data point exceeding this value
FIGURE 1 The geometry and dimensions of the CT specimen
TABLE 1 Mechanical properties of rolled 2024‐T351 Al alloy
YoungModulus
YieldStress UTS
Elongationat Break
BrinellHardness
73 GPa 325 MPa 470 MPa 20% 137
FIGURE 2 Schematic of loading sequences
2164 MOKHTARISHIRAZABAD ET AL.

is removed by the algorithm.48 To eliminate the effect of theoffset and the scale in lighting, the correlation criterion wasset to the zero‐normalized sum of squared differences. Thesubset size and step‐size were 39 × 39 pixels and 10 pixels,respectively (Figure 4).
A multipoint over‐deterministic method was employedto calculate SIF in mode I and II, by fitting the experimen-tal displacement data to the Williams' series31:
ModeluI ¼ ∑
∞
n¼1
r
n2
2μan
κ þ n2þ −1ð Þn
h icos
nθ2−n2cos
n−4ð Þθ2
� �
vI ¼ ∑∞
n¼1
r
n2
2μan κ−
n2− −1ð Þn
h isin
nθ2
þ n2sin
n−4ð Þθ2
� �
8>>>>>>><>>>>>>>:
9>>>>>>>=>>>>>>>;(1)and
ModeIIuII ¼ −∑
∞
n¼1
r
n2
2μbn
K þ n2− −1ð Þn
h isin
nθ2−n2sin
n−4ð Þθ2
� �
vII ¼ ∑∞
n¼1
r
n2
2μbn K−
n2þ −1ð Þn
h icos
nθ2
þ n2cos
n−4ð Þθ2
� �
8>>>>>>><>>>>>>>:
9>>>>>>>=>>>>>>>;(2)
where uI, vI, uII, and vII are horizontal and verticaldisplacements in mode I and mode II, respectively, μ isthe shear modulus, κ = (3 − ν)/(1 + ν) for plane stress
and κ = 3 − 4ν for plane strain condition, υ is the Poisson'sratio, r and θ are polar coordinates with the crack‐tip beingthe origin of coordinates, and a and b are constants.
Equations (1) and (2) can be rearranged as follow:
u ¼ KI
2μ
ffiffiffiffiffiffir2π
rcos
θ2
κ−1þ 2 sin2θ2
� �
þ KII
2μ
ffiffiffiffiffiffir2π
rsin
θ2
κ þ 1þ 2 cos2θ2
� �
þ T8μ
r κ þ 1ð Þ cosθ
(3)
v ¼ KI
2μ
ffiffiffiffiffiffir2π
rsin
θ2
Κþ 1−2 cos2θ2
� �
−KII
2μ
ffiffiffiffiffiffir2π
rcos
θ2
Κ−1−2 cos2θ2
� �
þ T8μ
r K−3ð Þ sinθ
(4)
by using
KI ¼ a1ffiffiffiffiffiffi2π
p;KII ¼ −b1
ffiffiffiffiffiffi2π
p;T ¼ 4a2 (5)
where KI and KII represent the mode I and II of SIF,respectively, and T stands for T‐stress.
FIGURE 3 High magnification view of the crack tip region at 3 different load levels. A small dark region can be observed only at
ΔKnom = 30 MPa√m
FIGURE 4 The size and position of AOIs
in the FOV of 36 × 32 mm2 [Colour figure
can be viewed at wileyonlinelibrary.com]
MOKHTARISHIRAZABAD ET AL. 2165

The SIF evaluated experimentally (ΔKexp) was com-pared with the nominal solution (ΔKnom).
49 To quantifythe difference, the parameter of δ was defined as follows:
δ ¼ ΔKexp−ΔKnom
ΔKnom
��������×100: (6)
Displacement data were collected from 3 different area ofinterests (AOI) including 10 × 10, 15 × 15, and 20 × 20 mm2
which contain 15620, 8740, and 3900 data points, respec-tively. The position of the AOI in the FOV was selected ina way that the crack tip was located at the one‐fourth ofthe width of the AOI (Figure 4). The data points located atthe plastic zone are also considered in the SIF evaluationsas suggested previously.43 The crack growth during thetest was considered in the calculation of nominal SIF.
3 | RESULTS AND DISCUSSION
Figure 5 illustrates the effect of considering a differentnumber of terms in Williams' solution in the displacementdata around the crack tip. Figure 5 is useful as a qualitative
way to visualise the uncertainty in the fitting of experi-mental to analytical displacement data. In Figure 5, thesmooth lines represent the analytical displacements, andthe serrated lines represent the experimental displace-ments. It can be seen that considering just 1 or 2 terms ofWilliams' series in the solution led to a weak fitting with
FIGURE 5 The quality of fitting the experimental displacement field to William's solution by solving A, 1 term, B, 2 terms, C, 3 terms, and
D, 7 terms when ΔKnom = 20 MPa√m and AOI = 20 × 20 mm2 [Colour figure can be viewed at wileyonlinelibrary.com]
FIGURE 6 Evolution of the quality of fitting displacement data
as a function of number of Williams' terms, ΔKnom = 20 MPa√m,
AOI = 20 × 20 mm2
2166 MOKHTARISHIRAZABAD ET AL.
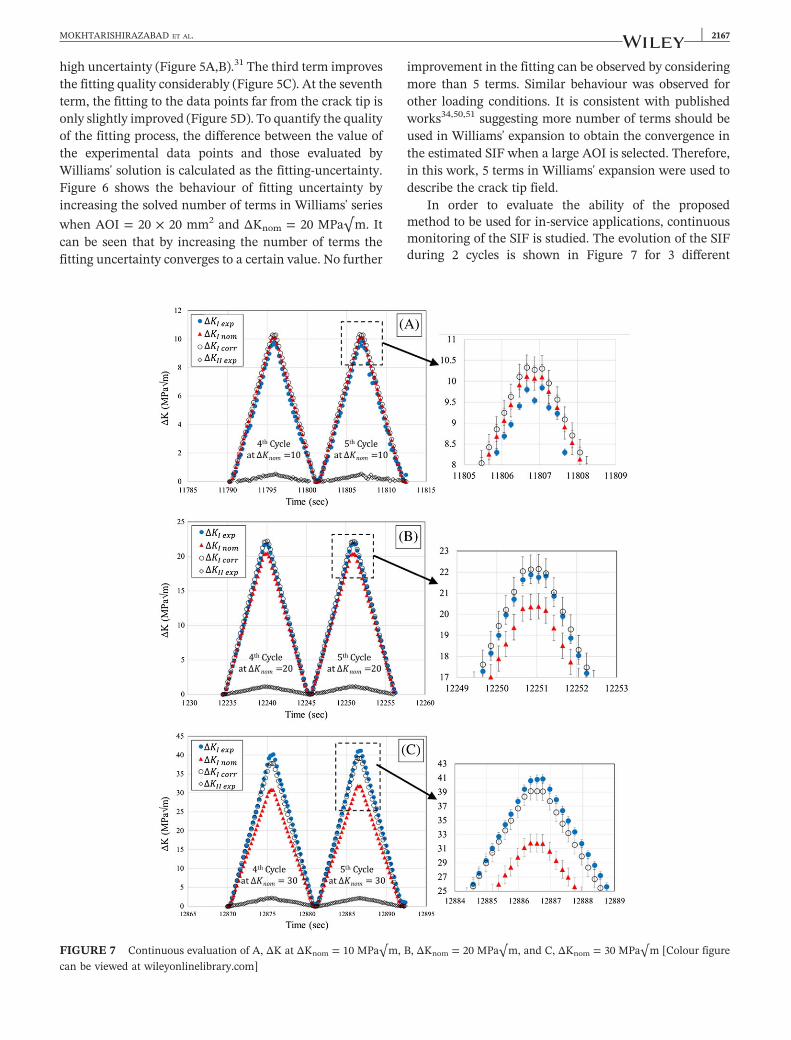
high uncertainty (Figure 5A,B).31 The third term improvesthe fitting quality considerably (Figure 5C). At the seventhterm, the fitting to the data points far from the crack tip isonly slightly improved (Figure 5D). To quantify the qualityof the fitting process, the difference between the value ofthe experimental data points and those evaluated byWilliams' solution is calculated as the fitting‐uncertainty.Figure 6 shows the behaviour of fitting uncertainty byincreasing the solved number of terms in Williams' series
when AOI = 20 × 20 mm2 and ΔKnom = 20 MPa√m. Itcan be seen that by increasing the number of terms thefitting uncertainty converges to a certain value. No further
improvement in the fitting can be observed by consideringmore than 5 terms. Similar behaviour was observed forother loading conditions. It is consistent with publishedworks34,50,51 suggesting more number of terms should beused in Williams' expansion to obtain the convergence inthe estimated SIF when a large AOI is selected. Therefore,in this work, 5 terms in Williams' expansion were used todescribe the crack tip field.
In order to evaluate the ability of the proposedmethod to be used for in‐service applications, continuousmonitoring of the SIF is studied. The evolution of the SIFduring 2 cycles is shown in Figure 7 for 3 different
FIGURE 7 Continuous evaluation of A, ΔK at ΔKnom = 10 MPa√m, B, ΔKnom = 20 MPa√m, and C, ΔKnom = 30 MPa√m [Colour figure
can be viewed at wileyonlinelibrary.com]
MOKHTARISHIRAZABAD ET AL. 2167

loading levels (ΔK = 10, 20, and 30 MPa√m). The errorbars shown in Figure 7 account for the error related tothe estimation of the crack tip position. It can be seen
that at low loads (ΔK =10 MPa√m), the nominal andexperimental ΔK agree well. For higher loads (Figure 7B,C), the experimental ΔK always overestimates the nom-inal values (ΔKnom). For example, when
ΔKnom = 20 MPa√m, the ΔKexp evaluated the higher
value of 21.6 MPa√m. The difference becomes more sig-nificant for higher loads. For example, for
ΔKnom = 30 MPa√m, the experimental ΔK is equal to
40.8 MPa√m, that is 36% higher than ΔKnom. This behav-iour can be attributed to the development of the plasti-cally deformed zone at the crack tip. It has been statedthat by extending the crack tip plastic zone, the crackbehaves like a crack with larger length.52 Consequently,the displacement field around the crack tip can beaffected by enlarging the crack tip plastic zone. To com-pensate the effect of plasticity at the nominally evaluatedSIF, Irwin's approach53 was used. To this end, the cracktip was located at the centre of the plastic zone. In otherwords, the crack length was computed as the sum ofcrack length (a) and the plastic zone (ry):
acorr ¼ aþ ry (7)
where
ry ¼ 12π
KI
σys
� �2
: (8)
Accordingly, the nominal SIF was recalculated byreplacing the crack length with the corrected crack length(acorr).
52,54 It should be mentioned that both of theoreticaland experimental methods used in this experiment werebased on LEFM. Therefore, the Small Scale Yielding(SSY) condition should be met. Based on ASTM E 647,41
for the geometry of this specimen and the crack length(a = 26.14 mm at the end of cyclic loading), the maxi-mum SIF (Kmax) which can be applied to the sample in
SSY condition is 44.35 MPa√m. Considering the loadratio of 0.3 in this experiment, the maximum SIF range
is 31.04 MPa√m.Figure 7 shows that experimental estimations corrected
with the plastic zone size significantly reduce the difference
between experimental and nominal ΔK from 10.8 MPa√m
to 1.7 MPa√m at ΔKnom = 30 MPa√m. It is worth notingthe small crack growth (0.06 mm) taking place between
cycles at ΔKnom = 30 MPa√m (Figure 7C). The crackgrowth for individual cycles was negligible for lower loads.
The expected value of ΔKII is zero because the CTgeometry allows only opening mode load to be nominally
applied. However, as it can be seen in Figure 6, the exper-
imentally estimated ΔKII is 0.5, 0.9, and 1.9 MPa√m for
ΔK applied of 10, 20, and 30 MPa√m, respectively. Simi-lar behaviour was previously observed and was attributedto local deviation of the growing crack which can inducesome mixed‐mode component.55 This mechanism is oftenreferred to as wedging effect. In addition, the presence ofa local mode II component at the crack tip is obscured bythe poor signal to noise ratio in the horizontal displace-ments that in CT samples are typically one‐third of anorder of magnitude of the vertical displacements.
The effect of collecting data points from different AOIsizes on the δ is shown in Figure 8. It can be seen that thevalue of δ has been confined to less than 10% for applied
ΔK up to 15 MPa√m. However, the difference between thetheoretical and the experimentalΔKI for AOI= 20× 20mm2
increases from 5 to 24.5% when ΔK increases from 15 to
30 MPa√m. Similar behaviour can be seen in Figure 8 forthe different AOIs studied, with AOI = 10 mm having thesteepest increase with growing ΔK.
Figure 8 shows how crack length correction can signifi-cantly improve the accuracy of the nominal SIF evaluationfor higher loads, while it has a negligible effect at low ΔK.For example, for ΔK= 30MPa√m, the value of δ is reducedby 24.6%, 23.6%, and 23.2% for AOIs of 10 × 10, 15 × 15, and20 × 20 mm2, respectively. The plasticity correction hasreduced the value of δ at AOI = 20 × 20 mm2 by 7.9%,
14.9%, and 23.2% for applied ΔK of 20, 25, and 30 MPa√m,
respectively. The higher value of δ at ΔK = 10 MPa√m
rather ΔK = 15 MPa√m can be attributed to the poorernoise to signal ratio at lower applied loads.
Figure 9 shows the evolution of SIFs as a function ofthe applied load during the last loading segment, leadingto the fracture of the sample. It can be observed that byincreasing the load, the difference between the experi-mental and nominal SIF becomes more significant. The
FIGURE 8 Evolution of δ by increasingΔKnom for different sizes of
AOI in mm [Colour figure can be viewed at wileyonlinelibrary.com]
2168 MOKHTARISHIRAZABAD ET AL.
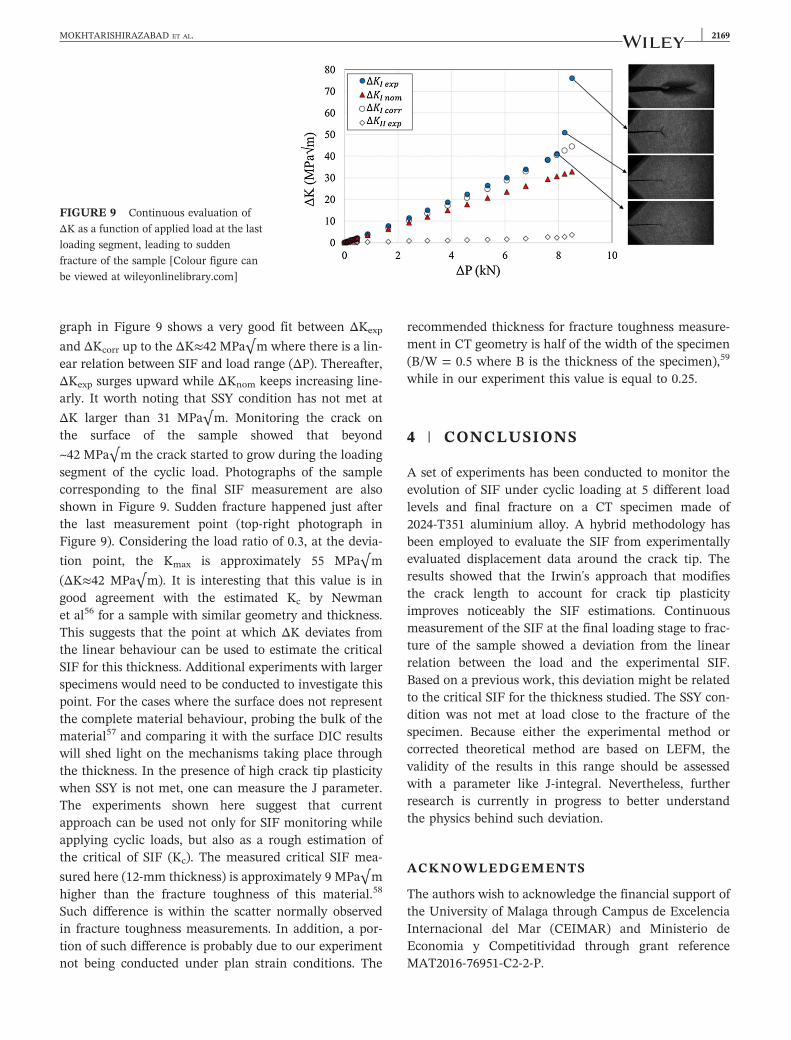
graph in Figure 9 shows a very good fit between ΔKexp
and ΔKcorr up to the ΔK≈42 MPa√m where there is a lin-ear relation between SIF and load range (ΔP). Thereafter,ΔKexp surges upward while ΔKnom keeps increasing line-arly. It worth noting that SSY condition has not met at
ΔK larger than 31 MPa√m. Monitoring the crack onthe surface of the sample showed that beyond
~42 MPa√m the crack started to grow during the loadingsegment of the cyclic load. Photographs of the samplecorresponding to the final SIF measurement are alsoshown in Figure 9. Sudden fracture happened just afterthe last measurement point (top‐right photograph inFigure 9). Considering the load ratio of 0.3, at the devia-
tion point, the Kmax is approximately 55 MPa√m
(ΔK≈42 MPa√m). It is interesting that this value is ingood agreement with the estimated Kc by Newmanet al56 for a sample with similar geometry and thickness.This suggests that the point at which ΔK deviates fromthe linear behaviour can be used to estimate the criticalSIF for this thickness. Additional experiments with largerspecimens would need to be conducted to investigate thispoint. For the cases where the surface does not representthe complete material behaviour, probing the bulk of thematerial57 and comparing it with the surface DIC resultswill shed light on the mechanisms taking place throughthe thickness. In the presence of high crack tip plasticitywhen SSY is not met, one can measure the J parameter.The experiments shown here suggest that currentapproach can be used not only for SIF monitoring whileapplying cyclic loads, but also as a rough estimation ofthe critical of SIF (Kc). The measured critical SIF mea-
sured here (12‐mm thickness) is approximately 9 MPa√mhigher than the fracture toughness of this material.58
Such difference is within the scatter normally observedin fracture toughness measurements. In addition, a por-tion of such difference is probably due to our experimentnot being conducted under plan strain conditions. The
recommended thickness for fracture toughness measure-ment in CT geometry is half of the width of the specimen(B/W = 0.5 where B is the thickness of the specimen),59
while in our experiment this value is equal to 0.25.
4 | CONCLUSIONS
A set of experiments has been conducted to monitor theevolution of SIF under cyclic loading at 5 different loadlevels and final fracture on a CT specimen made of2024‐T351 aluminium alloy. A hybrid methodology hasbeen employed to evaluate the SIF from experimentallyevaluated displacement data around the crack tip. Theresults showed that the Irwin's approach that modifiesthe crack length to account for crack tip plasticityimproves noticeably the SIF estimations. Continuousmeasurement of the SIF at the final loading stage to frac-ture of the sample showed a deviation from the linearrelation between the load and the experimental SIF.Based on a previous work, this deviation might be relatedto the critical SIF for the thickness studied. The SSY con-dition was not met at load close to the fracture of thespecimen. Because either the experimental method orcorrected theoretical method are based on LEFM, thevalidity of the results in this range should be assessedwith a parameter like J‐integral. Nevertheless, furtherresearch is currently in progress to better understandthe physics behind such deviation.
ACKNOWLEDGEMENTS
The authors wish to acknowledge the financial support ofthe University of Malaga through Campus de ExcelenciaInternacional del Mar (CEIMAR) and Ministerio deEconomia y Competitividad through grant referenceMAT2016‐76951‐C2‐2‐P.
FIGURE 9 Continuous evaluation of
ΔK as a function of applied load at the last
loading segment, leading to sudden
fracture of the sample [Colour figure can
be viewed at wileyonlinelibrary.com]
MOKHTARISHIRAZABAD ET AL. 2169

ORCID
M. Mokhtarishirazabad http://orcid.org/0000-0002-5035-0397P. Lopez‐Crespo http://orcid.org/0000-0002-5897-5615
REFERENCES
1. Purushothaman S, Panayotou NF, Tien JK. Synchrotronradiation microradiography of cracks in aluminum alloys.Metall Trans A. 1980;11A:621‐625.
2. Ritchie RO, Garrett GG, Knott JF. Crack‐growth monitoring:optimisation of the electrical potential technique using ananalogue method. Int J Fract Mech. 1971;7:462‐467.
3. Gandossi L, Summers SA, Taylor NG, Hurst RC, Hulm BJ,Parker JD. The potential drop method for monitoring crackgrowth in real components subjected to combined fatigue andcreep conditions: application of FE techniques for derivingcalibration curves. Int J Press Vessels Pip. 2001;78(11‐12):881‐891.
4. Neale BK, Priest RH. On the unloading compliance method forcrack length measurement. Eng Fract Mech. 1984;19(3):441‐448.
5. Wagner D, Ranc N, Bathias C, Paris PC. Fatigue crack initiationdetection by an infrared thermography method. Fatigue FractEng Mater Struct. 2009;33:12‐21.
6. Maslouhi A. Fatigue crack growth monitoring in aluminumusing acoustic emission and acousto‐ultrasonic methods. StructControl Health Monit. 2011;18(7):790‐806.
7. Zilberstein V, Grundy D, Weiss V, et al. Early detection andmonitoring of fatigue in high strength steels with MWM‐arrays.Int J Fatigue. 2005;27(10‐12):1644‐1652.
8. Hamia R, Cordier C, Dolabdjian C. Eddy‐current non‐destructivetesting system for the determination of crack orientation. NDTand E Int. 2014;61:24‐28.
9. Nakazawa H, Hirano K. Ultrasonic monitoring techniques ofcrack growth and fracture mechanics evaluation of materials.Jpn J Appl Phys. 1984;23(S1):12‐16.
10. ASTM E1685‐13, Standard practice for measuring the change inlength of fasteners using the ultrasonic pulse‐echo technique,West Conshohocken, PA: ASTM International; 2013.
11. Cuadra J, Vanniamparambil PA, Hazeli K, Bartoli I, KontsosAA. Hybrid optico‐acoustic NDE approach for deformationand damage monitoring. In: Kag J, Jablonski D, Dudzinski D,eds. Evaluation of Existing and New Sensor Technologies forFatigue, Fracture and Mechanical Testing, STP 1584. WestConshohocken,PA: ASTM International; 2015:135‐146.
12. Vanniamparambil PA, Bartoli I, Hazeli K, et al. An integratedstructural health monitoring approach for crack growthmonitoring. J Intell Mater Syst Struct. 2012;23(14):1563‐1573.
13. Whittaker VN. A review of non‐destructive measurement offlaw size. Non‐Destr Test. 1972;5(2):92‐100.
14. Gao P, Wang C, Li Y, Cong Z. Electromagnetic and eddy currentNDT in weld inspection: a review. Insight: Non‐DestructiveTesting and Condition Monitoring. 2015;43:337‐345.
15. Scruby CB. An introduction to acoustic emission. J Phys E: SciInstrum. 1987;20(8):946‐953.
16. Ramesh K, Gupta S, Kelkar AA. Evaluation of stress fieldparameters in fracture mechanics by photoelasticity—revisited.Eng Fract Mech. 1997;56(1):25‐45.
17. Diaz FA, Patterson EA, Tomlinson RA, Yates JR. Measuringstress intensity factors during fatigue crack growth usingthermoelasticity. Fatigue Fract Eng Mater Struct. 2004;27(7):571‐583.
18. Nowell D, De Matos PFP. Application of digital image correlationto the investigation of crack closure following overloads. ProcediaEng. 2010;2(1):1035‐1043.
19. McNeill SR, Peters WH, Sutton MA. Estimation of stressintensity factor by digital image correlation. Eng Fract Mech.1987;28(1):101‐112.
20. Lopez‐Crespo P, Mostafavi M, Steuwer A, Kelleher JF, BuslapsT, Withers PJ. Characterisation of overloads in fatigue by 2Dstrain mapping at the surface and in the bulk. Fatigue FractEng Mater Struct. 2016;39(8):1040‐1048.
21. Yoneyama S, Kitagawa A, Iwata S, Tani K, Kikuta H. Bridgedeflection measurement using digital image correlation. ExpTech. 2007;31(1):34‐40.
22. Sutton MA, Li N, Joy DC, Reynolds AP, Li X. Scanning electronmicroscopy for quantitative small and large deformationmeasurements part I: SEM imaging at magnifications from 200to 10,000. Exp Mech. 2007;47(6):775‐787.
23. Carroll JD, Abuzaid W, Lambros J, Sehitoglu H. High resolutiondigital image correlation measurements of strain accumulationin fatigue crack growth. Int J Fatigue. 2013;57:140‐150.
24. Pan B, Yu L, Wu D. High‐accuracy 2D digital image correlationmeasurements with bilateral telecentric lenses: error analysisand experimental verification. Exp Mech. 2013;53(9):1719‐1733.
25. Pan B, Wang B. Digital image correlation with enhancedaccuracy and efficiency: a comparison of two subpixel registrationalgorithms. Exp Mech. 2016;56(8):1395‐1409.
26. Luo PF, Chao YJ, Sutton MA, Peters WH. Accurate measurementof three‐dimensional deformations in deformable and rigid bodiesusing computer vision. Exp Mech. 1993;33(2):123‐132.
27. Sutton MA, Mingqi C, Peters WH, Chao YJ, McNeill SR.Application of an optimized digital correlation method toplanar deformation analysis. Image Vis Comput. 1986;4(3):143‐150.
28. Sutton MA, Orteu JJ, Schreier H. Image Correlation for Shape,Motion and Deformation Measurements: Basic Concepts, Theoryand Applications. New York: Springer Science & BusinessMedia; 2009.
29. Sutton MA, Matta F, Rizos D, et al. Recent progress in digitalimage correlation: background and developments since the2013 W M Murray lecture. Exp Mech. 2017;57(1):1‐30.
30. Hamam R, Hild F, Roux S. Stress intensity factor gauging bydigital image correlation: application in cyclic fatigue. Strain.2007;43(3):181‐192.
31. Yates JR, Zanganeh M, Tai YH. Quantifying crack tip displacementfields with DIC. Eng Fract Mech. 2010;77(11):2063‐2076.
32. Díaz FA, Burguete RL, Patterson EA. Evaluation using digitalimage correlation of stress intensity factors in an aerospacepanel. Exp Mech. 2011;51:45‐57.
2170 MOKHTARISHIRAZABAD ET AL.
33. Lopez‐Crespo P, Shterenlikht A, Yates JR, Patterson EA,Withers PJ. Some experimental observations on crack closureand crack‐tip plasticity. Fatigue Fract Eng Mater Struct.2009;32(5):418‐429.
34. Yoneyama S, Ogawa T, Kobayashi Y. Evaluating mixed‐modestress intensity factors from full‐field displacement fields obtainedby optical methods. Eng Fract Mech. 2007;74(9):1399‐1412.
35. Lopez‐Crespo P, Shterenlikht A, Patterson EA, Withers PJ,Yates JR. The stress intensity of mixed mode cracks determinedby digital image correlation. J Strain Anal Eng Des.2008;43(8):769‐780.
36. Zanganeh M, Lopez‐Crespo P, Tai YH, Yates JR. Locating thecrack tip using displacement field data: a comparative study.Strain. 2013;49(2):102‐115.
37. Yoneyama S, Arikawa S, Kusayanagi S, Hazumi K. EvaluatingJ‐integral from displacement fields measured by digital imagecorrelation. Strain. 2014;50(2):147‐160.
38. deMatos PFP, Nowell D. Experimental and numerical investigationof thickness effects in plasticity‐induced fatigue crack closure. Int JFatigue. 2009;31(11‐12):1795‐1804.
39. Díaz FV, Kaufmann GH, Armas AF, Galizzi GE. Opticalmeasurement of the plastic zone size in a notched metalspecimen subjected to low‐cycle fatigue. Opt Lasers Eng.2001;35(6):325‐333.
40. Vasco‐Olmo JM, James MN, Christopher CJ, Patterson EA, DíazFA. Assessment of crack tip plastic zone size and shape and itsinfluence on crack tip shielding. Fatigue Fract Eng Mater Struct.2016;39(8):969‐981.
41. ASTM E647‐15, Standard Test Method for Measurement ofFatigue Crack Growth Rates. West Conshohocken, PA: 2015.
42. Chaves V. Ecological criteria for the selection of materials infatigue. Fatigue Fract Eng Mater Struct. 2014;37(9):1034‐1042.
43. Mokhtarishirazabad M, Lopez‐Crespo P, Moreno B,Lopez‐Moreno A, Zanganeh M. Evaluation of crack‐tip fieldsfrom DIC data: a parametric study. Int J Fatigue. 2016;89:11‐19.
44. Shterenlikht A, Díaz‐Garrido FA, Lopez‐Crespo P, Withers PJ,Patterson EA. Mixed mode (KI + KII) stress intensity factormeasurement by electronic speckle pattern interferometry andimage correlation. Appl Mech Mater. 2004;1‐2:107‐112.
45. Lopez‐Crespo P, Burguete RL, Patterson EA, Shterenlikht A,Withers PJ, Yates JR. Study of a crack at a fastener hole bydigital image correlation. Exp Mech. 2009;49(4):551‐559.
46. Lopez‐Crespo P, Moreno B, Lopez‐Moreno A, Zapatero J.Characterisation of crack‐tip fields in biaxial fatigue based on
high‐magnification image correlation and electro‐spray technique.Int J Fatigue. 2015;71:17‐25.
47. Sutton MA, Turner JL, Chao YJ, Bruck HA, Chae TL.Experimental investigations of three‐dimensional effects near acrack tip using computer vision. Int J Fract. 1992;53:201‐228.
48. Vic‐2D V6 Reference Manual, Correlated Solutions Incorporated(C.S.Inc). n.d.
49. Murakami Y. Stress Intensity Factors Handbook. Oxford:Pergamon Press; 1987.
50. Shukla A, Dally JW. Experimental Solid Mechanics. Second ed.LLC: College House Enterprises; 2014.
51. Yoneyama S, Morimoto Y, Takashi M. Automatic evaluation ofmixed‐mode stress intensity factors utilizing digital imagecorrelation. Strain. 2006;42(1):21‐29.
52. Irwin GR. Linear fracture mechanics, fracture transition, andfracture control. Eng Fract Mech. 1968;1(2):241‐257.
53. Irwin GR. Plastic zone near a crack and fracture toughness.Sagamore Ordnance Materials Conference, Syracuse University:1961.
54. Heyer RH, McCabe DE. Crack growth resistance in plane‐stressfracture testing. Eng Fract Mech. 1972;4(3):413‐430.
55. Tong J, Yates JR, Brown MW. A model for sliding mode crackclosure. Parts I and II. Eng Fract Mech. 1995;52(4):599‐623.
56. Newman JC Jr. An evaluation of fracture analysis methods. In:Newman JC Jr, Loss FJ, eds. ASTM STP 896, Philadelphia:American Society for Testing and Materials; 1985:5‐96.
57. Withers PJ, Lopez‐Crespo P, Kyrieleis A, Hung Y‐C. Evolutionof crack‐bridging and crack‐tip driving force during the growthof a fatigue crack in a Ti/SiC composite. Proc Roy Soc A, MathPhys Eng Sci. 2012;468(2145):2722‐2743.
58. Kaufman JG. Fracture Resistance of Aluminum Alloys: NotchToughness, Tear Resistance, and Fracture Toughness. ASMInternational; 2001.
59. ASTM E1820 Standard test Method for measurement of fracturetoughness. Annual book of ASTM Standard, vol. 03, WestConshohocken, PA 19428.: ASTM International; 2003.
How to cite this article: Mokhtarishirazabad M,Lopez‐Crespo P, Zanganeh M. Stress intensityfactor monitoring under cyclic loading by digitalimage correlation. Fatigue Fract Eng Mater Struct.2018;41:2162–2171. https://doi.org/10.1111/ffe.12825
MOKHTARISHIRAZABAD ET AL. 2171

Appendix III
Published Paper #3
Title: Optical and analytical investigation of overloads in biaxial fatigue cracks
Authors: M. Mokhtarishirazbad1, P. Lopez-Crespo1, B. Moreno1, A. Lopez-Moreno2, M.
Zanganeh3
1Department of Civil and Materials Engineering, University of Malaga, C/Dr Ortiz Ramos s/n, 29071, Malaga, Spain
2Department of Materials Science and Metallurgy Engineering, University of Jaen, Campus Las Lagunillas, 23071,
Jaen, Spain
3Jacobs Technology, NASA Johnson Space Center, Houston TX, USA
Journal: International Journal of Fatigue, Volume 100, Part 2, July 2017, Pages 583-590
Impact Factor: 3.132 , Q1 in JCR

Optical and analytical investigation of overloads in biaxial fatigue cracks
M. Mokhtarishirazabad a, P. Lopez-Crespo a,⇑, B. Moreno a, A. Lopez-Moreno b, M. Zanganeh c
aDepartment of Civil and Materials Engineering, University of Malaga, C/Dr Ortiz Ramos s/n, 29071 Malaga, SpainbDepartment of Materials Science and Metallurgy Engineering, University of Jaen, Campus Las Lagunillas, 23071 Jaen, Spainc Jacobs Technology, NASA Johnson Space Center, Houston TX, USA
a r t i c l e i n f o
Article history:Received 24 October 2016Received in revised form 22 December 2016Accepted 23 December 2016Available online 27 December 2016
Keywords:Biaxial fatigueOverloadSt-52-3N steelDigital image correlation
a b s t r a c t
Structural components are often subjected to complex multiaxial loading conditions. The study of fatiguecracks under such conditions is not easy from an experimental point of view and most works tend tofocus more on the simpler but less realistic case of uni-axial loading. Consequently, there are many uncer-tainties related to the load sequence effect that is now well known and is not normally incorporated intothe growth models. The current work presents a new methodology for evaluating overload effect in biax-ial fatigue cracks. The methodology includes evaluation of mixed-mode (DKI and DKII) stress intensityfactor and the Crack Opening Displacement for samples with and without overload cycle under biaxialloading. The methodology is tested under two different load levels and a range of crack lengths. Allcrack-tip information is obtained with a hybrid optical-analytical methodology. It combines experimen-tal full-field digital image correlation data and Williams’ elastic model describing the crack-tip field.
� 2016 Elsevier Ltd. All rights reserved.
1. Introduction
Good estimation of fracture parameters is key to achieve reli-able life predictions for mechanical components. A number of suc-cessful approaches have been presented for estimatingexperimentally essential fracture parameters such as stress inten-sity factor (SIF) experimentally [1]. Apart from the conventionalstandard test methods [2], it has been shown that crack-tip fields(strain, stress and displacement field) include essential informa-tion for accurate estimation of fracture parameters [3]. A numberof different techniques are able to provide both surface and bulkinformation. Surface techniques include photo-elasticity [4],thermo-elasticity [5], Moiré interferometry [6] and digital imagecorrelation (DIC) [7]. Bulk techniques include neutron diffraction[8] and X-ray diffraction [9]. Among all these full-field techniques,DIC has received enormous attention recently [10,11] because ofits many advantages compared to other techniques [12]. Simplic-ity, accuracy and flexibility are the most prominent merits of DICtechnique for calculating displacement fields [13]. While fractureproblems can be simplified by considering mode I loading, cracksin structural materials are generally under mixed-mode loadingcondition [3]. Therefore, estimation of the fracture parametersbased on mixed-mode loading condition will be more representa-tive of the material fracture behaviour under the actual working
condition. Different optical methods have been used for obtainingfull-field information required for mixed-mode loading analysispreviously. Sanford and Dally [14] have determined the mixed-mode SIFs by utilising isochromatic fringes near the crack-tip. Theyhave reported that employing an over-deterministic approach onthe data points provided by the full filed fringe patterns led to ahighly accurate SIF estimation. Displacement fields derived byDIC technique have been utilised by Yoneyama et al. [15] to eval-uate the mixed-mode SIFs of a polymer (polymethyl-methacrylate). While they used a non-linear least square methodfor their solutions, Réthoré et al. [16] have developed a methodbased on the Lagrangian conservation law for mixed-mode SIFsestimations. A good agreement between analytical displacementfields generated based on the Muskhilishvili’s complex functionapproach and the experimentally measured displacement fields(obtained by DIC) has been also reported by Lopez-Crespo et al.[17]. By fitting the analytical model and experimental data, theyhave determined mixed-mode SIFs for a crack in a fastener hole.
Some of these approaches based on full-field techniques havebeen applied to study the effect of overload on fatigue cracks. Forexample, DIC was used to study the effect of overload on CT spec-imens made of 6082 Al alloy [18]. Comparison of the opening loadobtained by DIC and that obtained by strip-yield model was usefulto understand the influence of the aspect ratio of the crack on theclosure behaviour. Similar conclusions were drawn by employing acombination of DIC and Muskhelishvili’s complex potential devel-opment on 316L austenitic steel [19]. Full-field photo-elasticity
http://dx.doi.org/10.1016/j.ijfatigue.2016.12.0350142-1123/� 2016 Elsevier Ltd. All rights reserved.
⇑ Corresponding author.E-mail address: [email protected] (P. Lopez-Crespo).
International Journal of Fatigue 100 (2017) 583–590
Contents lists available at ScienceDirect
International Journal of Fatigue
journal homepage: www.elsevier .com/locate / i j fa t igue
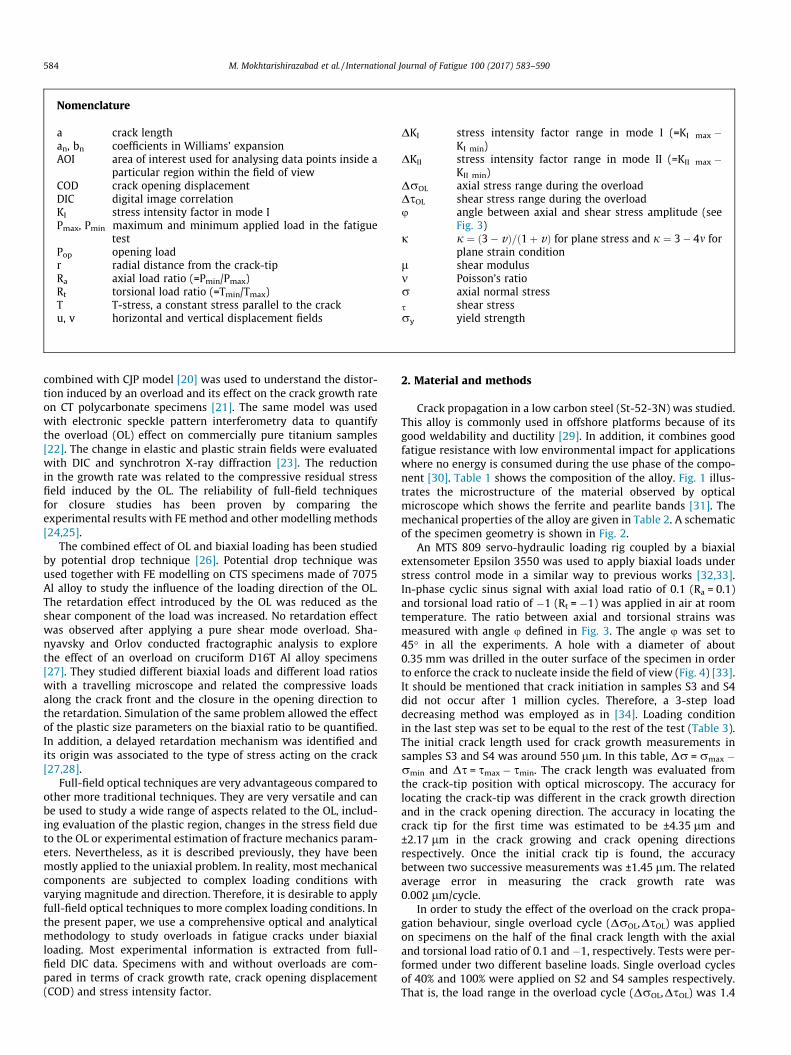
combined with CJP model [20] was used to understand the distor-tion induced by an overload and its effect on the crack growth rateon CT polycarbonate specimens [21]. The same model was usedwith electronic speckle pattern interferometry data to quantifythe overload (OL) effect on commercially pure titanium samples[22]. The change in elastic and plastic strain fields were evaluatedwith DIC and synchrotron X-ray diffraction [23]. The reductionin the growth rate was related to the compressive residual stressfield induced by the OL. The reliability of full-field techniquesfor closure studies has been proven by comparing theexperimental results with FE method and other modelling methods[24,25].
The combined effect of OL and biaxial loading has been studiedby potential drop technique [26]. Potential drop technique wasused together with FE modelling on CTS specimens made of 7075Al alloy to study the influence of the loading direction of the OL.The retardation effect introduced by the OL was reduced as theshear component of the load was increased. No retardation effectwas observed after applying a pure shear mode overload. Sha-nyavsky and Orlov conducted fractographic analysis to explorethe effect of an overload on cruciform D16T Al alloy specimens[27]. They studied different biaxial loads and different load ratioswith a travelling microscope and related the compressive loadsalong the crack front and the closure in the opening direction tothe retardation. Simulation of the same problem allowed the effectof the plastic size parameters on the biaxial ratio to be quantified.In addition, a delayed retardation mechanism was identified andits origin was associated to the type of stress acting on the crack[27,28].
Full-field optical techniques are very advantageous compared toother more traditional techniques. They are very versatile and canbe used to study a wide range of aspects related to the OL, includ-ing evaluation of the plastic region, changes in the stress field dueto the OL or experimental estimation of fracture mechanics param-eters. Nevertheless, as it is described previously, they have beenmostly applied to the uniaxial problem. In reality, most mechanicalcomponents are subjected to complex loading conditions withvarying magnitude and direction. Therefore, it is desirable to applyfull-field optical techniques to more complex loading conditions. Inthe present paper, we use a comprehensive optical and analyticalmethodology to study overloads in fatigue cracks under biaxialloading. Most experimental information is extracted from full-field DIC data. Specimens with and without overloads are com-pared in terms of crack growth rate, crack opening displacement(COD) and stress intensity factor.
2. Material and methods
Crack propagation in a low carbon steel (St-52-3N) was studied.This alloy is commonly used in offshore platforms because of itsgood weldability and ductility [29]. In addition, it combines goodfatigue resistance with low environmental impact for applicationswhere no energy is consumed during the use phase of the compo-nent [30]. Table 1 shows the composition of the alloy. Fig. 1 illus-trates the microstructure of the material observed by opticalmicroscope which shows the ferrite and pearlite bands [31]. Themechanical properties of the alloy are given in Table 2. A schematicof the specimen geometry is shown in Fig. 2.
An MTS 809 servo-hydraulic loading rig coupled by a biaxialextensometer Epsilon 3550 was used to apply biaxial loads understress control mode in a similar way to previous works [32,33].In-phase cyclic sinus signal with axial load ratio of 0.1 (Ra = 0.1)and torsional load ratio of �1 (Rt = �1) was applied in air at roomtemperature. The ratio between axial and torsional strains wasmeasured with angle u defined in Fig. 3. The angle u was set to45� in all the experiments. A hole with a diameter of about0.35 mm was drilled in the outer surface of the specimen in orderto enforce the crack to nucleate inside the field of view (Fig. 4) [33].It should be mentioned that crack initiation in samples S3 and S4did not occur after 1 million cycles. Therefore, a 3-step loaddecreasing method was employed as in [34]. Loading conditionin the last step was set to be equal to the rest of the test (Table 3).The initial crack length used for crack growth measurements insamples S3 and S4 was around 550 lm. In this table, Dr = rmax �rmin and Ds = smax � smin. The crack length was evaluated fromthe crack-tip position with optical microscopy. The accuracy forlocating the crack-tip was different in the crack growth directionand in the crack opening direction. The accuracy in locating thecrack tip for the first time was estimated to be ±4.35 lm and±2.17 lm in the crack growing and crack opening directionsrespectively. Once the initial crack tip is found, the accuracybetween two successive measurements was ±1.45 lm. The relatedaverage error in measuring the crack growth rate was0.002 lm/cycle.
In order to study the effect of the overload on the crack propa-gation behaviour, single overload cycle (DrOL,DsOL) was appliedon specimens on the half of the final crack length with the axialand torsional load ratio of 0.1 and �1, respectively. Tests were per-formed under two different baseline loads. Single overload cyclesof 40% and 100% were applied on S2 and S4 samples respectively.That is, the load range in the overload cycle (DrOL,DsOL) was 1.4
Nomenclature
a crack lengthan, bn coefficients in Williams’ expansionAOI area of interest used for analysing data points inside a
particular region within the field of viewCOD crack opening displacementDIC digital image correlationKI stress intensity factor in mode IPmax, Pmin maximum and minimum applied load in the fatigue
testPop opening loadr radial distance from the crack-tipRa axial load ratio (=Pmin/Pmax)Rt torsional load ratio (=Tmin/Tmax)T T-stress, a constant stress parallel to the cracku, v horizontal and vertical displacement fields
DKI stress intensity factor range in mode I (=KI max �KI min)
DKII stress intensity factor range in mode II (=KII max �KII min)
DrOL axial stress range during the overloadDsOL shear stress range during the overloadu angle between axial and shear stress amplitude (see
Fig. 3)j j ¼ ð3� vÞ=ð1þ vÞ for plane stress and j ¼ 3� 4m for
plane strain conditionl shear modulusm Poisson’s ratior axial normal stresss shear stressry yield strength
584 M. Mokhtarishirazabad et al. / International Journal of Fatigue 100 (2017) 583–590

and 2 times larger than load range during the rest of the test (Dr,Ds) for S2 and S4 samples, respectively. The cyclic loading thencontinued until the crack length reached about 1.45 mm. Thesecant method recommended in ASTM standard [35] has beenemployed to examine the rate of the fatigue crack growth. Table 3shows the loading condition for samples with and withoutoverload.
In addition, to evaluate the closure level, near tip crack openingdisplacement was measured by DIC [19,36]. To this end a virtualextensometer was placed 60 lm behind the crack-tip to measurethe displacement in the crack opening direction [37]. Fig. 4 showsthe positions of the virtual extensometer and crack initiation anglefor S2 sample as an example.
2.1. Fatigue crack growth
The effect of single overload was studied by observing the evo-lution of the crack length versus the number of cycles. Fig. 5 showshow applying a single overload cycle can affect the crack growthbehaviour for two different baseline loads. The test was stoppedwhen the crack length was �1.5 mm for all samples. Fig. 5a showsthat high loads produced lives of 58,000 and 66,000 cycles for thespecimens with no OL (S1) and with OL (S2), respectively. Fig. 5bshows that low loads produced lives of 136,000 and 138,000 cyclesfor the specimens with no OL (S3) and with OL (S4), respectively. Itis clear that the increase in fatigue life due to OL is greater in thehigh baseline load. While retardation in the crack growth isobserved right after the application of a 40% overload in sampleS2 (Fig. 5a), a static jump of 58 lm in the crack length followedby a delayed retardation was observed after the 100% overloadon sample S4 (Fig. 5b). Carlson et al. [38] argued that the fractureduring the overload cycle or a few cycles afterwards of thestretched region located just ahead of the crack-tip can result indisappearing the delayed retardation period. This can rationalisethe absence of the delayed retardation in sample S2 which wasunder higher baseline loads and the existence of the delayed retar-dation in S4. Delays of �8000 and �2000 cycles were observed at
Table 1Chemical composition in weight % of St-52-3N steel. The balance is Fe.
C Si Mn P S Cr Ni Mo
0.17 0.22 1.23 0.01 >0.0001 0.07 0.06 0.16
Fig. 1. The microstructure of St52-3N steel. Black and white vertical bands areshowing the pearlite and ferrite bands, respectively [31].
Table 2Monotonic properties of St-52-3N steel.
Yield stress, ry 386 MPaUltimate tensile stress, ru 639 MPaYoung’s modulus, E 206 GPaShear Modulus 78 GPa
Fig. 2. The geometry of the hollow cylinder specimen with a central hole. Alldimensions are in mm.
Fig. 3. Definition of angle between axial and shear stress amplitude.
Fig. 4. The position of virtual extensometers for COD examination. The white boldmark shows the crack-tip position.
M. Mokhtarishirazabad et al. / International Journal of Fatigue 100 (2017) 583–590 585

the end of the test for samples S2 and S4 respectively, as comparedto the non-overload condition.
The crack growth rate is plotted as a function of crack length inFig. 6. The overall higher da/dN values in Fig. 6a than in Fig. 6bindicate that growth rates observed in high load tests are on aver-age 8 times faster than rates in low load tests. It is worth noting thelogarithmic scale in the vertical axes in Fig. 6. The observed oscil-lation in this graph can be attributed to a combination of experi-mental error and the effect of microstructural barriers [31]. As itwas mentioned previously, the microstructure of this alloy is madeof ferrite and pearlite bands. Pearlite bands have a greater resis-tance due to higher percentage of carbon and can act asmicrostructural barrier [39].
The general regimes of crack growth rate after overload areacceleration, retardation and recovery [38]. Acceleration in crackgrowth rate just after the overload has been attributed to thecrack-tip stretching which can lead to an increase in the effectivestress intensity range [38].
Samples S2 and S4 exhibited different post-overload behaviour.After applying the overload cycle on S4, the growth rate did notdecrease suddenly as expected [26]. Instead, the growth ratedecreased gradually (from point B to point D in Fig. 6b). This phe-nomenon is normally referred to as delayed retardation[26,27,38,40] and lasted until the crack length was 0.890 mm.While the drop between acceleration and retardation occurredover a crack growth of 7 lm on S2, the drop required a 147 lmgrowth on S4 (between point C and point D in Fig. 6b). Shanyavskyand Orlov observed a very similar trend [27]. They suggested thatwhile shear stress in mode III is the dominant fracture process onthe specimen surface right after an overload cycle, subsequentcrack growth acceleration (point D to E in Fig. 6b) is due to crackpropagation in the interior by mode I opening. The differencebetween the OL condition and the non-OL condition is larger forhigh loads. That is, after the OL cycle, the difference between S1and S2 in Fig. 6a is greater than the differences between S3 andS4 in Fig. 6b, even though the OL factor in S2 was smaller than
Table 3Axial and shear stress values for specimens with and without overload cycle.
Specimen Crack length at OL (lm) Dr (MPa) Ds (MPa) DrOL (MPa) DsOL (MPa)
S1 – 216 277 – –S2 669 216 277 302.4 388S3 – 162 230 – –S4 689 162 230 324 460
Fig. 5. Evolution of crack length versus number of cycles for samples with andwithout overload cycle, (a) samples S1 and S2 under higher cyclic loads, (b) samplesS3 and S4 under lower cyclic loads.
Fig. 6. Crack growth rate as a function of the crack length for high (a) and low (b)baseline cyclic load.
586 M. Mokhtarishirazabad et al. / International Journal of Fatigue 100 (2017) 583–590

the OL factor in S4. By the end of the test, there are still noticeabledifferences for the low loads (Fig. 6a). For the high baseline loads,the differences are smaller. The end of the retardation stage occurswhen the OL growth rate curve meets the no-OL curve. Thus, by theend of the test sample S2 seems to be still in the retardation stage(Fig. 6a) and sample S4 seems to be coming out of the retardationstage (Fig. 6b). This is probably caused by the retardation inducedin S2 being more pronounced than the retardation in S4.
2.2. Processing of displacement information
Crack-tip displacement data was measured by DIC. Theobtained displacement data was then fitted into Williams’ series[41,42]:
Mode I
uI ¼X1n¼1
rn2
2l an jþ n2 þ ð�1Þn� �
cos nh2 � n
2 cos ðn�4Þh2
n o
v I ¼X1n¼1
rn2
2l an j� n2 � ð�1Þn� �
sin nh2 þ n
2 sin ðn�4Þh2
n o
8>>>><>>>>:
9>>>>=>>>>;
ð1Þ
and
Mode II
uII ¼ �X1n¼1
rn2
2l bn jþ n2 � ð�1Þn� �
sin nh2 � n
2 sin ðn�4Þh2
n o
v II ¼X1n¼1
rn2
2l bn j� n2 þ ð�1Þn� �
cos nh2 þ n
2 cos ðn�4Þh2
n o
8>>>><>>>>:
9>>>>=>>>>;
ð2Þwhere uI and vI are horizontal and vertical displacements in
mode I respectively, uII and vII are horizontal and vertical displace-ments in mode II respectively, l is the shear modulus,j ¼ ð3� mÞ=ð1þ mÞ for plane stress and j ¼ 3� 4m for plane straincondition, t is the Poisson’s ratio, r and h are polar coordinates withthe crack-tip being the origin of coordinates, and a and b areconstants.
Eqs. (1) and (2) can be written in terms of the SIFs as follows:
u ¼ KI
2l
ffiffiffiffiffiffiffir2p
rcos
h2
j� 1þ 2 sin2 h2
� �þ KII
2l
ffiffiffiffiffiffiffir2p
r
� sinh2
jþ 1þ 2 cos2h2
� �þ T8l
rðjþ 1Þ cos h ð3Þ
v ¼ KI
2l
ffiffiffiffiffiffiffir2p
rsin
h2
jþ 1� 2 cos2h2
� �� KII
2l
ffiffiffiffiffiffiffir2p
r
� cosh2
j� 1� 2 cos2h2
� �þ T8l rðj� 3Þ sin h ð4Þ
by using
KI ¼ a1ffiffiffiffiffiffiffi2p
p; KII ¼ �b1
ffiffiffiffiffiffiffi2p
p; T ¼ 4a2 ð5Þ
where KI and KII are the mode I and II of SIF respectively and T rep-resents T-stress.
In order to improve the quality of the SIF estimations, the rec-ommendations given in [43] were followed. Accordingly, a highorder interpolation scheme of optimized 8-tap spline was usedfor DIC analysis to achieve sub-pixel accuracy. The zero-normalized sum of squared differences was set as the correlationcriterion in order to vanish the effect of offset and scale in lighting[13]. The subset size was adjusted to 31 � 31 pixels. In addition,just 25% of the crack line was considered in the area of interest(the area where the displacement data were measured by DIC).The relative error in the estimated displacement (and consequentlyin COD) was 2.95%. This relative error was estimated from thequality of the correlation of the images taken at different loads.By taking to account the size of the area of interest
(0.4 � 0.4 mm2), two terms in the Williams’ solution were usedas suggested in [43]. Neglecting T-stress which appears at the sec-ond term of Williams’ series can also induce a significant error inSIFs calculations in short crack length examinations [3].
In order to extract the vertical and the horizontal displacementswith respect the axial loading axis, captured images have beenrotated so that the crack appears horizontal in all images. Fig. 7illustrates the vertical displacement contour for an area of interestaround a crack with a length of 0.689 mm (sample S2)1. The imageswere rotated 37� clockwise so that the crack line was horizontal [44].Displacement data points inside an area of 0.4 � 0.4 mm2 wereextracted and fitted to Williams’ solution in order to calculate SIFs.
The crack opening displacement, COD was also evaluated fromthe DIC data. A post processing routine was developed to measurethe COD with a virtual extensometer as follows:
CODðxÞ ¼ vbot � v top ð6Þ
where u and v are the horizontal and vertical displacement respec-tively, and x is the distance of the extensometer behind the crack-tip (here x = 60 lm). The subscripts ‘‘top” and ‘‘bot” refer to theposition of the virtual extensometer points relative to the crack line.The compliance based algorithm proposed by Skorupa et al. [45] hasbeen utilised to study the fatigue crack closure in this paper. Thismethod includes six main steps: 1. Smoothing the data 2. Convert-ing the smoothed data into a ‘‘loop data” 3. Data re-discretization inorder to obtain a uniform spaced data points 4. Rotating the unloadbranch by 180 degrees and 6. Determination of closure parametersby finding the overlap between the loading branch with 25% of theupper part of the rotated unloading branch. The inflection pointalong the loading portion of the cycle is used to estimate the open-ing load (Pop). This method has been used by other authors for char-acterising fatigue crack closure using local compliancemeasurements [46]. A cubic spline data smoothing has been appliedon extracted load-local displacement data with a smoothing param-eter equal to 0.9995 [47].
3. Results and discussion
The evolution of COD during a complete cycle (loading andunloading) at 60 lm behind the crack-tip for different cracklengths in all samples is shown in Fig. 8. For the specimens not sub-jected to OL, the maximum COD in a cycle increases approximatelyin a linear manner with the crack length (Figs. 8a and 7c). There is amore drastic increment as the crack grows in the COD for highbaseline load (Fig. 8a) than for the low baseline load (Fig. 8c), asone would expect. An increment of 54 MPa and 47 MPa in axialand shear stress between sample S3 and sample S1 (see Table 3)makes the COD rate increasing 52 times faster. Fig. 8 also showsa larger overall scattering of the COD data in low baseline loads(Figs. 8c and 7d) compared to high baseline loads (Fig. 8a and b).This is probably due to the lower signal to noise ratio of the DICdata in the low load experiments.
The effect of applying an axial-torsional overload of 40% on theevolution of COD is clear in Figs. 8a and 7b. For high baseline loadswithout an OL, the maximum COD measured at the end of the test(crack length �1.4 mm) is 7.3 lm (Fig. 8a) and with an OL, theequivalent COD is 2.6 lm (Fig. 8b). That is, the 40% OL produceda reduction in the maximum COD by the end of the test of 64%.For low baseline loads, the maximum COD values at the end ofthe text are 3.4 lm (Fig. 8c) and 2.1 lm (Fig. 8d) for the tests with-out and with OL, respectively. That is, a 38% reduction caused bythe 100% OL on the low baseline load. In terms of COD, the reduc-
1 For interpretation of color in Fig. 8, the reader is referred to the web version ofthis article.
M. Mokhtarishirazabad et al. / International Journal of Fatigue 100 (2017) 583–590 587

tion in COD is more pronounced in the high load and 40% OL thanin the low load and 100% OL.
Fig. 8b shows that soon after applying the OL on the high loadsample (S2), the COD falls from �2 lm to �1.2 lm. After the crackgrows 384 lm (total crack length = 1.057 mm), the COD is reducedfurther to around 0.8 lm. When the crack has extended by 335 lm(total crack length = 1.392 mm), the COD increases to�2.6 lm. Theequivalent COD for the non-overloaded sample subjected to similarloads is 7.3 lm (Fig. 8a).
The maximum COD over a cycle is a useful parameter to under-stand the stage of the crack growth. The acceleration stage is notcaptured in Figs. 8b and 7d because for the level of magnificationin use, it was not possible to image the crack-tip region duringthe OL cycle. The decrease in COD 5 cycles after applying the OL(yellow curve with square markers in Fig. 8b) indicates that thecrack is in the retardation stage. After a further 6210 cycles (bluecurve with diamond markers in Fig. 8b) the even lower COD valuesreveal that the crack is still well in the retardation stage. A compar-ison between the latest COD measurement in the overloaded spec-imens (red curve with circle markers in Fig. 8a and b) suggests that9160 cycles after the OL the crack is still in the retardation stage.This is also in agreement with the crack growth curve in the OLcase being clearly below the non-OL curve in Fig. 6a.
A closer look at the COD behaviour of S4 sample (Fig. 8d) showsthat after applying the overload there has been a slight increase inthe CODmax since it raised from �1.8 lm to �2.1 lm at the cracklength of 0.811 mm (point C in Fig. 6b). It should be noted here thatlarge crack wake opening due to overload made it impossible toposition the virtual extensometer at the exact location as for pre-overloading measurements. CODmax has then decreased to�1.8 lm at the crack length of 0.852 mm which is correspondingto point D in Fig. 6b. Subsequent crack growth makes the CODmax
to increase up to �2 lm when the crack length is 1.443 mm (pointE in Fig. 6b). It can be seen that applying the overload on sample S4,resulted in a 39% decrease in the CODmax compared to the refer-ence sample (S3) at the same crack length.
Larger COD values are indicative of higher cyclic damage in thematerial. Accordingly, COD can be used as an estimation of the
Fig. 8. COD behaviour during loading and unloading cycle for different crack lengths of specimens. The number of cycles before and after overload where overload cycle wasconsidered as 0 cycles, are shown in the graph b.
Fig. 7. The position of the area of interest for deriving the displacement field aheadof a crack with the length of 0.669 mm after 53,500 cycles (sample S2). The imagehas been rotated, so that the crack line becomes horizontal.
588 M. Mokhtarishirazabad et al. / International Journal of Fatigue 100 (2017) 583–590
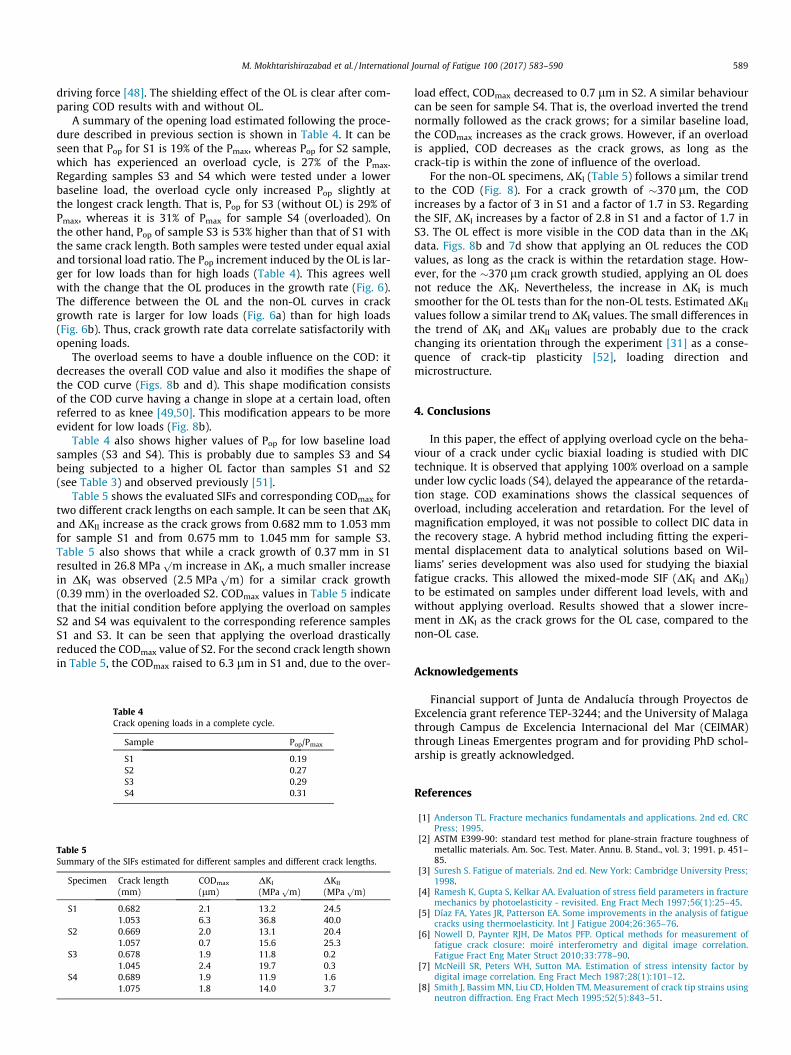
driving force [48]. The shielding effect of the OL is clear after com-paring COD results with and without OL.
A summary of the opening load estimated following the proce-dure described in previous section is shown in Table 4. It can beseen that Pop for S1 is 19% of the Pmax, whereas Pop for S2 sample,which has experienced an overload cycle, is 27% of the Pmax.Regarding samples S3 and S4 which were tested under a lowerbaseline load, the overload cycle only increased Pop slightly atthe longest crack length. That is, Pop for S3 (without OL) is 29% ofPmax, whereas it is 31% of Pmax for sample S4 (overloaded). Onthe other hand, Pop of sample S3 is 53% higher than that of S1 withthe same crack length. Both samples were tested under equal axialand torsional load ratio. The Pop increment induced by the OL is lar-ger for low loads than for high loads (Table 4). This agrees wellwith the change that the OL produces in the growth rate (Fig. 6).The difference between the OL and the non-OL curves in crackgrowth rate is larger for low loads (Fig. 6a) than for high loads(Fig. 6b). Thus, crack growth rate data correlate satisfactorily withopening loads.
The overload seems to have a double influence on the COD: itdecreases the overall COD value and also it modifies the shape ofthe COD curve (Figs. 8b and d). This shape modification consistsof the COD curve having a change in slope at a certain load, oftenreferred to as knee [49,50]. This modification appears to be moreevident for low loads (Fig. 8b).
Table 4 also shows higher values of Pop for low baseline loadsamples (S3 and S4). This is probably due to samples S3 and S4being subjected to a higher OL factor than samples S1 and S2(see Table 3) and observed previously [51].
Table 5 shows the evaluated SIFs and corresponding CODmax fortwo different crack lengths on each sample. It can be seen that DKI
and DKII increase as the crack grows from 0.682 mm to 1.053 mmfor sample S1 and from 0.675 mm to 1.045 mm for sample S3.Table 5 also shows that while a crack growth of 0.37 mm in S1resulted in 26.8 MPa
pm increase in DKI, a much smaller increase
in DKI was observed (2.5 MPapm) for a similar crack growth
(0.39 mm) in the overloaded S2. CODmax values in Table 5 indicatethat the initial condition before applying the overload on samplesS2 and S4 was equivalent to the corresponding reference samplesS1 and S3. It can be seen that applying the overload drasticallyreduced the CODmax value of S2. For the second crack length shownin Table 5, the CODmax raised to 6.3 lm in S1 and, due to the over-
load effect, CODmax decreased to 0.7 lm in S2. A similar behaviourcan be seen for sample S4. That is, the overload inverted the trendnormally followed as the crack grows; for a similar baseline load,the CODmax increases as the crack grows. However, if an overloadis applied, COD decreases as the crack grows, as long as thecrack-tip is within the zone of influence of the overload.
For the non-OL specimens, DKI (Table 5) follows a similar trendto the COD (Fig. 8). For a crack growth of �370 lm, the CODincreases by a factor of 3 in S1 and a factor of 1.7 in S3. Regardingthe SIF, DKI increases by a factor of 2.8 in S1 and a factor of 1.7 inS3. The OL effect is more visible in the COD data than in the DKI
data. Figs. 8b and 7d show that applying an OL reduces the CODvalues, as long as the crack is within the retardation stage. How-ever, for the �370 lm crack growth studied, applying an OL doesnot reduce the DKI. Nevertheless, the increase in DKI is muchsmoother for the OL tests than for the non-OL tests. Estimated DKII
values follow a similar trend to DKI values. The small differences inthe trend of DKI and DKII values are probably due to the crackchanging its orientation through the experiment [31] as a conse-quence of crack-tip plasticity [52], loading direction andmicrostructure.
4. Conclusions
In this paper, the effect of applying overload cycle on the beha-viour of a crack under cyclic biaxial loading is studied with DICtechnique. It is observed that applying 100% overload on a sampleunder low cyclic loads (S4), delayed the appearance of the retarda-tion stage. COD examinations shows the classical sequences ofoverload, including acceleration and retardation. For the level ofmagnification employed, it was not possible to collect DIC data inthe recovery stage. A hybrid method including fitting the experi-mental displacement data to analytical solutions based on Wil-liams’ series development was also used for studying the biaxialfatigue cracks. This allowed the mixed-mode SIF (DKI and DKII)to be estimated on samples under different load levels, with andwithout applying overload. Results showed that a slower incre-ment in DKI as the crack grows for the OL case, compared to thenon-OL case.
Acknowledgements
Financial support of Junta de Andalucía through Proyectos deExcelencia grant reference TEP-3244; and the University of Malagathrough Campus de Excelencia Internacional del Mar (CEIMAR)through Lineas Emergentes program and for providing PhD schol-arship is greatly acknowledged.
References
[1] Anderson TL. Fracture mechanics fundamentals and applications. 2nd ed. CRCPress; 1995.
[2] ASTM E399-90: standard test method for plane-strain fracture toughness ofmetallic materials. Am. Soc. Test. Mater. Annu. B. Stand., vol. 3; 1991. p. 451–85.
[3] Suresh S. Fatigue of materials. 2nd ed. New York: Cambridge University Press;1998.
[4] Ramesh K, Gupta S, Kelkar AA. Evaluation of stress field parameters in fracturemechanics by photoelasticity - revisited. Eng Fract Mech 1997;56(1):25–45.
[5] Díaz FA, Yates JR, Patterson EA. Some improvements in the analysis of fatiguecracks using thermoelasticity. Int J Fatigue 2004;26:365–76.
[6] Nowell D, Paynter RJH, De Matos PFP. Optical methods for measurement offatigue crack closure: moiré interferometry and digital image correlation.Fatigue Fract Eng Mater Struct 2010;33:778–90.
[7] McNeill SR, Peters WH, Sutton MA. Estimation of stress intensity factor bydigital image correlation. Eng Fract Mech 1987;28(1):101–12.
[8] Smith J, BassimMN, Liu CD, Holden TM. Measurement of crack tip strains usingneutron diffraction. Eng Fract Mech 1995;52(5):843–51.
Table 4Crack opening loads in a complete cycle.
Sample Pop/Pmax
S1 0.19S2 0.27S3 0.29S4 0.31
Table 5Summary of the SIFs estimated for different samples and different crack lengths.
Specimen Crack length(mm)
CODmax
(lm)DKI
(MPapm)
DKII
(MPapm)
S1 0.682 2.1 13.2 24.51.053 6.3 36.8 40.0
S2 0.669 2.0 13.1 20.41.057 0.7 15.6 25.3
S3 0.678 1.9 11.8 0.21.045 2.4 19.7 0.3
S4 0.689 1.9 11.9 1.61.075 1.8 14.0 3.7
M. Mokhtarishirazabad et al. / International Journal of Fatigue 100 (2017) 583–590 589

[9] Lopez-Crespo P et al. Overload effects on fatigue crack-tip fields under planestress conditions: surface and bulk analysis. Fatigue Fract Eng Mater Struct2013;36:75–84.
[10] Sutton MA, McNeill SR, Helm JD, Chao YJ. Advances in two-dimensional andthree-dimensional computer vision. In: Rastogi PK, editor.Photomechanics. Berlin, Heidelberg: Springer; 2000. p. 323–72.
[11] Pan B, Qian K, Xie H, Asundi A. Two-dimensional digital image correlation forin-plane displacement and strain measurement: a review. Meas Sci Technol2009;20(6):62001.
[12] Patterson EA, Olden EJ. Optical analysis of crack tip stress fields: a comparativestudy. Fatigue Fract Eng Mater Struct 2004;27(January):623–35.
[13] Sutton MA, Orteu J-J, Schreier HW. Image Correlation for shape, motion anddeformation measurements. New York: Springer; 2009.
[14] Sanford RJ, Dally JW. A general method for determining mixed-mode stressintensity factors from isochromatic fringe patterns. Eng Fract Mech1979;11:621–33.
[15] Yoneyama S, Ogawa T, Kobayashi Y. Evaluating mixed-mode stress intensityfactors from full-field displacement fields obtained by optical methods. EngFract Mech 2007;74:1399–412.
[16] Réthoré J, Gravouil A, Morestin F, Combescure A. Estimation of mixed-modestress intensity factors using digital image correlation and an interactionintegral. Int J Fract 2005;132:65–79.
[17] López-Crespo P, Burguete RL, Patterson EA, Shterenlikht A, Withers PJ, Yates JR.Study of a crack at a fastener hole by digital image correlation. Exp Mech2009;49:551–9.
[18] Nowell D, De Matos PFP. Application of digital image correlation to theinvestigation of crack closure following overloads. Procedia Eng 2010;2(1):1035–43.
[19] Yusof F, Lopez-Crespo P, Withers PJ. Effect of overload on crack closure in thickand thin specimens via digital image correlation. Int J Fatigue 2013;56:17–24.
[20] Christopher CJ, James MN, Patterson EA, Tee KF. Towards a new model of cracktip stress fields. Int J Fract 2007;148(4):361–71.
[21] Colombo C, Vergani L. A numerical and experimental study of crack tipshielding in presence of overloads. Eng Fract Mech 2010;77(11):1644–55.
[22] Vasco-Olmo JM, Díaz FA, Patterson EA. Experimental evaluation of shieldingeffect on growing fatigue cracks under overloads using ESPI. Int J Fatigue2016;83:117–26.
[23] Lopez-Crespo P, Mostafavi M, Steuwer A, Kelleher JF, Buslaps T, Withers PJ.Characterisation of overloads in fatigue by 2D strain mapping at the surfaceand in the bulk. Fatigue Fract Eng Mater Struct 2016;39(8):1040–8.
[24] Leser WP, Newman JA, Johnston WM. Fatigue crack closure analysis usingdigital image correlation. NASA/TM-2010-216695; 2010.
[25] Carroll RCJ, Efstathiou C, Lambros J, Sehitoglu H, Hauber B, Spottswood S.Investigation of fatigue crack closure using multiscale image correlationexperiments. Eng Fract Mech 2009;76:2384–98.
[26] Sander M, Richard H. Experimental and numerical investigations on theinfluence of the loading direction on the fatigue crack growth. Int J Fatigue2006;28(5–6):583–91.
[27] Shanyavsky AA, Orlov EF. Fracture surface development in an overloaded D16TAl-alloy subjected to biaxial loading. A fractographic analysis. Fatigue FractEng Mater Struct 1997;20(2):151–66.
[28] Shanyavskiy A. Fatigue cracking simulation based on crack closure effects inAl-based sheet materials subjected to biaxial cyclic loads. Eng Fract Mech2011;78(8):1516–28.
[29] Langseth BM, Lindholm US, Larsen PK, Lian B. Strain-rate sensitivity of mildsteel grade St-52-3N. J Eng Mech 1991;117(4):719–32.
[30] Chaves V. Ecological criteria for the selection of materials in fatigue. FatigueFract Eng Mater Struct 2014;37(9):1034–42.
[31] Lopez-Crespo P, Moreno B, Lopez-Moreno A, Zapatero J. Study of crackorientation and fatigue life prediction in biaxial fatigue with critical planemodels. Eng Fract Mech 2015;136:115–30.
[32] Lopez-Crespo P, Garcia-Gonzalez A, Moreno B, Lopez-Moreno A, Zapatero J.Some observations on short fatigue cracks under biaxial fatigue. Theor ApplFract Mech 2015;80:96–103.
[33] Lopez-Crespo P, Moreno B, Lopez-Moreno A, Zapatero J. Characterisation ofcrack-tip fields in biaxial fatigue based on high-magnification imagecorrelation and electro-spray technique. Int J Fatigue 2015;71:17–25.
[34] Shih TT, Wei RP. A study of crack closure in fatigue. NASA CR-2319,Wachington, D.C.; 1973.
[35] ASTM E647-00: standard test method for measurement of fatigue crackgrowth rates. Am. Soc. Test. Mater. Annu. B. Stand.; 1999.
[36] de Matos PFP, Nowell D. Experimental and numerical investigation ofthickness effects in plasticity-induced fatigue crack closure. Int J Fatigue2009;31(11–12):1795–804.
[37] Sutton MA, Zhao W, McNeill SR, Helm JD, Piascik RS, Riddell WT. Local crackclosure measurements: development of a measurement system usingcomputer vision and a far-field microscope. In: McClung RC, Newman JC,editors. Advances in fatigue crack closure measurement and analysis: secondvolume, ASTM STP 1343. West Conshohocken, PA. p. 145–56.
[38] Carlson RL, Kardomates GA, Bates PR. The effects of overloads in fatigue crackgrowth. Int J Fatigue 1991;13(6):453–60.
[39] Miller KJ. The behaviour of short fatigue cracks and their initiation, Part I – areview of two recent books. Fatigue Fract Eng Mater Struct 1987;10(1):75–91.
[40] Matsuoka S, Tanaka K, Kawahara M. The retardation phenomenon of fatiguecrack growth in HT80 steel. Eng Fract Mech 1976;8(3):507–23.
[41] Williams ML. On the stress distribution at the base of a stationary crack. J ApplMech 1957;24(3):109–14.
[42] Zanganeh M, Lopez-Crespo P, Tai YH, Yates JR. Locating the crack tip usingdisplacement field data: a comparative study. Strain 2013;49:102–15.
[43] Mokhtarishirazabad M, Lopez-Crespo P, Moreno B, Lopez-Moreno A, ZanganehM. Evaluation of crack-tip fields from DIC data: a parametric study. Int JFatigue 2016;89:11–9.
[44] Lopez-Crespo P, Shterenlikht A, Patterson EA, Yates JR, Withers PJ. The stressintensity of mixed mode cracks determined by digital image correlation. JStrain Anal Eng Des 2008;43:769–80.
[45] Skorupa M, Beretta S, Carboni M, Machniewicz T. An algorithm for evaluatingcrack closure from local compliance measurements. Fatigue Fract Eng MaterStruct 2002;25(3):261–73.
[46] Vasco-Olmo JM, Díaz FA. Experimental evaluation of the effect of overloads onfatigue crack growth by analysing crack tip displacement fields. Eng FractMech 2016;166:82–96.
[47] Pollock DSG. Smoothing with cubic splines. In: Signal processing and itsapplications, handbook of time series analysis, signal processing, anddynamics. London: Academic Press; 1999. p. 293–322.
[48] Sutton MA, Zhao W, McNeill SR, Helm JD, Piascik RS, Riddell WT. Local crackclosure measurements: development of a measurement system usingcomputer vision and a far-field microscope. Adv. Fatigue Crack Clos. Meas.Anal. ASTM STP 1343; 1999. p. 145–56.
[49] Joyce JA, Sutton GE. An automated method of computered-controlled low-cycle fatigue crack growth testing using the elastic-plastic parameter cyclic J”.In: Cullen WH, Landgraf RW, Kaizand LR, Underwood JH, editors. Automatedtest methods for fracture and fatigue crack growth. American Society forTesting and Materials; 1985. p. 225–47.
[50] Lopez-Crespo P, Shterenlikht A, Yates JR, Patterson EA, Withers PJ. Someexperimental observations on crack closure and crack-tip plasticity. FatigueFract Eng Mater Struct 2009;32:418–29.
[51] de Matos PFP, Nowell D. On the accurate assessment of crack opening andclosing stresses in plasticity-induced fatigue crack closure problems. Eng FractMech 2007;74:1579–601.
[52] Lopez-Crespo P, Pommier S. Numerical analysis of crack tip plasticity andhistory effects under mixed mode conditions. J Solid Mech Mater Eng 2008;2(12):1567–76.
590 M. Mokhtarishirazabad et al. / International Journal of Fatigue 100 (2017) 583–590